Embed Size (px)
Citation preview
31st January 2014
Sustainable products
from economic processing of biomass
in highly integrated biorefineries
Techno-economic assessment and market analysis of SUPRABIO biorefineries

Techno-economic assessment and market analysis
Authors and their organization Astrid Lervik Mejdell, Per Nygård and Esther Ochoa-Fernández, Statoil Mattias Ljunggren, Biogasol Costa Komodromos, Brunel University Claire Doherty, University of Manchester Peter Westermann, Aalborg University János Petrusán, IGV GmbH Martin O’Connell, Fraunhofer ICT IMM
Key words
Techno-economic assessment and market analysis
1
Publishable summary
The present report is a part of work package 7 (“Sustainability: Environmental, Economic, Social, Technical, Market and Geographical Aspects”), where important tasks are technical and economic evaluation of the integrated biorefinery concepts and market evaluation for the produced products. Two different biorefinery concepts have been evaluated, one based on a biochemical core process concept and the other based on a thermochemical core process concept. In addition the possibility to integrate with so-called add-ons has been investigated.
Techno - economic analysis For the two biorefinery concepts only waste treatment integration was implemented. No other relevant integration between the proposed processes in the biochemical refinery concept was found viable. Each process was therefore evaluated one by one integrated with the waste treatment scenario. Among the proposed add-ons only the seed oil hydrogenation process was established and could potentially been connected to the biorefinery concepts via hydrogen exchange. Unfortunately, the evaluation of hydrogen extraction from different biorefinery streams was delayed making it impossible to carry out the analysis. The two biorefinery concepts studied perform very differently. The ethanol case anticipated for year 2025 (Scenario II) has a high energy efficiency about 55% and 70% LHV efficiency and net efficiency, respectively. While the maximum performance for the thermochemical refinery concept is below 30%. Ethanol The early implementation scenario showed somewhat lower performance compared to the mature technology scenario as anticipated for 2025. With the process layout change and expected process improvements the process became profitable for three of the five sub-scenarios. Only the sub-scenarios with the gas turbines resulted in a negative NPV, mainly because of the necessary high investments in compressors and turbines. The sub-scenarios utilising gas engine and boiler result in comparable ethanol production cost. However, the gas engine based scenarios have higher capital cost, but compensate with income from the larger electricity export. Changing feedstock from straw to poplar wood significantly reduced the LHV efficiency from feedstock to fuel ethanol, while the net efficiency was still comparable. Acid mixtures The acid mixture separation end purification process is quite energy demanding which add a significant demand for importing electricity and steam. A potential challenge could be the membrane based separation of acids from the solids containing fermentation broth, but the process has according to Aalborg been proven in their laboratory with no membrane issues.
To make the process viable the price of the acid mixture has to be increased by 75% and/or the separation and purification process improved to reduce the processing cost.

Techno-economic assessment and market analysis
2
FT Liquids All the FT liquid scenarios result in a low net efficiency (below 30%) being the main carbon losses associated to:
Pyrolysis section: net efficiency ranging from 60 to 67%
Gasification section: cold gas efficiency ranging from 66 to 71%
FT section: LHV efficiency from conditioned syngas to fuel ranging from 52 to 67% In addition, considerable amounts of steam are needed for the acid gas removal process and the WGS reaction. The low efficiency combined with a large investment cost result in strong negative NPV estimates for all scenarios. FT liquids produced from straw/poplar result in approximately 15-20% higher production cost than from forest residues mainly due to the lower yield to pyrolysis oil for straw. However, the production cost difference is reduced to approximately 5-10% if the export of electricity from the pyrolysis section is accounted for in the economic analysis. All the FT liquids biorefinery scenarios result in a deficit of steam. Integration with the pyrolysis section or introduction of natural gas in order to overcome this deficit has been shown to be more energy efficient, but result in a higher fuel production cost (5-10%) than importing steam, mainly due to the higher CAPEX related to a larger CHP section. The most favourable change in terms of overall performance is the operation at higher pressure. Increasing the pressure results in both higher efficiency and reduced CAPEX according to the calculations. The higher efficiency is related to higher selectivity to heavier hydrocarbons in the FT section, while the CAPEX is related to less compression needs in the CHP unit and smaller FT section. However, the data related to this scenario both in terms of CAPEX and FT performance is of high uncertainty and has not been demonstrated yet.
Increasing the gasifier quenching temperature to 250C results in approximately 1-2% higher efficiency and fuel production costs can be reduced by additionally 3%. DME Production of DME from forest residues as feedstock results in an overall LHV efficiency approximately 6% higher than the equivalent configuration for FT diesel production. The main carbon losses are as described for FT liquids above for both the pyrolysis and gasification processes. The main difference is that higher selectivity to the final fuel product is achieved in the DME biorefinery. On the opposite side, the DME biorefinery results in a larger steam deficit. Still, the net efficiency of the DME biorefinery has been calculated to be approximately 2% higher than for FT diesel and the production cost per tonne of DME product is approximately 90% lower than FT diesel (25% in energy basis - €/MJ).
Market analysis Within Suprabio a wide range of processes for production of various products has been developed and evaluated. The products range from fuels, bulk chemicals to high value chemicals. The products included are:
Techno-economic assessment and market analysis
1
Fuels o Ethanol
o Butanol
o FT-diesel
o Hydrogenated seed oil
o Dimethyl ether
o Mixed alcohols
Chemicals
o 2,3-butanediol
o Methyl ethyl ketone
o Butyric and propionic acid
o Four carbon 1,4
dicarboxylic acids
o Lignin based products
o Glucosamine
o Sugar fatty acid esters
o Hydroxystearic acid
o Vernolic acid
o Ω-3 fatty acids
o β–glucan
The properties, applications and market of each Suprabio product have been evaluated and
the analysis is presented in the second part of this report.
Biochemicals and biofuels can potentially bring value to businesses in three ways:
Allow existing products to be produced at a lower cost
Allow companies to produce products with unique properties not achievable in any other way
Create opportunities for nature-based products In general the market for bio-based products is increasing in specific areas and the markets for biobased chemicals and fuels will most likely grow in the future. In 2011 the bio-based chemical market reached a value of 3.6 billion USD (excluding biofuels) and is forecasted to grow to 12.2 billion USD by 2021. The main hurdle for a large expansion is in general higher costs for bio-based products compared to the competing fossil-based products. Also a premium price for most bio-based products cannot be expected for the reason of just being “green”, they would also need to show superior properties. For a large expansion of bio-based chemicals many of the processes which today are in the development phase must have been commercialized. Also large scale production of cheap biofuel is needed which would allow other companies to valorize part of the fuel and wastes into chemicals. It is clear that the interest for bio-based chemicals increases and that the success of biochemicals depends on a number of factors, e.g. process and product development and demand and supply demand of crude oil (in other words the cost of crude oil).

Techno-economic assessment and market analysis
2
Table of Content
PUBLISHABLE SUMMARY ............................................................................................................. 1
TABLE OF CONTENT ...................................................................................................................... 2
1 INTRODUCTION ...................................................................................................................... 5
1.1 EARLY IMPLEMENTATION (2015) ................................................................................................. 5 1.1.1 BIOCHEMICAL CORE PROCESS ............................................................................................................. 5 1.1.2 THERMOCHEMICAL CORE PROCESS ..................................................................................................... 6 1.2 MATURE TECHNOLOGY (2025) ................................................................................................... 7 1.2.1 BIOCHEMICAL CORE PROCESS ............................................................................................................. 7 1.2.2 THERMOCHEMICAL CORE PROCESS ..................................................................................................... 8
2 PREVIOUS WORK AND SCOPE OF WORK.................................................................................. 9
2.1 PREVIOUS WORK ..................................................................................................................... 9 2.1.1 EVALUATION OF BIOCHEMICAL REFINERY CONCEPT ................................................................................ 9 2.1.2 EVALUATION OF THERMOCHEMICAL BIOREFINERY ............................................................................... 10 2.1.3 EVALUATION OF WASTE TREATMENT AND “ADD-ONS” ......................................................................... 10 2.2 SCOPE OF THIS WORK .............................................................................................................. 12 2.2.1 BIOCHEMICAL REFINERY CONCEPT .................................................................................................... 12 2.2.2 THERMOCHEMICAL BIOREFINERY CONCEPT......................................................................................... 13 2.2.3 ADD-ONS ..................................................................................................................................... 13 2.2.4 MARKET EVALUATION .................................................................................................................... 13
3 METHODOLOGY AND SOFTWARE .......................................................................................... 15
3.1 METHODOLOGY TECHNICAL ASSESSMENT AND DATA COLLECTION ...................................................... 15 3.2 METHODOLOGY ECONOMIC ASSESSMENT .................................................................................... 17
4 BIOCHEMICAL BIOREFINERY SCENARIOS ............................................................................... 19
4.1 SCENARIO I – STRAW TO ETHANOL – 2015 .................................................................................. 19 4.1.1 TECHNICAL EVALUATION ................................................................................................................. 20 4.1.2 ECONOMIC EVALUATION ................................................................................................................. 24 4.2 SCENARIO II – STRAW TO ETHANOL – 2025 ................................................................................. 26 4.2.1 TECHNICAL EVALUATION ................................................................................................................. 27 4.2.2 ECONOMIC EVALUATION ................................................................................................................. 29 4.3 SCENARIO III – POPLAR TO ETHANOL – 2025 ............................................................................... 30 4.3.1 TECHNICAL EVALUATION ................................................................................................................. 31 4.3.2 ECONOMIC EVALUATION ................................................................................................................. 32 4.4 SCENARIO IV – STRAW TO MIXED ACIDS – 2025........................................................................... 34 4.4.1 TECHNICAL EVALUATION ................................................................................................................. 34 4.4.2 ECONOMIC EVALUATION ................................................................................................................. 37 4.5 SYNOPSIS OF ALL SCENARIOS FOR THE BIOCHEMICAL BIOREFINERY ...................................................... 40

Techno-economic assessment and market analysis
3
4.6 SENSITIVITY .......................................................................................................................... 40
5 THERMOCHEMICAL BIOREFINERY SCENARIOS ....................................................................... 42
5.1 DESCRIPTION OF SCENARIOS ..................................................................................................... 42 5.1.1 SCENARIO I – FOREST RESIDUES TO FT LIQUIDS - 2015 ........................................................................ 42 5.1.2 SCENARIO II – FOREST RESIDUES TO FT LIQUIDS - 2025 ....................................................................... 43 5.1.3 SCENARIO III – FOREST RESIDUES TO DME - 2025 ............................................................................. 43 5.1.4 SCENARIO IV – STRAW TO FT LIQUIDS - 2025 .................................................................................... 43 5.1.5 SCENARIO V – POPLAR TO FT LIQUIDS - 2025 .................................................................................... 43 5.1.6 SCENARIO VI – FOREST RESIDUES TO FT LIQUIDS – 2025 – NATURAL GAS............................................... 43 5.1.7 SCENARIO VII – FOREST RESIDUES TO FT LIQUIDS – 2025 - CENTRALISED ............................................... 44 5.1.8 SCENARIO VIII – FOREST RESIDUES TO FT LIQUIDS – 2025 – HIGH PRESSURE .......................................... 44 5.1.9 SCENARIO IX – FOREST RESIDUES TO FT LIQUIDS – 2025 – HIGH PRESSURE AND QUENCHING TEMPERATURE 44 5.2 TECHNICAL EVALUATION .......................................................................................................... 44 5.2.1 PYROLYSIS .................................................................................................................................... 44 5.2.2 OIL CONDITIONING AND GASIFICATION .............................................................................................. 45 5.2.3 SYNGAS CLEANING AND CONDITIONING ............................................................................................. 47 5.2.4 FISCHER-TROPSCH SYNTHESIS .......................................................................................................... 47 5.2.5 FT UPGRADING ............................................................................................................................. 49 5.2.6 DME SYNTHESIS AND SEPARATION ................................................................................................... 49 5.2.7 HEAT AND POWER GENERATION ....................................................................................................... 51 5.2.8 WASTE WATER TREATMENT............................................................................................................. 51 5.3 OVERALL PERFORMANCE ......................................................................................................... 53 5.3.1 MATURITY OF TECHNOLOGY (2015 OR 2025) ................................................................................... 53 5.3.2 FINAL PRODUCT (FT LIQUIDS OR DME) ............................................................................................. 53 5.3.3 BIOMASS TYPE (FOREST RESIDUES, STRAW OR POPLAR) ........................................................................ 54 5.3.4 ENERGY SOURCE (STEAM IMPORT OR ON-SITE PRODUCTION FROM NG) ................................................. 54 5.3.5 PYROLYSIS (DISTRIBUTED OR CENTRALISED) ....................................................................................... 55 5.3.6 PRESSURE EFFECT (30 OR 100 BAR) ................................................................................................. 55
5.3.7 QUENCHING TEMPERATURE (45C OR 250C) .................................................................................. 55 5.4 ECONOMIC EVALUATION .......................................................................................................... 57 5.5 SENSITIVITY .......................................................................................................................... 60
6 CONCLUSION OF THE TECHNO-ECONOMIC EVALUATION ....................................................... 62
7 MARKET ANALYSIS ............................................................................................................... 64
7.1 INTRODUCTION TO THE MARKET ANALYSIS ................................................................................... 64 7.2 FUEL PRODUCTS .................................................................................................................... 66 7.2.1 ETHANOL ..................................................................................................................................... 66 7.2.2 BUTANOL ..................................................................................................................................... 67 7.2.3 FT DIESEL ..................................................................................................................................... 68 7.2.4 HYDROGENATED SEED OIL ............................................................................................................... 70 7.2.5 DIMETHYL-ETHER (DME) ............................................................................................................... 70 7.2.6 MIXED ALCOHOLS .......................................................................................................................... 72 7.3 BIOFUEL MARKET ANALYSIS ...................................................................................................... 74 7.3.1 BACKGROUND ............................................................................................................................... 74 7.3.2 THE EUROPEAN BIOFUEL MARKET .................................................................................................... 81 7.3.3 MARKET FOR ADVANCED BIOFUELS IN EUROPE ................................................................................... 84

Techno-economic assessment and market analysis
4
7.4 BIOCHEMICAL BIOREFINERY NON-FUEL PRODUCTS .......................................................................... 86 7.4.1 2,3-BUTANEDIOL ........................................................................................................................... 86 7.4.2 METHYL ETHYL KETONE .................................................................................................................. 87 7.4.3 BUTYRIC AND PROPIONIC ACID ......................................................................................................... 88 7.4.4 FOUR CARBON 1,4 DICARBOXYLIC ACIDS ............................................................................................ 90 7.4.5 LIGNIN-BASED PRODUCTS................................................................................................................ 92 7.5 ADD-ON PRODUCTS ................................................................................................................ 95 7.5.1 GLUCOSAMINE .............................................................................................................................. 95 7.5.2 SUGAR FATTY ACID ESTERS .............................................................................................................. 96 7.5.3 HYDROXYSTEARIC ACIDS ................................................................................................................. 99 7.5.4 VERNOLIC ACID ........................................................................................................................... 100 7.5.5 OMEGA-3 FATTY ACIDS ................................................................................................................. 101 7.5.6 Β-GLUCANS FROM MICROALGAE ..................................................................................................... 103 7.5.7 PHYCOERYTHRIN AND SULPHATED EXOPOLYSACCHARIDES .................................................................. 104 7.6 DISCUSSION AND CONCLUSION ............................................................................................... 104
APPENDIX A ............................................................................................................................. 107
ECONOMIC PARAMETERS ............................................................................................................... 107 ECONOMIC PERFORMANCE MEASURES ............................................................................................... 108
APPENDIX B ............................................................................................................................. 109
Techno-economic assessment and market analysis
5
1 Introduction
SUPRABIO is a collaborative research project sponsored by the European Commission, through the project no 241640. The main aim of the project is to develop and deliver technically and economically efficient concepts for biorefineries by making available a toolkit of generic processes and methodologies for intensification and integration of unit operations. The technical development will be supported by economic, technical and life-cycle analysis in order to optimise energy and carbon efficiency. The present report is a part of work package 7 (“Sustainability: Environmental, Economic, Social, Technical, Market and Geographical Aspects”), where important tasks are technical and economic evaluation of the integrated biorefinery concepts. Two different biorefinery concepts have been evaluated in the project, one based on a biochemical core process concept which has been addressed in Ljunggren et al. (2013)1 and the other based on a thermochemical core process concept which has been addressed in Ochoa-Fernández et al. (2013)2. The main product for both concepts was decided to be fuel products, while co-products were considered to increase profitability. Also, the possibility to integrate with so-called add-ons has been investigated and reported in Nygård et al. (2013)3. Thus, the two biorefinery concepts consist of a number of possible scenarios. Furthermore, the concepts are divided into two configurations: an early implementation configuration and a mature technology configuration, where the early implementation scenarios are envisioned as demonstration scale plants ready for production in 2015, while the mature technology configurations as industrial scale plants ready by 2025. However, extensive integration was only planned for the mature technology configurations. The report also includes a market analysis of both fuel and non-fuel products, as well as a discussion of the biofuels’ role in the future fuel mix, with focus on Europe.
1.1 Early implementation (2015)
1.1.1 Biochemical core process
The biochemical, early implementation configuration had originally ethanol or butanol as the only targeted final product as illustrated in Figure 1. However, later in the project it was identified that it would be more valuable to produce MEK instead of butanol. MEK is an
1 Ljunggren, M., Lervik Mejdell, A., Nygård, P., Ochoa-Fernández, E.: Technical – economical model for biorefinery based on
biochemical conversion of lignocellulosic materials. Deliverable D 7-9 prepared for the SUPRABIO project, supported by EC’s FP7 programme. Ballerup, 2013. 2 Ochoa-Fernández, E., Nygård, P., Ljunggren, M.: Technical – economical model for biorefinery based on thermochemical
conversion of lignocellulosic materials. Deliverable D 7-10 prepared for the SUPRABIO project, supported by EC’s FP7 programme. Trondheim, 2013. 3 Nygård, P., Lervik Mejdell, A., Ochoa-Fernández, E., Ljunggren, M.: Technical model for an optimum treatment of
biorefinery, municipal and farming wastes. Deliverable D 5-10 prepared for the SUPRABIO project, supported by EC’s FP7 programme. Trondheim, 2013.

Techno-economic assessment and market analysis
6
intermediate product in the butanol synthesis route. The size of the plant in all cases is constrained by 40,000 kt dry matter/year straw feed into the plant, see Figure 1.
Figure 1: Illustration of the biochemical refinery early implementation concept (2015)
1.1.2 Thermochemical core process
For the thermochemical early implementation configuration Fischer-Tropsch (FT) liquids (diesel and naphtha) is the only targeted final product. The capacity of the plant is 200 kt dry matter/year forest residues feed, see Figure 2. Forest residues are first converted into pyrolysis oil via fast pyrolysis. Five distributed pyrolysis units with a capacity of 40 kt dry matter/year each are envisaged.
Figure 2: Illustration of the thermochemical early implementation configuration (2015)

Techno-economic assessment and market analysis
7
1.2 Mature technology (2025)
1.2.1 Biochemical core process
The biochemical mature configurations, as illustrated in Figure 3, also have ethanol or MEK (earlier butanol) as the main product. However, the straw feedstock supplied to the plant is 10 times larger, i.e. 400 kt dry matter straw/year and the following selected processes have been considered for integration with the main routes:
Production of high-value products from C5 and C6 stream (succinic acid, propionic acid, butyric acid and chiral amines)
High-value products from lignin separation In addition, an alternative feedstock and several add-ons have been assessed:
Poplar as alternative feedstock
Algae production
Hydrogenation of volatile fatty acids (VFA) from sewage treatment
Hydrogenation of seed oil
Figure 3: Illustration of the mature technology biochemical refinery configuration (2025) including the add-ons

Techno-economic assessment and market analysis
8
1.2.2 Thermochemical core process
For the thermochemical mature technology configurations FT liquids or DME is the main product, see Figure 4. The feedstock consumed in the mature technology configurations, are 2 times larger than for the early implementation case (2015), i.e. 400 kt dry matter/year distributed in five pyrolysis units at 80 kt/year each. In addition, alternative feedstocks and several add-ons have also been assessed:
Poplar as alternative feedstock
Straw as an alternative feedstock
Algae production
Hydrogenation of volatile fatty acids (VFA) from sewage treatment
Hydrogenation of seed oil
Figure 4: Illustration of the mature technology thermochemical refinery configuration (2025) including the add-ons

Techno-economic assessment and market analysis
9
2 Previous work and scope of work
2.1 Previous work
This section summarizes the main conclusions of the initial technical evaluations carried for the different biochemical and thermochemical biorefinery scenarios, including the possible add-ons described above. This previous work was reported in Ljunggren et al. (2013)1, Ochoa-Fernández et al. (2013)2 and Nygård et al. (2013)3.
2.1.1 Evaluation of biochemical refinery concept
The analysis of three different biorefinery biochemical scenarios were presented in Ljunggren et al. (2013)1, including the early implementation configuration (2015) for ethanol and butanol, and the mature technology configuration (2025) for ethanol. All the process steps included in the ethanol basic configuration were concluded to be technically feasible. The net efficiency of the overall process according to the simulation work was 59% when a biomass boiler is used for conversion of the solids waste fraction and energy generation and between 65% to 69% when staged gasification is used for conversion of the solid waste into a gas fuel. In addition, it was identified that more than 70% of the water required for the biorefinery can be covered by recirculating water from the waste water treatment. A set of major drawbacks were on the other hand identified for the early implementation configuration of the butanol process. Firstly, the targeted product should probably not be butanol since one of the intermediate products of the process, MEK, is a more valuable product. In addition, no efficient and non-pathogenic organism for BDO production exists at present. This combined with the low BDO recovery and high energy and chemicals consumption in the separation step after the fermentation resulted in poor yield and low efficiency. The net efficiency of the overall process according to the simulation work was only 3.7% when a biomass boiler was used for conversion of the solids waste to energy. Due to the negative results of this initial evaluation, it was decided to change focus from butanol production to MEK production and Brunel has started new activities in order to improve the BDO separation step in addition to further improve the non-pathogenic organism. Only ethanol was considered as the fuel product for the integrated mature technology configuration (2025) due to lacking data for the butanol 2025 process and the challenges revealed in the 2015 configuration. In addition, four other processes were evaluated for integration with ethanol in the mature configuration: acids, chiral components and lignin. However, before the deadline of the report of Ljunggren et al. (2013)1 no integration work had been completed with any of them for various reasons:
Acids: The process from feedstock to final product was not fully established. The product was not well defined and the products from the process were a mixture of organic acids, as well as substantial amounts of water. It was clear that a new product specification had to be established and that further separation and purification was required to achieve the commercial products aimed for.
Techno-economic assessment and market analysis
10
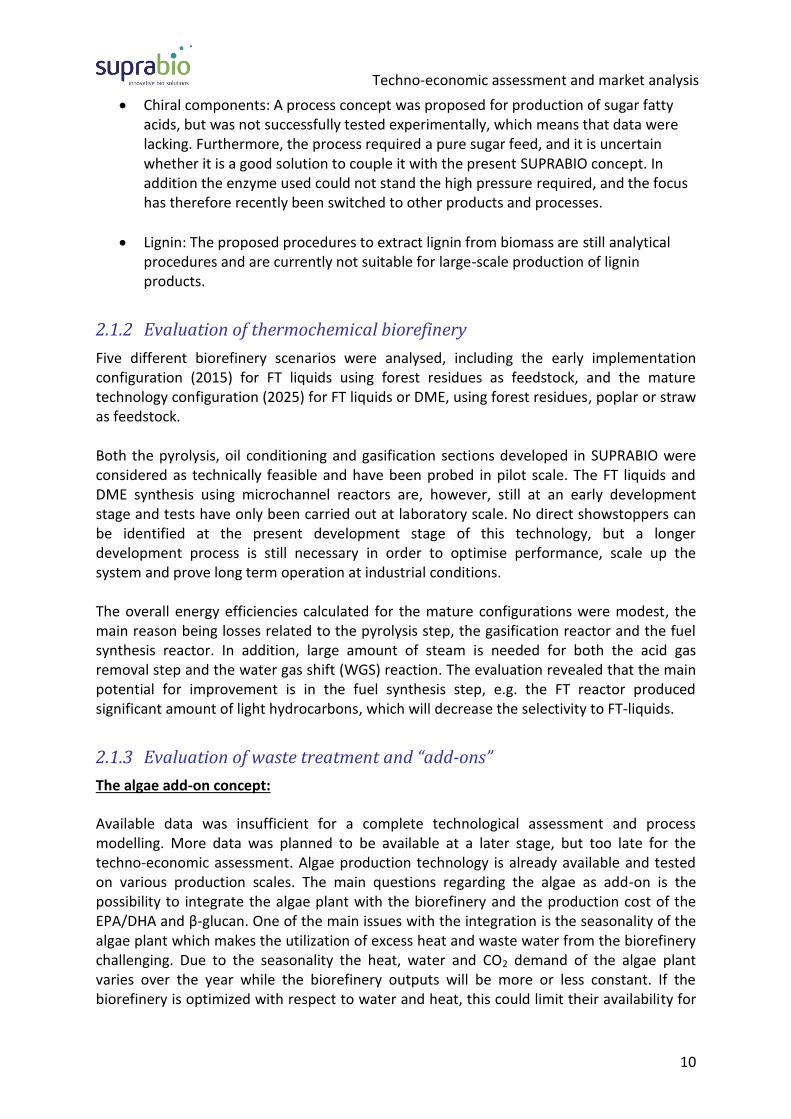
Chiral components: A process concept was proposed for production of sugar fatty acids, but was not successfully tested experimentally, which means that data were lacking. Furthermore, the process required a pure sugar feed, and it is uncertain whether it is a good solution to couple it with the present SUPRABIO concept. In addition the enzyme used could not stand the high pressure required, and the focus has therefore recently been switched to other products and processes.
Lignin: The proposed procedures to extract lignin from biomass are still analytical procedures and are currently not suitable for large-scale production of lignin products.
2.1.2 Evaluation of thermochemical biorefinery
Five different biorefinery scenarios were analysed, including the early implementation configuration (2015) for FT liquids using forest residues as feedstock, and the mature technology configuration (2025) for FT liquids or DME, using forest residues, poplar or straw as feedstock. Both the pyrolysis, oil conditioning and gasification sections developed in SUPRABIO were considered as technically feasible and have been probed in pilot scale. The FT liquids and DME synthesis using microchannel reactors are, however, still at an early development stage and tests have only been carried out at laboratory scale. No direct showstoppers can be identified at the present development stage of this technology, but a longer development process is still necessary in order to optimise performance, scale up the system and prove long term operation at industrial conditions. The overall energy efficiencies calculated for the mature configurations were modest, the main reason being losses related to the pyrolysis step, the gasification reactor and the fuel synthesis reactor. In addition, large amount of steam is needed for both the acid gas removal step and the water gas shift (WGS) reaction. The evaluation revealed that the main potential for improvement is in the fuel synthesis step, e.g. the FT reactor produced significant amount of light hydrocarbons, which will decrease the selectivity to FT-liquids.
2.1.3 Evaluation of waste treatment and “add-ons”
The algae add-on concept:
Available data was insufficient for a complete technological assessment and process modelling. More data was planned to be available at a later stage, but too late for the techno-economic assessment. Algae production technology is already available and tested on various production scales. The main questions regarding the algae as add-on is the possibility to integrate the algae plant with the biorefinery and the production cost of the EPA/DHA and β-glucan. One of the main issues with the integration is the seasonality of the algae plant which makes the utilization of excess heat and waste water from the biorefinery challenging. Due to the seasonality the heat, water and CO2 demand of the algae plant varies over the year while the biorefinery outputs will be more or less constant. If the biorefinery is optimized with respect to water and heat, this could limit their availability for
Techno-economic assessment and market analysis
11
an algae add-on. However, the microalgae could present an opportunity to use the wastes after optimization of the biorefinery.
Another issue is the interfaces between the biorefinery and the algae plant, e.g. to what extent the water must be purified before being fed to the photofermentor.
The seed oil to fuel add-on concept:
This process is already an established commercial process. The process should therefore be ready for implementation as an “add-on” to the two biorefinery concepts evaluated within SUPRABIO. The process development within the frame of SUPRABIO has been focused on the hydrogenation reactor. A new intensified staged hydrogenation reactor has been developed and tested by IMM and Brunel. They plan to compare the results with the trials done at the pilot facility at Statoil. The key performance indicator for the new reactor is an increase in conversion efficiency by 10% relative to pilot scale trials.
The final conclusions on using hydrogenation of seed oils as an “add-on” to the two biorefinery cases was planned to be drawn in the present report. Unfortunately, Brunel’s techno-economic evaluation of hydrogen production or separation from different biorefinery streams has been delayed. This information is crucial for the evaluation of the possible advantages of placing a seed oil hydrogenation plant beside a biochemical refinery and therefore the evaluation cannot be carried out.
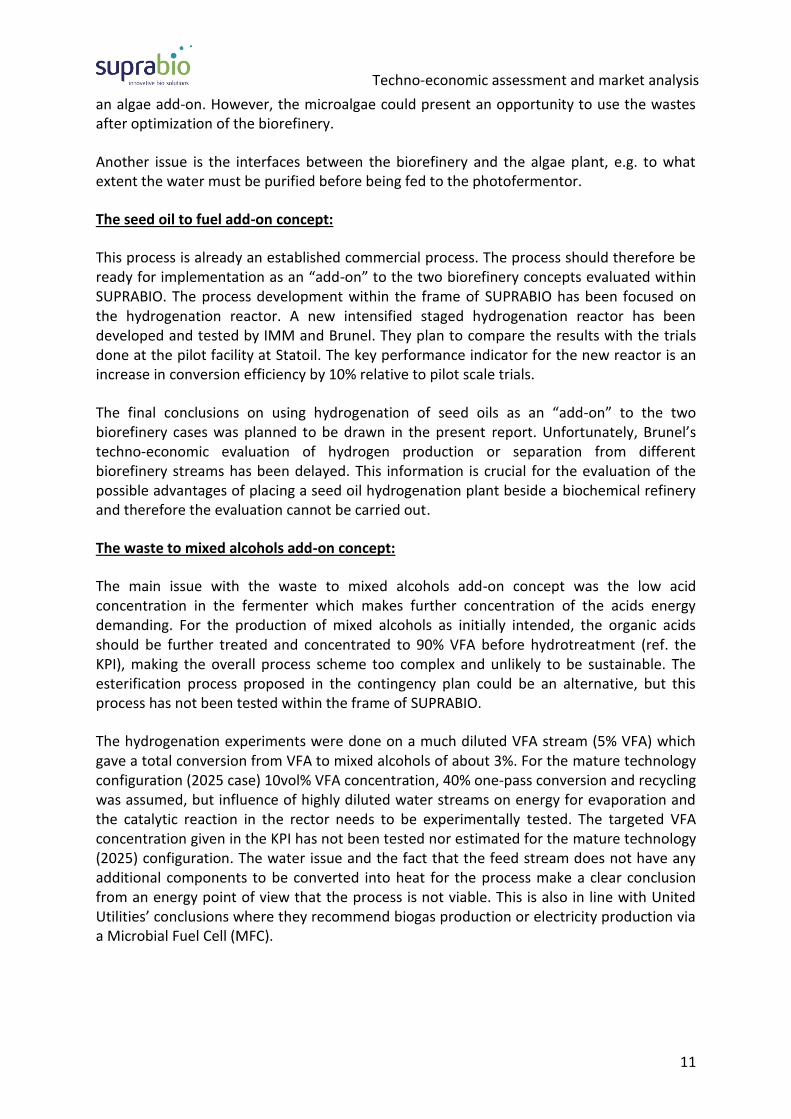
The waste to mixed alcohols add-on concept:
The main issue with the waste to mixed alcohols add-on concept was the low acid concentration in the fermenter which makes further concentration of the acids energy demanding. For the production of mixed alcohols as initially intended, the organic acids should be further treated and concentrated to 90% VFA before hydrotreatment (ref. the KPI), making the overall process scheme too complex and unlikely to be sustainable. The esterification process proposed in the contingency plan could be an alternative, but this process has not been tested within the frame of SUPRABIO.
The hydrogenation experiments were done on a much diluted VFA stream (5% VFA) which gave a total conversion from VFA to mixed alcohols of about 3%. For the mature technology configuration (2025 case) 10vol% VFA concentration, 40% one-pass conversion and recycling was assumed, but influence of highly diluted water streams on energy for evaporation and the catalytic reaction in the rector needs to be experimentally tested. The targeted VFA concentration given in the KPI has not been tested nor estimated for the mature technology (2025) configuration. The water issue and the fact that the feed stream does not have any additional components to be converted into heat for the process make a clear conclusion from an energy point of view that the process is not viable. This is also in line with United Utilities’ conclusions where they recommend biogas production or electricity production via a Microbial Fuel Cell (MFC).

Techno-economic assessment and market analysis
12
2.2 Scope of this work
This report has two main purposes:
Concluding the work initiated in Ljunggren et al. (2013)1, Ochoa-Fernández et al. (2013)2 and Nygård et al. (2013)3 by completing the techno-economic evaluation for selected scenarios.
Market evaluation of the SUPRABIO products
2.2.1 Biochemical refinery concept
The selected scenarios include:
I. Straw to Ethanol (2015) – Early implementation II. Straw to Ethanol (2025) – Mature technology configuration
III. Poplar to Ethanol (2025) – Mature technology configuration IV. Straw to Mixed acids (2025) – Mature technology configuration
Because of lacking process information the mixed acids processes were excluded from the integration work carried out in Ljunggren et al. (2013)1 due to reasons described in section 2.1.1. However, progress and further dialogue with the process developers during the last months has allowed for a simplified evaluation which is summarised in this report. Both processes were meant to be integrated with the fuel producing main processes. However, limited integration possibilities between the processes have been revealed. The processes are therefore evaluated as stand-alone processes from feedstock to final product, but with waste treatment implemented. Process information on the butanol production route was only established for the early implementation case and the performance was found to be very low. As a follow-up to the initial development of non-pathogenic BDO fermenting organisms by Biogasol, the research on finding a more efficient butanol production route will continue under the responsibility of Brunel. The proposed programme comprises development of attenuated bacterial strains for BDO production (Task 2.1.2.5) and also production of isobutanol directly from C6 sugars (Task 2.1.2.6). As already discussed in the previous main section the product aimed for in the BDO fermentation based process was later in the project decided to be changed to MEK. In addition Brunel is considering alternative BDO product recovery methods, and they concluded very recently that distillation may be a promising alternative. The distillation method was evaluated from a process modelling perspective by Ljunggren (2012)4. The conclusion then was that the water has to be evaporated off. To achieve a recovery of 95 % and a purity of 99 % the energy consumption for the distillation became 29.3 MJ/kg produced BDO with 100 g BDO/L and 90 °C in the fermentation broth, while the energy demand increased to 59.8 MJ/kg produced BDO if the BDO concentration is decreased to 50 g/L. Brunel’s distillation experimental work is still not completed and the Coordinator had therefore a strong preference to not include this route in the final techno-economic
4 Ljunggren, M.: Separation of 2,3-butanediol from fermentation broth by distillation. Internal report. Statoil, 29
th February
2012

Techno-economic assessment and market analysis
13
evaluation. Brunel will report their results and conclusions in the last half year of the project.
2.2.2 Thermochemical biorefinery concept
The following scenarios (described in Ochoa-Fernández et al. 20132) are part on the final techno-economic assessment:
I. Forest residues to FT liquids (2015) – Early implementation II. Forest residues to FT liquids (2025) – Mature configuration
III. Forest residues to DME (2025) – Mature configuration IV. Straw to FT liquids (2025) – Mature configuration
In addition, five new scenarios have been defined in order to study the effect of different process parameters and configurations:
V. Poplar to FT liquids (2025) – Mature configuration VI. Forest residues to FT liquids (2025) – Natural Gas – Mature configuration
VII. Forest residues to FT liquids (2025) – Centralised – Mature configuration VIII. Forest residues to FT liquids (2025) – High pressure – Mature configuration
IX. Forest residues to FT liquids (2025) – High pressure and quenching temperature – Mature configuration
A new scenario has also been included with operation at very high pressure (100 bar). This case has been included because the Coordinator is planning to carry out the demonstration of the process at such high pressures. In addition, sensitivity analysis has been carried out to evaluate the effect of important process parameters.
2.2.3 Add-ons
Both the “algae” and the “waste to fuel” add-on concepts are not fully defined and therefore impossible to integrate with the two biorefinery concepts. The “seed oil to fuel” concept is established and already commercially available. Utilising hydrogen from waste streams within the biorefinery concept could be a viable integration. An initial evaluation of hydrogen extraction from the two biorefinery concepts has been carried out by Brunel, see /Barta 2013a/5. Unfortunately, the follow-up work on cost estimation was significantly delayed and not reported yet. No further analysis of the add-ons has therefore been possible to include in the present report.
2.2.4 Market evaluation
The main objective with market analysis is to analyse the marked potential of the products for the biorefinery concepts. Products from biorefineries may substitute products from conventional mineral oil refineries, or yield completely new products. Data from the existing
5 Barta, Z.: Interim report on hydrogen production from biorefinery streams. Deliverable D 2-18 prepared for the SUPRABIO
project, supported by EC’s FP7 programme. London, 2013.

Techno-economic assessment and market analysis
14
market will be used for the evaluation of replacement of other components with the products from the biorefinery. An even larger potential might be that the refinery concepts produce new chemicals, which may be used for industrial applications or other market segments. High value products used for cosmetics or nutrition is one option, generation of new carbon structures with special physico-chemical behaviour may be another. A market analysis is performed for both fuel and non-fuel products. The partner responsible for the development of the process to produce a specific product has also had the responsibility for the market analysis for that product. The market evaluation includes:
description of the target product
comparison of SUPRABIO product and target product
applications
competing products
market evaluation.
For the fuel products, the market evaluation is done in an overall biofuel market analysis.
Techno-economic assessment and market analysis
15
3 Methodology and Software
3.1 Methodology technical assessment and data collection
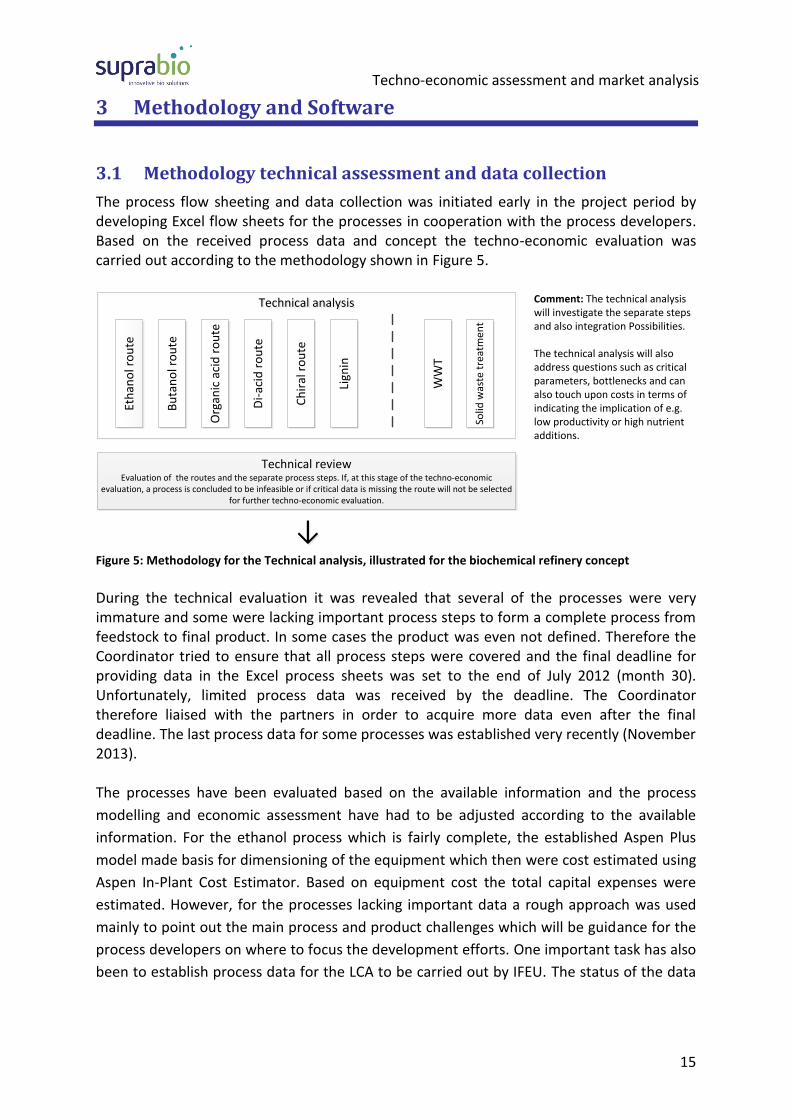
The process flow sheeting and data collection was initiated early in the project period by developing Excel flow sheets for the processes in cooperation with the process developers. Based on the received process data and concept the techno-economic evaluation was carried out according to the methodology shown in Figure 5.
Eth
ano
l ro
ute
Bu
tan
ol r
ou
te
Org
anic
aci
d r
ou
te
Di-
acid
ro
ute
Ch
iral
ro
ute
Lign
in
Technical analysisTechnical analysis
Technical reviewEvaluation of the routes and the separate process steps. If, at this stage of the techno-economic
evaluation, a process is concluded to be infeasible or if critical data is missing the route will not be selected for further techno-economic evaluation.
Comment: The technical analysis will investigate the separate steps and also integration Possibilities.
The technical analysis will also address questions such as critical parameters, bottlenecks and can also touch upon costs in terms of indicating the implication of e.g. low productivity or high nutrient additions.
WW
T
Solid
was
te t
reat
men
t
↓↓
Figure 5: Methodology for the Technical analysis, illustrated for the biochemical refinery concept
During the technical evaluation it was revealed that several of the processes were very immature and some were lacking important process steps to form a complete process from feedstock to final product. In some cases the product was even not defined. Therefore the Coordinator tried to ensure that all process steps were covered and the final deadline for providing data in the Excel process sheets was set to the end of July 2012 (month 30). Unfortunately, limited process data was received by the deadline. The Coordinator therefore liaised with the partners in order to acquire more data even after the final deadline. The last process data for some processes was established very recently (November 2013). The processes have been evaluated based on the available information and the process
modelling and economic assessment have had to be adjusted according to the available
information. For the ethanol process which is fairly complete, the established Aspen Plus
model made basis for dimensioning of the equipment which then were cost estimated using
Aspen In-Plant Cost Estimator. Based on equipment cost the total capital expenses were
estimated. However, for the processes lacking important data a rough approach was used
mainly to point out the main process and product challenges which will be guidance for the
process developers on where to focus the development efforts. One important task has also
been to establish process data for the LCA to be carried out by IFEU. The status of the data

Techno-economic assessment and market analysis
16
for the techno-economic evaluation for the biochemical processes and the thermochemical
processes are given in Table 1 and Table 2, respectively.
Table 1: Origin of data used in the technical evaluation of the biochemical refinery processes.
Process Data used in techno- economic evaluation
Ethanol Pretreatment Data for straw feedstock based on pilot scale trials.
Data for poplar feedstock based on lab scale (batch) experiments.
Hydrolysis Process tested in pilot scale and data based on experimental results
Data for poplar feedstock based on lab scale (batch) experiments.
Separate fermentation Process tested in pilot scale and data based on experimental results
Simultaneous scarification and fermentation (SScF)
Data for the straw based feedstock is based on expected performance of the new E1 organism in 2025. For the poplar based material Biogasol has assumed that the hydrolysis will have same performance as achieved in batch experiments on pretreated and washed fibres poplar fibres, while the fermentation will have the same performance as estimated for the straw based feedstock.
Product separation Based on NREL concept. Considered mature and proven technology
Butanol BDO fermentation
Only initial testing in lab. Very low performance yet. Significant development needed.
BDO separation
Concept demonstrated in lab on fermentation broth added 100 g/L BDO. Limited separation efficiency, high chemical consumption and high energy demand. New distillation based concept proposed.
BDO to MEK synthesis Process tested in lab scale.
MEK to butanol synthesis Process tested in lab scale.
Butyric/propionic acid Acid fermentation Process tested in lab.
Acid separation from broth Process recently tested in lab.
Water reduction in acid mixture (distillation)
Process not tested, but data generated by process simulation (Aspen Plus)
Maleic acid Not proven in lab
Chiral Not proven in lab
Lignin (Greenvalue) Only analytical method, no product defined
Lignin (Biogasol) Only analytical method, no product defined
Combined Heat and Power
Process simulated in Aspen Plus based on in house experience Economy data estimated from Aspen In Plant Cost Estimator and in house experience
Waste Water Treatment Process configuration and cost data provided by United Utilities

Techno-economic assessment and market analysis
17
Table 2: Origin of data used in the technical evaluation of the thermochemical biorefinery processes.
Process Data used in techno- economic evaluation
FT liquids / DME Pyrolysis Process tested on various biomass feedstock in pilot scale and data based on experimental results Economy data provided by BTG
Oil conditioning Process tested in pilot scale (pump skid) and input data determined by gasification requirements Economy data estimated from Aspen In-Plant Cost Estimator
Gasification
Process tested in pilot scale, but performance data based thermodynamic equilibrium predicted by Aspen Plus
Economy data from NREL report based on entrained gasifier for solid biomass
Syngas Cleaning and Conditioning
Not studied in SUPRABIO. Strategy described by NREL followed in the simulation. Economy data also based on NREL estimates.
Fuel synthesis / FT liquids
Process tested in lab scale. The data for the 2015 scenario is based on laboratory scale results at IMM. The data for 2025 is based on IMM estimates.
Economy data for FT reactor provided by IMM. Other equipment estimated from Aspen In-Plant Cost Estimator and NREL
Fuel synthesis / DME Process tested in lab scale. The data for the 2025 scenario is based on laboratory scale results at UBRUN in fixed bed reactors.
Economy data for DME reactor provided by IMM. Other equipments estimated from Aspen In Plant Cost Estimator and NREL
FT upgrading Not studied in SUPRABIO. Input data from Statoil used in the simulation as a black box. Economy data based on NREL estimates.
DME separation Not studied in SUPRABIO. Input data from an external publication used in the simulation as a black box. Economy data based also in an external publication for a similar process.
Combined Heat and Power Process simulated in Aspen Plus based on in house experience Economy data estimated from Aspen In-Plant Cost Estimator and in house experience
Waste Water Treatment
Process configuration and data provided by United Utilities
Economy data based on cost estimates for the main equipment units from Aspen In-Plant Cost Estimator and NREL
3.2 Methodology economic assessment
In the previous reports (Ljunggren et al. 20131 and Ochoa-Fernández et al. 20132) the presented economic analysis was rough and mainly based on incoming feedstock and chemicals/energy used throughout the process. In the present report only the processes possible to describe from feedstock to final product including waste treatment have been evaluated. In those cases where the process is modelled in Aspen Plus in sufficient detail, Aspen In-Plant Cost Estimator was used to establish the total equipment cost. An internal estimation tool developed in Statoil was used to calculate the total investment cost, see Appendix A for more details. As already mentioned in section 2.1 very limited integration possibilities were identified for the two biorefinery concepts. The different routes were therefore evaluated as separate processes, but in all cases integrated with the waste handling and treatment concept. This deviates from the original approach for the techno-economic analysis as illustrated in Figure 6 where the plan was to evaluate all separate process and the combine them into selected biorefinery concepts.

Techno-economic assessment and market analysis
18
Economic analysis of the separate routes including waste treatmentEconomic analysis of the separate routes including waste treatment Comment: The techno-economic evaluation will investigate the separates routes which passed the technical review. The routes where feed streams comes from other routes or add-ons (e.g. chiral, lignin and algae) will be evaluated assuming a cost on the feed streams.
This evaluation will also give insight to the possible economic benefits of different combinations of routes.
Techno-economic review of the separate routesInvestigation of the separate routes that passed the first technical evaluation. Based on the separate techno-economic evaluation of the routes the most promising refinery concepts will be identified and
further evaluated.
↓↓Et
han
ol r
ou
te
Bu
tan
ol r
ou
te
Org
anic
aci
d r
ou
te
Di-
acid
ro
ute
Ch
iral
ro
ute
Lign
in
WW
T
Solid
was
te t
reat
men
t
WWT and S-waste Treatment included
Techno-economic analysis of biorefinery concepts - examplesTechno-economic analysis of biorefinery concepts - examples Comment: The techno-economic evaluation of the separate processes will be followed by an evaluation of a few selected refinery concepts.
Lign
in
Ch
iral
ro
ute
Eth
ano
l ro
ute
Eth
ano
l ro
ute
Ch
iral
ro
ute
Techno-economic review of selected biorefinery ConceptsThis review will constitute the final part of D7-9 «Technical-economical model for biorefinery based on
biochemical conversion of lignocellulosic materials». It will also act as the basis for D7-11 «Final report on techno-economic assessment including the market potentials of SUPRABIO products».
Eth
ano
l ro
uteLi
gnin
Eth
ano
l ro
ute
↓
Figure 6: Methodology for the Techno-economic analysis, illustrated for the biochemical refinery concept
Techno-economic assessment and market analysis
19
4 Biochemical biorefinery scenarios
In this section the evaluation of four different biochemical biorefinery scenarios are presented both regarding technical and economic feasibility. The selected scenarios include:
I. Straw to Ethanol (2015) – Early implementation II. Straw to Ethanol (2025) – Mature technology configuration
III. Poplar to Ethanol (2025) – Mature technology configuration IV. Straw to Acids (2025) – Mature technology configuration
4.1 Scenario I – Straw to Ethanol – 2015
The straw to ethanol route consists of several steps as illustrated in Figure 7:
feed storage and handling,
pretreatment and enzymatic hydrolysis,
fermentation and distillation,
waste management and energy generation. In the present process evaluation five different sub-scenario strategies for waste management and energy generation have been considered. An overview of the different sub-scenarios is given in Table 3. In sub-scenario 1, the entire amount of stillage is sent to enzymatic hydrolysis and subsequently anaerobic digestion, while in sub-scenario 2 the solid and liquid are separated prior to methanogenesis, so that only the liquid waste is utilized for biogas production. In addition, in sub-scenarios 1-A and 2-A the solids are converted to syngas via the staged gasification process being developed by BTG and a gas turbine - steam cycle is used for energy generation. Sub-scenarios 1-B and 2-B also rely in staged gasification, but gas engine - steam cycle is used for energy conversion. Finally, sub-scenario 2-C does not include staged gasification, but all solid and gas fuels are sent directly to a fluidised bed furnace based boiler - steam cycle configuration. In all sub-scenarios it is aimed for producing enough steam and electricity for the process. Excess energy is converted to electricity and exported to the grid.

Techno-economic assessment and market analysis
20
Table 3: Overview sub-scenarios Sub-scenario 1-A:
Solids anaerobic digestion Staged gasification Gas turbine Steam cycle
Sub-scenario 1-B:
Solids anaerobic digestion Staged gasification Gas engine Steam cycle
Sub-scenario 2-A:
No solids anaerobic digestion Staged gasification Gas turbine Steam cycle
Sub-scenario 2-B:
No solids anaerobic digestion Staged gasification Gas engine Steam cycle
Sub-scenario 2-C:
No solids anaerobic digestion Boiler Steam cycle
Solids
Straw feedstock
Liquid
Feed storage and
handling
Pretreatment
and
enzymatic hydrolysis
Fermentation,
distillation and
dehydration
Staged gasification
Biogas production
CHP
Straw feedstock
Biogas
Syngas
Hyd
roly
sa
te
Steam
Electricity Solid - liquid
separation
Ethanol
Figure 7: Process block diagram illustrated for Sub-scenario 2-A.
4.1.1 Technical evaluation
A Biomass pretreatment
The principal aim of the pretreatment and hydrolysis is to release the carbohydrates and convert them into fermentable sugars. Figure 8 shows the process layout of the pretreatment process which consists of the following main process steps:
soaking
steam treatment The pretreatment process data has been supplied by Biogasol and the data is based on experimental work at their lab and pilot facility. However, the flash off in the flash tank has not been measured, but calculated in the process model in Aspen Plus. BioGasol has estimated the steam demand and the electricity demand from their pilot equipment. Biogasol is now scaling up their pretreatment process and they have demonstrated it at

Techno-economic assessment and market analysis
21
pilot plant capacity (up to 50 kg DM/hr) and at small scale demo capacity (1,000 kg DM/hr). They also report that they in 2013 completed the first sale of the first commercial pretreatment system (CarbofracTM 400) capable of treating up to 4,000 kg DM/hr. Biogasol has optimized the process for pretreatment of wheat straw, but report that they have tested successfully for example corn stover, sugar cane bagasse, hardwood and softwood on both pilot and small-scale demo. The hydrolysis process is done batch wise and uses standard equipment as tanks and pumps. Conditioning of the pretreated material (e.g. pH adjustment) can be done when filling the tank. One challenge is to handle the viscous pretreated feedstock and efficiently mix in the enzymes for further viscosity reduction. However, Biogasol does not report any issues related to this from their laboratory and pilot scale experiments. Presently, the general technology for pretreatment is at a relatively early development stage, but the concept and equipment presented by BioGasol is supported by results achieved in the laboratory and is demonstrated at 1,000 kg/hr scale. Based on the present knowledge and evaluation we do not see any showstoppers for the pretreatment technology and the hydrolysis process and we therefore consider the process to be proven and technically feasible.
De-watering
Steam treatment
Steam
Steam
reactorSoakingM M
M M
Flash
tank
M
Make-up water
Biomass
Acid
Pretreated biomass
Waste water
M
Figure 8: Simplified flow sheet of the pretreatment process
B Fermentation and Distillation
In the early implementation scenario (2015) hydrolysis and fermentation are done in two separate units; in a so-called Separate Hydrolysis and co-Fermentation configuration (SHcF). The fermentation process data has been supplied by Biogasol and is based on high temperature continuous fermentation experimental data achieved in their laboratory. The fermentation is done by Biogasol’s Pentocrobe 411 bacteria which convert both hexose (C6) and pentose (C5) to ethanol. Fermentation is an established large scale process. However, continuous fermentation using lignocellulosic material with water insoluble material present makes it impossible to recycle

Techno-economic assessment and market analysis
22
the microorganisms. It is therefore important that the organism growth is carefully controlled and the sugar concentration in the fermenter kept at a low level to avoid unwanted sugar loss. However, Biogasol does not report any issues related to this from their laboratory and pilot scale experiments. For the product separation Biogasol proposed to use the NREL concept since ethanol separation was not covered by the scope of SUPRABIO. The concept is illustrated in Figure 9 and a more detailed description of the process can be found in the corresponding NREL report6. No further technical evaluation has been carried out for this process. Based on the present knowledge and evaluation we do not see any issues for the SHcF fermentation process and we therefore consider the process to be technically feasible. This also applies for the distillation section which has been carefully investigated by NREL6.
Figure 9: Simplified flow diagram of the separation process
C Waste management
The waste from the ethanol product based biorefinery presented in this section consists of the stillage stream from the distillation section. Two sub-scenarios for waste management have been considered as described earlier. In sub-scenario 1, the entire amount of stillage is sent to enzymatic hydrolysis and subsequent anaerobic digestion, while in sub-scenario 2 the solid and liquid are separated prior to methanogenesis, so that only the liquid is utilized for biogas production. The remaining liquid stream from the anaerobic digestion is sent to a water treatment unit, consisting of three steps, i.e. activated sludge process, FeCl3 treatment and reverse osmosis.
6 NREL Technical Report NREL/TP-5100-47764, May 2011, “Design and Economics for Biochemical Conversion of
Lignocellulosic Biomass to Ethanol Dilute-Acid Pretreatment and Enzymatic Hydrolysis of Corn Stover”
Fermentation broth
Fermentation vents
Rectification
Column
Vent Scrubber
Stripper
Column
Clean water
CW
LP steam
LP steam
CW
Regenerate
CW
Molecular Sieve
Adsorption
Ethanol product
Water to recycleStillage

Techno-economic assessment and market analysis
23
The anaerobic digestion of a typical stillage stream from a biorefinery has been discussed by /Le & Hu 2013/7. An important technical issue is the fact that the acid pretreatment of the biomass leads to high sulphur content. Le and Hu have shown that such sulphur concentrations result in inhibition of the methanogenesis step and a reduction in the methane yield. Therefore, especially for sub-scenario 1 where the solids are not removed previous to digestion a 50-day HRT needs to be applied to convert over 95% of the SO4. Otherwise, the main components of the waste water treatment system are quite mature. Anaerobic digestion is a well-established process, with around 20,000 units operated in Europe, and maintenance is relatively simple. The activated sludge process is also well established in the waste treatment industry. It is simple, both with regards to construction and maintenance. RO membranes are the most sensitive equipment. Their main limiting factor is fouling due to pore clogging or adsorption of solutes on the membrane surface. Existing experimental work indicates that the water quality after RO treatment is slightly lower than typical potable quality standard. It is, however, believed that it will be acceptable for biorefinery requirements.
D Energy conversion
Three different alternatives have been considered for conversion of the solid waste fraction and biogas into heat and electricity in a combined heat and power plant (CHP):
A: The solid fraction is converted to syngas via staged gasification. The resulting syngas and the biogas product from anaerobic digestion are converted into steam and electricity via a gas turbine-steam cycle.
B: The solid fraction is converted to syngas via staged gasification. The resulting syngas and the biogas product from anaerobic digestion are converted into steam and electricity via a gas engine-steam cycle.
C: The solid fraction and the biogas product from anaerobic digestion are converted into steam and electricity via a boiler-steam cycle.
The staged gasification process is based on BTG’s technology where the solid residue is converted by fast pyrolysis into an organic vapour. This resulting vapour is subsequently sent to a gasifier and reformed catalytically to a syngas. Experimental work carried out by BTG during the SUPRABIO project in a small-scale unit (1-5 kg biomass/hr) confirms the ability to successfully convert a typical stillage fraction from a biorefinery. Still, there are some issues that are not fully clarified including the need for gas cleaning for the overall configuration, the stability of the catalyst and the cold gas efficiency. For example, the quality of the syngas and durability of the catalyst is related to the strategy selected for the waste water treatment. In fact, the selection of sub-scenario 1, where the solid fraction is sent through the anaerobic digestion step may be mandatory in order to succeed with the stage gasification process since most of the sulphur components have then been removed.
7 Le, S. & Hu, R.: Report on Energy production from biorefinery wastewater. Deliverable D 5-11 prepared for the SUPRABIO
project, supported by EC’s FP7 programme. Warrington, 2013.

Techno-economic assessment and market analysis
24
The biomass combustion in a fluidized bed was introduced as an alternative to staged gasification and has been evaluated by process modelling in Aspen Plus. Biomass combustion is an established mature technology for conventional biomass conversion which results in high energy efficiencies (typically above 90%).
E Overall performance
In Table 4 the total energy efficiency for the five different sub-scenarios are listed. The sub-scenarios using staged gasification combined with gas turbine or gas engine produce significant amounts of electricity. A challenge with these four sub-scenarios is that there is not enough energy in the flue gas from the turbine to produce sufficient steam for the process. This is in particular the case for the gas engine where the flue gas temperature is low resulting in very limited steam production. Therefore extra steam is needed for all the gas turbine and gas engine scenarios. For the boiler based sub-scenario (2-C) all the waste is converted to steam and after supplying enough steam to the process the produced electricity does not cover the electricity demand and it was estimated that 530 kW has to be imported from the grid. The total lower heating value based energy efficiency is about 50% for all the sub-scenarios, while the net efficiency, also taking into account the steam and electricity balance gives about 10% higher efficiency for the staged gasification based sub-scenarios. From the technical evaluation it is therefore difficult to select a preferred scenario and an economic evaluation is necessary to distinguish between them. Table 4: Overall energy efficiency for main Scenario I Straw to ethanol (2015)
Sub-scenario 1-A
Energy [kW]
Sub-scenario 1-B
Energy [kW]
Sub-scenario 2-A
Energy [kW]
Sub-scenario 2-B
Energy [kW]
Sub-scenario 2-C
Energy [kW]
LHV Biomass Feed: 22 600 22 600 22 600 22 600 22 600
LHV Ethanol Product: 11 600 11 600 11 600 11 600 11 600
Electricity Export: 1 250 1 840 1 060 1 580 -700
MP steam deficit: 0 0 0 0 0
LP steam deficit: 610 1 100 500 1 000 0
LHV efficiency1
51 % 51 % 51 % 51 % 51 %
Net efficiency2 58 % 60 % 57 % 59 % 48 %
1Calculated as: LHV Ethanol Product/ (LHV Biomass Feed) 2Calculated as: LHV Ethanol Product/ (LHV Biomass Feed – Electricity Export/0.4 + Steam deficit/0.9)
4.1.2 Economic evaluation
The direct installed equipment cost for each process section is shown in Figure 10. The staged gasification process has a significant contribution to the total installed cost. The CHP

Techno-economic assessment and market analysis
25
in the sub-scenarios using a gas turbine for electricity production is the largest contributor to the total direct installed cost. This is because of the costly compressors and turbine used in the CHP section.
Figure 10: Direct installed cost for main Scenario I Straw to ethanol (2015)
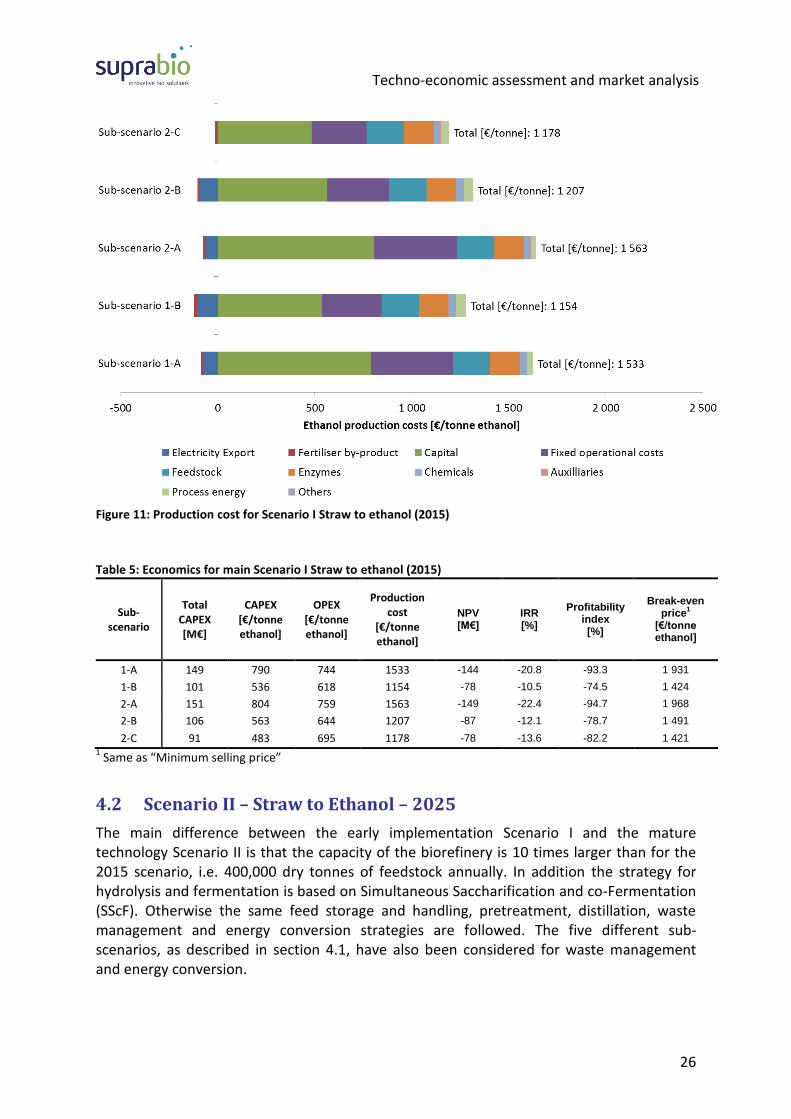
In Figure 11 the total production cost divided into categories for each sub-scenario is shown. In all cases the capital related cost is the largest cost category followed by the fixed operating cost including personnel cost, maintenance and insurance. In Table 5 the total CAPEX, OPEX and total production cost per tonne ethanol is listed for each sub-scenario. In addition the net present value (NPV), internal rate of return (IRR), profitability index (PI) and break-even prices for each biorefinery sub-scenario was determined based on the assumptions listed in Appendix A. All sub-scenarios result in negative NPV. To determine when the project can become economically viable the minimum selling price was calculated. In Table 5 these values are listed and it was concluded that the selling price must be well above €1400/tonne ethanol which is significant higher than €824/tonne ethanol used in the NPV calculation.
Techno-economic assessment and market analysis
26
Figure 11: Production cost for Scenario I Straw to ethanol (2015)
Table 5: Economics for main Scenario I Straw to ethanol (2015)
Sub-scenario
Total CAPEX [M€]
CAPEX [€/tonne ethanol]
OPEX [€/tonne ethanol]
Production cost
[€/tonne ethanol]
NPV [M€]
IRR [%]
Profitability index [%]
Break-even price
1
[€/tonne ethanol]
1-A 149 790 744 1533 -144 -20.8 -93.3 1 931
1-B 101 536 618 1154 -78 -10.5 -74.5 1 424
2-A 151 804 759 1563 -149 -22.4 -94.7 1 968
2-B 106 563 644 1207 -87 -12.1 -78.7 1 491
2-C 91 483 695 1178 -78 -13.6 -82.2 1 421
1 Same as “Minimum selling price”
4.2 Scenario II – Straw to Ethanol – 2025
The main difference between the early implementation Scenario I and the mature technology Scenario II is that the capacity of the biorefinery is 10 times larger than for the 2015 scenario, i.e. 400,000 dry tonnes of feedstock annually. In addition the strategy for hydrolysis and fermentation is based on Simultaneous Saccharification and co-Fermentation (SScF). Otherwise the same feed storage and handling, pretreatment, distillation, waste management and energy conversion strategies are followed. The five different sub-scenarios, as described in section 4.1, have also been considered for waste management and energy conversion.

Techno-economic assessment and market analysis
27
4.2.1 Technical evaluation
A Biomass pretreatment
The biomass pretreatment section is the same as for the Scenario I – Straw to Ethanol (2015), see section 4.1.1A, but scaled up to 10 times larger feedstock input. The largest single line foreseen by BioGasol is about 12 tonnes DM/hr, which means that four parallel lines of 12 tonnes DM/hr units are needed for the mature technology scenarios 2025 (100 MLPY).
B Simultaneous Hydrolysis and Fermentation
In the mature technology scenarios (2025) the hydrolysis and fermentation is planned to be done simultaneously in a common reactor by Simultaneous Saccharification and co-Fermentation (SScF). The great challenge with SSF is to find hydrolysis/fermentation conditions where both the enzyme and the fermentation organism can perform optimum or close to optimum. According to Biogasol, to date there is no efficient simultaneous co-fermenting yeast with sufficient ethanol yield at high biomass concentration and with high sugar conversion. The present process is based on the recently isolated organism E1 (Bacillus coagulans), which is aimed for growing under the conditions determined by the standard cellulose degrading enzymes (e.g. 50 °C and pH 5) and through genetic engineering making ethanol the major fermentation product. Biogasol was working on this organism in SUPRABIO’s work package 2 and they have estimated the expected performance for the organism in 2025. However, the E1 organism turned out to be recalcitrant to genetic modification. More recently Biogasol therefore decided to focus on combining the Pentocrobe™ organism and a new enzyme functional at a higher temperature and pH than the standard enzymes. After optimisation studies they determined that the highest pH and temperature where the enzyme was performing close to its optimum was at pH 6.5 and 59°C. To meet these conditions, the Pentocrobe™ organism with optimal growing conditions at pH 7 and 70°C was adapted towards the SSF conditions. Today the organism has been shown to have high sugar conversion and ethanol yield at pH 6.5 and 59°C. Unfortunately, very recently Biogasol found that the organism and the enzyme do not work well together. The Pentocrobe™ organism performed as expected by fermenting the sugars into ethanol, but the enzymatic hydrolysis of cellulose was minimal. The fermentation conditions seem to inhibit the enzymatic hydrolysis. This needs to be solved before the SScF process can be demonstrated. In the present scenario the SScF process concept is assumed to be commercially available by 2025. Biogasol can succeed with the concept by either
further develop the E1 organism to become an effective ethanol producer,
solve the observed inhibition effect between the Pentocrobe™ organism and the hydrolysing enzymes.
In the present Scenario the selected process is based on Biogasol’s estimated performance for the E1 organism by 2025. The estimation is based on Biogasol’s microbiologists’ knowledge and experience. They claim that the estimates are realistic and believed not to
Techno-economic assessment and market analysis
28
be optimistic and that the highest uncertainty is believed to be in the estimated retention time.
C Distillation
The distillation section has the same layout as for the Scenario I – Straw to Ethanol (2015). See section 4.1.1B.
D Waste management and energy conversion
The waste management and energy generation scenarios are the same as for the Scenario I – Straw to Ethanol (2015). See sections 4.1.1C and 4.1.1D.
E Overall performance
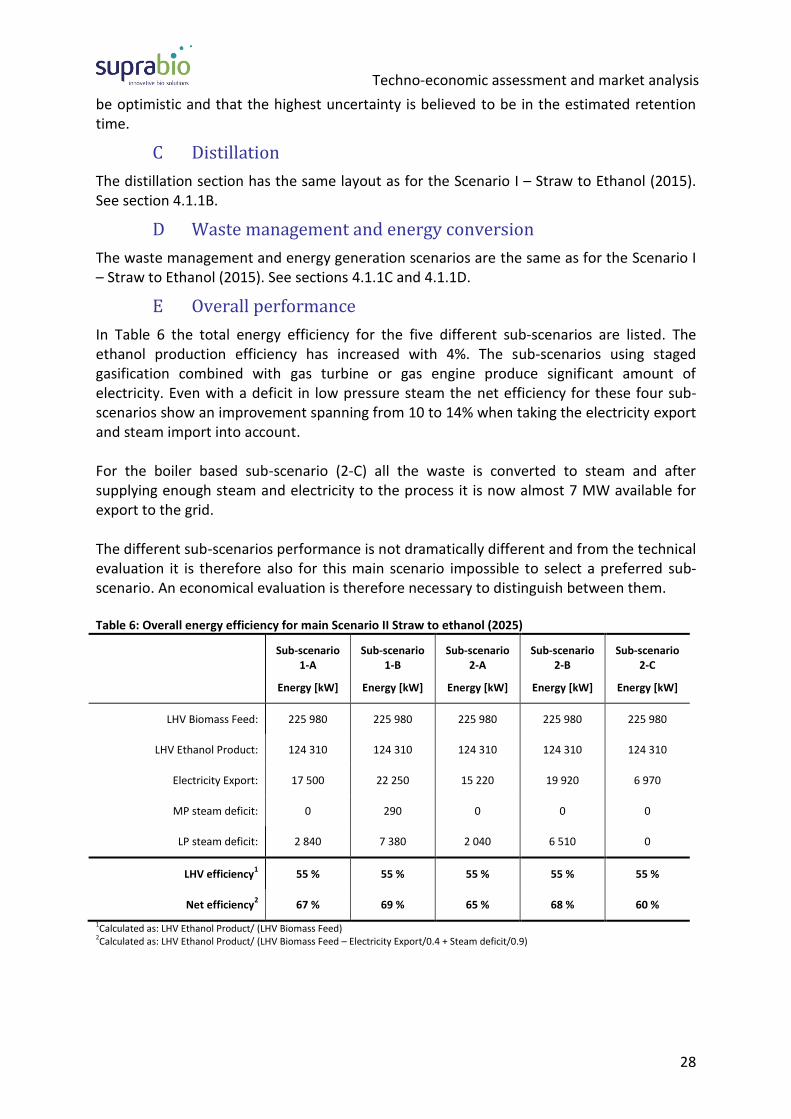
In Table 6 the total energy efficiency for the five different sub-scenarios are listed. The ethanol production efficiency has increased with 4%. The sub-scenarios using staged gasification combined with gas turbine or gas engine produce significant amount of electricity. Even with a deficit in low pressure steam the net efficiency for these four sub-scenarios show an improvement spanning from 10 to 14% when taking the electricity export and steam import into account. For the boiler based sub-scenario (2-C) all the waste is converted to steam and after supplying enough steam and electricity to the process it is now almost 7 MW available for export to the grid. The different sub-scenarios performance is not dramatically different and from the technical evaluation it is therefore also for this main scenario impossible to select a preferred sub-scenario. An economical evaluation is therefore necessary to distinguish between them. Table 6: Overall energy efficiency for main Scenario II Straw to ethanol (2025)
Sub-scenario 1-A
Energy [kW]
Sub-scenario 1-B
Energy [kW]
Sub-scenario 2-A
Energy [kW]
Sub-scenario 2-B
Energy [kW]
Sub-scenario 2-C
Energy [kW]
LHV Biomass Feed: 225 980 225 980 225 980 225 980 225 980
LHV Ethanol Product: 124 310 124 310 124 310 124 310 124 310
Electricity Export: 17 500 22 250 15 220 19 920 6 970
MP steam deficit: 0 290 0 0 0
LP steam deficit: 2 840 7 380 2 040 6 510 0
LHV efficiency1
55 % 55 % 55 % 55 % 55 %
Net efficiency2 67 % 69 % 65 % 68 % 60 %
1Calculated as: LHV Ethanol Product/ (LHV Biomass Feed) 2Calculated as: LHV Ethanol Product/ (LHV Biomass Feed – Electricity Export/0.4 + Steam deficit/0.9)
Techno-economic assessment and market analysis
29
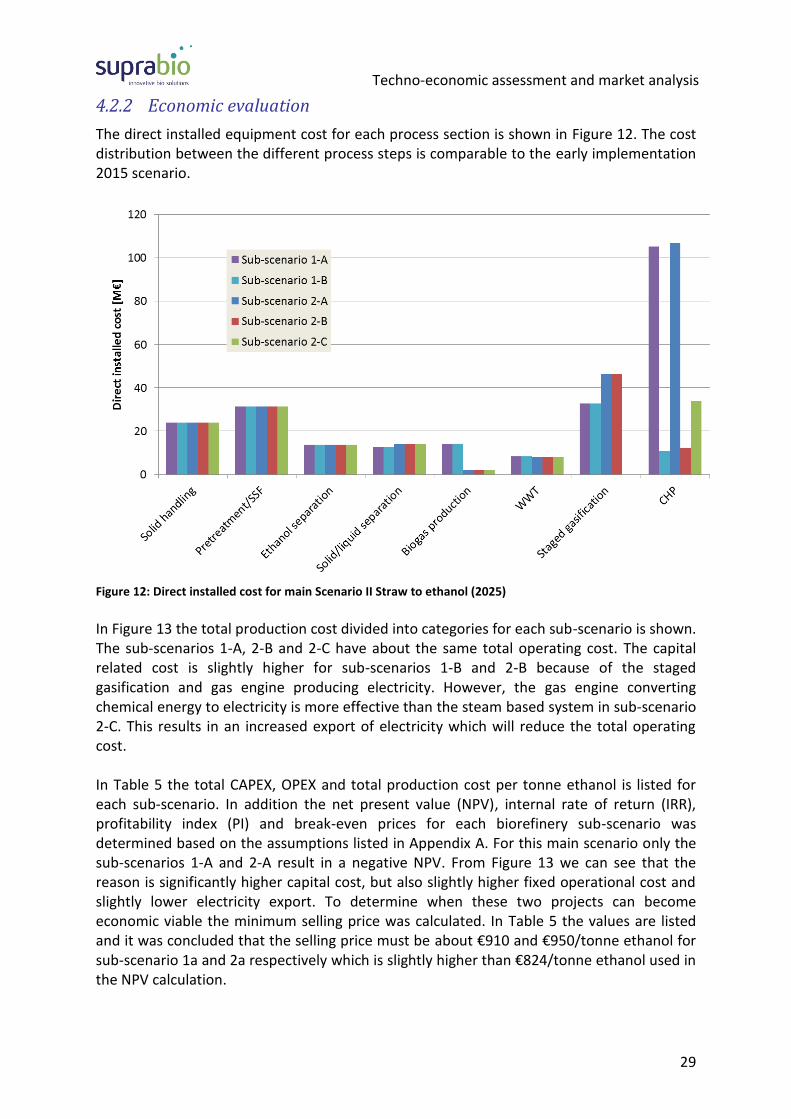
4.2.2 Economic evaluation
The direct installed equipment cost for each process section is shown in Figure 12. The cost distribution between the different process steps is comparable to the early implementation 2015 scenario.
Figure 12: Direct installed cost for main Scenario II Straw to ethanol (2025)
In Figure 13 the total production cost divided into categories for each sub-scenario is shown. The sub-scenarios 1-A, 2-B and 2-C have about the same total operating cost. The capital related cost is slightly higher for sub-scenarios 1-B and 2-B because of the staged gasification and gas engine producing electricity. However, the gas engine converting chemical energy to electricity is more effective than the steam based system in sub-scenario 2-C. This results in an increased export of electricity which will reduce the total operating cost. In Table 5 the total CAPEX, OPEX and total production cost per tonne ethanol is listed for each sub-scenario. In addition the net present value (NPV), internal rate of return (IRR), profitability index (PI) and break-even prices for each biorefinery sub-scenario was determined based on the assumptions listed in Appendix A. For this main scenario only the sub-scenarios 1-A and 2-A result in a negative NPV. From Figure 13 we can see that the reason is significantly higher capital cost, but also slightly higher fixed operational cost and slightly lower electricity export. To determine when these two projects can become economic viable the minimum selling price was calculated. In Table 5 the values are listed and it was concluded that the selling price must be about €910 and €950/tonne ethanol for sub-scenario 1a and 2a respectively which is slightly higher than €824/tonne ethanol used in the NPV calculation.

Techno-economic assessment and market analysis
30
Figure 13: Production cost for Scenario II Straw to ethanol (2025)
Table 7: Economics for main Scenario II Straw to ethanol (2025)
Sub-scenario
Total CAPEX [M€]
CAPEX [€/tonne ethanol]
OPEX [€/tonne ethanol]
Production cost
[€/tonne ethanol]
NPV [M€]
IRR [%]
Profitability index [%]
Break-even price
1
[€/tonne ethanol]
1-A 682 339 405 743 -125 2.3 -17.6 914
1-B 438 218 340 558 218 11.4 47.8 667
2-A 716 355 419 774 -180 1.2 -24.2 953
2-B 470 234 358 591 161 9.5 32.8 709
2-C 383 190 381 571 218 12.3 54.7 667
1 Same as “Minimum selling price”
4.3 Scenario III – Poplar to Ethanol – 2025
In Scenario III the feedstock is changed from straw to poplar and in Table 8 the composition of both straw and poplar are listed. The main difference is that poplar has more lignin and less xylan compared to the straw. In addition the ash content in straw is higher.

Techno-economic assessment and market analysis
31
Table 8: Feedstock composition
Straw Composition [%]
Poplar Composition [%]
Water content 15% 45%
Composition [% of DMT] Composition [% of DMT]
Cellulose Glucan 38% 41.3% Hemicellulose Arabinan 1.8% 0.5% Xylan 26.1% 12.1% Galactan 1.0% 0.5% Acetate 2.8% 3.9%
Lignin 18.5% 30.9%
Inorganic 5.3% 1.4%
Other Org. Comp. 6.5% 9.5%
4.3.1 Technical evaluation
A Biomass pretreatment
Based on recommendations from Biogasol the biomass pretreatment section was assumed to be the same as for the Scenario II – Straw to Ethanol (2025), see section 4.2.1A. The process data supplied by Biogasol is based on batch pretreatment experiments on poplar wood and on hydrolysis of washed poplar fibre material. This is an approximation that should be confirmed by larger scale experiments.
B Simultaneous Hydrolysis and Fermentation
Biogasol has only carried out hydrolysis of washed poplar fibre material. The hydrolysis process in the evaluated process is assumed to have the same performance as measured for the washed fibres. This is an approximation that should be confirmed by experiments on real material. Biogasol has not carried out fermentation experiments on the hydrolysate produced from the poplar material. For the SScF process expected to have available in 2025 they have therefore assumed hydrolysis performance as achieved in the laboratory experiments and fermentation yield and conversion to be the same as for the straw material. The SScF layout is assumed to be the same as for the Scenario II – Straw to Ethanol (2025), see section 4.2.1B. The assumed process performance is a major assumption that has to be confirmed by laboratory experiments, but also in larger scale experiments on real poplar feedstock. In addition the challenges experienced with the SScF concept has to be sorted out, see section 4.2.1B.
C Distillation
The distillation section is the same as for the Scenario II – Straw to Ethanol (2015), see section 4.2.1C.

Techno-economic assessment and market analysis
32
D Waste management and energy conversion
The waste management and energy generation section is the same as for the Scenario II – Straw to Ethanol (2025), see sections 4.2.1C and 4.2.1D.
E Overall performance
In Table 9 the total energy efficiency for the five different sub-scenarios are listed. The major difference when changing from straw to poplar based feedstock is that the lower heating value based efficiency is reduced with more than 10% compared to Scenario II where straw is used as feedstock. The main reason is the lower sugar content and slightly lower hydrolysis yield. The sub-scenarios using staged gasification combined with gas turbine or gas engine produce a significant amount of electricity. In fact in all sub-scenarios significantly more electricity is produced compared to the straw based feedstock. In addition more steam is produced reducing the steam import for most of the sub-scenarios. This means that even with a lower ethanol production the net efficiency becomes relatively high, but still somewhat below the Scenario II which uses straw as feedstock. From the technical evaluation it is impossible to select a preferred sub-scenario and an economical evaluation is necessary to distinguish between them. Table 9: Overall energy efficiency for main Scenario III Poplar to ethanol (2025)
Sub-scenario 1-A
Energy [kW]
Sub-scenario 1-B
Energy [kW]
Sub-scenario 2-A
Energy [kW]
Sub-scenario 2-B
Energy [kW]
Sub-scenario 2-C
Energy [kW]
LHV Biomass Feed: 222 810 222 810 222 810 222 810 222 810
LHV Ethanol Product: 92 760 92 760 92 760 92 760 92 760
Electricity Export: 32 370 37 960 24 190 32 560 17 620
MP steam deficit: 0 0 0 0 0
LP steam deficit: 0 7 380 230 3 500 0
LHV efficiency1
42 % 42 % 42 % 42 % 42 %
Net efficiency2 65 % 70 % 57 % 64 % 52 %
1Calculated as: LHV Ethanol Product/ (LHV Biomass Feed) 2Calculated as: LHV Ethanol Product/ (LHV Biomass Feed – Electricity Export/0.4 + Steam deficit/0.9)
4.3.2 Economic evaluation
The direct installed equipment cost for each process section is shown in Figure 14. The cost distribution between the different process steps is comparable to the Scenario II, but with slightly higher cost related to the solid waste treatment like staged gasification and the boiler.

Techno-economic assessment and market analysis
33
Figure 14: Direct installed cost for main Scenario III Poplar to ethanol (2025)
In Figure 15 the total production cost divided into categories for each sub-scenario is shown. Again it can be observed that the sub-scenarios 1-A, 2-B and 2-C have about the same total operating cost. The capital related cost is slightly higher for sub-scenarios 1-B and 2-B because of the staged gasification and gas engine producing electricity. However, the gas engine converting chemical energy to electricity is more effective than the steam based system in sub-scenario 2-C. This results in an increased export of electricity which will reduce the total operating cost. In Table 10 the total CAPEX, OPEX and total production cost per tonne ethanol is listed for each sub-scenario. In addition the net present value (NPV), internal rate of return (IRR), profitability index (PI) and break-even prices for each biorefinery sub-scenario was determined based on the assumptions listed in Appendix A. For this main scenario all the sub-scenarios result in a negative NPV, but sub-scenarios 1-A and 2-A have a significant lower NPV compared to the others. From Figure 15 it can be seen that the reason is significantly higher capital cost for sub-scenarios 1-A and 2-A, but also slightly higher fixed operational cost and slightly lower electricity export. To determine when these two projects can become economically viable the minimum selling price was calculated. In Table 10 the values are listed and it was concluded that the selling price must be about €1,300 and €1,470/tonne ethanol for sub-scenario 1-A and 2-A, respectively which are significantly higher than €824/tonne ethanol used in the NPV calculation. For the three other sub-scenarios the selling price only needs to be slightly increased to become economically viable.

Techno-economic assessment and market analysis
34
Figure 15: Production cost for main Scenario III Poplar to ethanol (2025)
Table 10: Economics for main Scenario III Poplar to ethanol (2025)
Sub-scenario
Total CAPEX [M€]
CAPEX [€/tonne ethanol]
OPEX [€/tonne ethanol]
Production cost
[€/tonne ethanol]
NPV [M€]
IRR [%]
Profitability index [%]
Break-even price
1
[€/tonne ethanol]
1-A 836 556 468 1 024 -499 -5.5 -57.5 1 304
1-B 496 330 354 684 -27 4.2 -5.3 850
2-A 912 607 555 1 162 -669 -9.2 -70.5 1 467
2-B 557 371 406 777 -145 1.0 -25.0 963
2-C 442 295 461 756 -83 2.2 -18.1 904 1 Same as “Minimum selling price”
4.4 Scenario IV – Straw to Mixed Acids – 2025
4.4.1 Technical evaluation
A Biomass pretreatment and hydrolysis
The biomass pretreatment section is the same as for the Scenario I – Straw to Ethanol (2015) but scaled to 400 ktonnes dry straw feed per year, See section 4.1.1A. The hydrolysis section has the same yields and conversions as for the 2015 case.

Techno-economic assessment and market analysis
35
B Acids fermentation and separation
The fermentation broth (stream 1 in Figure 16) is sent to the separation unit consisting of a Reverse Electro-Enhanced Dialysis (REED) unit combined with an ElectroDialysis with Bipolar Membrane (EDBM) unit delivered by Jurag Separation A/S8. According to the supplier the fermentation broth can continuously be taken from the fermenter and pumped into the REED unit lowering the acid concentration and then return the broth to the fermenter. This recirculation could increase the productivity in the fermenter by continuously removing inhibiting organic acids and replacing them by alkaline hydroxide ions. However, in the selected layout a one pass solution is used. For the butyric acid mixture case it means that
640 mol/m3 concentration in the incoming stream to the REED unit is lowered to 60 mol/m3 concentration in one pass. After passing through the REED unit the broth is sent further to a solid – liquid separation unit, while the separated acid water mixture is sent from the EDBM unit to a distillation column to further up concentrating the acid mixture to only contain 20% water.
Hydrolysate
239 350 kg/hrFermenter REED
Water
95 820 kg/hr
Fermentation gas
12 090 kg
1
EDBM
Solid liquid
separation
2
Acid mixture
19 000 kg
Solids
45 930 kg
Liquid
102 840 kg
Distillation
Water
155 310 kg
Figure 16: The acid process illustrated for butyric acid mixture production
According to the developer of the mixed acid production process (Aalborg) the fermentation and REED based separation have already been proven in lab on a wheat based SUPRABIO hydrolysate received from Biogasol, and the performance data given are based on these results. A major concern raised during the technical evaluation in Ljunggren et al. (2013)1 was the potential interaction between the impurities and solid materials in the fermentation broth and the membranes. However, Aalborg did not observe membrane fouling in the REED unit despite high solid concentration. In their present laboratory process layout the EDBM process is not implemented, but done in batches subsequently after the REED unit. In the EDBM unit the mixed salt solution coming from the REED unit is regenerated into acids and bases.
8 JURAG Separation A/S. Gydevang 4A, DK-3450 Alleroed, Denmark (http://www.jurag.dk)

Techno-economic assessment and market analysis
36
C Waste management and energy conversion
The waste management and energy conversion section is assumed to have the same layout and performance as for the ethanol scenarios.
D Overall performance
Aalborg has given mass and energy balance estimates for a process producing acids from a 1,000 kg/hr hydrolysate which has been linearly scaled up to the actual hydrolysate stream when utilising 400 ktonnes dry straw based feedstock annually. For the present evaluation limited process knowledge and experience have been available, but Alborg in cooperation with Jurag has recently established a process layout tested in lab. The process related data for both acid mixture production cases are shown in Figure 17 and Figure 18. The acid mixture production process has a relatively high electricity demand, see Table 11 and Table 12. The REED/EDBM unit is the main consumer of electrical energy and the higher consumption in the propionic acid process is due to the higher acid production resulting in higher acid flux through the membrane.
Electricity
28 350 kW
Butyric acid fermentation(37°C)
Process water95 829 kg/hr
Hydrolysate239 350 kg/hr
Electricity
445 kW
Fermentationbroth
323 080 kg/hrREED/EDBM
including distillation
NaOH
865 kg/hr
Waste water from distillation155 310 kg/hr
Acid mixture(20wt% water)19 000 kg/hr
LP-steam
297 100 kg/hr
Cooling water
10 043 640 kg/hr
Waste fromREED unit
148 770 kg/hrCooling water
9 605 kg/hr
Fermentationvent
12 090 kg/hr
Figure 17: Butyric acid production and separation

Techno-economic assessment and market analysis
37
Table 11: Overall energy efficiency for main Scenario IVa Straw to butyric acid (2025)
Butyric acid Straw
Sub-scenario 2-C Energy [kW]
LHV Biomass Feed: 225 980 LHV Acid Product: 85 240 Electricity Export: -37 350 MP steam deficit: 0 LP steam deficit: 29 910
LHV efficiency1
38 % Net efficiency
2 24 %
1Calculated as: LHV Ethanol Product/ (LHV Biomass Feed) 2Calculated as: LHV Ethanol Product/ (LHV Biomass Feed – Electricity Export/0.4 + Steam deficit/0.9)
Electricity
42 575 kW
Propionic acid fermentation
(30°C)
Process water95 829 kg/hr
Hydrolysate239 350 kg/hr
Electricity
445 kW
Fermentationbroth
332 690 kg/hrREED/EDBM
including distillation
NaOH
865 kg/hr
Waste water from distillation192 740 kg/hr
Acid mixture(20wt% water)22 090 kg/hr
LP-steam
497 650 kg/hr
Cooling water
16 734 740 kg/hr
Waste fromREED unit
117 560 kg/hrCooling water
146 590 kg/hr
Fermentationvent
2 480 kg/hr
Figure 18: Propionic acid production and separation
Table 12. Overall energy efficiency for main Scenario IVb Straw to propionic acid (2025)
Propionic acid Straw
Sub-scenario 2-C Energy [kW]
LHV Biomass Feed: 225 980 LHV Acid Product: 101 560 Electricity Export: -51 480 MP steam deficit: 0 LP steam deficit: 59 520
LHV efficiency1
45 % Net efficiency
2 24 %
1Calculated as: LHV Ethanol Product/ (LHV Biomass Feed) 2Calculated as: LHV Ethanol Product/ (LHV Biomass Feed – Electricity Export/0.4 + Steam deficit/0.9)
4.4.2 Economic evaluation
Because of the limited information on the REED/EDBM unit it was impossible to estimate the capital cost. However, an estimate for separation of lactic acid has been worked out by Jurag. In the present economy estimation their estimate has been scaled and used directly.

Techno-economic assessment and market analysis
38
This is a significant assumption introducing a major uncertainty to the estimate. In Figure 19 the estimated direct installation costs for all the process steps are shown.
Figure 19: Direct installed cost for main Scenario IV Straw to acids (2025)
In Figure 20 the total production cost divided into categories for both sub-scenarios are shown. We observe that the propionic acid sub-scenario has slightly higher total operating cost. The acid production is a more effective resulting in more acids per straw feedstock. However, more energy is needed for the process, mainly in the separation process. In Table 13 the total CAPEX, OPEX and total production cost per tonne acids is listed for each sub-scenario. In addition the net present value (NPV), internal rate of return (IRR), profitability index (PI) and break-even prices for each biorefinery sub-scenario was determined based on the assumptions listed in Appendix A. For this main scenario both sub-scenarios result in a negative NPV. To determine when these two projects can become economically viable the minimum selling price was calculated. In Table 13 the values are listed and it was concluded that the selling price must be about €1,200 and €1,275/tonne for propionic and butyric acid, respectively, which are significantly higher than €724/tonne acid mixture used in the NPV calculation.

Techno-economic assessment and market analysis
39
Figure 20: Production cost for main Scenario IV Straw to acids (2025)
Table 13: Economics for main Scenario IV Straw to acids (2025)
Sub-scenario
Total CAPEX [M€]
CAPEX [€/tonne
acid mixture]
OPEX [€/tonne
acid mixture]
Production cost
[€/tonne acid
mixture]
NPV [M€]
IRR [%]
Profitability index [%]
Break-even price
1
[€/tonne acid mixture]
Butyric acid
mixture 626 275 781 1 055 -741 - -113.8 1 194
Propionic acid
mixture 708 267 874 1 141 -1 012 - -137.3 1 275
1 Same as “Minimum selling price”
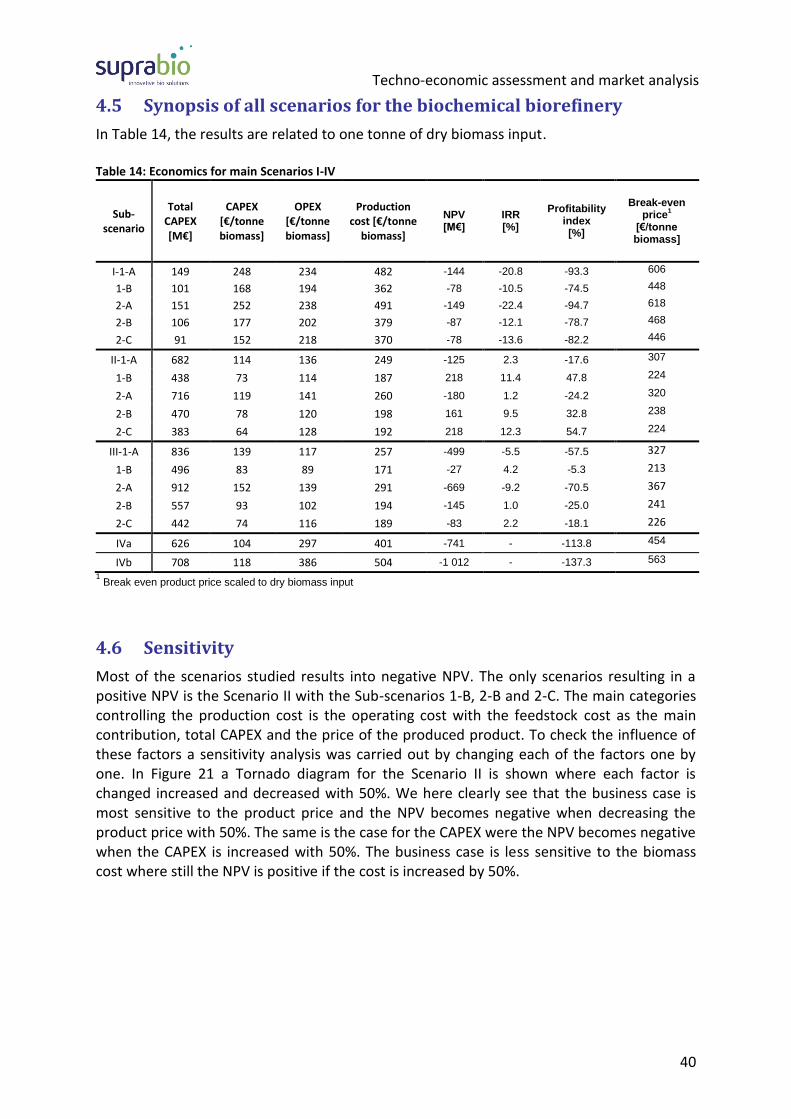
Techno-economic assessment and market analysis
40
4.5 Synopsis of all scenarios for the biochemical biorefinery
In Table 14, the results are related to one tonne of dry biomass input. Table 14: Economics for main Scenarios I-IV
Sub-scenario
Total CAPEX [M€]
CAPEX [€/tonne biomass]
OPEX [€/tonne biomass]
Production cost [€/tonne
biomass]
NPV [M€]
IRR [%]
Profitability index [%]
Break-even price
1
[€/tonne biomass]
I-1-A 149 248 234 482 -144 -20.8 -93.3 606
1-B 101 168 194 362 -78 -10.5 -74.5 448
2-A 151 252 238 491 -149 -22.4 -94.7 618
2-B 106 177 202 379 -87 -12.1 -78.7 468
2-C 91 152 218 370 -78 -13.6 -82.2 446
II-1-A 682 114 136 249 -125 2.3 -17.6 307
1-B 438 73 114 187 218 11.4 47.8 224
2-A 716 119 141 260 -180 1.2 -24.2 320
2-B 470 78 120 198 161 9.5 32.8 238
2-C 383 64 128 192 218 12.3 54.7 224
III-1-A 836 139 117 257 -499 -5.5 -57.5 327
1-B 496 83 89 171 -27 4.2 -5.3 213
2-A 912 152 139 291 -669 -9.2 -70.5 367
2-B 557 93 102 194 -145 1.0 -25.0 241
2-C 442 74 116 189 -83 2.2 -18.1 226
IVa 626 104 297 401 -741 - -113.8 454
IVb 708 118 386 504 -1 012 - -137.3 563
1 Break even product price scaled to dry biomass input
4.6 Sensitivity
Most of the scenarios studied results into negative NPV. The only scenarios resulting in a positive NPV is the Scenario II with the Sub-scenarios 1-B, 2-B and 2-C. The main categories controlling the production cost is the operating cost with the feedstock cost as the main contribution, total CAPEX and the price of the produced product. To check the influence of these factors a sensitivity analysis was carried out by changing each of the factors one by one. In Figure 21 a Tornado diagram for the Scenario II is shown where each factor is changed increased and decreased with 50%. We here clearly see that the business case is most sensitive to the product price and the NPV becomes negative when decreasing the product price with 50%. The same is the case for the CAPEX were the NPV becomes negative when the CAPEX is increased with 50%. The business case is less sensitive to the biomass cost where still the NPV is positive if the cost is increased by 50%.

Techno-economic assessment and market analysis
41
Figure 21: Tornado diagram for Scenario II sub-scenario 1-B
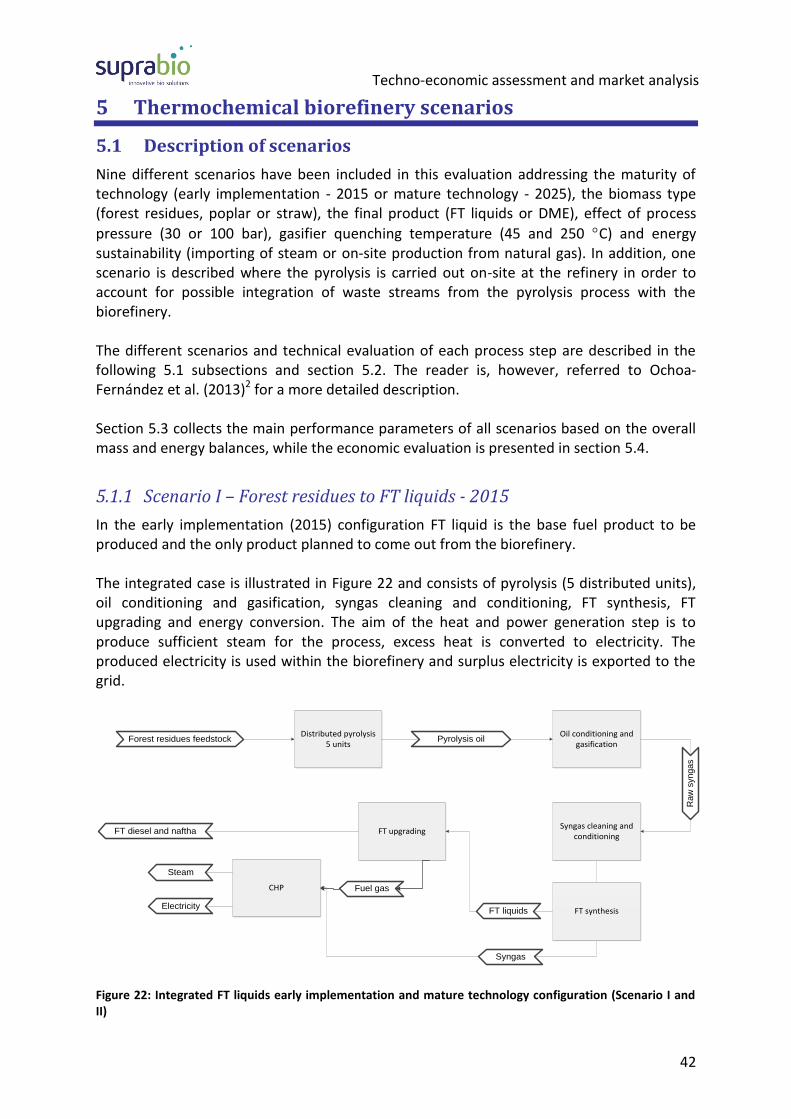
Techno-economic assessment and market analysis
42
5 Thermochemical biorefinery scenarios
5.1 Description of scenarios
Nine different scenarios have been included in this evaluation addressing the maturity of technology (early implementation - 2015 or mature technology - 2025), the biomass type (forest residues, poplar or straw), the final product (FT liquids or DME), effect of process
pressure (30 or 100 bar), gasifier quenching temperature (45 and 250 C) and energy sustainability (importing of steam or on-site production from natural gas). In addition, one scenario is described where the pyrolysis is carried out on-site at the refinery in order to account for possible integration of waste streams from the pyrolysis process with the biorefinery. The different scenarios and technical evaluation of each process step are described in the following 5.1 subsections and section 5.2. The reader is, however, referred to Ochoa-Fernández et al. (2013)2 for a more detailed description. Section 5.3 collects the main performance parameters of all scenarios based on the overall mass and energy balances, while the economic evaluation is presented in section 5.4.
5.1.1 Scenario I – Forest residues to FT liquids - 2015
In the early implementation (2015) configuration FT liquid is the base fuel product to be produced and the only product planned to come out from the biorefinery. The integrated case is illustrated in Figure 22 and consists of pyrolysis (5 distributed units), oil conditioning and gasification, syngas cleaning and conditioning, FT synthesis, FT upgrading and energy conversion. The aim of the heat and power generation step is to produce sufficient steam for the process, excess heat is converted to electricity. The produced electricity is used within the biorefinery and surplus electricity is exported to the grid.
FT liquids
Forest residues feedstock
Syngas
Distributed pyrolysis5 units
Oil conditioning and gasification
Syngas cleaning and conditioning
FT upgrading
CHP
Pyrolysis oil
FT diesel and naftha
Ra
w s
yn
ga
s
Steam
ElectricityFT synthesis
Fuel gas
Figure 22: Integrated FT liquids early implementation and mature technology configuration (Scenario I and II)

Techno-economic assessment and market analysis
43
5.1.2 Scenario II – Forest residues to FT liquids - 2025
The FT mature technology (2025) configuration is very similar to the early implementation configuration described in section 5.1.1, but scaled up to 400 kt dry feedstock/year. In addition, the operating conditions and performance parameters have been adjusted to an industrial level as summarised later on in the technical evaluation chapter. Figure 22 is therefore also valid for FT mature technology configuration 2025.
5.1.3 Scenario III – Forest residues to DME - 2025
The integrated DME case is illustrated in Figure 23 and consists of pyrolysis (5 distributed units), oil conditioning and gasification, syngas cleaning and conditioning, DME synthesis and separation and energy conversion. As in the FT liquid scenarios, the aim of the heat and power generation step is to produce sufficient amount of steam for the process, excess heat is converted to electricity. The produced electricity is used within the biorefinery and if there is surplus it is exported to the grid.
Forest residues / straw
Syngas
Distributed pyrolysis5 units
Oil conditioning and gasification
Syngas cleaning and conditioning
CHP
Pyrolysis oil
DMER
aw
syn
ga
s
Steam
Electricity
DME synthesis and separation
Figure 23: Integrated DME mature technology configuration 2025
5.1.4 Scenario IV – Straw to FT liquids - 2025
Scenario IV is identical to Scenario II, but utilising straw as feedstock instead of forest residues.
5.1.5 Scenario V – Poplar to FT liquids - 2025
Scenario V is identical to Scenario II, but utilising poplar as feedstock instead of forest residues.
5.1.6 Scenario VI – Forest residues to FT liquids – 2025 – natural gas
All scenarios described above result in a deficit of process steam in the biorefinery. The overall performance has been calculated assuming that this steam is purchased elsewhere. Scenario V evaluates the effect of producing the additional steam on-site (at the biorefinery) using natural gas as fuel.

Techno-economic assessment and market analysis
44
5.1.7 Scenario VII – Forest residues to FT liquids – 2025 - centralised
The pyrolysis plants result in a surplus of steam while the biorefinery has a deficit of energy. Scenario VI has been created to evaluate the possible gains by integrating the pyrolysis and the biorefinery.
5.1.8 Scenario VIII – Forest residues to FT liquids – 2025 – high pressure
SUPRABIO is considering carrying out a demonstration of the thermochemical route based on the Chemrec gasifier9 which can operate at significantly higher pressures (100 bar) than assumed as base case in this study (30 bar). Therefore, a new scenario has been designed where the effect of high pressure operation is investigated.
5.1.9 Scenario IX – Forest residues to FT liquids – 2025 – high pressure and quenching temperature
All scenarios described above are based on direct quenching of the syngas in the gasifier
with cooling water. The gas is cooled down to 47C, which is based on information from ETC and their gasifier. This mode of operation is not optimal considering the further downstream processing. For example, as described in the following section, a water gas shift reaction is carried out after the gasification in order to adjust the H2/CO ratio. This reaction
is carried out at 250C and a steam/CO ratio of 3. Therefore, it could be advantageous to keep some of the water and a high temperature in the gas. This effect has been studied by
creating this new scenario where the syngas is quenched to 250C instead of 47C.
5.2 Technical evaluation
5.2.1 Pyrolysis
The principal aim of the pyrolysis step is to convert the lignocellulosic material into organic vapours (which are later condensed to bio/pyrolysis oil), pyrolysis gases and charcoal. This transformation is done by rapidly heating the organic materials in absence of oxygen to
temperatures between 450 – 600C and atmospheric pressure. A simplified overview of the proposed pyrolysis process based on BTG’s patented pyrolysis concept is shown in Figure 24. The fast pyrolysis process is based on a rotating cone reactor where biomass particles and hot sand particles are introduced near the bottom of the cone. The produced organic vapour passes through several cyclones before entering the condenser, in which the vapour is quenched to a liquid by re-circulated oil. The non-condensable gases, as well as the flue gas from the char combustor, are fed to an afterburner to prevent emission problems. The energy in these streams is used to produce steam for the feedstock drying and for electricity production in a condensing turbine.
9 Communication with Coordinator

Techno-economic assessment and market analysis
45
The pyrolysis process has not been simulated in Aspen Plus due to the difficulties related to description of the oil composition. The energy and mass balance of the process has been established in Excel based on input data supplied from BTG which is mainly based on experimental work at their lab (2 – 3 kg/hr unit) and pilot facility (100 -200 kg/hr). All pyrolysis process cases presented by BTG are self-sufficient in energy. The LHV energy efficiency was in all cases between 60 and 67%. In addition, the pyrolysis process results in export of electricity. If electricity export is included the net energy efficiency will increase by ≈1% for forest residues and poplar and ≈3% for straw. BTG has optimized the process for pyrolysing various biomasses and residues, e.g. wood, dried sludge, straw, tobacco, bagasse, oil palm residues and others. BTG has been working with the scaling up of the pretreatment process and a plant with a capacity of 2,000 kg/hr has been constructed in Malaysia. In addition, there are plans to build a 5,000 kg/hr pyrolysis plant in Hengelo (The Netherlands). The plant will convert wood into pyrolysis oil, steam and electricity. Based on the present knowledge there does not seem to be any show stoppers for the pyrolysis technology and it is therefore considered technically feasible.
Figure 24: Simplified flowsheet of the pyrolysis reactor set-up. Source: BTG
5.2.2 Oil conditioning and gasification
The pyrolysis oil is converted to syngas in an oxygen blown pressurised entrained flow gasifier (PEBG). The oxygen is produced on-site in a dedicated air separation unit (ASU). In the gasification the main challenge is to maintain a steady oil flow into the pressurized gasifier. The viscous pyrolysis oil, which is both acidic and sensitive to re-polymerisation, must therefore be conditioned prior to being fed to the gasifier. BTG has designed and

Techno-economic assessment and market analysis
46
constructed a dedicated oil feeding skid in order to resolve these challenges. Their strategy has been to firstly pump the oil and then pre-heat it to reduce its viscosity. Then the solid content is lowered by running the oil through a centrifugal separator coupled to a double filter system. Large scale, pressurised, oxygen flow gasification using an entrained flow gasifier has for a long time been the state of the art for pulverised coal as feedstock. Gasification of various types of pulverised biomasses has also been tested successfully in various pilot scale equipment. Compared to coal the use of biomass introduces new challenges mainly related to feeding, ash chemistry, and achieving full conversion at short residence times. High pressure oxygen gasification of pyrolysis oil is one of SUPRABIO achievements and one of the main challenges is related to continuous feeding of the oil. The operating conditions and performance data of the gasifier section for the thermochemical scenarios are collected in Table 15 and Table 16. The cold gas efficiency of the gasification process in the mature configurations is between 69 to 71%, which results in an original biomass to raw syngas energy efficiency between 41 to 48%. Table 15: PEBG operation conditions.
Component Scenario I Scenarios II-VII Scenarios VIII-IX
Process configuration Early
implementation (2015)
Mature technology (2025)
High pressure (2025)
Temperature [C] 1 300 1 300 1 300
Pressure [bar] 10 30 100
CO2 [kg/kg oil] (pilot used nitrogen ) 0.006 0.006 0.006
Gasifier reactor energy loss [% of the LHV in the bio-oil] 10 5 5
Lambda [adjusted to reach the set temperature] 0.39 0.36 0.36
Carbon conversion [%] ≈ 100 ≈ 100 ≈ 100
Quenching water [kg water/kg dry syngas] 1.36 1.36 1.36
Table 16: PEBG performance data based on the Aspen Plus simulations.
Component Scenario I Scenarios II-III and VI-VII
Scenario IV Scenario V Scenarios VIII-IX
Process configuration
Early implementation
(2015) Forest residues
Mature technology
(2025) Forest residues
Mature technology
(2025) Straw
Mature technology
(2025) Poplar
Mature technology
(2025) High pressure
Bio-oil flow in [MW] 87 173 139 148 173
Raw syngas flow [MW] 57 123 96 102 123
Cold gas efficiency1 [%] 66 71 69 69 71
Biomass to syngas efficiency2 [%] 44 48 41 44 48
H2/CO 0.7 0.5 0.5 0.5 0.5
Methane slip [wt%] 1.5 < 100 ppm < 100 ppm < 100 ppm < 300 ppm
1Cold gas efficiency= LHV bio-oil/LHV raw syngas 2Biomass to syngas efficiency=LHV raw syngas/LHV biomass in

Techno-economic assessment and market analysis
47
5.2.3 Syngas cleaning and conditioning
The raw syngas obtained after gasification of the pyrolysis oil contains several contaminants. The contaminants need to be removed before the fuel synthesis steps, producing either FT liquids or DME. Syngas cleaning and conditioning have not been studied in detail within the frame of SUPRABIO and the strategy described in a NREL technical report10 has been followed for this simulation work. NREL proposes to use a cold-gas-cleaning approach which is proven technology and used in many commercial configurations. The only step of gas conditioning covered by SUPRABIO is the water gas shift (WGS). The SUPRABIO concept requires removing of sour gas before the WGS reaction and differs therefore considerably from the proposal from NREL described below. The SUPRABIO WGS solution has not been implemented in the model because no experimental data or complete concept was available when this study was carried out. A simplified overview of the syngas cleaning and conditioning section is shown in Figure 25. The LHV efficiency of the gas cleaning process described by NREL is typically above 90% operating at 30 bar of pressure, the main loss being related to hydrocarbons lost in the quenching prior to the acid gas removal. In addition, considerable amounts of LP steam (47,700 kg/hr) is needed in the stripping section. For more details the reader is referred to Ochoa-Fernández et al. (2013)2 and the original NREL technical report.
WGS sectionMP steam
Quenching
Shifted syngasRaw syngas Quenched syngas
Water
Cooling water
Cooling water
Cooling water
Cooling water
Waste to WWT
Acid Gas Removal
MEA + Water LP steam
MEA + Water
Electricity Cooling water
Cooling water
Sweet syngas
Stripped gas
Sulphur recovery
Air
Electricity
Cooling waterCooling water
Sulphur cake
CO2 gas
CO2 recycled CO2 to gasification
CO2 vent
Electricity
Dirty air
Split
Raw syngas to WGS Syngas from WGS
Figure 25: Simplified flow diagram of the syngas cleaning and conditioning section
5.2.4 Fischer-Tropsch synthesis
The sweet syngas is converted into liquid fuels via the Fischer-Tropsch synthesis route. The major operations in this area are conditioning (zinc oxide/activated carbon gas polishing, compression, temperature adjustment, hydrogen separation via pressure swing adsorption (PSA)), Fischer-Tropsch (FT) synthesis, FT product separation, and unconverted syngas
10
Techno-economic analysis of biofuels production based on gasification. Swanson et al. NREL Technical Report NREL/TP-6A20-46587. November 2010

Techno-economic assessment and market analysis
48
distribution. The concept used in SUPRABIO is the microchannel technology developed by IMM with FT synthesis catalyst developed at Brunel. Besides this, the same strategy as described in an NREL technical report11 has been followed for the simulation work. A simplified overview of the Fischer-Tropsch synthesis section is shown in Figure 26.
Conditioning
MP steam
Conditioned syngasSweet syngas
Cooling water
Cooling water
Water
LP steam
Electricity
MP steam
Recycled syngas
Electricity
Recycle FT synthesisFT feed gas
Product separationFT products FT liquids
Syngas to CHP
Waste to WWT
Hydrogen to upgrading
Figure 26: Simplified flow diagram for the Fischer-Tropsch synthesis section
Table 17 and Table 18 summarise the operating conditions and performance of the FT synthesis for the different scenarios. The product distribution has been provided by IMM and is based on the expected Anderson-Schulz-Flory (ASF) alpha distribution for the mature configuration and high pressure scenarios and on the existing experimental experience from testing of the micro-structured reactors for the early implementation configuration. The chain growth factor in the ASF distribution provided by IMM, α, has been calculated based on the kinetic model reported by Fengle et al.12 for a commercial Co/SiO2 catalyst. The FT synthesis reaction is exothermic and in order to control the temperature it has been assumed that water can be circulated in between the microchannel reactor units resulting in the production of LP steam. Table 17: FT synthesis operation conditions for the thermochemical biorefinery scenarios
Component Scenario I Scenarios II and IV-VII
Scenarios VIII-IX
Process configuration Basic (2015) Mature (2025) High pressure
(2025)
Temperature [C] 220 220 250
Pressure [bar] 30 30 100
H2/CO 2 2 2
Inert concentration [mol/mol] 0.15 0.05 0.05
CO conversion one pass [%] 60 60 99
CO overall conversion [%] 87 82 99
11
Techno-economic analysis of biofuels production based on gasification. Swanson et al. NREL Technical Report NREL/TP-6A20-46587. November 2010 12
Reaction kinetic of Fischer-Tropsch synthesis over a commercial Co/SiO2 catalyst. L. Fengle et al.

Techno-economic assessment and market analysis
49
α n.r. 0.85 0.88
Table 18: FT synthesis performance data for the thermochemical biorefinery scenarios
Component Scenario I Scenarios II and IV-VII
Scenarios VIII-IX
Process configuration Basic (2015) Mature (2025)
High pressure (2025)
Lights (C1-C2) [wt%] 9.3 6.3 4.0
LPG (C3-C4) [wt%] 22.3 10.7 7.4
Naphtha (C5-C10) [wt%] 35.5 34.8 27.7
Kerosene (C11-C15) [wt%] 16.4 20.8 20.2
Diesel (C16-C20) [wt%] 11.3 12.7 14.8
Wax (>C21) [wt%] 5.2 14.6 24.9
The performance data presented in Table 18 for the basic configuration resembles typical results obtained at IMM`s miniplant. As observed, large amounts of undesirable light hydrocarbons and LPG are produced (above 30 wt%). A significant improvement is foreseen for the mature configuration, but a yield of C1-C4 above 15 wt% will considerably reduce the production of FT liquid. The situation is further improved for the high pressure scenarios (11 wt% C1-C4), but it should be pointed out that these estimates are based on theoretical calculations. The FT synthesis in microchannel reactors has been proven by IMM in a lab scale under flows up to 100 ml/min and pressures not higher than 30 bar. In summary, no showstoppers can be directly identified at the level of development of the technology, but a long development process is still necessary in order to scale up the system and prove long term operation at industrial conditions.
5.2.5 FT upgrading
FT products from the fuel synthesis area contain significant amounts of high-molecular-weight wax. Hydrogen is required to crack these high-molecular-weight paraffins to low-molecular-weight hydrocarbons. It is assumed that the hydroprocessing area contains a hydrocracker for converting the wax fraction and a distillation section for separating naphtha, diesel, and lighter-molecular-weight hydrocarbons. Also, hydrogen is assumed to be recycled within this area as needed. Methane and propane are separated and used to fuel the gas turbine in the power generation area. The FT upgrading has not been studied by SUPRABIO and it has been modelled as a black box based on experience data obtained through internal communication within Statoil. No further technical evaluation has been carried out. However, it can be stated that hydrocracking and distillation are already common operations in the oil refinery industry.
5.2.6 DME synthesis and separation
The sweet syngas is converted into a mixture of DME and methanol via a direct synthesis step by the use of a bifunctional catalyst. The major operations in this area are conditioning

Techno-economic assessment and market analysis
50
(zinc oxide/activated carbon gas polishing, compression and temperature adjustment), direct DME synthesis, DME products separation, and unconverted syngas distribution. The concept used in SUPRABIO is the microchannel technology developed by IMM with DME synthesis catalyst developed at Brunel. DME separation has not been studied in SUPRABIO and typical performance data has been obtained from J. Cho13.
The DME synthesis reactor operates at 250 C and 30 bar using a bifunctional catalyst. The one pass carbon monoxide conversion in the reactor is set to 63.8% based on input data from Brunel extrapolated from their experimental work on fixed bed micro reactors. The product distribution has also been provided by Brunel and it has been simulated according to the following reactions: with conversions of 1, 58.3, and 4.5%, respectively. The DME synthesis reaction is exothermic and in order to control the temperature it has been assumed that water can be circulated in between the microchannel reactor units resulting in the production of LP steam. The DME performance data presented in Table 19 is based on results from experiments carried out by Brunel in small fixed bed reactors where typically 500 mg catalysts are used. Brunel has tested numerous catalyst formulations and has shown that DME selectivity above 90% and conversions above 60% are achievable by direct DME synthesis. IMM has recently done some initial tests in their microchannel reactor miniplant using Brunel’s catalyst. However, IMM has not been able to reproduce Brunel’s results and low DME selectivity has been obtained when using the microchannel reactors. It has been proposed by IMM and Brunel that the main reasons for the observed differences are the catalyst loading and the H2/CO ratio. It is too early to evaluate the ability of the microchannel technology for direct DME synthesis. New experimental campaigns using appropriate testing conditions need to be carried out in order to demonstrate highly selective one-step DME production. At the same time, a long development process is still necessary in order to optimise the catalyst formulation, maximise DME selectivity and study the long term mechanical and chemical stability of the system. In addition, as in the case of FT synthesis, a strategy for scaling up the system and management of the produced heat is still not clear.
13
DME (10 TPD) process simulation using Aspen Plus release 12.1. Dr. Jungho Cho. Dong Yang Universtiy. Link

Techno-economic assessment and market analysis
51
Table 19: DME synthesis operation conditions and performance for the mature configuration.
Component Scenario III
Process configuration Mature technology (2025)
Temperature [C] 250
Pressure [bar] 30
H2/CO 2
Inert concentration [mol/mol] 0.05
CO conversion one pass [%] 63.8
CO overall conversion [%] 84.8
DME selectivity [%] 91.4
5.2.7 Heat and power generation
The combined heat and power plant (CHP) is used to convert the unconverted syngas into steam and electricity for the biorefinery. The CHP consists of a gas turbine with an isentropic efficiency of 87% operating at 30 bar. The unconverted syngas and combustion air pressures are adjusted to 25 bar before combustion in the turbine. The discharge pressure of the gas turbine is set to 1 bar and the flue gas is sent through the heat recovery system (HRS) for steam production. Steam is extracted at different qualities in order to match the steam requirements of the biorefinery. The temperature of the exhaust flue gas is 200 °C. A schematic representation of the CHP process is presented in Figure 27.
Superheater Evaporator
Syngas
MP steam
Condensate return
Fluegas (200°C)
Air
Economizer
LP steam
Condenser
Makeup water
Combustor
Figure 27: Schematic representation of the CHP
5.2.8 Waste water treatment
United Utilities (UU) has provided a water management concept for the thermochemical biorefinery. A full description is given in Nygård et al. (2013)3 - Appendix C. A schematic diagram is shown in Figure 28. In the concept the recycling of waste water from quenching,

Techno-economic assessment and market analysis
52
gas conditioning and FT/DME synthesis is included, thus providing the process water required for the quenching and gas conditioning units.
Figure 28: Schematic overview waste water treatment
Hot syngas water (at 1,300°C) is entering the quenching unit, and the waste water after quenching is assumed to be recycled without further treatment. The waste water after gas conditioning is treated. First, unwanted gases are removed by gas stripping, and the remaining stream is then treated in a reverse osmosis (RO) unit. Part of the treated water is utilized for steam production for the WGS unit (a part of gas conditioning), while the rest is sent to recycling for process water. In FT/DME synthesis water is generated, and the waste water stream (also containing water from combustion) is recycled without further treatment.
It is assumed that the quenching and gas conditioning requires process water at 10°C. The resulting waste water stream from quenching, gas conditioning and FT/DME synthesis has a temperature of about 42°C, and UU proposes a refrigerant chiller system to lower the temperature.
UU proposes turbines to utilize the relatively high pressure of the waste streams to produce power.
The brine stream after RO treatment is the surplus water from the biorefinery. UU proposes two possible options for this stream, i.e.:
(1) Discharge to sewer if the biorefinery has access to a sewage works.

Techno-economic assessment and market analysis
53
(2) Further treatment to remove the H2S before discharge to a watercourse or export to a neighbouring industry.
Overall, the thermochemical biorefinery scheme producing FT or DME is a net water producer. The surplus water is the combined result of water produced in the combustion and the fuel synthesis. The surplus water from the biorefinery manifests itself as a brine stream from the RO treatment unit which has to be taken care of in a sustainable way.
5.3 Overall performance
Table 20 summarises the overall performance in the means of LHV and net efficiency for all the thermochemical scenarios presented above. The results are discussed in the following sections based on a comparative analysis.
5.3.1 Maturity of technology (2015 or 2025)
The FT liquids basic configuration (scenario I) results in an overall net efficiency of 17.1%. The main carbon losses have been described in the sections above and are associated to:
Pyrolysis reactor – 67% efficiency – results in the loss of 44 MW of the original biomass (129 MW)
Gasification reactor – 66% CGE – results in the loss of 28 MW of the original biomass (129 MW)
FT synthesis – overall conversion 87%, C5+ selectivity 68wt% – 31 MW of the original biomass end as other products than FT liquids
In addition, considerable amounts of steam are needed both in the acid gas removal step and the water gas shift reaction resulting in an overall deficit of steam in the basic biorefinery configuration. The net efficiency of the corresponding overall mature configuration plant (scenario IIII) is 21.6% which is 4.5% higher than the basic configuration. The main improvements are associated to:
Increased cold gas efficiency in the gasification reactor – 71% CGE – results in the loss of 46 MW of the original biomass (257 MW)
Increased selectivity of the FT synthesis reaction – overall conversion 82%, C5+ selectivity 83wt% – 55 MW of the original biomass end as other products than FT liquids
5.3.2 Final product (FT liquids or DME)
The overall performance of producing FT liquids or DME can be studied by comparison of scenarios II and III, respectively. As shown in Table 20, the DME mature configuration using forest residues as feedstock results in an overall LHV efficiency of 29.0% which is 5.9% higher than the equivalent configuration for FT diesel production. The main carbon losses are as described for FT liquids

Techno-economic assessment and market analysis
54
in section 5.3.1 for both the pyrolysis and gasification processes. The main difference is that the performance parameters provided by the partners for DME synthesis are more favourable (85% overall CO conversion and 91% DME selectivity). In addition, another important difference is the larger LP steam consumption in the DME biorefinery, mainly related to heat required for the DME separation process. As a result, the DME biorefinery has a larger deficit of steam. Still, the net efficiency of the DME biorefinery has been calculated to 23.9% (2.3% higher than for FT diesel).
5.3.3 Biomass type (Forest residues, straw or poplar)
The effect of the biomass type is studied by comparison of scenarios II (forest residues), IV (straw) and V (poplar). As shown, the FT liquids mature configuration using straw as feedstock results in an overall net efficiency of 18.7 % which is 2.9% lower than in the case of forest residues. In the case of poplar the net efficiency is 19.4% also 2% lower than forest residues. The main difference is related to a lower oil yield for straw and poplar in the pyrolysis section. Otherwise, the losses related to gasification or fuel synthesis are equivalent to forest residues. It should be however added that the electricity export from the pyrolysis process has not been included in the calculation of the net energy efficiency since this may vary with location. If the electricity export is included the net energy efficiency will increase with ≈1% for forest residues and ≈3% for straw and therefore both the straw and forest residues biorefineries will have very similar net efficiency. The straw scenario has a higher export of electricity from the pyrolysis section due to the lower water content which results in less energy need for heating. Poplar on the other side contains as much water as forest residues (45%). Still, it is expected to have a higher electricity export due to the higher yield to pyrolysis gas than forest residues which is burnt to produce energy. It has however been difficult to quantify exactly the energy export for the poplar case based on the input data from the partners.
5.3.4 Energy source (Steam import or on-site production from NG)
All the evaluated cases so far result in a deficit of low pressure and/or medium pressure steam and export of electricity. It has been assumed in the calculations that this steam is purchased outside the boundaries of the biorefinery. Scenario VI however addresses the effect of producing steam on-site in the biorefinery by burning natural gas in the existing gas turbine. As shown in Table 20, this last approach seems to be beneficial in terms of efficiency resulting in an increase of almost 2% of the net efficiency. In total, 47 MW natural gas is needed to cover the steam deficit. The use of natural gas also results in a larger electricity export.

Techno-economic assessment and market analysis
55
5.3.5 Pyrolysis (Distributed or centralised)
Another possibility to minimise the steam deficit in the biorefinery is to carry out the pyrolysis on-site at the biorefinery. As discussed above, the pyrolysis plant results in an excess of waste heat which is transformed into electricity. Depending on the location of the pyrolysis plant, the electricity may be exported. Scenario VII considers the possibility of sending the incondensable pyrolysis gas and the flue gas from the char combustion of the pyrolysis process to the central CHP unit for steam production. The new configuration results then in two larger pyrolysis units beside the biorefinery, instead of five smaller units distributed in the forest. The results in Table 20 indicate that the overall efficiency of the biorefinery can be increased by 3.3% by this approach. It should be mentioned that the feed to the gasifier is still the condensed pyrolysis oil. It could be foreseen in a centralised case that the pyrolysis gas could be sent directly to the gasifier, but this has not been considered in this study.
5.3.6 Pressure effect (30 or 100 bar)
The main effect of increasing the pressure to 100 bar in the thermochemical biorefinery is related to the fuel production step as visualised in Table 17 and Table 18, resulting theoretically in almost full conversion of CO in one step and increased selectivity to heavier hydrocarbons as given by IMM. On the other hand, the gasification performance based on equilibrium calculations is almost not dependent on the pressure. As discussed earlier, gas cleaning has not been studied in detail in SUPRABIO and the solution applied by NREL in an earlier study has been applied where amines are used for removal of the sour gases. The same solution has been kept when operating at 100 bar for simplicity in this comparison, but it should be pointed out that this is probably not the most appropriate configuration at such high pressures. Another important factor identified at these high pressures is that CO and CO2 are much more soluble in water and therefore the loss of carbon in the quenching streams is relatively high. In order to deal with this challenge it has been decided to flash the pressurised water waste stream in order to recover the purge gas containing important amounts of CO/CO2 which are sent to the CHP unit. In all, the calculations show that the overall net efficiency of the thermochemical biorefinery can theoretically be increased by almost 5% by increasing the pressure from 30 to 100 bar (Table 20).
5.3.7 Quenching temperature (45C or 250C)
In scenario IX a different syngas quenching temperature is assumed. In the base case
(scenario II) the gas is cooled down all the way to 45 C resulting in condensation of all the water. This has been based on input from ETC. However, keeping some temperature in the gas can be advantageous due to the downstream processes. In fact right after quenching,
part of the gas is sent to a water gas shift reactor. This unit operates at 250C and requires
steam. By increasing the quenching temperature from 45C to 250C the overall net efficiency of the thermochemical biorefinery can theoretically be increased by almost 1.5%.

Techno-economic assessment and market analysis
56
Table 20: Overall performance of the thermochemical biorefinery scenarios
Scenario I Scenario II Scenario III Scenario IV Scenario V Scenario VI Scenario VII Scenario VIII Scenario IX
2015 -FT 2025 -FT 2025 -DME 2025 - FT - Straw 2025 - FT -
Poplar 2025 - FT -
NG 2025 - FT - Central 2025 - FT - HP 2025 - FT - HP- Quench
[kW] [kW] [kW] [kW] [kW] [kW] [kW] [kW] [kW]
LHV Biomass Feed: 128 545 257 090 257 090 231 967 236 405 257 090 257 090 257 090 257 090
LHV Natural Gas 0 0 0 0 0 47 083 0 0 0
LHV FT Liquids: 22 266 59 316 74 545 46 147 48 811 59 316 59 316 65 905 67 939
Electricity Export: 2 657 5 005 1 075 3 544 4 085 20 132 7 501 5 975 4 707
LP steam import 0 0 17 220 0 0 0 0 0 0
MP steam import 7 548 27 474 35 119 20 792 22 966 0 0 4 830 0
HP steam Import: 0 0 0 0 0 0 0 2 155 0
LHV efficiency1 17,3 % 23,1 % 29,0 % 19,9 % 20,6 % 23,1 % 23,1 % 25,6 % 26,4 %
Net efficiency2 17,1 % 21,6 % 23,9 % 18,7 % 19,4 % 23,4 % 24,9 % 26,4 % 27,7 %
1Calculated as: (LHV FT liquids)/ (LHV Biomass Feed) 2Calculated as: (LHV FT liquids)/ (LHV Biomass Feed + Total steam import/0.9 – Electricity Export/0.4)

Techno-economic assessment and market analysis
57
5.4 Economic evaluation
Table 21 summarises the total CAPEX, OPEX, net present value (NPV), internal rate of return (IRR), profitability index (PI) and break-even prices for all thermochemical biorefinery scenarios per tonne fuel. A selling price of 750 €/tonne for FT liquids and 650 €/tonne for DME has been assumed. The rest of the assumptions and methodology is described in Appendix A. As observed, all scenarios result in a negative NPV based on the given assumptions. In Appendix B the values in Table 21 is calculated by tonne biomass for input to the LCA. Table 21: CAPEX, OPEX, NPV and minimum selling price for the thermochemical biorefinery scenarios
Scenario
Total CAPEX [M€]
CAPEX [€/tonne
fuel]
OPEX [€/tonne
fuel]
Production cost
[€/tonne fuel]
NPV [M€]
IRR PI Break-even price
[€/tonne fuel]
I 355 1634 1634 3268 -502 - -136 % 4087
II 561 968 1133 2101 -736 - -126 % 2586
III 511 457 630 1087 -515 - -97 % 1316
IV 511 1133 1431 2564 -738 - -139 % 3115
V 528 1107 1349 2456 -746 - -136 % 3011
VI 687 1184 1153 2337 -875 - -123 % 2930
VII 605 1043 1160 2203 -793 - -126 % 2726
VIII 522 809 915 1724 -616 - -114 % 2094
IX 520 782 900 1682 -609 - -113 % 2038
The investment cost for all mature configurations varies between 511 – 687 M€. Figure 29 shows the contribution of the different process steps to the final CAPEX of the biorefinery for the mature configuration FT liquids production from forest residues (scenario II). As shown, the five distributed pyrolysis units account for 45% of the overall investment cost, the CHP and gasification sections being the second and third largest contributors. The fuel synthesis accounts for only 4% of the overall CAPEX based on the cost estimates from IMM for microstructure reactors. This represents a significantly lower contribution than other conventional reactor systems. A similar CAPEX distribution (not shown here) has been calculated for Scenario I (2015) and Scenarios IV and V (2025, straw and poplar). The DME production scenario (Scenario III) results in an approximately 50 M€ lower investment cost than FT liquids (Scenario II) and it is mainly related to the smaller CHP unit section since more of the syngas is converted to the fuel product in this case. Scenarios VI and VII represent the case studies where either natural gas or the waste from the pyrolysis units are sent to the CHP unit, so the main reason for the increased CAPEX compared to the scenario II is related to the CHP unit. The two scenarios that result in the lowest CAPEX are VII and VIII operating at 100 bar. The reason is that operation at high pressures results in less investment in gas compressors in the gas conditioning and CHP section. In addition, high pressure operation results in high one-pass conversion in the FT section and no recycle is necessary reducing the size of the FT reactors. However, it should be mentioned that the same CAPEX references have been used for estimating the equipment cost at 100 bar and 30 bar. This is an important simplification since the equipment cost is most likely increased at 100 bar. Therefore, a sensitivity analysis is presented later on the minimum selling price

Techno-economic assessment and market analysis
58
for FT liquids based on the CAPEX for this scenario. Figure 30 summarises the fractionated direct installed cost for scenarios II to VIII for further details.
Figure 29. CAPEX fractionation for Scenario II: FT liquids from forest residues 2025
Figure 30: Direct installed cost for scenarios II to IX
Figure 31 presents the fractionated fuel production cost for all the thermochemical biorefinery scenarios. As shown, the capital cost is the main contributor to the production
45 %
1 %
5 %12 %
5 %4 %
6 %
21 %
1 %
Pyrolysis
Oil conditioning
ASU
Gasification
Gas Cleaning
Fuel synthesis
Fuel upgrading
CHP
WWT
-
20
40
60
80
100
120
Dir
ect
Inst
alle
d E
qu
ipm
en
t C
ost
[M
€]
Scenario II
Scenario III
Scenario IV
Scenario V
Scenario VI
Scenario VII
Scenario VIII
Scenario IX

Techno-economic assessment and market analysis
59
cost, followed by the feedstock and the fixed operational costs. All cases result in an export of electricity which is considered as an income to the biorefinery.
Figure 31: Production cost for the thermochemical biorefinery scenarios
The FT liquids production costs for the mature configuration, based on forest residues and the original SUPRABIO configuration (scenario II) is 2,100 €/ton. This is almost three times the actual assumed selling price and therefore the biorefinery result in a very negative NPV. The main reason for this effect is the low overall net efficiency and high CAPEX. Scenarios IV and V based on straw or poplar results in even higher production costs and this is again related to the low yield to FT liquids per ton incoming biomass which is even lower for straw and poplar since the yield to oil in the pyrolysis step is lower than compared to forest residues as discussed above. Scenarios VI and VII were included to evaluate if integrating the biorefinery with the pyrolysis plant or using natural gas for steam production in order to solve the deficit of energy in the refinery may improve the overall performance. However, as shown in Figure 31 these two approaches do not result in a positive result in terms of production costs even though as shown in Table 20 the net efficiency was improved. The increase in the CAPEX weights more than the efficiency improvement. Scenarios VIII and IX were included to evaluate the effect of further improvements by increasing the pressure and optimising the quenching process. As observed, these two scenarios result in the most favourable production costs even though the NPV is still
Total [€/tonne]: 3 268
Total [€/tonne]: 2 101
Total [€/tonne]: 1 087
Total [€/tonne]: 2 564
Total [€/tonne]: 2 456
Total [€/tonne]: 2 337
Total [€/tonne]: 2 203
Total [€/tonne]: 1 724
Total [€/tonne]: 1 682
-1 000 0 1 000 2 000 3 000 4 000 5 000
Scenario I
Scenario II
Scenario III
Scenario IV
Scenario V
Scenario VI
Scenario VII
Scenario VIII
Scenario IX
Fuel production costs [€/tonne fuel]
Electricity Export Sulphur Capital
Fixed operational costs Feedstock Chemicals
Auxilliaries Process energy Others
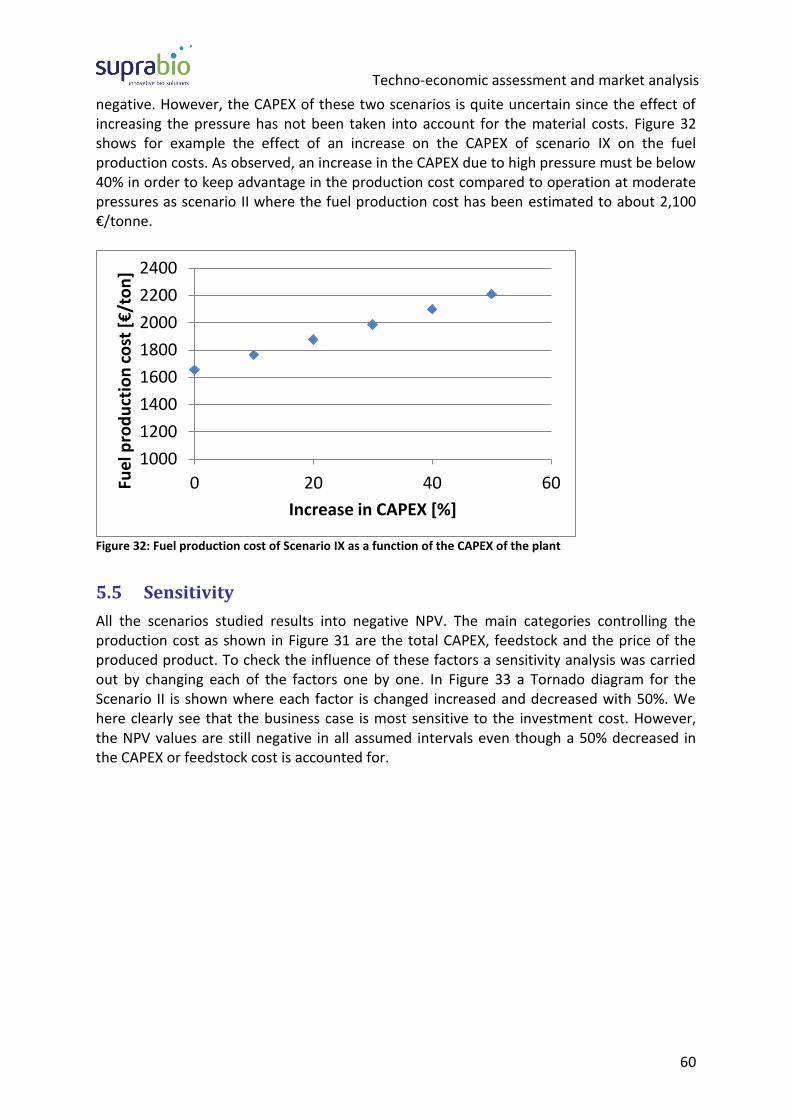
Techno-economic assessment and market analysis
60
negative. However, the CAPEX of these two scenarios is quite uncertain since the effect of increasing the pressure has not been taken into account for the material costs. Figure 32 shows for example the effect of an increase on the CAPEX of scenario IX on the fuel production costs. As observed, an increase in the CAPEX due to high pressure must be below 40% in order to keep advantage in the production cost compared to operation at moderate pressures as scenario II where the fuel production cost has been estimated to about 2,100 €/tonne.
Figure 32: Fuel production cost of Scenario IX as a function of the CAPEX of the plant
5.5 Sensitivity
All the scenarios studied results into negative NPV. The main categories controlling the production cost as shown in Figure 31 are the total CAPEX, feedstock and the price of the produced product. To check the influence of these factors a sensitivity analysis was carried out by changing each of the factors one by one. In Figure 33 a Tornado diagram for the Scenario II is shown where each factor is changed increased and decreased with 50%. We here clearly see that the business case is most sensitive to the investment cost. However, the NPV values are still negative in all assumed intervals even though a 50% decreased in the CAPEX or feedstock cost is accounted for.
1000
1200
1400
1600
1800
2000
2200
2400
0 20 40 60Fue
l pro
du
ctio
n c
ost
[€
/to
n]
Increase in CAPEX [%]

Techno-economic assessment and market analysis
61
Figure 33: Tornado diagram for Scenario II of the thermochemical biorefinery
-357
-887
-612
-1116
-586
-861
-1200 -1000 -800 -600 -400 -200 0
CAPEX
Product price
Feedstock cost
NPV
Low (50% decrease)
High (50% increase)

Techno-economic assessment and market analysis
62
6 Conclusion of the techno-economic evaluation
For the two biorefinery concepts only waste treatment integration was implemented. No other relevant integration between the proposed processes in the biochemical refinery concept was found viable. Each process was therefore evaluated one by one, integrated with the waste treatment scenario. Among the proposed add-ons only the seed oil hydrogenation process was established and could potentially been connected to the biorefinery concepts via hydrogen exchange. Unfortunately, the evaluation of hydrogen extraction from different biorefinery streams was delayed making it impossible to carry out the analysis. The two biorefinery concepts studied perform very differently. The ethanol case anticipated for year 2025 (Scenario II) has a high energy efficiency about 55% and 70% LHV efficiency and net efficiency, respectively. While the maximum performance for the thermochemical refinery concept is below 30%. Ethanol The early implementation scenario showed somewhat lower performance compared to the mature technology scenario as anticipated for 2025. With the process layout change and expected process improvements the process became profitable for three out of five sub-scenarios. Only the sub-scenarios with the gas turbines resulted in a negative NPV, mainly because of the necessary high investments in compressors and turbines. The sub-scenarios utilising gas engine and boiler result in comparable ethanol production cost. However, the gas engine based scenarios have higher capital cost, but compensate with income from the larger electricity export. Changing feedstock from straw to poplar wood significantly reduced the LHV efficiency from feedstock to fuel ethanol, while the net efficiency was still comparable. Acid mixtures The acid mixture separation end purification process is quite energy demanding which add a significant demand for importing electricity and steam. A potential challenge could be the membrane-based separation of acids from the solids-containing fermentation broth, but according to Aalborg the process has been proven in their laboratory with no membrane
issues. To make the process viable the price of the acid mixture has to be increased by 75% and/or the separation and purification process improved to reduce the processing cost. FT Liquids All FT liquid scenarios result in a low net efficiency (below 30%) being the main carbon losses associated to:
Pyrolysis section: net efficiency ranging from 60 to 67%
Gasification section: cold gas efficiency ranging from 66 to 71%
FT section: LHV efficiency from conditioned syngas to fuel ranging from 52 to 67%

Techno-economic assessment and market analysis
63
In addition, considerable amounts of steam are needed for the acid gas removal process and the WGS reaction. The low efficiency combined with a large investment cost result in strong negative NPV estimates for all scenarios. FT liquids produced from straw/poplar result in approximately 15-20% higher production cost than from forest residues mainly due to the lower yield to pyrolysis oil for straw. However, the production cost difference is reduced to approximately 5-10% if the export of electricity from the pyrolysis section is accounted for in the economic analysis. All FT liquids biorefinery scenarios result in a deficit of steam. Integration with the pyrolysis section or introduction of natural gas in order to overcome this deficit has been shown to be more energy efficient, but result in a higher fuel production cost (5-10%) than importing steam, mainly due to the higher CAPEX related to a larger CHP section. The most favourable change in terms of overall performance is the operation at higher pressure. Increasing the pressure results in both higher efficiency and reduced CAPEX according to the calculations. The higher efficiency is related to higher selectivity to heavier hydrocarbons in the FT section, while the CAPEX is related to less compression needs in the CHP unit and smaller FT section. However, the data related to this scenario both in terms of CAPEX and FT performance is of high uncertainty and has not been demonstrated yet.
Increasing the gasifier quenching temperature to 250C results in approximately 1-2% higher efficiency and fuel production costs can be reduced by additionally 3%. DME Production of DME from forest residues as feedstock results in an overall LHV efficiency approximately 6% higher than the equivalent configuration for FT diesel production. The main carbon losses are as described for FT liquids above for both the pyrolysis and gasification processes. The main difference is that higher selectivity to the final fuel product is achieved in the DME biorefinery. On the opposite side, the DME biorefinery results in a larger steam deficit. Still, the net efficiency of the DME biorefinery has been calculated to be approximately 2% higher than for FT diesel and the production cost per tonne of DME product is approximately 90% lower than FT diesel (25% on energy basis - €/MJ).

Techno-economic assessment and market analysis
64
7 Market analysis
7.1 Introduction to the market analysis
Within SUPRABIO a wide range of processes for production of a number of chemicals and fuels are studied. As discussed in Chapter 1 the focus of SUPRABIO is on two biorefinery concepts (the biochemical and thermochemical concept) with a few add-on processes (of which the algae add-on often is considered a biorefinery concept in itself). Currently, most biorefineries produce a very small number of products; one main product and a few co-products or by-products, e.g. ethanol (main product), Dried Distillers Grains with Solubles (DDGS) and heat. The current development of biorefineries can in many ways be compared with the development of the oil refinery during the 20th century. The first oil refineries were built in the 19th century and for many years the main product was kerosene, i.e. lamp oil. The lighter oil fraction (e.g. gasoline) was most often just discarded in nearby rivers. The invention of the internal combustion engine in the early 20th century and, as a consequence, the arisen demand for gasoline started a rapid development of the petroleum industry. The modern oil refinery produces a broad range of products (e.g. gasoline, liquefied petroleum gas, methane, diesel fuel, paraffin wax, lubricating oils, benzene). Also, very often chemical plants are located adjacent to oil refineries where selected refinery products streams are further processed. One example is light hydrocarbons which can be converted to ethylene which is then used to produce e.g. polyethylene. Another example is benzene which is used for production of a wide range of products: acetone, nylon, aniline, polystyrene, epoxy resins, etc. There are hence a number of parallels between the development of the oil refinery and the biorefinery:
Both started with a single or a few products (the main target product often being a fuel)
Development led/leads to a diversification of the product portfolio
Increased and more efficient utilization of the whole feedstock. E.g. oil developed from just utilization of kerosene to full utilization of the feedstock. This can be compared with 2nd generation bioethanol were the sugars are used for ethanol production and the lignin (potentially of high value) most often is used as a low value fuel
One main difference is that research on product diversification in principle is carried out in parallel with the development of the process for the main products of the biorefinery. This strategy has advantages and drawbacks. The main drawback is that no part of the biorefinery has a fixed design with a known output so that development of processes utilizing a waste/side-stream as a raw material is risky since it is not certain that the streams will have, for example, the same composition when the preceding steps have gotten their final design. In this section a portfolio of potential biorefinery products are evaluated from a market perspective (e.g. product properties and price, competing products, market volume, etc.).

Techno-economic assessment and market analysis
65
Different partners have been responsible for the market analysis of the different products and data has to a large extent been collected from open sources. An overview of SUPRABIO products and responsible partners can be found in Table 22. Table 22: An overview of the SUPRABIO products and the SUPRABIO partner responsible for the market analysis.
Product Partner responsible for Market analysis
Ethanol Biogasol Butanol Brunel University FT-diesel Fraunhofer ICT-IMM Hydrogenated seed oil Statoil DME Brunel University Mixed alcohols Brunel University Biofuel market analysis Statoil 2,3 butanediol Brunel University Methyl-ethyl ketone Brunel University Bytyric and propionic acid Aalborg University Four carbon 1,4-dicarboxylic acids Aalborg University Lignin-based products Biogasol Glucoseamine University of Manchester Sugar fatty acid ester surfactants University of Manchester Hydroxystearic acid University of Manchester Vernolic acid University of Manchester Omega 3 fatty acids IGV-GmbH β-glucan IGV-GmbH Phycoerythrin & sulphated exopolysaccharides IGV-GmbH
The section is divided in five sections: Fuel products, The biofuel market, Biochemical biorefinery non-fuel products, Add-on products and Discussion and Conclusions.

Techno-economic assessment and market analysis
66
7.2 Fuel products
This section includes a description of the various biofuels and is followed by an analysis of the biofuel market.
7.2.1 Ethanol
Ethanol is a fuel product in the biochemical biorefinery concept. There should be no deviation between the target product and the SUPRABIO product, since the proposed purification methods are proven techniques. Ethanol is used as an additive to present fossil fuels or as pure fuel for engines. Alternative applications for ethanol include:
- solvent - chemical feedstock - alcoholic beverage
The focus in this report is on the use of ethanol as a fuel. Ethanol has some interesting properties especially for blending with gasoline, i.e. high octane number (Table 23). A down-side with ethanol is the lower energy density as shown by the lower heating value. An example of a commercial ethanol mixture is E85 (85% ethanol, 15% gasoline), which is a clean burning, high octane fuel. For these high ethanol blends flexible fuel vehicles have been developed that can run on ethanol, gasoline or any mixture of the two. For cars with unmodified engines ethanol is typically blended up to 10vol% in gasoline. Table 23: Comparison of a few important fuel properties for ethanol, gasoline and diesel.
Property Ethanol Gasoline Diesel
Lower heating value (MJ/kg) 28.9 44.4 43.4 Cetane number 0-54 N/A 40-55 Octane number 110 84-93 N/A
In 2012 82.6 million m3 of ethanol was produced worldwide, the US being the largest producer. The US and Brazil represents 70% of the total global production, but authorities all over the world are encouraging ethanol production. The feedstock used for production of ethanol varies from country to country. Here are a few examples:
- USA and eastern Canada: maize - Western Canada: wheat - Brazil and many tropical countries: sugar cane and molasses - China: corn, cassava and sweet potatoes - EU: Wheat, sugar beet, maize,
The main ethanol markets are in the USA, Brazil and Europe (Figure 34)14.
14
Visiongain: The Biofuels Market 2011-2021

Techno-economic assessment and market analysis
67
Figure 34: Distribution of the world ethanol consumption (2011) (reprinted with permission from Visiongain)
The price for fuel grade ethanol (99%) in Europe in the beginning of 2013 was 810 - 923 EUR per tonne15. The price is sensitive to both the crude oil prices and feedstock availability and price, e.g. sugar cane and corn in Brazil and US, respectively.
7.2.2 Butanol
Butanol is a fuel product in the biochemical biorefinery concept. In the SUPRABIO process, 2,3 butanediol and methyl ethyl ketone (MEK) are intermediates in butanol production. Within SUPRABIO, the conversion of 2,3 BDO to MEK and then to butanol has been proven at the laboratory scale. The butanol produced is 100% pure and hence is identical to the target product. Butanol is an attractive biofuel, both as an additive to gasoline and as a base fuel. It has a higher energy density than ethanol (32.8MJ/kg compared with ethanol at 25.6MJ/kg - gasoline has 42.9MJ/kg), and is less volatile. It can be blended into gasoline at higher percentages than ethanol, and it is the least corrosive of the alcohols so there are no issues with it corroding aluminium or polymer components in fuel and dispensing systems at higher concentrations. Furthermore it is not as hydroscopic as ethanol, i.e. it does not pick up water as easily. It is also less susceptible to phase separation, which means butanol could be successfully delivered in existing pipelines. The RON value is 105.1 compared with 107 for ethanol and 97 for gasoline. Butanol is also an industrial commodity which makes it an interesting bio-based chemical. The annual global market currently for n-butanol is 5M tonnes/yr, while for iso-butanol it is ~0.4 M tonnes/yr.
15
Icis pricing, Ethanol - fuel (Europe), 2013

Techno-economic assessment and market analysis
68
7.2.3 FT diesel
Fischer-Tropsch (FT) diesel is a fuel product in the thermochemical biorefinery concept. There should be no deviation between the target product and the SUPRABIO product, since the proposed purification methods are proven techniques. Traditionally, diesel produced by FT synthesis is highly paraffinic (total aromatic content < 1%, polycyclic aromatics < 0.05%), and with a sulphur content < 1 ppm. The SUPRABIO FT diesel meets these requirements (O’Connell et al. 2012)16. However, the conversion to C11-C20 fraction is 73%, and the selectivity less than 5% (not calculated for each fraction), so the diesel selectivity in the SUPRABIO process could be improved, and effort is made to achieve this by lowering the temperature and testing different feedstock compositions. FT diesel can be used in standard diesel engines, in blends with mineral diesel, or on a stand-alone basis. It is a clear, odourless liquid. For diesel fuel, middle distillates have boiling-point curves in the range of 150°C to 400°C. In addition to environmental specifications regarding sulfur, nitrogen and aromatics impurities, combustion behaviour (cetane number and heating value), viscosity and flow behaviour specifications are important performance factors for diesel fuels. Properties for both FT diesel and fossil diesel are given in Table 24. FT diesel is an attractive diesel substitute due to several factors, including:
- A higher heating value (43 to 45 MJ/kg) than the diesel standard - A high cetane number (55–99), which indicates good auto-ignition quality - The low aromatic content leads to cleaner combustion (0–0.1%wt) as the particle
and NOX exhaust emissions are lower. - Low sulphur content - Low flash point, which raises the chances for auto-combustion - Good thermal stability. - The cold flow properties can be controlled by adjusting process severity to meet
various cloud point specifications in either a neat or blended fuel, thus making the process more flexible than biodiesel with respect to feedstock selection and plant location.
- High oxidation stability as its reported induction time is high (∼75.5 h). Therefore it does not need anti-oxidant additives as is required by, for example, FAME biodiesel which exhibits low oxidation stability due to its low levels of natural anti-oxidants.
The advantage of producing such a high quality diesel is either that it can be used in areas where there are strict constraints regarding automobile exhaust gases or it can be used as a blending stock to upgrade lower quality diesel and meet existing legislative specifications. In addition, FT diesel improves drivability (accelerator response) and reduces the noise level. These observations are for standard engines. The effects become larger when the diesel engine is specifically designed for the fuel. In recent years, FT diesel has been extensively tested in cars and trucks with positive results. This has resulted in the commercial introduction of premium diesel fuels containing FT diesel in a number of countries. The
16
O’Connell, S.: Report on laboratory conversions of syngas to FTS hydrocarbon. Deliverable D 2-17 prepared for the
SUPRABIO project, supported by EC’s FP7 programme. Mainz, 2012.

Techno-economic assessment and market analysis
69
green diesel is considered a premium diesel blending component from a petroleum refiner’s perspective; the boiling range is comparable to typical diesel products, with substantially higher cetane and lower density17. Table 24: Comparison of properties of FT diesel and fossil diesel18.
Property Units FT diesel Fossil diesel
Diesel standard Min/Max (EN 590)
Density g/ml 0.72–0.82 0.85 Min 0.8 Max 0.845
Sulphur content mg/kg (ppmwt)
<10 12 Max 10
Cetane Index 70 54.57 Min 46
Cetane number 70–99 50 Min 51
Flash point °C 55–78 52–136 Min 60 Max 170
Water content mg/kg 19 0.5 200
Viscosity 40 °C cSt 2.1–3.5 2.71 Min 2 Max 4.5
Induction time (oxidation time) (110°C)
H >22 >22 Min 6 –
Distillation 90 vol% °C 295–335 341 85–360 –
Net heating value MJ/kg 43–45 34.97 Min 35 –
Cloud point °C (−25)–0 −5 Min −5 Max 12
Pour point °C −21 Min −13 Max 10
The economy of biomass-to-liquids (BTL) plants is very much dependent on the production scale and large-scale facilities are required to benefit from the economy of scale. Large-scale plants in the gigawatt range yield the lowest fuel production costs. In large BTL plants the FT
17
http://www.environment.gov.au/archive/settlements/transport/comparison/#part1, Chapter 3 18
D. Leckel / Fuel Processing Technology 92 (2011) 959–969: Diesel production in coal-based high-temperature Fischer–Tropsch plants using fixed bed dry bottom gasification technology
Techno-economic assessment and market analysis
70
fuel production costs are approximately 15 €/GJ or 55 €ct/L. This means that at the current oil price, the biomass-based Fischer-Tropsch fuels should be competitive 19.
7.2.4 Hydrogenated seed oil
Hydrogenated seed oil is a fuel product to be evaluated as an add-on to the two biorefinery concepts. Jatropha and rape seed oil are converted into their corresponding alkanes by direct catalytic hydrogenation of the glycerides. The glycerol chain of the triglycerides is hydrogenated to propane and there is therefore no glycerol side stream from this process. The cetane number of the resulting biodiesel fuel will be high, but the cold flow properties could be an issue depending on the climate conditions. The melting point of straight chain paraffins is about 36°C (C20) indicating that the winter properties must be improved by isomerization if the bio-diesel is to be used alone or in high blends (>5%) with mineral diesel. Cold flow properties of a diesel fuel can typically be improved by dewaxing using either paraffin catalytic hydro-isomerization or catalytic dewaxing. Paraffin hydro-isomerisation is preferred because it achieves higher diesel yield. The process converts n-paraffins to the corresponding iso-paraffins which remain in the diesel distillation range. The pilot trials at Statoil showed that the achieved diesel product density and cetane index values were outstanding related to EN 590 product specifications. Typical values are densities at 0.78 g/cm3 and cetane index in the range 80 to 90. To achieve cold flow properties as cold filter plugging point CFPP of -26°C, a conversion in the hydroisomerization step is required, resulting in a naphtha loss of 20% (80% full range diesel product). The hydrogenated seed oil based diesel fuel is usually blended with fossil based diesel and can be blended in any blending ratio, i.e. 0–100% of the content. Neste Oil is today a commercial producer of hydrogenated bio-oils with a total annual capacity of 2 million tonnes of diesel, and in 2012 the production was 1.665 million tonnes.20 The process is based on palm oil, but Neste claim that 35% of the feedstock is now residual vegetable oil and waste animal fat. The market will be highly dependent on both feedstock requirements and blending mandates given by the authorities, see the “Biofuel market analysis” section.
7.2.5 Dimethyl-ether (DME)
DME is a fuel product in the thermochemical biorefinery concept. The main uses of DME are:
19
Economy of Biomass-to-Liquids (BTL) plants, Boerrigter H., report, ECN-C-06-019, May, 2006 (http://www.ecn.nl/docs/library/report/2006/c06019.pdf) 20
Neste Oil: http://2012.nesteoil.com/business/oil-products-and-renewables/renewable-fuels/renewable-fuels-customers-and-solutions

Techno-economic assessment and market analysis
71
Diesel Blending and Substitute
LPG Blending and Substitute
Power Generation
Acetylene Substitute DME can be used as a clean, high-efficiency compression ignition fuel, and is an attractive alternative due to several factors including:
- Only minor engine modifications required (Volvo D13 engine) - Safe to handle, store and dispense (similar to propane) - Low-pressure (tank pressure: about 5 bars), can be safely stored on-site - Ultra-low emissions, no sulphur and no soot (no need for a DPF – Diesel particulate
filter) - Non-carcinogenic, non-toxic and biodegradable
In Table 25 some characteristics of DME are shown and compared to other fuels. Table 25: Comparison of DME with other fuels
Methane Methanol Dimethyl ether
Ethanol Gasoline Diesel
Formula CH4 CH3OH CH3OCH3 CH3CH2OH C7H16 C14H30 Molecular weight (g mol−1)
16.04 32.04 46.07 46.07 100.2 198.4
Density (g cm−3) 0.00072 0.792 0.661 0.785 0.737 0.856 Normal boiling point (°C)
−162 64 −24.9 78 38–204 125–400
LHV (MJ L−1) 0.0346 15.82 18.92 21.09 32.05 35.66 LHV (MJ kg−1) 47.79 19.99 28.62 26.87 43.47 41.66 HHV (MJ L−1) 0.037 17.8 20.63 23.1 32.84 33.32 HHV (MJ kg−1) 51.76 22.36 30.75 29.4 47.46 46.94 Carbon Content (wt.%)
74 37.5 52.2 52.2 85.5 87
Sulfur content (ppm)
∼7–25 0 0 0 ∼200 ∼250
DME can also be used as a solvent, a spray propellant for cosmetics and fuel for home cooking. In such limited markets, the price of DME could stay at a very high level. However, if the objective is to produce DME for fuel market, the price of DME must be competitive in the existing fuels market where the price is much lower than on the chemical market. Commercial processes exist for the production of DME from coal or natural gas21 22 23.
21
E.D. Larson, Biofuel production technologies: status, prospects and implications for trade and development, United Nations Conference on Trade and Development, 2008, Available from: www.unctad.org/en/docs/ditcted200710_en.pdf. 22
M.J.A. Tijmensen, A.P.C. Faaij, C.N. Hamelinck, van Hardeveld, M. R. M., Biomass Bioenergy 23 (2002) 129-152. 23
I. Wender, Fuel. Proc. Technol. 48 (1996) 189-297.
Techno-economic assessment and market analysis
72
At present, Jiutai Energy Group in China is the world’s largest producer of DME with an annual production now reaching 1.12M tonnes of DME, the largest DME manufacturer in the world. The price of DME is 650 Euro/tonne.
7.2.6 Mixed alcohols
Mixed alcohols is a fuel product in an add-on concept, produced from volatile fatty acids (VFA). The target product is a mixture of methanol, ethanol, 2-propanol and 1-butanol, with minimal water content, octane number higher than gasoline and an energy content of approximately 85% of gasoline. The SUPRABIO product does not meet these requirements yet, but efforts are being made to close the gap through further development of catalysts to improve the selectivity of the catalytic process, and to improve the water removal. While pure acetic acid and propionic acids are established commodity products, mixed acids currently do not have a market. Since VFAs originate from waste streams, it is believed that there would be a high barrier to entry to food applications. The focus is therefore on the biofuel and fuel additive markets. Thus VFAs are considered to be chemical intermediates to be used for the production of mixed alcohols. Alcohol has been used as a fuel for internal combustion engines since the early 1900s. Historically, the level of interest in using alcohol as a motor fuel has followed cycles of fuel shortages and/or low feed-grain prices24. There are notable disadvantages to using alcohols, particularly methanol and ethanol. The relatively low boiling points and high vapour pressures of methanol and ethanol mean that vapour lock could be a serious problem, particularly at high altitudes or in warm weather. Butanol, because of its low vapour pressure, is the least likely of the alcohols to cause vapour lock. The cost of providing a distribution infrastructure for alcohols is also prohibitive. In order to overcome all these concerns, many countries, particularly those in Europe, have taken the approach of blending alcohols and petrol. In the Brazil the blended product is popularly known as gasohol. The advantages of fuel blends are that alcohol tends to increase the octane rating, which is particularly important in unleaded fuel, and reduce carbon monoxide (CO) emissions from the engine. The primary disadvantage of mixing methanol and ethanol with petrol is that under certain conditions these alcohols may separate from the petrol. An engine adjusted to burn petrol efficiently will produce less power from alcohol should it separate from the petrol. Separation is caused by the polar nature of the alcohol molecules and their tendency to absorb water, also a polar substance. Methanol is the most likely to separate, butanol the least likely. The tendency for separation increases as the temperature decreases, the quantity of water absorbed increases, and the quality of the petrol decreases. One solution to the problem of alcohol separation is the use of higher alcohols in the blends. The US Department of Energy reported that mixed alcohols when added to petrol produced significantly improved fuel quality. Mixed alcohols enhanced petrol octane and decreased
24
J.L. Smith and J.P. Workman. Alcohol for Motor Fuels, Colorado State University Extension. 9/92. Reviewed 12/04.
www.ext.colostate.edu

Techno-economic assessment and market analysis
73
engine emissions. The addition of mixed alcohols gave better results than adding individual alcohols such as methanol or ethanol to petrol. According to United Nations Conference on Trade and Development - The Biofuels Market: Current Situation and Alternative Scenarios (2009)25 the forecast demand for ethanol in the EU27 in 2020 will be around 32.4 billion L. As reference prices for ethanol, this report considered the average FOB (free on board) prices of sugar cane ethanol in Santos (Brazil) and of maize ethanol in Chicago (United States). These reference prices are $2.32 per gallon of ethanol26. Using these reference prices and the hypothetical import volumes, the report obtained a rough estimate of the value of biofuels trade. This value could be as much as $18 billion by the year 2020 and could reach over $130 billion under more favourable scenarios considered in this report. There is therefore a substantial potential market volume for ethanol and other alcohols.
25
United Nations Conference on Trade and Development - The Biofuels Market: Current Situationand Alternative Scenarios
(2009) 26
F.O Licht’s World Ethanol Report, 2008
Techno-economic assessment and market analysis
74
7.3 Biofuel market analysis
7.3.1 Background
A Drivers and constraints in the biofuel market
The main drivers for biofuel production include:
- High oil prices - Energy security - CO2 emission policies (e.g. blend mandates and targets)
For countries that rely largely on imports of oil, high oil prices and energy security are a major driver for development of new energy sources, including biofuels. While the world energy consumption will increase in the future, the fossil reserves will decrease, and energy security has high priority for many countries around the world. For instance, Barack Obama in 2011 called for a one-third cut in oil imports to US by 2025 to reduce the dependence on foreign fossil fuel27. The main constraints for biofuel production include:
- Competition with food/feed for 1st generation biofuels - High production costs of advanced biofuels - Limited willingness to invest in advanced biofuels - Limited land availability - High political risk
Competition between biofuel feedstock and food crops can lead to increased food prices. This is a major concern and also reflected in e.g. the suggested cap of food-based biofuels in the EU, as will be further addressed below. To reduce the high production costs of advanced biofuels, a massive investment in R&D is required worldwide, process improvement and improvement of the biomass logistic (transport) system. Recognition of this is for instance seen through the European Biofuels Technology Platform28.
B EU Biofuel policies
The goals in the Renewable Energy Directive (RED) (2009/28/EC)29, which will be revised in 2014, include:
- 20% share of energy from renewable sources by 2020. - 10% share of energy from renewable sources in all forms of transport by 2020.
Transport fuel must meet certain criteria to count against the 10% goal, including
27
The Washington Post: http://articles.washingtonpost.com/2011-03-30/business/35260087_1_domestic-oil-output-oil-imports-prices 28
http://www.biofuelstp.eu/ 29
Renewable Energy Directive: http://eur-lex.europa.eu/LexUriServ/LexUriServ.do?uri=OJ:L:2009:140:0016:0062:EN:PDF

Techno-economic assessment and market analysis
75
- a minimum greenhouse gas (GHG) reduction. 35% reduction has been given as a starting point, increasing to 50% and 60% in 2017, with higher requirements for new facilities.
- land use and environmental criteria (e.g. regarding biodiversity and water and air quality)
- economic and social criteria (e.g. regarding food price impact and International Labor Organization conventions).
These criteria also hold for import. In the RED, the GHG reduction made by biofuels produced from lignocellulosic and non-food cellulosic material, residues, and wastes is double-counted. The Fuel Quality Directive (FQD) (2009/30/EC) complements the RED, and states that the 10% reduction target is made up of30:
- 6% reduction in GHG intensity of fuels by 2020 (mandatory target). - 2% reduction due to developments in new technologies, e.g. carbon capture and
storage (CCS) (indicative target). - 2% reduction from purchase of Clean Development Mechanism (CDM) credits
(indicative target).
The 6 % target is an absolute requirement for fuel suppliers, and each member state must follow up in their national legislation. Furthermore, FQD sets an upper limit of 10% of ethanol in petrol. In October 2012 EC proposed a draft amendment to RED and FQD31, including the following:
- The use of food-based biofuels to meet the 10% target will be limited to 5 (energy) %.
- Installations starting operation after 1st July 2014 must have minimum 60% GHG reduction.
- Installations in operation before 1st July 2014 must have minimum 35% GHG reduction until 2018, and at least 50% from 2018.
- The principle of indirect land use change (ILUC) will not be included in calculations of GHG savings in FQD until 2020.
- For those second and third generation biofuels meeting the GHG reduction requirements, there will be a double or quadruple counting, i.e.:
o quadruple counting for algae, biomass fraction of mixed municipal and industrial waste, straw, manure and sewage sludge, palm oil mill effluent and empty palm fruit bunched, tall oil pitch, crude glycerin, bagasse, grape marcs and wine lees, nut shells, husks, cobs, bark, branches, leaves, saw dust and cutter shavings
o double counting for used cooking oil, animal fats (type I and II), non-food cellulosic material, ligno-cellulosic material except saw logs and veneer logs
30
Fuel Quality (EU): http://ec.europa.eu/clima/policies/transport/fuel/index_en.htm 31
EC: http://ec.europa.eu/energy/renewables/biofuels/doc/biofuels/com_2012_0595_en.pdf

Techno-economic assessment and market analysis
76
ILUC refers to the fact that production of biofuels on existing agricultural land may lead to food and feed production somewhere else, e.g. by changing forest into agricultural land, resulting in substantial emissions of CO2. Table 26 gives the proposed ILUC factors for different feedstocks, and also the resulting GHG savings when taking ILUC into account. The feedstock with highest GHG saving is waste vegetable or animal oil biodiesel. All seed oil crops have been given an ILUC factor of 55, actually leading to negative GHG savings. Table 26: Proposed ILUC factors and resulting GHG savings for different feedstocks (Source: EU Commission)
Since it was proposed in October 2012, the draft amendment has been subject to extensive discussions, and several compromises have been proposed. The last one was voted for 12th of December 201332, but the European Council failed to reach an agreement. Main elements in this compromise proposal included a 7% cap for food based biofuels under the RED target (not under the FQD), double counting for some biofuels (see Annex IX in the proposal), and minimum of 60% GHG reduction requirement for new installations beginning production after 1 July 2014. As the proposed compromise was rejected, it seems unlikely that a final decision will be reach before the European Parliamentary elections in May 2014, and uncertainty among investors and EU member states is thus prolonged. In today’s market there is little willingness to pay for biofuels without subsidies or mandates, and the largest risk is the highly unstable politics concerning renewables. The uncertainties around the RED make it difficult to invest in new biofuel initiatives. The development in Sweden is an example on how incentives and mandates influence the market. In several years Sweden has had tax incentives to increase the use of biofuels. This has for instance led to a blend of over 20% of hydrotreated vegetable oil (HVO). However, tax incentives are expensive for the state, and a switch to mandates moves the expenses to the blenders and eventually end users. From 1st May 2014 Sweden imposes mandates on biofuels. For biodiesel it will be 6% of the conventional biodiesel and 3.5% from waste based. Pricing structure in the market will as a result practically reduce the HVO blend from over 20% to 3.5%.
32 Council of the European Union: http://register.consilium.europa.eu/doc/srv?l=EN&t=PDF&gc=true&sc=false&f=ST%2016546%202013%20INIT&r=http%3A%2F%2Fregister.consilium.europa.eu%2Fpd%2Fen%2F13%2Fst16%2Fst16546.en13.pdf

Techno-economic assessment and market analysis
77
C The global biofuel market
Visiongain33 has estimated biofuel market values and forecasted Compound Annual Growth Rates (CAGR) for different geographical locations. Some values are summarized in Table 27. The biggest consumer of biofuels is the US, with South America as the second largest. It is expected that EU countries will lead the market in Europe due to the strong regulations for biofuels. However, each member state has different regulations. This could impact trade negatively, and less growth than in the US and South America is expected. The highest CAGR is expected to be in Asia. Table 27: Biofuel market values and CAGR for different locations (Visiongain)
Location Biofuel market value estimated for 2011
Biofuel market value estimated for 2021
Forecast CAGR for 2011-2021
Global $46.63bn $139.44bn 11.6% US $15.12bn $47.68bn 12.2% South America
$11.05bn $37.15bn 12.9%
Europe $7.56bn $17.54bn 8.8% Asia $6.20bn $21.59bn 13.3% Africa $3.47bn $8.51bn 9.4% Middle East $0.84bn $1.50bn 6.0%
South America and North America accounts for over 80% of the world’s bioethanol production, and these regions also consume by far the most. (Figure 35 and Figure 36). Europe has 70% of the share of biodiesel production, and consumes 66% (Figure 37 and Figure 38).
Figure 35:Regional production of bioethanol (2011) (reprinted with permission from Visiongain)
33
Visiongain: The Biofuels Market 2011-2021

Techno-economic assessment and market analysis
78
Figure 36: Regional consumption of bioethanol (2011) (reprinted with permission from Visiongain)
Figure 37: Regional production of biodiesel (2011) (reprinted with permission from Visiongain)
Figure 38: Regional consumption of biodiesel (2011) (reprinted with permission from Visiongain)

Techno-economic assessment and market analysis
79
Demand and supply do not necessarily coincide geographically, and the biofuel market is expected to be highly dynamic. The largest demand will typically be found in industrialized, highly energy consuming countries, while the best production potential will largely be found in developing countries due to geographical factors like advantageous climate and abundant land. In these countries, the biofuel market may be considered highly attractive as it could decrease the cost of imported oil and create jobs. On the other hand, the issue with food and feed competition could be particularly important in such areas, and there is increasing awareness of securing land for the local population. Governments’ incentives will vary widely, since it depends on each country’s specific conditions. There are large regional differences in the biofuel sector’s dependency on state support, depending on fossil fuel prices and biofuel production costs. The market in developing and emerging countries is also dependent on the biofuel policies in e.g. the US and EU where the ambitious targets can hardly be met domestically. The US has a blending mandate for 2nd generation biofuels through the Renewable Fuels Standard (RFS) requiring a lignocellulosic ethanol consumption of 60.6 billion litres per year in 2022 and 50-60% minimum GHG savings for advanced biofuels. Figure 39 gives an overview of the biofuel mandates in RFS34. To meet RFS mandates, the US is alone projected to import 15.1 billion litres of biofuel in 2020 (EnergyBusinessReports). On the other hand, both the US and EU have adopted measures protect the domestic biofuel markets against imports. Also several other countries have dedicated biofuel policies. E.g. India approved their National Policy of Biofuels in 2009, aiming for 20% blending of biofuels by 201735. And in an attempt to cut gasoil imports, Indonesia further strengthened its biodiesel blending mandate in August 2013, from 2.5% to 10% for the transport sector, and made it compulsory to use 20% biodiesel for power utilities36.
34
EnergyBusinessReports.com: Advanced Biofuels 35
Bioenergy Consult: http://www.bioenergyconsult.com/tag/national-policy-on-biofuels/ 36
Platts: http://www.platts.com/latest-news/oil/jakarta/indonesia-further-tightens-biodiesel-mandate-27357149

Techno-economic assessment and market analysis
80
Figure 39: Biofuel mandates in U.S. Renewable Fuels Standard. (Taken from EnergyBusinessReports.com)
D Biofuels in the future fuel mix
Ethanol is a commodity product, with nearly the same specifications all around the world, simplifying trade. The 1st generation biodiesel market, on the other hand, is highly fragmented, with many different suppliers and varying specifications. Thus it can be challenging to secure supply. Another challenge with 1st generation biodiesel is durability, as it cannot be stored for long. 2nd generation biodiesel, on the other hand, holds very good properties, is stable and can be stored in the same tanks as fossil fuel. 2nd generation biodiesel and hydrogenated seed oil based diesel is similar (or even premium) to fossil diesel, and can be used in mixture in any diesel engine. Among the bioalcohols, ethanol is most commonly used worldwide. European specifications limit the blend to 10% for newer cars and 5% for older cars. Butanol can mix with gasoline more easily, and current engines can tolerate even higher blends (up to 3. 7 % oxygen). Methanol is less expensive, however, a mixture of methanol with ethanol and petroleum would be preferred taking optimized engine performance into consideration. Furthermore, mixed alcohols are superior to both pure ethanol and methanol, due to e.g. the higher alcohols having higher energy content lower heat of vaporization, which is important for cold starts. Since relatively small modifications are required regarding distribution, storage and refuelling infrastructure for the liquid biofuels, this gives an advantage over other alternative fuels like liquefied petroleum gas, compressed natural gas, electricity and hydrogen. The application of hydrogen is, for instance, dependent on development of proper storage, distribution and conversion. However, the proposed food based biofuel limit (7% in the last proposed compromise), could enhance the use of alternative renewable fuels, such as hydrogen and electricity. Since biofuels are substitutes for fossil fuels, there is a close relationship between fossil fuel price and the economic feasibility of biofuels. The biofuel price will track the fossil fuel price

Techno-economic assessment and market analysis
81
in an open market as long as biofuels holds only a small fraction of the market. Ethanol from sugarcane grown in the Center-South region of Brazil is the only biofuel that could be competitive with fossil fuel to date, without financial support and over a wide range of oil prices37. With financial support that somewhat de-links the price of biofuel and fossil fuel, biofuel prices are vulnerable to crop prices and agricultural output. Furthermore, for feedstocks with alternative markets, e.g. sugar crops, the biofuel supply can be threatened since the growers could sell into a higher-priced alternative market. The use of flex-fuel cars can counter the sensitivity to variations in gasoline and sugar prices. Biomass to liquid (BTL) technology provides flexibility to market preferences (gasoline vs. diesel), since both diesel and gasoline can be produced from syngas. DME is a promising fuel in both diesel and gasoline engines due to its high cetane number, and only minor modifications are required for a diesel engine.
7.3.2 The European Biofuel Market
In 2010 about 4.7% of the transport fuel consumption in EU came from biofuels, mainly 1st generation, and biofuels are the main renewable alternative to fossil fuel since they are easily deployable on existing transport infrastructure. In EU around 2% of agricultural land is used for biofuels. 38 The primary production of biomass for Europe is illustrated in Figure 40.
Figure 40: Primary production of biomass in Europe (2011). Given in 1,000 tonnes of oil equivalent
39
Production, consumption and import (including forecasts) of biofuels in EU in the period 2006-2014, is shown in Figure 41. The EU member states both produce and consume more biodiesel than bioethanol. The bioethanol production capacity has increased steadily from
37
EnergyBusinessReports.com: Advanced Biofuels 38
EU press release database (http://europa.eu/rapid/press-release_MEMO-12-787_en.htm) 39
Eurostat (http://epp.eurostat.ec.europa.eu/tgm/mapToolClosed.do?tab=map&init=1&plugin=0& language=en&pcode=ten00082&toolbox=types)

Techno-economic assessment and market analysis
82
2,100 million litres in 2006, but is expected to be rather stable around 8,500 million litres in the period 2012 -2014, with 63% production capacity use in 201440. The Benelux countries, Germany, France, Spain and United Kingdom hold the majority of the capacity (Figure 42). In the period 2007-2012 the capacity use was only 50-60% due to periodically high grain prices, facilities being in start-up phase, and competitive imports from Brazil and the US. In February 2013 an anti-dumping duty on bioethanol from the US was introduced in EU, making imports from the US unlikely. Production flattened in 2010-2011 (Figure 41), but is expected to recover because competitive imports from US and Brazil have been cut off and feedstock supply is anticipated to improve. Consumption has flattened during the last years due to reduced fuel consumption and adjusted mandates. Actually, up until 2013, there was shortage of ethanol in Europe. However, due to a significant fall in gasoline demand, there is now a surplus, and Europe is a net exporter. This is not reflected in Figure 41. Due to uncertainty regarding future renewable policy, new investments in 1st generation bioethanol capacity seems unlikely.
Figure 41: EU supply and demand of biofuels
41
The biodiesel production capacity increased by 360% in the period 2006-2009, and then flattened (USDA Foreign Agricultural Service, 2013). The waning investment interest can be attributed to a difficult market due to low crude oil prices, high vegetable oil prices, increasing imports, and financial crisis. Furthermore the capacity utilization is expected to be only 41% in 2014, since a number of plants are temporarily stopped. Both the production
40
USDA Foreign Agricultural Service (2013): http://gain.fas.usda.gov/Recent%20GAIN%20Publications/Biofuels%20Annual_The%20Hague_EU-27_8-13-2013.pdf 41
USDA Foreign Agricultural Service (2013): http://gain.fas.usda.gov/Recent%20GAIN%20Publications/Biofuels%20Annual_The%20Hague_EU-27_8-13-2013.pdf
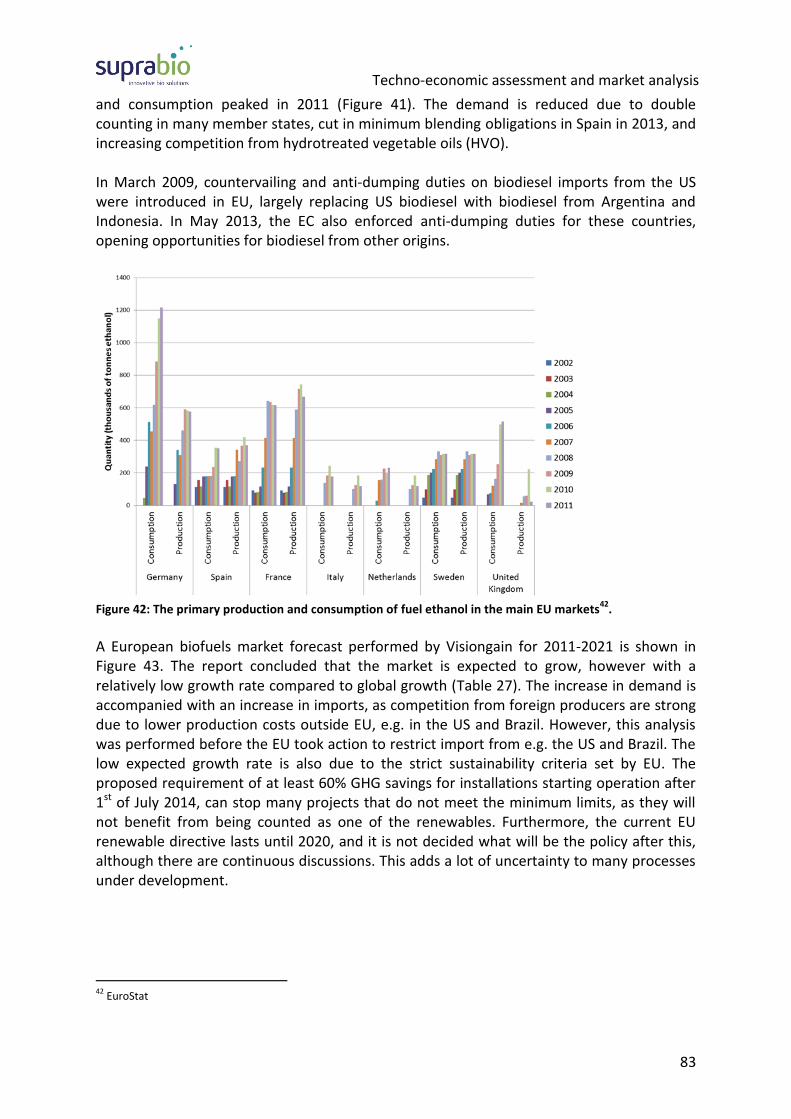
Techno-economic assessment and market analysis
83
and consumption peaked in 2011 (Figure 41). The demand is reduced due to double counting in many member states, cut in minimum blending obligations in Spain in 2013, and increasing competition from hydrotreated vegetable oils (HVO). In March 2009, countervailing and anti-dumping duties on biodiesel imports from the US were introduced in EU, largely replacing US biodiesel with biodiesel from Argentina and Indonesia. In May 2013, the EC also enforced anti-dumping duties for these countries, opening opportunities for biodiesel from other origins.
Figure 42: The primary production and consumption of fuel ethanol in the main EU markets
42.
A European biofuels market forecast performed by Visiongain for 2011-2021 is shown in Figure 43. The report concluded that the market is expected to grow, however with a relatively low growth rate compared to global growth (Table 27). The increase in demand is accompanied with an increase in imports, as competition from foreign producers are strong due to lower production costs outside EU, e.g. in the US and Brazil. However, this analysis was performed before the EU took action to restrict import from e.g. the US and Brazil. The low expected growth rate is also due to the strict sustainability criteria set by EU. The proposed requirement of at least 60% GHG savings for installations starting operation after 1st of July 2014, can stop many projects that do not meet the minimum limits, as they will not benefit from being counted as one of the renewables. Furthermore, the current EU renewable directive lasts until 2020, and it is not decided what will be the policy after this, although there are continuous discussions. This adds a lot of uncertainty to many processes under development.
42
EuroStat

Techno-economic assessment and market analysis
84
Figure 43: European biofuels market forecast 2011-2021 (reprinted with permission from Visiongain)
7.3.3 Market for advanced biofuels in Europe
For sugar cane ethanol an ILUC factor of 13 g CO2eq/MJ is proposed, resulting in 58% GHG savings compared to fossil fuels (See Table 26). For existing plants the GHG savings meet the requirements. The ILUC and GHG for wheat ethanol are similar, and almost meeting the requirement of 60% for new plants from 2014. Thus, 2nd generation ethanol could be an interesting candidate to fulfil the non-food requirement in the EU renewable directive draft amendment. However, in the coming years the gasoline demand is expected to decrease and the diesel to gasoline ratio to increase, as shown in Figure 44. The increased sale of new diesel cars is expected to stagnate, but not decrease. More old gasoline cars will be taken out, and thus the share of diesel cars is expected to increase in total. The number of hybrid gasoline cars will probably increase, so that the gasoline consumption is reduced, and more gasoline than diesel hybrid cars are expected to be sold because they are cheaper. Furthermore, there is a blend wall for ethanol at 10 vol%, set in FQD. Together, these factors will most probably limit the demand for ethanol in the future. 1st generation ethanol is currently cheap and available, and also has good GHG reduction. A cap for food based biofuels is proposed in EU. Currently, there is no clear alternative from the diesel sector if ILUC factors are adopted, so it seems likely that this portion will be filled with 1st generation ethanol. This leaves two important questions:
o Since the demand for ethanol will be limited in the future, how large will the actual market for 2nd generation ethanol in Europe be?
o How to meet the requirement for non-food diesel?
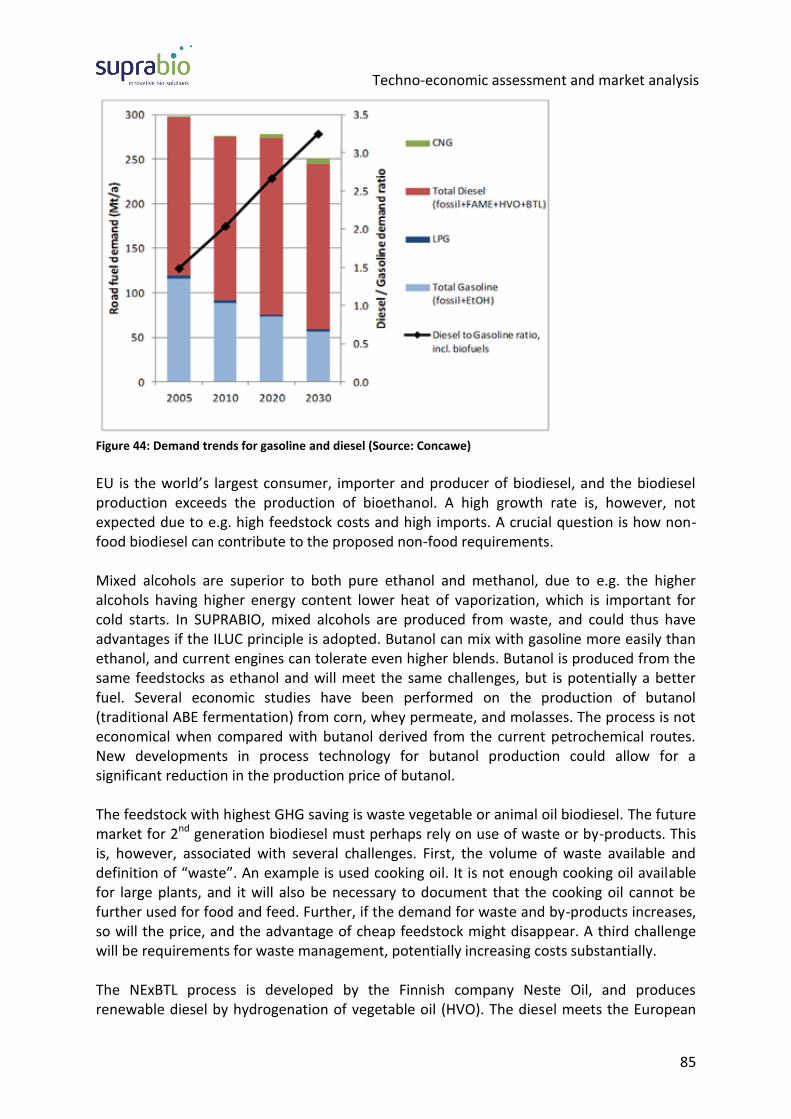
Techno-economic assessment and market analysis
85
Figure 44: Demand trends for gasoline and diesel (Source: Concawe)
EU is the world’s largest consumer, importer and producer of biodiesel, and the biodiesel production exceeds the production of bioethanol. A high growth rate is, however, not expected due to e.g. high feedstock costs and high imports. A crucial question is how non-food biodiesel can contribute to the proposed non-food requirements. Mixed alcohols are superior to both pure ethanol and methanol, due to e.g. the higher alcohols having higher energy content lower heat of vaporization, which is important for cold starts. In SUPRABIO, mixed alcohols are produced from waste, and could thus have advantages if the ILUC principle is adopted. Butanol can mix with gasoline more easily than ethanol, and current engines can tolerate even higher blends. Butanol is produced from the same feedstocks as ethanol and will meet the same challenges, but is potentially a better fuel. Several economic studies have been performed on the production of butanol (traditional ABE fermentation) from corn, whey permeate, and molasses. The process is not economical when compared with butanol derived from the current petrochemical routes. New developments in process technology for butanol production could allow for a significant reduction in the production price of butanol. The feedstock with highest GHG saving is waste vegetable or animal oil biodiesel. The future market for 2nd generation biodiesel must perhaps rely on use of waste or by-products. This is, however, associated with several challenges. First, the volume of waste available and definition of “waste”. An example is used cooking oil. It is not enough cooking oil available for large plants, and it will also be necessary to document that the cooking oil cannot be further used for food and feed. Further, if the demand for waste and by-products increases, so will the price, and the advantage of cheap feedstock might disappear. A third challenge will be requirements for waste management, potentially increasing costs substantially. The NExBTL process is developed by the Finnish company Neste Oil, and produces renewable diesel by hydrogenation of vegetable oil (HVO). The diesel meets the European

Techno-economic assessment and market analysis
86
standard CEN EN 590, and can be used in standard engines without modifications. Neste is the only large scale producer of HVO, and this influences the market significantly. The price is adjusted to each country’s blending requirements, incentives, subsidies, and potential competitors, and hence the price varies around Europe. It should, however, be noted that Neste uses palm oil and rape seed oil, and if the draft amendment including ILUC factors is adopted, the process will not meet the GHG savings requirement. The main challenge for the seed oil based diesel is the feedstock. The product properties is excellent for hydrogenated seed oil based biodiesel and can even improve the overall diesel properties by blending it into fossil based diesel. However, all seed oil crops have been given an ILUC factor of 55 in the draft directive, actually leading to negative GHG savings. If this stands, it can probably be concluded that there will be no market for fuels produced from seed oil crops after 2020. In SUPRABIO there is one such product, i.e. hydrogenated seed oil. FT diesel will be comparable to NExBTL. In SUPRABIO it is produced from forest residues, straw and poplar, and may thus have advantages of double counting and low ILUC factor. No expensive or extensive vehicle adaptation is required to introduce DME43. Fuel DME is used as a liquid at 5 bar, and the distribution infrastructure is similar to liquefied petroleum gas (LPG). DME could be interesting for captive fleet owners, e.g. buses and trucks. In June 2013, it was announced that Volvo Trucks together with Safeway Inc. and Oberon Fuels would test heavy-duty commercial vehicles powered by biomass-produced DME44.
7.4 Biochemical biorefinery non-fuel products
7.4.1 2,3-butanediol
2,3-butanediol (BDO) is an intermediate product in the butanol biochemical pathway. It is produced in a fermentation step. The BDO is extracted from the fermentation broth and purified to achieve a product of suitable quality (>96% pure).
43
Volvo: http://www.volvogroup.com/SiteCollectionDocuments/Volvo%20AB/values/environment/climate_issues_in_focus_eng.pdf 44
Volvo press release: http://www.volvotrucks.com/SiteCollectionDocuments/VTNA_Tree/ILF/Products/Alt_Fuel/press_kit/Volvo%20Trucks%20and%20Safeway%20to%20Test%20Bio-DME-Powered%20Vehicles%20in%20North%20Ameri.pdf

Techno-economic assessment and market analysis
87
A Properties
BDO has a high boiling point (177 °C, varying to 182 °C depending on the isomeric content). It has got two chiral carbon atoms and thus occurs as optical isomers. It is miscible in water (hydrophilic). It is also considered as a possible alternative fuel since its combustion value is 27.19 KJ/g45. It has a low freezing point of -60 °C.
B Applications
BDO is used as a fuel additive and in the manufacture of printing inks, perfumes, fumigants, moistening and softening agents, explosives, plasticizers, foods and pharmaceuticals46. BDO can be used as an antifreeze agent due to its low freezing point of -60 °C. Dehydration of BDO gives methyl ethyl ketone which is an effective fuel additive having a higher heat of combustion than ethanol40. Other possible application is its conversion to 1,3-butadiene which is used in the manufacture of synthetic rubber.
C Competing products
The main competing product is BDO produced from fossil oil.
D Market and volume estimation
Global market for BDO was estimated to be 58,000 tonnes in 2010. The bulk chemical price is $1.00-$2.00 / kg47.
7.4.2 Methyl ethyl ketone
Methyl ethyl ketone (MEK) is an intermediate product in the butanol biochemical pathway. It is produced by dehydrating BDO.
A Properties
MEK is a colourless, stable, flammable liquid (boiling point 79.6 °C). It is miscible with water (27.95 g / 100 ml) and a variety of organic solvents. It has a low ignition point. The energy density of MEK is 33.9 MJ/kg and the octane number of MEK is 96.7 when mixed (25 % volume) with gasoline48.
B Applications
MEK’s fuel properties make it an excellent fuel additive. It aids in cleaning the engine during combustion thereby preventing a build-up of sticky tars and varnishes along the valves and cylinder walls of the engine49.
45
Y. Li, Y. Wu, J. Zhu and J. Liu., Biotecnology and Bioprocess Engineering, 2011, 17, 337-345 46
X-J Ji, H. Huang, P-K Ouyang, Biotechnology Advances., 2011, 29, 351-36 47
E. Celinska and W. Grajek., Biotechnology Advances, 2009, 27, 715-725 48
Ai. V. Tran and R. P. Chambers, Biotech. and Bioengineering, 1987, 29, 343-351 49
G. L. Osgood and G. G. Reinhard, US Patent 4,482,352
Techno-economic assessment and market analysis
88
It is also a coating solvent (worldwide 50% of MEK is consumed for this application). Printing inks makes up 8% of MEK. It is also used as a plastic welding agent. It is used in processes involving gums, resins, cellulose acetate, nitrocellulose, vinyl films, in the manufacture of plastics, textiles, in household products such as lacquer, varnishes, paint remover, adhesives and as cleaning agent50.
C Competing products
The main competing product is MEK produced from mineral oil. Other competing products are alcohols (ethanol, butanol, butanediol) both as solvents and fuel additives for gasoline and diesel. Furthermore, water-based solvents are now becoming known as low cost, environmentally friendly alternatives to traditional carbon-based solvents such as MEK. Other competing solvents are acetone (propanone) and ethyl acetate.
D Market and volume estimation
In 2005, publicly available sources reported global production for MEK reached 1,141,000 tonnes51. In Japan alone, the largest plant is capable of producing some 170,000 tonne/year. The European market price is 1.85-2.10 Euro/kg, which is equivalent to $2.46 - $2.80/kg52.
7.4.3 Butyric and propionic acid
The initial target products were pure butyric and propionic acid. However, due to a discrepancy between the target product and the actual SUPRABIO product the target product has been changed to a mixed acid product. The new target product contains propionate, acetate and succinate and maximum 20% water. Butyric acid, propionic acid and the mixed product are all discussed in this section.
A Applications
Both propionic and butyric acids are to a large degree used in the food industry but also have other applications. Propionic acid is mainly used:
As preservation agent in feed and food
As a herbicide precursor
As precursor of cellulose acetate propionate plastics (CAP)
As feed acidifier
For flavouring, fragrances, and pharmaceuticals.
50
Butanone, http://en.wikipedia.org/wiki/Butanone 51
Chemical.net (December 2013) 52
NBS; ResearchInChina
Techno-economic assessment and market analysis
89
Butyric acid is used:
For flavouring and fragrances, food, beverage, and perfume production
As animal feed
As a antimicrobial agent
For polymer production (plastics and rubbers)
The mixed acid product, containing maximum 20% water, can be used for conservation of grain for feed. Literature studies have suggested the proposed use, and all the produced compounds from the metabolism (propionate, acetate, succinate) are GRAS (Generally Recognised As Safe) compounds, i.e. recognised as safe for human and animal food/feed.
B Competing products
The competing products are butyric and propionic acids produced from other feedstocks (e.g. fossil oil) and through other processes.
C Market and volume estimation
The global annual amount of propionic acid produced is 130,000 tonnes. The price ranges from 900-1,500 US$/tonne. The global annual production of butyric acid is 50,000 tonnes. The price ranges from 1,500-1,800 US$/tonne53. Currently 154 companies are listed as producers of propionic acid from all continents except South America. The production of butyric acid is carried out by 64 producers from countries from all continents except South America and Australia54. The principal producers of propionic and butyric acid are either Chinese or US-based. Main players are: Celanese Corporation, USA and Eastman Chemical Company, USA. Both companies produce either butyric acid or both acids based upon petro-refinery sources. The company ZeaChem Inc, USA operates a biorefinery producing propionic acid from renewable resources. Butyric acid is planned to be included in the biorefinery production the coming years55. The demand for propionic acid is heavily dependent upon food and feed production. The demand for propionic acid is, therefore, rather stable regardless the global economic situation. The demand for propionic acid is estimated to increase by 2.3% per year56. In agricultural systems, propionic acid is increasingly used for conservation of grain for feed. At a lower price, this means of conservation (around 1 liter/ton grain) could compete with energy demanding drying processes, which would increase the demand dramatically. According to a 2011 report from Global Industry Analysts, a total ban on animal feed antibiotics as growth promoters by the European Union has increased the interest in feed acidifiers such as propionic and butyric acids57. Today the propionic acid market represents
53
www.lookchem.com and Sauer, M. Et al. 2008. Trends in Biotechnology 26:100-108. 54
www.Kompass.com 55
www.datamonitor360.com 56
www.ICIS.com 57
www.strategyr.com

Techno-economic assessment and market analysis
90
the largest market for feed acidifiers globally and is expected to exceed US$USD 417 million in 2012. There are not so many political aspects regarding butyric and propionic acid, they are what they are and are established products on the commodity market. The industries and manufacturers that currently buy these compounds on the world market or in the local supply, will probably switch to the SUPRABIO product if the price is favourablefavorable. A premium price for being green cannot be expected on most of the markets. However, depending upon the acceptance of the use of sulphuric acid in the pretreatment process, the acids from the SUPRABIO process could possibly be accepted for organic farming and food production since organically grown biomass could be used as a feedstock for the process. This could justify a premium price. If sulphuric acid is not acceptable a pretreatment process without acid (e.g. wet oxidation) could be used.
7.4.4 Four carbon 1,4 dicarboxylic acids
Belonging to the four carbon 1,4 dicarboxylic acids are malic acid, fumaric acid, and succinic acid. These compounds are chemically interconvertable and will therefore be covered as carbon 1,4 dicarboxylic acids in this market evaluation1. The target product has not been produced, extracted and purified within SUPRABIO. The development of fungal cell factories for the production of 1,4 dicarboxylic acids is still in progress. Also, the process from substrate to purified product has not been fully described. The target products are still the pure dicarboxylic acids (>99% purity). Therefore, the market analysis is focused on the pure acids even though the actual SUPRABIO product not yet meets the target product specifications.
A Applications
The main use of carbon 1,4 dicarboxylic acids is as building blocks for the construction of secondary chemicals. These secondary chemicals are according to the US Department of Energy58.
Tetrahydrofuran (THF)
Butanediol (BDO)
Secondary chemicals belonging to the γ-butyroacetone family (GBL Family)
Secondary chemicals belonging to pyrrolidinone family (GBL Family)
Straight and branched chain polymers
These secondary chemicals are mainly used for the production of fibres, green solvents, water soluble polymers suitable for water treatment, metal cleaning and finishing, textile finishing, electroless plating, pharmaceuticals, infusions in hospitals and paints etc.58,58.
58 PNNL, NREL, & EERE (2004) Top Value Added Chemicals from Biomass. US Department of Energy

Techno-economic assessment and market analysis
91
Biologically derived 1,4-dicarboxylic acids are also widely used in the food industry (beverages, candy and food) and are valuable intermediates for preparing edible products59.
B Competing products
The main competing product is the petrochemically derived maleic acid, which serves as building block for the synthesis of 1,4-dicaboxylic acids. The conversion of maleic acid to 1,4-dicarboxylic acids is a well-known procedure that is currently used to produce 1,4-dicaboxylic acids58,59.
C Market and volume estimation
The current estimated production volumes differ according to source. The National Non-Food Crops Centre NNFCC (2010) and Zeikus et al. (1999) estimate a current global production of succinic acid to be approximately 15,000-30,000 metric ton/year, whereas Roa Engel et al. (2008) goes as high as 270,000 metric ton/year citing Chemical Week magazine from 200760,61,62. There are however two reasons to doubt the findings of NNFCC (2010) and Zeikus et al. (1999):
1. An independent report regarding maleic acid made by Felthouse et al. (2001) indicates that the numbers originating from Roa Engel et al. (2008) are most reliable63
2. Missing citations from Zeikus et al. (1999) and NNFCC (2010) impair their findings.
Roa Engel et al. (2008) goes a step further and lists the global production volumes of fumaric acid to be 90,000 metric ton/year, whereas malic acid production volume is indirectly reported to be less than 15,300 metric ton/year62. In a different issue of Chemical Week Magazine it is reported that the global demand of malic-, and fumaric acid in 2004 was 28,000 metric ton and 84,000 metric ton respectively64. However, taking the close relationship seen between the demand and production of fumaric acid into consideration, the malic acid production volume is estimated to be closer to 30,000 metric ton/year and not >15,300 metric ton/year as reported by Roa Engel et al. (2008). An estimation of the global production volume of 1,4-dicarboxylic acid would therefore be 390,000 metric ton/year. Using the distribution of maleic acid product volumes, it can be
59
Goldberg, I., Rokem, J., & Pines, O. (2006) Organic acids: old metabolites, new themes. Journal of Chemical Technology and Biotechnology 81, 1601-1611 60
Adrian Higson (2010) NNFCC Renewable Chemicals Factsheet: Succinic Acid, National Non-Food Crops Centre, February 3, accessed November 23, 2011 61
Zeikus, J. G., Jain, M. K., & Elankovan, P. (1999) Biotechnology of succinic acid production and markets for derived industrial products. Applied Microbiology and Biotechnology 51, 545-552 62 Roa Engel, C. A., Straathof, A. J. J., Zijlmans, T. W., van Gulik, W. M., & van der Wielen, L. A. M. (2008)
Fumaric acid production by fermentation. Appl Microbiol Biotechnol 78, 379-89 63
Felthouse, T. R., Burnett, J. C., Horrell, B., Mummey, M. J., & Kuo, Y. J. (2001) Maleic anhydride, maleic acid, and fumaric acid. Kirk-Othmer Encyclopedia of Chemical Technology 64
Alex Scott (2005) Product focus, maleic acid. Chemical Week p.26, May, accessed November 23, 2011

Techno-economic assessment and market analysis
92
estimated that the European production volume equals 28 %, which is equivalent to 109,000 metric ton. Because of the interconversion of 1,4-dicarboxylic acids, the current market price is estimated based on the price for succinic acid. According to NNFCC (2010) and RSC (2010) the price for succinic acid and therefore also 1,4-dicarboxylic acids is 2-3,000 US$/tonne60,65.
7.4.5 Lignin-based products
In the SUPRABIO project several potential products from lignin extracted from pretreated straw are included. The products are of two kinds:
Health care products – substances with antioxidant properties
Surfactants – surface active substances, one application being emulsifiers As has been described in the “Report on lignin properties for health products” (Ghidoni et al. 2013)66, the “Report on process for manufacturing emulsifiers” (Ljunggren 2013)67 and the “Report on surfactants manufactured from lignin” (Ljunggren & Pedersen 2013)68 the actual properties of the extracted lignin samples do not correspond with the targeted product properties. The antioxidant analysis showed some antioxidant properties but far less than anticipated, and similarly the surfactant properties were inadequate. To attain a lignin with suitable properties the extracted lignin could be chemically and/or physically modified. Modification of the extracted lignin has not been tested within the SUPRABIO project. However, recent findings and experience within Borregaard point towards that the steam-explosion pretreatment process destroys a large part of the lignin’s reactive side-groups by chemical crosslinking. This will make it difficult to apply chemical reaction for functionalization to improve product properties. To conclude, improving the lignin properties by chemical reaction will most likely be very difficult. Since the target products are not available within the SUPRABIO consortium and therefore cannot be evaluated by an external party and for the same reason a connection between the achieved SUPRABIO product and the target product cannot be realised. Therefore this market analysis will broadly discuss lignin as a potential feedstock for high-value products where surfactants and health care products are two important product families.
A Potential applications for lignin
The potential number of products manufactured from lignin is huge ranging from very low value-large volume products to very high value-low volume products (see Figure 45). In the SUPRABIO project the lignin products in focus has been health-care products (high value-low
65
Phil Taylor (2010) Biosuccinic acid ready for take off? RSC – Chemistry World, January 21, accessed November 23, 2011 66
Ghidoni, D., Mathey, R., Nguyen, T.Q.: Sustainable products from economic processing of biomass in highly integrated biorefineries. Deliverable D 4-8 prepared for the SUPRABIO project, supported by EC’s FP7 programme. Orbe, 2013. 67
Ljunggren, M.: Report on process for manufacturing emulsifiers. Deliverable D 4-5 prepared for the SUPRABIO project, supported by EC’s FP7 programme. Ballerup, 2013. 68
Ljunggren, M. & Pedersen M.: Report on surfactants manufactured from lignin. Deliverable D 4-6 prepared for the SUPRABIO project, supported by EC’s FP7 programme. Ballerup, 2013.

Techno-economic assessment and market analysis
93
volume) and surfactants (low to high value and large to small volumes). Other potential applications are for example phenolic resins, platform chemicals (e.g. benzene) and vanillin. The unique composition and the large number of aromatic compounds can make lignin a renewable and the main source of aromatic compounds for the chemical industry in the future.
B The lignin market
The current global production of lignin is estimated to be 50 million tonnes, made available from pulping processes. However, most of the lignin is burned on-site for heat and power generation. Table 28 gives an overview of current production processes, their state of development, annual production, example producers and purity of lignin. Currently the main isolated lignin product category is lignosulfonates with an annual production of about 1.1 million tonnes of which approximately 70% is used for dispersant applications and 30 % for adhesive and binder applications. Borregaard Lignotech (NO) is the largest producer of lignosulfonate, other producers being MeadWestvaco (US) and Tembec (CAN). Depending on form, quality and purity the current market price of lignin is £250 - £2000 per tonne69.
Figure 45: Potential lignin applications. Figure adopted from Gosselink, 2011
70 .
However, specific products (from chemically modified lignin and highly purified) can claim significantly higher prices, e.g. synthetic vanillin from lignin which competes with vanilla extract (600,000 US$/tonne)71 and synthetic vanillin from crude-oil (12,000 US$/tonne). The lignin available from various processes is likely to rapidly increase in the near future as a result of increased activity in the biofuel/biorefinery sector. An increased activity in this sector is likely due to EU and US biofuel directives (e.g. in EU the target is to replace 10% of transportation fuels by biofuels by 2020). The challenge is to develop economically and
69
Renewable Chemicals Factsheet: Lignin, The National Non-Food Crops Centre (NNFCC), 2011 70
Lignin as a renewable aromatic resource for the chemical industry, Gosselink, PhD thesis, 2011 71
High-value opportunities for lignin: Unlocking its potential, Frost & Sullivan, 2012
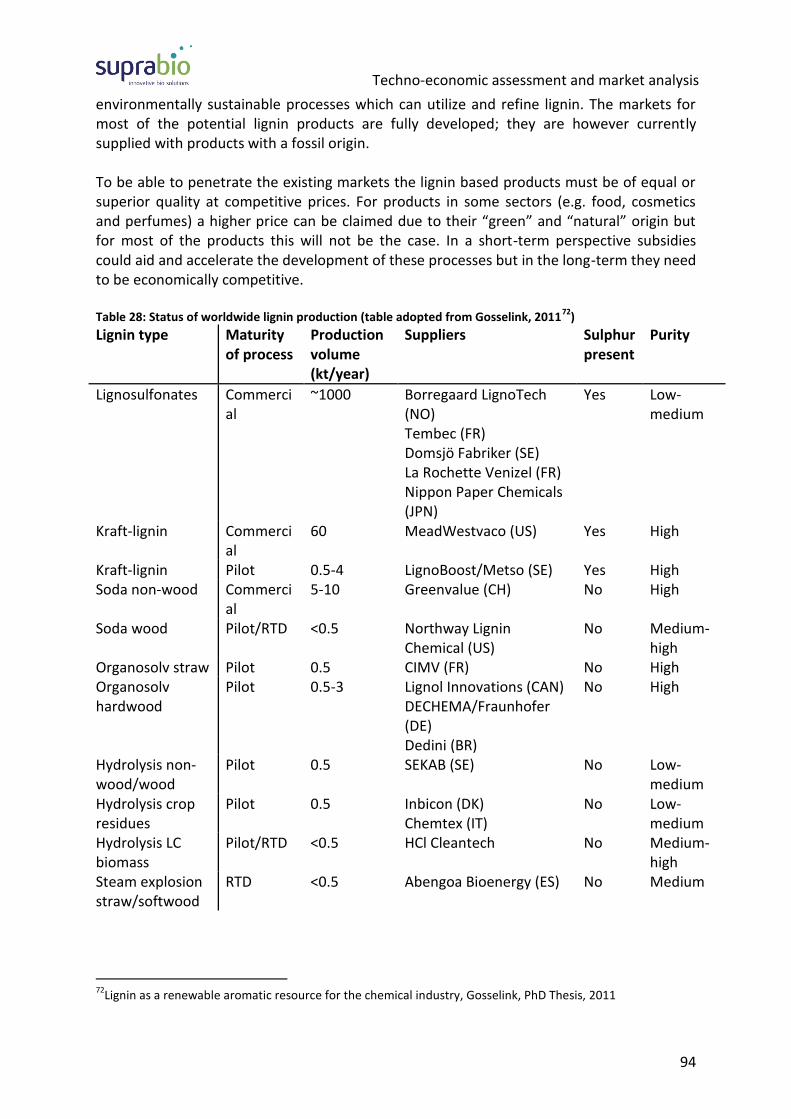
Techno-economic assessment and market analysis
94
environmentally sustainable processes which can utilize and refine lignin. The markets for most of the potential lignin products are fully developed; they are however currently supplied with products with a fossil origin. To be able to penetrate the existing markets the lignin based products must be of equal or superior quality at competitive prices. For products in some sectors (e.g. food, cosmetics and perfumes) a higher price can be claimed due to their “green” and “natural” origin but for most of the products this will not be the case. In a short-term perspective subsidies could aid and accelerate the development of these processes but in the long-term they need to be economically competitive. Table 28: Status of worldwide lignin production (table adopted from Gosselink, 2011
72)
Lignin type Maturity of process
Production volume (kt/year)
Suppliers Sulphur present
Purity
Lignosulfonates Commercial
~1000 Borregaard LignoTech (NO) Tembec (FR) Domsjö Fabriker (SE) La Rochette Venizel (FR) Nippon Paper Chemicals (JPN)
Yes Low-medium
Kraft-lignin Commercial
60 MeadWestvaco (US) Yes High
Kraft-lignin Pilot 0.5-4 LignoBoost/Metso (SE) Yes High Soda non-wood Commerci
al 5-10 Greenvalue (CH) No High
Soda wood Pilot/RTD <0.5 Northway Lignin Chemical (US)
No Medium-high
Organosolv straw Pilot 0.5 CIMV (FR) No High Organosolv hardwood
Pilot 0.5-3 Lignol Innovations (CAN) DECHEMA/Fraunhofer (DE) Dedini (BR)
No High
Hydrolysis non-wood/wood
Pilot 0.5 SEKAB (SE) No Low-medium
Hydrolysis crop residues
Pilot 0.5 Inbicon (DK) Chemtex (IT)
No Low-medium
Hydrolysis LC biomass
Pilot/RTD <0.5 HCl Cleantech No Medium-high
Steam explosion straw/softwood
RTD <0.5 Abengoa Bioenergy (ES) No Medium
72
Lignin as a renewable aromatic resource for the chemical industry, Gosselink, PhD Thesis, 2011

Techno-economic assessment and market analysis
95
In principle there are two different strategies for the development of the lignin processes. Lignin can either be viewed as a value added by-product (as in SUPRABIO) or as a principal product (as in SUPRABIO’s sister project BIOCORE). In both cases the lignin can be refined to more valuable products. The difference is that the main focus in the former strategy is on utilizing the sugars in the cellulose and hemicellulose (for example the pretreatment is focused on high yield of the sugars) while in the latter strategy focus is on retrieving the three fractions (cellulose, hemicellulose and lignin) as pure and unaltered as possible. Both strategies have their merits and are valuable for the development of lignin as a feedstock for aromatic compounds.
7.5 Add-on products
The idea with add-on products is to integrate a process with the main biorefinery process which could utilize waste streams and could result in synergistic advantages (both from an economic and a sustainability perspective). The add-on products targeted are high-value chemicals. In SUPRABIO the high-value chemicals comprise Ω-3 fatty acids, β-glucan, phycoerythrin and sulphated exopolysaccharides, glucosamine, sugar fatty acid esters, hydroxystearic acid and vernolic acid. Within SUPRABIO IGV GmbH has the intention of extracting the omega-3 fatty acids eicosapentaenoic acid (C20:5n-3, EPA) and docosahexaenoic acid (C22:6n-3, DHA), immune modulating β-glucans, phycoerythrin and sulphated exopolysaccharides from microalgae biomass. The algae biomass would be produced in a plant integrated with either a biochemical or thermochemical biorefinery. The glucosamine process is an add-on to the biochemical biorefinery utilizing glucose. The sugar fatty acid ester production is also an add-on to the biochemical biorefinery but also incorporates a product from an algae add-on facility, free fatty acids. Hydroxystearic acid and vernoclic acid are both products of an add-on to the algal process, which in turn is an add-on to the biorefinery.
7.5.1 Glucosamine
The structure of glucose amine is shown in Figure 46.
Figure 46: 2-Amino-2-deoxy-β-D-glucopyranose (glucosamine).
A Applications
Glucosamine is an amino sugar that is naturally present in shellfish, fungi and bone marrow. Glucosamine is sold as either the HCl or sulfate salts and also as mixtures with chondroitin a biopolymer, which is a structural component of cartilage. It is used as a nutritional supplement for the prevention and treatment of joint conditions, e.g. osteoarthritis. It is also used by sportspeople for the treatment of joint pain. Glucosamine is an intermediate in

Techno-economic assessment and market analysis
96
the production of N-acetyl glucosamine and hyaluronic acid. By synthesising glucosamine directly from glucose using biocatalysis, animal sources are avoided making it suitable for people who are allergic to shellfish and vegetarians/vegans73,74.
B Competing products
Competing products are glucosamine produced through other processes and there are currently two production methods: 1. Hydrolysis of chitin from shellfish. This form of glucosamine is unsuitable for vegetarians and people with shellfish allergies. As well as this, production can be seasonally dependent. 2. Fermentation using microorganisms and subsequent acid hydrolysis of the isolated chitin (as for method 1). Metabolic engineering is increasing titre yields, which are currently low, and purification from the fermentation broth is an issue.
C Market and volume estimation
The total size of the EU food supplement market in 2005 was estimated to be around 5 billion € (retail selling prices). This breaks down into 50% ‘Vitamins & Minerals’ and 43% ‘Other Substances’ of which there are over 400 including glucosamine. 75% of the ‘Other Substances’ market is in the 4 countries; Germany, Italy, France and the United Kingdom. There are national variations across the EU between market size and type of ‘Other Substance’ used. Glucosamine has a market value of € 64.3 M in the EU. Prospects for growth are strongest in member states where consumption is relatively low.75
7.5.2 Sugar fatty acid esters
The main potential of sugar fatty acid esters is the use as surfactants76. The challenge is to produce cheaper, greener surfactants. Most surfactants are currently derived from petroleum. Ethylene oxide (EO) is widely used in surfactant production however avoidance of its use is desirable as it is highly flammable and hazardous to health. Green alternatives are sought, either from renewable feedstocks or via more sustainable manufacturing processes.
73
Sitanggang, A.B., et al. (2012) Mini Review: Aspects of glucosamine production using microorganisms International Food Research Journal 19(2): 393-404 74
Report from the commission to the council and the European parliament on the use of substances other than vitamins and minerals in food supplements 75
Commission staff working document: Characteristics and perspectives of the food market for food supplements containing substances other than vitamins and minerals COM(2008)824 final, SEC(2008)2977 Brussels, 5.12.2008, SEC(2008)2976, COM(2008)824 Final, SEC(2008)2977 76
Sources of information: http://www.acmite.com/market-reports/chemicals/world-surfactant-market.html Croda – personal communication http://www.elevance.com/2010/11/09/what-were-reading-seeking-cheap-green-surfactants/ http://www.icis.com/Articles/2010/10/04/9396996/surfactant-manufacturers-look-for-green-but-cheap-petro-alternatives.html

Techno-economic assessment and market analysis
97
Croda Ltd. want to develop a non-EO non-ionic surfactant with a hydrophilic-lipophilic balance (HLB) between 10 and 17. For example lauryl glucoside (an alkyl polyglucoside) has a HLB of 13. Croda produce sorbitan esters however it is difficult to get the desired HLB without the use of EO. By using a sugar with a fatty acid, a high HLB can be achieved. Croda do produce sugar (sucrose) esters however, they are expensive to manufacture and use non-ideal solvents in production. In SUPRABIO the aim is to produce sugar fatty acid esters. These are non-ionic surfactants. By using the sugars and fatty acids produced in the biorefinery, the product will be produced from 100% renewable sources. Moreover, by using an enzyme to produce the sugar fatty acid ester, the manufacturing process will be greener due to the mild conditions employed and the avoidance of undesirable solvents.
A Applications
Surfactants are compounds that lower the surface tension of a liquid, the interfacial tension between two liquids or a solid and a liquid. Surfactants may act as detergents, wetting agents, emulsifiers, foaming agents and dispersants. They are used in many products including household cleaning, industrial and institutional cleaning, personal care and cosmetics, textiles, food and beverage, oil, polymer paints and coatings. They can be broadly classed, based on their heads or tails, into the following categories; anionic, cationic, LAS, amphoteric and specialty (which includes silicone, fluoro, polymeric and biosurfactant).

Techno-economic assessment and market analysis
98
B Competing products
Competing products for sugar fatty acid esters are listed in Table 29. Table 29: Competing products for sugar fatty acid esters.
Product Notes Manufacturers
Sodium dodecyl sulfate (SDS)/Sodium lauryl ether sulfate (SLES)
Anionic surfactants. Derived from coconut and palm oil. Inexpensive and effective but irritants. Questionable manufacturing techniques.
Various
Alkyl polyglucoside (APG) and esters
Non-ionic. Made from vegetable oils and starch.
Cognis (part of BASF) is the world’s largest producer, expanded, new plant in Jinshan, China 25,000 tonnes/year. Total worldwide production not disclosed. Strong patent position. Others: Clariant, Croda, SEPPIC, Lamberti, LG Household and Healthcare
Suga and Polysuga
Sugar based surfactants from corn syrup and coconut oil. Drum and bulk quantities.
Colonial Chemical
Alkyl polpentosides (APPs)
From natural fatty alcohols and pentose sugars from wheat bran and straw. Production levels N/K. Strong patent position. Price competitive with APG.
WheatOleo
Biosurfactants (Sophorolipids/ Rhamnolipids)
Produced by yeast fermentation process. Mild and low aquatic toxicity. Current production scale is small, aiming for several thousand tonnes in order to compete with APGs.
Ecover (30 tonnes/year)
Methyl ester sulfonates (MES)
Anionic surfactants. Potential alternative to SLS and SDS. High detergency at low concentration. Hard to manufacture. Slow growth.
Lion (Japan) Sun Products (US)

Techno-economic assessment and market analysis
99
C Market and volume estimation
These products command prices in the order of €10-100 per kilo. The global surfactant market is valued at $600m (€413m) and naturally derived speciality surfactants currently account for 10% of this. However, this is growing due to increased consumer awareness and desire to use environmentally friendly products.
7.5.3 Hydroxystearic acids
The chemical structures of two hydroxystearic acids are shown in Figure 47 and Figure 48.
Figure 47: Delta-12-hydroxystearic acid (12-HSA).
Figure 48: Omega-1-hydroxystearic acid (1-HSA).
A Applications
12-HSA has lubricating, emulsifying, cleansing and surfactant properties and as such is used in a wide variety of products/industries. The corresponding lithium and calcium salts are lubricants used in grease manufacture and plastics lubrication. It is used in cosmetics as its polymer, polyhydroxystearic acid (PHSA), which has humectant properties. It is used to produce acrylic esters, which are used as paints. It is also used as an additive in natural and synthetic rubber. It is also used as a raw material for chemical synthesis. 1-HSA has similar functions to 12-HSA but its properties will vary slightly due the slight difference in chemical structure. A purity of >99% is required77.
B Competing products
12-HSA is produced by hydrogenation of castor oil. Castor oil consists of various fatty acids but is predominantly ricinoleic acid (>85%) which when hydrogenated forms 12-HSA78. 1-HSA production methods have not been found.
77
Croda Ltd, personal communication 78
http://www.greenerpro.com/Castor.html

Techno-economic assessment and market analysis
100
C Market and volume estimation
No free-of-charge data on prices and market volume has been found. A market report has been found online but is available for 2650 US$79. Presumably, as for vernolic acid, the market can only increase as bio-based products replace existing petroleum-derived products.
7.5.4 Vernolic acid
The chemical structure of vernolic acid is shown in Figure 4980.
Figure 49: (+)-(12S,13R)-Epoxy-cis-9-octadecenoic acid.
A Applications
Vernolic acid is mainly used in the paints and plastics industries. Examples of applications:
Non-volatile solvent.
Use as plasticizers of PVC, currently served by petroleum derived compounds such as phthalates.
Ability of epoxy group to crosslink means it has potential use in adhesives and coatings/paints.
Precursor of monomers of nylon-11 and nylon-12
The use of vernolic acid would greatly reduce volatile organic compound (VOC) air pollution that is associated with its alternatives.
B Competing products
Vernolic acid is a replacement product for the above applications and therefore a relatively new product. Vernolic acid is a natural epoxy fatty acid that is present in new oil seed crops like Euphorbia lagascae and Vernonia spp. The seed of Euphorbia lagascae contains up to 50% oil of which up to 60% is vernolic acid. Production via processing of these seed crops could be considered more ‘natural’ than the SUPRABIO product.
79
http://marketpublishers.com/report/industry/chemicals_petrochemicals/12-hydroxystearic_acid_106-14-9_market_research_report.html 80
Sources of information: http://www.hort.purdue.edu/newcrop/proceedings1996/v3-354.html FP4 project: FAIR984460 Cahoon et al Plant Physiology (2002) 128 p615-624 http://www.plastice.org/fileadmin/files/PROBIP2009_Final_June_2009.pdf

Techno-economic assessment and market analysis
101
C Market and volume estimation
Exact figures for vernolic acid have been difficult to find. However, it is expected the market for vernolic acid will grow as petroleum-based products are replaced with bio-based alternatives. For example, the worldwide market for bio-based plastics will increase from 0.36 Mt in 2007 to 2.33 Mt in 2013 and to 3.45 Mt in 2020. This is equivalent to average annual growth rates of 37% between 2007 and 2013 and 6% between 2013 and 2020. The market of emerging bio-based plastics has been experiencing rapid growth. From 2003 to the end of 2007, the global average annual growth rate was 38%. In Europe, the annual growth rate was as high as 48% in the same period.
7.5.5 Omega-3 fatty acids
A Properties and applications
The omega-3 fatty acids EPA/DHA are considered as essential for humans since the consumption of EPA/DHA contributes to a positive cardiovascular health and DHA supports the normal development of the brain, eyes and nerves. Traditionally, fish oil has been the main source. However, the origin of EPA/DHA in aquatic ecosystems is microalgae and the marine fish and mammals accumulate high levels of EPA/DHA in their body. The disadvantage of exploiting fish positioned up in the food chain as a feedstock for marine oils, polluting elements from industry soluble in oil like heavy metals, polychlorinated hydrocarbons also get accumulated in the same feedstock. To produce an acceptable end-product out of that raw material, thorough and costly cleaning processes are necessary. Cultivated microalgae are pollution-free, there are also other benefits of using microalgae as a source of EPA/DHA. Vegetarians, would preferably substitute fish oil supplements with microalgae and the concern of reducing wild stock of fish populations will be alleviated by using microalgae as source. The microalgae rich of EPA/DHA may be produced phototrophic or heterotrophic. IGV GmbH are going to produce EPA/DHA from microalgae in a phototrophic process.
B Competing products and estimate on volume and price
Traditionally, omega-3 oils have been extracted from wild caught fish. The total costs of producing omega-3 fatty acids from microalgae are higher compared to fish, simply due to the cultivation costs and the harvest costs of the low density microalgae biomass from the cultivation medium. The availability of algal oil is still very limited and the retail market is more relevant than the bulk market. The retail market pays a higher price for algal omega-3 since it is a vegetable source and has not been in contact with industrial pollution. Actually, there is a lack of omega-3 products on the market. The increasing demand of omega-3 is leading to a depletion of fish stocks and cultivated microalgae biomass is expected to be one of the future sources of omega-3. Omega-3 ingredients have been growing at 10 to 18 % across different regions in the globe, and marine source omega-3
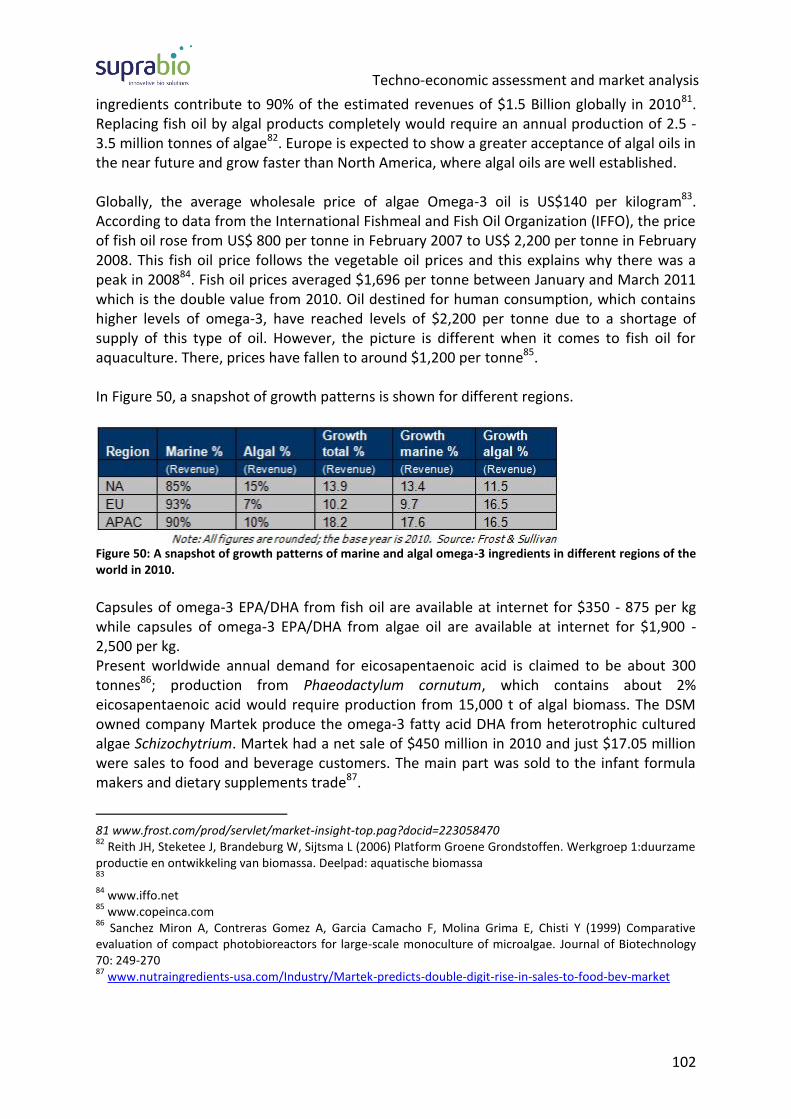
Techno-economic assessment and market analysis
102
ingredients contribute to 90% of the estimated revenues of $1.5 Billion globally in 201081. Replacing fish oil by algal products completely would require an annual production of 2.5 - 3.5 million tonnes of algae82. Europe is expected to show a greater acceptance of algal oils in the near future and grow faster than North America, where algal oils are well established. Globally, the average wholesale price of algae Omega-3 oil is US$140 per kilogram83. According to data from the International Fishmeal and Fish Oil Organization (IFFO), the price of fish oil rose from US$ 800 per tonne in February 2007 to US$ 2,200 per tonne in February 2008. This fish oil price follows the vegetable oil prices and this explains why there was a peak in 200884. Fish oil prices averaged $1,696 per tonne between January and March 2011 which is the double value from 2010. Oil destined for human consumption, which contains higher levels of omega-3, have reached levels of $2,200 per tonne due to a shortage of supply of this type of oil. However, the picture is different when it comes to fish oil for aquaculture. There, prices have fallen to around $1,200 per tonne85. In Figure 50, a snapshot of growth patterns is shown for different regions.
Figure 50: A snapshot of growth patterns of marine and algal omega-3 ingredients in different regions of the world in 2010.
Capsules of omega-3 EPA/DHA from fish oil are available at internet for $350 - 875 per kg while capsules of omega-3 EPA/DHA from algae oil are available at internet for $1,900 - 2,500 per kg. Present worldwide annual demand for eicosapentaenoic acid is claimed to be about 300 tonnes86; production from Phaeodactylum cornutum, which contains about 2% eicosapentaenoic acid would require production from 15,000 t of algal biomass. The DSM owned company Martek produce the omega-3 fatty acid DHA from heterotrophic cultured algae Schizochytrium. Martek had a net sale of $450 million in 2010 and just $17.05 million were sales to food and beverage customers. The main part was sold to the infant formula makers and dietary supplements trade87.
81 www.frost.com/prod/servlet/market-insight-top.pag?docid=223058470 82
Reith JH, Steketee J, Brandeburg W, Sijtsma L (2006) Platform Groene Grondstoffen. Werkgroep 1:duurzame productie en ontwikkeling van biomassa. Deelpad: aquatische biomassa 83
84
www.iffo.net 85
www.copeinca.com 86
Sanchez Miron A, Contreras Gomez A, Garcia Camacho F, Molina Grima E, Chisti Y (1999) Comparative evaluation of compact photobioreactors for large-scale monoculture of microalgae. Journal of Biotechnology 70: 249-270 87
www.nutraingredients-usa.com/Industry/Martek-predicts-double-digit-rise-in-sales-to-food-bev-market

Techno-economic assessment and market analysis
103
7.5.6 β-glucans from microalgae
A Properties and applications
β-glucans are fiber-type polysaccharides or sugar compounds and belong to a group of compounds possessing a range of different biological activities, and are thus called biological response modifiers (BRMs). Structural components of cell walls in fungi, yeast, grain and seaweed have the capability of stimulating the non-specific immune system of humans and animals, but still after many years of intensive research, the exact mechanism of their action remain unsolved. The activity of the β-glucans is dependent on molecular size and other structural traits such as branching characteristics and solution conformation. The significant role of glucans in cancer treatment, infection immunity, stress reduction and restoration of damaged bone marrow has already been established. β-glucans can activate macrophages, B lymphocytes, natural killer cells, and suppressor T cells. It is also thought to be an affective antioxidant and free radical scavenger. The β-(1,3)-D-glucans are abundant and widespread in marine diatoms which store β-(1,3)-glucans as an energy reserve. The β-(1,3)-glucans from diatoms have been under several structural studies and called chrysolaminarans due to their similarity with laminarans which are found in most brown algae. The main difference between chrysolaminarans and laminarans is that the former are devoid of guluronic and mannuronic acid terminal end groups. The chrysolaminaran from Chaetoceros mülleri has been characterized and found to be a β-(1,3)-glucan with a DP of 19-24 and a degree of β-(1,6)-branching (DB) of 0.005-0.009. The chrysolaminaran from Chaetoceros mülleri is shown to be a promising candidate for its effects on the immune system of fish in comparison to β-glucans from yeast Saccharomyces cerevisae and laminaran from the brown algae Durvillaea antarctica.
B Competing products and estimate on volume and price
The global β-glucan market is emerging and still limited today, as beta-glucans have only been marketed as specific ingredients for 10 or 15 years. However it has great potential, and is likely to grow in the future, especially as far as animal food industry is concerned88. Since β-glucan from marine diatoms is indicated to be a strong biological response modifier it will compete against β-glucan from baker yeast in the nutraceutical and pharmaceutical market. The US β-glucan market holds significant growth potential with expected annual growth rates of 10-15 % for the coming years. The market for β-glucan ingredients has an estimated value of US$ 80-100 M89. β-glucan extracted from the mushroom shiitake (Shanghai, China) is available at internet for $40 - 100 per kg while gelatine capsules with β-glucan from yeast are available at internet for $1,660 - 3,900 per kg.
88
www.ubic-consulting.com/template/fs/documents/Nutraceuticals/The-World-Beta-Glucan-Ingredient-Market.pdf 89
Steen Andersen, Fluxome CEO - personal communication

Techno-economic assessment and market analysis
104
7.5.7 Phycoerythrin and Sulphated exopolysaccharides
Phycoerythrin and sulphated exopolysaccharides are extremely high value products targeting the pharmaceutical market and industry. For example, Sigma Aldrich sells a B-Phycoerythrin for 470.5 $/mg90. Phycoerythrin can be extracted by an aqueous extraction via a phosphate buffer. The sulphated exopolysaccharides are used to target the cancer and HIV therapy91. Furthermore there is the possibility to use the intracellular polysaccharides for cosmetics and nutraceuticals.
7.6 Discussion and Conclusion
To find accurate and reliable data for comprehensive market analyses has been found to be very difficult. The available information is scarce and if something is available it comes at a high price (a market analysis generally costs from 2000 to 5000 €). The information presented herein is recovered from public sources, personal communication, or partner’s in-house knowledge and experience. An overview of the SUPRABIO products and markets is given in Table 30. Many of the products from crude oil are very difficult to produce from alternative feedstocks in a cost competitive manner and will be difficult to replace. However, for some of the bulk products from crude oil (e.g. gasoline and diesel) already today renewable alternatives exist. For these products the question is not if it can be done but if sufficient amounts can be produced in a sustainable and cost-competitive way. Biochemicals can potentially bring value to businesses in three ways:
Allow existing products to be produced at a lower cost
Allow companies to produce products with unique properties not achievable in any other way
Create opportunities for nature-based products, for example vanillin produced by Borregaard, squalene produced by Croda
90
http://www.sigmaaldrich.com 91
Sun, Liqin, et al. 2009. Preparation of different molecular weight polysaccharides from Porphyridium cruentum and their antioxidant activities. International Journal of Biological Macromolecules. 2009, 45, pp. 42-47

Techno-economic assessment and market analysis
105
Table 30: Overview of the SUPRABIO products and markets
a The prices were converted from US$ to €. Currency: 1 € = 1.3596 US$
b The reference price for the fuels is calculated based on the price of ethanol.
c Market size: S: Small, e.g. speciality chemicals; M: Medium, e.g. bulk chemicals; L: Large, i.e. fuels.
dN.A: Not available
In general the market for bio-based products is increasing in specific areas and the markets
for biobased chemicals and fuels will most likely grow in the future. In 2011 the bio-based
chemical market reached a value of 3.6 billion US$ (excluding biofuels) and is forecasted to
grow to 12.2 billion US$ by 202192. The interest for bio-based chemicals also increases but
the main hurdle for a large expansion is in general higher costs for bio-based products
compared to the competing fossil-based products. Also a premium price for most bio-based
products cannot be expected for the reason of just being “green”, they would also need to
show superior properties. For a large expansion of bio-based chemicals many of the
processes which today are in the development phase must have been commercialized. Also
large scale production of cheap biofuel is needed which would allow other companies to
valorize part of the fuel and wastes into chemicals. This could indeed happen but it is an
optimistic scenario and would most likely also require that the crude oil prices increases
92
http://www.businesswire.com/news/home/20120912005750/en/Global-Bio-Based-Chemicals-Market-Trends-Reviewed-SBI
Product Market priced Reference priceb
Market sizec
Ethanol 810 – 923 €/tonne L
Butanol N.A. 28-32 €/GJ L
FT-diesel N.A. 28-32 €/GJ L
Hydrogenated seed oil N.A. 28-32 €/GJ L
DME 650 €/ tonne 28-32 €/GJ L
Mixed alcohols 28-32 €/GJ L
2,3 butanediol 740-1,500 €/tonne a M
Methyl-ethyl ketone 1,850-2,100 €/tonne M
Propionic acid 660-1,100 €/tonne a M
Butyric acid 1,100-1,300 €/tonne a M
Four carbon 1,4-dicarboxylic acids 1,500-2,200 €/tonne a M
Lignin-based products N.A. S-L
Glucoseamine N.A. S-M
Sugar fatty acid ester surfactants 10,000-100,000 €/tonne S-M
Hydroxystearic acid N.A. S-M
Vernolic acid N.A. S-M
Omega 3 fatty acids 103 €/kg a S
β-glucan N.A. S
Phycoerythrin & sulphated exopolysaccharides
346 €/mg a S

Techno-economic assessment and market analysis
106
further. If nothing changes an increased crude oil price is likely but if, for example, electric
vehicles have a break though, this would reduce the demand for gasoline and diesel and in
turn reduce the price of crude oil. Therefore the future market for bio-based fuels and
chemicals is uncertain and to bloom on a larger scale several events need to take place. For
a more in-depth analysis see article by Peter Nieuwenhuizen93.
93
www.icis.com/resources/news/2010/06/21/9368973/biochemical-market-forecasts-suggest-strong-growth/

Techno-economic assessment and market analysis
107
Appendix A
Economic parameters
Table 31: Economic parameters
Parameter Proposed value
Cost comparison metric Metric for comparison
As proposed below under “Economic performance measures”
Functional unit for cost comparison
Feedstock: Cost per tonne dry biomass input Straw: 60 €/dry tonne Poplar: 60 €/dry tonne Forest residues: 60 €/dry tonne
Product: Value per tonne product (delivered from production plant) Ethanol: 824 €/tonne Acid mixture (20% water): 724 €/tonne FT-liquids: 750 €/tonne DME: 650 €/tonne
CAPEX related factors
Allowance: 25% Contingency: 25% Installation factor (bulk, construction, civil) and other indirect factors added depending on equipment type based on Statoil know how
Finance scenario
Discount rate: 5% Investment life: 15 years Salvage Value at end of project: Zero Investment grant: Zero Depreciation method: Straight line Taxes: Not included Insurance: 1% (% CAPEX) Maintenance: 2% (% CAPEX) Working capital: 4% (% CAPEX) Investment profile: assume plant built overnight at start of year 1
Currency conversion Currency Euro Currency reference year
2010
Exchange rate - data base
European Central Bank, Annual Euro Spot. Bilateral rate. Available from: http://sdw.ecb.europa.eu/browse.do?node=2018794
Producer price index - database
Industry producer prices index - annual data for EU27. Link.
(Used to inflate or deflate cost estimates to the reference year)
Default commodity prices and values Gas prices for industrial consumers: 7.802 €/GJ (2010, EU27, Link)
Electricity prices for industrial consumers: 0.0923 €/kwh (2010, EU27, Link)

Techno-economic assessment and market analysis
108
Economic performance measures
Net present value (NPV): An absolute measure and given by the sum of the discounted
cash flows for all operating years:
where Cn is the total cash flow in year n, and r is the required rate of return (discount rate)
set for the project. Thus, the project can be considered profitable if NPV > 0.
Internal rate of return (IRR): Is defined as the discount rate (r) giving NPV = 0. In contrast
to NPV, it is a relative measure and independent of the project size. The IRR indicate the
return on investment for the project, and the project can be considered profitable if IRR > r.
Profitability index (PI): Ratio between the NPV and the discounted value of all investments.
It is a measure of the amount of value created per unit of investment, and can be a useful
tool when comparing different potential project.
Break-even price of a product is the market price needed over the operating years to reach
NPV = 0. The lower the break-even price, the more robust the project can be considered.
All together, these measures will provide a comprehensive picture of the expected
profitability and economic robustness of the different biorefinery scenarios.
n
n
n
r
CNPV
1

Techno-economic assessment and market analysis
109
Appendix B
Table 32: CAPEX, OPEX, NPV, IRR, PI and minimum selling price for the thermochemical biorefinery scenarios calculated per biomass input
Scenario Total
CAPEX [M€]
CAPEX [€/tonne biomass]
OPEX [€/tonne biomass]
Production cost
[€/tonne biomass]
NPV [M€]
IRR PI Break-even price
1
[€/tonne biomass]
I 355 118 118 237 -502 - -136 % 296
II 561 94 109 203 -736 - -126 % 250
III 511 85 117 202 -515 - -97 % 245
IV 511 85 106 191 -738 - -139 % 227
V 528 88 107 195 -746 - -136 % 239
VI 687 114 111 225 -875 - -123 % 283
VII 605 101 112 213 -793 - -126 % 263
VIII 522 87 98 185 -616 - -114 % 225
IX 520 87 100 187 -609 - -113 % 226 1Break even product price scaled to dry biomass input