Embed Size (px)
Citation preview


FOREWORD
The assessment of environmentally sustainable carrying capacity for aquaculture in coastal areas poses a major challenge, given the range of issues that must be taken into account, the interactions between natural and social components, and the coupling between watershed and coastal zone.
In 2001, The Department of Agriculture and Rural Development published the Shellfi sh Aquaculture Man-agement Plan for Northern Ireland. The Minister for Agriculture and Rural Development stated at the pre-sentation: “There has been a signifi cant growth in shellfi sh aquaculture in Northern Ireland over the past few years. It is important that this growth is structured and that the shellfi sh aquaculture industry develops in a sustainable manner and with minimal environmental impact.” Following this publication, Queen’s University Belfast and the Department for Agriculture and Rural Development (DARD) produced a Phase I study of Carrying Capacity in 2003.
In 2004, a consortium made up of the Institute of Marine Research – IMAR (Portugal), Plymouth Marine Laboratory – PML (U.K.) and CSIR (South Africa) was awarded a two-year contract for the Sustainable Mariculture in northern Irish Lough Ecosystems (SMILE) project, with a duration of two years, with the aim of “developing dynamic ecosystem level carrying capacity models for the fi ve northern Irish sea loughs.
In order to provide medium-term guidelines, this work needed to be placed in the context of a set of Euro-pean legislative instruments in the area of water policy, which include older generation directives such as Habitats, and new and emerging ones such as the Water Framework Directive and the proposed Marine Strategy Directive.
The SMILE contract was conceived as an application of know-how collected in many R&D projects, but the excellent collaboration with the Agri-Food and Biosciences Institute (AFBI), Queen’s University of Belfast (QUB) and the Loughs Agency, together with the interest and feedback of the Environment and Heritage Service (EHS) and other agencies on the Oversight Committee, provided several avenues for research. In SMILE, carrying capacity assessment can be summed up as a clear practical application of integrated coastal zone management, using water quality criteria, cultivated shellfi sh production and sustainability of native wild species as environmental metrics.
This book provides an overview of the approach taken in SMILE, and presents the key results for the fi ve loughs. Data were drawn from many sources, and collected into databases that form the backbone of the modelling work. Our thanks go to all who provided data and information, and especially to the people on the ground, who watched this work develop and trusted us to get on with it. We are very grateful to Anne Dorbie for her support for this work, and her faith in the team, and to Jason Holt (POL) for Irish Sea boundary conditions. We additionally wish to thank all the producers and growers who helped with growth trials and provided the use of vessels, Tom Cowan, Greg Hood and Roy Griffi n from Fisheries Division, Annika Mitchell from QUB and Nuala McQuaid from CMAR. We hope managers and shellfi sh farmers alike in Northern Ireland will fi nd this and the other SMILE products both useful and profi table. Europe cannot hope to compete on quantity with the emerging shellfi sh export markets, the added value which is required to provide growth in jobs and profi ts at home must come from superior product quality, branding and environmental sustainability.

SMILE TEAM
J.G. Ferreira IMAR – Institute of Marine Research, Centre for Ecological Modelling, New University of Lisbon, PortugalA.J.S. Hawkins PML – Plymouth Marine Laboratory, United KingdomP. Monteiro CSIR – Council for Scientifi c and Industrial Research, South AfricaH. Moore QUB – Queen’s University of BelfastM. Service AFBI – Agri-Food and Biosciences InstituteA. Edwards SEPA – Scottish Environmental Protection Agency, ScotlandR. Gowen AFBI – Agri-Food and Biosciences InstituteP. Lourenco IMAR – Institute of Marine Research, Centre for Ecological Modelling, New University of Lisbon, PortugalA. Mellor QUB – Queen’s University of BelfastJ.P. Nunes IMAR – Institute of Marine Research, Centre for Ecological Modelling, New University of Lisbon, PortugalP.L. Pascoe PML – Plymouth Marine Laboratory, United KingdomL. Ramos Ministry of the Environment, PortugalA. Sequeira IMAR – Institute of Marine Research, Centre for Ecological Modelling, New University of Lisbon, PortugalM.T. Simas IMAR – Institute of Marine Research, Centre for Ecological Modelling, New University of Lisbon, PortugalJ. Strong QUB – Queen’s University of Belfast
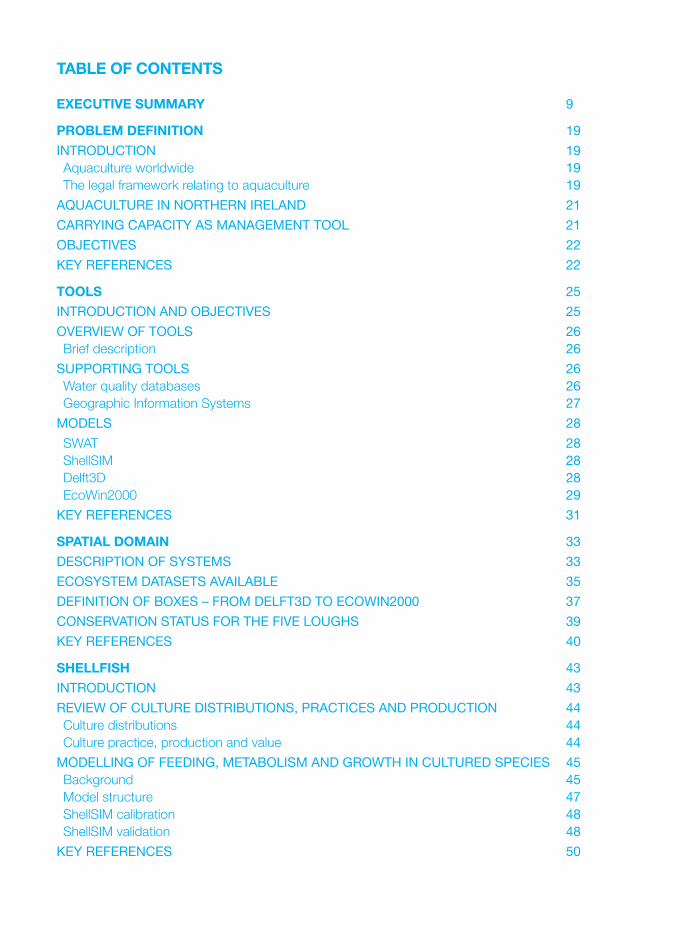
TABLE OF CONTENTS
EXECUTIVE SUMMARY 9
PROBLEM DEFINITION 19
INTRODUCTION 19 Aquaculture worldwide 19 The legal framework relating to aquaculture 19
AQUACULTURE IN NORTHERN IRELAND 21
CARRYING CAPACITY AS MANAGEMENT TOOL 21
OBJECTIVES 22
KEY REFERENCES 22
TOOLS 25
INTRODUCTION AND OBJECTIVES 25
OVERVIEW OF TOOLS 26 Brief description 26
SUPPORTING TOOLS 26 Water quality databases 26 Geographic Information Systems 27
MODELS 28
SWAT 28 ShellSIM 28 Delft3D 28 EcoWin2000 29
KEY REFERENCES 31
SPATIAL DOMAIN 33
DESCRIPTION OF SYSTEMS 33
ECOSYSTEM DATASETS AVAILABLE 35
DEFINITION OF BOXES – FROM DELFT3D TO ECOWIN2000 37
CONSERVATION STATUS FOR THE FIVE LOUGHS 39
KEY REFERENCES 40
SHELLFISH 43
INTRODUCTION 43
REVIEW OF CULTURE DISTRIBUTIONS, PRACTICES AND PRODUCTION 44 Culture distributions 44 Culture practice, production and value 44
MODELLING OF FEEDING, METABOLISM AND GROWTH IN CULTURED SPECIES 45 Background 45 Model structure 47 ShellSIM calibration 48 ShellSIM validation 48
KEY REFERENCES 50
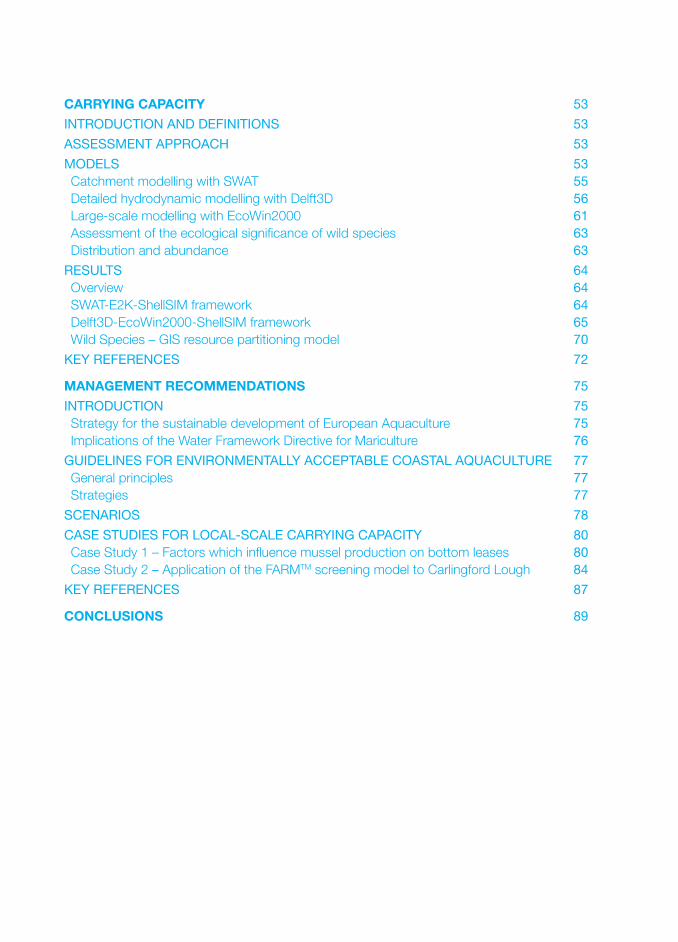
CARRYING CAPACITY 53
INTRODUCTION AND DEFINITIONS 53
ASSESSMENT APPROACH 53
MODELS 53 Catchment modelling with SWAT 55 Detailed hydrodynamic modelling with Delft3D 56 Large-scale modelling with EcoWin2000 61 Assessment of the ecological signifi cance of wild species 63 Distribution and abundance 63
RESULTS 64 Overview 64 SWAT-E2K-ShellSIM framework 64 Delft3D-EcoWin2000-ShellSIM framework 65 Wild Species – GIS resource partitioning model 70
KEY REFERENCES 72
MANAGEMENT RECOMMENDATIONS 75
INTRODUCTION 75 Strategy for the sustainable development of European Aquaculture 75 Implications of the Water Framework Directive for Mariculture 76
GUIDELINES FOR ENVIRONMENTALLY ACCEPTABLE COASTAL AQUACULTURE 77 General principles 77 Strategies 77
SCENARIOS 78
CASE STUDIES FOR LOCAL-SCALE CARRYING CAPACITY 80 Case Study 1 – Factors which infl uence mussel production on bottom leases 80 Case Study 2 – Application of the FARMTM screening model to Carlingford Lough 84
KEY REFERENCES 87
CONCLUSIONS 89

EXECUTIVESUMMARY
EXECUTIVE SUMMARY 11
The fi ve sea lough systems addressed by the Sustainable Mariculture in northern Irish sea Lough Ecosys-tems (SMILE) project are Carlingford Lough, Strangford Lough, Belfast Lough, Larne Lough and Lough Foyle. The project began in September 2004, had a duration of two years, and addressed four key ob-jectives.
SMILE OBJECTIVES
• To establish functional models at the lough scale, describing key environmental
variables and processes, aquaculture activities and their interactions
• To evaluate the sustainable carrying capacity for aquaculture in the different
loughs, considering interactions between cultivated species, targeting marketable
cohorts, and fully integrating cultivation practices
• To examine the effects of overexploitation on key ecological variables
• To examine bay-scale environmental effects of different culture strategies
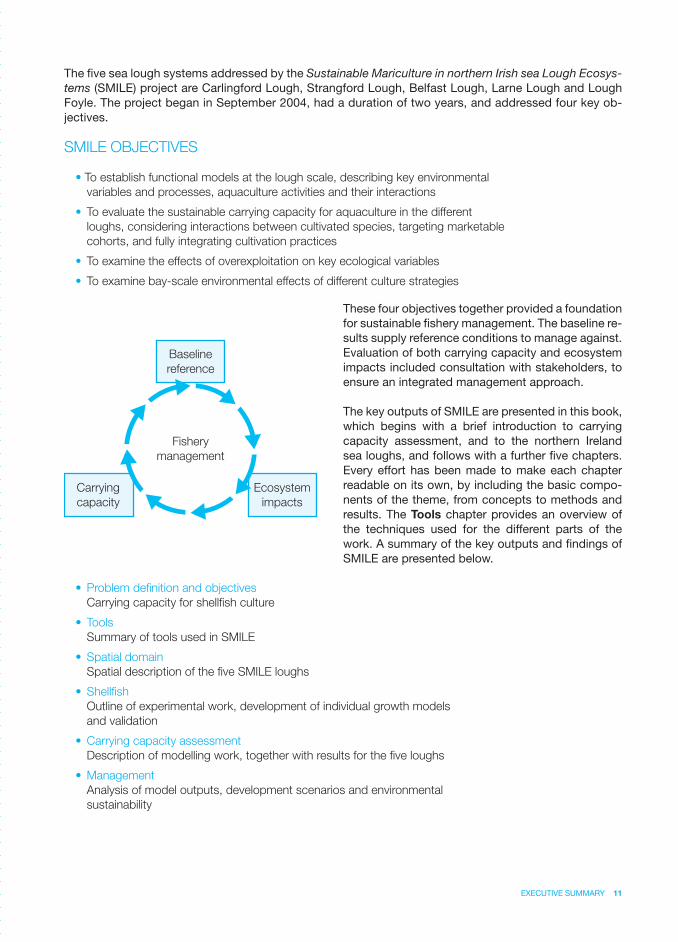
These four objectives together provided a foundation for sustainable fi shery management. The baseline re-sults supply reference conditions to manage against. Evaluation of both carrying capacity and ecosystem impacts included consultation with stakeholders, to ensure an integrated management approach.
The key outputs of SMILE are presented in this book, which begins with a brief introduction to carrying capacity assessment, and to the northern Ireland sea loughs, and follows with a further fi ve chapters. Every effort has been made to make each chapter readable on its own, by including the basic compo-nents of the theme, from concepts to methods and results. The Tools chapter provides an overview of the techniques used for the different parts of the work. A summary of the key outputs and fi ndings of SMILE are presented below.
• Problem defi nition and objectives
Carrying capacity for shellfi sh culture
• Tools
Summary of tools used in SMILE
• Spatial domain
Spatial description of the fi ve SMILE loughs
• Shellfi sh
Outline of experimental work, development of individual growth models
and validation
• Carrying capacity assessment
Description of modelling work, together with results for the fi ve loughs
• Management
Analysis of model outputs, development scenarios and environmental
sustainability
Fishery
management
Baseline
reference
Ecosystem
impacts
Carrying
capacity
12 EXECUTIVE SUMMARY
DATA
Over 185,000 records of data for the fi ve loughs were archived in relational databases during the project. These are available online, and contain variables ranging from water and sediment quality to biological species lists, collected over the past 22 years. These data were the foundation for the work that has been developed, and are an important reference collection of historical information on which future monitoring and research activities may build.
SPATIAL DOMAIN
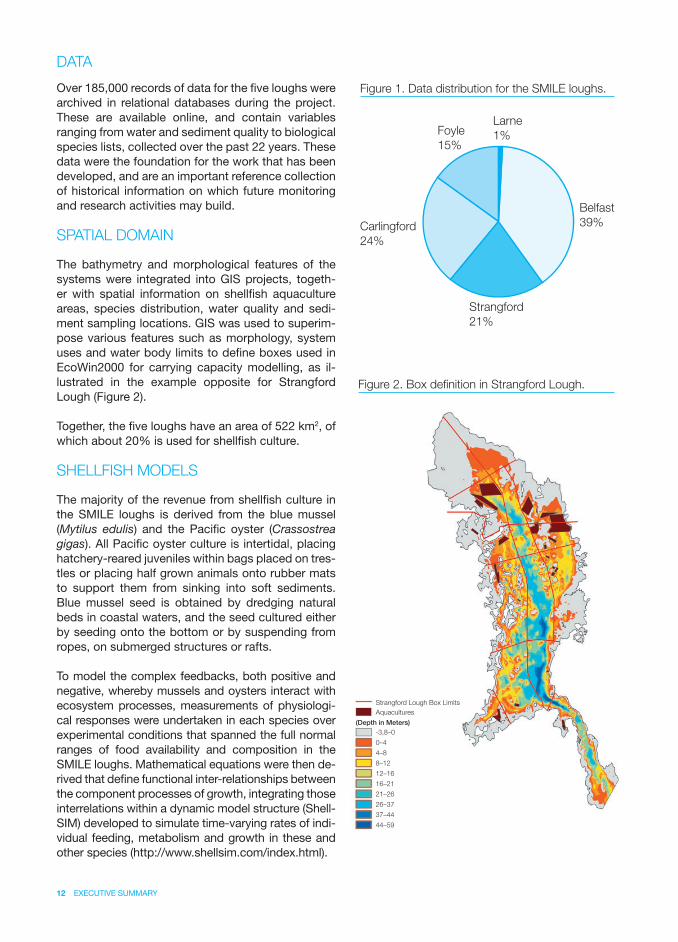
The bathymetry and morphological features of the systems were integrated into GIS projects, togeth-er with spatial information on shellfi sh aquaculture areas, species distribution, water quality and sedi-ment sampling locations. GIS was used to superim-pose various features such as morphology, system uses and water body limits to defi ne boxes used in EcoWin2000 for carrying capacity modelling, as il-lustrated in the example opposite for Strangford Lough (Figure 2).
Together, the fi ve loughs have an area of 522 km2, of which about 20% is used for shellfi sh culture.
SHELLFISH MODELS
The majority of the revenue from shellfi sh culture in the SMILE loughs is derived from the blue mussel (Mytilus edulis) and the Pacifi c oyster (Crassostrea gigas). All Pacifi c oyster culture is intertidal, placing hatchery-reared juveniles within bags placed on tres-tles or placing half grown animals onto rubber mats to support them from sinking into soft sediments. Blue mussel seed is obtained by dredging natural beds in coastal waters, and the seed cultured either by seeding onto the bottom or by suspending from ropes, on submerged structures or rafts.
To model the complex feedbacks, both positive and negative, whereby mussels and oysters interact with ecosystem processes, measurements of physiologi-cal responses were undertaken in each species over experimental conditions that spanned the full normal ranges of food availability and composition in the SMILE loughs. Mathematical equations were then de-rived that defi ne functional inter-relationships between the component processes of growth, integrating those interrelations within a dynamic model structure (Shell-SIM) developed to simulate time-varying rates of indi-vidual feeding, metabolism and growth in these and other species (http://www.shellsim.com/index.html).
Figure 2. Box defi nition in Strangford Lough.
Larne
1%Foyle
15%
Belfast
39%
Strangford
21%
Carlingford
24%
Figure 1. Data distribution for the SMILE loughs.
Aquacultures
-3,8–0
0–4
4–8
8–12
12–16
16–21
21–26
26–37
37–44
44–59
Strangford Lough Box Limits
(Depth in Meters)
EXECUTIVE SUMMARY 13
Simulations have been validated successfully using monthly fi eld measures of environmental drivers and shellfi sh growth for both the blue mussel and Pacifi c oyster from the SMILE loughs. Model outputs confi rm that ShellSIM, when run with a separate single standard set of parameters for each species, optimized upon the basis of calibrations at different sites, can effectively (± 20%) simulate dynamic responses in physiology and growth across the full range of natural environmental changes experienced within northern Irish sea loughs and elsewhere.
CARRYING CAPACITY
A short summary is given below of some of the key fi ndings resulting from simulations carried out using the standard models developed in EcoWin2000.
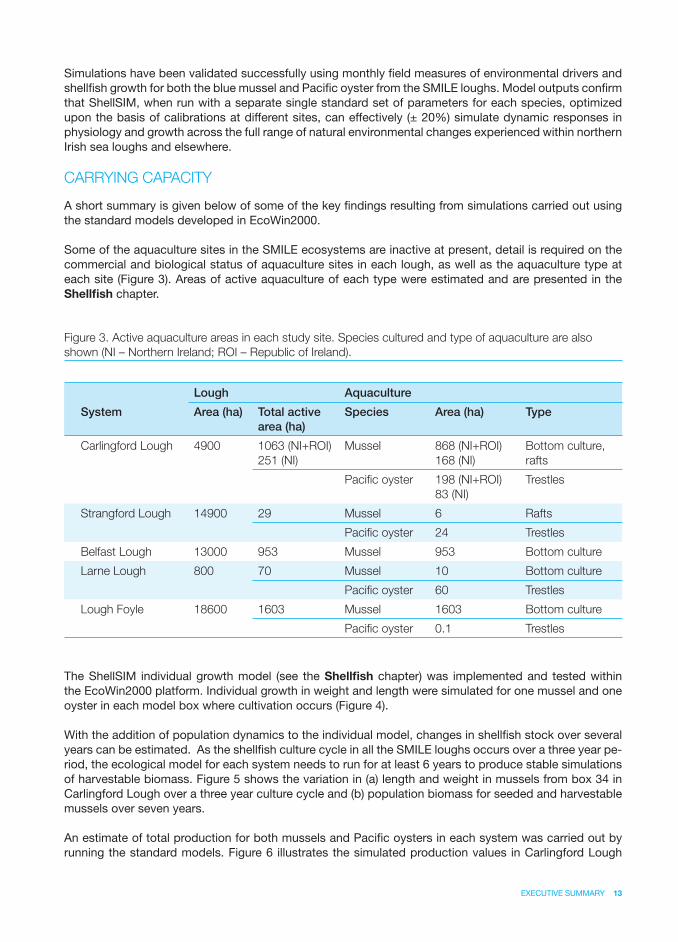
Some of the aquaculture sites in the SMILE ecosystems are inactive at present, detail is required on the commercial and biological status of aquaculture sites in each lough, as well as the aquaculture type at each site (Figure 3). Areas of active aquaculture of each type were estimated and are presented in the Shellfi sh chapter.
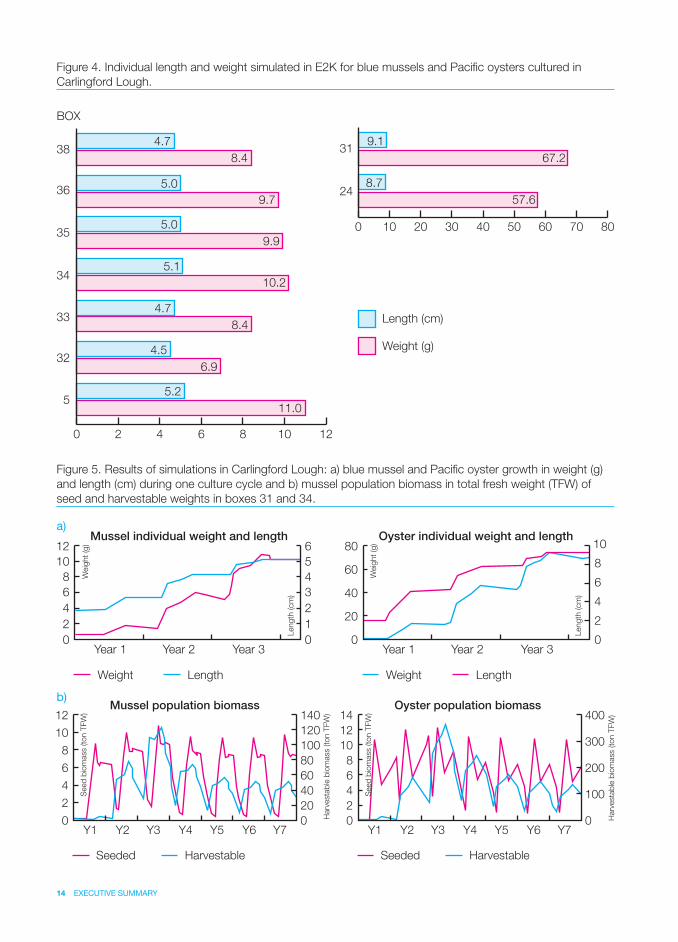
The ShellSIM individual growth model (see the Shellfi sh chapter) was implemented and tested within the EcoWin2000 platform. Individual growth in weight and length were simulated for one mussel and one oyster in each model box where cultivation occurs (Figure 4).
With the addition of population dynamics to the individual model, changes in shellfi sh stock over several years can be estimated. As the shellfi sh culture cycle in all the SMILE loughs occurs over a three year pe-riod, the ecological model for each system needs to run for at least 6 years to produce stable simulations of harvestable biomass. Figure 5 shows the variation in (a) length and weight in mussels from box 34 in Carlingford Lough over a three year culture cycle and (b) population biomass for seeded and harvestable mussels over seven years.
An estimate of total production for both mussels and Pacifi c oysters in each system was carried out by running the standard models. Figure 6 illustrates the simulated production values in Carlingford Lough
Lough Aquaculture
System Area (ha) Total active
area (ha)
Species Area (ha) Type
Carlingford Lough 4900 1063 (NI+ROI)
251 (NI)
Mussel 868 (NI+ROI)
168 (NI)
Bottom culture,
rafts
Pacifi c oyster 198 (NI+ROI)
83 (NI)
Trestles
Strangford Lough 14900 29 Mussel 6 Rafts
Pacifi c oyster 24 Trestles
Belfast Lough 13000 953 Mussel 953 Bottom culture
Larne Lough 800 70 Mussel 10 Bottom culture
Pacifi c oyster 60 Trestles
Lough Foyle 18600 1603 Mussel 1603 Bottom culture
Pacifi c oyster 0.1 Trestles
Figure 3. Active aquaculture areas in each study site. Species cultured and type of aquaculture are also
shown (NI – Northern Ireland; ROI – Republic of Ireland).
14 EXECUTIVE SUMMARY
Figure 4. Individual length and weight simulated in E2K for blue mussels and Pacifi c oysters cultured in
Carlingford Lough.
Figure 5. Results of simulations in Carlingford Lough: a) blue mussel and Pacifi c oyster growth in weight (g)
and length (cm) during one culture cycle and b) mussel population biomass in total fresh weight (TFW) of
seed and harvestable weights in boxes 31 and 34.
Weight
Weig
ht
(g)
Harv
esta
ble
bio
mass (to
n T
FW
)
Harv
esta
ble
bio
mass (to
n T
FW
)
Length
(cm
)
Length
(cm
)
Weig
ht
(g)
Length
Mussel individual weight and length
0
2
4
6
8
10
12
0
1
2
3
4
5
6
Year 1 Year 2 Year 3
Seeded Harvestable
Mussel population biomass
0
2
4
6
8
10
12
0
20
40
60
80
100
140
120
Y1 Y2 Y3 Y4 Y5 Y6 Y7
Seeded Harvestable
Oyster population biomass
0
2
4
6
8
10
12
14
0
100
200
300
400
Y1 Y2 Y3 Y4 Y5 Y6 Y7
Weight Length
Oyster individual weight and length
0
20
40
60
80
0
2
4
6
8
10
Year 1 Year 2 Year 3
Seed
bio
mass (to
n T
FW
)
Seed
bio
mass (to
n T
FW
)
a)
b)
0 2 4 6 8 10 12
0 10 20 30 40 50 60 70 80
BOX
384.7 9.1
67.2
8.7
57.6
8.4
5.0
9.7
5.0
9.9
5.1
10.2
4.7
8.4
4.5
6.9
5.2
11.0
31
2436
35
34
33
32
5
Length (cm)
Weight (g)
EXECUTIVE SUMMARY 15
Aquacultures
Active
Inactive
E2K Box division
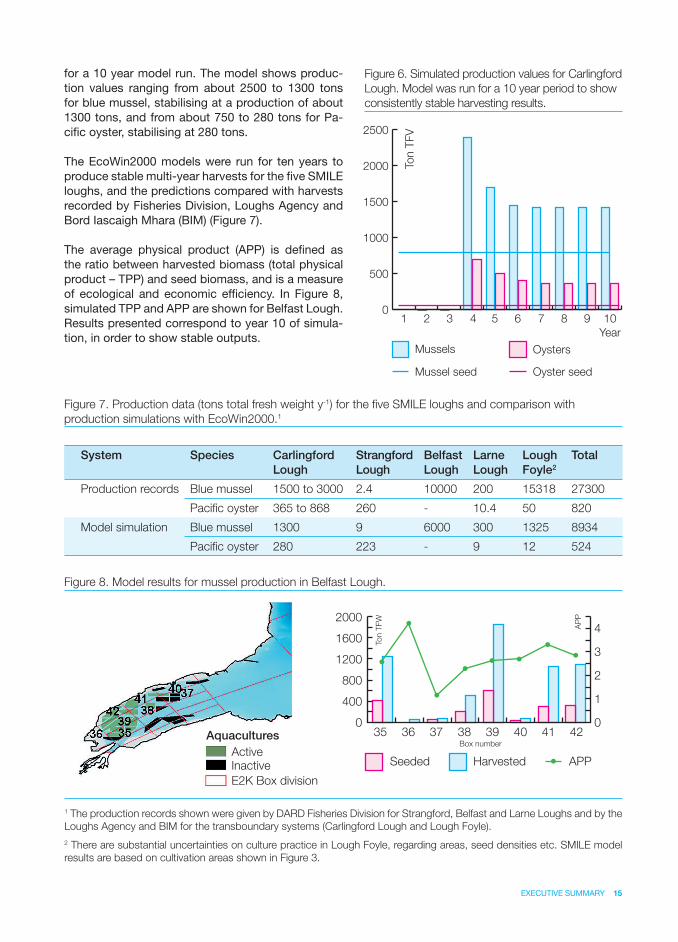
for a 10 year model run. The model shows produc-tion values ranging from about 2500 to 1300 tons for blue mussel, stabilising at a production of about 1300 tons, and from about 750 to 280 tons for Pa-cifi c oyster, stabilising at 280 tons.
The EcoWin2000 models were run for ten years to produce stable multi-year harvests for the fi ve SMILE loughs, and the predictions compared with harvests recorded by Fisheries Division, Loughs Agency and Bord Iascaigh Mhara (BIM) (Figure 7).
The average physical product (APP) is defi ned as the ratio between harvested biomass (total physical product – TPP) and seed biomass, and is a measure of ecological and economic effi ciency. In Figure 8, simulated TPP and APP are shown for Belfast Lough. Results presented correspond to year 10 of simula-tion, in order to show stable outputs.
Figure 6. Simulated production values for Carlingford
Lough. Model was run for a 10 year period to show
consistently stable harvesting results.
Figure 7. Production data (tons total fresh weight y-1) for the fi ve SMILE loughs and comparison with
production simulations with EcoWin2000.1
System Species Carlingford
Lough
Strangford
Lough
Belfast
Lough
Larne
Lough
Lough
Foyle2
Total
Production records Blue mussel 1500 to 3000 2.4 10000 200 15318 27300
Pacifi c oyster 365 to 868 260 - 10.4 50 820
Model simulation Blue mussel 1300 9 6000 300 1325 8934
Pacifi c oyster 280 223 - 9 12 524
Figure 8. Model results for mussel production in Belfast Lough.
0
500
1000
1500
2000
2500
1 2 3 4 5 6 7 8 9 10
Year
Mussels
Mussel seed
Oysters
Oyster seed
Ton T
FV
1 The production records shown were given by DARD Fisheries Division for Strangford, Belfast and Larne Loughs and by the
Loughs Agency and BIM for the transboundary systems (Carlingford Lough and Lough Foyle).
2 There are substantial uncertainties on culture practice in Lough Foyle, regarding areas, seed densities etc. SMILE model
results are based on cultivation areas shown in Figure 3.
AP
P
Seeded Harvested APP
0
400
800
1200
1600
2000
0
1
2
3
4
35 36 37 38 39 40 41 42
Ton T
FW
Box number
16 EXECUTIVE SUMMARY
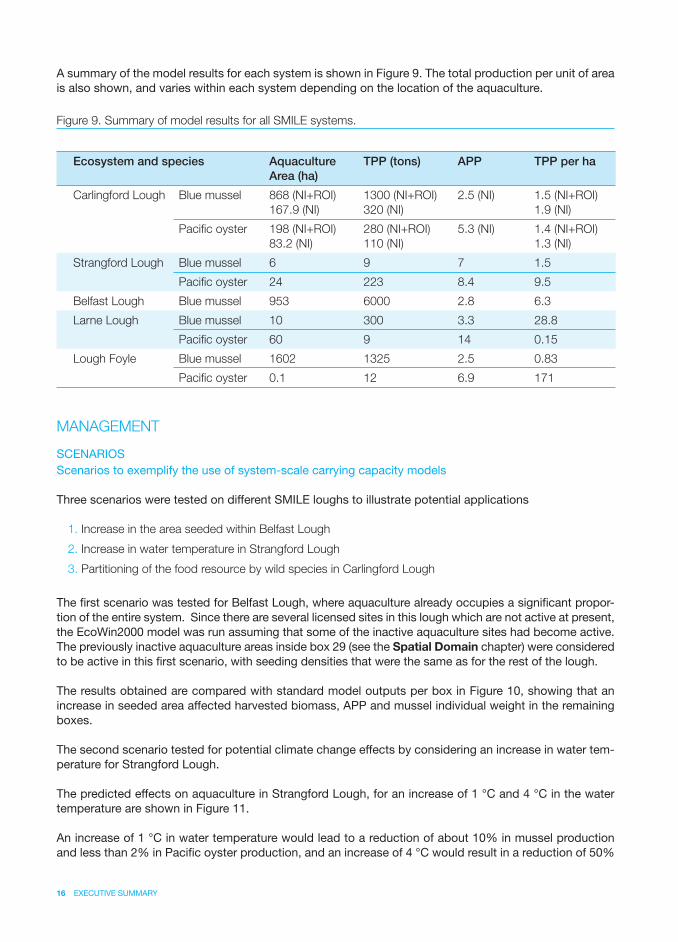
A summary of the model results for each system is shown in Figure 9. The total production per unit of area is also shown, and varies within each system depending on the location of the aquaculture.
MANAGEMENT
SCENARIOSScenarios to exemplify the use of system-scale carrying capacity models
Three scenarios were tested on different SMILE loughs to illustrate potential applications
1. Increase in the area seeded within Belfast Lough
2. Increase in water temperature in Strangford Lough
3. Partitioning of the food resource by wild species in Carlingford Lough
The fi rst scenario was tested for Belfast Lough, where aquaculture already occupies a signifi cant propor-tion of the entire system. Since there are several licensed sites in this lough which are not active at present, the EcoWin2000 model was run assuming that some of the inactive aquaculture sites had become active. The previously inactive aquaculture areas inside box 29 (see the Spatial Domain chapter) were considered to be active in this fi rst scenario, with seeding densities that were the same as for the rest of the lough.
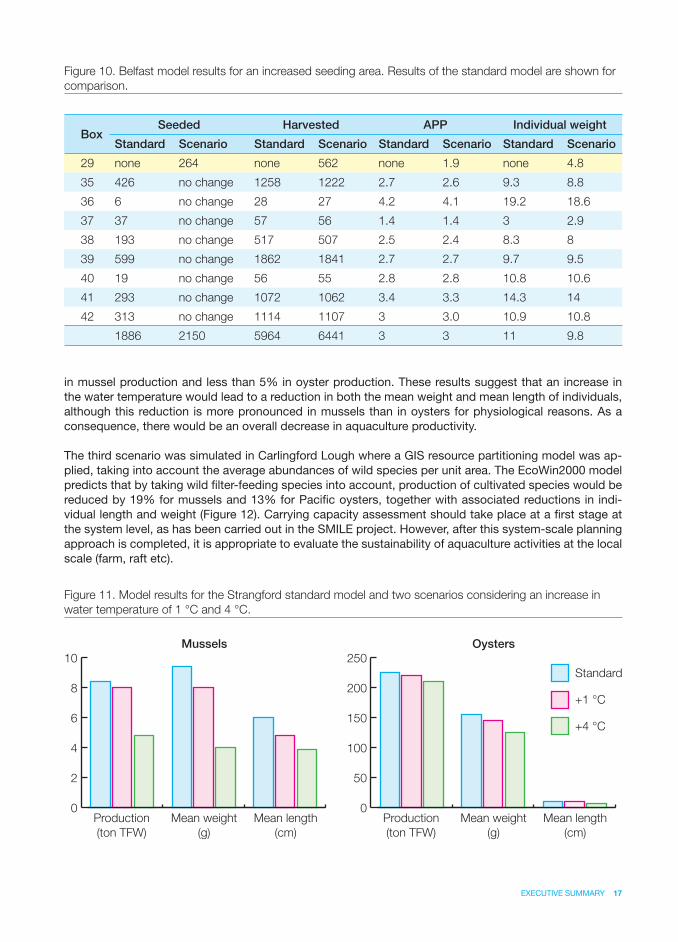
The results obtained are compared with standard model outputs per box in Figure 10, showing that an increase in seeded area affected harvested biomass, APP and mussel individual weight in the remaining boxes.
The second scenario tested for potential climate change effects by considering an increase in water tem-perature for Strangford Lough.
The predicted effects on aquaculture in Strangford Lough, for an increase of 1 °C and 4 °C in the water temperature are shown in Figure 11.
An increase of 1 °C in water temperature would lead to a reduction of about 10% in mussel production and less than 2% in Pacifi c oyster production, and an increase of 4 °C would result in a reduction of 50%
Figure 9. Summary of model results for all SMILE systems.
Ecosystem and species Aquaculture
Area (ha)
TPP (tons) APP TPP per ha
Carlingford Lough Blue mussel 868 (NI+ROI)
167.9 (NI)
1300 (NI+ROI)
320 (NI)
2.5 (NI) 1.5 (NI+ROI)
1.9 (NI)
Pacifi c oyster 198 (NI+ROI)
83.2 (NI)
280 (NI+ROI)
110 (NI)
5.3 (NI) 1.4 (NI+ROI)
1.3 (NI)
Strangford Lough Blue mussel 6 9 7 1.5
Pacifi c oyster 24 223 8.4 9.5
Belfast Lough Blue mussel 953 6000 2.8 6.3
Larne Lough Blue mussel 10 300 3.3 28.8
Pacifi c oyster 60 9 14 0.15
Lough Foyle Blue mussel 1602 1325 2.5 0.83
Pacifi c oyster 0.1 12 6.9 171
EXECUTIVE SUMMARY 17
in mussel production and less than 5% in oyster production. These results suggest that an increase in the water temperature would lead to a reduction in both the mean weight and mean length of individuals, although this reduction is more pronounced in mussels than in oysters for physiological reasons. As a consequence, there would be an overall decrease in aquaculture productivity.
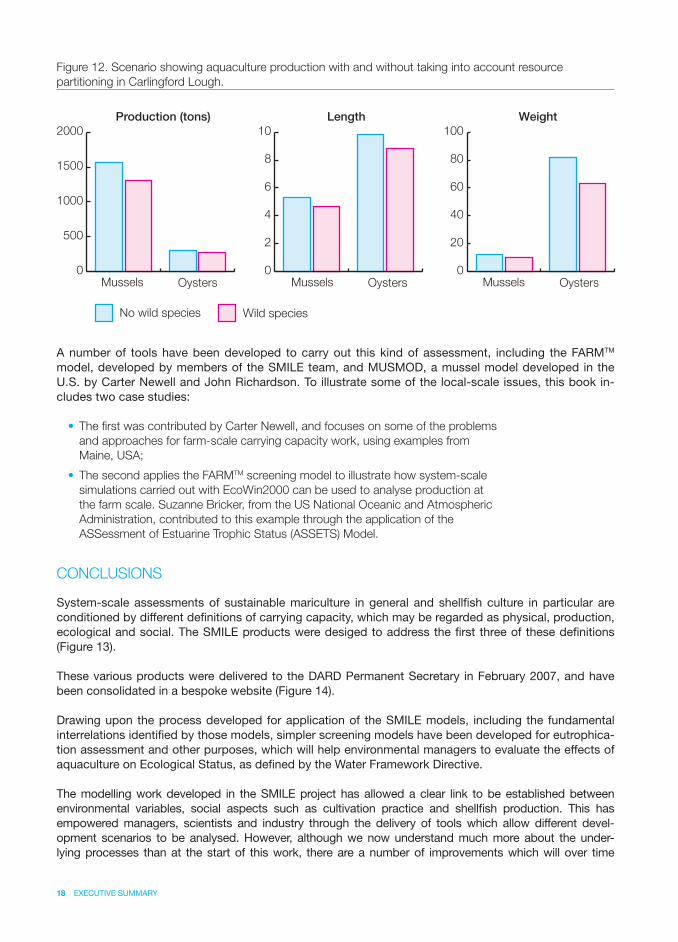
The third scenario was simulated in Carlingford Lough where a GIS resource partitioning model was ap-plied, taking into account the average abundances of wild species per unit area. The EcoWin2000 model predicts that by taking wild fi lter-feeding species into account, production of cultivated species would be reduced by 19% for mussels and 13% for Pacifi c oysters, together with associated reductions in indi-vidual length and weight (Figure 12). Carrying capacity assessment should take place at a fi rst stage at the system level, as has been carried out in the SMILE project. However, after this system-scale planning approach is completed, it is appropriate to evaluate the sustainability of aquaculture activities at the local scale (farm, raft etc).
Figure 11. Model results for the Strangford standard model and two scenarios considering an increase in
water temperature of 1 °C and 4 °C.
0
2
4
6
8
10
0
50
100
150
200
250
Production
(ton TFW)
Mean weight
(g)
Mean length
(cm)
Production
(ton TFW)
Mean weight
(g)
Mean length
(cm)
Mussels Oysters
Standard
+1 °C
+4 °C
Figure 10. Belfast model results for an increased seeding area. Results of the standard model are shown for
comparison.
BoxSeeded Harvested APP Individual weight
Standard Scenario Standard Scenario Standard Scenario Standard Scenario
29 none 264 none 562 none 1.9 none 4.8
35 426 no change 1258 1222 2.7 2.6 9.3 8.8
36 6 no change 28 27 4.2 4.1 19.2 18.6
37 37 no change 57 56 1.4 1.4 3 2.9
38 193 no change 517 507 2.5 2.4 8.3 8
39 599 no change 1862 1841 2.7 2.7 9.7 9.5
40 19 no change 56 55 2.8 2.8 10.8 10.6
41 293 no change 1072 1062 3.4 3.3 14.3 14
42 313 no change 1114 1107 3 3.0 10.9 10.8
1886 2150 5964 6441 3 3 11 9.8
18 EXECUTIVE SUMMARY
A number of tools have been developed to carry out this kind of assessment, including the FARMTM model, developed by members of the SMILE team, and MUSMOD, a mussel model developed in the U.S. by Carter Newell and John Richardson. To illustrate some of the local-scale issues, this book in-cludes two case studies:
• The fi rst was contributed by Carter Newell, and focuses on some of the problems
and approaches for farm-scale carrying capacity work, using examples from
Maine, USA;
• The second applies the FARMTM screening model to illustrate how system-scale
simulations carried out with EcoWin2000 can be used to analyse production at
the farm scale. Suzanne Bricker, from the US National Oceanic and Atmospheric
Administration, contributed to this example through the application of the
ASSessment of Estuarine Trophic Status (ASSETS) Model.
CONCLUSIONS
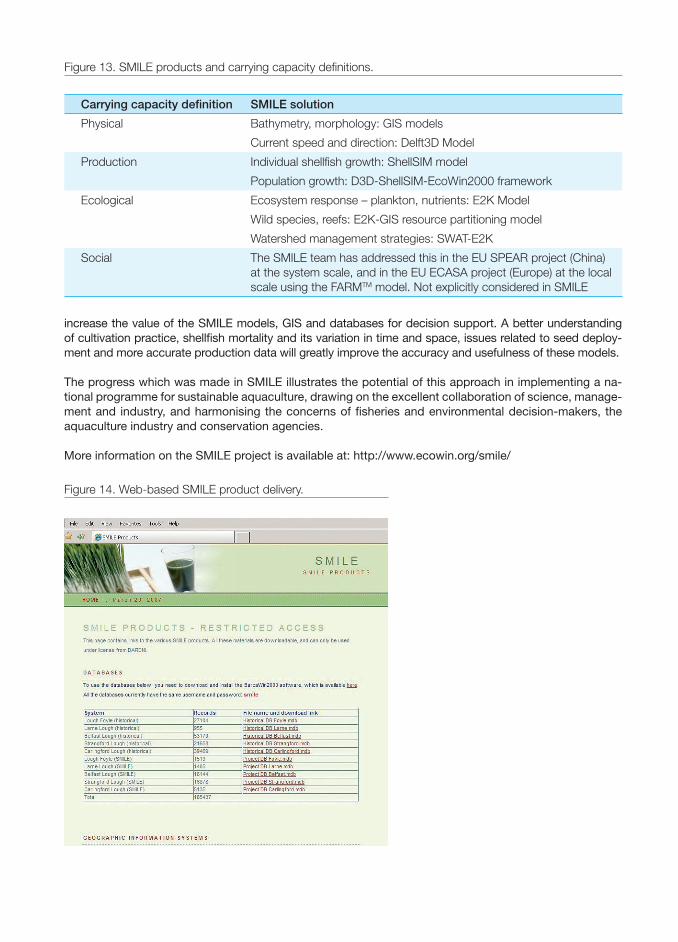
System-scale assessments of sustainable mariculture in general and shellfi sh culture in particular are conditioned by different defi nitions of carrying capacity, which may be regarded as physical, production, ecological and social. The SMILE products were desiged to address the fi rst three of these defi nitions (Figure 13).
These various products were delivered to the DARD Permanent Secretary in February 2007, and have been consolidated in a bespoke website (Figure 14).
Drawing upon the process developed for application of the SMILE models, including the fundamental interrelations identifi ed by those models, simpler screening models have been developed for eutrophica-tion assessment and other purposes, which will help environmental managers to evaluate the effects of aquaculture on Ecological Status, as defi ned by the Water Framework Directive.
The modelling work developed in the SMILE project has allowed a clear link to be established between environmental variables, social aspects such as cultivation practice and shellfi sh production. This has empowered managers, scientists and industry through the delivery of tools which allow different devel-opment scenarios to be analysed. However, although we now understand much more about the under-lying processes than at the start of this work, there are a number of improvements which will over time
Figure 12. Scenario showing aquaculture production with and without taking into account resource
partitioning in Carlingford Lough.
0
500
1000
1500
2000
0
2
4
6
8
10
0
20
40
60
80
100
Production (tons) Length Weight
Mussels Oysters Mussels Oysters Mussels Oysters
No wild species Wild species
EXECUTIVE SUMMARY 19
increase the value of the SMILE models, GIS and databases for decision support. A better understanding of cultivation practice, shellfi sh mortality and its variation in time and space, issues related to seed deploy-ment and more accurate production data will greatly improve the accuracy and usefulness of these models.
The progress which was made in SMILE illustrates the potential of this approach in implementing a na-tional programme for sustainable aquaculture, drawing on the excellent collaboration of science, manage-ment and industry, and harmonising the concerns of fi sheries and environmental decision-makers, the aquaculture industry and conservation agencies.
More information on the SMILE project is available at: http://www.ecowin.org/smile/
Figure 14. Web-based SMILE product delivery.
Carrying capacity defi nition SMILE solution
Physical Bathymetry, morphology: GIS models
Current speed and direction: Delft3D Model
Production Individual shellfi sh growth: ShellSIM model
Population growth: D3D-ShellSIM-EcoWin2000 framework
Ecological Ecosystem response – plankton, nutrients: E2K Model
Wild species, reefs: E2K-GIS resource partitioning model
Watershed management strategies: SWAT-E2K
Social The SMILE team has addressed this in the EU SPEAR project (China)
at the system scale, and in the EU ECASA project (Europe) at the local
scale using the FARMTM model. Not explicitly considered in SMILE
Figure 13. SMILE products and carrying capacity defi nitions.
PROBLEM DEFINITION
PROBLEM DEFINITION 21
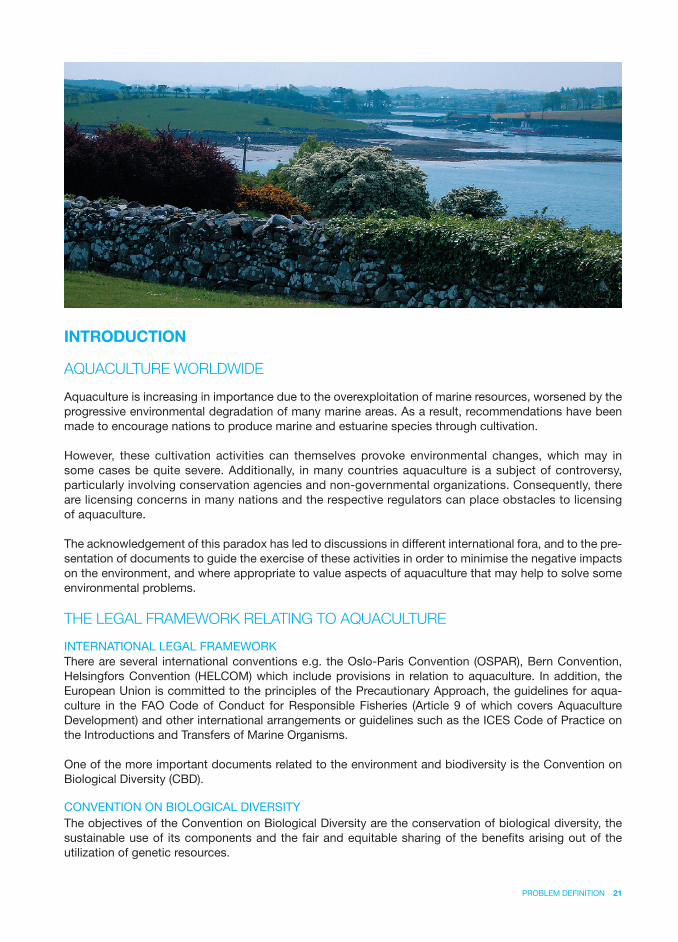
INTRODUCTION
AQUACULTURE WORLDWIDE
Aquaculture is increasing in importance due to the overexploitation of marine resources, worsened by the progressive environmental degradation of many marine areas. As a result, recommendations have been made to encourage nations to produce marine and estuarine species through cultivation.
However, these cultivation activities can themselves provoke environmental changes, which may in some cases be quite severe. Additionally, in many countries aquaculture is a subject of controversy, particularly involving conservation agencies and non-governmental organizations. Consequently, there are licensing concerns in many nations and the respective regulators can place obstacles to licensing of aquaculture.
The acknowledgement of this paradox has led to discussions in different international fora, and to the pre-sentation of documents to guide the exercise of these activities in order to minimise the negative impacts on the environment, and where appropriate to value aspects of aquaculture that may help to solve some environmental problems.
THE LEGAL FRAMEWORK RELATING TO AQUACULTURE
INTERNATIONAL LEGAL FRAMEWORKThere are several international conventions e.g. the Oslo-Paris Convention (OSPAR), Bern Convention, Helsingfors Convention (HELCOM) which include provisions in relation to aquaculture. In addition, the European Union is committed to the principles of the Precautionary Approach, the guidelines for aqua-culture in the FAO Code of Conduct for Responsible Fisheries (Article 9 of which covers Aquaculture Development) and other international arrangements or guidelines such as the ICES Code of Practice on the Introductions and Transfers of Marine Organisms. One of the more important documents related to the environment and biodiversity is the Convention on Biological Diversity (CBD).
CONVENTION ON BIOLOGICAL DIVERSITYThe objectives of the Convention on Biological Diversity are the conservation of biological diversity, the sustainable use of its components and the fair and equitable sharing of the benefi ts arising out of the utilization of genetic resources.
22 PROBLEM DEFINITION
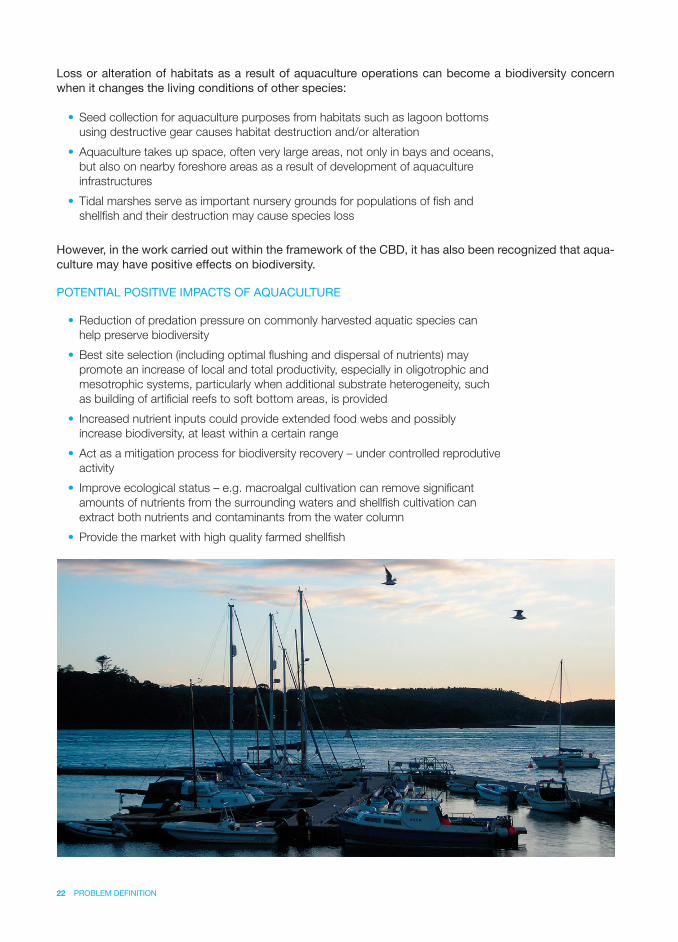
Loss or alteration of habitats as a result of aquaculture operations can become a biodiversity concern when it changes the living conditions of other species:
• Seed collection for aquaculture purposes from habitats such as lagoon bottoms
using destructive gear causes habitat destruction and/or alteration
• Aquaculture takes up space, often very large areas, not only in bays and oceans,
but also on nearby foreshore areas as a result of development of aquaculture
infrastructures
• Tidal marshes serve as important nursery grounds for populations of fi sh and
shellfi sh and their destruction may cause species loss
However, in the work carried out within the framework of the CBD, it has also been recognized that aqua-culture may have positive effects on biodiversity.
POTENTIAL POSITIVE IMPACTS OF AQUACULTURE
• Reduction of predation pressure on commonly harvested aquatic species can
help preserve biodiversity
• Best site selection (including optimal fl ushing and dispersal of nutrients) may
promote an increase of local and total productivity, especially in oligotrophic and
mesotrophic systems, particularly when additional substrate heterogeneity, such
as building of artifi cial reefs to soft bottom areas, is provided
• Increased nutrient inputs could provide extended food webs and possibly
increase biodiversity, at least within a certain range
• Act as a mitigation process for biodiversity recovery – under controlled reprodutive
activity
• Improve ecological status – e.g. macroalgal cultivation can remove signifi cant
amounts of nutrients from the surrounding waters and shellfi sh cultivation can
extract both nutrients and contaminants from the water column
• Provide the market with high quality farmed shellfi sh
PROBLEM DEFINITION 23
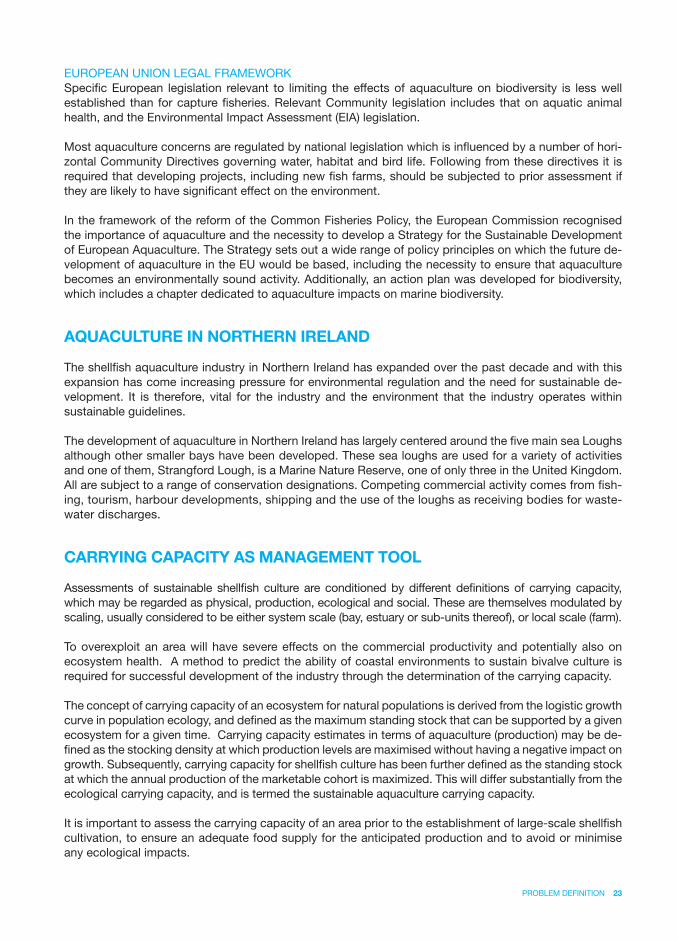
EUROPEAN UNION LEGAL FRAMEWORKSpecifi c European legislation relevant to limiting the effects of aquaculture on biodiversity is less well established than for capture fi sheries. Relevant Community legislation includes that on aquatic animal health, and the Environmental Impact Assessment (EIA) legislation.
Most aquaculture concerns are regulated by national legislation which is infl uenced by a number of hori-zontal Community Directives governing water, habitat and bird life. Following from these directives it is required that developing projects, including new fi sh farms, should be subjected to prior assessment if they are likely to have signifi cant effect on the environment.
In the framework of the reform of the Common Fisheries Policy, the European Commission recognised the importance of aquaculture and the necessity to develop a Strategy for the Sustainable Development of European Aquaculture. The Strategy sets out a wide range of policy principles on which the future de-velopment of aquaculture in the EU would be based, including the necessity to ensure that aquaculture becomes an environmentally sound activity. Additionally, an action plan was developed for biodiversity, which includes a chapter dedicated to aquaculture impacts on marine biodiversity.
AQUACULTURE IN NORTHERN IRELAND
The shellfi sh aquaculture industry in Northern Ireland has expanded over the past decade and with this expansion has come increasing pressure for environmental regulation and the need for sustainable de-velopment. It is therefore, vital for the industry and the environment that the industry operates within sustainable guidelines.
The development of aquaculture in Northern Ireland has largely centered around the fi ve main sea Loughs although other smaller bays have been developed. These sea loughs are used for a variety of activities and one of them, Strangford Lough, is a Marine Nature Reserve, one of only three in the United Kingdom. All are subject to a range of conservation designations. Competing commercial activity comes from fi sh-ing, tourism, harbour developments, shipping and the use of the loughs as receiving bodies for waste-water discharges.
CARRYING CAPACITY AS MANAGEMENT TOOL
Assessments of sustainable shellfi sh culture are conditioned by different defi nitions of carrying capacity, which may be regarded as physical, production, ecological and social. These are themselves modulated by scaling, usually considered to be either system scale (bay, estuary or sub-units thereof), or local scale (farm).
To overexploit an area will have severe effects on the commercial productivity and potentially also on ecosystem health. A method to predict the ability of coastal environments to sustain bivalve culture is required for successful development of the industry through the determination of the carrying capacity.
The concept of carrying capacity of an ecosystem for natural populations is derived from the logistic growth curve in population ecology, and defi ned as the maximum standing stock that can be supported by a given ecosystem for a given time. Carrying capacity estimates in terms of aquaculture (production) may be de-fi ned as the stocking density at which production levels are maximised without having a negative impact on growth. Subsequently, carrying capacity for shellfi sh culture has been further defi ned as the standing stock at which the annual production of the marketable cohort is maximized. This will differ substantially from the ecological carrying capacity, and is termed the sustainable aquaculture carrying capacity.
It is important to assess the carrying capacity of an area prior to the establishment of large-scale shellfi sh cultivation, to ensure an adequate food supply for the anticipated production and to avoid or minimise any ecological impacts.
For bivalve suspension feeders, the dominant factors determining the sustainable carrying capacity at the ecosystem scale are primary production, detrital inputs and exchange with adjacent ecosystems. At the local scale, carrying capacity depends on physical constraints such as substrate, shelter and food trans-ported by tidal currents, and density-dependent food depletion. Mortality is a critical factor, and high seed mortality due to sub-optimal seed deployment, particularly in bottom culture, is a key factor in reducing production yield and economic competitiveness.
Generic carrying capacity modelling should include both ecosystem-scale and local-scale approaches. Estimation of the carrying capacity should take into account the functional role of shellfi sh beds as com-ponents of an ecosystem. This may be achieved if carrying capacity modelling is applied within the broader framework of decision support systems, where exploitation and conservation are evaluated.
OBJECTIVES
Four key objectives were established for the Sustainable Mariculture in northern Irish Sea Lough Ecosys-tems (SMILE) project.
SMILE OBJECTIVES
• To establish functional models at the lough scale, describing key environmental
variables and processes, aquaculture activities and their interactions
• To evaluate the sustainable carrying capacity for aquaculture in the different
loughs, considering interactions between cultivated species, targeting marketable
cohorts, and fully integrating cultivation practices
• To examine the effects of overexploitation on key ecological variables
• To examine bay-scale environmental effects of different culture strategies
KEY REFERENCES
Convention on Biological Diversity – http://www.biodiv.org
European Union Legal Framework – “Report of the Working Group on Environmental Interaction of Mari-culture, 11–15 April, Ottawa, Canada. ICES WGEIM Report 2005”.
Inglis, G.J., Hayden, B.J., Ross, A.H., 2000. An overview of factors affecting the carrying capacity of coastal embayments for mussel culture. NIWA Client Report CHC00/69, Christchurch, New Zealand.
McKindsey, C.W., Thetmeyer, H., Landry, T., Silvert, W., 2006. Review of recent carrying capacity models for bivalve culture and recommendations for research and management. Aquaculture, 261, 451–462.

TOOLS
TOOLS 27
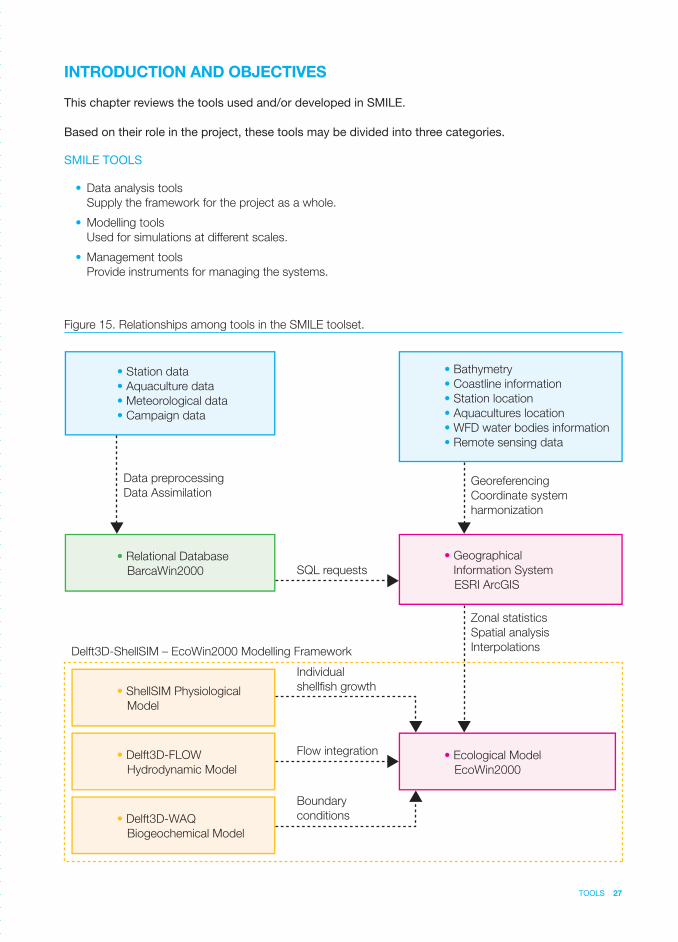
INTRODUCTION AND OBJECTIVES
This chapter reviews the tools used and/or developed in SMILE.
Based on their role in the project, these tools may be divided into three categories.
SMILE TOOLS
• Data analysis tools
Supply the framework for the project as a whole.
• Modelling tools
Used for simulations at different scales.
• Management tools
Provide instruments for managing the systems.
• Station data
• Aquaculture data
• Meteorological data
• Campaign data
• Bathymetry
• Coastline information
• Station location
• Aquacultures location
• WFD water bodies information
• Remote sensing data
Georeferencing
Coordinate system
harmonization
• Geographical
Information System
ESRI ArcGIS
Zonal statistics
Spatial analysis
Interpolations
• Ecological Model
EcoWin2000
• Relational Database
BarcaWin2000
• ShellSIM Physiological
Model
• Delft3D-FLOW
Hydrodynamic Model
• Delft3D-WAQ
Biogeochemical Model
Data preprocessing
Data Assimilation
Delft3D-ShellSIM – EcoWin2000 Modelling Framework
SQL requests
Individual
shellfish growth
Boundary
conditions
Flow integration
Figure 15. Relationships among tools in the SMILE toolset.
28 TOOLS
OVERVIEW OF TOOLS
BRIEF DESCRIPTION
Relational database
Relational databases were built for the fi ve SMILE systems using the
Barcawin2000TM software, for water quality data assimilation and management.
Geographic Information System (GIS)
A geographical information system (GIS) was implemented for each system, for the
analysis and management of spatially distributed data.
Modelling tools
Bespoke tools were developed and implemented to simulate catchment discharge,
fi ne-scale circulation in the loughs, individual shellfi sh growth and system-scale
multi-year aquaculture activity.
Management tools
The aim of this toolset is to provide a user-friendly approach for testing management
options using the integrated EcoWin2000 (E2K) model.
Figure 15 illustrates the relationships among the various tools applied in SMILE.
SUPPORTING TOOLS
WATER QUALITY DATABASES
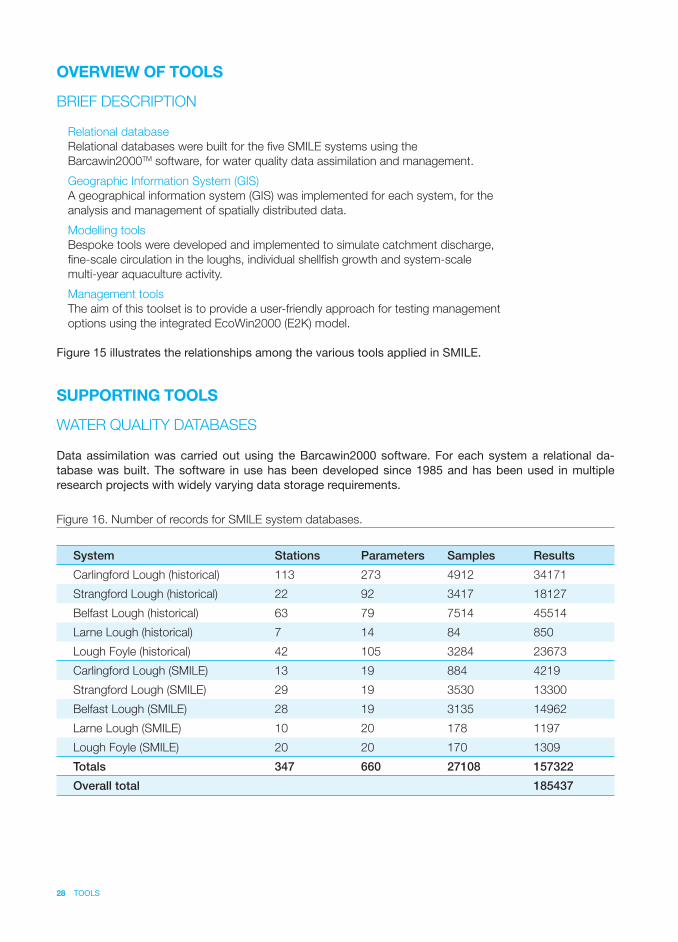
Data assimilation was carried out using the Barcawin2000 software. For each system a relational da-tabase was built. The software in use has been developed since 1985 and has been used in multiple research projects with widely varying data storage requirements.
System Stations Parameters Samples Results
Carlingford Lough (historical) 113 273 4912 34171
Strangford Lough (historical) 22 92 3417 18127
Belfast Lough (historical) 63 79 7514 45514
Larne Lough (historical) 7 14 84 850
Lough Foyle (historical) 42 105 3284 23673
Carlingford Lough (SMILE) 13 19 884 4219
Strangford Lough (SMILE) 29 19 3530 13300
Belfast Lough (SMILE) 28 19 3135 14962
Larne Lough (SMILE) 10 20 178 1197
Lough Foyle (SMILE) 20 20 170 1309
Totals 347 660 27108 157322
Overall total 185437
Figure 16. Number of records for SMILE system databases.
TOOLS 29
The main advantages of this database can be summed up as follows:
• Organization of information in a state-of-the-art relational model
• Security for fi ve levels of user access
• Easy input of data, by mapping MS-Excel spreadsheets to database fi elds,
followed by automatic import and validation
• Robust data entry validation
• Numeric listings and search results are output to an Excel compatible spread
sheet, or to graphs created directly in Excel
• Open architecture and easy export to Oracle, SQL server, etc
GEOGRAPHIC INFORMATION SYSTEMS
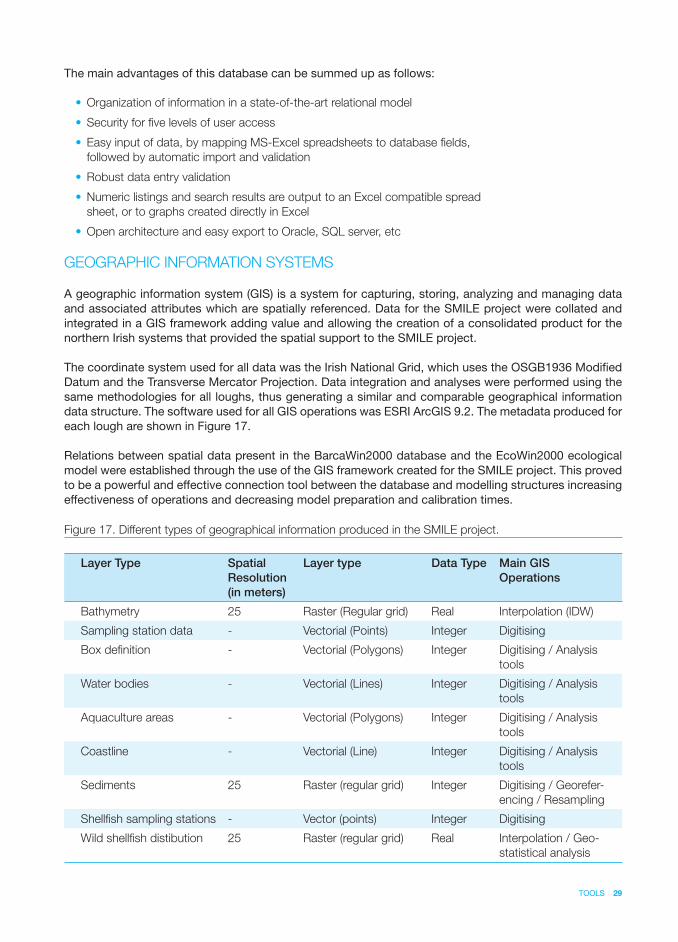
A geographic information system (GIS) is a system for capturing, storing, analyzing and managing data and associated attributes which are spatially referenced. Data for the SMILE project were collated and integrated in a GIS framework adding value and allowing the creation of a consolidated product for the northern Irish systems that provided the spatial support to the SMILE project.
The coordinate system used for all data was the Irish National Grid, which uses the OSGB1936 Modifi ed Datum and the Transverse Mercator Projection. Data integration and analyses were performed using the same methodologies for all loughs, thus generating a similar and comparable geographical information data structure. The software used for all GIS operations was ESRI ArcGIS 9.2. The metadata produced for each lough are shown in Figure 17.
Relations between spatial data present in the BarcaWin2000 database and the EcoWin2000 ecological model were established through the use of the GIS framework created for the SMILE project. This proved to be a powerful and effective connection tool between the database and modelling structures increasing effectiveness of operations and decreasing model preparation and calibration times.
Layer Type Spatial
Resolution
(in meters)
Layer type Data Type Main GIS
Operations
Bathymetry 25 Raster (Regular grid) Real Interpolation (IDW)
Sampling station data - Vectorial (Points) Integer Digitising
Box defi nition - Vectorial (Polygons) Integer Digitising / Analysis
tools
Water bodies - Vectorial (Lines) Integer Digitising / Analysis
tools
Aquaculture areas - Vectorial (Polygons) Integer Digitising / Analysis
tools
Coastline - Vectorial (Line) Integer Digitising / Analysis
tools
Sediments 25 Raster (regular grid) Integer Digitising / Georefer-
encing / Resampling
Shellfi sh sampling stations - Vector (points) Integer Digitising
Wild shellfi sh distibution 25 Raster (regular grid) Real Interpolation / Geo-
statistical analysis
Figure 17. Different types of geographical information produced in the SMILE project.
30 TOOLS
MODELS
SWAT
The Soil and Water Assessment Tool (SWAT) catchment model was used to simulate nutrient inputs from agricultural and urban sources. The model simulates processes such as vegetation growth (tak-ing into account agricultural and grazing activities), river fl ow, soil erosion and nutrient transport from fi elds and wastewater discharge points into the lough. The physical equations which form the backbone of SWAT allow its application to investigate scenarios of climate, land use and agricultural manage-ment changes in order to predict consequences for water discharge, nutrient and sediment loadings to aquatic systems.
SHELLSIM
To model the complex feedbacks, whereby mussels and oysters interact with ecosystem processes, ex-perimental measurements of physiological responses were undertaken in each species over conditions that spanned full normal ranges of food availability and composition in each SMILE lough.
Mathematical equations were then derived that defi ne functional inter-relationships between the component processes of growth, integrating those interrelations within a dynamic model structure (ShellSIM) developed to simulate time-varying rates of individual feeding, metabolism and growth in these and other species.
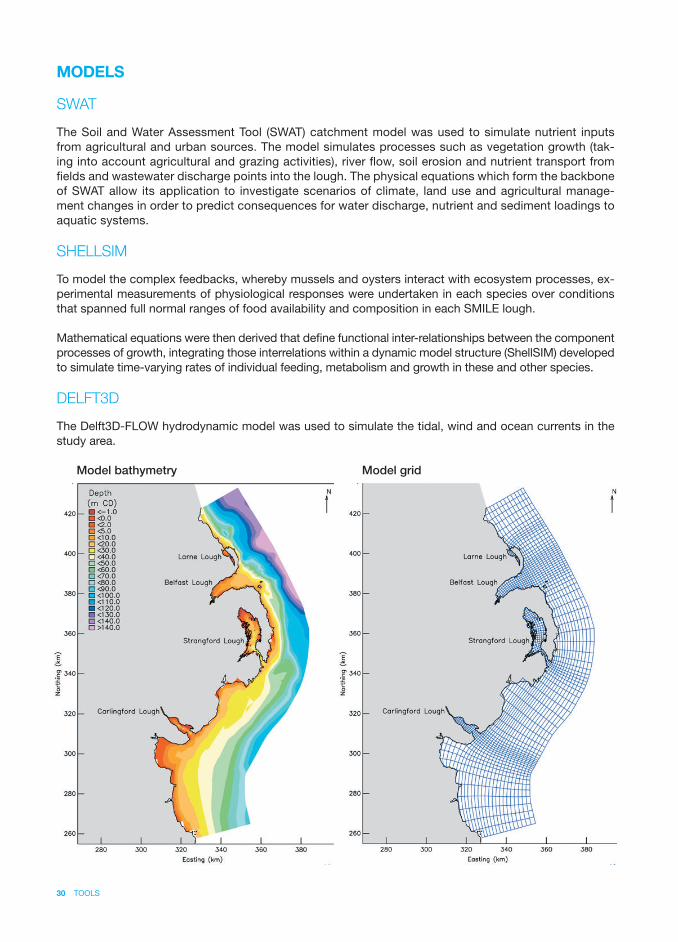
DELFT3D
The Delft3D-FLOW hydrodynamic model was used to simulate the tidal, wind and ocean currents in the study area.
Model bathymetry Model grid
TOOLS 31
This fi ne-grid model provides a detailed description of the circulation, and is coupled with other models to provide an appropriate description of hydrodynamics for broader-scale models such as EcoWin2000.
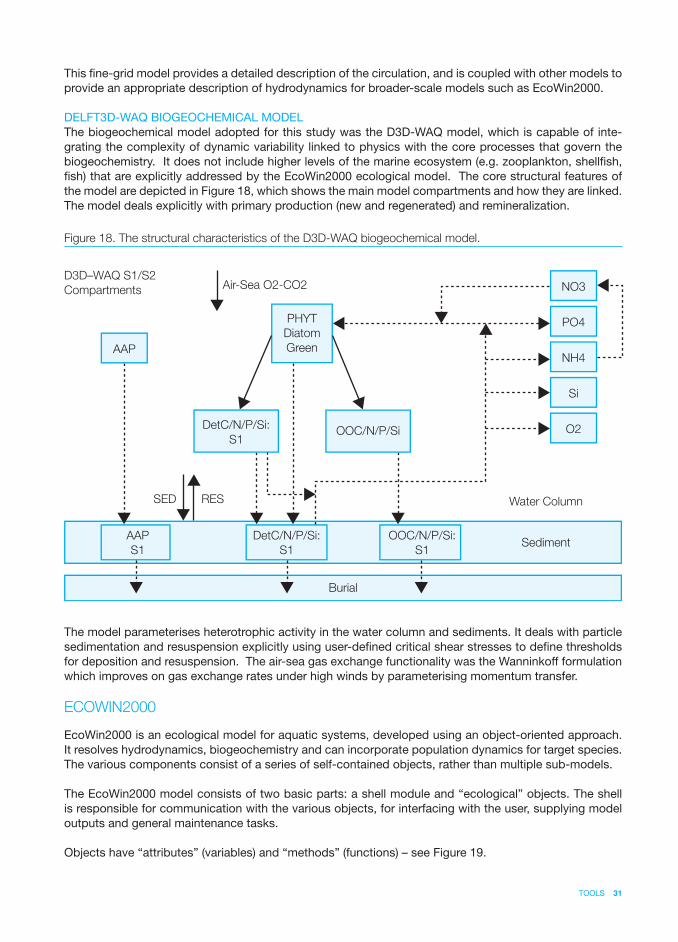
DELFT3D-WAQ BIOGEOCHEMICAL MODELThe biogeochemical model adopted for this study was the D3D-WAQ model, which is capable of inte-grating the complexity of dynamic variability linked to physics with the core processes that govern the biogeochemistry. It does not include higher levels of the marine ecosystem (e.g. zooplankton, shellfi sh, fi sh) that are explicitly addressed by the EcoWin2000 ecological model. The core structural features of the model are depicted in Figure 18, which shows the main model compartments and how they are linked. The model deals explicitly with primary production (new and regenerated) and remineralization.
The model parameterises heterotrophic activity in the water column and sediments. It deals with particle sedimentation and resuspension explicitly using user-defi ned critical shear stresses to defi ne thresholds for deposition and resuspension. The air-sea gas exchange functionality was the Wanninkoff formulation which improves on gas exchange rates under high winds by parameterising momentum transfer.
ECOWIN2000
EcoWin2000 is an ecological model for aquatic systems, developed using an object-oriented approach. It resolves hydrodynamics, biogeochemistry and can incorporate population dynamics for target species. The various components consist of a series of self-contained objects, rather than multiple sub-models.
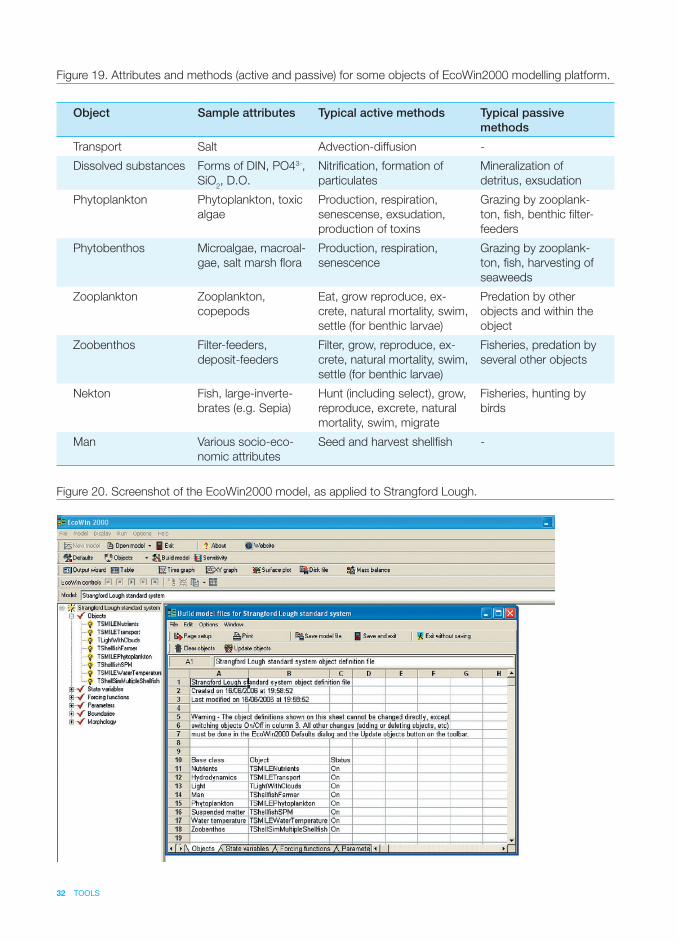
The EcoWin2000 model consists of two basic parts: a shell module and “ecological” objects. The shell is responsible for communication with the various objects, for interfacing with the user, supplying model outputs and general maintenance tasks.
Objects have “attributes” (variables) and “methods” (functions) – see Figure 19.
Figure 18. The structural characteristics of the D3D-WAQ biogeochemical model.
NO3
PO4
NH4
Si
O2
AAP
S1
DetC/N/P/Si:
S1
AAP
Burial
SED RES
D3D–WAQ S1/S2
Compartments Air-Sea O2-CO2
PHYT
Diatom
Green
DetC/N/P/Si:
S1OOC/N/P/Si
OOC/N/P/Si:
S1
Water Column
Sediment
32 TOOLS
Figure 19. Attributes and methods (active and passive) for some objects of EcoWin2000 modelling platform.
Object Sample attributes Typical active methods Typical passive
methods
Transport Salt Advection-diffusion -
Dissolved substances Forms of DIN, PO43-,
SiO2, D.O.
Nitrifi cation, formation of
particulates
Mineralization of
detritus, exsudation
Phytoplankton Phytoplankton, toxic
algae
Production, respiration,
senescense, exsudation,
production of toxins
Grazing by zooplank-
ton, fi sh, benthic fi lter-
feeders
Phytobenthos Microalgae, macroal-
gae, salt marsh fl ora
Production, respiration,
senescence
Grazing by zooplank-
ton, fi sh, harvesting of
seaweeds
Zooplankton Zooplankton,
copepods
Eat, grow reproduce, ex-
crete, natural mortality, swim,
settle (for benthic larvae)
Predation by other
objects and within the
object
Zoobenthos Filter-feeders,
deposit-feeders
Filter, grow, reproduce, ex-
crete, natural mortality, swim,
settle (for benthic larvae)
Fisheries, predation by
several other objects
Nekton Fish, large-inverte-
brates (e.g. Sepia)
Hunt (including select), grow,
reproduce, excrete, natural
mortality, swim, migrate
Fisheries, hunting by
birds
Man Various socio-eco-
nomic attributes
Seed and harvest shellfi sh -
Figure 20. Screenshot of the EcoWin2000 model, as applied to Strangford Lough.
Each object groups together related state variables, and may at any time be extended to contain a new state variable without affecting the code of any other part of EcoWin2000. Similarly, the methods which control interactions among state variables within objects may be easily changed, due to inheritance (which is a property of object-oriented programming languages).
EcoWin2000 uses a range of equations depending on the application requirements, and may be used as a research model to examine nutrient loading and aquaculture development scenarios. It has been extensively tested, and is a potentially useful tool for supporting an ecosystem approach to sustainable aquaculture development.
In the SMILE project, the EcoWin2000 modelling platform was used to implement an ecological model for each northern Irish lough to estimate carrying capacity using appropriate biogeochemistry and population dynamics. The main features modelled for these systems were the hydrodynamics, suspended matter transport, nitrogen cycle, phytoplankton and detrital dynamics, shellfi sh growth and human interaction.
KEY REFERENCES
Ferreira, J.G., 1995. EcoWin – An object-oriented ecological model for aquatic ecosystems. Ecol. Model-ling, 79, 21–34.
Srinivasan, R., Arnold, J.G., 1994. Integration of a basin-scale water-quality model with GIS. Water Re-sources Bulletin, 30 (3), 453–462.

SPATIALDOMAIN
SPATIAL DOMAIN 35
DESCRIPTION OF SYSTEMS
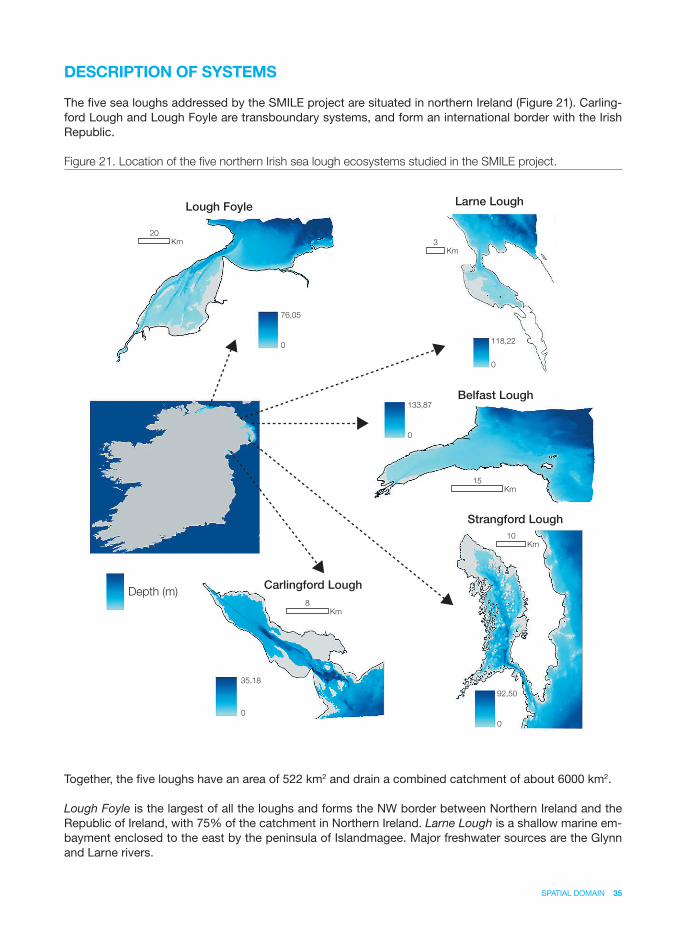
The fi ve sea loughs addressed by the SMILE project are situated in northern Ireland (Figure 21). Carling-ford Lough and Lough Foyle are transboundary systems, and form an international border with the Irish Republic.
Together, the fi ve loughs have an area of 522 km2 and drain a combined catchment of about 6000 km2.
Lough Foyle is the largest of all the loughs and forms the NW border between Northern Ireland and the Republic of Ireland, with 75% of the catchment in Northern Ireland. Larne Lough is a shallow marine em-bayment enclosed to the east by the peninsula of Islandmagee. Major freshwater sources are the Glynn and Larne rivers.
Figure 21. Location of the fi ve northern Irish sea lough ecosystems studied in the SMILE project.
Lough Foyle Larne Lough
Belfast Lough
Strangford Lough
Carlingford LoughDepth (m)
8
35,18
0
76,05
0
133,87
0
0
92,50
Km
20Km
10Km
0
118,22
3Km
15Km
36 SPATIAL DOMAIN
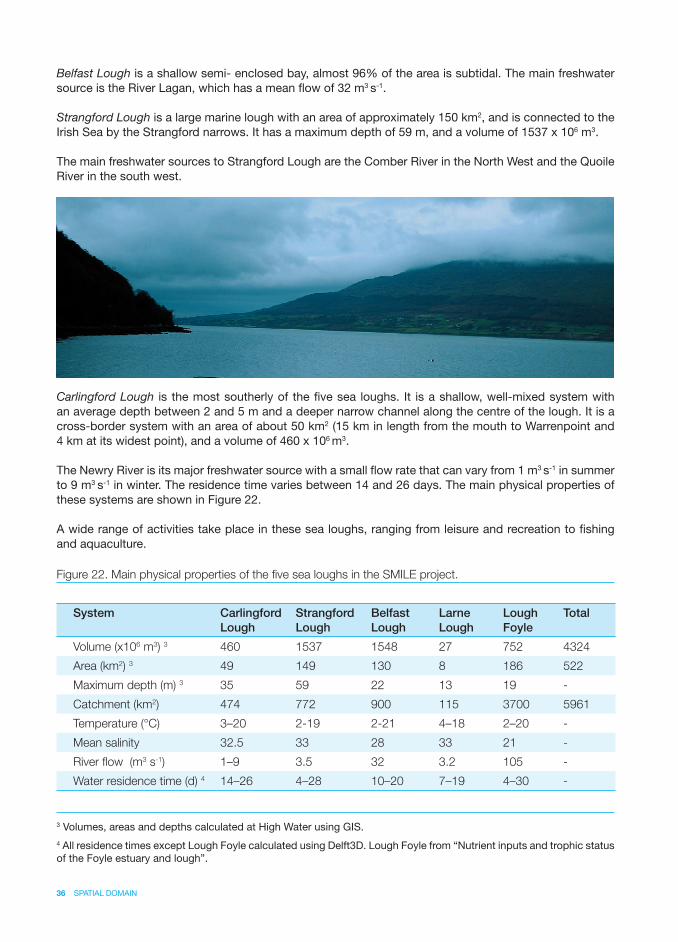
Belfast Lough is a shallow semi- enclosed bay, almost 96% of the area is subtidal. The main freshwater source is the River Lagan, which has a mean fl ow of 32 m3 s-1.
Strangford Lough is a large marine lough with an area of approximately 150 km2, and is connected to the Irish Sea by the Strangford narrows. It has a maximum depth of 59 m, and a volume of 1537 x 106 m3.
The main freshwater sources to Strangford Lough are the Comber River in the North West and the Quoile River in the south west.
Carlingford Lough is the most southerly of the fi ve sea loughs. It is a shallow, well-mixed system with an average depth between 2 and 5 m and a deeper narrow channel along the centre of the lough. It is a cross-border system with an area of about 50 km2 (15 km in length from the mouth to Warrenpoint and 4 km at its widest point), and a volume of 460 x 106 m3.
The Newry River is its major freshwater source with a small fl ow rate that can vary from 1 m3 s-1 in summer to 9 m3 s-1 in winter. The residence time varies between 14 and 26 days. The main physical properties of these systems are shown in Figure 22.
A wide range of activities take place in these sea loughs, ranging from leisure and recreation to fi shing and aquaculture.
Figure 22. Main physical properties of the fi ve sea loughs in the SMILE project.
System Carlingford
Lough
Strangford
Lough
Belfast
Lough
Larne
Lough
Lough
Foyle
Total
Volume (x106 m3) 3 460 1537 1548 27 752 4324
Area (km2) 3 49 149 130 8 186 522
Maximum depth (m) 3 35 59 22 13 19 -
Catchment (km2) 474 772 900 115 3700 5961
Temperature (°C) 3–20 2-19 2-21 4–18 2–20 -
Mean salinity 32.5 33 28 33 21 -
River fl ow (m3 s-1) 1–9 3.5 32 3.2 105 -
Water residence time (d) 4 14–26 4–28 10–20 7–19 4–30 -
3 Volumes, areas and depths calculated at High Water using GIS.4 All residence times except Lough Foyle calculated using Delft3D. Lough Foyle from “Nutrient inputs and trophic status of the Foyle estuary and lough”.
SPATIAL DOMAIN 37
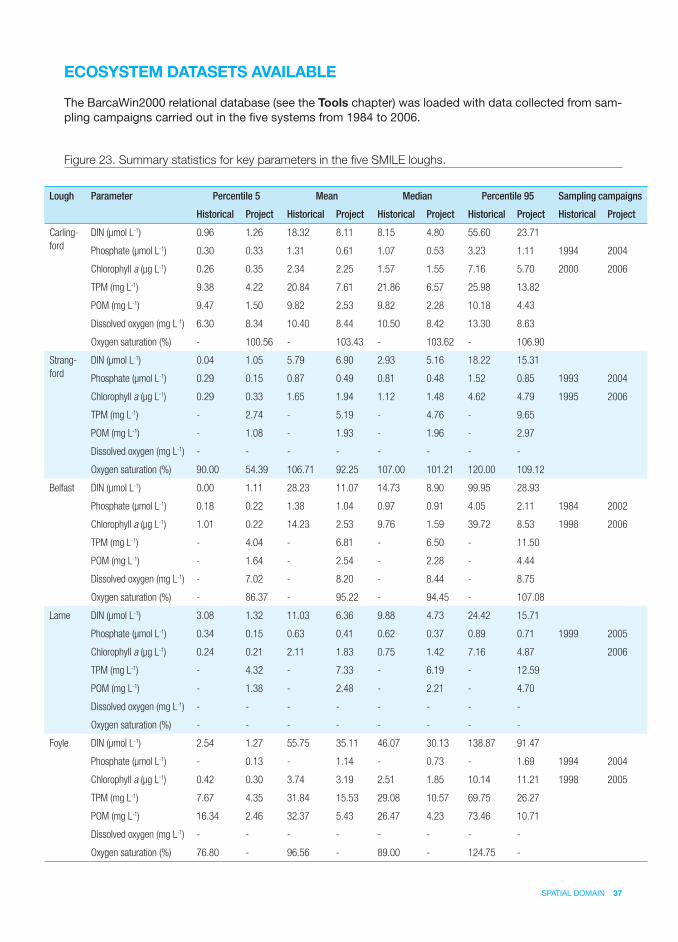
ECOSYSTEM DATASETS AVAILABLE
The BarcaWin2000 relational database (see the Tools chapter) was loaded with data collected from sam-pling campaigns carried out in the fi ve systems from 1984 to 2006.
Figure 23. Summary statistics for key parameters in the fi ve SMILE loughs.
Lough Parameter Percentile 5 Mean Median Percentile 95 Sampling campaigns
Historical Project Historical Project Historical Project Historical Project Historical Project
Carling-
ford
DIN (μmol L-1) 0.96 1.26 18.32 8.11 8.15 4.80 55.60 23.71
Phosphate (μmol L-1) 0.30 0.33 1.31 0.61 1.07 0.53 3.23 1.11 1994 2004
Chlorophyll a (μg L-1) 0.26 0.35 2.34 2.25 1.57 1.55 7.16 5.70 2000 2006
TPM (mg L-1) 9.38 4.22 20.84 7.61 21.86 6.57 25.98 13.82
POM (mg L-1) 9.47 1.50 9.82 2.53 9.82 2.28 10.18 4.43
Dissolved oxygen (mg L-1) 6.30 8.34 10.40 8.44 10.50 8.42 13.30 8.63
Oxygen saturation (%) - 100.56 - 103.43 - 103.62 - 106.90
Strang-
ford
DIN (μmol L-1) 0.04 1.05 5.79 6.90 2.93 5.16 18.22 15.31
Phosphate (μmol L-1) 0.29 0.15 0.87 0.49 0.81 0.48 1.52 0.85 1993 2004
Chlorophyll a (μg L-1) 0.29 0.33 1.65 1.94 1.12 1.48 4.62 4.79 1995 2006
TPM (mg L-1) - 2.74 - 5.19 - 4.76 - 9.65
POM (mg L-1) - 1.08 - 1.93 - 1.96 - 2.97
Dissolved oxygen (mg L-1) - - - - - - - -
Oxygen saturation (%) 90.00 54.39 106.71 92.25 107.00 101.21 120.00 109.12
Belfast DIN (μmol L-1) 0.00 1.11 28.23 11.07 14.73 8.90 99.95 28.93
Phosphate (μmol L-1) 0.18 0.22 1.38 1.04 0.97 0.91 4.05 2.11 1984 2002
Chlorophyll a (μg L-1) 1.01 0.22 14.23 2.53 9.76 1.59 39.72 8.53 1998 2006
TPM (mg L-1) - 4.04 - 6.81 - 6.50 - 11.50
POM (mg L-1) - 1.64 - 2.54 - 2.28 - 4.44
Dissolved oxygen (mg L-1) - 7.02 - 8.20 - 8.44 - 8.75
Oxygen saturation (%) - 86.37 - 95.22 - 94.45 - 107.08
Larne DIN (μmol L-1) 3.08 1.32 11.03 6.36 9.88 4.73 24.42 15.71
Phosphate (μmol L-1) 0.34 0.15 0.63 0.41 0.62 0.37 0.89 0.71 1999 2005
Chlorophyll a (μg L-1) 0.24 0.21 2.11 1.83 0.75 1.42 7.16 4.87 2006
TPM (mg L-1) - 4.32 - 7.33 - 6.19 - 12.59
POM (mg L-1) - 1.38 - 2.48 - 2.21 - 4.70
Dissolved oxygen (mg L-1) - - - - - - - -
Oxygen saturation (%) - - - - - - - -
Foyle DIN (μmol L-1) 2.54 1.27 55.75 35.11 46.07 30.13 138.87 91.47
Phosphate (μmol L-1) - 0.13 - 1.14 - 0.73 - 1.69 1994 2004
Chlorophyll a (μg L-1) 0.42 0.30 3.74 3.19 2.51 1.85 10.14 11.21 1998 2005
TPM (mg L-1) 7.67 4.35 31.84 15.53 29.08 10.57 69.75 26.27
POM (mg L-1) 16.34 2.46 32.37 5.43 26.47 4.23 73.46 10.71
Dissolved oxygen (mg L-1) - - - - - - - -
Oxygen saturation (%) 76.80 - 96.56 - 89.00 - 124.75 -
38 SPATIAL DOMAIN
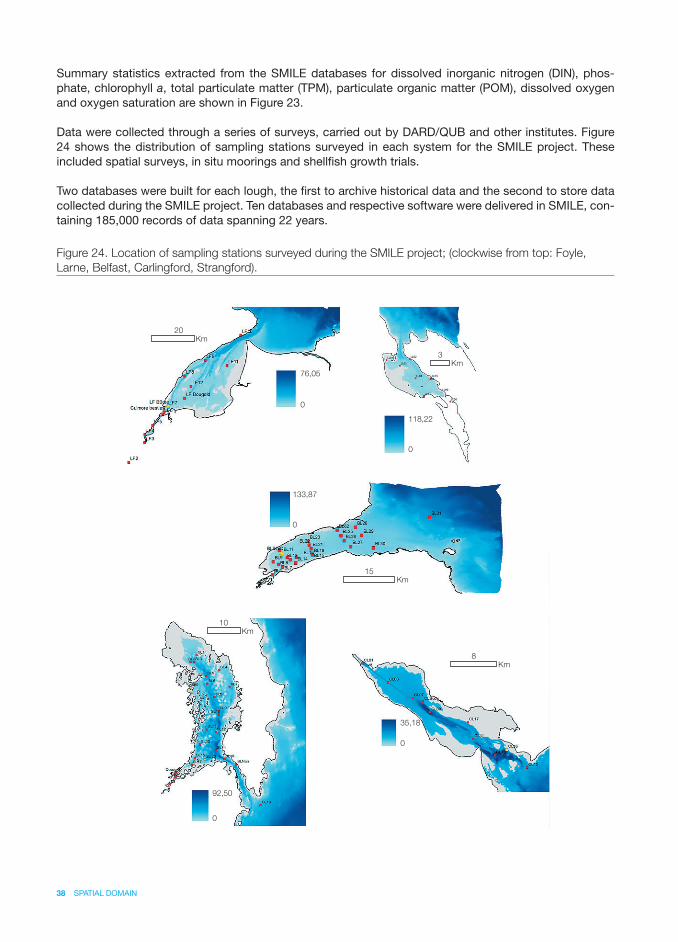
Figure 24. Location of sampling stations surveyed during the SMILE project; (clockwise from top: Foyle,
Larne, Belfast, Carlingford, Strangford).
Summary statistics extracted from the SMILE databases for dissolved inorganic nitrogen (DIN), phos-phate, chlorophyll a, total particulate matter (TPM), particulate organic matter (POM), dissolved oxygen and oxygen saturation are shown in Figure 23.
Data were collected through a series of surveys, carried out by DARD/QUB and other institutes. Figure 24 shows the distribution of sampling stations surveyed in each system for the SMILE project. These included spatial surveys, in situ moorings and shellfi sh growth trials.
Two databases were built for each lough, the fi rst to archive historical data and the second to store data collected during the SMILE project. Ten databases and respective software were delivered in SMILE, con-taining 185,000 records of data spanning 22 years.
Depth (m)
Sample sites
Growth sites 0
133,87
35,18
0
76,05
0
0
92,50
8Km
20Km
10Km
0
118,22
3Km
15Km
SPATIAL DOMAIN 39
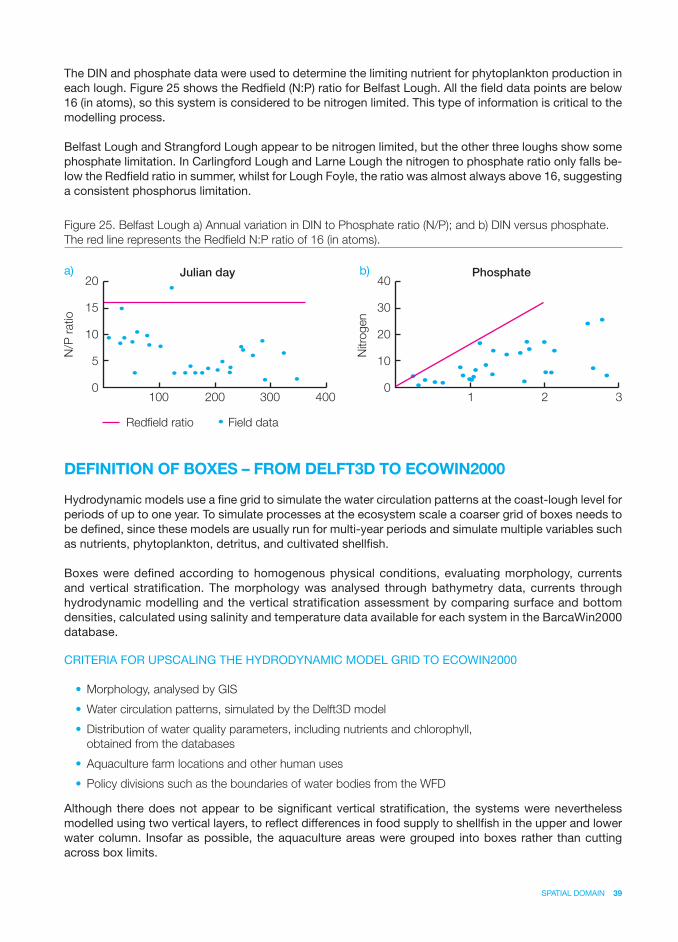
The DIN and phosphate data were used to determine the limiting nutrient for phytoplankton production in each lough. Figure 25 shows the Redfi eld (N:P) ratio for Belfast Lough. All the fi eld data points are below 16 (in atoms), so this system is considered to be nitrogen limited. This type of information is critical to the modelling process.
Belfast Lough and Strangford Lough appear to be nitrogen limited, but the other three loughs show some phosphate limitation. In Carlingford Lough and Larne Lough the nitrogen to phosphate ratio only falls be-low the Redfi eld ratio in summer, whilst for Lough Foyle, the ratio was almost always above 16, suggesting a consistent phosphorus limitation.
DEFINITION OF BOXES – FROM DELFT3D TO ECOWIN2000
Hydrodynamic models use a fi ne grid to simulate the water circulation patterns at the coast-lough level for periods of up to one year. To simulate processes at the ecosystem scale a coarser grid of boxes needs to be defi ned, since these models are usually run for multi-year periods and simulate multiple variables such as nutrients, phytoplankton, detritus, and cultivated shellfi sh.
Boxes were defi ned according to homogenous physical conditions, evaluating morphology, currents and vertical stratifi cation. The morphology was analysed through bathymetry data, currents through hydrodynamic modelling and the vertical stratifi cation assessment by comparing surface and bottom densities, calculated using salinity and temperature data available for each system in the BarcaWin2000 database.
CRITERIA FOR UPSCALING THE HYDRODYNAMIC MODEL GRID TO ECOWIN2000
• Morphology, analysed by GIS
• Water circulation patterns, simulated by the Delft3D model
• Distribution of water quality parameters, including nutrients and chlorophyll,
obtained from the databases
• Aquaculture farm locations and other human uses
• Policy divisions such as the boundaries of water bodies from the WFD
Although there does not appear to be signifi cant vertical stratifi cation, the systems were nevertheless modelled using two vertical layers, to refl ect differences in food supply to shellfi sh in the upper and lower water column. Insofar as possible, the aquaculture areas were grouped into boxes rather than cutting across box limits.
Figure 25. Belfast Lough a) Annual variation in DIN to Phosphate ratio (N/P); and b) DIN versus phosphate.
The red line represents the Redfi eld N:P ratio of 16 (in atoms).
Redfield ratio Field data
Julian day
0
5
15
10
20
100 200 300 400
Phosphate
0
10
30
20
40
1 2 3
N/P
ratio
Nitro
gen
a) b)
40 SPATIAL DOMAIN
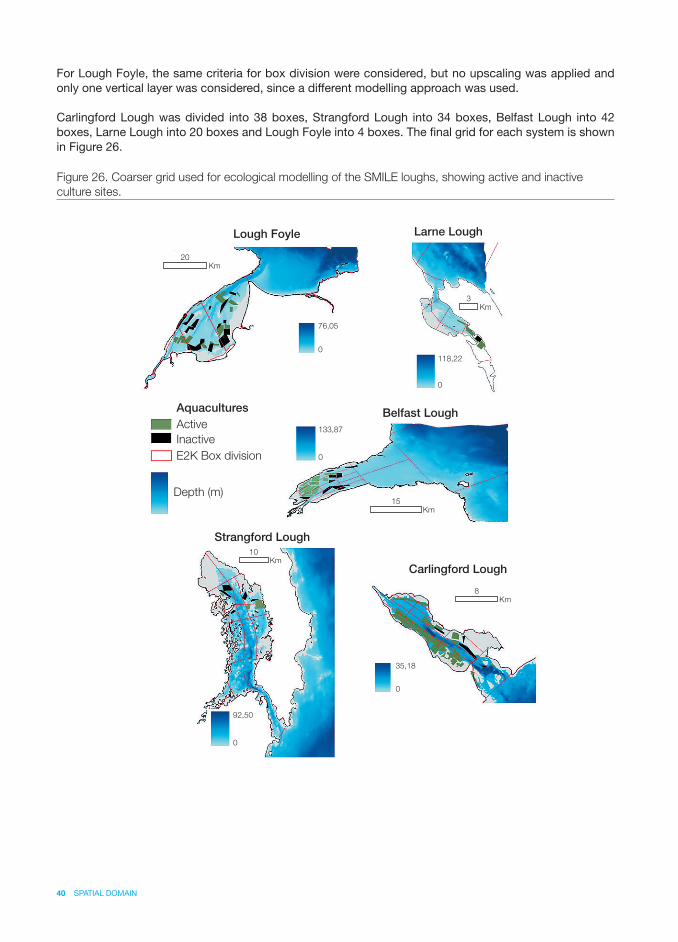
For Lough Foyle, the same criteria for box division were considered, but no upscaling was applied and only one vertical layer was considered, since a different modelling approach was used.
Carlingford Lough was divided into 38 boxes, Strangford Lough into 34 boxes, Belfast Lough into 42 boxes, Larne Lough into 20 boxes and Lough Foyle into 4 boxes. The fi nal grid for each system is shown in Figure 26.
Figure 26. Coarser grid used for ecological modelling of the SMILE loughs, showing active and inactive
culture sites.
Lough Foyle Larne Lough
Belfast Lough
Strangford Lough
Carlingford Lough
Depth (m)
8
35,18
0
Km
0
76,05
20Km
0
92,50
10Km
0
118,22
3Km
0
133,87
15Km
Aquacultures
Active
Inactive
E2K Box division
SPATIAL DOMAIN 41
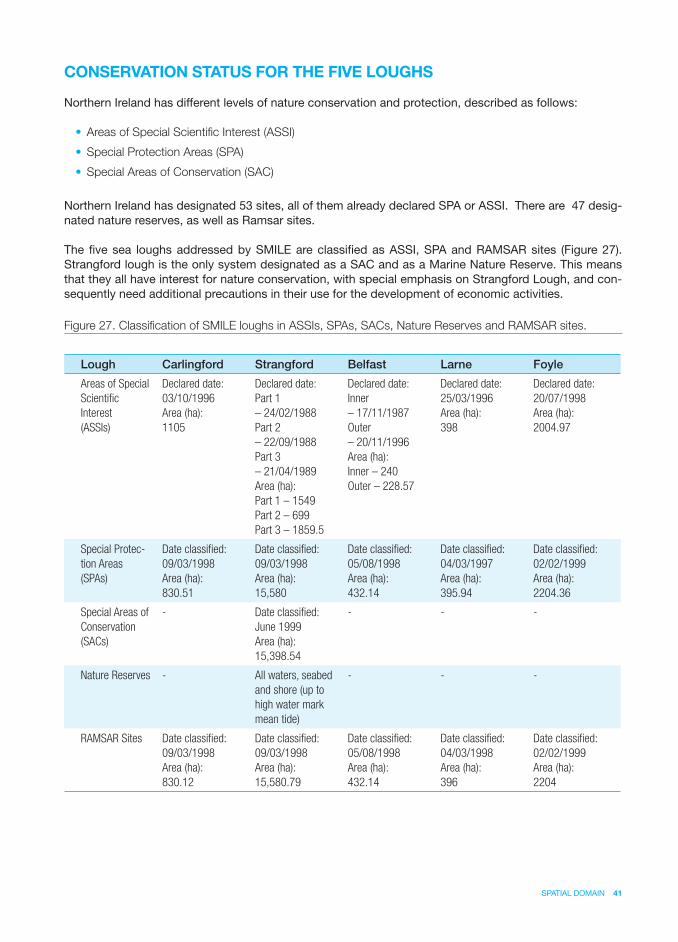
CONSERVATION STATUS FOR THE FIVE LOUGHS
Northern Ireland has different levels of nature conservation and protection, described as follows:
• Areas of Special Scientifi c Interest (ASSI)
• Special Protection Areas (SPA)
• Special Areas of Conservation (SAC)
Northern Ireland has designated 53 sites, all of them already declared SPA or ASSI. There are 47 desig-nated nature reserves, as well as Ramsar sites.
The fi ve sea loughs addressed by SMILE are classifi ed as ASSI, SPA and RAMSAR sites (Figure 27). Strangford lough is the only system designated as a SAC and as a Marine Nature Reserve. This means that they all have interest for nature conservation, with special emphasis on Strangford Lough, and con-sequently need additional precautions in their use for the development of economic activities.
Figure 27. Classifi cation of SMILE loughs in ASSIs, SPAs, SACs, Nature Reserves and RAMSAR sites.
Lough Carlingford Strangford Belfast Larne Foyle
Areas of Special
Scientifi c
Interest
(ASSIs)
Declared date:
03/10/1996
Area (ha):
1105
Declared date:
Part 1
– 24/02/1988
Part 2
– 22/09/1988
Part 3
– 21/04/1989
Area (ha):
Part 1 – 1549
Part 2 – 699
Part 3 – 1859.5
Declared date:
Inner
– 17/11/1987
Outer
– 20/11/1996
Area (ha):
Inner – 240
Outer – 228.57
Declared date:
25/03/1996
Area (ha):
398
Declared date:
20/07/1998
Area (ha):
2004.97
Special Protec-
tion Areas
(SPAs)
Date classifi ed:
09/03/1998
Area (ha):
830.51
Date classifi ed:
09/03/1998
Area (ha):
15,580
Date classifi ed:
05/08/1998
Area (ha):
432.14
Date classifi ed:
04/03/1997
Area (ha):
395.94
Date classifi ed:
02/02/1999
Area (ha):
2204.36
Special Areas of
Conservation
(SACs)
- Date classifi ed:
June 1999
Area (ha):
15,398.54
- - -
Nature Reserves - All waters, seabed
and shore (up to
high water mark
mean tide)
- - -
RAMSAR Sites Date classifi ed:
09/03/1998
Area (ha):
830.12
Date classifi ed:
09/03/1998
Area (ha):
15,580.79
Date classifi ed:
05/08/1998
Area (ha):
432.14
Date classifi ed:
04/03/1998
Area (ha):
396
Date classifi ed:
02/02/1999
Area (ha):
2204

KEY REFERENCES
Ferreira, J.G., Nobre, A.M., Simas, T.C., Silva, M.C., Newton, A., Bricker, S.B., Wolff, W.J., Stacey, P.E., Sequeira, A., 2006. A methodology for defi ning homogeneous water bodies in estuaries – Application to the transitional systems of the EU Water Framework Directive. Estuarine, Coastal and Shelf Science, 66 (3/4), 468–482.
Environment and Heritage Service Northern Ireland. http://www.ehsni.gov.uk/
Loughs Agency. http://www.loughs-agency.org/
Joint Nature Conservation Committee. http://www.jncc.gov.uk/
TOOLS 43

SHELLFISH
SHELLFISH 45
INTRODUCTION
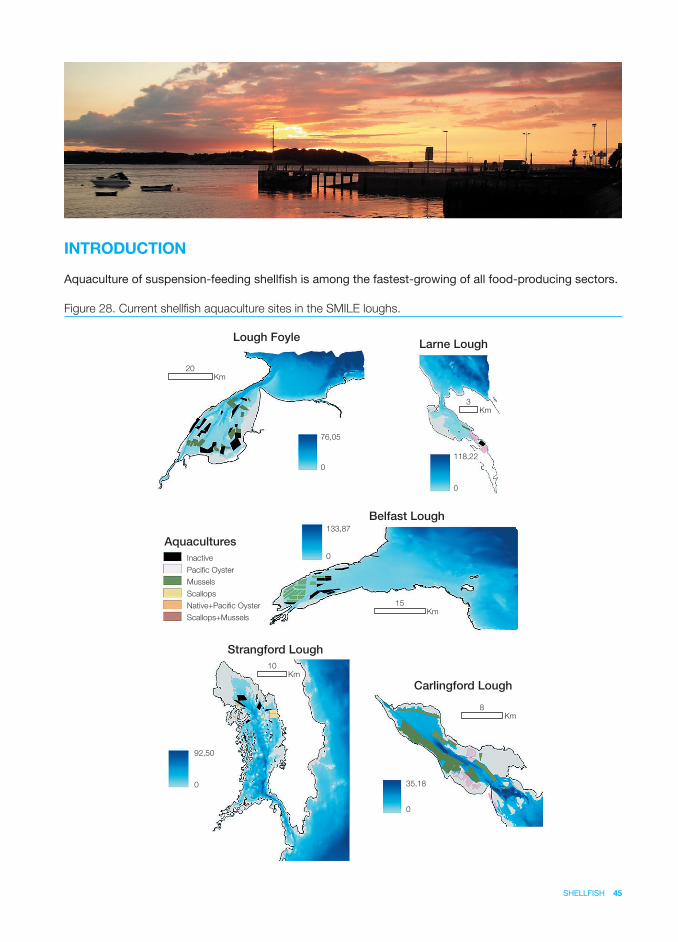
Aquaculture of suspension-feeding shellfi sh is among the fastest-growing of all food-producing sectors.
Figure 28. Current shellfi sh aquaculture sites in the SMILE loughs.
Lough FoyleLarne Lough
Belfast Lough
Strangford Lough
Carlingford Lough
8
35,18
0
Km
0
76,05
20Km
0
92,50
10Km
0
118,22
3Km
0
133,87
15Km
Aquacultures
Inactive
Pacific Oyster
Mussels
Scallops
Native+Pacific Oyster
Scallops+Mussels
46 SHELLFISH
As a consequence, there is increasing pressure to develop management strategies which will allow sus-tainable development. Such modelling is complicated by observations that fi lter-feeding and metabolism in shellfi sh are highly responsive to fl uctuations in temperature, salinity, food availability and food compo-sition, as frequently occur in near-shore environments where most such aquaculture takes place.
These physiological adjustments affect growth of individual animals. By influencing the relative bio-geochemical fluxes of different particles and nutrients, they also affect ecosystem processes. Only by modelling the complex set of feedbacks, both positive and negative, whereby suspension-feed-ing shellfish interact with ecosystem processes, such as may include stimulation of primary produc-tion by nitrogen excreted from shellfish, can environmental impacts of and capacities for culture be realistically assessed.
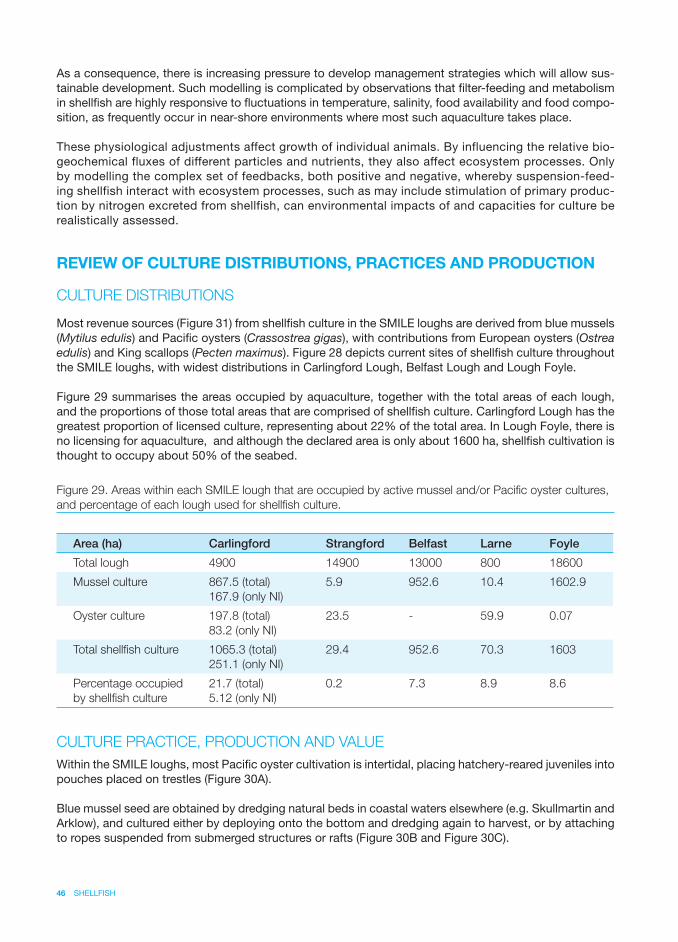
REVIEW OF CULTURE DISTRIBUTIONS, PRACTICES AND PRODUCTION
CULTURE DISTRIBUTIONS
Most revenue sources (Figure 31) from shellfi sh culture in the SMILE loughs are derived from blue mussels (Mytilus edulis) and Pacifi c oysters (Crassostrea gigas), with contributions from European oysters (Ostrea edulis) and King scallops (Pecten maximus). Figure 28 depicts current sites of shellfi sh culture throughout the SMILE loughs, with widest distributions in Carlingford Lough, Belfast Lough and Lough Foyle.
Figure 29 summarises the areas occupied by aquaculture, together with the total areas of each lough, and the proportions of those total areas that are comprised of shellfi sh culture. Carlingford Lough has the greatest proportion of licensed culture, representing about 22% of the total area. In Lough Foyle, there is no licensing for aquaculture, and although the declared area is only about 1600 ha, shellfi sh cultivation is thought to occupy about 50% of the seabed.
CULTURE PRACTICE, PRODUCTION AND VALUE
Within the SMILE loughs, most Pacifi c oyster cultivation is intertidal, placing hatchery-reared juveniles into pouches placed on trestles (Figure 30A).
Blue mussel seed are obtained by dredging natural beds in coastal waters elsewhere (e.g. Skullmartin and Arklow), and cultured either by deploying onto the bottom and dredging again to harvest, or by attaching to ropes suspended from submerged structures or rafts (Figure 30B and Figure 30C).
Area (ha) Carlingford Strangford Belfast Larne Foyle
Total lough 4900 14900 13000 800 18600
Mussel culture 867.5 (total)
167.9 (only NI)
5.9 952.6 10.4 1602.9
Oyster culture 197.8 (total)
83.2 (only NI)
23.5 - 59.9 0.07
Total shellfi sh culture 1065.3 (total)
251.1 (only NI)
29.4 952.6 70.3 1603
Percentage occupied
by shellfi sh culture
21.7 (total)
5.12 (only NI)
0.2 7.3 8.9 8.6
Figure 29. Areas within each SMILE lough that are occupied by active mussel and/or Pacifi c oyster cultures,
and percentage of each lough used for shellfi sh culture.
SHELLFISH 47
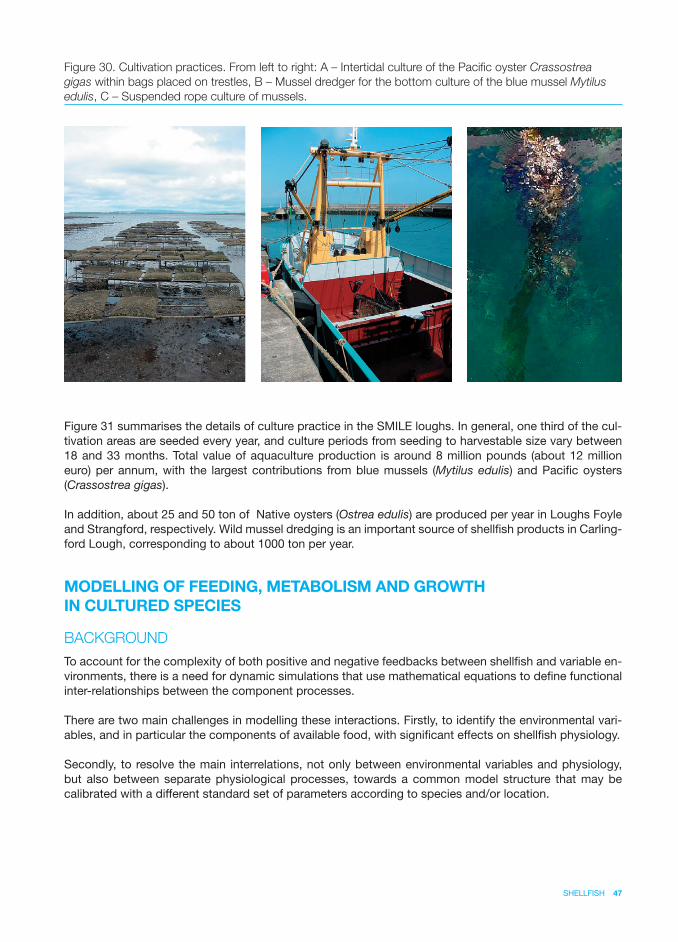
Figure 30. Cultivation practices. From left to right: A – Intertidal culture of the Pacifi c oyster Crassostrea
gigas within bags placed on trestles, B – Mussel dredger for the bottom culture of the blue mussel Mytilus
edulis, C – Suspended rope culture of mussels.
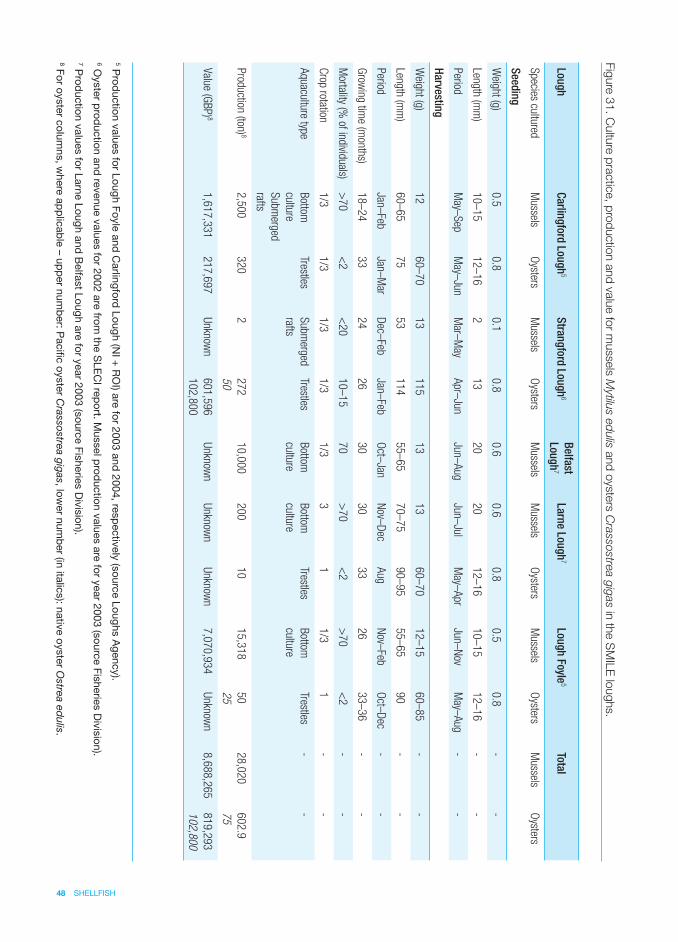
Figure 31 summarises the details of culture practice in the SMILE loughs. In general, one third of the cul-tivation areas are seeded every year, and culture periods from seeding to harvestable size vary between 18 and 33 months. Total value of aquaculture production is around 8 million pounds (about 12 million euro) per annum, with the largest contributions from blue mussels (Mytilus edulis) and Pacifi c oysters (Crassostrea gigas).
In addition, about 25 and 50 ton of Native oysters (Ostrea edulis) are produced per year in Loughs Foyle and Strangford, respectively. Wild mussel dredging is an important source of shellfi sh products in Carling-ford Lough, corresponding to about 1000 ton per year.
MODELLING OF FEEDING, METABOLISM AND GROWTH
IN CULTURED SPECIES
BACKGROUND
To account for the complexity of both positive and negative feedbacks between shellfi sh and variable en-vironments, there is a need for dynamic simulations that use mathematical equations to defi ne functional inter-relationships between the component processes.
There are two main challenges in modelling these interactions. Firstly, to identify the environmental vari-ables, and in particular the components of available food, with signifi cant effects on shellfi sh physiology.
Secondly, to resolve the main interrelations, not only between environmental variables and physiology, but also between separate physiological processes, towards a common model structure that may be calibrated with a different standard set of parameters according to species and/or location.
48 SHELLFISH
Lou
gh
Carlin
gfo
rd Lo
ug
h5
Stra
ng
ford
Lou
gh
6 B
elfa
st
Lou
gh
7 La
rne Lo
ug
h7
Lou
gh
Foyle
5To
tal
Species cultured
Mussels
Oysters
Mussels
Oysters
Mussels
Mussels
Oysters
Mussels
Oysters
Mussels
Oysters
Seed
ing
Weight (g)
0.5
0.8
0.1
0.8
0.6
0.6
0.8
0.5
0.8
--
Length (mm
)1
0–
15
12
–1
62
13
20
20
12
–1
61
0–
15
12–
16
--
Period
May–
Sep
May–
JunM
ar–M
ayA
pr–Jun
Jun–A
ugJun–
JulM
ay–A
prJun–
Nov
May–
Aug
--
Harve
sting
Weight (g)
12
60
–7
01
31
15
13
13
60
–7
01
2–
15
60
–8
5-
-
Length (mm
)6
0–
65
75
53
11
45
5–
65
70
–7
59
0–
95
55
–6
59
0-
-
Period
Jan–Feb
Jan–M
arD
ec–Feb
Jan–Feb
Oct–
JanN
ov–D
ecA
ugN
ov–Feb
Oct–
Dec
--
Grow
ing time (m
onths)1
8–
24
33
24
26
30
30
33
26
33
–36
--
Mortality (%
of individuals)>
70
<2
<2
01
0–
15
70
>7
0<
2>
70
<2
--
Crop rotation
1/3
1/3
1/3
1/3
1/3
31
1/3
1-
-
Aquaculture type
Bottom
culture
Subm
erged
rafts
TrestlesS
ubmerged
rafts
TrestlesB
ottom
culture
Bottom
culture
TrestlesB
ottom
culture
Trestles-
-
Production (ton) 8
2,5
00
32
02
27
2
50
10
,00
02
00
10
15
,31
850
25
28,0
20
60
2.9
75
Value (GB
P) 8
1,6
17
,33
12
17
,69
7U
nknown
60
1,5
96
10
2,8
00
Unknow
nU
nknown
Unknow
n7
,07
0,9
34
Unknow
n8
,688
,265
81
9,2
93
10
2,8
00
Fig
ure
31
. Cultu
re p
ractic
e, p
rod
uctio
n a
nd
valu
e fo
r mussels
Mytilu
s e
dulis
and
oyste
rs C
rassostre
a g
igas in
the S
MIL
E lo
ughs.
5 Prod
uction values for Lough Foyle and C
arlingford Lough (N
I + R
OI) are for 2003 and
2004, respectively (source Loughs A
gency).6 O
yster prod
uction and revenue values for 2002 are from
the SLE
CI rep
ort. Mussel p
roduction values are for year 2003 (source Fisheries D
ivision).7 P
roduction values for Larne Lough and
Belfast Lough are for year 2003 (source Fisheries D
ivision).8 For oyster colum
ns, where ap
plicab
le – upp
er numb
er: Pacifi c oyster C
rassostrea gigas, lower num
ber (in italics): native oyster O
strea edulis.
SHELLFISH 49
MODEL STRUCTURE
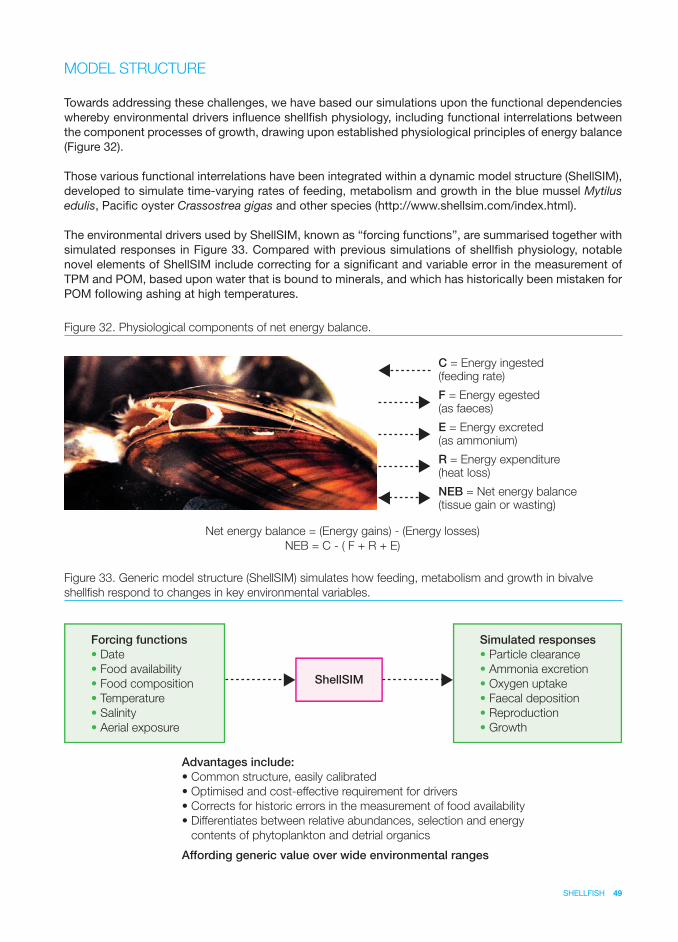
Towards addressing these challenges, we have based our simulations upon the functional dependencies whereby environmental drivers infl uence shellfi sh physiology, including functional interrelations between the component processes of growth, drawing upon established physiological principles of energy balance (Figure 32).
Those various functional interrelations have been integrated within a dynamic model structure (ShellSIM), developed to simulate time-varying rates of feeding, metabolism and growth in the blue mussel Mytilus edulis, Pacifi c oyster Crassostrea gigas and other species (http://www.shellsim.com/index.html).
The environmental drivers used by ShellSIM, known as “forcing functions”, are summarised together with simulated responses in Figure 33. Compared with previous simulations of shellfi sh physiology, notable novel elements of ShellSIM include correcting for a signifi cant and variable error in the measurement of TPM and POM, based upon water that is bound to minerals, and which has historically been mistaken for POM following ashing at high temperatures.
Figure 32. Physiological components of net energy balance.
Forcing functions
• Date
• Food availability
• Food composition
• Temperature
• Salinity
• Aerial exposure
Simulated responses
• Particle clearance
• Ammonia excretion
• Oxygen uptake
• Faecal deposition
• Reproduction
• Growth
ShellSIM
Advantages include:
• Common structure, easily calibrated
• Optimised and cost-effective requirement for drivers
• Corrects for historic errors in the measurement of food availability
• Differentiates between relative abundances, selection and energy
contents of phytoplankton and detrial organics
Affording generic value over wide environmental ranges
Figure 33. Generic model structure (ShellSIM) simulates how feeding, metabolism and growth in bivalve
shellfi sh respond to changes in key environmental variables.
C = Energy ingested(feeding rate)
F = Energy egested(as faeces)
E = Energy excreted(as ammonium)
R = Energy expenditure(heat loss)
NEB = Net energy balance (tissue gain or wasting)
Net energy balance = (Energy gains) - (Energy losses)
NEB = C - ( F + R + E)
50 SHELLFISH
In addition, ShellSIM resolves rapid regulatory adjustments in the relative processing of living chlorophyll-rich phytoplankton organics, non-phytoplankton organics and the remaining inorganic matter during both differential retention on the gill and selective pre-ingestive rejection within pseudofaeces.
SHELLSIM CALIBRATION
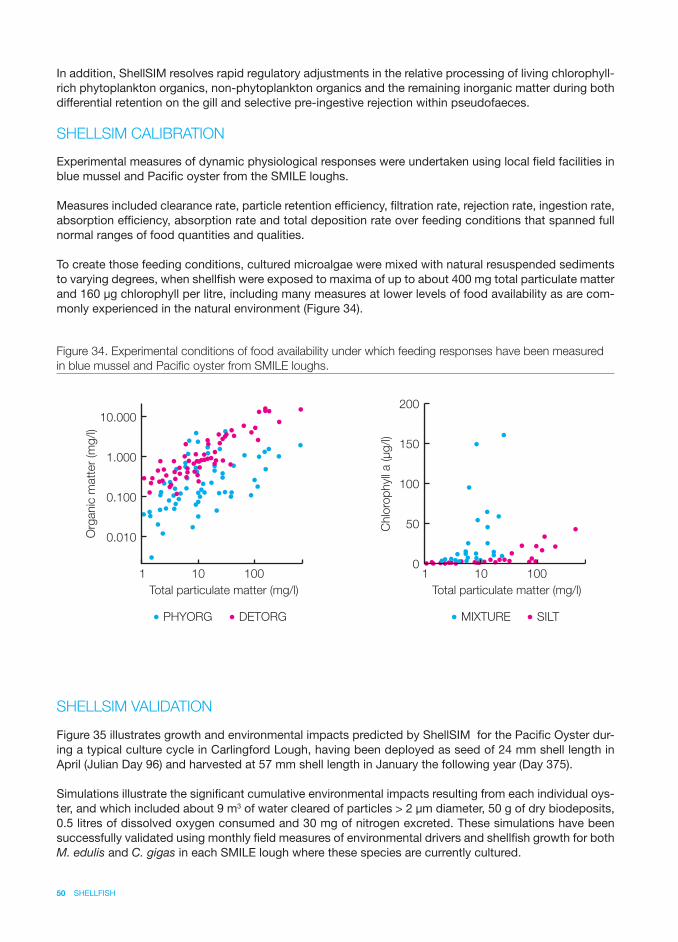
Experimental measures of dynamic physiological responses were undertaken using local fi eld facilities in blue mussel and Pacifi c oyster from the SMILE loughs.
Measures included clearance rate, particle retention effi ciency, fi ltration rate, rejection rate, ingestion rate, absorption effi ciency, absorption rate and total deposition rate over feeding conditions that spanned full normal ranges of food quantities and qualities.
To create those feeding conditions, cultured microalgae were mixed with natural resuspended sediments to varying degrees, when shellfi sh were exposed to maxima of up to about 400 mg total particulate matter and 160 μg chlorophyll per litre, including many measures at lower levels of food availability as are com-monly experienced in the natural environment (Figure 34).
SHELLSIM VALIDATION
Figure 35 illustrates growth and environmental impacts predicted by ShellSIM for the Pacifi c Oyster dur-ing a typical culture cycle in Carlingford Lough, having been deployed as seed of 24 mm shell length in April (Julian Day 96) and harvested at 57 mm shell length in January the following year (Day 375).
Simulations illustrate the signifi cant cumulative environmental impacts resulting from each individual oys-ter, and which included about 9 m3 of water cleared of particles > 2 μm diameter, 50 g of dry biodeposits, 0.5 litres of dissolved oxygen consumed and 30 mg of nitrogen excreted. These simulations have been successfully validated using monthly fi eld measures of environmental drivers and shellfi sh growth for both M. edulis and C. gigas in each SMILE lough where these species are currently cultured.
Figure 34. Experimental conditions of food availability under which feeding responses have been measured
in blue mussel and Pacifi c oyster from SMILE loughs.
Chlo
rop
hyll
a (μg/l)
Total particulate matter (mg/l)
0
50
100
150
200
1 10 100
Org
anic
matt
er
(mg/l)
Total particulate matter (mg/l)
PHYORG
0.010
0.100
1.000
10.000
1 10 100
DETORG MIXTURE SILT
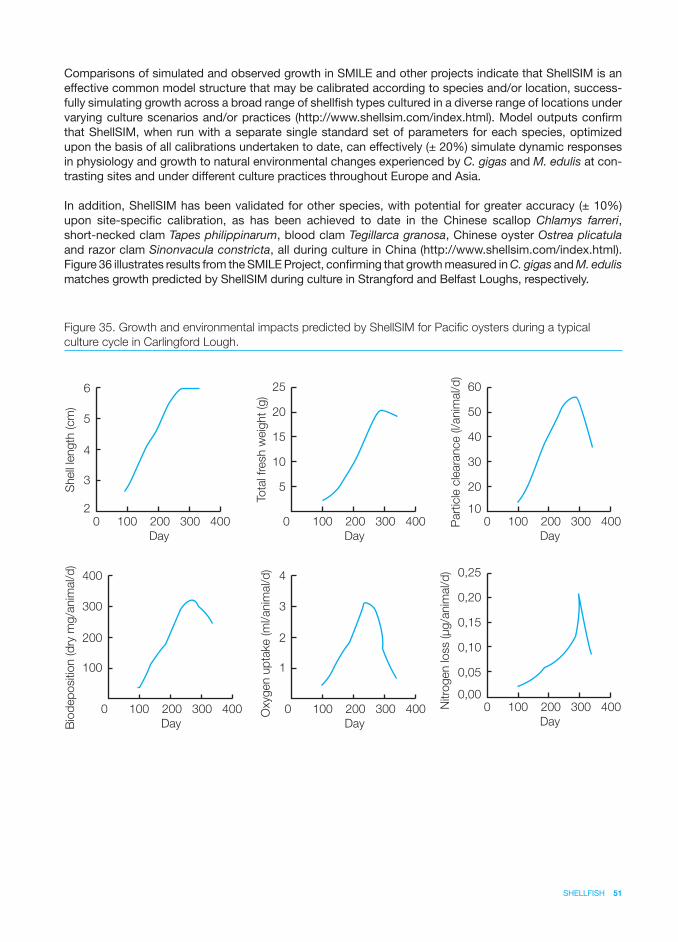
SHELLFISH 51
Comparisons of simulated and observed growth in SMILE and other projects indicate that ShellSIM is an effective common model structure that may be calibrated according to species and/or location, success-fully simulating growth across a broad range of shellfi sh types cultured in a diverse range of locations under varying culture scenarios and/or practices (http://www.shellsim.com/index.html). Model outputs confi rm that ShellSIM, when run with a separate single standard set of parameters for each species, optimized upon the basis of all calibrations undertaken to date, can effectively (± 20%) simulate dynamic responses in physiology and growth to natural environmental changes experienced by C. gigas and M. edulis at con-trasting sites and under different culture practices throughout Europe and Asia.
In addition, ShellSIM has been validated for other species, with potential for greater accuracy (± 10%) upon site-specifi c calibration, as has been achieved to date in the Chinese scallop Chlamys farreri, short-necked clam Tapes philippinarum, blood clam Tegillarca granosa, Chinese oyster Ostrea plicatula and razor clam Sinonvacula constricta, all during culture in China (http://www.shellsim.com/index.html). Figure 36 illustrates results from the SMILE Project, confi rming that growth measured in C. gigas and M. edulismatches growth predicted by ShellSIM during culture in Strangford and Belfast Loughs, respectively.
Figure 35. Growth and environmental impacts predicted by ShellSIM for Pacifi c oysters during a typical
culture cycle in Carlingford Lough.
40030020010002
3
4
5
6
Shell
length
(cm
)
Day
4003002001000
100
200
300
400
Bio
dep
ositio
n (d
ry m
g/a
nim
al/d
)
Day
4003002001000
1
2
3
4
Oxygen u
pta
ke (m
l/anim
al/d
)
Day
4003002001000
5
10
15
20
25
Tota
l fresh w
eig
ht
(g)
Day
4003002001000
20
10
30
40
50
60
Part
icle
cle
ara
nce (l/anim
al/d
)
Day
4003002001000
0,05
0,00
0,10
0,15
0,20
0,25
Nitro
gen loss (μg/a
nim
al/d
)
Day
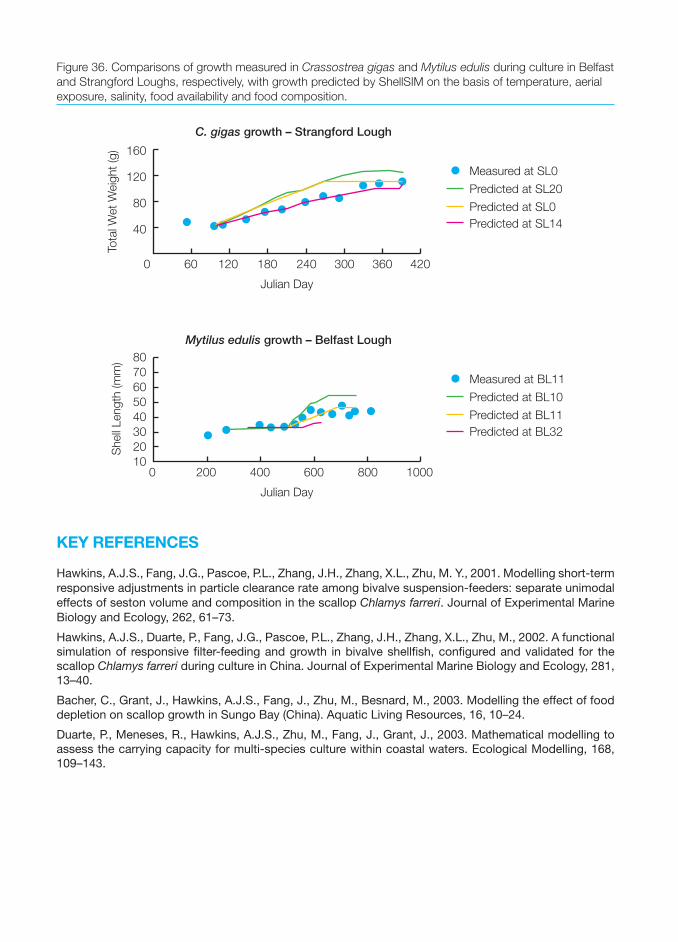
52 SHELLFISH
KEY REFERENCES
Hawkins, A.J.S., Fang, J.G., Pascoe, P.L., Zhang, J.H., Zhang, X.L., Zhu, M. Y., 2001. Modelling short-term responsive adjustments in particle clearance rate among bivalve suspension-feeders: separate unimodal effects of seston volume and composition in the scallop Chlamys farreri. Journal of Experimental Marine Biology and Ecology, 262, 61–73.
Hawkins, A.J.S., Duarte, P., Fang, J.G., Pascoe, P.L., Zhang, J.H., Zhang, X.L., Zhu, M., 2002. A functional simulation of responsive fi lter-feeding and growth in bivalve shellfi sh, confi gured and validated for the scallop Chlamys farreri during culture in China. Journal of Experimental Marine Biology and Ecology, 281, 13–40.
Bacher, C., Grant, J., Hawkins, A.J.S., Fang, J., Zhu, M., Besnard, M., 2003. Modelling the effect of food depletion on scallop growth in Sungo Bay (China). Aquatic Living Resources, 16, 10–24.
Duarte, P., Meneses, R., Hawkins, A.J.S., Zhu, M., Fang, J., Grant, J., 2003. Mathematical modelling to assess the carrying capacity for multi-species culture within coastal waters. Ecological Modelling, 168, 109–143.
Figure 36. Comparisons of growth measured in Crassostrea gigas and Mytilus edulis during culture in Belfast
and Strangford Loughs, respectively, with growth predicted by ShellSIM on the basis of temperature, aerial
exposure, salinity, food availability and food composition.
010
20
30
40
50
60
70
80
200 400 600 800 1000
Julian Day
Mytilus edulis growth – Belfast Lough
Shell
Length
(m
m)
Measured at BL11
Predicted at BL10
Predicted at BL11
Predicted at BL32
0
40
80
120
160
60 120 180 240 300 360 420
Julian Day
C. gigas growth – Strangford Lough
Tota
l W
et
Weig
ht
(g)
Measured at SL0
Predicted at SL20
Predicted at SL0
Predicted at SL14
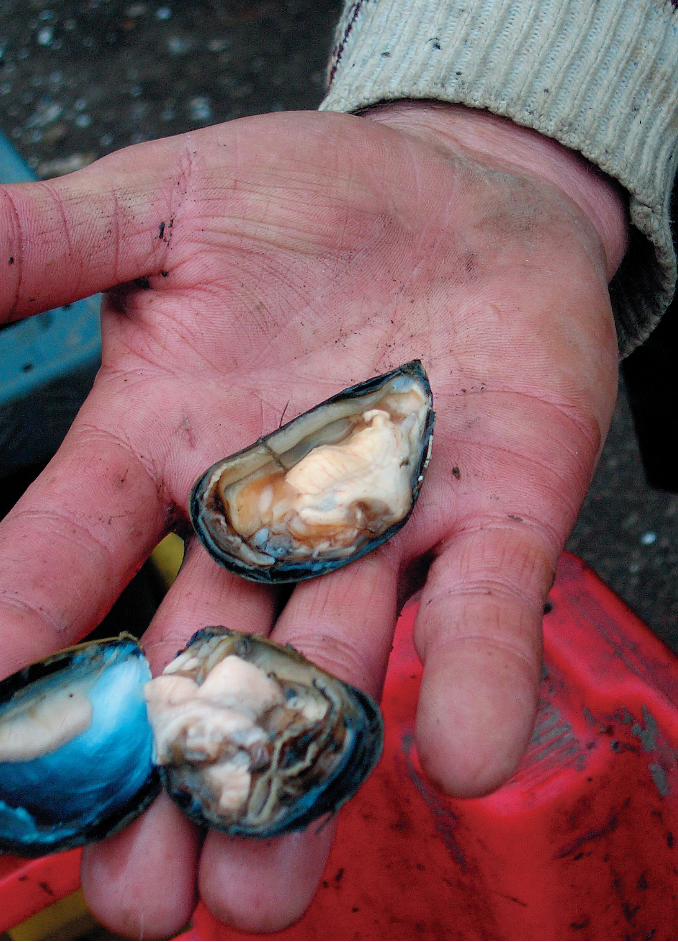

CARRYINGCAPACITY
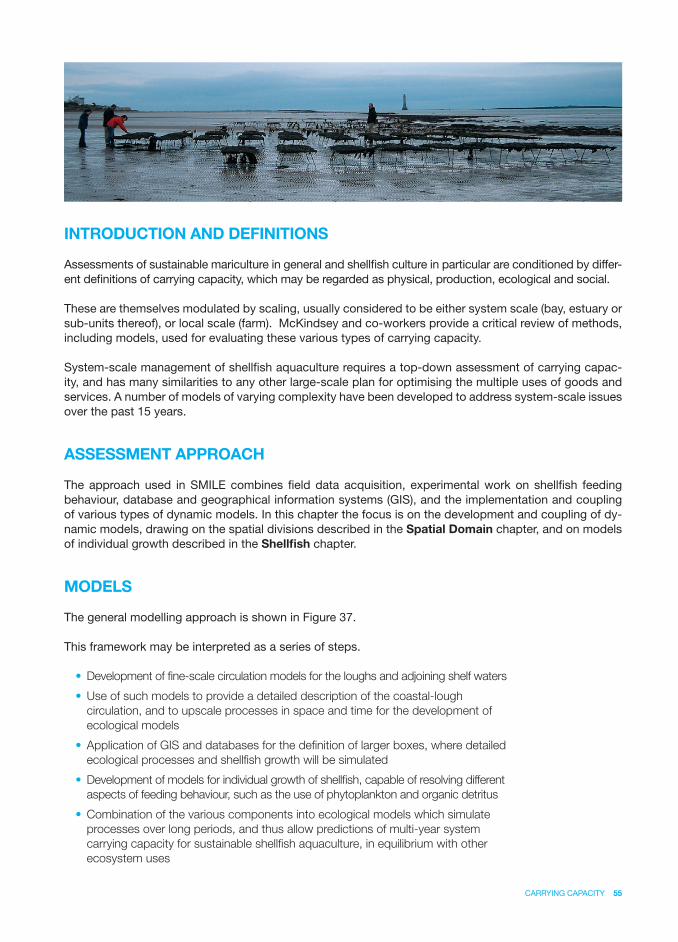
CARRYING CAPACITY 55
INTRODUCTION AND DEFINITIONS
Assessments of sustainable mariculture in general and shellfi sh culture in particular are conditioned by differ-ent defi nitions of carrying capacity, which may be regarded as physical, production, ecological and social.
These are themselves modulated by scaling, usually considered to be either system scale (bay, estuary or sub-units thereof), or local scale (farm). McKindsey and co-workers provide a critical review of methods, including models, used for evaluating these various types of carrying capacity.
System-scale management of shellfi sh aquaculture requires a top-down assessment of carrying capac-ity, and has many similarities to any other large-scale plan for optimising the multiple uses of goods and services. A number of models of varying complexity have been developed to address system-scale issues over the past 15 years.
ASSESSMENT APPROACH
The approach used in SMILE combines fi eld data acquisition, experimental work on shellfi sh feeding behaviour, database and geographical information systems (GIS), and the implementation and coupling of various types of dynamic models. In this chapter the focus is on the development and coupling of dy-namic models, drawing on the spatial divisions described in the Spatial Domain chapter, and on models of individual growth described in the Shellfi sh chapter.
MODELS
The general modelling approach is shown in Figure 37.
This framework may be interpreted as a series of steps.
• Development of fi ne-scale circulation models for the loughs and adjoining shelf waters
• Use of such models to provide a detailed description of the coastal-lough
circulation, and to upscale processes in space and time for the development of
ecological models
• Application of GIS and databases for the defi nition of larger boxes, where detailed
ecological processes and shellfi sh growth will be simulated
• Development of models for individual growth of shellfi sh, capable of resolving different
aspects of feeding behaviour, such as the use of phytoplankton and organic detritus
• Combination of the various components into ecological models which simulate
processes over long periods, and thus allow predictions of multi-year system
carrying capacity for sustainable shellfi sh aquaculture, in equilibrium with other
ecosystem uses
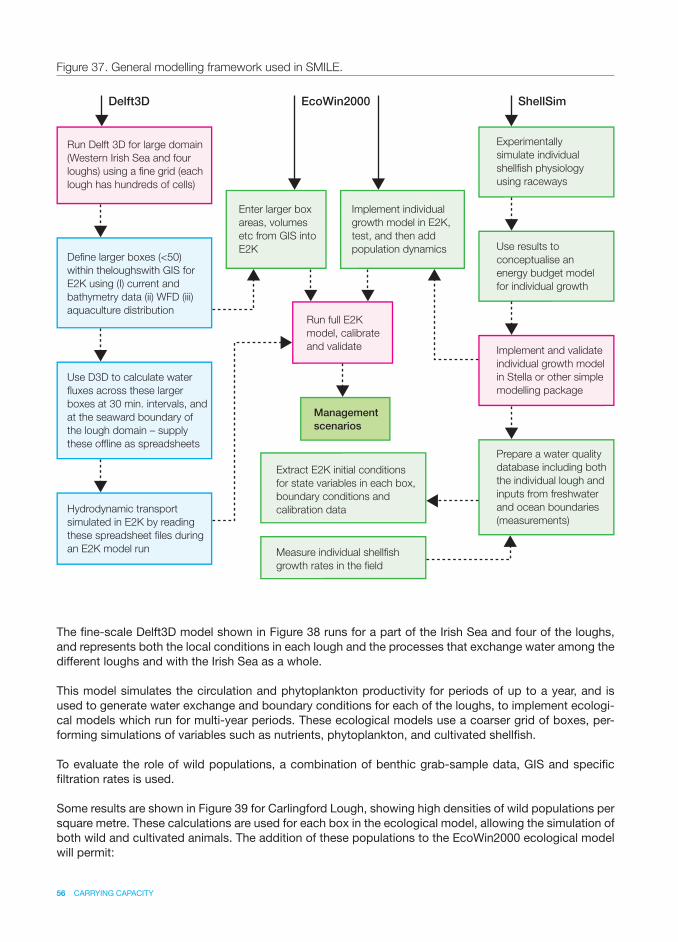
56 CARRYING CAPACITY
Figure 37. General modelling framework used in SMILE.
The fi ne-scale Delft3D model shown in Figure 38 runs for a part of the Irish Sea and four of the loughs, and represents both the local conditions in each lough and the processes that exchange water among the different loughs and with the Irish Sea as a whole.
This model simulates the circulation and phytoplankton productivity for periods of up to a year, and is used to generate water exchange and boundary conditions for each of the loughs, to implement ecologi-cal models which run for multi-year periods. These ecological models use a coarser grid of boxes, per-forming simulations of variables such as nutrients, phytoplankton, and cultivated shellfi sh.
To evaluate the role of wild populations, a combination of benthic grab-sample data, GIS and specifi c fi ltration rates is used.
Some results are shown in Figure 39 for Carlingford Lough, showing high densities of wild populations per square metre. These calculations are used for each box in the ecological model, allowing the simulation of both wild and cultivated animals. The addition of these populations to the EcoWin2000 ecological model will permit:
Run Delft 3D for large domain
(Western Irish Sea and four
loughs) using a fine grid (each
lough has hundreds of cells)
Define larger boxes (<50)
within theloughswith GIS for
E2K using (I) current and
bathymetry data (ii) WFD (iii)
aquaculture distribution
Use D3D to calculate water
fluxes across these larger
boxes at 30 min. intervals, and
at the seaward boundary of
the lough domain – supply
these offline as spreadsheets
Hydrodynamic transport
simulated in E2K by reading
these spreadsheet files during
an E2K model run
Enter larger box
areas, volumes
etc from GIS into
E2K
Implement individual
growth model in E2K,
test, and then add
population dynamics
Run full E2K
model, calibrate
and validate
Management
scenarios
Extract E2K initial conditions
for state variables in each box,
boundary conditions and
calibration data
Measure individual shellfish
growth rates in the field
Experimentally
simulate individual
shellfish physiology
using raceways
Use results to
conceptualise an
energy budget model
for individual growth
Implement and validate
individual growth model
in Stella or other simple
modelling package
Prepare a water quality
database including both
the individual lough and
inputs from freshwater
and ocean boundaries
(measurements)
ShellSimEcoWin2000Delft3D
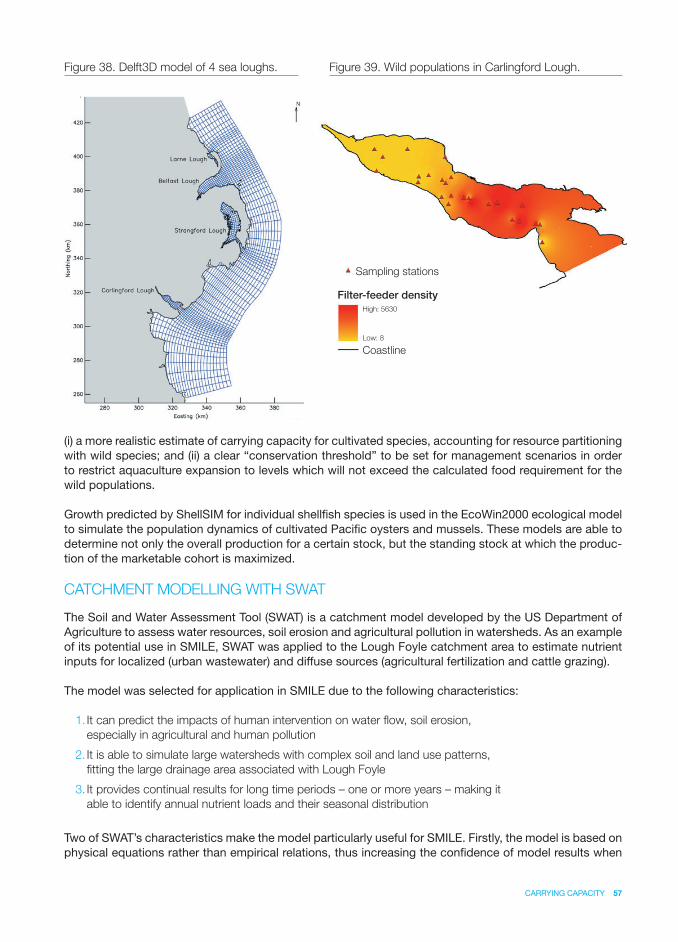
CARRYING CAPACITY 57
Figure 38. Delft3D model of 4 sea loughs.
(i) a more realistic estimate of carrying capacity for cultivated species, accounting for resource partitioning with wild species; and (ii) a clear “conservation threshold” to be set for management scenarios in order to restrict aquaculture expansion to levels which will not exceed the calculated food requirement for the wild populations.
Growth predicted by ShellSIM for individual shellfi sh species is used in the EcoWin2000 ecological model to simulate the population dynamics of cultivated Pacifi c oysters and mussels. These models are able to determine not only the overall production for a certain stock, but the standing stock at which the produc-tion of the marketable cohort is maximized.
CATCHMENT MODELLING WITH SWAT
The Soil and Water Assessment Tool (SWAT) is a catchment model developed by the US Department of Agriculture to assess water resources, soil erosion and agricultural pollution in watersheds. As an example of its potential use in SMILE, SWAT was applied to the Lough Foyle catchment area to estimate nutrient inputs for localized (urban wastewater) and diffuse sources (agricultural fertilization and cattle grazing).
The model was selected for application in SMILE due to the following characteristics:
1. It can predict the impacts of human intervention on water fl ow, soil erosion,
especially in agricultural and human pollution
2. It is able to simulate large watersheds with complex soil and land use patterns,
fi tting the large drainage area associated with Lough Foyle
3. It provides continual results for long time periods – one or more years – making it
able to identify annual nutrient loads and their seasonal distribution
Two of SWAT’s characteristics make the model particularly useful for SMILE. Firstly, the model is based on physical equations rather than empirical relations, thus increasing the confi dence of model results when
Figure 39. Wild populations in Carlingford Lough.
Sampling stations
High: 5630
Low: 8
Coastline
Filter-feeder density
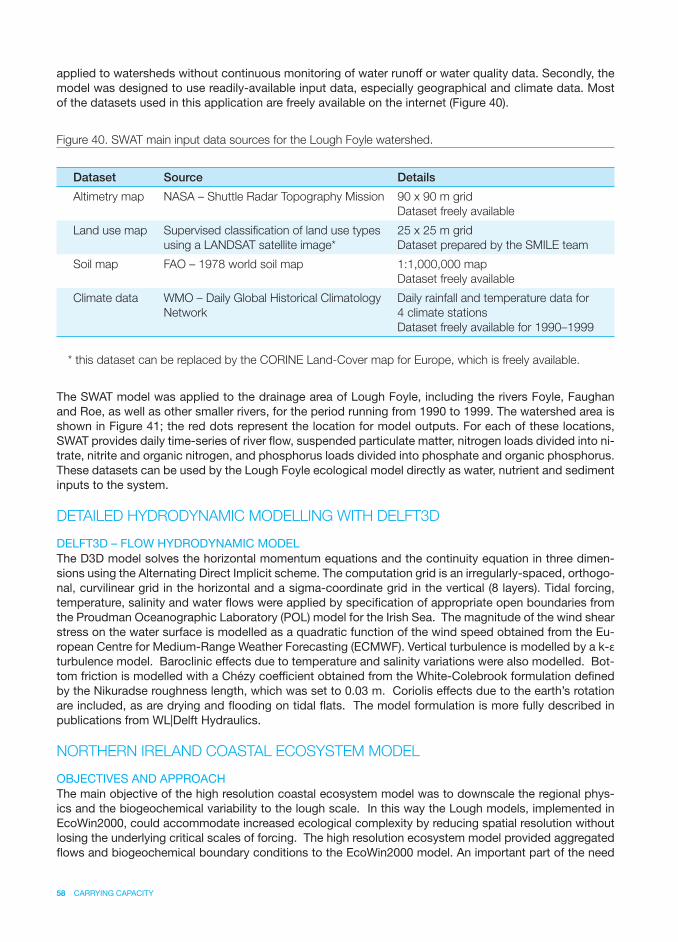
58 CARRYING CAPACITY
applied to watersheds without continuous monitoring of water runoff or water quality data. Secondly, the model was designed to use readily-available input data, especially geographical and climate data. Most of the datasets used in this application are freely available on the internet (Figure 40).
The SWAT model was applied to the drainage area of Lough Foyle, including the rivers Foyle, Faughan and Roe, as well as other smaller rivers, for the period running from 1990 to 1999. The watershed area is shown in Figure 41; the red dots represent the location for model outputs. For each of these locations, SWAT provides daily time-series of river fl ow, suspended particulate matter, nitrogen loads divided into ni-trate, nitrite and organic nitrogen, and phosphorus loads divided into phosphate and organic phosphorus. These datasets can be used by the Lough Foyle ecological model directly as water, nutrient and sediment inputs to the system.
DETAILED HYDRODYNAMIC MODELLING WITH DELFT3D
DELFT3D – FLOW HYDRODYNAMIC MODELThe D3D model solves the horizontal momentum equations and the continuity equation in three dimen-sions using the Alternating Direct Implicit scheme. The computation grid is an irregularly-spaced, orthogo-nal, curvilinear grid in the horizontal and a sigma-coordinate grid in the vertical (8 layers). Tidal forcing, temperature, salinity and water fl ows were applied by specifi cation of appropriate open boundaries from the Proudman Oceanographic Laboratory (POL) model for the Irish Sea. The magnitude of the wind shear stress on the water surface is modelled as a quadratic function of the wind speed obtained from the Eu-ropean Centre for Medium-Range Weather Forecasting (ECMWF). Vertical turbulence is modelled by a k-ε turbulence model. Baroclinic effects due to temperature and salinity variations were also modelled. Bot-tom friction is modelled with a Chézy coeffi cient obtained from the White-Colebrook formulation defi ned by the Nikuradse roughness length, which was set to 0.03 m. Coriolis effects due to the earth’s rotation are included, as are drying and fl ooding on tidal fl ats. The model formulation is more fully described in publications from WL|Delft Hydraulics.
NORTHERN IRELAND COASTAL ECOSYSTEM MODEL
OBJECTIVES AND APPROACHThe main objective of the high resolution coastal ecosystem model was to downscale the regional phys-ics and the biogeochemical variability to the lough scale. In this way the Lough models, implemented in EcoWin2000, could accommodate increased ecological complexity by reducing spatial resolution without losing the underlying critical scales of forcing. The high resolution ecosystem model provided aggregated fl ows and biogeochemical boundary conditions to the EcoWin2000 model. An important part of the need
Dataset Source Details
Altimetry map NASA – Shuttle Radar Topography Mission 90 x 90 m grid
Dataset freely available
Land use map Supervised classifi cation of land use types
using a LANDSAT satellite image*
25 x 25 m grid
Dataset prepared by the SMILE team
Soil map FAO – 1978 world soil map 1:1,000,000 map
Dataset freely available
Climate data WMO – Daily Global Historical Climatology
Network
Daily rainfall and temperature data for
4 climate stations
Dataset freely available for 1990–1999
Figure 40. SWAT main input data sources for the Lough Foyle watershed.
* this dataset can be replaced by the CORINE Land-Cover map for Europe, which is freely available.
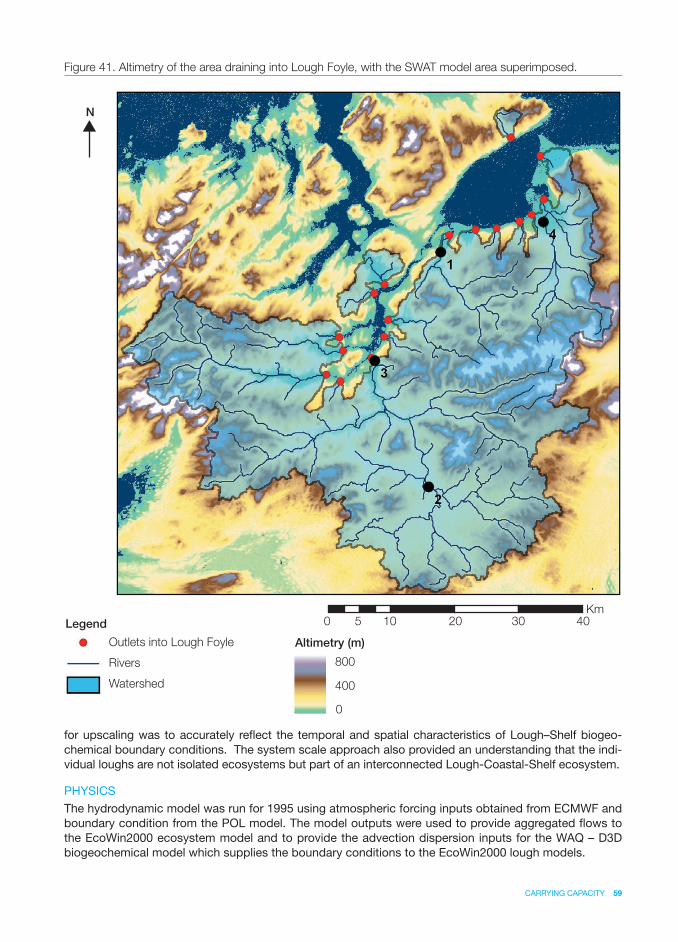
CARRYING CAPACITY 59
Legend
Outlets into Lough Foyle
Rivers
Watershed
800
400
0
0 5 10 20 30 40Km
Altimetry (m)
N
Figure 41. Altimetry of the area draining into Lough Foyle, with the SWAT model area superimposed.
for upscaling was to accurately refl ect the temporal and spatial characteristics of Lough–Shelf biogeo-chemical boundary conditions. The system scale approach also provided an understanding that the indi-vidual loughs are not isolated ecosystems but part of an interconnected Lough-Coastal-Shelf ecosystem.
PHYSICS
The hydrodynamic model was run for 1995 using atmospheric forcing inputs obtained from ECMWF and boundary condition from the POL model. The model outputs were used to provide aggregated fl ows to the EcoWin2000 ecosystem model and to provide the advection dispersion inputs for the WAQ – D3D biogeochemical model which supplies the boundary conditions to the EcoWin2000 lough models.
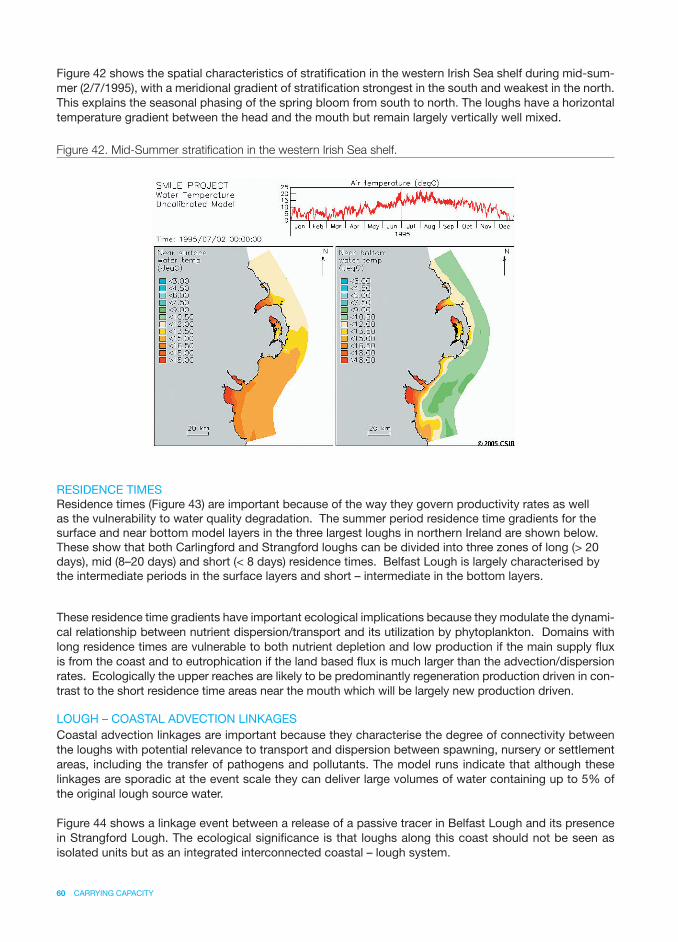
60 CARRYING CAPACITY
Figure 42 shows the spatial characteristics of stratifi cation in the western Irish Sea shelf during mid-sum-mer (2/7/1995), with a meridional gradient of stratifi cation strongest in the south and weakest in the north. This explains the seasonal phasing of the spring bloom from south to north. The loughs have a horizontal temperature gradient between the head and the mouth but remain largely vertically well mixed.
RESIDENCE TIMESResidence times (Figure 43) are important because of the way they govern productivity rates as well as the vulnerability to water quality degradation. The summer period residence time gradients for the surface and near bottom model layers in the three largest loughs in northern Ireland are shown below. These show that both Carlingford and Strangford loughs can be divided into three zones of long (> 20 days), mid (8–20 days) and short (< 8 days) residence times. Belfast Lough is largely characterised by the intermediate periods in the surface layers and short – intermediate in the bottom layers.
These residence time gradients have important ecological implications because they modulate the dynami-cal relationship between nutrient dispersion/transport and its utilization by phytoplankton. Domains with long residence times are vulnerable to both nutrient depletion and low production if the main supply fl ux is from the coast and to eutrophication if the land based fl ux is much larger than the advection/dispersion rates. Ecologically the upper reaches are likely to be predominantly regeneration production driven in con-trast to the short residence time areas near the mouth which will be largely new production driven.
LOUGH – COASTAL ADVECTION LINKAGESCoastal advection linkages are important because they characterise the degree of connectivity between the loughs with potential relevance to transport and dispersion between spawning, nursery or settlement areas, including the transfer of pathogens and pollutants. The model runs indicate that although these linkages are sporadic at the event scale they can deliver large volumes of water containing up to 5% of the original lough source water.
Figure 44 shows a linkage event between a release of a passive tracer in Belfast Lough and its presence in Strangford Lough. The ecological signifi cance is that loughs along this coast should not be seen as isolated units but as an integrated interconnected coastal – lough system.
Figure 42. Mid-Summer stratifi cation in the western Irish Sea shelf.
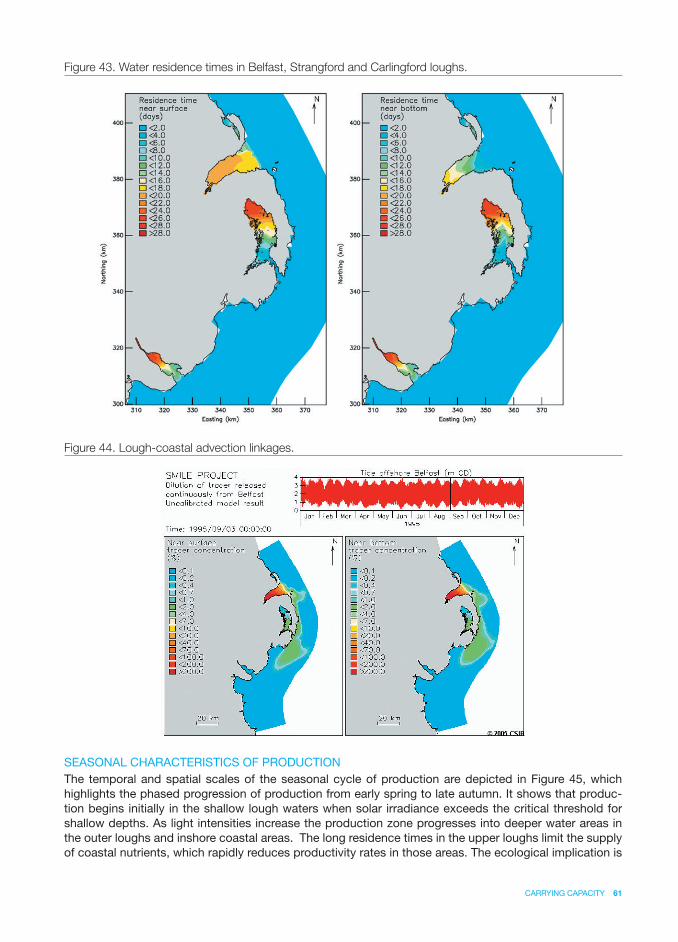
CARRYING CAPACITY 61
Figure 43. Water residence times in Belfast, Strangford and Carlingford loughs.
Figure 44. Lough-coastal advection linkages.
SEASONAL CHARACTERISTICS OF PRODUCTIONThe temporal and spatial scales of the seasonal cycle of production are depicted in Figure 45, which highlights the phased progression of production from early spring to late autumn. It shows that produc-tion begins initially in the shallow lough waters when solar irradiance exceeds the critical threshold for shallow depths. As light intensities increase the production zone progresses into deeper water areas in the outer loughs and inshore coastal areas. The long residence times in the upper loughs limit the supply of coastal nutrients, which rapidly reduces productivity rates in those areas. The ecological implication is
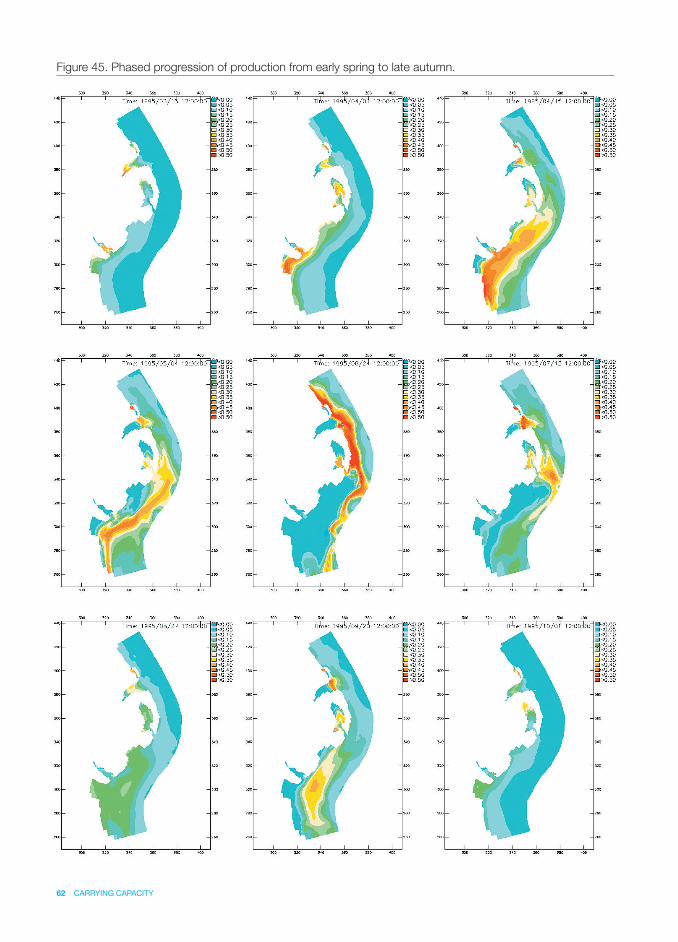
62 CARRYING CAPACITY
Figure 45. Phased progression of production from early spring to late autumn.
CARRYING CAPACITY 63
that, in the absence of signifi cant land inputs, the upper lough zone may shift to a regenerated production mode. Surface warming and the relatively sluggish circulation in the shallow southern shelf stabilize the surface layer leading to the onset of the early spring bloom by mid-April. Further warming, partly linked to the development of the summer-stratifi ed region, is required to stabilise the surface layer in the deeper central shelf zone.
This progressively phases the spring/summer bloom to the central region in May and the northern shelf in June. The spring/summer phasing is inverted during the summer/autumn period as the production peak shifts southwards, moves into shallower regions and fi nally into the upper lough zones.
The ecological importance of this phasing is that it results in a longer production season in the south than in the northern zone. This increases the importance of shallow water production in the lower reaches of the northern loughs. The spatial and temporal phasing of the seasonal production highlights the impor-tance and need to take the system approach adopted in SMILE for the boundary conditions of the loughs. These boundary conditions vary at the advective event and seasonal scales, such that the system scale approach ensures sensitivity to this cross scalar variability.
LARGE-SCALE MODELLING WITH ECOWIN2000
EcoWin2000 (E2K) is an ecological model that provides a platform for integration of the various other models, and adds functionality of its own. This model has been developed over the last 15 years, and although it can be used to run short-term simulations, in the past fi ve years it has mainly been used to run multi-year models.
EcoWin2000 typically divides coastal systems into (less than one hundred) boxes, which may be struc-tured in one, two or three dimensions, and performs simulations at the system scale. It is not an appro-priate tool for looking at effects at the farm scale. Other tools such as the Farm Aquaculture Resource Management (FARMTM – http://www.farmscale.org) are tailored to smaller scale processes, and may be driven by measured data or by outputs of models such as Delft3D or EcoWin2000 (see Case Study 2 in the Management Recommendations chapter).
Figure 46 shows an abridged list of state variables used in the SMILE models. The full model runs with eight different objects, containing a total of 20 forcing functions and 82 state variables. EcoWin2000 simu-lates one year in about one minute.
Two different approaches were used:
1. Lough Foyle was simulated by means of a combined approach using SWAT
and E2K, where river fl ows, nutrient loads and solid discharge were obtained as
described previously, and a one-dimensional application of E2K was made to the
lough. Lough Foyle was divided longitudinally into four boxes (see Figure 26 in the
Spatial Domain chapter). The hydrodynamics of the lough were simulated using
an advection-dispersion model calibrated on salinity.
2. The other four systems were simulated as 3-D models, using offl ine coupling
between the D3D model and E2K, as detailed previously.
A simpler approach was chosen for Lough Foyle and Larne Lough, partly due to project timing and bud-get constraints, partly due to a reduced information base for these systems, but equally to optimise the cost-benefi t of testing the methodology on three systems in order to establish its merits. The simpler hydrodynamic modelling approach used in the Foyle was initially also to be applied to Larne Lough, but the use of the D3D model for part of the Irish Sea shelf enabled the 3D approach to be used for Larne, albeit as a demonstration of the potential of this work, visible in the implementation for Belfast, Strangford and Carlingford.
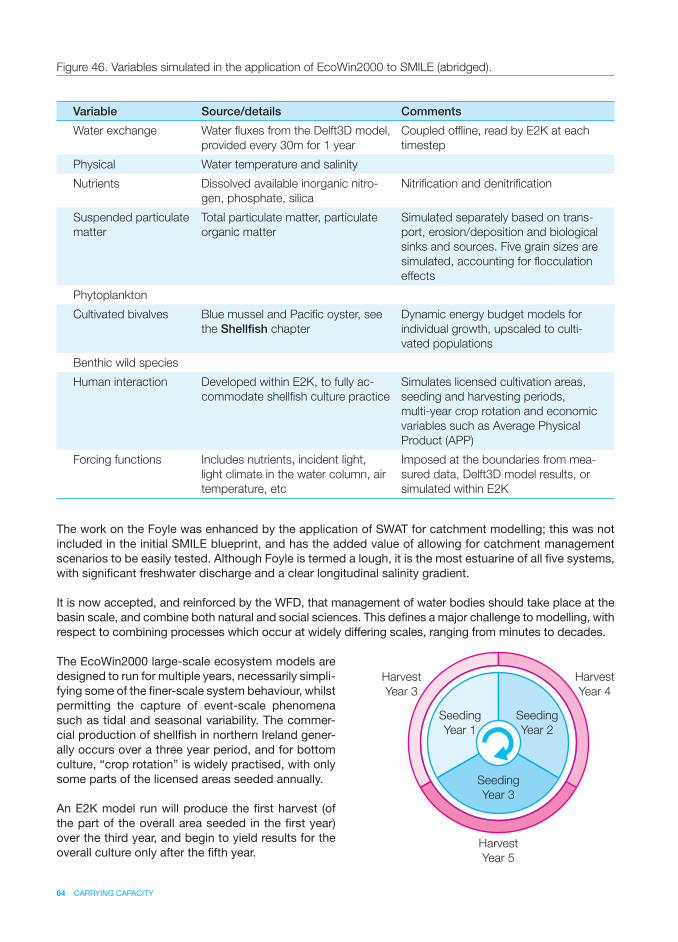
64 CARRYING CAPACITY
Variable Source/details Comments
Water exchange Water fl uxes from the Delft3D model,
provided every 30m for 1 year
Coupled offl ine, read by E2K at each
timestep
Physical Water temperature and salinity
Nutrients Dissolved available inorganic nitro-
gen, phosphate, silica
Nitrifi cation and denitrifi cation
Suspended particulate
matter
Total particulate matter, particulate
organic matter
Simulated separately based on trans-
port, erosion/deposition and biological
sinks and sources. Five grain sizes are
simulated, accounting for fl occulation
effects
Phytoplankton
Cultivated bivalves Blue mussel and Pacifi c oyster, see
the Shellfi sh chapter
Dynamic energy budget models for
individual growth, upscaled to culti-
vated populations
Benthic wild species
Human interaction Developed within E2K, to fully ac-
commodate shellfi sh culture practice
Simulates licensed cultivation areas,
seeding and harvesting periods,
multi-year crop rotation and economic
variables such as Average Physical
Product (APP)
Forcing functions Includes nutrients, incident light,
light climate in the water column, air
temperature, etc
Imposed at the boundaries from mea-
sured data, Delft3D model results, or
simulated within E2K
The work on the Foyle was enhanced by the application of SWAT for catchment modelling; this was not included in the initial SMILE blueprint, and has the added value of allowing for catchment management scenarios to be easily tested. Although Foyle is termed a lough, it is the most estuarine of all fi ve systems, with signifi cant freshwater discharge and a clear longitudinal salinity gradient.
It is now accepted, and reinforced by the WFD, that management of water bodies should take place at the basin scale, and combine both natural and social sciences. This defi nes a major challenge to modelling, with respect to combining processes which occur at widely differing scales, ranging from minutes to decades.
The EcoWin2000 large-scale ecosystem models are designed to run for multiple years, necessarily simpli-fying some of the fi ner-scale system behaviour, whilst permitting the capture of event-scale phenomena such as tidal and seasonal variability. The commer-cial production of shellfi sh in northern Ireland gener-ally occurs over a three year period, and for bottom culture, “crop rotation” is widely practised, with only some parts of the licensed areas seeded annually.
An E2K model run will produce the fi rst harvest (of the part of the overall area seeded in the fi rst year) over the third year, and begin to yield results for the overall culture only after the fi fth year.
Figure 46. Variables simulated in the application of EcoWin2000 to SMILE (abridged).
Seeding
Year 1
Harvest
Year 3
Harvest
Year 4
Harvest
Year 5
Seeding
Year 2
Seeding
Year 3
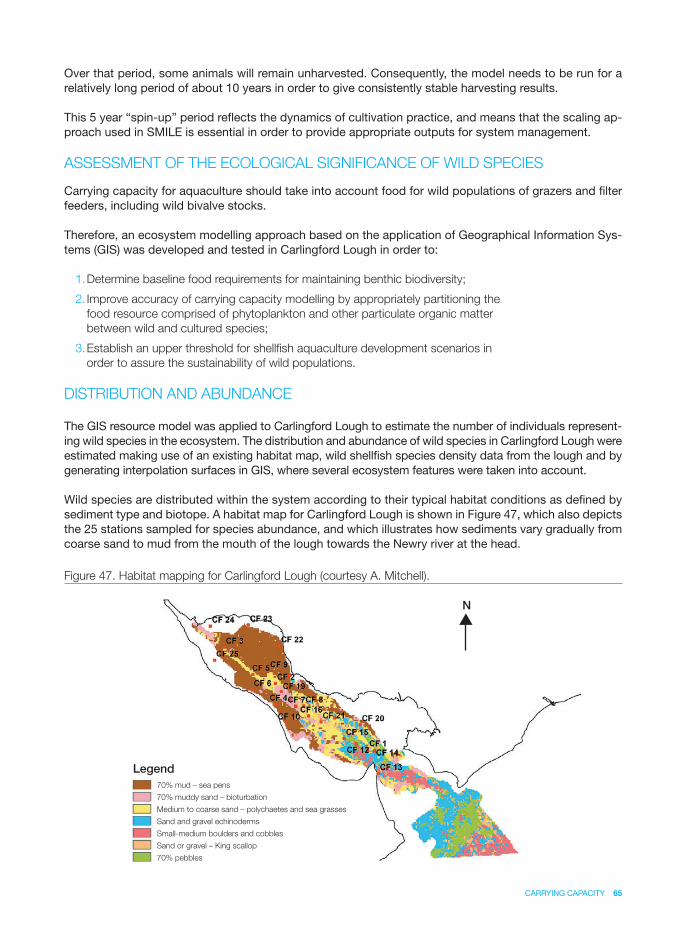
CARRYING CAPACITY 65
Over that period, some animals will remain unharvested. Consequently, the model needs to be run for a relatively long period of about 10 years in order to give consistently stable harvesting results.
This 5 year “spin-up” period refl ects the dynamics of cultivation practice, and means that the scaling ap-proach used in SMILE is essential in order to provide appropriate outputs for system management.
ASSESSMENT OF THE ECOLOGICAL SIGNIFICANCE OF WILD SPECIES
Carrying capacity for aquaculture should take into account food for wild populations of grazers and fi lter feeders, including wild bivalve stocks.
Therefore, an ecosystem modelling approach based on the application of Geographical Information Sys-tems (GIS) was developed and tested in Carlingford Lough in order to:
1. Determine baseline food requirements for maintaining benthic biodiversity;
2. Improve accuracy of carrying capacity modelling by appropriately partitioning the
food resource comprised of phytoplankton and other particulate organic matter
between wild and cultured species;
3. Establish an upper threshold for shellfi sh aquaculture development scenarios in
order to assure the sustainability of wild populations.
DISTRIBUTION AND ABUNDANCE
The GIS resource model was applied to Carlingford Lough to estimate the number of individuals represent-ing wild species in the ecosystem. The distribution and abundance of wild species in Carlingford Lough were estimated making use of an existing habitat map, wild shellfi sh species density data from the lough and by generating interpolation surfaces in GIS, where several ecosystem features were taken into account.
Wild species are distributed within the system according to their typical habitat conditions as defi ned by sediment type and biotope. A habitat map for Carlingford Lough is shown in Figure 47, which also depicts the 25 stations sampled for species abundance, and which illustrates how sediments vary gradually from coarse sand to mud from the mouth of the lough towards the Newry river at the head.
Figure 47. Habitat mapping for Carlingford Lough (courtesy A. Mitchell).
Legend
70% mud – sea pens
70% pebbles
70% muddy sand – bioturbation
Medium to coarse sand – polychaetes and sea grasses
Sand and gravel echinoderms
Sand or gravel – King scallop
Small-medium boulders and cobbles
N
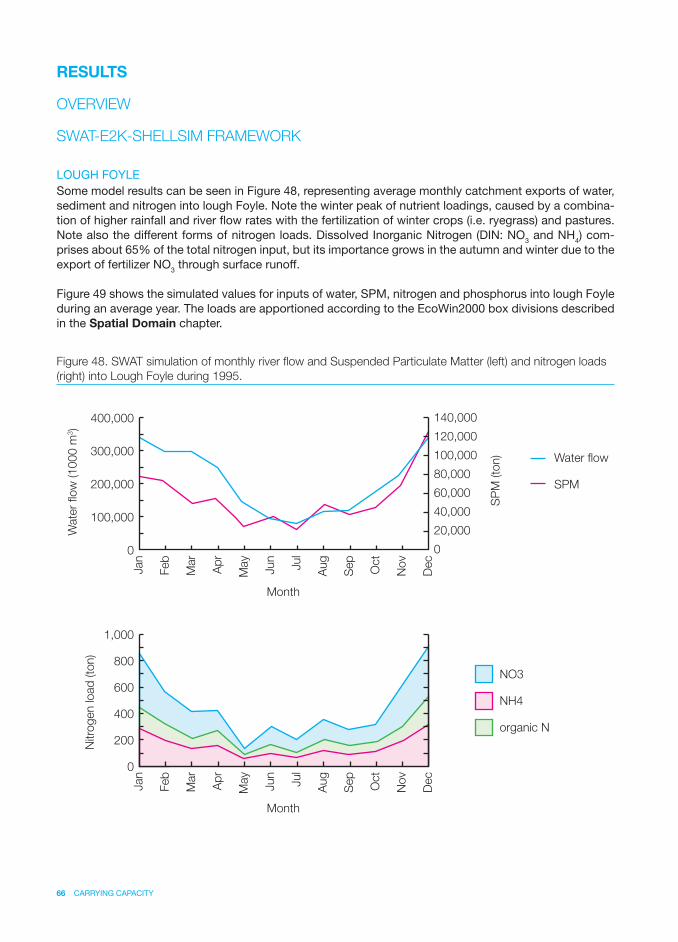
66 CARRYING CAPACITY
RESULTS
OVERVIEW
SWAT-E2K-SHELLSIM FRAMEWORK
LOUGH FOYLESome model results can be seen in Figure 48, representing average monthly catchment exports of water, sediment and nitrogen into lough Foyle. Note the winter peak of nutrient loadings, caused by a combina-tion of higher rainfall and river fl ow rates with the fertilization of winter crops (i.e. ryegrass) and pastures. Note also the different forms of nitrogen loads. Dissolved Inorganic Nitrogen (DIN: NO3 and NH4) com-prises about 65% of the total nitrogen input, but its importance grows in the autumn and winter due to the export of fertilizer NO3 through surface runoff.
Figure 49 shows the simulated values for inputs of water, SPM, nitrogen and phosphorus into lough Foyle during an average year. The loads are apportioned according to the EcoWin2000 box divisions described in the Spatial Domain chapter.
Figure 48. SWAT simulation of monthly river fl ow and Suspended Particulate Matter (left) and nitrogen loads
(right) into Lough Foyle during 1995.
0
200,000
100,00020,000
40,000
60,000
80,000
100,000
120,000
140,000
0
300,000
400,000
Month
Jan
Feb
Mar
Ap
r
May
Jun
Jul
Aug
Sep
Oct
Nov
Dec
Wate
r flo
w (1000 m
3)
SP
M (to
n) Water flow
SPM
0
400
200
600
800
1,000
Month
Jan
Feb
Mar
Ap
r
May
Jun
Jul
Aug
Sep
Oct
Nov
Dec
Nitro
gen load
(to
n)
NO3
NH4
organic N
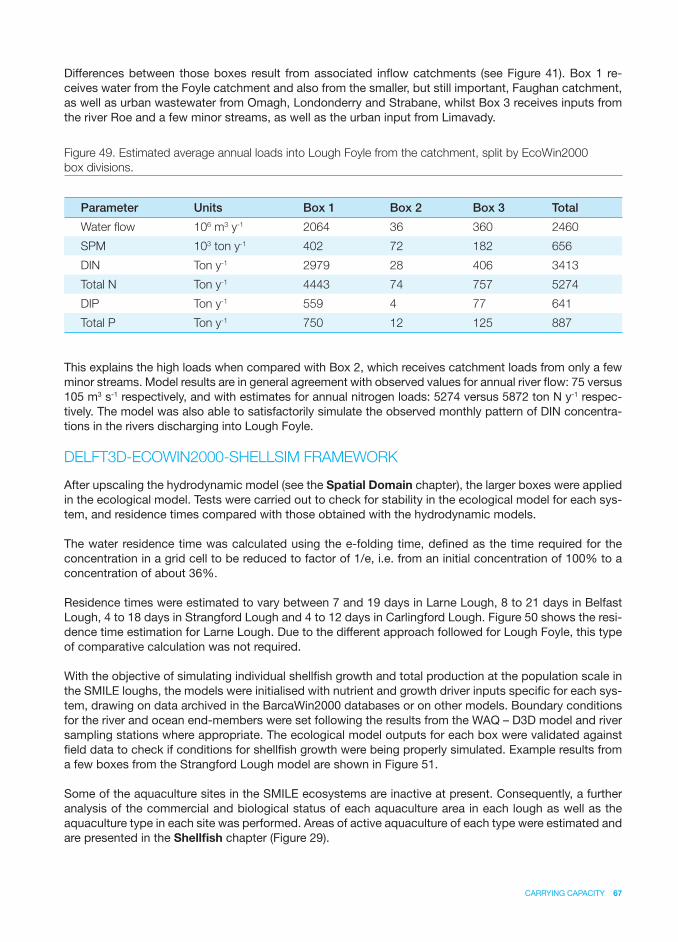
CARRYING CAPACITY 67
Differences between those boxes result from associated infl ow catchments (see Figure 41). Box 1 re-ceives water from the Foyle catchment and also from the smaller, but still important, Faughan catchment, as well as urban wastewater from Omagh, Londonderry and Strabane, whilst Box 3 receives inputs from the river Roe and a few minor streams, as well as the urban input from Limavady.
This explains the high loads when compared with Box 2, which receives catchment loads from only a few minor streams. Model results are in general agreement with observed values for annual river fl ow: 75 versus 105 m3 s-1 respectively, and with estimates for annual nitrogen loads: 5274 versus 5872 ton N y-1 respec-tively. The model was also able to satisfactorily simulate the observed monthly pattern of DIN concentra-tions in the rivers discharging into Lough Foyle.
DELFT3D-ECOWIN2000-SHELLSIM FRAMEWORK
After upscaling the hydrodynamic model (see the Spatial Domain chapter), the larger boxes were applied in the ecological model. Tests were carried out to check for stability in the ecological model for each sys-tem, and residence times compared with those obtained with the hydrodynamic models.
The water residence time was calculated using the e-folding time, defi ned as the time required for the concentration in a grid cell to be reduced to factor of 1/e, i.e. from an initial concentration of 100% to a concentration of about 36%.
Residence times were estimated to vary between 7 and 19 days in Larne Lough, 8 to 21 days in Belfast Lough, 4 to 18 days in Strangford Lough and 4 to 12 days in Carlingford Lough. Figure 50 shows the resi-dence time estimation for Larne Lough. Due to the different approach followed for Lough Foyle, this type of comparative calculation was not required.
With the objective of simulating individual shellfi sh growth and total production at the population scale in the SMILE loughs, the models were initialised with nutrient and growth driver inputs specifi c for each sys-tem, drawing on data archived in the BarcaWin2000 databases or on other models. Boundary conditions for the river and ocean end-members were set following the results from the WAQ – D3D model and river sampling stations where appropriate. The ecological model outputs for each box were validated against fi eld data to check if conditions for shellfi sh growth were being properly simulated. Example results from a few boxes from the Strangford Lough model are shown in Figure 51.
Some of the aquaculture sites in the SMILE ecosystems are inactive at present. Consequently, a further analysis of the commercial and biological status of each aquaculture area in each lough as well as the aquaculture type in each site was performed. Areas of active aquaculture of each type were estimated and are presented in the Shellfi sh chapter (Figure 29).
Figure 49. Estimated average annual loads into Lough Foyle from the catchment, split by EcoWin2000
box divisions.
Parameter Units Box 1 Box 2 Box 3 Total
Water fl ow 106 m3 y-1 2064 36 360 2460
SPM 103 ton y-1 402 72 182 656
DIN Ton y-1 2979 28 406 3413
Total N Ton y-1 4443 74 757 5274
DIP Ton y-1 559 4 77 641
Total P Ton y-1 750 12 125 887
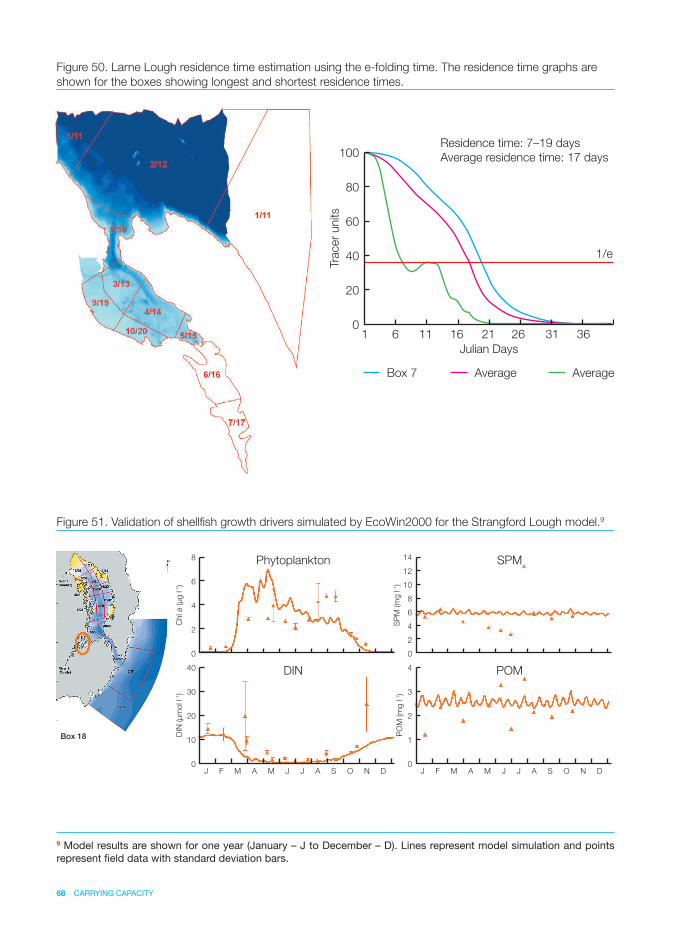
68 CARRYING CAPACITY
Figure 50. Larne Lough residence time estimation using the e-folding time. The residence time graphs are
shown for the boxes showing longest and shortest residence times.
Figure 51. Validation of shellfi sh growth drivers simulated by EcoWin2000 for the Strangford Lough model.9
9 Model results are shown for one year (January – J to December – D). Lines represent model simulation and points represent fi eld data with standard deviation bars.
Box 7 Average Average
Residence time: 7–19 days
Average residence time: 17 days
0
20
60
80
40
100
61 11 16 21 26 31 36Tra
cer
units
1/e
Julian Days
Box 18
DIN
Phytoplankton
0
2
6
8
4
0
10
30
40
20
DIN
(μm
ol l-1
)C
hl a
(μg l
-1)
J F M A M J J A S O N D
POM
SPM
0
2
6
8
10
12
14
4
0
1
3
4
2
PO
M (m
g l
-1)
SP
M (m
g l
-1)
J F M A M J J A S O N D
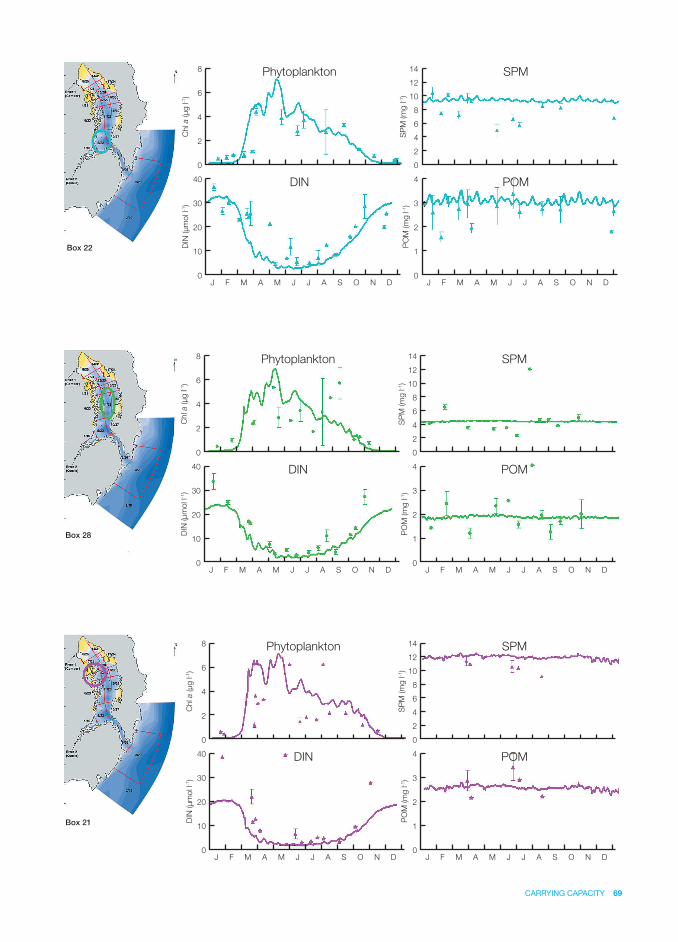
CARRYING CAPACITY 69
Box 22
DIN
Phytoplankton
0
2
6
8
4
0
10
30
40
20
DIN
(μm
ol l-1
)C
hl a
(μg l
-1)
J F M A M J J A S O N D
POM
SPM
0
2
6
8
10
12
14
4
0
1
3
4
2
PO
M (m
g l
-1)
SP
M (m
g l
-1)
J F M A M J J A S O N D
Box 28
DIN
Phytoplankton
0
2
6
8
4
0
10
30
40
20
DIN
(μm
ol l-1
)C
hl a
(μg l
-1)
J F M A M J J A S O N D
POM
SPM
0
2
6
8
10
12
14
4
0
1
3
4
2
PO
M (m
g l
-1)
SP
M (m
g l
-1)
J F M A M J J A S O N D
Box 21
DIN
Phytoplankton
0
2
6
8
4
0
10
30
40
20
DIN
(μm
ol l-1
)C
hl a
(μg l
-1)
J F M A M J J A S O N D
POM
SPM
0
2
6
8
10
12
14
4
0
1
3
4
2
PO
M (m
g l
-1)
SP
M (m
g l
-1)
J F M A M J J A S O N D
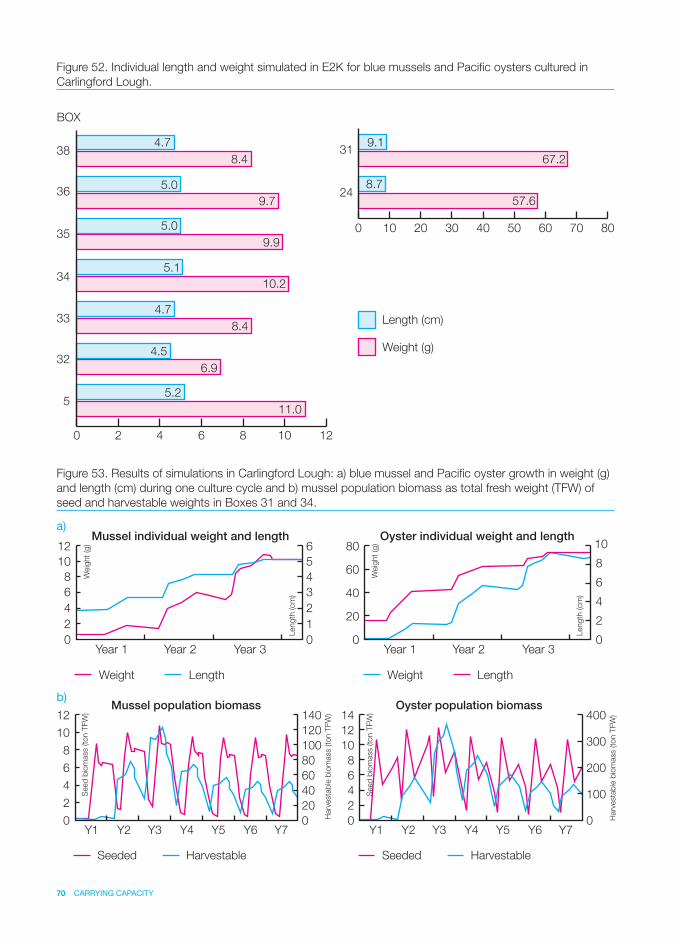
70 CARRYING CAPACITY
Figure 52. Individual length and weight simulated in E2K for blue mussels and Pacifi c oysters cultured in
Carlingford Lough.
Figure 53. Results of simulations in Carlingford Lough: a) blue mussel and Pacifi c oyster growth in weight (g)
and length (cm) during one culture cycle and b) mussel population biomass as total fresh weight (TFW) of
seed and harvestable weights in Boxes 31 and 34.
Weight
Weig
ht
(g)
Harv
esta
ble
bio
mass (to
n T
FW
)
Harv
esta
ble
bio
mass (to
n T
FW
)
Length
(cm
)
Length
(cm
)
Weig
ht
(g)
Length
Mussel individual weight and length
0
2
4
6
8
10
12
0
1
2
3
4
5
6
Year 1 Year 2 Year 3
Seeded Harvestable
Mussel population biomass
0
2
4
6
8
10
12
0
20
40
60
80
100
140
120
Y1 Y2 Y3 Y4 Y5 Y6 Y7
Seeded Harvestable
Oyster population biomass
0
2
4
6
8
10
12
14
0
100
200
300
400
Y1 Y2 Y3 Y4 Y5 Y6 Y7
Weight Length
Oyster individual weight and length
0
20
40
60
80
0
2
4
6
8
10
Year 1 Year 2 Year 3
Seed
bio
mass (to
n T
FW
)
Seed
bio
mass (to
n T
FW
)
a)
b)
0 2 4 6 8 10 12
0 10 20 30 40 50 60 70 80
BOX
384.7 9.1
67.2
8.7
57.6
8.4
5.0
9.7
5.0
9.9
5.1
10.2
4.7
8.4
4.5
6.9
5.2
11.0
31
2436
35
34
33
32
5
Length (cm)
Weight (g)
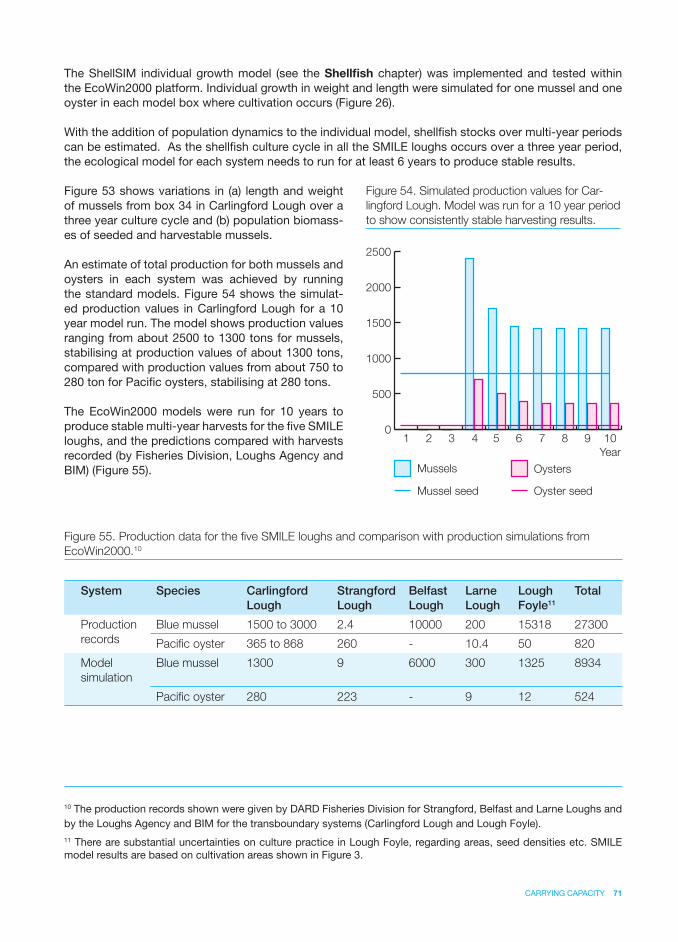
CARRYING CAPACITY 71
The ShellSIM individual growth model (see the Shellfi sh chapter) was implemented and tested within the EcoWin2000 platform. Individual growth in weight and length were simulated for one mussel and one oyster in each model box where cultivation occurs (Figure 26).
With the addition of population dynamics to the individual model, shellfi sh stocks over multi-year periods can be estimated. As the shellfi sh culture cycle in all the SMILE loughs occurs over a three year period, the ecological model for each system needs to run for at least 6 years to produce stable results.
Figure 53 shows variations in (a) length and weight of mussels from box 34 in Carlingford Lough over a three year culture cycle and (b) population biomass-es of seeded and harvestable mussels.
An estimate of total production for both mussels and oysters in each system was achieved by running the standard models. Figure 54 shows the simulat-ed production values in Carlingford Lough for a 10 year model run. The model shows production values ranging from about 2500 to 1300 tons for mussels, stabilising at production values of about 1300 tons, compared with production values from about 750 to 280 ton for Pacifi c oysters, stabilising at 280 tons.
The EcoWin2000 models were run for 10 years to produce stable multi-year harvests for the fi ve SMILE loughs, and the predictions compared with harvests recorded (by Fisheries Division, Loughs Agency and BIM) (Figure 55).
0
500
1000
1500
2000
2500
1 2 3 4 5 6 7 8 9 10
Year
Mussels
Mussel seed
Oysters
Oyster seed
Figure 54. Simulated production values for Car-
lingford Lough. Model was run for a 10 year period
to show consistently stable harvesting results.
Figure 55. Production data for the fi ve SMILE loughs and comparison with production simulations from
EcoWin2000.10
System Species Carlingford
Lough
Strangford
Lough
Belfast
Lough
Larne
Lough
Lough
Foyle11
Total
Production
records
Blue mussel 1500 to 3000 2.4 10000 200 15318 27300
Pacifi c oyster 365 to 868 260 - 10.4 50 820
Model
simulation
Blue mussel 1300 9 6000 300 1325 8934
Pacifi c oyster 280 223 - 9 12 524
10 The production records shown were given by DARD Fisheries Division for Strangford, Belfast and Larne Loughs and by the Loughs Agency and BIM for the transboundary systems (Carlingford Lough and Lough Foyle).11 There are substantial uncertainties on culture practice in Lough Foyle, regarding areas, seed densities etc. SMILE model results are based on cultivation areas shown in Figure 3.
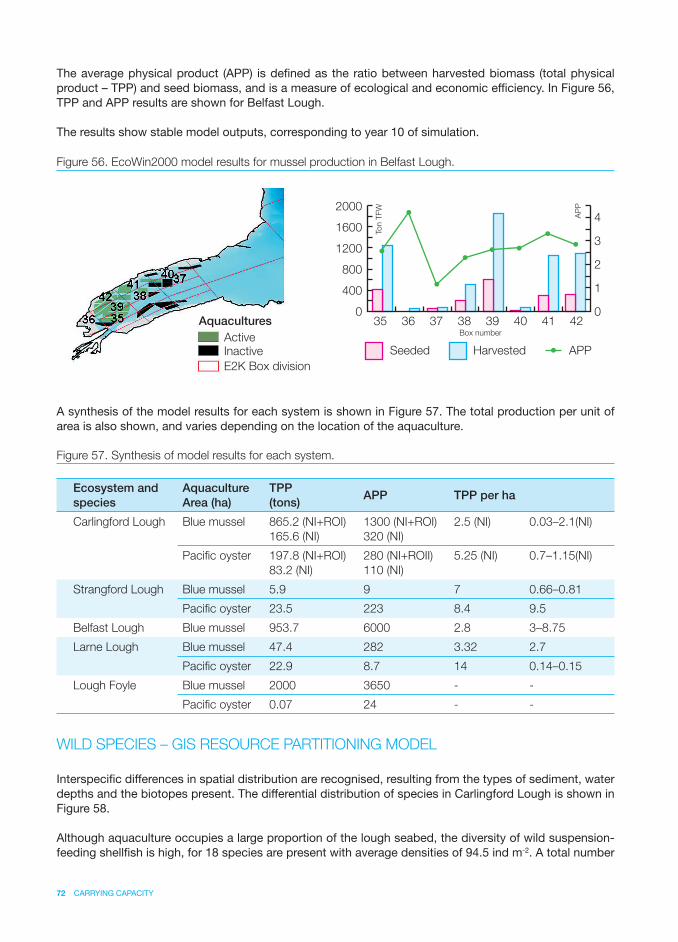
72 CARRYING CAPACITY
The average physical product (APP) is defi ned as the ratio between harvested biomass (total physical product – TPP) and seed biomass, and is a measure of ecological and economic effi ciency. In Figure 56, TPP and APP results are shown for Belfast Lough.
The results show stable model outputs, corresponding to year 10 of simulation.
A synthesis of the model results for each system is shown in Figure 57. The total production per unit of area is also shown, and varies depending on the location of the aquaculture.
WILD SPECIES – GIS RESOURCE PARTITIONING MODEL
Interspecifi c differences in spatial distribution are recognised, resulting from the types of sediment, water depths and the biotopes present. The differential distribution of species in Carlingford Lough is shown in Figure 58.
Although aquaculture occupies a large proportion of the lough seabed, the diversity of wild suspension-feeding shellfi sh is high, for 18 species are present with average densities of 94.5 ind m-2. A total number
Figure 56. EcoWin2000 model results for mussel production in Belfast Lough.
Figure 57. Synthesis of model results for each system.
Ecosystem and
species
Aquaculture
Area (ha)
TPP
(tons)APP TPP per ha
Carlingford Lough Blue mussel 865.2 (NI+ROI)
165.6 (NI)
1300 (NI+ROI)
320 (NI)
2.5 (NI) 0.03–2.1(NI)
Pacifi c oyster 197.8 (NI+ROI)
83.2 (NI)
280 (NI+ROII)
110 (NI)
5.25 (NI) 0.7–1.15(NI)
Strangford Lough Blue mussel 5.9 9 7 0.66–0.81
Pacifi c oyster 23.5 223 8.4 9.5
Belfast Lough Blue mussel 953.7 6000 2.8 3–8.75
Larne Lough Blue mussel 47.4 282 3.32 2.7
Pacifi c oyster 22.9 8.7 14 0.14–0.15
Lough Foyle Blue mussel 2000 3650 - -
Pacifi c oyster 0.07 24 - -
Aquacultures
Active
Inactive
E2K Box division
AP
P
Seeded Harvested APP
0
400
800
1200
1600
2000
0
1
2
3
4
35 36 37 38 39 40 41 42
Ton T
FW
Box number
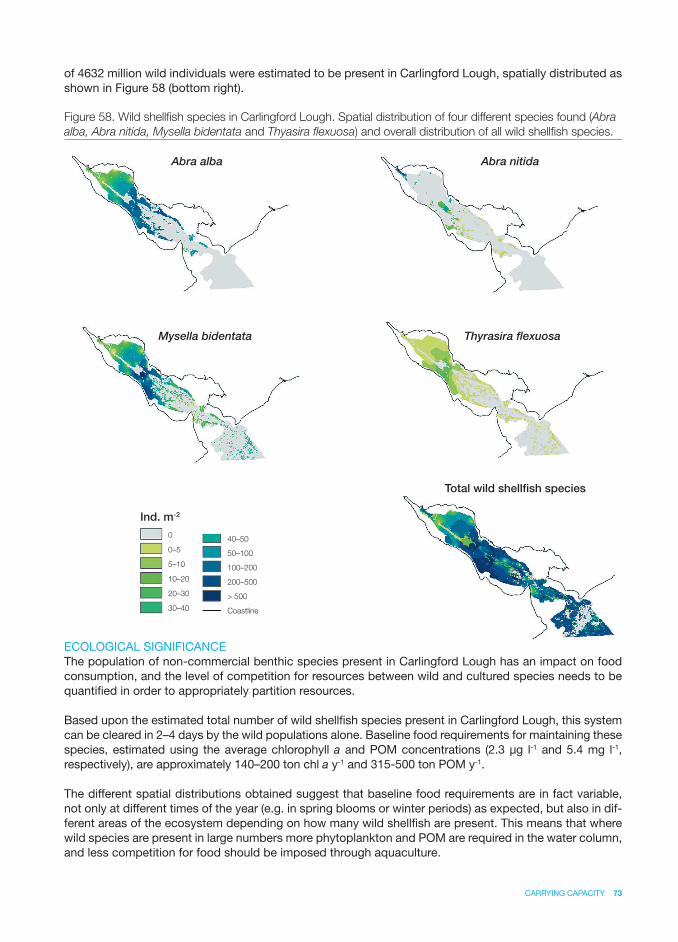
CARRYING CAPACITY 73
Abra alba
Mysella bidentata Thyrasira flexuosa
Total wild shellfish species
Ind. m-2
Abra nitida
0
0–5
5–10
10–20
20–30
30–40
40–50
50–100
100–200
200–500
> 500
Coastline
of 4632 million wild individuals were estimated to be present in Carlingford Lough, spatially distributed as shown in Figure 58 (bottom right).
ECOLOGICAL SIGNIFICANCEThe population of non-commercial benthic species present in Carlingford Lough has an impact on food consumption, and the level of competition for resources between wild and cultured species needs to be quantifi ed in order to appropriately partition resources.
Based upon the estimated total number of wild shellfi sh species present in Carlingford Lough, this system can be cleared in 2–4 days by the wild populations alone. Baseline food requirements for maintaining these species, estimated using the average chlorophyll a and POM concentrations (2.3 μg l-1 and 5.4 mg l-1, respectively), are approximately 140–200 ton chl a y-1 and 315-500 ton POM y-1.
The different spatial distributions obtained suggest that baseline food requirements are in fact variable, not only at different times of the year (e.g. in spring blooms or winter periods) as expected, but also in dif-ferent areas of the ecosystem depending on how many wild shellfi sh are present. This means that where wild species are present in large numbers more phytoplankton and POM are required in the water column, and less competition for food should be imposed through aquaculture.
Figure 58. Wild shellfi sh species in Carlingford Lough. Spatial distribution of four different species found (Abra
alba, Abra nitida, Mysella bidentata and Thyasira fl exuosa) and overall distribution of all wild shellfi sh species.
The high number of at least 18 suspension-feeding shellfi sh species within Carlingford Lough suggests that competition for food is not currently an issue at the aquaculture production levels being practised in this ecosystem. Since the wild species data is based on a study carried out in 1994, it is recommended that new surveys be conducted to validate fi ndings.
Information on the distributions of wild species will assist in the licensing of new aquaculture areas. In ad-dition, the establishment of upper thresholds for shellfi sh aquaculture development in an ecosystem or in certain areas of that ecosystem can be estimated to assure the sustainability of wild populations.
KEY REFERENCES
Carver, C.E.A., Mallet, A.L., 1990. Estimating the carrying capacity of a coastal inlet for mussel culture. Aquaculture, 88, 39–53.
Ferreira, J.G., Duarte, P., Ball, B., 1998. Trophic capacity of Carlingford Lough for oyster culture – analysis by ecological modelling. Aquatic Ecology, 31 (4), 361–378.
Foy, R.H., Girvan, J., 2004. An evaluation of nitrogen sources and inputs to tidal waters in Northern Ire-land. Report by the Queen’s University of Belfast and the Department of Agriculture and Rural Develop-ment, Belfast.109 pp.
Gangnery, A., Bacher, C., Buestel, D., 2001. Assessing the production and the impact of cultivated oysters in the Thau lagoon (Méditerranée, France) with a population dynamics model. Canadian Journal of Fisher-ies and Aquatic Sciences, 58, 1–9.
Grayson R., Blöschl, G., 2001. Spatial modelling of catchment dynamics. In: “Spatial patterns in catch-ment hydrology – observations and modelling”, Grayson, R.; Blöschl, G. (eds.); Cambridge University Press, Cambridge, 51–81.
Nobre, A.M., Ferreira, J.G., Newton, A., Simas, T., Icely, J.D., Neves, R., 2005. Management of coastal eutrophication: Integration of fi eld data, ecosystem-scale simulations and screening models. Journal of Marine Systems, 56 (3/4), 375–390.
Nunes, J.P, Ferreira, J.G., Gazeau, F., Lencart-Silva, J., Zhang, X.L, Zhu M.Y., Fang J.G., 2003. A model for sustainable management of shellfi sh polyculture in coastal bays. Aquaculture, 219 (1–4), 257–277.
Raillard, O., Ménesguen, A., 1994. An ecosystem box model for estimating the carrying capacity of a macrotidal shellfi sh system. Marine Ecology Progress Series, 115, 117–130.
Wanninkhof, R., 1992. Relantionship between gas exchange and wind speed over the ocean. J. Geophys. Res, 97, 7373–7381.
WL | Delft, 2003a. Delft3D-FLOW users manual. WL | Delft, Delft.
WL | Delft, 2003b. Delft3D-WAQ users manual. WL | Delft, Delft.

MANAGEMENTRECOMMENDATIONS
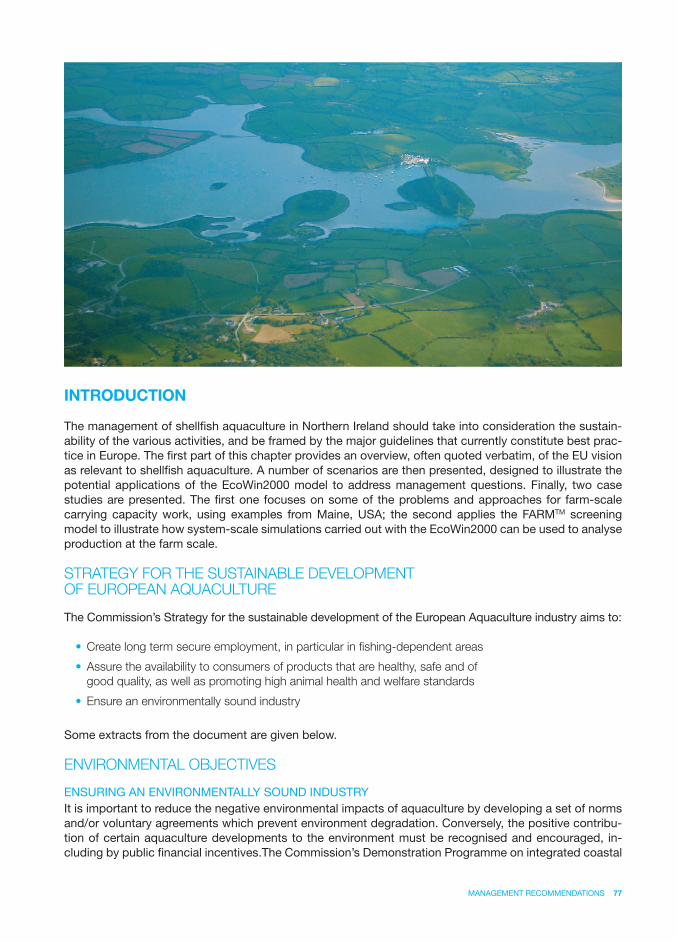
MANAGEMENT RECOMMENDATIONS 77
INTRODUCTION
The management of shellfi sh aquaculture in Northern Ireland should take into consideration the sustain-ability of the various activities, and be framed by the major guidelines that currently constitute best prac-tice in Europe. The fi rst part of this chapter provides an overview, often quoted verbatim, of the EU vision as relevant to shellfi sh aquaculture. A number of scenarios are then presented, designed to illustrate the potential applications of the EcoWin2000 model to address management questions. Finally, two case studies are presented. The fi rst one focuses on some of the problems and approaches for farm-scale carrying capacity work, using examples from Maine, USA; the second applies the FARMTM screening model to illustrate how system-scale simulations carried out with the EcoWin2000 can be used to analyse production at the farm scale.
STRATEGY FOR THE SUSTAINABLE DEVELOPMENT OF EUROPEAN AQUACULTURE
The Commission’s Strategy for the sustainable development of the European Aquaculture industry aims to:
• Create long term secure employment, in particular in fi shing-dependent areas
• Assure the availability to consumers of products that are healthy, safe and of
good quality, as well as promoting high animal health and welfare standards
• Ensure an environmentally sound industry
Some extracts from the document are given below.
ENVIRONMENTAL OBJECTIVES
ENSURING AN ENVIRONMENTALLY SOUND INDUSTRYIt is important to reduce the negative environmental impacts of aquaculture by developing a set of norms and/or voluntary agreements which prevent environment degradation. Conversely, the positive contribu-tion of certain aquaculture developments to the environment must be recognised and encouraged, in-cluding by public fi nancial incentives.The Commission’s Demonstration Programme on integrated coastal
78 MANAGEMENT RECOMMENDATIONS
zone management has shown that the best response to such complex situations is an integrated territo-rial approach that addresses concurrently the many different problems an area faces and involves all the stakeholders. Aquaculture is included in activities that shall be considered in the aim of Integrated Coastal Zone Management (ICZM) process.
CHALLENGES
COMPETITION FOR SPACEMany complaints against aquaculture development refl ect competition for space; the recent growth of aquaculture, particularly on the coastline where there is already a high concentration of activities, put it in the place of the newcomer disrupting the long-established status quo between existing users. Land and water for aquaculture will be more and more expensive in future. Aquaculture establishments may be forced to move offshore, but this is a possibility for some species only.
IMPLICATIONS OF THE WATER FRAMEWORK DIRECTIVE FOR MARICULTURE
DEFINITION OF WATER BODIES AND REFERENCE CONDITIONSAt the moment, most countries have defi ned their water bodies. These tend to be large, on the scale of kilometres to low tens of kilometres, and therefore the majority of mariculture activities will be considered as one of the pressures acting on the overall quality of the water body.
Whilst it is somewhat clearer what implications the WFD may have for intensive aquaculture activities that are confi ned to small spatial areas, there are certain activities e.g. bottom culture of mussels and intertidal culture of oysters, that may be impacted as a consequence of the Directive. Given that these activities may constitute large proportions of a water body, the areas may be representative of the wa-ter body. These activities have defi ned impacts on the benthos over wide spatial scales, of the order of km2, and consequently may put the water body at risk of failing to meet good ecological status. Initial risk assessment efforts carried out by England and Wales have determined that the shellfi sheries (even if comprising up to 50% of a water body) may not be considered of having high pressure on a water body. However, this exercise considered managed wild-fi sheries only and not true aquaculture operations. As yet, the implications on broad-scale aquaculture activities have not been fully assessed and discussed.
MEASURES TO IMPROVE ECOLOGICAL QUALITY (MITIGATION MEASURES) The overall aim of the Water Framework Directive is the achievement of good water status in all waters by 2015. It is probable that the initial classifi cation will result in some water bodies being classifi ed as a having an ecological status below the target level. In such cases, Member States will then be required to take steps to improve the status of these water bodies.
“Member states should adopt measures to eliminate pollution of surface waters by the priority substances and progressively to reduce pollution by other substances which would otherwise prevent Member States from achieving the objectives for the bodies of surface water.”
At this time it is not clear what measures/actions Member States may choose to take. It is apparent that rather little consideration has so far been given to this aspect of the Directive, with most attention being given to prior activities with more pressing deadlines, such as may include the development of reference conditions, monitoring, and subsequent classifi cation. However, it can be anticipated that additional man-agement and mitigative actions may be required of aquaculture operations in some areas where good ecological status has not been achieved.
It is clear that the promotion of sustainable European aquaculture does not confl ict with the require-ments of the WFD. Aquaculture should therefore not seek “special treatment”. Rather, aquaculture is to be viewed as a coastal zone activity in the same manner as other activities that can infl uence, and have requirements for, good coastal water quality, such as domestic waste disposal, agriculture, tourism and
MANAGEMENT RECOMMENDATIONS 79
forestry. The contribution of aquaculture to ecological conditions assessed as less than good should be considered in the same manner as the contributions from other activities.
In developing mitigation schemes, however, it should be noted that aquaculture can also contribute to improving ecological status of surface water bodies. Such activities could include:
• Macroalgal cultivation which can remove signifi cant amounts of nutrients from the
surrounding waters
• Bivalve mollusc cultivation which can extract both nutrients and contaminants
from the water column through their fi ltering activity
• Polyculture, e.g., fi nfi sh and macroalgae in which the inorganic nutrients from the
fi nfi sh farms are taken up by the macroalgae and in which both products can have
an economic value
GUIDELINES FOR ENVIRONMENTALLY ACCEPTABLE
COASTAL AQUACULTURE
The ecological and socio-economic benefi ts and costs of aquaculture activity are potentially so sig-nifi cant that action-oriented policies are necessary. In order to ensure that fi nancial gain is not at the expense of the ecosystem or the rest of society, aquaculture developments must follow established principles.
The formulation of strategies will provide the focus for an equitable balance between those seeking a simple livelihood, those wanting to make a profi t, the quality of the environment and the interests of local people, the wider community and, where appropriate, the international community.
GENERAL PRINCIPLES
• Coastal aquaculture has the potential to produce food and to generate income
contributing to social and economic well-being
• Planned and properly managed aquaculture development is a productive use of
the coastal zone if undertaken within the broader framework of integrated coastal
zone management plans, according to national goals for sustainable development
and in harmony with international obligations
• The likely consequences of coastal aquaculture developments on the social and
ecological environment must be predicted and evaluated, and measures
formulated in order to contain them within acceptable, pre-determined limits
• Coastal aquaculture activity must be regulated and monitored to ensure that
impacts remain within pre-determined limits and to signal when contingency and
other plans need to be brought into effect to reverse any trends leading towards
unacceptable environmental consequences
• Carrying capacity for aquaculture shall take into account food for wild populations
of grazers and fi lter feeders, including wild bivalve stocks
STRATEGIES
Strategy 1. The sound utilization of the ecological capacity of the coastal zone to produce aquatic prod-ucts and generate income.
Strategy 2. The development of policy and management mechanisms to reduce confl ict with other coastal activities.
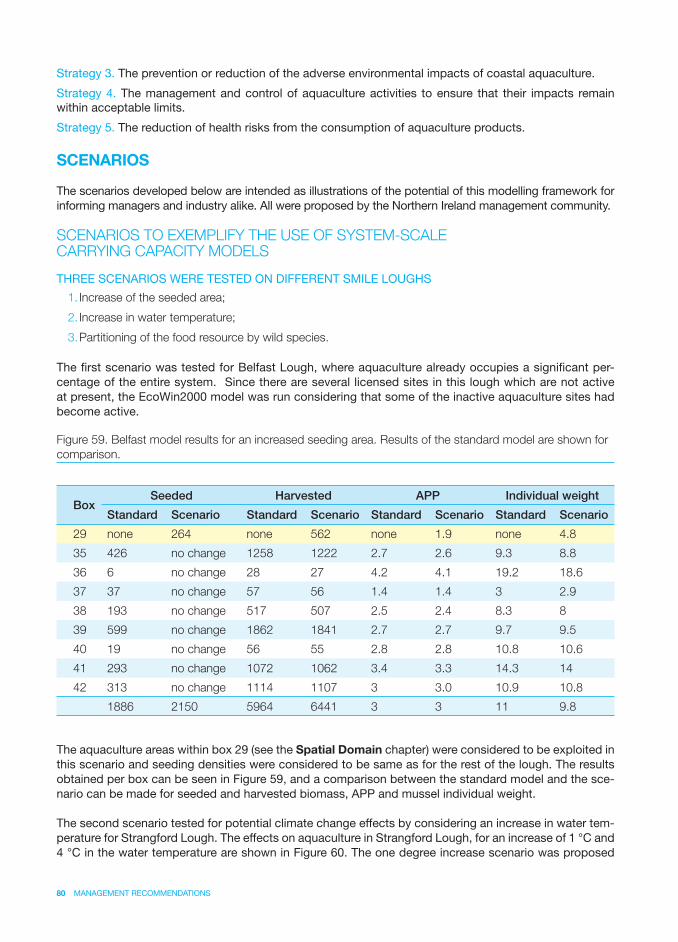
80 MANAGEMENT RECOMMENDATIONS
Strategy 3. The prevention or reduction of the adverse environmental impacts of coastal aquaculture.
Strategy 4. The management and control of aquaculture activities to ensure that their impacts remain within acceptable limits.
Strategy 5. The reduction of health risks from the consumption of aquaculture products.
SCENARIOS
The scenarios developed below are intended as illustrations of the potential of this modelling framework for informing managers and industry alike. All were proposed by the Northern Ireland management community.
SCENARIOS TO EXEMPLIFY THE USE OF SYSTEM-SCALE CARRYING CAPACITY MODELS
THREE SCENARIOS WERE TESTED ON DIFFERENT SMILE LOUGHS
1. Increase of the seeded area;
2. Increase in water temperature;
3. Partitioning of the food resource by wild species.
The fi rst scenario was tested for Belfast Lough, where aquaculture already occupies a signifi cant per-centage of the entire system. Since there are several licensed sites in this lough which are not active at present, the EcoWin2000 model was run considering that some of the inactive aquaculture sites had become active.
The aquaculture areas within box 29 (see the Spatial Domain chapter) were considered to be exploited in this scenario and seeding densities were considered to be same as for the rest of the lough. The results obtained per box can be seen in Figure 59, and a comparison between the standard model and the sce-nario can be made for seeded and harvested biomass, APP and mussel individual weight.
The second scenario tested for potential climate change effects by considering an increase in water tem-perature for Strangford Lough. The effects on aquaculture in Strangford Lough, for an increase of 1 °C and 4 °C in the water temperature are shown in Figure 60. The one degree increase scenario was proposed
Figure 59. Belfast model results for an increased seeding area. Results of the standard model are shown for
comparison.
BoxSeeded Harvested APP Individual weight
Standard Scenario Standard Scenario Standard Scenario Standard Scenario
29 none 264 none 562 none 1.9 none 4.8
35 426 no change 1258 1222 2.7 2.6 9.3 8.8
36 6 no change 28 27 4.2 4.1 19.2 18.6
37 37 no change 57 56 1.4 1.4 3 2.9
38 193 no change 517 507 2.5 2.4 8.3 8
39 599 no change 1862 1841 2.7 2.7 9.7 9.5
40 19 no change 56 55 2.8 2.8 10.8 10.6
41 293 no change 1072 1062 3.4 3.3 14.3 14
42 313 no change 1114 1107 3 3.0 10.9 10.8
1886 2150 5964 6441 3 3 11 9.8
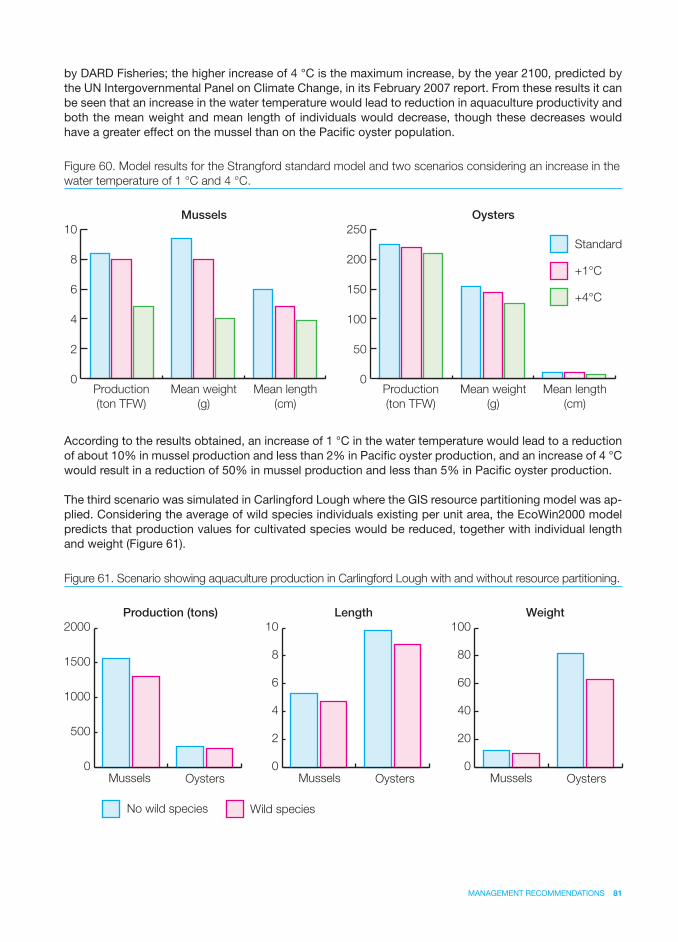
MANAGEMENT RECOMMENDATIONS 81
by DARD Fisheries; the higher increase of 4 °C is the maximum increase, by the year 2100, predicted by the UN Intergovernmental Panel on Climate Change, in its February 2007 report. From these results it can be seen that an increase in the water temperature would lead to reduction in aquaculture productivity and both the mean weight and mean length of individuals would decrease, though these decreases would have a greater effect on the mussel than on the Pacifi c oyster population.
According to the results obtained, an increase of 1 °C in the water temperature would lead to a reduction of about 10% in mussel production and less than 2% in Pacifi c oyster production, and an increase of 4 °C would result in a reduction of 50% in mussel production and less than 5% in Pacifi c oyster production.
The third scenario was simulated in Carlingford Lough where the GIS resource partitioning model was ap-plied. Considering the average of wild species individuals existing per unit area, the EcoWin2000 model predicts that production values for cultivated species would be reduced, together with individual length and weight (Figure 61).
Figure 60. Model results for the Strangford standard model and two scenarios considering an increase in the
water temperature of 1 °C and 4 °C.
0
2
4
6
8
10
0
50
100
150
200
250
Production
(ton TFW)
Mean weight
(g)
Mean length
(cm)
Production
(ton TFW)
Mean weight
(g)
Mean length
(cm)
Mussels Oysters
Standard
+1°C
+4°C
Figure 61. Scenario showing aquaculture production in Carlingford Lough with and without resource partitioning.
0
500
1000
1500
2000
0
2
4
6
8
10
0
20
40
60
80
100
Production (tons) Length Weight
Mussels Oysters Mussels Oysters Mussels Oysters
No wild species Wild species
82 MANAGEMENT RECOMMENDATIONS
CASE STUDIES FOR LOCAL-SCALE CARRYING CAPACITY
The fi rst stage of carrying capacity assessment should take place at the system level, as has been carried out in the SMILE project. However, after this system-scale planning approach is completed, it is appropri-ate to evaluate the sustainability of aquaculture activities at the local scale (farm, raft etc). A number of tools have been developed to carry out this kind of assessment, including the FARMTM model, developed by members of the SMILE team, and MUSMOD, a mussel model developed in the U.S. by Carter Newell and John Richardson. In order to illustrate some of the local-scale issues, two case studies are presented below. The fi rst was prepared by Carter Newell, and illustrates some of the problems and approaches for farm-scale carrying capacity work, using examples from Maine, USA. The second was prepared by members of the SMILE team, together with Suzanne Bricker from NOAA, and focuses on the integration of system-scale and farm-scale approaches, using the FARMTM screening model.
CASE STUDY 1 – FACTORS WHICH INFLUENCE MUSSEL PRODUCTION ON BOTTOM LEASES
By: Carter Newell, Great Eastern Mussel Farms, Maine, USA
The management of shellfi sh aquaculture in bottom or suspended systems for maximum productivity is often based on fi eld experience (trial and error) but not necessarily on a detailed quantitative knowledge of the hydrodynamics of the sites and factors which affect food supply and demand. Furthermore, hus-bandry practices which control shellfi sh density (number per square meter), biomass (tissue weight per square meter) and density distribution (patch size) affect the growth rates of shellfi sh due to competition for food two levels: the localized (culture unit) scale and farm scale (i.e. 100 meters). Shellfi sh mortality is also a function of size of seed, time of year seeded, handling, sedimentation, and activity of predators. In-vestigations on factors affecting survival, growth, and seed to harvest yield in bottom cultures of mussels in Maine, USA have resulted in the development of a productive capacity model MUSMOD which predicts the growth rates and yields of seed mussels based on key parameters which include:
1. The size and condition of the mussel seed;
2. Seeding mortality;
3. Mortality during grow-out;
4. The concentration and fl ux of live phytoplankton and organic detritus particles;
5. Water temperature: more important for rapid shell growth of seed;
6. Mussel density and biomass;
7. Mussel biomass distribution (i.e. patches or small clumps);
8. Time of year seeded.
MUSSEL SEED DISTRIBUTIONMussel seed obtained from seed mussel beds and harvested by dredge, or mussel seed obtained from a plot of half-grown mussels, is spread by the vessel, and growth and survival is a function of both the quality (percent weight 100% live mussels), the physiological condition (mechanical damage, time and temperature from harvest to spreading, wet or dry storage) and the spreading rates (discharge rate of the vessel, water depth, vessel speed and seed dispersion) of the mussel seed. Mussels spread in numerous small patches are illustrated in Figure 62. The density distribution of the mussel seed either results in the production of mussel patches or a more uniformly distributed small clumps of mussels on the bottom. If seed is not evenly distributed, intense competition for food and space on a localized (mussel patch) level limits mussel growth in addition to larger (farm) scale patterns of food availability. Growth samples and a simulation model of depletion of chl a over mussel patches demonstrated severe competition for food for mussels within 0.5 m of the edges of thick mussel patches.
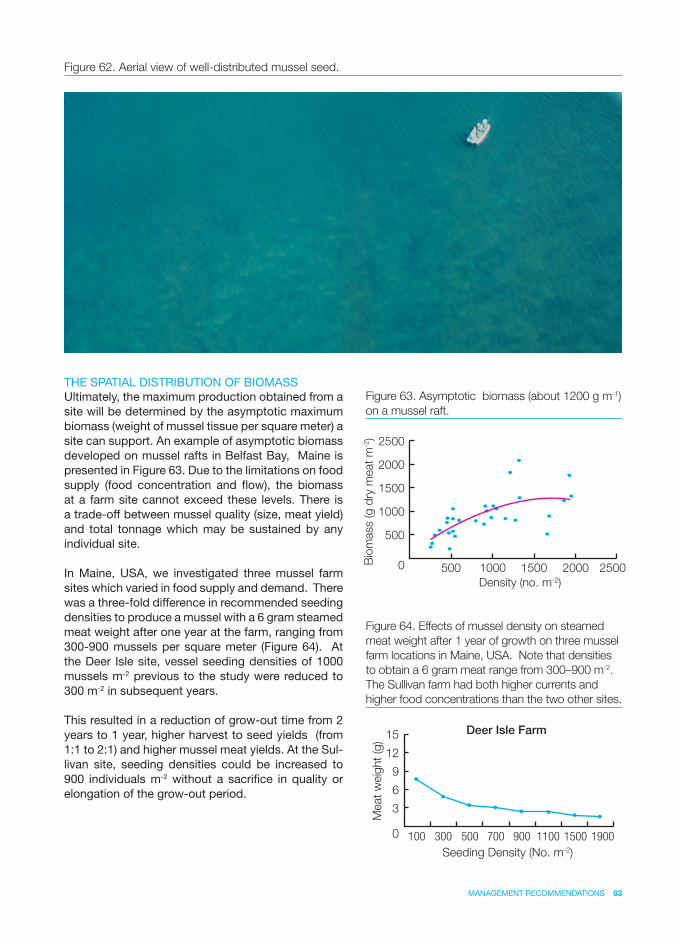
MANAGEMENT RECOMMENDATIONS 83
Figure 62. Aerial view of well-distributed mussel seed.
THE SPATIAL DISTRIBUTION OF BIOMASSUltimately, the maximum production obtained from a site will be determined by the asymptotic maximum biomass (weight of mussel tissue per square meter) a site can support. An example of asymptotic biomass developed on mussel rafts in Belfast Bay, Maine is presented in Figure 63. Due to the limitations on food supply (food concentration and fl ow), the biomass at a farm site cannot exceed these levels. There is a trade-off between mussel quality (size, meat yield) and total tonnage which may be sustained by any individual site.
In Maine, USA, we investigated three mussel farm sites which varied in food supply and demand. There was a three-fold difference in recommended seeding densities to produce a mussel with a 6 gram steamed meat weight after one year at the farm, ranging from 300-900 mussels per square meter (Figure 64). At the Deer Isle site, vessel seeding densities of 1000 mussels m-2 previous to the study were reduced to 300 m-2 in subsequent years.
This resulted in a reduction of grow-out time from 2 years to 1 year, higher harvest to seed yields (from 1:1 to 2:1) and higher mussel meat yields. At the Sul-livan site, seeding densities could be increased to 900 individuals m-2 without a sacrifi ce in quality or elongation of the grow-out period.
Figure 63. Asymptotic biomass (about 1200 g m-1)
on a mussel raft.
Figure 64. Effects of mussel density on steamed
meat weight after 1 year of growth on three mussel
farm locations in Maine, USA. Note that densities
to obtain a 6 gram meat range from 300–900 m-2.
The Sullivan farm had both higher currents and
higher food concentrations than the two other sites.
100 300 500 700 900 1100 1500 1900
Meat
weig
ht
(g)
Seeding Density (No. m-2)
Deer Isle Farm
0
3
9
12
15
6
0
500
1500
2000
1000
2500
500 1000 1500 2000 2500
Bio
mass (g
dry
meat
m-2)
Density (no. m-2)
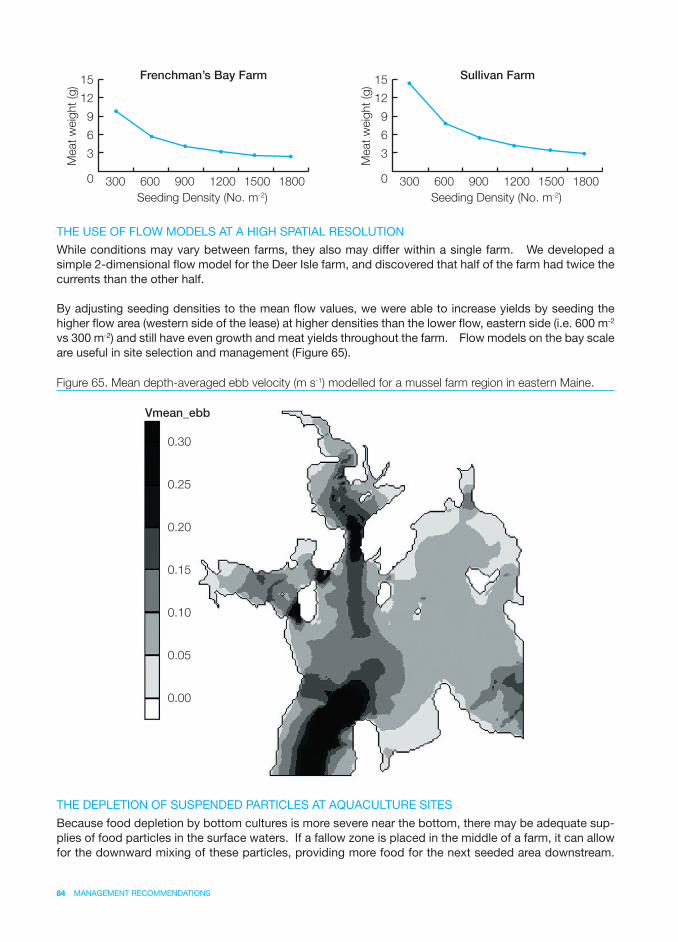
84 MANAGEMENT RECOMMENDATIONS
THE USE OF FLOW MODELS AT A HIGH SPATIAL RESOLUTION
While conditions may vary between farms, they also may differ within a single farm. We developed a simple 2-dimensional fl ow model for the Deer Isle farm, and discovered that half of the farm had twice the currents than the other half.
By adjusting seeding densities to the mean fl ow values, we were able to increase yields by seeding the higher fl ow area (western side of the lease) at higher densities than the lower fl ow, eastern side (i.e. 600 m-2 vs 300 m-2) and still have even growth and meat yields throughout the farm. Flow models on the bay scale are useful in site selection and management (Figure 65).
THE DEPLETION OF SUSPENDED PARTICLES AT AQUACULTURE SITES
Because food depletion by bottom cultures is more severe near the bottom, there may be adequate sup-plies of food particles in the surface waters. If a fallow zone is placed in the middle of a farm, it can allow for the downward mixing of these particles, providing more food for the next seeded area downstream.
Figure 65. Mean depth-averaged ebb velocity (m s-1) modelled for a mussel farm region in eastern Maine.
0
3
9
12
15
6
300 600 900 1200 1500 1800
Meat
weig
ht
(g)
Seeding Density (No. m-2)
Frenchman’s Bay Farm
0
3
9
12
15
6
300 600 900 1200 1500 1800
Meat
weig
ht
(g)
Seeding Density (No. m-2)
Sullivan Farm
Vmean_ebb
0.00
0.05
0.10
0.15
0.20
0.25
0.30
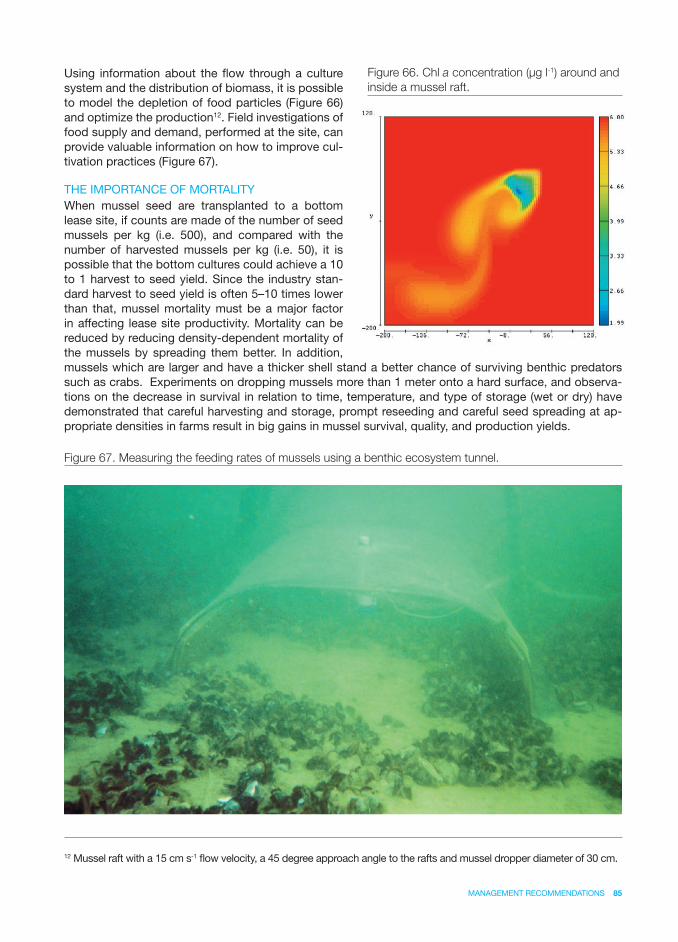
MANAGEMENT RECOMMENDATIONS 85
Using information about the fl ow through a culture system and the distribution of biomass, it is possible to model the depletion of food particles (Figure 66) and optimize the production12. Field investigations of food supply and demand, performed at the site, can provide valuable information on how to improve cul-tivation practices (Figure 67).
THE IMPORTANCE OF MORTALITYWhen mussel seed are transplanted to a bottom lease site, if counts are made of the number of seed mussels per kg (i.e. 500), and compared with the number of harvested mussels per kg (i.e. 50), it is possible that the bottom cultures could achieve a 10 to 1 harvest to seed yield. Since the industry stan-dard harvest to seed yield is often 5–10 times lower than that, mussel mortality must be a major factor in affecting lease site productivity. Mortality can be reduced by reducing density-dependent mortality of the mussels by spreading them better. In addition, mussels which are larger and have a thicker shell stand a better chance of surviving benthic predators such as crabs. Experiments on dropping mussels more than 1 meter onto a hard surface, and observa-tions on the decrease in survival in relation to time, temperature, and type of storage (wet or dry) have demonstrated that careful harvesting and storage, prompt reseeding and careful seed spreading at ap-propriate densities in farms result in big gains in mussel survival, quality, and production yields.
Figure 66. Chl a concentration (μg l-1) around and
inside a mussel raft.
Figure 67. Measuring the feeding rates of mussels using a benthic ecosystem tunnel.
12 Mussel raft with a 15 cm s-1 fl ow velocity, a 45 degree approach angle to the rafts and mussel dropper diameter of 30 cm.
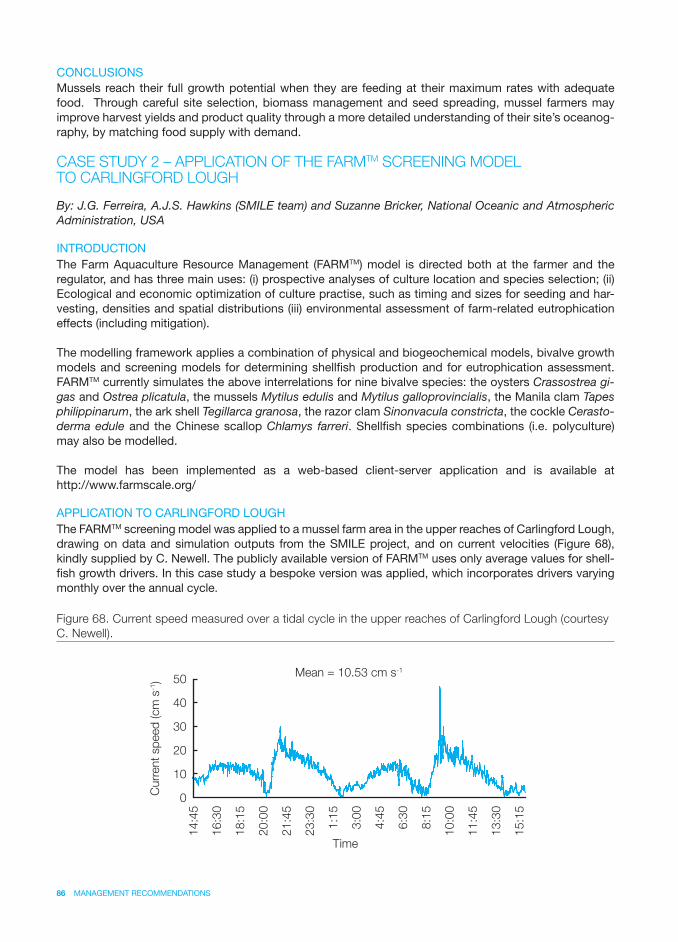
86 MANAGEMENT RECOMMENDATIONS
CONCLUSIONSMussels reach their full growth potential when they are feeding at their maximum rates with adequate food. Through careful site selection, biomass management and seed spreading, mussel farmers may improve harvest yields and product quality through a more detailed understanding of their site’s oceanog-raphy, by matching food supply with demand.
CASE STUDY 2 – APPLICATION OF THE FARMTM SCREENING MODEL TO CARLINGFORD LOUGH
By: J.G. Ferreira, A.J.S. Hawkins (SMILE team) and Suzanne Bricker, National Oceanic and Atmospheric Administration, USA
INTRODUCTIONThe Farm Aquaculture Resource Management (FARMTM) model is directed both at the farmer and the regulator, and has three main uses: (i) prospective analyses of culture location and species selection; (ii) Ecological and economic optimization of culture practise, such as timing and sizes for seeding and har-vesting, densities and spatial distributions (iii) environmental assessment of farm-related eutrophication effects (including mitigation).
The modelling framework applies a combination of physical and biogeochemical models, bivalve growth models and screening models for determining shellfi sh production and for eutrophication assessment. FARMTM currently simulates the above interrelations for nine bivalve species: the oysters Crassostrea gi-gas and Ostrea plicatula, the mussels Mytilus edulis and Mytilus galloprovincialis, the Manila clam Tapes philippinarum, the ark shell Tegillarca granosa, the razor clam Sinonvacula constricta, the cockle Cerasto-derma edule and the Chinese scallop Chlamys farreri. Shellfi sh species combinations (i.e. polyculture) may also be modelled.
The model has been implemented as a web-based client-server application and is available at http://www.farmscale.org/
APPLICATION TO CARLINGFORD LOUGHThe FARMTM screening model was applied to a mussel farm area in the upper reaches of Carlingford Lough, drawing on data and simulation outputs from the SMILE project, and on current velocities (Figure 68), kindly supplied by C. Newell. The publicly available version of FARMTM uses only average values for shell-fi sh growth drivers. In this case study a bespoke version was applied, which incorporates drivers varying monthly over the annual cycle.
Figure 68. Current speed measured over a tidal cycle in the upper reaches of Carlingford Lough (courtesy
C. Newell).
Mean = 10.53 cm s-1
Curr
ent
sp
eed
(cm
s-1)
0
10
20
30
40
50
Time
14:4
5
16:3
0
18:1
5
20:0
0
21:4
5
23:3
0
1:1
5
3:0
0
4:4
5
6:3
0
8:1
5
10:0
0
11:4
5
13:3
0
15:1
5
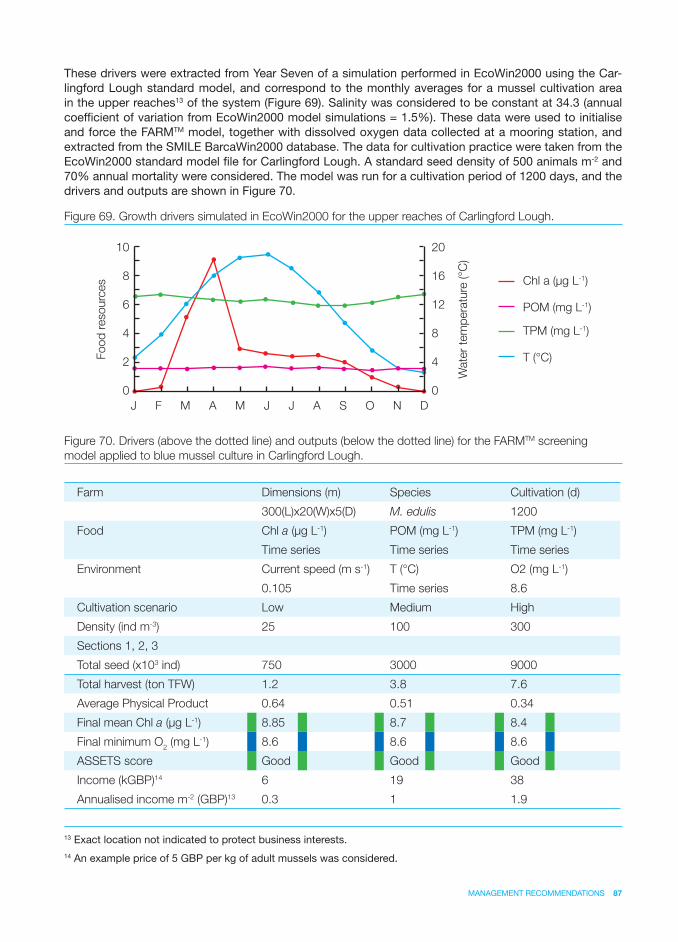
MANAGEMENT RECOMMENDATIONS 87
These drivers were extracted from Year Seven of a simulation performed in EcoWin2000 using the Car-lingford Lough standard model, and correspond to the monthly averages for a mussel cultivation area in the upper reaches13 of the system (Figure 69). Salinity was considered to be constant at 34.3 (annual coeffi cient of variation from EcoWin2000 model simulations = 1.5%). These data were used to initialise and force the FARMTM model, together with dissolved oxygen data collected at a mooring station, and extracted from the SMILE BarcaWin2000 database. The data for cultivation practice were taken from the EcoWin2000 standard model fi le for Carlingford Lough. A standard seed density of 500 animals m-2 and 70% annual mortality were considered. The model was run for a cultivation period of 1200 days, and the drivers and outputs are shown in Figure 70.
13 Exact location not indicated to protect business interests.14 An example price of 5 GBP per kg of adult mussels was considered.
Figure 69. Growth drivers simulated in EcoWin2000 for the upper reaches of Carlingford Lough.
Farm Dimensions (m) Species Cultivation (d)
300(L)x20(W)x5(D) M. edulis 1200
Food Chl a (μg L-1) POM (mg L-1) TPM (mg L-1)
Time series Time series Time series
Environment Current speed (m s-1) T (°C) O2 (mg L-1)
0.105 Time series 8.6
Cultivation scenario Low Medium High
Density (ind m-3) 25 100 300
Sections 1, 2, 3
Total seed (x103 ind) 750 3000 9000
Total harvest (ton TFW) 1.2 3.8 7.6
Average Physical Product 0.64 0.51 0.34
Final mean Chl a (μg L-1) 8.85 8.7 8.4
Final minimum O2 (mg L-1) 8.6 8.6 8.6
ASSETS score Good Good Good
Income (kGBP)14 6 19 38
Annualised income m-2 (GBP)13 0.3 1 1.9
Figure 70. Drivers (above the dotted line) and outputs (below the dotted line) for the FARMTM screening
model applied to blue mussel culture in Carlingford Lough.
0
4
2
6
8
10
0
8
4
12
16
20
Food
resourc
es
Wate
r te
mp
era
ture
(°C
)
Chl a (μg L-1)
POM (mg L-1)
TPM (mg L-1)
T (°C)
J F M A M J J A S O N D
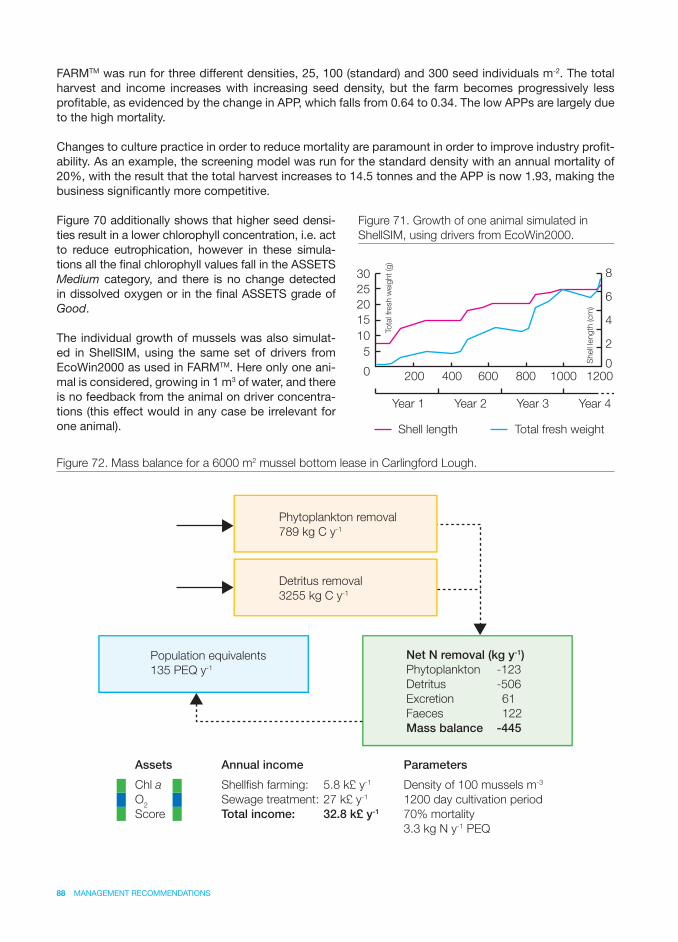
88 MANAGEMENT RECOMMENDATIONS
FARMTM was run for three different densities, 25, 100 (standard) and 300 seed individuals m-2. The total harvest and income increases with increasing seed density, but the farm becomes progressively less profi table, as evidenced by the change in APP, which falls from 0.64 to 0.34. The low APPs are largely due to the high mortality.
Changes to culture practice in order to reduce mortality are paramount in order to improve industry profi t-ability. As an example, the screening model was run for the standard density with an annual mortality of 20%, with the result that the total harvest increases to 14.5 tonnes and the APP is now 1.93, making the business signifi cantly more competitive.
Figure 70 additionally shows that higher seed densi-ties result in a lower chlorophyll concentration, i.e. act to reduce eutrophication, however in these simula-tions all the fi nal chlorophyll values fall in the ASSETS Medium category, and there is no change detected in dissolved oxygen or in the fi nal ASSETS grade of Good.
The individual growth of mussels was also simulat-ed in ShellSIM, using the same set of drivers from EcoWin2000 as used in FARMTM. Here only one ani-mal is considered, growing in 1 m3 of water, and there is no feedback from the animal on driver concentra-tions (this effect would in any case be irrelevant for one animal).
Figure 71. Growth of one animal simulated in
ShellSIM, using drivers from EcoWin2000.
Figure 72. Mass balance for a 6000 m2 mussel bottom lease in Carlingford Lough.
Shell length
Tota
l fresh w
eig
ht
(g)
Shell
length
(cm
)
Total fresh weight
0 200 400 600 800 1000 1200
5
10
15
20
25
30
0
2
4
6
8
Year 1 Year 2 Year 3 Year 4
Population equivalents
135 PEQ y-1
Net N removal (kg y-1)
Phytoplankton -123
Detritus -506
Excretion 61
Faeces 122
Mass balance -445
Parameters
Density of 100 mussels m-3
1200 day cultivation period
70% mortality
3.3 kg N y-1 PEQ
Annual income
Shellfish farming: 5.8 k£ y-1
Sewage treatment: 27 k£ y-1
Total income: 32.8 k£ y-1
Assets
Chl aO
2
Score
Phytoplankton removal
789 kg C y-1
Detritus removal
3255 kg C y-1
Finally, Figure 72 shows an annualised mass balance carried out with FARMTM for the standard simulation. The mussels are responsible for a annual net removal of 445 kg of nitrogen, equivalent to the sewage dis-charge of 135 population equivalents (PEQ). The substitution costs of land-based nitrogen treatment (i.e. the reduction of emissions) are of the order of 25,000 pounds sterling per year, which may be considered an environmental contribution by the 6000 m2 mussel farm. Such contributions may in the future form part of a trading system of nitrogen credits, to manage nutrient emissions at the watershed scale, thereby constituting a signifi cant additional source of revenue to shellfi sh aquaculture farmers.
KEY REFERENCES
Bricker, S.B., Ferreira, J.G., Simas, T., 2003. An Integrated Methodology for Assessment of Estuarine Tro-phic Status. Ecological Modelling, 169(1), 39–60.
Campbell, D.E., Newell, C.R., 1998. MUSMOD: a production model for bottom culture of the blue mussel, Mytilus edulis. J. exp. mar. biol. ecol., 219, 171–204.
GESAMP (IMO/FAO/Unesco/WMO/WHO/IAEA/UN/UNEP Joint Group of Experts on the Scientifi c As-pects of Marine Pollution), Reducing Environmental Impacts of Coastal Aquaculture. Rep. Stud. GESAMP. (47), 35p.
Ferreira, J.G., Hawkins, A.J.S., Bricker, S.B., 2007. Management of productivity, environmental effects and profi tability of shellfi sh aquaculture – the Farm Aquaculture Resource Management (FARMTM) model. Aquaculture, In Press.
Newell, C.R., 1990. The effects of mussel (Mytilus edulis, Linnaeus, 1758) position in seeded bottom patches on growth at subtidal lease sites in Maine. J. Shellfi sh Res., 9, 113–118.
Newell, C.R., Richardson, J.R., 2004. Shellfi sh carrying capacity and site optimization. Aquaculture Ire-land, 115, 15–19.
Newell, C.R., Shumway S.E., 1993. Grazing of natural particulates by bivalve molluscs: a spatial and temporal perspective. In: Bivalve Filter Feeders in Estuarine and Coastal Ecosystem Processes, Ed. R.F. Dame. NATO ASI Series V. G33, 85–148.
Report of the Working Group on Environmental Interaction of Mariculture, 11–15 April, Ottawa, Canada. ICES WGEIM Report 2005.

CONCLUSIONS
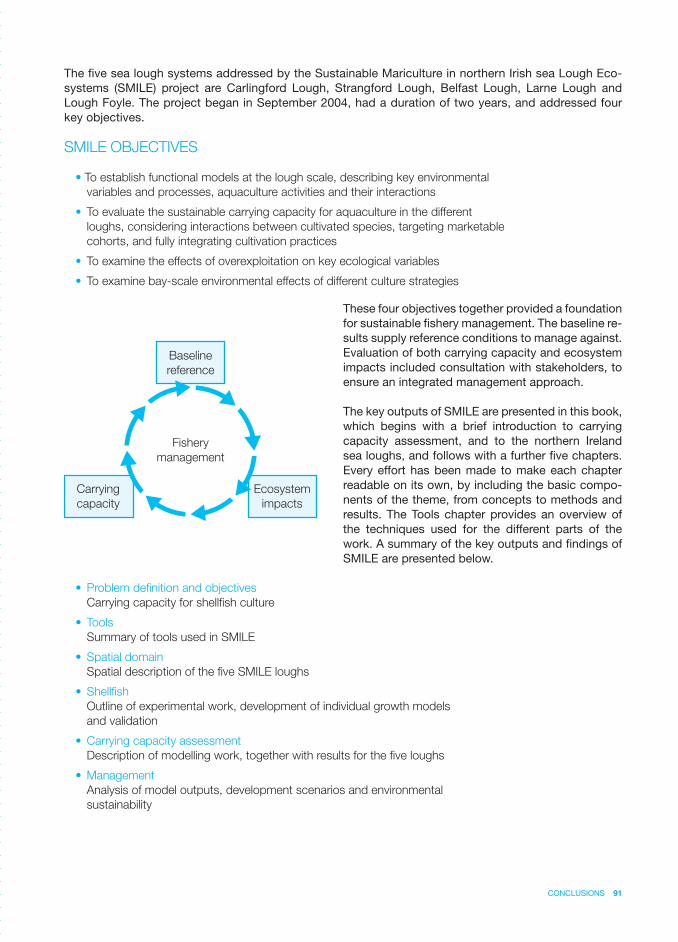
CONCLUSIONS 91
The fi ve sea lough systems addressed by the Sustainable Mariculture in northern Irish sea Lough Eco-systems (SMILE) project are Carlingford Lough, Strangford Lough, Belfast Lough, Larne Lough and Lough Foyle. The project began in September 2004, had a duration of two years, and addressed four key objectives.
SMILE OBJECTIVES
• To establish functional models at the lough scale, describing key environmental
variables and processes, aquaculture activities and their interactions
• To evaluate the sustainable carrying capacity for aquaculture in the different
loughs, considering interactions between cultivated species, targeting marketable
cohorts, and fully integrating cultivation practices
• To examine the effects of overexploitation on key ecological variables
• To examine bay-scale environmental effects of different culture strategies
These four objectives together provided a foundation for sustainable fi shery management. The baseline re-sults supply reference conditions to manage against. Evaluation of both carrying capacity and ecosystem impacts included consultation with stakeholders, to ensure an integrated management approach.
The key outputs of SMILE are presented in this book, which begins with a brief introduction to carrying capacity assessment, and to the northern Ireland sea loughs, and follows with a further fi ve chapters. Every effort has been made to make each chapter readable on its own, by including the basic compo-nents of the theme, from concepts to methods and results. The Tools chapter provides an overview of the techniques used for the different parts of the work. A summary of the key outputs and fi ndings of SMILE are presented below.
• Problem defi nition and objectives
Carrying capacity for shellfi sh culture
• Tools
Summary of tools used in SMILE
• Spatial domain
Spatial description of the fi ve SMILE loughs
• Shellfi sh
Outline of experimental work, development of individual growth models
and validation
• Carrying capacity assessment
Description of modelling work, together with results for the fi ve loughs
• Management
Analysis of model outputs, development scenarios and environmental
sustainability
Fishery
management
Baseline
reference
Ecosystem
impacts
Carrying
capacity
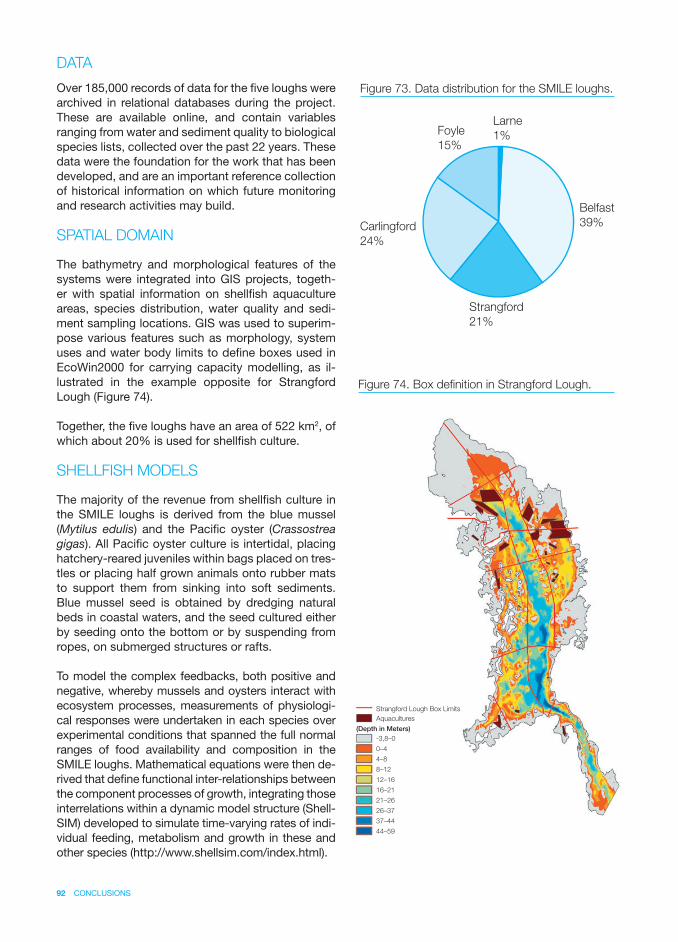
92 CONCLUSIONS
DATA
Over 185,000 records of data for the fi ve loughs were archived in relational databases during the project. These are available online, and contain variables ranging from water and sediment quality to biological species lists, collected over the past 22 years. These data were the foundation for the work that has been developed, and are an important reference collection of historical information on which future monitoring and research activities may build.
SPATIAL DOMAIN
The bathymetry and morphological features of the systems were integrated into GIS projects, togeth-er with spatial information on shellfi sh aquaculture areas, species distribution, water quality and sedi-ment sampling locations. GIS was used to superim-pose various features such as morphology, system uses and water body limits to defi ne boxes used in EcoWin2000 for carrying capacity modelling, as il-lustrated in the example opposite for Strangford Lough (Figure 74).
Together, the fi ve loughs have an area of 522 km2, of which about 20% is used for shellfi sh culture.
SHELLFISH MODELS
The majority of the revenue from shellfi sh culture in the SMILE loughs is derived from the blue mussel (Mytilus edulis) and the Pacifi c oyster (Crassostrea gigas). All Pacifi c oyster culture is intertidal, placing hatchery-reared juveniles within bags placed on tres-tles or placing half grown animals onto rubber mats to support them from sinking into soft sediments. Blue mussel seed is obtained by dredging natural beds in coastal waters, and the seed cultured either by seeding onto the bottom or by suspending from ropes, on submerged structures or rafts.
To model the complex feedbacks, both positive and negative, whereby mussels and oysters interact with ecosystem processes, measurements of physiologi-cal responses were undertaken in each species over experimental conditions that spanned the full normal ranges of food availability and composition in the SMILE loughs. Mathematical equations were then de-rived that defi ne functional inter-relationships between the component processes of growth, integrating those interrelations within a dynamic model structure (Shell-SIM) developed to simulate time-varying rates of indi-vidual feeding, metabolism and growth in these and other species (http://www.shellsim.com/index.html).
Figure 74. Box defi nition in Strangford Lough.
Larne
1%Foyle
15%
Belfast
39%
Strangford
21%
Carlingford
24%
Figure 73. Data distribution for the SMILE loughs.
Aquacultures
-3,8–0
0–4
4–8
8–12
12–16
16–21
21–26
26–37
37–44
44–59
Strangford Lough Box Limits
(Depth in Meters)
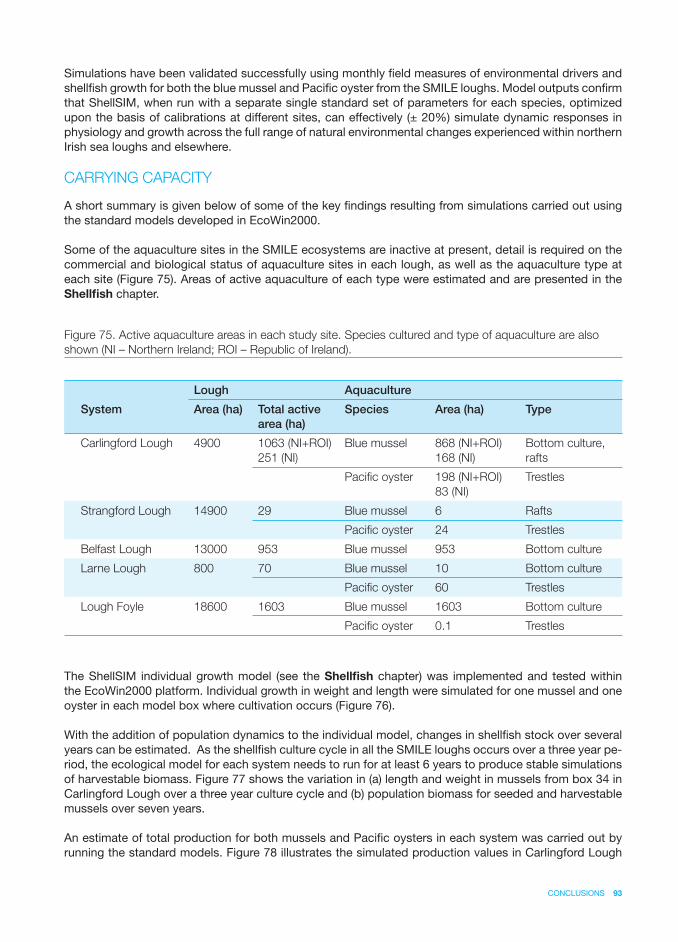
CONCLUSIONS 93
Simulations have been validated successfully using monthly fi eld measures of environmental drivers and shellfi sh growth for both the blue mussel and Pacifi c oyster from the SMILE loughs. Model outputs confi rm that ShellSIM, when run with a separate single standard set of parameters for each species, optimized upon the basis of calibrations at different sites, can effectively (± 20%) simulate dynamic responses in physiology and growth across the full range of natural environmental changes experienced within northern Irish sea loughs and elsewhere.
CARRYING CAPACITY
A short summary is given below of some of the key fi ndings resulting from simulations carried out using the standard models developed in EcoWin2000.
Some of the aquaculture sites in the SMILE ecosystems are inactive at present, detail is required on the commercial and biological status of aquaculture sites in each lough, as well as the aquaculture type at each site (Figure 75). Areas of active aquaculture of each type were estimated and are presented in the Shellfi sh chapter.
The ShellSIM individual growth model (see the Shellfi sh chapter) was implemented and tested within the EcoWin2000 platform. Individual growth in weight and length were simulated for one mussel and one oyster in each model box where cultivation occurs (Figure 76).
With the addition of population dynamics to the individual model, changes in shellfi sh stock over several years can be estimated. As the shellfi sh culture cycle in all the SMILE loughs occurs over a three year pe-riod, the ecological model for each system needs to run for at least 6 years to produce stable simulations of harvestable biomass. Figure 77 shows the variation in (a) length and weight in mussels from box 34 in Carlingford Lough over a three year culture cycle and (b) population biomass for seeded and harvestable mussels over seven years.
An estimate of total production for both mussels and Pacifi c oysters in each system was carried out by running the standard models. Figure 78 illustrates the simulated production values in Carlingford Lough
Lough Aquaculture
System Area (ha) Total active
area (ha)
Species Area (ha) Type
Carlingford Lough 4900 1063 (NI+ROI)
251 (NI)
Blue mussel 868 (NI+ROI)
168 (NI)
Bottom culture,
rafts
Pacifi c oyster 198 (NI+ROI)
83 (NI)
Trestles
Strangford Lough 14900 29 Blue mussel 6 Rafts
Pacifi c oyster 24 Trestles
Belfast Lough 13000 953 Blue mussel 953 Bottom culture
Larne Lough 800 70 Blue mussel 10 Bottom culture
Pacifi c oyster 60 Trestles
Lough Foyle 18600 1603 Blue mussel 1603 Bottom culture
Pacifi c oyster 0.1 Trestles
Figure 75. Active aquaculture areas in each study site. Species cultured and type of aquaculture are also
shown (NI – Northern Ireland; ROI – Republic of Ireland).

94 CONCLUSIONS
Figure 76. Individual length and weight simulated in E2K for blue mussels and Pacifi c oysters cultured in
Carlingford Lough.
Figure 77. Results of simulations in Carlingford Lough: a) blue mussel and Pacifi c oyster growth in weight
(g) and length (cm) during one culture cycle and b) mussel population biomass in total fresh weight (TFW) of
seed and harvestable weights in boxes 31 and 34.
Weight
Weig
ht
(g)
Harv
esta
ble
bio
mass (to
n T
FW
)
Harv
esta
ble
bio
mass (to
n T
FW
)
Length
(cm
)
Length
(cm
)
Weig
ht
(g)
Length
Mussel individual weight and length
0
2
4
6
8
10
12
0
1
2
3
4
5
6
Year 1 Year 2 Year 3
Seeded Harvestable
Mussel population biomass
0
2
4
6
8
10
12
0
20
40
60
80
100
140
120
Y1 Y2 Y3 Y4 Y5 Y6 Y7
Seeded Harvestable
Oyster population biomass
0
2
4
6
8
10
12
14
0
100
200
300
400
Y1 Y2 Y3 Y4 Y5 Y6 Y7
Weight Length
Oyster individual weight and length
0
20
40
60
80
0
2
4
6
8
10
Year 1 Year 2 Year 3
Seed
bio
mass (to
n T
FW
)
Seed
bio
mass (to
n T
FW
)
a)
b)
0 2 4 6 8 10 12
0 10 20 30 40 50 60 70 80
BOX
384.7 9.1
67.2
8.7
57.6
8.4
5.0
9.7
5.0
9.9
5.1
10.2
4.7
8.4
4.5
6.9
5.2
11.0
31
2436
35
34
33
32
5
Length (cm)
Weight (g)
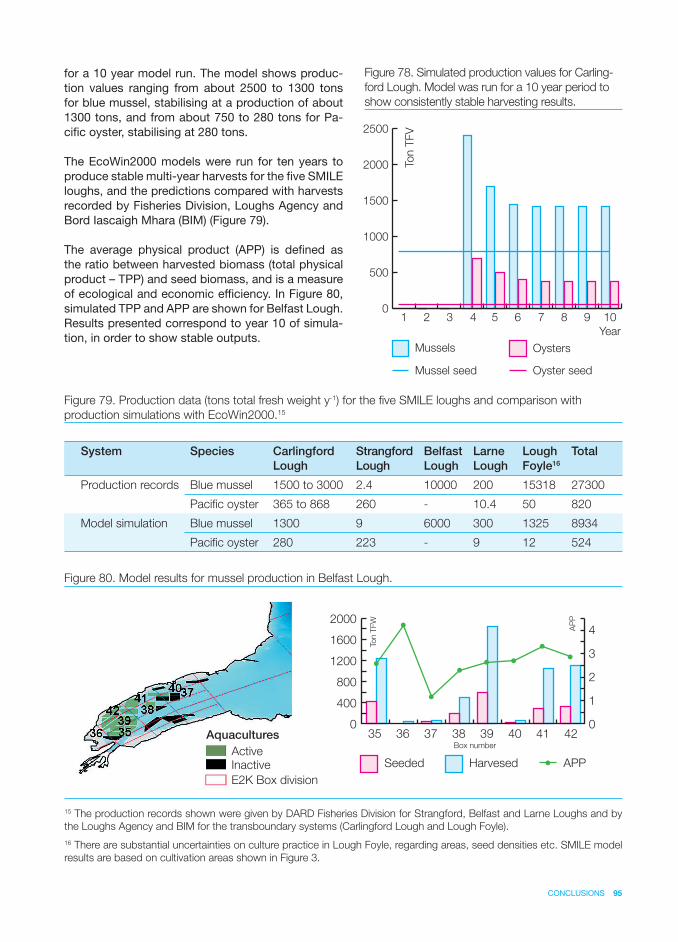
CONCLUSIONS 95
Aquacultures
Active
Inactive
E2K Box division
for a 10 year model run. The model shows produc-tion values ranging from about 2500 to 1300 tons for blue mussel, stabilising at a production of about 1300 tons, and from about 750 to 280 tons for Pa-cifi c oyster, stabilising at 280 tons.
The EcoWin2000 models were run for ten years to produce stable multi-year harvests for the fi ve SMILE loughs, and the predictions compared with harvests recorded by Fisheries Division, Loughs Agency and Bord Iascaigh Mhara (BIM) (Figure 79).
The average physical product (APP) is defi ned as the ratio between harvested biomass (total physical product – TPP) and seed biomass, and is a measure of ecological and economic effi ciency. In Figure 80, simulated TPP and APP are shown for Belfast Lough. Results presented correspond to year 10 of simula-tion, in order to show stable outputs.
Figure 78. Simulated production values for Carling-
ford Lough. Model was run for a 10 year period to
show consistently stable harvesting results.
Figure 79. Production data (tons total fresh weight y-1) for the fi ve SMILE loughs and comparison with
production simulations with EcoWin2000.15
System Species Carlingford
Lough
Strangford
Lough
Belfast
Lough
Larne
Lough
Lough
Foyle16
Total
Production records Blue mussel 1500 to 3000 2.4 10000 200 15318 27300
Pacifi c oyster 365 to 868 260 - 10.4 50 820
Model simulation Blue mussel 1300 9 6000 300 1325 8934
Pacifi c oyster 280 223 - 9 12 524
Figure 80. Model results for mussel production in Belfast Lough.
0
500
1000
1500
2000
2500
1 2 3 4 5 6 7 8 9 10
Year
Mussels
Mussel seed
Oysters
Oyster seed
Ton T
FV
15 The production records shown were given by DARD Fisheries Division for Strangford, Belfast and Larne Loughs and by
the Loughs Agency and BIM for the transboundary systems (Carlingford Lough and Lough Foyle).
16 There are substantial uncertainties on culture practice in Lough Foyle, regarding areas, seed densities etc. SMILE model
results are based on cultivation areas shown in Figure 3.
AP
P
Seeded Harvesed APP
0
400
800
1200
1600
2000
0
1
2
3
4
35 36 37 38 39 40 41 42
Ton T
FW
Box number
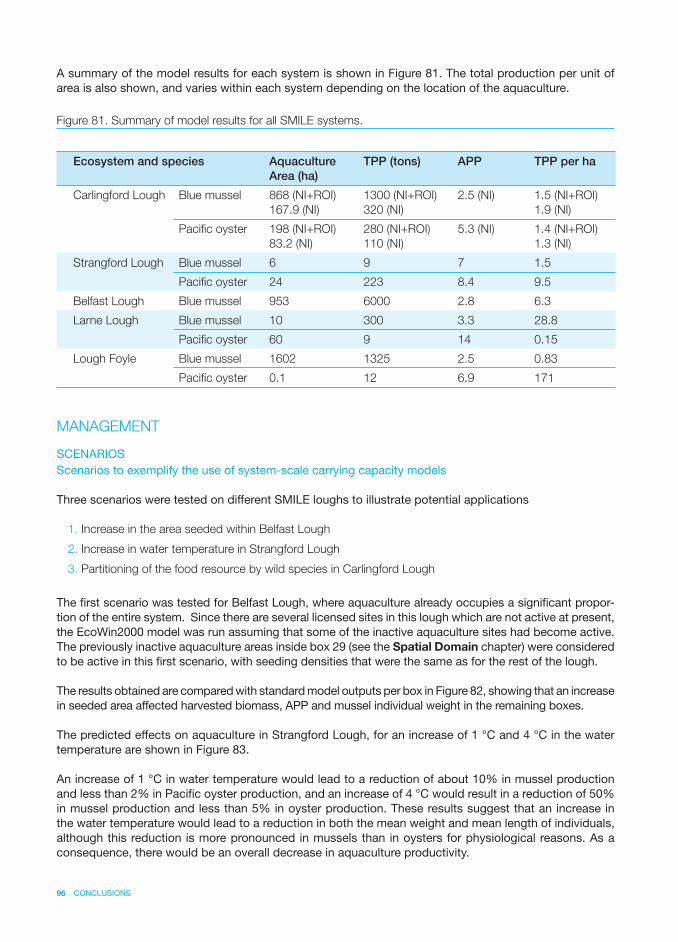
96 CONCLUSIONS
A summary of the model results for each system is shown in Figure 81. The total production per unit of area is also shown, and varies within each system depending on the location of the aquaculture.
MANAGEMENT
SCENARIOSScenarios to exemplify the use of system-scale carrying capacity models
Three scenarios were tested on different SMILE loughs to illustrate potential applications
1. Increase in the area seeded within Belfast Lough
2. Increase in water temperature in Strangford Lough
3. Partitioning of the food resource by wild species in Carlingford Lough
The fi rst scenario was tested for Belfast Lough, where aquaculture already occupies a signifi cant propor-tion of the entire system. Since there are several licensed sites in this lough which are not active at present, the EcoWin2000 model was run assuming that some of the inactive aquaculture sites had become active. The previously inactive aquaculture areas inside box 29 (see the Spatial Domain chapter) were considered to be active in this fi rst scenario, with seeding densities that were the same as for the rest of the lough.
The results obtained are compared with standard model outputs per box in Figure 82, showing that an increase in seeded area affected harvested biomass, APP and mussel individual weight in the remaining boxes.
The predicted effects on aquaculture in Strangford Lough, for an increase of 1 °C and 4 °C in the water temperature are shown in Figure 83.
An increase of 1 °C in water temperature would lead to a reduction of about 10% in mussel production and less than 2% in Pacifi c oyster production, and an increase of 4 °C would result in a reduction of 50% in mussel production and less than 5% in oyster production. These results suggest that an increase in the water temperature would lead to a reduction in both the mean weight and mean length of individuals, although this reduction is more pronounced in mussels than in oysters for physiological reasons. As a consequence, there would be an overall decrease in aquaculture productivity.
Figure 81. Summary of model results for all SMILE systems.
Ecosystem and species Aquaculture
Area (ha)
TPP (tons) APP TPP per ha
Carlingford Lough Blue mussel 868 (NI+ROI)
167.9 (NI)
1300 (NI+ROI)
320 (NI)
2.5 (NI) 1.5 (NI+ROI)
1.9 (NI)
Pacifi c oyster 198 (NI+ROI)
83.2 (NI)
280 (NI+ROI)
110 (NI)
5.3 (NI) 1.4 (NI+ROI)
1.3 (NI)
Strangford Lough Blue mussel 6 9 7 1.5
Pacifi c oyster 24 223 8.4 9.5
Belfast Lough Blue mussel 953 6000 2.8 6.3
Larne Lough Blue mussel 10 300 3.3 28.8
Pacifi c oyster 60 9 14 0.15
Lough Foyle Blue mussel 1602 1325 2.5 0.83
Pacifi c oyster 0.1 12 6.9 171
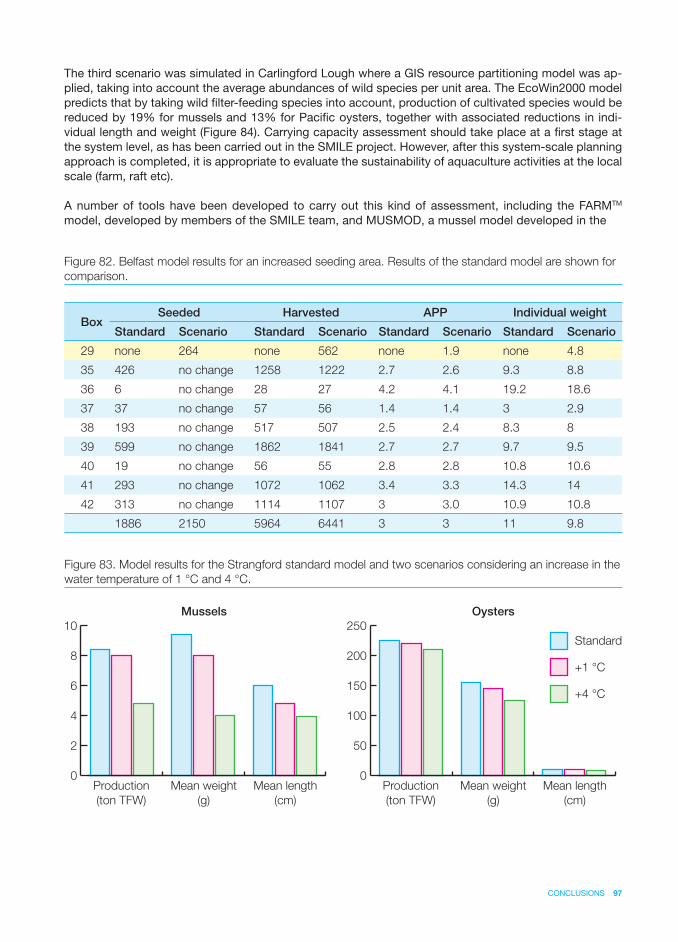
CONCLUSIONS 97
The third scenario was simulated in Carlingford Lough where a GIS resource partitioning model was ap-plied, taking into account the average abundances of wild species per unit area. The EcoWin2000 model predicts that by taking wild fi lter-feeding species into account, production of cultivated species would be reduced by 19% for mussels and 13% for Pacifi c oysters, together with associated reductions in indi-vidual length and weight (Figure 84). Carrying capacity assessment should take place at a fi rst stage at the system level, as has been carried out in the SMILE project. However, after this system-scale planning approach is completed, it is appropriate to evaluate the sustainability of aquaculture activities at the local scale (farm, raft etc).
A number of tools have been developed to carry out this kind of assessment, including the FARMTM model, developed by members of the SMILE team, and MUSMOD, a mussel model developed in the
Figure 82. Belfast model results for an increased seeding area. Results of the standard model are shown for
comparison.
BoxSeeded Harvested APP Individual weight
Standard Scenario Standard Scenario Standard Scenario Standard Scenario
29 none 264 none 562 none 1.9 none 4.8
35 426 no change 1258 1222 2.7 2.6 9.3 8.8
36 6 no change 28 27 4.2 4.1 19.2 18.6
37 37 no change 57 56 1.4 1.4 3 2.9
38 193 no change 517 507 2.5 2.4 8.3 8
39 599 no change 1862 1841 2.7 2.7 9.7 9.5
40 19 no change 56 55 2.8 2.8 10.8 10.6
41 293 no change 1072 1062 3.4 3.3 14.3 14
42 313 no change 1114 1107 3 3.0 10.9 10.8
1886 2150 5964 6441 3 3 11 9.8
Figure 83. Model results for the Strangford standard model and two scenarios considering an increase in the
water temperature of 1 °C and 4 °C.
0
2
4
6
8
10
0
50
100
150
200
250
Production
(ton TFW)
Mean weight
(g)
Mean length
(cm)
Production
(ton TFW)
Mean weight
(g)
Mean length
(cm)
Mussels Oysters
Standard
+1 °C
+4 °C
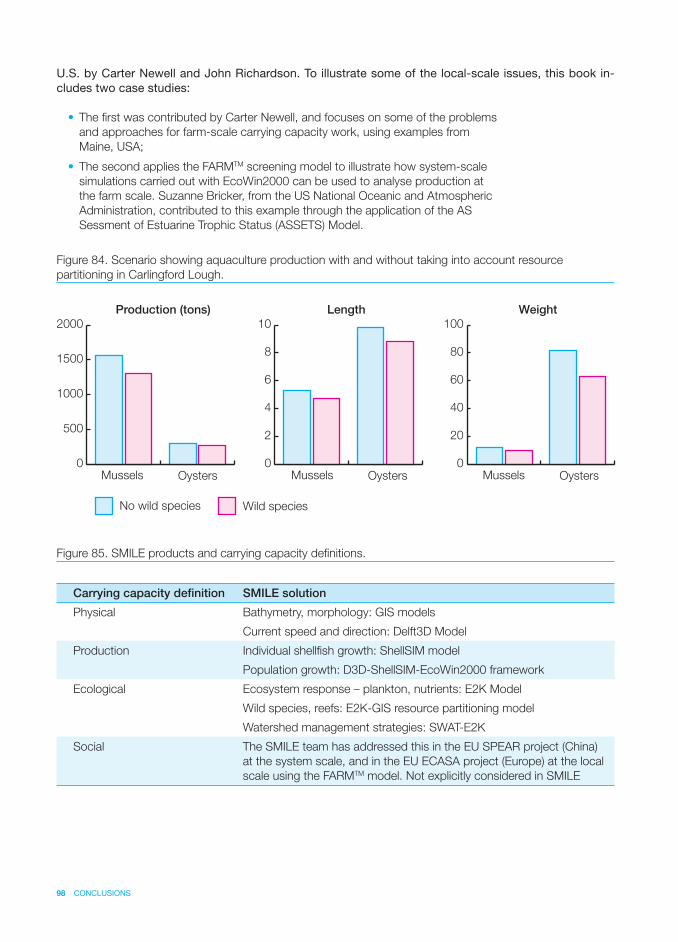
98 CONCLUSIONS
U.S. by Carter Newell and John Richardson. To illustrate some of the local-scale issues, this book in-cludes two case studies:
• The fi rst was contributed by Carter Newell, and focuses on some of the problems
and approaches for farm-scale carrying capacity work, using examples from
Maine, USA;
• The second applies the FARMTM screening model to illustrate how system-scale
simulations carried out with EcoWin2000 can be used to analyse production at
the farm scale. Suzanne Bricker, from the US National Oceanic and Atmospheric
Administration, contributed to this example through the application of the AS
Sessment of Estuarine Trophic Status (ASSETS) Model.
Carrying capacity defi nition SMILE solution
Physical Bathymetry, morphology: GIS models
Current speed and direction: Delft3D Model
Production Individual shellfi sh growth: ShellSIM model
Population growth: D3D-ShellSIM-EcoWin2000 framework
Ecological Ecosystem response – plankton, nutrients: E2K Model
Wild species, reefs: E2K-GIS resource partitioning model
Watershed management strategies: SWAT-E2K
Social The SMILE team has addressed this in the EU SPEAR project (China)
at the system scale, and in the EU ECASA project (Europe) at the local
scale using the FARMTM model. Not explicitly considered in SMILE
Figure 85. SMILE products and carrying capacity defi nitions.
Figure 84. Scenario showing aquaculture production with and without taking into account resource
partitioning in Carlingford Lough.
0
500
1000
1500
2000
0
2
4
6
8
10
0
20
40
60
80
100
Production (tons) Length Weight
Mussels Oysters Mussels Oysters Mussels Oysters
No wild species Wild species
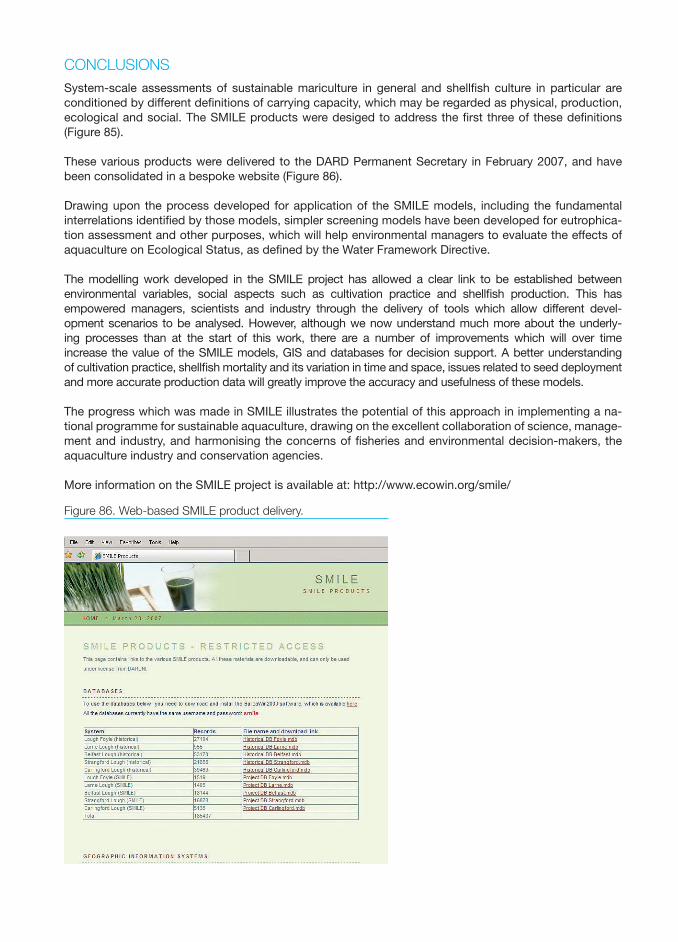
CONCLUSIONS
System-scale assessments of sustainable mariculture in general and shellfi sh culture in particular are conditioned by different defi nitions of carrying capacity, which may be regarded as physical, production, ecological and social. The SMILE products were desiged to address the fi rst three of these defi nitions (Figure 85).
These various products were delivered to the DARD Permanent Secretary in February 2007, and have been consolidated in a bespoke website (Figure 86).
Drawing upon the process developed for application of the SMILE models, including the fundamental interrelations identifi ed by those models, simpler screening models have been developed for eutrophica-tion assessment and other purposes, which will help environmental managers to evaluate the effects of aquaculture on Ecological Status, as defi ned by the Water Framework Directive.
The modelling work developed in the SMILE project has allowed a clear link to be established between environmental variables, social aspects such as cultivation practice and shellfi sh production. This has empowered managers, scientists and industry through the delivery of tools which allow different devel-opment scenarios to be analysed. However, although we now understand much more about the underly-ing processes than at the start of this work, there are a number of improvements which will over time increase the value of the SMILE models, GIS and databases for decision support. A better understanding of cultivation practice, shellfi sh mortality and its variation in time and space, issues related to seed deployment and more accurate production data will greatly improve the accuracy and usefulness of these models.
The progress which was made in SMILE illustrates the potential of this approach in implementing a na-tional programme for sustainable aquaculture, drawing on the excellent collaboration of science, manage-ment and industry, and harmonising the concerns of fi sheries and environmental decision-makers, the aquaculture industry and conservation agencies.
More information on the SMILE project is available at: http://www.ecowin.org/smile/
Figure 86. Web-based SMILE product delivery.