Embed Size (px)
Citation preview
Topic
Notes for the Facilitator
2
Learning Objective
TABLE OF CONTENTS Learning Objectives 3 Approved Resource Materials 4 Glossary Terms 5 Module-At-A-Glance 7 Step-By-Step Instructions
Introduction 11 Carbon Intensity of Energy Sources 14 Why Carbon Matters to Manufacturers 18 How Manufacturers Pay For Energy 23 Energy Efficiency 29
Appendix A: Video Resource List 36 Appendix B: Module Quizzes 37 Appendix B: Facilitator Materials
KLW Chart 43 Environmental Terms Crossword 44 What Is Energy Explained 46 The Use of Energy In The United States Explained 48 Your Family’s Carbon Footprint 50 A Simple Energy Audit 57
Concluding Activity 60
Topic
Notes for the Facilitator
3
Learning Objective
LEARNING OBJECTIVES
By the end of this session, students will be able to:
• Define energy.
• Rank the carbon intensity of various energy sources.
• Describe the role of carbon dioxide and other air emissions in the greenhouse effect.
• Calculate a discrete carbon footprint and propose ways to reduce it.
• Read and disseminate information from an industrial energy bill.
• Recognize energy intensive manufacturing processes and equipment.
Topic
Notes for the Facilitator
4
Learning Objective
APPROVED RESOURCE MATERIALS
Throughout the workshop, you will see references to approved materials not included in Appendix C which include:
Carbon Dioxide Emissions from the Generation of Electric Power in the United States: http://www.eia.gov/cneaf/electricity/page/co2_report/co2emiss.pdf Life Cycle Balance and Greenhouse Gas Emissions of Nuclear Energy: http://www.isa.org.usyd.edu.au/publications/documents/ISA_Nuclear_Report.pdf Climate Literacy: The Essential Principals of Climate Sciences: http://downloads.climatescience.gov/Literacy/Climate%20Literacy%20Booklet%20Low-Res.pdf Energy Policy Act of 2005: http://www1.eere.energy.gov/femp/regulations/epact2005.html Energy Strategy for the Road Ahead: Scenario Thinking for Business Executives and Corporate Boards: http://www.energystar.gov/ia/business/GBN_Energy_Strategy.pdf Energy Efficiency Improvement and Cost Saving Opportunities for the Vehicle Assembly Industry: An ENERGY STAR® Guide for Energy and Plant Managers: http://www.energystar.gov/ia/business/industry/LBNL-50939.pdf Energy Efficiency Improvement and Cost Saving Opportunities for the Vehicle Assembly Industry: http://www.energystar.gov/ia/business/industry/LBNL-50939.pdf.
Topic
Notes for the Facilitator
5
Learning Objective
Glossary Terms
Alternative energy—energy derived from nontraditional sources (e.g., compressed natural gas, solar, hydroelectric, wind).
Autonomous maintenance—ongoing maintenance activities performed by equipment operators on their own equipment.
Carbon dioxide—naturally occurring gas, and also a byproduct of burning fossil fuels and biomass, as well as land-use changes and other industrial processes. It is the principal anthropogenic greenhouse gas that affects the Earth's radiative balance.
Carbon footprint—the total amount of greenhouse gases that are emitted into the atmosphere each year by a person, family, building, organization, or company.
Carbon intensity—the amount of carbon by weight emitted per unit of energy consumed. A common measure of carbon intensity is weight of carbon per British thermal unit (Btu) of energy.
Climate—the average weather in an area.
Consumption charges—charge applied for the amount of an energy source used during a billing period.
Demand charges—charge applied in an electricity bill that is based on the peak use each month averaged over a short time period.
Electricity—a form of energy generated by creating an electrical charge.
Energy—the capacity to perform work.
Energy audit—accounting analysis of energy flows in a building, process, or system to establish a baseline for the amount of energy input into the system and to identify potential reductions.
Energy efficiency —reducing the amount of energy required to heat and cool homes, and to power appliances and electronics.
Fuel adjustment charges—charges that account for fluctuations in the cost of fuel, or purchased power, used to supply electricity.
Fuel costs—amount charged for the fuel you receive and a delivery charge for the transportation and delivery of the fuel. Fuel charges can vary based on seasonal demand or by the volume purchased.
Topic
Notes for the Facilitator
6
Learning Objective
Glossary Terms
Greenhouse effect—trapping and build-up of heat in the atmosphere (troposphere) near the Earth’s surface.
Greenhouse gas—any gas that absorbs infrared radiation in the atmosphere. Greenhouse gases include, but are not limited to, water vapor, carbon dioxide (CO2), methane (CH4), nitrous oxide (N2O), chlorofluorocarbons (CFCs), hydrochlorofluorocarbons (HCFCs), ozone (O3), hydrofluorocarbons (HFCs), perfluorocarbons (PFCs), and sulfur hexafluoride (SF6).
Infrared radiation—radiation emitted by the Earth's surface, the atmosphere and the clouds.
Non-renewable energy—energy from a natural resource that cannot be re-made, re-grown or regenerated on a scale comparative to its consumption.
Peak demand—measure of metered usage at the highest rate over a short (15, 30, or 60 minute) interval for the billing period.
Power factor adjustments—charges that account for a manufacturing facility’s ability to effectively convert the electrical input current and voltage into “useful” electric power.
Radiation—transmission of energy though space or any medium.
Renewable energy—energy obtained from sources that are essentially inexhaustible. Renewable sources of energy include wood, waste, geothermal, wind, photovoltaic, and solar thermal energy.
Solar radiation—radiation emitted by the sun.
Total productive maintenance—to focus on optimizing the effectiveness of manufacturing equipment through team-based maintenance that involves employees at every level and function.
Transmission charges—charge added to a customer's energy bill to cover the cost of delivering energy over the distance between the supply or generation facility to the local utility's distribution system.
Visual controls—graphic prompts or cues that reinforce standardized procedures or display the status of an activity that every employee can see and take appropriate action.
Weather—atmospheric condition at any given time or place.
Topic
Notes for the Facilitator
7
Learning Objective
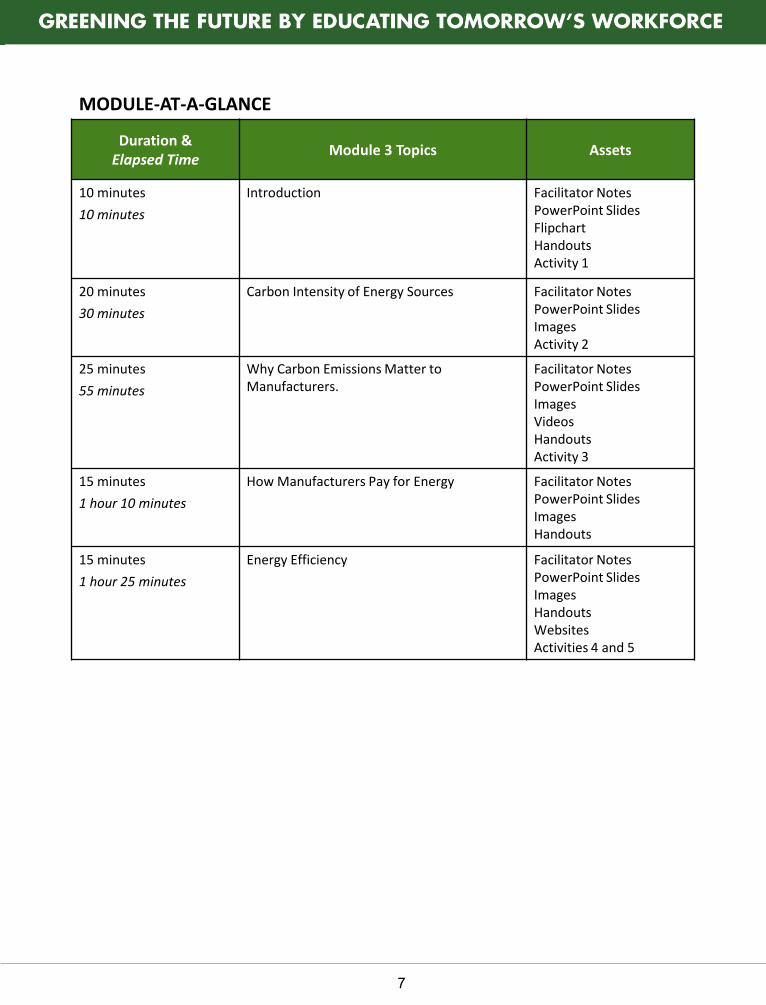
MODULE-AT-A-GLANCE
Duration & Elapsed Time
Module 3 Topics Assets
10 minutes
10 minutes
Introduction Facilitator Notes PowerPoint Slides Flipchart Handouts Activity 1
20 minutes
30 minutes
Carbon Intensity of Energy Sources
Facilitator Notes PowerPoint Slides Images Activity 2
25 minutes
55 minutes
Why Carbon Emissions Matter to Manufacturers.
Facilitator Notes PowerPoint Slides Images Videos Handouts Activity 3
15 minutes
1 hour 10 minutes
How Manufacturers Pay for Energy Facilitator Notes PowerPoint Slides Images Handouts
15 minutes
1 hour 25 minutes
Energy Efficiency Facilitator Notes PowerPoint Slides Images Handouts Websites Activities 4 and 5

Topic
Notes for the Facilitator
8
Learning Objective
MODULE-AT-A-GLANCE (continued)
Duration Module 3 Activities Materials
10 minutes Activity 1: Know, Want to Know, Learned (K-W-L) Chart Handout
5 minutes Activity 2: Ranking Carbon Intensity of Energy Sources Graphics
20 minutes Activity 3: Calculating Carbon Footprint Website Handout
15 minutes Activity 4: Kia Virtual Tour Website
25 minutes Activity 5: A Simple Energy Audit Handout
TOTAL TIME: 2 HOURS, 40 MINUTES

Topic
Notes for the Facilitator
9
Learning Objective
Step-by-Step Instructions
Topic
Notes for the Facilitator
10
Learning Objective
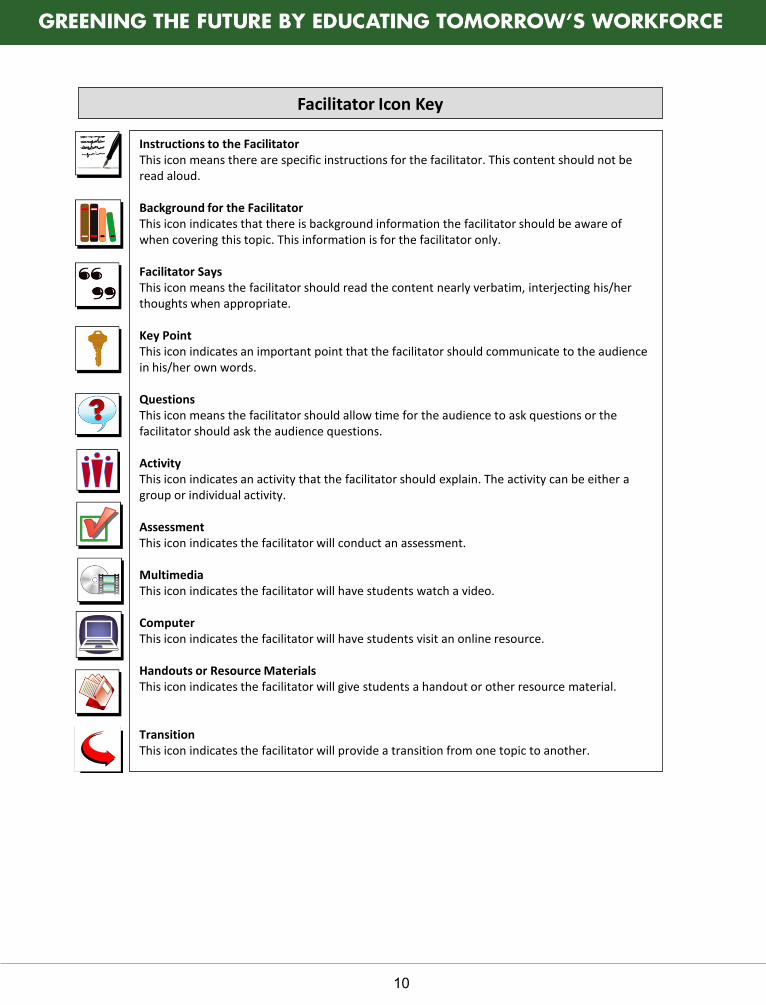
Facilitator Icon Key
Instructions to the Facilitator This icon means there are specific instructions for the facilitator. This content should not be read aloud. Background for the Facilitator This icon indicates that there is background information the facilitator should be aware of when covering this topic. This information is for the facilitator only. Facilitator Says This icon means the facilitator should read the content nearly verbatim, interjecting his/her thoughts when appropriate. Key Point This icon indicates an important point that the facilitator should communicate to the audience in his/her own words. Questions This icon means the facilitator should allow time for the audience to ask questions or the facilitator should ask the audience questions. Activity This icon indicates an activity that the facilitator should explain. The activity can be either a group or individual activity. Assessment This icon indicates the facilitator will conduct an assessment. Multimedia This icon indicates the facilitator will have students watch a video. Computer This icon indicates the facilitator will have students visit an online resource. Handouts or Resource Materials This icon indicates the facilitator will give students a handout or other resource material. Transition This icon indicates the facilitator will provide a transition from one topic to another.
Topic
Notes for the Facilitator
11
Learning Objective
Introduction 10 minutes
As a class or in small groups, ask students to brainstorm what they already know about energy efficiency or carbon footprints and what they would like to know. Pass out the Know, Want to Know, Learned (K-W-L) chart. Have students begin a K-W-L chart. The K-W-L strategy allows students to take inventory of what they already know and what they want to know. This chart is to be completed by the end of the module. Possible homework assignments: Add “How we can learn more” (H) to the K-W-L chart and ask students to select a related topic to research and present to the class.
Define energy.
Topic
Notes for the Facilitator
12
Learning Objective
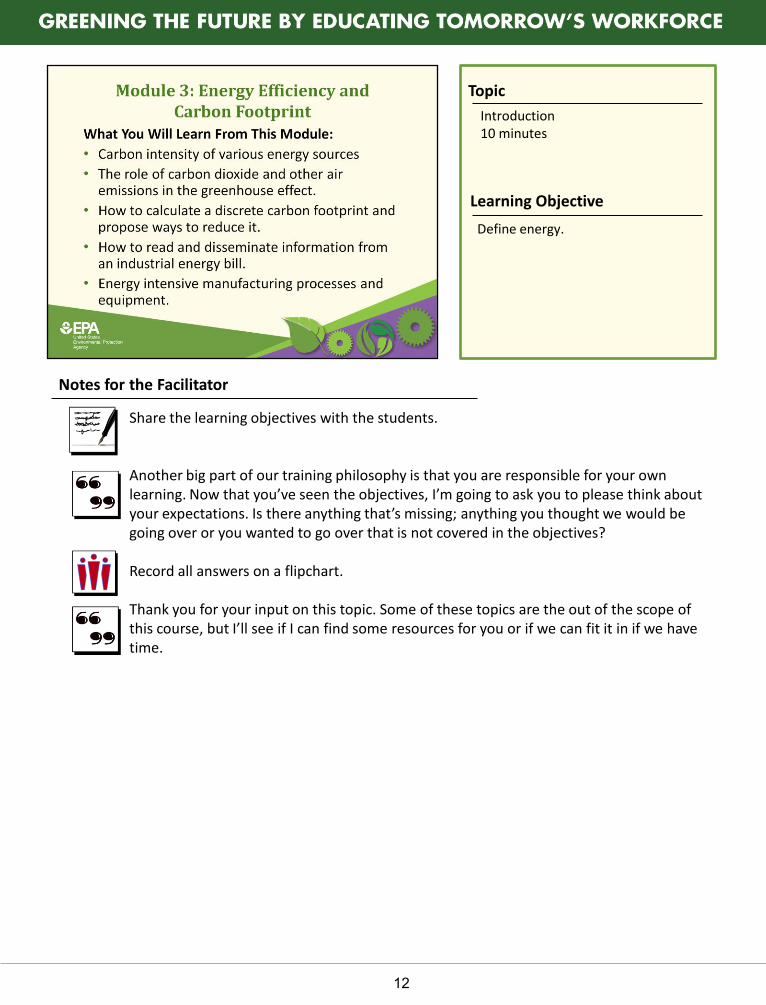
Share the learning objectives with the students. Another big part of our training philosophy is that you are responsible for your own learning. Now that you’ve seen the objectives, I’m going to ask you to please think about your expectations. Is there anything that’s missing; anything you thought we would be going over or you wanted to go over that is not covered in the objectives? Record all answers on a flipchart. Thank you for your input on this topic. Some of these topics are the out of the scope of this course, but I’ll see if I can find some resources for you or if we can fit it in if we have time.
Introduction 10 minutes
Define energy.

Topic
Notes for the Facilitator
13
Learning Objective
Introduce topic by asking the following questions: • What is energy? Energy is the capacity for doing work. • What are primary energy sources in the United States? Petroleum (oil), natural gas, coal,
nuclear, and renewable energy. • Where do we use energy? Everywhere! Ask students for examples. • How are energy costs currently trending? Is there potential for manufacturers to
significantly reduce costs by saving energy? Show this video to help make the case for why manufacturers care about energy use. Reinventing Fire: http://www.youtube.com/watch?v=lT-g__695Go Primary energy sources are commonly measured in different units: barrels (= 42 gallons) of oil, cubic feet of natural gas, tons of coal. To compare across fuels, we need to use a common unit of measure. The United States uses Btu, or British thermal units, which measure fuel use by the energy content of each fuel source. Print copies or project on screen the two short articles from the U.S. Energy Information Administration for students to read about energy. The handouts are located in Appendix C. • What Is Energy Explained • The Use of Energy in the United States Explained
Introduction 10 minutes
Define energy.
Topic
Notes for the Facilitator
14
Learning Objective
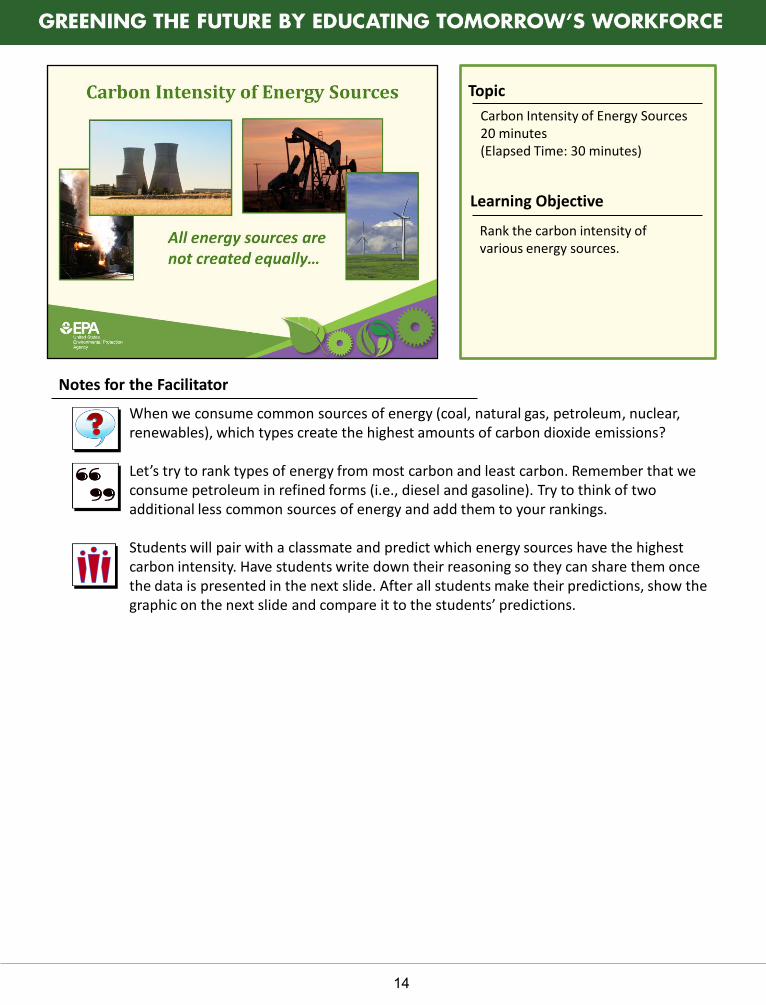
When we consume common sources of energy (coal, natural gas, petroleum, nuclear, renewables), which types create the highest amounts of carbon dioxide emissions? Let’s try to rank types of energy from most carbon and least carbon. Remember that we consume petroleum in refined forms (i.e., diesel and gasoline). Try to think of two additional less common sources of energy and add them to your rankings. Students will pair with a classmate and predict which energy sources have the highest carbon intensity. Have students write down their reasoning so they can share them once the data is presented in the next slide. After all students make their predictions, show the graphic on the next slide and compare it to the students’ predictions.
Carbon Intensity of Energy Sources 20 minutes (Elapsed Time: 30 minutes)
Rank the carbon intensity of various energy sources.
Topic
Notes for the Facilitator
15
Learning Objective
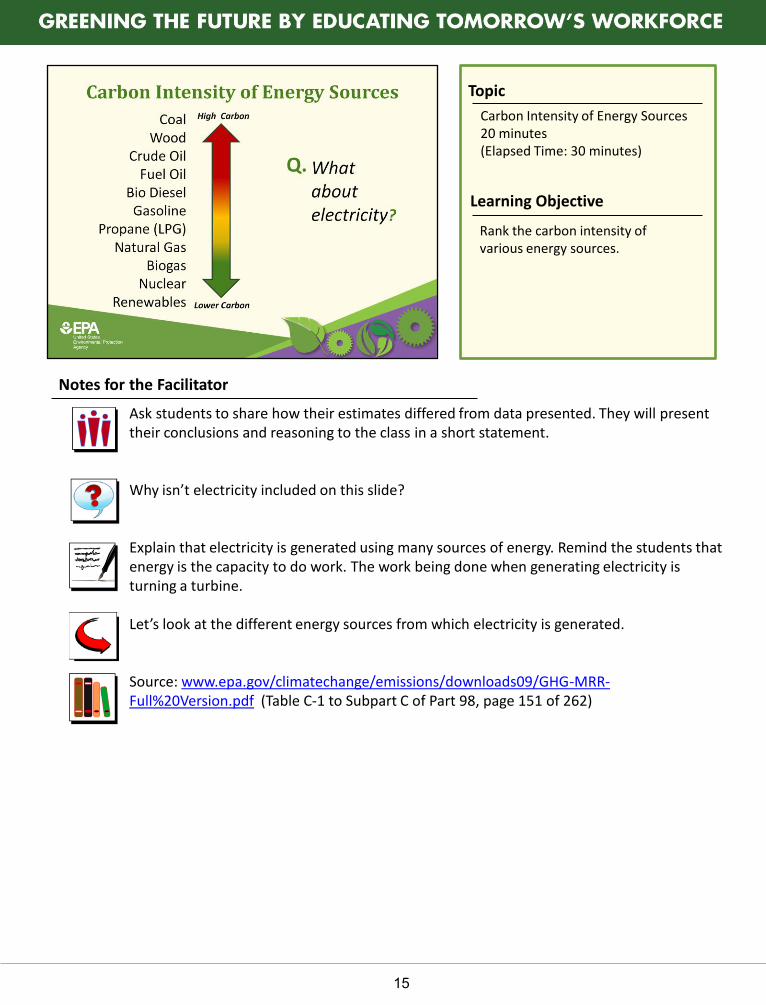
Ask students to share how their estimates differed from data presented. They will present their conclusions and reasoning to the class in a short statement. Why isn’t electricity included on this slide? Explain that electricity is generated using many sources of energy. Remind the students that energy is the capacity to do work. The work being done when generating electricity is turning a turbine. Let’s look at the different energy sources from which electricity is generated. Source: www.epa.gov/climatechange/emissions/downloads09/GHG-MRR-Full%20Version.pdf (Table C-1 to Subpart C of Part 98, page 151 of 262)
Carbon Intensity of Energy Sources 20 minutes (Elapsed Time: 30 minutes)
Rank the carbon intensity of various energy sources.
Topic
Notes for the Facilitator
16
Learning Objective
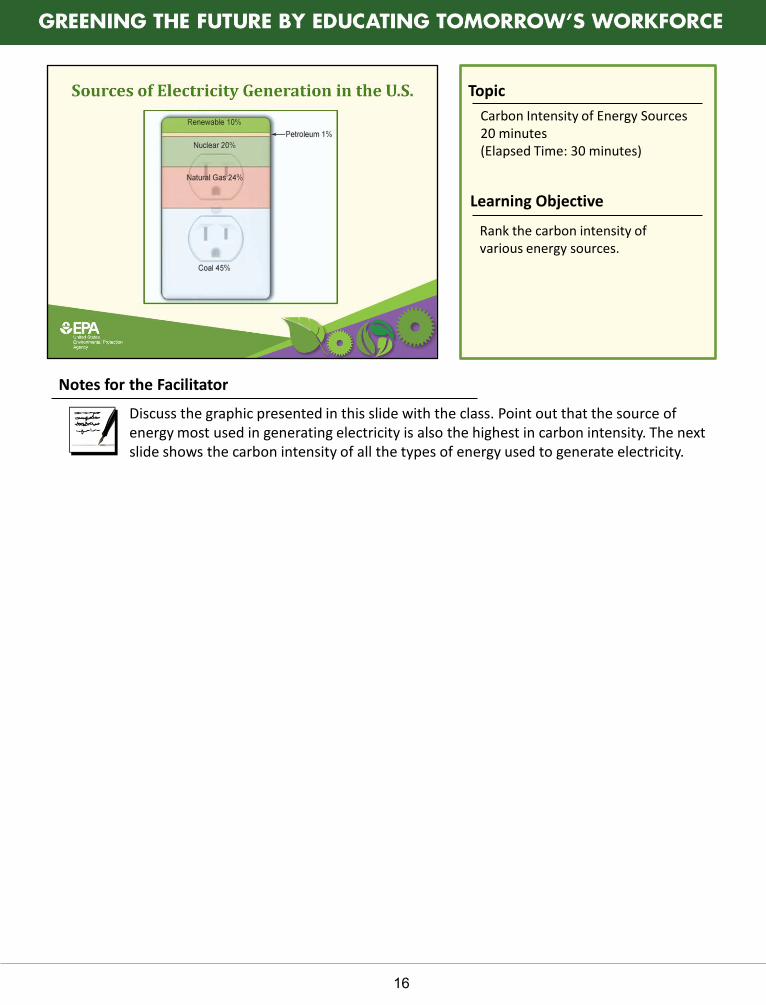
Discuss the graphic presented in this slide with the class. Point out that the source of energy most used in generating electricity is also the highest in carbon intensity. The next slide shows the carbon intensity of all the types of energy used to generate electricity.
Carbon Intensity of Energy Sources 20 minutes (Elapsed Time: 30 minutes)
Rank the carbon intensity of various energy sources.
Topic
Notes for the Facilitator
17
Learning Objective
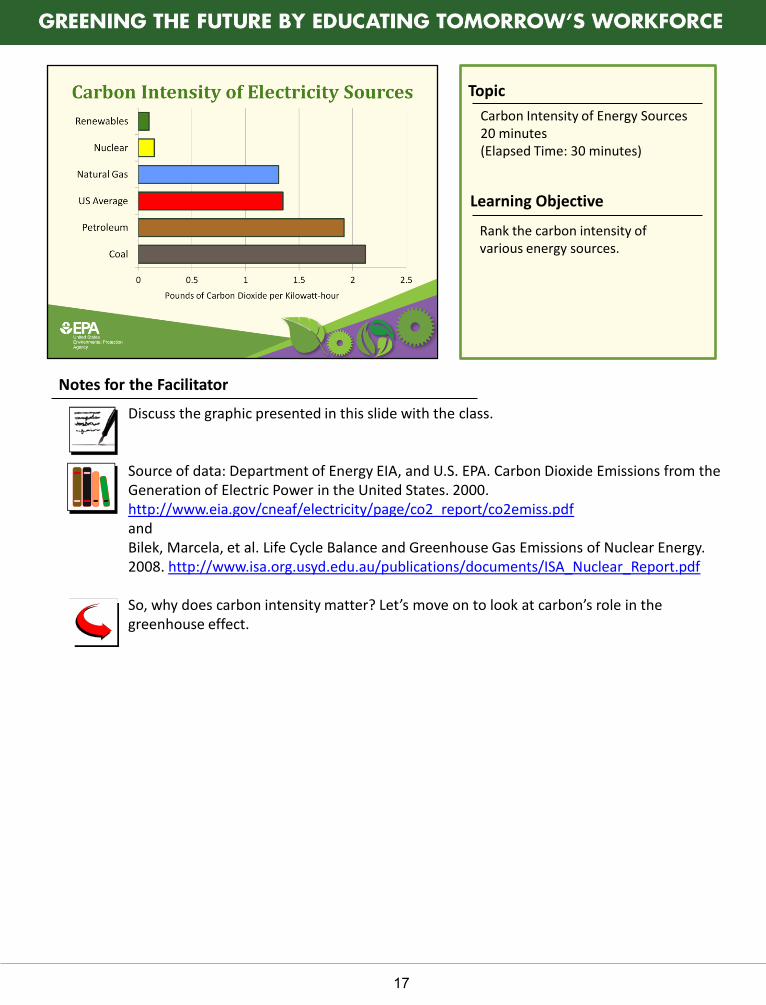
Discuss the graphic presented in this slide with the class. Source of data: Department of Energy EIA, and U.S. EPA. Carbon Dioxide Emissions from the Generation of Electric Power in the United States. 2000. http://www.eia.gov/cneaf/electricity/page/co2_report/co2emiss.pdf and Bilek, Marcela, et al. Life Cycle Balance and Greenhouse Gas Emissions of Nuclear Energy. 2008. http://www.isa.org.usyd.edu.au/publications/documents/ISA_Nuclear_Report.pdf So, why does carbon intensity matter? Let’s move on to look at carbon’s role in the greenhouse effect.
Carbon Intensity of Energy Sources 20 minutes (Elapsed Time: 30 minutes)
Rank the carbon intensity of various energy sources.
Topic
Notes for the Facilitator
18
Learning Objective
Watch Robert Krulwich's five-part cartoon series, Global Warming: It's All About Carbon http://www.npr.org/news/specials/climate/video. If time is not available to watch the entire series, episodes 1, 4, and 5 are most relevant.
Why Carbon Emissions Matter to Manufacturers 25 minutes (Elapsed Time: 55 minutes)
Describe the role of carbon dioxide and other air emissions in the greenhouse effect.
Topic
Notes for the Facilitator
19
Learning Objective
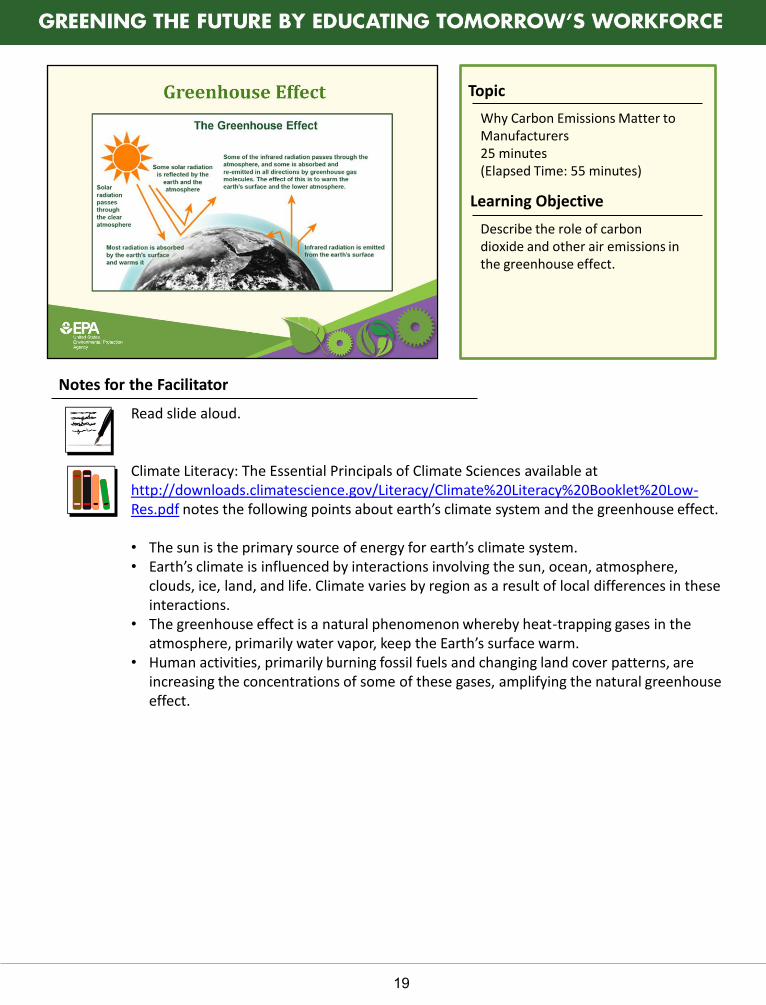
Read slide aloud. Climate Literacy: The Essential Principals of Climate Sciences available at http://downloads.climatescience.gov/Literacy/Climate%20Literacy%20Booklet%20Low-Res.pdf notes the following points about earth’s climate system and the greenhouse effect. • The sun is the primary source of energy for earth’s climate system. • Earth’s climate is influenced by interactions involving the sun, ocean, atmosphere,
clouds, ice, land, and life. Climate varies by region as a result of local differences in these interactions.
• The greenhouse effect is a natural phenomenon whereby heat-trapping gases in the atmosphere, primarily water vapor, keep the Earth’s surface warm.
• Human activities, primarily burning fossil fuels and changing land cover patterns, are increasing the concentrations of some of these gases, amplifying the natural greenhouse effect.
Describe the role of carbon dioxide and other air emissions in the greenhouse effect.
Why Carbon Emissions Matter to Manufacturers 25 minutes (Elapsed Time: 55 minutes)
Topic
Notes for the Facilitator
20
Learning Objective
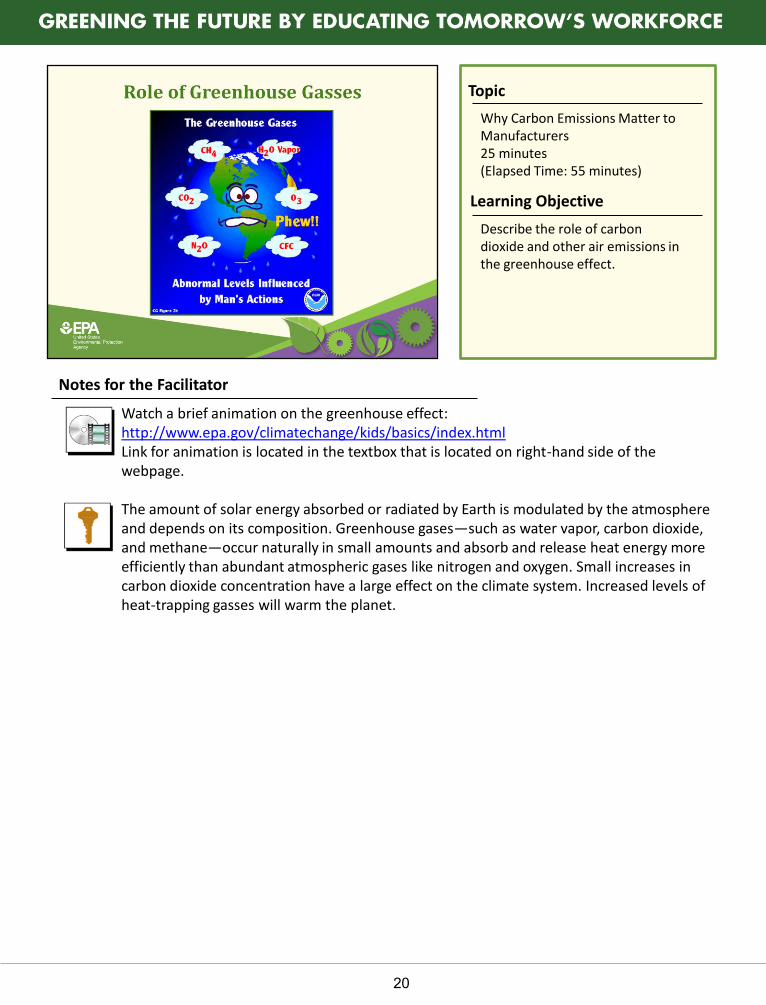
Watch a brief animation on the greenhouse effect: http://www.epa.gov/climatechange/kids/basics/index.html Link for animation is located in the textbox that is located on right-hand side of the webpage. The amount of solar energy absorbed or radiated by Earth is modulated by the atmosphere and depends on its composition. Greenhouse gases—such as water vapor, carbon dioxide, and methane—occur naturally in small amounts and absorb and release heat energy more efficiently than abundant atmospheric gases like nitrogen and oxygen. Small increases in carbon dioxide concentration have a large effect on the climate system. Increased levels of heat-trapping gasses will warm the planet.
Describe the role of carbon dioxide and other air emissions in the greenhouse effect.
Why Carbon Emissions Matter to Manufacturers 25 minutes (Elapsed Time: 55 minutes)
Topic
Notes for the Facilitator
21
Learning Objective
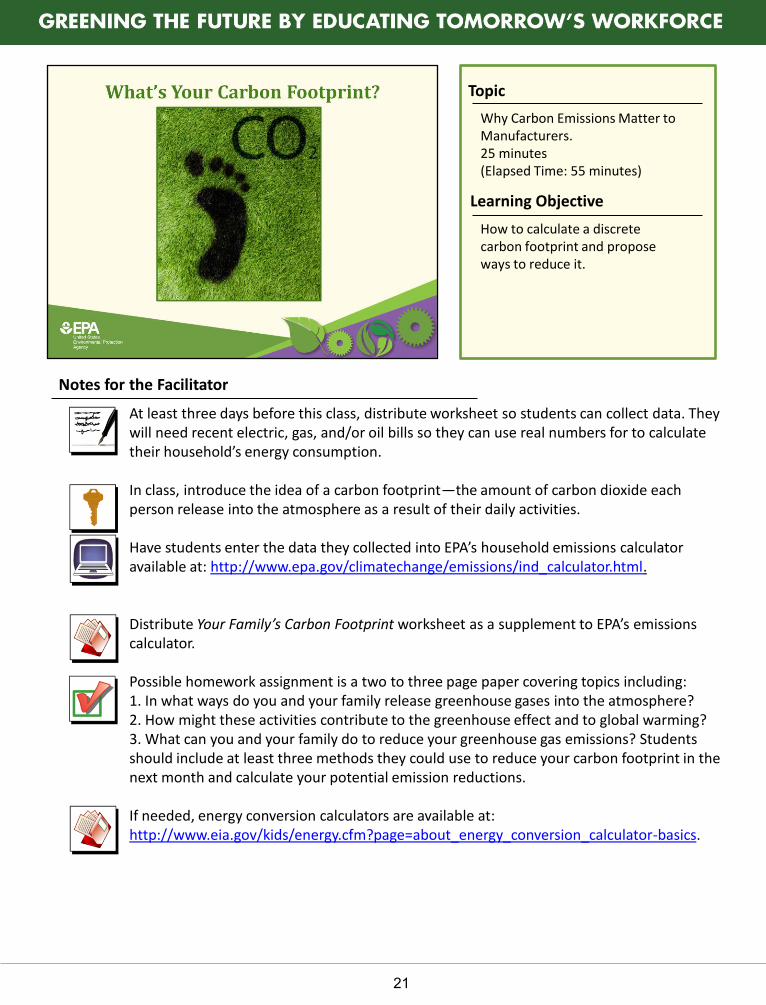
At least three days before this class, distribute worksheet so students can collect data. They will need recent electric, gas, and/or oil bills so they can use real numbers for to calculate their household’s energy consumption. In class, introduce the idea of a carbon footprint—the amount of carbon dioxide each person release into the atmosphere as a result of their daily activities. Have students enter the data they collected into EPA’s household emissions calculator available at: http://www.epa.gov/climatechange/emissions/ind_calculator.html. Distribute Your Family’s Carbon Footprint worksheet as a supplement to EPA’s emissions calculator. Possible homework assignment is a two to three page paper covering topics including: 1. In what ways do you and your family release greenhouse gases into the atmosphere? 2. How might these activities contribute to the greenhouse effect and to global warming? 3. What can you and your family do to reduce your greenhouse gas emissions? Students should include at least three methods they could use to reduce your carbon footprint in the next month and calculate your potential emission reductions. If needed, energy conversion calculators are available at: http://www.eia.gov/kids/energy.cfm?page=about_energy_conversion_calculator-basics.
How to calculate a discrete carbon footprint and propose ways to reduce it.
Why Carbon Emissions Matter to Manufacturers. 25 minutes (Elapsed Time: 55 minutes)

Topic
Notes for the Facilitator
22
Learning Objective
This quiz can serve as the end or the beginning a classroom session. The material covered in the rest of module 3 builds upon the material covered in this quiz. See Appendix B for sample quiz and answer key.
Topic
Notes for the Facilitator
23
Learning Objective
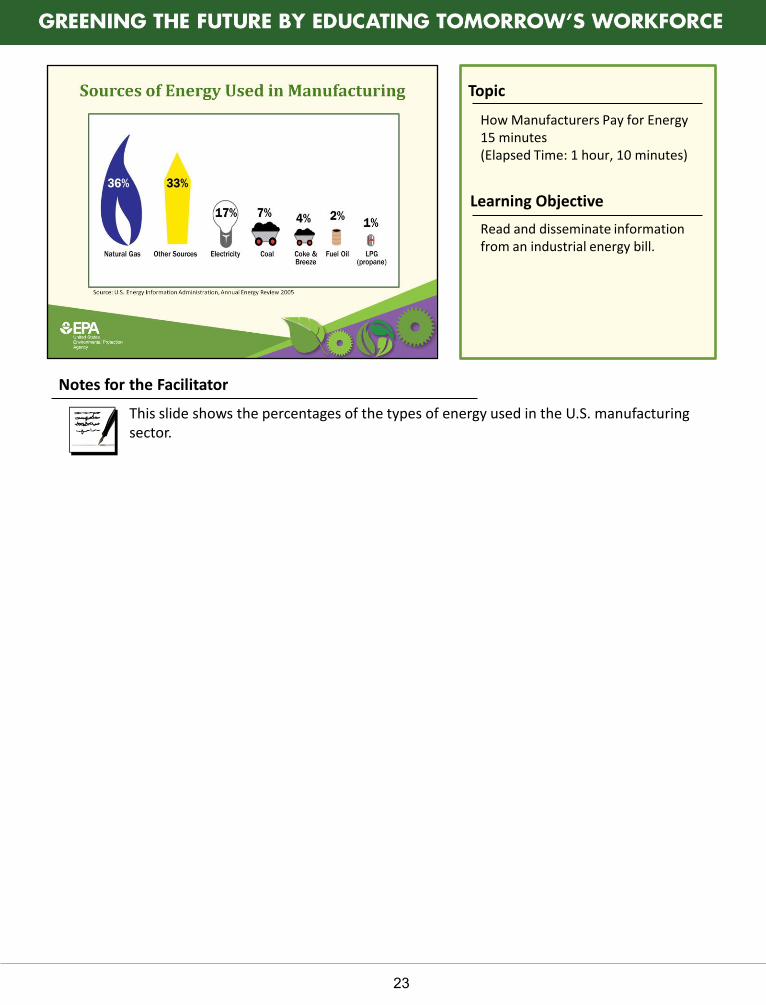
This slide shows the percentages of the types of energy used in the U.S. manufacturing sector.
How Manufacturers Pay for Energy 15 minutes (Elapsed Time: 1 hour, 10 minutes)
Read and disseminate information from an industrial energy bill.
Topic
Notes for the Facilitator
24
Learning Objective
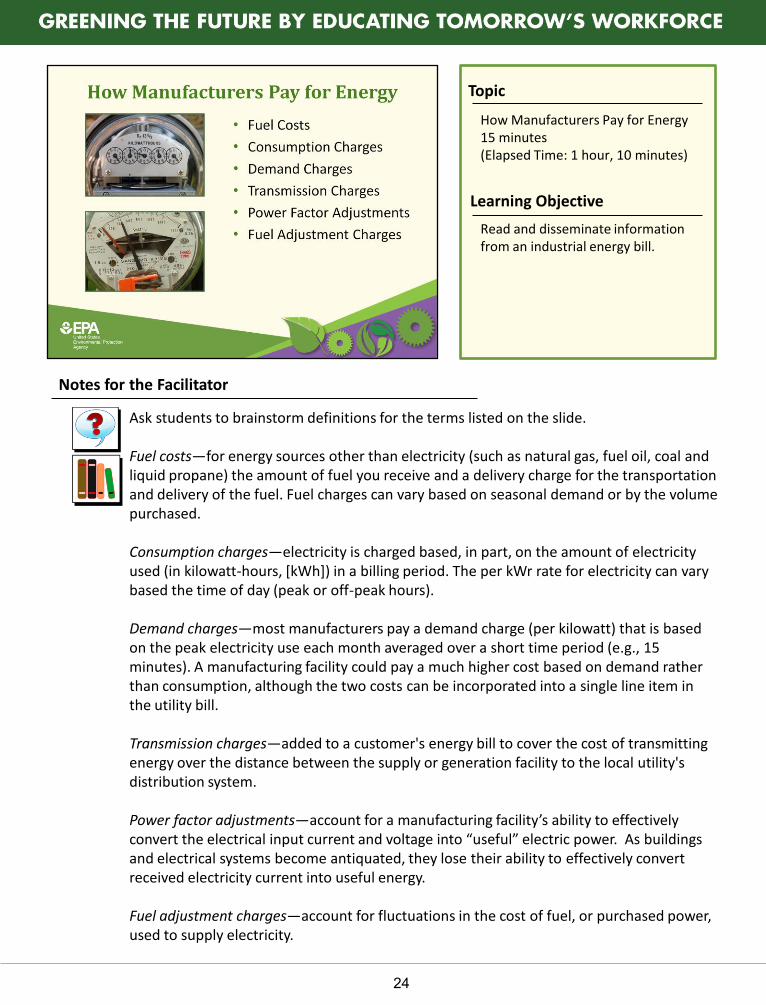
Ask students to brainstorm definitions for the terms listed on the slide. Fuel costs—for energy sources other than electricity (such as natural gas, fuel oil, coal and liquid propane) the amount of fuel you receive and a delivery charge for the transportation and delivery of the fuel. Fuel charges can vary based on seasonal demand or by the volume purchased. Consumption charges—electricity is charged based, in part, on the amount of electricity used (in kilowatt-hours, [kWh]) in a billing period. The per kWr rate for electricity can vary based the time of day (peak or off-peak hours). Demand charges—most manufacturers pay a demand charge (per kilowatt) that is based on the peak electricity use each month averaged over a short time period (e.g., 15 minutes). A manufacturing facility could pay a much higher cost based on demand rather than consumption, although the two costs can be incorporated into a single line item in the utility bill. Transmission charges—added to a customer's energy bill to cover the cost of transmitting energy over the distance between the supply or generation facility to the local utility's distribution system. Power factor adjustments—account for a manufacturing facility’s ability to effectively convert the electrical input current and voltage into “useful” electric power. As buildings and electrical systems become antiquated, they lose their ability to effectively convert received electricity current into useful energy. Fuel adjustment charges—account for fluctuations in the cost of fuel, or purchased power, used to supply electricity.
How Manufacturers Pay for Energy 15 minutes (Elapsed Time: 1 hour, 10 minutes)
Read and disseminate information from an industrial energy bill.
Topic
Notes for the Facilitator
25
Learning Objective
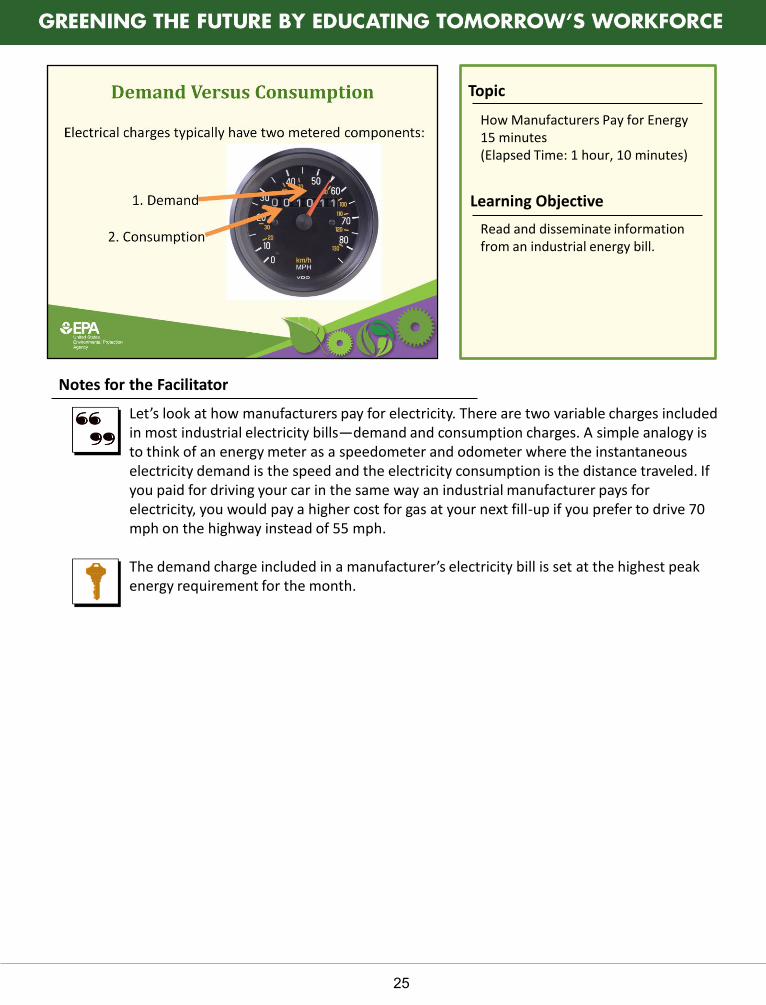
Let’s look at how manufacturers pay for electricity. There are two variable charges included in most industrial electricity bills—demand and consumption charges. A simple analogy is to think of an energy meter as a speedometer and odometer where the instantaneous electricity demand is the speed and the electricity consumption is the distance traveled. If you paid for driving your car in the same way an industrial manufacturer pays for electricity, you would pay a higher cost for gas at your next fill-up if you prefer to drive 70 mph on the highway instead of 55 mph. The demand charge included in a manufacturer’s electricity bill is set at the highest peak energy requirement for the month.
How Manufacturers Pay for Energy 15 minutes (Elapsed Time: 1 hour, 10 minutes)
Read and disseminate information from an industrial energy bill.
Topic
Notes for the Facilitator
26
Learning Objective
While usage-based rates cover the cost of generating the electricity, utilities need to cover the significant costs of either maintaining adequate capacity or purchasing it from other electricity providers. The issues with estimating the appropriate capacity for a service area are caused by the peak demands of large energy consumers that fluctuate sporadically over different times. Utilities must maintain capacity for the combined peak demand or risk not being able to meet the needs of its customers.
How Manufacturers Pay for Energy 15 minutes (Elapsed Time: 1 hour, 10 minutes)
Read and disseminate information from an industrial energy bill.
Topic
Notes for the Facilitator
27
Learning Objective
Understanding how to read energy bills is an important first step in any energy efficiency improvement projects. You can’t manage what you don’t measure.
How Manufacturers Pay for Energy 15 minutes (Elapsed Time: 1 hour, 10 minutes)
Read and disseminate information from an industrial energy bill.
Topic
Notes for the Facilitator
28
Learning Objective
Natural gas bills are generally simpler to read and comprehend than industrial electricity bills. Natural gas is measured in volumetric units of cubic feet and customers are charged for the volume of fuel delivered and an additional cost of delivering the gas. As you can see, energy bills are a significant factor in a company’s budget so reducing energy use benefits both the environment and the company’s bottom line.
How Manufacturers Pay for Energy 15 minutes (Elapsed Time: 1 hour, 10 minutes)
Read and disseminate information from an industrial energy bill.
Topic
Notes for the Facilitator
29
Learning Objective
The Energy Policy Act of 2005 (EPAct 2005) addresses energy production in the United States, including: (1) energy efficiency, (2) renewable energy, (3) oil and gas, (4) coal, (5) Tribal energy, (6) nuclear matters and security, (7) vehicles and motor fuels, including ethanol, (8) hydrogen, (9) electricity, (10) energy tax incentives, (11) hydropower and geothermal energy, and (12) climate change technology. For example, EPAct 2005 provides loan guarantees for entities that develop or use innovative technologies that avoid the byproduction of greenhouse gases. Another provision of the Act increases the amount of biofuel that must be mixed with gasoline sold in the United States. The Energy Policy Act of 1992 (EPAct 1992) aims to reduce U.S. dependence on imported petroleum and improve air quality by addressing all aspects of energy supply and demand, including alternative fuels, renewable energy, and energy efficiency. EPAct 1992 encourages the use of alternative fuels through both regulatory and voluntary activities. It requires federal, state, and alternative fuel provider fleets to acquire alternative fuel vehicles. EPAct 1992 also defined "alternative fuels" as methanol, ethanol, and other alcohols; blends of 85 percent or more of alcohol with gasoline (E85); natural gas and liquid fuels domestically produced from natural gas; propane; hydrogen; electricity; biodiesel (B100); coal-derived liquid fuels; fuels, other than alcohol, derived from biological materials; and P-Series fuels, which were added to the definition in 1999. Under EPAct 1992, the U.S. Department of Energy has the authority to add more alternative fuels to the list of authorized alternative fuels if certain criteria are met. EPAct 2005 can be viewed online here: http://www1.eere.energy.gov/femp/regulations/epact2005.html.
Energy Efficiency 15 minutes (Elapsed Time: 1 hour, 25 minutes)
Recognize energy intensive manufacturing processes and equipment.
Topic
Notes for the Facilitator
30
Learning Objective
The Energy Information Administration states that significant opportunities exist to increase energy efficiency in the current manufacturing sector, and its investigations show that no segment of the U.S. economy has as much to gain from energy reduction as the manufacturers. In fact, a September 2005 poll taken by the National Association of Manufacturers revealed that 93 percent of directors from small and medium-sized manufacturing companies believe that higher energy prices are having a negative impact on their profitability. Current business trends show that energy efficiency is becoming a market differentiator for manufacturers. Customers are including suppliers’ energy performance when making purchasing decisions. Other reasons for energy efficiency include: • Reduce greenhouse gas emissions and carbon footprint. • Industrial sector consumes about one-third of all the energy used in the United States. • Industrial manufacturers consume nearly 40 percent of all electricity generated in the
United States. • Natural gas prices are up 136 percent in 5 years. • Crude oil price are up 5 times greater than 1998 price (22 percent increase per year,
every year, for 8 years). • Electricity demand in the United States will grow by at least 40 percent by 2032. Energy Strategy for the Road Ahead: Scenario Thinking for Business Executives and Corporate Boards. The Global Business Network: http://www.energystar.gov/ia/business/GBN_Energy_Strategy.pdf
Energy Efficiency 15 minutes (Elapsed Time: 1 hour, 25 minutes)
Recognize energy intensive manufacturing processes and equipment.
Topic
Notes for the Facilitator
31
Learning Objective
Distribute sections 3 and 4 of Energy Efficiency Improvement and Cost Saving Opportunities for the Vehicle Assembly Industry: An ENERGY STAR® Guide for Energy and Plant Managers. http://www.energystar.gov/ia/business/industry/LBNL-50939.pdf. Have students read in class. Then, as a class or in small groups, visit the following website: http://www.history.com/interactives/start-to-finish/#/kia. Using the “tour” as a guide, have the groups brainstorm and identify where opportunities for energy efficiency and conservation exist. Ask the groups to list their opportunities to share with the class at the end of the time provided.
Energy Efficiency 15 minutes (Elapsed Time: 1 hour, 25 minutes)
Recognize energy intensive manufacturing processes and equipment.
Topic
Notes for the Facilitator
32
Learning Objective
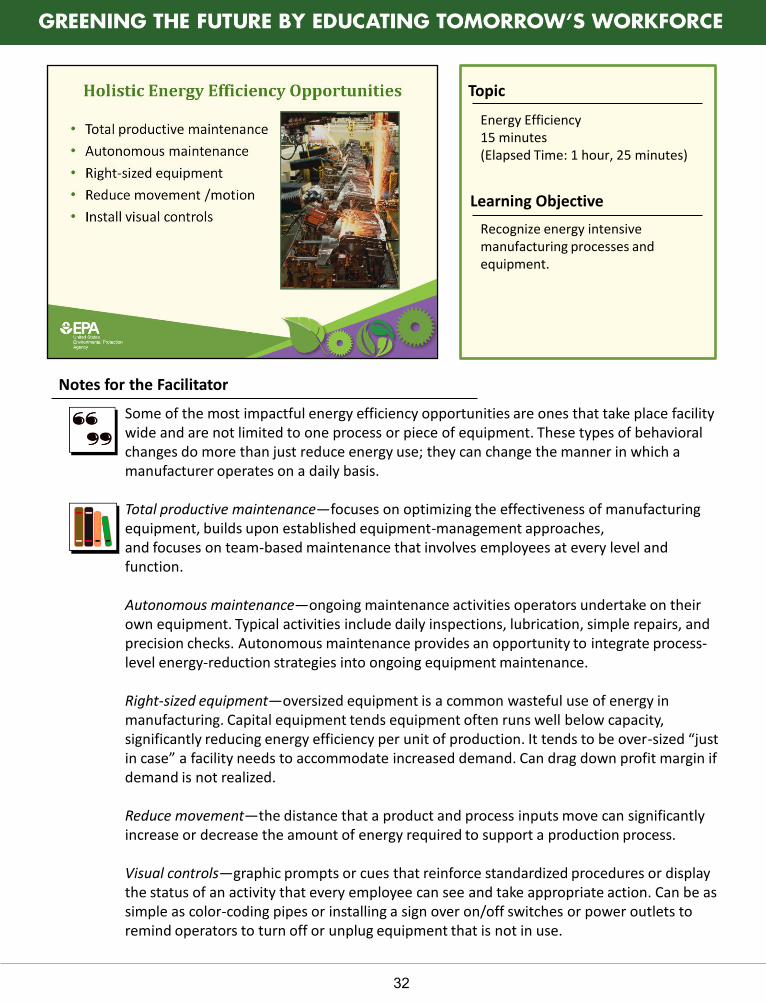
Some of the most impactful energy efficiency opportunities are ones that take place facility wide and are not limited to one process or piece of equipment. These types of behavioral changes do more than just reduce energy use; they can change the manner in which a manufacturer operates on a daily basis. Total productive maintenance—focuses on optimizing the effectiveness of manufacturing equipment, builds upon established equipment-management approaches, and focuses on team-based maintenance that involves employees at every level and function. Autonomous maintenance—ongoing maintenance activities operators undertake on their own equipment. Typical activities include daily inspections, lubrication, simple repairs, and precision checks. Autonomous maintenance provides an opportunity to integrate process-level energy-reduction strategies into ongoing equipment maintenance. Right-sized equipment—oversized equipment is a common wasteful use of energy in manufacturing. Capital equipment tends equipment often runs well below capacity, significantly reducing energy efficiency per unit of production. It tends to be over-sized “just in case” a facility needs to accommodate increased demand. Can drag down profit margin if demand is not realized. Reduce movement—the distance that a product and process inputs move can significantly increase or decrease the amount of energy required to support a production process. Visual controls—graphic prompts or cues that reinforce standardized procedures or display the status of an activity that every employee can see and take appropriate action. Can be as simple as color-coding pipes or installing a sign over on/off switches or power outlets to remind operators to turn off or unplug equipment that is not in use.
Energy Efficiency 15 minutes (Elapsed Time: 1 hour, 25 minutes)
Recognize energy intensive manufacturing processes and equipment.
Topic
Notes for the Facilitator
33
Learning Objective
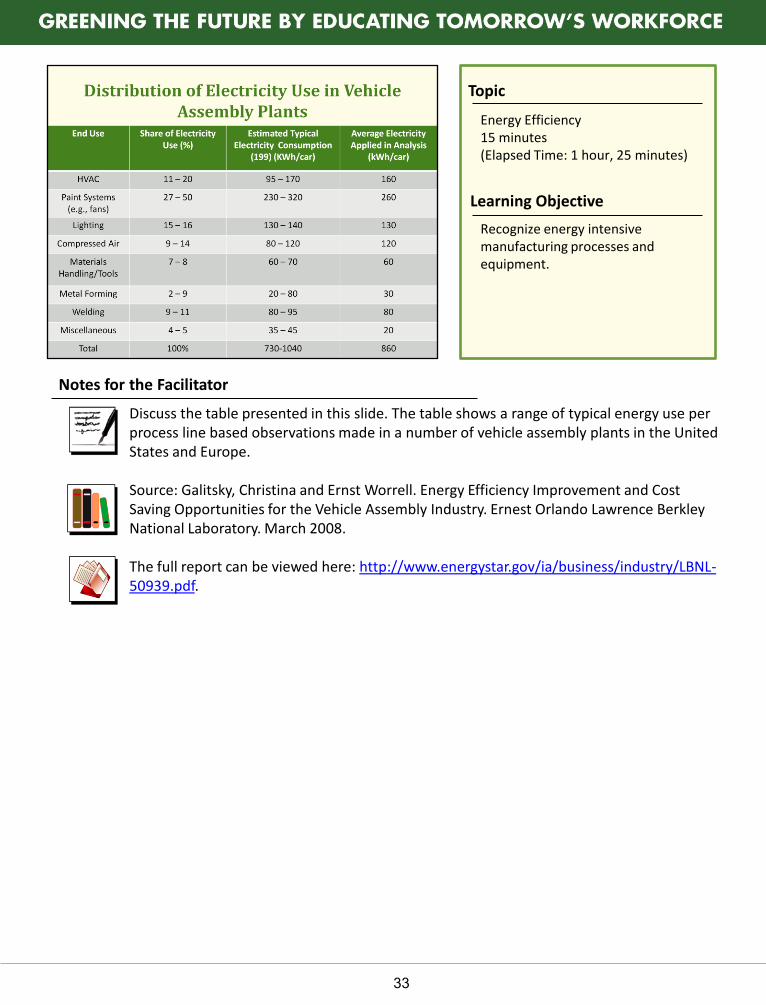
Discuss the table presented in this slide. The table shows a range of typical energy use per process line based observations made in a number of vehicle assembly plants in the United States and Europe. Source: Galitsky, Christina and Ernst Worrell. Energy Efficiency Improvement and Cost Saving Opportunities for the Vehicle Assembly Industry. Ernest Orlando Lawrence Berkley National Laboratory. March 2008. The full report can be viewed here: http://www.energystar.gov/ia/business/industry/LBNL-50939.pdf.
Energy Efficiency 15 minutes (Elapsed Time: 1 hour, 25 minutes)
Recognize energy intensive manufacturing processes and equipment.

Topic
Notes for the Facilitator
34
Learning Objective
An energy audit is a comprehensive assessment of the energy use of a building. Energy audits help to identify and prioritize specific areas for efficiency improvement. In the residential and commercial sectors, energy audits target the building as a whole, and are therefore an avenue for maximizing energy savings in existing buildings. In the industrial sector, audits are often comprehensive, but may focus on specific energy-intensive processes. Have students complete a simple energy audit in the classroom using A Simple Energy Audit. A handout for this activity is included in Appendix C.
Energy Efficiency 15 minutes (Elapsed Time: 1 hour, 25 minutes)
Recognize energy intensive manufacturing processes and equipment.

Topic
Notes for the Facilitator
35
Learning Objective
This quiz can serve as the end or the beginning a classroom session. See Appendix B for sample quiz and answer key.

Topic
Notes for the Facilitator
36
Learning Objective
APPENDIX A: Video Resource List Reinventing Fire: http://www.youtube.com/watch?v=lT-g__695Go Global Warming: It's All About Carbon: http://www.npr.org/news/specials/climate/video Greenhouse Effect Animation http://www.epa.gov/climatechange/kids/basics/index.html

Topic
Notes for the Facilitator
37
Learning Objective
APPENDIX B: Module Quizzes
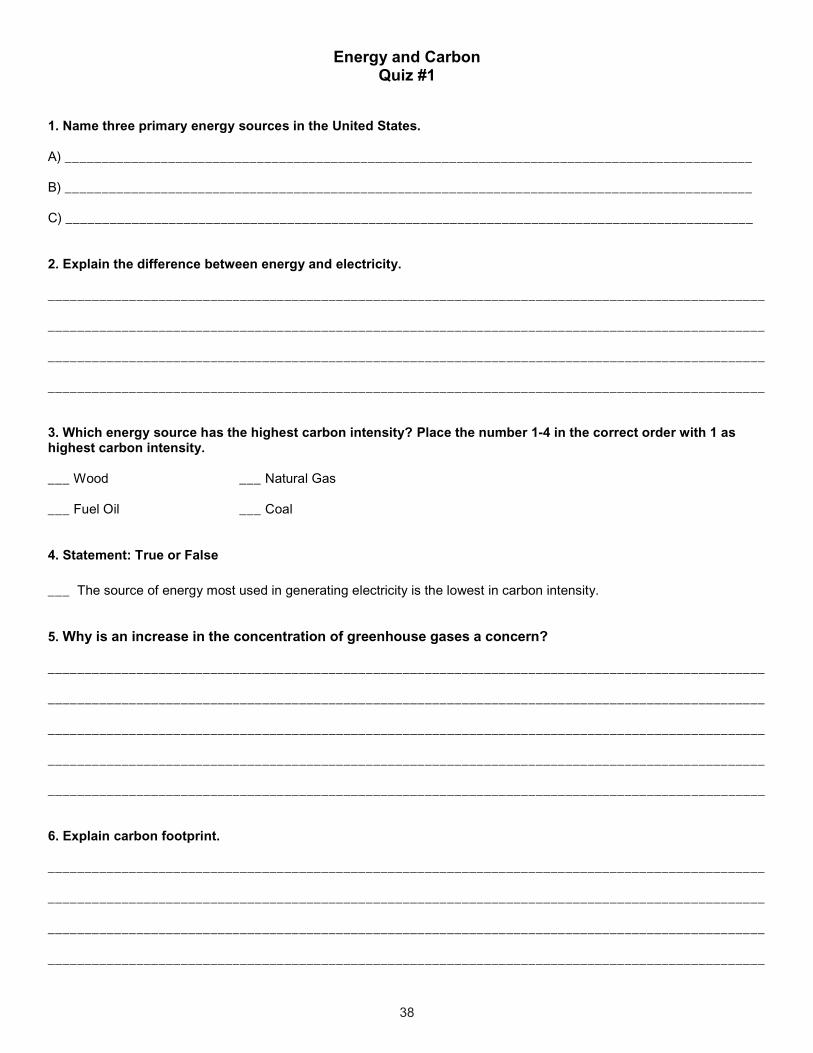
Energy and Carbon
Quiz #1
1. Name three primary energy sources in the United States.
A) _____________________________________________________________________________________________
B) _____________________________________________________________________________________________
C) _____________________________________________________________________________________________
2. Explain the difference between energy and electricity.
_________________________________________________________________________________________________
_________________________________________________________________________________________________
_________________________________________________________________________________________________
_________________________________________________________________________________________________
3. Which energy source has the highest carbon intensity? Place the number 1-4 in the correct order with 1 as
highest carbon intensity.
___ Wood ___ Natural Gas
___ Fuel Oil ___ Coal
4. Statement: True or False
___ The source of energy most used in generating electricity is the lowest in carbon intensity.
5. Why is an increase in the concentration of greenhouse gases a concern?
_________________________________________________________________________________________________
_________________________________________________________________________________________________
_________________________________________________________________________________________________
_________________________________________________________________________________________________
_________________________________________________________________________________________________
6. Explain carbon footprint.
_________________________________________________________________________________________________
_________________________________________________________________________________________________
_________________________________________________________________________________________________
_________________________________________________________________________________________________
38
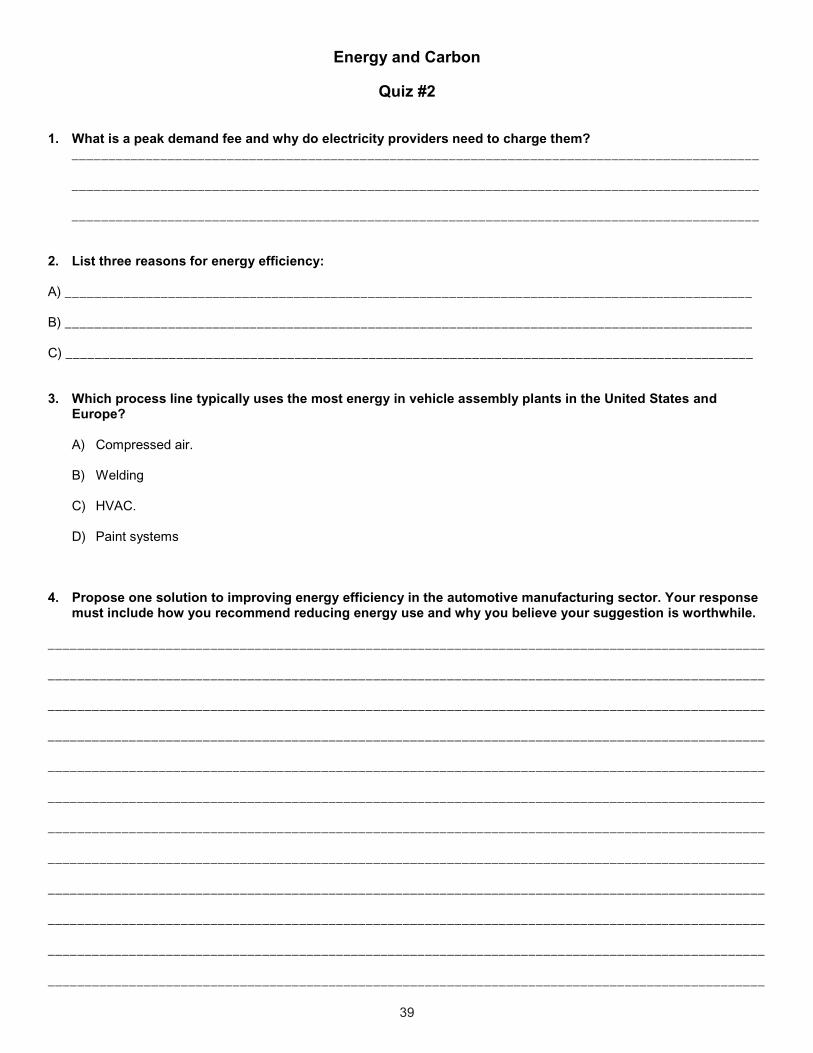
Energy and Carbon
Quiz #2
1. What is a peak demand fee and why do electricity providers need to charge them?
_____________________________________________________________________________________________
_____________________________________________________________________________________________
_____________________________________________________________________________________________
2. List three reasons for energy efficiency:
A) _____________________________________________________________________________________________
B) _____________________________________________________________________________________________
C) _____________________________________________________________________________________________
3. Which process line typically uses the most energy in vehicle assembly plants in the United States and
Europe?
A) Compressed air.
B) Welding
C) HVAC.
D) Paint systems
4. Propose one solution to improving energy efficiency in the automotive manufacturing sector. Your response
must include how you recommend reducing energy use and why you believe your suggestion is worthwhile.
_________________________________________________________________________________________________
_________________________________________________________________________________________________
_________________________________________________________________________________________________
_________________________________________________________________________________________________
_________________________________________________________________________________________________
_________________________________________________________________________________________________
_________________________________________________________________________________________________
_________________________________________________________________________________________________
_________________________________________________________________________________________________
_________________________________________________________________________________________________
_________________________________________________________________________________________________
_________________________________________________________________________________________________
39
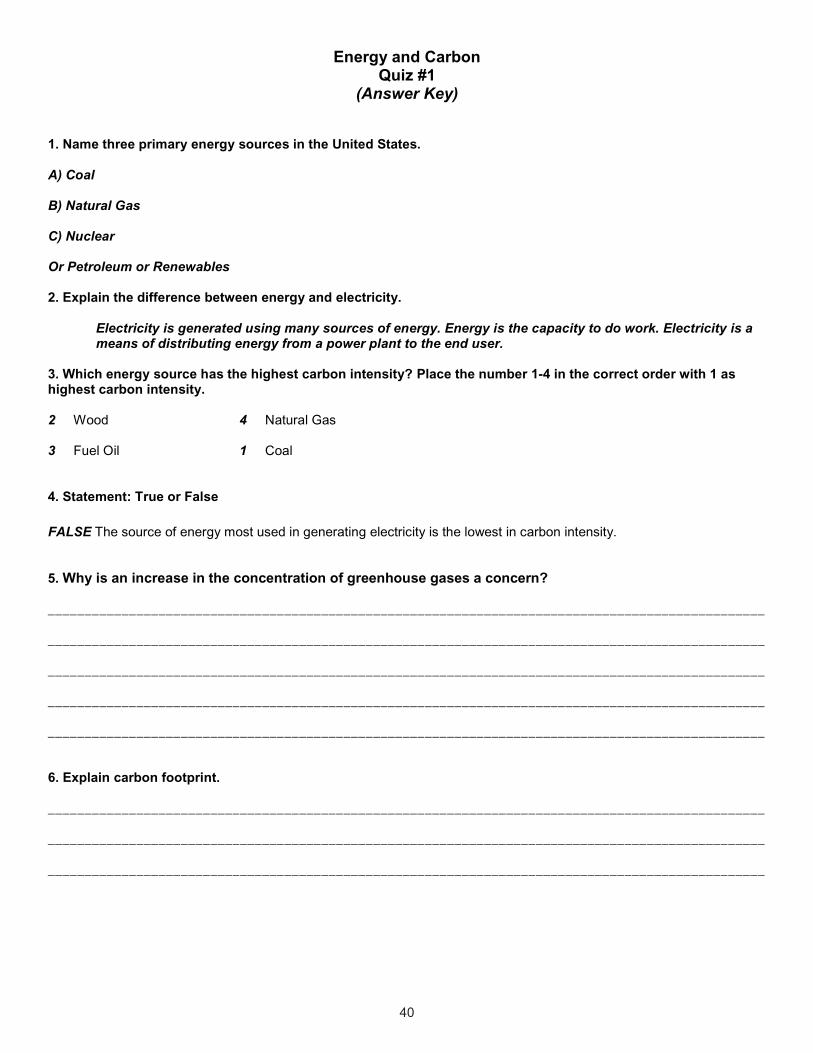
Energy and Carbon
Quiz #1
(Answer Key)
1. Name three primary energy sources in the United States.
A) Coal
B) Natural Gas
C) Nuclear
Or Petroleum or Renewables
2. Explain the difference between energy and electricity.
Electricity is generated using many sources of energy. Energy is the capacity to do work. Electricity is a
means of distributing energy from a power plant to the end user.
3. Which energy source has the highest carbon intensity? Place the number 1-4 in the correct order with 1 as
highest carbon intensity.
2 Wood 4 Natural Gas
3 Fuel Oil 1 Coal
4. Statement: True or False
FALSE The source of energy most used in generating electricity is the lowest in carbon intensity.
5. Why is an increase in the concentration of greenhouse gases a concern?
_________________________________________________________________________________________________
_________________________________________________________________________________________________
_________________________________________________________________________________________________
_________________________________________________________________________________________________
_________________________________________________________________________________________________
6. Explain carbon footprint.
_________________________________________________________________________________________________
_________________________________________________________________________________________________
_________________________________________________________________________________________________
40
Energy and Carbon
Quiz #2
(Answer Key)
1. What is a peak demand fee and why do electricity providers need to charge them?
The peak demand fee is a fee based on the highest rate of electricity usage for large energy consumers
whose demand fluctuates sporadically. Utilities must maintain capacity for the combined peak demand of
all its customers or risk not being able to meet the total demand. Utilities need to cover significant costs
of either maintaining adequate capacity or purchasing it from other electricity
2. List three reasons for energy efficiency:
A) Increasing costs or economic factors
B) Greenhouse gas emissions and carbon footprint
C) Energy security
Among others reasons…
3. Which process line typically uses the most energy in vehicle assembly plants in the United States and
Europe?
D) Paint systems
4. Propose one solution to improving energy efficiency in the automotive manufacturing sector. Your response
must include how you recommend reducing energy use and why you believe your suggestion is worthwhile.
_________________________________________________________________________________________________
_________________________________________________________________________________________________
_________________________________________________________________________________________________
_________________________________________________________________________________________________
_________________________________________________________________________________________________
_________________________________________________________________________________________________
_________________________________________________________________________________________________
_________________________________________________________________________________________________
_________________________________________________________________________________________________
_________________________________________________________________________________________________
_________________________________________________________________________________________________
_________________________________________________________________________________________________
_________________________________________________________________________________________________
41

Topic
Notes for the Facilitator
42
Learning Objective
APPENDIX C: Facilitator Materials

43

Environmental Terms Crossword Energy and Carbon
44
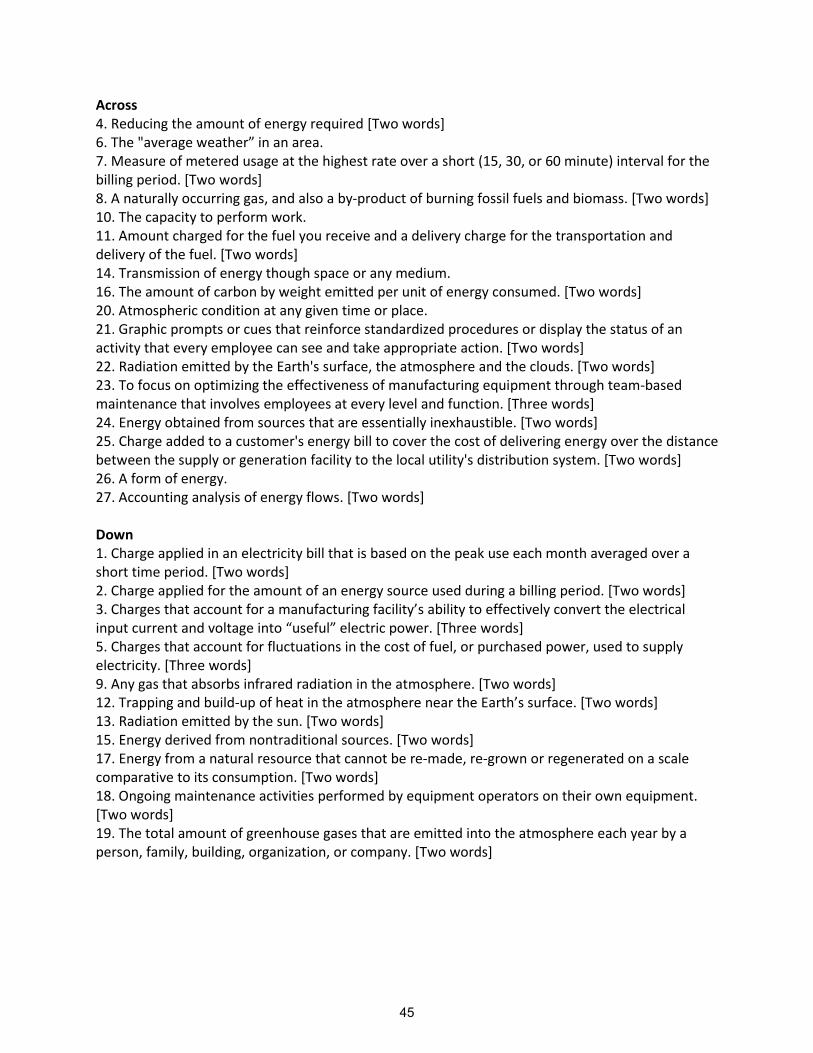
Across 4. Reducing the amount of energy required [Two words] 6. The "average weather” in an area. 7. Measure of metered usage at the highest rate over a short (15, 30, or 60 minute) interval for the billing period. [Two words] 8. A naturally occurring gas, and also a by-product of burning fossil fuels and biomass. [Two words] 10. The capacity to perform work. 11. Amount charged for the fuel you receive and a delivery charge for the transportation and delivery of the fuel. [Two words] 14. Transmission of energy though space or any medium. 16. The amount of carbon by weight emitted per unit of energy consumed. [Two words] 20. Atmospheric condition at any given time or place. 21. Graphic prompts or cues that reinforce standardized procedures or display the status of an activity that every employee can see and take appropriate action. [Two words] 22. Radiation emitted by the Earth's surface, the atmosphere and the clouds. [Two words] 23. To focus on optimizing the effectiveness of manufacturing equipment through team-based maintenance that involves employees at every level and function. [Three words] 24. Energy obtained from sources that are essentially inexhaustible. [Two words] 25. Charge added to a customer's energy bill to cover the cost of delivering energy over the distance between the supply or generation facility to the local utility's distribution system. [Two words] 26. A form of energy. 27. Accounting analysis of energy flows. [Two words] Down 1. Charge applied in an electricity bill that is based on the peak use each month averaged over a short time period. [Two words] 2. Charge applied for the amount of an energy source used during a billing period. [Two words] 3. Charges that account for a manufacturing facility’s ability to effectively convert the electrical input current and voltage into “useful” electric power. [Three words] 5. Charges that account for fluctuations in the cost of fuel, or purchased power, used to supply electricity. [Three words] 9. Any gas that absorbs infrared radiation in the atmosphere. [Two words] 12. Trapping and build-up of heat in the atmosphere near the Earth’s surface. [Two words] 13. Radiation emitted by the sun. [Two words] 15. Energy derived from nontraditional sources. [Two words] 17. Energy from a natural resource that cannot be re-made, re-grown or regenerated on a scale comparative to its consumption. [Two words] 18. Ongoing maintenance activities performed by equipment operators on their own equipment. [Two words] 19. The total amount of greenhouse gases that are emitted into the atmosphere each year by a person, family, building, organization, or company. [Two words]
45
Basics
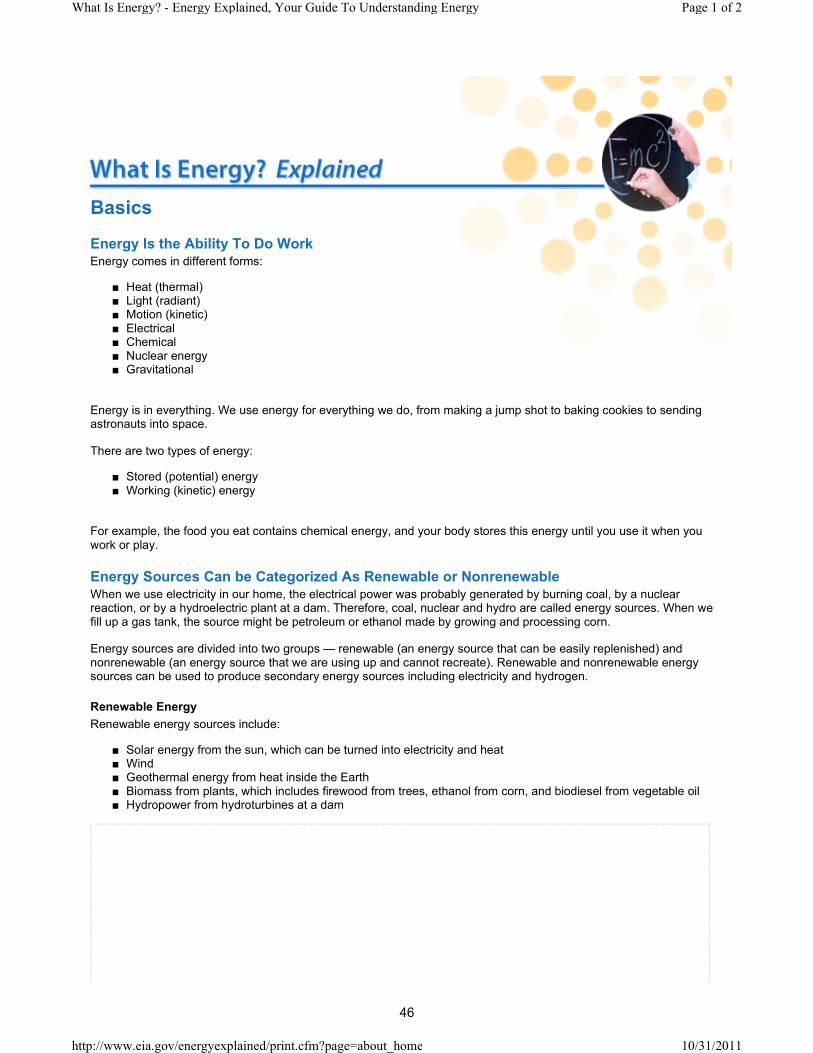
Energy Is the Ability To Do WorkEnergy comes in different forms:
■ Heat (thermal)■ Light (radiant) ■ Motion (kinetic)■ Electrical ■ Chemical ■ Nuclear energy ■ Gravitational
Energy is in everything. We use energy for everything we do, from making a jump shot to baking cookies to sending astronauts into space.
There are two types of energy:
■ Stored (potential) energy ■ Working (kinetic) energy
For example, the food you eat contains chemical energy, and your body stores this energy until you use it when you work or play.
Energy Sources Can be Categorized As Renewable or NonrenewableWhen we use electricity in our home, the electrical power was probably generated by burning coal, by a nuclear reaction, or by a hydroelectric plant at a dam. Therefore, coal, nuclear and hydro are called energy sources. When we fill up a gas tank, the source might be petroleum or ethanol made by growing and processing corn.
Energy sources are divided into two groups — renewable (an energy source that can be easily replenished) and nonrenewable (an energy source that we are using up and cannot recreate). Renewable and nonrenewable energy sources can be used to produce secondary energy sources including electricity and hydrogen.
Renewable Energy
Renewable energy sources include:
■ Solar energy from the sun, which can be turned into electricity and heat■ Wind■ Geothermal energy from heat inside the Earth■ Biomass from plants, which includes firewood from trees, ethanol from corn, and biodiesel from vegetable oil■ Hydropower from hydroturbines at a dam
Page 1 of 2What Is Energy? - Energy Explained, Your Guide To Understanding Energy
10/31/2011http://www.eia.gov/energyexplained/print.cfm?page=about_home
46
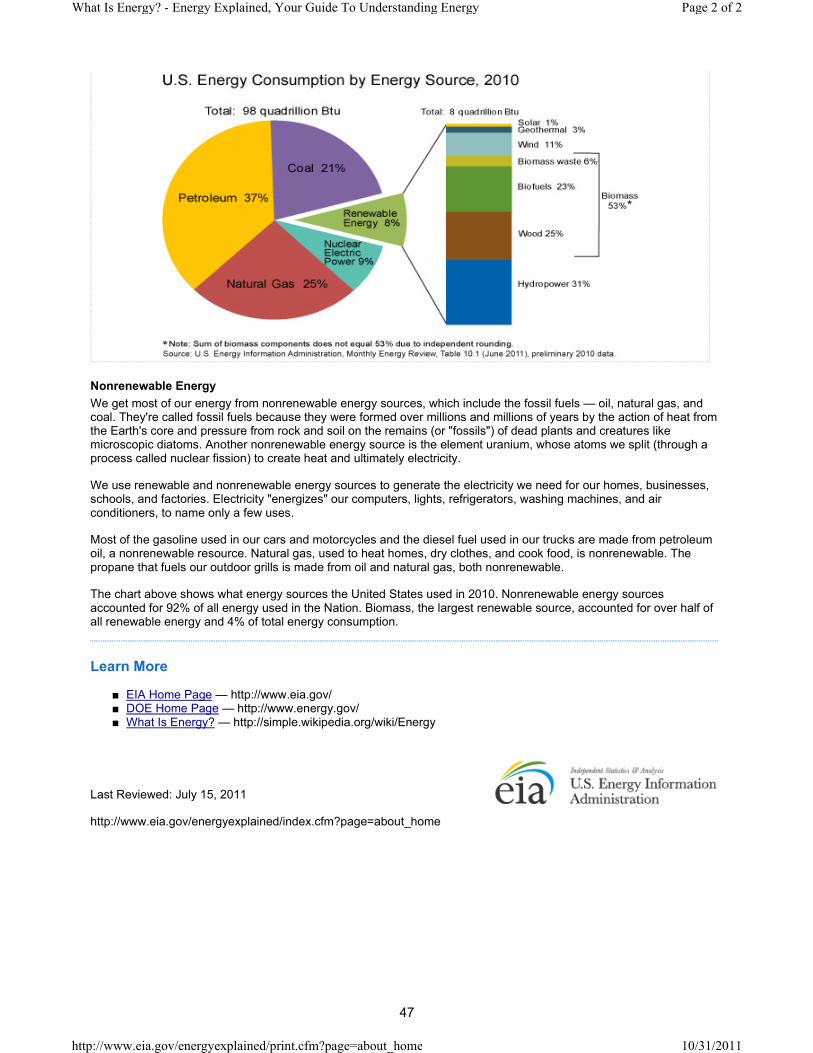
Nonrenewable Energy
We get most of our energy from nonrenewable energy sources, which include the fossil fuels — oil, natural gas, and coal. They're called fossil fuels because they were formed over millions and millions of years by the action of heat from the Earth's core and pressure from rock and soil on the remains (or "fossils") of dead plants and creatures like microscopic diatoms. Another nonrenewable energy source is the element uranium, whose atoms we split (through a process called nuclear fission) to create heat and ultimately electricity.
We use renewable and nonrenewable energy sources to generate the electricity we need for our homes, businesses, schools, and factories. Electricity "energizes" our computers, lights, refrigerators, washing machines, and air conditioners, to name only a few uses.
Most of the gasoline used in our cars and motorcycles and the diesel fuel used in our trucks are made from petroleum oil, a nonrenewable resource. Natural gas, used to heat homes, dry clothes, and cook food, is nonrenewable. The propane that fuels our outdoor grills is made from oil and natural gas, both nonrenewable.
The chart above shows what energy sources the United States used in 2010. Nonrenewable energy sources accounted for 92% of all energy used in the Nation. Biomass, the largest renewable source, accounted for over half of all renewable energy and 4% of total energy consumption.
Learn More
■ EIA Home Page — http://www.eia.gov/■ DOE Home Page — http://www.energy.gov/■ What Is Energy? — http://simple.wikipedia.org/wiki/Energy
Last Reviewed: July 15, 2011
http://www.eia.gov/energyexplained/index.cfm?page=about_home
Page 2 of 2What Is Energy? - Energy Explained, Your Guide To Understanding Energy
10/31/2011http://www.eia.gov/energyexplained/print.cfm?page=about_home
47

Basics
How We Use Energy The United States is a highly developed and industrialized society. We use a lot of energy in our homes, in businesses, in industry, and for personal travel and transporting goods. There are four major sectors that consume energy at the point of end use.
■ The industrial sector includes facilities and equipment used for manufacturing, agriculture, mining, and construction.
■ The transportation sector comprises vehicles that transport people or goods, such as: cars, trucks, buses, motorcycles, trains, subways, aircraft, boats, barges, and even hot air balloons.
■ The residential sector consists of homes and apartments.
■ The commercial sector includes buildings such as offices, malls, stores, schools, hospitals, hotels, warehouses, restaurants, places of worship, and more.
Each end-use sector consumes electricity produced by the electric power sector.
U.S. Total Energy Consumption by End-Use Sector, 1949-2010 From 1949 to 2010, primary energy consumption in the United States tripled. In all but 16 of those years, primary energy consumption increased over the previous year.
The year 2009 provided a sharp contrast to this historical trend, in part due to the economic recession. Real gross domestic product (GDP) fell 2% compared to 2008, and energy consumption declined as well: by nearly 5%. Decreases occurred in all four major end-use sectors: residential — 2%, commercial — 1%, industrial — 9%, and transportation — 4%.
Consumption decreased the most in the industrial sector, which was particularly hard hit by the recession. Real value added for the manufacturing sector fell by 6%. Total energy consumption in the transportation sector fell by about 4% in 2009. Decreases in total transportation sector consumption in 2008 and 2009 were the first since 1990 and 1991 that consumption fell in consecutive years.
The general historical trend for annual increases in energy consumption resumed in 2010 as the U.S. economy improved. Total energy consumption increased by about 4% over 2009. Increases occurred in all sectors: residential — 5%, commercial — 2%, industrial — 6%, transportation — 2%.
Learn More
■ Energy Perspectives — http://www.eia.gov/emeu/aer/ep/ep_frame.html
Page 1 of 2Use of Energy in the United States - Energy Explained, Your Guide To Understanding Energy
10/31/2011http://www.eia.gov/energyexplained/print.cfm?page=us_energy_use
48

■ Major sources and users of energy in the United States —http://www.eia.gov/energy_in_brief/major_energy_sources_and_users.cfm
■ Monthly Energy Review — http://www.eia.gov/totalenergy/data/monthly/
Last Updated: July 20, 2011
http://www.eia.gov/energyexplained/index.cfm?page=us_energy_use
Page 2 of 2Use of Energy in the United States - Energy Explained, Your Guide To Understanding Energy
10/31/2011http://www.eia.gov/energyexplained/print.cfm?page=us_energy_use
49
Your Family’s Carbon Footprint
Greenhouse Gas Carbon footprint Carbon dioxide Greenhouse gas Greenhouse effect Methane Nitrous oxide
Your Family’s Carbon Footprint
1. You will calculate the amount of carbon dioxide
you and your family release into the atmosphere each year—your carbon footprint.
2. You will identify ways for you and your family to
reduce your carbon footprint.
3. You will calculate the mean, median, mode, and range for your class’s carbon dioxide emissions data: your class carbon footprint.
Key Concepts: WHAT YOU WILL LEARN
Activities for Conceptualizing Climate and Climate Change 1
50
Your Family’s Carbon Footprint
Engage Your Thinking
How much greenhouse gas (carbon dioxide and methane) does your family release into the atmosphere each year? How do you and your family contribute to the greenhouse effect and to global warming? To answer these questions, you will use the Environmental Protection Agency’s (EPA) Personal Emissions Calculator to estimate your family’s greenhouse gas emissions and to think about how you and your family could reduce your greenhouse gas emissions. Before starting this activity, however, answer the following questions based on what you currently know and think.
ly contribute to the greenhouse effect and to global warming? To answer these questions, you will use the Environmental Protection Agency’s (EPA) Personal Emissions Calculator to estimate your family’s greenhouse gas emissions and to think about how you and your family could reduce your greenhouse gas emissions. Before starting this activity, however, answer the following questions based on what you currently know and think.
1. In what ways do you and your family release greenhouse gases into the atmosphere?
1. In what ways do you and your family release greenhouse gases into the atmosphere?
2. How might these activities contribute to the greenhouse effect and to global warming?
2. How might these activities contribute to the greenhouse effect and to global warming?
3. What can you and your family do to reduce your greenhouse gas emissions? 3. What can you and your family do to reduce your greenhouse gas emissions?
Explore and Explain
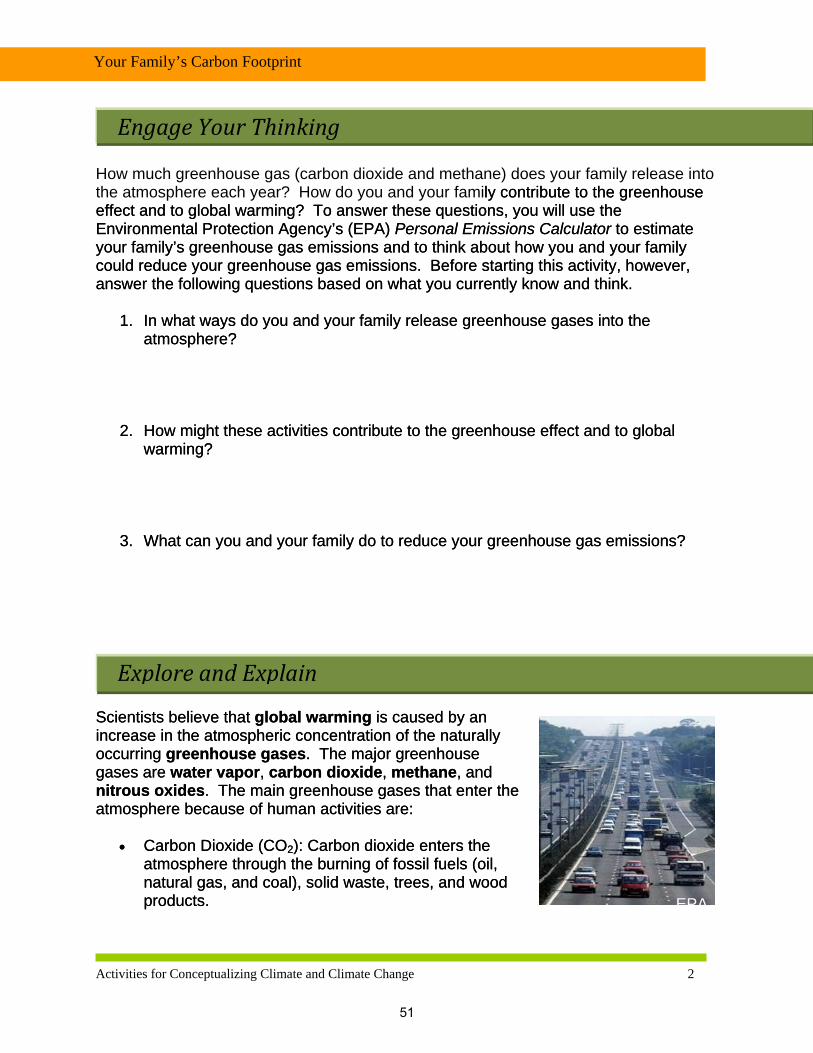
Scientists believe that global warming is caused by an increase in the atmospheric concentration of the naturally occurring greenhouse gases. The major greenhouse gases are water vapor, carbon dioxide, methane, and nitrous oxides. The main greenhouse gases that enter the atmosphere because of human activities are:
Scientists believe that global warming is caused by an increase in the atmospheric concentration of the naturally occurring greenhouse gases. The major greenhouse gases are water vapor, carbon dioxide, methane, and nitrous oxides. The main greenhouse gases that enter the atmosphere because of human activities are:
EPA
• Carbon Dioxide (CO2): Carbon dioxide enters the
atmosphere through the burning of fossil fuels (oil, natural gas, and coal), solid waste, trees, and wood products.
• Carbon Dioxide (CO
2): Carbon dioxide enters the atmosphere through the burning of fossil fuels (oil, natural gas, and coal), solid waste, trees, and wood products.
Activities for Conceptualizing Climate and Climate Change 2
51
Your Family’s Carbon Footprint
• Methane (CH4): Methane is emitted during the production and transport of coal, natural gas, and oil. Methane emissions also result from livestock and other agricultural practices and from the decay of organic waste in municipal solid waste landfills.
• Nitrous Oxides (NOx): Nitrous oxides are emitted during agricultural and industrial
activities, as well as during the combustion of fossil fuels and solid waste.
Many of your daily activities result in carbon dioxide and methane emissions; these activities add greenhouse gases to the atmosphere and this contributes to global warming and climate change. The greenhouse gas emissions you produce reflect your carbon footprint: the amount of greenhouse gases you contribute to the atmosphere measured in units of carbon dioxide. By calculating your carbon footprint you better estimate your contribution to global warming. When you understand the impact of your actions on the environment, you can make more informed decisions about specific ways to reduce your carbon footprint and to minimize your personal impact on the Earth’s temperature and climate.
The Environmental Protection Agency (EPA) has developed the Personal Emissions Calculator that allows individuals and households (families) to calculate the amount of greenhouse gas they emit each year and to estimate their individual carbon footprints. The estimate is based on energy use and waste disposal. In the following activity, you will use the EPA online calculator to estimate how much greenhouse gas you and your family release into the atmosphere each year. To use the online calculator go to:
EPA
http://epa.gov/climatechange/emissions/ind_calculator.html
Follow the instructions for using the calculator; you will need about 10-15 minutes to enter the data. For more accurate results, ask your parents to assist you in answering the following questions before going to the online calculator:
How do you heat your home? ____________ How much does your family spend per month on electricity? ________ How much does your family spend per month on natural gas? ________ How much does your family spend per month on heating oil? ________ On average how many miles does your family drive per week? __________ What is the average gas mileage for your family car(s)? ____________ Does your family recycle newspaper? ________ Does your family recycle glass? ________ Does your family recycle plastic? ________ Does your family recycle aluminum/steel cans? ________
Activities for Conceptualizing Climate and Climate Change 3
52
Your Family’s Carbon Footprint
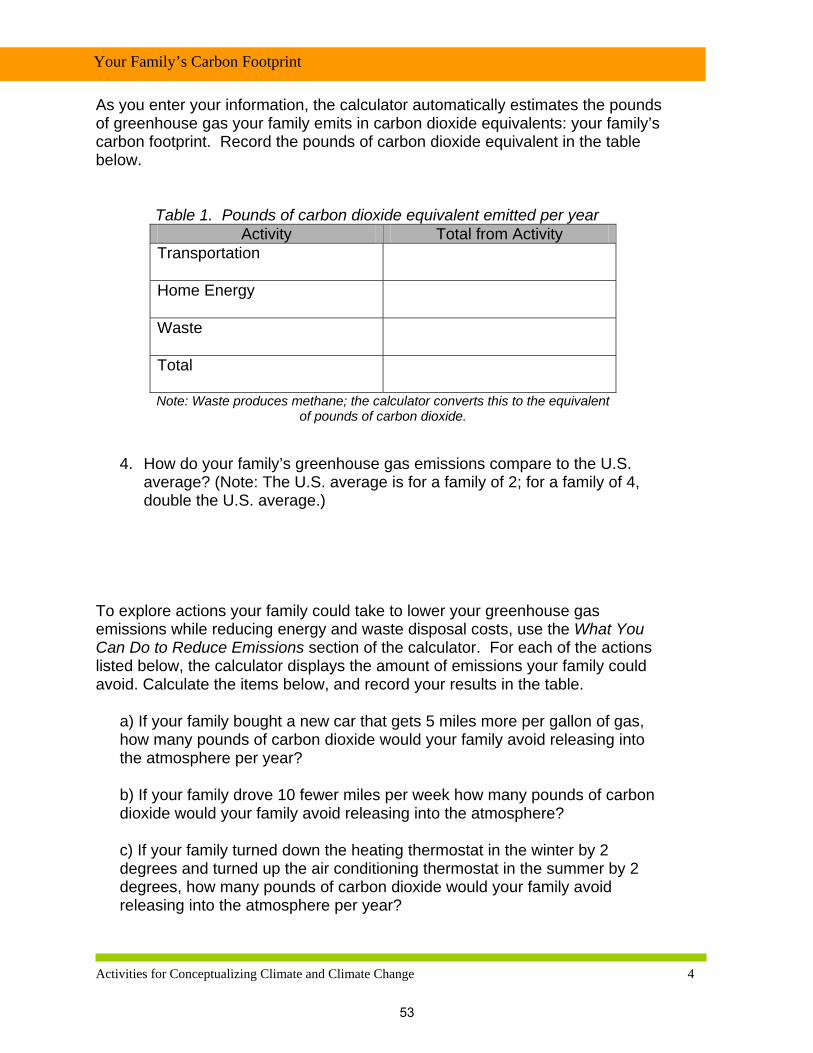
As you enter your information, the calculator automatically estimates the pounds of greenhouse gas your family emits in carbon dioxide equivalents: your family’s carbon footprint. Record the pounds of carbon dioxide equivalent in the table below.
Table 1. Pounds of carbon dioxide equivalent emitted per year Activity Total from Activity
Transportation
Home Energy
Waste
Total
Note: Waste produces methane; the calculator converts this to the equivalent of pounds of carbon dioxide.
4. How do your family’s greenhouse gas emissions compare to the U.S. average? (Note: The U.S. average is for a family of 2; for a family of 4, double the U.S. average.)
To explore actions your family could take to lower your greenhouse gas emissions while reducing energy and waste disposal costs, use the What You Can Do to Reduce Emissions section of the calculator. For each of the actions listed below, the calculator displays the amount of emissions your family could avoid. Calculate the items below, and record your results in the table.
EPA
a) If your family bought a new car that gets 5 miles more per gallon of gas, how many pounds of carbon dioxide would your family avoid releasing into the atmosphere per year?
b) If your family drove 10 fewer miles per week how many pounds of carbon dioxide would your family avoid releasing into the atmosphere?
c) If your family turned down the heating thermostat in the winter by 2 degrees and turned up the air conditioning thermostat in the summer by 2 degrees, how many pounds of carbon dioxide would your family avoid releasing into the atmosphere per year?
Activities for Conceptualizing Climate and Climate Change 4
53
Your Family’s Carbon Footprint
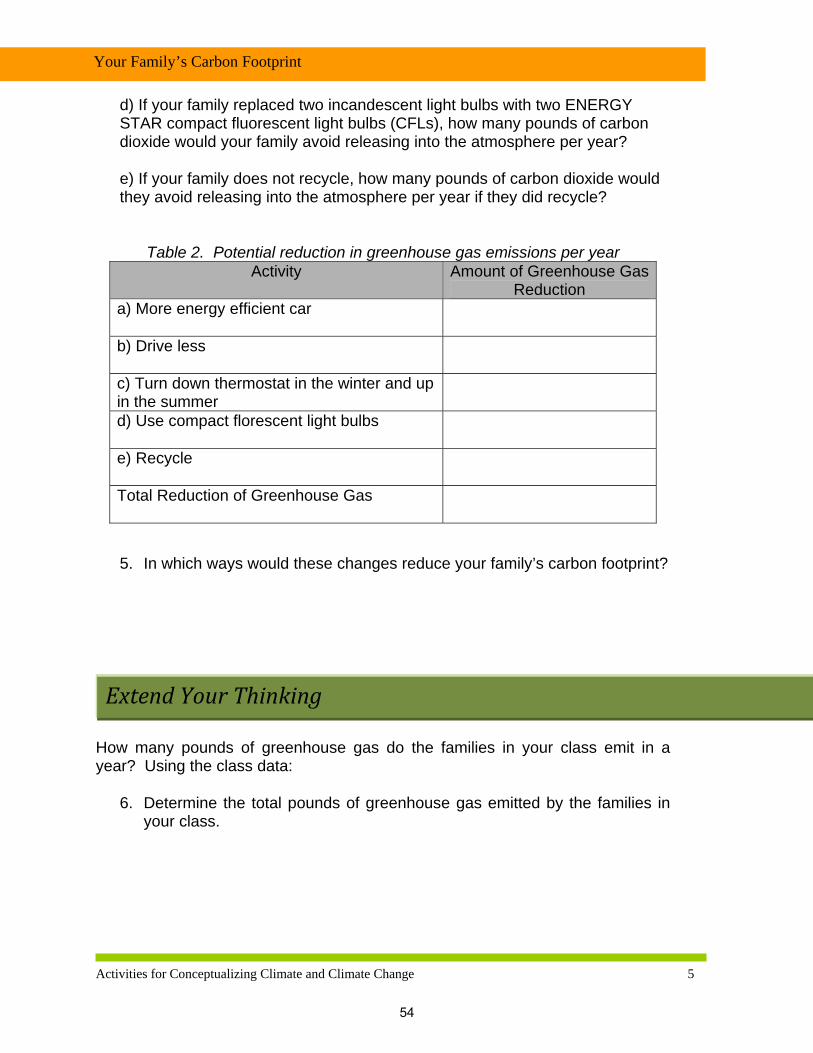
d) If your family replaced two incandescent light bulbs with two ENERGY STAR compact fluorescent light bulbs (CFLs), how many pounds of carbon dioxide would your family avoid releasing into the atmosphere per year?
e) If your family does not recycle, how many pounds of carbon dioxide would they avoid releasing into the atmosphere per year if they did recycle?
Table 2. Potential reduction in greenhouse gas emissions per year
Activity Amount of Greenhouse Gas Reduction
a) More energy efficient car
b) Drive less
c) Turn down thermostat in the winter and up in the summer
d) Use compact florescent light bulbs
e) Recycle
Total Reduction of Greenhouse Gas
5. In which ways would these changes reduce your family’s carbon footprint?
Extend Your Thinking
How many pounds of greenhouse gas do the families in your class emit in a year? Using the class data:
6. Determine the total pounds of greenhouse gas emitted by the families in your class.
Activities for Conceptualizing Climate and Climate Change 5
54
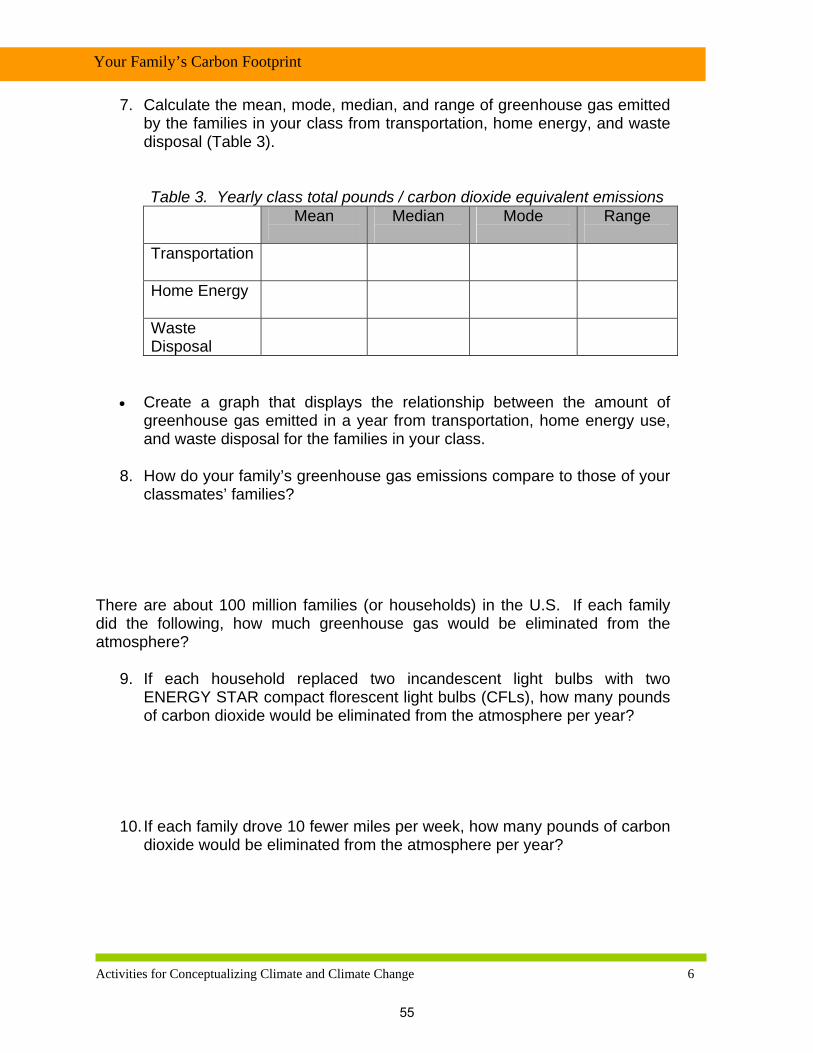
Your Family’s Carbon Footprint
7. Calculate the mean, mode, median, and range of greenhouse gas emitted by the families in your class from transportation, home energy, and waste disposal (Table 3).
Table 3. Yearly class total pounds / carbon dioxide equivalent emissions
Mean
Median
Mode
Range
Transportation
Home Energy
Waste Disposal
• Create a graph that displays the relationship between the amount of
greenhouse gas emitted in a year from transportation, home energy use, and waste disposal for the families in your class.
8. How do your family’s greenhouse gas emissions compare to those of your classmates’ families?
There are about 100 million families (or households) in the U.S. If each family did the following, how much greenhouse gas would be eliminated from the atmosphere?
9. If each household replaced two incandescent light bulbs with two ENERGY STAR compact florescent light bulbs (CFLs), how many pounds of carbon dioxide would be eliminated from the atmosphere per year?
10. If each family drove 10 fewer miles per week, how many pounds of carbon dioxide would be eliminated from the atmosphere per year?
Activities for Conceptualizing Climate and Climate Change 6
55
Your Family’s Carbon Footprint
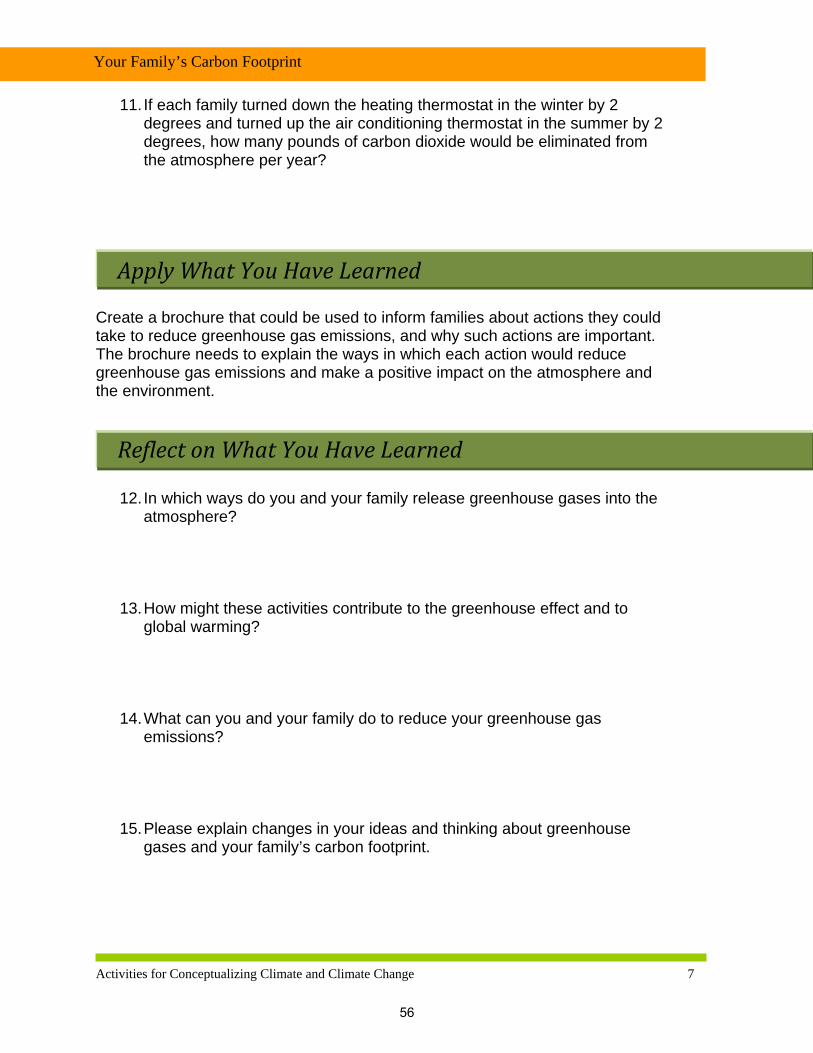
11. If each family turned down the heating thermostat in the winter by 2 degrees and turned up the air conditioning thermostat in the summer by 2 degrees, how many pounds of carbon dioxide would be eliminated from the atmosphere per year?
Apply What You Have Learned
Create a brochure that could be used to inform families about actions they could take to reduce greenhouse gas emissions, and why such actions are important. The brochure needs to explain the ways in which each action would reduce greenhouse gas emissions and make a positive impact on the atmosphere and the environment.
Reflect on What You Have Learned 12. In which ways do you and your family release greenhouse gases into the
atmosphere?
13. How might these activities contribute to the greenhouse effect and to global warming?
14. What can you and your family do to reduce your greenhouse gas emissions?
15. Please explain changes in your ideas and thinking about greenhouse gases and your family’s carbon footprint.
Activities for Conceptualizing Climate and Climate Change 7
56
United States Environmental ProtectionAgency
Office of Air and Radiation(6207J)
EPA 430-K-09-005May 2009
10www.epa.gov/climatechange Recycled/Recyclable Printed with Vegetable Oil Based Inks on Recycled Paper (Minimum 50% Postconsumer) Process Chlorine Free
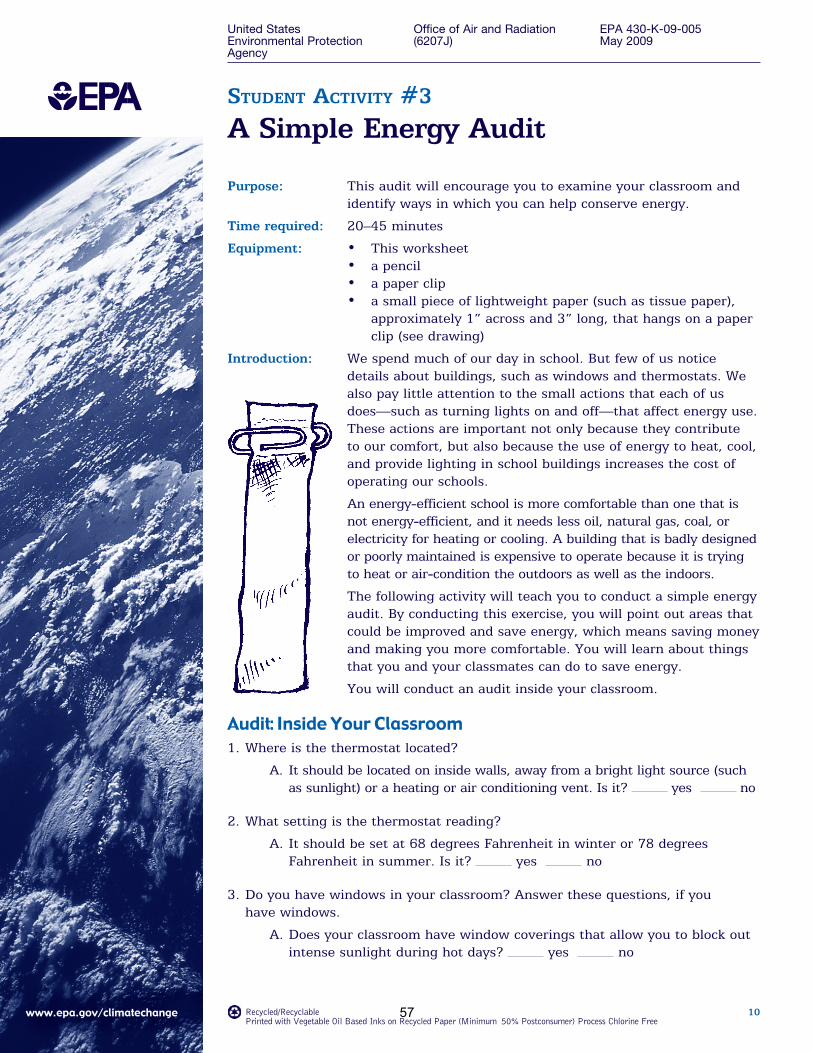
Purpose: This audit will encourage you to examine your classroom and identify ways in which you can help conserve energy.
Time required: 20–45 minutes
Equipment: • This worksheet • a pencil • a paper clip • a small piece of lightweight paper (such as tissue paper),
approximately 1” across and 3” long, that hangs on a paper clip (see drawing)
Introduction: We spend much of our day in school. But few of us notice details about buildings, such as windows and thermostats. We also pay little attention to the small actions that each of us does—such as turning lights on and off—that affect energy use. These actions are important not only because they contribute to our comfort, but also because the use of energy to heat, cool, and provide lighting in school buildings increases the cost of operating our schools.
An energy-efficient school is more comfortable than one that is not energy-efficient, and it needs less oil, natural gas, coal, or electricity for heating or cooling. A building that is badly designed or poorly maintained is expensive to operate because it is trying to heat or air-condition the outdoors as well as the indoors.
The following activity will teach you to conduct a simple energy audit. By conducting this exercise, you will point out areas that could be improved and save energy, which means saving money and making you more comfortable. You will learn about things that you and your classmates can do to save energy.
You will conduct an audit inside your classroom.
Audit: Inside Your Classroom 1. Where is the thermostat located?
A. It should be located on inside walls, away from a bright light source (such as sunlight) or a heating or air conditioning vent. Is it? yes no
2. What setting is the thermostat reading?
A. It should be set at 68 degrees Fahrenheit in winter or 78 degrees Fahrenheit in summer. Is it? yes no
3. Do you have windows in your classroom? Answer these questions, if you have windows.
A. Does your classroom have window coverings that allow you to block out intense sunlight during hot days? yes no
Student Activity #3
A Simple Energy Audit
57
11www.epa.gov/climatechange
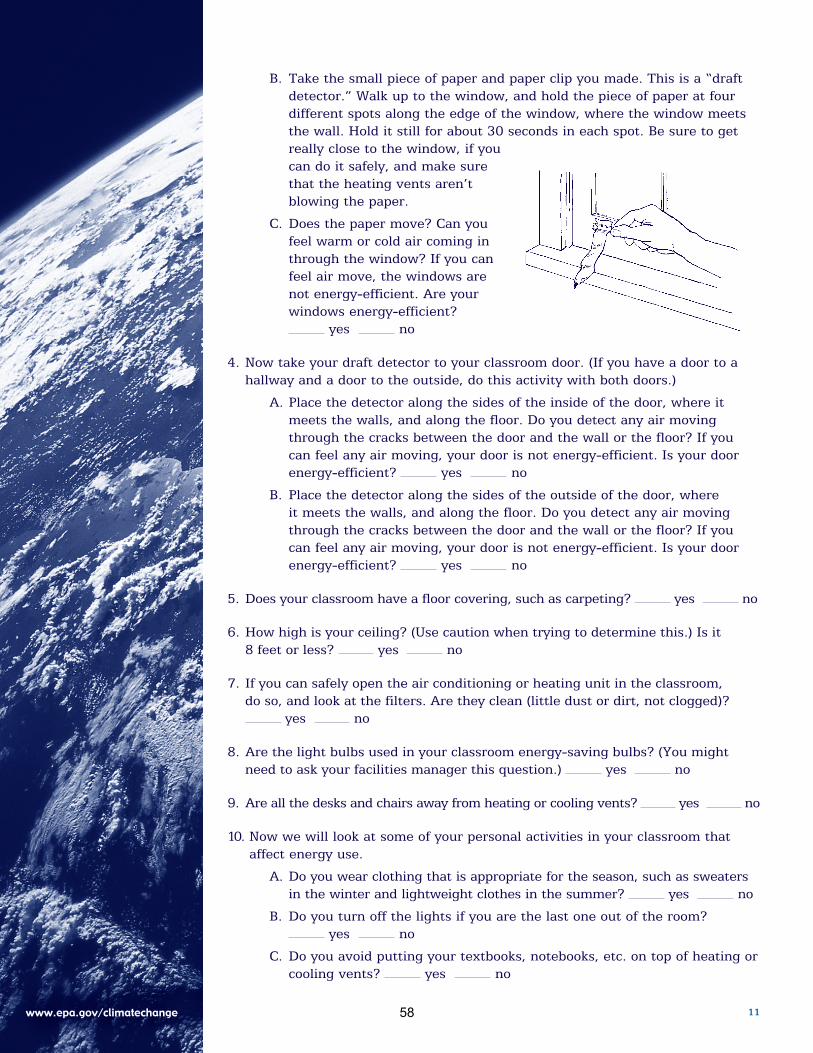
B. Take the small piece of paper and paper clip you made. This is a “draft detector.” Walk up to the window, and hold the piece of paper at four different spots along the edge of the window, where the window meets the wall. Hold it still for about 30 seconds in each spot. Be sure to get really close to the window, if you can do it safely, and make sure that the heating vents aren’t blowing the paper.
C. Does the paper move? Can you feel warm or cold air coming in through the window? If you can feel air move, the windows are not energy-efficient. Are your windows energy-efficient?
yes no
4. Now take your draft detector to your classroom door. (If you have a door to a hallway and a door to the outside, do this activity with both doors.)
A. Place the detector along the sides of the inside of the door, where it meets the walls, and along the floor. Do you detect any air moving through the cracks between the door and the wall or the floor? If you can feel any air moving, your door is not energy-efficient. Is your door energy-efficient? yes no
B. Place the detector along the sides of the outside of the door, where it meets the walls, and along the floor. Do you detect any air moving through the cracks between the door and the wall or the floor? If you can feel any air moving, your door is not energy-efficient. Is your door energy-efficient? yes no
5. Does your classroom have a floor covering, such as carpeting? yes no
6. How high is your ceiling? (Use caution when trying to determine this.) Is it 8 feet or less? yes no
7. If you can safely open the air conditioning or heating unit in the classroom, do so, and look at the filters. Are they clean (little dust or dirt, not clogged)?
yes no
8. Are the light bulbs used in your classroom energy-saving bulbs? (You might need to ask your facilities manager this question.) yes no
9. Are all the desks and chairs away from heating or cooling vents? yes no
10. Now we will look at some of your personal activities in your classroom that affect energy use.
A. Do you wear clothing that is appropriate for the season, such as sweaters in the winter and lightweight clothes in the summer? yes no
B. Do you turn off the lights if you are the last one out of the room? yes no
C. Do you avoid putting your textbooks, notebooks, etc. on top of heating or cooling vents? yes no
58
12www.epa.gov/climatechange
If you answered “yes” to most of these questions, your classroom is doing well. But if you said “no” to three or more, you need to work with your teacher, facilities manager, or other adult to improve these areas.
Here’s why your answers matter:
1. If your thermostat is located too close to a strong light or heat source, it will not properly measure the room temperature, which means that energy will be wasted because the heater or air conditioner runs more than it needs to. It also could mean that you are uncomfortable in your classroom, because if the thermostat is near a source of heat or air-conditioning, it will turn off well before the entire room is heated or cooled.
2. If your thermostat is set too high in winter or too low in summer, you are wasting energy. Ask the person responsible for energy management in your school to check your thermostats and make sure that they are working properly.
3. If your windows do not have the ability to block out intense sun, your air-conditioning costs are too high, or your comfort level is lowered (because the room cannot cool down). If you see or feel air moving through the edge of the window, this means you are losing energy from your classroom, and the windows need to be caulked, sealed, or covered by a storm window system.
4. Your draft detector has helped you to determine whether your door is energy-efficient.
5. Carpeting helps keep rooms more comfortable and conserves heat.
6. Ceilings higher than 8 feet waste energy, because warm air moves to the top of the room instead of remaining near the floor where we are.
7. Clean filters conserve energy by allowing the unit to run efficiently. Dirty filters waste energy.
8. Energy-saving bulbs are more expensive to buy but save lots of money on electricity in the long term.
9. If furniture blocks heating or cooling vents, the furnace or air conditioner will insufficiently heat or cool the room.
10. When you wear clothes that are appropriate for the weather, you require less energy to keep warm or cool. Keeping lights on when you do not need them wastes energy. Again, if objects block heating or cooling vents, the furnace or air conditioner will insufficiently heat or cool the room.
continuedStudent Activity #3: A Simple energy Audit
59
Topic
Notes for the Facilitator
60
Learning Objective
Materials Needed: Ball of yarn (untangled) and Environmental Term Cards (cut into individual cards) Instructions: 1. Ask students to stand in a circle and give each person an Environmental Term Card . If
the class is large, students can work in pairs. 2. Start the activity by reading your card. Hold on to one end of the yarn and gently toss
the ball to someone on the other side of the circle. 3. The person now holding the ball of yarn will read their card, then state how the two
terms on the cards are connected. For example, if the first card is ‘recycle’ and the second card is ‘energy,’ the statement could be “Processing a material that has been recycled takes less energy than using virgin materials. ” Note: Other students may help brainstorm a connection if necessary. If no one is able to make a connection between the terms, return the ball of yarn to the previous person and toss to a different student.
4. Once the student makes a connection between the two terms, they will hold onto a piece of the yarn and toss to someone else across the circle.
5. Continue the exercise until everyone has caught the ball of yarn, called out the interconnections and is now holding a piece of the yarn.
6. Everyone pulls the yarn so the “web” is taut. 7. Pull on your piece of the yarn and ask if anyone felt the tug. Have other students pull
on the yarn at varying strengths and see if others feel it. 8. Conclude with a discussion about What might that pull represent or signify about the
connections between environmental issues? What might the softer pull represent or signify? How can understanding the interconnectedness of environmental issues help us green the manufacturing sector?
Adapted from: Facing the Future, Making Global Connections, www.facingthefuture.org.
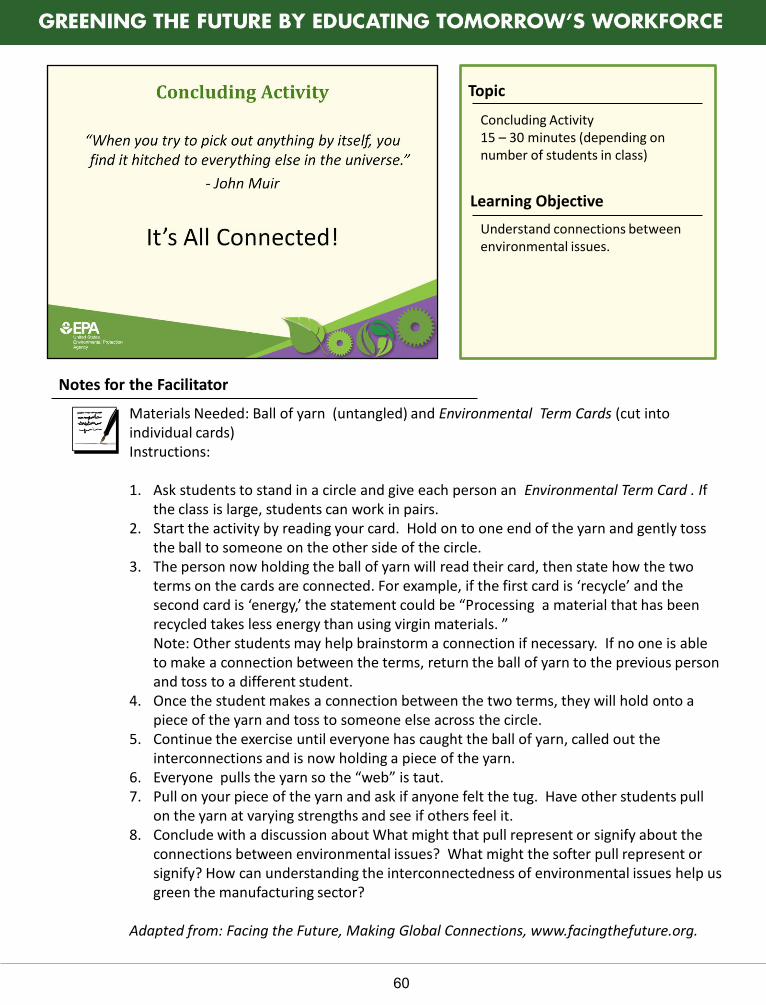
Concluding Activity 15 – 30 minutes (depending on number of students in class)
Understand connections between environmental issues.