Embed Size (px)
Citation preview
Sustainable Investment in the Middle East and North AfricaRegion Report
IFC Advisory Services in the Middle East and North Africa
Italy, Ireland, Luxembourg, Netherlands, Norway, and the United States
In partnership with:
IFC, a member of the World Bank Group, creates opportunity for people to escape poverty and improve their lives. We foster
sustainable economic growth in developing countries by supporting private sector development, mobilizing private capital, and
providing advisory and risk mitigation services to businesses and governments. This report was commissioned by IFC through
its Corporate Governance program which helps improve access to capital and increase the operational efficiency and financial
performance of family-run enterprises and financial institutions serving micro, small and medium enterprises.
The conclusions and judgments contained in this report should not be attributed to, and do not necessarily represent the views
of, IFC or its Board of Directors or the World Bank or its Executive Directors, or the countries they represent. IFC and the World
Bank do not guarantee the accuracy of the data in this publication and accept no responsibility for any consequences of their
use.
2009 © International Finance Corporation (IFC)
2121 Pennsylvania Avenue NW
Washington, D.C. 20433, USA
Telephone: 202–473–1000
Internet: IFC.org
All rights reserved
This information, while based on sources that IFC considers to be reliable, is not guaranteed as to accuracy and does not
purport to be complete. This information shall not be construed, implicitly or explicitly, as containing any investment recommen-
dations and, accordingly, IFC is not registered under the U.S. Investment Advisers Act of 1940.
The denominations and geographical names in this publication are used solely for the convenience of the reader and do not
imply any judgment on the part of IFC, the World Bank, or other affiliates concerning the legal status of any territory or the
endorsement or acceptance of such boundaries.
Any views expressed herein are those of the authors and do not necessarily represent the views of the World Bank or the
International Finance Corporation.
Rights and Permissions
The material in this publication is copyrighted. Copying and/or transmitting portions or all of this work without permission may
be a violation of applicable law. The World Bank Group encourages dissemination of its work and will normally grant permission
to reproduce portions of the work promptly.
For permission to photocopy or reprint any part of this work, please send a request with complete information to the Copyright
Clearance Center Inc., 222 Rosewood Drive, Danvers, MA 01923, USA; telephone: 978–750–8400; facsimile: 978–750–4470;
Internet: www.copyright.com
All other queries on rights and licenses, including subsidiary rights, should be addressed to the Office of the Publisher,
The World Bank, 1818 H Street NW, Washington, D.C. 20433, USA; facsimile: 202–522–2422; e-mail:
Acknowledgements ..........................................................................................................................................................................6
Executive Summary ...........................................................................................................................................................................8
1. Introduction .....................................................................................................................................................................................15
Objectives ............................................................................................................................................................................... 15
Scope ......................................................................................................................................................................................... 15
Report Structure ................................................................................................................................................................. 15
2. Regional Overview....................................................................................................................................................................17
Region’s Material ESG Issues ................................................................................................................................... 17
Region’s Economic Fundamentals ......................................................................................................................... 17
Water Scarcity .................................................................................................................................................................... 19
Building a Competitive, Diverse, Employed and Respected Labor Force .................................20
Economic Sectors Breakdown ................................................................................................................................21
FDI and Outward Investment ....................................................................................................................................24
MENA Securities Markets ..........................................................................................................................................27
3. Market Preparedness for SI ............................................................................................................................................29
Investment and ESG Regulations and Country Performance ..................................................................30
Investment Laws and Regulations ....................................................................................................................................32
Corporate Governance Laws and Regulations and Country Performance .................................. 37
Environmental Laws and Regulations and Country Performance ........................................................43
Social-Related Laws and Regulations and Country Performance ........................................................51
ESG Disclosure .................................................................................................................................................................................. 61
Sustainability Reporting and Non-Financial Information Disclosure .................................................. 61
Adoption of International Voluntary SI Frameworks by Asset Managers/Owners ..................65
ESG Disclosure Analysis .........................................................................................................................................................67
Supporting Infrastructure ...........................................................................................................................................................69
Responsible Competitiveness Research ...................................................................................................................69
Analysis and Summary of Key Observations ...........................................................................................................71
Contents
4. Market Interest in SI .................................................................................................................................................................73
Shari’ah-Compliant Investing ................................................................................................................................................. 75
Sovereign Wealth Funds ............................................................................................................................................................ 76
Private Equity .......................................................................................................................................................................................86
Foreign Investment .........................................................................................................................................................................93
Analysis and Summary of Key Observations ..........................................................................................................95
5. Challenges and Opportunities for Development of the Sustainable Investment Market in MENA ...............................................................................................................................................................................................98
Key Challenges and Opportunities ................................................................................................................................ 101
Recommendations .......................................................................................................................................................................102
6. Appendices ............................................................................................................................................................................................
Appendix 1: Explanation of the Methodology ....................................................................................................... 107
Appendix 2: In-depth review of 11 key markets ...................................................................................................110
Appendix 3: Regional Supporting Infrastructure ................................................................................................144
Appendix 4: Exchange Rates Used ..............................................................................................................................150
Appendix 5: Explanation of Terms and Abbreviations ...................................................................................151
IGNISI BLA CORE ESED EA CONULLA FEUGAIT, QUIPISIM XX
For the past five years, IFC’s Sustainable Investing Team has delivered
technical and financial support for projects that aim to mobilize
sustainable capital flows into emerging markets. The goal is to increase
the volume of investment that uses ESG analysis as a standard practice
in investment decisions.
Preface
IFC’s approach is twofold:To catalyze capital market flows into sustainable investing (SI), IFC works to (a) promote the business case for SI by drawing on lessons from IFC’s own portfolio, (b) establish frameworks to identify and assess new SI opportunities, and (c) develop new financial products (e.g. Sustainability Indices); andTo support fund managers investing in sustainable companies, IFC works (a) with private equity funds in IFC’s portfolio to assist them in establishing ESG analytical processes, and (b) with capital market actors to improve the environment for the market to recognize sustainability in corporate valuation.
IFC is committed to continue its work in partnership with key market actors to improve the enabling environment and address barriers to sustainable investment in emerging markets. In order to do this, IFC’s work is centered in three areas: policies and standards, knowledge management, and investment vehicles. The Sustainable Investing Team is part of IFC’s Environment and Social Development Department, and benefits from the generous financial support of IFC and the governments of Japan, the Netherlands, Norway, Canada, South Africa, and Switzerland. For more information, please visit the Sustainable Investing website at www.ifc.org/sustainableinvesting.
SUSTAINABLE INVESTMENT IN THE MIDDLE EAST AND NORTH AFRICA, 20106
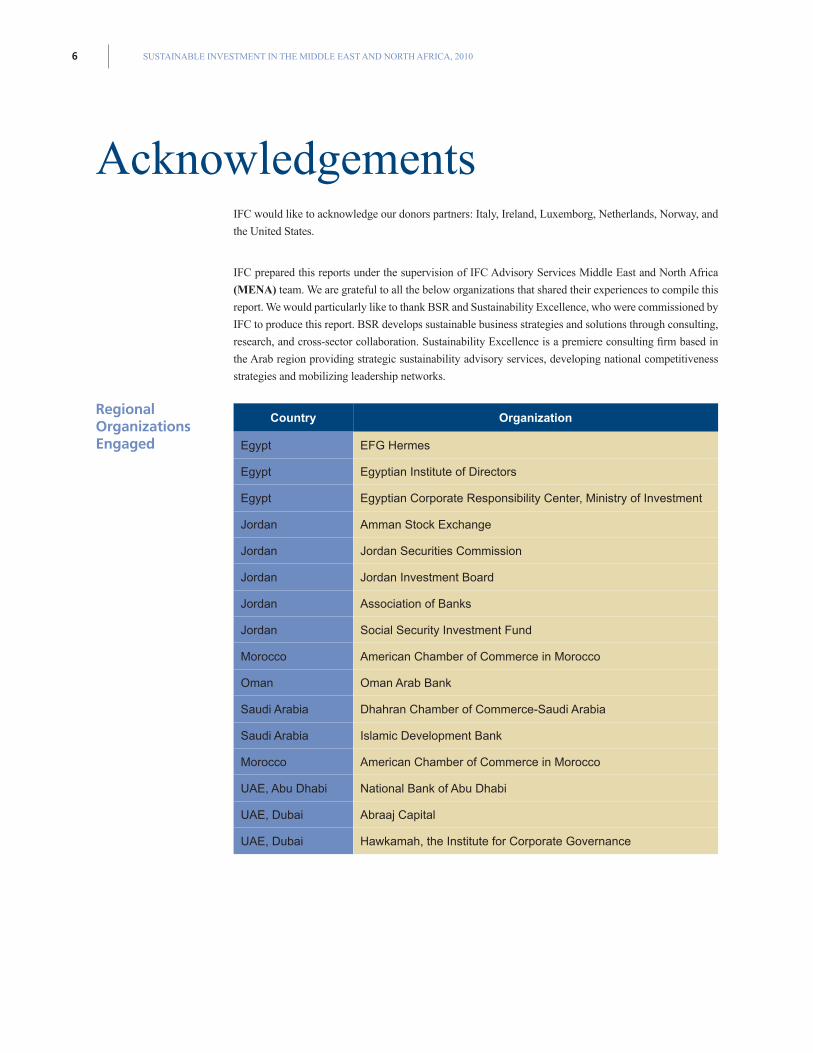
Country Organization
Egypt EFG Hermes
Egypt Egyptian Institute of Directors
Egypt Egyptian Corporate Responsibility Center, Ministry of Investment
Jordan Amman Stock Exchange
Jordan Jordan Securities Commission
Jordan Jordan Investment Board
Jordan Association of Banks
Jordan Social Security Investment Fund
Morocco American Chamber of Commerce in Morocco
Oman Oman Arab Bank
Saudi Arabia Dhahran Chamber of Commerce-Saudi Arabia
Saudi Arabia Islamic Development Bank
Morocco American Chamber of Commerce in Morocco
UAE, Abu Dhabi National Bank of Abu Dhabi
UAE, Dubai Abraaj Capital
UAE, Dubai Hawkamah, the Institute for Corporate Governance
Acknowledgements
RegionalOrganizationsEngaged
IFC would like to acknowledge our donors partners: Italy, Ireland, Luxemborg, Netherlands, Norway, and
the United States.
IFC prepared this reports under the supervision of IFC Advisory Services Middle East and North Africa
(MENA) team. We are grateful to all the below organizations that shared their experiences to compile this
report. We would particularly like to thank BSR and Sustainability Excellence, who were commissioned by
IFC to produce this report. BSR develops sustainable business strategies and solutions through consulting,
research, and cross-sector collaboration. Sustainability Excellence is a premiere consulting firm based in
the Arab region providing strategic sustainability advisory services, developing national competitiveness
strategies and mobilizing leadership networks.
7ACKNOWLEDGEMENTS
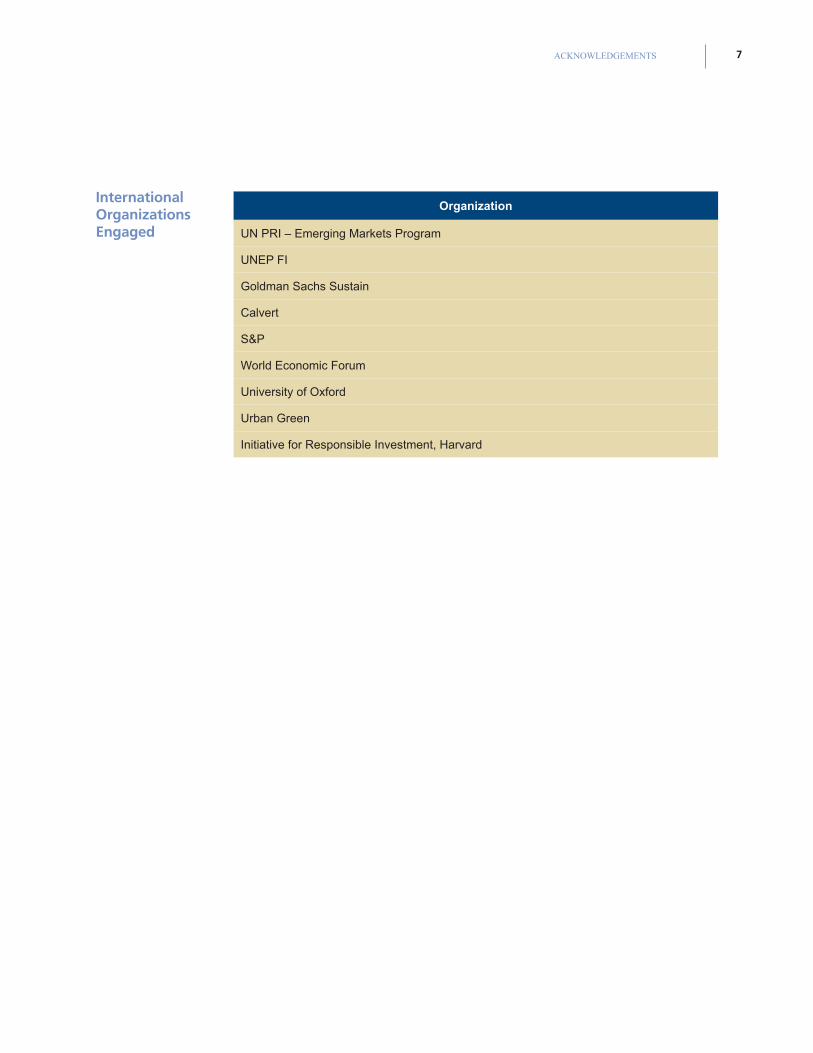
InternationalOrganizationsEngaged
Organization
UN PRI – Emerging Markets Program
UNEP FI
Goldman Sachs Sustain
Calvert
S&P
World Economic Forum
University of Oxford
Urban Green
Initiative for Responsible Investment, Harvard
SUSTAINABLE INVESTMENT IN THE MIDDLE EAST AND NORTH AFRICA, 20108
Executive SummaryObjectives and Scope
This report is part of IFC’s Sustainable Business Advisory. The report has the following objectives:
• To determine the current state of development of SI in MENA by measuring the market on a number of indicators.
• To establish the feasibility of interventions such as sustainability indices, ratings and regulations to stimulate the market and make recommendations for the appropriate development path unique to the region.
For the purposes of this report, SI is taken to mean investment techniques that integrate ESG value drivers into financial research and investment processes. The report includes Shari’ah-compliant investments within this definition. The assessment draws on available information from 11 key markets in the MENA region—Bahrain, Egypt, Jordan, Kuwait, Lebanon, Morocco, Oman, Qatar, Saudi Arabia, Tunisia, and the United Arab Emirates (UAE).
Regional Context and Key ESG Issues
The MENA region produces more than $1,500 billion per annum in Gross Domestic Product (GDP), or approximately three percent of global GDP1, and accounts for 6 percent of the global population with300 million people2. Prevailing socio-economic issues include a drive toward more diversified economies, the challenge of youth development and employment when two-thirds of the population is below the age of 30 and roughly 27 percent is below the age of 15, the contribution of women to economic and social development and opportunities for women in the workplace, and labor conditions, particularly for foreign workers. Environmental issues include water scarcity and climate change, while governance issues center around ongoing governance reform and the push for greater transparency.
Assessment
This assessment is based on an analysis of “Market Preparedness” and current “Market Interest” in SI among different investors active in the MENA region.
1 World Development Indicators database, World Bank, 1 July, 2010
2World Bank.org, regional overview: http://web.worldbank.org/WBSITE/EXTERNAL/COUNTRIES/MENAEXT/0,,menuPK:247619~pagePK:146748~piPK:146812~theSitePK:256299,00.html
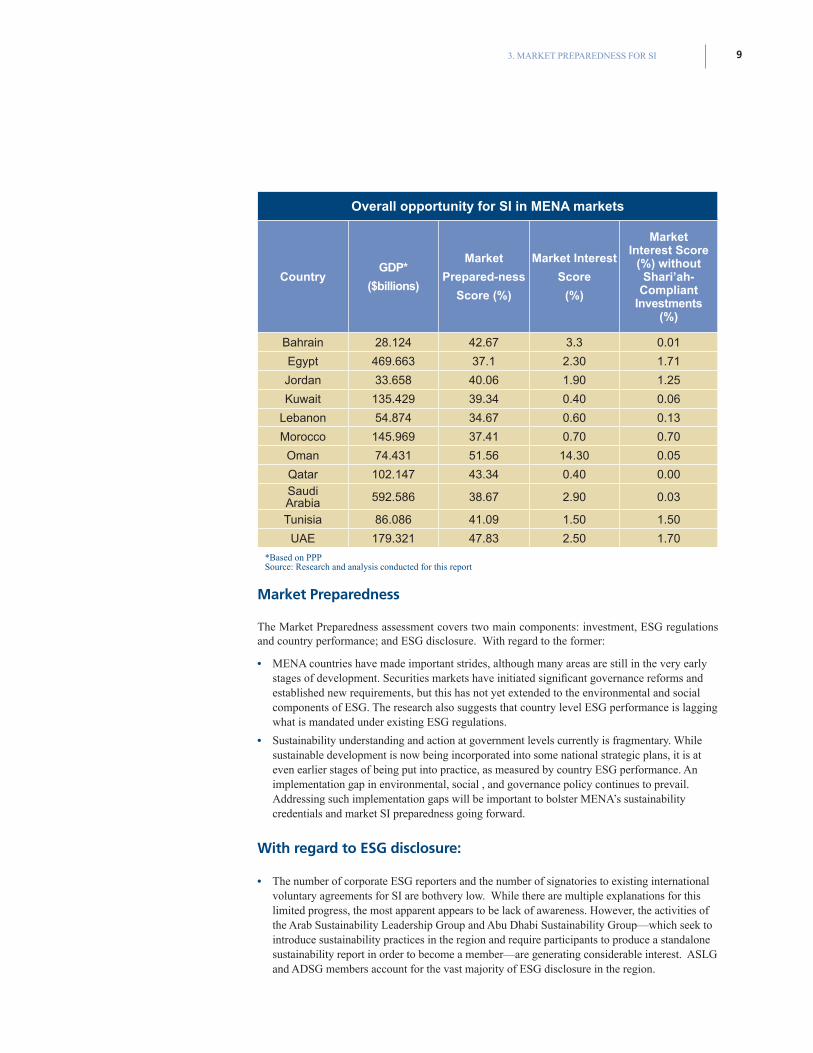
3. MARKET PREPAREDNESS FOR SI 9
Overall opportunity for SI in MENA markets
CountryGDP*
($billions)
Market
Prepared-ness
Score (%)
Market Interest
Score
(%)
Market Interest Score
(%) without Shari’ah-
Compliant Investments
(%)
Bahrain 28.124 42.67 3.3 0.01
Egypt 469.663 37.1 2.30 1.71
Jordan 33.658 40.06 1.90 1.25
Kuwait 135.429 39.34 0.40 0.06
Lebanon 54.874 34.67 0.60 0.13
Morocco 145.969 37.41 0.70 0.70
Oman 74.431 51.56 14.30 0.05
Qatar 102.147 43.34 0.40 0.00SaudiArabia 592.586 38.67 2.90 0.03
Tunisia 86.086 41.09 1.50 1.50
UAE 179.321 47.83 2.50 1.70
*Based on PPPSource: Research and analysis conducted for this report
Market Preparedness
The Market Preparedness assessment covers two main components: investment, ESG regulations and country performance; and ESG disclosure. With regard to the former:
• MENA countries have made important strides, although many areas are still in the very early stages of development. Securities markets have initiated significant governance reforms and established new requirements, but this has not yet extended to the environmental and social components of ESG. The research also suggests that country level ESG performance is lagging what is mandated under existing ESG regulations.
• Sustainability understanding and action at government levels currently is fragmentary. While sustainable development is now being incorporated into some national strategic plans, it is at even earlier stages of being put into practice, as measured by country ESG performance. An implementation gap in environmental, social , and governance policy continues to prevail. Addressing such implementation gaps will be important to bolster MENA’s sustainability credentials and market SI preparedness going forward.
With regard to ESG disclosure:
• The number of corporate ESG reporters and the number of signatories to existing international voluntary agreements for SI are bothvery low. While there are multiple explanations for this limited progress, the most apparent appears to be lack of awareness. However, the activities of the Arab Sustainability Leadership Group and Abu Dhabi Sustainability Group—which seek to introduce sustainability practices in the region and require participants to produce a standalone sustainability report in order to become a member—are generating considerable interest. ASLG and ADSG members account for the vast majority of ESG disclosure in the region.
SUSTAINABLE INVESTMENT IN THE MIDDLE EAST AND NORTH AFRICA, 201010
Overall, the markets are mainly tightly clustered, suggesting that some
countries are at similar points of development and that it may be pos-
sible to undertake regional or sub-regional efforts to enhance Market
Preparedness for SI.
345 6 7
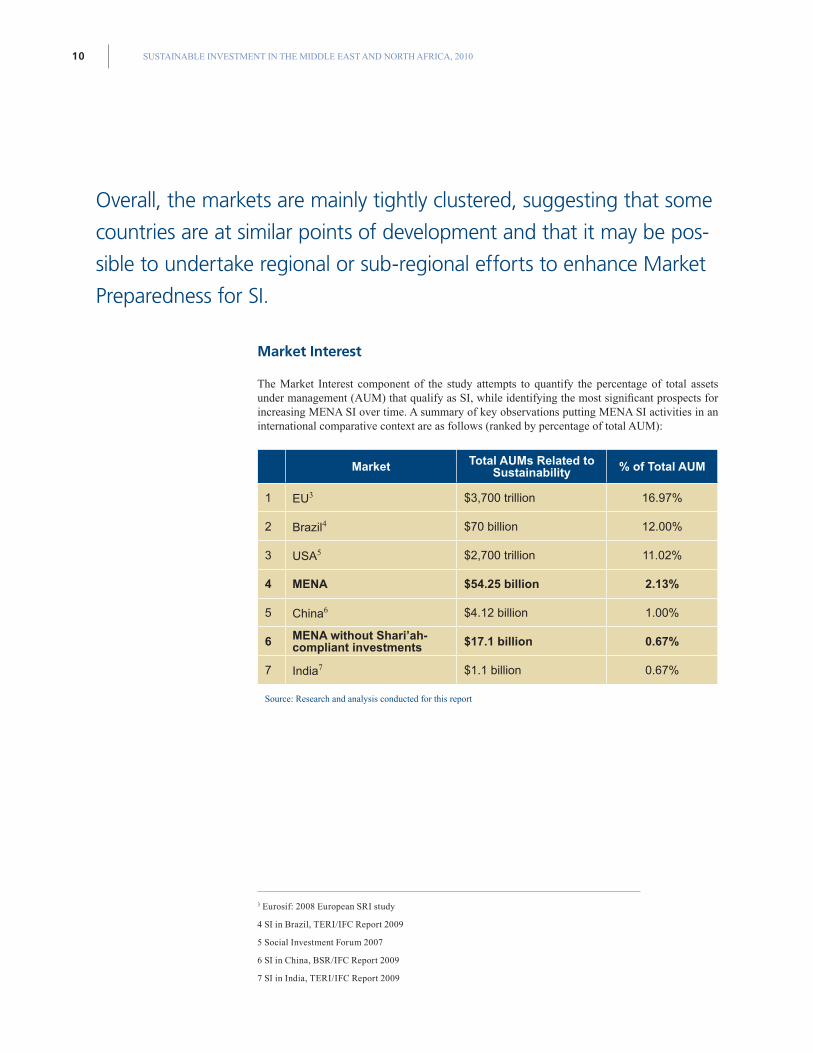
Market Interest
The Market Interest component of the study attempts to quantify the percentage of total assets under management (AUM) that qualify as SI, while identifying the most significant prospects for increasing MENA SI over time. A summary of key observations putting MENA SI activities in an international comparative context are as follows (ranked by percentage of total AUM):
Market Total AUMs Related to Sustainability % of Total AUM
1 EU3 $3,700 trillion 16.97%
2 Brazil4 $70 billion 12.00%
3 USA5 $2,700 trillion 11.02%
4 MENA $54.25 billion 2.13%
5 China6 $4.12 billion 1.00%
6 MENA without Shari’ah- compliant investments $17.1 billion 0.67%
7 India7 $1.1 billion 0.67%
Source: Research and analysis conducted for this report
3 Eurosif: 2008 European SRI study
4 SI in Brazil, TERI/IFC Report 2009
5 Social Investment Forum 2007
6 SI in China, BSR/IFC Report 2009
7 SI in India, TERI/IFC Report 2009
11EXECUTIVE SUMMARY
• Approximately 2.13 percent of MENA AUMs incorporate SI. This is a conservative estimate based solely on disclosed data, and excludes publicly committed investments which cannot be verified as already invested. This includes Shari’ah-compliant investments. If Shari’ah-compliant investments are excluded, the percentage decreases to 0.67 percent.
• MENA SI levels are low, but not insignificant. While the MENA SI AUM levels are low, they are higher than SI AUM in India and China. Even if Shari’ah compliant investments are removed, the level is on par with India.
• Existing SIs are potentially significant catalysts, including Shari’ah-compliant investment funds, SI leadership by the largest MENA private equity firm, the influence of World Bank/IFC and other foreign institution screening practices on relevant PE funds, and significant recent ESG developments by major MENA Sovereign Wealth Funds (SWFs). Of these opportunities, the most widely practiced SI activity in the region is Shari’ah-compliant investing.
• Shari’ah-compliant investment funds are similar to “negative-screen” SI funds and their current scale of awareness and uptake represent a potential mass platform for creating greater awareness of SI. Elsewhere in the world, negative-screen funds typically precede positively screened SI funds that then adopt increasingly aggressive criteria for environmental, social and governance screening. While Shari’ah compliant investors may not necessarily follow this pattern, their commitment to Islamic ideals and general interest in betterment of society has the potential to translate into support for “positive-screen” sustainable investments.
• SI uptake by market investors in MENA is likely to take some time, although it will likely advance within dramatically compacted timelines in comparison to Europe and North America. In addition to the currently low percentage of MENA SI AUM versus total AUM, there is presently a lack of interest in investing in securities due to heavy market losses in recent years. This will significantly affect activity relating to Shari’ah-compliant funds. Nevertheless, the take-up of SI in the region will be dramatically accelerated compared to the timeline in North America and Europe, with expectations of high levels of SI AUM within 3-5 years.
• Private equity SI initiatives will have a disproportionate impact on Market Interest. MENA private equity is taking a growing interest in SI. This is in part due to the recognition of the added risk-mitigation benefits of SI-screening, the potential benefits of sustainability management by portfolio companies, and emerging clean technology investment opportunities in sectors such as water management that are essential to the region. As PE firms increasingly adopt and promote the benefits of SI-screening, sustainability management, and reporting by portfolio companies, this will influence key PE stakeholders including some of the region’s wealthiest and most active investors. It also likely will inspire influential government officials who may monitor the factors that successful PE firms deem important to effective investing.
• Sovereign wealth funds represent the greatest MENA SI opportunity. Contrary to perception, analysis suggests that the most likely source of a significant nearer-term increase in MENA SI AUMs is from the SWFs. Their growing role in global SWF affairs as relates to governance, transparency, and risk management; the growing emphasis on sustainability within their national agendas, including emerging theme-based investments in sustainability and clean technology sectors; the business case for risk-minimizing ESG screening of investments and for improving performance of portfolio companies; and the business case for using SI as a tool for reducing resistance to foreign acquisitions offer multiple catalysts for increased SWF SI. SWFs make up 60 percent of the MENA AUMs covered by this study, and any notable movement by SWFs will have the greatest effect on total MENA SI AUMs and the regional business community. The impact on public markets will be less extensive, in that it will be limited to SWF SI-screening with publicly listed portfolio companies. Nonetheless, it will raise awareness of SI screening and its potential benefits among a wide range of investment classes.
SUSTAINABLE INVESTMENT IN THE MIDDLE EAST AND NORTH AFRICA, 201012
• Some foreign-based guidelines, such as World Bank / IFC guidelines, OPIC criteria, the Equator Principles, and other international guidelines will provide some support for the adoption of SI in that they offer SI-screening with affected projects or guidelines that have been tested in other respected markets and thus are viewed with greater receptiveness.
13EXECUTIVE SUMMARY
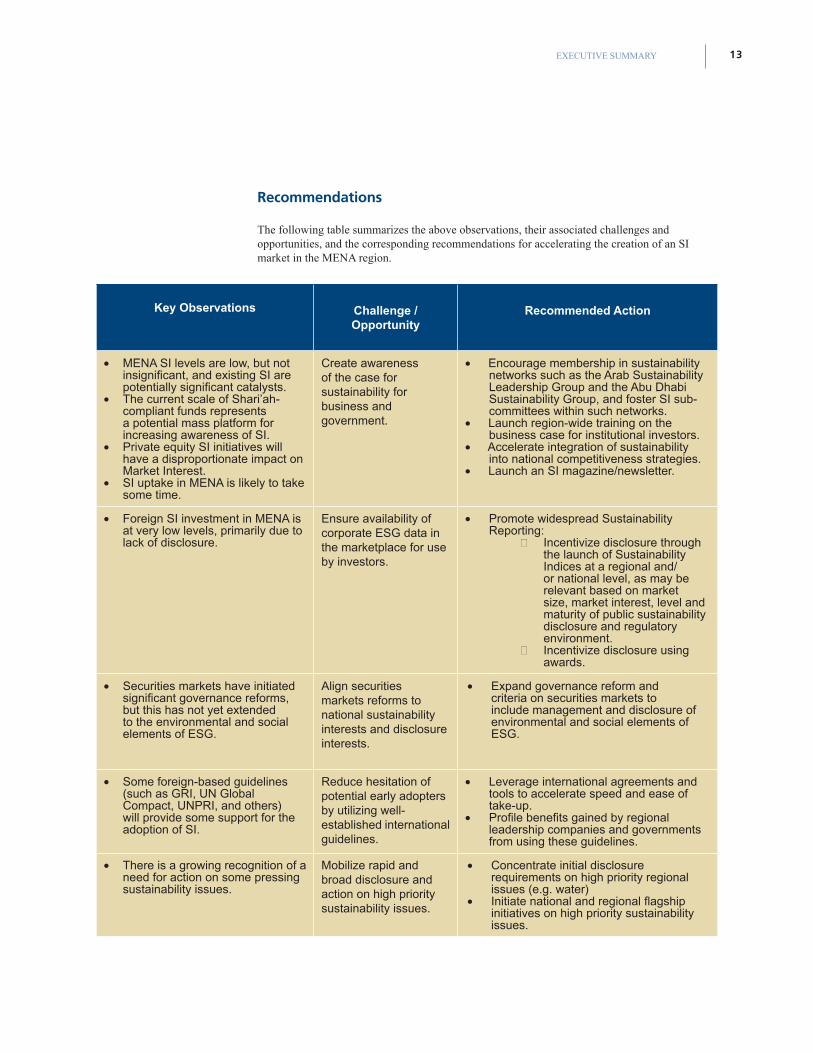
Recommendations
The following table summarizes the above observations, their associated challenges and opportunities, and the corresponding recommendations for accelerating the creation of an SI market in the MENA region.
Key Observations
Challenge / Opportunity
Recommended Action
• MENA SI levels are low, but not insignificant, and existing SI are potentially significant catalysts.
• The current scale of Shari’ah-compliant funds represents a potential mass platform for increasing awareness of SI.
• Private equity SI initiatives will have a disproportionate impact on Market Interest.
• SI uptake in MENA is likely to take some time.
Create awareness of the case for sustainability for business and government.
• Encourage membership in sustainability networks such as the Arab Sustainability Leadership Group and the Abu Dhabi Sustainability Group, and foster SI sub-committees within such networks.
• Launch region-wide training on the business case for institutional investors.
• Accelerate integration of sustainability into national competitiveness strategies.
• Launch an SI magazine/newsletter.
• Foreign SI investment in MENA is at very low levels, primarily due to lack of disclosure.
Ensure availability of corporate ESG data in the marketplace for use by investors.
• Promote widespread Sustainability Reporting:
○ Incentivize disclosure through the launch of Sustainability Indices at a regional and/or national level, as may be relevant based on market size, market interest, level and maturity of public sustainability disclosure and regulatory environment.
○ Incentivize disclosure using awards.
• Securities markets have initiated significant governance reforms, but this has not yet extended to the environmental and social elements of ESG.
Align securities markets reforms to national sustainability interests and disclosure interests.
• Expand governance reform and criteria on securities markets to include management and disclosure of environmental and social elements of ESG.
• Some foreign-based guidelines (such as GRI, UN Global Compact, UNPRI, and others) will provide some support for the adoption of SI.
Reduce hesitation of potential early adopters by utilizing well-established international guidelines.
• Leverage international agreements and tools to accelerate speed and ease of take-up.
• Profile benefits gained by regional leadership companies and governments from using these guidelines.
• There is a growing recognition of a need for action on some pressing sustainability issues.
Mobilize rapid and broad disclosure and action on high priority sustainability issues.
• Concentrate initial disclosure requirements on high priority regional issues (e.g. water)
• Initiate national and regional flagship initiatives on high priority sustainability issues.
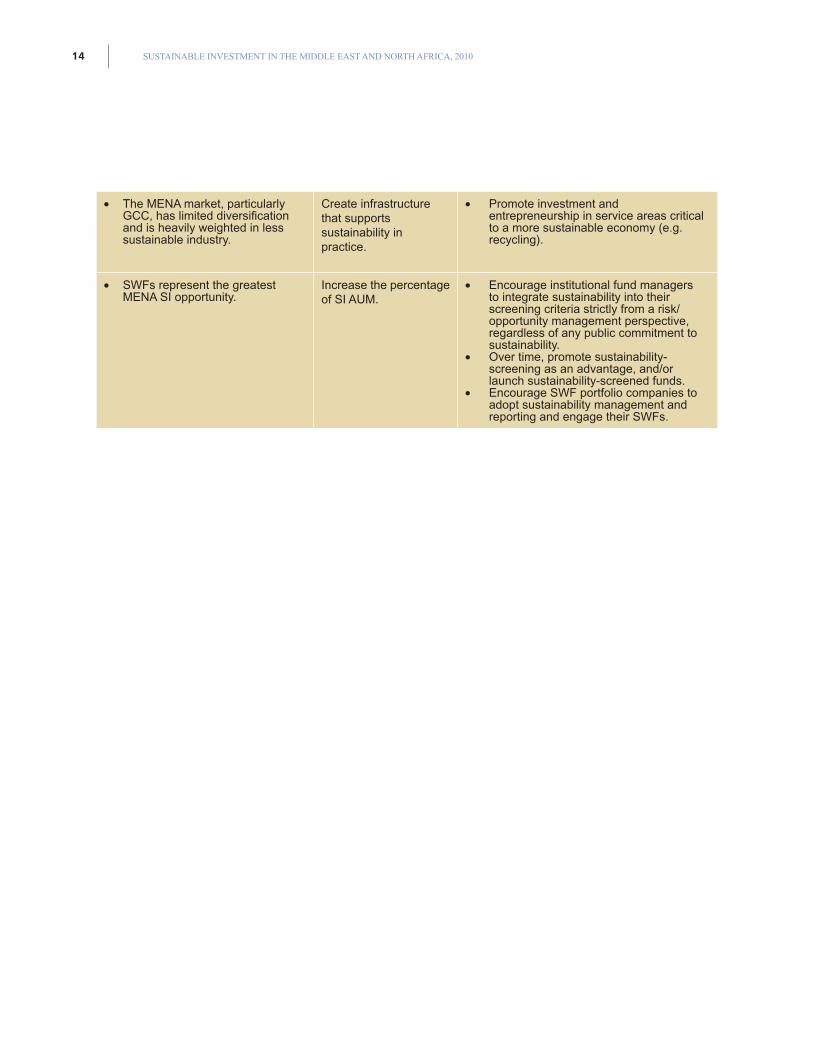
SUSTAINABLE INVESTMENT IN THE MIDDLE EAST AND NORTH AFRICA, 201014
• The MENA market, particularly GCC, has limited diversification and is heavily weighted in less sustainable industry.
Create infrastructure that supports sustainability in practice.
• Promote investment and entrepreneurship in service areas critical to a more sustainable economy (e.g. recycling).
• SWFs represent the greatest MENA SI opportunity.
Increase the percentage of SI AUM.
• Encourage institutional fund managers to integrate sustainability into their screening criteria strictly from a risk/opportunity management perspective, regardless of any public commitment to sustainability.
• Over time, promote sustainability-screening as an advantage, and/or launch sustainability-screened funds.
• Encourage SWF portfolio companies to adopt sustainability management and reporting and engage their SWFs.
151. INTRODUCTION
1. Introduction Objectives
The report has the following objectives:
• To determine the current state of development of SI in MENA by measuring the market against a number of indicators.
• To establish the feasibility of interventions such as sustainability indices, ratings and regulations to stimulate the market and make recommendations for the appropriate development path unique to the region.
The sources of information include desk research and interviews over the phone and in person with interviewees in Abu Dhabi, Amman, Boston, Cairo, Dhahran, Dubai, Geneva, Jeddah, London, Muscat, New York, and Paris from May-August, 2010.
Scope
The document provides an overall assessment of the SI market in the Middle East and North Africa (MENA) region. For the purposes of this report, SI is taken to mean investment techniques which integrate ESG value drivers into financial research and investment processes. Types of SI techniques considered in this report include, but are not limited to, negative screening, positive screening, best-in-class, and “integrated” approaches such as engagement and non-financial risk auditing/analysis. The report includes Shari’ah-compliant investments within this definition, as a form of negative screening.
The assessment is based on an analysis of Market Preparedness and current Market Interest among different investors active in the MENA region for SI. In order to get a full sense of the level of interest and take-up of SI in the MENA region, the report looks not only at individual and institutional investments into public markets, but also at investment practices of private equity firms and sovereign wealth funds into both private and public firms. The report reviews domestic (regional) investment practices as well as the practices of international investors.
The assessment draws on available information from 11 key markets in the MENA region—Bahrain, Egypt, Jordan, Kuwait, Lebanon, Morocco, Oman, Qatar, Saudi Arabia, Tunisia, and the United Arab Emirates (UAE). Combined, these markets represent 42 percent of the total population of the 20 countries making up the region, and account for 63 percent of its GDP. For ease of analysis, the 11 markets are sometimes clustered as follows:
• Gulf Co-Operation Council (GCC): Bahrain, Kuwait, Oman, Qatar, Saudi Arabia, and UAE
• The Levant: Jordan and Lebanon
• North Africa: Egypt, Morocco and Tunisia
Report Structure
Following this introductory chapter, Chapter 2 provides a review of MENA fundamentals, including a description of the economy and capital markets. Material ESG issues for the region are referenced throughout the text.
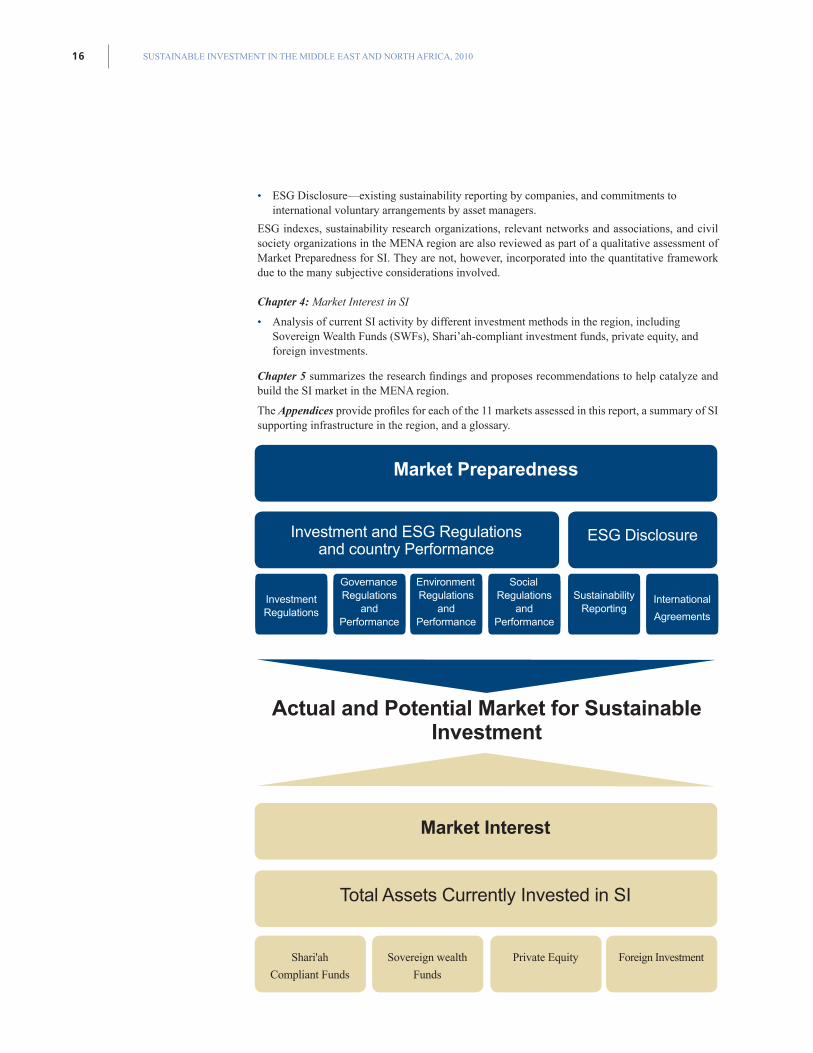
Chapters 3 and 4 capture the main research for the report. Content is organized around an analytical framework (see next page) for assessing SI-readiness as follows:
Chapter 3: Market Preparedness for SI
• Regulatory environment for SI—the current laws and regulations covering investment, governance, environment, disclosure, and transparency.
• Country performance—country-by-country environmental, social, and governance analysis, allowing for some comparison of progress on ESG-relevant laws and regulations vis-à-vis actual national ESG performance.
SUSTAINABLE INVESTMENT IN THE MIDDLE EAST AND NORTH AFRICA, 201016
Market Interest
Total Assets Currently Invested in SI
Shari'ah
Compliant Funds
Sovereign wealth
Funds
Private Equity Foreign Investment
ESG Disclosure
Investment Regulations
Environment Regulations
andPerformance
Sustainability Reporting
Governance Regulations
andPerformance
SocialRegulations
andPerformance
International
Agreements
Investment and ESG Regulationsand country Performance
Market Preparedness
Actual and Potential Market for Sustainable Investment
• ESG Disclosure—existing sustainability reporting by companies, and commitments to international voluntary arrangements by asset managers.
ESG indexes, sustainability research organizations, relevant networks and associations, and civil society organizations in the MENA region are also reviewed as part of a qualitative assessment of Market Preparedness for SI. They are not, however, incorporated into the quantitative framework due to the many subjective considerations involved.
Chapter 4: Market Interest in SI
• Analysis of current SI activity by different investment methods in the region, including Sovereign Wealth Funds (SWFs), Shari’ah-compliant investment funds, private equity, and foreign investments.
Chapter 5 summarizes the research findings and proposes recommendations to help catalyze and build the SI market in the MENA region.
The Appendices provide profiles for each of the 11 markets assessed in this report, a summary of SI supporting infrastructure in the region, and a glossary.
172. REGIONAL OVERVIEW
2. Regional Overview Region’s Material ESG Issues
This chapter provides an overview of MENA fundamentals through information on the economic structure and the capital/securities markets. Throughout, references are made to material ESG issues in the region, and their relevance to investors. The regional material ESG issues discussed include:
ESG Material IssuesEnvironment
IssuesSocial Issues
Governance Issues
Water Scarcity l
A Competitive, Diverse, Employed, and Respected Workforce
l
Diversification Towards Sustainability
l l l
SWF Transparency and Contribution to the Global Economy
l
Corporate Governance and Disclosure
l
Region’s Economic Fundamentals
This section is divided into three sub-sections: current economic realities; main sectors in different MENA regions; FDI and outward investment.
Current Economic Realities
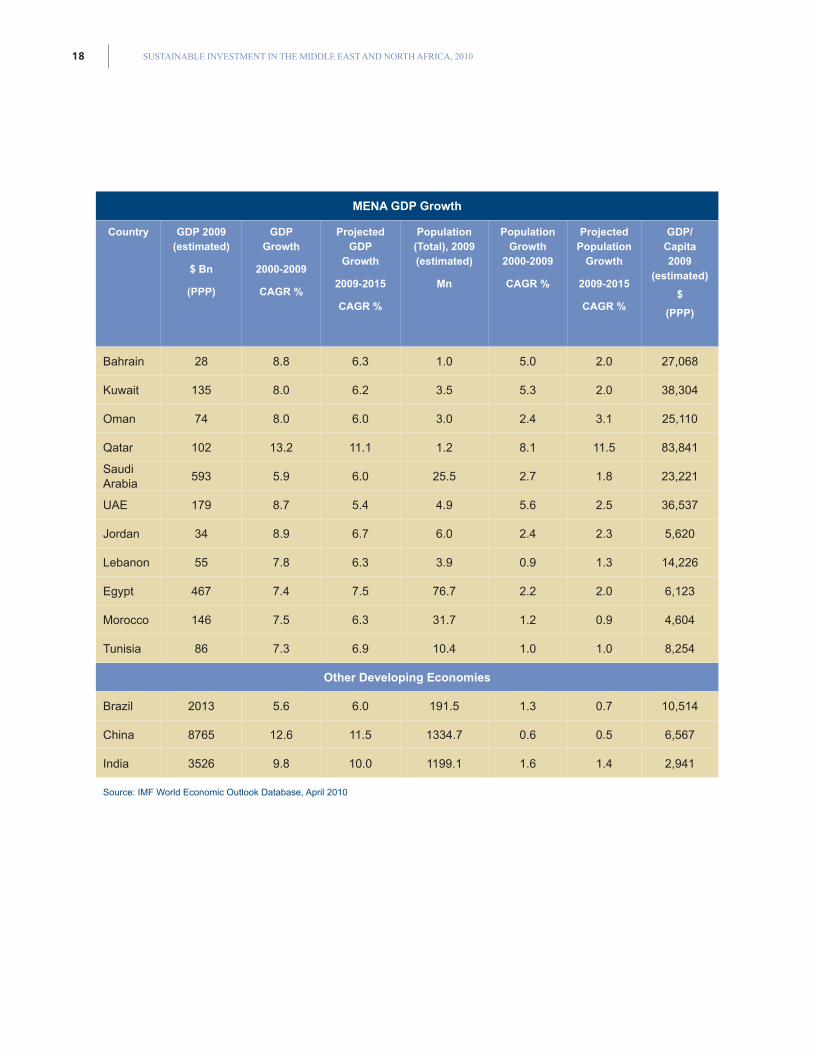
GDP GrowthCombined, MENA produces over $1,500 billion per annum in Gross Domestic Product (GDP), or approximately 3 percent of global GDP.8 While the GDP of the MENA countries sampled for this report (see below) show economic growth, for many, growth over the past two decades has been disappointing9 relative to other emerging economies. This is partly explained by the high volatility of these economies, given their heavy dependence on oil and other commodities. Other constraints to growth10 include poor infrastructure (outside the Gulf States), poor deployment of human capital, labor skills shortages, and poor corporate governance, among others. Going forward, the MENA countries sampled for the report are expected to grow at an average rate of 6.8 percent Compound Annual Growth Rate (CAGR) over the period of 2009-2015. There are important variations between sub-regions and individual markets. For example, within the GCC, only Saudi Arabia is expected to increase its growth rate from the previous period (2000-2009). All other GCC economies are expected to grow at a slower rate than they did between 2000 and 2009, with UAE slowing primarily due to recent turmoil in Dubai. Of the sub-regions, North Africa’s growth rate for the 2009-2015 period is expected to slow the least. The aforementioned existing constraints to growth will continue to have a bearing on the development of the region, alongside emerging challenges such as environmental pressures that include increasingly severe water scarcity.
8 World Development Indicators database, World Bank, 1 July, 2010
9 IMF Working Paper—Constraints on growth in the MENA region, Bhattacharya and Wolde, February, 2010
10 ibid
SUSTAINABLE INVESTMENT IN THE MIDDLE EAST AND NORTH AFRICA, 201018
MENA GDP Growth
Country GDP 2009 (estimated)
$ Bn
(PPP)
GDP Growth
2000-2009
CAGR %
Projected GDP
Growth
2009-2015
CAGR %
Population (Total), 2009 (estimated)
Mn
Population Growth
2000-2009
CAGR %
Projected Population
Growth
2009-2015
CAGR %
GDP/ Capita 2009
(estimated)
$
(PPP)
Bahrain 28 8.8 6.3 1.0 5.0 2.0 27,068
Kuwait 135 8.0 6.2 3.5 5.3 2.0 38,304
Oman 74 8.0 6.0 3.0 2.4 3.1 25,110
Qatar 102 13.2 11.1 1.2 8.1 11.5 83,841
Saudi Arabia
593 5.9 6.0 25.5 2.7 1.8 23,221
UAE 179 8.7 5.4 4.9 5.6 2.5 36,537
Jordan 34 8.9 6.7 6.0 2.4 2.3 5,620
Lebanon 55 7.8 6.3 3.9 0.9 1.3 14,226
Egypt 467 7.4 7.5 76.7 2.2 2.0 6,123
Morocco 146 7.5 6.3 31.7 1.2 0.9 4,604
Tunisia 86 7.3 6.9 10.4 1.0 1.0 8,254
Other Developing Economies
Brazil 2013 5.6 6.0 191.5 1.3 0.7 10,514
China 8765 12.6 11.5 1334.7 0.6 0.5 6,567
India 3526 9.8 10.0 1199.1 1.6 1.4 2,941
Source: IMF World Economic Outlook Database, April 2010
192. REGIONAL OVERVIEW
Water Scarcity
The MENA region is among the most fresh-water scarce regions in the world. Average annual available water per capita was measured at 977 cubic meters in 2001, well below the United Nations (UN) definition of water scarcity.11 By 2023, available water is expected to decrease to 460 cubic meters.12 With the exception of Egypt, Sudan, Iraq, Lebanon, and Syria, all MENA countries are projected to experience severe water stress by the year 2025. As part of a response, governments in the region are expected to invest more than $400 billion in infrastructure investments (including water) over the next three years, mostly in Saudi Arabia, UAE and Qatar.13
MENA investors increasingly will need to consider water intensity and dependency metrics as factors in business operational risk, particularly for industries that rely heavily on water, such as agriculture/food/ beverage, pharmaceuticals, and others.
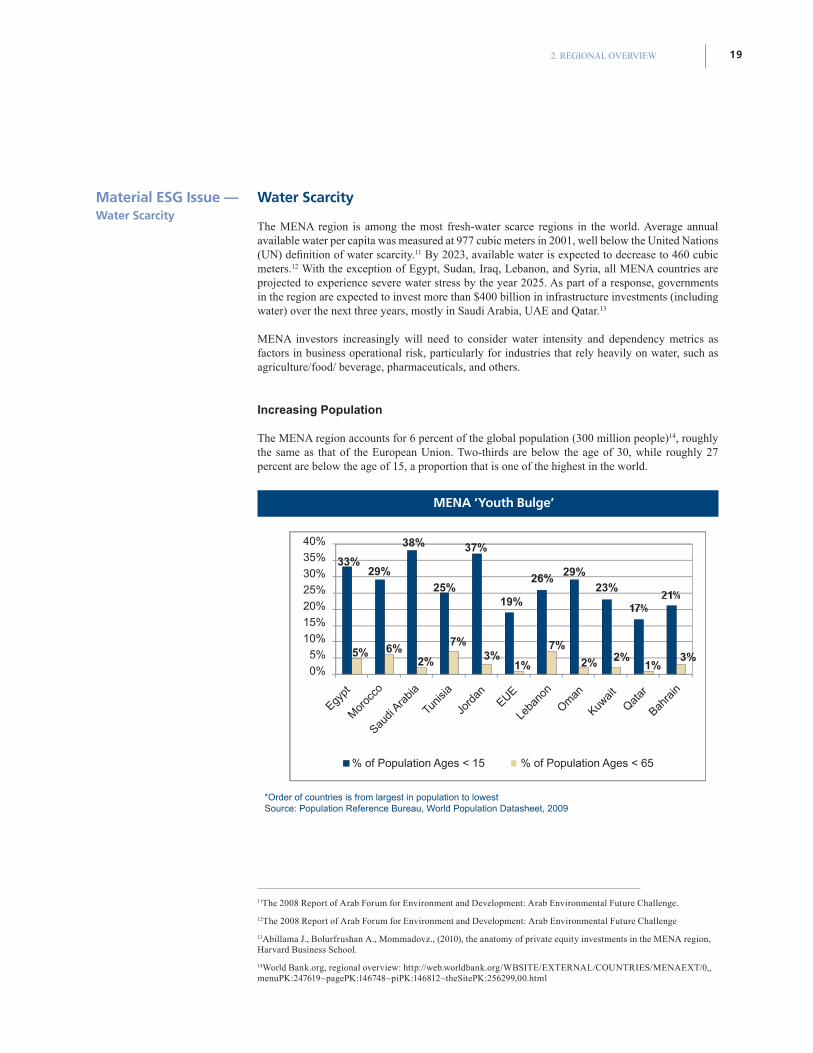
Increasing Population
The MENA region accounts for 6 percent of the global population (300 million people)14, roughly the same as that of the European Union. Two-thirds are below the age of 30, while roughly 27 percent are below the age of 15, a proportion that is one of the highest in the world.
*Order of countries is from largest in population to lowestSource: Population Reference Bureau, World Population Datasheet, 2009
11The 2008 Report of Arab Forum for Environment and Development: Arab Environmental Future Challenge.
12The 2008 Report of Arab Forum for Environment and Development: Arab Environmental Future Challenge
13Abillama J., Bolurfrushan A., Mommadovz., (2010), the anatomy of private equity investments in the MENA region, Harvard Business School.
14World Bank.org, regional overview: http://web.worldbank.org/WBSITE/EXTERNAL/COUNTRIES/MENAEXT/0,,menuPK:247619~pagePK:146748~piPK:146812~theSitePK:256299,00.html
Material ESG Issue —Water Scarcity
% of Population Ages < 65% of Population Ages < 15
Egypt
Mor
occo
Saudi
Arabia
Leba
non
Oman
Kuwait
Qatar
Bahra
in
Tunis
ia
Jord
anEUE
40%
35%
30%
25%
20%
15%
10%
5%
0%
33%
38% 37%
19%
29% 29%25%
5% 6%2% 2% 2% 3%
1%1%
7%3%
7%
26%23%
MENA ‘Youth Bulge’
SUSTAINABLE INVESTMENT IN THE MIDDLE EAST AND NORTH AFRICA, 201020
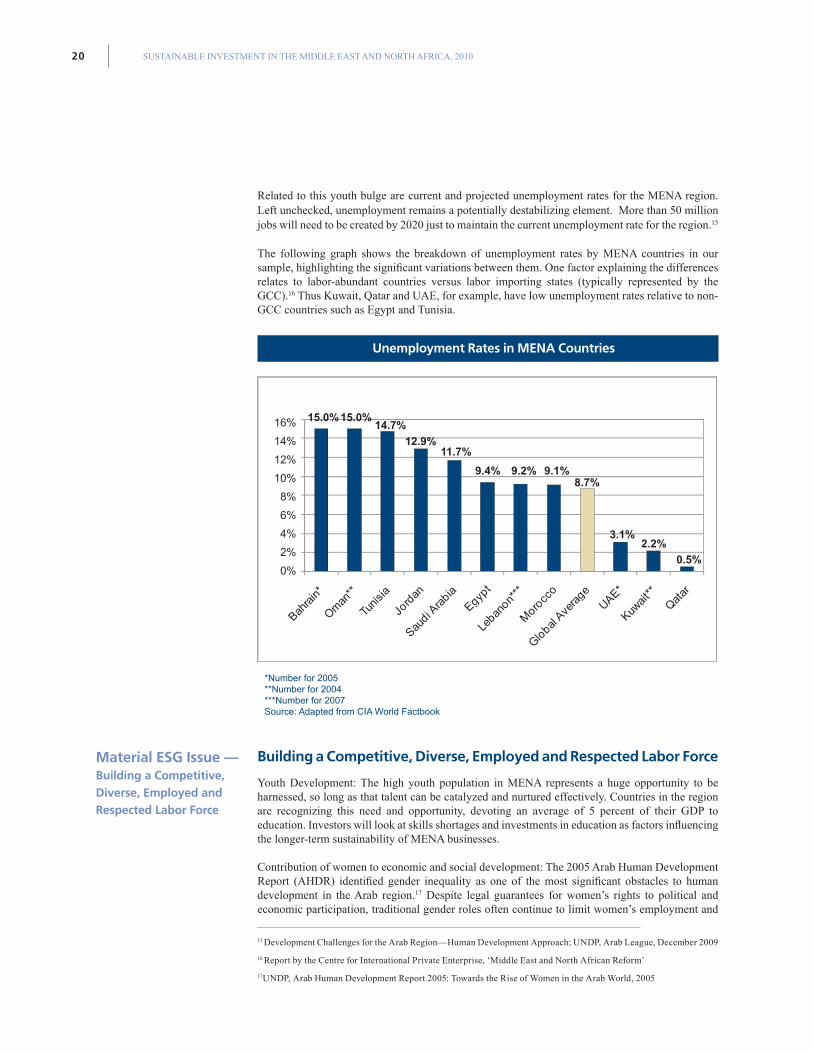
Related to this youth bulge are current and projected unemployment rates for the MENA region. Left unchecked, unemployment remains a potentially destabilizing element. More than 50 million jobs will need to be created by 2020 just to maintain the current unemployment rate for the region.15
The following graph shows the breakdown of unemployment rates by MENA countries in our sample, highlighting the significant variations between them. One factor explaining the differences relates to labor-abundant countries versus labor importing states (typically represented by the GCC).16 Thus Kuwait, Qatar and UAE, for example, have low unemployment rates relative to non-GCC countries such as Egypt and Tunisia.
*Number for 2005**Number for 2004 ***Number for 2007Source: Adapted from CIA World Factbook
Building a Competitive, Diverse, Employed and Respected Labor Force
Youth Development: The high youth population in MENA represents a huge opportunity to be harnessed, so long as that talent can be catalyzed and nurtured effectively. Countries in the region are recognizing this need and opportunity, devoting an average of 5 percent of their GDP to education. Investors will look at skills shortages and investments in education as factors influencing the longer-term sustainability of MENA businesses.
Contribution of women to economic and social development: The 2005 Arab Human Development Report (AHDR) identified gender inequality as one of the most significant obstacles to human development in the Arab region.17 Despite legal guarantees for women’s rights to political and economic participation, traditional gender roles often continue to limit women’s employment and
15 Development Challenges for the Arab Region—Human Development Approach; UNDP, Arab League, December 2009
16 Report by the Centre for International Private Enterprise, ‘Middle East and North African Reform’
17UNDP, Arab Human Development Report 2005: Towards the Rise of Women in the Arab World, 2005
Material ESG Issue —Building a Competitive, Diverse, Employed and Respected Labor Force
Unemployment Rates in MENA Countries
16%
14%
12%
10%
8%
6%
4%
2%
0%
15.0%15.0%14.7%
11.7%
9.4%
12.9%
9.2% 9.1%8.7%
3.1%2.2%
0.5%
212. REGIONAL OVERVIEW
decision-making opportunities. While there have been significant improvements in the education of women, their economic participation and career advancement opportunities have yet to match the gains witnessed in the world of education.18
Labor conditions: In many MENA countries, particularly the GCC, an extremely high percentage of the workforce, particularly in the private sector, is made of up migrant labor. Treatment of these workers has often come under criticism with respect to work conditions, pay, living conditions, freedom of mobility, and other concerns. Many MENA countries have responded to these concerns with significant regulatory and performance improvements, but this nonetheless remains a sensitive and serious issue that will continue to feature prominently as a highly visible ESG consideration in the region.
Economic Sectors Breakdown
Sector Breakdown
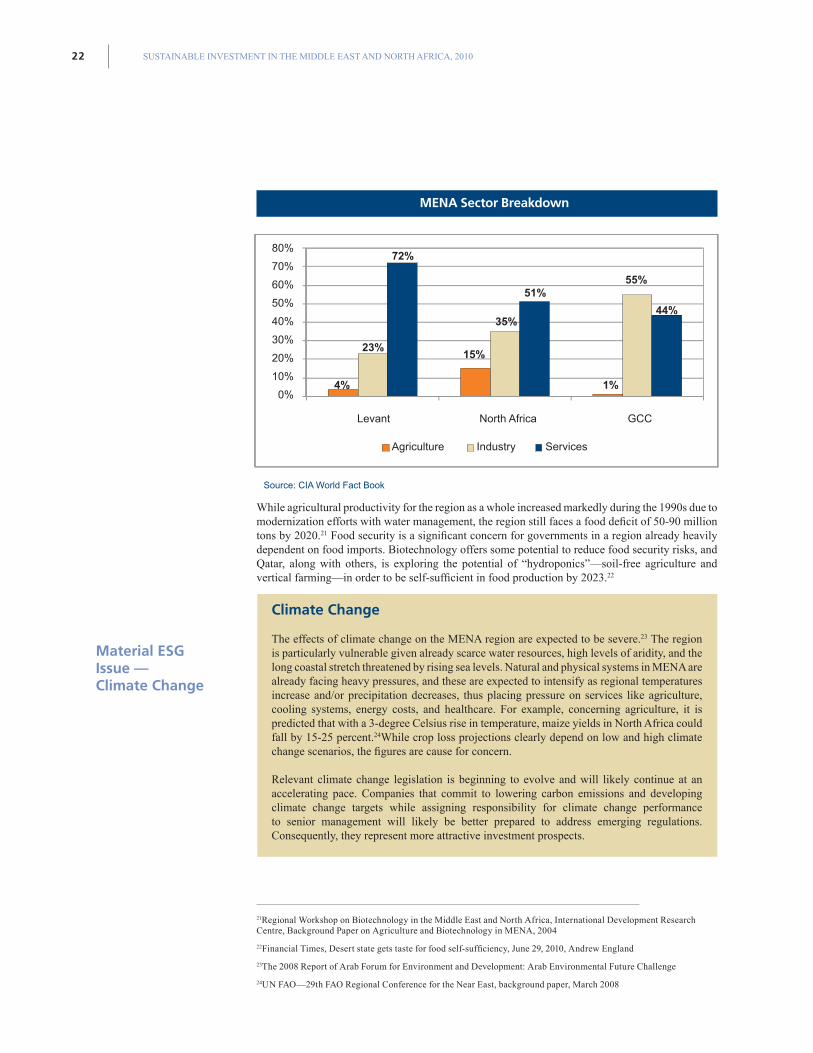
Oil and gas fuel much of the economic growth of the MENA region, through the GCC oil-producing economies. The GCC generates more than 60 percent of the total GDP for the MENA region. Kuwait, Oman, Qatar, Saudi Arabia, and the UAE are 5 of the top 15 oil exporting countries in the world. The GCC has more than 37 percent of the world’s proven oil reserves and 23 percent of the world’s proven natural gas reserves.19
In the relatively natural-resources poor Levant region, tourism and banking services dominate due to strong laissez-faire commercial traditions. Together, the economies of Lebanon and Jordan account for approximately 4 percentof the total GDP for the MENA region.
The North African countries—Morocco, Tunisia, and Egypt—relative to other countries in the sample, are the most diversified economies (through strong trade and tourism linkages with Europe and the OECD). According the World Bank, these countries are also the most integrated into the rest of the global economy and, consequently, have felt the impact of the economic crisis most acutely, especially because they were not cushioned by the rebound in oil prices at the start of 2009 (a situation enjoyed by the GCC oil-producing countries).20 Together, North Africa accounts for more than 21 percent of the total GDP for the MENA region.
18Responsible Competitiveness in the Arab World Report, 2009
19BP Statistical Review of World Energy, 2010
20Auguste Kouame, Acting Chief Economist for the MENA Region, April 23, 2009 interview, Available: http://web.worldbank.org/WBSITE/EXTERNAL/COUNTRIES/MENAEXT/0,,contentMDK:22153569~pagePK:146736~piPK:146830~theSitePK:256299,00.html; menafm.com, rising oil prices help cushion impact of recession on GCC, Jan 28, 2010
SUSTAINABLE INVESTMENT IN THE MIDDLE EAST AND NORTH AFRICA, 201022
Source: CIA World Fact Book
While agricultural productivity for the region as a whole increased markedly during the 1990s due to modernization efforts with water management, the region still faces a food deficit of 50-90 million tons by 2020.21 Food security is a significant concern for governments in a region already heavily dependent on food imports. Biotechnology offers some potential to reduce food security risks, and Qatar, along with others, is exploring the potential of “hydroponics”—soil-free agriculture and vertical farming—in order to be self-sufficient in food production by 2023.22
Climate Change
The effects of climate change on the MENA region are expected to be severe.23 The region is particularly vulnerable given already scarce water resources, high levels of aridity, and the long coastal stretch threatened by rising sea levels. Natural and physical systems in MENA are already facing heavy pressures, and these are expected to intensify as regional temperatures increase and/or precipitation decreases, thus placing pressure on services like agriculture, cooling systems, energy costs, and healthcare. For example, concerning agriculture, it is predicted that with a 3-degree Celsius rise in temperature, maize yields in North Africa could fall by 15-25 percent.24While crop loss projections clearly depend on low and high climate change scenarios, the figures are cause for concern.
Relevant climate change legislation is beginning to evolve and will likely continue at an accelerating pace. Companies that commit to lowering carbon emissions and developing climate change targets while assigning responsibility for climate change performance to senior management will likely be better prepared to address emerging regulations. Consequently, they represent more attractive investment prospects.
21Regional Workshop on Biotechnology in the Middle East and North Africa, International Development Research Centre, Background Paper on Agriculture and Biotechnology in MENA, 2004
22Financial Times, Desert state gets taste for food self-sufficiency, June 29, 2010, Andrew England
23The 2008 Report of Arab Forum for Environment and Development: Arab Environmental Future Challenge
24UN FAO—29th FAO Regional Conference for the Near East, background paper, March 2008
Agriculture
Levant North Africa GCC
Industry Services
80%
70%
60%
50%
40%
30%
20%
10%
0%4%
23%
72%
15%
35%
51%55%
44%
1%
MENA Sector Breakdown
Material ESG Issue —Climate Change
232. REGIONAL OVERVIEW
Moves to Diversify
In MENA, many countries have made investments to diversify their economies and have undertaken free-market economic reforms over the past five to 10 years.25 Pathways to economic diversification in the MENA region include, but are not limited to: • Diversification inside the petroleum industry.
• Diversification outside the petroleum industry.
• Regional cooperation to enhance complementary economies with regard to labor markets and sources of goods/services.
• Overall improvement of the investment climate.26
For example, the UAE is investing in large scale projects (such as Masdar—see page 84 for more information) in order to become a global knowledge base in alternative energy. Other MENA countries also are investing heavily in educational infrastructure with the aim of shifting towards knowledge and innovation-based economies. Saudi Arabia, for example, recently inaugurated the King Abdullah University of Science and Technology (KAUST), its first coeducational university. Additionally, the Saudi authorities are building six new economic cities in different regions of the country to promote economic development. According to the official website for King Abdullah Economic City, the largest of Saudi Arabia’s economic cities is scheduled for completion by 2020.27
Diversification Toward Sustainability
From a sustainability perspective, the challenge of diversification is not only economic but also environmental, with the two tightly interlinked. Any economic diversification strategy should consider whether it also will be competitive in a low-carbon, low-water, low-waste, sustainability-oriented economy. As such, attempts by the region’s economies to diversify outside the petroleum industry are the most important, with the proviso that the targeted sectors are indeed more sustainable.
This is also an important measure and signal for global SI investors and for the broader uptake of clean-technology industry and knowledge-based industry in the region. Goldman Sachs Sustain, for example, places a large emphasis on industry type when deciding where to make investments. Other institutional investors engaged for this report indicated that the high prevalence of “dirty” industry in the MENA region currently makes it far less interesting from an ESG perspective. The extent to which individual markets can diversify outside the petroleum industry and the rate at which they do so will affect future interest from mainstream international investors placing a premium on ESG performance. Such diversification should not be decoupled from an overall improvement of the investment climate in the region. Indeed, the two occurring in tandem may help catalyze SI.
Looking more deeply into economic diversification strategies, many MENA countries have a specific strategic focus on transitioning to “knowledge-based” economies. Part of the challenge associated with this goal is the region’s limited current investment in research and development, and very low levels of patents, which are a reflection of research and commercialization of research innovation. In the UAE, at least two economic zones have been established to directly support the transition to knowledge-based economies, but to do so with a special emphasis on knowledge and innovation as they relate to environmentally friendly technology. These zones are:
25McKinsey & Co. Perspective on the MENASA region, 2008
26Middle East Economic Survey, 9 April 2007
27King Abdullah Economic City Website, Available: www.kingabdullahcity.com
Material ESG Issue — Diversification Toward Sustainability
SUSTAINABLE INVESTMENT IN THE MIDDLE EAST AND NORTH AFRICA, 201024
Masdar City (Abu Dhabi):An emerging global clean-technology cluster located in what aims to be one of the world’s most sustainable urban developments, powered by renewable energy.
This $22 billion Free Zone, located about 17 km from downtown Abu Dhabi, will eventually be home to companies, researchers and academics from across the globe, creating an international hub for companies and organizations focused on renewable energy and clean technologies. The Masdar Institute of Science and Technology, in collaboration with Massachusetts Institute of Technology, is already open.
Dubai: Enpark: The Energy and Environment Park is a Free Zone spanning more than 8 million square feet, comprised of offices, research centers, residential buildings, and educational and leisure facilities. It describes itself as “a special destination for clean energy and environmental technology companies to operate and a fully-integrated knowledge community that includes programs, services, partnerships and amenities to support the success of environment companies and their employees.”
Source: www.masdar.ae; www.enpark.ae
FDI and Outward Investment
The State of FDI
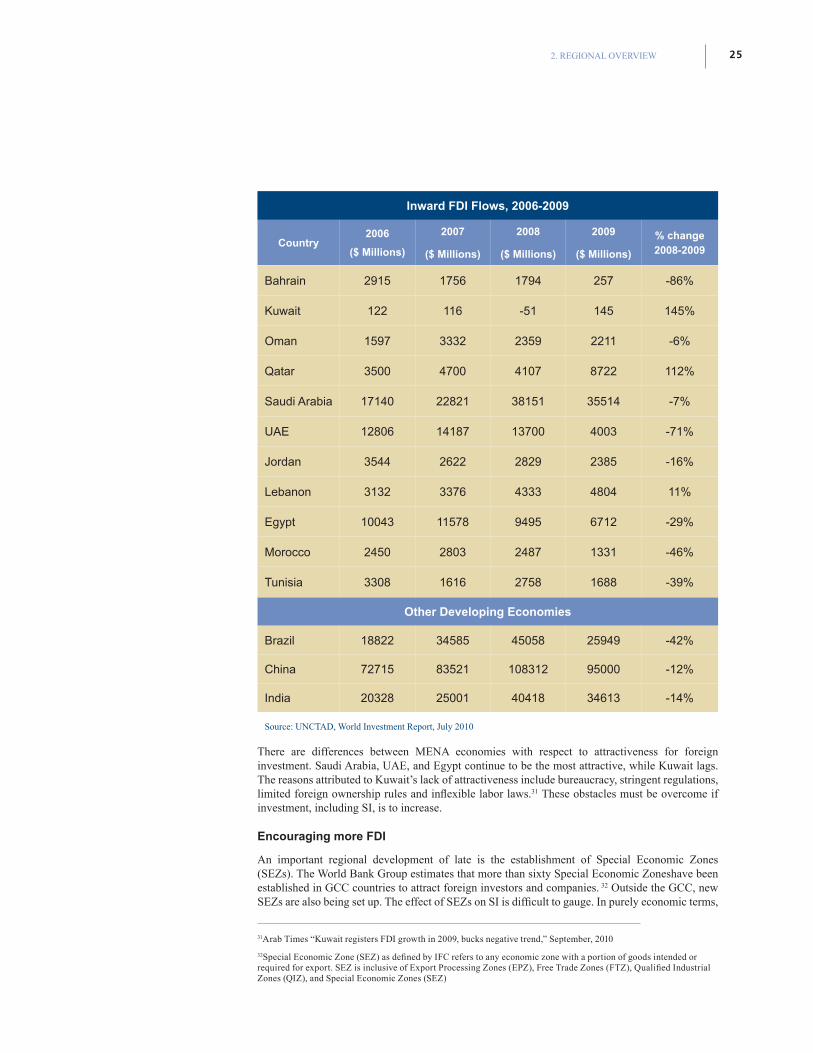
Notwithstanding the global economic downturn, which saw FDI inflows into the countries in this report’s sample slow by an average of more than 17 percent,28 MENA countries generally are attracting more world FDI, fueled by intraregional foreign investment from the oil-rich countries and by investment from other emerging markets, with China and India becoming more significant.29 However, FDI is contributing very little to job creation outside the petroleum industry or to the transfer and diffusion of technology,30 a situation which, if not addressed, will do little to solve the region’s lack of economic diversification and employment challenges.
28Based on UNCTAD World Investment Report figures, July 2010
29World Bank – MENA’s investment links with China and India. September 2008.
30World Bank – MENA’s investment links with China and India. September 2008.
252. REGIONAL OVERVIEW
Inward FDI Flows, 2006-2009
Country2006
($ Millions)
2007
($ Millions)
2008
($ Millions)
2009
($ Millions)
% change 2008-2009
Bahrain 2915 1756 1794 257 -86%
Kuwait 122 116 -51 145 145%
Oman 1597 3332 2359 2211 -6%
Qatar 3500 4700 4107 8722 112%
Saudi Arabia 17140 22821 38151 35514 -7%
UAE 12806 14187 13700 4003 -71%
Jordan 3544 2622 2829 2385 -16%
Lebanon 3132 3376 4333 4804 11%
Egypt 10043 11578 9495 6712 -29%
Morocco 2450 2803 2487 1331 -46%
Tunisia 3308 1616 2758 1688 -39%
Other Developing Economies
Brazil 18822 34585 45058 25949 -42%
China 72715 83521 108312 95000 -12%
India 20328 25001 40418 34613 -14%
Source: UNCTAD, World Investment Report, July 2010
There are differences between MENA economies with respect to attractiveness for foreign investment. Saudi Arabia, UAE, and Egypt continue to be the most attractive, while Kuwait lags. The reasons attributed to Kuwait’s lack of attractiveness include bureaucracy, stringent regulations, limited foreign ownership rules and inflexible labor laws.31 These obstacles must be overcome if investment, including SI, is to increase.
Encouraging more FDI
An important regional development of late is the establishment of Special Economic Zones (SEZs). The World Bank Group estimates that more than sixty Special Economic Zoneshave been established in GCC countries to attract foreign investors and companies. 32 Outside the GCC, new SEZs are also being set up. The effect of SEZs on SI is difficult to gauge. In purely economic terms,
31Arab Times “Kuwait registers FDI growth in 2009, bucks negative trend,” September, 2010
32Special Economic Zone (SEZ) as defined by IFC refers to any economic zone with a portion of goods intended or required for export. SEZ is inclusive of Export Processing Zones (EPZ), Free Trade Zones (FTZ), Qualified Industrial Zones (QIZ), and Special Economic Zones (SEZ)
SUSTAINABLE INVESTMENT IN THE MIDDLE EAST AND NORTH AFRICA, 201026
for the most part, SEZs have been shown to attract investment and foreign exchange, catalyze employment, and boost development of new technologies and infrastructure. In some cases, however, they have led to displacement of indigenous peoples, or resulted in land-use changes with a negative net effect on the environment. These zones have also been used specifically to attract investment in clean technologies. The success of the latter will likely have a bearing on the overall regional market for SI.
Outward Investment
Outbound foreign investment for the region is dominated by the GCC’s SWFs, which have targeted strategically important assets (including high tech, real estate, and aerospace) to sponsoring governments to establish a strong foothold in global capital markets. Some estimates put total investment by the GCC states abroad above $2 trillion, which represents the private assets of major Gulf investors (ruling families), the GCC SWFs, and GCC central banks.33 The Market Interest chapter of this report provides more commentary on the SI potential of SWFs.
Sovereign Wealth Fund Transparency and Contribution to the Global Economy
The growing level of investment by SWFs in western markets has prompted both relief and concern. Some western governments have expressed trepidation about broader geo-economic implications and heightened potential for meddling in corporate governance for political purposes.34 These same governments and their corporations have sought and received SWF backing as GCC SWFs played a prominent role in shoring up the U.S. and European financial systems during the global financial crisis. For example, The Financial Times reported that the Kuwait Investment Authority invested $30-40 billion abroad since the onset of the financial crisis.35 These SWFs are in a strong position to persuade and ask for better governance and ESG transparency from the companies in which they are investing, several of which already have demonstrated severely lacking governance and risk management.
SWFs also have been playing a more prominent role domestically since the onset of the global crisis. This includes support for:
• Stabilization of the banking systems: Despite limited exposure to the subprime sector, some MENA governments needed to inject liquidity into their banking systems to avoid a credit freeze and ensure that infrastructure projects continued.
• Support for Dubai: In November 2009 Dubai World revealed it was seeking to delay repaying $80 billion in debt. Abu Dhabi stepped in to support Dubai World.
• Advancement of local development: There is a window of opportunity, as well as newly developed and sophisticated national economic agendas, to advance local economies and bridge the development gap as the rest of the world suffers through a recession, particularly as global capital markets currently offer poor or risky investment opportunities.
These growing global and MENA roles for SWFs will likely lead not only to more requests for increased transparency by SWFs, but also to greater demands by the SWFs for transparency and enhanced governance performance by international portfolio companies. The evolving roles will also likely lead to enhanced ESG performance of SWFs’ national portfolio companies as a means of demonstrating their contribution to national sustainable development agendas. In both regards, ESG issues will be highly material to SWFs and their national governments.
33Understanding the new financial superpower—the management of GCC Official Foreign Assets, Brad Setser, Council on Foreign Relations, Rachel Ziemba, RGE Monitor, December 2007
34Sovereign Wealth Funds, January 28, 2009, Council on Foreign Relations, Lee Hudson Teslik
35DubaiBeat.com, Available: http://www.dubaibeat.com/2009/12/08/kuwait_investment_authority_in.php
Material ESG Issue — Sovereign Wealth Fund Transparency and Contribution to the Global Economy
272. REGIONAL OVERVIEW
MENA Securities Markets
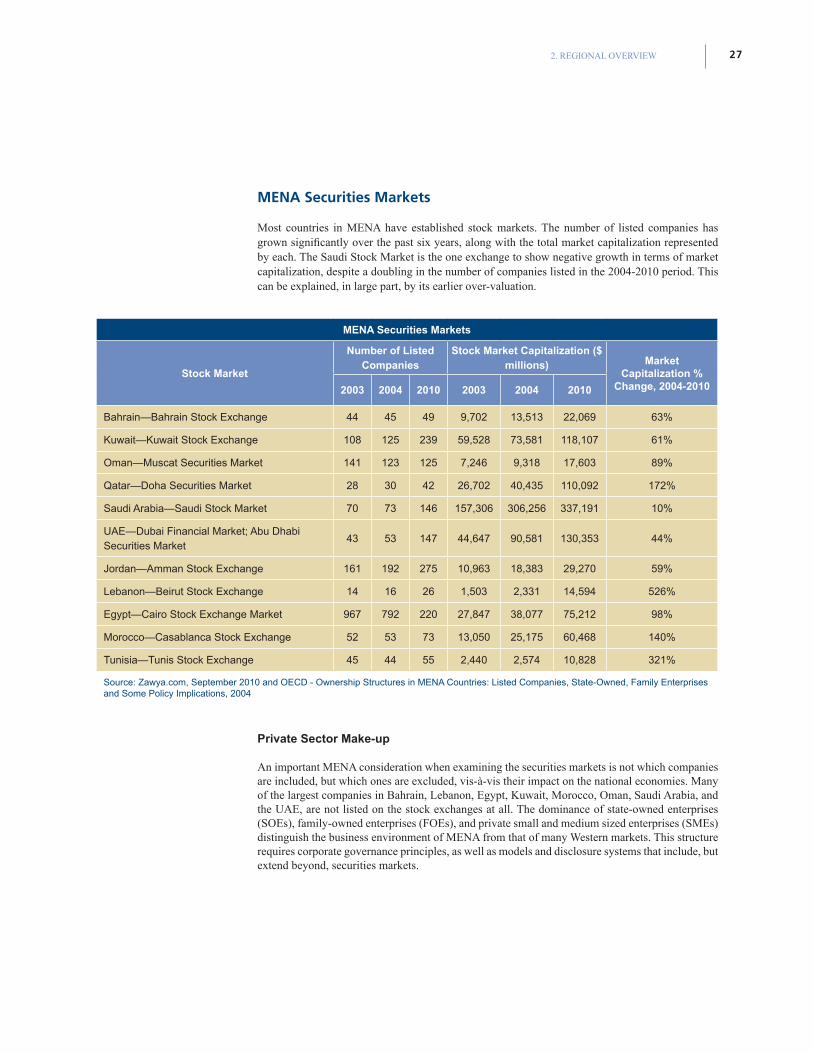
Most countries in MENA have established stock markets. The number of listed companies has grown significantly over the past six years, along with the total market capitalization represented by each. The Saudi Stock Market is the one exchange to show negative growth in terms of market capitalization, despite a doubling in the number of companies listed in the 2004-2010 period. This can be explained, in large part, by its earlier over-valuation.
MENA Securities Markets
Stock Market
Number of Listed Companies
Stock Market Capitalization ($ millions) Market
Capitalization % Change, 2004-20102003 2004 2010 2003 2004 2010
Bahrain—Bahrain Stock Exchange 44 45 49 9,702 13,513 22,069 63%
Kuwait—Kuwait Stock Exchange 108 125 239 59,528 73,581 118,107 61%
Oman—Muscat Securities Market 141 123 125 7,246 9,318 17,603 89%
Qatar—Doha Securities Market 28 30 42 26,702 40,435 110,092 172%
Saudi Arabia—Saudi Stock Market 70 73 146 157,306 306,256 337,191 10%
UAE—Dubai Financial Market; Abu Dhabi Securities Market
43 53 147 44,647 90,581 130,353 44%
Jordan—Amman Stock Exchange 161 192 275 10,963 18,383 29,270 59%
Lebanon—Beirut Stock Exchange 14 16 26 1,503 2,331 14,594 526%
Egypt—Cairo Stock Exchange Market 967 792 220 27,847 38,077 75,212 98%
Morocco—Casablanca Stock Exchange 52 53 73 13,050 25,175 60,468 140%
Tunisia—Tunis Stock Exchange 45 44 55 2,440 2,574 10,828 321%
Source: Zawya.com, September 2010 and OECD - Ownership Structures in MENA Countries: Listed Companies, State-Owned, Family Enterprises and Some Policy Implications, 2004
Private Sector Make-up
An important MENA consideration when examining the securities markets is not which companies are included, but which ones are excluded, vis-à-vis their impact on the national economies. Many of the largest companies in Bahrain, Lebanon, Egypt, Kuwait, Morocco, Oman, Saudi Arabia, and the UAE, are not listed on the stock exchanges at all. The dominance of state-owned enterprises (SOEs), family-owned enterprises (FOEs), and private small and medium sized enterprises (SMEs) distinguish the business environment of MENA from that of many Western markets. This structure requires corporate governance principles, as well as models and disclosure systems that include, but extend beyond, securities markets.
SUSTAINABLE INVESTMENT IN THE MIDDLE EAST AND NORTH AFRICA, 201028
Corporate Governance and Disclosure
Over recent years, many MENA securities markets have achieved significant advancements in corporate governance regulations and disclosure requirements. Many listed companies have enhanced their governance in response, while many others are still in the process. While transparency and disclosure issues in the MENA region are mostly focused on governance, there is growing awareness among listed companies that the next phase of transparency will be related to environmental and social performance. For the time being, however, there is only mild pressure from investors, even relating to governance information.
Corporate governance has not seen the same volume of gains as State Owned Enterprises (SOEs) and Family-Owned Enterprises (FOEs), although this also is shifting. There is growing appreciation of environmental and social issues within national sustainable development agendas, and this in turn is drawing attention to the benefits of sustainability reporting that covers the economic, environmental, and social performance of SOEs. At the same time, many FOEs are taking their own initiative to enhance corporate governance—some in preparation for initial public offerings (IPOs), some to assist in transitioning the business from one generation of family to the next, and some because they believe in continuously seeking to meet best international practices.
Despite these advancements, ESG reporting by publicly listed companies, SOEs, and FOEs in MENA is still in its infancy and for the most part absent, even as sustainability awareness begins to take root in the region.
These regional economic fundamentals, combined with the highlighted material environmental, social and governance (ESG) issues, form the backdrop to our examination of SI activity and opportunity in the MENA region.
Material ESG Issue — Corporate Governance and Disclosure
293. MARKET PREPAREDNESS FOR SI
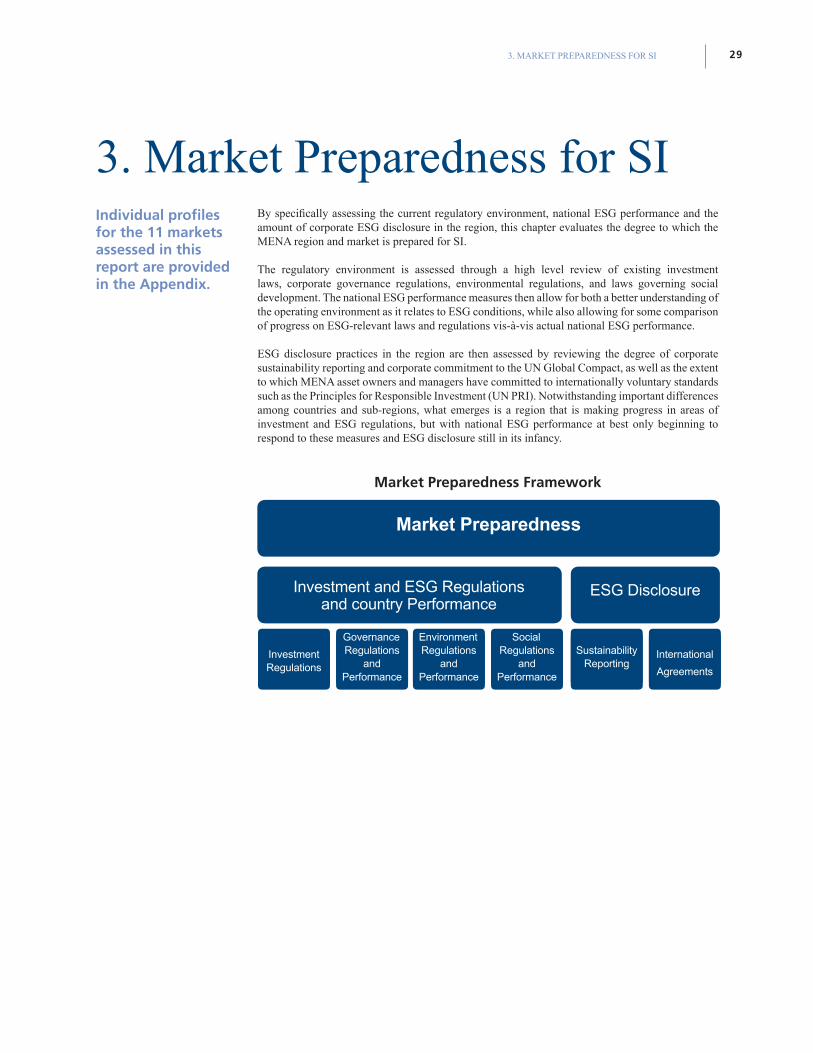
By specifically assessing the current regulatory environment, national ESG performance and the amount of corporate ESG disclosure in the region, this chapter evaluates the degree to which the MENA region and market is prepared for SI.
The regulatory environment is assessed through a high level review of existing investment laws, corporate governance regulations, environmental regulations, and laws governing social development. The national ESG performance measures then allow for both a better understanding of the operating environment as it relates to ESG conditions, while also allowing for some comparison of progress on ESG-relevant laws and regulations vis-à-vis actual national ESG performance.
ESG disclosure practices in the region are then assessed by reviewing the degree of corporate sustainability reporting and corporate commitment to the UN Global Compact, as well as the extent to which MENA asset owners and managers have committed to internationally voluntary standards such as the Principles for Responsible Investment (UN PRI). Notwithstanding important differences among countries and sub-regions, what emerges is a region that is making progress in areas of investment and ESG regulations, but with national ESG performance at best only beginning to respond to these measures and ESG disclosure still in its infancy.
Market Preparedness Framework
Individual profiles for the 11 markets assessed in this report are provided in the Appendix.
3. Market Preparedness for SI
ESG Disclosure
Investment Regulations
Environment Regulations
andPerformance
Sustainability Reporting
Governance Regulations
andPerformance
SocialRegulations
andPerformance
International
Agreements
Investment and ESG Regulationsand country Performance
Market Preparedness
SUSTAINABLE INVESTMENT IN THE MIDDLE EAST AND NORTH AFRICA, 201030
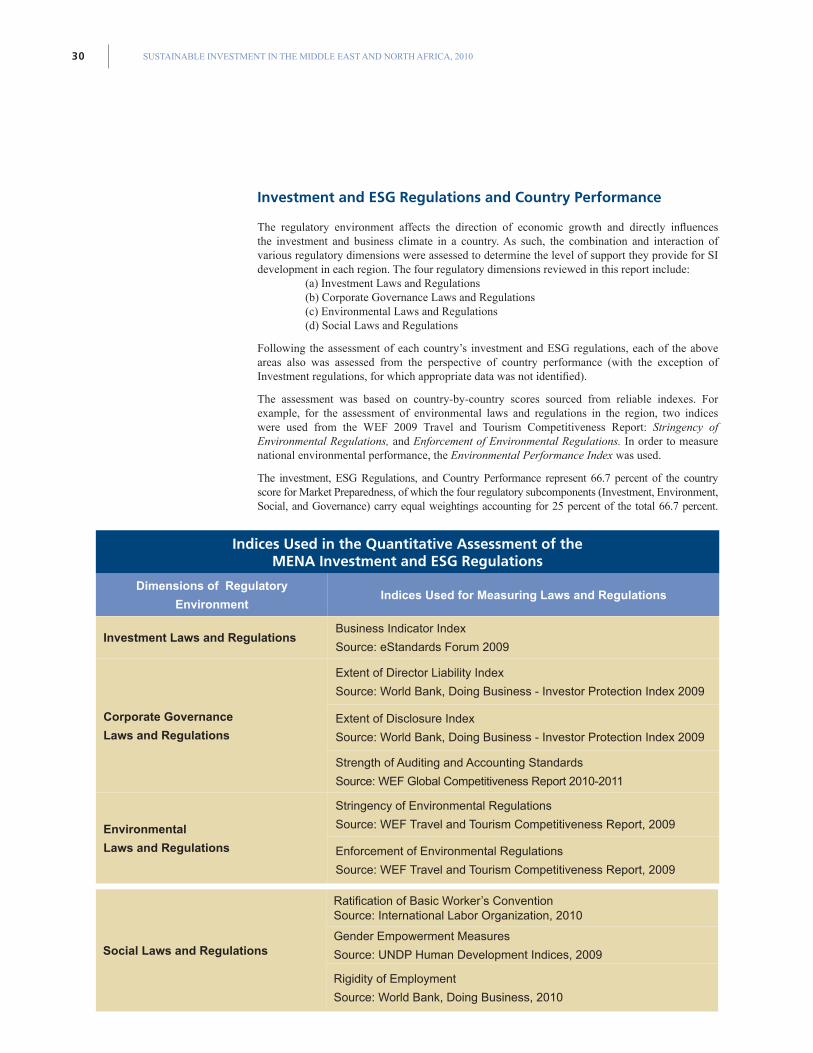
Investment and ESG Regulations and Country Performance
The regulatory environment affects the direction of economic growth and directly influences the investment and business climate in a country. As such, the combination and interaction of various regulatory dimensions were assessed to determine the level of support they provide for SI development in each region. The four regulatory dimensions reviewed in this report include:
(a) Investment Laws and Regulations (b) Corporate Governance Laws and Regulations (c) Environmental Laws and Regulations (d) Social Laws and Regulations
Following the assessment of each country’s investment and ESG regulations, each of the above areas also was assessed from the perspective of country performance (with the exception of Investment regulations, for which appropriate data was not identified).
The assessment was based on country-by-country scores sourced from reliable indexes. For example, for the assessment of environmental laws and regulations in the region, two indices were used from the WEF 2009 Travel and Tourism Competitiveness Report: Stringency of Environmental Regulations, and Enforcement of Environmental Regulations. In order to measure national environmental performance, the Environmental Performance Index was used.
The investment, ESG Regulations, and Country Performance represent 66.7 percent of the country score for Market Preparedness, of which the four regulatory subcomponents (Investment, Environment, Social, and Governance) carry equal weightings accounting for 25 percent of the total 66.7 percent.
Indices Used in the Quantitative Assessment of the MENA Investment and ESG Regulations
Dimensions of Regulatory
EnvironmentIndices Used for Measuring Laws and Regulations
Investment Laws and RegulationsBusiness Indicator Index
Source: eStandards Forum 2009
Corporate Governance
Laws and Regulations
Extent of Director Liability Index
Source: World Bank, Doing Business - Investor Protection Index 2009
Extent of Disclosure Index
Source: World Bank, Doing Business - Investor Protection Index 2009
Strength of Auditing and Accounting Standards
Source: WEF Global Competitiveness Report 2010-2011
Environmental
Laws and Regulations
Stringency of Environmental Regulations
Source: WEF Travel and Tourism Competitiveness Report, 2009
Enforcement of Environmental Regulations
Source: WEF Travel and Tourism Competitiveness Report, 2009
Social Laws and Regulations
Ratification of Basic Worker’s Convention Source: International Labor Organization, 2010
Gender Empowerment Measures
Source: UNDP Human Development Indices, 2009
Rigidity of Employment
Source: World Bank, Doing Business, 2010
313. MARKET PREPAREDNESS FOR SI
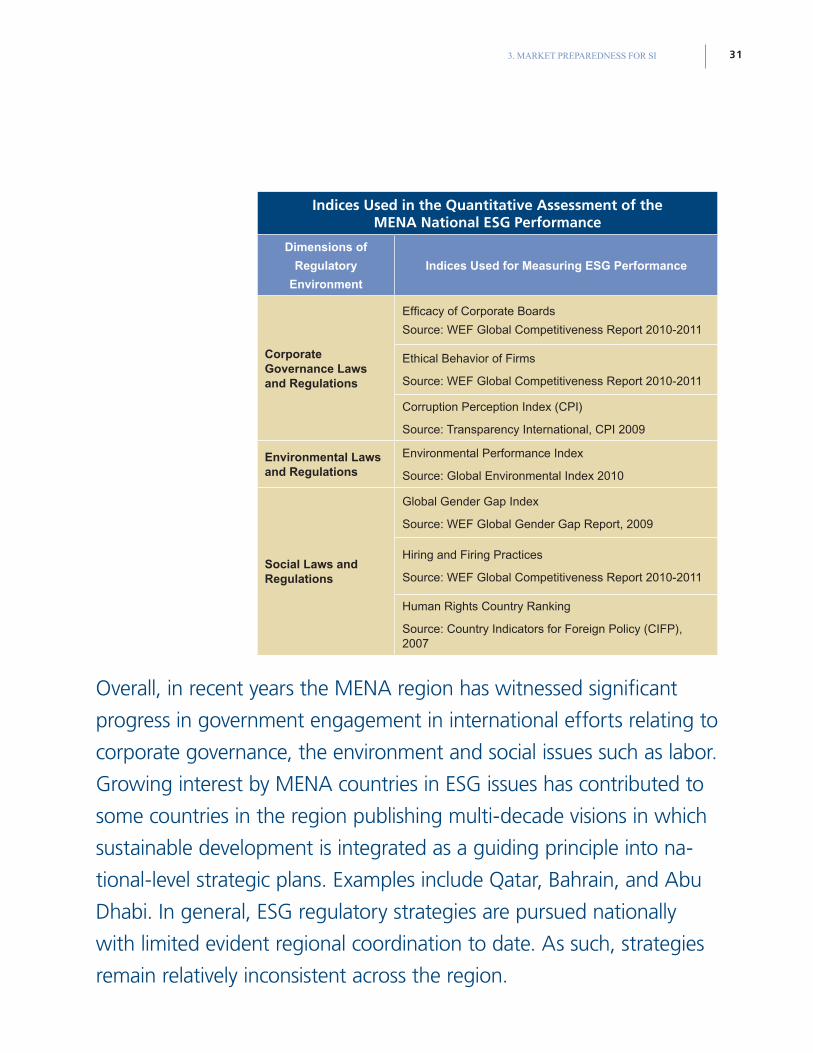
Indices Used in the Quantitative Assessment of the MENA National ESG Performance
Dimensions of
Regulatory
Environment
Indices Used for Measuring ESG Performance
Corporate Governance Laws and Regulations
Efficacy of Corporate Boards
Source: WEF Global Competitiveness Report 2010-2011
Ethical Behavior of Firms
Source: WEF Global Competitiveness Report 2010-2011
Corruption Perception Index (CPI)
Source: Transparency International, CPI 2009
Environmental Laws and Regulations
Environmental Performance Index
Source: Global Environmental Index 2010
Social Laws and Regulations
Global Gender Gap Index
Source: WEF Global Gender Gap Report, 2009
Hiring and Firing Practices
Source: WEF Global Competitiveness Report 2010-2011
Human Rights Country Ranking
Source: Country Indicators for Foreign Policy (CIFP), 2007
Overall, in recent years the MENA region has witnessed significant
progress in government engagement in international efforts relating to
corporate governance, the environment and social issues such as labor.
Growing interest by MENA countries in ESG issues has contributed to
some countries in the region publishing multi-decade visions in which
sustainable development is integrated as a guiding principle into na-
tional-level strategic plans. Examples include Qatar, Bahrain, and Abu
Dhabi. In general, ESG regulatory strategies are pursued nationally
with limited evident regional coordination to date. As such, strategies
remain relatively inconsistent across the region.
SUSTAINABLE INVESTMENT IN THE MIDDLE EAST AND NORTH AFRICA, 201032
The following subsections attempt to address the four subcomponents of the regulatory environment and national ESG performance in more detail, and provide the quantitative analysis for each subcomponent separately.
Investment Laws and Regulations
Investment Regulations in the MENA Region
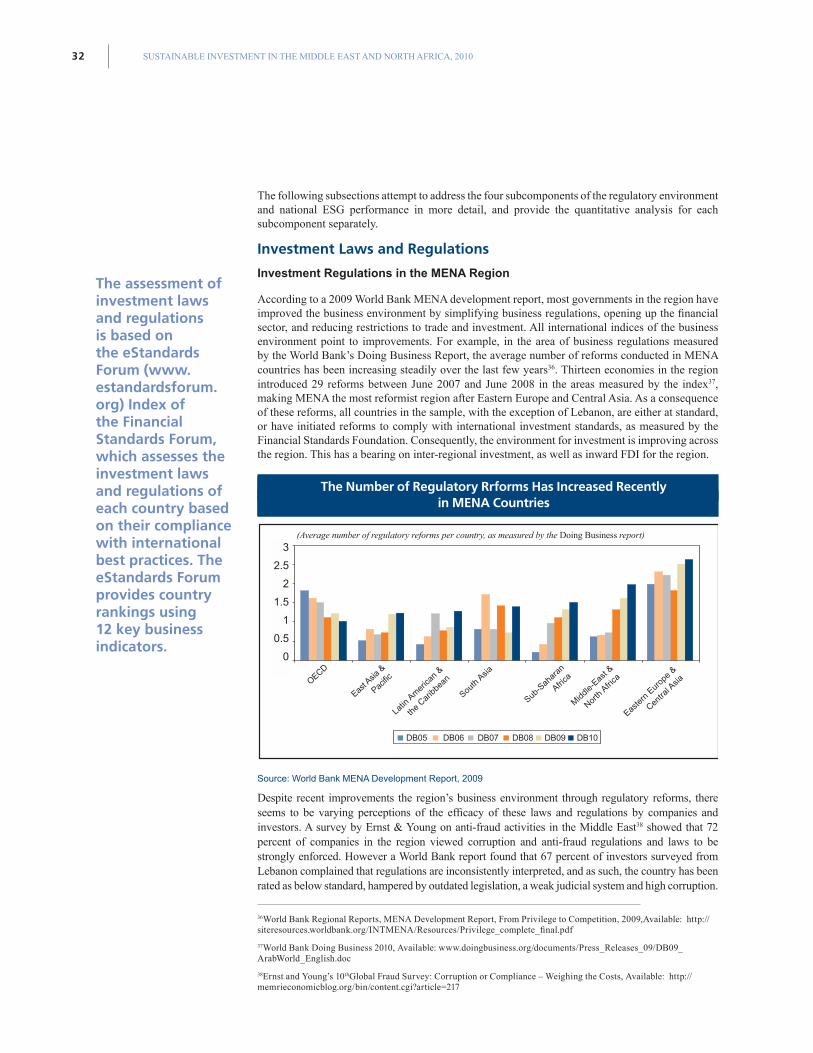
According to a 2009 World Bank MENA development report, most governments in the region have improved the business environment by simplifying business regulations, opening up the financial sector, and reducing restrictions to trade and investment. All international indices of the business environment point to improvements. For example, in the area of business regulations measured by the World Bank’s Doing Business Report, the average number of reforms conducted in MENA countries has been increasing steadily over the last few years36. Thirteen economies in the region introduced 29 reforms between June 2007 and June 2008 in the areas measured by the index37, making MENA the most reformist region after Eastern Europe and Central Asia. As a consequence of these reforms, all countries in the sample, with the exception of Lebanon, are either at standard, or have initiated reforms to comply with international investment standards, as measured by the Financial Standards Foundation. Consequently, the environment for investment is improving across the region. This has a bearing on inter-regional investment, as well as inward FDI for the region.
Source: World Bank MENA Development Report, 2009
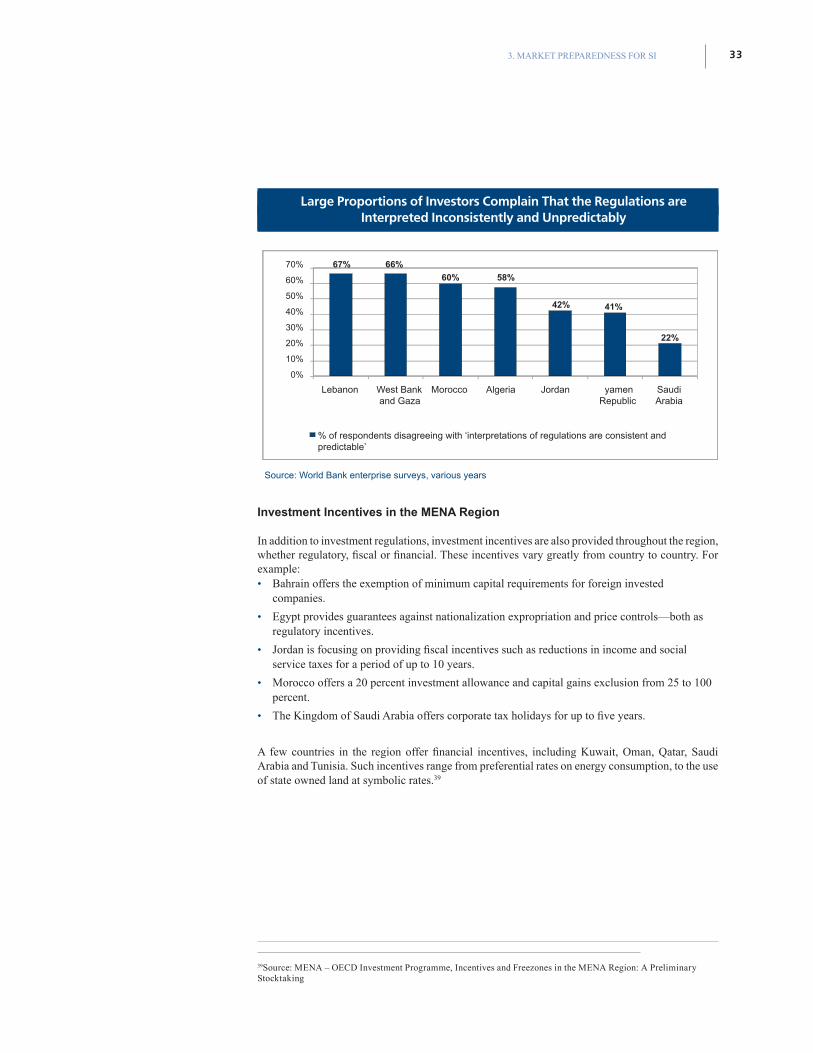
Despite recent improvements the region’s business environment through regulatory reforms, there seems to be varying perceptions of the efficacy of these laws and regulations by companies and investors. A survey by Ernst & Young on anti-fraud activities in the Middle East38 showed that 72 percent of companies in the region viewed corruption and anti-fraud regulations and laws to be strongly enforced. However a World Bank report found that 67 percent of investors surveyed from Lebanon complained that regulations are inconsistently interpreted, and as such, the country has been rated as below standard, hampered by outdated legislation, a weak judicial system and high corruption.
36World Bank Regional Reports, MENA Development Report, From Privilege to Competition, 2009,Available: http://siteresources.worldbank.org/INTMENA/Resources/Privilege_complete_final.pdf
37World Bank Doing Business 2010, Available: www.doingbusiness.org/documents/Press_Releases_09/DB09_ArabWorld_English.doc
38Ernst and Young’s 10thGlobal Fraud Survey: Corruption or Compliance – Weighing the Costs, Available: http://memrieconomicblog.org/bin/content.cgi?article=217
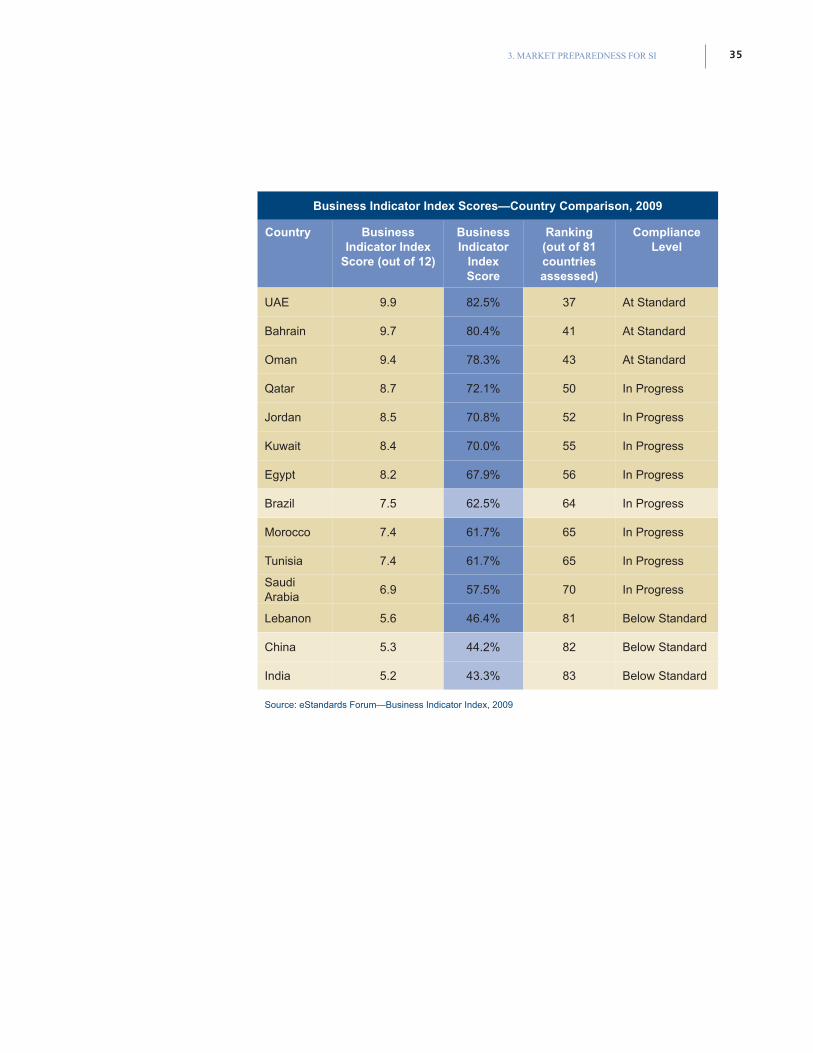
The assessment of investment laws and regulations is based on the eStandards Forum (www.estandardsforum.org) Index of the Financial Standards Forum, which assesses the investment laws and regulations of each country based on their compliance with international best practices. The eStandards Forum provides country rankings using 12 key business indicators.
3
2.5
2
1.5
1
0.5
0
The Number of Regulatory Rrforms Has Increased Recentlyin MENA Countries
(Average number of regulatory reforms per country, as measured by the Doing Business report)
333. MARKET PREPAREDNESS FOR SI
Source: World Bank enterprise surveys, various years
Investment Incentives in the MENA Region
In addition to investment regulations, investment incentives are also provided throughout the region, whether regulatory, fiscal or financial. These incentives vary greatly from country to country. For example: • Bahrain offers the exemption of minimum capital requirements for foreign invested
companies.
• Egypt provides guarantees against nationalization expropriation and price controls—both as regulatory incentives.
• Jordan is focusing on providing fiscal incentives such as reductions in income and social service taxes for a period of up to 10 years.
• Morocco offers a 20 percent investment allowance and capital gains exclusion from 25 to 100 percent.
• The Kingdom of Saudi Arabia offers corporate tax holidays for up to five years.
A few countries in the region offer financial incentives, including Kuwait, Oman, Qatar, Saudi Arabia and Tunisia. Such incentives range from preferential rates on energy consumption, to the use of state owned land at symbolic rates.39
39Source: MENA – OECD Investment Programme, Incentives and Freezones in the MENA Region: A Preliminary Stocktaking
% of respondents disagreeing with ‘interpretations of regulations are consistent andpredictable’
Lebanon Morocco Algeria Jordan yamenRepublic
SaudiArabia
West Bankand Gaza
70%
60%
50%
40%
30%
20%
10%
0%
67% 66%
60% 58%
42% 41%
22%
Large Proportions of Investors Complain That the Regulations areInterpreted Inconsistently and Unpredictably
SUSTAINABLE INVESTMENT IN THE MIDDLE EAST AND NORTH AFRICA, 201034
UAE—Regional Leader
The UAE government welcomes foreign investment and provides tax incentives and low tax rates to investors. According to the Financial Standards Forum, the UAE is also a regional leader in protecting intellectual property rights. It passed copyright, trademark, and patent legislation in 2002, and has demonstrably been enforcing these laws. Corruption is also being contained—the UAE is ranked 30th out of 180 countries in Transparency International’s 2009 Corruption Perceptions Index.
Source: eStandardsforum.org—UAE country profile
Impact of Existing Investment Regulations on SI
The region’s investment regulatory environment has improved over the years through increased reforms that align the region’s regulations to international standards. Despite these improvements, the perceived efficacy and stringency of these newly reformed regulations are uneven, leading to fragmented levels of stability across the region. This fragmentation has resulted in an unequal distribution of investments in the region.
The impact of investment regulations on SI depends upon several variables, including the ease of investment, clear regulatory frameworks, type of investment incentives provided, level of foreign investment, and level of domestic investment, among others. The investment incentive framework in the region, while certainly attractive for investment in the region, can also counteract SI practices; this is best illustrated where governments are providing preferential electricity consumption rates as an incentive, even though it reduces the incentive for organizations to practice energy-efficient operating behavior. On the other hand, incentivizing local recruitment promotes sustainable labor practices.
This variation in impact also is observed in terms of foreign versus domestic investment. For example in cases where foreign investment is encouraged, the transfer of knowledge regarding best practices in SI (e.g. ESG auditing and due diligence prior to acquisition) is facilitated.
Overall it is difficult to draw a clear correlation between investment
regulations and SI, yet the analysis attempts to quantify this relation
using the business indicator index, an index provided by the eStan-
dards Forum that assesses the investment laws and regulations of
each country based on their compliance with international best prac-
tices. This index demonstrates that the GCC countries, with the excep-
tion of Saudi Arabia, exhibit the highest scores as relates to investment
regulation
353. MARKET PREPAREDNESS FOR SI
Business Indicator Index Scores—Country Comparison, 2009
Country Business Indicator Index
Score (out of 12)
Business Indicator
Index Score
Ranking (out of 81 countries assessed)
Compliance Level
UAE 9.9 82.5% 37 At Standard
Bahrain 9.7 80.4% 41 At Standard
Oman 9.4 78.3% 43 At Standard
Qatar 8.7 72.1% 50 In Progress
Jordan 8.5 70.8% 52 In Progress
Kuwait 8.4 70.0% 55 In Progress
Egypt 8.2 67.9% 56 In Progress
Brazil 7.5 62.5% 64 In Progress
Morocco 7.4 61.7% 65 In Progress
Tunisia 7.4 61.7% 65 In Progress
Saudi Arabia
6.9 57.5% 70 In Progress
Lebanon 5.6 46.4% 81 Below Standard
China 5.3 44.2% 82 Below Standard
India 5.2 43.3% 83 Below Standard
Source: eStandards Forum—Business Indicator Index, 2009
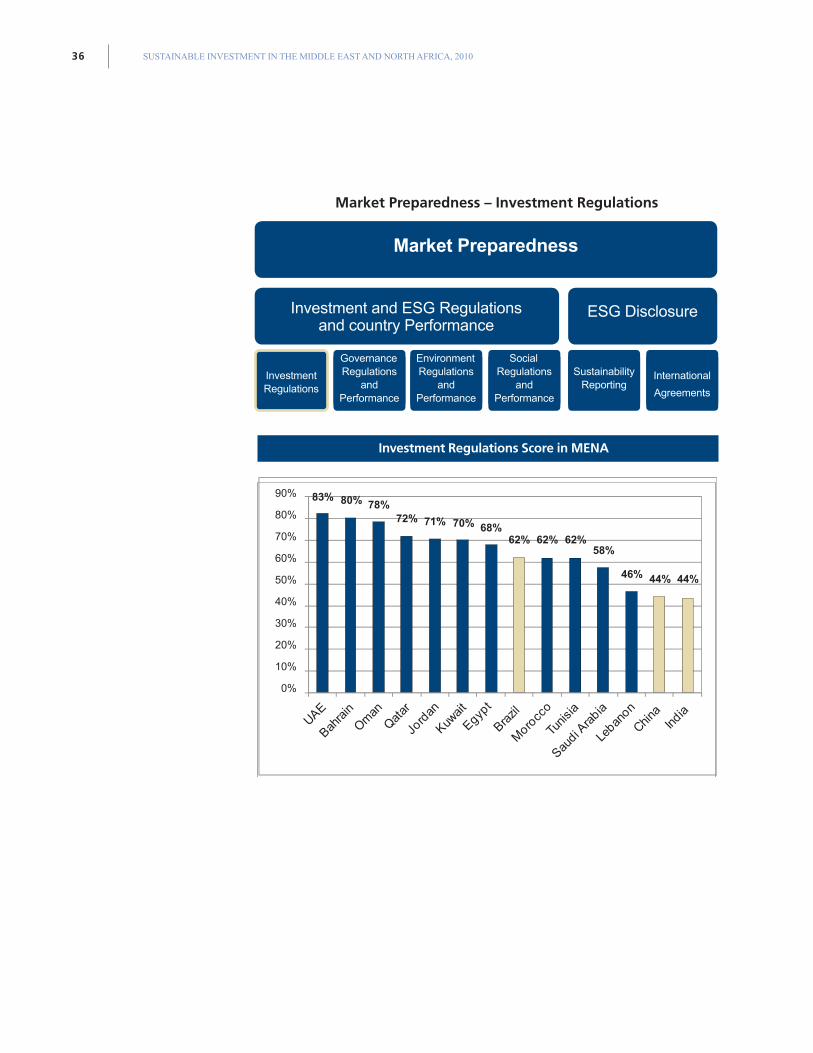
SUSTAINABLE INVESTMENT IN THE MIDDLE EAST AND NORTH AFRICA, 201036
Market Preparedness – Investment Regulations
90%
80%
70%
60%
50%
40%
30%
20%
10%
0%
83% 80% 78%72% 71% 70% 68%
62% 62% 62%58%
46% 44% 44%
ESG Disclosure
Investment Regulations
Environment Regulations
andPerformance
Sustainability Reporting
Governance Regulations
andPerformance
SocialRegulations
andPerformance
International
Agreements
Investment and ESG Regulationsand country Performance
Market Preparedness
Investment Regulations Score in MENA
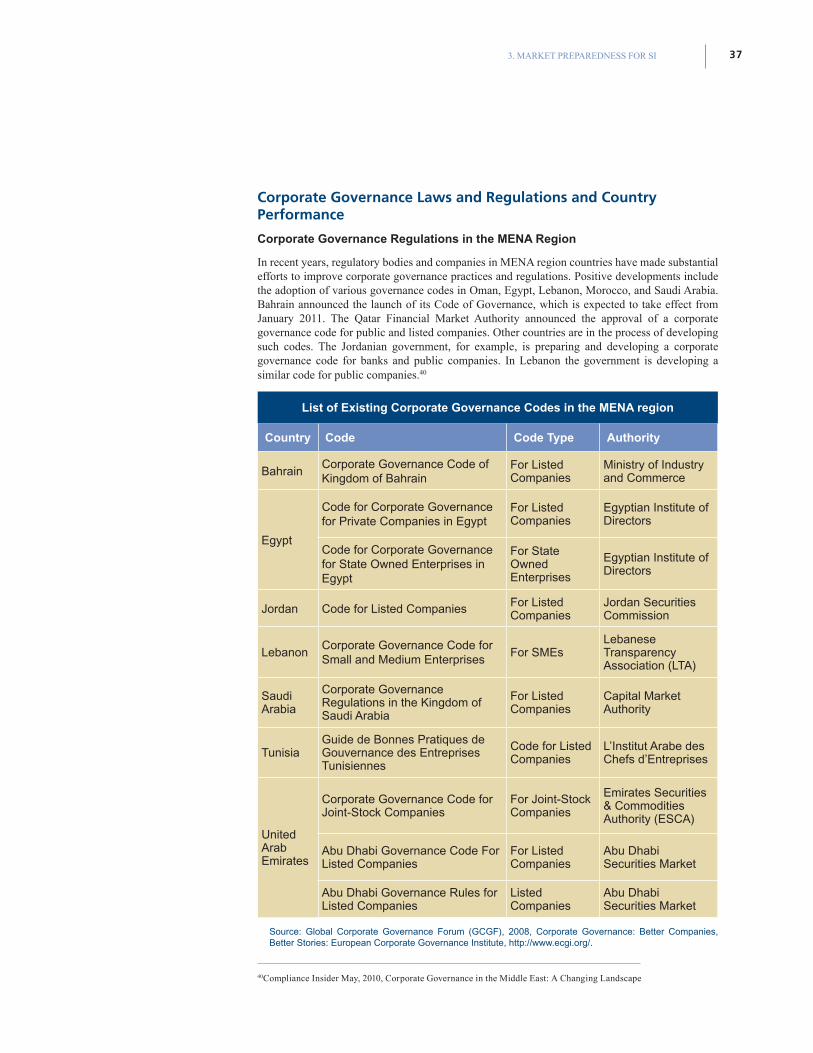
373. MARKET PREPAREDNESS FOR SI
Corporate Governance Laws and Regulations and Country Performance
Corporate Governance Regulations in the MENA Region
In recent years, regulatory bodies and companies in MENA region countries have made substantial efforts to improve corporate governance practices and regulations. Positive developments include the adoption of various governance codes in Oman, Egypt, Lebanon, Morocco, and Saudi Arabia. Bahrain announced the launch of its Code of Governance, which is expected to take effect from January 2011. The Qatar Financial Market Authority announced the approval of a corporate governance code for public and listed companies. Other countries are in the process of developing such codes. The Jordanian government, for example, is preparing and developing a corporate governance code for banks and public companies. In Lebanon the government is developing a similar code for public companies.40
List of Existing Corporate Governance Codes in the MENA region
Country Code Code Type Authority
BahrainCorporate Governance Code of Kingdom of Bahrain
For Listed Companies
Ministry of Industry and Commerce
Egypt
Code for Corporate Governance for Private Companies in Egypt
For Listed Companies
Egyptian Institute of Directors
Code for Corporate Governance for State Owned Enterprises in Egypt
For State Owned Enterprises
Egyptian Institute of Directors
Jordan Code for Listed Companies For Listed Companies
Jordan Securities Commission
LebanonCorporate Governance Code for Small and Medium Enterprises
For SMEsLebanese Transparency Association (LTA)
Saudi Arabia
Corporate Governance Regulations in the Kingdom of Saudi Arabia
For Listed Companies
Capital Market Authority
Tunisia Guide de Bonnes Pratiques de Gouvernance des Entreprises Tunisiennes
Code for Listed Companies
L’Institut Arabe des Chefs d’Entreprises
United Arab Emirates
Corporate Governance Code for Joint-Stock Companies
For Joint-Stock Companies
Emirates Securities & Commodities Authority (ESCA)
Abu Dhabi Governance Code For Listed Companies
For Listed Companies
Abu Dhabi Securities Market
Abu Dhabi Governance Rules for Listed Companies
Listed Companies
Abu Dhabi Securities Market
Source: Global Corporate Governance Forum (GCGF), 2008, Corporate Governance: Better Companies, Better Stories: European Corporate Governance Institute, http://www.ecgi.org/.
40Compliance Insider May, 2010, Corporate Governance in the Middle East: A Changing Landscape
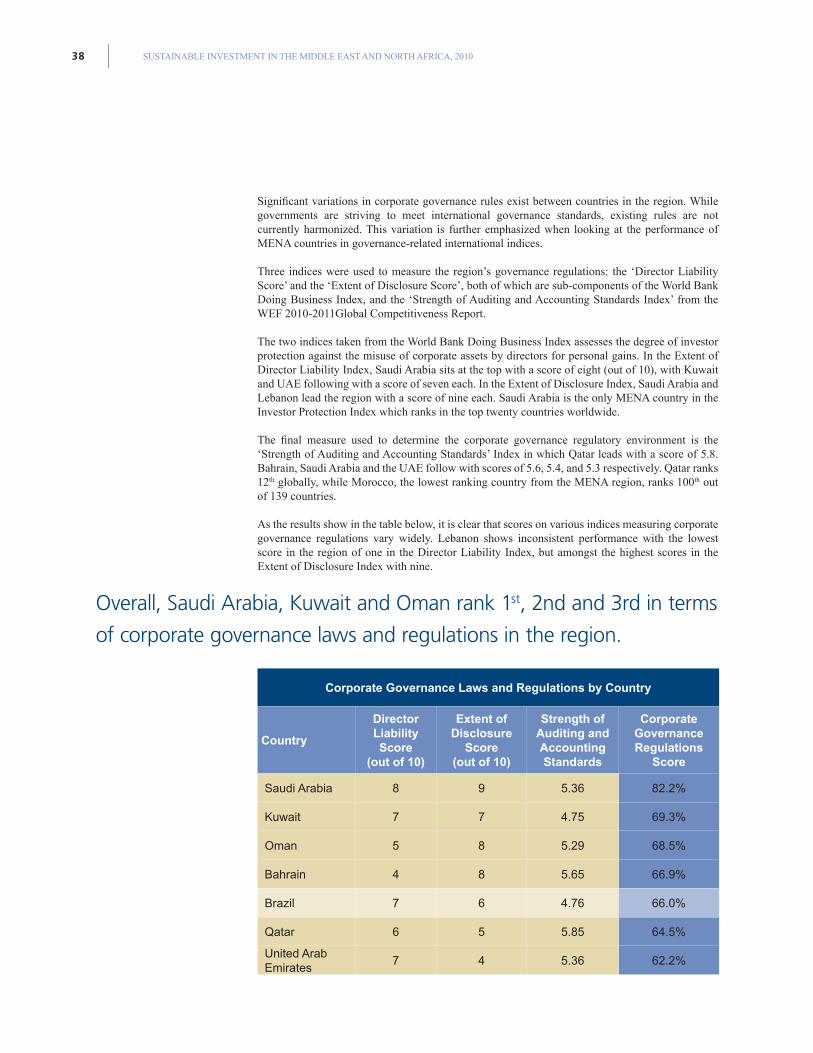
SUSTAINABLE INVESTMENT IN THE MIDDLE EAST AND NORTH AFRICA, 201038
Significant variations in corporate governance rules exist between countries in the region. While governments are striving to meet international governance standards, existing rules are not currently harmonized. This variation is further emphasized when looking at the performance of MENA countries in governance-related international indices.
Three indices were used to measure the region’s governance regulations: the ‘Director Liability Score’ and the ‘Extent of Disclosure Score’, both of which are sub-components of the World Bank Doing Business Index, and the ‘Strength of Auditing and Accounting Standards Index’ from the WEF 2010-2011Global Competitiveness Report.
The two indices taken from the World Bank Doing Business Index assesses the degree of investor protection against the misuse of corporate assets by directors for personal gains. In the Extent of Director Liability Index, Saudi Arabia sits at the top with a score of eight (out of 10), with Kuwait and UAE following with a score of seven each. In the Extent of Disclosure Index, Saudi Arabia and Lebanon lead the region with a score of nine each. Saudi Arabia is the only MENA country in the Investor Protection Index which ranks in the top twenty countries worldwide.
The final measure used to determine the corporate governance regulatory environment is the ‘Strength of Auditing and Accounting Standards’ Index in which Qatar leads with a score of 5.8. Bahrain, Saudi Arabia and the UAE follow with scores of 5.6, 5.4, and 5.3 respectively. Qatar ranks 12th globally, while Morocco, the lowest ranking country from the MENA region, ranks 100th out of 139 countries.
As the results show in the table below, it is clear that scores on various indices measuring corporate governance regulations vary widely. Lebanon shows inconsistent performance with the lowest score in the region of one in the Director Liability Index, but amongst the highest scores in the Extent of Disclosure Index with nine.
Overall, Saudi Arabia, Kuwait and Oman rank 1st, 2nd and 3rd in terms
of corporate governance laws and regulations in the region.
Corporate Governance Laws and Regulations by Country
Country
Director Liability Score
(out of 10)
Extent of Disclosure
Score (out of 10)
Strength of Auditing and Accounting Standards
Corporate Governance Regulations
Score
Saudi Arabia 8 9 5.36 82.2%
Kuwait 7 7 4.75 69.3%
Oman 5 8 5.29 68.5%
Bahrain 4 8 5.65 66.9%
Brazil 7 6 4.76 66.0%
Qatar 6 5 5.85 64.5%
United Arab Emirates
7 4 5.36 62.2%
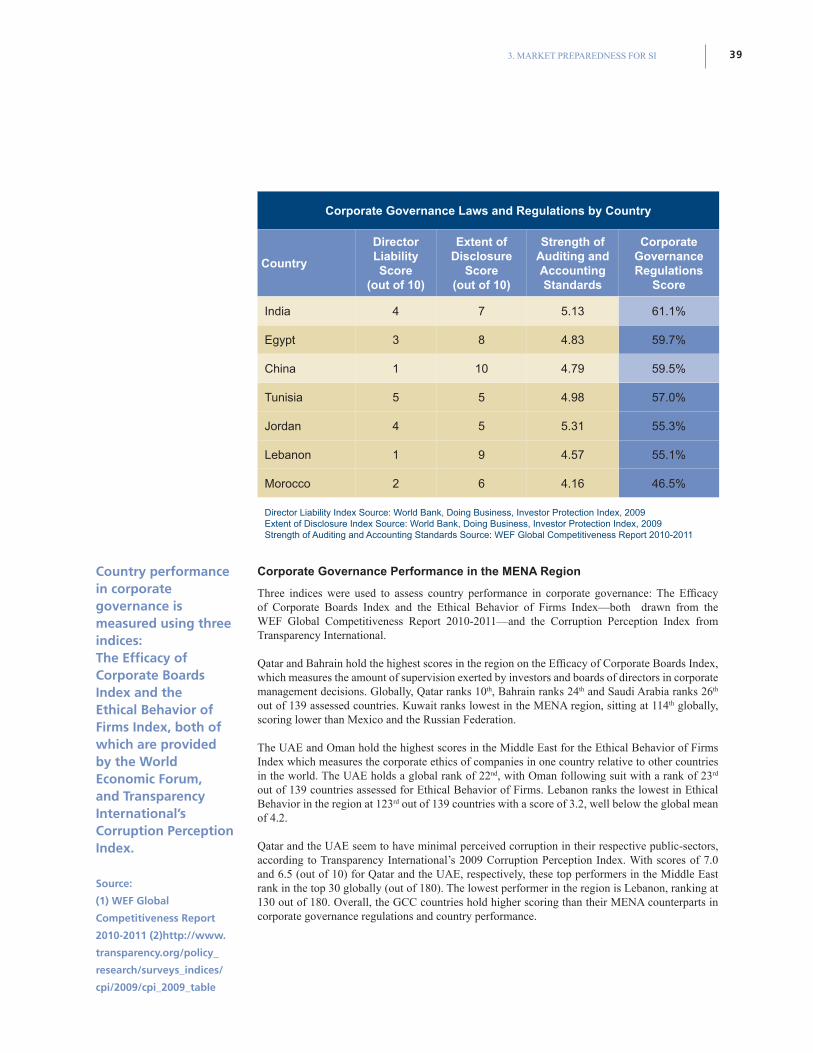
393. MARKET PREPAREDNESS FOR SI
Corporate Governance Laws and Regulations by Country
Country
Director Liability Score
(out of 10)
Extent of Disclosure
Score (out of 10)
Strength of Auditing and Accounting Standards
Corporate Governance Regulations
Score
India 4 7 5.13 61.1%
Egypt 3 8 4.83 59.7%
China 1 10 4.79 59.5%
Tunisia 5 5 4.98 57.0%
Jordan 4 5 5.31 55.3%
Lebanon 1 9 4.57 55.1%
Morocco 2 6 4.16 46.5%
Director Liability Index Source: World Bank, Doing Business, Investor Protection Index, 2009 Extent of Disclosure Index Source: World Bank, Doing Business, Investor Protection Index, 2009Strength of Auditing and Accounting Standards Source: WEF Global Competitiveness Report 2010-2011
Corporate Governance Performance in the MENA Region
Three indices were used to assess country performance in corporate governance: The Efficacy of Corporate Boards Index and the Ethical Behavior of Firms Index—both drawn from the WEF Global Competitiveness Report 2010-2011—and the Corruption Perception Index from Transparency International.
Qatar and Bahrain hold the highest scores in the region on the Efficacy of Corporate Boards Index, which measures the amount of supervision exerted by investors and boards of directors in corporate management decisions. Globally, Qatar ranks 10th, Bahrain ranks 24th and Saudi Arabia ranks 26th out of 139 assessed countries. Kuwait ranks lowest in the MENA region, sitting at 114th globally, scoring lower than Mexico and the Russian Federation.
The UAE and Oman hold the highest scores in the Middle East for the Ethical Behavior of Firms Index which measures the corporate ethics of companies in one country relative to other countries in the world. The UAE holds a global rank of 22nd, with Oman following suit with a rank of 23rd out of 139 countries assessed for Ethical Behavior of Firms. Lebanon ranks the lowest in Ethical Behavior in the region at 123rd out of 139 countries with a score of 3.2, well below the global mean of 4.2.
Qatar and the UAE seem to have minimal perceived corruption in their respective public-sectors, according to Transparency International’s 2009 Corruption Perception Index. With scores of 7.0 and 6.5 (out of 10) for Qatar and the UAE, respectively, these top performers in the Middle East rank in the top 30 globally (out of 180). The lowest performer in the region is Lebanon, ranking at 130 out of 180. Overall, the GCC countries hold higher scoring than their MENA counterparts in corporate governance regulations and country performance.
Country performance in corporate governance is measured using three indices:The Efficacy of Corporate Boards Index and the Ethical Behavior of Firms Index, both of which are provided by the World Economic Forum, and Transparency International’s Corruption Perception Index.
Source:
(1) WEF Global
Competitiveness Report
2010-2011 (2)http://www.
transparency.org/policy_
research/surveys_indices/
cpi/2009/cpi_2009_table
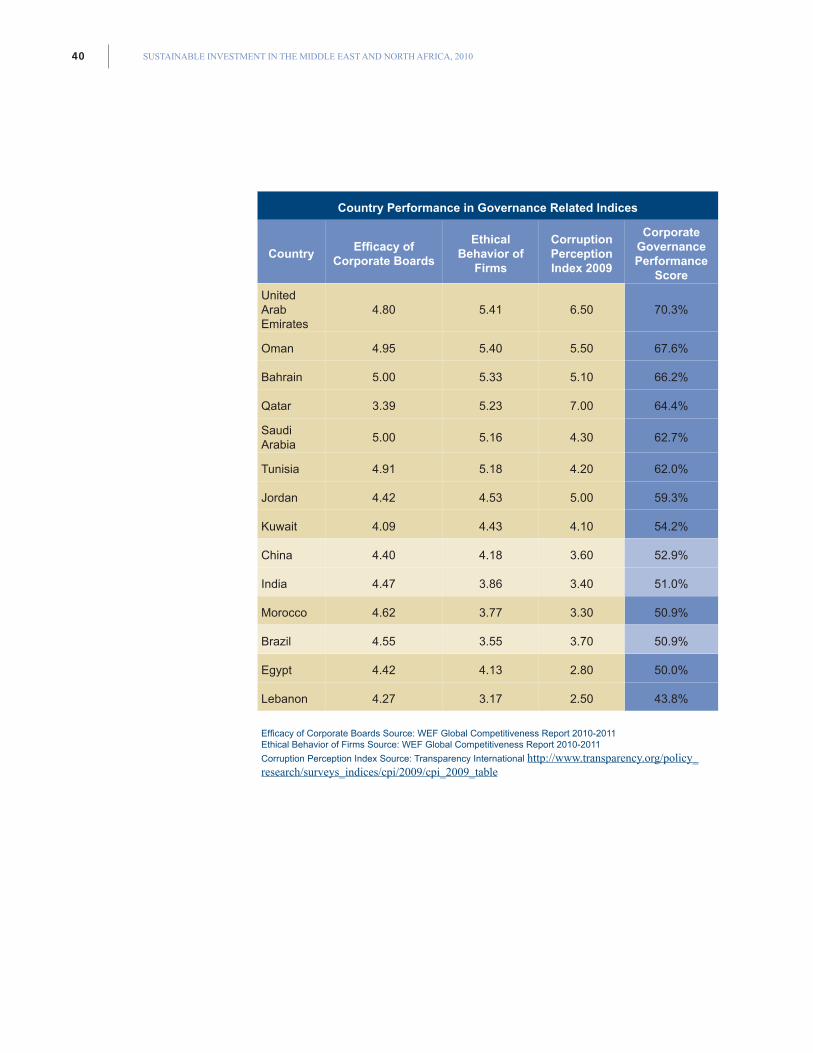
SUSTAINABLE INVESTMENT IN THE MIDDLE EAST AND NORTH AFRICA, 201040
Country Performance in Governance Related Indices
CountryEfficacy of
Corporate Boards
Ethical Behavior of
Firms
Corruption Perception Index 2009
Corporate Governance Performance
Score
United Arab Emirates
4.80 5.41 6.50 70.3%
Oman 4.95 5.40 5.50 67.6%
Bahrain 5.00 5.33 5.10 66.2%
Qatar 3.39 5.23 7.00 64.4%
Saudi Arabia
5.00 5.16 4.30 62.7%
Tunisia 4.91 5.18 4.20 62.0%
Jordan 4.42 4.53 5.00 59.3%
Kuwait 4.09 4.43 4.10 54.2%
China 4.40 4.18 3.60 52.9%
India 4.47 3.86 3.40 51.0%
Morocco 4.62 3.77 3.30 50.9%
Brazil 4.55 3.55 3.70 50.9%
Egypt 4.42 4.13 2.80 50.0%
Lebanon 4.27 3.17 2.50 43.8%
Efficacy of Corporate Boards Source: WEF Global Competitiveness Report 2010-2011Ethical Behavior of Firms Source: WEF Global Competitiveness Report 2010-2011
Corruption Perception Index Source: Transparency International http://www.transparency.org/policy_research/surveys_indices/cpi/2009/cpi_2009_table
3. MARKET PREPAREDNESS FOR SI 41
Impact of Existing Governance Regulations and Country Performance on SI
Corporate governance plays a vital role in supporting economic development as it: (1) Increases access to external financing by firms, leading to larger investments and higher
growth, (2) Lowers the cost of capital and associated higher firm valuation, (3) Enhances the operational performance, (4) Reduces financial risk, and (5) Improves the relationship with stakeholders.41
Sound corporate governance regulations and practices can have a significant impact on the investment market by building confidence and garnering a stronger reputation for investors. Eventually this could lead to increased access to capital and lower the cost of equity. Moreover, good governance increasingly is being seen as a means to improve the performance and stability of a company. It accomplishes these goals by requiring stronger risk management and financial practices, clarifying management and board responsibilities, and monitoring director performance, which, in turn, would improve non-financial risk assessment of a company. Attaining those benefits helps meet three equally important goals: to expand operations, create jobs and attract the best talent.42
The disparity between country scoring in Corporate Governance Regulations and the scoring in Corporate Governance Performance is to some degree a reflection of the varying degrees of enforcement of governance regulations in the MENA region; these findings indicate that the region is still on a development path in regards to its governance rules with some countries like Oman and Saudi Arabia being in advanced stages, while other countries in North Africa and the Levant such as Morocco, Lebanon and Egypt still in earlier developmental stages. In terms of a global comparison, all countries in the GCC plus Tunisia rank higher than Brazil in Corporate Governance Regulations and Performance.
41Najib, H., 2007, State of Corporate Governance in Arab Countries, University of Applied Sciences.
42Compliance Insider May, 2010, Corporate Governance in the Middle East: A Changing Landscape.
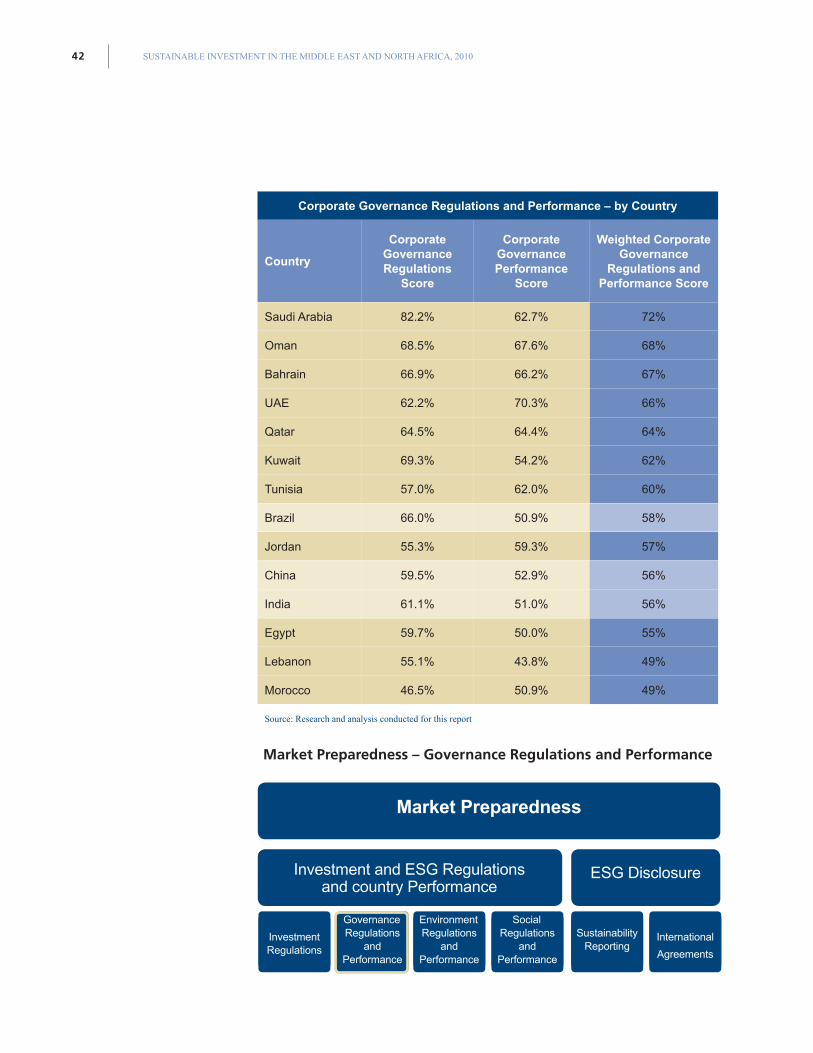
SUSTAINABLE INVESTMENT IN THE MIDDLE EAST AND NORTH AFRICA, 201042
Corporate Governance Regulations and Performance – by Country
Country
Corporate Governance Regulations
Score
Corporate Governance Performance
Score
Weighted Corporate Governance
Regulations and Performance Score
Saudi Arabia 82.2% 62.7% 72%
Oman 68.5% 67.6% 68%
Bahrain 66.9% 66.2% 67%
UAE 62.2% 70.3% 66%
Qatar 64.5% 64.4% 64%
Kuwait 69.3% 54.2% 62%
Tunisia 57.0% 62.0% 60%
Brazil 66.0% 50.9% 58%
Jordan 55.3% 59.3% 57%
China 59.5% 52.9% 56%
India 61.1% 51.0% 56%
Egypt 59.7% 50.0% 55%
Lebanon 55.1% 43.8% 49%
Morocco 46.5% 50.9% 49%
Source: Research and analysis conducted for this report
Market Preparedness – Governance Regulations and Performance
ESG Disclosure
Investment Regulations
Environment Regulations
andPerformance
Sustainability Reporting
Governance Regulations
andPerformance
SocialRegulations
andPerformance
International
Agreements
Investment and ESG Regulationsand country Performance
Market Preparedness
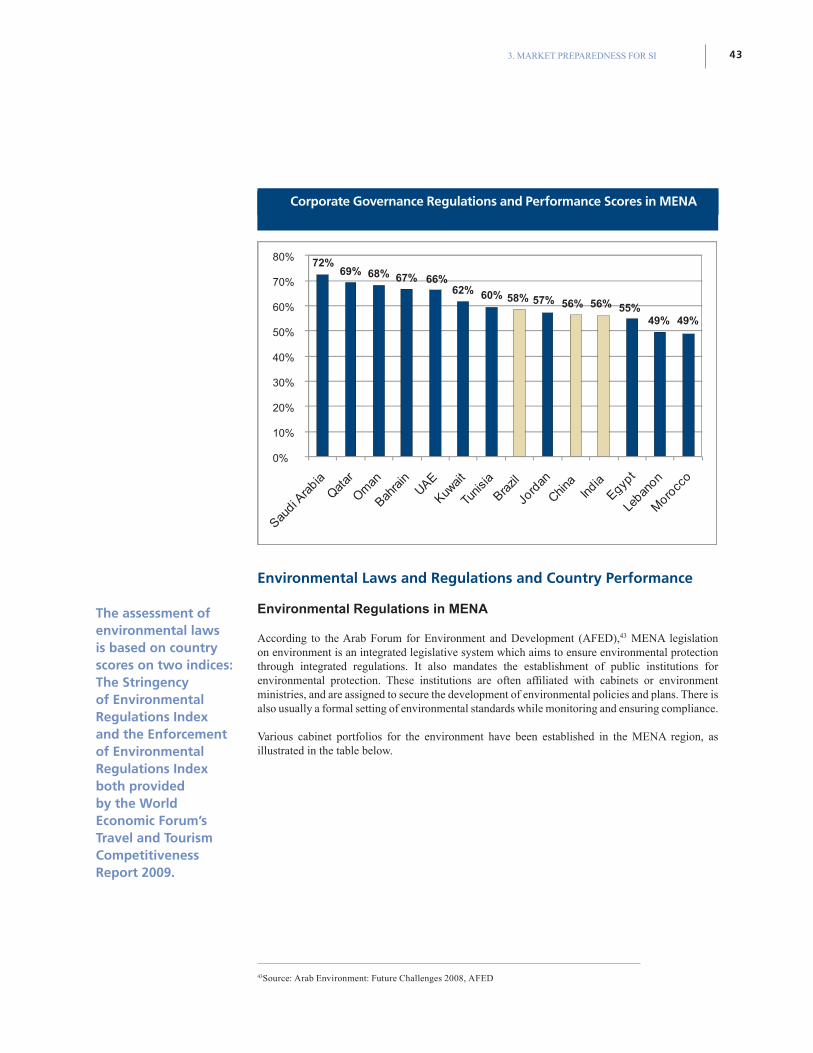
3. MARKET PREPAREDNESS FOR SI 43
Environmental Laws and Regulations and Country Performance
Environmental Regulations in MENA
According to the Arab Forum for Environment and Development (AFED),43 MENA legislation on environment is an integrated legislative system which aims to ensure environmental protection through integrated regulations. It also mandates the establishment of public institutions for environmental protection. These institutions are often affiliated with cabinets or environment ministries, and are assigned to secure the development of environmental policies and plans. There is also usually a formal setting of environmental standards while monitoring and ensuring compliance.
Various cabinet portfolios for the environment have been established in the MENA region, as illustrated in the table below.
43Source: Arab Environment: Future Challenges 2008, AFED
80%
70%
60%
50%
40%
30%
20%
10%
0%
72%69% 68% 67% 66%
62% 60% 58% 57% 56% 56% 55%49% 49%
Corporate Governance Regulations and Performance Scores in MENA
The assessment of environmental laws is based on country scores on two indices: The Stringency of Environmental Regulations Index and the Enforcement of Environmental Regulations Index both provided by the World Economic Forum’s Travel and Tourism Competitiveness Report 2009.
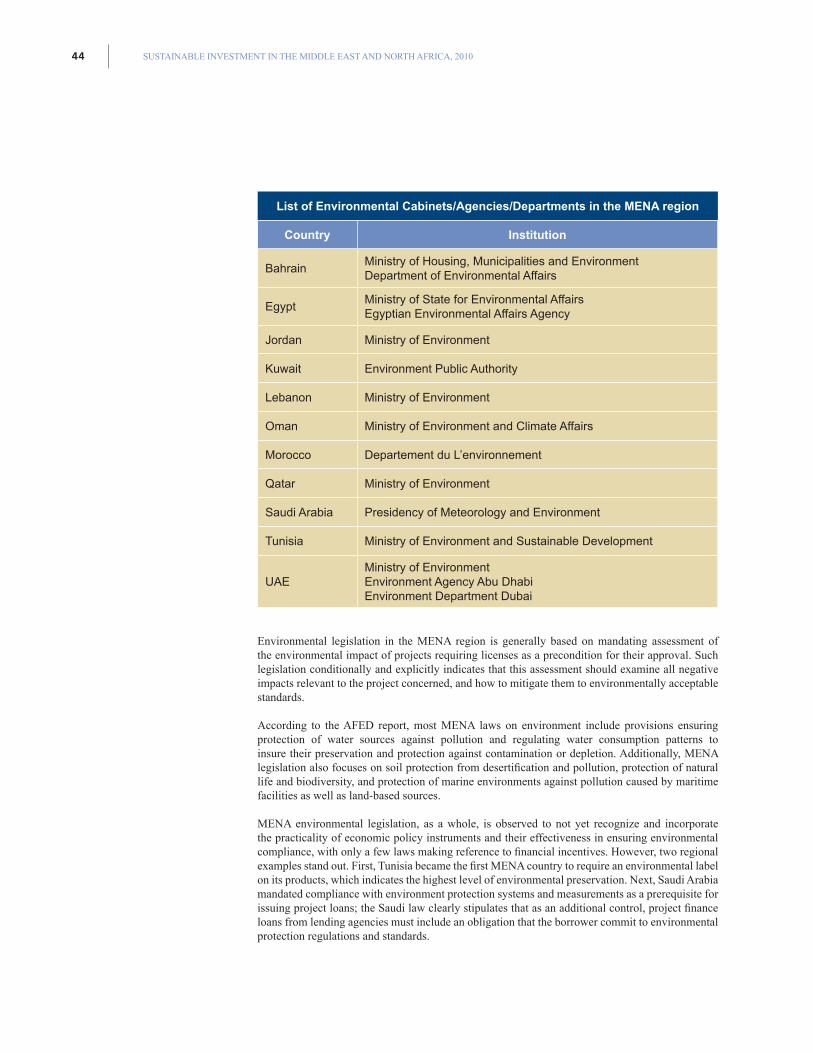
SUSTAINABLE INVESTMENT IN THE MIDDLE EAST AND NORTH AFRICA, 201044
List of Environmental Cabinets/Agencies/Departments in the MENA region
Country Institution
BahrainMinistry of Housing, Municipalities and Environment Department of Environmental Affairs
EgyptMinistry of State for Environmental AffairsEgyptian Environmental Affairs Agency
Jordan Ministry of Environment
Kuwait Environment Public Authority
Lebanon Ministry of Environment
Oman Ministry of Environment and Climate Affairs
Morocco Departement du L’environnement
Qatar Ministry of Environment
Saudi Arabia Presidency of Meteorology and Environment
Tunisia Ministry of Environment and Sustainable Development
UAEMinistry of EnvironmentEnvironment Agency Abu DhabiEnvironment Department Dubai
Environmental legislation in the MENA region is generally based on mandating assessment of the environmental impact of projects requiring licenses as a precondition for their approval. Such legislation conditionally and explicitly indicates that this assessment should examine all negative impacts relevant to the project concerned, and how to mitigate them to environmentally acceptable standards.
According to the AFED report, most MENA laws on environment include provisions ensuring protection of water sources against pollution and regulating water consumption patterns to insure their preservation and protection against contamination or depletion. Additionally, MENA legislation also focuses on soil protection from desertification and pollution, protection of natural life and biodiversity, and protection of marine environments against pollution caused by maritime facilities as well as land-based sources.
MENA environmental legislation, as a whole, is observed to not yet recognize and incorporate the practicality of economic policy instruments and their effectiveness in ensuring environmental compliance, with only a few laws making reference to financial incentives. However, two regional examples stand out. First, Tunisia became the first MENA country to require an environmental label on its products, which indicates the highest level of environmental preservation. Next, Saudi Arabia mandated compliance with environment protection systems and measurements as a prerequisite for issuing project loans; the Saudi law clearly stipulates that as an additional control, project finance loans from lending agencies must include an obligation that the borrower commit to environmental protection regulations and standards.
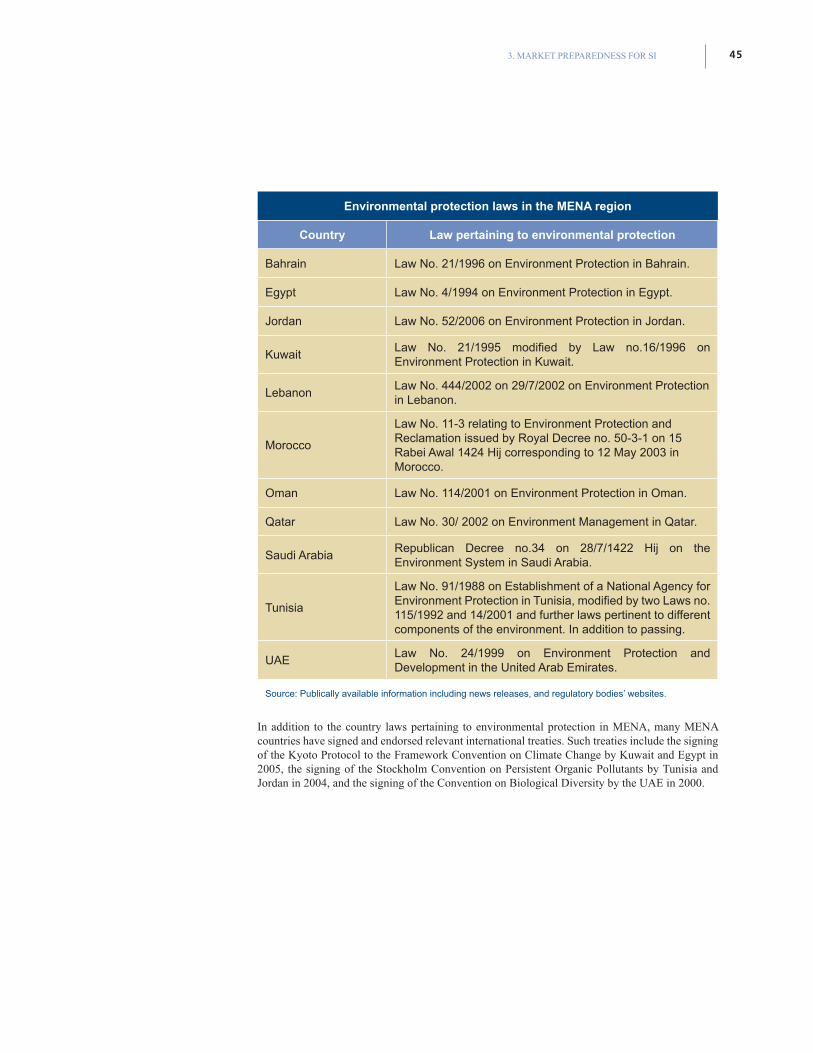
3. MARKET PREPAREDNESS FOR SI 45
Environmental protection laws in the MENA region
Country Law pertaining to environmental protection
Bahrain Law No. 21/1996 on Environment Protection in Bahrain.
Egypt Law No. 4/1994 on Environment Protection in Egypt.
Jordan Law No. 52/2006 on Environment Protection in Jordan.
KuwaitLaw No. 21/1995 modified by Law no.16/1996 on Environment Protection in Kuwait.
LebanonLaw No. 444/2002 on 29/7/2002 on Environment Protection in Lebanon.
Morocco
Law No. 11-3 relating to Environment Protection and Reclamation issued by Royal Decree no. 50-3-1 on 15 Rabei Awal 1424 Hij corresponding to 12 May 2003 in Morocco.
Oman Law No. 114/2001 on Environment Protection in Oman.
Qatar Law No. 30/ 2002 on Environment Management in Qatar.
Saudi ArabiaRepublican Decree no.34 on 28/7/1422 Hij on the Environment System in Saudi Arabia.
Tunisia
Law No. 91/1988 on Establishment of a National Agency for Environment Protection in Tunisia, modified by two Laws no. 115/1992 and 14/2001 and further laws pertinent to different components of the environment. In addition to passing.
UAELaw No. 24/1999 on Environment Protection and Development in the United Arab Emirates.
Source: Publically available information including news releases, and regulatory bodies’ websites.
In addition to the country laws pertaining to environmental protection in MENA, many MENA countries have signed and endorsed relevant international treaties. Such treaties include the signing of the Kyoto Protocol to the Framework Convention on Climate Change by Kuwait and Egypt in 2005, the signing of the Stockholm Convention on Persistent Organic Pollutants by Tunisia and Jordan in 2004, and the signing of the Convention on Biological Diversity by the UAE in 2000.
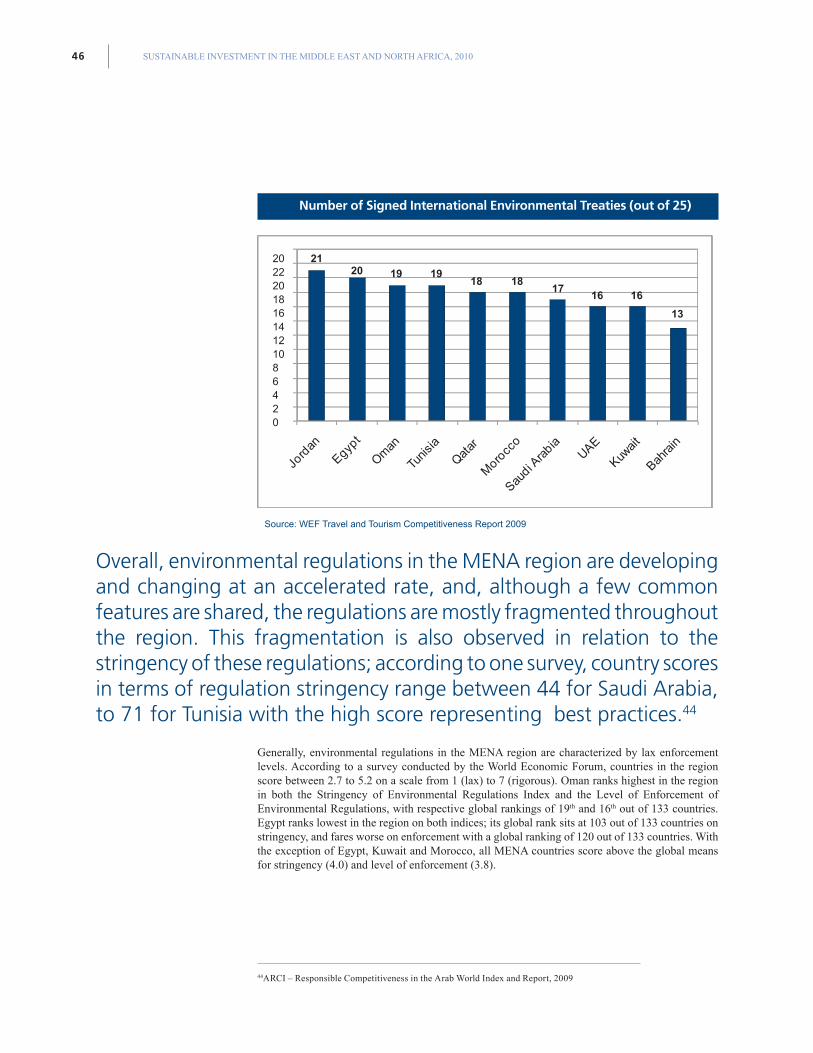
SUSTAINABLE INVESTMENT IN THE MIDDLE EAST AND NORTH AFRICA, 201046
Source: WEF Travel and Tourism Competitiveness Report 2009
202220181614121086420
20 19 1918 18
1716 16
13
21
Number of Signed International Environmental Treaties (out of 25)
Overall, environmental regulations in the MENA region are developing and changing at an accelerated rate, and, although a few common features are shared, the regulations are mostly fragmented througof regulation stringency range between 44 for Saudi Arabia, to 71 for Tunisia with the high score representing best practices.44 Generally, environmental regulations in the MENA region are characterized by lax enforcement levels. According to a survey conducted by the World Economic Forum, countries in the region score between 2.7 to 5.2 on a scale from 1 (lax) to 7 (rigorous). Oman ranks highest in the region in both the Stringency of Environmental Regulations Index and the Level of Enforcement of Environmental Regulations, with respective global rankings of 19th and 16th out of 133 countries. Egypt ranks lowest in the region on both indices; its global rank sits at 103 out of 133 countries on stringency, and fares worse on enforcement with a global ranking of 120 out of 133 countries. With the exception of Egypt, Kuwait and Morocco, all MENA countries score above the global means for stringency (4.0) and level of enforcement (3.8).
44ARCI – Responsible Competitiveness in the Arab World Index and Report, 2009
Overall, environmental regulations in the MENA region are developing and changing at an accelerated rate, and, although a few common features are shared, the regulations are mostly fragmented throughout the region. This fragmentation is also observed in relation to the stringency of these regulations; according to one survey, country scores in terms of regulation stringency range between 44 for Saudi Arabia, to 71 for Tunisia with the high score representing best practices.44
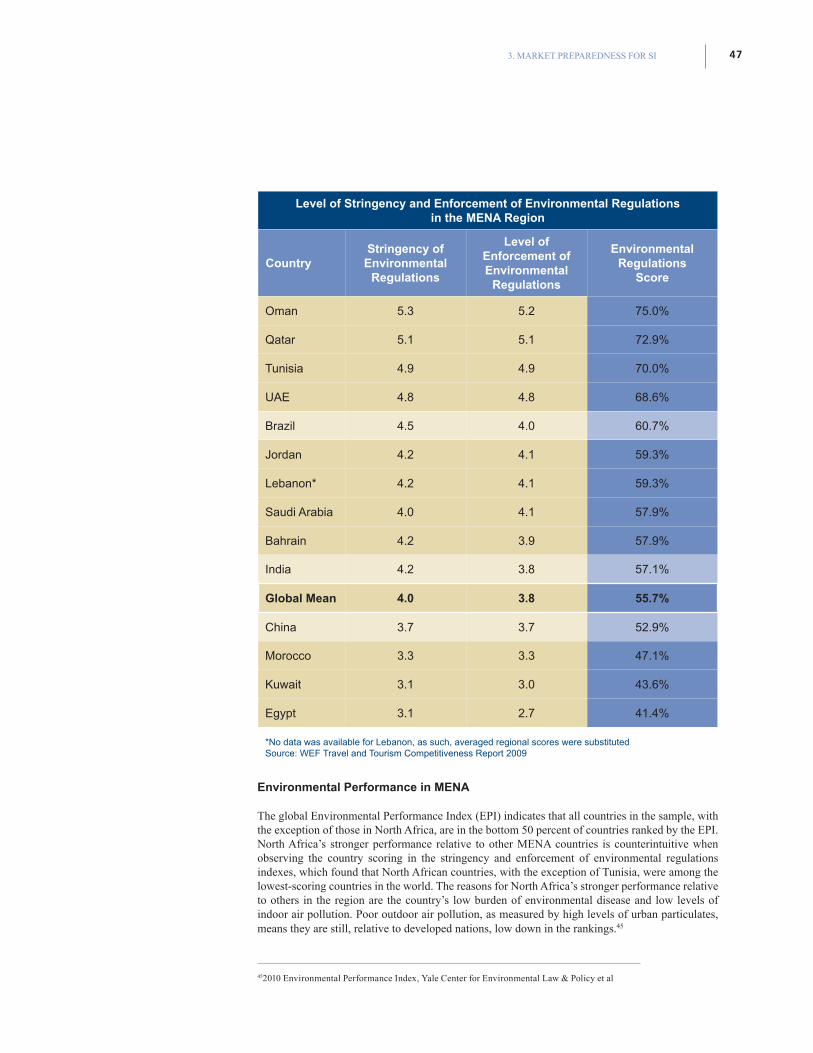
3. MARKET PREPAREDNESS FOR SI 47
Level of Stringency and Enforcement of Environmental Regulations in the MENA Region
CountryStringency of
Environmental Regulations
Level of Enforcement of Environmental
Regulations
Environmental Regulations
Score
Oman 5.3 5.2 75.0%
Qatar 5.1 5.1 72.9%
Tunisia 4.9 4.9 70.0%
UAE 4.8 4.8 68.6%
Brazil 4.5 4.0 60.7%
Jordan 4.2 4.1 59.3%
Lebanon* 4.2 4.1 59.3%
Saudi Arabia 4.0 4.1 57.9%
Bahrain 4.2 3.9 57.9%
India 4.2 3.8 57.1%
Global Mean 4.0 3.8 55.7%
China 3.7 3.7 52.9%
Morocco 3.3 3.3 47.1%
Kuwait 3.1 3.0 43.6%
Egypt 3.1 2.7 41.4%
*No data was available for Lebanon, as such, averaged regional scores were substitutedSource: WEF Travel and Tourism Competitiveness Report 2009
Environmental Performance in MENA
The global Environmental Performance Index (EPI) indicates that all countries in the sample, with the exception of those in North Africa, are in the bottom 50 percent of countries ranked by the EPI. North Africa’s stronger performance relative to other MENA countries is counterintuitive when observing the country scoring in the stringency and enforcement of environmental regulations indexes, which found that North African countries, with the exception of Tunisia, were among the lowest-scoring countries in the world. The reasons for North Africa’s stronger performance relative to others in the region are the country’s low burden of environmental disease and low levels of indoor air pollution. Poor outdoor air pollution, as measured by high levels of urban particulates, means they are still, relative to developed nations, low down in the rankings.45
452010 Environmental Performance Index, Yale Center for Environmental Law & Policy et al
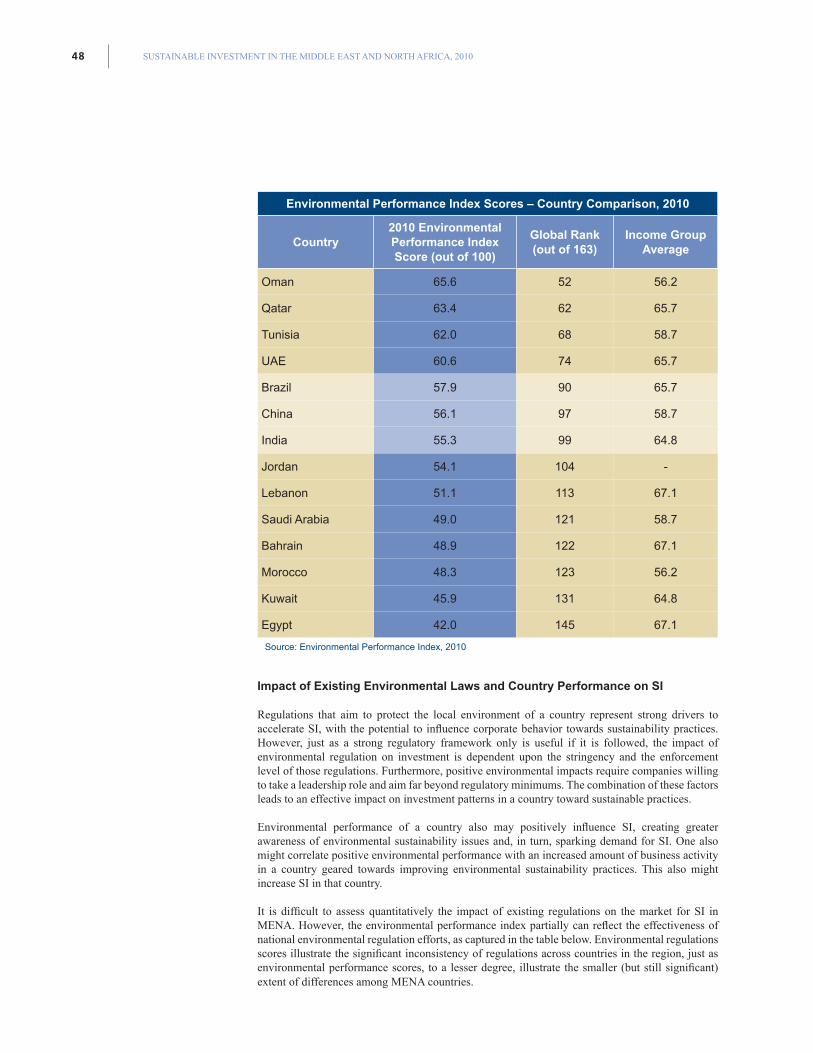
SUSTAINABLE INVESTMENT IN THE MIDDLE EAST AND NORTH AFRICA, 201048
Environmental Performance Index Scores – Country Comparison, 2010
Country2010 Environmental Performance Index Score (out of 100)
Global Rank (out of 163)
Income Group Average
Oman 65.6 52 56.2
Qatar 63.4 62 65.7
Tunisia 62.0 68 58.7
UAE 60.6 74 65.7
Brazil 57.9 90 65.7
China 56.1 97 58.7
India 55.3 99 64.8
Jordan 54.1 104 -
Lebanon 51.1 113 67.1
Saudi Arabia 49.0 121 58.7
Bahrain 48.9 122 67.1
Morocco 48.3 123 56.2
Kuwait 45.9 131 64.8
Egypt 42.0 145 67.1
Source: Environmental Performance Index, 2010
Impact of Existing Environmental Laws and Country Performance on SI
Regulations that aim to protect the local environment of a country represent strong drivers to accelerate SI, with the potential to influence corporate behavior towards sustainability practices. However, just as a strong regulatory framework only is useful if it is followed, the impact of environmental regulation on investment is dependent upon the stringency and the enforcement level of those regulations. Furthermore, positive environmental impacts require companies willing to take a leadership role and aim far beyond regulatory minimums. The combination of these factors leads to an effective impact on investment patterns in a country toward sustainable practices.
Environmental performance of a country also may positively influence SI, creating greater awareness of environmental sustainability issues and, in turn, sparking demand for SI. One also might correlate positive environmental performance with an increased amount of business activity in a country geared towards improving environmental sustainability practices. This also might increase SI in that country.
It is difficult to assess quantitatively the impact of existing regulations on the market for SI in MENA. However, the environmental performance index partially can reflect the effectiveness of national environmental regulation efforts, as captured in the table below. Environmental regulations scores illustrate the significant inconsistency of regulations across countries in the region, just as environmental performance scores, to a lesser degree, illustrate the smaller (but still significant) extent of differences among MENA countries.
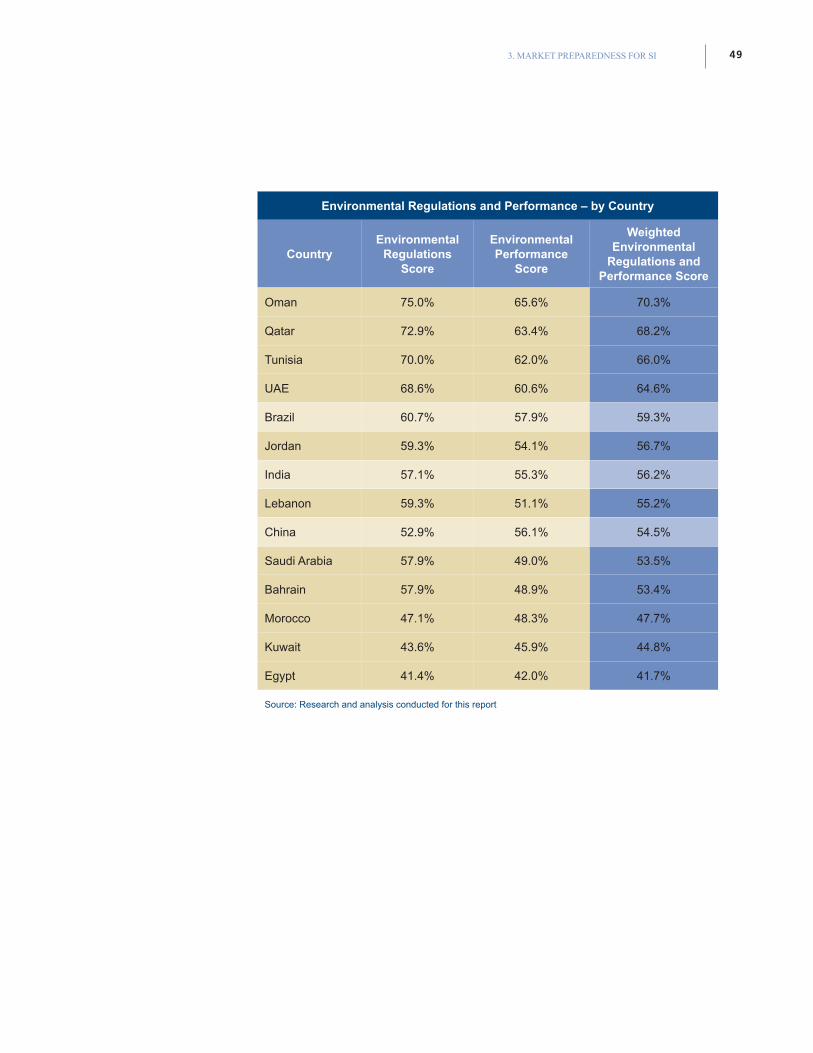
3. MARKET PREPAREDNESS FOR SI 49
Environmental Regulations and Performance – by Country
CountryEnvironmental
Regulations Score
Environmental Performance
Score
Weighted Environmental
Regulations and Performance Score
Oman 75.0% 65.6% 70.3%
Qatar 72.9% 63.4% 68.2%
Tunisia 70.0% 62.0% 66.0%
UAE 68.6% 60.6% 64.6%
Brazil 60.7% 57.9% 59.3%
Jordan 59.3% 54.1% 56.7%
India 57.1% 55.3% 56.2%
Lebanon 59.3% 51.1% 55.2%
China 52.9% 56.1% 54.5%
Saudi Arabia 57.9% 49.0% 53.5%
Bahrain 57.9% 48.9% 53.4%
Morocco 47.1% 48.3% 47.7%
Kuwait 43.6% 45.9% 44.8%
Egypt 41.4% 42.0% 41.7%
Source: Research and analysis conducted for this report
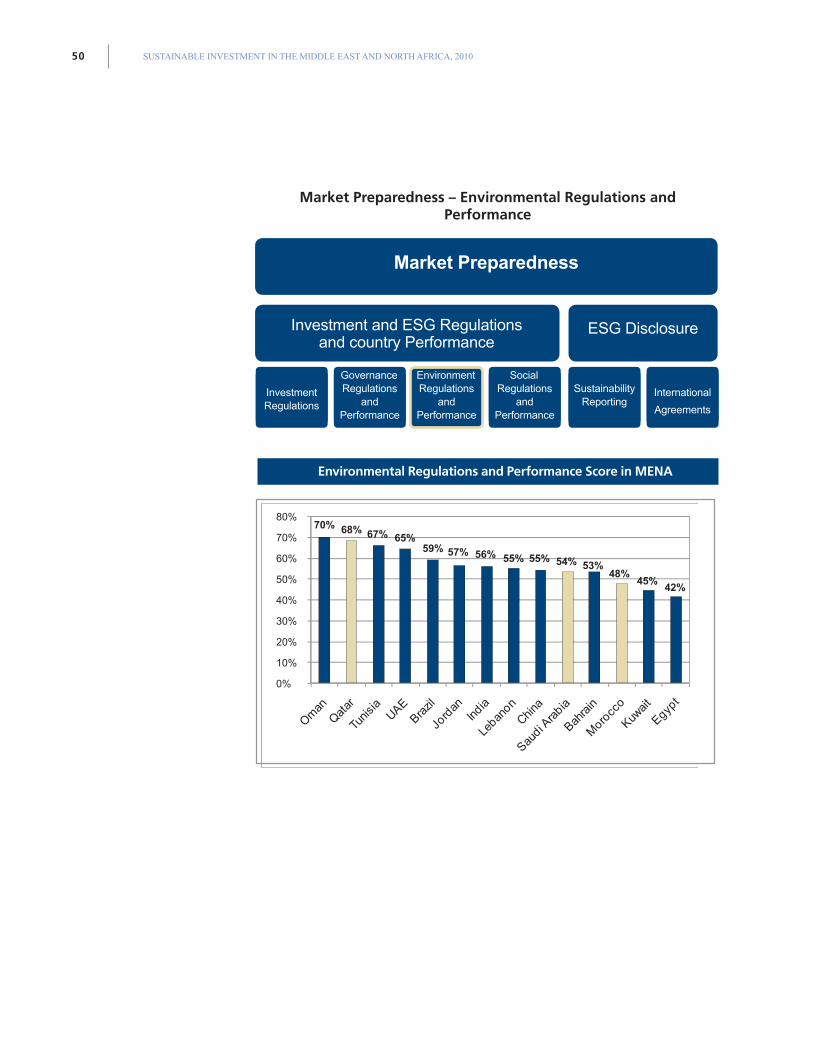
SUSTAINABLE INVESTMENT IN THE MIDDLE EAST AND NORTH AFRICA, 201050
Market Preparedness – Environmental Regulations and Performance
80%
70%
60%
50%
40%
30%
20%
10%
0%
70% 68% 67% 65%59% 57% 56% 55% 55% 54% 53%
48%45%
42%
ESG Disclosure
Investment Regulations
Environment Regulations
andPerformance
Sustainability Reporting
Governance Regulations
andPerformance
SocialRegulations
andPerformance
International
Agreements
Investment and ESG Regulationsand country Performance
Market Preparedness
Environmental Regulations and Performance Score in MENA
3. MARKET PREPAREDNESS FOR SI 51
Social-Related Laws and Regulations and Country Performance
Social Regulations in MENA
Social regulations comprise a wide range of laws. This report focuses on laws and regulations in relation to labor, gender equality, and human rights, given the identification of these issues as among the most material ESG issues for the MENA region (as per chapter 1).
Despite the similarity in some legislative frameworks, the MENA region represents a blend of countries ranging in size, social and political structure, economic realities, and regulatory frameworks. This is reflected in the apparent differences among MENA region countries in their various social laws and regulations.
Gender Equality Regulations in MENA
One such issue where regulations vary greatly from one MENA country to another is gender equality. To illustrate the disparity between gender equality levels in the region, take the example of the varying years in which women were granted the right to vote and stand for election: In Jordan, women received this right in 1974, in Kuwait, it was not until 2005.
GCC countries have reported significant improvements in gender equality over the last five years, shrinking the existing gap between them and the other MENA countries. For example, the first female judges were appointed in Bahrain in 2006 and in the UAE in 2008. Women in GCC countries are also participating more in public life, education and business. As for overall improvements in the MENA region, the biggest steps were taken in the areas of employment, education, and political representation. In addition, there were a number of efforts and initiatives to empower women in the region, most notably Her Majesty Queen Rania Al Abdullah of Jordan’s strong support for education.
In the UNDP 2009 Human Development Report, the UAE and Bahrain ranked highest in the region for gender empowerment, coming in at 25th and 46th respectively out of 109 ranked countries. Egypt and Saudi Arabia ranked lowest in the MENA region, and are among the lowest-ranking countries in the world. Among countries that have gender empowerment-related data, the worst performing countries include Saudi Arabia, Egypt, Yemen, and Bangladesh.
The assessments of social laws and regulations in MENA are based on the country scores on indices related to Gender Equality and Labor Rights.
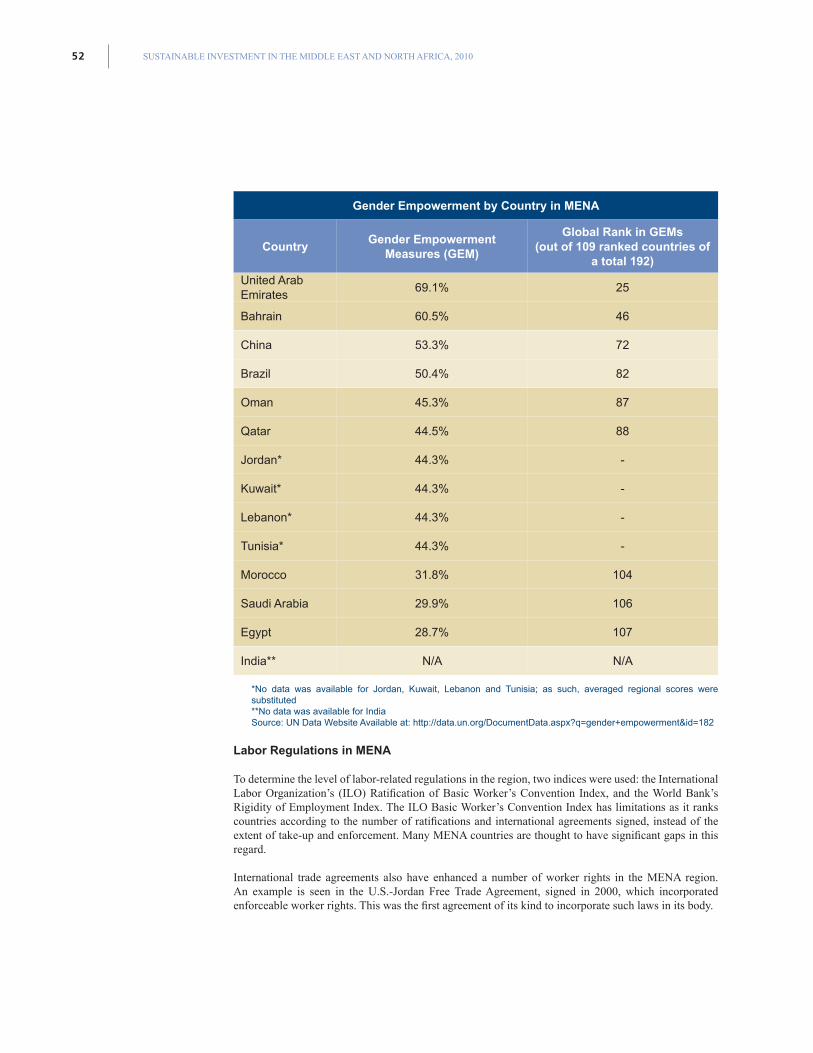
SUSTAINABLE INVESTMENT IN THE MIDDLE EAST AND NORTH AFRICA, 201052
Gender Empowerment by Country in MENA
CountryGender Empowerment
Measures (GEM)
Global Rank in GEMs (out of 109 ranked countries of
a total 192)
United Arab Emirates
69.1% 25
Bahrain 60.5% 46
China 53.3% 72
Brazil 50.4% 82
Oman 45.3% 87
Qatar 44.5% 88
Jordan* 44.3% -
Kuwait* 44.3% -
Lebanon* 44.3% -
Tunisia* 44.3% -
Morocco 31.8% 104
Saudi Arabia 29.9% 106
Egypt 28.7% 107
India** N/A N/A
*No data was available for Jordan, Kuwait, Lebanon and Tunisia; as such, averaged regional scores were substituted**No data was available for IndiaSource: UN Data Website Available at: http://data.un.org/DocumentData.aspx?q=gender+empowerment&id=182
Labor Regulations in MENA
To determine the level of labor-related regulations in the region, two indices were used: the International Labor Organization’s (ILO) Ratification of Basic Worker’s Convention Index, and the World Bank’s Rigidity of Employment Index. The ILO Basic Worker’s Convention Index has limitations as it ranks countries according to the number of ratifications and international agreements signed, instead of the extent of take-up and enforcement. Many MENA countries are thought to have significant gaps in this regard.
International trade agreements also have enhanced a number of worker rights in the MENA region. An example is seen in the U.S.-Jordan Free Trade Agreement, signed in 2000, which incorporated enforceable worker rights. This was the first agreement of its kind to incorporate such laws in its body.
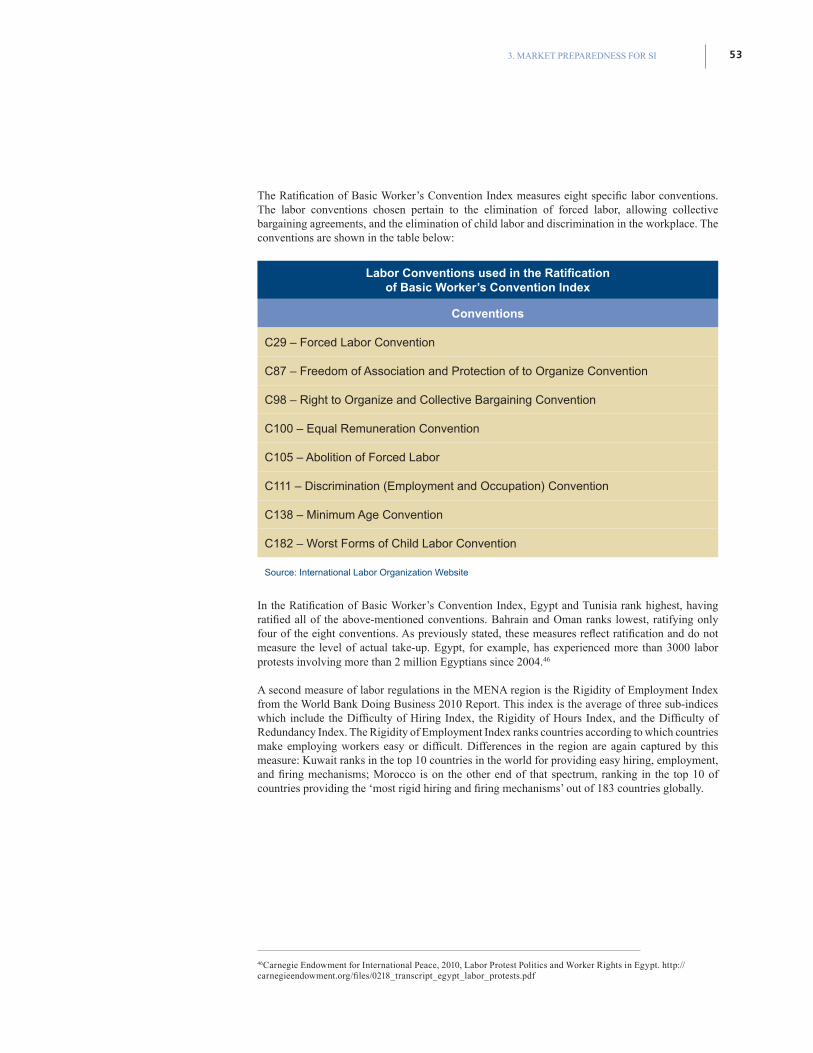
3. MARKET PREPAREDNESS FOR SI 53
The Ratification of Basic Worker’s Convention Index measures eight specific labor conventions. The labor conventions chosen pertain to the elimination of forced labor, allowing collective bargaining agreements, and the elimination of child labor and discrimination in the workplace. The conventions are shown in the table below:
Labor Conventions used in the Ratification of Basic Worker’s Convention Index
Conventions
C29 – Forced Labor Convention
C87 – Freedom of Association and Protection of to Organize Convention
C98 – Right to Organize and Collective Bargaining Convention
C100 – Equal Remuneration Convention
C105 – Abolition of Forced Labor
C111 – Discrimination (Employment and Occupation) Convention
C138 – Minimum Age Convention
C182 – Worst Forms of Child Labor Convention
Source: International Labor Organization Website
In the Ratification of Basic Worker’s Convention Index, Egypt and Tunisia rank highest, having ratified all of the above-mentioned conventions. Bahrain and Oman ranks lowest, ratifying only four of the eight conventions. As previously stated, these measures reflect ratification and do not measure the level of actual take-up. Egypt, for example, has experienced more than 3000 labor protests involving more than 2 million Egyptians since 2004.46
A second measure of labor regulations in the MENA region is the Rigidity of Employment Index from the World Bank Doing Business 2010 Report. This index is the average of three sub-indices which include the Difficulty of Hiring Index, the Rigidity of Hours Index, and the Difficulty of Redundancy Index. The Rigidity of Employment Index ranks countries according to which countries make employing workers easy or difficult. Differences in the region are again captured by this measure: Kuwait ranks in the top 10 countries in the world for providing easy hiring, employment, and firing mechanisms; Morocco is on the other end of that spectrum, ranking in the top 10 of countries providing the ‘most rigid hiring and firing mechanisms’ out of 183 countries globally.
46Carnegie Endowment for International Peace, 2010, Labor Protest Politics and Worker Rights in Egypt. http://carnegieendowment.org/files/0218_transcript_egypt_labor_protests.pdf
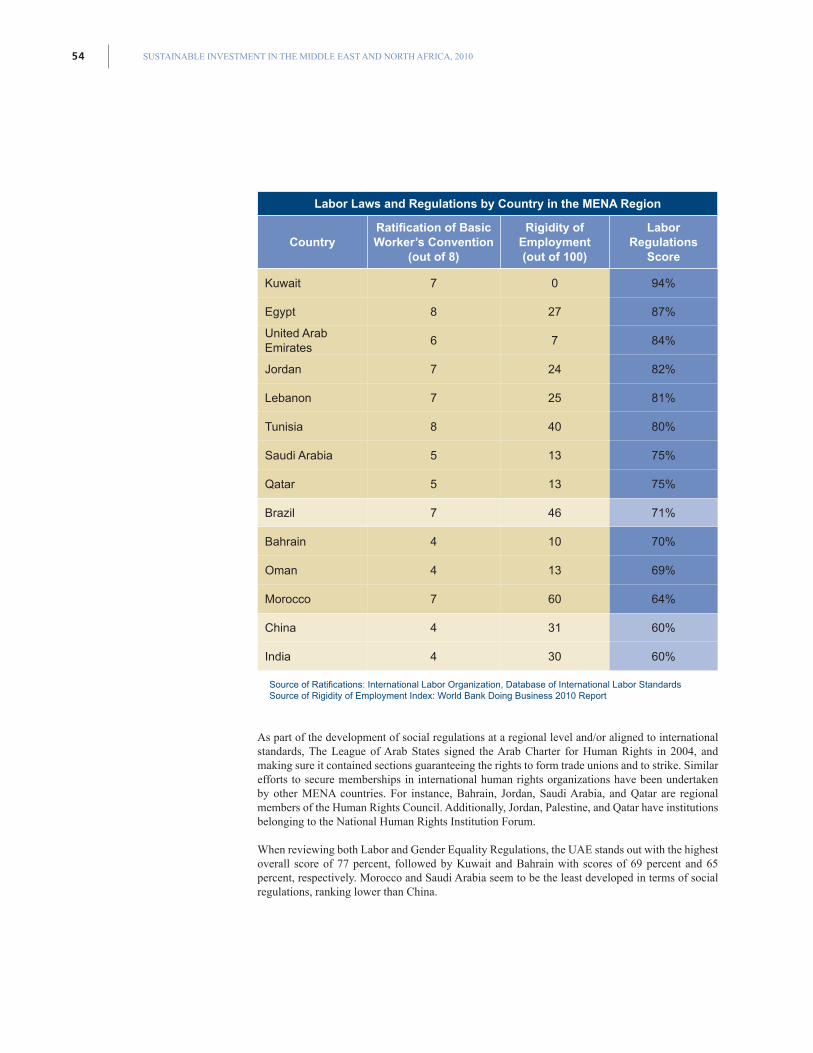
SUSTAINABLE INVESTMENT IN THE MIDDLE EAST AND NORTH AFRICA, 201054
Labor Laws and Regulations by Country in the MENA Region
CountryRatification of Basic Worker’s Convention
(out of 8)
Rigidity of Employment (out of 100)
Labor Regulations
Score
Kuwait 7 0 94%
Egypt 8 27 87%
United Arab Emirates
6 7 84%
Jordan 7 24 82%
Lebanon 7 25 81%
Tunisia 8 40 80%
Saudi Arabia 5 13 75%
Qatar 5 13 75%
Brazil 7 46 71%
Bahrain 4 10 70%
Oman 4 13 69%
Morocco 7 60 64%
China 4 31 60%
India 4 30 60%
Source of Ratifications: International Labor Organization, Database of International Labor StandardsSource of Rigidity of Employment Index: World Bank Doing Business 2010 Report
As part of the development of social regulations at a regional level and/or aligned to international standards, The League of Arab States signed the Arab Charter for Human Rights in 2004, and making sure it contained sections guaranteeing the rights to form trade unions and to strike. Similar efforts to secure memberships in international human rights organizations have been undertaken by other MENA countries. For instance, Bahrain, Jordan, Saudi Arabia, and Qatar are regional members of the Human Rights Council. Additionally, Jordan, Palestine, and Qatar have institutions belonging to the National Human Rights Institution Forum.
When reviewing both Labor and Gender Equality Regulations, the UAE stands out with the highest overall score of 77 percent, followed by Kuwait and Bahrain with scores of 69 percent and 65 percent, respectively. Morocco and Saudi Arabia seem to be the least developed in terms of social regulations, ranking lower than China.
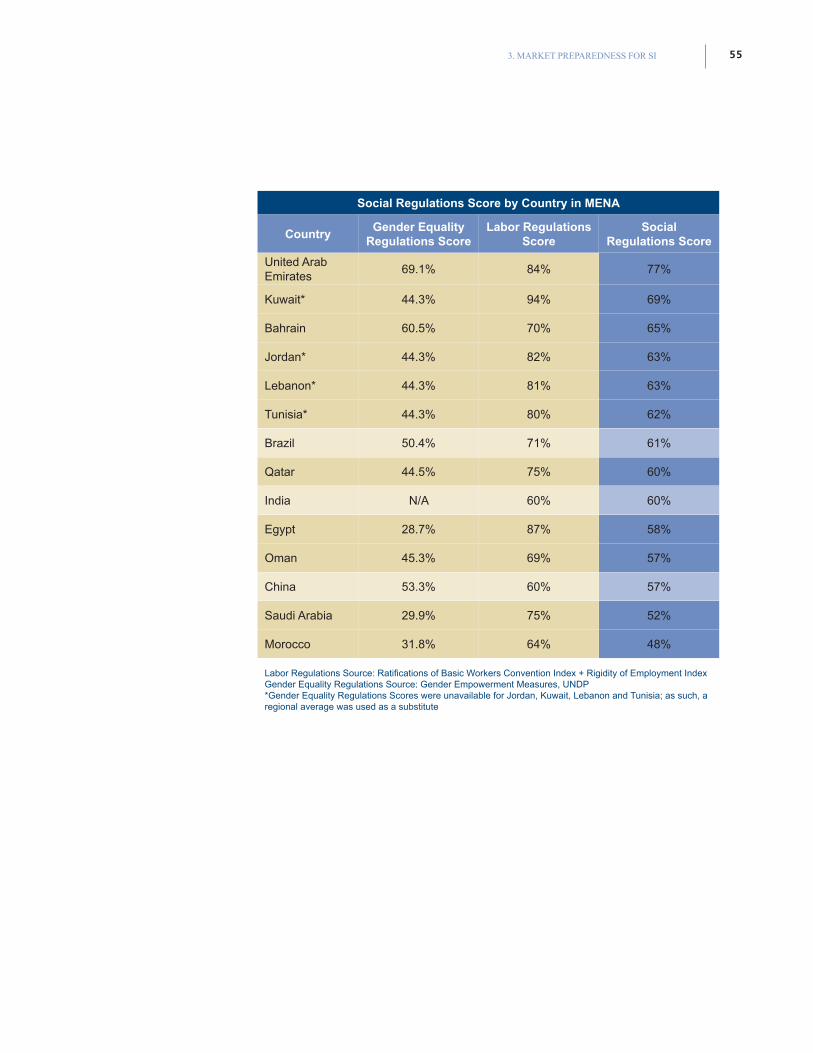
3. MARKET PREPAREDNESS FOR SI 55
Social Regulations Score by Country in MENA
CountryGender Equality
Regulations ScoreLabor Regulations
ScoreSocial
Regulations Score
United Arab Emirates
69.1% 84% 77%
Kuwait* 44.3% 94% 69%
Bahrain 60.5% 70% 65%
Jordan* 44.3% 82% 63%
Lebanon* 44.3% 81% 63%
Tunisia* 44.3% 80% 62%
Brazil 50.4% 71% 61%
Qatar 44.5% 75% 60%
India N/A 60% 60%
Egypt 28.7% 87% 58%
Oman 45.3% 69% 57%
China 53.3% 60% 57%
Saudi Arabia 29.9% 75% 52%
Morocco 31.8% 64% 48%
Labor Regulations Source: Ratifications of Basic Workers Convention Index + Rigidity of Employment IndexGender Equality Regulations Source: Gender Empowerment Measures, UNDP*Gender Equality Regulations Scores were unavailable for Jordan, Kuwait, Lebanon and Tunisia; as such, a regional average was used as a substitute
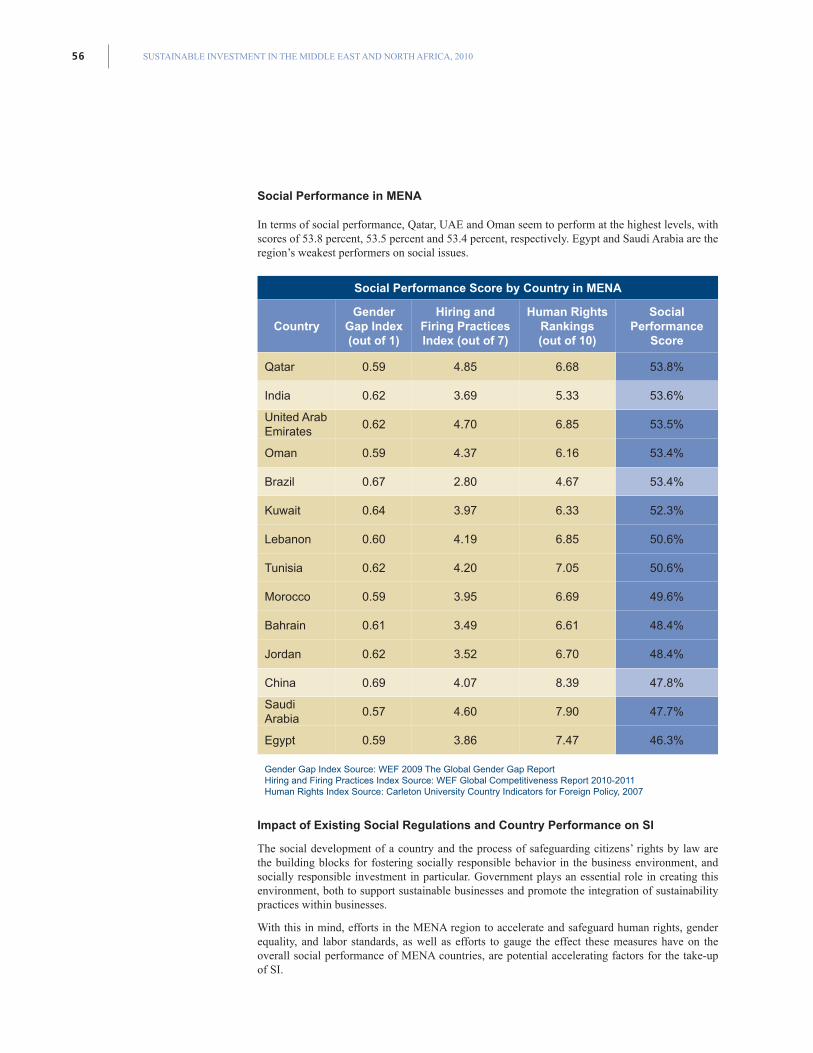
SUSTAINABLE INVESTMENT IN THE MIDDLE EAST AND NORTH AFRICA, 201056
Social Performance in MENA
In terms of social performance, Qatar, UAE and Oman seem to perform at the highest levels, with scores of 53.8 percent, 53.5 percent and 53.4 percent, respectively. Egypt and Saudi Arabia are the region’s weakest performers on social issues.
Social Performance Score by Country in MENA
CountryGender
Gap Index (out of 1)
Hiring and Firing Practices Index (out of 7)
Human Rights Rankings (out of 10)
Social Performance
Score
Qatar 0.59 4.85 6.68 53.8%
India 0.62 3.69 5.33 53.6%
United Arab Emirates
0.62 4.70 6.85 53.5%
Oman 0.59 4.37 6.16 53.4%
Brazil 0.67 2.80 4.67 53.4%
Kuwait 0.64 3.97 6.33 52.3%
Lebanon 0.60 4.19 6.85 50.6%
Tunisia 0.62 4.20 7.05 50.6%
Morocco 0.59 3.95 6.69 49.6%
Bahrain 0.61 3.49 6.61 48.4%
Jordan 0.62 3.52 6.70 48.4%
China 0.69 4.07 8.39 47.8%
Saudi Arabia
0.57 4.60 7.90 47.7%
Egypt 0.59 3.86 7.47 46.3%
Gender Gap Index Source: WEF 2009 The Global Gender Gap ReportHiring and Firing Practices Index Source: WEF Global Competitiveness Report 2010-2011Human Rights Index Source: Carleton University Country Indicators for Foreign Policy, 2007
Impact of Existing Social Regulations and Country Performance on SI
The social development of a country and the process of safeguarding citizens’ rights by law are the building blocks for fostering socially responsible behavior in the business environment, and socially responsible investment in particular. Government plays an essential role in creating this environment, both to support sustainable businesses and promote the integration of sustainability practices within businesses.
With this in mind, efforts in the MENA region to accelerate and safeguard human rights, gender equality, and labor standards, as well as efforts to gauge the effect these measures have on the overall social performance of MENA countries, are potential accelerating factors for the take-up of SI.
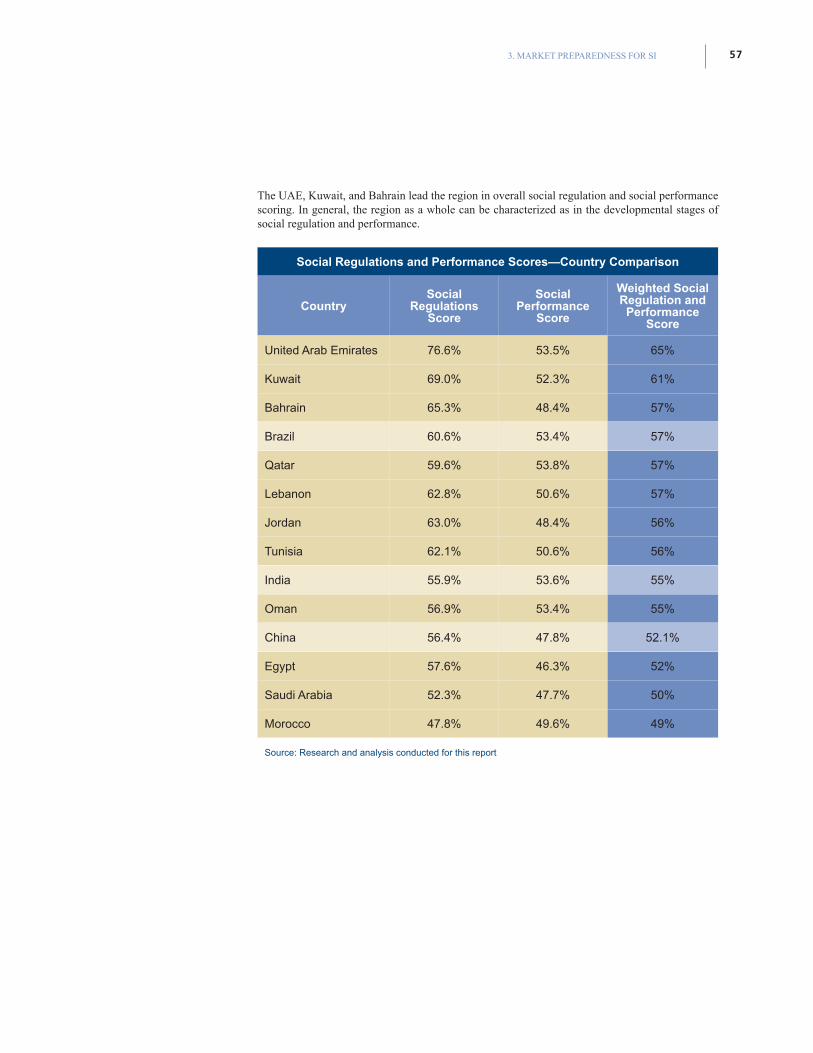
3. MARKET PREPAREDNESS FOR SI 57
The UAE, Kuwait, and Bahrain lead the region in overall social regulation and social performance scoring. In general, the region as a whole can be characterized as in the developmental stages of social regulation and performance.
Social Regulations and Performance Scores—Country Comparison
CountrySocial
Regulations Score
Social Performance
Score
Weighted Social Regulation and Performance
Score
United Arab Emirates 76.6% 53.5% 65%
Kuwait 69.0% 52.3% 61%
Bahrain 65.3% 48.4% 57%
Brazil 60.6% 53.4% 57%
Qatar 59.6% 53.8% 57%
Lebanon 62.8% 50.6% 57%
Jordan 63.0% 48.4% 56%
Tunisia 62.1% 50.6% 56%
India 55.9% 53.6% 55%
Oman 56.9% 53.4% 55%
China 56.4% 47.8% 52.1%
Egypt 57.6% 46.3% 52%
Saudi Arabia 52.3% 47.7% 50%
Morocco 47.8% 49.6% 49%
Source: Research and analysis conducted for this report
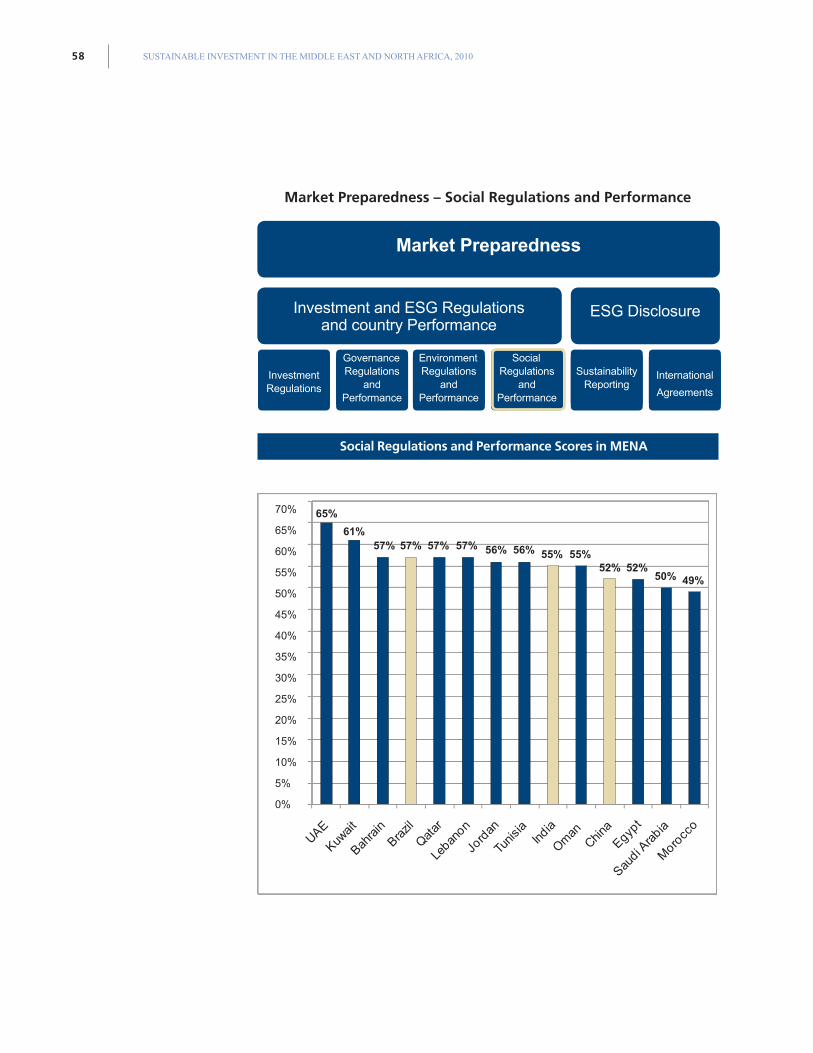
SUSTAINABLE INVESTMENT IN THE MIDDLE EAST AND NORTH AFRICA, 201058
Market Preparedness – Social Regulations and Performance
ESG Disclosure
Investment Regulations
Environment Regulations
andPerformance
Sustainability Reporting
Governance Regulations
andPerformance
SocialRegulations
andPerformance
International
Agreements
Investment and ESG Regulationsand country Performance
Market Preparedness
70%
65%
60%
55%
50%
45%
40%
35%
30%
25%
20%
15%
10%
5%
0%
65%
61%57% 57% 57% 57% 56% 56% 55% 55%
52% 52%50% 49%
Social Regulations and Performance Scores in MENA
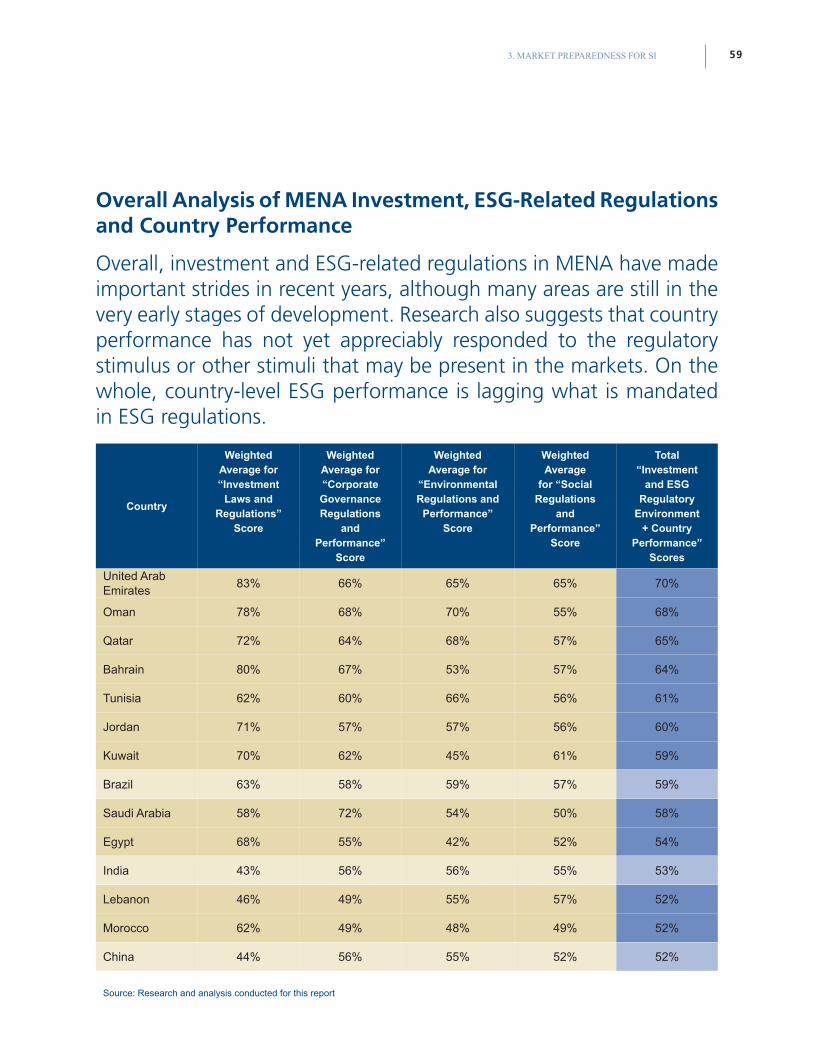
3. MARKET PREPAREDNESS FOR SI 59
Overall Analysis of MENA Investment, ESG-Related Regulations and Country Performance
Overall, investment and ESG-related regulations in MENA have made important strides in recent years, although many areas are still in the very early stages of development. Research also suggests that country performance has not yet appreciably responded to the regulatory stimulus or other stimuli that may be present in the markets. On the whole, country-level ESG performance is lagging what is mandated in ESG regulations.
Country
Weighted Average for “Investment
Laws and Regulations”
Score
Weighted Average for “Corporate Governance Regulations
and Performance”
Score
Weighted Average for
“Environmental Regulations and
Performance” Score
Weighted Average
for “Social Regulations
and Performance”
Score
Total “Investment
and ESG Regulatory
Environment + Country
Performance” Scores
United Arab Emirates
83% 66% 65% 65% 70%
Oman 78% 68% 70% 55% 68%
Qatar 72% 64% 68% 57% 65%
Bahrain 80% 67% 53% 57% 64%
Tunisia 62% 60% 66% 56% 61%
Jordan 71% 57% 57% 56% 60%
Kuwait 70% 62% 45% 61% 59%
Brazil 63% 58% 59% 57% 59%
Saudi Arabia 58% 72% 54% 50% 58%
Egypt 68% 55% 42% 52% 54%
India 43% 56% 56% 55% 53%
Lebanon 46% 49% 55% 57% 52%
Morocco 62% 49% 48% 49% 52%
China 44% 56% 55% 52% 52%
Source: Research and analysis conducted for this report
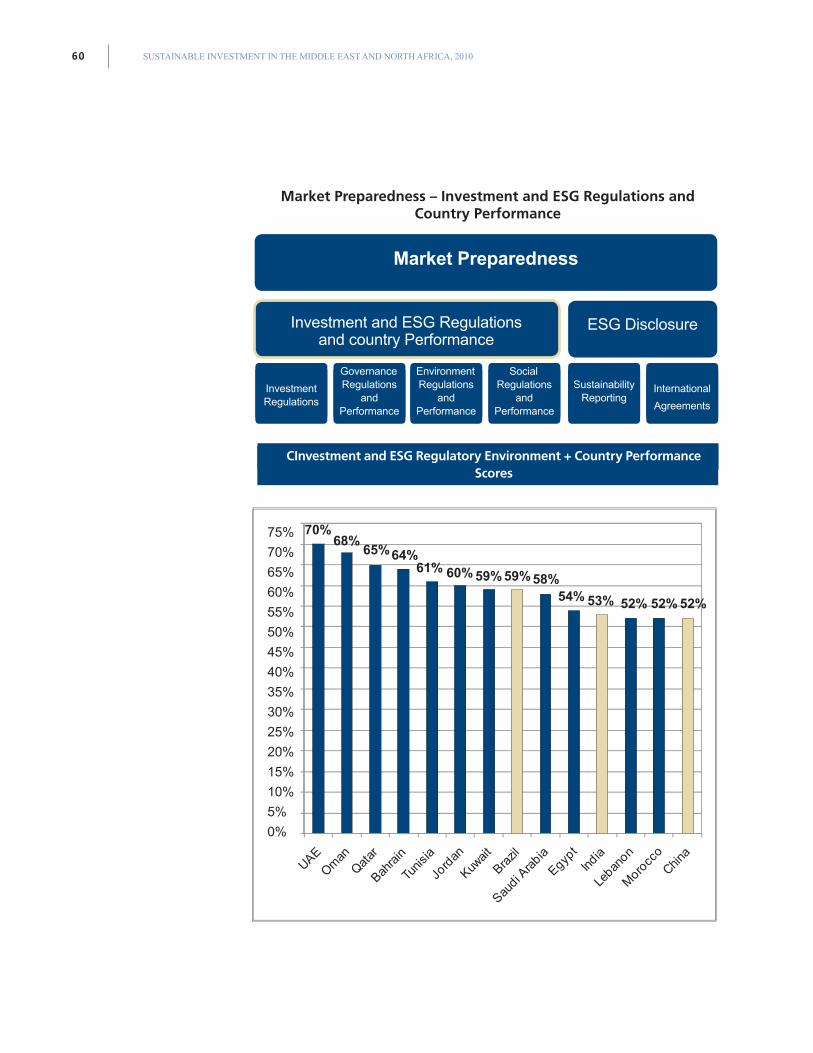
SUSTAINABLE INVESTMENT IN THE MIDDLE EAST AND NORTH AFRICA, 201060
Market Preparedness – Investment and ESG Regulations and Country Performance
75%
70%
65%
60%
55%
50%
45%
40%
35%
30%
25%
20%
15%
10%
5%
0%
70%68%
65%64%61% 60% 59% 59% 58%
54% 53% 52% 52% 52%
ESG Disclosure
Investment Regulations
Environment Regulations
andPerformance
Sustainability Reporting
Governance Regulations
andPerformance
SocialRegulations
andPerformance
International
Agreements
Investment and ESG Regulationsand country Performance
Market Preparedness
CInvestment and ESG Regulatory Environment + Country Performance Scores
3. MARKET PREPAREDNESS FOR SI 61
ESG Disclosure
In addition to reviewing ESG regulations and country performance, the second main element of the quantitative assessment of MENA SI Market Preparedness is a review of: • Current disclosure mechanisms/tools for ESG performance data used by companies
in the region. Disclosure tools reviewed include the Global Reporting Initiative (GRI) and the UN Global Compact. Generally sound ESG disclosure reports from the Corporate Register were also reviewed.
• Current adoption of SI tools by asset owners/managers in MENA, including adoption of the UN Principles for Responsible Investment (PRI), the UN Environmental Programme’s Finance Initiative (UNEP FI), and the Equator Principles (EP).
Sustainability Reporting and Non-Financial Information Disclosure
Disclosure of ESG performance is essential to SI activity, in that it is the primary source of ESG data. Companies that are transparent are thus more likely to be valued by not only SI investors but investors and stakeholders in general: according to a survey conducted by Ernst and Young,47 69 percent of 137 institutional investors in charge of some of the world’s largest portfolios in sixteen countries identified transparency as a top priority when considering an initial investment.
A survey conducted by Hawkamah in 200848 on disclosure practices in banks and listed companies in MENA indicated that adoption of non-financial disclosure practices are weak, with disclosure of corporate governance-related information, as well as charters and by-laws, being the information disclosed the least.
The Hawkamah survey also assessed the barriers preventing the adoption of good disclosure practices among banks and listed companies. Roughly 72 percent of the survey sample indicated the absence of legal disclosure obligation as the major barrier, while around 30 percent indicated the lack of demand to disclose as another obstacle. Additional barriers included: lack of economic incentive, fear of unfair competition, security issues, anticipation of regulatory consequences, and lack of resources.
A few international efforts, such as the Global Reporting Initiative and the UN’s Global Compact Principles, provide guidance on, and/or inventories of, ESG reporting from companies for public consumption. These initiatives also support investors who want to make informed investment decisions while taking material ESG risks into account. The uptake of these international ESG disclosure mechanisms in the region is still limited, as illustrated through the following tables.
47Ernst & Young, 2005, Investors on Risk: The Need for Transparency
48 IFC/Hawkamah, 2008, A Corporate Governance Survey of Listed Companies and Banks Across the Middle East & North Africa.
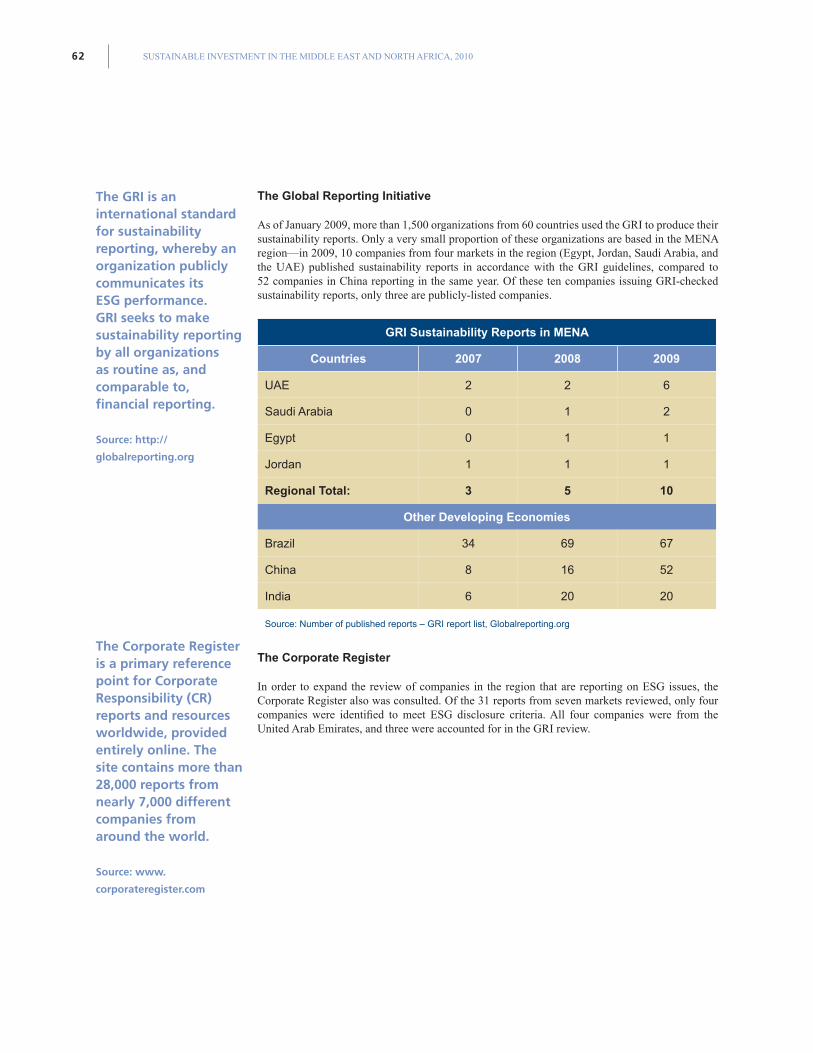
SUSTAINABLE INVESTMENT IN THE MIDDLE EAST AND NORTH AFRICA, 201062
The Global Reporting Initiative
As of January 2009, more than 1,500 organizations from 60 countries used the GRI to produce their sustainability reports. Only a very small proportion of these organizations are based in the MENA region—in 2009, 10 companies from four markets in the region (Egypt, Jordan, Saudi Arabia, and the UAE) published sustainability reports in accordance with the GRI guidelines, compared to 52 companies in China reporting in the same year. Of these ten companies issuing GRI-checked sustainability reports, only three are publicly-listed companies.
GRI Sustainability Reports in MENA
Countries 2007 2008 2009
UAE 2 2 6
Saudi Arabia 0 1 2
Egypt 0 1 1
Jordan 1 1 1
Regional Total: 3 5 10
Other Developing Economies
Brazil 34 69 67
China 8 16 52
India 6 20 20
Source: Number of published reports – GRI report list, Globalreporting.org
The Corporate Register
In order to expand the review of companies in the region that are reporting on ESG issues, the Corporate Register also was consulted. Of the 31 reports from seven markets reviewed, only four companies were identified to meet ESG disclosure criteria. All four companies were from the United Arab Emirates, and three were accounted for in the GRI review.
The GRI is an international standard for sustainability reporting, whereby an organization publicly communicates its ESG performance. GRI seeks to make sustainability reporting by all organizations as routine as, and comparable to, financial reporting.
Source: http://
globalreporting.org
The Corporate Register is a primary reference point for Corporate Responsibility (CR) reports and resources worldwide, provided entirely online. The site contains more than 28,000 reports from nearly 7,000 different companies from around the world.
Source: www.
corporateregister.com
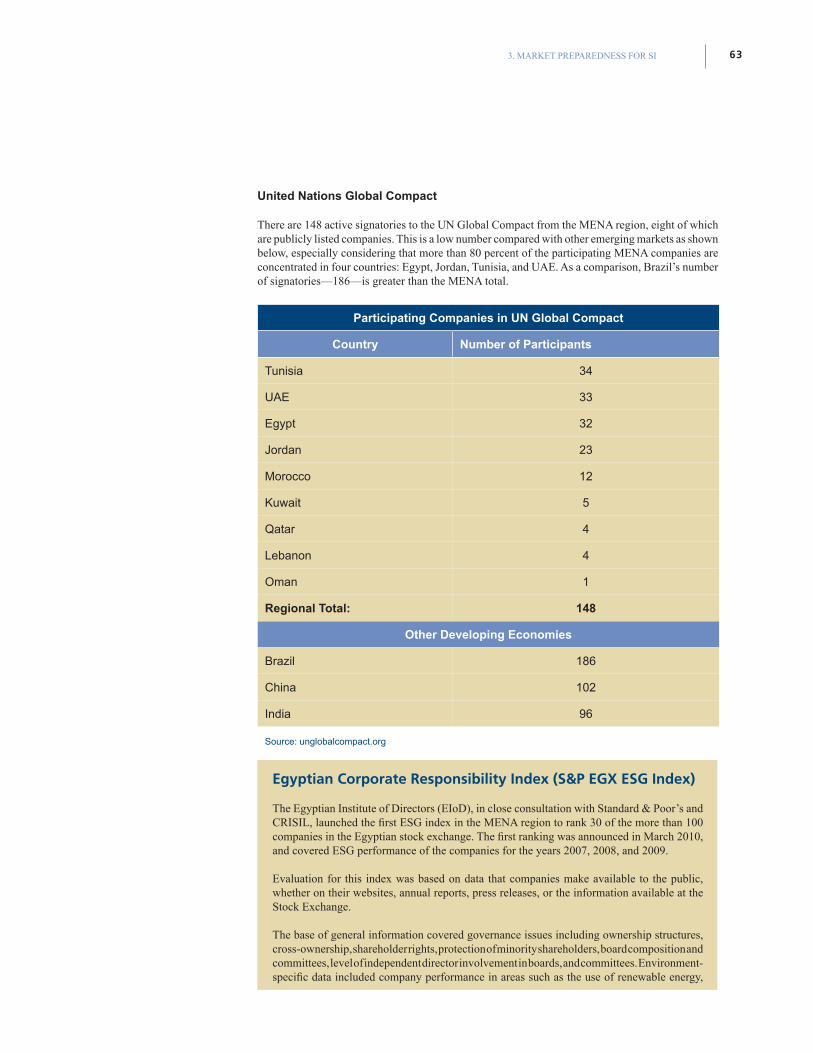
3. MARKET PREPAREDNESS FOR SI 63
United Nations Global Compact
There are 148 active signatories to the UN Global Compact from the MENA region, eight of which are publicly listed companies. This is a low number compared with other emerging markets as shown below, especially considering that more than 80 percent of the participating MENA companies are concentrated in four countries: Egypt, Jordan, Tunisia, and UAE. As a comparison, Brazil’s number of signatories—186—is greater than the MENA total.
Participating Companies in UN Global Compact
Country Number of Participants
Tunisia 34
UAE 33
Egypt 32
Jordan 23
Morocco 12
Kuwait 5
Qatar 4
Lebanon 4
Oman 1
Regional Total: 148
Other Developing Economies
Brazil 186
China 102
India 96
Source: unglobalcompact.org
Egyptian Corporate Responsibility Index (S&P EGX ESG Index)
The Egyptian Institute of Directors (EIoD), in close consultation with Standard & Poor’s and CRISIL, launched the first ESG index in the MENA region to rank 30 of the more than 100 companies in the Egyptian stock exchange. The first ranking was announced in March 2010, and covered ESG performance of the companies for the years 2007, 2008, and 2009.
Evaluation for this index was based on data that companies make available to the public, whether on their websites, annual reports, press releases, or the information available at the Stock Exchange.
The base of general information covered governance issues including ownership structures, cross-ownership, shareholder rights, protection of minority shareholders, board composition and committees, level of independent director involvement in boards, and committees. Environment-specific data included company performance in areas such as the use of renewable energy,
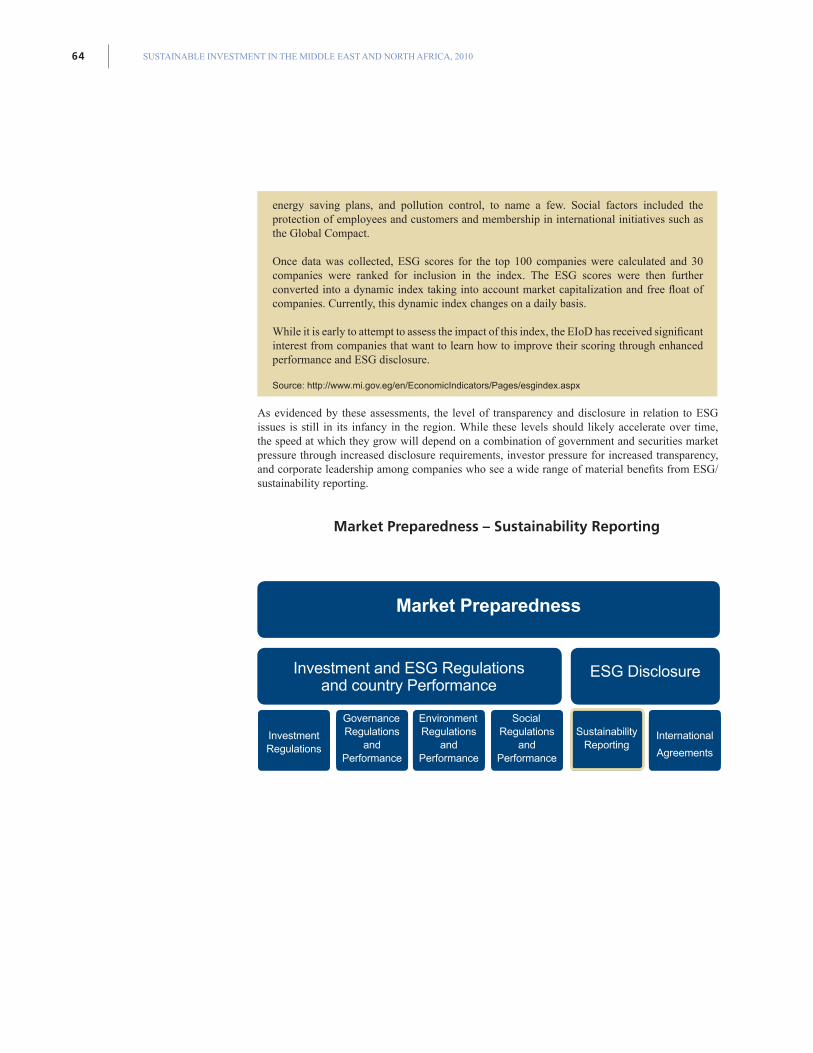
SUSTAINABLE INVESTMENT IN THE MIDDLE EAST AND NORTH AFRICA, 201064
energy saving plans, and pollution control, to name a few. Social factors included the protection of employees and customers and membership in international initiatives such as the Global Compact.
Once data was collected, ESG scores for the top 100 companies were calculated and 30 companies were ranked for inclusion in the index. The ESG scores were then further converted into a dynamic index taking into account market capitalization and free float of companies. Currently, this dynamic index changes on a daily basis.
While it is early to attempt to assess the impact of this index, the EIoD has received significant interest from companies that want to learn how to improve their scoring through enhanced performance and ESG disclosure.
Source: http://www.mi.gov.eg/en/EconomicIndicators/Pages/esgindex.aspx
As evidenced by these assessments, the level of transparency and disclosure in relation to ESG issues is still in its infancy in the region. While these levels should likely accelerate over time, the speed at which they grow will depend on a combination of government and securities market pressure through increased disclosure requirements, investor pressure for increased transparency, and corporate leadership among companies who see a wide range of material benefits from ESG/sustainability reporting.
Market Preparedness – Sustainability Reporting
ESG Disclosure
Investment Regulations
Environment Regulations
andPerformance
Sustainability Reporting
Governance Regulations
andPerformance
SocialRegulations
andPerformance
International
Agreements
Investment and ESG Regulationsand country Performance
Market Preparedness
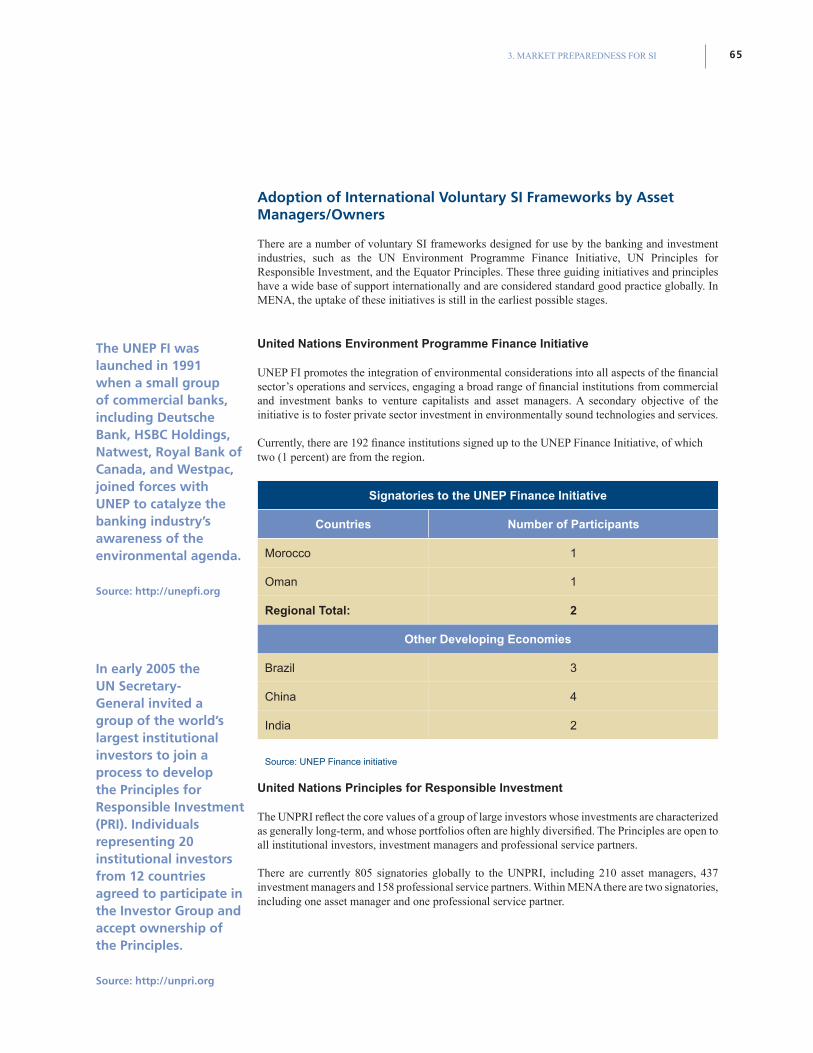
3. MARKET PREPAREDNESS FOR SI 65
Adoption of International Voluntary SI Frameworks by Asset Managers/Owners
There are a number of voluntary SI frameworks designed for use by the banking and investment industries, such as the UN Environment Programme Finance Initiative, UN Principles for Responsible Investment, and the Equator Principles. These three guiding initiatives and principles have a wide base of support internationally and are considered standard good practice globally. In MENA, the uptake of these initiatives is still in the earliest possible stages.
United Nations Environment Programme Finance Initiative
UNEP FI promotes the integration of environmental considerations into all aspects of the financial sector’s operations and services, engaging a broad range of financial institutions from commercial and investment banks to venture capitalists and asset managers. A secondary objective of the initiative is to foster private sector investment in environmentally sound technologies and services.
Currently, there are 192 finance institutions signed up to the UNEP Finance Initiative, of which two (1 percent) are from the region.
Signatories to the UNEP Finance Initiative
Countries Number of Participants
Morocco 1
Oman 1
Regional Total: 2
Other Developing Economies
Brazil 3
China 4
India 2
Source: UNEP Finance initiative
United Nations Principles for Responsible Investment
The UNPRI reflect the core values of a group of large investors whose investments are characterized as generally long-term, and whose portfolios often are highly diversified. The Principles are open to all institutional investors, investment managers and professional service partners.
There are currently 805 signatories globally to the UNPRI, including 210 asset managers, 437 investment managers and 158 professional service partners. Within MENA there are two signatories, including one asset manager and one professional service partner.
The UNEP FI was launched in 1991 when a small group of commercial banks, including Deutsche Bank, HSBC Holdings, Natwest, Royal Bank of Canada, and Westpac, joined forces with UNEP to catalyze the banking industry’s awareness of the environmental agenda.
Source: http://unepfi.org
In early 2005 the UN Secretary-General invited a group of the world’s largest institutional investors to join a process to develop the Principles for Responsible Investment (PRI). Individuals representing 20 institutional investors from 12 countries agreed to participate in the Investor Group and accept ownership of the Principles.
Source: http://unpri.org
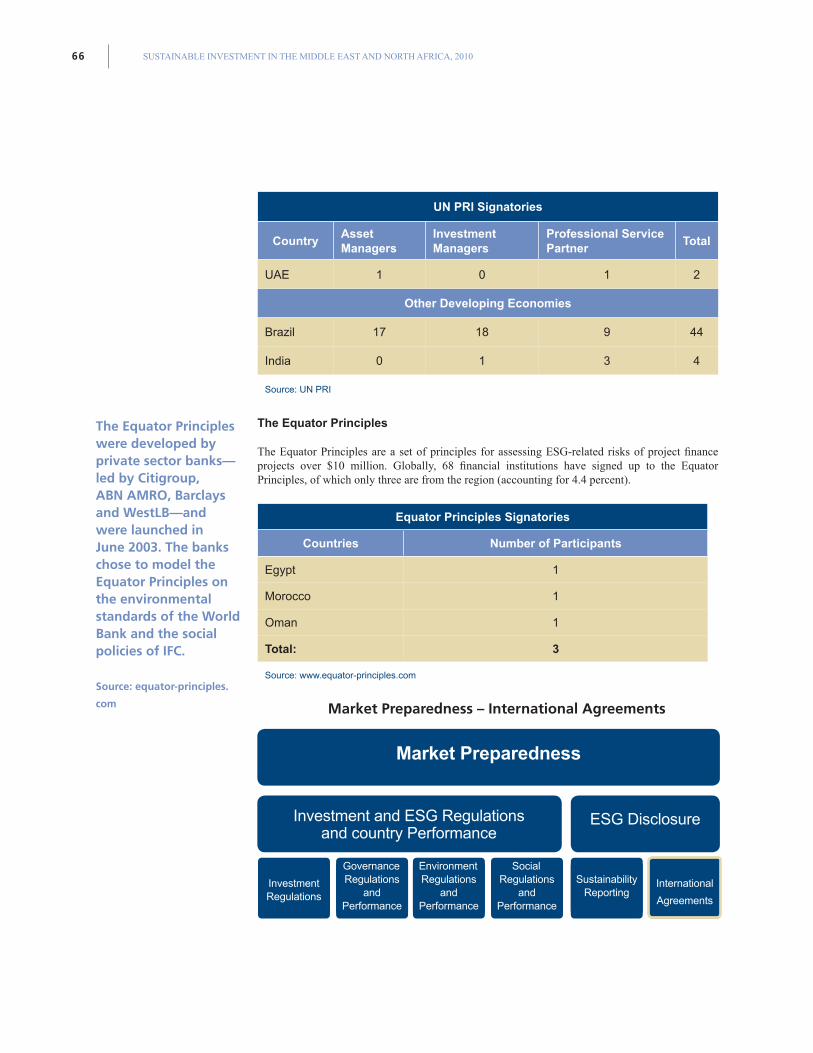
SUSTAINABLE INVESTMENT IN THE MIDDLE EAST AND NORTH AFRICA, 201066
UN PRI Signatories
CountryAsset Managers
Investment Managers
Professional Service Partner
Total
UAE 1 0 1 2
Other Developing Economies
Brazil 17 18 9 44
India 0 1 3 4
Source: UN PRI
The Equator Principles
The Equator Principles are a set of principles for assessing ESG-related risks of project finance projects over $10 million. Globally, 68 financial institutions have signed up to the Equator Principles, of which only three are from the region (accounting for 4.4 percent).
Equator Principles Signatories
Countries Number of Participants
Egypt 1
Morocco 1
Oman 1
Total: 3
Source: www.equator-principles.com
Market Preparedness – International Agreements
The Equator Principles were developed by private sector banks—led by Citigroup, ABN AMRO, Barclays and WestLB—and were launched in June 2003. The banks chose to model the Equator Principles on the environmental standards of the World Bank and the social policies of IFC.
Source: equator-principles.
com
ESG Disclosure
Investment Regulations
Environment Regulations
andPerformance
Sustainability Reporting
Governance Regulations
andPerformance
SocialRegulations
andPerformance
International
Agreements
Investment and ESG Regulationsand country Performance
Market Preparedness
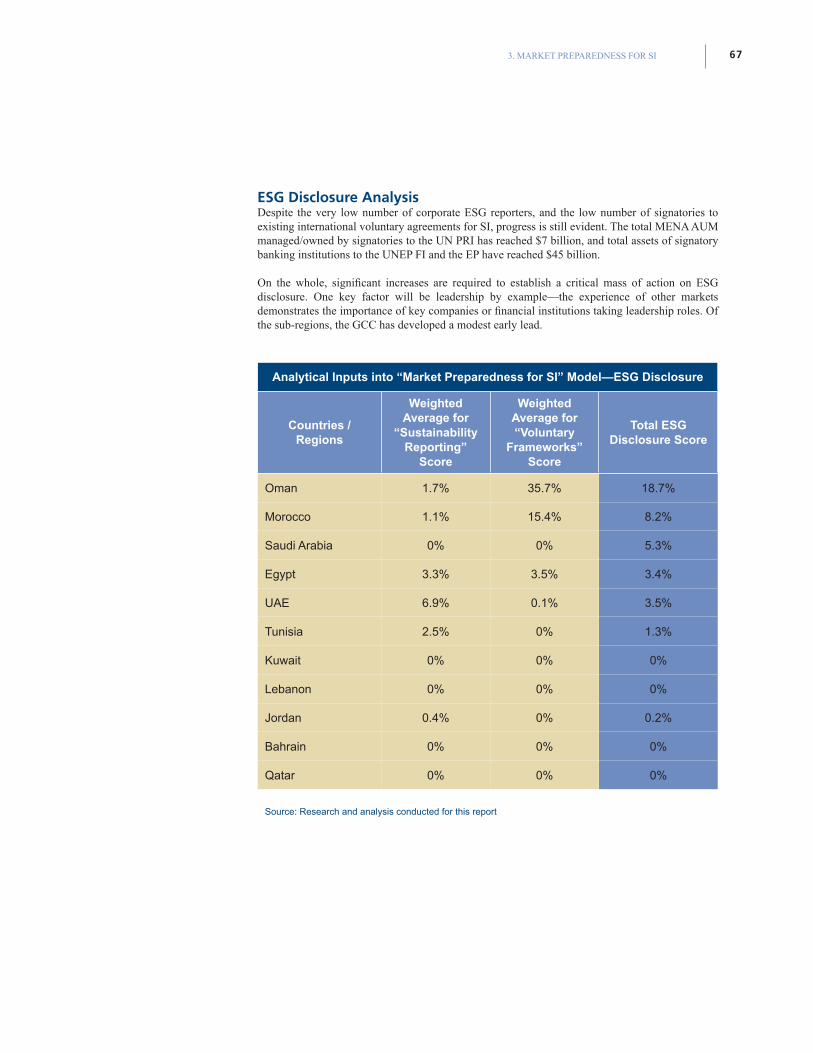
3. MARKET PREPAREDNESS FOR SI 67
ESG Disclosure AnalysisDespite the very low number of corporate ESG reporters, and the low number of signatories to existing international voluntary agreements for SI, progress is still evident. The total MENA AUM managed/owned by signatories to the UN PRI has reached $7 billion, and total assets of signatory banking institutions to the UNEP FI and the EP have reached $45 billion.
On the whole, significant increases are required to establish a critical mass of action on ESG disclosure. One key factor will be leadership by example—the experience of other markets demonstrates the importance of key companies or financial institutions taking leadership roles. Of the sub-regions, the GCC has developed a modest early lead.
Analytical Inputs into “Market Preparedness for SI” Model—ESG Disclosure
Countries / Regions
Weighted Average for
“Sustainability Reporting”
Score
Weighted Average for “Voluntary
Frameworks” Score
Total ESG Disclosure Score
Oman 1.7% 35.7% 18.7%
Morocco 1.1% 15.4% 8.2%
Saudi Arabia 0% 0% 5.3%
Egypt 3.3% 3.5% 3.4%
UAE 6.9% 0.1% 3.5%
Tunisia 2.5% 0% 1.3%
Kuwait 0% 0% 0%
Lebanon 0% 0% 0%
Jordan 0.4% 0% 0.2%
Bahrain 0% 0% 0%
Qatar 0% 0% 0%
Source: Research and analysis conducted for this report
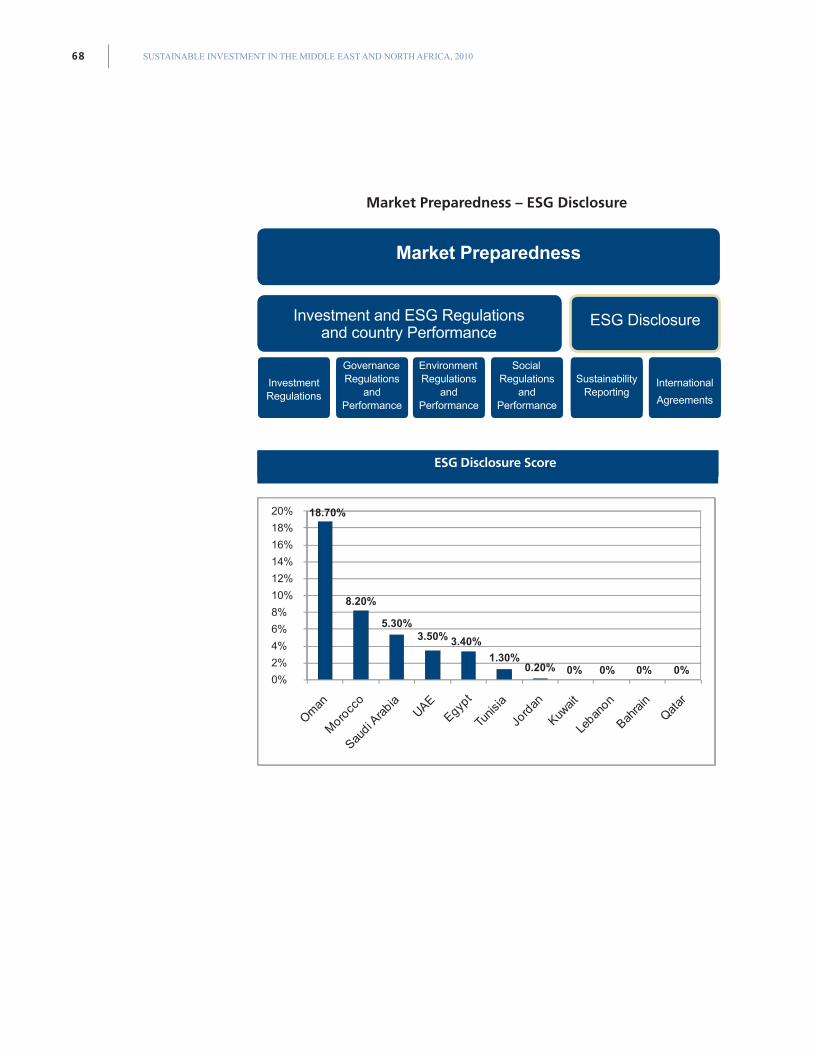
SUSTAINABLE INVESTMENT IN THE MIDDLE EAST AND NORTH AFRICA, 201068
Market Preparedness – ESG Disclosure
ESG Disclosure
Investment Regulations
Environment Regulations
andPerformance
Sustainability Reporting
Governance Regulations
andPerformance
SocialRegulations
andPerformance
International
Agreements
Investment and ESG Regulationsand country Performance
Market Preparedness
20%
18%
16%
14%
12%
10%
8%
6%
4%
2%
0%
18.70%
8.20%
5.30%3.50% 3.40%
1.30%0.20% 0% 0% 0% 0%
ESG Disclosure Score
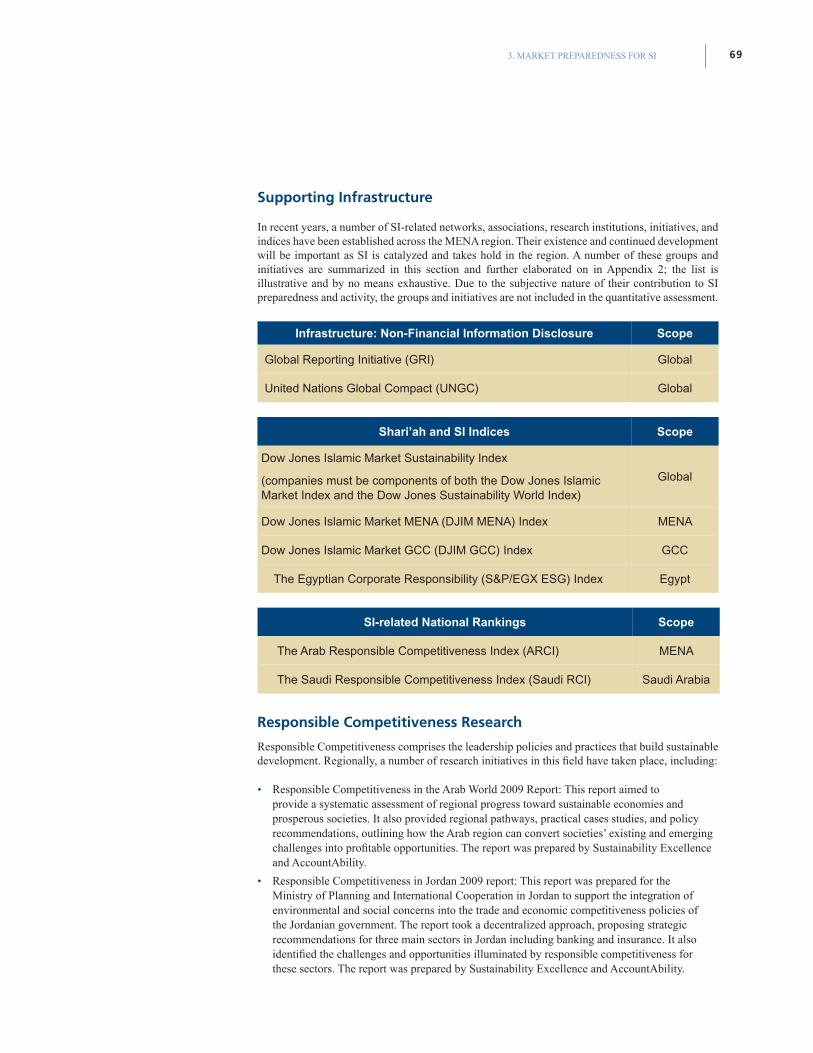
3. MARKET PREPAREDNESS FOR SI 69
Supporting Infrastructure
In recent years, a number of SI-related networks, associations, research institutions, initiatives, and indices have been established across the MENA region. Their existence and continued development will be important as SI is catalyzed and takes hold in the region. A number of these groups and initiatives are summarized in this section and further elaborated on in Appendix 2; the list is illustrative and by no means exhaustive. Due to the subjective nature of their contribution to SI preparedness and activity, the groups and initiatives are not included in the quantitative assessment.
Infrastructure: Non-Financial Information Disclosure Scope
Global Reporting Initiative (GRI) Global
United Nations Global Compact (UNGC) Global
Shari’ah and SI Indices Scope
Dow Jones Islamic Market Sustainability Index
(companies must be components of both the Dow Jones Islamic Market Index and the Dow Jones Sustainability World Index)
Global
Dow Jones Islamic Market MENA (DJIM MENA) Index MENA
Dow Jones Islamic Market GCC (DJIM GCC) Index GCC
The Egyptian Corporate Responsibility (S&P/EGX ESG) Index Egypt
SI-related National Rankings Scope
The Arab Responsible Competitiveness Index (ARCI) MENA
The Saudi Responsible Competitiveness Index (Saudi RCI) Saudi Arabia
Responsible Competitiveness Research
Responsible Competitiveness comprises the leadership policies and practices that build sustainable development. Regionally, a number of research initiatives in this field have taken place, including:
• Responsible Competitiveness in the Arab World 2009 Report: This report aimed to provide a systematic assessment of regional progress toward sustainable economies and prosperous societies. It also provided regional pathways, practical cases studies, and policy recommendations, outlining how the Arab region can convert societies’ existing and emerging challenges into profitable opportunities. The report was prepared by Sustainability Excellence and AccountAbility.
• Responsible Competitiveness in Jordan 2009 report: This report was prepared for the Ministry of Planning and International Cooperation in Jordan to support the integration of environmental and social concerns into the trade and economic competitiveness policies of the Jordanian government. The report took a decentralized approach, proposing strategic recommendations for three main sectors in Jordan including banking and insurance. It also identified the challenges and opportunities illuminated by responsible competitiveness for these sectors. The report was prepared by Sustainability Excellence and AccountAbility.
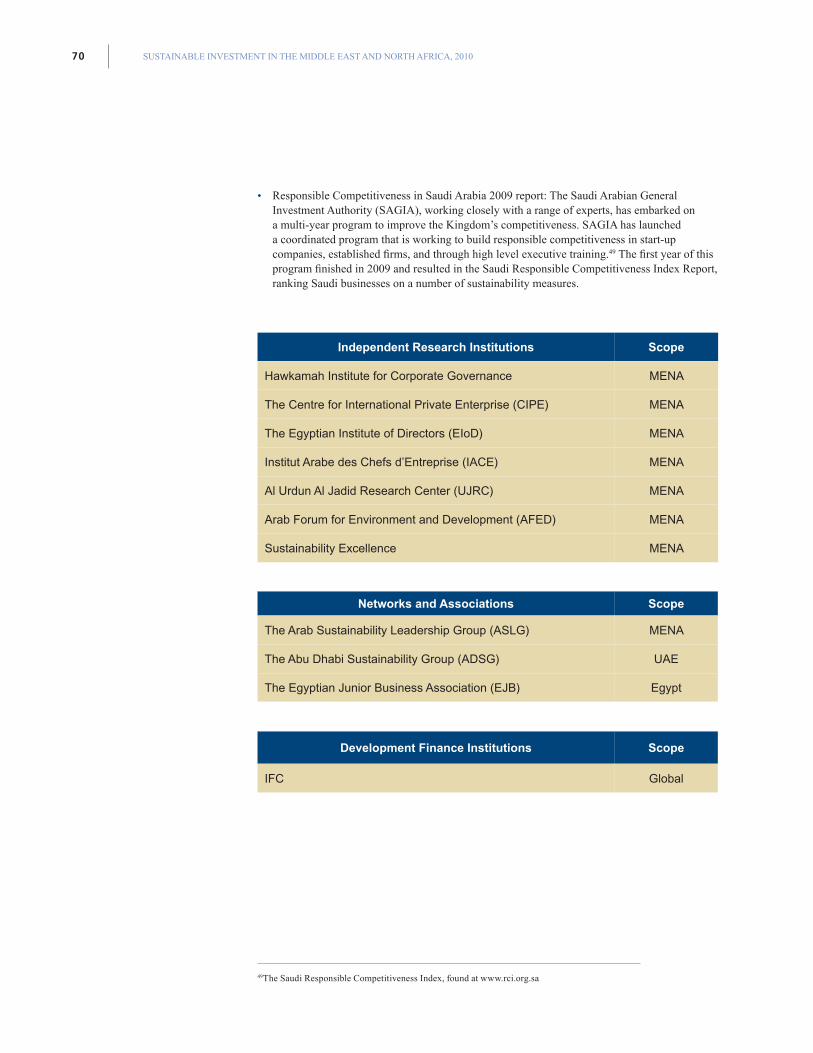
SUSTAINABLE INVESTMENT IN THE MIDDLE EAST AND NORTH AFRICA, 201070
• Responsible Competitiveness in Saudi Arabia 2009 report: The Saudi Arabian General Investment Authority (SAGIA), working closely with a range of experts, has embarked on a multi-year program to improve the Kingdom’s competitiveness. SAGIA has launched a coordinated program that is working to build responsible competitiveness in start-up companies, established firms, and through high level executive training.49 The first year of this program finished in 2009 and resulted in the Saudi Responsible Competitiveness Index Report, ranking Saudi businesses on a number of sustainability measures.
Independent Research Institutions Scope
Hawkamah Institute for Corporate Governance MENA
The Centre for International Private Enterprise (CIPE) MENA
The Egyptian Institute of Directors (EIoD) MENA
Institut Arabe des Chefs d’Entreprise (IACE) MENA
Al Urdun Al Jadid Research Center (UJRC) MENA
Arab Forum for Environment and Development (AFED) MENA
Sustainability Excellence MENA
Networks and Associations Scope
The Arab Sustainability Leadership Group (ASLG) MENA
The Abu Dhabi Sustainability Group (ADSG) UAE
The Egyptian Junior Business Association (EJB) Egypt
Development Finance Institutions Scope
IFC Global
49The Saudi Responsible Competitiveness Index, found at www.rci.org.sa
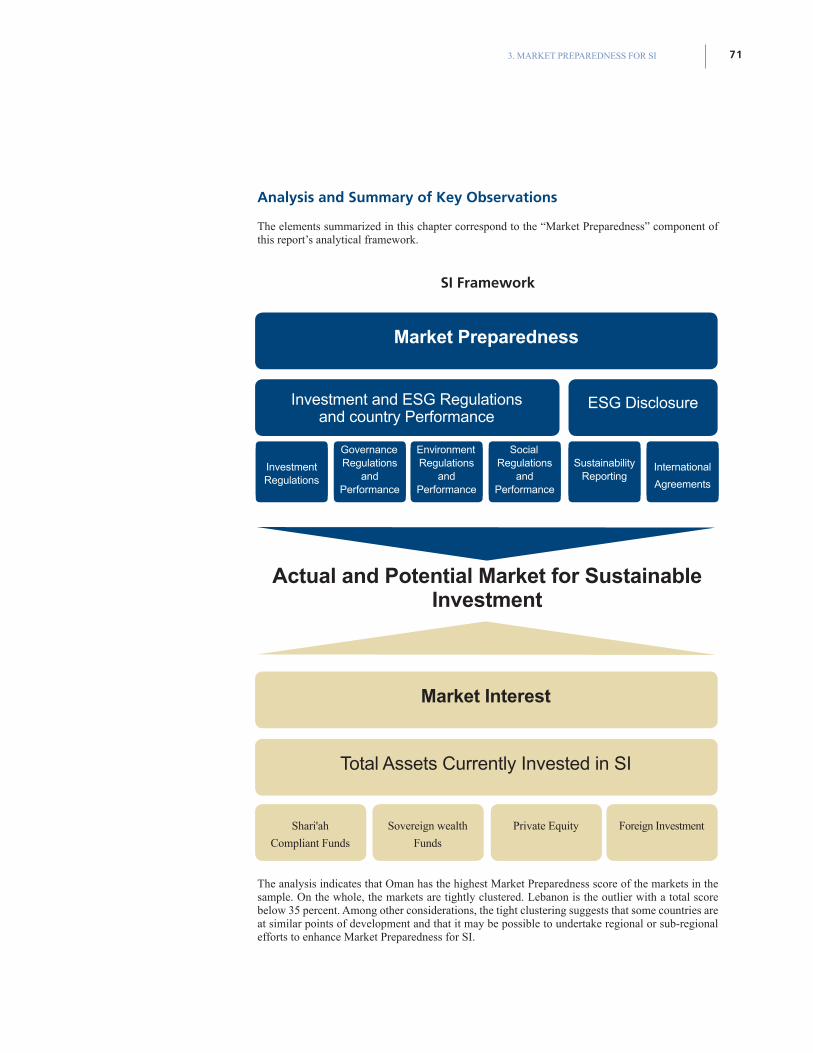
3. MARKET PREPAREDNESS FOR SI 71
Analysis and Summary of Key Observations
The elements summarized in this chapter correspond to the “Market Preparedness” component of this report’s analytical framework.
SI Framework
The analysis indicates that Oman has the highest Market Preparedness score of the markets in the sample. On the whole, the markets are tightly clustered. Lebanon is the outlier with a total score below 35 percent. Among other considerations, the tight clustering suggests that some countries are at similar points of development and that it may be possible to undertake regional or sub-regional efforts to enhance Market Preparedness for SI.
Market Interest
Total Assets Currently Invested in SI
Shari'ah
Compliant Funds
Sovereign wealth
Funds
Private Equity Foreign Investment
ESG Disclosure
Investment Regulations
Environment Regulations
andPerformance
Sustainability Reporting
Governance Regulations
andPerformance
SocialRegulations
andPerformance
International
Agreements
Investment and ESG Regulationsand country Performance
Market Preparedness
Actual and Potential Market for Sustainable Investment
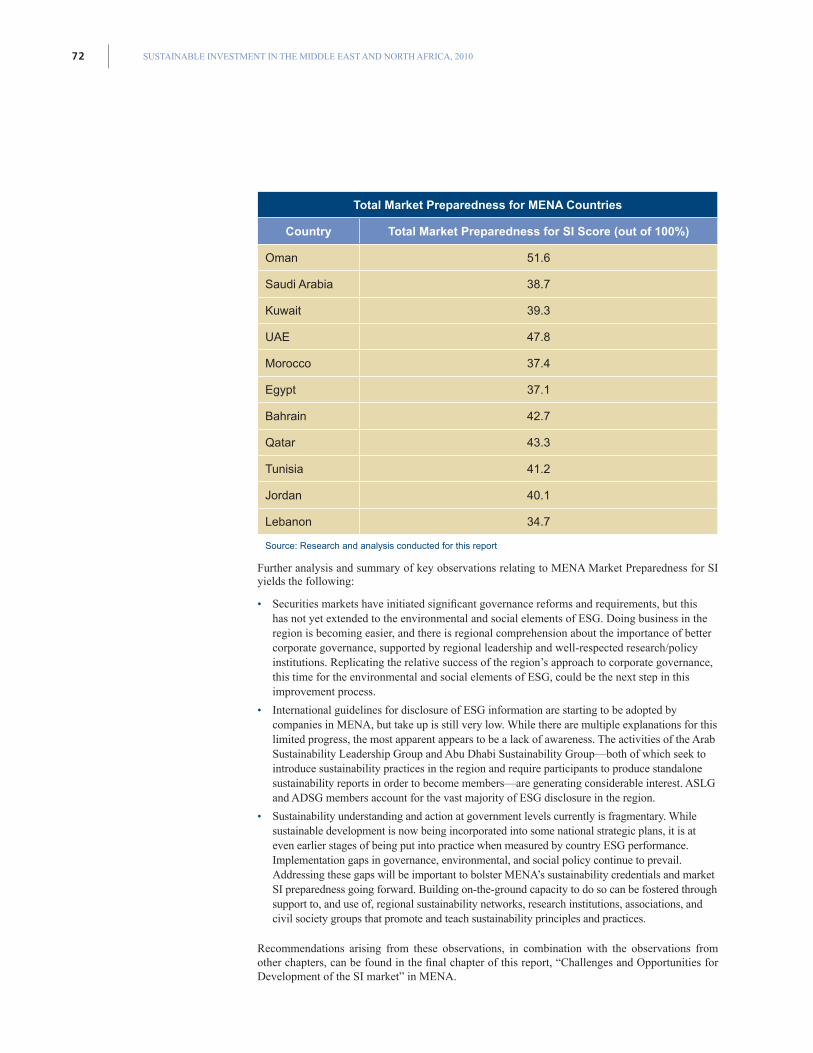
SUSTAINABLE INVESTMENT IN THE MIDDLE EAST AND NORTH AFRICA, 201072
Total Market Preparedness for MENA Countries
Country Total Market Preparedness for SI Score (out of 100%)
Oman 51.6
Saudi Arabia 38.7
Kuwait 39.3
UAE 47.8
Morocco 37.4
Egypt 37.1
Bahrain 42.7
Qatar 43.3
Tunisia 41.2
Jordan 40.1
Lebanon 34.7
Source: Research and analysis conducted for this report
Further analysis and summary of key observations relating to MENA Market Preparedness for SI yields the following:
• Securities markets have initiated significant governance reforms and requirements, but this has not yet extended to the environmental and social elements of ESG. Doing business in the region is becoming easier, and there is regional comprehension about the importance of better corporate governance, supported by regional leadership and well-respected research/policy institutions. Replicating the relative success of the region’s approach to corporate governance, this time for the environmental and social elements of ESG, could be the next step in this improvement process.
• International guidelines for disclosure of ESG information are starting to be adopted by companies in MENA, but take up is still very low. While there are multiple explanations for this limited progress, the most apparent appears to be a lack of awareness. The activities of the Arab Sustainability Leadership Group and Abu Dhabi Sustainability Group—both of which seek to introduce sustainability practices in the region and require participants to produce standalone sustainability reports in order to become members—are generating considerable interest. ASLG and ADSG members account for the vast majority of ESG disclosure in the region.
• Sustainability understanding and action at government levels currently is fragmentary. While sustainable development is now being incorporated into some national strategic plans, it is at even earlier stages of being put into practice when measured by country ESG performance. Implementation gaps in governance, environmental, and social policy continue to prevail. Addressing these gaps will be important to bolster MENA’s sustainability credentials and market SI preparedness going forward. Building on-the-ground capacity to do so can be fostered through support to, and use of, regional sustainability networks, research institutions, associations, and civil society groups that promote and teach sustainability principles and practices.
Recommendations arising from these observations, in combination with the observations from other chapters, can be found in the final chapter of this report, “Challenges and Opportunities for Development of the SI market” in MENA.
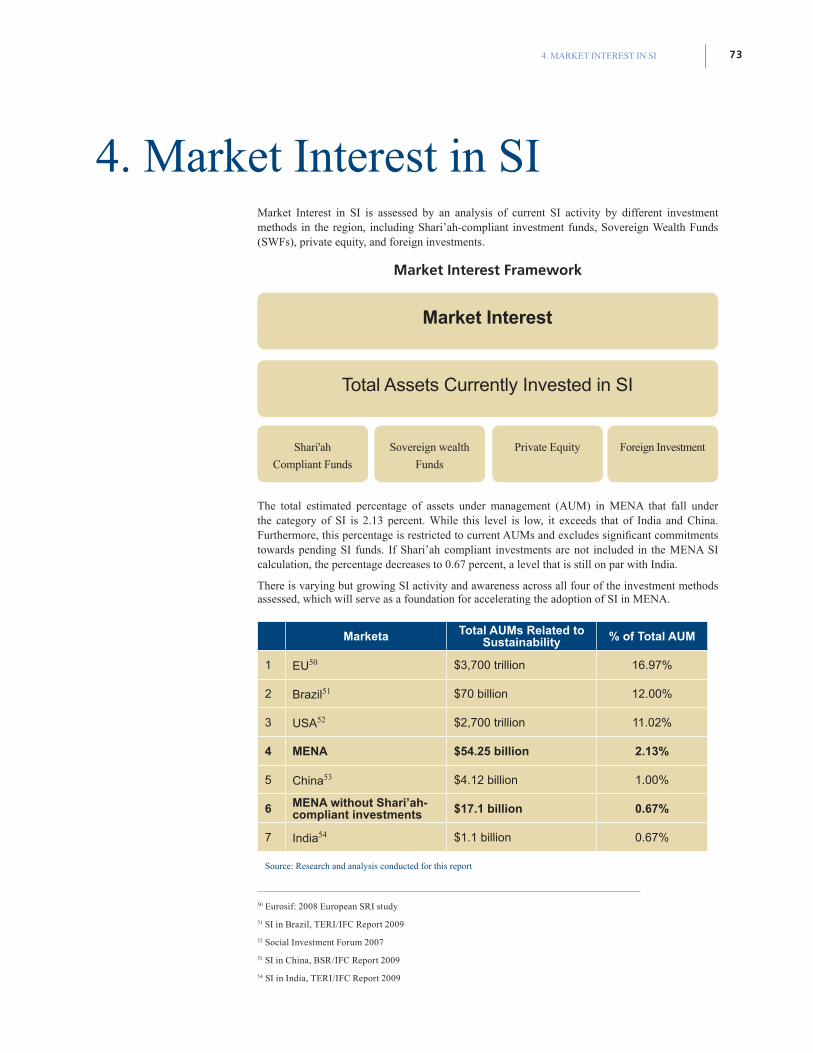
734. MARKET INTEREST IN SI
Market Interest in SI is assessed by an analysis of current SI activity by different investment methods in the region, including Shari’ah-compliant investment funds, Sovereign Wealth Funds (SWFs), private equity, and foreign investments.
Market Interest Framework
The total estimated percentage of assets under management (AUM) in MENA that fall under the category of SI is 2.13 percent. While this level is low, it exceeds that of India and China. Furthermore, this percentage is restricted to current AUMs and excludes significant commitments towards pending SI funds. If Shari’ah compliant investments are not included in the MENA SI calculation, the percentage decreases to 0.67 percent, a level that is still on par with India.
There is varying but growing SI activity and awareness across all four of the investment methods assessed, which will serve as a foundation for accelerating the adoption of SI in MENA.5051525354
Marketa Total AUMs Related to Sustainability % of Total AUM
1 EU50 $3,700 trillion 16.97%
2 Brazil51 $70 billion 12.00%
3 USA52 $2,700 trillion 11.02%
4 MENA $54.25 billion 2.13%
5 China53 $4.12 billion 1.00%
6 MENA without Shari’ah- compliant investments $17.1 billion 0.67%
7 India54 $1.1 billion 0.67%
Source: Research and analysis conducted for this report
50 Eurosif: 2008 European SRI study
51 SI in Brazil, TERI/IFC Report 2009
52 Social Investment Forum 2007
53 SI in China, BSR/IFC Report 2009
54 SI in India, TERI/IFC Report 2009
4. Market Interest in SI
Market Interest
Total Assets Currently Invested in SI
Shari'ah
Compliant Funds
Sovereign wealth
Funds
Private Equity Foreign Investment
SUSTAINABLE INVESTMENT IN THE MIDDLE EAST AND NORTH AFRICA, 201074
Of these opportunities, the most widely practiced SI activity in the region is Shari’ah-compliant investing. Shari’ah-compliant investing is the highest contributor to the region’s SI AUM, the most widely adopted in terms of the number of engaged investors, and is prevalent across the MENA region. As such, it represents a potential stepping stone for advancing investor interest in SI. While Shari’ah compliant investors may not necessarily take an interest in broader SI, their commitment to Islamic ideals and general interest in betterment of society has the potential to translate into growing support for SI.
Perhaps the highest leverage opportunity for SI in the region relates to the SWFs, which represent 60 percent of the MENA AUMs covered by this study (although they are only in the GCC). As more and more GCC countries specifically re-evaluate national strategies from a sustainability perspective and explicitly incorporate sustainable development into those strategies, many of the SWFs will likely incorporate elements of sustainability screening into their domestic investment decision-making. The region’s most dynamic evidence of this emerging trend is the investment by Abu Dhabi’s Mubadala SWF in Masdar, an initiative to establish Abu Dhabi as a world leader in renewable energy and sustainable urban design. There is also a self-interest business case for SWF’s to incorporate SI into their international investment strategies. As these SWF’s have sought to expand international investments, they have encountered some concerns in target markets about their investment intentions. An SI strategy can reduce concerns and facilitate ease of investment while allowing for effective projection of soft power on the international stage.
MENA private equity (PE) also is taking a growing interest in SI. This is in part due to recognition of the added risk-mitigation benefits of SI-screening, the potential benefits of sustainability management by portfolio companies, and emerging clean technology investment opportunities in sectors such as water management. The region’s largest private equity company, Abraaj Capital, which managed 20 percent of the region’s PE funds in 2008,55 has taken a leadership role through the development of its Ethical Framework for Investments and other SI-related activity and governance leadership. Abraaj’s leadership is a catalyst for SI implementation by the PE sector in the region.
The other major catalyst for the take-up of SI by the PE sector is the role of foreign investment and financing. Of the PE funds that incorporate SI, nearly half do so as a result of the involvement of the World Bank’s IFC on major projects. The percentage of total FDI into the MENA region that incorporates SI is estimated at 2.12 percent, thereby pulling up the overall regional average percentage of SI AUM for the region.
55INSEAD/ Booz&Company, 2010, Private Equity in the Middle East: A Rising Contender in Emerging Markets.
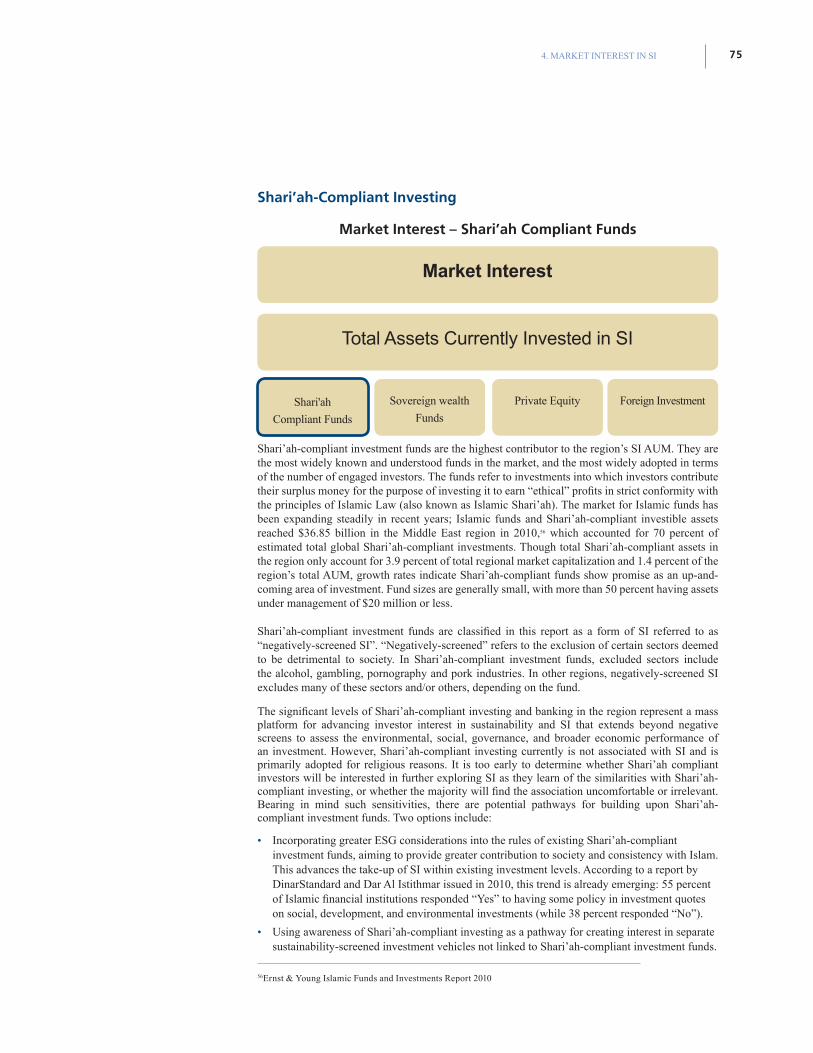
754. MARKET INTEREST IN SI
Shari’ah-Compliant Investing
Market Interest – Shari’ah Compliant Funds
Shari’ah-compliant investment funds are the highest contributor to the region’s SI AUM. They are the most widely known and understood funds in the market, and the most widely adopted in terms of the number of engaged investors. The funds refer to investments into which investors contribute their surplus money for the purpose of investing it to earn “ethical” profits in strict conformity with the principles of Islamic Law (also known as Islamic Shari’ah). The market for Islamic funds has been expanding steadily in recent years; Islamic funds and Shari’ah-compliant investible assets reached $36.85 billion in the Middle East region in 2010,56 which accounted for 70 percent of estimated total global Shari’ah-compliant investments. Though total Shari’ah-compliant assets in the region only account for 3.9 percent of total regional market capitalization and 1.4 percent of the region’s total AUM, growth rates indicate Shari’ah-compliant funds show promise as an up-and-coming area of investment. Fund sizes are generally small, with more than 50 percent having assets under management of $20 million or less.
Shari’ah-compliant investment funds are classified in this report as a form of SI referred to as “negatively-screened SI”. “Negatively-screened” refers to the exclusion of certain sectors deemed to be detrimental to society. In Shari’ah-compliant investment funds, excluded sectors include the alcohol, gambling, pornography and pork industries. In other regions, negatively-screened SI excludes many of these sectors and/or others, depending on the fund.
The significant levels of Shari’ah-compliant investing and banking in the region represent a mass platform for advancing investor interest in sustainability and SI that extends beyond negative screens to assess the environmental, social, governance, and broader economic performance of an investment. However, Shari’ah-compliant investing currently is not associated with SI and is primarily adopted for religious reasons. It is too early to determine whether Shari’ah compliant investors will be interested in further exploring SI as they learn of the similarities with Shari’ah-compliant investing, or whether the majority will find the association uncomfortable or irrelevant. Bearing in mind such sensitivities, there are potential pathways for building upon Shari’ah-compliant investment funds. Two options include:
• Incorporating greater ESG considerations into the rules of existing Shari’ah-compliant investment funds, aiming to provide greater contribution to society and consistency with Islam. This advances the take-up of SI within existing investment levels. According to a report by DinarStandard and Dar Al Istithmar issued in 2010, this trend is already emerging: 55 percent of Islamic financial institutions responded “Yes” to having some policy in investment quotes on social, development, and environmental investments (while 38 percent responded “No”).
• Using awareness of Shari’ah-compliant investing as a pathway for creating interest in separate sustainability-screened investment vehicles not linked to Shari’ah-compliant investment funds.
56Ernst & Young Islamic Funds and Investments Report 2010
Market Interest
Total Assets Currently Invested in SI
Shari'ah
Compliant Funds
Sovereign wealth
Funds
Private Equity Foreign Investment
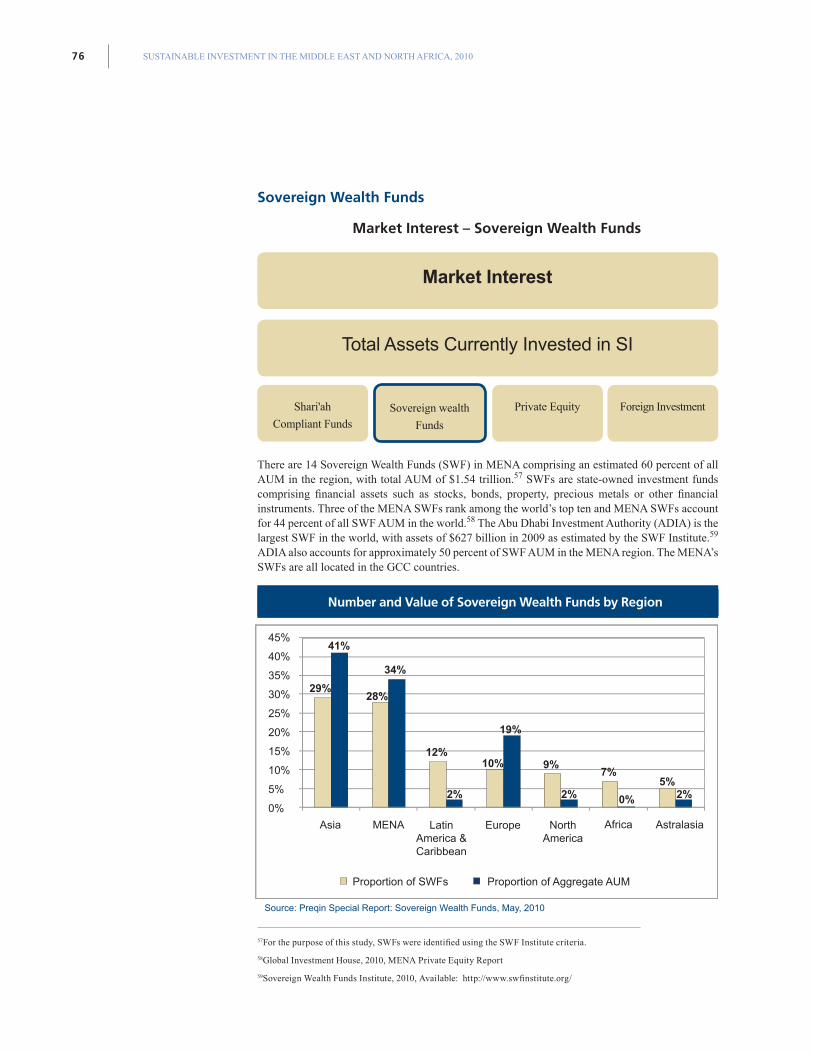
SUSTAINABLE INVESTMENT IN THE MIDDLE EAST AND NORTH AFRICA, 201076
Sovereign Wealth Funds
Market Interest – Sovereign Wealth Funds
There are 14 Sovereign Wealth Funds (SWF) in MENA comprising an estimated 60 percent of all AUM in the region, with total AUM of $1.54 trillion.57 SWFs are state-owned investment funds comprising financial assets such as stocks, bonds, property, precious metals or other financial instruments. Three of the MENA SWFs rank among the world’s top ten and MENA SWFs account for 44 percent of all SWF AUM in the world.58 The Abu Dhabi Investment Authority (ADIA) is the largest SWF in the world, with assets of $627 billion in 2009 as estimated by the SWF Institute.59 ADIA also accounts for approximately 50 percent of SWF AUM in the MENA region. The MENA’s SWFs are all located in the GCC countries.
Source: Preqin Special Report: Sovereign Wealth Funds, May, 2010
57For the purpose of this study, SWFs were identified using the SWF Institute criteria.
58Global Investment House, 2010, MENA Private Equity Report
59Sovereign Wealth Funds Institute, 2010, Available: http://www.swfinstitute.org/
Market Interest
Total Assets Currently Invested in SI
Shari'ah
Compliant FundsSovereign wealth
Funds
Private Equity Foreign Investment
45%
40%
35%
30%
25%
20%
15%
10%
5%
0%
29%
41%
28%
34%
12%10%
19%
9%7%
5%
0%2% 2%2%
Asia MENA
Proportion of SWFs Proportion of Aggregate AUM
Europe NorthAmerica
Africa AstralasiaLatinAmerica &Caribbean
Number and Value of Sovereign Wealth Funds by Region
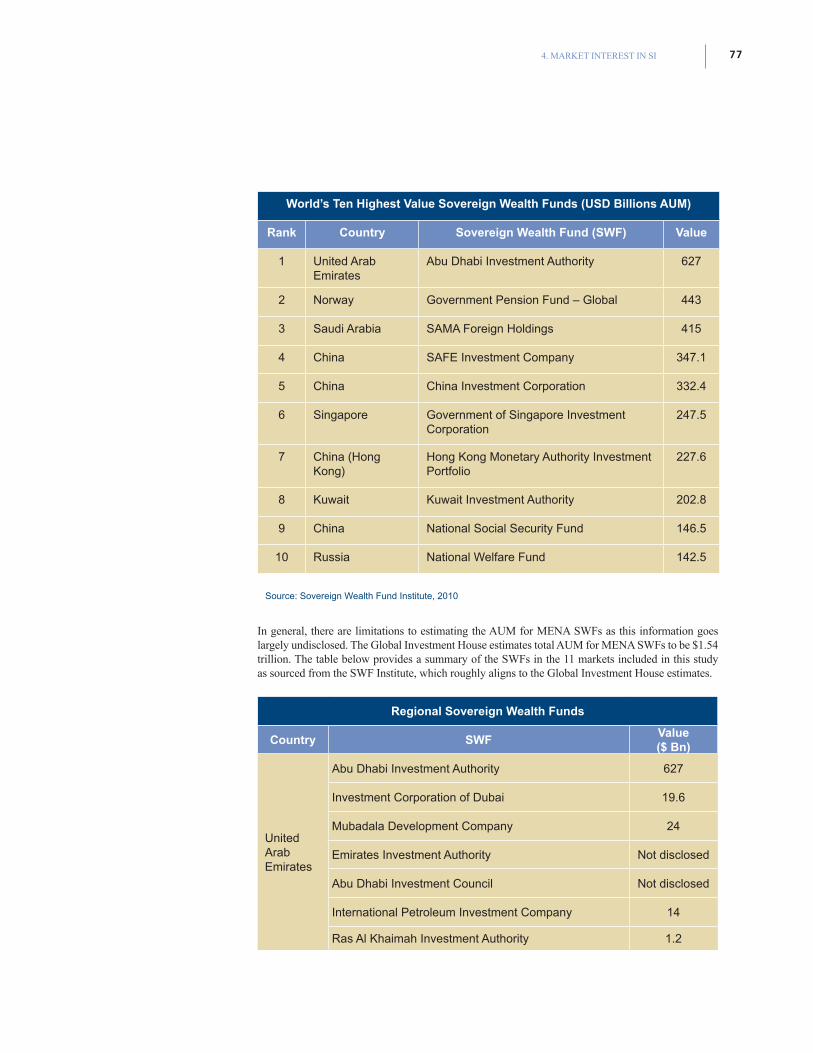
774. MARKET INTEREST IN SI
World’s Ten Highest Value Sovereign Wealth Funds (USD Billions AUM)
Rank Country Sovereign Wealth Fund (SWF) Value
1 United Arab Emirates
Abu Dhabi Investment Authority 627
2 Norway Government Pension Fund – Global 443
3 Saudi Arabia SAMA Foreign Holdings 415
4 China SAFE Investment Company 347.1
5 China China Investment Corporation 332.4
6 Singapore Government of Singapore Investment Corporation
247.5
7 China (Hong Kong)
Hong Kong Monetary Authority Investment Portfolio
227.6
8 Kuwait Kuwait Investment Authority 202.8
9 China National Social Security Fund 146.5
10 Russia National Welfare Fund 142.5
Source: Sovereign Wealth Fund Institute, 2010
In general, there are limitations to estimating the AUM for MENA SWFs as this information goes largely undisclosed. The Global Investment House estimates total AUM for MENA SWFs to be $1.54 trillion. The table below provides a summary of the SWFs in the 11 markets included in this study as sourced from the SWF Institute, which roughly aligns to the Global Investment House estimates.
Regional Sovereign Wealth Funds
Country SWFValue ($ Bn)
United Arab Emirates
Abu Dhabi Investment Authority 627
Investment Corporation of Dubai 19.6
Mubadala Development Company 24
Emirates Investment Authority Not disclosed
Abu Dhabi Investment Council Not disclosed
International Petroleum Investment Company 14
Ras Al Khaimah Investment Authority 1.2
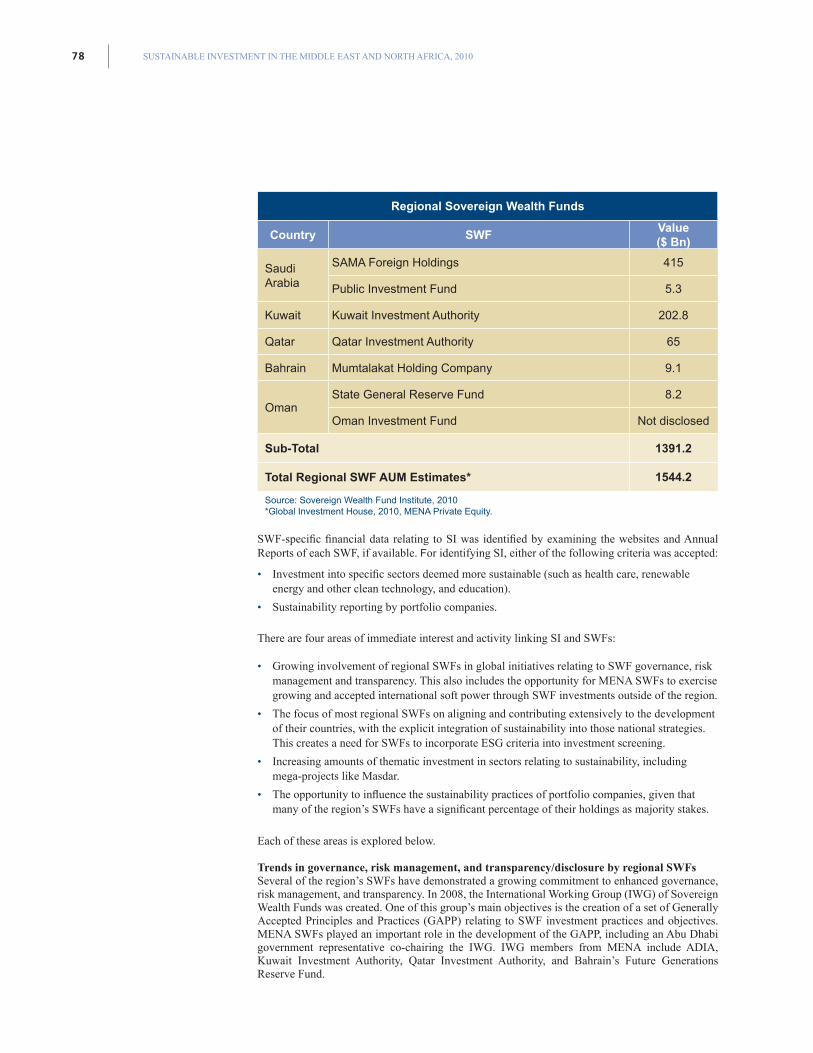
SUSTAINABLE INVESTMENT IN THE MIDDLE EAST AND NORTH AFRICA, 201078
Regional Sovereign Wealth Funds
Country SWFValue ($ Bn)
Saudi Arabia
SAMA Foreign Holdings 415
Public Investment Fund 5.3
Kuwait Kuwait Investment Authority 202.8
Qatar Qatar Investment Authority 65
Bahrain Mumtalakat Holding Company 9.1
OmanState General Reserve Fund 8.2
Oman Investment Fund Not disclosed
Sub-Total 1391.2
Total Regional SWF AUM Estimates* 1544.2
Source: Sovereign Wealth Fund Institute, 2010*Global Investment House, 2010, MENA Private Equity.
SWF-specific financial data relating to SI was identified by examining the websites and Annual Reports of each SWF, if available. For identifying SI, either of the following criteria was accepted:
• Investment into specific sectors deemed more sustainable (such as health care, renewable energy and other clean technology, and education).
• Sustainability reporting by portfolio companies.
There are four areas of immediate interest and activity linking SI and SWFs:
• Growing involvement of regional SWFs in global initiatives relating to SWF governance, risk management and transparency. This also includes the opportunity for MENA SWFs to exercise growing and accepted international soft power through SWF investments outside of the region.
• The focus of most regional SWFs on aligning and contributing extensively to the development of their countries, with the explicit integration of sustainability into those national strategies. This creates a need for SWFs to incorporate ESG criteria into investment screening.
• Increasing amounts of thematic investment in sectors relating to sustainability, including mega-projects like Masdar.
• The opportunity to influence the sustainability practices of portfolio companies, given that many of the region’s SWFs have a significant percentage of their holdings as majority stakes.
Each of these areas is explored below.
Trends in governance, risk management, and transparency/disclosure by regional SWFs Several of the region’s SWFs have demonstrated a growing commitment to enhanced governance, risk management, and transparency. In 2008, the International Working Group (IWG) of Sovereign Wealth Funds was created. One of this group’s main objectives is the creation of a set of Generally Accepted Principles and Practices (GAPP) relating to SWF investment practices and objectives. MENA SWFs played an important role in the development of the GAPP, including an Abu Dhabi government representative co-chairing the IWG. IWG members from MENA include ADIA, Kuwait Investment Authority, Qatar Investment Authority, and Bahrain’s Future Generations Reserve Fund.
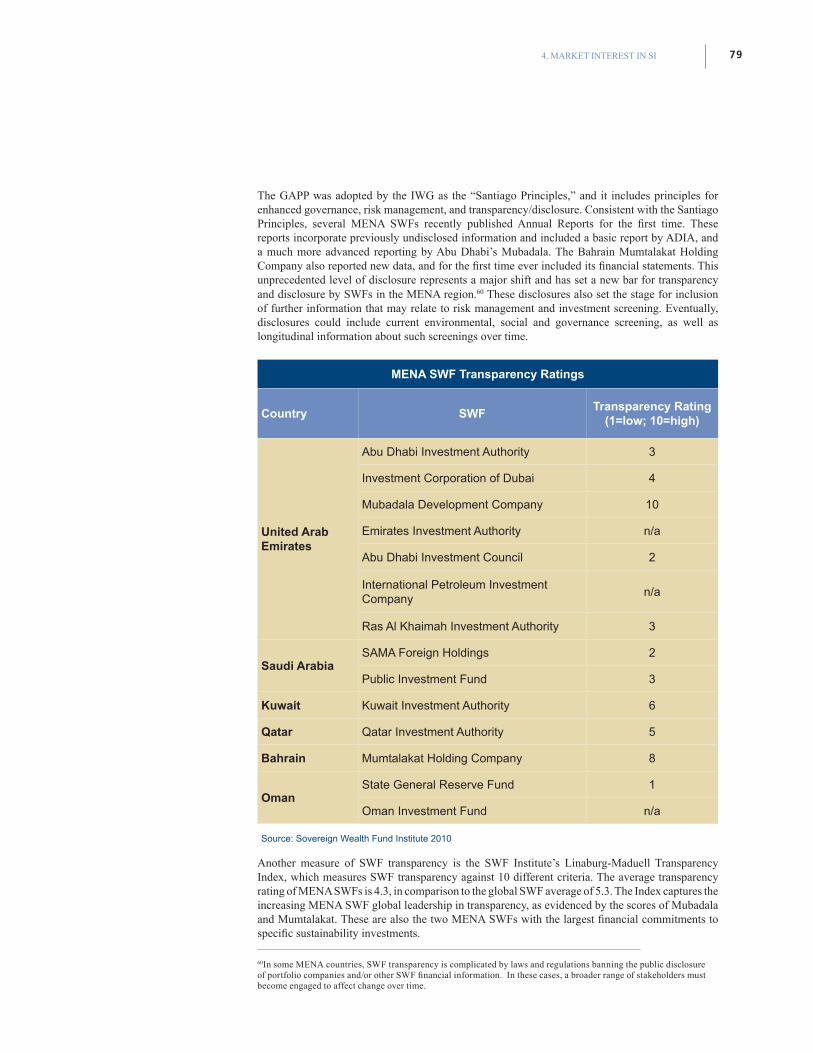
794. MARKET INTEREST IN SI
The GAPP was adopted by the IWG as the “Santiago Principles,” and it includes principles for enhanced governance, risk management, and transparency/disclosure. Consistent with the Santiago Principles, several MENA SWFs recently published Annual Reports for the first time. These reports incorporate previously undisclosed information and included a basic report by ADIA, and a much more advanced reporting by Abu Dhabi’s Mubadala. The Bahrain Mumtalakat Holding Company also reported new data, and for the first time ever included its financial statements. This unprecedented level of disclosure represents a major shift and has set a new bar for transparency and disclosure by SWFs in the MENA region.60 These disclosures also set the stage for inclusion of further information that may relate to risk management and investment screening. Eventually, disclosures could include current environmental, social and governance screening, as well as longitudinal information about such screenings over time.
MENA SWF Transparency Ratings
Country SWFTransparency Rating
(1=low; 10=high)
United Arab Emirates
Abu Dhabi Investment Authority 3
Investment Corporation of Dubai 4
Mubadala Development Company 10
Emirates Investment Authority n/a
Abu Dhabi Investment Council 2
International Petroleum Investment Company
n/a
Ras Al Khaimah Investment Authority 3
Saudi ArabiaSAMA Foreign Holdings 2
Public Investment Fund 3
Kuwait Kuwait Investment Authority 6
Qatar Qatar Investment Authority 5
Bahrain Mumtalakat Holding Company 8
OmanState General Reserve Fund 1
Oman Investment Fund n/a
Source: Sovereign Wealth Fund Institute 2010
Another measure of SWF transparency is the SWF Institute’s Linaburg-Maduell Transparency Index, which measures SWF transparency against 10 different criteria. The average transparency rating of MENA SWFs is 4.3, in comparison to the global SWF average of 5.3. The Index captures the increasing MENA SWF global leadership in transparency, as evidenced by the scores of Mubadala and Mumtalakat. These are also the two MENA SWFs with the largest financial commitments to specific sustainability investments.
60In some MENA countries, SWF transparency is complicated by laws and regulations banning the public disclosure of portfolio companies and/or other SWF financial information. In these cases, a broader range of stakeholders must become engaged to affect change over time.
SUSTAINABLE INVESTMENT IN THE MIDDLE EAST AND NORTH AFRICA, 201080
This growing involvement of MENA SWFs on the world stage is aligned with their growing importance in the global economy. As these SWF’s have sought to expand international investments, or as outside markets have sought MENA SWF funds, they have encountered some concerns in target markets about investment intentions. For example, a paper published in 2008, prepared for members and committees of the U.S. Congress, focused on SWFs and their investment in the U.S. The document indicated that for policy makers, dealings with SWFs raise two broad policy concerns: Their lack of transparency from the U.S. perspective, and their possible misuse for political or other non-commercial goals. Therefore, incorporating SI into international investment strategies is a means for MENA SWFs to reduce these concerns and facilitate ease of investment by providing greater clarity of investment criteria, investment stewardship, and transparency. This is not in any way a capitulation to Western demands, but rather an attempt to trade acceptable and value-enhancing sustainability-related modifications to an investment strategy in exchange for increased projection of soft power by MENA SWFs on the international stage.
Alignment with national sustainable development strategiesAt the domestic level, many of the regional SWFs emphasize their responsibilities for contributing to society’s development through alignment with economic and other national strategies. Many GCC countries have now developed or are developing long-term (e.g. 2030) strategies. In most cases, these plans are economic strategies, but more recently these are being expanded into broader strategies that incorporate environmental or social elements such as low-carbon competitiveness, and/or even broader sustainable development plans. Abu Dhabi, for example, recently conducted a review of its overall sustainability performance across the entire government.
SWFs, given their mandate, are being called upon to support implementation of these plans. Therefore, as national strategies increasingly incorporate ESG issues, so too do the investments undertaken by SWFs to support these national strategies. SWFs most interested in maximizing economic, environmental and social gains for their societies may choose to enhance their ESG screening to serve this purpose. In short: investment and screening strategies increasingly will factor in SI.
For the time being, this growing SWF focus on national sustainability strategy is not evidenced in any specific and systematic commitment to adopting SI. There are some references that indicate interest, such as Bahrain’s Mumtalakat Holding Company, which claims to support the integration of corporate responsibility into its core business (though the extent to which this may impact portfolio companies is not explained). Additionally, the Qatar Investment Authority claims that it takes ethical considerations seriously when selecting investment opportunities (although, again, the methodology is not further elaborated on). None of the MENA SWFs have signed on to the UN Principles for Responsible Investment or other similar global initiatives or guidelines. It is also for this reason that this report’s quantitative assessment of SI activity by MENA SWFs did not assess each SWF as a whole but instead reviewed the specific investments and investment activities disclosed by each SWF. For example, the UAE SWF Mubadala was assessed by reviewing 69 of its portfolio companies, of which 17 were found to participate in SI activity.
Thematic investments in sustainabilityFurther to the evolution of national strategies toward sustainable development, several MENA countries with SWFs are exploring economic diversification into more environmentally sustainable industries—in particular renewable energy and sustainable urban development. For the purposes of this study, SWF investments into specific sectors deemed more sustainable (such as health care, renewable energy and other clean technology, and education) were deemed to be SI.
Several MENA SWFs have announced major commitments to these sustainability-oriented sectors. Abu Dhabi’s Mubadala has committed $15 billion to the Masdar Initiative (see Masdar case study). Furthermore, Mubadala has taken stakes in some companies, as well. An example of this is the 0.7 percent stake Mubadala acquired in General Electric (GE) due to interest in GE’s Ecomagination program.
Part of the difficulty in assessing actual SI in the region is the challenge of distinguishing between earmarked versus invested funds. For example, in the case of Mubadala’s $15 billion commitment to the Masdar initiative, the amount currently deployed is not evident. As such, this study, in its calculation of the percentage of AUM that classify as SI, accounts for only the AUM disclosed by Mubadala as being held under “renewable energy”. In terms of sector-oriented investments,
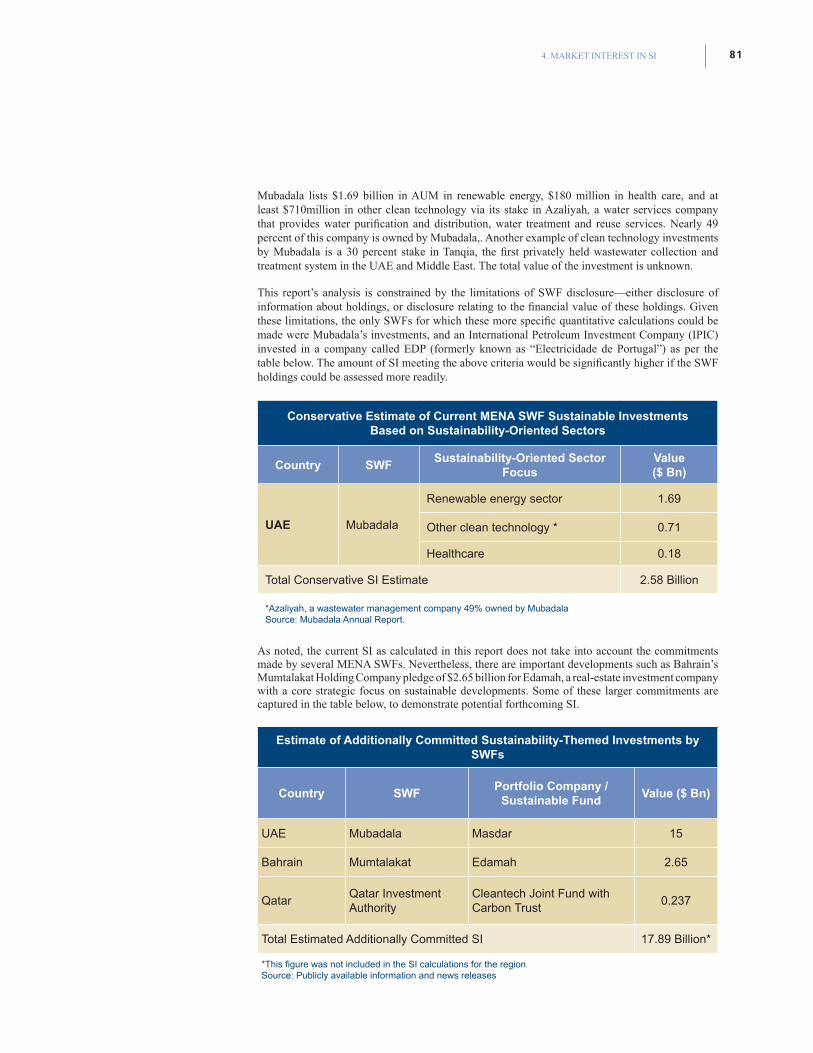
814. MARKET INTEREST IN SI
Mubadala lists $1.69 billion in AUM in renewable energy, $180 million in health care, and at least $710million in other clean technology via its stake in Azaliyah, a water services company that provides water purification and distribution, water treatment and reuse services. Nearly 49 percent of this company is owned by Mubadala,. Another example of clean technology investments by Mubadala is a 30 percent stake in Tanqia, the first privately held wastewater collection and treatment system in the UAE and Middle East. The total value of the investment is unknown.
This report’s analysis is constrained by the limitations of SWF disclosure—either disclosure of information about holdings, or disclosure relating to the financial value of these holdings. Given these limitations, the only SWFs for which these more specific quantitative calculations could be made were Mubadala’s investments, and an International Petroleum Investment Company (IPIC) invested in a company called EDP (formerly known as “Electricidade de Portugal”) as per the table below. The amount of SI meeting the above criteria would be significantly higher if the SWF holdings could be assessed more readily.
Conservative Estimate of Current MENA SWF Sustainable Investments Based on Sustainability-Oriented Sectors
Country SWFSustainability-Oriented Sector
FocusValue ($ Bn)
UAE Mubadala
Renewable energy sector 1.69
Other clean technology * 0.71
Healthcare 0.18
Total Conservative SI Estimate 2.58 Billion
*Azaliyah, a wastewater management company 49% owned by MubadalaSource: Mubadala Annual Report.
As noted, the current SI as calculated in this report does not take into account the commitments made by several MENA SWFs. Nevertheless, there are important developments such as Bahrain’s Mumtalakat Holding Company pledge of $2.65 billion for Edamah, a real-estate investment company with a core strategic focus on sustainable developments. Some of these larger commitments are captured in the table below, to demonstrate potential forthcoming SI.
Estimate of Additionally Committed Sustainability-Themed Investments by SWFs
Country SWFPortfolio Company /
Sustainable FundValue ($ Bn)
UAE Mubadala Masdar 15
Bahrain Mumtalakat Edamah 2.65
QatarQatar Investment Authority
Cleantech Joint Fund with Carbon Trust
0.237
Total Estimated Additionally Committed SI 17.89 Billion*
*This figure was not included in the SI calculations for the regionSource: Publicly available information and news releases
SUSTAINABLE INVESTMENT IN THE MIDDLE EAST AND NORTH AFRICA, 201082
Extending the analysis beyond available financial information, 140 publicly disclosed MENA SWF portfolio companies were assessed for SI on the basis of two dimensions: (1) the relative sustainability of their respective sectors, and (2) the availability of sustainability reporting for the company.
Of the 140 publicly listed companies reviewed, 22 met the above criteria,61 and 17 of those were within Mubadala’s portfolio, including six healthcare companies, four education companies and seven clean technology companies. Mumtalakat had two investments in sustainable buildings, one in eco-tourism, and one in education. Again, disclosure levels have the most significant effect on these findings.
Case StudyMASDAR, The Abu Dhabi Future Energy Company
Masdar (the Abu Dhabi Future Energy Company) is a multi-faceted company advancing the development, commercialization and deployment of renewable energy solutions and clean technologies. Masdar integrates the full renewable and clean technology lifecycle from research to commercial deployment. The company operates with the aim of creating scalable clean energy solutions.
Masdar consists of three business units and one investment arm:
• Masdar Carbon specializes in developing energy efficiency and clean fossil fuel projects that bring significant reduction in carbon emissions.
• Masdar City is a clean technology cluster being developed on the outskirts of Abu Dhabi that will be powered entirely by renewable energy.
• Masdar Power builds and invests in utility-scale renewable energy power projects.
• Masdar Venture Capital manages the Masdar Clean Tech Funds, a series of diversified venture capital investment vehicles focused on building portfolios of direct investments in clean technology and renewable energy.
In addition, Masdar is associated with the Masdar Institute of Science and Technology, the world’s first graduate-only academic institution focused on research into alternative energies and sustainable technologies. It is also a wholly-owned subsidiary of the Mubadala Development Company.
MASDAR Clean Tech FundRegionally, the most widely publicized fund is the Masdar Clean Tech Fund. This $250 million venture capital investment fund is financed by the Abu Dhabi Future Energy Company, Consensus Business Group, Credit Suisse and Siemens. Masdar aims to invest the capital into two separate areas: $60 million is earmarked for leading funds focusing on cutting-edge clean technology, while the remaining $190 million is reserved for direct investments in companies sourced by the Fund and co-investments alongside fund managers.
MASDAR-GE CooperationIn 2009, Mubadala joined with GE in a joint venture to develop projects throughout the MENA region, with each partner contributing $4 billion to the effort.
Other Clean Tech VenturesIn addition to the above, Masdar/Mubadala made many other pledges toward the different forms of renewable energy and clean tech, including but not limited to:
61Unless the financial values of these holdings were disclosed, they were not included in the SI calculations. They are nonetheless provided to demonstrate the extent of non-quantifiable SI in MENA.
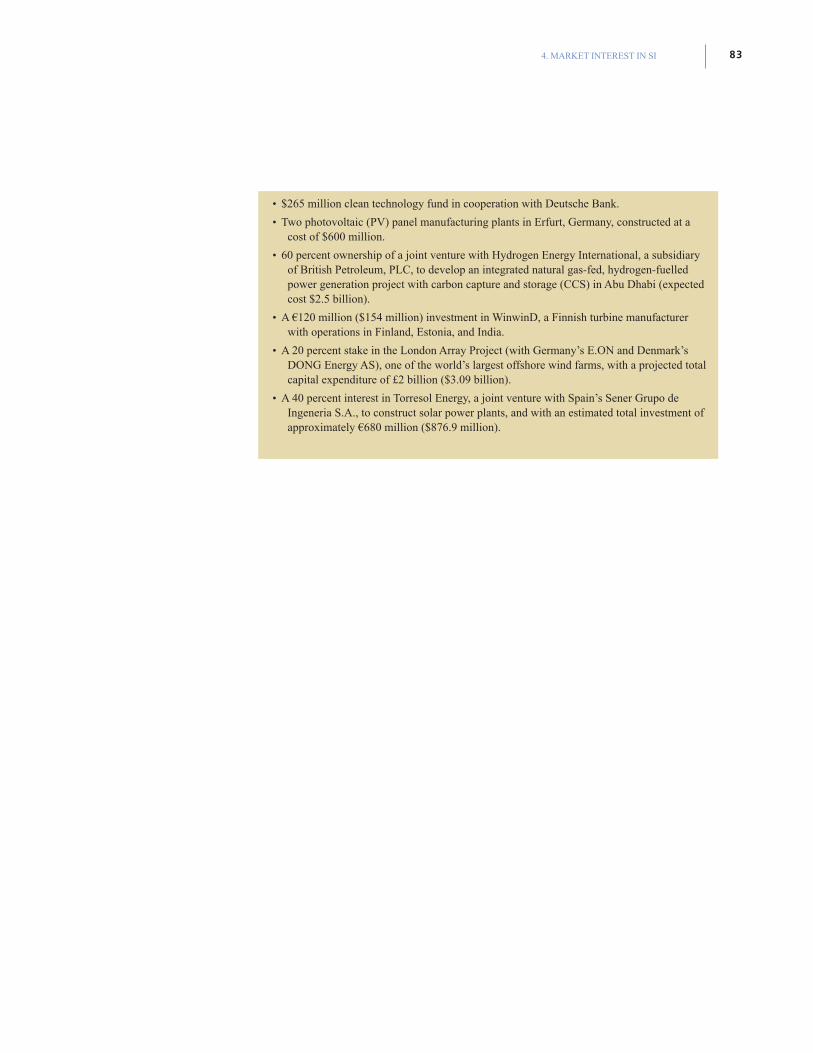
834. MARKET INTEREST IN SI
• $265 million clean technology fund in cooperation with Deutsche Bank.
• Two photovoltaic (PV) panel manufacturing plants in Erfurt, Germany, constructed at a cost of $600 million.
• 60 percent ownership of a joint venture with Hydrogen Energy International, a subsidiary of British Petroleum, PLC, to develop an integrated natural gas-fed, hydrogen-fuelled power generation project with carbon capture and storage (CCS) in Abu Dhabi (expected cost $2.5 billion).
• A €120 million ($154 million) investment in WinwinD, a Finnish turbine manufacturer with operations in Finland, Estonia, and India.
• A 20 percent stake in the London Array Project (with Germany’s E.ON and Denmark’s DONG Energy AS), one of the world’s largest offshore wind farms, with a projected total capital expenditure of £2 billion ($3.09 billion).
• A 40 percent interest in Torresol Energy, a joint venture with Spain’s Sener Grupo de Ingeneria S.A., to construct solar power plants, and with an estimated total investment of approximately €680 million ($876.9 million).
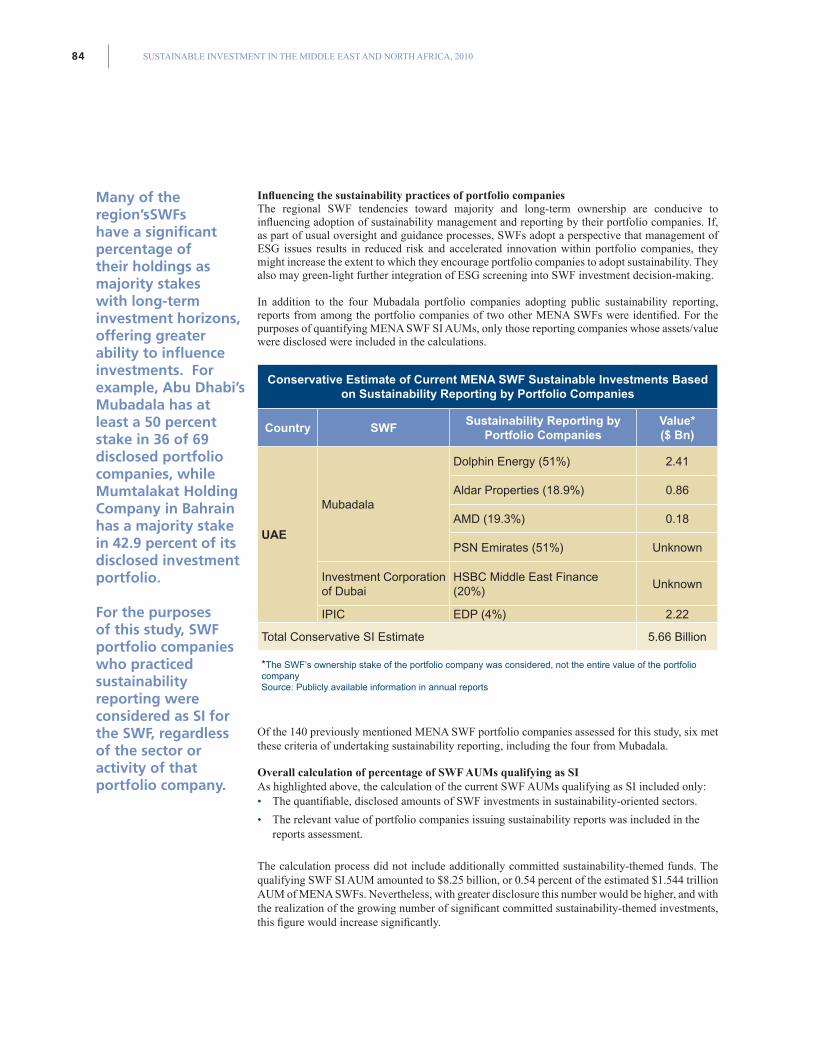
SUSTAINABLE INVESTMENT IN THE MIDDLE EAST AND NORTH AFRICA, 201084
Influencing the sustainability practices of portfolio companiesThe regional SWF tendencies toward majority and long-term ownership are conducive to influencing adoption of sustainability management and reporting by their portfolio companies. If, as part of usual oversight and guidance processes, SWFs adopt a perspective that management of ESG issues results in reduced risk and accelerated innovation within portfolio companies, they might increase the extent to which they encourage portfolio companies to adopt sustainability. They also may green-light further integration of ESG screening into SWF investment decision-making.
In addition to the four Mubadala portfolio companies adopting public sustainability reporting, reports from among the portfolio companies of two other MENA SWFs were identified. For the purposes of quantifying MENA SWF SI AUMs, only those reporting companies whose assets/value were disclosed were included in the calculations.
Conservative Estimate of Current MENA SWF Sustainable Investments Based on Sustainability Reporting by Portfolio Companies
Country SWFSustainability Reporting by
Portfolio CompaniesValue* ($ Bn)
UAE
Mubadala
Dolphin Energy (51%) 2.41
Aldar Properties (18.9%) 0.86
AMD (19.3%) 0.18
PSN Emirates (51%) Unknown
Investment Corporation of Dubai
HSBC Middle East Finance (20%)
Unknown
IPIC EDP (4%) 2.22
Total Conservative SI Estimate 5.66 Billion
*The SWF’s ownership stake of the portfolio company was considered, not the entire value of the portfolio companySource: Publicly available information in annual reports
Of the 140 previously mentioned MENA SWF portfolio companies assessed for this study, six met these criteria of undertaking sustainability reporting, including the four from Mubadala.
Overall calculation of percentage of SWF AUMs qualifying as SIAs highlighted above, the calculation of the current SWF AUMs qualifying as SI included only: • The quantifiable, disclosed amounts of SWF investments in sustainability-oriented sectors.
• The relevant value of portfolio companies issuing sustainability reports was included in the reports assessment.
The calculation process did not include additionally committed sustainability-themed funds. The qualifying SWF SI AUM amounted to $8.25 billion, or 0.54 percent of the estimated $1.544 trillion AUM of MENA SWFs. Nevertheless, with greater disclosure this number would be higher, and with the realization of the growing number of significant committed sustainability-themed investments, this figure would increase significantly.
Many of the region’sSWFs have a significant percentage of their holdings as majority stakes with long-term investment horizons, offering greater ability to influence investments. For example, Abu Dhabi’s Mubadala has at least a 50 percent stake in 36 of 69 disclosed portfolio companies, while Mumtalakat Holding Company in Bahrain has a majority stake in 42.9 percent of its disclosed investment portfolio.
For the purposes of this study, SWF portfolio companies who practiced sustainability reporting were considered as SI for the SWF, regardless of the sector or activity of that portfolio company.
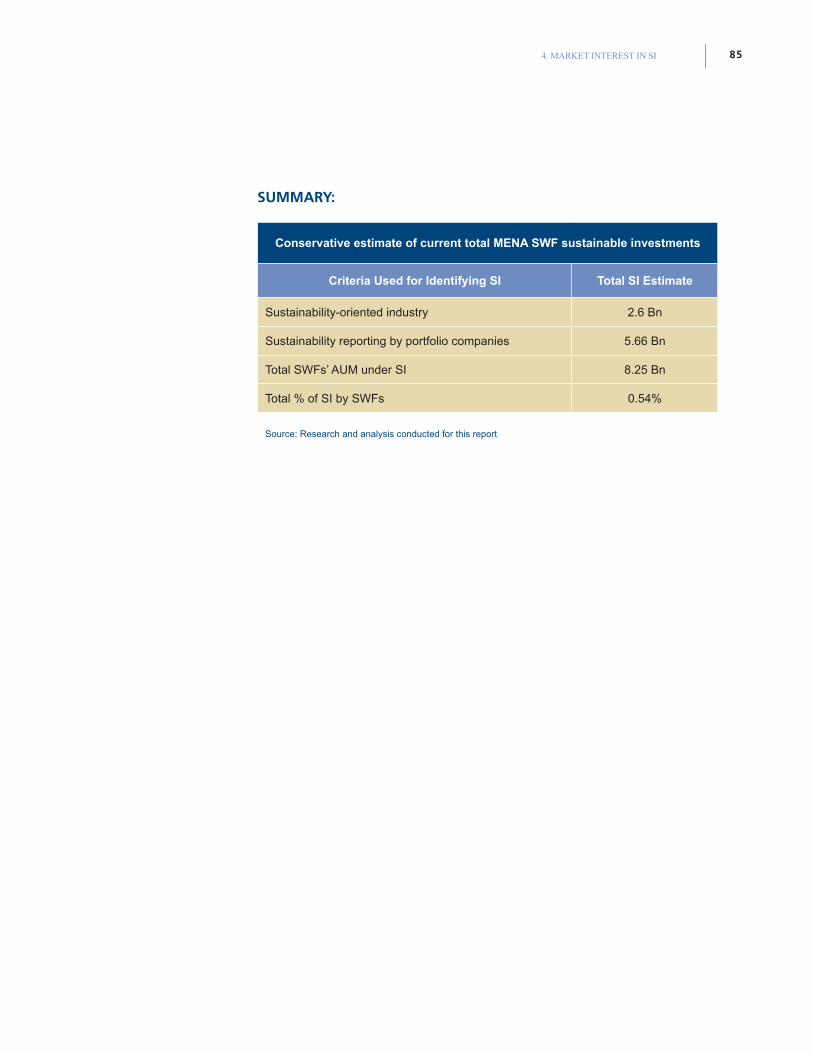
854. MARKET INTEREST IN SI
SUMMARY:
Conservative estimate of current total MENA SWF sustainable investments
Criteria Used for Identifying SI Total SI Estimate
Sustainability-oriented industry 2.6 Bn
Sustainability reporting by portfolio companies 5.66 Bn
Total SWFs’ AUM under SI 8.25 Bn
Total % of SI by SWFs 0.54%
Source: Research and analysis conducted for this report
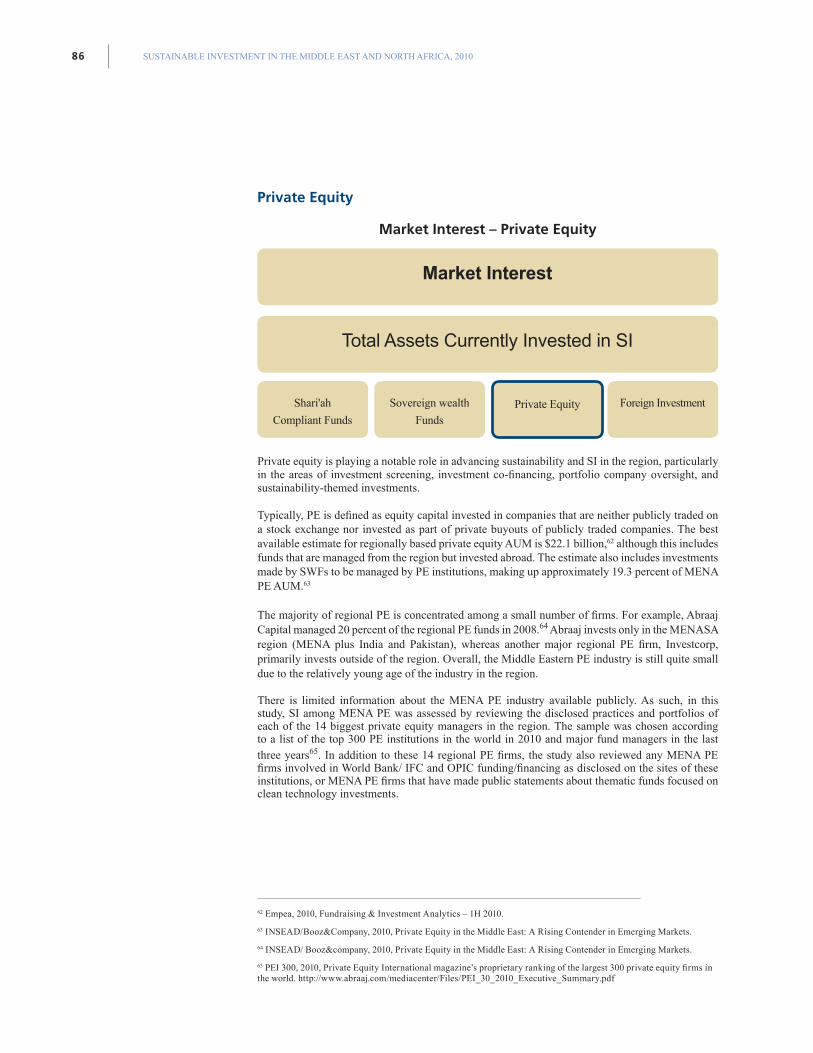
SUSTAINABLE INVESTMENT IN THE MIDDLE EAST AND NORTH AFRICA, 201086
Private Equity
Market Interest – Private Equity
Private equity is playing a notable role in advancing sustainability and SI in the region, particularly in the areas of investment screening, investment co-financing, portfolio company oversight, and sustainability-themed investments.
Typically, PE is defined as equity capital invested in companies that are neither publicly traded on a stock exchange nor invested as part of private buyouts of publicly traded companies. The best available estimate for regionally based private equity AUM is $22.1 billion,62 although this includes funds that are managed from the region but invested abroad. The estimate also includes investments made by SWFs to be managed by PE institutions, making up approximately 19.3 percent of MENA PE AUM.63
The majority of regional PE is concentrated among a small number of firms. For example, Abraaj Capital managed 20 percent of the regional PE funds in 2008.64 Abraaj invests only in the MENASA region (MENA plus India and Pakistan), whereas another major regional PE firm, Investcorp, primarily invests outside of the region. Overall, the Middle Eastern PE industry is still quite small due to the relatively young age of the industry in the region.
There is limited information about the MENA PE industry available publicly. As such, in this study, SI among MENA PE was assessed by reviewing the disclosed practices and portfolios of each of the 14 biggest private equity managers in the region. The sample was chosen according to a list of the top 300 PE institutions in the world in 2010 and major fund managers in the last three years65. In addition to these 14 regional PE firms, the study also reviewed any MENA PE firms involved in World Bank/ IFC and OPIC funding/financing as disclosed on the sites of these institutions, or MENA PE firms that have made public statements about thematic funds focused on clean technology investments.
62 Empea, 2010, Fundraising & Investment Analytics – 1H 2010.
63 INSEAD/Booz&Company, 2010, Private Equity in the Middle East: A Rising Contender in Emerging Markets.
64 INSEAD/ Booz&company, 2010, Private Equity in the Middle East: A Rising Contender in Emerging Markets.
65 PEI 300, 2010, Private Equity International magazine’s proprietary ranking of the largest 300 private equity firms in the world. http://www.abraaj.com/mediacenter/Files/PEI_30_2010_Executive_Summary.pdf
Market Interest
Total Assets Currently Invested in SI
Shari'ah
Compliant Funds
Sovereign wealth
FundsPrivate Equity Foreign Investment
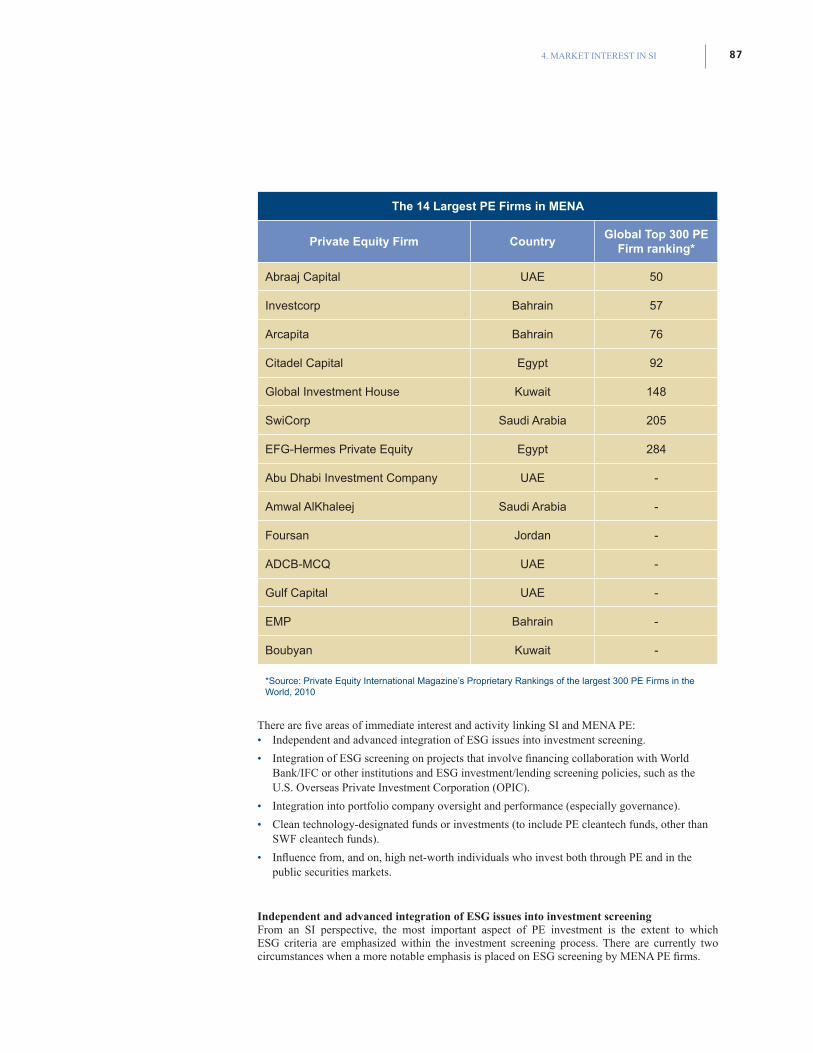
874. MARKET INTEREST IN SI
The 14 Largest PE Firms in MENA
Private Equity Firm CountryGlobal Top 300 PE
Firm ranking*
Abraaj Capital UAE 50
Investcorp Bahrain 57
Arcapita Bahrain 76
Citadel Capital Egypt 92
Global Investment House Kuwait 148
SwiCorp Saudi Arabia 205
EFG-Hermes Private Equity Egypt 284
Abu Dhabi Investment Company UAE -
Amwal AlKhaleej Saudi Arabia -
Foursan Jordan -
ADCB-MCQ UAE -
Gulf Capital UAE -
EMP Bahrain -
Boubyan Kuwait -
*Source: Private Equity International Magazine’s Proprietary Rankings of the largest 300 PE Firms in the World, 2010
There are five areas of immediate interest and activity linking SI and MENA PE: • Independent and advanced integration of ESG issues into investment screening.
• Integration of ESG screening on projects that involve financing collaboration with World Bank/IFC or other institutions and ESG investment/lending screening policies, such as the U.S. Overseas Private Investment Corporation (OPIC).
• Integration into portfolio company oversight and performance (especially governance).
• Clean technology-designated funds or investments (to include PE cleantech funds, other than SWF cleantech funds).
• Influence from, and on, high net-worth individuals who invest both through PE and in the public securities markets.
Independent and advanced integration of ESG issues into investment screeningFrom an SI perspective, the most important aspect of PE investment is the extent to which ESG criteria are emphasized within the investment screening process. There are currently two circumstances when a more notable emphasis is placed on ESG screening by MENA PE firms.
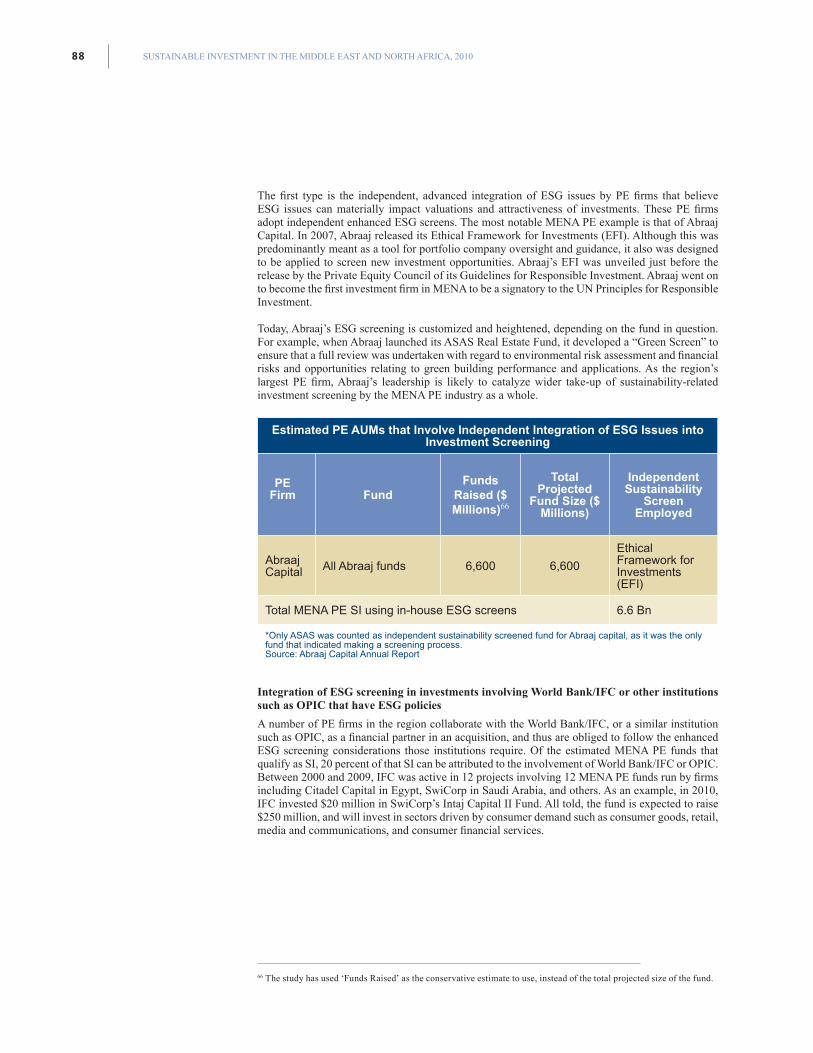
SUSTAINABLE INVESTMENT IN THE MIDDLE EAST AND NORTH AFRICA, 201088
The first type is the independent, advanced integration of ESG issues by PE firms that believe ESG issues can materially impact valuations and attractiveness of investments. These PE firms adopt independent enhanced ESG screens. The most notable MENA PE example is that of Abraaj Capital. In 2007, Abraaj released its Ethical Framework for Investments (EFI). Although this was predominantly meant as a tool for portfolio company oversight and guidance, it also was designed to be applied to screen new investment opportunities. Abraaj’s EFI was unveiled just before the release by the Private Equity Council of its Guidelines for Responsible Investment. Abraaj went on to become the first investment firm in MENA to be a signatory to the UN Principles for Responsible Investment.
Today, Abraaj’s ESG screening is customized and heightened, depending on the fund in question. For example, when Abraaj launched its ASAS Real Estate Fund, it developed a “Green Screen” to ensure that a full review was undertaken with regard to environmental risk assessment and financial risks and opportunities relating to green building performance and applications. As the region’s largest PE firm, Abraaj’s leadership is likely to catalyze wider take-up of sustainability-related investment screening by the MENA PE industry as a whole.
Estimated PE AUMs that Involve Independent Integration of ESG Issues into Investment Screening
PE Firm Fund
Funds Raised ($ Millions)66
Total Projected
Fund Size ($ Millions)
Independent Sustainability
Screen Employed
Abraaj Capital All Abraaj funds 6,600 6,600
Ethical Framework for Investments (EFI)
Total MENA PE SI using in-house ESG screens 6.6 Bn
*Only ASAS was counted as independent sustainability screened fund for Abraaj capital, as it was the only fund that indicated making a screening process.Source: Abraaj Capital Annual Report
Integration of ESG screening in investments involving World Bank/IFC or other institutions such as OPIC that have ESG policies
A number of PE firms in the region collaborate with the World Bank/IFC, or a similar institution such as OPIC, as a financial partner in an acquisition, and thus are obliged to follow the enhanced ESG screening considerations those institutions require. Of the estimated MENA PE funds that qualify as SI, 20 percent of that SI can be attributed to the involvement of World Bank/IFC or OPIC. Between 2000 and 2009, IFC was active in 12 projects involving 12 MENA PE funds run by firms including Citadel Capital in Egypt, SwiCorp in Saudi Arabia, and others. As an example, in 2010, IFC invested $20 million in SwiCorp’s Intaj Capital II Fund. All told, the fund is expected to raise $250 million, and will invest in sectors driven by consumer demand such as consumer goods, retail, media and communications, and consumer financial services.66
66 The study has used ‘Funds Raised’ as the conservative estimate to use, instead of the total projected size of the fund.
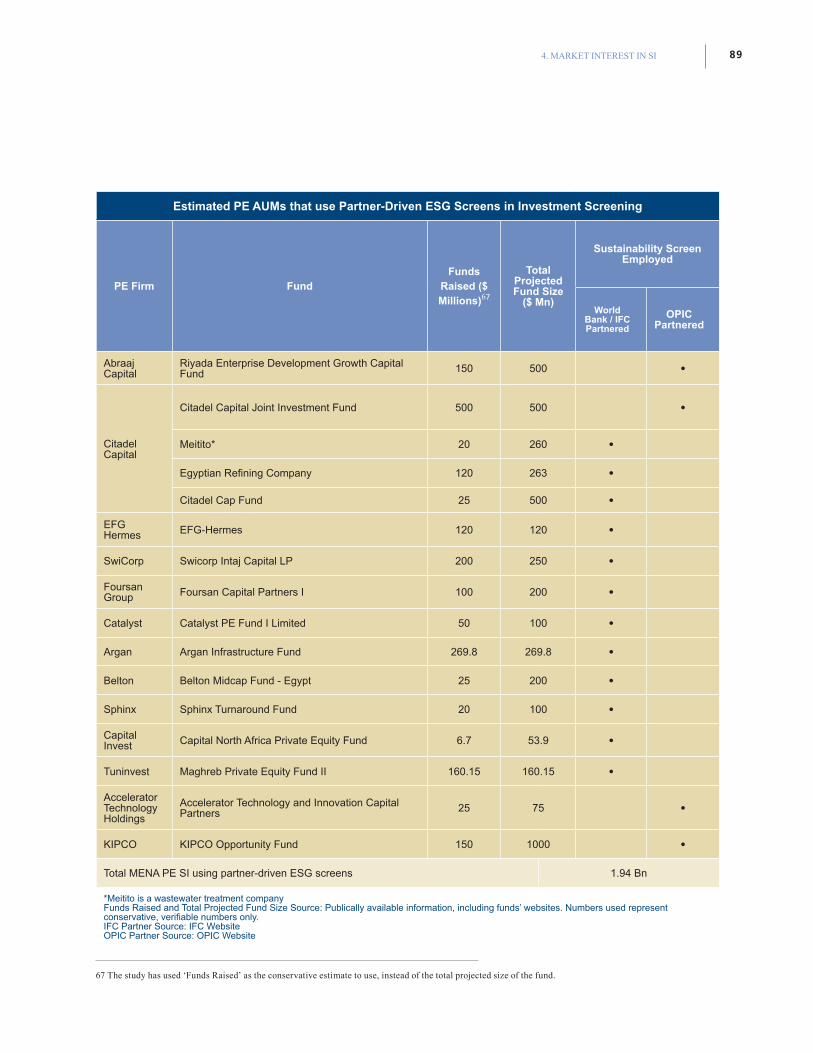
894. MARKET INTEREST IN SI
Estimated PE AUMs that use Partner-Driven ESG Screens in Investment Screening
PE Firm FundFunds
Raised ($ Millions)67
Total Projected Fund Size
($ Mn)
Sustainability Screen Employed
World Bank / IFC Partnered
OPIC Partnered
Abraaj Capital
Riyada Enterprise Development Growth Capital Fund 150 500 •
Citadel Capital
Citadel Capital Joint Investment Fund 500 500 •
Meitito* 20 260 •
Egyptian Refining Company 120 263 •
Citadel Cap Fund 25 500 •
EFG Hermes EFG-Hermes 120 120 •
SwiCorp Swicorp Intaj Capital LP 200 250 •
Foursan Group Foursan Capital Partners I 100 200 •
Catalyst Catalyst PE Fund I Limited 50 100 •
Argan Argan Infrastructure Fund 269.8 269.8 •
Belton Belton Midcap Fund - Egypt 25 200 •
Sphinx Sphinx Turnaround Fund 20 100 •
Capital Invest Capital North Africa Private Equity Fund 6.7 53.9 •
Tuninvest Maghreb Private Equity Fund II 160.15 160.15 •
Accelerator Technology Holdings
Accelerator Technology and Innovation Capital Partners 25 75 •
KIPCO KIPCO Opportunity Fund 150 1000 •
Total MENA PE SI using partner-driven ESG screens 1.94 Bn
*Meitito is a wastewater treatment companyFunds Raised and Total Projected Fund Size Source: Publically available information, including funds’ websites. Numbers used represent conservative, verifiable numbers only.IFC Partner Source: IFC WebsiteOPIC Partner Source: OPIC Website
67
67 The study has used ‘Funds Raised’ as the conservative estimate to use, instead of the total projected size of the fund.
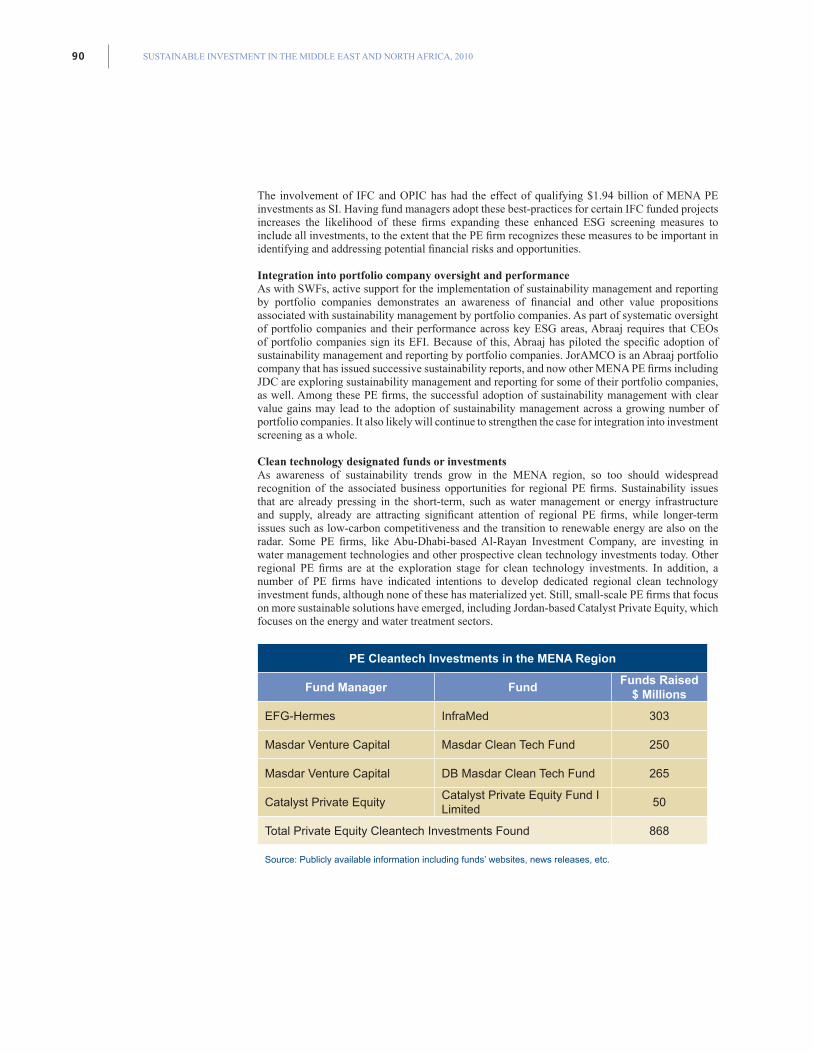
SUSTAINABLE INVESTMENT IN THE MIDDLE EAST AND NORTH AFRICA, 201090
The involvement of IFC and OPIC has had the effect of qualifying $1.94 billion of MENA PE investments as SI. Having fund managers adopt these best-practices for certain IFC funded projects increases the likelihood of these firms expanding these enhanced ESG screening measures to include all investments, to the extent that the PE firm recognizes these measures to be important in identifying and addressing potential financial risks and opportunities.
Integration into portfolio company oversight and performanceAs with SWFs, active support for the implementation of sustainability management and reporting by portfolio companies demonstrates an awareness of financial and other value propositions associated with sustainability management by portfolio companies. As part of systematic oversight of portfolio companies and their performance across key ESG areas, Abraaj requires that CEOs of portfolio companies sign its EFI. Because of this, Abraaj has piloted the specific adoption of sustainability management and reporting by portfolio companies. JorAMCO is an Abraaj portfolio company that has issued successive sustainability reports, and now other MENA PE firms including JDC are exploring sustainability management and reporting for some of their portfolio companies, as well. Among these PE firms, the successful adoption of sustainability management with clear value gains may lead to the adoption of sustainability management across a growing number of portfolio companies. It also likely will continue to strengthen the case for integration into investment screening as a whole.
Clean technology designated funds or investmentsAs awareness of sustainability trends grow in the MENA region, so too should widespread recognition of the associated business opportunities for regional PE firms. Sustainability issues that are already pressing in the short-term, such as water management or energy infrastructure and supply, already are attracting significant attention of regional PE firms, while longer-term issues such as low-carbon competitiveness and the transition to renewable energy are also on the radar. Some PE firms, like Abu-Dhabi-based Al-Rayan Investment Company, are investing in water management technologies and other prospective clean technology investments today. Other regional PE firms are at the exploration stage for clean technology investments. In addition, a number of PE firms have indicated intentions to develop dedicated regional clean technology investment funds, although none of these has materialized yet. Still, small-scale PE firms that focus on more sustainable solutions have emerged, including Jordan-based Catalyst Private Equity, which focuses on the energy and water treatment sectors.
PE Cleantech Investments in the MENA Region
Fund Manager FundFunds Raised
$ Millions
EFG-Hermes InfraMed 303
Masdar Venture Capital Masdar Clean Tech Fund 250
Masdar Venture Capital DB Masdar Clean Tech Fund 265
Catalyst Private EquityCatalyst Private Equity Fund I Limited
50
Total Private Equity Cleantech Investments Found 868
Source: Publicly available information including funds’ websites, news releases, etc.
914. MARKET INTEREST IN SI
Influence from, and on, high net worth individuals, who invest both through PE and in the public securities marketsIn 2009, Merrill Lynch estimated there were about 400,000 High Net-Worth Individuals (HNWI) and 3,600 Ultra-High Net-Worth Individuals (UHNWIs) in the MENA region, with wealth of about $1.5 trillion.68 These investors make up an important source of PE funds; UHNWIs alone make up 32 percent of PE Limited Partners in the region, as opposed to 13 percent in most other markets.69
Whereas Limited Partners in other regions are more often passive HNWIs, in the Middle East they tend to be actively involved. One estimate suggests that 60 percent of General Partners in the region expect key sources of deals to be proprietary. In this regard, there is a potential two-way effect on SI. First, as MENA PE firms adopt SI screens or other practices mentioned above, active HNWI and UHNWI individuals will be exposed to this philosophy and will implicitly or explicitly endorse it as the Limited Partners. Alternately, MENA PE firms are being influenced by their active HNWIs and UHNWIs who raise issues of sustainability either as criteria for their investment dollars, or more commonly, as factors that they emphasize to be important for the PE firm to assess and manage.
HNWIs and UHNWIs can also be the source of deal-flow relating to clean technology. When surveyed, 20 percent of MENA HNWIs and 21 percent of MENA UHNWIs claimed to allocate some percentage of their portfolio to green technologies and alternative energy sources. MENA HNWIs and UNHWIs ranked highest among all regions in this survey, exceeding European HNWIs (17 percent) and UHNWIs (20 percent) and well above the global average of HNWIs (12 percent) and UHNWIs (14 percent).70 Although survey results may not match actual performance, these results may at minimum be an important leading indicator and signal of the increasing trajectory of PE and HNWI and UHNWI in SI.
Related to this issue, HNWI or UHNWI individuals usually maintain a portion of their investments via public securities markets. As such, their increasing interest in clean technology and other SI likely will contribute to further emphasis on ESG reporting in public markets. HNWI and UHNWI investments in the public market are likely to be direct and not through any form of sustainability-screened fund, but will be influential SI in the marketplace nevertheless.
To calculate the current total PE SI AUMs, the SI AUMs for each of these four areas of PE SI activity have been aggregated and adjusted to eliminate any double-counting.71 This study found $9.56 billion in PE were SI out of $22.1 billion total PE, or 43.26 percent. However, for the aggregate total of SI in the region (across SWF, PE, Shariah-investing, etc.) the calculations for PE total must be reduced by a factor of 19.3 percent, given that SWF funds comprise about 19.3 percent of all MENA PE funds. Furthermore, when reviewing the total projected size of the planned investment funds qualifying as SI, it can be extrapolated that another $3.98 billion will be deployed as PE SI. If Shari’ah-compliant investments are excluded from the SI calculations, the amount of PE SI will decrease by $350 million, in turn reducing the SI percentage of MENA PE to 41.67 percent.
68 INSEAD/Boos&Co, 2010, Private Equity in the Middle East
69Merrill Lunch, 2008, World Wealth Report 2008
70 Merrill Lunch, 2008, World Wealth Report 2008
71 For example, Catalyst is listed under both World Bank/IFC influence SI, and Cleantech qualifying SI
Overall Calculation of Percentage of PE AUMs Qualifying as SI
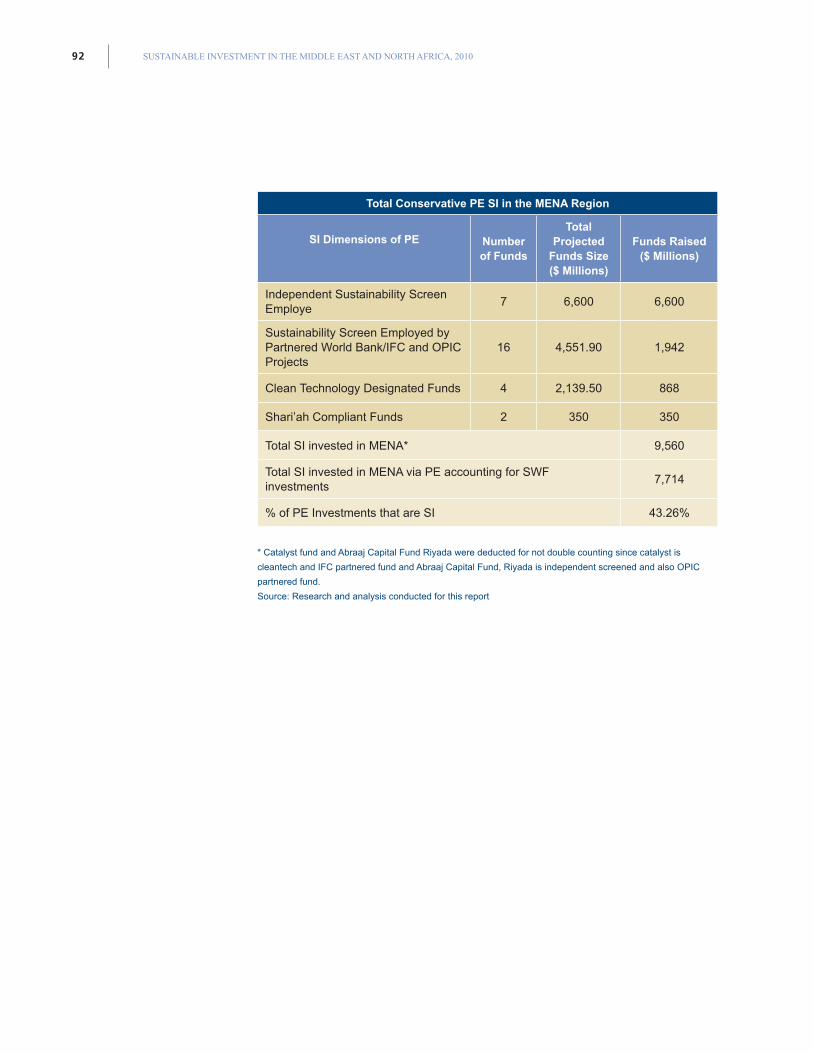
SUSTAINABLE INVESTMENT IN THE MIDDLE EAST AND NORTH AFRICA, 201092
Total Conservative PE SI in the MENA Region
SI Dimensions of PE Number of Funds
Total Projected
Funds Size ($ Millions)
Funds Raised ($ Millions)
Independent Sustainability Screen Employe
7 6,600 6,600
Sustainability Screen Employed by Partnered World Bank/IFC and OPIC Projects
16 4,551.90 1,942
Clean Technology Designated Funds 4 2,139.50 868
Shari’ah Compliant Funds 2 350 350
Total SI invested in MENA* 9,560
Total SI invested in MENA via PE accounting for SWF investments
7,714
% of PE Investments that are SI 43.26%
* Catalyst fund and Abraaj Capital Fund Riyada were deducted for not double counting since catalyst is
cleantech and IFC partnered fund and Abraaj Capital Fund, Riyada is independent screened and also OPIC
partnered fund.
Source: Research and analysis conducted for this report
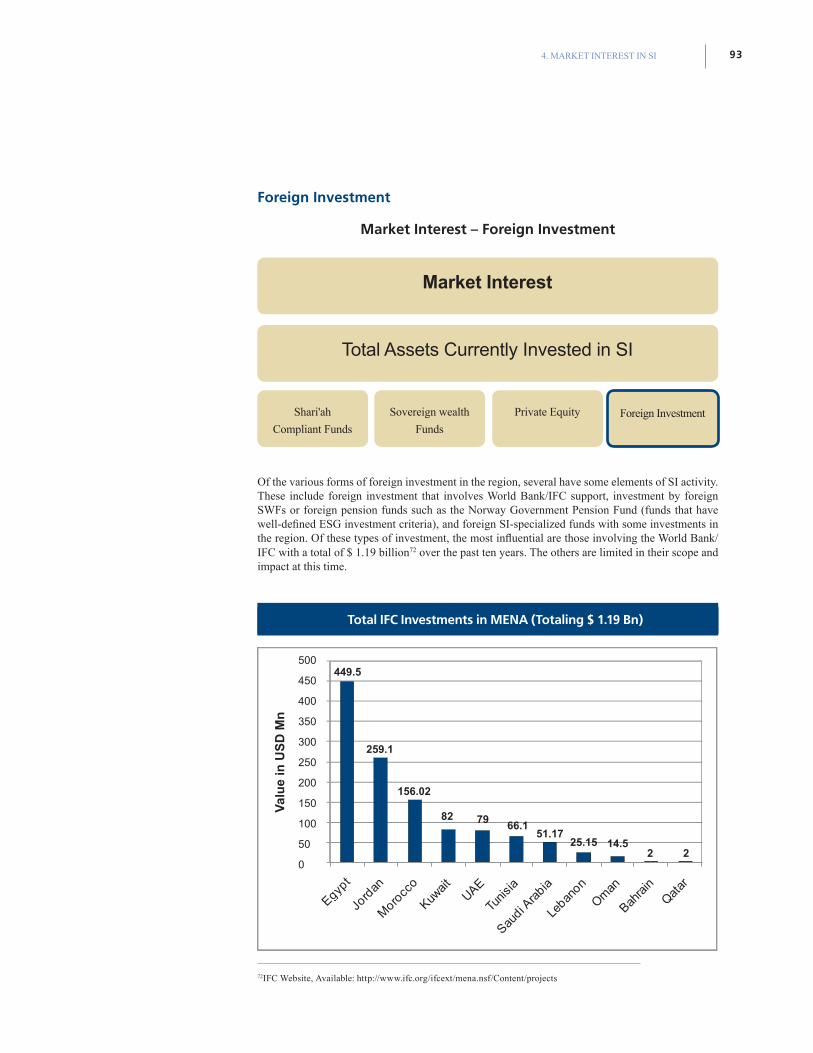
934. MARKET INTEREST IN SI
Foreign Investment
Market Interest – Foreign Investment
Of the various forms of foreign investment in the region, several have some elements of SI activity. These include foreign investment that involves World Bank/IFC support, investment by foreign SWFs or foreign pension funds such as the Norway Government Pension Fund (funds that have well-defined ESG investment criteria), and foreign SI-specialized funds with some investments in the region. Of these types of investment, the most influential are those involving the World Bank/IFC with a total of $ 1.19 billion72 over the past ten years. The others are limited in their scope and impact at this time.
72IFC Website, Available: http://www.ifc.org/ifcext/mena.nsf/Content/projects
Market Interest
Total Assets Currently Invested in SI
Shari'ah
Compliant Funds
Sovereign wealth
Funds
Private Equity Foreign Investment
500
450
400
350
300
250
200
150
100
50
0
449.5
Val
ue
in U
SD
Mn
259.1
156.02
82 7966.1
51.1725.15 14.5
2 2
Total IFC Investments in MENA (Totaling $ 1.19 Bn)
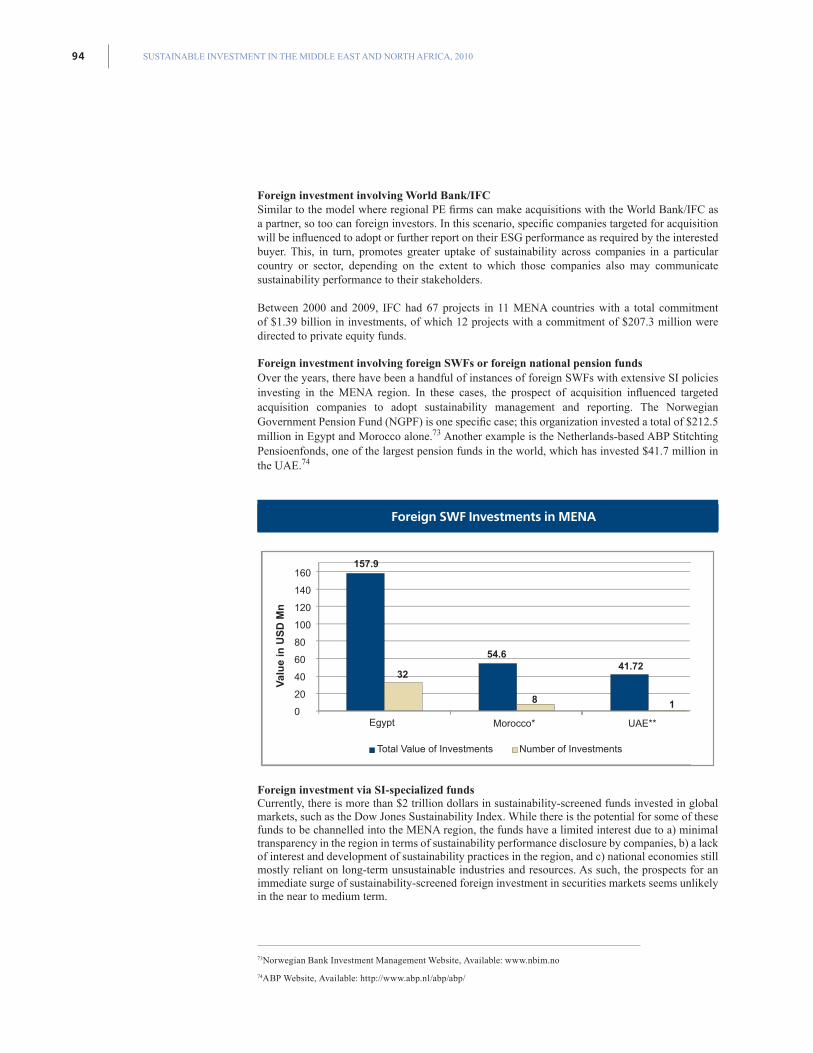
SUSTAINABLE INVESTMENT IN THE MIDDLE EAST AND NORTH AFRICA, 201094
Foreign investment involving World Bank/IFC Similar to the model where regional PE firms can make acquisitions with the World Bank/IFC as a partner, so too can foreign investors. In this scenario, specific companies targeted for acquisition will be influenced to adopt or further report on their ESG performance as required by the interested buyer. This, in turn, promotes greater uptake of sustainability across companies in a particular country or sector, depending on the extent to which those companies also may communicate sustainability performance to their stakeholders.
Between 2000 and 2009, IFC had 67 projects in 11 MENA countries with a total commitment of $1.39 billion in investments, of which 12 projects with a commitment of $207.3 million were directed to private equity funds.
Foreign investment involving foreign SWFs or foreign national pension funds Over the years, there have been a handful of instances of foreign SWFs with extensive SI policies investing in the MENA region. In these cases, the prospect of acquisition influenced targeted acquisition companies to adopt sustainability management and reporting. The Norwegian Government Pension Fund (NGPF) is one specific case; this organization invested a total of $212.5 million in Egypt and Morocco alone.73 Another example is the Netherlands-based ABP Stitchting Pensioenfonds, one of the largest pension funds in the world, which has invested $41.7 million in the UAE.74
Foreign investment via SI-specialized fundsCurrently, there is more than $2 trillion dollars in sustainability-screened funds invested in global markets, such as the Dow Jones Sustainability Index. While there is the potential for some of these funds to be channelled into the MENA region, the funds have a limited interest due to a) minimal transparency in the region in terms of sustainability performance disclosure by companies, b) a lack of interest and development of sustainability practices in the region, and c) national economies still mostly reliant on long-term unsustainable industries and resources. As such, the prospects for an immediate surge of sustainability-screened foreign investment in securities markets seems unlikely in the near to medium term.
73Norwegian Bank Investment Management Website, Available: www.nbim.no
74ABP Website, Available: http://www.abp.nl/abp/abp/
Number of InvestmentsTotal Value of Investments
Egypt
160
140
120
100
80
60
40
20
0Morocco* UAE**
157.9
Val
ue
in U
SD
Mn
32
54.641.72
8 1
Foreign SWF Investments in MENA
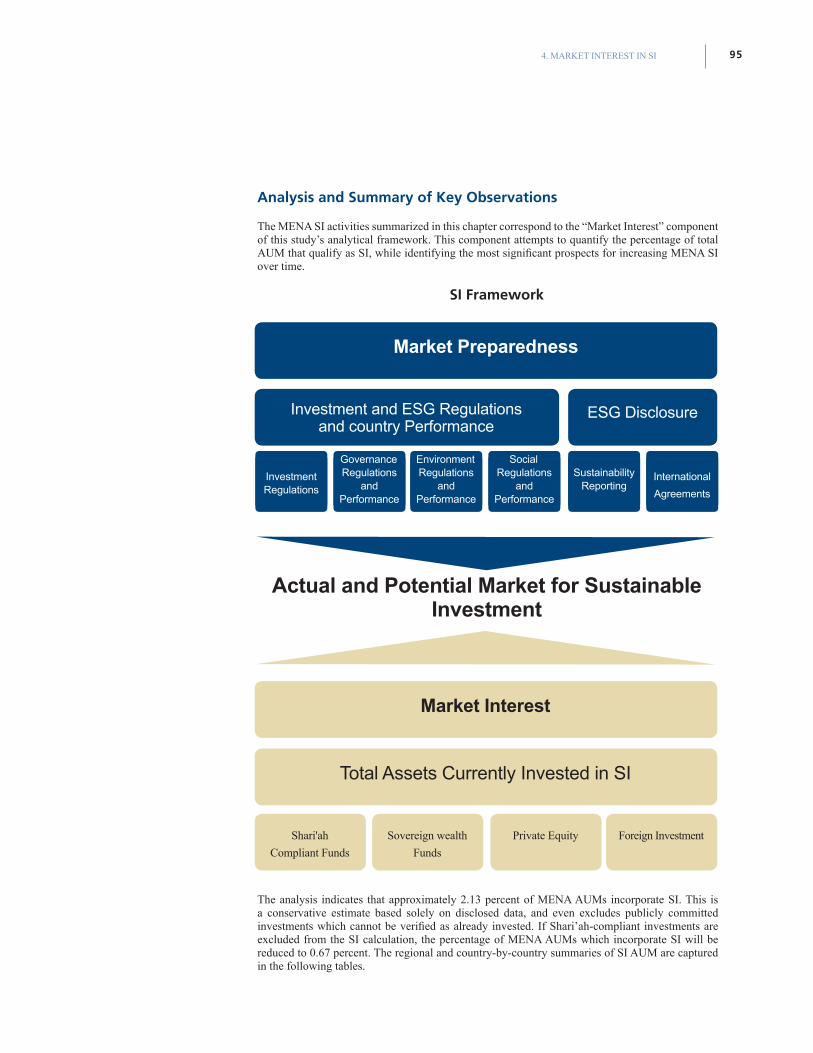
954. MARKET INTEREST IN SI
Analysis and Summary of Key Observations
The MENA SI activities summarized in this chapter correspond to the “Market Interest” component of this study’s analytical framework. This component attempts to quantify the percentage of total AUM that qualify as SI, while identifying the most significant prospects for increasing MENA SI over time.
SI Framework
The analysis indicates that approximately 2.13 percent of MENA AUMs incorporate SI. This is a conservative estimate based solely on disclosed data, and even excludes publicly committed investments which cannot be verified as already invested. If Shari’ah-compliant investments are excluded from the SI calculation, the percentage of MENA AUMs which incorporate SI will be reduced to 0.67 percent. The regional and country-by-country summaries of SI AUM are captured in the following tables.
Market Interest
Total Assets Currently Invested in SI
Shari'ah
Compliant Funds
Sovereign wealth
Funds
Private Equity Foreign Investment
ESG Disclosure
Investment Regulations
Environment Regulations
andPerformance
Sustainability Reporting
Governance Regulations
andPerformance
SocialRegulations
andPerformance
International
Agreements
Investment and ESG Regulationsand country Performance
Market Preparedness
Actual and Potential Market for Sustainable Investment
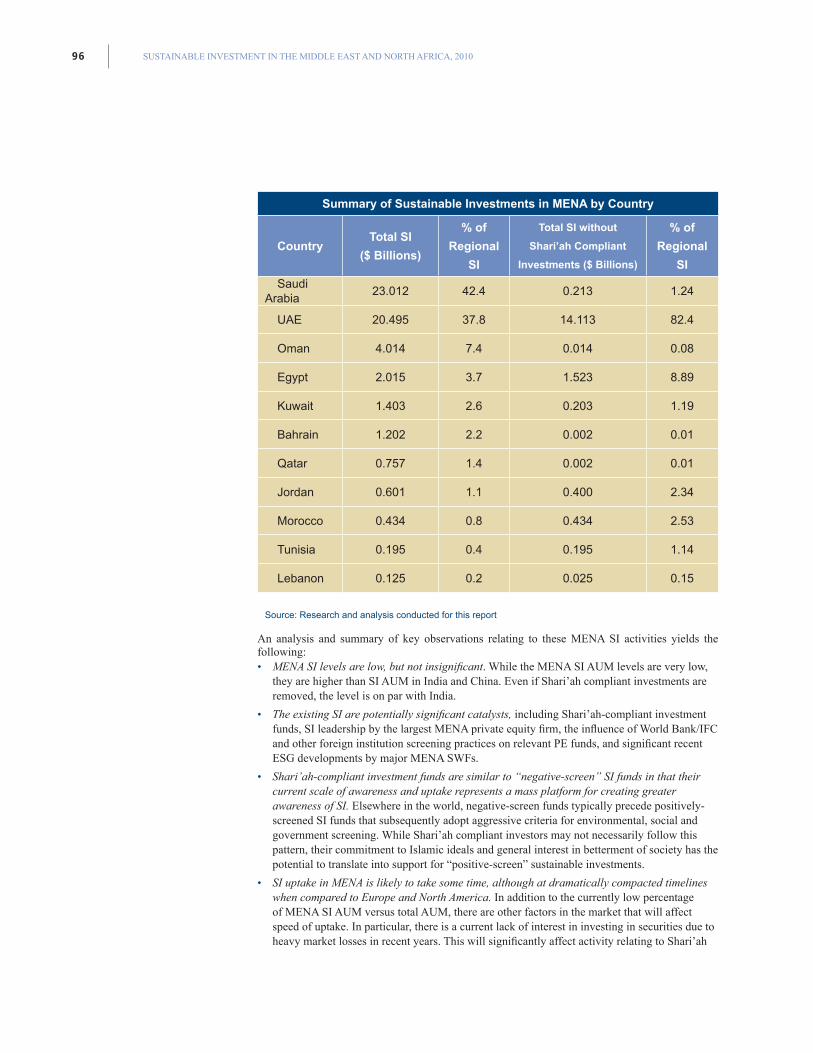
SUSTAINABLE INVESTMENT IN THE MIDDLE EAST AND NORTH AFRICA, 201096
Summary of Sustainable Investments in MENA by Country
CountryTotal SI
($ Billions)
% of
Regional
SI
Total SI without
Shari’ah Compliant
Investments ($ Billions)
% of
Regional
SI
Saudi Arabia
23.012 42.4 0.213 1.24
UAE 20.495 37.8 14.113 82.4
Oman 4.014 7.4 0.014 0.08
Egypt 2.015 3.7 1.523 8.89
Kuwait 1.403 2.6 0.203 1.19
Bahrain 1.202 2.2 0.002 0.01
Qatar 0.757 1.4 0.002 0.01
Jordan 0.601 1.1 0.400 2.34
Morocco 0.434 0.8 0.434 2.53
Tunisia 0.195 0.4 0.195 1.14
Lebanon 0.125 0.2 0.025 0.15
Source: Research and analysis conducted for this report
An analysis and summary of key observations relating to these MENA SI activities yields the following: • MENA SI levels are low, but not insignificant. While the MENA SI AUM levels are very low,
they are higher than SI AUM in India and China. Even if Shari’ah compliant investments are removed, the level is on par with India.
• The existing SI are potentially significant catalysts, including Shari’ah-compliant investment funds, SI leadership by the largest MENA private equity firm, the influence of World Bank/IFC and other foreign institution screening practices on relevant PE funds, and significant recent ESG developments by major MENA SWFs.
• Shari’ah-compliant investment funds are similar to “negative-screen” SI funds in that their current scale of awareness and uptake represents a mass platform for creating greater awareness of SI. Elsewhere in the world, negative-screen funds typically precede positively-screened SI funds that subsequently adopt aggressive criteria for environmental, social and government screening. While Shari’ah compliant investors may not necessarily follow this pattern, their commitment to Islamic ideals and general interest in betterment of society has the potential to translate into support for “positive-screen” sustainable investments.
• SI uptake in MENA is likely to take some time, although at dramatically compacted timelines when compared to Europe and North America. In addition to the currently low percentage of MENA SI AUM versus total AUM, there are other factors in the market that will affect speed of uptake. In particular, there is a current lack of interest in investing in securities due to heavy market losses in recent years. This will significantly affect activity relating to Shari’ah
974. MARKET INTEREST IN SI
compliant funds. To a lesser extent, it will affect PE funds, as well. Nonetheless, the timeline for take-up of SI in the region will be accelerated compared to the timeline in North America and Europe, with expectations of high levels of SI AUM within three to five years.
• PE SI initiatives will have a disproportionate impact on Market Interest, even as MENA PE investment flows remain limited in the troubled global economic climate. As PE firms increasingly adopt and promote the benefits of SI-screening, sustainability management, and reporting by portfolio companies, key PE stakeholders (including some of the region’s wealthiest business people and most active regional investors, as well as influential government officials), will take notice.
• SWFs represent the greatest MENA SI opportunity. Contrary to perception, the analysis suggests that the most likely source of a significant nearer-term increase in MENA SI AUMs is from SWFs. There are multiple catalysts for increased SWF SI, including the growing global role of SWFs in governance, transparency and risk management; the growing emphasis on sustainability (including emerging theme-based investments in sustainability and clean technology sectors) within their national agendas; the business case for risk-minimizing ESG screening of investments and for improving performance of portfolio companies; and the business case for using SI as a tool for reducing resistance to foreign acquisitions. Self-interest on the part of SWFs likely will outweigh and gradually soften traditional cautiousness with regard to sustainability and disclosure. This is especially true in the UAE, which accounts for 50 percent of all SWF AUM in MENA, and where the Emirate of Abu Dhabi has embarked on an aggressive sustainability agenda. Furthermore, SWFs comprise a considerable proportion of total regional AUMs, and any notable movement by SWFs will have the greatest effect on total MENA SI AUMs and the regional business community. The impact on public markets will be less extensive, in that it will be limited to SWF SI-screening with publicly listed portfolio companies. The impact, therefore, on demand for an SI-screened investment product for public markets will be less than the general increase in demand for SI across the MENA business community. Nonetheless, it will raise awareness of SI screening and its potential benefits across a wide range of investment classes.
• Some foreign-based guidelines, such as World Bank/IFC guidelines, OPIC criteria, the Equator Principles, and other international guidelines as outlined elsewhere in this report will provide some support for the adoption of SI in that they offer a means of piloting SI-screening with affected projects, and guidelines that have been tested in other respected markets.
The recommendations arising from these observations, in combination with the observations from other chapters, can be found in the final chapter of this report “Challenges and Opportunities for Development of the SI Market in MENA.”
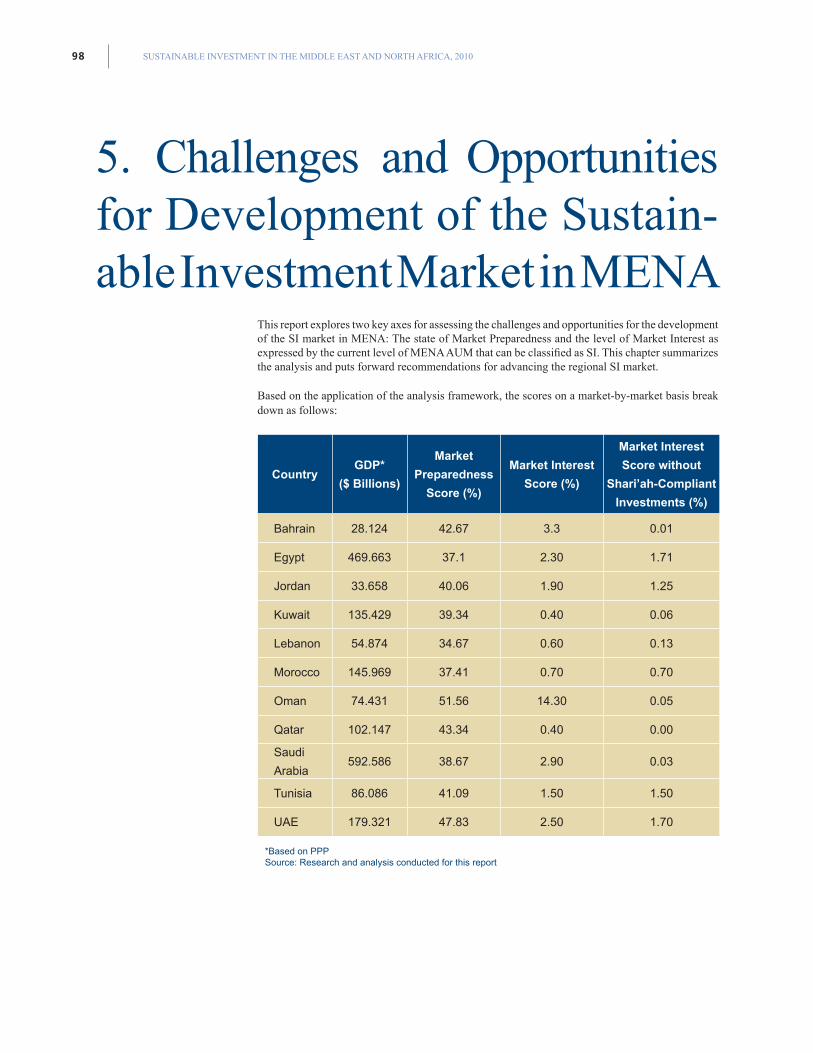
SUSTAINABLE INVESTMENT IN THE MIDDLE EAST AND NORTH AFRICA, 201098
This report explores two key axes for assessing the challenges and opportunities for the development of the SI market in MENA: The state of Market Preparedness and the level of Market Interest as expressed by the current level of MENA AUM that can be classified as SI. This chapter summarizes the analysis and puts forward recommendations for advancing the regional SI market.
Based on the application of the analysis framework, the scores on a market-by-market basis break down as follows:
Country GDP*
($ Billions)
Market
Preparedness
Score (%)
Market Interest
Score (%)
Market Interest
Score without
Shari’ah-Compliant
Investments (%)
Bahrain 28.124 42.67 3.3 0.01
Egypt 469.663 37.1 2.30 1.71
Jordan 33.658 40.06 1.90 1.25
Kuwait 135.429 39.34 0.40 0.06
Lebanon 54.874 34.67 0.60 0.13
Morocco 145.969 37.41 0.70 0.70
Oman 74.431 51.56 14.30 0.05
Qatar 102.147 43.34 0.40 0.00
Saudi
Arabia592.586 38.67 2.90 0.03
Tunisia 86.086 41.09 1.50 1.50
UAE 179.321 47.83 2.50 1.70
*Based on PPPSource: Research and analysis conducted for this report
5. Challenges and Opportunities for Development of the Sustain-able Investment Market in MENA
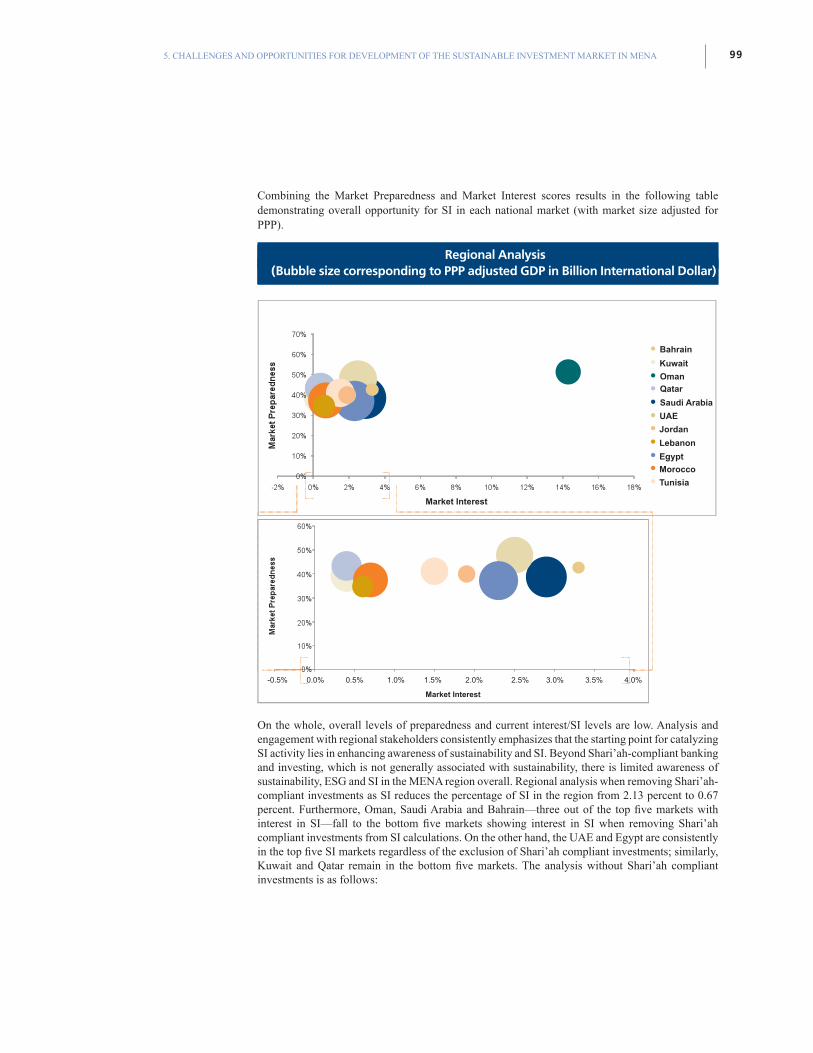
995. CHALLENGES AND OPPORTUNITIES FOR DEVELOPMENT OF THE SUSTAINABLE INVESTMENT MARKET IN MENA
Combining the Market Preparedness and Market Interest scores results in the following table demonstrating overall opportunity for SI in each national market (with market size adjusted for PPP).
On the whole, overall levels of preparedness and current interest/SI levels are low. Analysis and engagement with regional stakeholders consistently emphasizes that the starting point for catalyzing SI activity lies in enhancing awareness of sustainability and SI. Beyond Shari’ah-compliant banking and investing, which is not generally associated with sustainability, there is limited awareness of sustainability, ESG and SI in the MENA region overall. Regional analysis when removing Shari’ah-compliant investments as SI reduces the percentage of SI in the region from 2.13 percent to 0.67 percent. Furthermore, Oman, Saudi Arabia and Bahrain—three out of the top five markets with interest in SI—fall to the bottom five markets showing interest in SI when removing Shari’ah compliant investments from SI calculations. On the other hand, the UAE and Egypt are consistently in the top five SI markets regardless of the exclusion of Shari’ah compliant investments; similarly, Kuwait and Qatar remain in the bottom five markets. The analysis without Shari’ah compliant investments is as follows:
Market Interest
Market Interest
Bahrain
Kuwait
Oman
Qatar
Saudi Arabia
UAE
Jordan
Lebanon
Egypt
Morocco
Tunisia
-0.5% 0.0% 0.5% 1.0% 1.5% 2.0% 2.5% 3.0% 3.5% 4.0%
Regional Analysis(Bubble size corresponding to PPP adjusted GDP in Billion International Dollar)
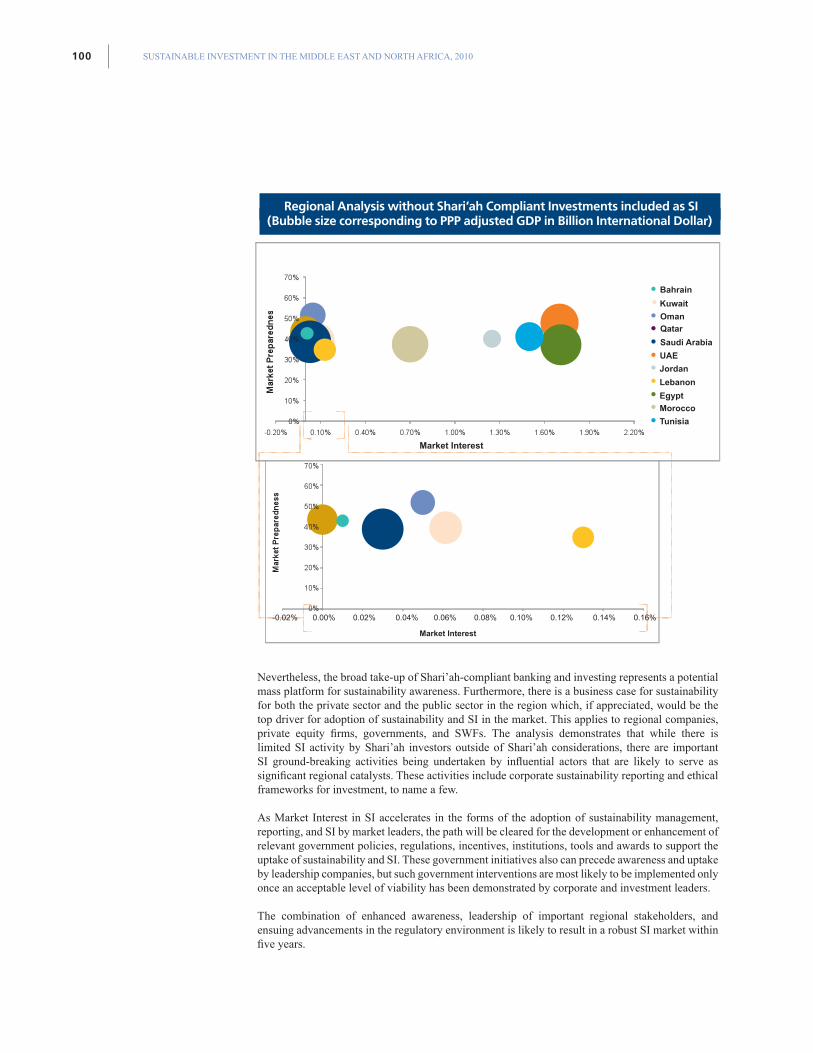
SUSTAINABLE INVESTMENT IN THE MIDDLE EAST AND NORTH AFRICA, 2010100
Nevertheless, the broad take-up of Shari’ah-compliant banking and investing represents a potential mass platform for sustainability awareness. Furthermore, there is a business case for sustainability for both the private sector and the public sector in the region which, if appreciated, would be the top driver for adoption of sustainability and SI in the market. This applies to regional companies, private equity firms, governments, and SWFs. The analysis demonstrates that while there is limited SI activity by Shari’ah investors outside of Shari’ah considerations, there are important SI ground-breaking activities being undertaken by influential actors that are likely to serve as significant regional catalysts. These activities include corporate sustainability reporting and ethical frameworks for investment, to name a few.
As Market Interest in SI accelerates in the forms of the adoption of sustainability management, reporting, and SI by market leaders, the path will be cleared for the development or enhancement of relevant government policies, regulations, incentives, institutions, tools and awards to support the uptake of sustainability and SI. These government initiatives also can precede awareness and uptake by leadership companies, but such government interventions are most likely to be implemented only once an acceptable level of viability has been demonstrated by corporate and investment leaders.
The combination of enhanced awareness, leadership of important regional stakeholders, and ensuing advancements in the regulatory environment is likely to result in a robust SI market within five years.
Market Interest
Market Interest
-0.02% 0.00% 0.02% 0.04% 0.06% 0.08% 0.10% 0.12% 0.14% 0.16%
Bahrain
Kuwait
Oman
Qatar
Saudi Arabia
UAE
Jordan
Lebanon
Egypt
Morocco
Tunisia
Regional Analysis without Shari’ah Compliant Investments included as SI (Bubble size corresponding to PPP adjusted GDP in Billion International Dollar)
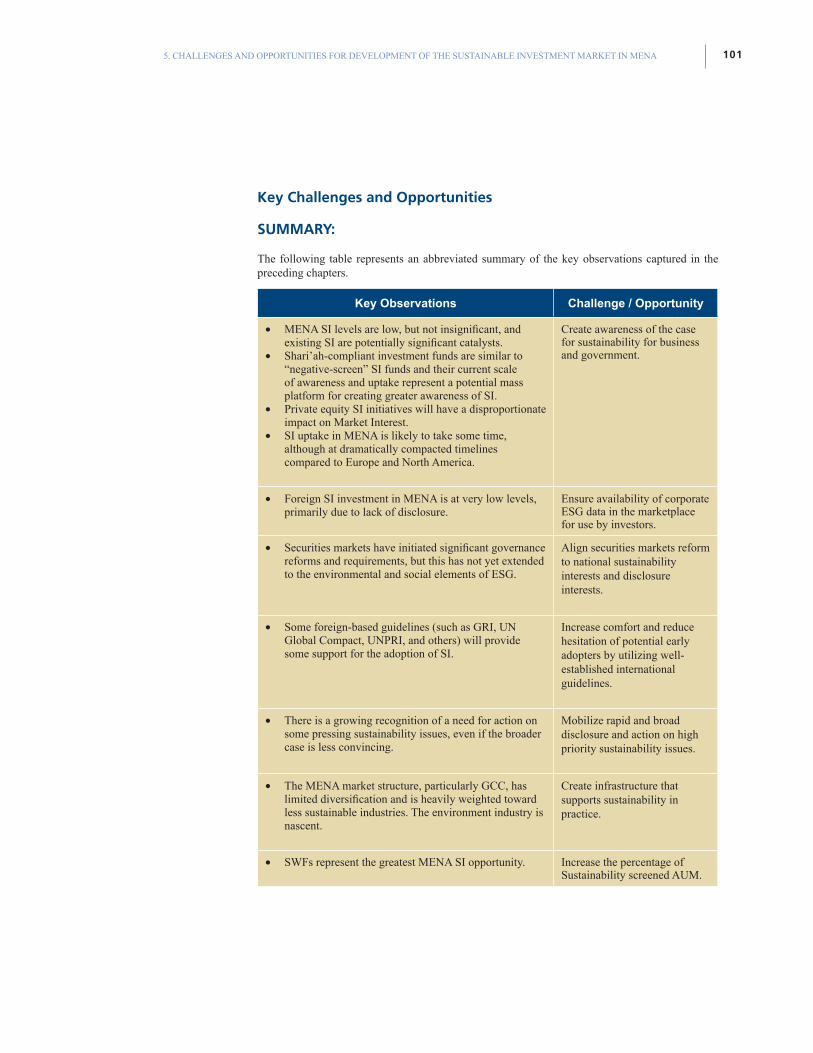
1015. CHALLENGES AND OPPORTUNITIES FOR DEVELOPMENT OF THE SUSTAINABLE INVESTMENT MARKET IN MENA
Key Challenges and Opportunities
SUMMARY:
The following table represents an abbreviated summary of the key observations captured in the preceding chapters.
Key Observations Challenge / Opportunity
• MENA SI levels are low, but not insignificant, and existing SI are potentially significant catalysts.
• Shari’ah-compliant investment funds are similar to “negative-screen” SI funds and their current scale of awareness and uptake represent a potential mass platform for creating greater awareness of SI.
• Private equity SI initiatives will have a disproportionate impact on Market Interest.
• SI uptake in MENA is likely to take some time, although at dramatically compacted timelines compared to Europe and North America.
Create awareness of the case for sustainability for business and government.
• Foreign SI investment in MENA is at very low levels, primarily due to lack of disclosure.
Ensure availability of corporate ESG data in the marketplace for use by investors.
• Securities markets have initiated significant governance reforms and requirements, but this has not yet extended to the environmental and social elements of ESG.
Align securities markets reform to national sustainability interests and disclosure interests.
• Some foreign-based guidelines (such as GRI, UN Global Compact, UNPRI, and others) will provide some support for the adoption of SI.
Increase comfort and reduce hesitation of potential early adopters by utilizing well-established international guidelines.
• There is a growing recognition of a need for action on some pressing sustainability issues, even if the broader case is less convincing.
Mobilize rapid and broad disclosure and action on high priority sustainability issues.
• The MENA market structure, particularly GCC, has limited diversification and is heavily weighted toward less sustainable industries. The environment industry is nascent.
Create infrastructure that supports sustainability in practice.
• SWFs represent the greatest MENA SI opportunity. Increase the percentage of Sustainability screened AUM.
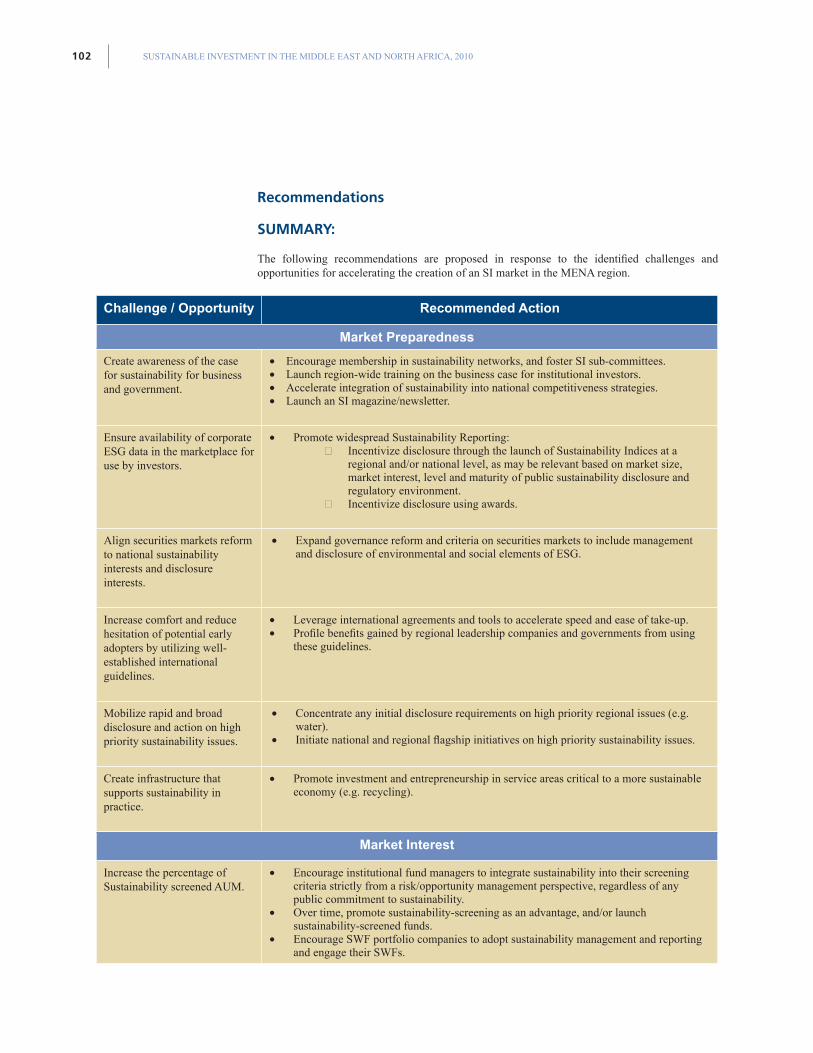
SUSTAINABLE INVESTMENT IN THE MIDDLE EAST AND NORTH AFRICA, 2010102
Recommendations
SUMMARY:
The following recommendations are proposed in response to the identified challenges and opportunities for accelerating the creation of an SI market in the MENA region.
Challenge / Opportunity Recommended Action
Market Preparedness
Create awareness of the case for sustainability for business and government.
• Encourage membership in sustainability networks, and foster SI sub-committees.• Launch region-wide training on the business case for institutional investors.• Accelerate integration of sustainability into national competitiveness strategies.• Launch an SI magazine/newsletter.
Ensure availability of corporate ESG data in the marketplace for use by investors.
• Promote widespread Sustainability Reporting:○ Incentivize disclosure through the launch of Sustainability Indices at a
regional and/or national level, as may be relevant based on market size, market interest, level and maturity of public sustainability disclosure and regulatory environment.
○ Incentivize disclosure using awards.
Align securities markets reform to national sustainability interests and disclosure interests.
• Expand governance reform and criteria on securities markets to include management and disclosure of environmental and social elements of ESG.
Increase comfort and reduce hesitation of potential early adopters by utilizing well-established international guidelines.
• Leverage international agreements and tools to accelerate speed and ease of take-up.• Profile benefits gained by regional leadership companies and governments from using
these guidelines.
Mobilize rapid and broad disclosure and action on high priority sustainability issues.
• Concentrate any initial disclosure requirements on high priority regional issues (e.g. water).
• Initiate national and regional flagship initiatives on high priority sustainability issues.
Create infrastructure that supports sustainability in practice.
• Promote investment and entrepreneurship in service areas critical to a more sustainable economy (e.g. recycling).
Market Interest
Increase the percentage of Sustainability screened AUM.
• Encourage institutional fund managers to integrate sustainability into their screening criteria strictly from a risk/opportunity management perspective, regardless of any public commitment to sustainability.
• Over time, promote sustainability-screening as an advantage, and/or launch sustainability-screened funds.
• Encourage SWF portfolio companies to adopt sustainability management and reporting and engage their SWFs.
1035. CHALLENGES AND OPPORTUNITIES FOR DEVELOPMENT OF THE SUSTAINABLE INVESTMENT MARKET IN MENA
Recommendations—Details
Each of the above recommendations can be elaborated upon as follows:
Market Preparedness
Challenge: Create awareness of the case for sustainability for business and government and convert into public sustainability commitments.
Recommended Actions: • Encourage membership in sustainability networks and foster SI sub-committees.
– Encourage corporate and government membership in learning and experience-sharing forums that simultaneously require commitments, such as the Arab Sustainability Leadership Group or the Abu Dhabi Sustainability Group. It is recommended that the ASLG establish an SI sub-committee that includes banking and investment sector representatives. This sub-committee also can seek to engage international stakeholders with longer-term SI experience as a means of learning from other markets and accelerating regional uptake.
• Launch region-wide training on the business case for institutional investors.
– Launch region-wide training on institutional investor business-case for sustainability screening, undertaken independently or in collaboration with above networks such as the ASLG.
• Accelerate integration of sustainability into national competitiveness strategies.
– Encourage each MENA government to conduct review and enhance integration of sustainability considerations into long-term development and competitiveness strategies.
• Launch an SI magazine/newsletter
– Launch an SI Magazine that captures leadership practices and commitments, and reports back on progress against commitments and corresponding benefits over time.
Measure: Increased number and intensity of sustainability commitments by business and government, and measured percentage of performance against those commitments.
Challenge: Ensure availability of corporate ESG data in the marketplace for use by investors.
Recommended Actions:
• Promote and incentivize widespread sustainability reporting through the launch of sustainability indices at a national level.
– Sustainability indices based on public sustainability performance disclosure require sustainability reporting by publicly-listed companies who wish to participate in and compete on the Index. Therefore, the creation of a Sustainability Index for a given securities market tends to catalyze widespread sustainability reporting without actually making it a requirement to do so. National level indices should be prioritized, as prestige and reputation-related competitiveness is often most prevalent at the national level (and can even indirectly promote sustainability reporting of large non-listed family-owned companies). The Egyptian Index should be supported and strengthened, while immediately adding Abu Dhabi, Saudi Arabia, and Jordan, and Qatar in the near term. Depending on the consistency of methodology, these can be aggregated into a regional Index to generate additional competitiveness and interest, but the greatest impact will be at national level.
• Promote and incentivize widespread sustainability reporting through the creation of prestigious awards.
SUSTAINABLE INVESTMENT IN THE MIDDLE EAST AND NORTH AFRICA, 2010104
– The development and promotion of prestigious awards has a demonstrated influence on behavior in the region, where such awards are aggressively contested. It is proposed that regional-level as well as national-level awards be developed, with appropriate high-level patronage. A prospective champion of such rewards, with demonstrated region-wide appeal in launching other regional initiatives, is Her Majesty Queen Rania Al Abdullah of Jordan, who is also founder and champion of the Arab Sustainability Leadership Group.
Measure: Number and percentage of publicly listed companies issuing sustainability reports.
Challenge: Align securities markets reform to national sustainability interests and disclosure interests.
Recommended Actions: • Expand governance reform and criteria on securities markets to include management and
disclosure of environmental and social elements of ESG.
– Many securities markets across the MENA region have demonstrated considerable progress in enhancing governance criteria and disclosure requirements for publicly listed companies. These efforts now are translating into visible governance reforms by the listed companies. These reforms also have had sufficient time for initial implementation and can be complemented by reasonable additional reforms that need not place unmanageable demands on listed companies. It is recommended that these reforms build on the governance element by enhancing the focus on the environmental and social dimensions of ESG, essentially adopting a range of guidance on sustainability management and reporting by listed companies. The specific reforms and criteria can be discussed within national level sustainability forums and networks so as to promote the widest possible buy-in for such reforms.
Measure: Percentage of securities markets requiring established basket of ESG disclosure measures.
Challenge: Increase comfort and reduce hesitation of potential early adopters by utilizing well-established international guidelines.
Recommended Actions: • Leverage international guidelines and tools to accelerate speed and ease of take-up of
sustainability and SI.
– There are numerous international guidelines and tools that provide a sound level of guidance on sustainability and SI. These tools are widely applicable to MENA, and include the Global Reporting Initiative, Equator Principles, Carbon Disclosure Project, CDP Water, and the UN Global Compact. These mechanisms can be used as reliable and tested guidance for companies and investment institutions. They can reduce concerns relating to first movers in a market and instead provide prestige and positioning as taking leadership in adopting international standards. Leadership organizations in the region should be encouraged to adopt these standards as tools for accelerating their confidence and speed of take-up of sustainability and SI.
• Profile benefits gained by regional leadership companies and governments from using these guidelines.
– The efforts of leadership companies and governments adopting these guidelines should be profiled and recognized, and the specific benefits identified by these organizations should be emphasized. Leadership networks such as the ASLG or other regional networks can assist by encouraging the adoption of these guidelines and profiling the success stories and benefits to implementing organizations.
1055. CHALLENGES AND OPPORTUNITIES FOR DEVELOPMENT OF THE SUSTAINABLE INVESTMENT MARKET IN MENA
Measure: Number of regional signatories or adopters of GRI, Equator Principles, CDP, CDP Water, and UN Global Compact.
Challenge: Mobilize rapid and broad disclosure and action on high-priority sustainability issues.
Recommended Actions: • Concentrate any initial disclosure requirements on high-priority regional issues (e.g. water).
– While broad sustainability disclosure is essential for SI, the general uptake of sustainability may be most easily encouraged by placing emphasis on those sustainability issues already recognized as more pressing and requiring transparency and action. Such issues include those described earlier in this report: water management; energy infrastructure, optimization and diversification, and greenhouse gas emissions; skills development and preparation of the youth bulge for the workforce; and gender equality. Focusing on the most relevant issues in a manner that generates positive benefits, while limiting the initial scope and complexity of sustainability management, may serve as a manageable bridge to sustainability that otherwise would not be crossed.
• Initiate national and regional flagship projects on high priority sustainability issues.
– Following the logic of the preceding recommendation, there may be added benefits to encouraging individual actors to address priority issues, and organizing flagship projects that aim to tackle the highest priority regional sustainability issues in a manner that could not be achieved by individual actors. Such initiatives could be national in scope—led by national governments or business associations—or they could be led by regional sustainability networks. Priority issues for consideration include water, energy, and GHG emissions management, and in many cases issue-specific international guidelines and tools can be adopted to facilitate the process (such as CDP for GHG emissions and CDP Water for water management projects).
Measure: Number and percentage of publicly-listed companies, private companies, and other stakeholders participating in and demonstrating performance gains on flagship initiatives.
Challenge: Create an infrastructure that supports sustainability in practice.
Recommended Actions: • Promote investment and entrepreneurialism in service areas critical to a more sustainable
economy (e.g. recycling).
– This recommendation derives from the combined regional challenges of a lack of supporting infrastructure for a sustainability-oriented economy (such as recycling facilities, green building, smart grids, etc.), and limited economic diversification with an emphasis on non-sustainable industry (particularly in the GCC). There are significant entrepreneurial and investment opportunities to address these market gaps, which increase SI opportunities and opportunities for companies, governments, and citizens to adopt sustainability practices. As services come online, governments can reinforce the use of such services and infrastructure through legislative requirements, which, in turn, would promote further industry development. Alternatively, where barriers or disincentives to invest in sustainability-oriented industries exist, governments could use long-term legislation to create market attractiveness for potential sustainability-related investments
Measure: Measured diversification of economy into sustainability-oriented sectors, including measured investment in these sectors and measured growth in relevant SMEs.
SUSTAINABLE INVESTMENT IN THE MIDDLE EAST AND NORTH AFRICA, 2010106
Market Interest
Challenge: Increase the percentage of sustainability screened AUM.
Recommended Actions: • Encourage institutional fund managers to integrate sustainability into their screening criteria
from a risk/opportunity management perspective, regardless of any public commitment to sustainability.
– The emphasis of this recommendation is that institutional fund managers and fund marketers need not be sold on the marketability of sustainability-screened investing before adopting such screens. There is a sufficient business case for institutional investors to adopt sustainability screening as part of standard screening. This, in turn, will influence uptake of sustainability management, performance, and reporting in the marketplace, regardless of any demonstrated interest by individual citizen investors. The aforementioned training programs targeting institutional investors and the participation of key companies in regional leadership networks and sub-committees both aim to provide learning platforms for executing this recommendation.
• Over time, promote sustainability-screening as an advantage, and/or launch sustainability-screened funds.
– While institutional fund managers initially may determine that there is limited interest in sustainability-screened investment funds, they may over time promote their sustainability-screening as value-added to clients. This can be marketed with regard to existing products, without trying to encourage clients to shift or buy into new SI products. As time and market awareness evolve further, these institutions may wish to begin launching explicit sustainability-screened and sustainability-themed funds.
• Encourage SWF portfolio companies to adopt sustainability management and reporting to engage their SWFs.
– While SWFs may be approached directly regarding SI and sustainability performance across their portfolios, they may also be influenced by their own portfolio companies who may allow for adoption in incremental steps. This strategy paves the way for take-up of sustainability management and reporting by the majority of the SWF holdings and the SWF itself as an aggregate of the portfolio companies. Portfolio companies also have direct and privileged relations with regional SWFs; these relationships are not enjoyed by outsiders seen as wishing to impose Western standards while seeking SWF support. Portfolio companies can approach SWFs from the perspective of the pure business benefits for the company, and individually or collectively can engage, together with the SWF, on SI for the SWF in the context of supporting its own sustainability agenda, its projection of international soft power, and its portfolio performance.
Measure: Percentage of regional AUM using sustainability screens, including measured breakdown by category of SI stakeholders (i.e. SWFs, PE, Shari’ah compliant investments, and foreign investment).
107APPENDIX 1-EXPLANATION OF THE METHODOLOGY
Appendix 1-Explanation of the Methodology
The methodologies used for the research and analysis of this report’s main sections are summarized below under their corresponding sections.
MARKET PREPAREDNESSESG and Investment Regulations and Country Performance
The assessment of ESG and investment regulatory frameworks in each market allowed for some comparison of regulations versus country performance. The relevant indices used throughout the report were:
• Investment laws and regulations:
– The eStandards Forum75 index, which assesses the investment laws and regulations of each country based on their compliance with international best practices. The study did not use any measure to assess national performance as relates to investment.
• Governance laws and regulations:
– Director Liability Index and the Extent of Disclosure Index, two component indices of The Investor Protection Index, and subcomponents of the IBRD/World Bank 2010 Doing Business Indicators.76
– Strength of Auditing and Accounting Index, from World Economic Forum’s (WEF) Global Competitiveness Report, 2010-2011.
• Corporate governance country performance:
– Efficacy of Corporate Boards Index from WEF Global Competitiveness Report, 2010-2011.
– Ethical Behavior of Firms Index, from WEF Global Competitiveness Report, 2010-2011.
– Corruption Perception Index by Transparency International, 2009.
• Environmental laws and regulations:
– Stringency of Environmental Laws Index, from WEF’s Travel and Tourism Competitiveness Report, 2009.
– Level of Enforcement of Environmental Laws Index, from WEF’s Travel and Tourism Competitiveness Report, 2009.
• Environmental country performance:
– Environmental Performance Index (EPI), 2010.77
• Social laws and regulations:
– Gender Empowerment Measures index from the UNDP Human Development Report, 2009.
– Ratification of Basic Worker’s Rights Index, from the International Labor Organization.
– Rigidity of Employment Index from the World Bank’s Doing Business Report, 2010.
• Social country performance:
– Gender Gap Index, from WEF’s Global Gender Gap Report, 2009.
75Financial Standards Foundation, eStandardsforum, Available : http://www.estandardsforum.org/
76World Bank, Doing Business 2010, Available : http://www.doingbusiness.org/economyrankings/
772010 Environmental Performance Index, Yale Center for Environmental Law & Policy et al, Available : http://epi.yale.edu/Countries
SUSTAINABLE INVESTMENT IN THE MIDDLE EAST AND NORTH AFRICA, 2010108
– Hiring and Firing Practices Index, from WEF’s Global Competitiveness Report, 2010-2011.
– Human Rights Ranking by Carleton University’s Country Indicators for Foreign Policy (CIFP), 2007.
ESG Disclosure
The assessment of ESG disclosure was based on two factors:
• Sustainability and ESG reporting/issue of UN Global Compact Communications on Progress (COP) by publicly listed companies/review of reports registered on the Corporate Register:78 The score for this factor was generated by assessing the total number of publicly listed companies producing sustainability and ESG reports/ UN Global Compact COPs as a percentage of the market based on their market valuations.
• Voluntary international agreements: The score for this factor was an averaged ratio of the following:
– Total assets of signatories to the Equator Principles (EPs) in each country to the total assets of major banks for the country.
– Total assets of banks that are signatories to the UNEP Finance Initiative (UNEP FI) in each country to the total assets of major banks in the country.
– Total assets under management (AUM) managed by signatories to the UN PRI to the total regional AUM.
Weights were defined for this dimension of the analysis based on an assessment of the relative importance of each driver—investment, ESG regulations, and Country Performance; and ESG Disclosure. While the components of these drivers have different relative importance by market, this analysis kept them constant to allow for a consistent regional comparative assessment.
78Regulated EHS reporting is not included in this component. To control for this, the UNGC COP criterion was added since COPs capture EHS data, and the Reports available on the Corporate Register from the region were reviewed.
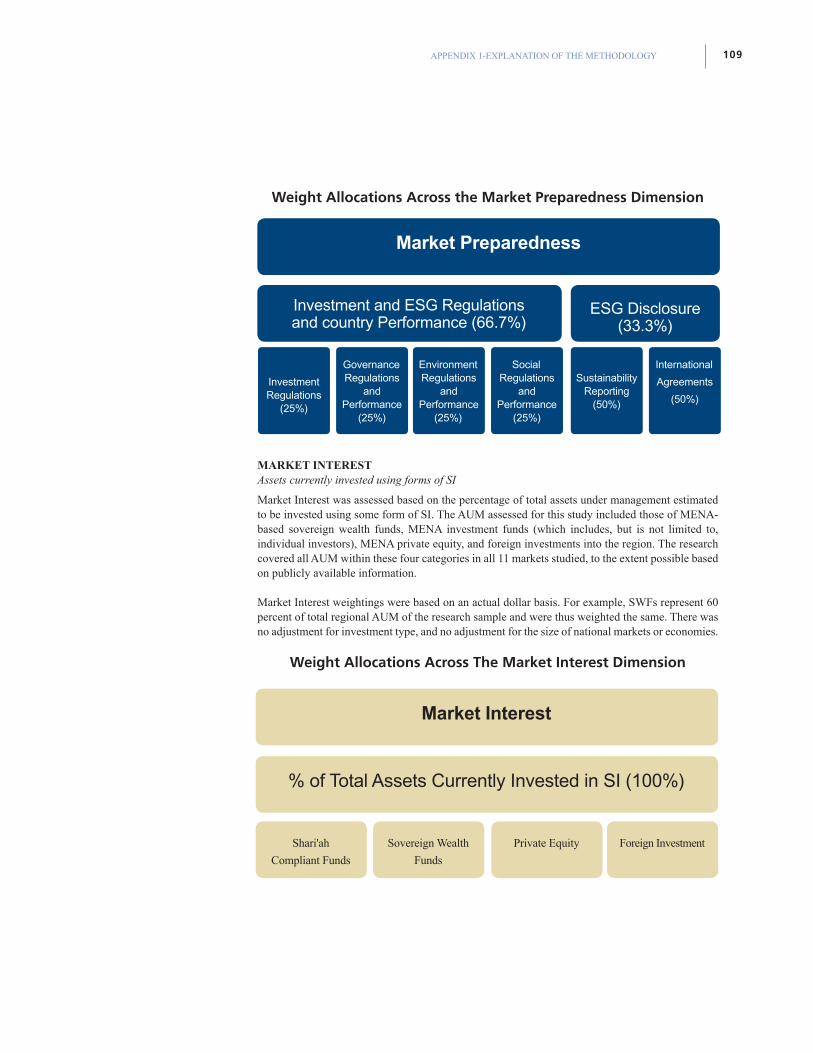
109APPENDIX 1-EXPLANATION OF THE METHODOLOGY
Weight Allocations Across the Market Preparedness Dimension
MARKET INTERESTAssets currently invested using forms of SI
Market Interest was assessed based on the percentage of total assets under management estimated to be invested using some form of SI. The AUM assessed for this study included those of MENA-based sovereign wealth funds, MENA investment funds (which includes, but is not limited to, individual investors), MENA private equity, and foreign investments into the region. The research covered all AUM within these four categories in all 11 markets studied, to the extent possible based on publicly available information.
Market Interest weightings were based on an actual dollar basis. For example, SWFs represent 60 percent of total regional AUM of the research sample and were thus weighted the same. There was no adjustment for investment type, and no adjustment for the size of national markets or economies.
Weight Allocations Across The Market Interest Dimension
Market Interest
% of Total Assets Currently Invested in SI (100%)
Shari'ah
Compliant Funds
Sovereign Wealth
Funds
Private Equity Foreign Investment
ESG Disclosure(33.3%)
Investment Regulations
(25%)
Environment Regulations
andPerformance
(25%)
Sustainability Reporting
(50%)
Governance Regulations
andPerformance
(25%)
SocialRegulations
andPerformance
(25%)
International
Agreements
(50%)
Investment and ESG Regulationsand country Performance (66.7%)
Market Preparedness
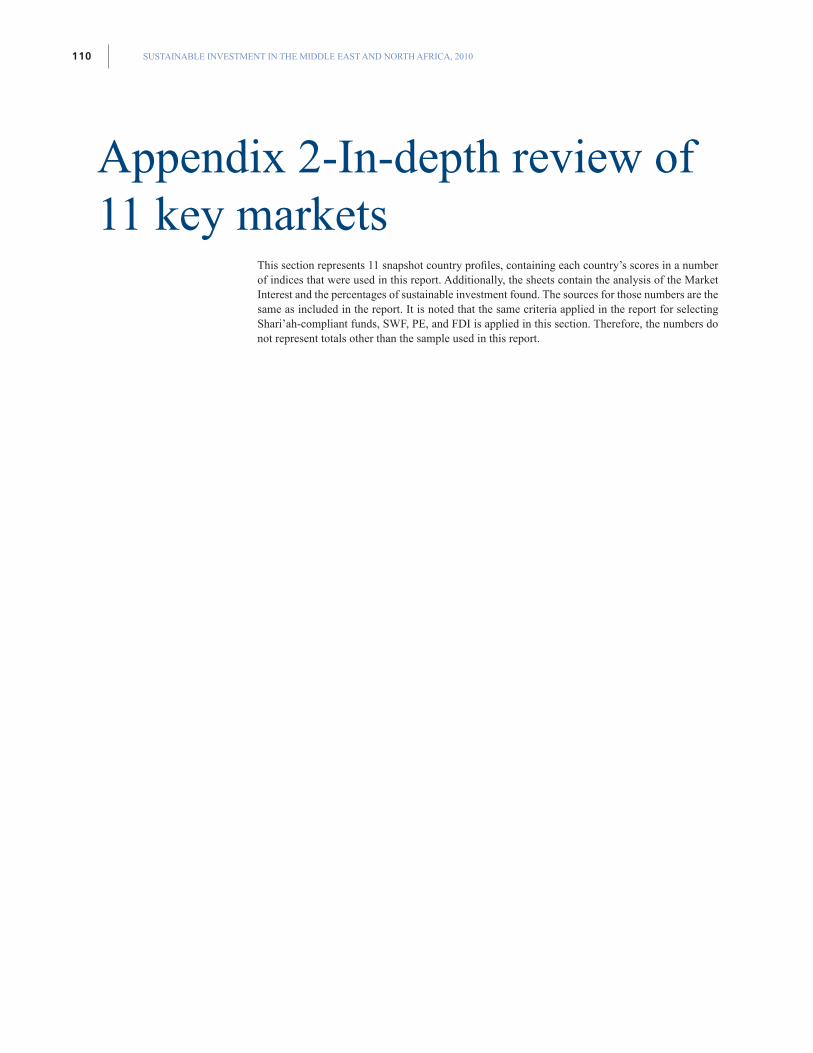
SUSTAINABLE INVESTMENT IN THE MIDDLE EAST AND NORTH AFRICA, 2010110
Appendix 2-In-depth review of 11 key markets
This section represents 11 snapshot country profiles, containing each country’s scores in a number of indices that were used in this report. Additionally, the sheets contain the analysis of the Market Interest and the percentages of sustainable investment found. The sources for those numbers are the same as included in the report. It is noted that the same criteria applied in the report for selecting Shari’ah-compliant funds, SWF, PE, and FDI is applied in this section. Therefore, the numbers do not represent totals other than the sample used in this report.
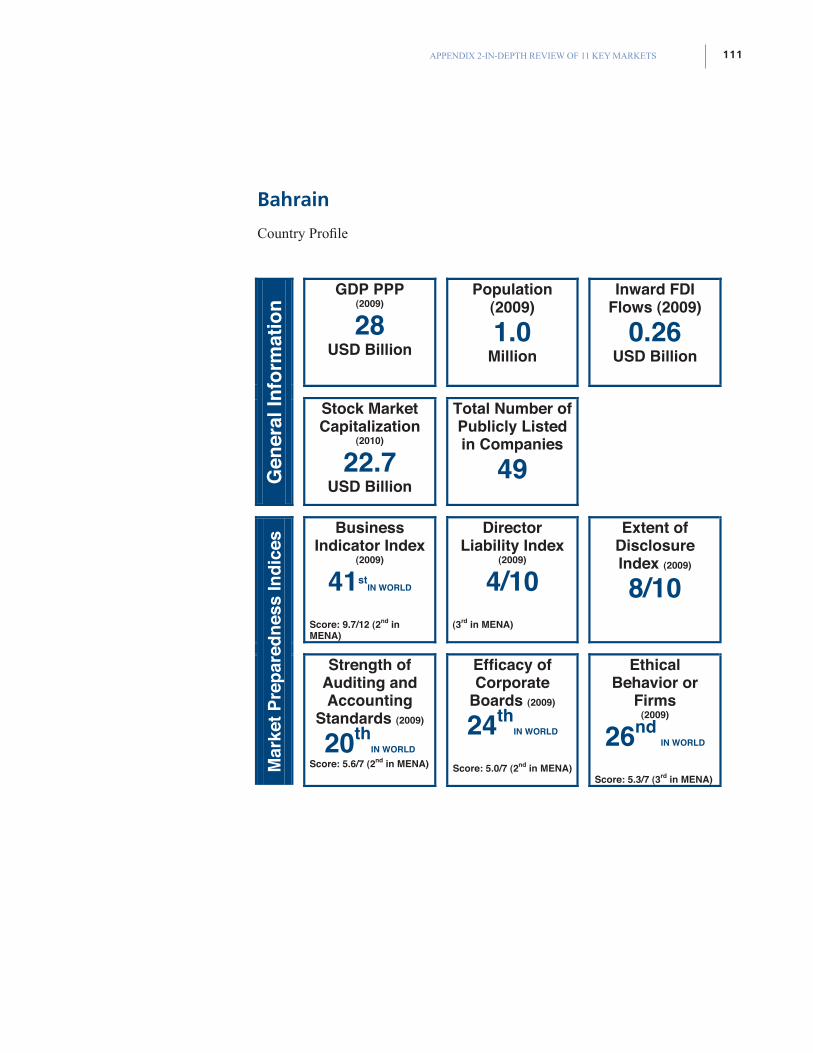
111APPENDIX 2-IN-DEPTH REVIEW OF 11 KEY MARKETS
Bahrain
Country Profile
GDP PPP (2009)
28USD Billion
Population(2009)
1.0Million
Inward FDI Flows (2009)
0.26 USD Billion
Gen
eral
Info
rmat
ion
Stock Market Capitalization
(2010)
22.7USD Billion
Total Number of Publicly Listed in Companies
49
BusinessIndicator Index
(2009)
41stIN WORLD
Score: 9.7/12 (2nd in MENA)
Director Liability Index
(2009)
4/10(3rd in MENA)
Extent of DisclosureIndex (2009)
8/10
Mar
ket P
repa
redn
ess
Indi
ces
Strength of Auditing and Accounting
Standards (2009)
20thIN WORLD
Score: 5.6/7 (2nd in MENA)
Efficacy of Corporate
Boards (2009)
24thIN WORLD
Score: 5.0/7 (2nd in MENA)
EthicalBehavior or
Firms(2009)
26ndIN WORLD
Score: 5.3/7 (3rd in MENA)
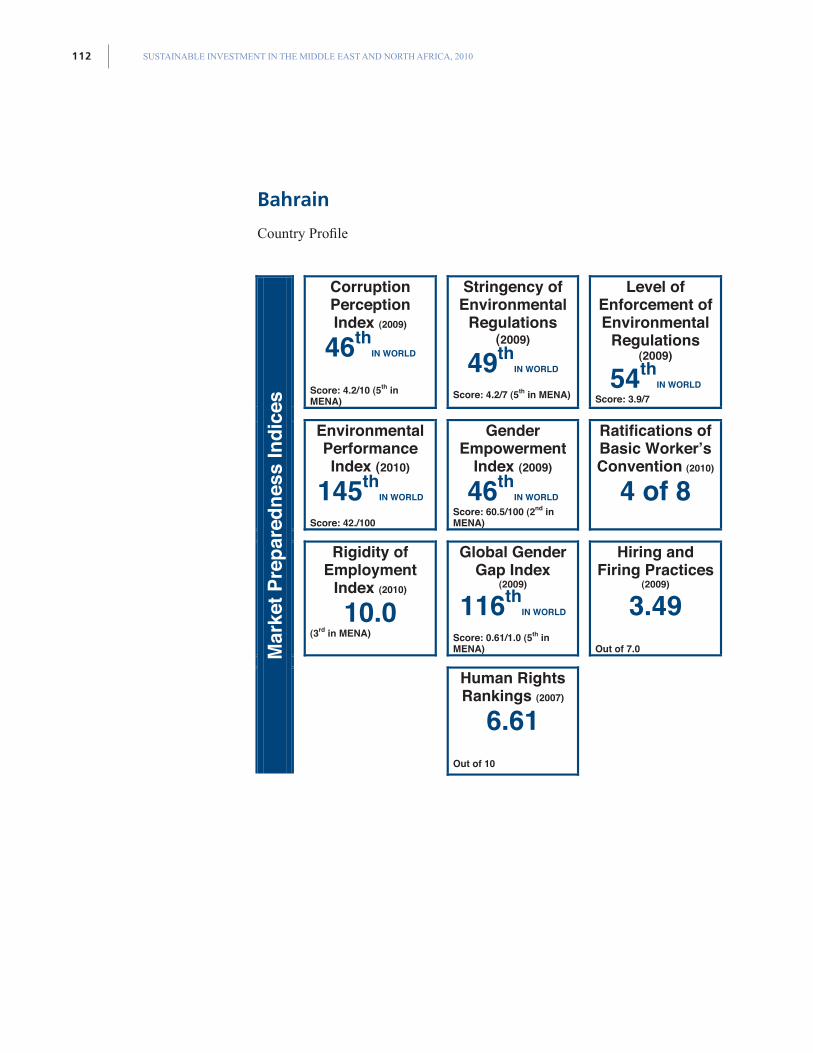
SUSTAINABLE INVESTMENT IN THE MIDDLE EAST AND NORTH AFRICA, 2010112
Bahrain
Country Profile
Corruption PerceptionIndex (2009)
46thIN WORLD
Score: 4.2/10 (5th in MENA)
Stringency of Environmental
Regulations (2009)
49thIN WORLD
Score: 4.2/7 (5th in MENA)
Level of Enforcement of Environmental
Regulations (2009)
54thIN WORLD
Score: 3.9/7
Environmental Performance Index (2010)
145thIN WORLD
Score: 42./100
Gender Empowerment
Index (2009)
46thIN WORLD
Score: 60.5/100 (2nd in MENA)
Ratifications of Basic Worker’s Convention (2010)
4 of 8
Rigidity of Employment
Index (2010)
10.0(3rd in MENA)
Global Gender Gap Index
(2009)
116thIN WORLD
Score: 0.61/1.0 (5th in MENA)
Hiring and Firing Practices
(2009)
3.49Out of 7.0 M
arke
t Pre
pare
dnes
s In
dice
s
Human Rights Rankings (2007)
6.61Out of 10
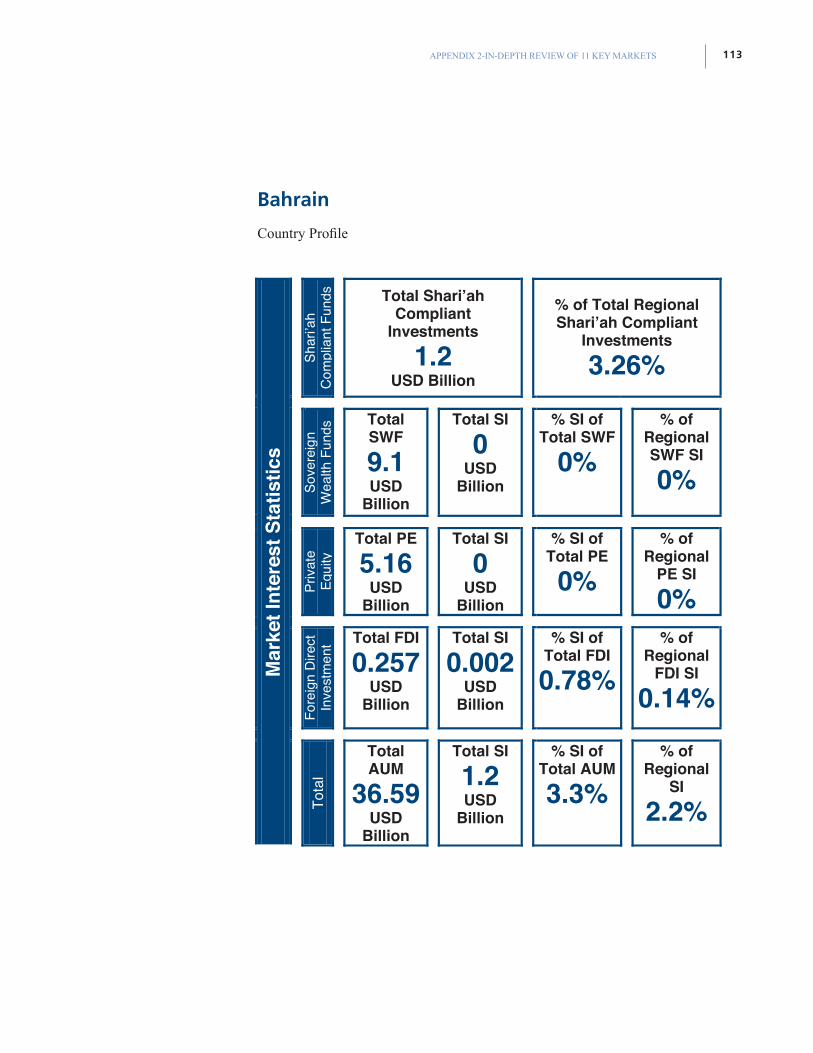
113APPENDIX 2-IN-DEPTH REVIEW OF 11 KEY MARKETS
Bahrain
Country Profile
Shar
i’ah
Com
plia
nt F
unds
Total Shari’ah Compliant
Investments
1.2USD Billion
% of Total Regional Shari’ah Compliant
Investments
3.26%
Sove
reig
n W
ealth
Fun
ds Total
SWF
9.1USD
Billion
Total SI
0USD
Billion
% SI of Total SWF
0% % of
Regional SWF SI
0%
Priv
ate
Equi
t y
Total PE
5.16USD
Billion
Total SI
0USD
Billion
% SI of Total PE
0% % of
Regional PE SI
0%
Fore
ign
Dire
ct
Inve
stm
ent Total FDI
0.257USD
Billion
Total SI
0.002USD
Billion
% SI of Total FDI
0.78% % of
Regional FDI SI
0.14%
Mar
ket I
nter
est S
tatis
tics
Tota
l
TotalAUM
36.59USD
Billion
Total SI
1.2USD
Billion
% SI of Total AUM
3.3% % of
Regional SI
2.2%
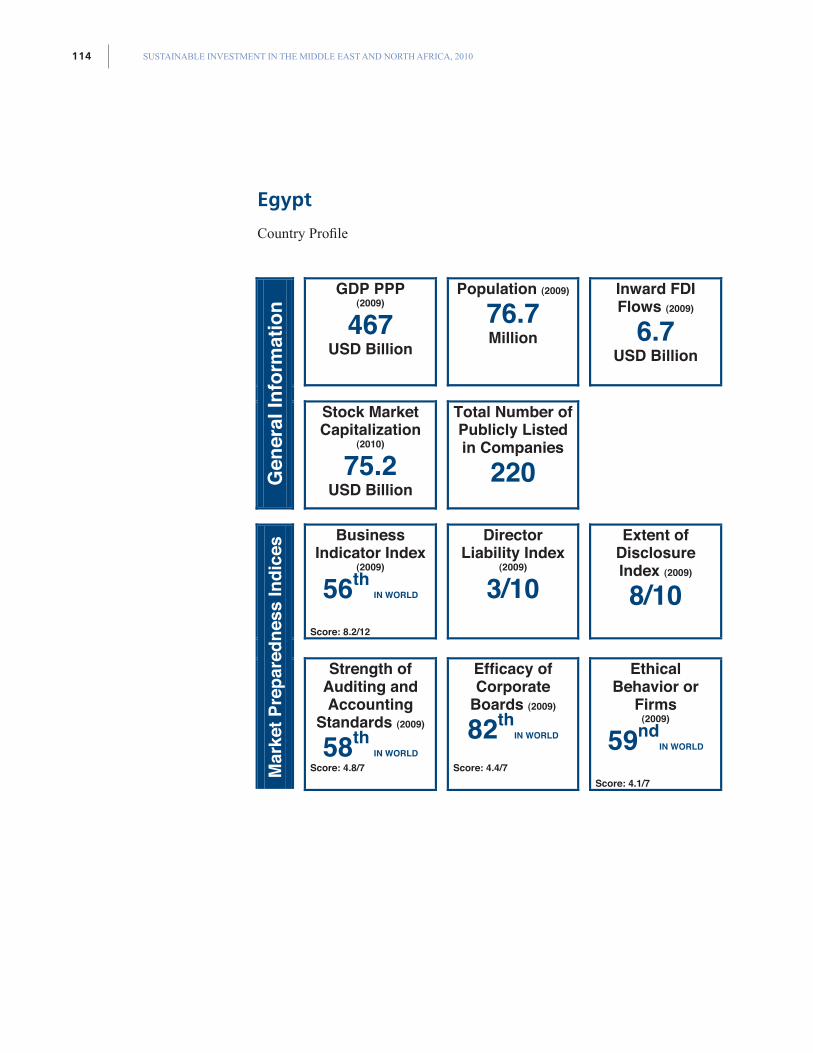
SUSTAINABLE INVESTMENT IN THE MIDDLE EAST AND NORTH AFRICA, 2010114
Egypt
Country Profile
GDP PPP (2009)
467USD Billion
Population (2009)
76.7Million
Inward FDI Flows (2009)
6.7USD Billion
Gen
eral
Info
rmat
ion
Stock Market Capitalization
(2010)
75.2USD Billion
Total Number of Publicly Listed in Companies
220
BusinessIndicator Index
(2009)
56thIN WORLD
Score: 8.2/12
Director Liability Index
(2009)
3/10
Extent of DisclosureIndex (2009)
8/10
Mar
ket P
repa
redn
ess
Indi
ces
Strength of Auditing and Accounting
Standards (2009)
58thIN WORLD
Score: 4.8/7
Efficacy of Corporate
Boards (2009)
82thIN WORLD
Score: 4.4/7
EthicalBehavior or
Firms(2009)
59ndIN WORLD
Score: 4.1/7
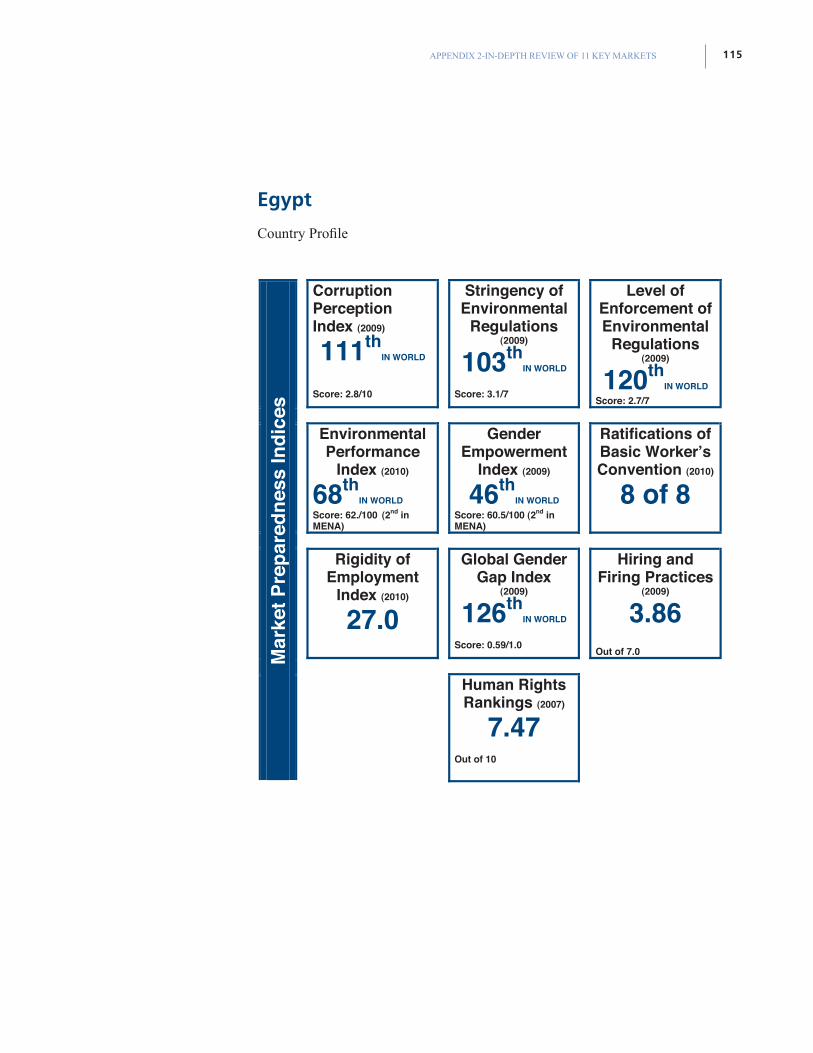
115APPENDIX 2-IN-DEPTH REVIEW OF 11 KEY MARKETS
Egypt
Country Profile
Corruption PerceptionIndex (2009)
111thIN WORLD
Score: 2.8/10
Stringency of Environmental
Regulations (2009)
103thIN WORLD
Score: 3.1/7
Level of Enforcement of Environmental
Regulations (2009)
120thIN WORLD
Score: 2.7/7
Environmental Performance
Index (2010)
68thIN WORLD
Score: 62./100 (2nd in MENA)
Gender Empowerment
Index (2009)
46thIN WORLD
Score: 60.5/100 (2nd in MENA)
Ratifications of Basic Worker’s Convention (2010)
8 of 8
Rigidity of Employment
Index (2010)
27.0
Global Gender Gap Index
(2009)
126thIN WORLD
Score: 0.59/1.0
Hiring and Firing Practices
(2009)
3.86Out of 7.0 M
arke
t Pre
pare
dnes
s In
dice
s
Human Rights Rankings (2007)
7.47Out of 10
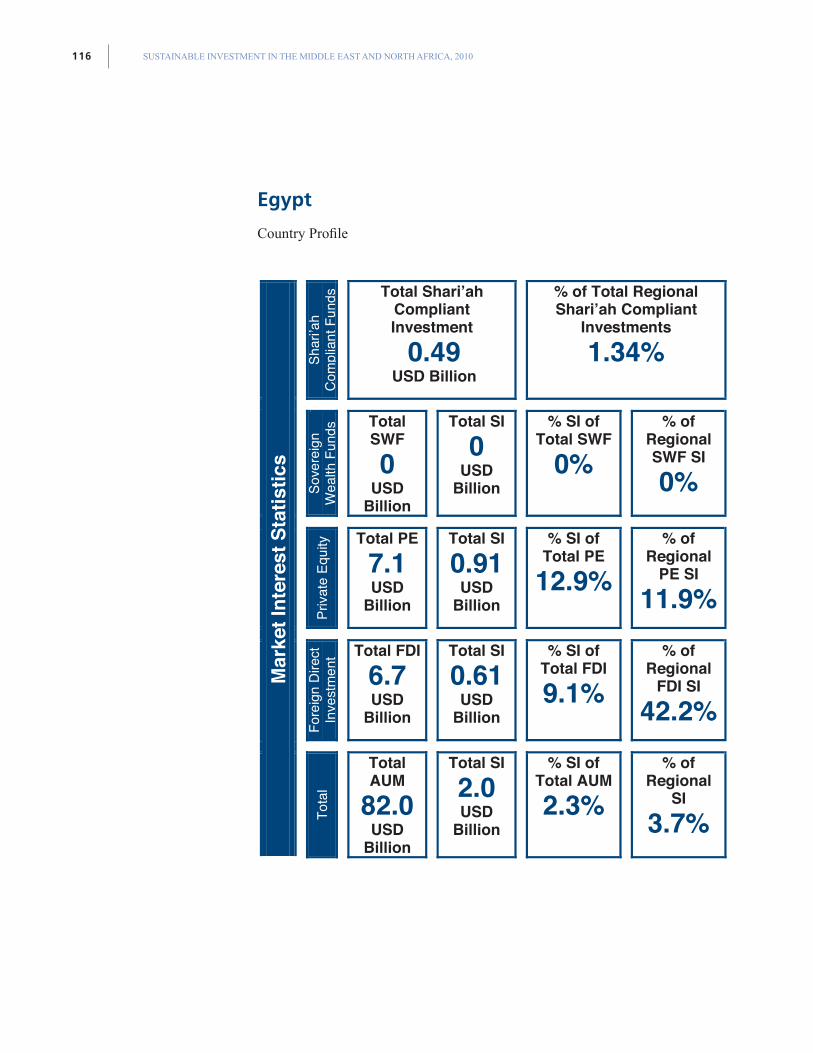
SUSTAINABLE INVESTMENT IN THE MIDDLE EAST AND NORTH AFRICA, 2010116
Egypt
Country Profile
Shar
i’ah
Com
plia
nt F
unds
Total Shari’ah CompliantInvestment
0.49USD Billion
% of Total Regional Shari’ah Compliant
Investments
1.34%
Sove
reig
n W
ealth
Fun
ds Total
SWF
0USD
Billion
Total SI
0USD
Billion
% SI of Total SWF
0% % of
RegionalSWF SI
0%
Priv
ate
Equi
ty Total PE
7.1USD
Billion
Total SI
0.91USD
Billion
% SI of Total PE
12.9% % of
RegionalPE SI
11.9%
Fore
ign
Dire
ct
Inve
stm
ent Total FDI
6.7USD
Billion
Total SI
0.61USD
Billion
% SI of Total FDI
9.1% % of
RegionalFDI SI
42.2%
Mar
ket I
nter
est S
tatis
tics
Tota
l
TotalAUM
82.0USD
Billion
Total SI
2.0 USD
Billion
% SI of Total AUM
2.3% % of
RegionalSI
3.7%
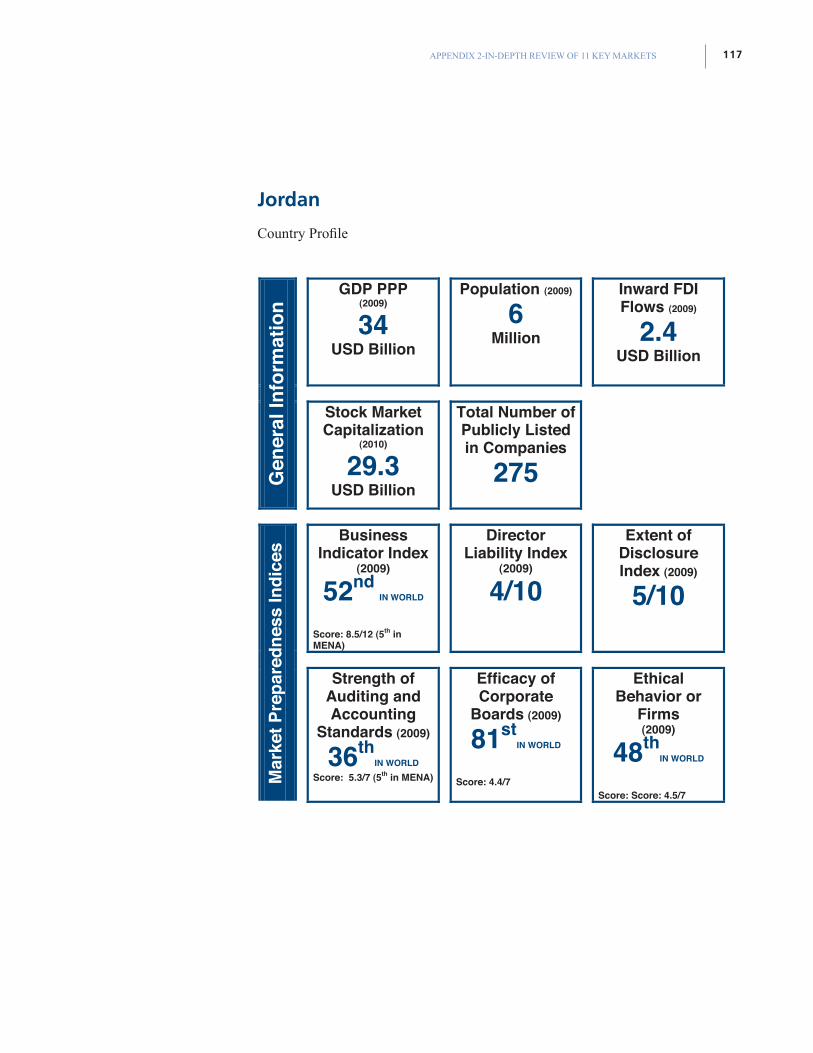
117APPENDIX 2-IN-DEPTH REVIEW OF 11 KEY MARKETS
Jordan
Country Profile
GDP PPP (2009)
34USD Billion
Population (2009)
6Million
Inward FDI Flows (2009)
2.4USD Billion
Gen
eral
Info
rmat
ion
Stock Market Capitalization
(2010)
29.3USD Billion
Total Number of Publicly Listed in Companies
275
BusinessIndicator Index
(2009)
52ndIN WORLD
Score: 8.5/12 (5th in MENA)
Director Liability Index
(2009)
4/10
Extent of DisclosureIndex (2009)
5/10
Mar
ket P
repa
redn
ess
Indi
ces
Strength of Auditing and Accounting
Standards (2009)
36thIN WORLD
Score: 5.3/7 (5th in MENA)
Efficacy of Corporate
Boards (2009)
81stIN WORLD
Score: 4.4/7
EthicalBehavior or
Firms(2009)
48thIN WORLD
Score: Score: 4.5/7
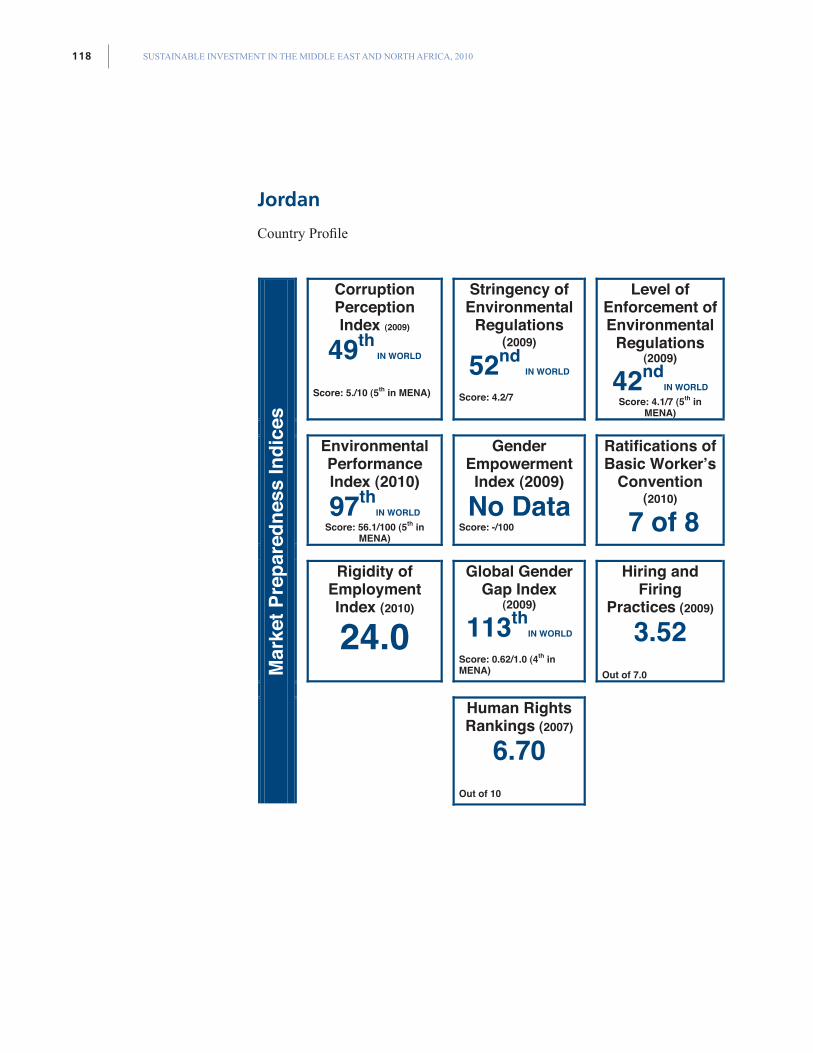
SUSTAINABLE INVESTMENT IN THE MIDDLE EAST AND NORTH AFRICA, 2010118
Jordan
Country Profile
Corruption PerceptionIndex (2009)
49th IN WORLD
Score: 5./10 (5th in MENA)
Stringency of Environmental
Regulations(2009)
52ndIN WORLD
Score: 4.2/7
Level of Enforcement of Environmental
Regulations (2009)
42ndIN WORLD
Score: 4.1/7 (5th in MENA)
Environmental PerformanceIndex (2010)
97thIN WORLD
Score: 56.1/100 (5th in MENA)
Gender EmpowermentIndex (2009)
No DataScore: -/100
Ratifications of Basic Worker’s
Convention (2010)
7 of 8
Rigidity of Employment Index (2010)
24.0
Global Gender Gap Index
(2009)
113thIN WORLD
Score: 0.62/1.0 (4th in MENA)
Hiring and Firing
Practices (2009)
3.52Out of 7.0
Mar
ket P
repa
redn
ess
Indi
ces
Human Rights Rankings (2007)
6.70Out of 10
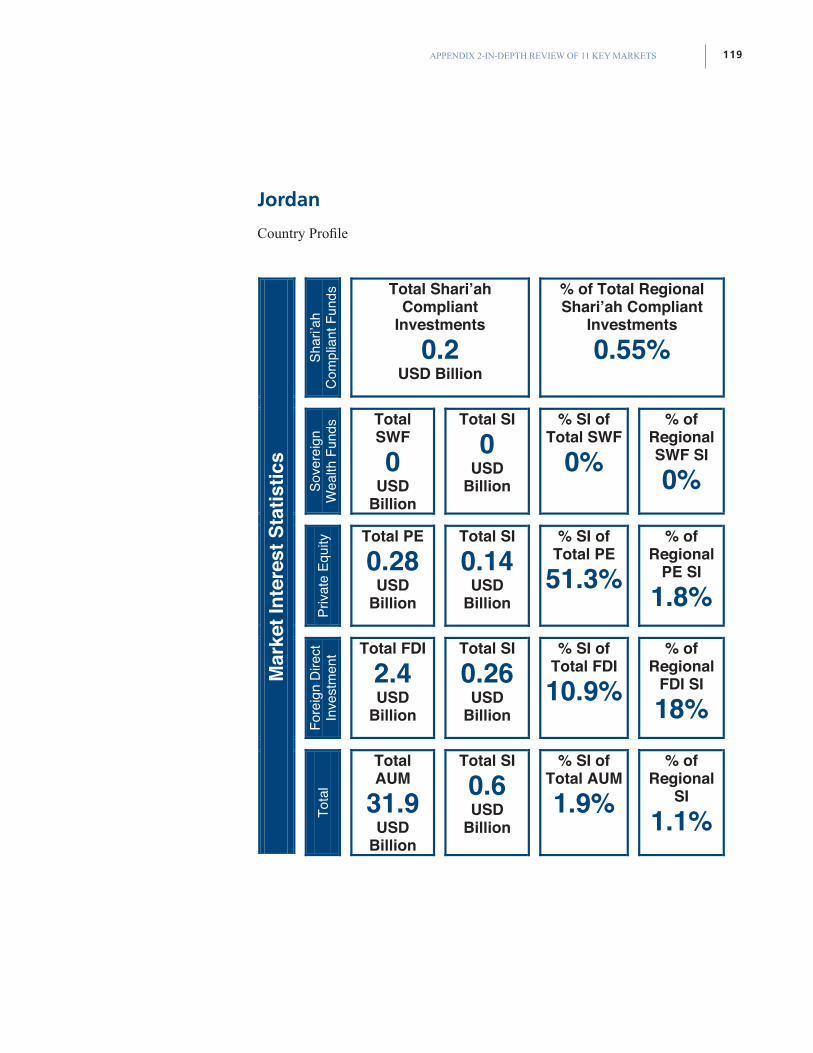
119APPENDIX 2-IN-DEPTH REVIEW OF 11 KEY MARKETS
Jordan
Country Profile
Shar
i’ah
Com
plia
nt F
unds
Total Shari’ah Compliant
Investments
0.2USD Billion
% of Total Regional Shari’ah Compliant
Investments
0.55%
Sove
reig
n W
ealth
Fun
ds Total
SWF
0USD
Billion
Total SI
0USD
Billion
% SI of Total SWF
0%% of
RegionalSWF SI
0%
Priv
ate
Equi
ty Total PE
0.28USD
Billion
Total SI
0.14USD
Billion
% SI of Total PE
51.3% % of
RegionalPE SI
1.8%
Fore
ign
Dire
ct
Inve
stm
ent Total FDI
2.4USD
Billion
Total SI
0.26USD
Billion
% SI of Total FDI
10.9% % of
RegionalFDI SI
18%
Mar
ket I
nter
est S
tatis
tics
Tota
l
TotalAUM
31.9USD
Billion
Total SI
0.6USD
Billion
% SI of Total AUM
1.9% % of
RegionalSI
1.1%
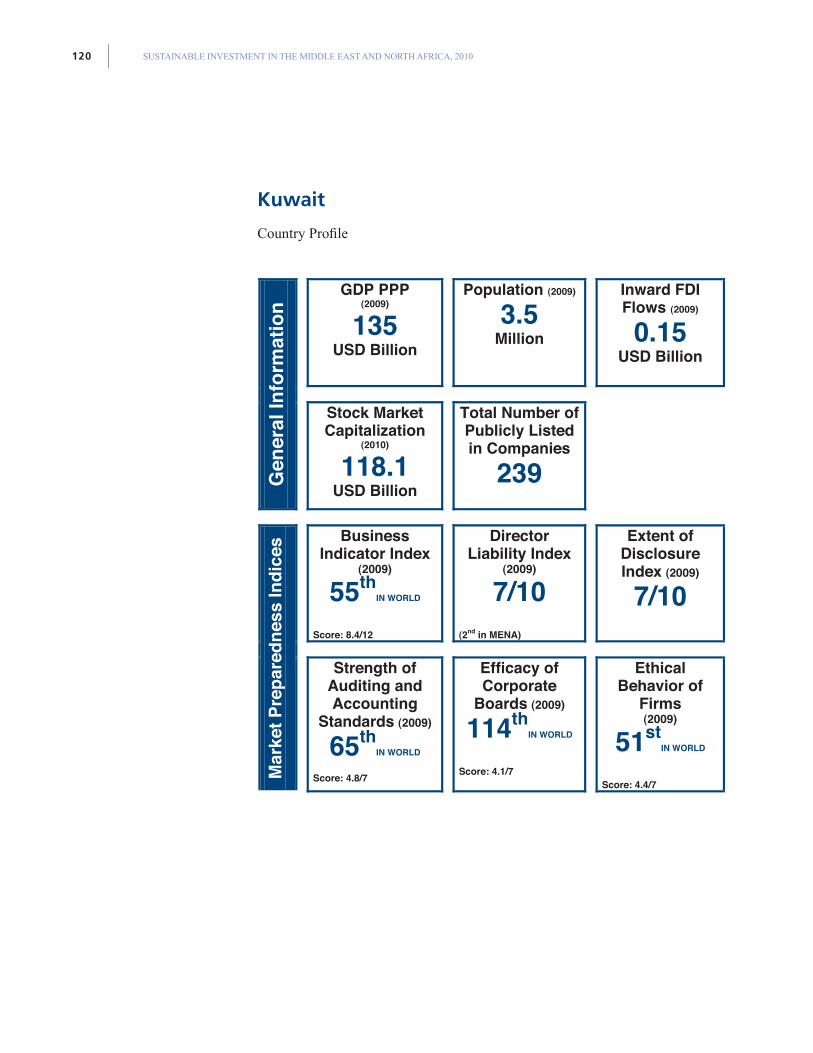
SUSTAINABLE INVESTMENT IN THE MIDDLE EAST AND NORTH AFRICA, 2010120
Kuwait
Country Profile
GDP PPP (2009)
135USD Billion
Population (2009)
3.5 Million
Inward FDI Flows (2009)
0.15USD Billion
Gen
eral
Info
rmat
ion
Stock Market Capitalization
(2010)
118.1USD Billion
Total Number of Publicly Listed in Companies
239
BusinessIndicator Index
(2009)
55thIN WORLD
Score: 8.4/12
Director Liability Index
(2009)
7/10(2nd in MENA)
Extent of Disclosure Index (2009)
7/10
Mar
ket P
repa
redn
ess
Indi
ces
Strength of Auditing and Accounting
Standards (2009)
65thIN WORLD
Score: 4.8/7
Efficacy of Corporate
Boards (2009)
114thIN WORLD
Score: 4.1/7
EthicalBehavior of
Firms(2009)
51stIN WORLD
Score: 4.4/7

121APPENDIX 2-IN-DEPTH REVIEW OF 11 KEY MARKETS
Kuwait
Country Profile
Corruption PerceptionIndex (2009)
66th IN WORLD
Score: 4.1/10
Stringency of Environmental
Regulations(2009)
105thIN WORLD
Score: 3.1/7
Level of Enforcement of Environmental
Regulations (2009)
107thIN WORLD
Score: 3.0/7
Environmental Performance Index (2010)
113thIN WORLD
Score: 51.1/100
Gender Empowerment Index (2009)
No DataScore: -/100
Ratifications of Basic Worker’s
Convention(2010)
7 of 8
Rigidity of Employment Index (2010)
0.0(1st in MENA)
Global Gender Gap Index
(2009)
113thIN WORLD
Score: 0.62/1.0 (4th in MENA)
Hiring and Firing Practices
(2009)
3.97Out of 7.0
Mar
ket P
repa
redn
ess
Indi
ces
Human Rights Rankings (2007)
6.33Out of 10

SUSTAINABLE INVESTMENT IN THE MIDDLE EAST AND NORTH AFRICA, 2010122
Kuwait
Country Profile
Shar
i’ah
Com
plia
nt F
unds
Total Shari’ah Compliant
Investments
1.2USD Billion
% of Total Regional Shari’ah Compliant
Investments
3.3%
Sove
reig
n W
ealth
Fun
ds Total
SWF
202.8USD
Billion
Total SI
0USD
Billion
% SI of Total SWF
0%% of
Regional SWF SI
0%
Priv
ate
Equi
ty Total PE
6.9USD
Billion
Total SI
0.12USD
Billion
% SI of Total PE
1.8% % of
Regional PE SI
1.6%
Fore
ign
Dire
ct
Inve
stm
ent Total FDI
0.15USD
Billion
Total SI
0.08USD
Billion
% SI of Total FDI
56.6% % of
Regional FDI SI
5.7%
Mar
ket I
nter
est S
tatis
tics
Tota
l
TotalAUM
327.9USD
Billion
Total SI
1.4USD
Billion
% SI of Total AUM
0.4% % of
Regional SI
2.6%
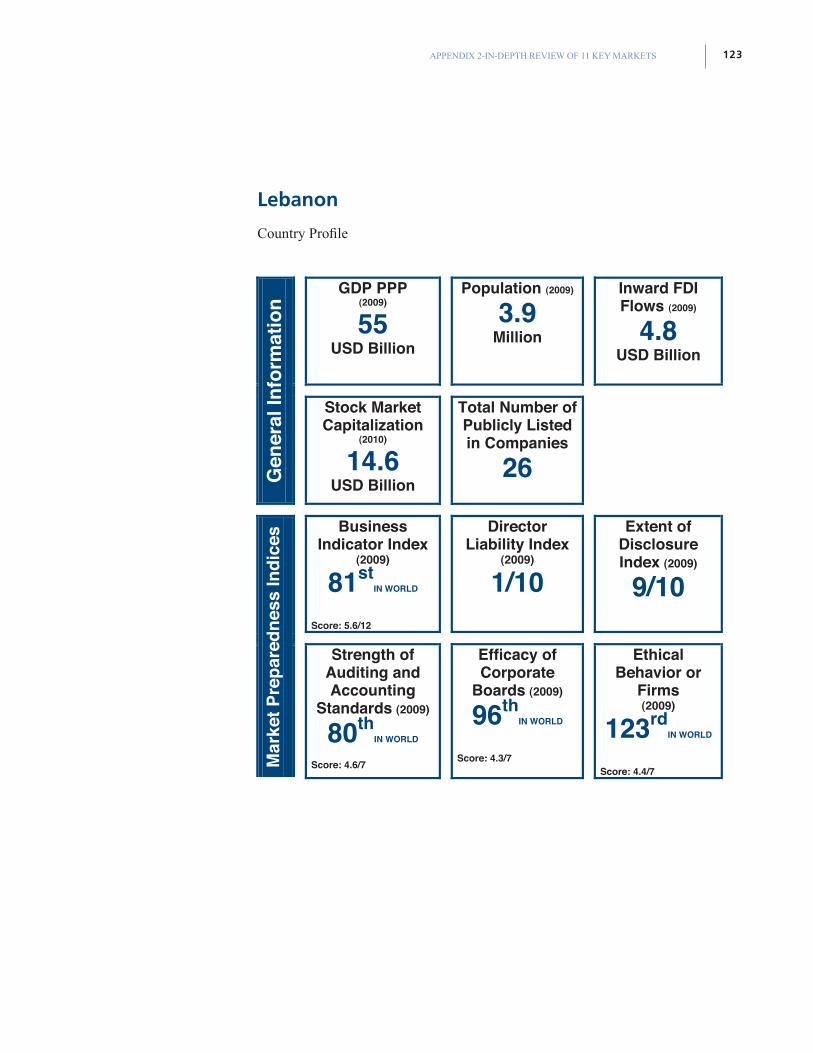
123APPENDIX 2-IN-DEPTH REVIEW OF 11 KEY MARKETS
Lebanon
Country Profile
GDP PPP (2009)
55USD Billion
Population (2009)
3.9 Million
Inward FDI Flows (2009)
4.8USD Billion
Gen
eral
Info
rmat
ion
Stock Market Capitalization
(2010)
14.6USD Billion
Total Number of Publicly Listed in Companies
26
BusinessIndicator Index
(2009)
81stIN WORLD
Score: 5.6/12
Director Liability Index
(2009)
1/10
Extent of Disclosure Index (2009)
9/10
Mar
ket P
repa
redn
ess
Indi
ces
Strength of Auditing and Accounting
Standards (2009)
80thIN WORLD
Score: 4.6/7
Efficacy of Corporate
Boards (2009)
96thIN WORLD
Score: 4.3/7
EthicalBehavior or
Firms(2009)
123rdIN WORLD
Score: 4.4/7
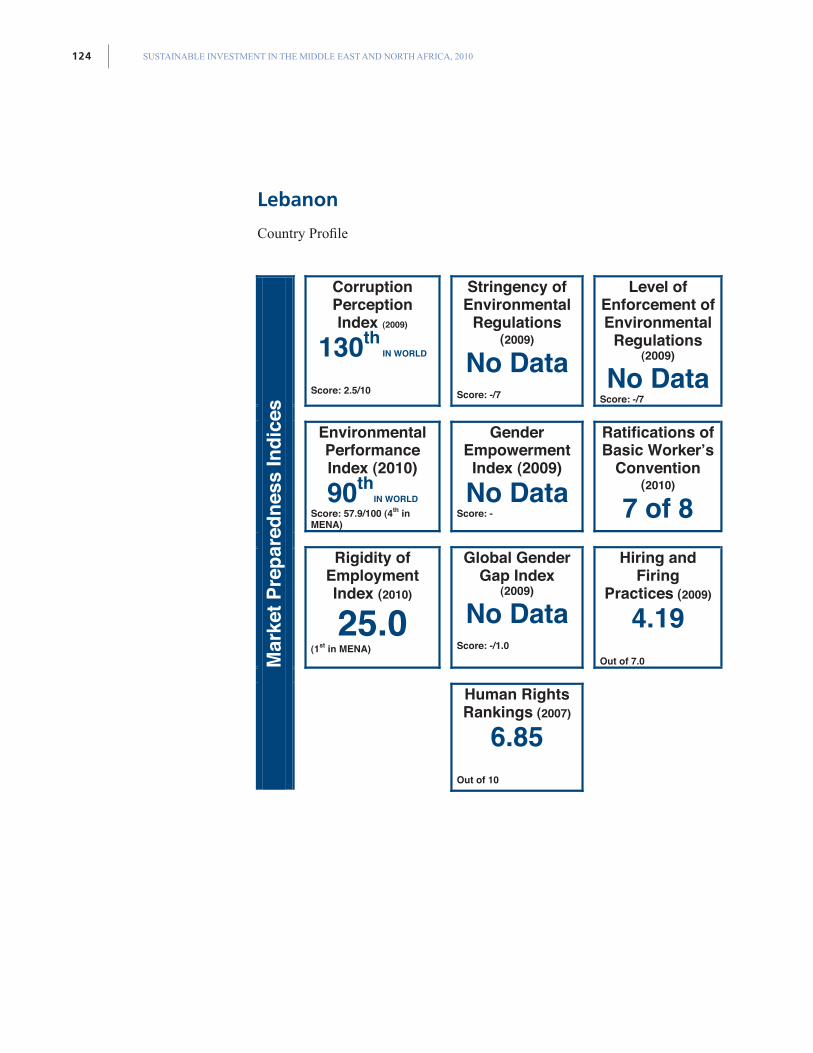
SUSTAINABLE INVESTMENT IN THE MIDDLE EAST AND NORTH AFRICA, 2010124
Lebanon
Country Profile
Corruption PerceptionIndex (2009)
130th IN WORLD
Score: 2.5/10
Stringency of Environmental
Regulations(2009)
No DataScore: -/7
Level of Enforcement of Environmental
Regulations (2009)
No DataScore: -/7
Environmental PerformanceIndex (2010)
90thIN WORLD
Score: 57.9/100 (4th in MENA)
Gender EmpowermentIndex (2009)
No DataScore: -
Ratifications of Basic Worker’s
Convention (2010)
7 of 8
Rigidity of Employment Index (2010)
25.0(1st in MENA)
Global Gender Gap Index
(2009)
No DataScore: -/1.0
Hiring and Firing
Practices (2009)
4.19Out of 7.0
Mar
ket P
repa
redn
ess
Indi
ces
Human Rights Rankings (2007)
6.85Out of 10
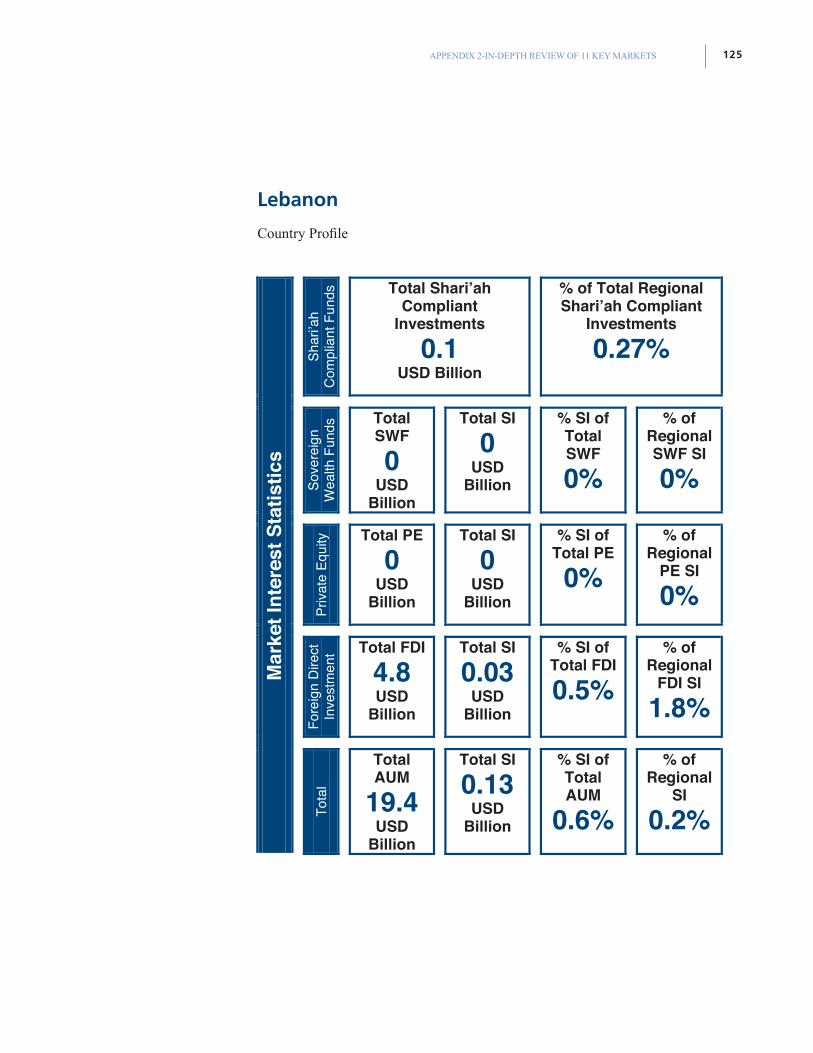
125APPENDIX 2-IN-DEPTH REVIEW OF 11 KEY MARKETS
Lebanon
Country Profile
Shar
i’ah
Com
plia
nt F
unds
Total Shari’ah Compliant
Investments
0.1USD Billion
% of Total Regional Shari’ah Compliant
Investments
0.27%
Sove
reig
n W
ealth
Fun
ds Total
SWF
0USD
Billion
Total SI
0USD
Billion
% SI of TotalSWF
0%
% of RegionalSWF SI
0%
Priva
te E
quity
Total PE
0USD
Billion
Total SI
0USD
Billion
% SI of Total PE
0% % of
RegionalPE SI
0%
Fore
ign
Dire
ct
Inve
stm
ent Total FDI
4.8USD
Billion
Total SI
0.03USD
Billion
% SI of Total FDI
0.5% % of
RegionalFDI SI
1.8%
Mar
ket I
nter
est S
tatis
tics
Tota
l
TotalAUM
19.4USD
Billion
Total SI
0.13USD
Billion
% SI of TotalAUM
0.6%
% of Regional
SI
0.2%
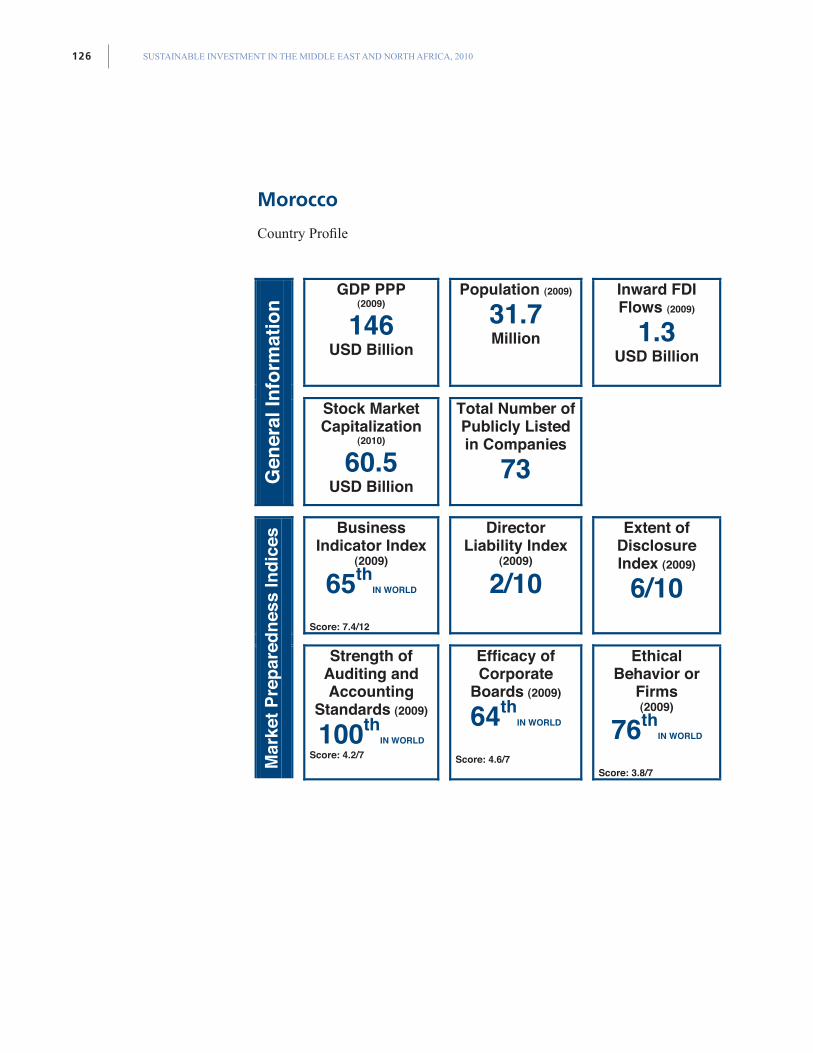
SUSTAINABLE INVESTMENT IN THE MIDDLE EAST AND NORTH AFRICA, 2010126
Morocco
Country Profile
GDP PPP (2009)
146USD Billion
Population (2009)
31.7Million
Inward FDI Flows (2009)
1.3USD Billion
Gen
eral
Info
rmat
ion
Stock Market Capitalization
(2010)
60.5USD Billion
Total Number of Publicly Listed in Companies
73
BusinessIndicator Index
(2009)
65thIN WORLD
Score: 7.4/12
Director Liability Index
(2009)
2/10
Extent of Disclosure Index (2009)
6/10
Mar
ket P
repa
redn
ess
Indi
ces
Strength of Auditing and Accounting
Standards (2009)
100thIN WORLD
Score: 4.2/7
Efficacy of Corporate
Boards (2009)
64thIN WORLD
Score: 4.6/7
EthicalBehavior or
Firms(2009)
76thIN WORLD
Score: 3.8/7
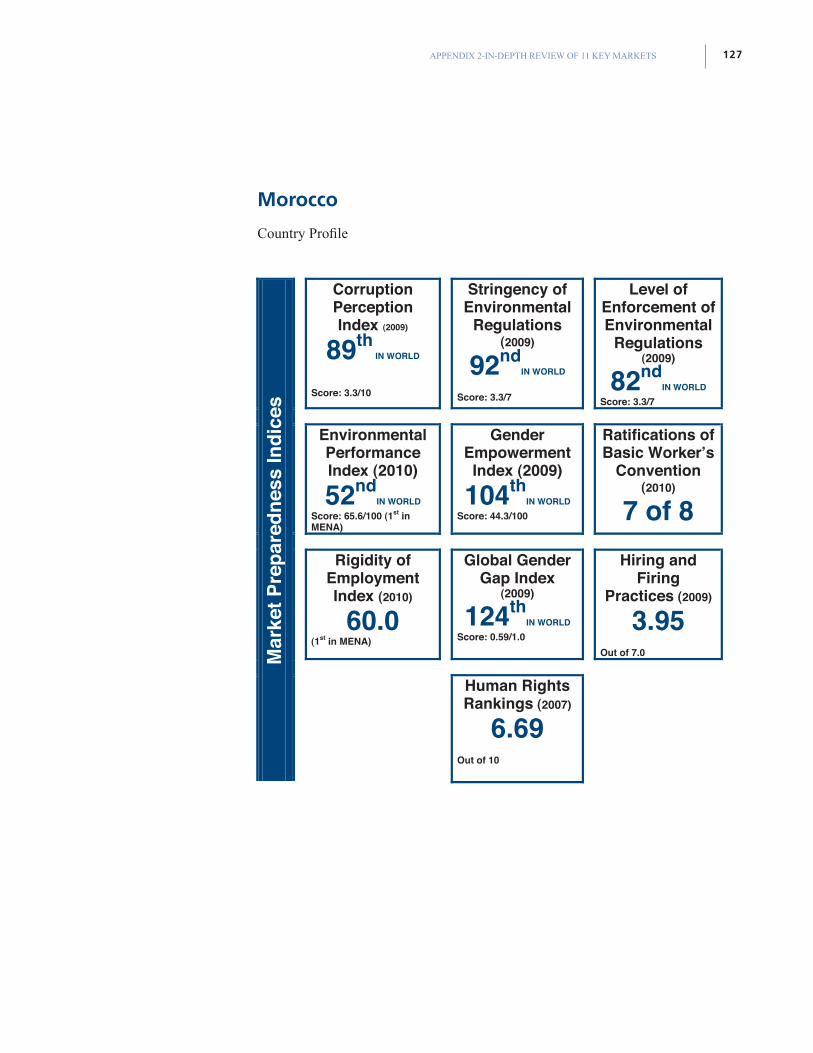
127APPENDIX 2-IN-DEPTH REVIEW OF 11 KEY MARKETS
Morocco
Country Profile
Corruption PerceptionIndex (2009)
89th IN WORLD
Score: 3.3/10
Stringency of Environmental
Regulations(2009)
92ndIN WORLD
Score: 3.3/7
Level of Enforcement of Environmental
Regulations (2009)
82ndIN WORLD
Score: 3.3/7
Environmental PerformanceIndex (2010)
52ndIN WORLD
Score: 65.6/100 (1st in MENA)
Gender EmpowermentIndex (2009)
104thIN WORLD
Score: 44.3/100
Ratifications of Basic Worker’s
Convention (2010)
7 of 8
Rigidity of Employment Index (2010)
60.0(1st in MENA)
Global Gender Gap Index
(2009)
124thIN WORLD
Score: 0.59/1.0
Hiring and Firing
Practices (2009)
3.95Out of 7.0 M
arke
t Pre
pare
dnes
s In
dice
s
Human Rights Rankings (2007)
6.69Out of 10
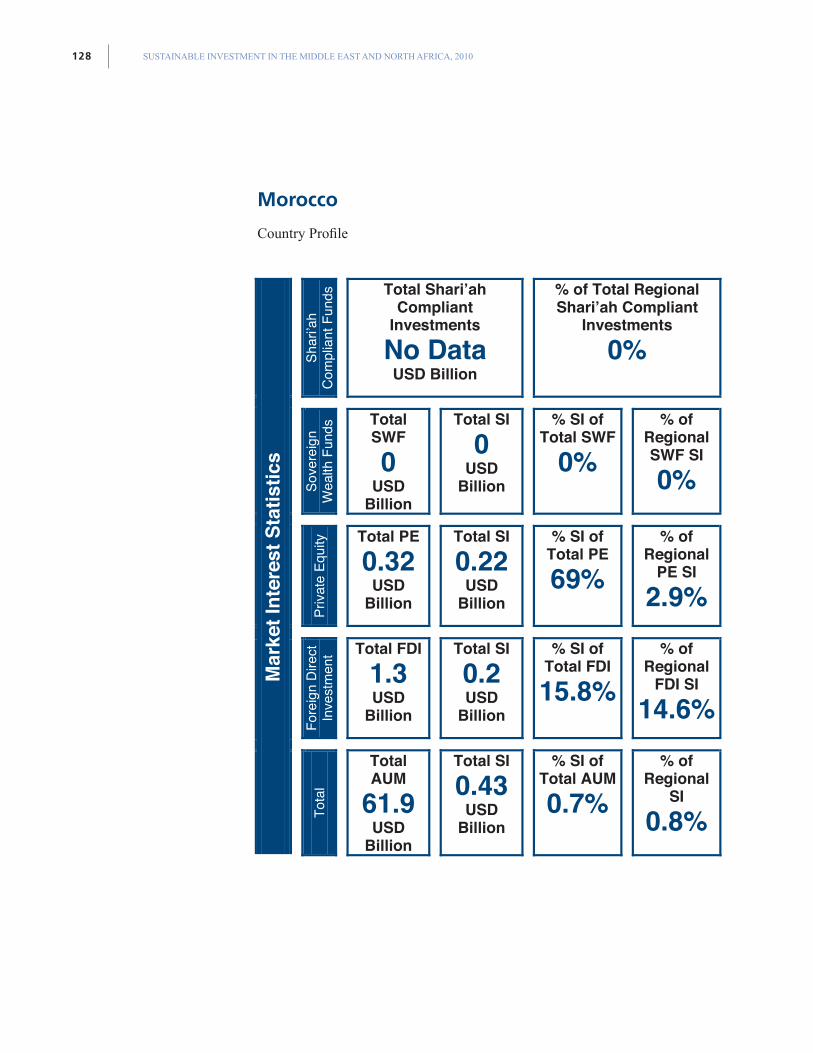
SUSTAINABLE INVESTMENT IN THE MIDDLE EAST AND NORTH AFRICA, 2010128
Morocco
Country Profile
Shar
i’ah
Com
plia
nt F
unds
Total Shari’ah Compliant
Investments
No Data USD Billion
% of Total Regional Shari’ah Compliant
Investments
0%
Sove
reig
n W
ealth
Fun
ds Total
SWF
0USD
Billion
Total SI
0USD
Billion
% SI of Total SWF
0%% of
Regional SWF SI
0%
Priva
te E
quity
Total PE
0.32USD
Billion
Total SI
0.22USD
Billion
% SI of Total PE
69% % of
Regional PE SI
2.9%
Fore
ign
Dire
ct
Inve
stm
ent Total FDI
1.3USD
Billion
Total SI
0.2USD
Billion
% SI of Total FDI
15.8% % of
Regional FDI SI
14.6%
Mar
ket I
nter
est S
tatis
tics
Tota
l
TotalAUM
61.9USD
Billion
Total SI
0.43USD
Billion
% SI of Total AUM
0.7% % of
Regional SI
0.8%
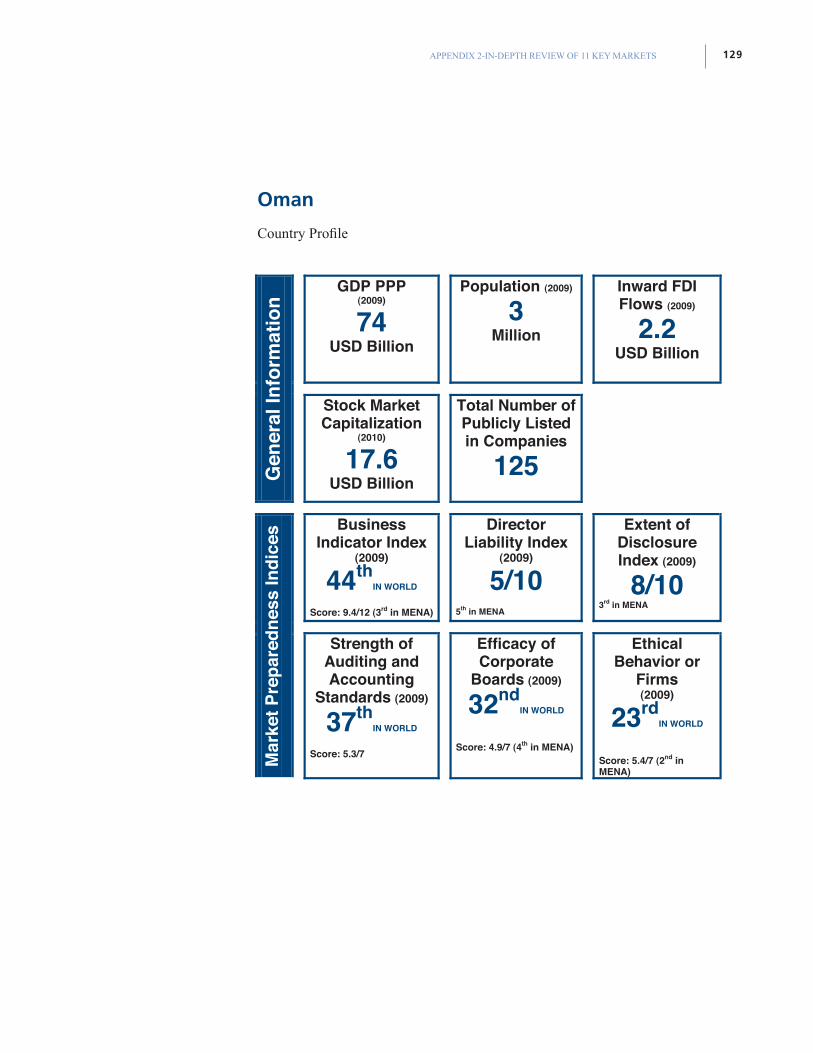
129APPENDIX 2-IN-DEPTH REVIEW OF 11 KEY MARKETS
Oman
Country Profile
GDP PPP (2009)
74USD Billion
Population (2009)
3Million
Inward FDI Flows (2009)
2.2USD Billion
Gen
eral
Info
rmat
ion
Stock Market Capitalization
(2010)
17.6USD Billion
Total Number of Publicly Listed in Companies
125
BusinessIndicator Index
(2009)
44thIN WORLD
Score: 9.4/12 (3rd in MENA)
Director Liability Index
(2009)
5/105th in MENA
Extent of Disclosure Index (2009)
8/10 3rd in MENA
Mar
ket P
repa
redn
ess
Indi
ces
Strength of Auditing and Accounting
Standards (2009)
37thIN WORLD
Score: 5.3/7
Efficacy of Corporate
Boards (2009)
32ndIN WORLD
Score: 4.9/7 (4th in MENA)
EthicalBehavior or
Firms(2009)
23rdIN WORLD
Score: 5.4/7 (2nd in MENA)
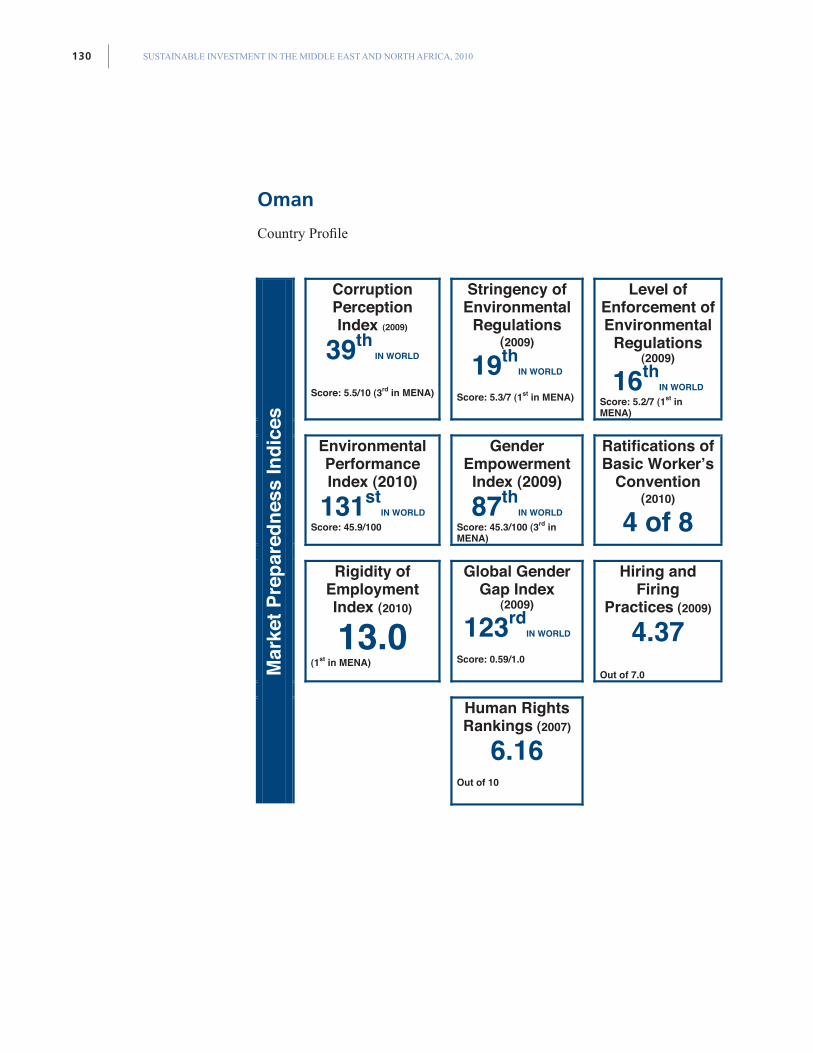
SUSTAINABLE INVESTMENT IN THE MIDDLE EAST AND NORTH AFRICA, 2010130
Oman
Country Profile
Corruption PerceptionIndex (2009)
39th IN WORLD
Score: 5.5/10 (3rd in MENA)
Stringency of Environmental
Regulations(2009)
19thIN WORLD
Score: 5.3/7 (1st in MENA)
Level of Enforcement of Environmental
Regulations (2009)
16thIN WORLD
Score: 5.2/7 (1st in MENA)
Environmental PerformanceIndex (2010)
131stIN WORLD
Score: 45.9/100
Gender EmpowermentIndex (2009)
87thIN WORLD
Score: 45.3/100 (3rd in MENA)
Ratifications of Basic Worker’s
Convention (2010)
4 of 8
Rigidity of Employment Index (2010)
13.0(1st in MENA)
Global Gender Gap Index
(2009)
123rdIN WORLD
Score: 0.59/1.0
Hiring and Firing
Practices (2009)
4.37Out of 7.0
Mar
ket P
repa
redn
ess
Indi
ces
Human Rights Rankings (2007)
6.16Out of 10
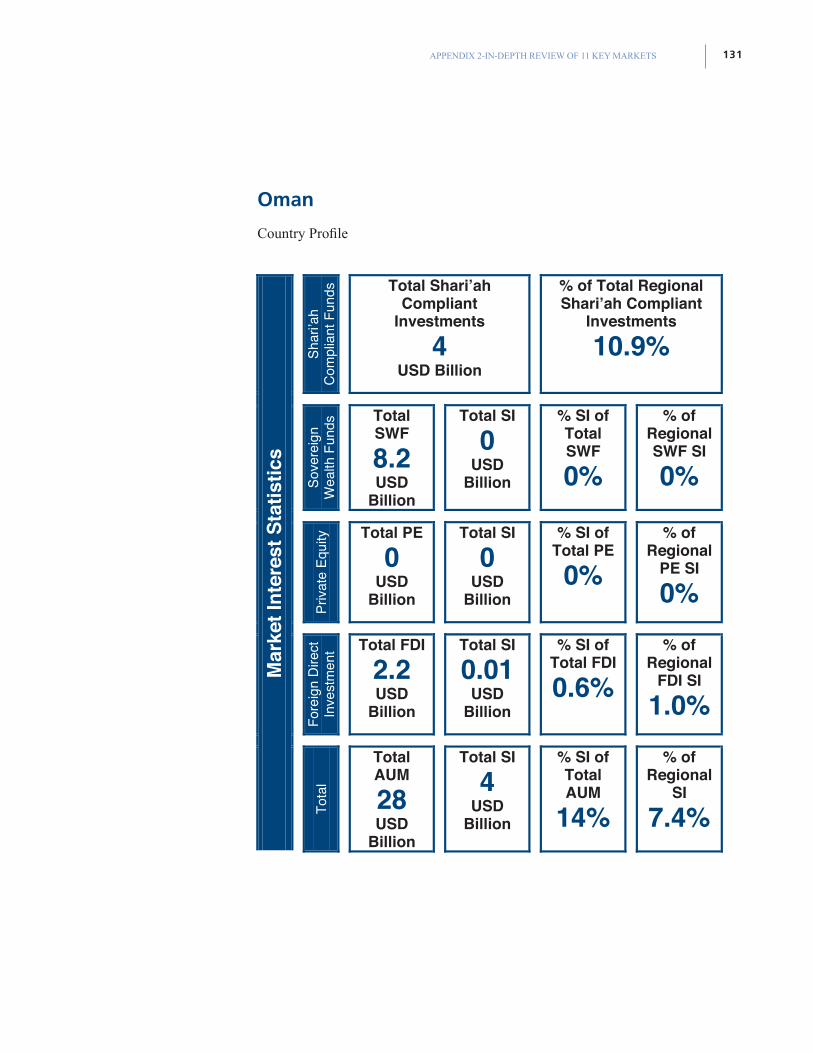
131APPENDIX 2-IN-DEPTH REVIEW OF 11 KEY MARKETS
Oman
Country Profile
Shar
i’ah
Com
plia
nt F
unds
Total Shari’ah Compliant
Investments
4USD Billion
% of Total Regional Shari’ah Compliant
Investments
10.9%
Sove
reig
n W
ealth
Fun
ds Total
SWF
8.2USD
Billion
Total SI
0USD
Billion
% SI of TotalSWF
0%
% of RegionalSWF SI
0%
Priva
te E
quity
Total PE
0USD
Billion
Total SI
0USD
Billion
% SI of Total PE
0% % of
RegionalPE SI
0%
Fore
ign
Dire
ct
Inve
stm
ent Total FDI
2.2USD
Billion
Total SI
0.01USD
Billion
% SI of Total FDI
0.6% % of
RegionalFDI SI
1.0%
Mar
ket I
nter
est S
tatis
tics
Tota
l
TotalAUM
28USD
Billion
Total SI
4USD
Billion
% SI of TotalAUM
14%
% of Regional
SI
7.4%
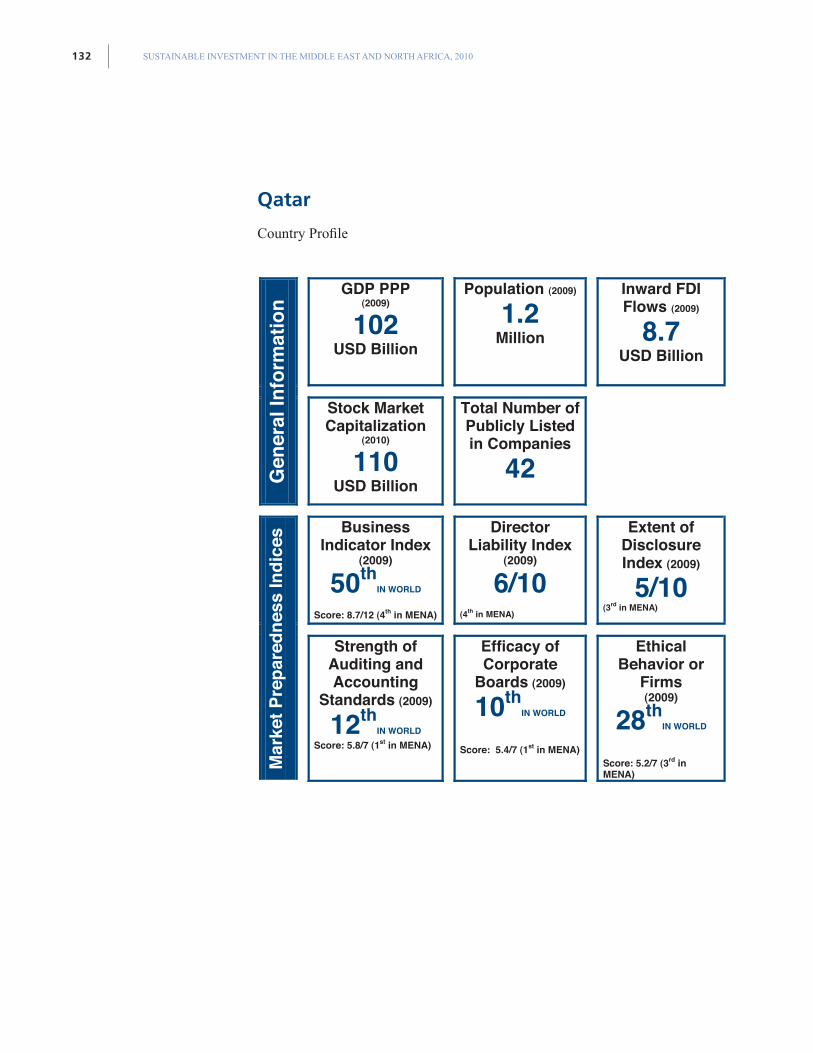
SUSTAINABLE INVESTMENT IN THE MIDDLE EAST AND NORTH AFRICA, 2010132
Qatar
Country Profile
GDP PPP (2009)
102USD Billion
Population (2009)
1.2 Million
Inward FDI Flows (2009)
8.7USD Billion
Gen
eral
Info
rmat
ion
Stock Market Capitalization
(2010)
110USD Billion
Total Number of Publicly Listed in Companies
42
BusinessIndicator Index
(2009)
50thIN WORLD
Score: 8.7/12 (4th in MENA)
Director Liability Index
(2009)
6/10(4th in MENA)
Extent of Disclosure Index (2009)
5/10 (3rd in MENA)
Mar
ket P
repa
redn
ess
Indi
ces
Strength of Auditing and Accounting
Standards (2009)
12thIN WORLD
Score: 5.8/7 (1st in MENA)
Efficacy of Corporate
Boards (2009)
10thIN WORLD
Score: 5.4/7 (1st in MENA)
EthicalBehavior or
Firms(2009)
28thIN WORLD
Score: 5.2/7 (3rd in MENA)
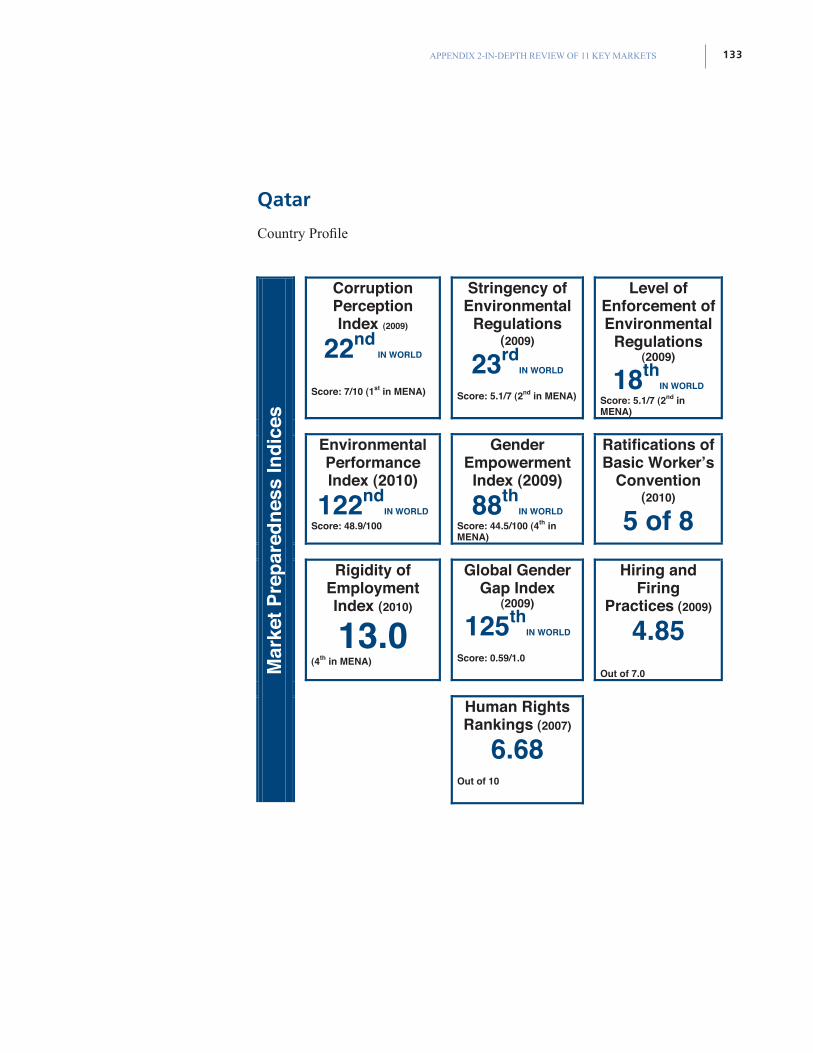
133APPENDIX 2-IN-DEPTH REVIEW OF 11 KEY MARKETS
Qatar
Country Profile
Corruption PerceptionIndex (2009)
22nd IN WORLD
Score: 7/10 (1st in MENA)
Stringency of Environmental
Regulations(2009)
23rdIN WORLD
Score: 5.1/7 (2nd in MENA)
Level of Enforcement of Environmental
Regulations (2009)
18thIN WORLD
Score: 5.1/7 (2nd in MENA)
Environmental PerformanceIndex (2010)
122ndIN WORLD
Score: 48.9/100
Gender EmpowermentIndex (2009)
88thIN WORLD
Score: 44.5/100 (4th in MENA)
Ratifications of Basic Worker’s
Convention (2010)
5 of 8
Rigidity of Employment Index (2010)
13.0(4th in MENA)
Global Gender Gap Index
(2009)
125thIN WORLD
Score: 0.59/1.0
Hiring and Firing
Practices (2009)
4.85Out of 7.0
Mar
ket P
repa
redn
ess
Indi
ces
Human Rights Rankings (2007)
6.68Out of 10
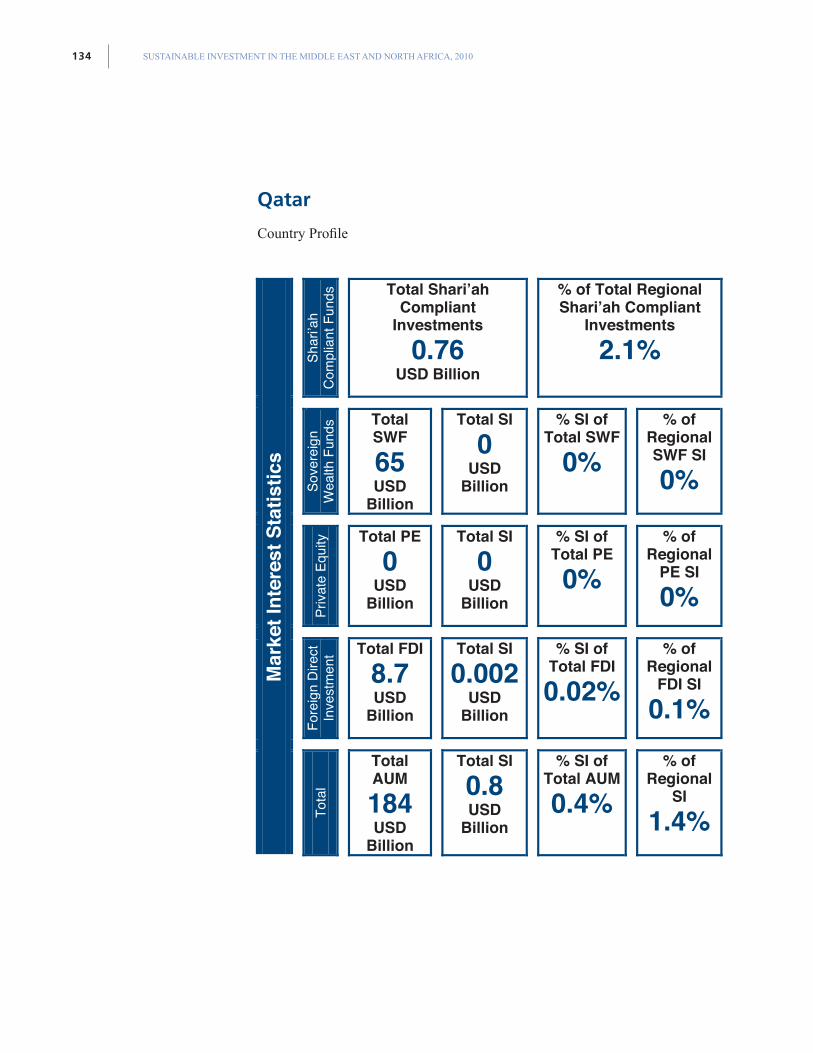
SUSTAINABLE INVESTMENT IN THE MIDDLE EAST AND NORTH AFRICA, 2010134
Qatar
Country Profile
Shar
i’ah
Com
plia
nt F
unds
Total Shari’ah Compliant
Investments
0.76 USD Billion
% of Total Regional Shari’ah Compliant
Investments
2.1%
Sove
reig
n W
ealth
Fun
ds Total
SWF
65USD
Billion
Total SI
0USD
Billion
% SI of Total SWF
0%% of
RegionalSWF SI
0%
Priva
te E
quity
Total PE
0USD
Billion
Total SI
0USD
Billion
% SI of Total PE
0% % of
RegionalPE SI
0%
Fore
ign
Dire
ct
Inve
stm
ent Total FDI
8.7 USD
Billion
Total SI
0.002USD
Billion
% SI of Total FDI
0.02% % of
RegionalFDI SI
0.1%
Mar
ket I
nter
est S
tatis
tics
Tota
l
TotalAUM
184USD
Billion
Total SI
0.8USD
Billion
% SI of Total AUM
0.4% % of
RegionalSI
1.4%
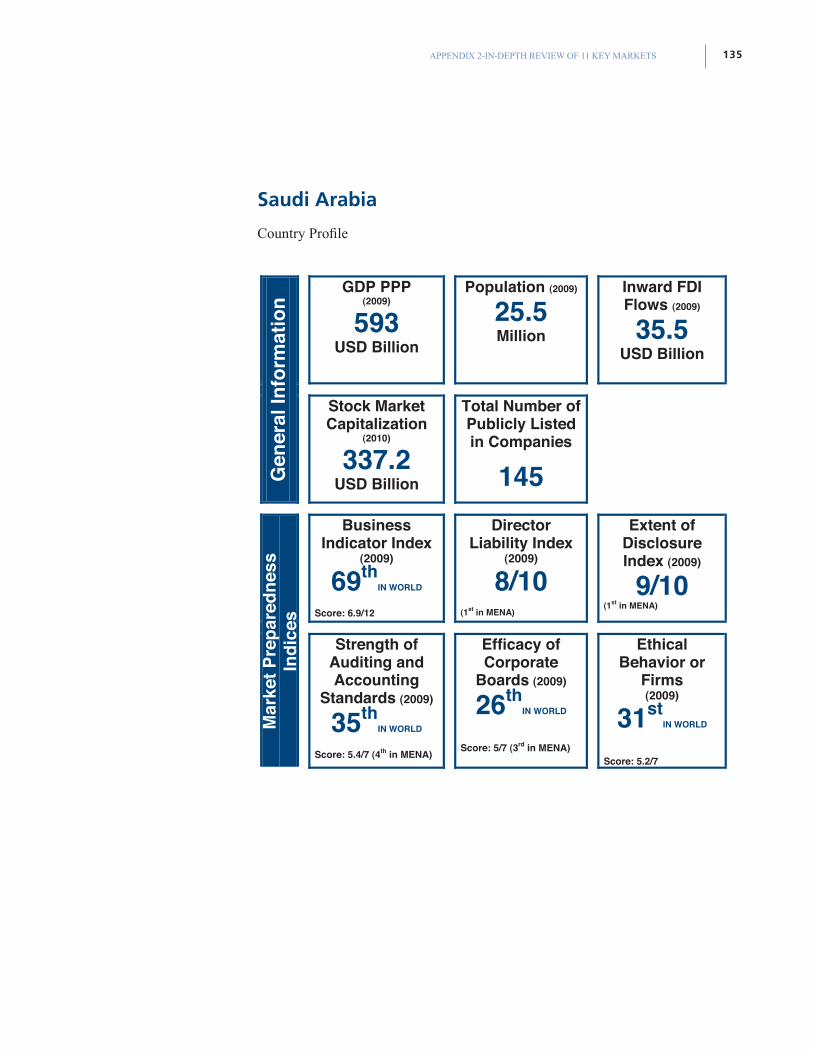
135APPENDIX 2-IN-DEPTH REVIEW OF 11 KEY MARKETS
Saudi Arabia
Country Profile
GDP PPP (2009)
593USD Billion
Population (2009)
25.5Million
Inward FDI Flows (2009)
35.5 USD Billion
Gen
eral
Info
rmat
ion
Stock Market Capitalization
(2010)
337.2USD Billion
Total Number of Publicly Listed in Companies
145
BusinessIndicator Index
(2009)
69thIN WORLD
Score: 6.9/12
Director Liability Index
(2009)
8/10(1st in MENA)
Extent of Disclosure Index (2009)
9/10 (1st in MENA)
Mar
ket P
repa
redn
ess
Indi
ces
Strength of Auditing and Accounting
Standards (2009)
35thIN WORLD
Score: 5.4/7 (4th in MENA)
Efficacy of Corporate
Boards (2009)
26thIN WORLD
Score: 5/7 (3rd in MENA)
EthicalBehavior or
Firms(2009)
31stIN WORLD
Score: 5.2/7
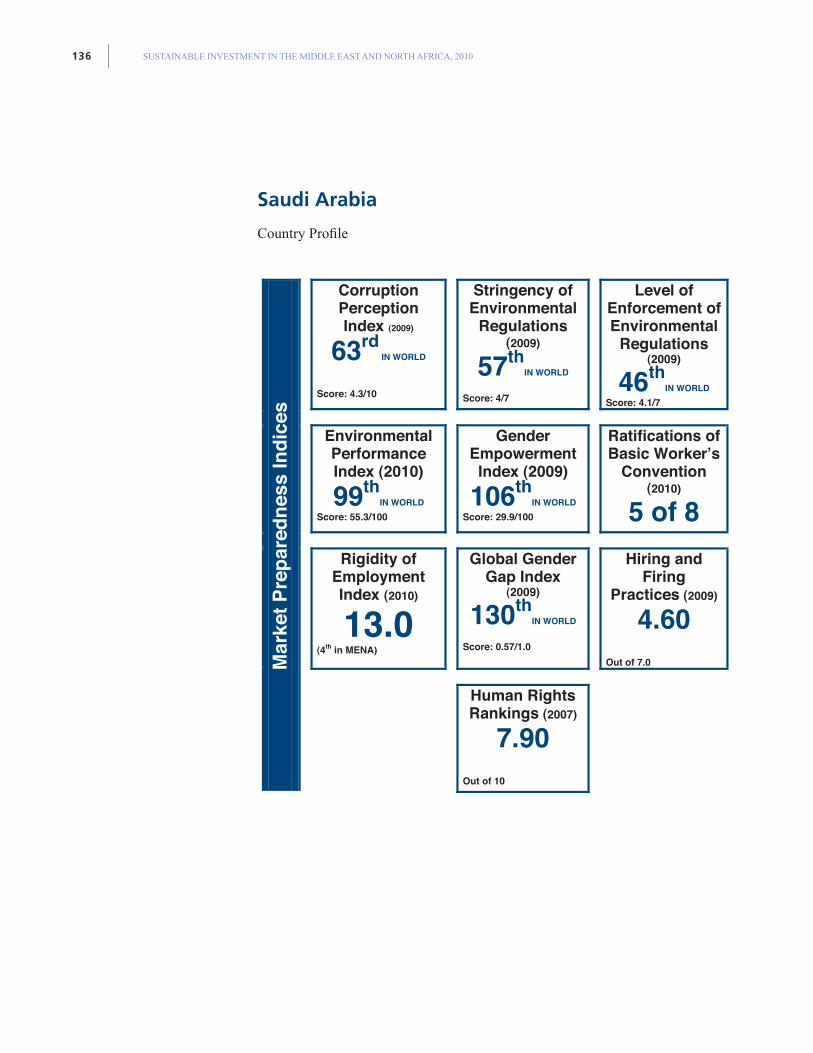
SUSTAINABLE INVESTMENT IN THE MIDDLE EAST AND NORTH AFRICA, 2010136
Saudi Arabia
Country Profile
Corruption PerceptionIndex (2009)
63rd IN WORLD
Score: 4.3/10
Stringency of Environmental
Regulations(2009)
57thIN WORLD
Score: 4/7
Level of Enforcement of Environmental
Regulations (2009)
46thIN WORLD
Score: 4.1/7
Environmental PerformanceIndex (2010)
99thIN WORLD
Score: 55.3/100
Gender EmpowermentIndex (2009)
106thIN WORLD
Score: 29.9/100
Ratifications of Basic Worker’s
Convention (2010)
5 of 8
Rigidity of Employment Index (2010)
13.0(4th in MENA)
Global Gender Gap Index
(2009)
130thIN WORLD
Score: 0.57/1.0
Hiring and Firing
Practices (2009)
4.60 Out of 7.0
Mar
ket P
repa
redn
ess
Indi
ces
Human Rights Rankings (2007)
7.90Out of 10
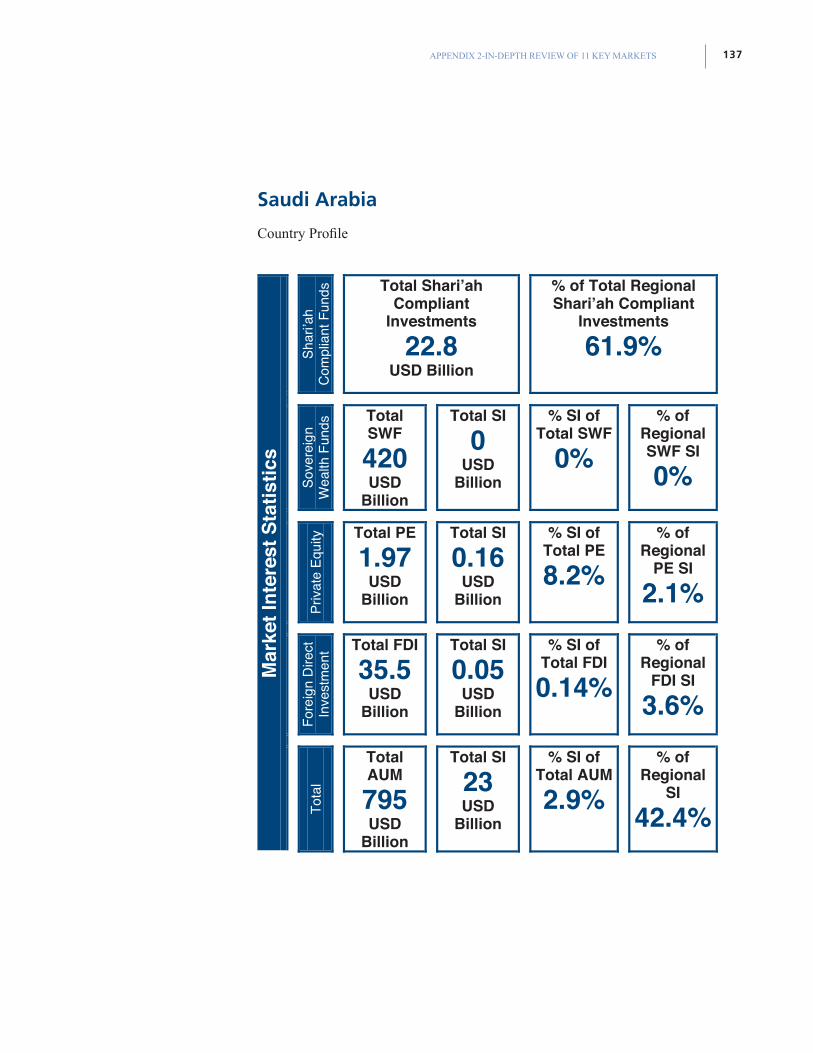
137APPENDIX 2-IN-DEPTH REVIEW OF 11 KEY MARKETS
Saudi Arabia
Country Profile
Shar
i’ah
Com
plia
nt F
unds
Total Shari’ah Compliant
Investments
22.8USD Billion
% of Total Regional Shari’ah Compliant
Investments
61.9%
Sove
reig
n W
ealth
Fun
ds Total
SWF
420USD
Billion
Total SI
0USD
Billion
% SI of Total SWF
0%% of
Regional SWF SI
0%
Priva
te E
quity
Total PE
1.97USD
Billion
Total SI
0.16USD
Billion
% SI of Total PE
8.2% % of
Regional PE SI
2.1%
Fore
ign
Dire
ct
Inve
stm
ent Total FDI
35.5USD
Billion
Total SI
0.05USD
Billion
% SI of Total FDI
0.14% % of
Regional FDI SI
3.6%
Mar
ket I
nter
est S
tatis
tics
Tota
l
TotalAUM
795USD
Billion
Total SI
23USD
Billion
% SI of Total AUM
2.9% % of
Regional SI
42.4%
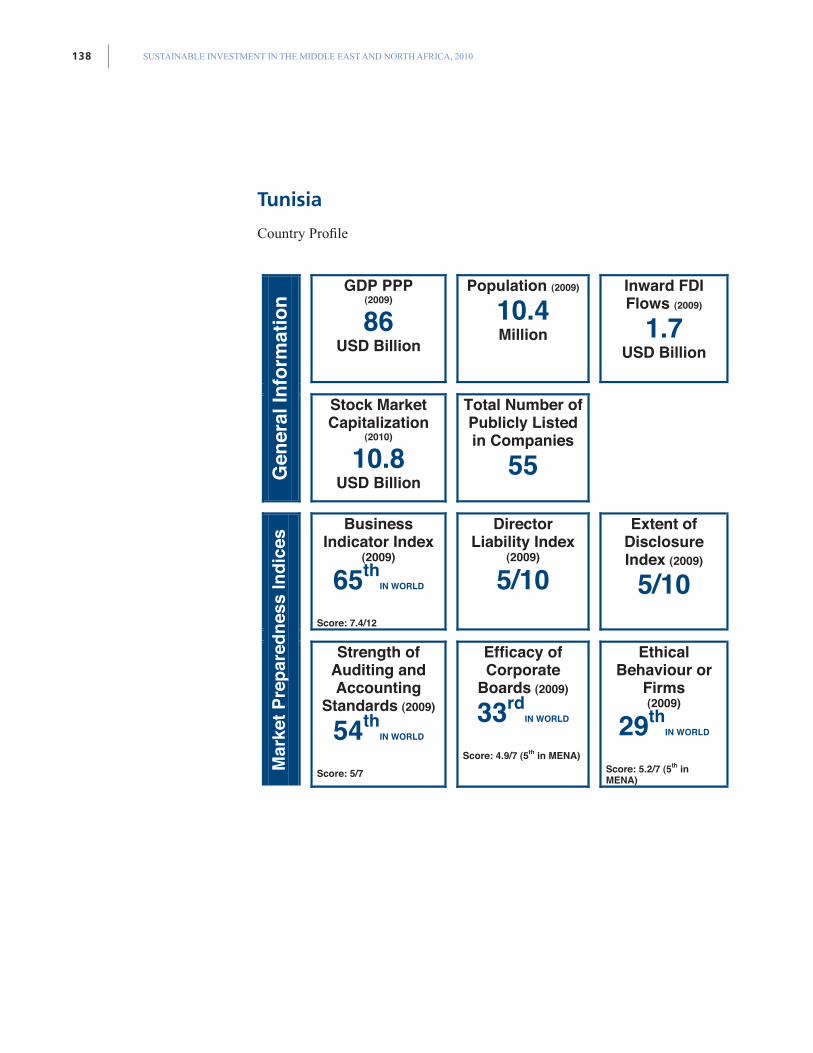
SUSTAINABLE INVESTMENT IN THE MIDDLE EAST AND NORTH AFRICA, 2010138
Tunisia
Country Profile
GDP PPP (2009)
86USD Billion
Population (2009)
10.4Million
Inward FDI Flows (2009)
1.7USD Billion
Gen
eral
Info
rmat
ion
Stock Market Capitalization
(2010)
10.8USD Billion
Total Number of Publicly Listed in Companies
55
BusinessIndicator Index
(2009)
65thIN WORLD
Score: 7.4/12
Director Liability Index
(2009)
5/10
Extent of Disclosure Index (2009)
5/10
Mar
ket P
repa
redn
ess
Indi
ces
Strength of Auditing and Accounting
Standards (2009)
54thIN WORLD
Score: 5/7
Efficacy of Corporate
Boards (2009)
33rdIN WORLD
Score: 4.9/7 (5th in MENA)
EthicalBehaviour or
Firms(2009)
29thIN WORLD
Score: 5.2/7 (5th in MENA)
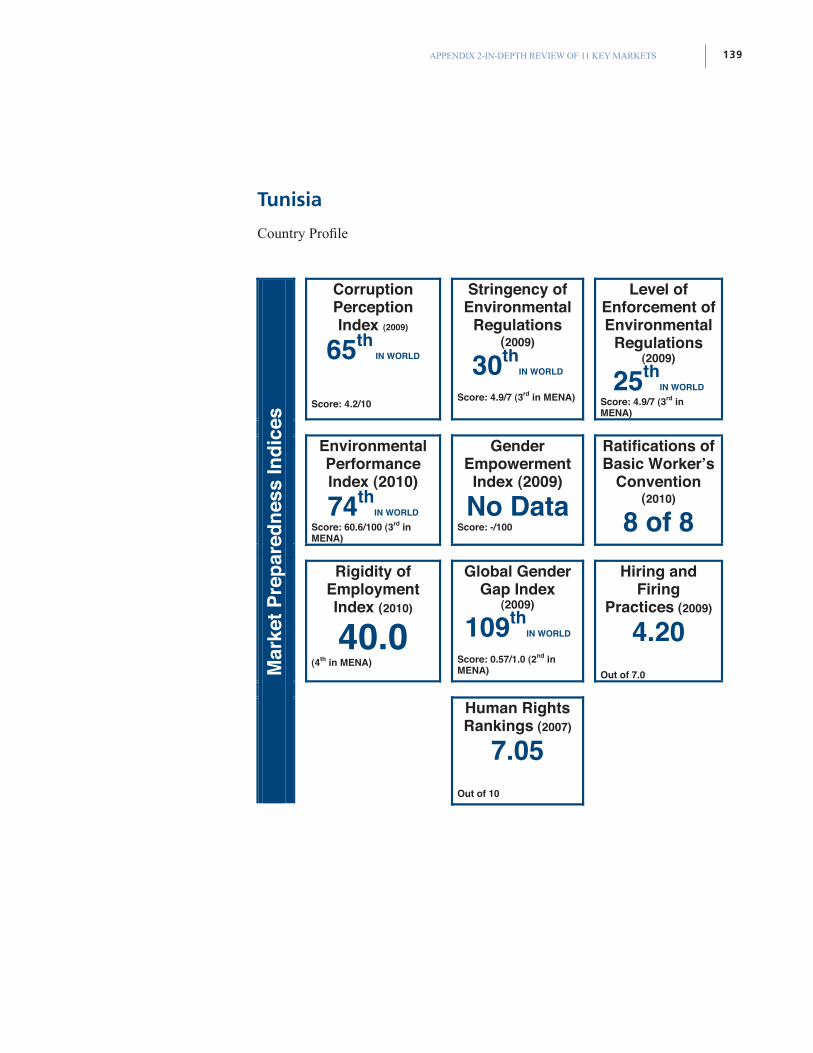
139APPENDIX 2-IN-DEPTH REVIEW OF 11 KEY MARKETS
Tunisia
Country Profile
Corruption PerceptionIndex (2009)
65th IN WORLD
Score: 4.2/10
Stringency of Environmental
Regulations(2009)
30thIN WORLD
Score: 4.9/7 (3rd in MENA)
Level of Enforcement of Environmental
Regulations (2009)
25thIN WORLD
Score: 4.9/7 (3rd in MENA)
Environmental PerformanceIndex (2010)
74thIN WORLD
Score: 60.6/100 (3rd in MENA)
Gender EmpowermentIndex (2009)
No DataScore: -/100
Ratifications of Basic Worker’s
Convention (2010)
8 of 8
Rigidity of Employment Index (2010)
40.0(4th in MENA)
Global Gender Gap Index
(2009)
109thIN WORLD
Score: 0.57/1.0 (2nd in MENA)
Hiring and Firing
Practices (2009)
4.20Out of 7.0
Mar
ket P
repa
redn
ess
Indi
ces
Human Rights Rankings (2007)
7.05Out of 10
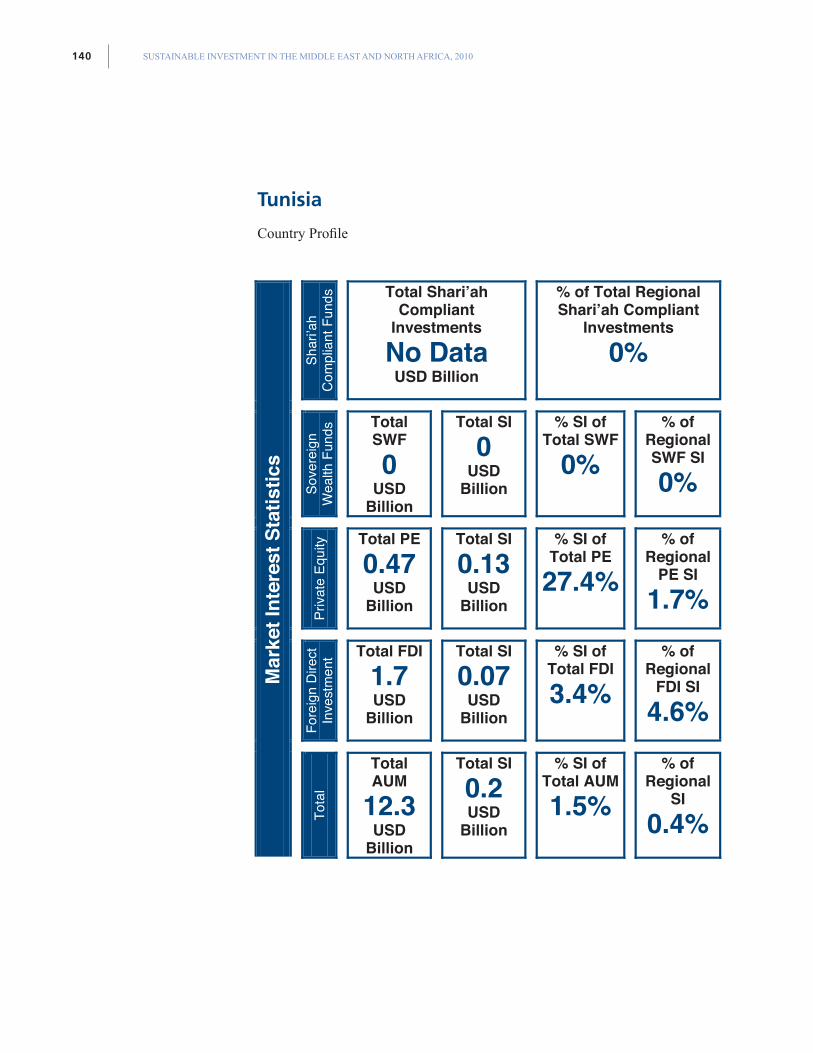
SUSTAINABLE INVESTMENT IN THE MIDDLE EAST AND NORTH AFRICA, 2010140
Tunisia
Country Profile
Shar
i’ah
Com
plia
nt F
unds
Total Shari’ah Compliant
Investments
No Data USD Billion
% of Total Regional Shari’ah Compliant
Investments
0%
Sove
reig
n W
ealth
Fun
ds Total
SWF
0USD
Billion
Total SI
0USD
Billion
% SI of Total SWF
0%% of
RegionalSWF SI
0%
Priva
te E
quity
Total PE
0.47USD
Billion
Total SI
0.13USD
Billion
% SI of Total PE
27.4% % of
RegionalPE SI
1.7%
Fore
ign
Dire
ct
Inve
stm
ent Total FDI
1.7USD
Billion
Total SI
0.07USD
Billion
% SI of Total FDI
3.4% % of
RegionalFDI SI
4.6%
Mar
ket I
nter
est S
tatis
tics
Tota
l
TotalAUM
12.3USD
Billion
Total SI
0.2USD
Billion
% SI of Total AUM
1.5% % of
RegionalSI
0.4%
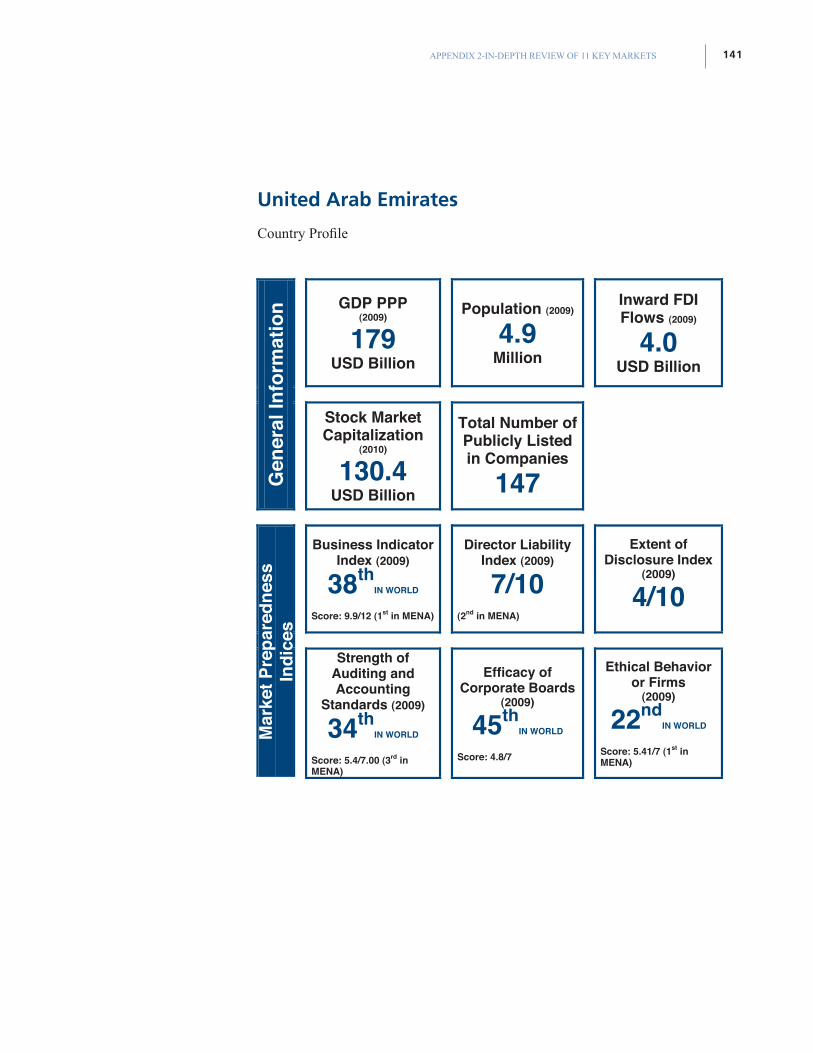
141APPENDIX 2-IN-DEPTH REVIEW OF 11 KEY MARKETS
United Arab Emirates
Country Profile
GDP PPP (2009)
179USD Billion
Population (2009)
4.9 Million
Inward FDI Flows (2009)
4.0USD Billion
Gen
eral
Info
rmat
ion
Stock Market Capitalization
(2010)
130.4USD Billion
Total Number of Publicly Listed in Companies
147
Business Indicator Index (2009)
38thIN WORLD
Score: 9.9/12 (1st in MENA)
Director Liability Index (2009)
7/10(2nd in MENA)
Extent of Disclosure Index
(2009)
4/10
Mar
ket P
repa
redn
ess
Indi
ces
Strength of Auditing and Accounting
Standards (2009)
34thIN WORLD
Score: 5.4/7.00 (3rd in MENA)
Efficacy of Corporate Boards
(2009)
45thIN WORLD
Score: 4.8/7
Ethical Behavior or Firms
(2009)
22ndIN WORLD
Score: 5.41/7 (1st in MENA)
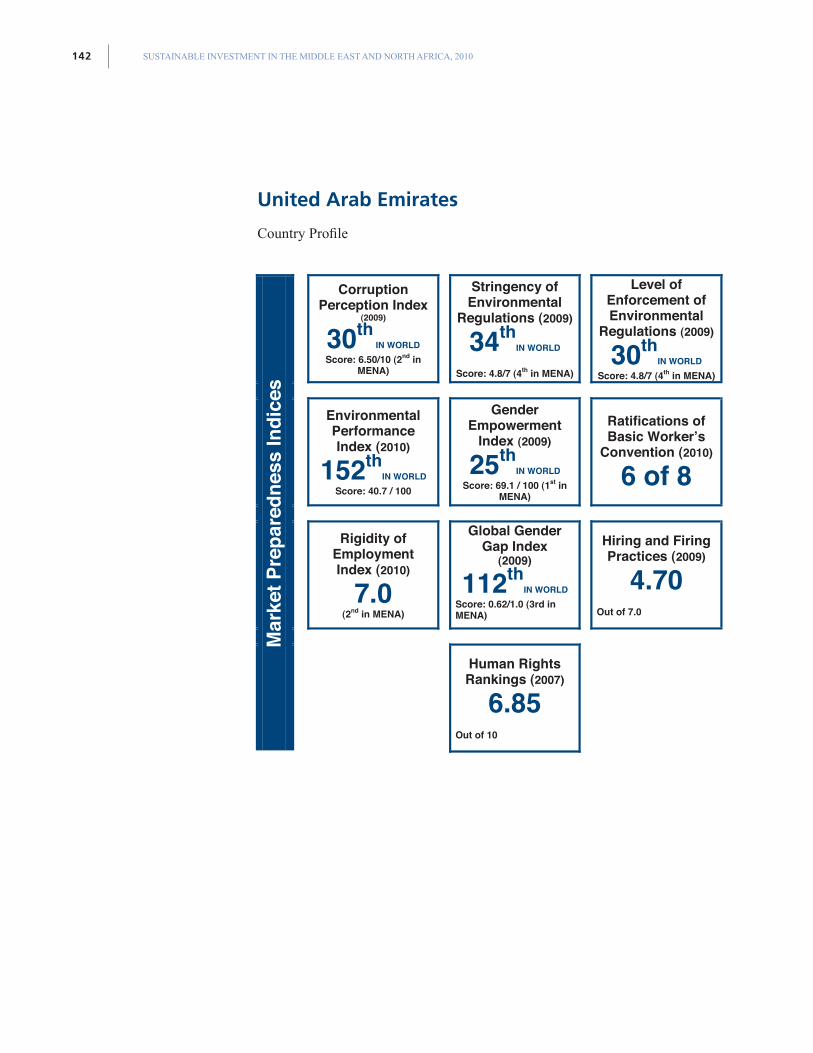
SUSTAINABLE INVESTMENT IN THE MIDDLE EAST AND NORTH AFRICA, 2010142
United Arab Emirates
Country Profile
Corruption Perception Index
(2009)
30th IN WORLD
Score: 6.50/10 (2nd in MENA)
Stringency of Environmental
Regulations (2009)
34thIN WORLD
Score: 4.8/7 (4th in MENA)
Level of Enforcement of Environmental
Regulations (2009)
30thIN WORLD
Score: 4.8/7 (4th in MENA)
EnvironmentalPerformance Index (2010)
152thIN WORLD
Score: 40.7 / 100
Gender Empowerment
Index (2009)
25thIN WORLD
Score: 69.1 / 100 (1st in MENA)
Ratifications of Basic Worker’s
Convention (2010)
6 of 8
Rigidity of Employment Index (2010)
7.0(2nd in MENA)
Global Gender Gap Index
(2009)
112thIN WORLD
Score: 0.62/1.0 (3rd in MENA)
Hiring and Firing Practices (2009)
4.70Out of 7.0
Mar
ket P
repa
redn
ess
Indi
ces
Human Rights Rankings (2007)
6.85Out of 10
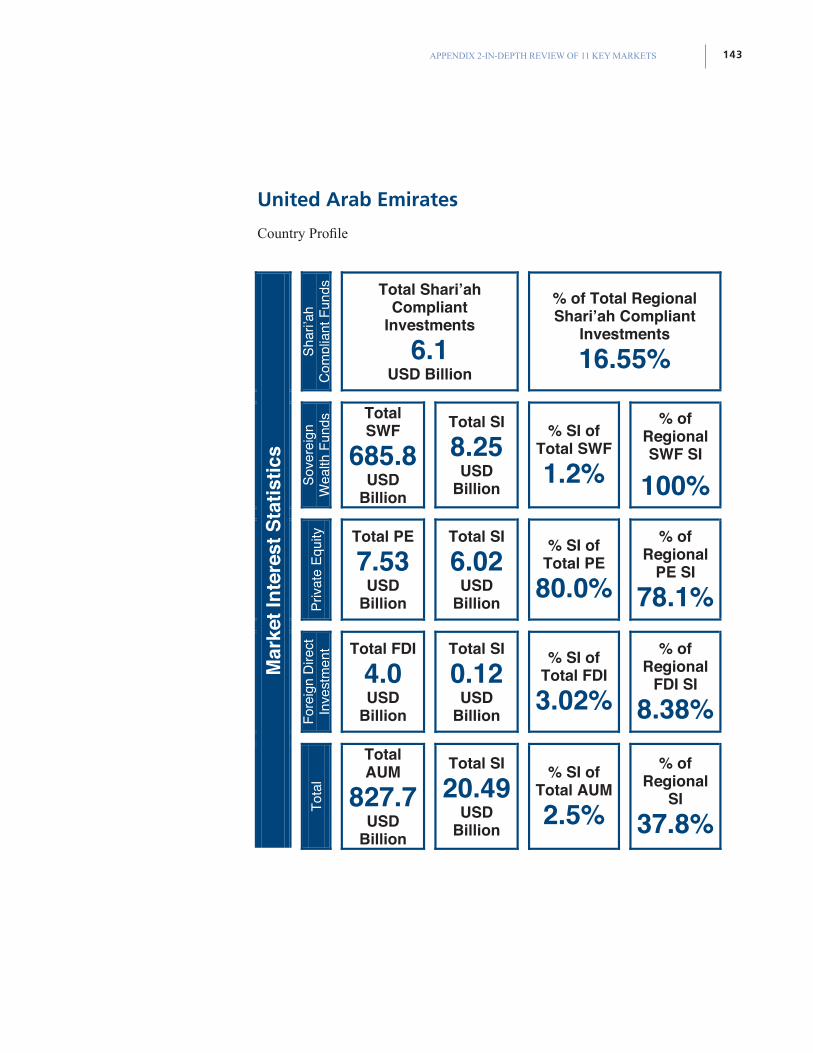
143APPENDIX 2-IN-DEPTH REVIEW OF 11 KEY MARKETS
United Arab Emirates
Country Profile
Shar
i’ah
Com
plia
nt F
unds
Total Shari’ah Compliant
Investments
6.1USD Billion
% of Total Regional Shari’ah Compliant
Investments
16.55%
Sove
reig
n W
ealth
Fun
ds Total
SWF
685.8 USD
Billion
Total SI
8.25USD
Billion
% SI of Total SWF
1.2%
% of RegionalSWF SI
100%
Priv
ate
Equi
ty
Total PE
7.53USD
Billion
Total SI
6.02USD
Billion
% SI of Total PE
80.0%
% of Regional
PE SI
78.1%
Fore
ign
Dire
ct
Inve
stm
ent Total FDI
4.0USD
Billion
Total SI
0.12USD
Billion
% SI of Total FDI
3.02%
% of Regional
FDI SI
8.38%
Mar
ket I
nter
est S
tatis
tics
Tota
l
TotalAUM
827.7 USD
Billion
Total SI
20.49USD
Billion
% SI of Total AUM
2.5%
% of Regional
SI
37.8%
SUSTAINABLE INVESTMENT IN THE MIDDLE EAST AND NORTH AFRICA, 2010144
Appendix 3 - RegionalSupporting Infrastructure
Supporting Infrastructure
Despite the modest size of SI in the MENA region at the moment, and the relatively immature infrastructure to support SI overall, it is crucial to identify the supporting infrastructure that might play a role in the growth and development of SI into the future. International, regional, and national establishments exist that can help. In recent years, a number of networks, associations, think tanks, and research institutions have been established across the MENA region. Their very existence and continued development will be important as SI is catalyzed and takes hold in the region.
Non-Financial Information Disclosure
Global Reporting Initiative (GRI)Global Reporting Initiative (GRI) is a network-based organization that has pioneered the development of the world’s most widely used sustainability reporting framework. The GRI website provides information on all the sustainability reports published by organizations, and it is considered a tool for identifying socially responsible companies and businesses. A total of 11 sustainability reports are listed on the GRI website that have been published in the MENA region.79
United Nations Global Compact (UNGC)The United Nations Global Compact is an initiative developed by the UN to promote the adoption in business of 10 universally accepted principles in areas relating to sustainable development. The 10 principles are in the areas of human rights, labor, environment, and anti-corruption. In a sense, the UNGC is self-perpetuating, since businesses that participate in it commit to aligning their strategies and operations with its principles, and therefore help ensure the sustainable benefits of business. To date, a total of 206 participants from the MENA region are recorded on the UN Global Compact website.80
Sustainability Indices – Regional Level
Dow Jones Islamic Market Index (DJIM)The Dow Jones Islamic Market Index, launched in Bahrain in 1999, provides thousands of indices that have passed rules-based screens for Shari’ah compliance. Industries deemed non-compliant with Islamic law—such as gambling, alcohol, and tobacco—are excluded. DJIM was the first index to be created for identifying Shari’ah-compliant investments. This family of indices is the most popular and visible Shari’ah-compliant benchmark in the world.
79 The GRI Website http://www.globalreporting.org
80The UN Global Compact Website http://www.unglobalcompact.org
145APPENDIX 3 - REGIONAL SUPPORTING INFRASTRUCTURE
Global and regional DJIM Indices have been created, two of which are in the MENA region:
(1) Dow Jones Islamic Market Middle East & Africa Index81
The DJIM MENA Index was first calculated in May 2009. The index covers 10 countries in the MENA region. Countries covered by the index include Bahrain, Egypt, Jordan, Kuwait, Morocco, Oman, Qatar, Saudi Arabia, Tunisia, and the United Arab Emirates.
(2) Dow Jones Islamic Market GCC Index82
The DJIM GCC Index was first calculated in August 2009. The index intends to measure stocks that are accessible to local investors. Countries covered by the index include Bahrain, Kuwait, Oman, Qatar, Saudi Arabia, and the United Arab Emirates. Additionally, the DJIM family of indices includes some thematic and strategy indices, one of which is the Dow Jones Islamic Market Sustainability Index.83
Sustainability Indices – National Level
The Egyptian Corporate Responsibility Index (The S&P/EGX ESG Index) – Egypt84
Launched in March 2010, the S&P/Egyptian Stock Exchange ESG Index is the first of its kind in the region to track the performance of companies listed on the Egyptian Stock Exchange that excel on environmental, social, and corporate governance issues. Designed and launched by Standard & Poor’s (S&P), the world’s leading index provider, the index comprises a unique and innovative methodology designed to provide quantitative rather than qualitative factors. This process results in providing investors with exposure to 30 of the best performing companies in issues of ESG.
The index also helps create a sustainable competitive business environment by enhancing the quality and level of disclosure to investors while promoting a culture of social responsibility among companies. Additionally, it enhances the quality and level of disclosure by encouraging companies to disclose governance, social, and environmental practices, and to increase competitive advantage by becoming more transparent.
The Saudi Responsible Competitiveness Index (Saudi RCI) – Saudi ArabiaThe Saudi Responsible Competitiveness Index is a multi-year initiative by the Saudi Arabian General Investment Authority, the King Khalid Foundation, and AccountAbility. The aim of the program is to help companies in the Kingdom of Saudi Arabia allocate new areas of value creation, and provide support for the Saudi General Investment Authority’s aim to achieve its goal in making the Kingdom’s economy one of the most competitive in the world by 2010.
The Saudi RCI assesses the social, environmental, and economic performance of companies using a consistent methodology. Of course all evaluations are tailored to the local context. Top-performing companies are rewarded with the prestigious King Khalid Responsible Competitiveness Award (KKRCA) at the Global Competitiveness Forum. Scores and ranks for the rest of the participating companies are kept strictly confidential. Companies are entitled to confidential feedback sessions to better understand their scores and to learn their strengths and weaknesses.
81Dow Jones Islamic Market MENA Index Fact Sheet, Available: http://www.djindexes.com/mdsidx/downloads/fact_info/Dow_Jones_Islamic_Market_MENA_Index_Fact_Sheet.pdf
82Dow Jones Islamic Market GCC Index Fact Sheet, Available: http://www.djindexes.com/mdsidx/downloads/fact_info/Dow_Jones_Islamic_Market_GCC_Index_Fact_Sheet.pdf
83Dow Jones Islamic Market Sustainability Index Fact Sheet, Available: http://www.djindexes.com/mdsidx/downloads/fact_info/Dow_Jones_Islamic_Market_Sustainability_Index_Fact_Sheet.pdf
84Standard and Poor’s Website, Available: http://www.standardandpoors.com/indices/sp-egx-esg-index/en/us/?indexId=sp-egx-esg-index
SUSTAINABLE INVESTMENT IN THE MIDDLE EAST AND NORTH AFRICA, 2010146
Independent Research Institutions – Regional Level
Hawkamah (The Institute for Corporate Governance)85
Hawkamah was created to bridge the governance gap by assisting countries and businesses in the MENA region to develop and implement sound and well integrated governance frameworks. Hawkamah provides analysis, research, and technical assistance by commissioning regional and national surveys and research. One of the most notable annual research projects is the ‘IIF/Hawkamah Report on Corporate Governance of GCC Countries’. The report is comprised of individual country reports for Bahrain, Kuwait, Oman, Qatar, Saudi Arabia, and the United Arab Emirates. It also contains a comparative survey, and is published in Arabic and English. The report identifies key corporate governance issues facing individual countries; provides detailed analyses of their corporate governance frameworks; and offers recommendations for improving the corporate governance environment in participating nations.
The Centre for International Private Enterprise (CIPE)86
The Centre for International Private Enterprise strengthens democracy around the globe through private enterprise and market-oriented reforms. Key program areas include anti-corruption, advocacy, business associations, corporate and democratic governance, access to information, informal sector and property rights, and women and youth.
CIPE’s work in the MENA region involves a broader cross-section of society in the process of reform, taking advantage of the demographic realities of the region. CIPE’s programs in the region involve supporting grassroots and other business associations through programs on anti-corruption and good governance, empowering women and youth, and widening access to information. This support will render these organizations capable of representing the private sector by participating in and influencing the policymaking process.
The Egyptian Institute of Directors (EIoD) - Egypt87
The Egyptian Institute of Directors (EIoD) is a professional and research center operating under the Ministry of Investment. Its goal is to promote awareness, knowledge, and best practices of corporate governance in the MENA region, and to do so in a manner that meets the best interests of different stakeholders. The EIoD collaborates with a number of leading international organizations such as the United Nations Development Program (UNDP), World Bank Institute (WBI), IFC (International Finance Corporation), Organization for Economic Cooperation and Development (OECD), European Union (EU), and the Center for International Private Enterprise (CIPE).
The EIoD undertakes the design and delivery of a variety of certificate programs and training courses covering all areas of corporate governance. The institute also provides consultancy services, research, and training and development.
Institut Arabe des Chefs d’Entreprise (IACE), CIPE partner – Tunisia88
The institute has accomplished a number of projects and initiatives to spread awareness and implementation of corporate governance. It released the ‘Code of Best Practice of Corporate Governance’ in 2008, organized a high-profile conference on corporate governance in 2009, started the Best Corporate Governance Article Award program, and launched the first Center for Corporate Governance in North Africa.
85Hawkamah Website, Available: http://www.hawkamah.org/
86Center for International Private Enterprises (CIPE), Available: http://www.cipe.org/regional/mena/index.php
87The Egyptian Institute of Directors Website, Available: http://www.eiod.org/default.aspx
88Center for International Private Enterprises, Available: www.cipe-arabia.org
147APPENDIX 3 - REGIONAL SUPPORTING INFRASTRUCTURE
Al Urdun Al Jadid Research Center (UJRC) – Jordan89
Al Urdun Al Jadid Research Center (the New Jordan Research Center) is an independent non-governmental organization (NGO) that works for sustainable development in Jordan and the Arab World. The center conducts scientific research, facilitates discussions and dialogues, coordinates conferences and workshops, and serves as a point of expertise and information exchange with other regional and international organizations.
As part of the Fifth MENA Development Forum (MDF5)90, the center implemented a successful and notable regional project called, ‘Strengthening Responsible Corporate Citizenship in the Businesses of the MENA Region’. Two North African case studies for Egypt and Morocco were included in the project.
Arab Forum for Environment and Development (AFED)91
AFED is a not-for-profit non-governmental organization that links experts with civil society, the business community, and media, and aims to promote sensible environmental policies and programs in the Arab World. AFED brings together regional and national stakeholders to discuss issues related to the environment. These stakeholders include civil society, the private sector, environmental organizations, experts and leading academic institutions, and the media. The Arab League of Arab States (LAS) and the United Nations Environment program (UNEP) have endorsed AFED..
Publications by AFED include ‘Arab Environment: Climate Change’, and ‘Arab Environment: Future Challenges’. Their programs include ‘Making a Transition to a Green Economy: Challenges and Opportunities’, and ‘AFED’S Corporate Environmental Responsibility (CER)’.
Sustainability Excellence Sustainability Excellence is a consultancy based in the Arab region providing sustainability strategy, reporting, and implementation services. Its mission is to accelerate the uptake of sustainability in the region. Sustainability Excellence has led various pioneering research projects in the region, specifically the ‘Responsible Competitiveness in the Arab World’ report and Index. This report contained a responsible competitiveness index that correlated responsible practices with the competitiveness of industry. Another report produced by Sustainability Excellence was ‘Responsible Competitiveness in Jordan’, which reviewed the responsible competitiveness of Jordan’s insurance, banking and meat-processing sectors. Sustainability Excellence was also a key research and development partner in the delivery of this report.
Networks and Associations – Regional Level
The Arab Sustainability Leadership GroupThe Arab Sustainability Leadership Group (ASLG) is a Queen Rania Al Abdullah initiative, aiming to provide a network of high profile companies, government entities, and non-profit organizations with a commitment to achieving the highest levels of sustainability management, performance, and reporting. So far the ASLG has conducted two CEO-level meetings with Her Majesty, along with a practitioner-level meeting and a half-day forum on youth development. Members have delivered on their commitments to adopt sustainability management and reporting, highlighting their performance successes. The ASLG is now composed of 47 members, including 34 members in the ASLG Egypt chapter, and it is expected to grow rapidly over the course of the next two years.
89Al Urdun Al Jadid Research Center Website, Available: www.ujrc-jordan.org
90MDF5 is a partnership conference between the World Bank Group, UNDP and MENA think-tank. The conference aims to strengthen CSR culture and practices through building regional coalitions for that purpose.
91AFED Website, Available: http://www.afedonline.org/en/
SUSTAINABLE INVESTMENT IN THE MIDDLE EAST AND NORTH AFRICA, 2010148
Abu Dhabi Sustainability Group - UAEThe Abu Dhabi Sustainability Group (ADSG) is a membership organization whose mission is to promote sustainability management in Abu Dhabi by providing learning and knowledge sharing opportunities for government, private companies and not-for-profit organizations. The ADSG was established in June 2008 as a forum for members who have signed the ADSG Declaration. Members commit to adopting best practices of sustainability management and reporting, and to participate actively in ADSG activities. The ADSG is open to new members willing to practice and champion sustainability in Abu Dhabi. The group currently consists of 21 members, including 11 government agencies, eight private companies and two non-for-profit organizations.
The Egyptian Junior Business Association (EJB) – Egypt92
The association counts a network of 600 prominent members of young business executives and entrepreneurs representing various business sectors. The basic catalyst for EJB was achieving a sustainable business environment through vision, hope, and enthusiasm to stand as one of Egypt’s most efficient and competent business associations.
The association established a taskforce on corporate governance to spread awareness and support implementation of good governance. Three workshops and three roundtable discussions were conducted on the subject. The EJB even held a corporate governance conference entitled ‘Corporate Governance… The Future for Family Firms’ in October 2006. The conference resulted in the publishing of the ‘Corporate Governance in Family Business’ manual, the first of its kind in the MENA region.
Development Finance Institutions
IFC (International Finance Corporation)93
IFC, part of the World Bank Group, provides investment and advisory services to build the private sector in developing countries. In the MENA region, IFC’s focus is on development projects that provide long-term finance and benefit to the private sector. Ultimately, the goal of these projects is to benefit the underserved.
Among IFC’s efforts in the MENA region is the production of the ‘Corporate Governance Success Stories’ report, which presents an overview of companies in the region that have taken serious steps to improve their governance practices and structures. IFC also recently held a conference with Egypt on free Investment zones where IFC continues to support the Egyptian government’s efforts to implement transparent and integrated investment regulations.
Furthermore, IFC has extensive investments in a number of projects in each of the MENA region countries. A component of IFC’s investments in the MENA region is in Global Financial Markets. IFC believes that the development of successful and sustainable financial markets in low- and middle-income countries depends on the financial health of the private sector. To help build a strong and sustainable private sector, IFC delivers investment and advisory services through its network of people and financial institutions, with the objective of-helping people improve their lives and escape poverty.
92The Egyptian Junior Business Association Website, Available: http://www.ejb.org.eg
93IFC Website, Available: http://www.ifc.org
149APPENDIX 3 - REGIONAL SUPPORTING INFRASTRUCTURE
Civil Society
No civil society organizations have played explicit roles in promoting SI in the MENA region, but civil society plays a pivotal role in influencing the course of growth, with many organizations active in environmental, social, and human development. Strong consumer groups are also emerging in several countries, and the ability of citizens to drive up business performance is building, resulting in a growing pressure for government and corporations to accelerate the adoption of sustainable practices.
Consequently, civil society organizations in the region require extensive capacity- building to become more influential in the investment market. The stronger these organizations get, the more pressure they can exert on investors, listed companies and other concerned stakeholders to support SI approaches.
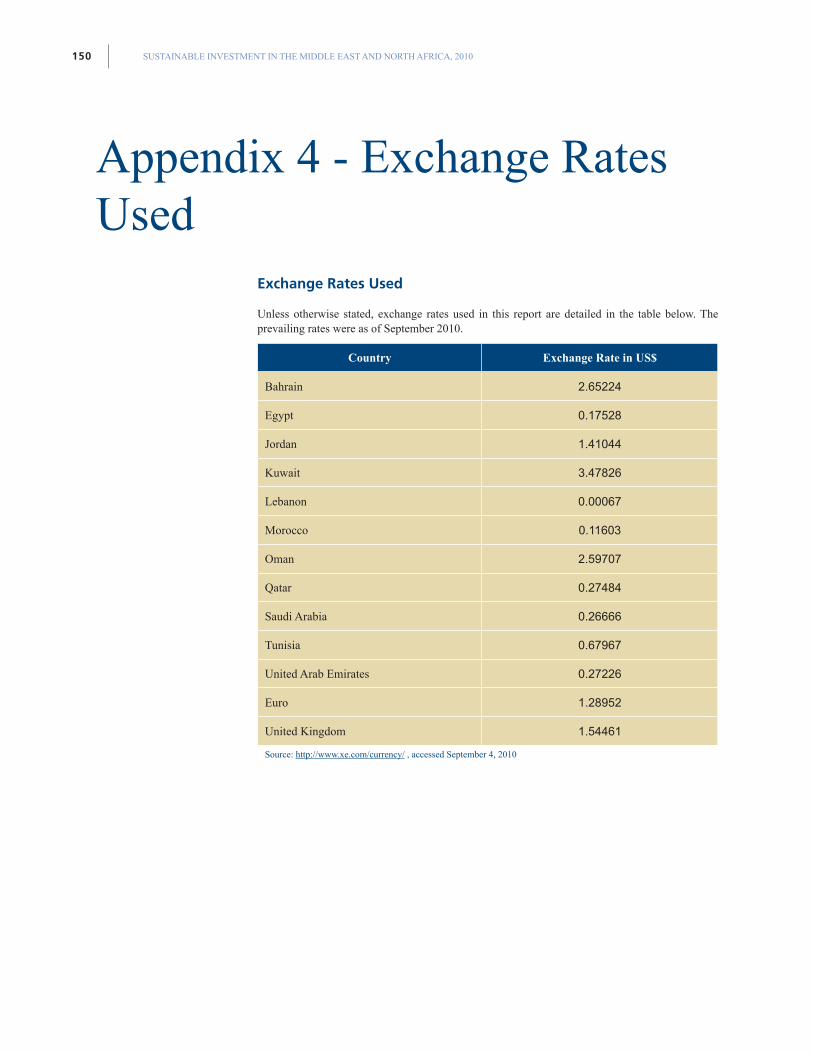
SUSTAINABLE INVESTMENT IN THE MIDDLE EAST AND NORTH AFRICA, 2010150
Appendix 4 - Exchange Rates Used
Exchange Rates Used
Unless otherwise stated, exchange rates used in this report are detailed in the table below. The prevailing rates were as of September 2010.
Country Exchange Rate in US$
Bahrain 2.65224
Egypt 0.17528
Jordan 1.41044
Kuwait 3.47826
Lebanon 0.00067
Morocco 0.11603
Oman 2.59707
Qatar 0.27484
Saudi Arabia 0.26666
Tunisia 0.67967
United Arab Emirates 0.27226
Euro 1.28952
United Kingdom 1.54461
Source: http://www.xe.com/currency/ , accessed September 4, 2010
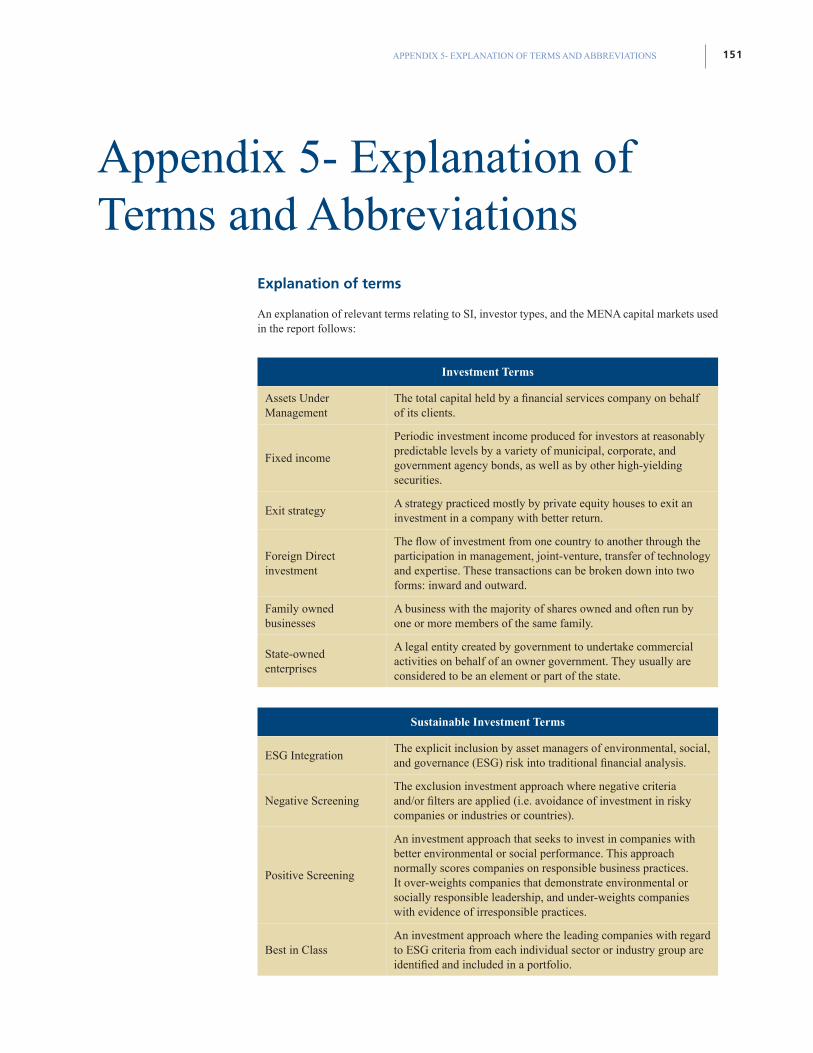
151APPENDIX 5- EXPLANATION OF TERMS AND ABBREVIATIONS
Appendix 5- Explanation of Terms and Abbreviations
Explanation of terms
An explanation of relevant terms relating to SI, investor types, and the MENA capital markets used in the report follows:
Investment Terms
Assets Under Management
The total capital held by a financial services company on behalf of its clients.
Fixed income
Periodic investment income produced for investors at reasonably predictable levels by a variety of municipal, corporate, and government agency bonds, as well as by other high-yielding securities.
Exit strategyA strategy practiced mostly by private equity houses to exit an investment in a company with better return.
Foreign Direct investment
The flow of investment from one country to another through the participation in management, joint-venture, transfer of technology and expertise. These transactions can be broken down into two forms: inward and outward.
Family owned businesses
A business with the majority of shares owned and often run by one or more members of the same family.
State-owned enterprises
A legal entity created by government to undertake commercial activities on behalf of an owner government. They usually are considered to be an element or part of the state.
Sustainable Investment Terms
ESG IntegrationThe explicit inclusion by asset managers of environmental, social, and governance (ESG) risk into traditional financial analysis.
Negative ScreeningThe exclusion investment approach where negative criteria and/or filters are applied (i.e. avoidance of investment in risky companies or industries or countries).
Positive Screening
An investment approach that seeks to invest in companies with better environmental or social performance. This approach normally scores companies on responsible business practices. It over-weights companies that demonstrate environmental or socially responsible leadership, and under-weights companies with evidence of irresponsible practices.
Best in ClassAn investment approach where the leading companies with regard to ESG criteria from each individual sector or industry group are identified and included in a portfolio.
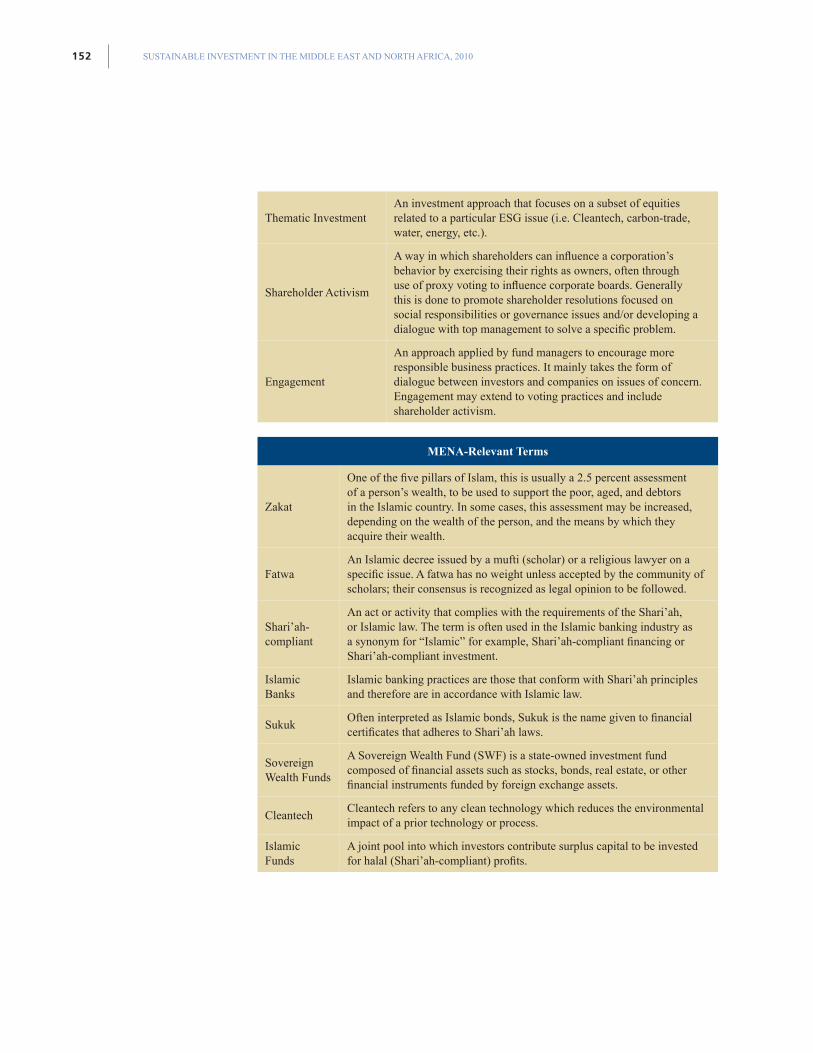
SUSTAINABLE INVESTMENT IN THE MIDDLE EAST AND NORTH AFRICA, 2010152
Thematic InvestmentAn investment approach that focuses on a subset of equities related to a particular ESG issue (i.e. Cleantech, carbon-trade, water, energy, etc.).
Shareholder Activism
A way in which shareholders can influence a corporation’s behavior by exercising their rights as owners, often through use of proxy voting to influence corporate boards. Generally this is done to promote shareholder resolutions focused on social responsibilities or governance issues and/or developing a dialogue with top management to solve a specific problem.
Engagement
An approach applied by fund managers to encourage more responsible business practices. It mainly takes the form of dialogue between investors and companies on issues of concern. Engagement may extend to voting practices and include shareholder activism.
MENA-Relevant Terms
Zakat
One of the five pillars of Islam, this is usually a 2.5 percent assessment of a person’s wealth, to be used to support the poor, aged, and debtors in the Islamic country. In some cases, this assessment may be increased, depending on the wealth of the person, and the means by which they acquire their wealth.
FatwaAn Islamic decree issued by a mufti (scholar) or a religious lawyer on a specific issue. A fatwa has no weight unless accepted by the community of scholars; their consensus is recognized as legal opinion to be followed.
Shari’ah-compliant
An act or activity that complies with the requirements of the Shari’ah, or Islamic law. The term is often used in the Islamic banking industry as a synonym for “Islamic” for example, Shari’ah-compliant financing or Shari’ah-compliant investment.
Islamic Banks
Islamic banking practices are those that conform with Shari’ah principles and therefore are in accordance with Islamic law.
SukukOften interpreted as Islamic bonds, Sukuk is the name given to financial certificates that adheres to Shari’ah laws.
Sovereign Wealth Funds
A Sovereign Wealth Fund (SWF) is a state-owned investment fund composed of financial assets such as stocks, bonds, real estate, or other financial instruments funded by foreign exchange assets.
CleantechCleantech refers to any clean technology which reduces the environmental impact of a prior technology or process.
Islamic Funds
A joint pool into which investors contribute surplus capital to be invested for halal (Shari’ah-compliant) profits.
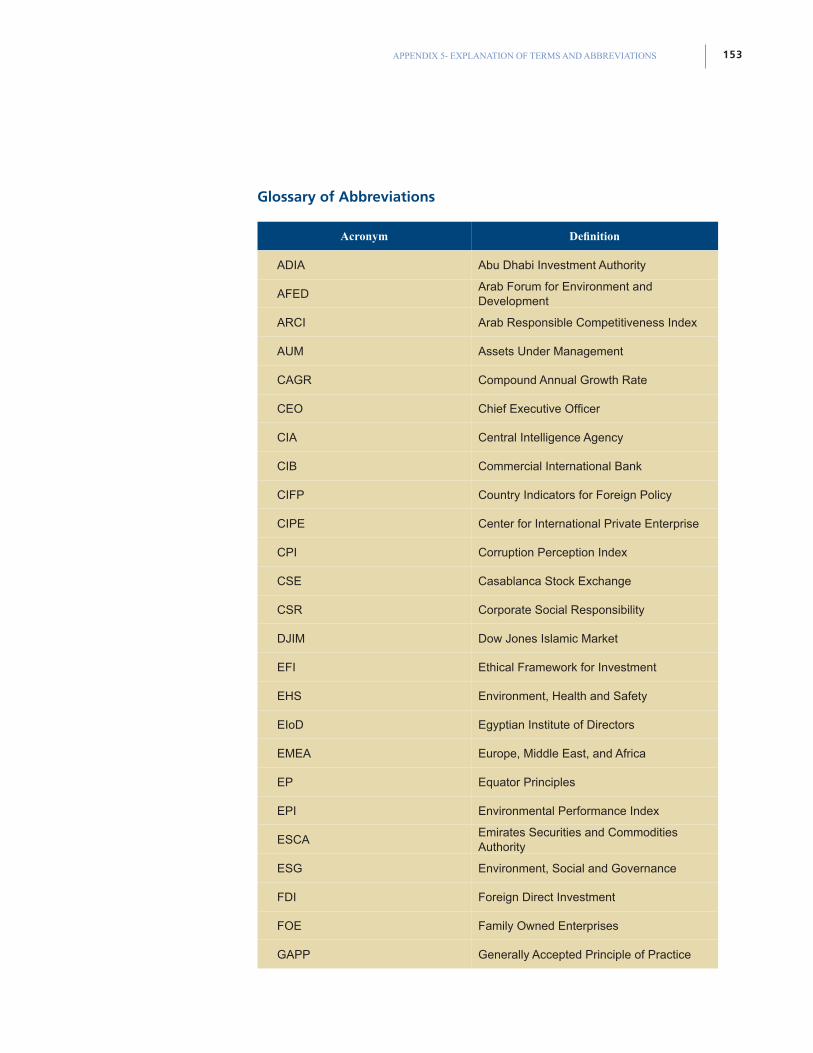
153APPENDIX 5- EXPLANATION OF TERMS AND ABBREVIATIONS
Glossary of Abbreviations
Acronym Definition
ADIA Abu Dhabi Investment Authority
AFEDArab Forum for Environment and Development
ARCI Arab Responsible Competitiveness Index
AUM Assets Under Management
CAGR Compound Annual Growth Rate
CEO Chief Executive Officer
CIA Central Intelligence Agency
CIB Commercial International Bank
CIFP Country Indicators for Foreign Policy
CIPE Center for International Private Enterprise
CPI Corruption Perception Index
CSE Casablanca Stock Exchange
CSR Corporate Social Responsibility
DJIM Dow Jones Islamic Market
EFI Ethical Framework for Investment
EHS Environment, Health and Safety
EIoD Egyptian Institute of Directors
EMEA Europe, Middle East, and Africa
EP Equator Principles
EPI Environmental Performance Index
ESCAEmirates Securities and Commodities Authority
ESG Environment, Social and Governance
FDI Foreign Direct Investment
FOE Family Owned Enterprises
GAPP Generally Accepted Principle of Practice
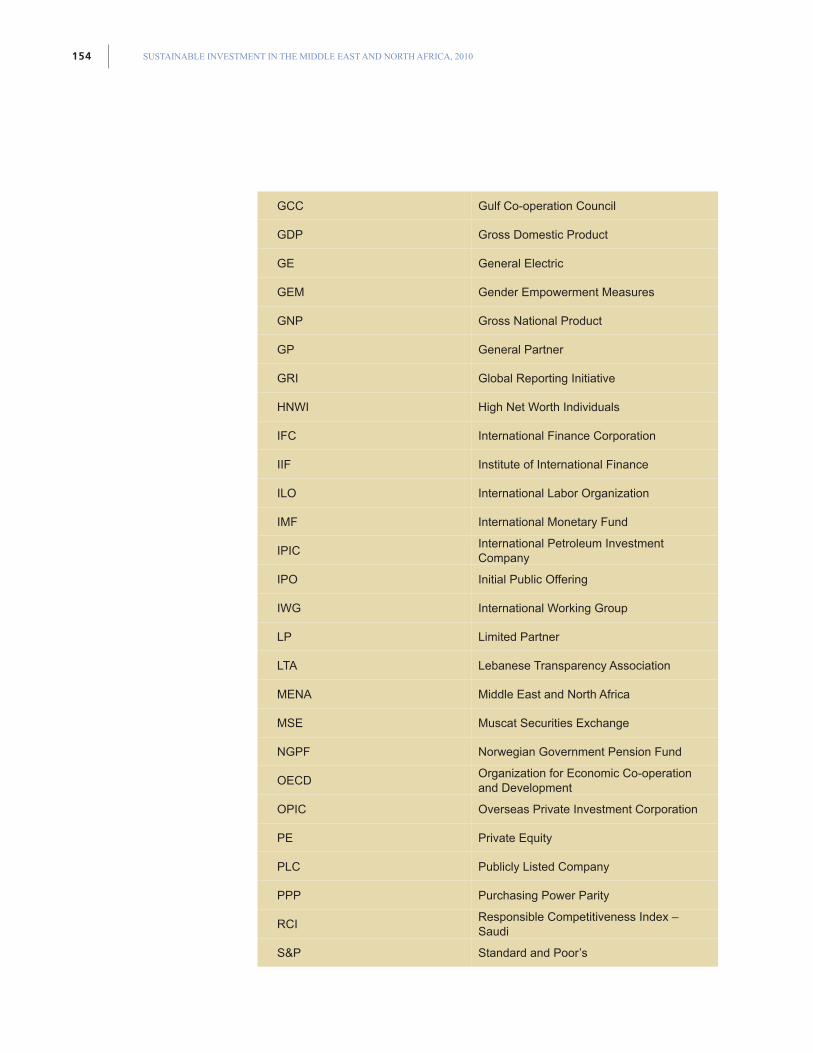
SUSTAINABLE INVESTMENT IN THE MIDDLE EAST AND NORTH AFRICA, 2010154
GCC Gulf Co-operation Council
GDP Gross Domestic Product
GE General Electric
GEM Gender Empowerment Measures
GNP Gross National Product
GP General Partner
GRI Global Reporting Initiative
HNWI High Net Worth Individuals
IFC International Finance Corporation
IIF Institute of International Finance
ILO International Labor Organization
IMF International Monetary Fund
IPICInternational Petroleum Investment Company
IPO Initial Public Offering
IWG International Working Group
LP Limited Partner
LTA Lebanese Transparency Association
MENA Middle East and North Africa
MSE Muscat Securities Exchange
NGPF Norwegian Government Pension Fund
OECDOrganization for Economic Co-operation and Development
OPIC Overseas Private Investment Corporation
PE Private Equity
PLC Publicly Listed Company
PPP Purchasing Power Parity
RCIResponsible Competitiveness Index – Saudi
S&P Standard and Poor’s
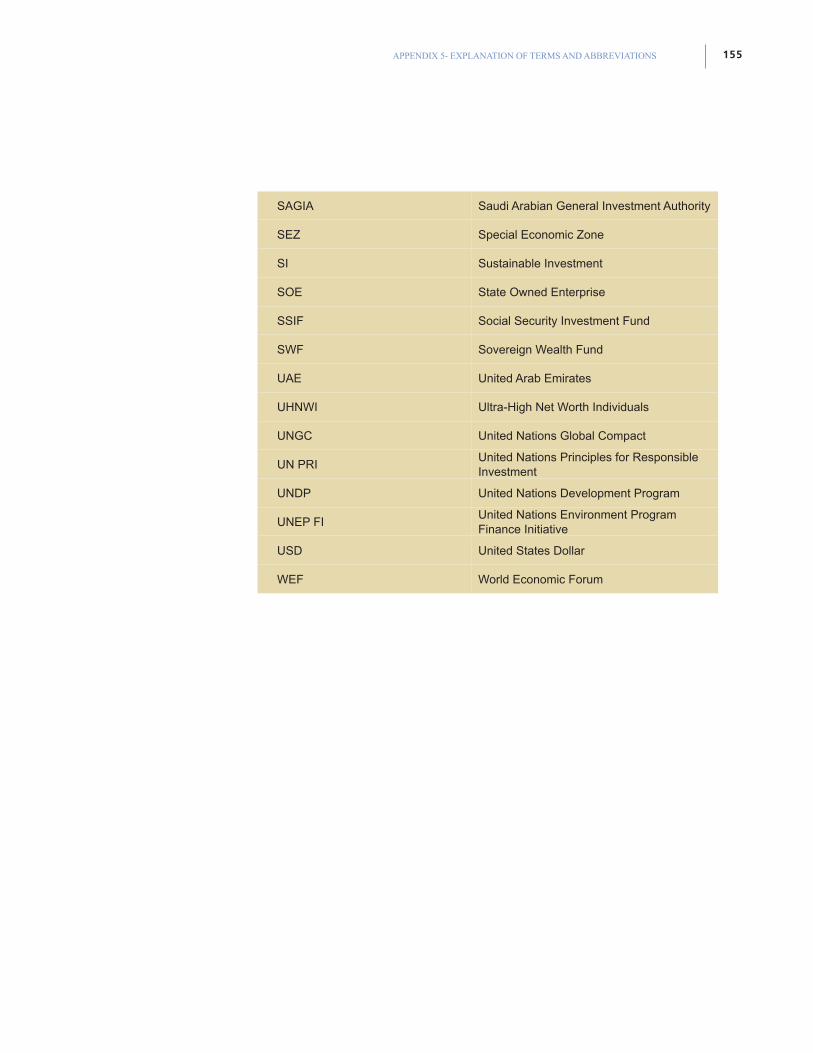
155APPENDIX 5- EXPLANATION OF TERMS AND ABBREVIATIONS
SAGIA Saudi Arabian General Investment Authority
SEZ Special Economic Zone
SI Sustainable Investment
SOE State Owned Enterprise
SSIF Social Security Investment Fund
SWF Sovereign Wealth Fund
UAE United Arab Emirates
UHNWI Ultra-High Net Worth Individuals
UNGC United Nations Global Compact
UN PRIUnited Nations Principles for Responsible Investment
UNDP United Nations Development Program
UNEP FIUnited Nations Environment Program Finance Initiative
USD United States Dollar
WEF World Economic Forum


2011