Embed Size (px)
Citation preview
GCA / 1
Performance of
Key Market
Indices
Notable
Mergers &
Acquisitions and
Asset
Transactions
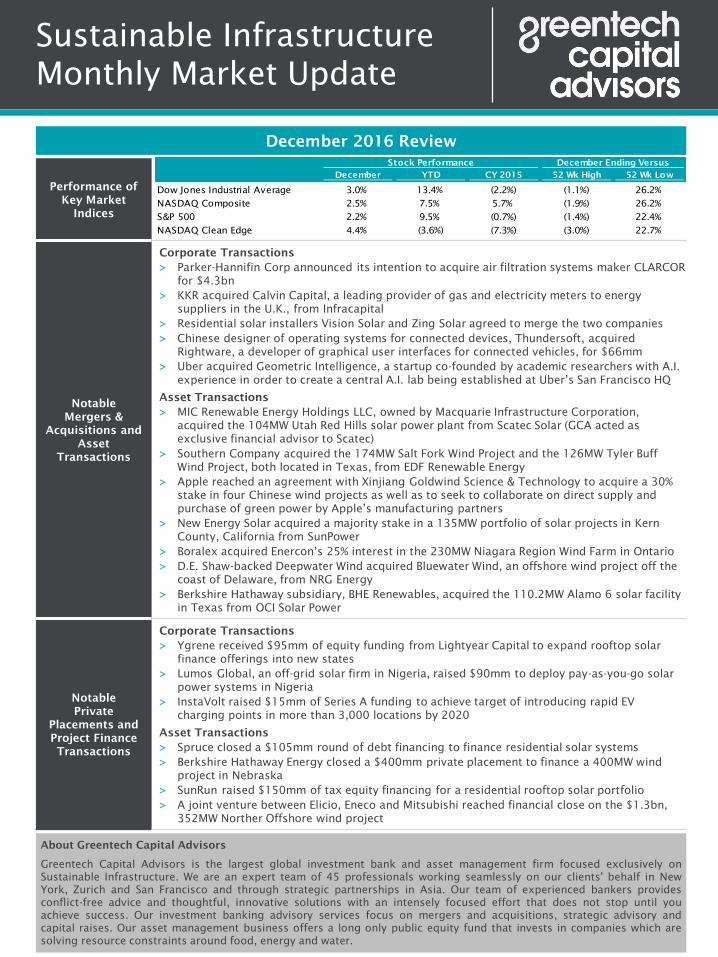
Corporate Transactions
> Parker-Hannifin Corp announced its intention to acquire air filtration systems maker CLARCOR
for $4.3bn
> KKR acquired Calvin Capital, a leading provider of gas and electricity meters to energy
suppliers in the U.K., from Infracapital
> Residential solar installers Vision Solar and Zing Solar agreed to merge the two companies
> Chinese designer of operating systems for connected devices, Thundersoft, acquired
Rightware, a developer of graphical user interfaces for connected vehicles, for $66mm
> Uber acquired Geometric Intelligence, a startup co-founded by academic researchers with A.I.
experience in order to create a central A.I. lab being established at Uber’s San Francisco HQ
Asset Transactions
> MIC Renewable Energy Holdings LLC, owned by Macquarie Infrastructure Corporation,
acquired the 104MW Utah Red Hills solar power plant from Scatec Solar (GCA acted as
exclusive financial advisor to Scatec)
> Southern Company acquired the 174MW Salt Fork Wind Project and the 126MW Tyler Buff
Wind Project, both located in Texas, from EDF Renewable Energy
> Apple reached an agreement with Xinjiang Goldwind Science & Technology to acquire a 30%
stake in four Chinese wind projects as well as to seek to collaborate on direct supply and
purchase of green power by Apple’s manufacturing partners
> New Energy Solar acquired a majority stake in a 135MW portfolio of solar projects in Kern
County, California from SunPower
> Boralex acquired Enercon’s 25% interest in the 230MW Niagara Region Wind Farm in Ontario
> D.E. Shaw-backed Deepwater Wind acquired Bluewater Wind, an offshore wind project off the
coast of Delaware, from NRG Energy
> Berkshire Hathaway subsidiary, BHE Renewables, acquired the 110.2MW Alamo 6 solar facility
in Texas from OCI Solar Power
Notable
Private
Placements and
Project Finance
Transactions
Corporate Transactions
> Ygrene received $95mm of equity funding from Lightyear Capital to expand rooftop solar
finance offerings into new states
> Lumos Global, an off-grid solar firm in Nigeria, raised $90mm to deploy pay-as-you-go solar
power systems in Nigeria
> InstaVolt raised $15mm of Series A funding to achieve target of introducing rapid EV
charging points in more than 3,000 locations by 2020
Asset Transactions
> Spruce closed a $105mm round of debt financing to finance residential solar systems
> Berkshire Hathaway Energy closed a $400mm private placement to finance a 400MW wind
project in Nebraska
> SunRun raised $150mm of tax equity financing for a residential rooftop solar portfolio
> A joint venture between Elicio, Eneco and Mitsubishi reached financial close on the $1.3bn,
352MW Norther Offshore wind project
Sustainable Infrastructure
Monthly Market Update
December 2016 Review
About Greentech Capital Advisors
Greentech Capital Advisors is the largest global investment bank and asset management firm focused exclusively on
Sustainable Infrastructure. We are an expert team of 45 professionals working seamlessly on our clients' behalf in New
York, Zurich and San Francisco and through strategic partnerships in Asia. Our team of experienced bankers provides
conflict-free advice and thoughtful, innovative solutions with an intensely focused effort that does not stop until you
achieve success. Our investment banking advisory services focus on mergers and acquisitions, strategic advisory and
capital raises. Our asset management business offers a long only public equity fund that invests in companies which are
solving resource constraints around food, energy and water.
Stock Performance December Ending Versus First Day of the
December YTD CY 2015 52 Wk High 52 Wk Low
Dow Jones Industrial Average 3.0% 13.4% (2.2%) (1.1%) 26.2%
NASDAQ Composite 2.5% 7.5% 5.7% (1.9%) 26.2%
S&P 500 2.2% 9.5% (0.7%) (1.4%) 22.4%
NASDAQ Clean Edge 4.4% (3.6%) (7.3%) (3.0%) 22.7%
GCA / 2
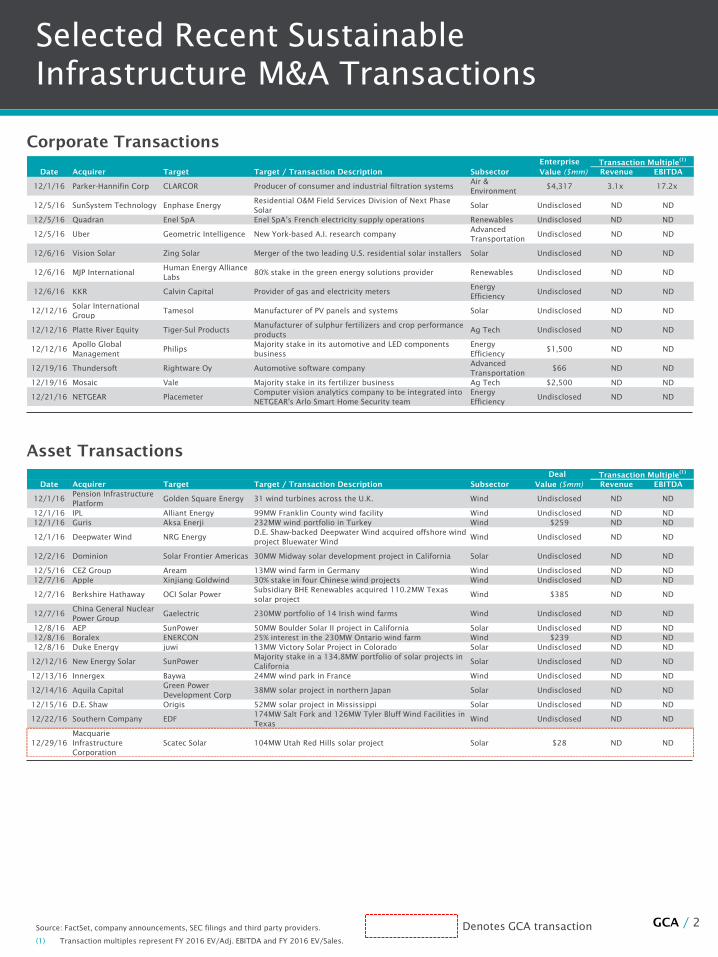
Selected Recent Sustainable
Infrastructure M&A Transactions
Asset Transactions
Source: FactSet, company announcements, SEC filings and third party providers.
(1) Transaction multiples represent FY 2016 EV/Adj. EBITDA and FY 2016 EV/Sales.
Corporate Transactions
Deal Transaction Multiple(1)
Date Acquirer Target Target / Transaction Description Subsector Value ($mm) Revenue EBITDA
12/1/16Pension Infrastructure
Platform Golden Square Energy 31 wind turbines across the U.K. Wind Undisclosed ND ND
12/1/16 IPL Alliant Energy 99MW Franklin County wind facility Wind Undisclosed ND ND
12/1/16 Guris Aksa Enerji 232MW wind portfolio in Turkey Wind $259 ND ND
12/1/16 Deepwater Wind NRG EnergyD.E. Shaw-backed Deepwater Wind acquired offshore wind
project Bluewater WindWind Undisclosed ND ND
12/2/16 Dominion Solar Frontier Americas 30MW Midway solar development project in California Solar Undisclosed ND ND
12/5/16 CEZ Group Aream 13MW wind farm in Germany Wind Undisclosed ND ND
12/7/16 Apple Xinjiang Goldwind 30% stake in four Chinese wind projects Wind Undisclosed ND ND
12/7/16 Berkshire Hathaway OCI Solar PowerSubsidiary BHE Renewables acquired 110.2MW Texas
solar projectWind $385 ND ND
12/7/16China General Nuclear
Power GroupGaelectric 230MW portfolio of 14 Irish wind farms Wind Undisclosed ND ND
12/8/16 AEP SunPower 50MW Boulder Solar II project in California Solar Undisclosed ND ND
12/8/16 Boralex ENERCON 25% interest in the 230MW Ontario wind farm Wind $239 ND ND
12/8/16 Duke Energy juwi 13MW Victory Solar Project in Colorado Solar Undisclosed ND ND
12/12/16 New Energy Solar SunPowerMajority stake in a 134.8MW portfolio of solar projects in
California Solar Undisclosed ND ND
12/13/16 Innergex Baywa 24MW wind park in France Wind Undisclosed ND ND
12/14/16 Aquila CapitalGreen Power
Development Corp38MW solar project in northern Japan Solar Undisclosed ND ND
12/15/16 D.E. Shaw Origis 52MW solar project in Mississippi Solar Undisclosed ND ND
12/22/16 Southern Company EDF174MW Salt Fork and 126MW Tyler Bluff Wind Facilities in
TexasWind Undisclosed ND ND
12/29/16
Macquarie
Infrastructure
Corporation
Scatec Solar 104MW Utah Red Hills solar project Solar $28 ND ND
Denotes GCA transaction
Enterprise Transaction Multiple(1)
Date Acquirer Target Target / Transaction Description Subsector Value ($mm) Revenue EBITDA
12/1/16 Parker-Hannifin Corp CLARCOR Producer of consumer and industrial filtration systemsAir &
Environment$4,317 3.1x 17.2x
12/5/16 SunSystem Technology Enphase EnergyResidential O&M Field Services Division of Next Phase
SolarSolar Undisclosed ND ND
12/5/16 Quadran Enel SpA Enel SpA’s French electricity supply operations Renewables Undisclosed ND ND
12/5/16 Uber Geometric Intelligence New York-based A.I. research companyAdvanced
TransportationUndisclosed ND ND
12/6/16 Vision Solar Zing Solar Merger of the two leading U.S. residential solar installers Solar Undisclosed ND ND
12/6/16 MJP InternationalHuman Energy Alliance
Labs80% stake in the green energy solutions provider Renewables Undisclosed ND ND
12/6/16 KKR Calvin Capital Provider of gas and electricity metersEnergy
EfficiencyUndisclosed ND ND
12/12/16Solar International
GroupTamesol Manufacturer of PV panels and systems Solar Undisclosed ND ND
12/12/16 Platte River Equity Tiger-Sul ProductsManufacturer of sulphur fertilizers and crop performance
productsAg Tech Undisclosed ND ND
12/12/16Apollo Global
ManagementPhilips
Majority stake in its automotive and LED components
business
Energy
Efficiency$1,500 ND ND
12/19/16 Thundersoft Rightware Oy Automotive software companyAdvanced
Transportation$66 ND ND
12/19/16 Mosaic Vale Majority stake in its fertilizer business Ag Tech $2,500 ND ND
12/21/16 NETGEAR PlacemeterComputer vision analytics company to be integrated into
NETGEAR's Arlo Smart Home Security team
Energy
EfficiencyUndisclosed ND ND
GCA / 3
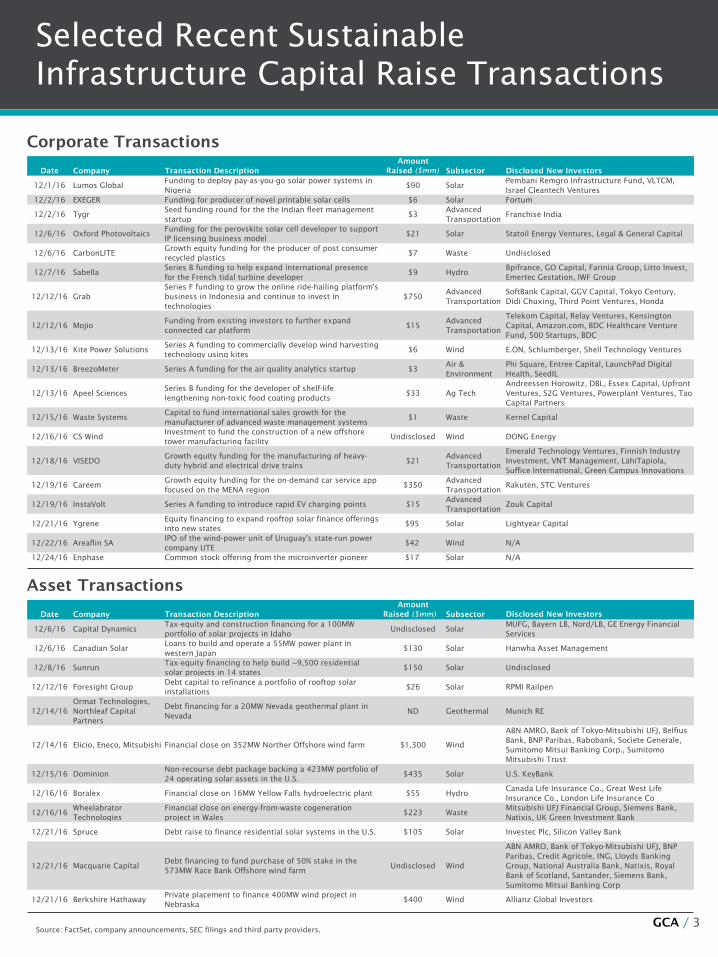
Selected Recent Sustainable
Infrastructure Capital Raise Transactions
Corporate Transactions
Source: FactSet, company announcements, SEC filings and third party providers.
Amount
Date Company Transaction Description Raised ($mm) Subsector Disclosed New Investors
12/6/16 Capital DynamicsTax-equity and construction financing for a 100MW
portfolio of solar projects in IdahoUndisclosed Solar
MUFG, Bayern LB, Nord/LB, GE Energy Financial
Services
12/6/16 Canadian SolarLoans to build and operate a 55MW power plant in
western Japan$130 Solar Hanwha Asset Management
12/8/16 SunrunTax-equity financing to help build ~9,500 residential
solar projects in 14 states$150 Solar Undisclosed
12/12/16 Foresight GroupDebt capital to refinance a portfolio of rooftop solar
installations$26 Solar RPMI Railpen
12/14/16
Ormat Technologies,
Northleaf Capital
Partners
Debt financing for a 20MW Nevada geothermal plant in
NevadaND Geothermal Munich RE
12/14/16 Elicio, Eneco, Mitsubishi Financial close on 352MW Norther Offshore wind farm $1,300 Wind
ABN AMRO, Bank of Tokyo-Mitsubishi UFJ, Belfius
Bank, BNP Paribas, Rabobank, Societe Generale,
Sumitomo Mitsui Banking Corp., Sumitomo
Mitsubishi Trust
12/15/16 DominionNon-recourse debt package backing a 423MW portfolio of
24 operating solar assets in the U.S.$435 Solar U.S. KeyBank
12/16/16 Boralex Financial close on 16MW Yellow Falls hydroelectric plant $55 HydroCanada Life Insurance Co., Great West Life
Insurance Co., London Life Insurance Co
12/16/16Wheelabrator
Technologies
Financial close on energy-from-waste cogeneration
project in Wales$223 Waste
Mitsubishi UFJ Financial Group, Siemens Bank,
Natixis, UK Green Investment Bank
12/21/16 Spruce Debt raise to finance residential solar systems in the U.S. $105 Solar Investec Plc, Silicon Valley Bank
12/21/16 Macquarie CapitalDebt financing to fund purchase of 50% stake in the
573MW Race Bank Offshore wind farmUndisclosed Wind
ABN AMRO, Bank of Tokyo-Mitsubishi UFJ, BNP
Paribas, Credit Agricole, ING, Lloyds Banking
Group, National Australia Bank, Natixis, Royal
Bank of Scotland, Santander, Siemens Bank,
Sumitomo Mitsui Banking Corp
12/21/16 Berkshire HathawayPrivate placement to finance 400MW wind project in
Nebraska$400 Wind Allianz Global Investors
Asset Transactions
Amount
Date Company Transaction Description Raised ($mm) Subsector Disclosed New Investors
12/1/16 Lumos GlobalFunding to deploy pay-as-you-go solar power systems in
Nigeria$90 Solar
Pembani Remgro Infrastructure Fund, VLTCM,
Israel Cleantech Ventures
12/2/16 EXEGER Funding for producer of novel printable solar cells $6 Solar Fortum
12/2/16 TygrSeed funding round for the the Indian fleet management
startup$3
Advanced
TransportationFranchise India
12/6/16 Oxford PhotovoltaicsFunding for the perovskite solar cell developer to support
IP licensing business model$21 Solar Statoil Energy Ventures, Legal & General Capital
12/6/16 CarbonLITEGrowth equity funding for the producer of post consumer
recycled plastics$7 Waste Undisclosed
12/7/16 SabellaSeries B funding to help expand international presence
for the French tidal turbine developer$9 Hydro
Bpifrance, GO Capital, Farinia Group, Litto Invest,
Emertec Gestation, IWF Group
12/12/16 Grab
Series F funding to grow the online ride-hailing platform's
business in Indonesia and continue to invest in
technologies
$750 Advanced
Transportation
SoftBank Capital, GGV Capital, Tokyo Century,
Didi Chuxing, Third Point Ventures, Honda
12/12/16 MojioFunding from existing investors to further expand
connected car platform$15
Advanced
Transportation
Telekom Capital, Relay Ventures, Kensington
Capital, Amazon.com, BDC Healthcare Venture
Fund, 500 Startups, BDC
12/13/16 Kite Power SolutionsSeries A funding to commercially develop wind harvesting
technology using kites$6 Wind E.ON, Schlumberger, Shell Technology Ventures
12/13/16 BreezoMeter Series A funding for the air quality analytics startup $3 Air &
Environment
Phi Square, Entree Capital, LaunchPad Digital
Health, SeedIL
12/13/16 Apeel SciencesSeries B funding for the developer of shelf-life
lengthening non-toxic food coating products$33 Ag Tech
Andreessen Horowitz, DBL, Essex Capital, Upfront
Ventures, S2G Ventures, Powerplant Ventures, Tao
Capital Partners
12/15/16 Waste SystemsCapital to fund international sales growth for the
manufacturer of advanced waste management systems$1 Waste Kernel Capital
12/16/16 CS WindInvestment to fund the construction of a new offshore
tower manufacturing facility Undisclosed Wind DONG Energy
12/18/16 VISEDOGrowth equity funding for the manufacturing of heavy-
duty hybrid and electrical drive trains$21
Advanced
Transportation
Emerald Technology Ventures, Finnish Industry
Investment, VNT Management, LähiTapiola,
Suffice International, Green Campus Innovations
12/19/16 CareemGrowth equity funding for the on-demand car service app
focused on the MENA region$350
Advanced
TransportationRakuten, STC Ventures
12/19/16 InstaVolt Series A funding to introduce rapid EV charging points $15 Advanced
TransportationZouk Capital
12/21/16 YgreneEquity financing to expand rooftop solar finance offerings
into new states$95 Solar Lightyear Capital
12/22/16 Areaflin SAIPO of the wind-power unit of Uruguay's state-run power
company UTE$42 Wind N/A
12/24/16 Enphase Common stock offering from the microinverter pioneer $17 Solar N/A
GCA / 4
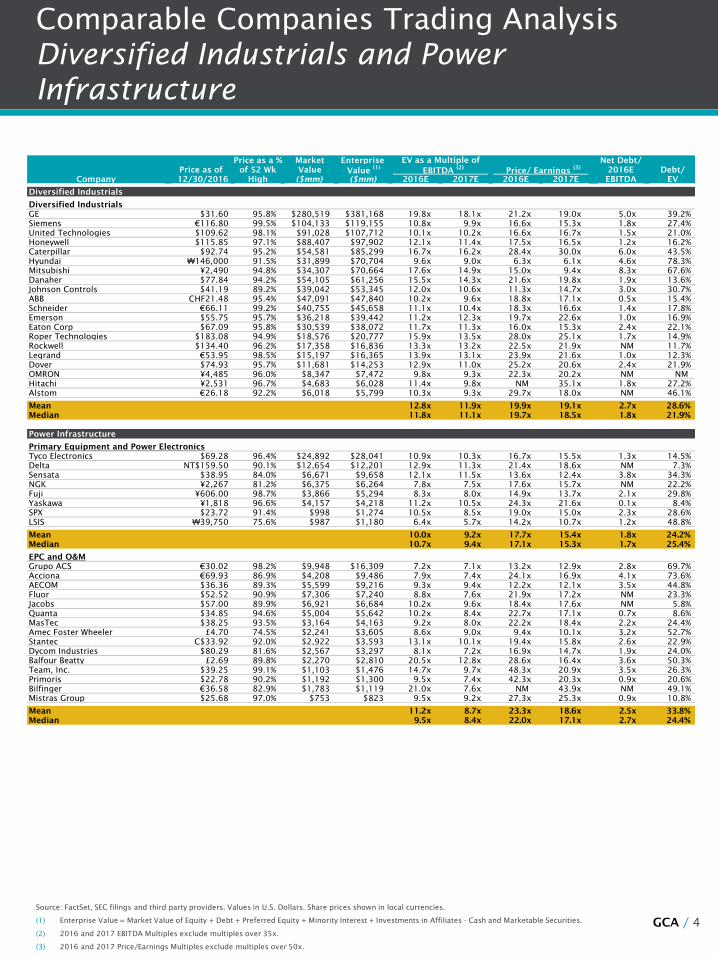
Comparable Companies Trading Analysis
Diversified Industrials and Power
Infrastructure
Source: FactSet, SEC filings and third party providers. Values in U.S. Dollars. Share prices shown in local currencies.
(1) Enterprise Value = Market Value of Equity + Debt + Preferred Equity + Minority Interest + Investments in Affiliates - Cash and Marketable Securities.
(2) 2016 and 2017 EBITDA Multiples exclude multiples over 35x.
(3) 2016 and 2017 Price/Earnings Multiples exclude multiples over 50x.
Price as a % Market Enterprise Net Debt/
Price as of of 52 Wk Value Value (1)
EBITDA (2)
Price/ Earnings (3)
2016E Debt/
Company 12/30/2016 High ($mm) ($mm) 2016E 2017E 2016E 2017E EBITDA EV
Diversified Industrials
Diversified Industrials
GE $31.60 95.8% $280,519 $381,168 19.8x 18.1x 21.2x 19.0x 5.0x 39.2%
Siemens €116.80 99.5% $104,133 $119,155 10.8x 9.9x 16.6x 15.3x 1.8x 27.4%
United Technologies $109.62 98.1% $91,028 $107,712 10.1x 10.2x 16.6x 16.7x 1.5x 21.0%
Honeywell $115.85 97.1% $88,407 $97,902 12.1x 11.4x 17.5x 16.5x 1.2x 16.2%
Caterpillar $92.74 95.2% $54,581 $85,299 16.7x 16.2x 28.4x 30.0x 6.0x 43.5%
Hyundai ₩146,000 91.5% $31,899 $70,704 9.6x 9.0x 6.3x 6.1x 4.6x 78.3%
Mitsubishi ¥2,490 94.8% $34,307 $70,664 17.6x 14.9x 15.0x 9.4x 8.3x 67.6%
Danaher $77.84 94.2% $54,105 $61,256 15.5x 14.3x 21.6x 19.8x 1.9x 13.6%
Johnson Controls $41.19 89.2% $39,042 $53,345 12.0x 10.6x 11.3x 14.7x 3.0x 30.7%
ABB CHF21.48 95.4% $47,091 $47,840 10.2x 9.6x 18.8x 17.1x 0.5x 15.4%
Schneider €66.11 99.2% $40,755 $45,658 11.1x 10.4x 18.3x 16.6x 1.4x 17.8%
Emerson $55.75 95.7% $36,218 $39,442 11.2x 12.3x 19.7x 22.6x 1.0x 16.9%
Eaton Corp $67.09 95.8% $30,539 $38,072 11.7x 11.3x 16.0x 15.3x 2.4x 22.1%
Roper Technologies $183.08 94.9% $18,576 $20,777 15.9x 13.5x 28.0x 25.1x 1.7x 14.9%
Rockwell $134.40 96.2% $17,358 $16,836 13.3x 13.2x 22.5x 21.9x NM 11.7%
Legrand €53.95 98.5% $15,197 $16,365 13.9x 13.1x 23.9x 21.6x 1.0x 12.3%
Dover $74.93 95.7% $11,681 $14,253 12.9x 11.0x 25.2x 20.6x 2.4x 21.9%
OMRON ¥4,485 96.0% $8,347 $7,472 9.8x 9.3x 22.3x 20.2x NM NM
Hitachi ¥2,531 96.7% $4,683 $6,028 11.4x 9.8x NM 35.1x 1.8x 27.2%
Alstom €26.18 92.2% $6,018 $5,799 10.3x 9.3x 29.7x 18.0x NM 46.1%
Mean 12.8x 11.9x 19.9x 19.1x 2.7x 28.6%
Median 11.8x 11.1x 19.7x 18.5x 1.8x 21.9%
Power Infrastructure
Primary Equipment and Power Electronics
Tyco Electronics $69.28 96.4% $24,892 $28,041 10.9x 10.3x 16.7x 15.5x 1.3x 14.5%
Delta NT$159.50 90.1% $12,654 $12,201 12.9x 11.3x 21.4x 18.6x NM 7.3%
Sensata $38.95 84.0% $6,671 $9,658 12.1x 11.5x 13.6x 12.4x 3.8x 34.3%
NGK ¥2,267 81.2% $6,375 $6,264 7.8x 7.5x 17.6x 15.7x NM 22.2%
Fuji ¥606.00 98.7% $3,866 $5,294 8.3x 8.0x 14.9x 13.7x 2.1x 29.8%
Yaskawa ¥1,818 96.6% $4,157 $4,218 11.2x 10.5x 24.3x 21.6x 0.1x 8.4%
SPX $23.72 91.4% $998 $1,274 10.5x 8.5x 19.0x 15.0x 2.3x 28.6%
LSIS ₩39,750 75.6% $987 $1,180 6.4x 5.7x 14.2x 10.7x 1.2x 48.8%
Mean 10.0x 9.2x 17.7x 15.4x 1.8x 24.2%
Median 10.7x 9.4x 17.1x 15.3x 1.7x 25.4%
EPC and O&M
Grupo ACS €30.02 98.2% $9,948 $16,309 7.2x 7.1x 13.2x 12.9x 2.8x 69.7%
Acciona €69.93 86.9% $4,208 $9,486 7.9x 7.4x 24.1x 16.9x 4.1x 73.6%
AECOM $36.36 89.3% $5,599 $9,216 9.3x 9.4x 12.2x 12.1x 3.5x 44.8%
Fluor $52.52 90.9% $7,306 $7,240 8.8x 7.6x 21.9x 17.2x NM 23.3%
Jacobs $57.00 89.9% $6,921 $6,684 10.2x 9.6x 18.4x 17.6x NM 5.8%
Quanta $34.85 94.6% $5,004 $5,642 10.2x 8.4x 22.7x 17.1x 0.7x 8.6%
MasTec $38.25 93.5% $3,164 $4,163 9.2x 8.0x 22.2x 18.4x 2.2x 24.4%
Amec Foster Wheeler £4.70 74.5% $2,241 $3,605 8.6x 9.0x 9.4x 10.1x 3.2x 52.7%
Stantec C$33.92 92.0% $2,922 $3,593 13.1x 10.1x 19.4x 15.8x 2.6x 22.9%
Dycom Industries $80.29 81.6% $2,567 $3,297 8.1x 7.2x 16.9x 14.7x 1.9x 24.0%
Balfour Beatty £2.69 89.8% $2,270 $2,810 20.5x 12.8x 28.6x 16.4x 3.6x 50.3%
Team, Inc. $39.25 99.1% $1,103 $1,476 14.7x 9.7x 48.3x 20.9x 3.5x 26.3%
Primoris $22.78 90.2% $1,192 $1,300 9.5x 7.4x 42.3x 20.3x 0.9x 20.6%
Bilfinger €36.58 82.9% $1,783 $1,119 21.0x 7.6x NM 43.9x NM 49.1%
Mistras Group $25.68 97.0% $753 $823 9.5x 9.2x 27.3x 25.3x 0.9x 10.8%
Mean 11.2x 8.7x 23.3x 18.6x 2.5x 33.8%
Median 9.5x 8.4x 22.0x 17.1x 2.7x 24.4%
EV as a Multiple of
GCA / 5
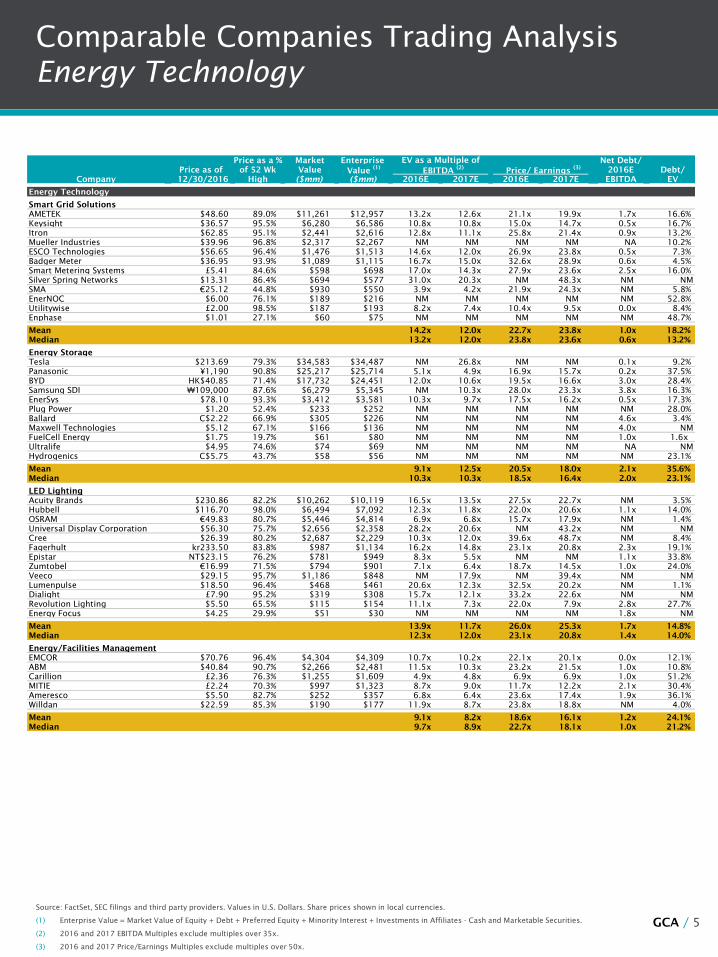
Comparable Companies Trading Analysis
Energy Technology
Source: FactSet, SEC filings and third party providers. Values in U.S. Dollars. Share prices shown in local currencies.
(1) Enterprise Value = Market Value of Equity + Debt + Preferred Equity + Minority Interest + Investments in Affiliates - Cash and Marketable Securities.
(2) 2016 and 2017 EBITDA Multiples exclude multiples over 35x.
(3) 2016 and 2017 Price/Earnings Multiples exclude multiples over 50x.
Price as a % Market Enterprise Net Debt/
Price as of of 52 Wk Value Value (1)
EBITDA (2)
Price/ Earnings (3)
2016E Debt/
Company 12/30/2016 High ($mm) ($mm) 2016E 2017E 2016E 2017E EBITDA EV
Energy Technology
Smart Grid Solutions
AMETEK $48.60 89.0% $11,261 $12,957 13.2x 12.6x 21.1x 19.9x 1.7x 16.6%
Keysight $36.57 95.5% $6,280 $6,586 10.8x 10.8x 15.0x 14.7x 0.5x 16.7%
Itron $62.85 95.1% $2,441 $2,616 12.8x 11.1x 25.8x 21.4x 0.9x 13.2%
Mueller Industries $39.96 96.8% $2,317 $2,267 NM NM NM NM NA 10.2%
ESCO Technologies $56.65 96.4% $1,476 $1,513 14.6x 12.0x 26.9x 23.8x 0.5x 7.3%
Badger Meter $36.95 93.9% $1,089 $1,115 16.7x 15.0x 32.6x 28.9x 0.6x 4.5%
Smart Metering Systems £5.41 84.6% $598 $698 17.0x 14.3x 27.9x 23.6x 2.5x 16.0%
Silver Spring Networks $13.31 86.4% $694 $577 31.0x 20.3x NM 48.3x NM NM
SMA €25.12 44.8% $930 $550 3.9x 4.2x 21.9x 24.3x NM 5.8%
EnerNOC $6.00 76.1% $189 $216 NM NM NM NM NM 52.8%
Utilitywise £2.00 98.5% $187 $193 8.2x 7.4x 10.4x 9.5x 0.0x 8.4%
Enphase $1.01 27.1% $60 $75 NM NM NM NM NM 48.7%
Mean 14.2x 12.0x 22.7x 23.8x 1.0x 18.2%
Median 13.2x 12.0x 23.8x 23.6x 0.6x 13.2%
Energy Storage
Tesla $213.69 79.3% $34,583 $34,487 NM 26.8x NM NM 0.1x 9.2%
Panasonic ¥1,190 90.8% $25,217 $25,714 5.1x 4.9x 16.9x 15.7x 0.2x 37.5%
BYD HK$40.85 71.4% $17,732 $24,451 12.0x 10.6x 19.5x 16.6x 3.0x 28.4%
Samsung SDI ₩109,000 87.6% $6,279 $5,345 NM 10.3x 28.0x 23.3x 3.8x 16.3%
EnerSys $78.10 93.3% $3,412 $3,581 10.3x 9.7x 17.5x 16.2x 0.5x 17.3%
Plug Power $1.20 52.4% $233 $252 NM NM NM NM NM 28.0%
Ballard C$2.22 66.9% $305 $226 NM NM NM NM 4.6x 3.4%
Maxwell Technologies $5.12 67.1% $166 $136 NM NM NM NM 4.0x NM
FuelCell Energy $1.75 19.7% $61 $80 NM NM NM NM 1.0x 1.6x
Ultralife $4.95 74.6% $74 $69 NM NM NM NM NA NM
Hydrogenics C$5.75 43.7% $58 $56 NM NM NM NM NM 23.1%
Mean 9.1x 12.5x 20.5x 18.0x 2.1x 35.6%
Median 10.3x 10.3x 18.5x 16.4x 2.0x 23.1%
LED Lighting
Acuity Brands $230.86 82.2% $10,262 $10,119 16.5x 13.5x 27.5x 22.7x NM 3.5%
Hubbell $116.70 98.0% $6,494 $7,092 12.3x 11.8x 22.0x 20.6x 1.1x 14.0%
OSRAM €49.83 80.7% $5,446 $4,814 6.9x 6.8x 15.7x 17.9x NM 1.4%
Universal Display Corporation $56.30 75.7% $2,656 $2,358 28.2x 20.6x NM 43.2x NM NM
Cree $26.39 80.2% $2,687 $2,229 10.3x 12.0x 39.6x 48.7x NM 8.4%
Fagerhult kr233.50 83.8% $987 $1,134 16.2x 14.8x 23.1x 20.8x 2.3x 19.1%
Epistar NT$23.15 76.2% $781 $949 8.3x 5.5x NM NM 1.1x 33.8%
Zumtobel €16.99 71.5% $794 $901 7.1x 6.4x 18.7x 14.5x 1.0x 24.0%
Veeco $29.15 95.7% $1,186 $848 NM 17.9x NM 39.4x NM NM
Lumenpulse $18.50 96.4% $468 $461 20.6x 12.3x 32.5x 20.2x NM 1.1%
Dialight £7.90 95.2% $319 $308 15.7x 12.1x 33.2x 22.6x NM NM
Revolution Lighting $5.50 65.5% $115 $154 11.1x 7.3x 22.0x 7.9x 2.8x 27.7%
Energy Focus $4.25 29.9% $51 $30 NM NM NM NM 1.8x NM
Mean 13.9x 11.7x 26.0x 25.3x 1.7x 14.8%
Median 12.3x 12.0x 23.1x 20.8x 1.4x 14.0%
Energy/Facilities Management
EMCOR $70.76 96.4% $4,304 $4,309 10.7x 10.2x 22.1x 20.1x 0.0x 12.1%
ABM $40.84 90.7% $2,266 $2,481 11.5x 10.3x 23.2x 21.5x 1.0x 10.8%
Carillion £2.36 76.3% $1,255 $1,609 4.9x 4.8x 6.9x 6.9x 1.0x 51.2%
MITIE £2.24 70.3% $997 $1,323 8.7x 9.0x 11.7x 12.2x 2.1x 30.4%
Ameresco $5.50 82.7% $252 $357 6.8x 6.4x 23.6x 17.4x 1.9x 36.1%
Willdan $22.59 85.3% $190 $177 11.9x 8.7x 23.8x 18.8x NM 4.0%
Mean 9.1x 8.2x 18.6x 16.1x 1.2x 24.1%
Median 9.7x 8.9x 22.7x 18.1x 1.0x 21.2%
EV as a Multiple of
GCA / 6
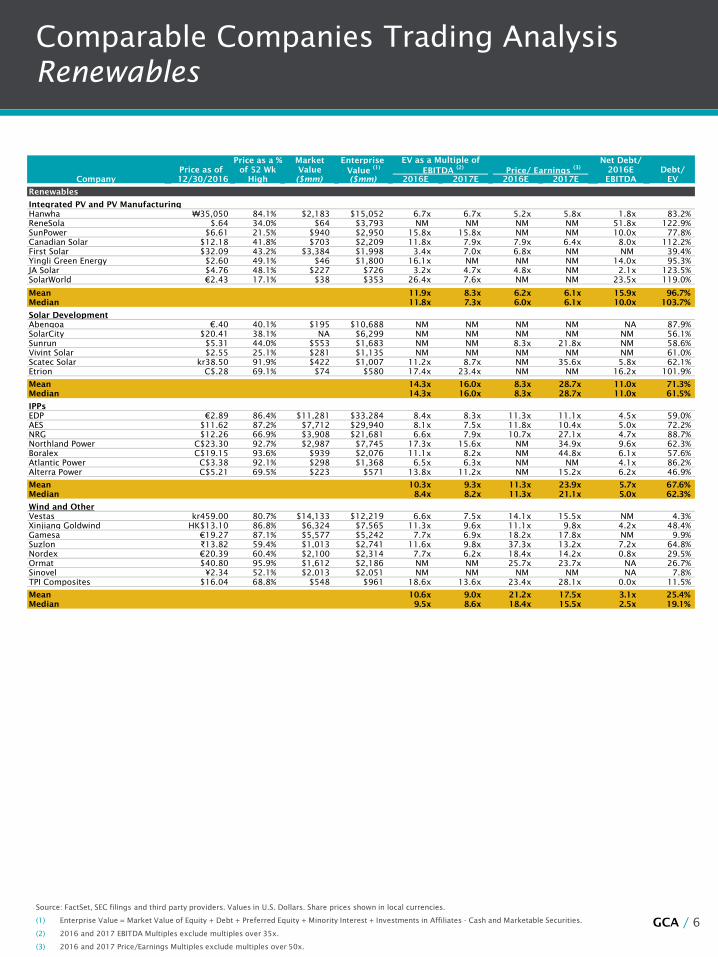
Comparable Companies Trading Analysis
Renewables
Source: FactSet, SEC filings and third party providers. Values in U.S. Dollars. Share prices shown in local currencies.
(1) Enterprise Value = Market Value of Equity + Debt + Preferred Equity + Minority Interest + Investments in Affiliates - Cash and Marketable Securities.
(2) 2016 and 2017 EBITDA Multiples exclude multiples over 35x.
(3) 2016 and 2017 Price/Earnings Multiples exclude multiples over 50x.
Price as a % Market Enterprise Net Debt/
Price as of of 52 Wk Value Value (1)
EBITDA (2)
Price/ Earnings (3)
2016E Debt/
Company 12/30/2016 High ($mm) ($mm) 2016E 2017E 2016E 2017E EBITDA EV
Renewables
Integrated PV and PV Manufacturing
Hanwha ₩35,050 84.1% $2,183 $15,052 6.7x 6.7x 5.2x 5.8x 1.8x 83.2%
ReneSola $.64 34.0% $64 $3,793 NM NM NM NM 51.8x 122.9%
SunPower $6.61 21.5% $940 $2,950 15.8x 15.8x NM NM 10.0x 77.8%
Canadian Solar $12.18 41.8% $703 $2,209 11.8x 7.9x 7.9x 6.4x 8.0x 112.2%
First Solar $32.09 43.2% $3,384 $1,998 3.4x 7.0x 6.8x NM NM 39.4%
Yingli Green Energy $2.60 49.1% $46 $1,800 16.1x NM NM NM 14.0x 95.3%
JA Solar $4.76 48.1% $227 $726 3.2x 4.7x 4.8x NM 2.1x 123.5%
SolarWorld €2.43 17.1% $38 $353 26.4x 7.6x NM NM 23.5x 119.0%
Mean 11.9x 8.3x 6.2x 6.1x 15.9x 96.7%
Median 11.8x 7.3x 6.0x 6.1x 10.0x 103.7%
Solar Development
Abengoa €.40 40.1% $195 $10,688 NM NM NM NM NA 87.9%
SolarCity $20.41 38.1% NA $6,299 NM NM NM NM NM 56.1%
Sunrun $5.31 44.0% $553 $1,683 NM NM 8.3x 21.8x NM 58.6%
Vivint Solar $2.55 25.1% $281 $1,135 NM NM NM NM NM 61.0%
Scatec Solar kr38.50 91.9% $422 $1,007 11.2x 8.7x NM 35.6x 5.8x 62.1%
Etrion C$.28 69.1% $74 $580 17.4x 23.4x NM NM 16.2x 101.9%
Mean 14.3x 16.0x 8.3x 28.7x 11.0x 71.3%
Median 14.3x 16.0x 8.3x 28.7x 11.0x 61.5%
IPPs
EDP €2.89 86.4% $11,281 $33,284 8.4x 8.3x 11.3x 11.1x 4.5x 59.0%
AES $11.62 87.2% $7,712 $29,940 8.1x 7.5x 11.8x 10.4x 5.0x 72.2%
NRG $12.26 66.9% $3,908 $21,681 6.6x 7.9x 10.7x 27.1x 4.7x 88.7%
Northland Power C$23.30 92.7% $2,987 $7,745 17.3x 15.6x NM 34.9x 9.6x 62.3%
Boralex C$19.15 93.6% $939 $2,076 11.1x 8.2x NM 44.8x 6.1x 57.6%
Atlantic Power C$3.38 92.1% $298 $1,368 6.5x 6.3x NM NM 4.1x 86.2%
Alterra Power C$5.21 69.5% $223 $571 13.8x 11.2x NM 15.2x 6.2x 46.9%
Mean 10.3x 9.3x 11.3x 23.9x 5.7x 67.6%
Median 8.4x 8.2x 11.3x 21.1x 5.0x 62.3%
Wind and Other
Vestas kr459.00 80.7% $14,133 $12,219 6.6x 7.5x 14.1x 15.5x NM 4.3%
Xinjiang Goldwind HK$13.10 86.8% $6,324 $7,565 11.3x 9.6x 11.1x 9.8x 4.2x 48.4%
Gamesa €19.27 87.1% $5,577 $5,242 7.7x 6.9x 18.2x 17.8x NM 9.9%
Suzlon ₹13.82 59.4% $1,013 $2,741 11.6x 9.8x 37.3x 13.2x 7.2x 64.8%
Nordex €20.39 60.4% $2,100 $2,314 7.7x 6.2x 18.4x 14.2x 0.8x 29.5%
Ormat $40.80 95.9% $1,612 $2,186 NM NM 25.7x 23.7x NA 26.7%
Sinovel ¥2.34 52.1% $2,013 $2,051 NM NM NM NM NA 7.8%
TPI Composites $16.04 68.8% $548 $961 18.6x 13.6x 23.4x 28.1x 0.0x 11.5%
Mean 10.6x 9.0x 21.2x 17.5x 3.1x 25.4%
Median 9.5x 8.6x 18.4x 15.5x 2.5x 19.1%
EV as a Multiple of
GCA / 7
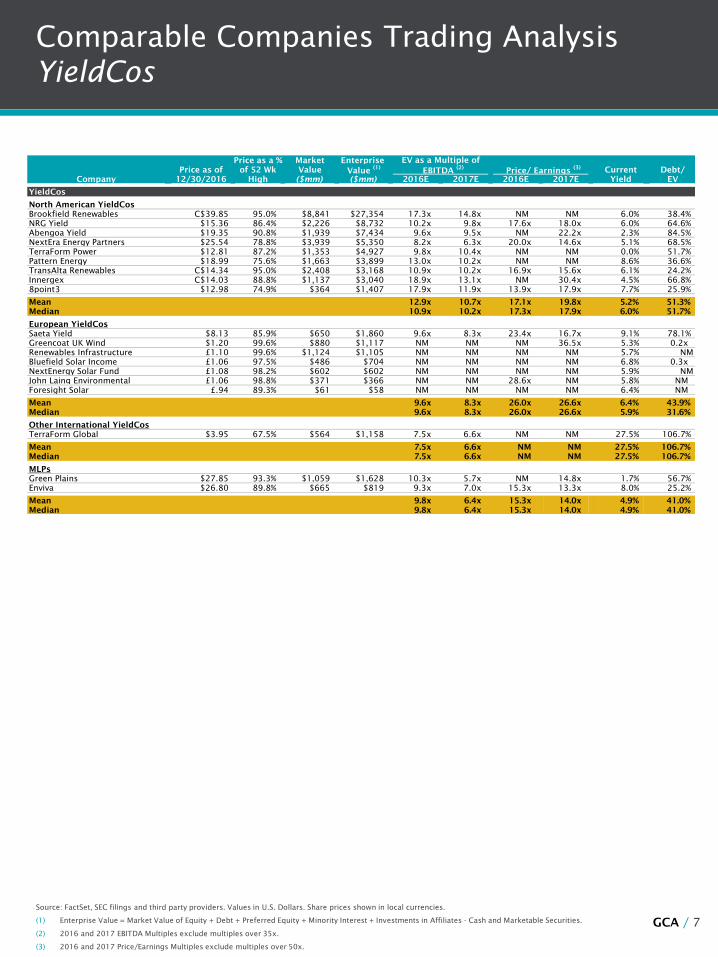
Comparable Companies Trading Analysis
YieldCos
Source: FactSet, SEC filings and third party providers. Values in U.S. Dollars. Share prices shown in local currencies.
(1) Enterprise Value = Market Value of Equity + Debt + Preferred Equity + Minority Interest + Investments in Affiliates - Cash and Marketable Securities.
(2) 2016 and 2017 EBITDA Multiples exclude multiples over 35x.
(3) 2016 and 2017 Price/Earnings Multiples exclude multiples over 50x.
Price as a % Market Enterprise
Price as of of 52 Wk Value Value (1)
EBITDA (2)
Price/ Earnings (3)
Current Debt/
Company 12/30/2016 High ($mm) ($mm) 2016E 2017E 2016E 2017E Yield EV
YieldCos
North American YieldCos
Brookfield Renewables C$39.85 95.0% $8,841 $27,354 17.3x 14.8x NM NM 6.0% 38.4%
NRG Yield $15.36 86.4% $2,226 $8,732 10.2x 9.8x 17.6x 18.0x 6.0% 64.6%
Abengoa Yield $19.35 90.8% $1,939 $7,434 9.6x 9.5x NM 22.2x 2.3% 84.5%
NextEra Energy Partners $25.54 78.8% $3,939 $5,350 8.2x 6.3x 20.0x 14.6x 5.1% 68.5%
TerraForm Power $12.81 87.2% $1,353 $4,927 9.8x 10.4x NM NM 0.0% 51.7%
Pattern Energy $18.99 75.6% $1,663 $3,899 13.0x 10.2x NM NM 8.6% 36.6%
TransAlta Renewables C$14.34 95.0% $2,408 $3,168 10.9x 10.2x 16.9x 15.6x 6.1% 24.2%
Innergex C$14.03 88.8% $1,137 $3,040 18.9x 13.1x NM 30.4x 4.5% 66.8%
8point3 $12.98 74.9% $364 $1,407 17.9x 11.9x 13.9x 17.9x 7.7% 25.9%
Mean 12.9x 10.7x 17.1x 19.8x 5.2% 51.3%
Median 10.9x 10.2x 17.3x 17.9x 6.0% 51.7%
European YieldCos
Saeta Yield $8.13 85.9% $650 $1,860 9.6x 8.3x 23.4x 16.7x 9.1% 78.1%
Greencoat UK Wind $1.20 99.6% $880 $1,117 NM NM NM 36.5x 5.3% 0.2x
Renewables Infrastructure £1.10 99.6% $1,124 $1,105 NM NM NM NM 5.7% NM
Bluefield Solar Income £1.06 97.5% $486 $704 NM NM NM NM 6.8% 0.3x
NextEnergy Solar Fund £1.08 98.2% $602 $602 NM NM NM NM 5.9% NM
John Laing Environmental £1.06 98.8% $371 $366 NM NM 28.6x NM 5.8% NM
Foresight Solar £.94 89.3% $61 $58 NM NM NM NM 6.4% NM
Mean 9.6x 8.3x 26.0x 26.6x 6.4% 43.9%
Median 9.6x 8.3x 26.0x 26.6x 5.9% 31.6%
Other International YieldCos
TerraForm Global $3.95 67.5% $564 $1,158 7.5x 6.6x NM NM 27.5% 106.7%
Mean 7.5x 6.6x NM NM 27.5% 106.7%
Median 7.5x 6.6x NM NM 27.5% 106.7%
MLPs
Green Plains $27.85 93.3% $1,059 $1,628 10.3x 5.7x NM 14.8x 1.7% 56.7%
Enviva $26.80 89.8% $665 $819 9.3x 7.0x 15.3x 13.3x 8.0% 25.2%
Mean 9.8x 6.4x 15.3x 14.0x 4.9% 41.0%
Median 9.8x 6.4x 15.3x 14.0x 4.9% 41.0%
EV as a Multiple of
GCA / 8
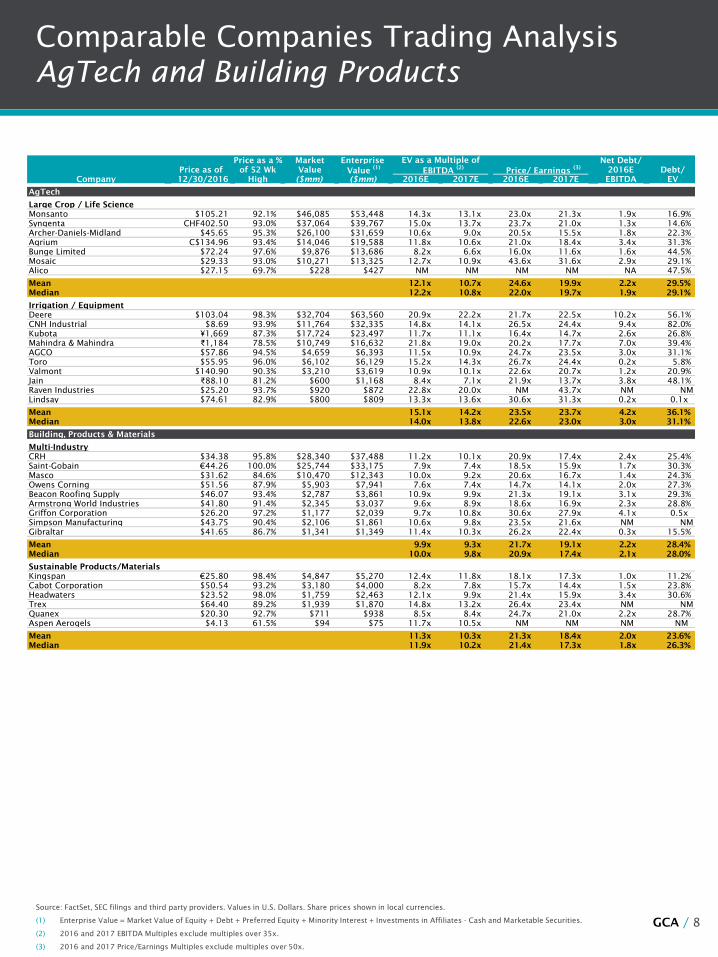
Comparable Companies Trading Analysis
AgTech and Building Products
Source: FactSet, SEC filings and third party providers. Values in U.S. Dollars. Share prices shown in local currencies.
(1) Enterprise Value = Market Value of Equity + Debt + Preferred Equity + Minority Interest + Investments in Affiliates - Cash and Marketable Securities.
(2) 2016 and 2017 EBITDA Multiples exclude multiples over 35x.
(3) 2016 and 2017 Price/Earnings Multiples exclude multiples over 50x.
Price as a % Market Enterprise Net Debt/
Price as of of 52 Wk Value Value (1)
EBITDA (2)
Price/ Earnings (3)
2016E Debt/
Company 12/30/2016 High ($mm) ($mm) 2016E 2017E 2016E 2017E EBITDA EV
AgTech
Large Crop / Life Science
Monsanto $105.21 92.1% $46,085 $53,448 14.3x 13.1x 23.0x 21.3x 1.9x 16.9%
Syngenta CHF402.50 93.0% $37,064 $39,767 15.0x 13.7x 23.7x 21.0x 1.3x 14.6%
Archer-Daniels-Midland $45.65 95.3% $26,100 $31,659 10.6x 9.0x 20.5x 15.5x 1.8x 22.3%
Agrium C$134.96 93.4% $14,046 $19,588 11.8x 10.6x 21.0x 18.4x 3.4x 31.3%
Bunge Limited $72.24 97.6% $9,876 $13,686 8.2x 6.6x 16.0x 11.6x 1.6x 44.5%
Mosaic $29.33 93.0% $10,271 $13,325 12.7x 10.9x 43.6x 31.6x 2.9x 29.1%
Alico $27.15 69.7% $228 $427 NM NM NM NM NA 47.5%
Mean 12.1x 10.7x 24.6x 19.9x 2.2x 29.5%
Median 12.2x 10.8x 22.0x 19.7x 1.9x 29.1%
Irrigation / Equipment
Deere $103.04 98.3% $32,704 $63,560 20.9x 22.2x 21.7x 22.5x 10.2x 56.1%
CNH Industrial $8.69 93.9% $11,764 $32,335 14.8x 14.1x 26.5x 24.4x 9.4x 82.0%
Kubota ¥1,669 87.3% $17,724 $23,497 11.7x 11.1x 16.4x 14.7x 2.6x 26.8%
Mahindra & Mahindra ₹1,184 78.5% $10,749 $16,632 21.8x 19.0x 20.2x 17.7x 7.0x 39.4%
AGCO $57.86 94.5% $4,659 $6,393 11.5x 10.9x 24.7x 23.5x 3.0x 31.1%
Toro $55.95 96.0% $6,102 $6,129 15.2x 14.3x 26.7x 24.4x 0.2x 5.8%
Valmont $140.90 90.3% $3,210 $3,619 10.9x 10.1x 22.6x 20.7x 1.2x 20.9%
Jain ₹88.10 81.2% $600 $1,168 8.4x 7.1x 21.9x 13.7x 3.8x 48.1%
Raven Industries $25.20 93.7% $920 $872 22.8x 20.0x NM 43.7x NM NM
Lindsay $74.61 82.9% $800 $809 13.3x 13.6x 30.6x 31.3x 0.2x 0.1x
Mean 15.1x 14.2x 23.5x 23.7x 4.2x 36.1%
Median 14.0x 13.8x 22.6x 23.0x 3.0x 31.1%
Building, Products & Materials
Multi-Industry
CRH $34.38 95.8% $28,340 $37,488 11.2x 10.1x 20.9x 17.4x 2.4x 25.4%
Saint-Gobain €44.26 100.0% $25,744 $33,175 7.9x 7.4x 18.5x 15.9x 1.7x 30.3%
Masco $31.62 84.6% $10,470 $12,343 10.0x 9.2x 20.6x 16.7x 1.4x 24.3%
Owens Corning $51.56 87.9% $5,903 $7,941 7.6x 7.4x 14.7x 14.1x 2.0x 27.3%
Beacon Roofing Supply $46.07 93.4% $2,787 $3,861 10.9x 9.9x 21.3x 19.1x 3.1x 29.3%
Armstrong World Industries $41.80 91.4% $2,345 $3,037 9.6x 8.9x 18.6x 16.9x 2.3x 28.8%
Griffon Corporation $26.20 97.2% $1,177 $2,039 9.7x 10.8x 30.6x 27.9x 4.1x 0.5x
Simpson Manufacturing $43.75 90.4% $2,106 $1,861 10.6x 9.8x 23.5x 21.6x NM NM
Gibraltar $41.65 86.7% $1,341 $1,349 11.4x 10.3x 26.2x 22.4x 0.3x 15.5%
Mean 9.9x 9.3x 21.7x 19.1x 2.2x 28.4%
Median 10.0x 9.8x 20.9x 17.4x 2.1x 28.0%
Sustainable Products/Materials
Kingspan €25.80 98.4% $4,847 $5,270 12.4x 11.8x 18.1x 17.3x 1.0x 11.2%
Cabot Corporation $50.54 93.2% $3,180 $4,000 8.2x 7.8x 15.7x 14.4x 1.5x 23.8%
Headwaters $23.52 98.0% $1,759 $2,463 12.1x 9.9x 21.4x 15.9x 3.4x 30.6%
Trex $64.40 89.2% $1,939 $1,870 14.8x 13.2x 26.4x 23.4x NM NM
Quanex $20.30 92.7% $711 $938 8.5x 8.4x 24.7x 21.0x 2.2x 28.7%
Aspen Aerogels $4.13 61.5% $94 $75 11.7x 10.5x NM NM NM NM
Mean 11.3x 10.3x 21.3x 18.4x 2.0x 23.6%
Median 11.9x 10.2x 21.4x 17.3x 1.8x 26.3%
EV as a Multiple of
GCA / 9
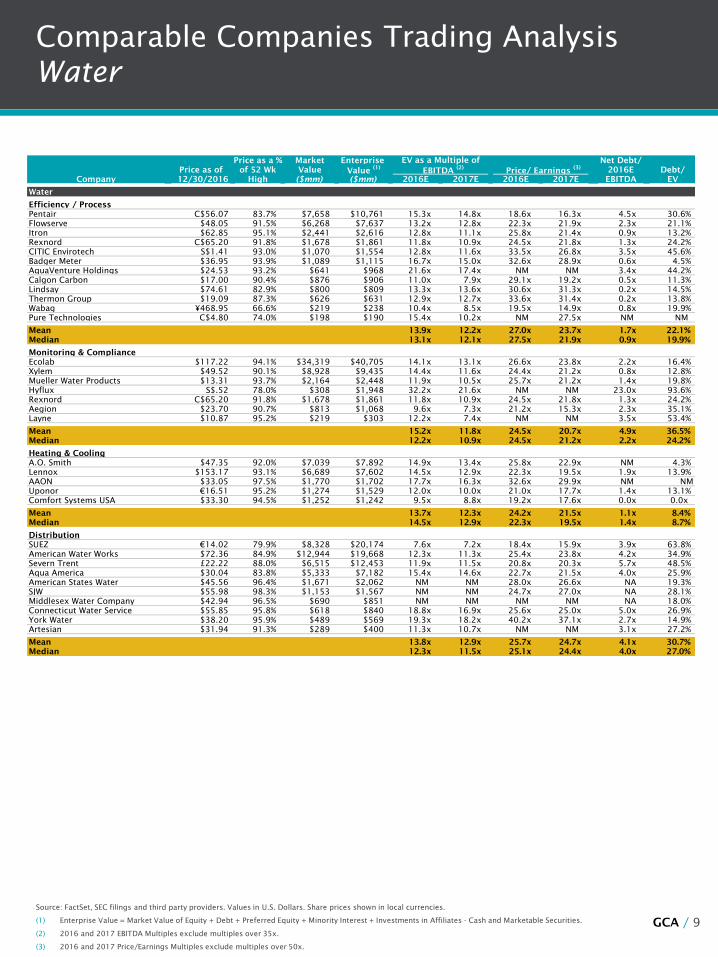
Comparable Companies Trading Analysis
Water
Source: FactSet, SEC filings and third party providers. Values in U.S. Dollars. Share prices shown in local currencies.
(1) Enterprise Value = Market Value of Equity + Debt + Preferred Equity + Minority Interest + Investments in Affiliates - Cash and Marketable Securities.
(2) 2016 and 2017 EBITDA Multiples exclude multiples over 35x.
(3) 2016 and 2017 Price/Earnings Multiples exclude multiples over 50x.
Price as a % Market Enterprise Net Debt/
Price as of of 52 Wk Value Value (1)
EBITDA (2)
Price/ Earnings (3)
2016E Debt/
Company 12/30/2016 High ($mm) ($mm) 2016E 2017E 2016E 2017E EBITDA EV
Water
Efficiency / Process
Pentair C$56.07 83.7% $7,658 $10,761 15.3x 14.8x 18.6x 16.3x 4.5x 30.6%
Flowserve $48.05 91.5% $6,268 $7,637 13.2x 12.8x 22.3x 21.9x 2.3x 21.1%
Itron $62.85 95.1% $2,441 $2,616 12.8x 11.1x 25.8x 21.4x 0.9x 13.2%
Rexnord C$65.20 91.8% $1,678 $1,861 11.8x 10.9x 24.5x 21.8x 1.3x 24.2%
CITIC Envirotech S$1.41 93.0% $1,070 $1,554 12.8x 11.6x 33.5x 26.8x 3.5x 45.6%
Badger Meter $36.95 93.9% $1,089 $1,115 16.7x 15.0x 32.6x 28.9x 0.6x 4.5%
AquaVenture Holdings $24.53 93.2% $641 $968 21.6x 17.4x NM NM 3.4x 44.2%
Calgon Carbon $17.00 90.4% $876 $906 11.0x 7.9x 29.1x 19.2x 0.5x 11.3%
Lindsay $74.61 82.9% $800 $809 13.3x 13.6x 30.6x 31.3x 0.2x 14.5%
Thermon Group $19.09 87.3% $626 $631 12.9x 12.7x 33.6x 31.4x 0.2x 13.8%
Wabag ¥468.95 66.6% $219 $238 10.4x 8.5x 19.5x 14.9x 0.8x 19.9%
Pure Technologies C$4.80 74.0% $198 $190 15.4x 10.2x NM 27.5x NM NM
Mean 13.9x 12.2x 27.0x 23.7x 1.7x 22.1%
Median 13.1x 12.1x 27.5x 21.9x 0.9x 19.9%
Monitoring & Compliance
Ecolab $117.22 94.1% $34,319 $40,705 14.1x 13.1x 26.6x 23.8x 2.2x 16.4%
Xylem $49.52 90.1% $8,928 $9,435 14.4x 11.6x 24.4x 21.2x 0.8x 12.8%
Mueller Water Products $13.31 93.7% $2,164 $2,448 11.9x 10.5x 25.7x 21.2x 1.4x 19.8%
Hyflux S$.52 78.0% $308 $1,948 32.2x 21.6x NM NM 23.0x 93.6%
Rexnord C$65.20 91.8% $1,678 $1,861 11.8x 10.9x 24.5x 21.8x 1.3x 24.2%
Aegion $23.70 90.7% $813 $1,068 9.6x 7.3x 21.2x 15.3x 2.3x 35.1%
Layne $10.87 95.2% $219 $303 12.2x 7.4x NM NM 3.5x 53.4%
Mean 15.2x 11.8x 24.5x 20.7xNM 4.9x 36.5%
Median 12.2x 10.9x 24.5x 21.2xNM 2.2x 24.2%
Heating & Cooling
A.O. Smith $47.35 92.0% $7,039 $7,892 14.9x 13.4x 25.8x 22.9x NM 4.3%
Lennox $153.17 93.1% $6,689 $7,602 14.5x 12.9x 22.3x 19.5x 1.9x 13.9%
AAON $33.05 97.5% $1,770 $1,702 17.7x 16.3x 32.6x 29.9x NM NM
Uponor €16.51 95.2% $1,274 $1,529 12.0x 10.0x 21.0x 17.7x 1.4x 13.1%
Comfort Systems USA $33.30 94.5% $1,252 $1,242 9.5x 8.8x 19.2x 17.6x 0.0x 0.0x
Mean 13.7x 12.3x 24.2x 21.5x 1.1x 8.4%
Median 14.5x 12.9x 22.3x 19.5x 1.4x 8.7%
Distribution
SUEZ €14.02 79.9% $8,328 $20,174 7.6x 7.2x 18.4x 15.9x 3.9x 63.8%
American Water Works $72.36 84.9% $12,944 $19,668 12.3x 11.3x 25.4x 23.8x 4.2x 34.9%
Severn Trent £22.22 88.0% $6,515 $12,453 11.9x 11.5x 20.8x 20.3x 5.7x 48.5%
Aqua America $30.04 83.8% $5,333 $7,182 15.4x 14.6x 22.7x 21.5x 4.0x 25.9%
American States Water $45.56 96.4% $1,671 $2,062 NM NM 28.0x 26.6x NA 19.3%
SJW $55.98 98.3% $1,153 $1,567 NM NM 24.7x 27.0x NA 28.1%
Middlesex Water Company $42.94 96.5% $690 $851 NM NM NM NM NA 18.0%
Connecticut Water Service $55.85 95.8% $618 $840 18.8x 16.9x 25.6x 25.0x 5.0x 26.9%
York Water $38.20 95.9% $489 $569 19.3x 18.2x 40.2x 37.1x 2.7x 14.9%
Artesian $31.94 91.3% $289 $400 11.3x 10.7x NM NM 3.1x 27.2%
Mean 13.8x 12.9x 25.7x 24.7x 4.1x 30.7%
Median 12.3x 11.5x 25.1x 24.4x 4.0x 27.0%
EV as a Multiple of
GCA / 10
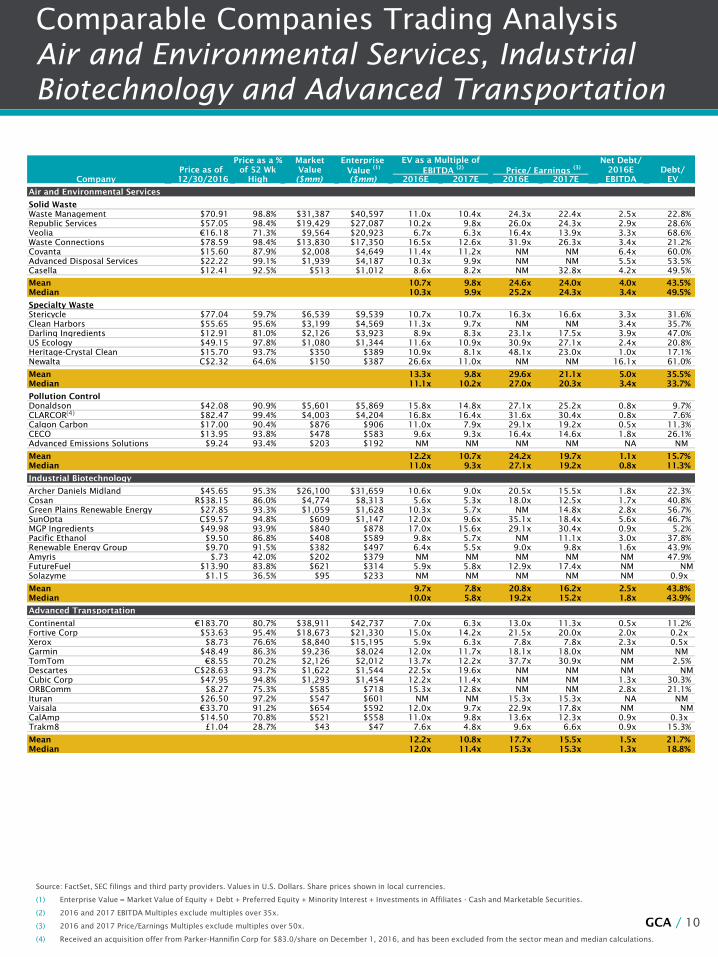
Comparable Companies Trading Analysis
Air and Environmental Services, Industrial
Biotechnology and Advanced Transportation
Source: FactSet, SEC filings and third party providers. Values in U.S. Dollars. Share prices shown in local currencies.
(1) Enterprise Value = Market Value of Equity + Debt + Preferred Equity + Minority Interest + Investments in Affiliates - Cash and Marketable Securities.
(2) 2016 and 2017 EBITDA Multiples exclude multiples over 35x.
(3) 2016 and 2017 Price/Earnings Multiples exclude multiples over 50x.
(4) Received an acquisition offer from Parker-Hannifin Corp for $83.0/share on December 1, 2016, and has been excluded from the sector mean and median calculations.
Price as a % Market Enterprise Net Debt/
Price as of of 52 Wk Value Value (1)
EBITDA (2)
Price/ Earnings (3)
2016E Debt/
Company 12/30/2016 High ($mm) ($mm) 2016E 2017E 2016E 2017E EBITDA EV
Air and Environmental Services
Solid Waste
Waste Management $70.91 98.8% $31,387 $40,597 11.0x 10.4x 24.3x 22.4x 2.5x 22.8%
Republic Services $57.05 98.4% $19,429 $27,087 10.2x 9.8x 26.0x 24.3x 2.9x 28.6%
Veolia €16.18 71.3% $9,564 $20,923 6.7x 6.3x 16.4x 13.9x 3.3x 68.6%
Waste Connections $78.59 98.4% $13,830 $17,350 16.5x 12.6x 31.9x 26.3x 3.4x 21.2%
Covanta $15.60 87.9% $2,008 $4,649 11.4x 11.2x NM NM 6.4x 60.0%
Advanced Disposal Services $22.22 99.1% $1,939 $4,187 10.3x 9.9x NM NM 5.5x 53.5%
Casella $12.41 92.5% $513 $1,012 8.6x 8.2x NM 32.8x 4.2x 49.5%
Mean 10.7x 9.8x 24.6x 24.0x 4.0x 43.5%
Median 10.3x 9.9x 25.2x 24.3x 3.4x 49.5%
Specialty Waste
Stericycle $77.04 59.7% $6,539 $9,539 10.7x 10.7x 16.3x 16.6x 3.3x 31.6%
Clean Harbors $55.65 95.6% $3,199 $4,569 11.3x 9.7x NM NM 3.4x 35.7%
Darling Ingredients $12.91 81.0% $2,126 $3,923 8.9x 8.3x 23.1x 17.5x 3.9x 47.0%
US Ecology $49.15 97.8% $1,080 $1,344 11.6x 10.9x 30.9x 27.1x 2.4x 20.8%
Heritage-Crystal Clean $15.70 93.7% $350 $389 10.9x 8.1x 48.1x 23.0x 1.0x 17.1%
Newalta C$2.32 64.6% $150 $387 26.6x 11.0x NM NM 16.1x 61.0%
Mean 13.3x 9.8x 29.6x 21.1x 5.0x 35.5%
Median 11.1x 10.2x 27.0x 20.3x 3.4x 33.7%
Pollution Control
Donaldson $42.08 90.9% $5,601 $5,869 15.8x 14.8x 27.1x 25.2x 0.8x 9.7%
CLARCOR $82.47 99.4% $4,003 $4,204 16.8x 16.4x 31.6x 30.4x 0.8x 7.6%
Calgon Carbon $17.00 90.4% $876 $906 11.0x 7.9x 29.1x 19.2x 0.5x 11.3%
CECO $13.95 93.8% $478 $583 9.6x 9.3x 16.4x 14.6x 1.8x 26.1%
Advanced Emissions Solutions $9.24 93.4% $203 $192 NM NM NM NM NA NM
Mean 12.2x 10.7x 24.2x 19.7x 1.1x 15.7%
Median 11.0x 9.3x 27.1x 19.2x 0.8x 11.3%
Industrial Biotechnology
Archer Daniels Midland $45.65 95.3% $26,100 $31,659 10.6x 9.0x 20.5x 15.5x 1.8x 22.3%
Cosan R$38.15 86.0% $4,774 $8,313 5.6x 5.3x 18.0x 12.5x 1.7x 40.8%
Green Plains Renewable Energy $27.85 93.3% $1,059 $1,628 10.3x 5.7x NM 14.8x 2.8x 56.7%
SunOpta C$9.57 94.8% $609 $1,147 12.0x 9.6x 35.1x 18.4x 5.6x 46.7%
MGP Ingredients $49.98 93.9% $840 $878 17.0x 15.6x 29.1x 30.4x 0.9x 5.2%
Pacific Ethanol $9.50 86.8% $408 $589 9.8x 5.7x NM 11.1x 3.0x 37.8%
Renewable Energy Group $9.70 91.5% $382 $497 6.4x 5.5x 9.0x 9.8x 1.6x 43.9%
Amyris $.73 42.0% $202 $379 NM NM NM NM NM 47.9%
FutureFuel $13.90 83.8% $621 $314 5.9x 5.8x 12.9x 17.4x NM NM
Solazyme $1.15 36.5% $95 $233 NM NM NM NM NM 0.9x
Mean 9.7x 7.8x 20.8x 16.2x 2.5x 43.8%
Median 10.0x 5.8x 19.2x 15.2x 1.8x 43.9%
Advanced Transportation
Continental €183.70 80.7% $38,911 $42,737 7.0x 6.3x 13.0x 11.3x 0.5x 11.2%
Fortive Corp $53.63 95.4% $18,673 $21,330 15.0x 14.2x 21.5x 20.0x 2.0x 0.2x
Xerox $8.73 76.6% $8,840 $15,195 5.9x 6.3x 7.8x 7.8x 2.3x 0.5x
Garmin $48.49 86.3% $9,236 $8,024 12.0x 11.7x 18.1x 18.0x NM NM
TomTom €8.55 70.2% $2,126 $2,012 13.7x 12.2x 37.7x 30.9x NM 2.5%
Descartes C$28.63 93.7% $1,622 $1,544 22.5x 19.6x NM NM NM NM
Cubic Corp $47.95 94.8% $1,293 $1,454 12.2x 11.4x NM NM 1.3x 30.3%
ORBComm $8.27 75.3% $585 $718 15.3x 12.8x NM NM 2.8x 21.1%
Ituran $26.50 97.2% $547 $601 NM NM 15.3x 15.3x NA NM
Vaisala €33.70 91.2% $654 $592 12.0x 9.7x 22.9x 17.8x NM NM
CalAmp $14.50 70.8% $521 $558 11.0x 9.8x 13.6x 12.3x 0.9x 0.3x
Trakm8 £1.04 28.7% $43 $47 7.6x 4.8x 9.6x 6.6x 0.9x 15.3%
Mean 12.2x 10.8x 17.7x 15.5x 1.5x 21.7%
Median 12.0x 11.4x 15.3x 15.3x 1.3x 18.8%
EV as a Multiple of
(4)
GCA / 11
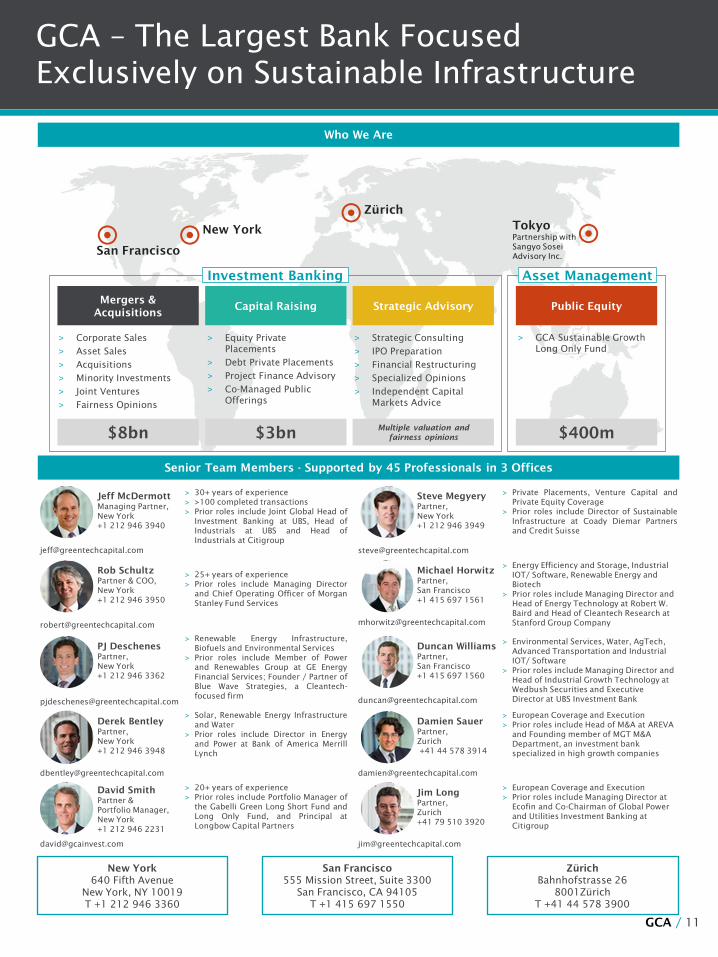
GCA – The Largest Bank Focused
Exclusively on Sustainable Infrastructure
San Francisco
New York
Zürich
Tokyo
Partnership with
Sangyo Sosei
Advisory Inc.
Investment Banking Asset Management
Capital Raising
> Equity Private
Placements
> Debt Private Placements
> Project Finance Advisory
> Co-Managed Public
Offerings
$3bn
Mergers &
Acquisitions
> Corporate Sales
> Asset Sales
> Acquisitions
> Minority Investments
> Joint Ventures
> Fairness Opinions
$8bn
Strategic Advisory
> Strategic Consulting
> IPO Preparation
> Financial Restructuring
> Specialized Opinions
> Independent Capital
Markets Advice
Multiple valuation and
fairness opinions
Public Equity
> GCA Sustainable Growth
Long Only Fund
$400m
Who We Are
New York
640 Fifth Avenue
New York, NY 10019
T +1 212 946 3360
Zürich
Bahnhofstrasse 26
8001Zürich
T +41 44 578 3900
San Francisco
555 Mission Street, Suite 3300
San Francisco, CA 94105
T +1 415 697 1550
Jeff McDermott
Managing Partner,
New York
+1 212 946 3940
Steve Megyery
Partner,
New York
+1 212 946 3949
Senior Team Members - Supported by 45 Professionals in 3 Offices
Rob Schultz
Partner & COO,
New York
+1 212 946 3950
Jim Long
Partner,
Zurich
+41 79 510 3920
Damien Sauer
Partner,
Zurich
+41 44 578 3914
PJ Deschenes
Partner,
New York
+1 212 946 3362
Duncan Williams
Partner,
San Francisco
+1 415 697 1560
Michael Horwitz
Partner,
San Francisco
+1 415 697 1561
> 30+ years of experience
> >100 completed transactions
> Prior roles include Joint Global Head of
Investment Banking at UBS, Head of
Industrials at UBS and Head of
Industrials at Citigroup
> 25+ years of experience
> Prior roles include Managing Director
and Chief Operating Officer of Morgan
Stanley Fund Services
> Renewable Energy Infrastructure,
Biofuels and Environmental Services
> Prior roles include Member of Power
and Renewables Group at GE Energy
Financial Services; Founder / Partner of
Blue Wave Strategies, a Cleantech-
focused firm
> Private Placements, Venture Capital and
Private Equity Coverage
> Prior roles include Director of Sustainable
Infrastructure at Coady Diemar Partners
and Credit Suisse
> Energy Efficiency and Storage, Industrial
IOT/ Software, Renewable Energy and
Biotech
> Prior roles include Managing Director and
Head of Energy Technology at Robert W.
Baird and Head of Cleantech Research at
Stanford Group Company
> Environmental Services, Water, AgTech,
Advanced Transportation and Industrial
IOT/ Software
> Prior roles include Managing Director and
Head of Industrial Growth Technology at
Wedbush Securities and Executive
Director at UBS Investment Bank
> European Coverage and Execution
> Prior roles include Head of M&A at AREVA
and Founding member of MGT M&A
Department, an investment bank
specialized in high growth companies
> European Coverage and Execution
> Prior roles include Managing Director at
Ecofin and Co-Chairman of Global Power
and Utilities Investment Banking at
Citigroup
David Smith
Partner &
Portfolio Manager,
New York
+1 212 946 2231
> 20+ years of experience
> Prior roles include Portfolio Manager of
the Gabelli Green Long Short Fund and
Long Only Fund, and Principal at
Longbow Capital Partners
Derek Bentley
Partner,
New York
+1 212 946 3948
> Solar, Renewable Energy Infrastructure
and Water
> Prior roles include Director in Energy
and Power at Bank of America Merrill
Lynch
GCA / 12
Disclaimer
This industry update, (the “Monthly Update”) was developed from publicly available information,
without any independent investigation or verification thereof by Greentech Capital Advisors, LLC,
taken together with its affiliates, (“GCA”), and GCA makes no representation or warranty as to the
accuracy and completeness of such information. The Monthly Update is not intended to provide, and
should not be relied upon for, legal, tax, regulatory, financial, accounting or investment advice. Prior
to entering into any transaction advised by GCA (a “Transaction”), you should determine, without
reliance upon GCA, the economic risks and merits (and independently determine that you are able to
assume these risks) as well as the legal, tax and accounting characterizations and consequences of
any such Transaction. In this regard, by accepting this Presentation, you acknowledge that (a) GCA is
not in the business of providing (and you are not relying on GCA for) legal, tax or accounting advice,
(b) there may be legal, tax or accounting risks associated with any Transaction, (c) you should receive
(and rely on) separate and qualified legal, tax and accounting advice and (d) you should apprise
senior management in your organization as to such legal, tax and accounting advice (and any risks
associated with any Transaction) and our disclaimers to these matters.
The Monthly Update does not purport to be complete on any topic addressed. The information in the
Presentation is provided to you as of the dates indicated and GCA does not intend to update the
information after its distribution, even in the event that the information becomes materially
inaccurate. Certain information contained in the Presentation includes calculations or figures which
have been prepared by GCA using physically available information and have not been audited or
verified by GCA or a third party. GCA has used data sourced from FactSet and has not reviewed or
verified this data in the preparation of the Monthly Update. GCA expressly prohibits any
redistribution of the Monthly Update without the prior written consent of GCA. The Monthly Update is
not intended for distribution, or use by, any person or entity in any jurisdiction or country where
such distribution or use is contrary to law, rule or regulation.
GCA is engaged in or may be engaged in the future in investment banking, securities trading,
brokerage activities and principal investing activities, as well as providing financial advisory services.
The Monthly Update is neither an expressed nor an implied agreement by GCA to act in any capacity
with respect to you, and any such agreement shall only be as set forth in an executed engagement
letter, the terms of which are to be agreed upon by you and GCA. The Monthly Update in no way
restricts GCA or its affiliates from any other engagement, including acting in any capacity in a
manner adverse to you.
No fiduciary, advisory or agency relationship between GCA, on the one hand, and you and your
affiliates, employees, officers, directors, or stockholders on the other hand, has been created in
respect of the Presentation, and none of your affiliates, employees, officers, directors, or
stockholders may rely on the Presentation.