Embed Size (px)
Citation preview

Sustainable Forest Management Preferences of Interest Groupsin Three Regions with Different Levels of Industrial Forestry: AnExploratory Attribute-Based Choice Experiment
Kati Berninger • Wiktor Adamowicz •
Daniel Kneeshaw • Christian Messier
Received: 9 February 2009 / Accepted: 14 May 2010 / Published online: 5 June 2010
� Springer Science+Business Media, LLC 2010
Abstract The challenge of sustainable forest manage-
ment is to integrate diverse and sometimes conflicting
management objectives. In order to achieve this goal, we
need a better understanding of the aspects influencing the
preferences of diverse groups and how these groups make
trade-offs between different attributes of SFM. We com-
pare the SFM preferences of interest groups in regions with
different forest use histories based on the reasoning that the
condition of the forest reflects the forest use history of the
area. The condition of the forest also shapes an individual’s
forest values and attitudes. These held values and attitudes
are thought to influence SFM preferences. We tested
whether the SFM preferences vary amongst the different
interest groups within and across regions. We collected
data from 252 persons using a choice experiment approach,
where participants chose multiple times among different
options described by a combination of attributes that are
assigned different levels. The novelty of our approach was
the use of choice experiments in the assessment of regional
preference differences. Given the complexity of inter-
regional comparison and the small sample size, this was an
exploratory study based on a purposive rather than random
sample. Nevertheless, our results suggest that the aggre-
gation of preferences of all individuals within a region does
not reveal all information necessary for forest management
planning since opposing viewpoints could cancel each
other out and lead to an interpretation that does not reflect
possibly polarised views. Although based on a small
sample size, the preferences of interest groups within a
region are generally statistically significantly different
from each other; however preferences of interest groups
across regions are also significantly different. This illus-
trates the potential importance of assessing heterogeneity
by region and by group.
Keywords Sustainable forest management �Environmental economics � Preference elicitation �Stated preference � Trade offs �Heterogeneity of preferences
Introduction
The notion of Sustainable Forest Management (SFM) has
evolved historically from sustainable timber production to
managing the forests for various ecological, economic and
social values (Messier and Kneeshaw 1999; McDonald and
Lane 2002; Wang 2004). In trying to implement sustain-
able forest management (SFM), forest managers face the
challenge of integrating diverse management objectives
into their management plans (Margerum 1995; Ananda and
Herath 2003). The task is not simple, since a balance is
needed between different objectives such as conservation,
recreational use and timber production which are valued
differently by different groups of people. The task becomes
even more challenging in regions with a high proportion of
private forest ownership where regional objectives are
desired (Leskinen and others 2004).
Sophisticated planning and decision making tools have
been developed to help in combining the various objec-
tives (Seely and others 2004; Kangas and others 2005;
Sturtevant and others 2007). Participatory processes have
K. Berninger (&) � D. Kneeshaw � C. Messier
Centre d’Etude de la Foret, Case postale 8888,
succursale Centre-ville, Montreal, QC H3C 3P8, Canada
e-mail: [email protected]
W. Adamowicz
Department of Rural Economy, University of Alberta,
Edmonton, AB, Canada
123
Environmental Management (2010) 46:117–133
DOI 10.1007/s00267-010-9507-1

been used to identify the management preferences of
interested parties (Tanz and Howard 1991; Kangas and
others 2001; Tyrvainen and others 2003). Research is
needed, however, in order to better understand which
aspects influence the preferences of diverse groups and
how they make trade-offs between different attributes
describing the characteristics of SFM, for example jobs
and conservation areas.
We used a choice experiment approach that has proven
useful in studying trade-offs in resource management set-
tings (Horne and others 2005). Choice experiments on forest
use have been carried out mainly related to the recreational
use of the forest (Boxall and others 1996; Adamowicz and
others 1997, 1998a; Boxall and Macnab 2000; Horne and
others 2005) and nature conservation (Li and others 2004;
Horne 2006; Lehtonen and others 2006). Some choice
experiments related to SFM have also been conducted
(Shapansky and others 2008; Xu and others 2003), but
studies that compare different groups are rare.
Our study compares the preferences of various interest
groups in each study region and similar groups across
regions. Group membership is an important component of
social identity (Turner and Oakes 1989). Individuals may
belong to various social groups simultaneously and their
social identity is a combination of these group identities
(Harshaw and Tindall 2005). Interest or user groups are
thought to create subcultures based on their shared forest
experiences, which would lead to group-specific prefer-
ences related to forest management (Berninger and others
2009). For example foresters, representing the forest
industry, have been shown to have a greater preference for
use of the forest to produce market products compared to
environmental and aboriginal groups (Kant and Lee 2004;
Kumar and Kant 2007).
All above mentioned research focuses on one study area at
a time. Thus the influence of place-related factors on SFM
preferences is unexplored. Earlier research indicates that
forest use history and importance of commercial forestry in
the region has an effect on rankings of SFM indicators and
forest value orientations (Berninger and others 2009; Bern-
inger and Kneeshaw 2009). Theoretically, it has been stated
that forest values are influenced by current and historical
forest use through changing forest conditions and through
forest experiences that modify cultural models about forests
(Berninger and others 2009). These held values1 are then
thought to have an influence on preferences which can be
defined as favoured options (Adamowicz and others 1998b).
Empirically, forest values and attitudes are shown to mod-
erately predict respondent preferences for forest use or
management alternatives (Brown and Reed 2000; Horne and
others 2004). This gives us reason to believe that forest use
history and importance of commercial forestry has an effect
on SFM preferences as well.
Our research questions are the following: Do SFM
preferences differ across regions and can these differences
be explained by differing current and historical forest use?
How do the SFM preferences differ in the different interest
groups within and across regions? Do inter-group differ-
ences in SFM preferences increase as the importance of
commercial forestry increases in a region?
Methods
The Choice Experiment Method
In order to evaluate SFM preferences we used choice
experiments where participants are given multiple choice
tasks and for each task they are asked to choose their
preferred alternative of two or more alternatives. The
alternatives are described by various levels of a set of
attributes. The attributes and their levels are designed to
reveal individual preferences for SFM attributes and dif-
ferent management strategies. This method can be used to
study both use and non-use values of natural resources
(Grafton and others 2004, p. 264).
The choice experiment method is based on random
utility theory and provides information on trade-offs
between the attributes in question (Adamowicz and others
1997, 1998a). Individuals are assumed to choose the
alternative that maximizes their utility or as described by
Hensher and others (2005, p. 707) the level of happiness
that an alternative provides them.
According to random utility theory the utility (U) of
alternative i is the sum of systematic (Vi) and error (ei)
components. The systematic component (V) contains spe-
cific and observable attributes that in the case of a stated
preference method are defined by the researcher and pre-
sented to the individual in the form of choice sets. The
presence of an error component e means that the overall
utility is random and only the probability of choice of one
alternative over another can be analyzed:
P ið Þ ¼ PðVi þ ei [ Vj þ ejÞ 8j 6¼ i; i; j 2 Cn
where Cn is the choice set of individual n (Adamowicz and
others 1997).
The Survey Instrument
The attributes were designed to represent each of the three
dimensions of sustainable forest management: ecological,
economic and social (Table 1). The attributes were based
on a preliminary study conducted in 2005 where 4–10
1 Held values can be described as ‘‘emotionally charged beliefs about
what is desirable, right and appropriate’’ (Tindall 2003).
118 Environmental Management (2010) 46:117–133
123

persons from each interest group were asked to list and
rank sustainable forest management indicators (Berninger
2006; Berninger and others 2009). The proportion of forest
land set aside for conservation is an ecological variable.
The attribute wildlife species that the forest supports
combines ecological aspects of biodiversity maintenance
with social aspects of the multiple use of the forest:
Hunters want favourable conditions for game species,
recreational users like to see charismatic species and nature
observation enthusiasts seek rare species. The attribute
average size of clear cuts is an ecological variable that was
included because many people in the preliminary study
were against big clear cuts and preferred selection cutting.
It is also a social variable since opposition to clear cuts is
partially based on landscape effects for recreational users
of the forest. It can also be considered an economic vari-
able, since it affects logging costs. Forest sector jobs
describe the socioeconomic role of forestry in the region
and the decrease or increase in annual household expenses
describes the costs of possible additional conservation
areas or the gains in reducing conservation areas for the
personal economy of the respondent.
The five attributes described above were used in the
study and each attribute was assigned four levels, one of
which represents the current situation (Table 1). Since the
current level was different in each study region, as
described in the study area section, most of the attributes
were coded as a change from the current situation. Thus we
are comparing preferences for changes (percent changes in
most cases) in attribute levels across regions. We are
assuming that within the range of attributes of our exper-
iment, preferences for changes are not affected by the
initial level of the attribute. In a typical case diminishing
marginal utility would suggest that preferences for
Table 1 Components of sustainable forest management (SFM), related attributes and their levels in the three study regions
Component of SFM and attribute Levels (current situation in bold) Coding
Ecological
Conservation area % forest land Southeastern Finland: 2, 3, 5, 8
The Mauricie: 2, 5, 8, 12
Central Labrador: 50, 40, 53, 56
Change from
current in % units
Ecological, economic and social
Average size of clear cuts, ha Southeastern Finland: 2, selective cutting,
1 (50%), 4 (200%)
The Mauricie: 25, selective cutting,
12.5 (50%), 50 (200%)
Central Labrador: 10, selective cutting,
5 (50%), 20 (200%)
0 = selective cutting
1 = current situation
0.5 = half the current
2 = double the current
Ecological and social
Wildlife species the forest supports 1. The forest supports common species
2. The forest supports common species and also
some spectacular large mammals and birds
3. The forest supports common sp.,
some spectacular species and some rare species
4. The forest supports common sp., some spectacular
sp., some rare sp. and some endangered species
Categories, dummy
coding
Social and economic
Forest sector jobs at the local
and regional level
Southeastern Finland: 15950, 12760 (-20%),
14355 (-10%), 17545 (?10%)
The Mauricie: 8300, 6640 (-20%),
7470 (-10%), 9130 (?10%)
Central Labrador: 60, 54 (-10%), 66 (?10%), 72 (?20%)
% change from current
situation
Economic
Increase/decrease in taxes, prices of goods and
costs of services will cause an increase/decrease
of your annual personal expenses,
change $/€ per year per household
Southeastern Finland: 0, 30 €, 100 €, 300 €
The Mauricie: 0, 42 $, 140 $, 420 $
Central Labrador: 0, -140 $, 140 $ 420 $
Money, 1€ = CAD 1.4a
Since the current level was different in each study region, the attributes were coded as a change from the current situation except for the wildlife
categorical attribute and the change in annual expenses attributea Purchasing power parity conversion factor for Finland 1.1, for Canada 1
Environmental Management (2010) 46:117–133 119
123

percentage changes in attributes would depend on the ini-
tial level of the attribute. In order to compare across
regions with very different base conditions, we are required
to make this assumption. Changes in annual household
expenses that were measured in euros were converted into
Canadian dollars. Central Labrador is the only area where
this attribute included a negative level referring to a situ-
ation of decreasing taxes (Table 1). The wildlife attribute
was dummy-coded, since it is a categorical variable, not
continuous like the other attributes.
The questionnaire started by asking background infor-
mation of the participants and questions related to forest
values and attitudes that were used to introduce the par-
ticipants to the topic. The results of the value and attitude
section are presented in Berninger (2007a, b, c) and
Berninger and Kneeshaw (2009). In the choice experiment
section, each participant was presented eight different
choice tasks, where an individual compares the current
situation with two possible future scenarios. The study
included all together 16 different choice tasks. Thus two
different versions of the questionnaire were used and were
distributed alternately to the respondents. An example of a
choice task is presented in Table 2. The combinations of
the levels of different attributes used in the choice tasks
were determined using orthogonal tables that are developed
for choice experiments (Sloane 2006). The questionnaires
were first written in English and then translated into
Finnish and French. Thus each region had a different lan-
guage version of the questionnaire. The explanation of the
attributes was adjusted to the specific situation in each
region. Before application, the questionnaires were tested
by a small group of people in each region and adjusted to
improve comprehension.
The Study Areas and Interest Groups
Our study areas were Southeastern Finland, the Mauricie in
Central Quebec and Central Labrador (Berninger and
Kneeshaw 2009). They all have an extensive cover of
boreal forest and forest use is important for the local
people. They form a gradient of importance of commercial
forestry, an index described by the forest sector’s share of
the labour force and total economic production as well as
the amount of logging per forest area; Southeastern Finland
being the most intensive, the Mauricie next and Central
Labrador the least intensive (Berninger and others 2009).
Also the length of time forests have been commercially
managed varies across regions, the longest history being in
Southeastern Finland where industrial forestry began in the
1870’s (Tasanen 2004, p. 421) and the shortest in Central
Labrador where commercial logging started in the 1970’s
and is still marginal (Forsyth and others 2003).
The forest management strategy in each study region
also differs due in part to the different forest use history
and partly due to differing land ownership patterns. In
Southeastern Finland, 80% of the forest land is owned by
families, the mean size of the holdings is about 20 ha and
there are about 7,000 small holdings of less than 4 ha
(Finnish statistical yearbook of forestry 2006). This has led
to management by small cut blocks, the average size being
under 2 ha. Due to intensive forest management over a
long time period, the forests in Southeastern Finland are
Table 2 An example of a choice set from the Central Labrador study area
Please select one of these three options by checking the box below your preferred option
Attributes Option 1
Current situation
Option 2 Option 3
Conservation
area % forest land
50% 50% 40%
(Current situation less 10%)
Average size of
clear cuts
10 ha Selective cutting 5 ha
(Current situation/2)
Wildlife species the
forest supports
Species favored by or neutral to forestry, charismatic
species, some species of late successional forests
and some endangered sp.
Species favored by
or neutral to
forestry only
Species favored by or neutral to forestry,
charismatic species and some species of
late successional forests
Forest sector jobs 60 66 (?10%) 54 (-10%)
Increase in your
annual expenses, $
per household
$ 0 $ -140 $ 140
Preferred option:
(Check one box)
1h 2h 3h
120 Environmental Management (2010) 46:117–133
123
dominated by even age stands and there is very little old
forest in the area. About 3.4% of the forest land is over
120 years old and only 0.9% of the forest land is over
140 years old (Kaakkois-Suomen metsakeskus 2005b).
Less than 2% of the forest land in Southeastern Finland is
legally protected (Kaakkois-Suomen metsakeskus 2005a)
and there is little potential of increasing it through con-
ventional methods.
In the Mauricie, where most of the forests are owned by
the province of Quebec, very large cut blocks have been
used for industrial forestry (Fall and others 2004). At the
moment the mean size of cut blocks is 25 ha. In the
Mauricie only 2% of the forest land is legally protected, but
potential for increasing protected area coverage still exists
in the region.
In Central Labrador almost all of the forest is provin-
cially owned. The average cut block size is 10 ha as cal-
culated for logging carried out between 1975 and 2005. In
Central Labrador there are no legally protected areas. The
proportion of conservation area used in this study is based
on the current management plan for District 19 A (Forsyth
and others 2003). Under the current plan no logging is
carried out in areas dedicated for conservation of natural
and cultural values (50% of forest land), but the plan is
revised periodically. Logging has been marginal in the area
and there are few fires. Thus most of the forests can be
considered old (Forsyth and others 2003).
In Southeastern Finland and in the Mauricie the number of
forest sector jobs is decreasing, whereas given the low level of
forest sector employment there is a potential for an increase in
Central Labrador (Kaakkois-Suomen metsakeskus 2005a;
Halifax Global 2006; Government of Quebec 2008).
This study included the following groups in each area:
(1) local or regional environmental groups; (2) multiple
users of the forest; and (3) forestry professionals. In
Southeastern Finland forest owners and in Central Labra-
dor the indigenous groups of Innu and Metis were also
included since they are important actors in forest policy in
these regions. The multiple users group included hunters,
berry and mushroom pickers, hikers and other recreational
users of the forest. The forestry professionals group
included representatives of the government forest planning
officers and the forest industry.
The Recruitment of Participants and Meetings
The study consisted of separate meetings with a sample of
each interest group in order to obtain information about
their forestry preferences. We invited the participants to
come to a central facility, to give them an opportunity to
reflect thoroughly on the issues and questions at hand. The
use of separate meetings for each group has proven to be
effective, especially in conflict-prone settings (Sheppard
and Meitner 2005). The meetings with the different interest
groups were organized in 2006: in Kouvola and Lappeen-
ranta, Southeastern Finland from January 17th to January
26th, in La Tuque and Trois Rivieres, Mauricie from July
4th to July 9th, in Goose Bay and Sheshatshiu, Central
Labrador from September 19th to September 22nd and on
November 30th. Each meeting lasted about 2 h.
The recruitment techniques used were adapted to the
local conditions of each region and special characteristics
of each group. The participants were invited using email,
whenever possible, but also by traditional letters, telephone
calls, a newspaper advertisement and posters distributed in
the Innu community of Sheshatsiu in Central Labrador. The
contact information was obtained through local forest
planning networks in each region (for example the
Regional Forest Council in Southeastern Finland, the
TRIAD project in the Mauricie Quebec, and Forest Man-
agement Committee of District 19A in Goose Bay Labra-
dor). We did not aim for a random sample, but instead tried
to reach as many potential participants for each interest
group as possible. For example, the base population of
environmentalists or forestry professionals in Central
Labrador was about 20 persons (Berninger 2007c). Ran-
dom sampling was only used to choose 200 forest owners
to be invited from the forest owners register in South-
eastern Finland since these were abundant (Berninger
2007a). 28 forest owners came to the meetings, the
response rate thus being 14%. More details on recruitment
in each region are available in Berninger (2007a, b, c, c).
In each meeting the participants were explained the
objectives of the study and the contents of the questionnaire.
Each attribute was described in detail and the idea of a choice
experiment was explained. The questionnaire was distrib-
uted and participants had an opportunity to ask questions
prior to its completion. In the meeting for the Innu in She-
shatsiu, questions presented in English were translated to
innu-aimun when needed. Assistance was also provided in
understanding and filling in the questionnaires. At the end of
each meeting a de-briefing session was held. The discussion
was focused mainly on the participant’s impressions of the
survey and the approaches they used in making choices and
trade-offs, but the task also inspired discussion on important
local issues related to forests and their use.
The Participants
A total of 252 persons participated in the study (Table 3).
The region with the most participants was Southeastern
Finland, which is also the region with the largest popula-
tion. Mean age and the percentage of women participants
in the forestry professionals group were very similar in all
three regions and also consistent with McFarlane and
Boxall’s (2000) study. About half of the environmentalists
Environmental Management (2010) 46:117–133 121
123

were women both in Southeastern Finland and Central
Labrador, but only one third of the environmentalists were
women in the Mauricie, Central Quebec (Table 3). The
mean age of the environmentalists in Central Labrador was
higher than in the other regions due to a limited number of
persons under 40 years among the active members of
environmental organizations in the area. The multiple users
group in Central Labrador had more women than men
participants, while only one fifth of the multiple users
group in the other regions were women (Table 3). There
was a considerable difference in the mean age of the
multiple user groups in the different regions with the oldest
participants being in Southeastern Finland and the youn-
gest in the Mauricie, Central Quebec.
Data Analysis
The choice experiment data were analyzed using a condi-
tional logit model with the MDC procedure of the SAS
statistical package (SAS institute 2001) as well as the
NLOGIT procedure with the statistical package Limdep
(Greene 2007).2 Joint models for each region and separate
models for each interest group were estimated. An alter-
native-specific constant (ASC) was estimated to measure
the tendency to select options representing the current sit-
uation (Adamowicz and others 1998a). Both linear and
quadratic models were estimated for each data set and
models with a best fit to the data are presented in the
results. Pairwise likelihood ratio tests were conducted with
SAS to test whether the estimated model parameters for
interest groups within and across regions differed signifi-
cantly (Hensher and others 2005, pp. 335–337). In order to
have more detailed information on the attributes contrib-
uting to the differences between groups, we estimated a
joint model for all participants in the three regions
including the interactions of regions and groups with the
attributes conservation area, cut block size, wildlife cate-
gory 4, money and ASC for the current situation. The base
region used was the Mauricie (Quebec, Canada) and the
base group was multiple users. Marginal values of attribute
change were calculated by region and by group. For the
wildlife categorical variable marginal values were calcu-
lated for the change from one category to another. The
marginal value is the dollar amount an individual would be
willing to trade for a change in an attribute and still
maintain the same utility level. Marginal values are used to
standardize attributes to the same units (dollars) in order to
enable comparisons across models. As mentioned above,
we are comparing preferences for change in attributes and
not accounting for the fact that each region has a different
base level of attributes or set of initial conditions. If these
differences in base levels affect the preferences for attri-
bute changes, then the regional differences in preferences
we examine are confounded with the differences in the
base level of attributes. However, we hope that for the
range of attributes we examine the base level has relatively
little effect. Nevertheless one should interpret the inter-
regional comparisons with this in mind—results stated as
preference differences across regions could be a result of
the different initial conditions or could be actual preference
differences.
Results
Differences Within Regions
In Southeastern Finland, the parameter estimates for con-
servation area, cut block size and the alternative-specific
constant (ASC) for the current situation contrast between
the different groups (Table 4). Some groups have positive
and significant parameter estimates which means that they
prefer a situation with more of that attribute, when all else
is held constant. In contrast, other groups have negative
and significant parameter estimates for the same attributes
demonstrating a preference for less of that attribute. The
joint model (column ‘All’ in Table 4) does not reflect this
polarized setting (Table 4). According to pairwise likeli-
hood ratio tests, the model estimated for environmentalists
in Southeastern Finland is significantly (P \ 0.0001) dif-
ferent from those of other groups in the region (Table 5).
The model estimated for forestry professionals differs
significantly from the model estimated for multiple users
(pairwise likelihood ratio test, P = 0.025, Table 5).
In the Mauricie, the models estimated for each group are
significantly different from each other (pairwise likelihood
ratio test, P \ 0.001, Table 5), but there are no significant
opposite parameter estimates like in Southeastern Finland
(Table 4). In Central Labrador, none of the groups had a
significant parameter estimate for conservation area
(Table 4). According to the pairwise likelihood ratio test
significant differences (P \ 0.05) were detected between
most groups, but not between the multiple users and the Metis
or environmentalists and forestry professionals (Table 5).
Comparison of Groups Across Regions
When the models estimated for the same groups in dif-
ferent regions are compared, some similarities and
2 We also estimated mixed logit models by group (that account for
the replication of choices by individuals—panel data) and compared
them with the conditional logit models. The results show that
although there is some heterogeneity within the groups, the mixed
logit results are qualitatively similar to conditional logit in terms of
our research questions. Thus the mixed logit results are not reported
here, but are available from the authors upon request.
122 Environmental Management (2010) 46:117–133
123

differences are detected. Models estimated for environ-
mentalists in Southeastern Finland and the Mauricie are
similar in many aspects, for example in parameter esti-
mates for conservation area and cut block size (Table 4),
and they both differ significantly from the model estimated
for the environmentalists in Central Labrador (pairwise
likelihood ratio test, P \ 0.001, Table 6). The models
estimated for forestry professionals and multiple users are
significantly different in Southeastern Finland in compari-
son to both other regions (pairwise likelihood ratio test,
P \ 0.001, Table 6). The biggest differences are found in
the parameter estimates for the ASC for the current situa-
tion and cut block size (Table 4).
At least one level of the wildlife attribute was significant
for all groups and generally the categories with more
wildlife were preferred with the exception of multiple users
in the Mauricie and the Innu in Central Labrador. The
models for these groups showed preference of level 3
(forest conditions supporting common species, some
spectacular species and some rare species) over level 4
(which also includes endangered species, Table 4).
Our study areas are designed to form a gradient from
lesser to greater importance of commercial forestry (for
more information, see section on study areas) when moving
from Central Labrador through the Mauricie to South-
eastern Finland. When marginal values of attribute change
for the same groups across regions are examined, some
regional trends along the gradient can be detected. The
marginal value of cut block size for environmentalists
decreases from Central Labrador to Southeastern Finland,
while the trend increases for multiple users (Fig. 1). This
means that environmentalists in Southeastern Finland are
willing to pay more for decreasing cut block size than the
environmentalists from other regions, even if the current
cut block size is already the smallest among the three
regions (mean cut block size 2 ha in contrast to 25 ha in the
Mauricie and 10 ha in Central Labrador).
For jobs, both forestry professionals and multiple users
show a decreasing trend of marginal values from Central
Labrador to Southeastern Finland (Fig. 1). These positive
marginal values indicate that people are willing to pay for
additional jobs or to avoid losing jobs from the area. This
trend may reflect differences in the way forest use gener-
ates employment and in the general economic opportunities
in the region.
For wildlife, marginal values for moving from level 1 to
level 3 show an increasing trend from Central Labrador to
Southeastern Finland for environmentalists and a decreas-
ing trend for forestry professionals (Fig. 1). This means
that environmentalists in Southeastern Finland are willing
to pay more for moving from a situation with less wildlife
species to a situation with more wildlife species than
environmentalists in Central Labrador. The reverse is true
for forestry professionals.
The tendency of selecting the status quo alternative was
measured by the alternative-specific constant (ASC). The
difference between groups in ASC parameter estimates
within a region grows from Central Labrador through the
Maurice to Southeastern Finland (Table 4, Fig. 2). In
Central Labrador the environmentalists favoured the status
quo alternative all else held constant, while the ASC was
not significant for other groups in the region. In the Mau-
ricie the multiple users group had a tendency to select
alternatives with changes in relation to status quo, all else
Table 3 The number of participants, percentage of women and mean age in each region and each group
Environmentalists Forestry
professionals
Multiple
users
Forest
owners
Metis Innu Total
Southeastern Finland
No of
participants
41 24 22 28 – – 115
% of women 49 13 18 18 28
Mean age 45 43 58 50 49
The Mauricie
No of
participants
13 20 18 – – – 51
% of women 31 11 20 20
Mean age 47 43 46 45
Central Labrador
No of
participants
15 15 15 – 18 23 86
% of women 53 13 53 39 32 38
Mean age 52 45 50 52 40 47
Environmental Management (2010) 46:117–133 123
123

Ta
ble
4P
aram
eter
esti
mat
es(a
nd
stan
dar
der
rors
)fo
rm
od
els
esti
mat
edfo
rea
chg
rou
pan
djo
int
mo
del
ses
tim
ated
for
all
par
tici
pan
tsin
each
reg
ion
(co
lum
n‘A
ll’)
Att
ribute
South
east
ern
Fin
land
The
Mau
rici
e
Env.
n=
41
Pro
f.
n=
24
Mult
.
n=
22
Ow
ner
s
n=
28
All
n=
115
Env.
n=
13
Pro
f.
n=
20
Mult
.
n=
18
All
n=
51
Cons.
0.1
07**
(0.0
392)
-0.1
18
(0.0
810)
-0.0
139
(0.0
624)
-0.1
23*
(0.0
592)
0.0
0234
(0.0
240)
0.2
04***
(0.0
526)
0.0
271
(0.0
383)
-0.0
126
(0.0
361)
0.0
559**
(0.0
216)
Cut
blo
cksi
ze-
0.8
55***
(0.1
64)
0.6
80**
(0.2
33)
-0.0
499
(0.1
98)
0.0
463
(0.1
81)
-0.1
45**
(0.0
790)
-0.4
70*
(0.2
54)
-0.0
680
(0.1
99)
-0.8
09***
(0.2
28)
-0.4
05***
(0.1
20)
Wil
dli
fe1
a-
1.0
84***
(0.2
37)
-0.4
40
(0.3
18)
-0.6
01*
(0.2
63)
-0.1
69
(0.2
26)
-0.5
85***
(0.1
10)
-0.8
78
(0.5
59)
-0.0
10
(0.4
56)
-0.6
13
(0.4
40)
-0.4
05
(0.2
61)
Wil
dli
fe3
a1.1
19***
(0.3
29)
1.3
34**
(0.4
28)
0.7
42*
(0.3
61)
0.7
55*
(0.3
37)
0.8
81***
(0.1
48)
0.8
68
(0.5
71)
0.8
79*
(0.4
56)
1.3
91**
(0.4
38)
0.9
41***
(0.2
58)
Wil
dli
fe4
a1.9
04***
(0.2
67)
1.9
39***
(0.4
17)
1.1
43**
(0.3
29)
1.1
54***
(0.3
06)
1.3
14***
(0.1
30)
1.8
67***
(0.4
75)
1.0
40*
(0.4
09)
1.0
381**
(0.3
79)
1.1
79***
(0.2
24)
Jobs
0.0
0422
(0.0
0950)
0.0
404*
(0.0
167)
0.0
325*
(0.0
128)
0.0
170
(0.0
118)
0.0
155**
(0.0
0506)
0.0
279*
(0.0
167)
0.0
207
(0.0
128)
0.0
357**
(0.0
132)
0.0
273***
(0.0
0747)
Money
b-
0.1
32*
(0.0
610)
-0.4
65***
(0.1
351)
-0.2
31*
(0.0
925)
-0.3
86***
(0.0
97)
-0.1
63***
(0.0
345)
-0.1
20
(0.1
14)
-0.2
21*
(0.0
920)
-0.2
35**
(0.0
872)
-0.1
766***
(0.0
513)
AS
Cfo
rth
ecu
rren
tsi
tuat
ion
-0.8
30**
(0.2
92)
1.5
07***
(0.4
11)
1.1
95***
(0.3
12)
0.8
00**
(0.2
754)
0.8
57**
(0.1
24)
-0.2
12
(0.5
43)
0.1
34
(0.3
55)
-1.2
59***
(0.3
74)
-0.3
47
(0.2
19)
Log-l
ikel
ihood
-194.7
3-
131.1
8-
152.8
7-
184.7
6-
874.7
2-
72.1
3-
138.6
6-
136.2
6-
381.4
7
Att
ribute
Cen
tral
Lab
r.
Env.
n=
15
Pro
f.
n=
15
Mult
.
n=
15
Met
is
n=
18
Innu
n=
23
All
n=
86
Cons.
0.0
277
(0.0
309)
-0.0
181
(0.0
281)
0.0
15
(0.0
26)
-0.0
256
(0.0
222)
0.0
0350
(0.0
179)
-0.0
0218
(0.0
102)
Cut
blo
cksi
ze-
0.3
29
(0.2
69)
0.2
83
(0.2
32)
-0.8
50***
(0.2
46)
-0.6
48**
(0.2
18)
0.0
564
(0.1
53)
-0.2
40**
(0.0
895)
Wil
dli
fe1
a0.0
891
(0.6
444)
-2.0
59*
(1.0
765)
-1.1
01*
(0.5
68)
-0.1
58
(0.4
462)
0.7
00*
(0.3
54)
-0.0
773
(0.2
09)
Wil
dli
fe3
a0.7
00
(0.5
87)
0.4
78
(0.4
93)
0.4
61
(0.4
78)
0.3
37
(0.4
46)
1.0
25**
(0.3
49)
0.6
14**
(0.1
92)
Wil
dli
fe4
a1.5
87**
(0.5
17)
1.4
92***
(0.4
342)
0.9
47*
(0.4
01)
0.9
47*
(0.3
71)
0.8
16**
(0.3
05)
1.0
14***
(0.1
67)
Jobs
0.0
259
(0.0
159)
0.0
244*
(0.0
147)
0.0
303*
(0.0
132)
0.0
0966
(0.0
113)
0.0
0516
(0.0
0852)
0.0
134**
(0.0
0506)
Money
b-
0.2
11*
(0.0
923)
-0.1
11
(0.0
866)
-0.1
49*
(0.0
777)
0.0
340
(0.0
663)
-0.0
198
(0.0
515)
-0.0
567*
(0.0
298)
AS
Cfo
rth
ecu
rren
tsi
tuat
ion
0.5
19*
(0.3
03)
-0.0
582
(0.2
94)
-0.0
699
(0.0
699)
0.2
15
(0.2
73)
-0.2
35
(0.2
38)
0.0
804
(0.1
20)
Log-l
ikel
ihood
-95.4
3-
98.1
8-
111.3
9-
138.6
0-
196.7
0-
688.1
2
Lin
ear
model
sw
ere
abet
ter
fit
toth
edat
ath
anquad
rati
cm
odel
s.T
hus
all
the
resu
lts
pre
sente
dher
ear
ebas
edon
linea
rm
odel
s
Cons.
conse
rvat
ion
area
,E
nv.
envir
onm
enta
list
s,P
rof.
fore
stry
pro
fess
ional
s,M
ult
.m
ult
iple
use
rs,
ASC
alte
rnat
ive-
spec
ific
const
ant
for
the
curr
ent
situ
atio
na
This
var
iable
was
dum
my
coded
.,th
ele
vel
sof
the
attr
ibute
are
pre
sente
din
Tab
le1
bO
ne
unit
iseq
uiv
alen
tof
100
Can
adia
ndoll
ars
***
Sig
nifi
cant
atP
B0.0
01;
**
signifi
cant
atP
B0.0
1;
*si
gnifi
cant
atP
B0.1
124 Environmental Management (2010) 46:117–133
123

held constant. For other groups in the region the parameter
estimate for ASC was not significant. In Southeastern
Finland forestry professionals, multiple users and forest
owners had a tendency to choose the status quo alternative,
while the environmentalists had a tendency to choose
alternatives different from the current situation when all
else was held constant.
We also studied the monetary impact of increasing
conservation area by 3 and 6 percentage units for different
regions and groups (Fig. 3). This analysis illustrates the
polarization of groups in Southeastern Finland, the
importance of increasing conservation area for the envi-
ronmentalists in the Mauricie in contrast to other groups,
and the lack of importance of increasing conservation area
in Central Labrador.
Interactions
An alternative approach to identify differences between
groups is to pool the data and model the interactions of
the regions and groups with the attributes. This gives
more detailed information on the attributes which con-
tribute to the differences between groups. When com-
pared to the base category of multiple users and the base
region Mauricie, environmentalists in Finland and in the
Mauricie place a higher weight on conservation, whereas
Finnish forestry professionals, multiple users and forest
owners as well as the Metis and forestry professionals
from Central Labrador place a lower weight on conser-
vation (Table 7). Finnish environmentalists prefer smaller
cut blocks, and Finnish forestry professionals prefer
larger cut blocks than the multiple users in the Mauricie
(Table 7). The Finnish environmentalists also put more
weight on wildlife category 4 with endangered species
and less weight on cost than the multiple users in the
Mauricie. Also the Metis from Central Labrador place
little weight on cost. Forest owners from Finland place
more weight on cost than the multiple users in the
Mauricie (Table 7).
Is the Difference Between Groups Greater
than the Difference Across Regions?
We used marginal values for attribute changes for con-
servation area, cut block size, jobs and wildlife attributes to
see if the difference between groups is greater than the
difference between regions. For each attribute, the groups
in each region were ordered according to the resulting
marginal value (Fig. 1). We then analyzed visually which
marginal values were similar.
For conservation area the marginal values cluster by
group with the environmentalists being on one end and
professionals on the other and multiple users in the
middle (Fig. 1). For cut block size the marginal values
also cluster by group, but here multiple users and envi-
ronmentalists are similar. For jobs, the marginal values
seem to be clustered more by region than by group
(Fig. 1). For wildlife there is no clear pattern although
there is some clustering for environmentalists and mul-
tiple users (Fig. 1).
Table 5 Results of the pairwise likelihood ratio test between groups
in each region
Likelihood
ratio
Degrees
of freedom
P
Southeastern Finland
Env–Prof 301.56 7 \0.0001
Env–Own 263.78 7 \0.0001
Env–Mult 197.46 7 \0.0001
Prof–Mult 16.00 7 0.0251
Prof–Own 12.32 7 0.0905
Mult–Own 6.16 7 0.5212
Mauricie
Env–Prof 52.24 7 \0.0001
Env–Mult 43.88 7 \0.0001
Prof–Mult 25.42 7 0.0006
Central Labrador
Env–Innu 43.80 7 \0.0001
Prof–Innu 40.02 7 \0.0001
Mult–Innu 25.78 7 0.0006
Prof–Metis 22.64 7 0.002
Prof–Mult 21.80 7 0.0028
Metis–Innu 19.57 7 0.0066
Env–Metis 17.54 7 0.0142
Env–Mult 16.70 7 0.0195
Env–Prof 13.89 7 0.0532
Metis–Mult 7.85 7 0.3456
Table 6 Results of the pairwise likelihood ratio test between the
same groups across regions
Likelihood
ratio
Degrees
of freedom
P
Environmentalists
Finland-Labrador 37.95 7 \0.0001
Mauricie-Labrador 23.14 7 0.0016
Finland-Mauricie 5.59 7 0.5889
Professionals
Finland-Mauricie 46.99 7 \0.0001
Finland-Labrador 40.75 7 \0.0001
Mauricie-Labrador 12.98 7 0.0725
Multiple users
Finland-Mauricie 50.84 7 \0.0001
Finland-Labrador 28.17 7 0.0002
Mauricie-Labrador 9.97 7 0.19
Environmental Management (2010) 46:117–133 125
123

Conservation
-1 0 1 2
MaurEnv***
FinEnv**
LabEnv
MaurProf
LabMult
LabMetisª
LabInnuª
MaurMult
FinMult
LabProf
FinProf
FinOwn*
Wildlife1 to Wildlife 4
0 10 20 30 40
LabProf
FinEnv
MaurEnv
LabMult
FinMult
LabEnv
MaurMult
FinProf
MaurProf
FinOwn
LabMetisª
LabInnuª
Cut block size
-8 -6 -4 -2 0 2 4
FinEnv***
LabMult***
MaurEnv*
MaurMult***
LabEnv
MaurProf
FinMult
LabMetisª
LabInnuª
FinOwn
FinProf**
LabProf
Jobs
0 0.05 0.1 0.15 0.2 0.25
MaurEnv*
LabProf*
LabMult*
MaurMult**
FinMult*
LabEnv
MaurProf
FinProf*
FinOwn
FinEnv
LabMetisª
LabInnuª
Wildlife 3 to Wildlife4
-5 0 5 10
LabProf
MaurEnv
FinEnv
LabEnv
LabMult
FinMult
FinProf
FinOwn
MaurProf
LabMetis
LabInnuª
MaurMultª
Wildlife1 to Wildlife3
0 5 10 15 20 25
LabProf
FinEnv
MaurEnv¹
LabMult
MaurMult
FinMult
MaurProf
FinProf
LabEnv¹
FinOwn
LabInnuª
LabMetisª
Fig. 1 The marginal values (in
CAD 100) of attribute change
for conservation, cut block size,
wildlife and jobs by region and
by group. Those marginal
values calculated using
significant parameter estimates
are marked with a grey fill. For
the wildlife attribute, no
significance levels are marked,
since attribute change is
calculated as difference between
two categories which may have
different significance levels.
Each category is explained in
Table 4. Fin Southeastern
Finland, Maur the Mauricie,
Lab Central Labrador, Envenvironmentalists, Multmultiple users, Prof forestry
professionals, Own forest
owners. *** Significant at
P B 0.001; ** significant at
P B 0.01; * significant at
P B 0.1. a The parameter
estimate for annual household
costs was very small and not
significant. It was thus treated as
0. Marginal values were not
calculated. 1 None of the
attribute levels was significant
126 Environmental Management (2010) 46:117–133
123

Discussion
Preference Differences Within and Across Regions
Regional comparison is not easy, since several factors
affect the results simultaneously and only some of them
can be considered in any given study. We tried to eliminate
some factors by choosing only boreal regions and areas
where forest is abundant and its non-timber use important
for local people. We also chose areas to form a gradient in
the importance of commercial forestry as described in the
methods. Although this index includes various factors
related to forestry, other factors like demographic patterns
are not covered here. Thus the inter-regional comparison
should be interpreted with caution.
Our first research question asked whether SFM prefer-
ences differ across regions and whether the differences can
be explained by differing current and historical forest use.
Our results indicate that SFM preferences differ across
regions: The same interest groups across regions were sta-
tistically different. In addition, we detected regional trends
in marginal values of attribute change that seem to reflect
regional differences in current and historical forest use.
These results are in line with earlier research in which we
reported trends in the differences between extreme groups in
biocentric and anthropocentric value orientations (Bernin-
ger and Kneeshaw 2009) and in the weightings of environ-
mental and economic components of sustainability
(Berninger and others 2009) along the same gradient. In its
incorporation of historical and cultural differences between
regions, the above mentioned results suggest that the gra-
dient of importance of commercial forestry represents an
important factor in the variation across regions. The con-
nection between the importance of commercial forestry and
people’s perceptions may be explained by the historical and
current forest management that shapes individual and group
forest experiences through local forest conditions (Halli-
kainen 1998; Berninger and others 2009). These forest
experiences, in turn, modify cultural models about forests.
Thus regional preference differences are a result of a com-
plex interaction of culture, forest use and physical condi-
tions of the forest.
Our second research question asked how the SFM
preferences differ over interest groups within and across
regions. The statistical analysis of our sample groups
suggests that the preferences of interest groups within a
region are generally significantly different from each other;
Differences between extreme groups in ASC parameter estimates across regions
0
0.5
1
1.5
2
2.5
SoutheasternFinland
The Mauricie Central LabradorDiff
eren
ce in
par
amet
er
estim
ate
Fig. 2 Differences between extreme groups in alternative-specific
constant (ASC) parameter estimates across regions. Fin Southeastern
Finland, Maur the Mauricie, Lab Central Labrador
Monetary impact of increasing conservation areafor different groups, Southeastern Finland
-2000
-1500
-1000
-500
0
500
1000
1500
Current 3% 6%CA
D
FinEnv
FinMult
FinProf
FinOwn
Monetary impact of increasing conservation areafor different groups, Mauricie
-2000
-1500
-1000
-500
0
500
1000
1500
Current 3% 6%CA
D
MaurEnv
MaurMult
MaurProf
Monetary impact of increasing conservation areafor different groups, Central Labrador
-2000
-1500
-1000
-500
0
500
1000
1500
Current 3% 6%CA
D
LabEnv
LabMult
LabProf
Fig. 3 Monetary impact of increasing conservation area from the
current situation by 3 and 6% units for different groups in the three
research areas. The solid lines mean that the parameter estimates were
significant, the dashed lines mean that they were not significant and
the figure should be interpreted with caution
Environmental Management (2010) 46:117–133 127
123
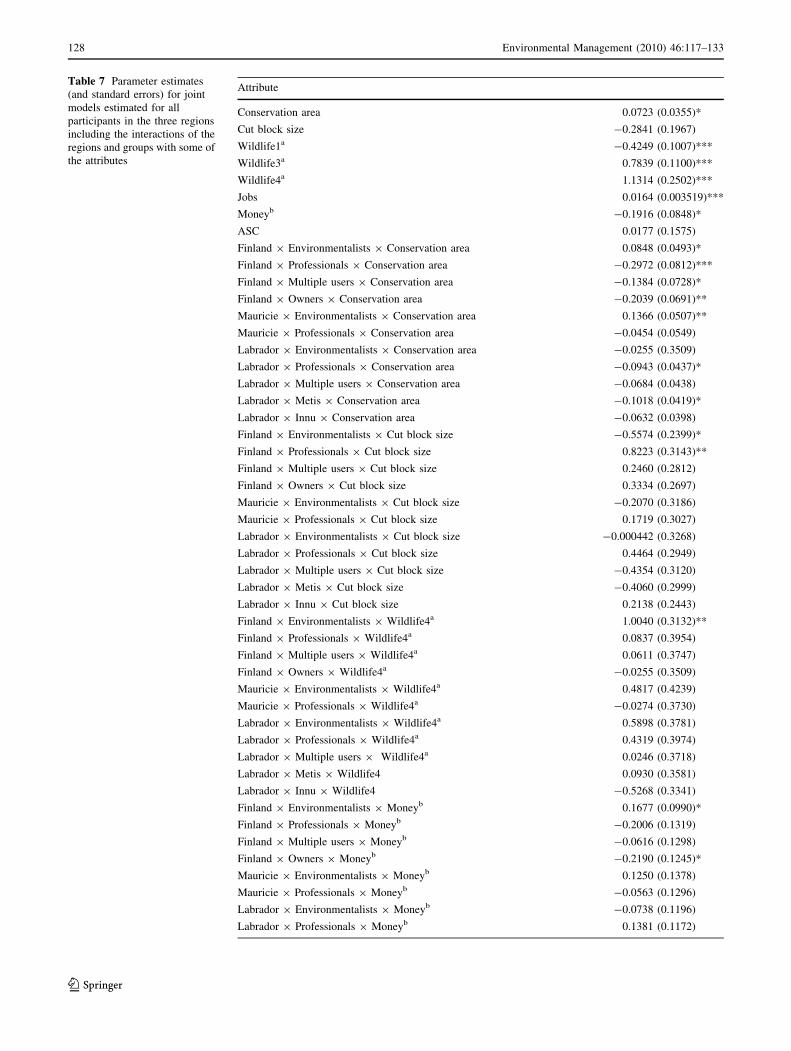
Table 7 Parameter estimates
(and standard errors) for joint
models estimated for all
participants in the three regions
including the interactions of the
regions and groups with some of
the attributes
Attribute
Conservation area 0.0723 (0.0355)*
Cut block size -0.2841 (0.1967)
Wildlife1a -0.4249 (0.1007)***
Wildlife3a 0.7839 (0.1100)***
Wildlife4a 1.1314 (0.2502)***
Jobs 0.0164 (0.003519)***
Moneyb -0.1916 (0.0848)*
ASC 0.0177 (0.1575)
Finland 9 Environmentalists 9 Conservation area 0.0848 (0.0493)*
Finland 9 Professionals 9 Conservation area -0.2972 (0.0812)***
Finland 9 Multiple users 9 Conservation area -0.1384 (0.0728)*
Finland 9 Owners 9 Conservation area -0.2039 (0.0691)**
Mauricie 9 Environmentalists 9 Conservation area 0.1366 (0.0507)**
Mauricie 9 Professionals 9 Conservation area -0.0454 (0.0549)
Labrador 9 Environmentalists 9 Conservation area -0.0255 (0.3509)
Labrador 9 Professionals 9 Conservation area -0.0943 (0.0437)*
Labrador 9 Multiple users 9 Conservation area -0.0684 (0.0438)
Labrador 9 Metis 9 Conservation area -0.1018 (0.0419)*
Labrador 9 Innu 9 Conservation area -0.0632 (0.0398)
Finland 9 Environmentalists 9 Cut block size -0.5574 (0.2399)*
Finland 9 Professionals 9 Cut block size 0.8223 (0.3143)**
Finland 9 Multiple users 9 Cut block size 0.2460 (0.2812)
Finland 9 Owners 9 Cut block size 0.3334 (0.2697)
Mauricie 9 Environmentalists 9 Cut block size -0.2070 (0.3186)
Mauricie 9 Professionals 9 Cut block size 0.1719 (0.3027)
Labrador 9 Environmentalists 9 Cut block size -0.000442 (0.3268)
Labrador 9 Professionals 9 Cut block size 0.4464 (0.2949)
Labrador 9 Multiple users 9 Cut block size -0.4354 (0.3120)
Labrador 9 Metis 9 Cut block size -0.4060 (0.2999)
Labrador 9 Innu 9 Cut block size 0.2138 (0.2443)
Finland 9 Environmentalists 9 Wildlife4a 1.0040 (0.3132)**
Finland 9 Professionals 9 Wildlife4a 0.0837 (0.3954)
Finland 9 Multiple users 9 Wildlife4a 0.0611 (0.3747)
Finland 9 Owners 9 Wildlife4a -0.0255 (0.3509)
Mauricie 9 Environmentalists 9 Wildlife4a 0.4817 (0.4239)
Mauricie 9 Professionals 9 Wildlife4a -0.0274 (0.3730)
Labrador 9 Environmentalists 9 Wildlife4a 0.5898 (0.3781)
Labrador 9 Professionals 9 Wildlife4a 0.4319 (0.3974)
Labrador 9 Multiple users 9 Wildlife4a 0.0246 (0.3718)
Labrador 9 Metis 9 Wildlife4 0.0930 (0.3581)
Labrador 9 Innu 9 Wildlife4 -0.5268 (0.3341)
Finland 9 Environmentalists 9 Moneyb 0.1677 (0.0990)*
Finland 9 Professionals 9 Moneyb -0.2006 (0.1319)
Finland 9 Multiple users 9 Moneyb -0.0616 (0.1298)
Finland 9 Owners 9 Moneyb -0.2190 (0.1245)*
Mauricie 9 Environmentalists 9 Moneyb 0.1250 (0.1378)
Mauricie 9 Professionals 9 Moneyb -0.0563 (0.1296)
Labrador 9 Environmentalists 9 Moneyb -0.0738 (0.1196)
Labrador 9 Professionals 9 Moneyb 0.1381 (0.1172)
128 Environmental Management (2010) 46:117–133
123

however preferences of interest groups across regions are
also significantly different. This illustrates the importance
of assessing preferences by region and by group.
The aggregation of preferences of all individuals within
a region does not reveal all of the information necessary for
forest management planning since opposing viewpoints can
cancel each other out, as demonstrated by results in
Southeastern Finland, and lead to an interpretation that
may not reflect possibly polarised views.
The detected preference differences across groups may
be seen as interplay between local and interest group
identities (Harshaw and Tindall 2005). For some attributes
like jobs local identity seems to play a stronger role than
group identity, whereas for other issues like conservation
and cut block size group identities are, to some extent,
shared across regions. This may reflect the global agenda of
environmental groups which includes protection of old
growth forests and elimination of clear cutting (Humphreys
2004). Also a general negative attitude of forest users
towards clear cuts has been reported for example by Paquet
and Belanger (1997) and Ribe (2006). An exception is
Southeastern Finland, where the multiple users were neu-
tral towards cut block size which could be due to the large
number of forest owners within the multiple users group
(Berninger 2007a; Tahvanainen and others 2001). An
interesting topic for further research would be to study
whether the opposition to clear cuts is due to ecological
reasons in contrast to social reasons like their landscape
effects, and also whether forest owners who are also mul-
tiple users of the forest have different views on clear cuts in
their different roles concerning the forest.
Another interesting line of future research would be to
further develop the idea of industrial forestry considering
the life-cycle impacts of the goods it produces. For
example, the type and amount of energy used and the
durability of the products (like furniture) may be important
variables affecting how individuals value products from
forest industry.
The third research question asked whether inter-group
differences in SFM preferences increase as the importance
of commercial forestry increases in the region. Inter-group
differences, as reflected in the difference in the parameter
estimates for ASC, conservation area and money3 across
groups, increase as one moves from Central Labrador to the
Mauricie and finally to Southeastern Finland.
Preferences Possibly Reflecting Indigenous
and Multiple Use Values
The very low and/or insignificant parameter estimate for
household costs for the Metis and Innu imply that for these
groups, in contrast to the other groups, money was not an
important factor in their choice of preferred alternatives.
This can be interpreted as reflecting cultural differences
between indigenous and non-indigenous peoples. It has
been suggested that indigenous cultures have common
features like indifference to ownership and the value of
sharing (Adamowicz and others 1998b). Specifically, the
Innu culture does not encourage accumulating property;
money is used quickly, often for going out to the land
(Mailhot 1997, p. 69; Samson 2003, p. 154).
The multiple users in the Mauricie and the Innu in
Central Labrador showed a preference for a lower over a
higher wildlife level. It seems confusing that a situation
Table 7 continued
The base region is Mauricie and
the base group is multiple users
*** Significant at P B 0.001;
** significant at P B 0.01;
* significant at P B 0.1a This variable was dummy
coded., the levels of the attribute
are presented in Table 1b One unit is equivalent of 100
Canadian dollars
–, Could not be estimated due to
collinearity
Attribute
Labrador 9 Multiple users 9 Moneyb 0.0585 (0.1155)
Labrador 9 Metis 9 Money 0.2131 (0.1073)*
Labrador 9 Innu 9 Money 0.1386 (0.0998)
Finland 9 Environmentalists 9 ASC 0.7461 (0.2729)**
Finland 9 Professionals 9 ASC 0.8356 (0.3428)*
Finland 9 Multiple users 9 ASC 0.8832 (0.3011)**
Finland 9 Owners 9 ASC –
Mauricie 9 Environmentalists 9 ASC –
Mauricie 9 Professionals 9 ASC 0.0871 (0.3322)
Labrador 9 Environmentalists 9 ASC –
Labrador 9 Professionals 9 ASC 0.2157 (0.3255)
Labrador 9 Multiple users 9 ASC -0.1970 (0.3537)
Labrador 9 Metis 9 ASC 0.1032 (0.3239)
Labrador 9 Innu 9 ASC -0.4498 (0.2835)
Log-likelihood -1704
3 The parameter estimates for household costs for the Metis and Innu
groups form an exception explained in the next section and are not
included in the comparison.
Environmental Management (2010) 46:117–133 129
123

with less wildlife is preferred. The highest level in the
wildlife attribute, however, adds endangered species to the
picture, and this could be viewed as a threat to hunting, a
very popular activity for these two groups.
Tendencies to Select or to Avoid the Status Quo
Alternative
It is common that participants exposed to a choice situation
have a tendency to prefer the status quo alternative, holding
all attributes constant. This observation is often explained
as status quo bias, which means reluctance to move away
from the current situation in order to avoid making choices;
it is frequently reported as a common characteristic of
difficult choice situations (Samuelson and Zeckhauser
1988). However, the tendency for selecting the status quo
alternative may also mean that participants genuinely
prefer the current management regime over the alternatives
presented (Horne and others 2005). They may have their
own interests embedded in the current system, for example
income from logging or a job in the forest industry.
The tendency to favour the status quo has also been
interpreted as a possible mistrust of the managing institution,
or as a belief that resource managers would not be capable of
carrying out the programs suggested (Adamowicz and others
1998a). This interpretation, however, refers to a situation
where a new project is carried out with the status quo alter-
native being the non-implementation alternative comparable
to the zero alternative in the Environmental Impact Assess-
ment (EIA, Polonen 2006). This interpretation may be valid
in Central Labrador, where industrial forest management is
new, and environmentalists favoured the status quo alter-
native. In the case of suggesting alternatives to management
that has been applied in the present form for decades, as is the
case in Southeastern Finland and the Mauricie, the above
mentioned interpretation may not be valid. The tendency of
forestry professionals, multiple users and forest owners in
Southeastern Finland to favour the current situation may in
this case be interpreted more as a trust of the resource
managers: they are doing a good job in managing the forests
and no change is needed. Conversely, the environmentalists
in Southeastern Finland and the multiple users in the Mau-
ricie systematically searched for change to the current situ-
ation, which could be interpreted as a mistrust of resource
managers to meaningfully incorporate suggested alterna-
tives for managing the forest.
Sampling Issues
This was an exploratory study with a relatively small
sample size based on a purposive rather than random
sample. Sampling was challenging since we wanted to
reach the interest groups that formed the target group for
this study. At a population level the groups studied here are
not evenly distributed, but multiple users groups are the
largest group in each region. In forest management plan-
ning forest users have not always been well represented
(except for hunting organizations) since they are weakly
organized. In future studies focused specifically on multi-
ple users, a random sample of a general population in the
area with specific questions on the use of the forests may be
the most feasible. However, the use of our sampling
strategy permitted us to reach groups that would have been
almost absent in sampling of the general population, for
example environmentalists in Central Labrador.
Aspects Possibly Influencing Preferences or Preference
Differences
Adoption of a consumer or citizen role when answering the
questions may have an effect on preferences (Nyborg 2000;
van Rensburg and others 2002; Ovaskainen and Kniivila
2005). In our study, a part of the attributes represent broad
social issues while another part reflects more private issues
with both roles being partially present at the same time.
Another aspect possibly influencing our results is the use of
both positive and negative attribute levels. It has been
shown in the economic literature that preferences depend
on a reference point and that people tend to value avoiding
loss more than securing an equal sized gain (for example
Tversky and Kahneman 1991). Also the fact that the
meetings in different regions were held in different seasons
may have an impact on the results as shown by Lindhjem
(2007) in a valuation study of non-timber benefits. We
assume that trade-offs among different components of
sustainable forest management are not as sensitive to sea-
sonal variation. More research is needed to explore these
issues.
Preference differences (as exhibited by different coeffi-
cients or partworths) may arise from differences in error
variances across the groups or regions (Swait and Louviere
1993). This is a potential source of error in our interpretation.
Forest ownership structure is one of the factors influ-
encing regional differences. People may have different
preferences for private and public land. The choice
experiment conducted here focused more on regional
objectives than on individual forest owners. In future
research, it would be interesting to compare responses of
the same subjects to separate questions for public and
private forest areas.
Conclusions
We studied regional and group differences in SFM pref-
erences in three boreal regions. Our results show that
130 Environmental Management (2010) 46:117–133
123
preferences differ between the different interest groups
within and across regions. We interpret the differences
across regions as being partially due to differing current
and historical forest use. Our results indicate that the
preference structure of each group is influenced by both the
local forest conditions and forest use, which is reflected in
the gradient of importance of commercial forestry, forest
culture and group identities that are partially shared with
similar groups in other regions.
A higher level of importance of commercial forestry in the
region seems to increase the nature orientation of environ-
mentalists and the economic orientation of forestry profes-
sionals. This along with the trends detected in supporting or
rejecting the status quo alternative suggests that there is an
increasing trend in inter-group differences in SFM prefer-
ences from the little managed area to the intensively man-
aged region. This may, among other factors, reflect the
influence of the current and historical forest use in shaping
SFM preferences and the differences across groups.
Our results show that the aggregation of preferences of
all individuals within a region does not reveal all of the
information necessary for forest management planning
since opposing viewpoints can cancel each other out and
lead to an interpretation that does not reflect possibly po-
larised views. Instead, preferences should be assessed
separately for all relevant user groups.
Acknowledgments We thank all participants and the persons who
made this research possible: Timo Weckroth from the Regional
Forestry Centre of Southeastern Finland; Nadyre Beaulieu from Ab-
itibiBowater in Shawinigan Quebec; Neal Simon and Frank Phillips
from the NL Department of Natural Resources; Valerie Courtois from
the Innu Nation and Bryn Wood from the Labrador Metis Nation. We
thank the anonymous reviewers for valuable comments and Melanie
Desrochers for her help with maps. We also thank the Sustainable
Forest Management Network, the Finnish Helsingin Sanomat Fund
and the Finnish Cultural Foundation for funding.
References
Adamowicz WL, Swait J, Boxall PC, Louviere J, Williams M (1997)
Perceptions versus objective measures of environmental quality
in combined revealed and stated preference models of environ-
mental valuation. Journal of Environmental Economics and
Management 32:65–84
Adamowicz WL, Boxall P, Williams M, Louviere M (1998a) Stated
preference approaches for measuring passive use values: choice
experiments and contingent valuation. American Journal of
Agricultural Economics 80(1):64–75
Adamowicz W, Beckley T, MacDonald DH, Just L, Luckert M,
Murray E, Phillips W (1998b) In search of forest resource values
of indigenous peoples. Society and Natural Resources 11:51–66
Ananda J, Herath G (2003) Incorporating stakeholder values into
regional forest planning: a value function approach. Ecological
Economics 45(1):75–90
Berninger K (2006) Millaisia teemoja ja painotuksia sisaltyy kaakko-
issuomalaisten mielesta kestavaan metsatalouteen? Neljan in-
tressiryhman ajatuksia. Metsatieteen aikakauskirja 3:399–410
(Which themes and rankings do forest users in Southeastern
Finland include in SFM? Thoughts of four interest groups, in
Finnish)
Berninger K (2007a) Neljan intressiryhman nakemyksia Kaakkois-
Suomen metsien hoidosta. Alue ja ymparisto 36(1):45–50
(Views of four interest groups on forest management in
Southeastern Finland, in Finnish)
Berninger K (2007b) Attitudes des trois groupes d’interet sur les
forets et la foresterie en Mauricie. Rapport pour le projet
TRIADE. http://www.projettriade.ca/recherche_doc.php. Acces-
sed November 27, 2008
Berninger K (2007c) Attitudes towards forests and forestry of five
interest groups in Central Labrador. Report for the Labrador
Forest Management Model Integration Project. http://www.
lfmi.uqam.ca/report/report/Forest_attitudes_and_preferences.pdf
. Accessed August 13, 2007
Berninger K, Kneeshaw D (2009) Forest value orientations and
attitudes towards forestry of interest groups in three regions
varying in importance of commercial forestry. International
Journal of Sustainable Society 1(4):391–408
Berninger K, Kneeshaw D, Messier C (2009) The role of cultural
models in local perceptions of SFM—differences and similarities
of interest groups from three boreal regions. Journal of
Environmental Management 90:740–751
Boxall PC, Macnab B (2000) Exploring the preferences of wildlife
recreationists for features of boreal forest management: a choice
experiment approach. Canadian Journal of Forest Research
30:1931–1941
Boxall PC, Adamowicz WL, Swait J, Williams M, Louviere JJ (1996)
A comparison of stated preference methods for environmental
valuation. Ecological Economics 18:243–253
Brown G, Reed P (2000) Validation of a forest values typology for
use in national forest planning. Forest Science 46:240–247
Fall A, Fortin M-J, Kneeshaw D, Yamasaki S, Messier C, Bouthillier
L, Smyth S (2004) Consequences of various landscape-scale
ecosystem management strategies and fire cycles on age-class
structure and harvest in boreal forests. Canadian Journal of
Forest Research 34:310–322
Finnish statistical yearbook of forestry (2006) SVT agriculture,
forestry and fishery 2006. Finnish Forest Research Institute,
Helsinki
Forsyth J, Innes L, Deering K, Moores L (2003) Forest ecosystem
strategy plan for forest management district 19 Labrador/
Nitassinan. Innu Nation and Newfoundland and Labrador
Department of Forest Resources and Agrifoods, Northwest
River
Government of Quebec (2008) Forests: building a future for Quebec,
green paper. Ministere des Ressources naturelles et de la Faune
(MRNF), Quebec City
Grafton RQ, Adamowicz W, Dupont D, Nelson H, Hill RJ, Renzetti S
(2004) The economics of the environment and natural resources.
Blackwell Publishing, Malden
Greene W (2007) LIMDEP 9.0 reference guide. Econometric
Software Inc, Plainview
Halifax Global (2006) Strategic plan to develop Labrador secondary
manufacturing and value added wood products industry. http://
www.nr.gov.nl.ca/forestry/publications/labrador_wood_products_
report_1.pdf. Accessed May 29, 2006
Hallikainen V (1998) The Finnish wilderness experience. Finnish
Forest Research Institute, Research Papers 711, Rovaniemi
Harshaw HW, Tindall DB (2005) Social structure, identities,
and values: a network approach to understanding people’s
relationship to forests. Journal of Leisure Research 37(4):
426–449
Hensher DA, Rose J-M, Greene WH (2005) Applied choice analysis:
a primer. Cambridge University Press, Cambridge
Environmental Management (2010) 46:117–133 131
123
Horne P (2006) Forest owners’ acceptance of incentive based policy
instruments in forest biodiversity conservation—a choice exper-
iment based approach. Silva Fennica 40:169–178
Horne P, Karppinen H, Ylinen E (2004) Kansalaisten mielipiteet
metsien monimuotoisuuden turvaamisesta. In: Horne P, Koskela
T, Ovaskainen V (eds) Metsanomistajien ja kansalaisten nake-
mykset metsaluonnon monimuotoisuuden turvaamisesta. Mets-
antutkimuslaitoksen tiedonantoja 933, pp 25–46 (in Finnish)
Horne P, Boxall PC, Adamowicz WL (2005) Multiple-use manage-
ment of forest recreation sites: a spatially explicit choice
experiment. Forest Ecology and Management 207:189–199
Humphreys D (2004) Redefining the issues: NGO influence on
international forest negotiations. Global Environmental Politics
4:51–74
Kaakkois-Suomen metsakeskus (2005a) Metsaohjelma 2006–2010.
Kouvola, 37 pp
Kaakkois-Suomen metsakeskus (2005b) Metsa- ja ymparistokertomus
2005. Kouvola, 36 pp
Kangas J, Kangas A, Leskinen P, Pykalainen J (2001) MCDM
methods in strategic planning of forestry on state-owned lands in
Finland: applications and experiences. Journal of Multi-Criteria
Decision Analysis 10:257–271
Kangas J, Store R, Kangas A (2005) Socioecological landscape
planning approach and multicriteria acceptability analysis in
multiple-purpose forest management. Forest Policy and Eco-
nomics 7:603–614
Kant S, Lee S (2004) A social choice approach to sustainable forest
management. Forest Policy and Economics 6:215–227
Kumar S, Kant S (2007) Exploded logit modeling of stakeholders’
preferences for multiple forest values. Forest Policy and
Economics 9:516–526
Lehtonen E, Kuuluvainen J, Pouta E, Rekola M, Li C-Z (2006) Non-
market benefits of forest conservation in southern Finland.
Environmental Science & Policy 6:195–204
Leskinen P, Leskinen L, Tikkanen J (2004) Assessing objectives of
regional forest policy in northern Finland. Scandinavian Journal
of Forest Research 19:180–190
Li C-Z, Kuuluvainen J, Pouta E, Rekola M, Tahvonen O (2004) Using
choice experiments to value the Natura 2000 nature conservation
programs in Finland. Environmental & Resource Economics
29:361–374
Lindhjem H (2007) 20 Years of stated preference valuation of non-
timber benefits from Fennoscandian forests: a meta-analysis.
Journal of Forest Economics 12:251–277
Mailhot J (1997) The people of Sheshatshit: in the land of the Innu.
Institute of Social and economic Research, Memorial University,
St. John’s
Margerum RD (1995) Integrated environmental management: moving
from theory to practice. Journal of Environmental Planning and
Management 38:371–392
McDonald GT, Lane MB (2002) Forest management systems
evaluation: using ISO14000. Journal of Environmental Planning
and Management 45:633–652
McFarlane B, Boxall P (2000) Forest values and attitudes of the
public, environmentalists, professional foresters, and members of
public advisory groups in Alberta. Canadian Forest Service,
Northern Forest Centre, Information Report NOR-X-374
Messier C, Kneeshaw D (1999) Thinking and acting differently for
sustainable management of the boreal forest. Forestry Chronicle
75(6):929–938
Nyborg K (2000) Homo economicus and Homo politicus: interpre-
tation and aggregation of environmental value. Journal of
Economic Behaviour & Organization 42(3):305–322
Ovaskainen V, Kniivila M (2005) Consumer versus citizen prefer-
ences in contingent valuation: evidence on the role of question
framing. The Australian Journal of Agricultural and Resource
Economics 49:379–394
Paquet J, Belanger L (1997) Public acceptability thresholds of
clearcutting to maintain visual quality of boreal balsam fir
landscapes. Forest Science 43:46–55
Polonen I (2006) Quality control and the substitutive influence of
environmental impact assessment in Finland. Environmental
Impact Assessment Review 26:481–491
Ribe RG (2006) Perceptions of forestry alternatives in the US Pacific
Northwest: information effects and acceptability distribution
analysis. Journal of Environmental Psychology 26:100–115
Samson C (2003) A way of life that does not exist, Canada and the
extinguishment of the Innu. Social and economic studies 67.
Institute of Social and Economic Research, Memorial Univer-
sity, St. John’s
Samuelson W, Zeckhauser R (1988) Status quo bias in decision
making. Journal of Risk and Uncertainty 1:7–59
SAS Institute (2001) Documentation for the 8.2 release of the MDC
procedure. http://support.sas.com/rnd/app/doc.html. Accessed
May 11, 2007
Seely B, Nelson J, Wells R, Peter B, Meitner M, Anderson A,
Harshaw H, Sheppard S, Bunnell RL, Kimmins H, Harrison D
(2004) The application of a hierarchical, decision-support system
to evaluate multi-objective forest management strategies: a case
study in northeastern British Columbia, Canada. Forest Ecology
and Management 199:283–305
Shapansky B, Adamowicz WL, Boxall P (2008) Assessing informa-
tion provision and respondent involvement effects on prefer-
ences. Ecological Economics 65:626–635
Sheppard S, Meitner M (2005) Using multi-criteria analysis and
visualisation for sustainable forest management planning with
stakeholder groups. Forest Ecology and Management 207:171–
187
Sloane NJA (2006) Www pages. A library of orthogonal arrays.
http://www.research.att.com/*njas/oadir/. Accessed April 18, 2006
Sturtevant B, Fall A, Kneeshaw D, Simon N, Papaik M, Berninger
K, Doyon F, Morgan D, Messier C (2007) A toolkit modeling
approach for sustainable forest management planning: achiev-
ing balance between science and local needs. Ecology and
Society 12(2):7. http://www.ecologyandsociety.org/vol12/iss2/
art7/
Swait J, Louviere J (1993) The role of the scale parameter in the
estimation and comparison of multinomial logit models. Journal
of Marketing Research 30(3):305–314
Tahvanainen L, Tyrvainen L, Ihalainen M, Vuorela N, Kolehmainen
O (2001) Forest management and public perceptions—visual
versus verbal information. Landscape and Urban Planning
53:53–70
Tanz JS, Howard AF (1991) Meaningful public participation in the
planning and management of publicly owned forests. Forestry
Chronicle 67(2):125–130
Tasanen T (2004) Laksi puut ylenemahan. Metsien hoidon historia
Suomessa keskiajalta metsateollisuuden lapimurtoon 1870
–luvulla [Summary: The history of silviculture in Finland from
the Medieval to the breakthrough of forest industry in 1870s].
Finnish Forest Research Institute Report 920, Vammala
Tindall DB (2003) Social values and the contingent nature of public
opinion and attitudes about forests. Forestry Chronicle 79:692–
705
Turner JC, Oakes PJ (1989) Self-categorization theory and social
influence. In: Paulus SB (ed) Psychology of group influence.
Erlbaum, Hillsdale, pp 233–275
Tversky A, Kahneman D (1991) Loss aversion in riskless choice: a
reference dependent model. Quarterly Journal of Economics
106:1039–1061
132 Environmental Management (2010) 46:117–133
123

Tyrvainen L, Silvennoinen H, Kolehmainen O (2003) Ecological and
aesthetic values in urban forest management. Urban Forestry and
Urban Greening 1:135–149
Van Rensburg T, Mill G, Common M, Lovett J (2002) Preferences
and multiple use forest management. Ecological Economics
43(2–3):231–244
Wang S (2004) One hundred faces of sustainable forest management.
Forest Policy and Economics 6:205–213
Xu W, Lippke BR, Perez-Garcia J (2003) Valuing biodiversity,
aesthetics, and job losses associated with ecosystem manage-
ment using stated preferences. Forest Science 49:247–257
Environmental Management (2010) 46:117–133 133
123