Embed Size (px)
Citation preview
Sustainable Energy Systems
for Indoor Growing &
Greenhouses
Jim Leidel
DTE Energy
Gas Major Accounts
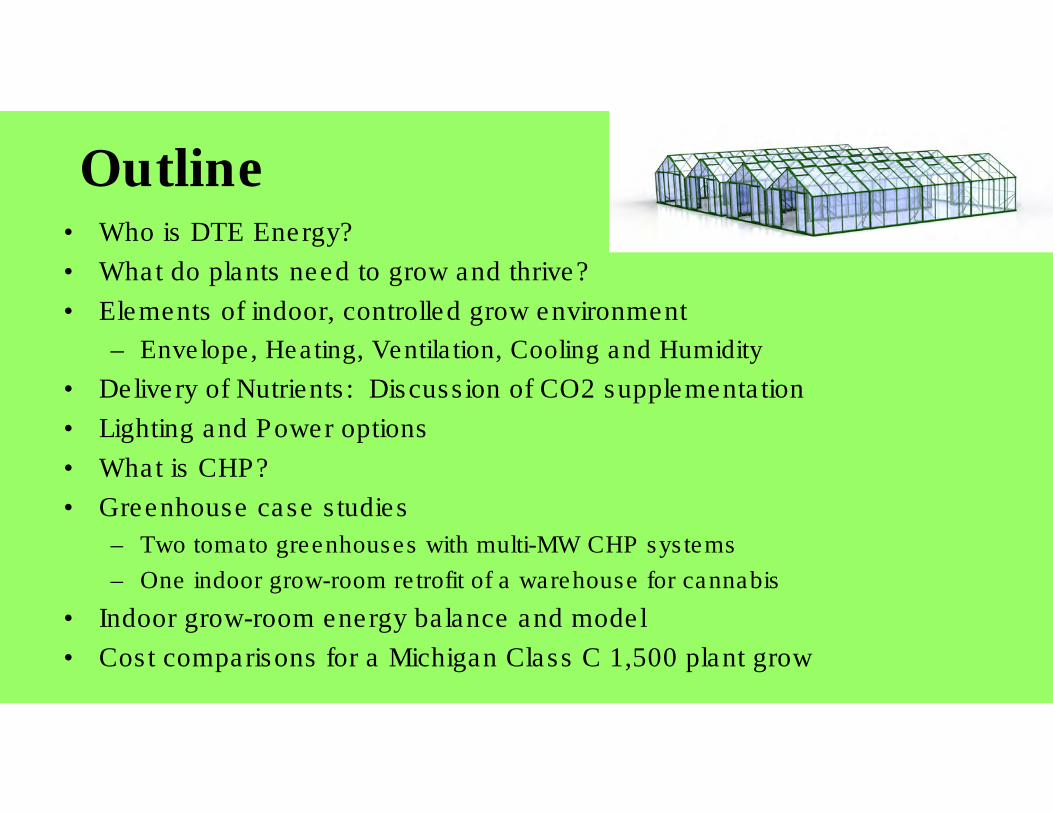
• Who is DTE Energy?
• What do plants need to grow and thrive?
• Elements of indoor, controlled grow environment
– Envelope, Heating, Ventilation, Cooling and Humidity
• Delivery of Nutrients: Discussion of CO2 supplementation
• Lighting and Power options
• What is CHP?
• Greenhouse case studies
– Two tomato greenhouses with multi-MW CHP systems
– One indoor grow-room retrofit of a warehouse for cannabis
• Indoor grow-room energy balance and model
• Cost comparisons for a Michigan Class C 1,500 plant grow
Outline
5
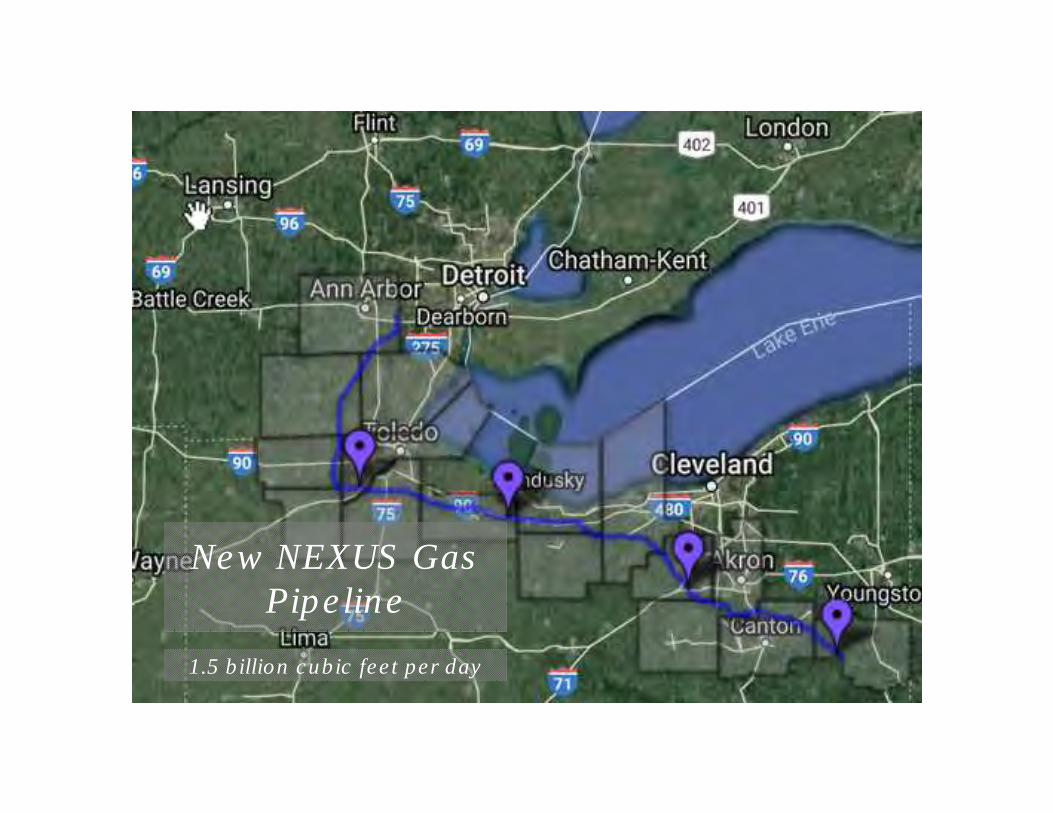
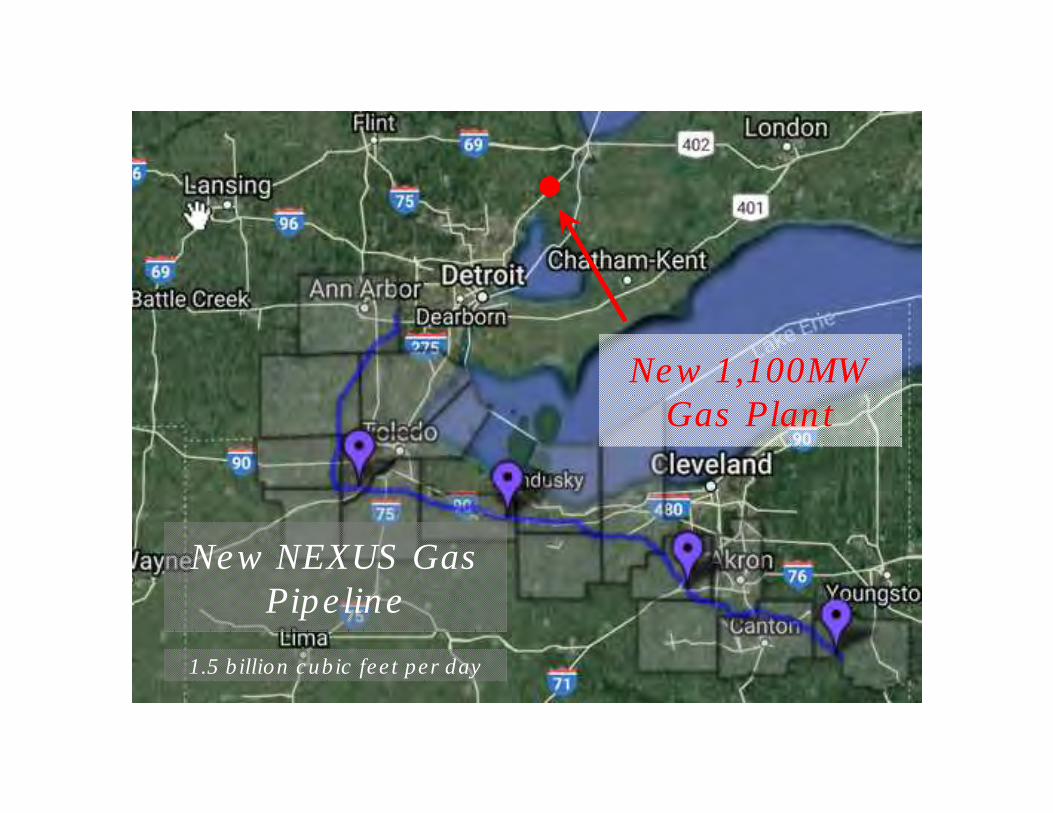
New NEXUS Gas
Pipeline
1.5 billion cubic feet per day
6
New 1,100MW
Gas Plant
New NEXUS Gas
Pipeline
1.5 billion cubic feet per day
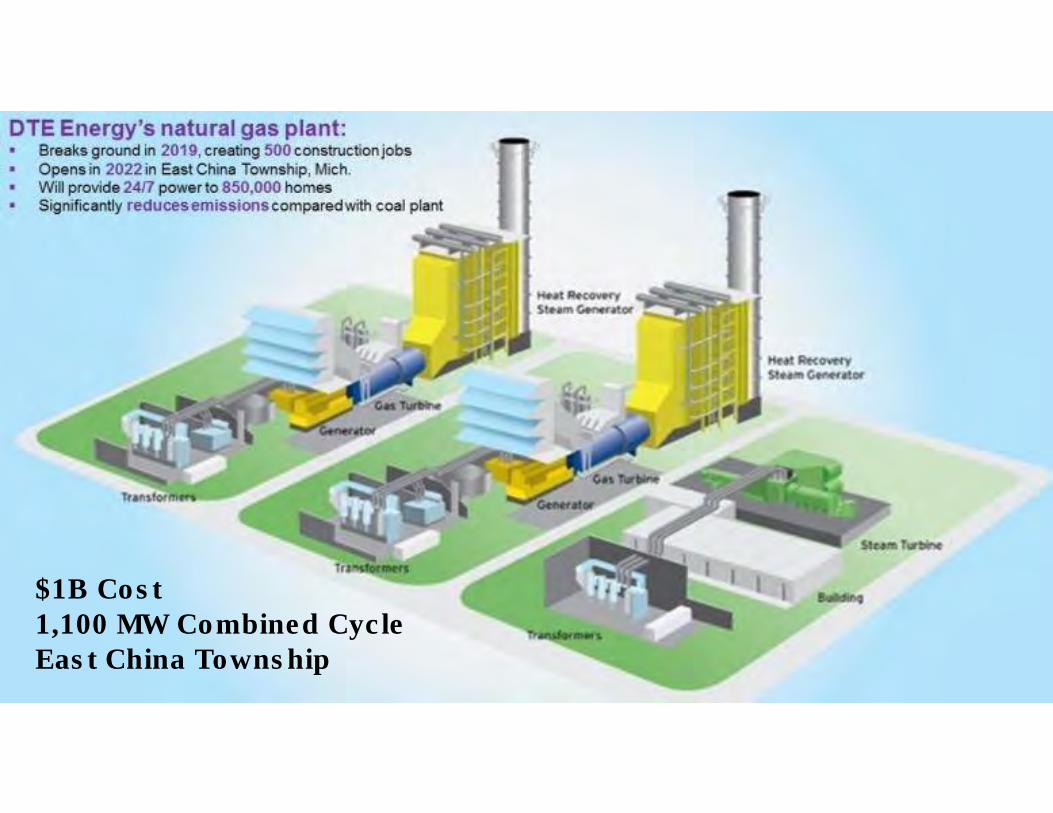
$1B Cost1,100 MW Combined CycleEast China Township
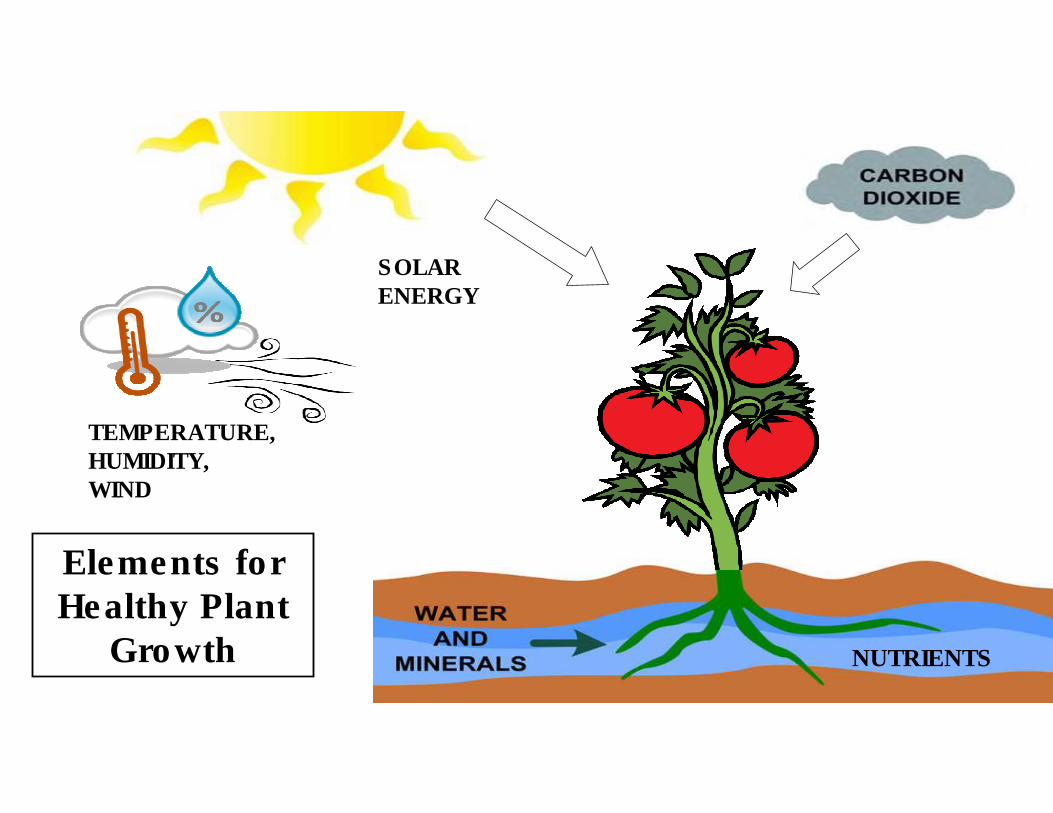
TEMPERATURE,HUMIDITY,WIND
SOLAR ENERGY
NUTRIENTS
Elements for Healthy Plant
Growth
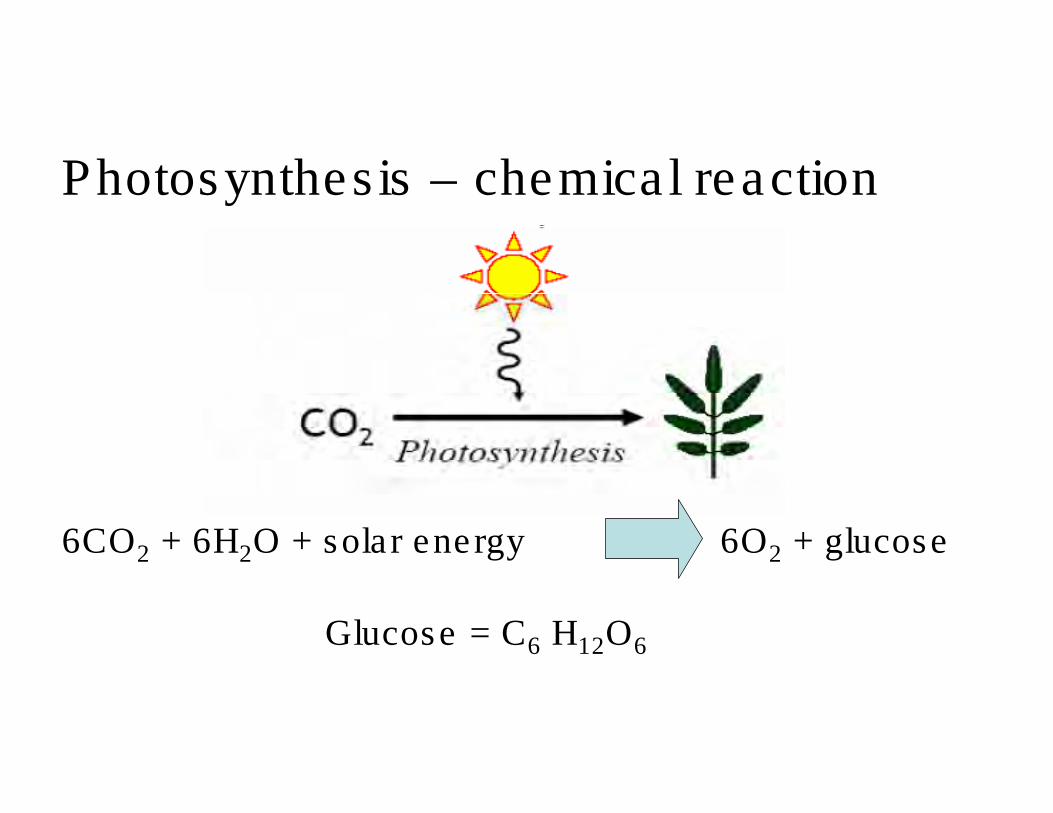
6CO2 + 6H2O + solar energy 6O2 + glucose
Glucose = C6 H12O6
Photosynthesis – chemical reaction
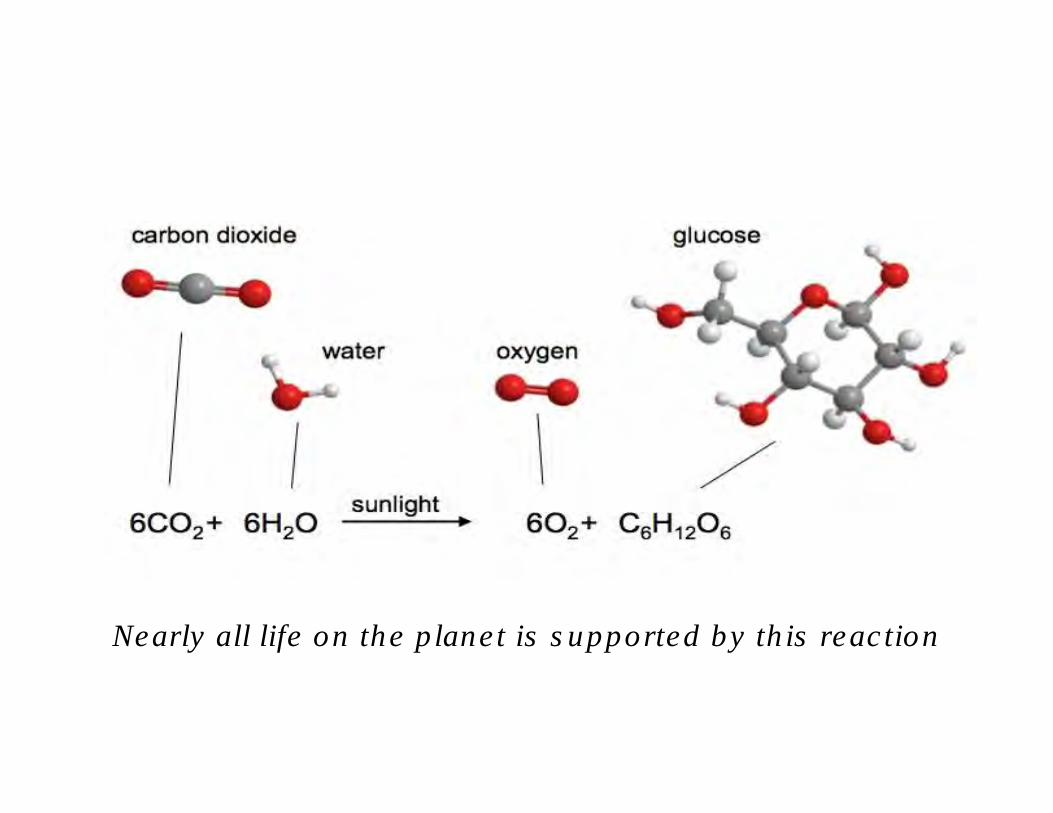
Nearly all life on the planet is supported by this reaction
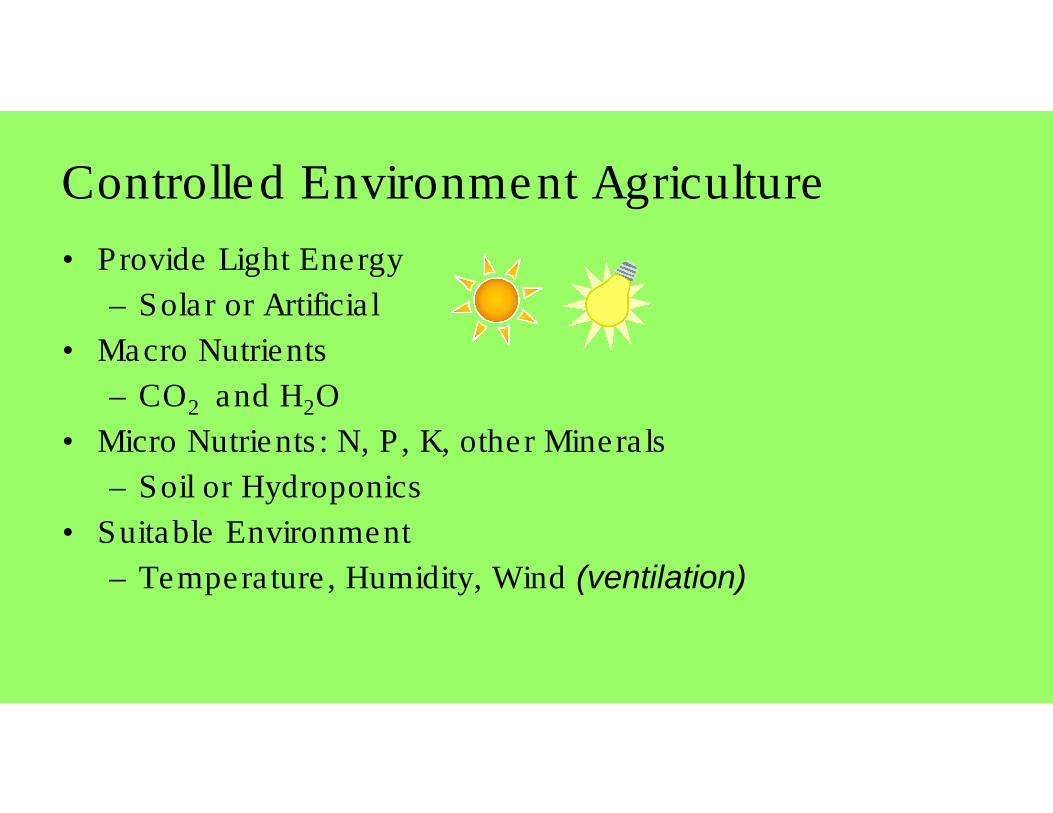
Controlled Environment Agriculture
• Provide Light Energy
– Solar or Artificial
• Macro Nutrients
– CO2 and H2O
• Micro Nutrients: N, P, K, other Minerals
– Soil or Hydroponics
• Suitable Environment
– Temperature, Humidity, Wind (ventilation)
Elements of a Greenhouse• Building envelope
– Weatherization / air infiltration
– heat insulation
– light transmittance
• Lighting
• Heating
• Ventilation
• Cooling
• Humidity control
• Delivery of nutrients– CO2, water, fertilizer (N,P,K and minerals)
• Supply of energy: electric utility, natural gas, renewables, CHP
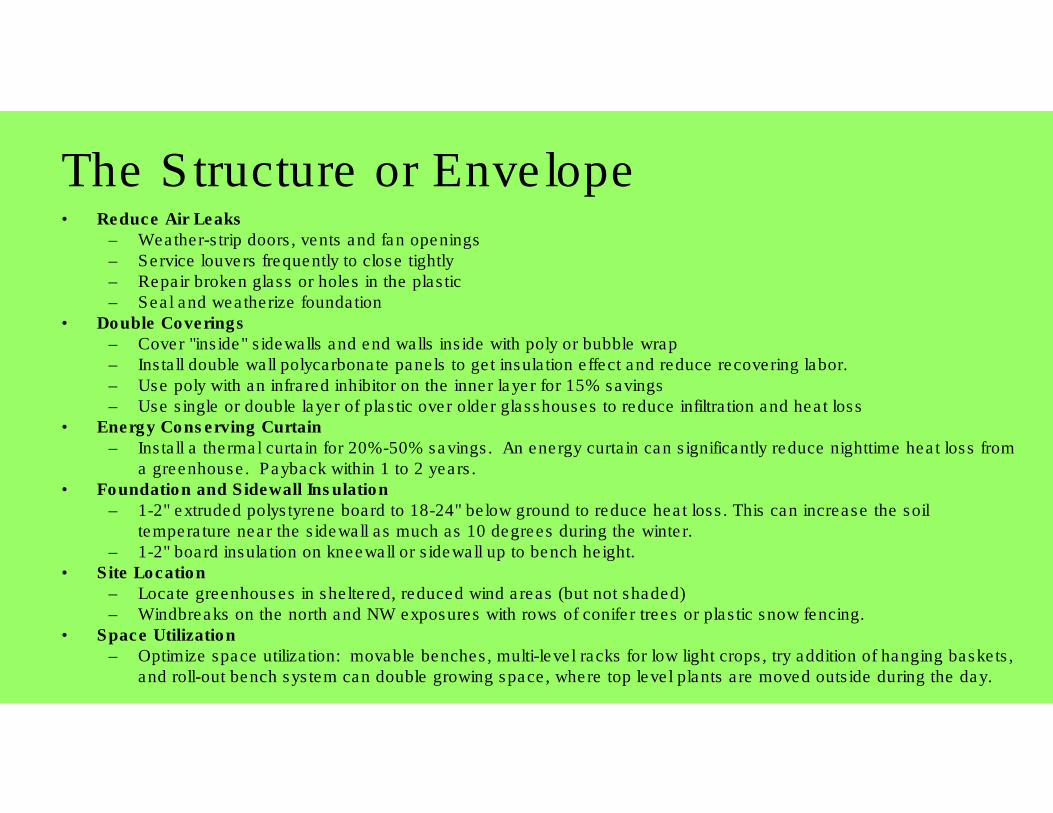
The Structure or Envelope• Reduce Air Leaks
– Weather-strip doors, vents and fan openings– Service louvers frequently to close tightly– Repair broken glass or holes in the plastic– Seal and weatherize foundation
• Double Coverings– Cover "inside" sidewalls and end walls inside with poly or bubble wrap– Install double wall polycarbonate panels to get insulation effect and reduce recovering labor.– Use poly with an infrared inhibitor on the inner layer for 15% savings– Use single or double layer of plastic over older glasshouses to reduce infiltration and heat loss
• Energy Conserving Curtain– Install a thermal curtain for 20%-50% savings. An energy curtain can significantly reduce nighttime heat loss from
a greenhouse. Payback within 1 to 2 years. • Foundation and Sidewall Insulation
– 1-2" extruded polystyrene board to 18-24" below ground to reduce heat loss. This can increase the soiltemperature near the sidewall as much as 10 degrees during the winter.
– 1-2" board insulation on kneewall or sidewall up to bench height. • Site Location
– Locate greenhouses in sheltered, reduced wind areas (but not shaded)– Windbreaks on the north and NW exposures with rows of conifer trees or plastic snow fencing.
• Space Utilization– Optimize space utilization: movable benches, multi-level racks for low light crops, try addition of hanging baskets,
and roll-out bench system can double growing space, where top level plants are moved outside during the day.
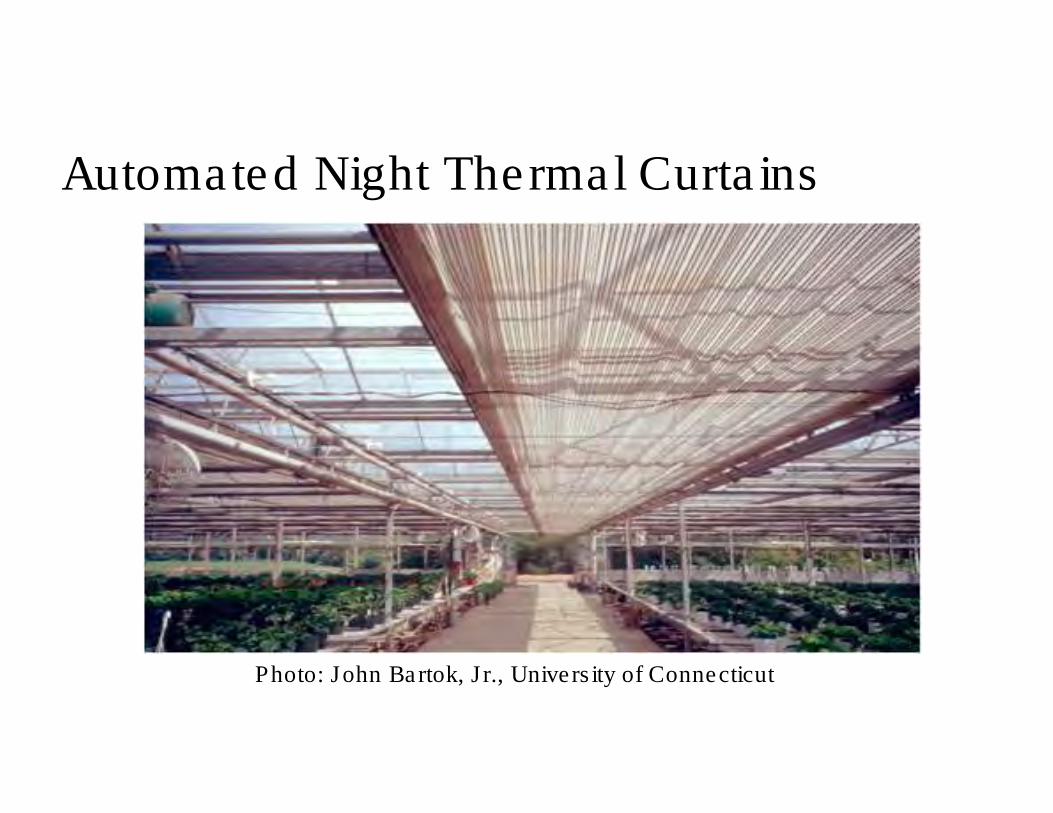
Automated Night Thermal Curtains
Photo: John Bartok, Jr., University of Connecticut
Heating Options• Consider Thermal Storage
• Direct fired unit heaters (CO2 + heat)
• Indirect fired unit heaters
– High efficiency condensing unit heaters (90%+)
• Natural gas boiler, natural gas
– Radiant piping distribution
– Radiant floor distribution
• Combined Heat & Power (CHP), natural gas
• Engine driven heat pumps, natural gas
• Ground source heat pumps, electric
• Renewable options
– Solar thermal or Biomass (wood chips)
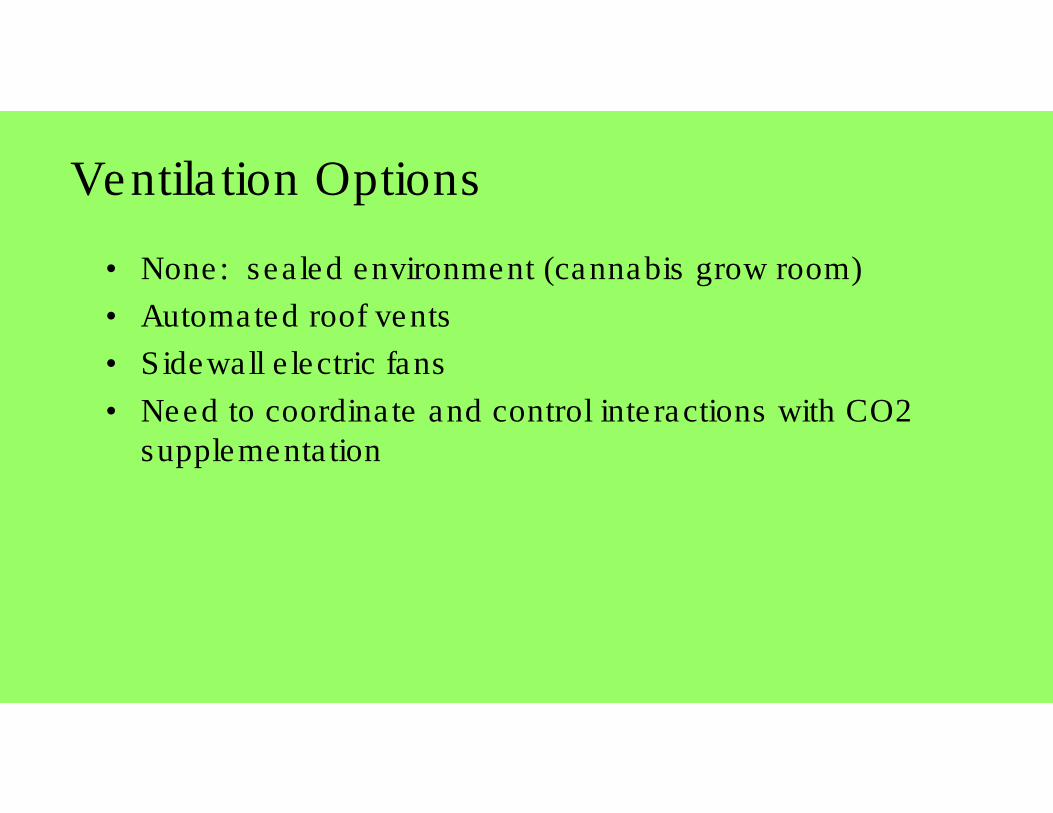
Ventilation Options
• None: sealed environment (cannabis grow room)
• Automated roof vents
• Sidewall electric fans
• Need to coordinate and control interactions with CO2 supplementation
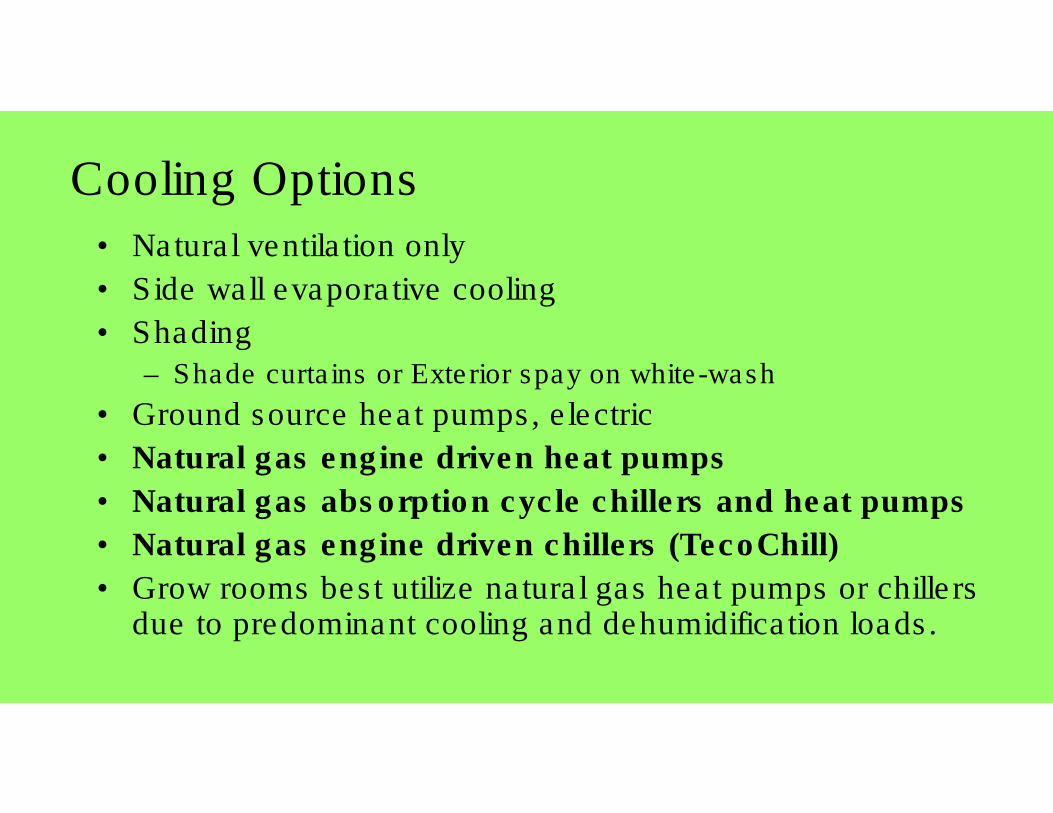
Cooling Options
• Natural ventilation only
• Side wall evaporative cooling
• Shading– Shade curtains or Exterior spay on white-wash
• Ground source heat pumps, electric
• Natural gas engine driven heat pumps
• Natural gas absorption cycle chillers and heat pumps
• Natural gas engine driven chillers (TecoChill)
• Grow rooms best utilize natural gas heat pumps or chillers due to predominant cooling and dehumidification loads.
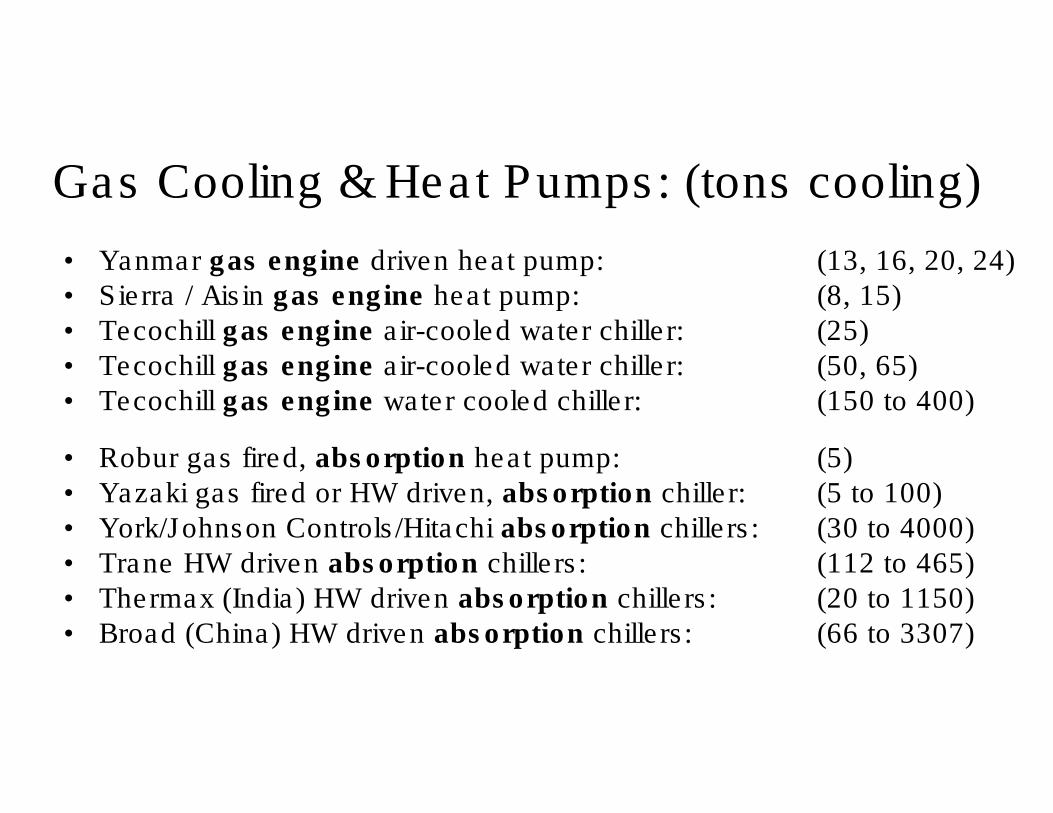
Gas Cooling & Heat Pumps: (tons cooling)
• Yanmar gas engine driven heat pump: (13, 16, 20, 24)• Sierra / Aisin gas engine heat pump: (8, 15)• Tecochill gas engine air-cooled water chiller: (25)• Tecochill gas engine air-cooled water chiller: (50, 65)• Tecochill gas engine water cooled chiller: (150 to 400)
• Robur gas fired, absorption heat pump: (5)• Yazaki gas fired or HW driven, absorption chiller: (5 to 100)• York/Johnson Controls/Hitachi absorption chillers: (30 to 4000) • Trane HW driven absorption chillers: (112 to 465)• Thermax (India) HW driven absorption chillers: (20 to 1150)• Broad (China) HW driven absorption chillers: (66 to 3307)
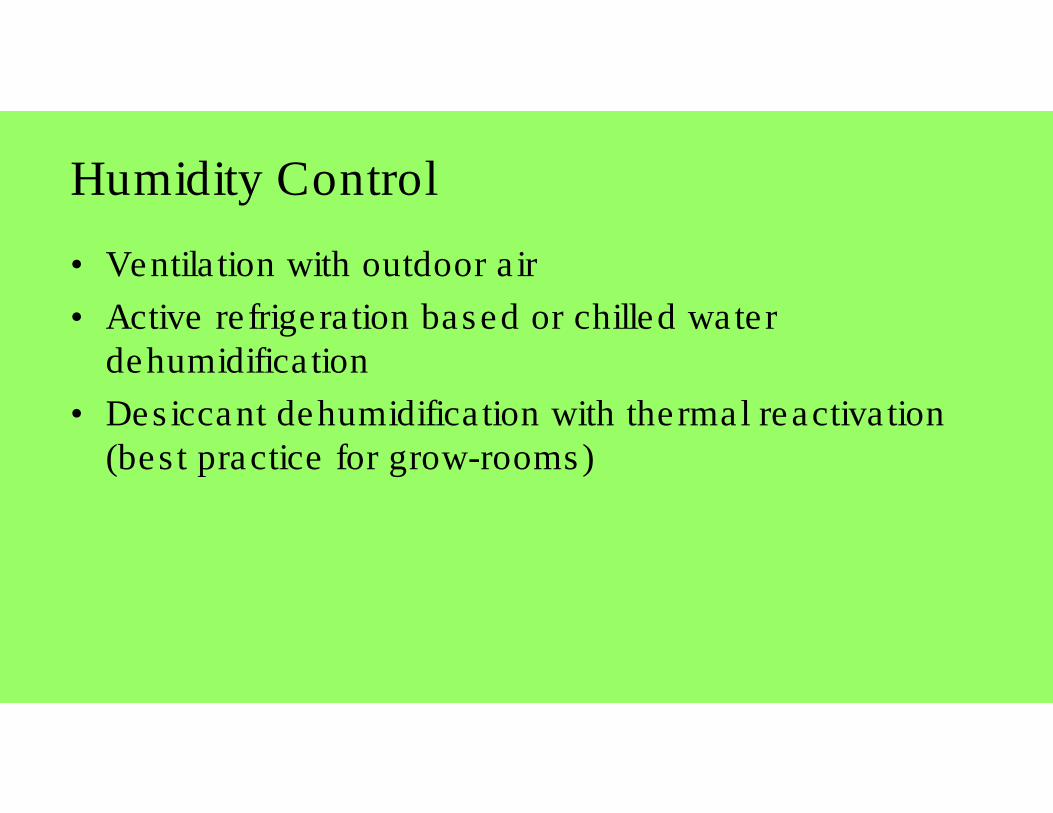
Humidity Control
• Ventilation with outdoor air
• Active refrigeration based or chilled water dehumidification
• Desiccant dehumidification with thermal reactivation (best practice for grow-rooms)
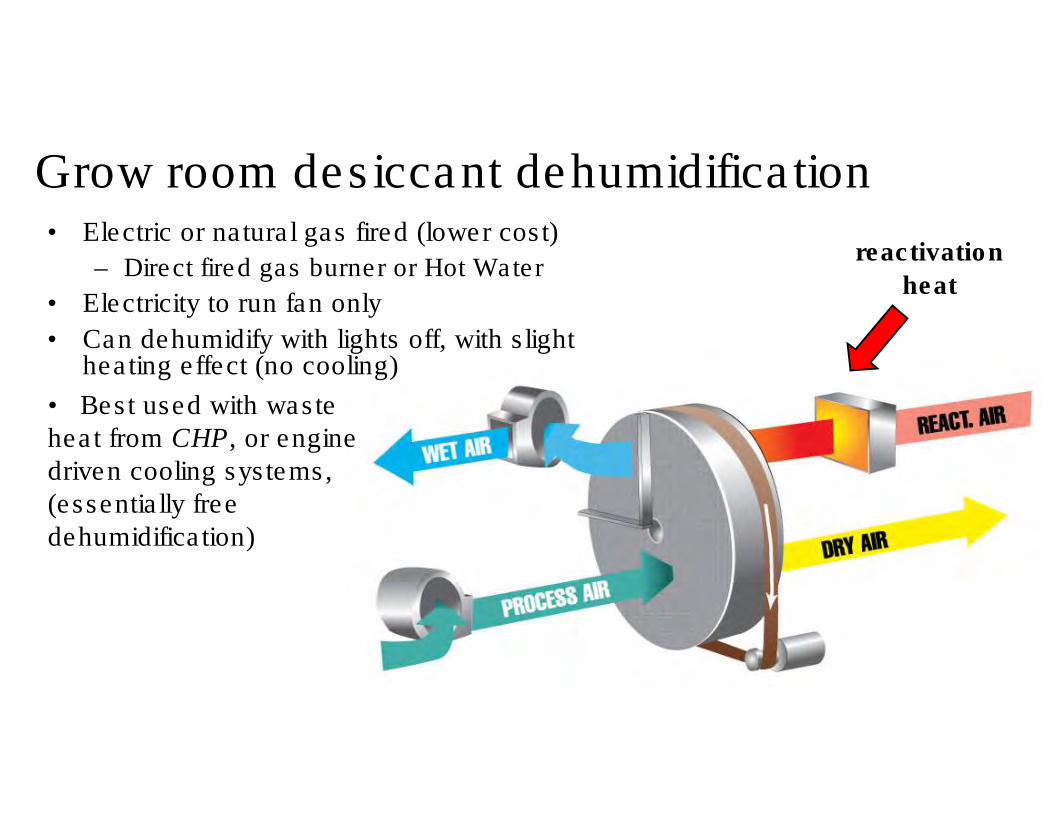
Grow room desiccant dehumidification• Electric or natural gas fired (lower cost)
– Direct fired gas burner or Hot Water
• Electricity to run fan only
• Can dehumidify with lights off, with slight heating effect (no cooling)
reactivation
heat
• Best used with waste heat from CHP, or engine driven cooling systems, (essentially free dehumidification)

Delivery of Nutrients
• CO2• N, P, K, minerals
– Soil– Hydroponics
CO2 Supplementation
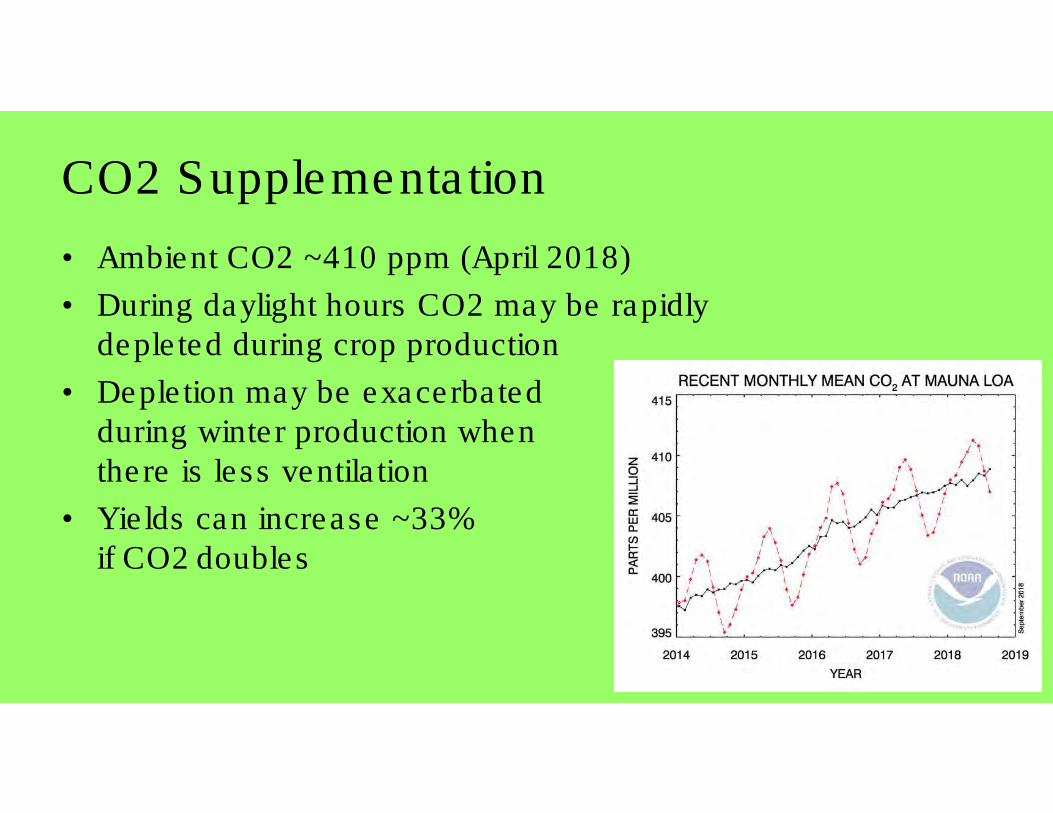
• Ambient CO2 ~410 ppm (April 2018)
• During daylight hours CO2 may be rapidly depleted during crop production
• Depletion may be exacerbated during winter production when there is less ventilation
• Yields can increase ~33% if CO2 doubles
Am
bie
nt
2018
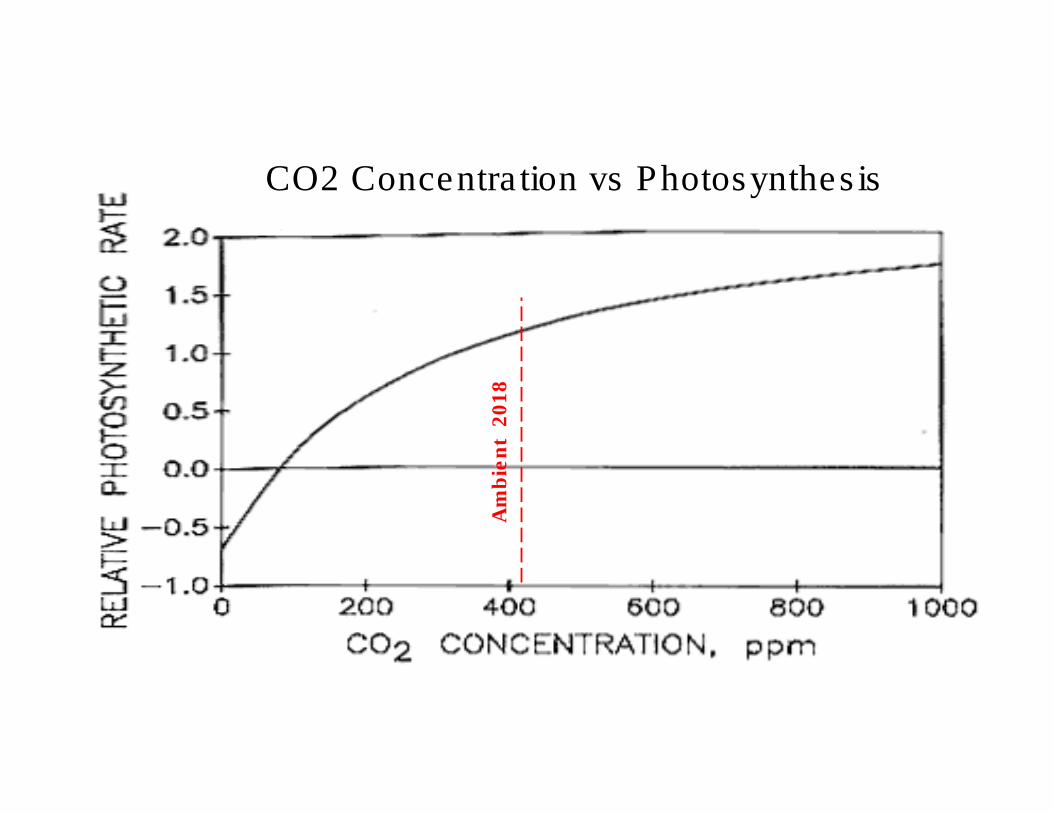
CO2 Concentration vs Photosynthesis
CO2 Concentration Levels
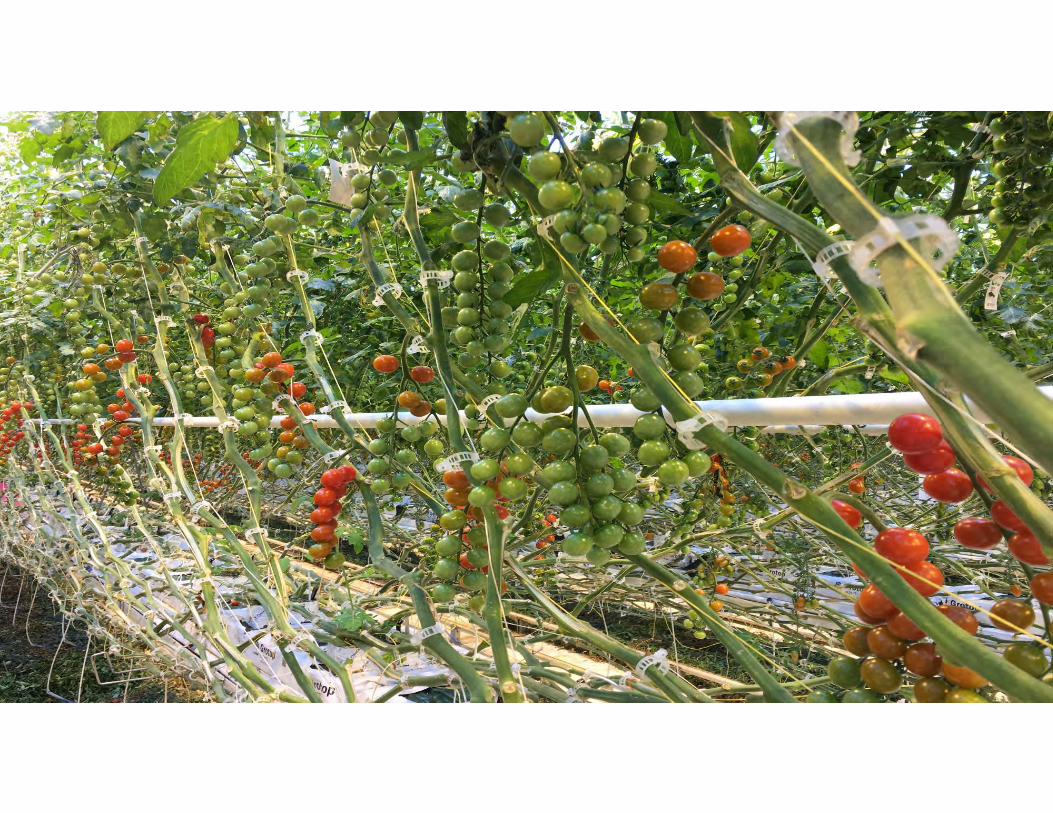
• 1,000 ppm or more have shown to increase tomato yields economically
• However, you must adjust based on plant maturity and environmental conditions• Bright, sunny weather 1000 ppm
• Cloudy weather 750 ppm
• Young plants 700 ppm
• During moderate ventilation 350-400 ppm
• Less needed as temperature and ventilation rates increase
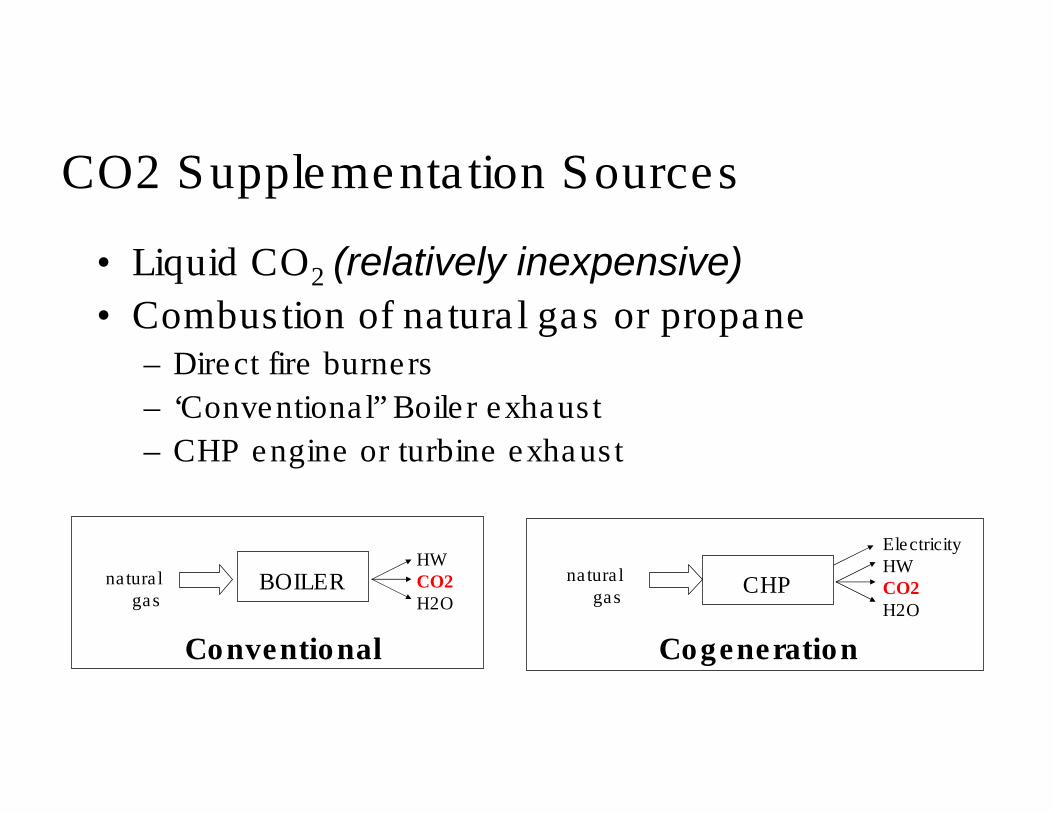
CO2 Supplementation Sources
• Liquid CO2 (relatively inexpensive)
• Combustion of natural gas or propane– Direct fire burners
– ‘Conventional” Boiler exhaust
– CHP engine or turbine exhaust
BOILER CHP
Conventional
naturalgas
Cogeneration
HWCO2H2O
ElectricityHWCO2H2O
naturalgas
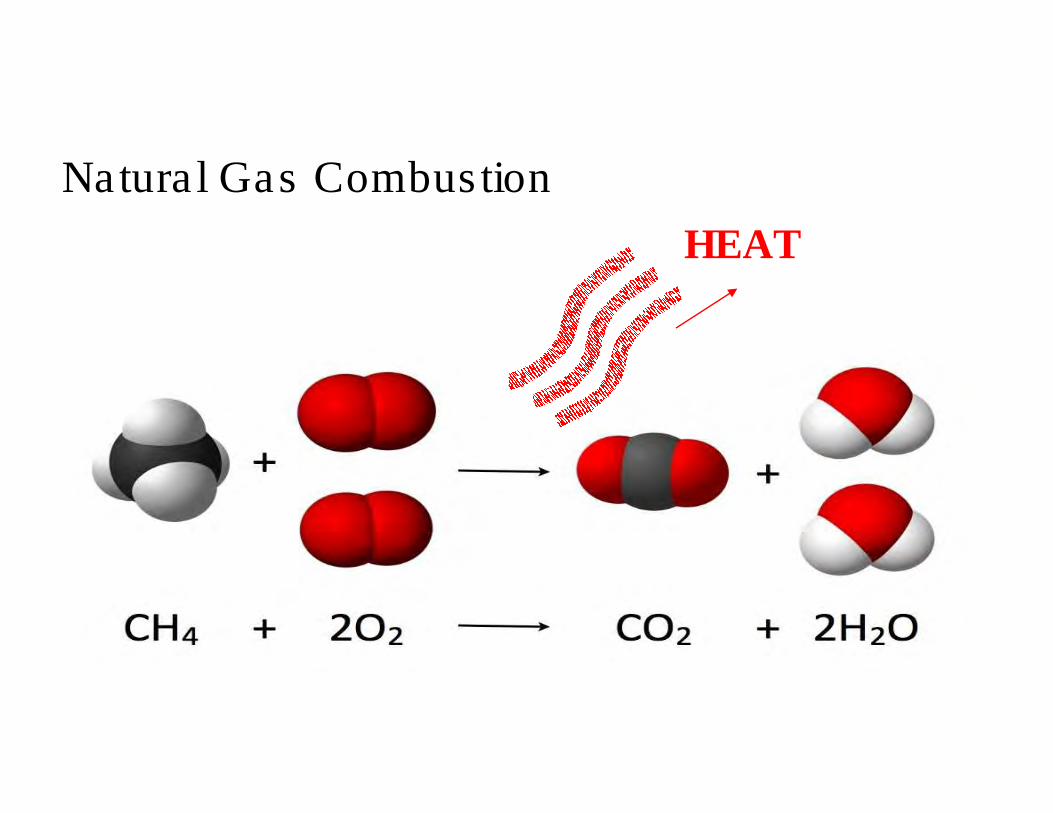
Natural Gas Combustion
HEAT
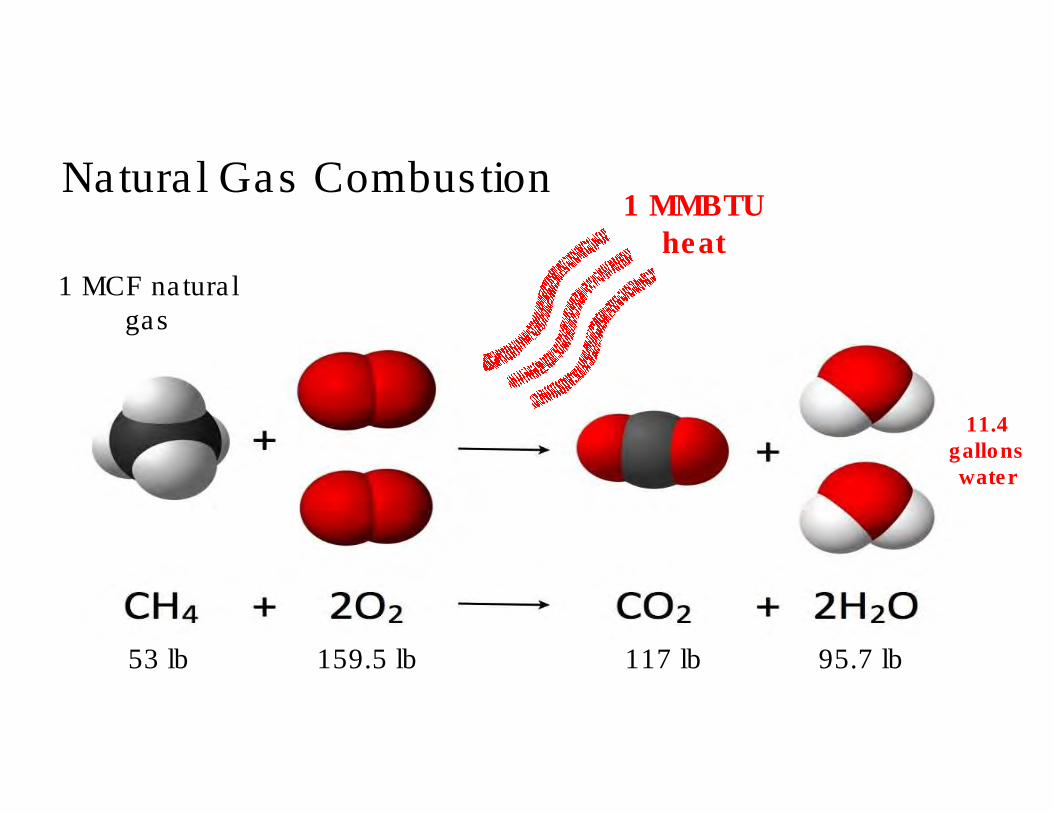
Natural Gas Combustion
1 MCF natural gas
1 MMBTU heat
117 lb53 lb 159.5 lb 95.7 lb
11.4 gallons water
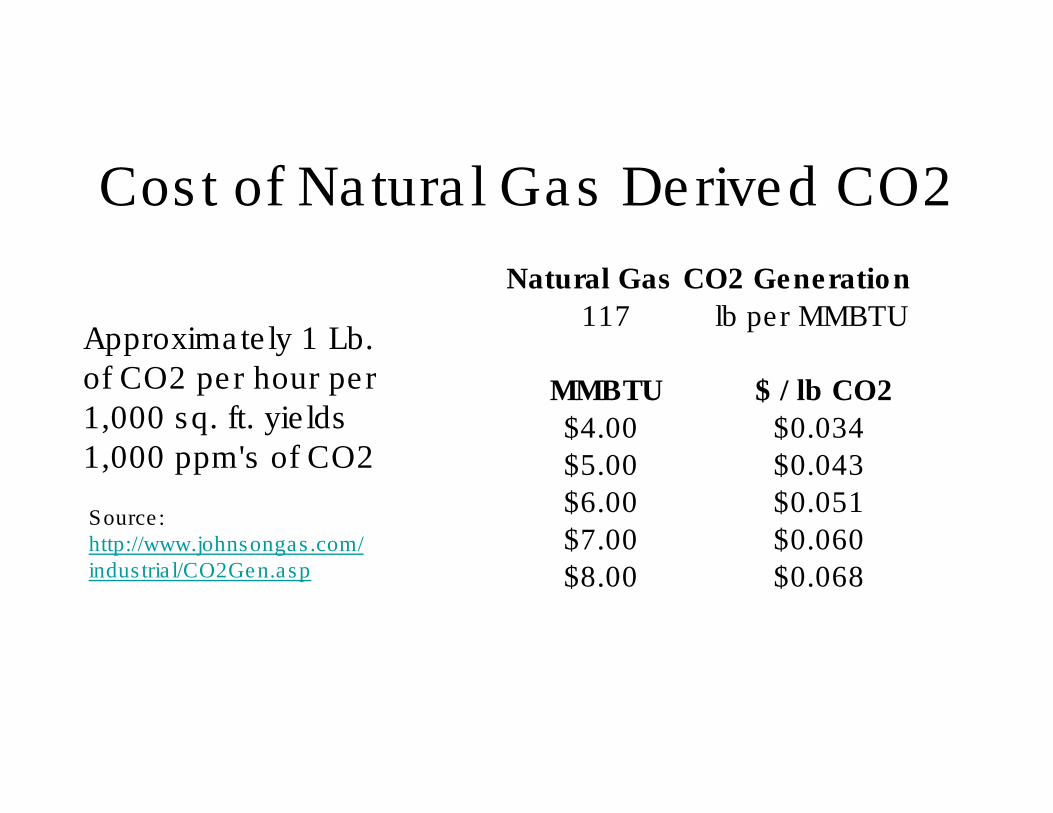
Cost of Natural Gas Derived CO2
Source: http://www.johnsongas.com/industrial/CO2Gen.asp
Natural Gas CO2 Generation
117 lb per MMBTU
MMBTU $ / lb CO2
$4.00 $0.034
$5.00 $0.043
$6.00 $0.051
$7.00 $0.060
$8.00 $0.068
Approximately 1 Lb. of CO2 per hour per 1,000 sq. ft. yields 1,000 ppm's of CO2
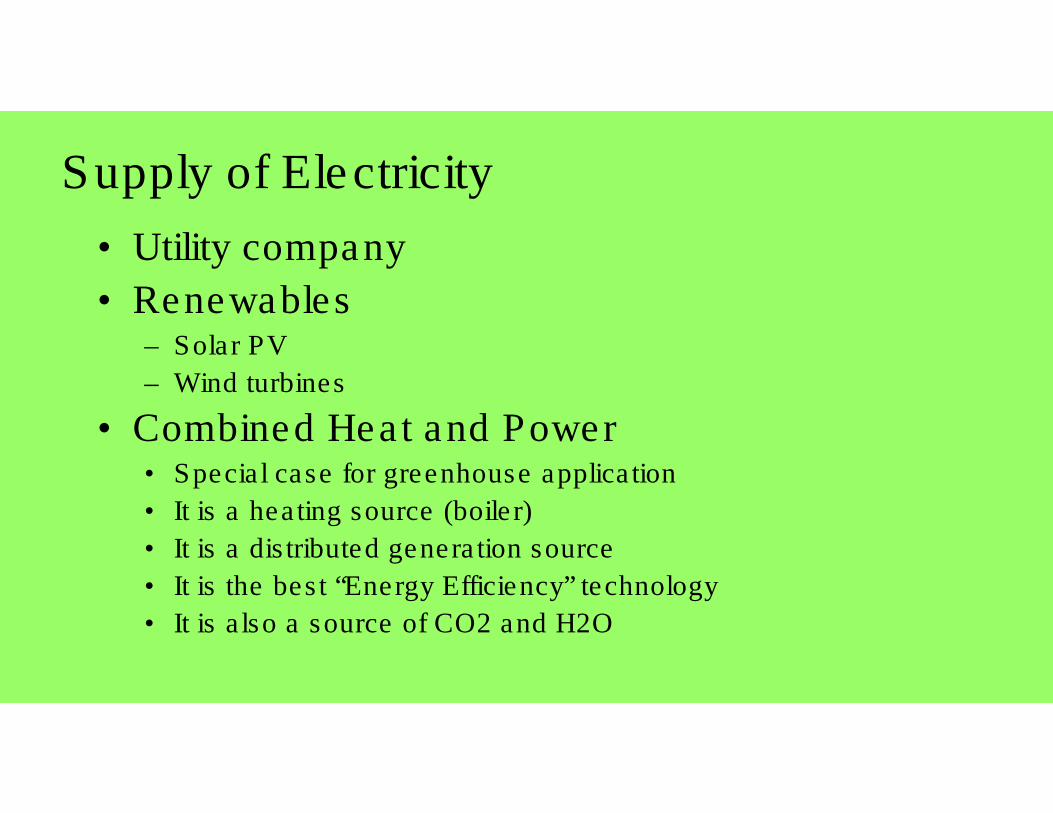
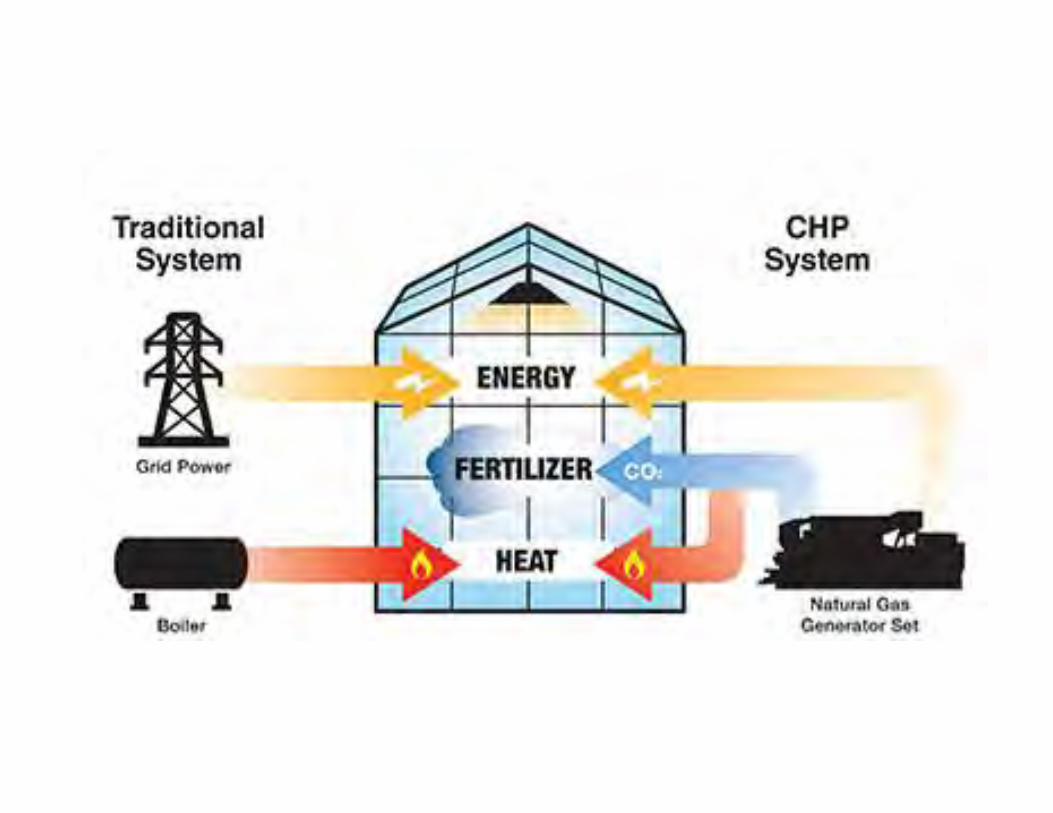
Supply of Electricity
• Utility company
• Renewables– Solar PV
– Wind turbines
• Combined Heat and Power• Special case for greenhouse application
• It is a heating source (boiler)
• It is a distributed generation source
• It is the best “Energy Efficiency” technology
• It is also a source of CO2 and H2O
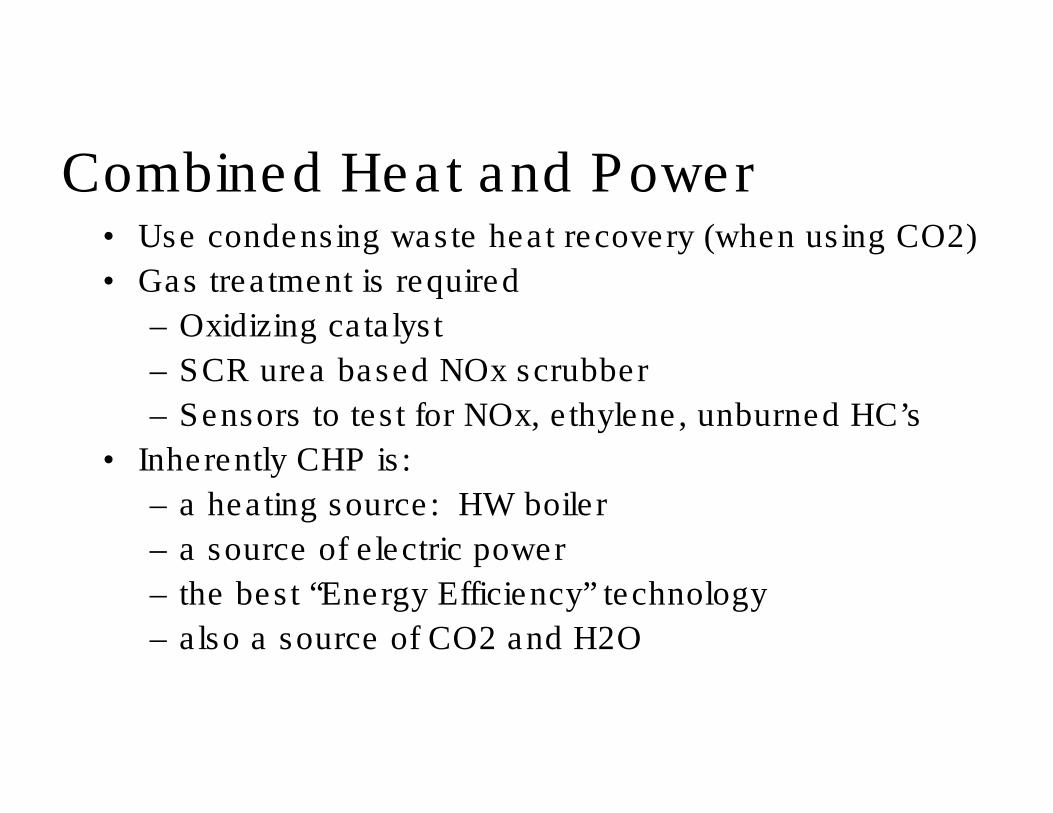
Combined Heat and Power• Use condensing waste heat recovery (when using CO2)
• Gas treatment is required
– Oxidizing catalyst
– SCR urea based NOx scrubber
– Sensors to test for NOx, ethylene, unburned HC’s
• Inherently CHP is:
– a heating source: HW boiler
– a source of electric power
– the best “Energy Efficiency” technology
– also a source of CO2 and H2O
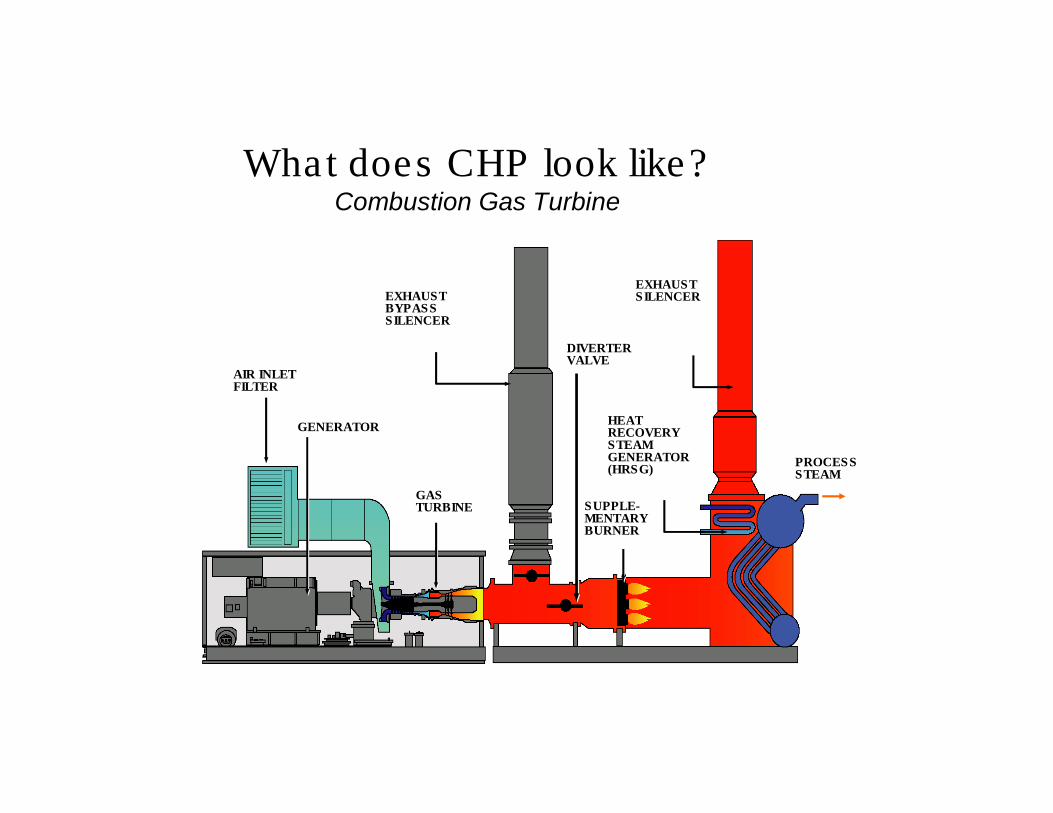
What does CHP look like?Combustion Gas Turbine
AIR INLETFILTER
DIVERTERVALVE
GASTURBINE
GENERATOR
EXHAUSTBYPASSSILENCER
SUPPLE-MENTARYBURNER
HEATRECOVERYSTEAMGENERATOR(HRSG)
EXHAUSTSILENCER
PROCESSSTEAM
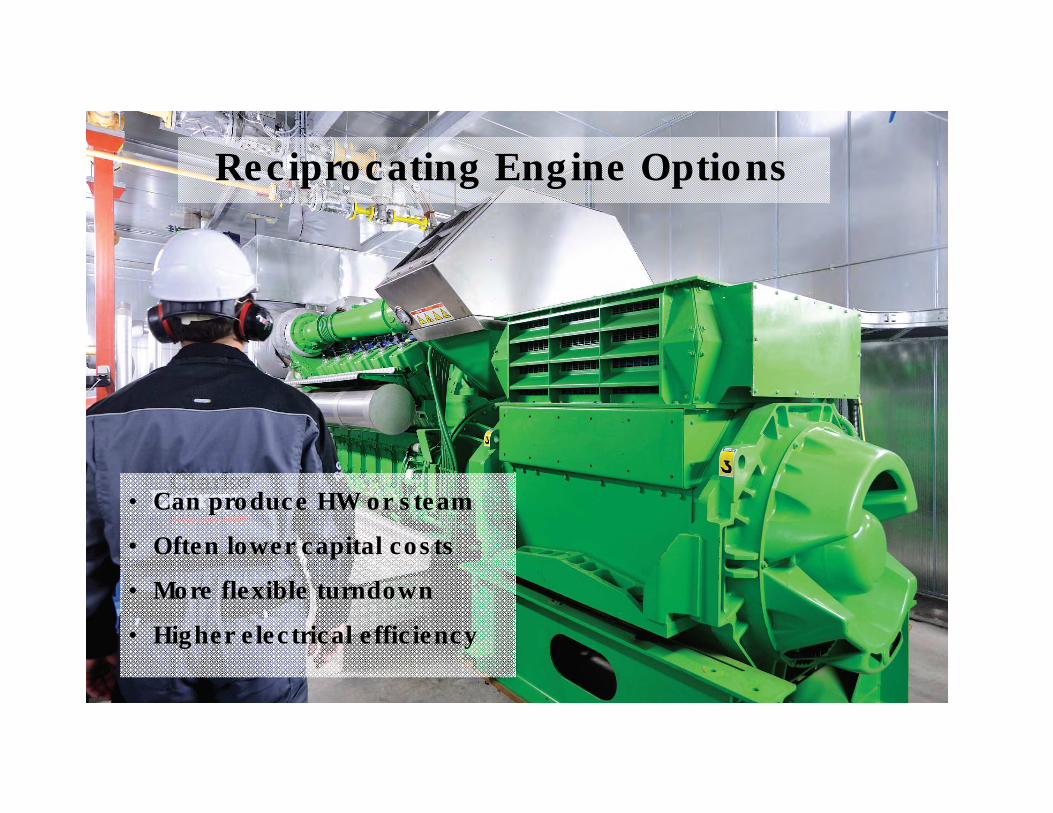
Reciprocating Engine Options
• Can produce HW or steam
• Often lower capital costs
• More flexible turndown
• Higher electrical efficiency
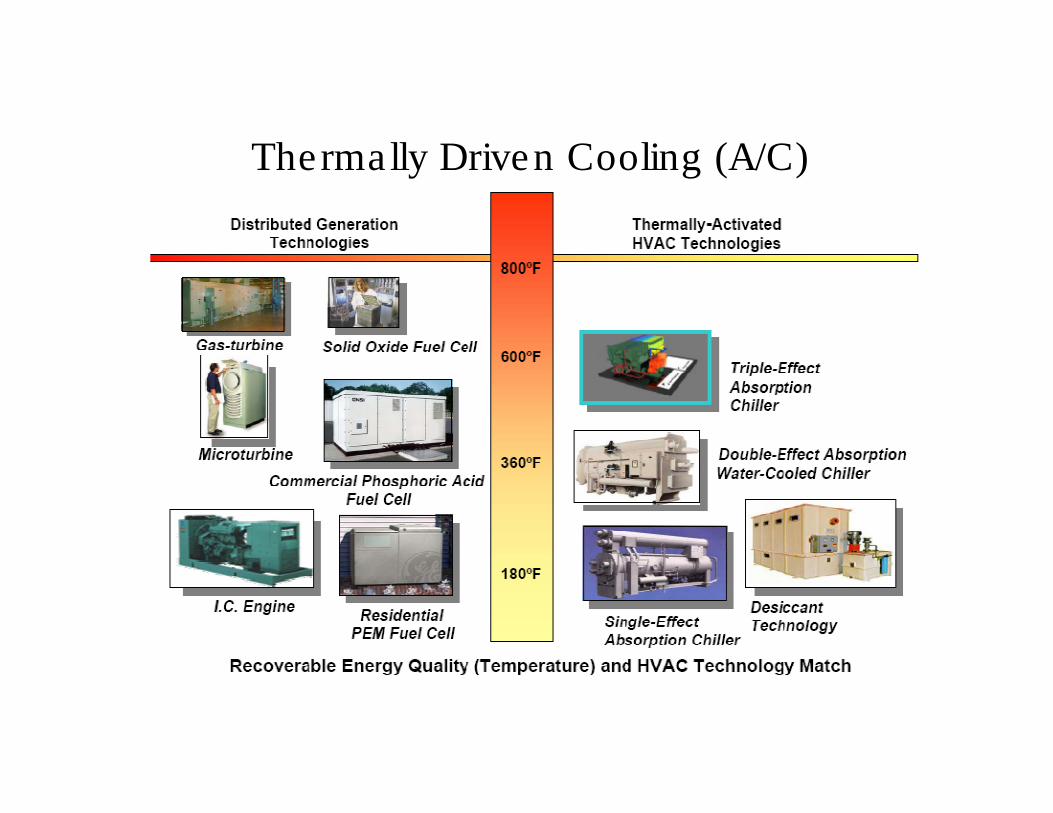
Thermally Driven Cooling (A/C)
ww
w.u
nd
ers
tan
din
gC
HP
.co
m
Click for Video
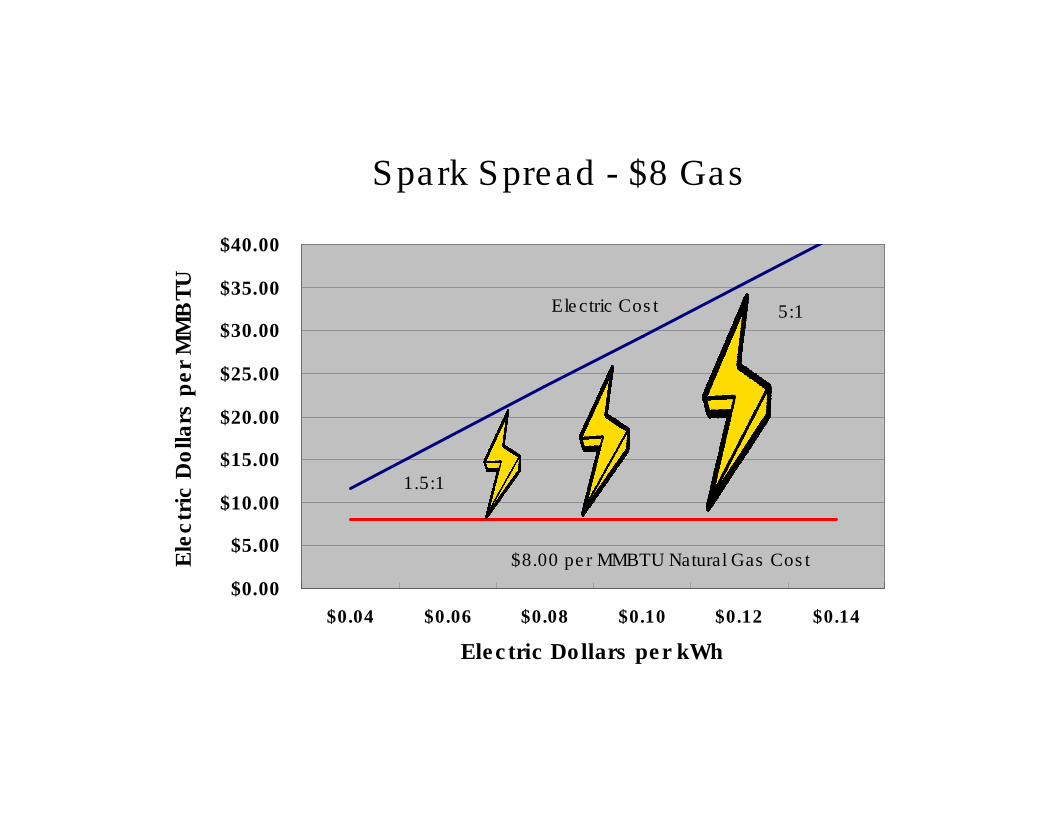
Spark Spread - $8 Gas
$0.00
$5.00
$10.00
$15.00
$20.00
$25.00
$30.00
$35.00
$40.00
$0.04 $0.06 $0.08 $0.10 $0.12 $0.14
Electric Dollars per kWh
Ele
ctr
ic D
olla
rs p
er
MM
BT
U
$8.00 per MMBTU Natural Gas Cost
5:1
1.5:1
Electric Cost
Spark Spread - $6 Gas
$0.00
$5.00
$10.00
$15.00
$20.00
$25.00
$30.00
$35.00
$40.00
$0.04 $0.06 $0.08 $0.10 $0.12 $0.14
Electric Dollars per kWh
Ele
ctr
ic D
olla
rs p
er
MM
BT
U
$6.00 per MMBTU Natural Gas Cost
Electric Cost
2:1
7:1
Spark Spread - $4.50 Gas
$0.00
$5.00
$10.00
$15.00
$20.00
$25.00
$30.00
$35.00
$40.00
$0.04 $0.06 $0.08 $0.10 $0.12 $0.14
Electric Dollars per kWh
Ele
ctr
ic D
olla
rs p
er
MM
BT
U
$4.50 per MMBTU Natural Gas Cost
Electric Cost
4:1
9:1
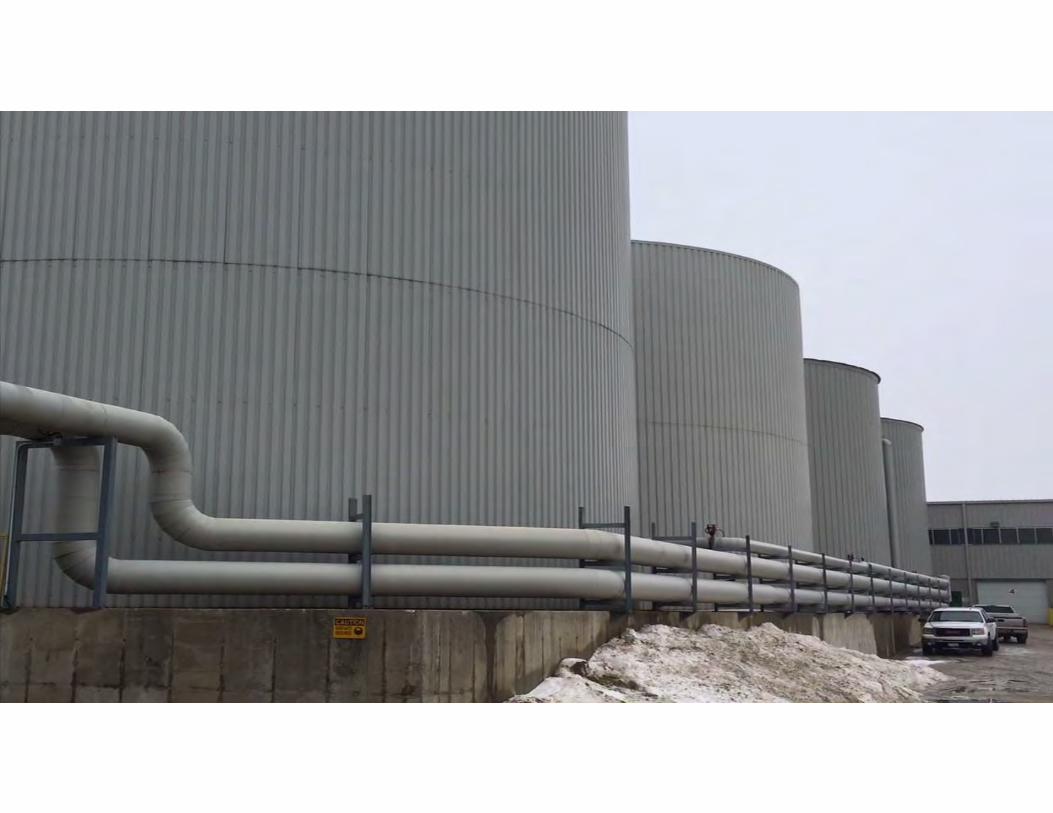
Boiler and Liquid CO2 Supplementation
Source: GE Jenbacher
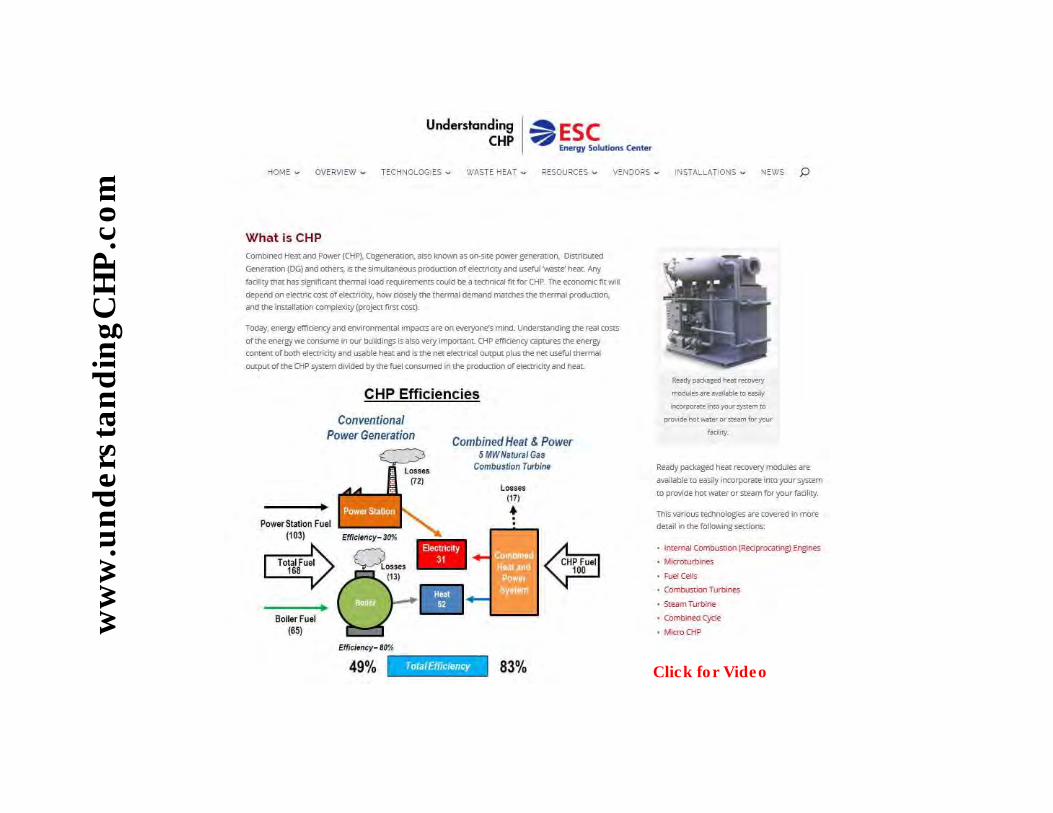
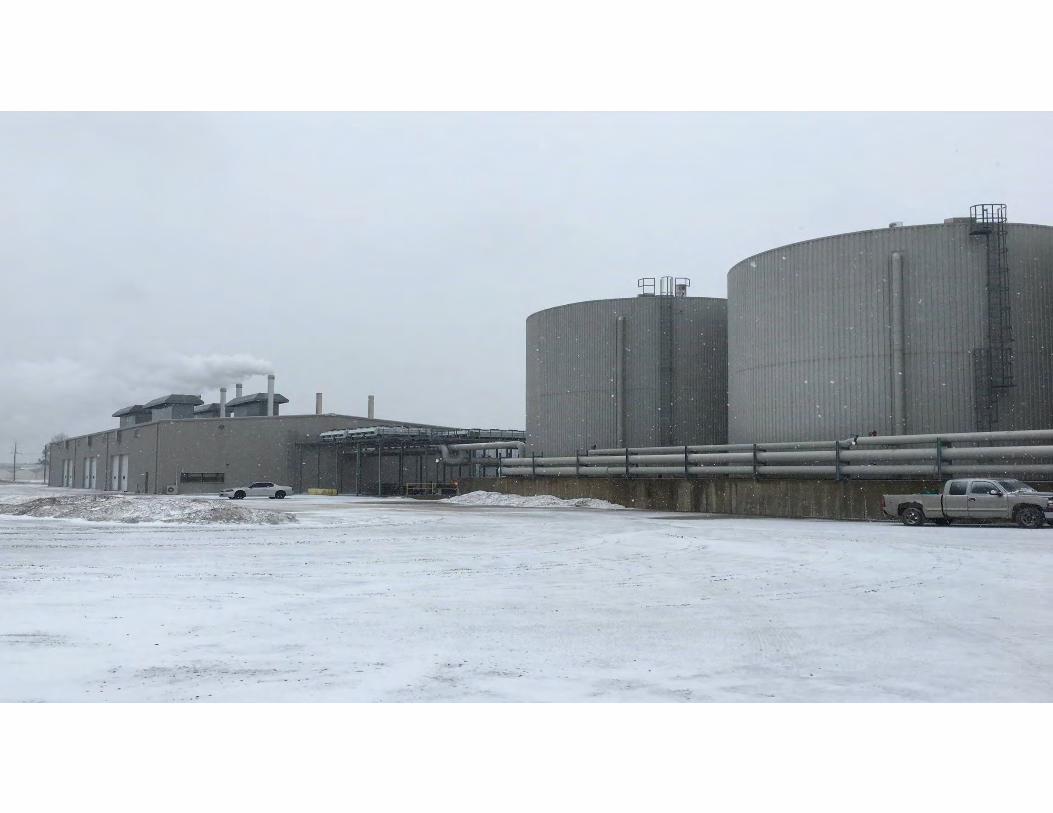
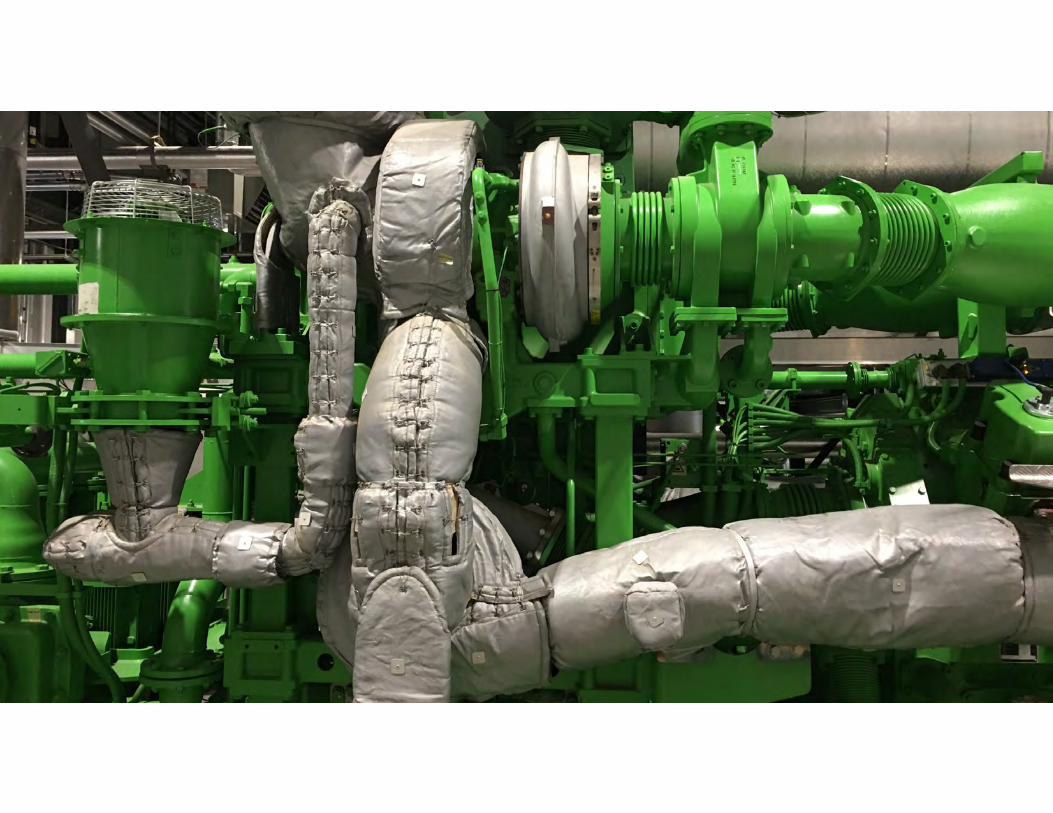
CHP System (Combined Heat and Power)
Source: GE Jenbacher
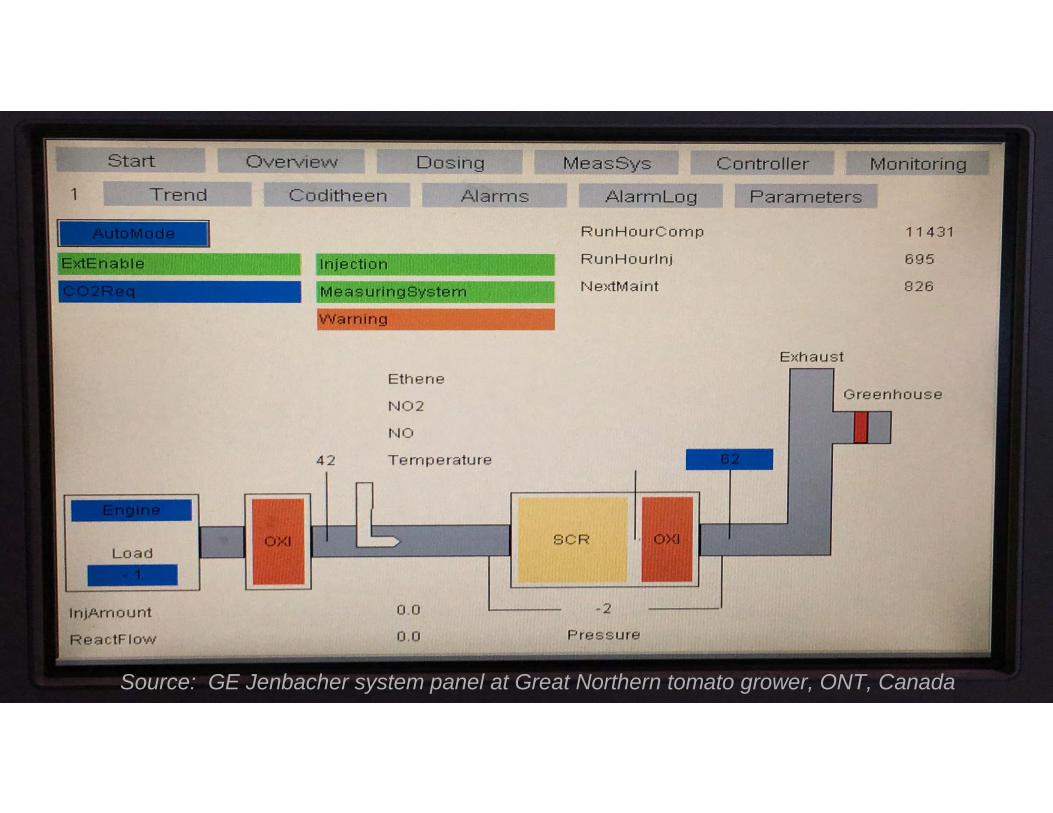
Source: GE Jenbacher system panel at Great Northern tomato grower, ONT, Canada
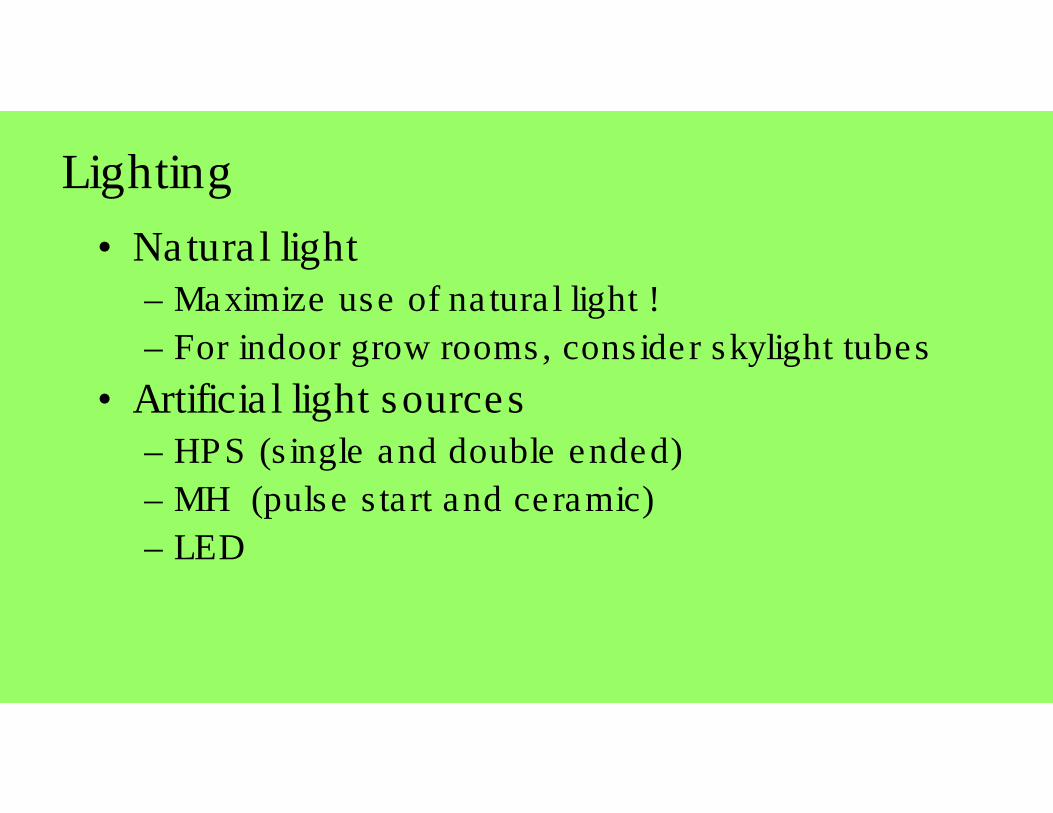
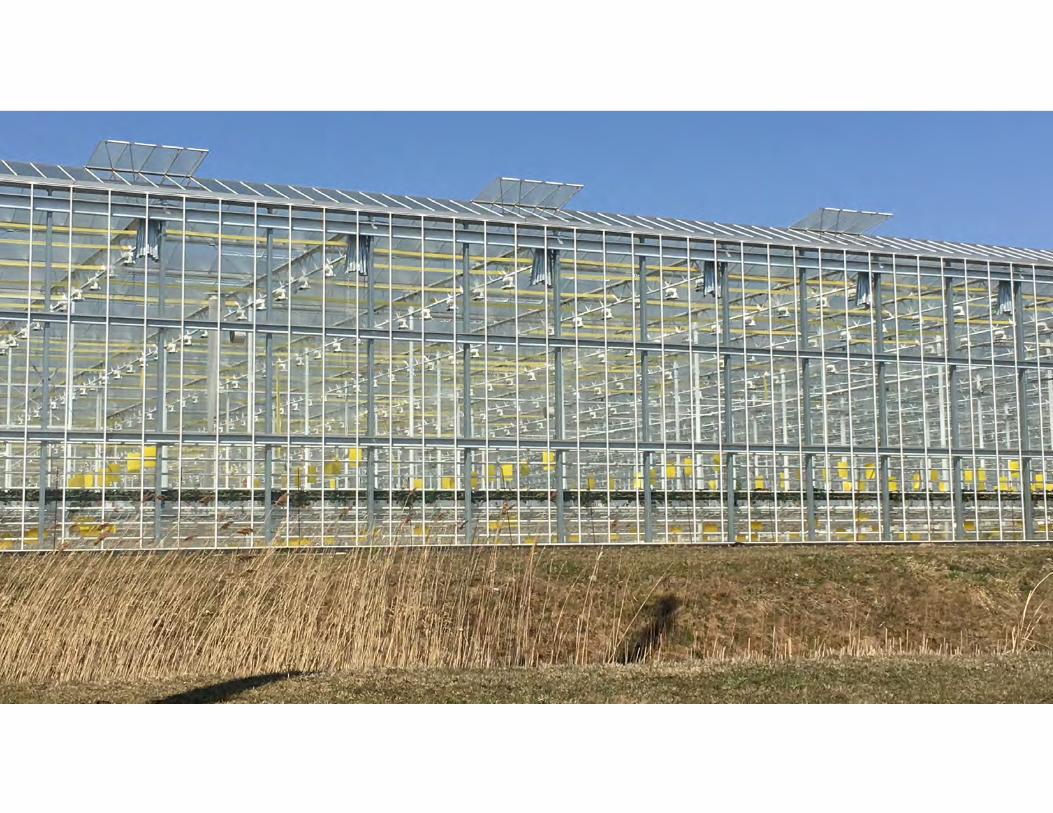
Lighting
• Natural light– Maximize use of natural light !
– For indoor grow rooms, consider skylight tubes
• Artificial light sources– HPS (single and double ended)
– MH (pulse start and ceramic)
– LED
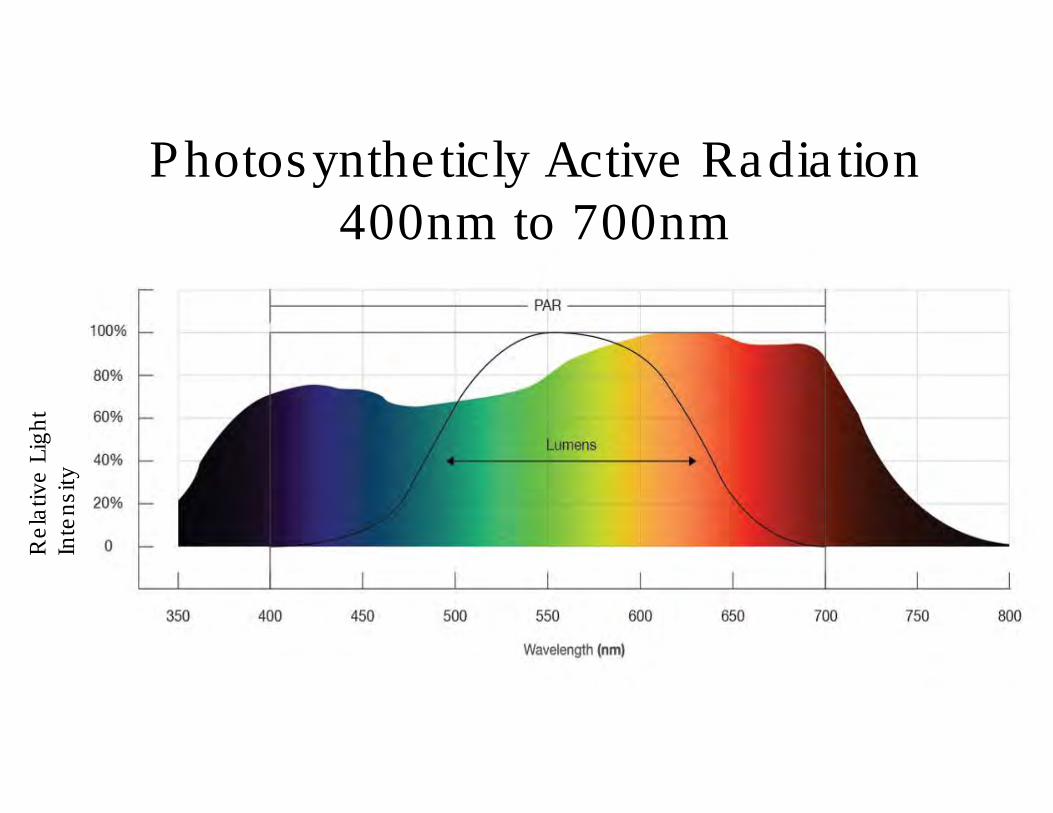
Re
lative
Lig
ht
Inte
nsity
Photosyntheticly Active Radiation400nm to 700nm
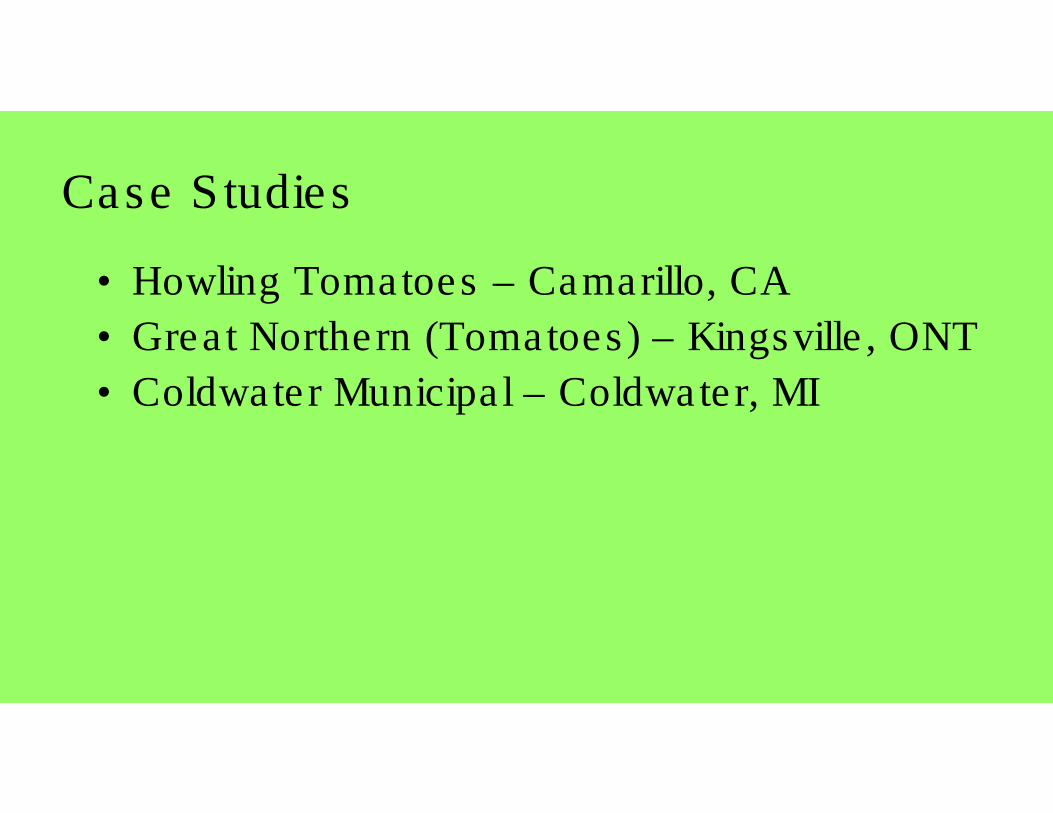
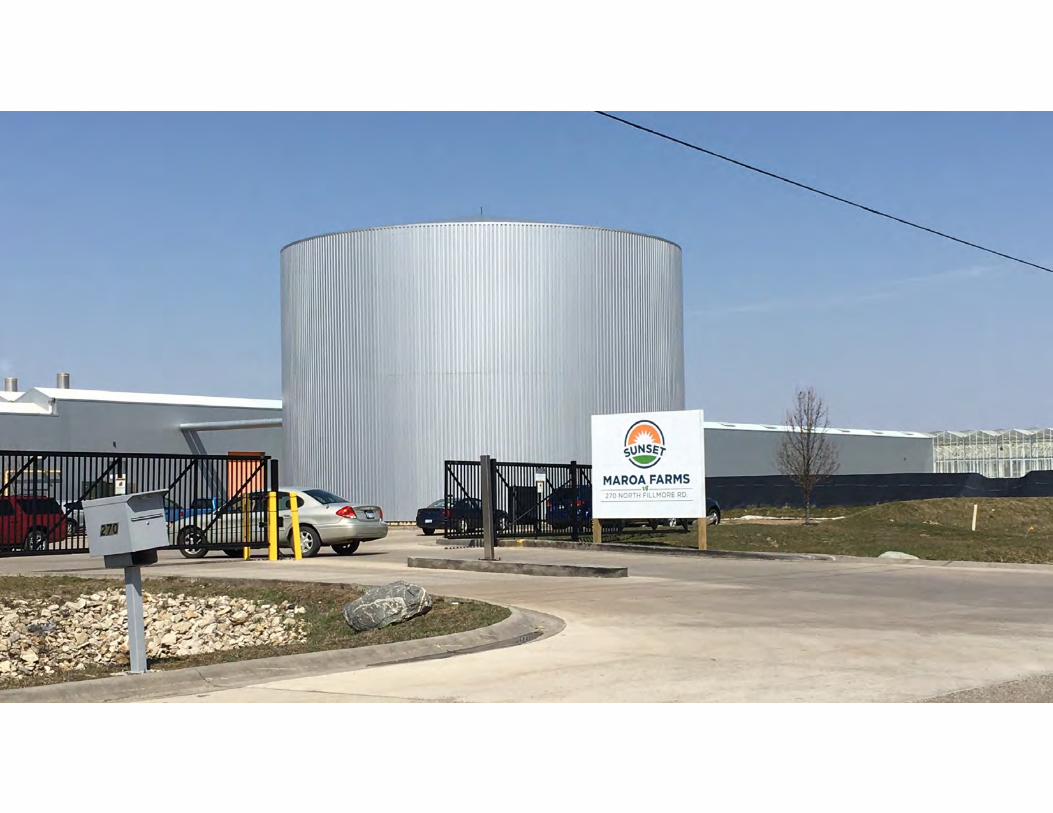
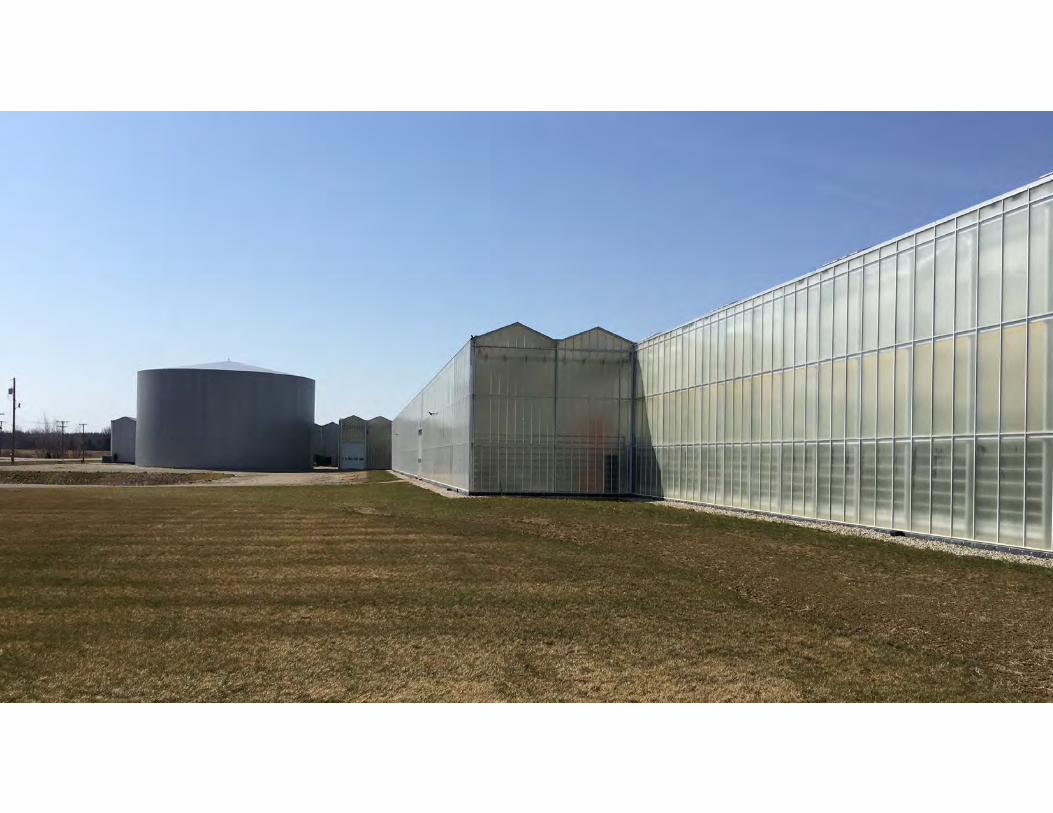
Case Studies
• Howling Tomatoes – Camarillo, CA
• Great Northern (Tomatoes) – Kingsville, ONT
• Coldwater Municipal – Coldwater, MI
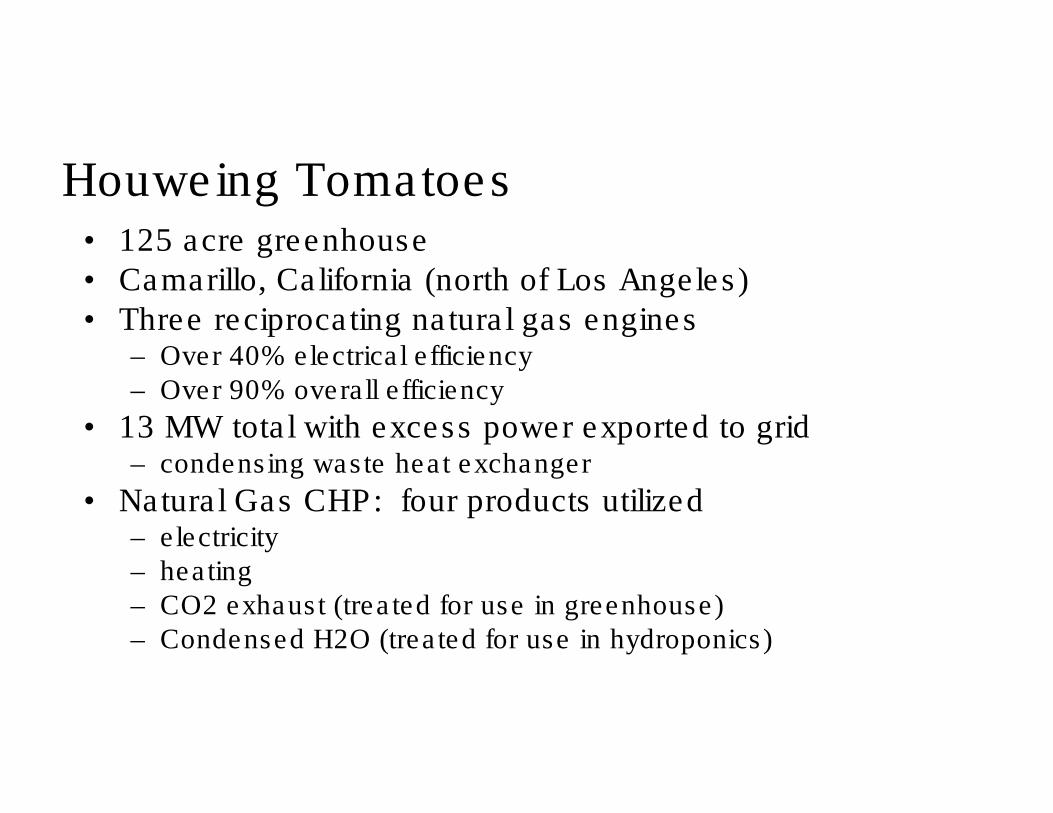
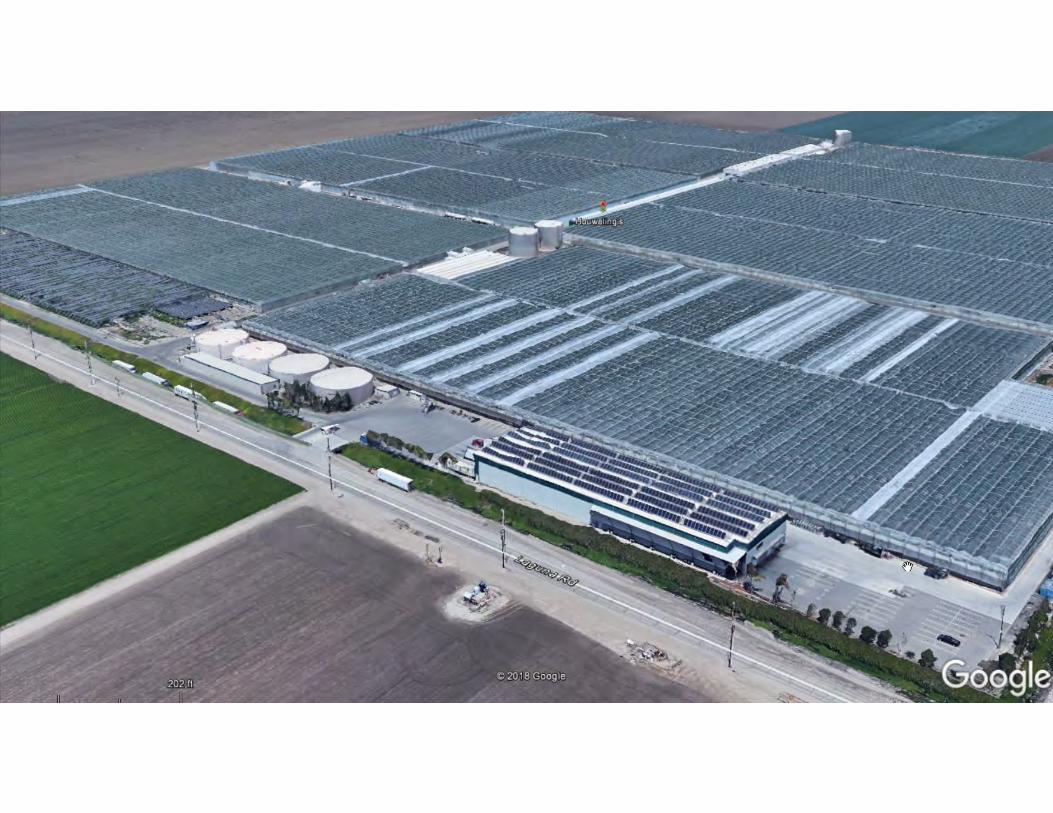
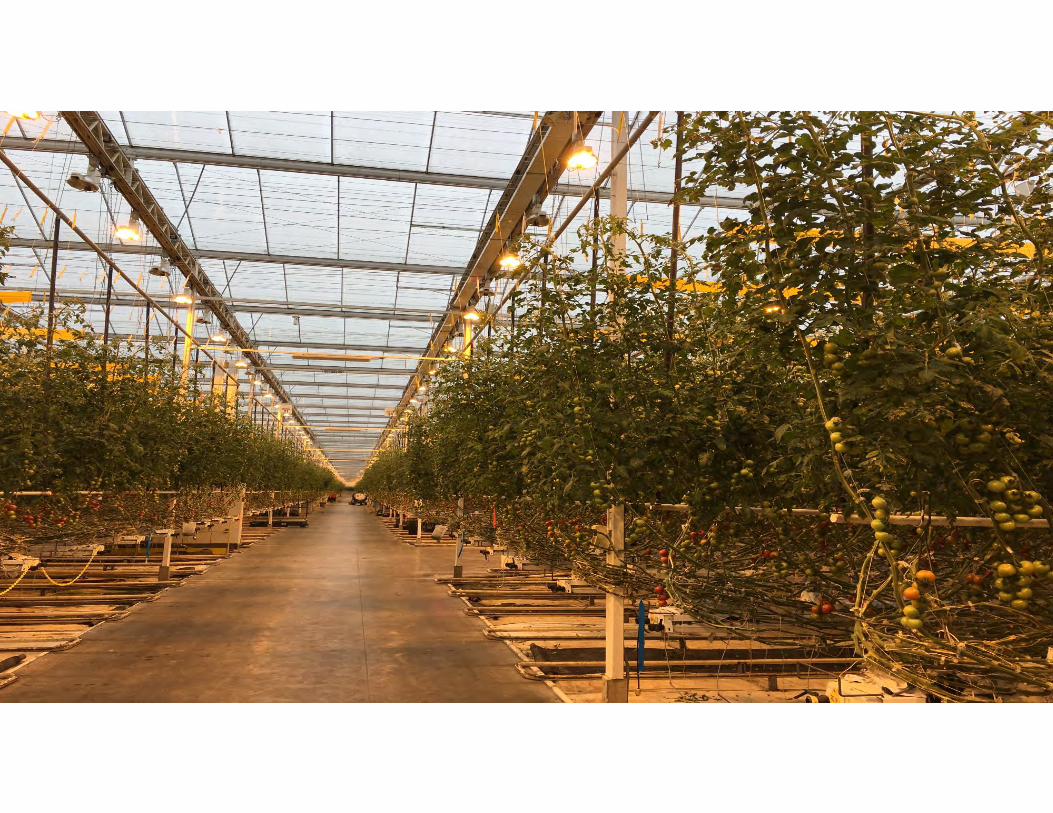
Houweing Tomatoes• 125 acre greenhouse• Camarillo, California (north of Los Angeles)• Three reciprocating natural gas engines
– Over 40% electrical efficiency– Over 90% overall efficiency
• 13 MW total with excess power exported to grid– condensing waste heat exchanger
• Natural Gas CHP: four products utilized– electricity– heating– CO2 exhaust (treated for use in greenhouse)– Condensed H2O (treated for use in hydroponics)
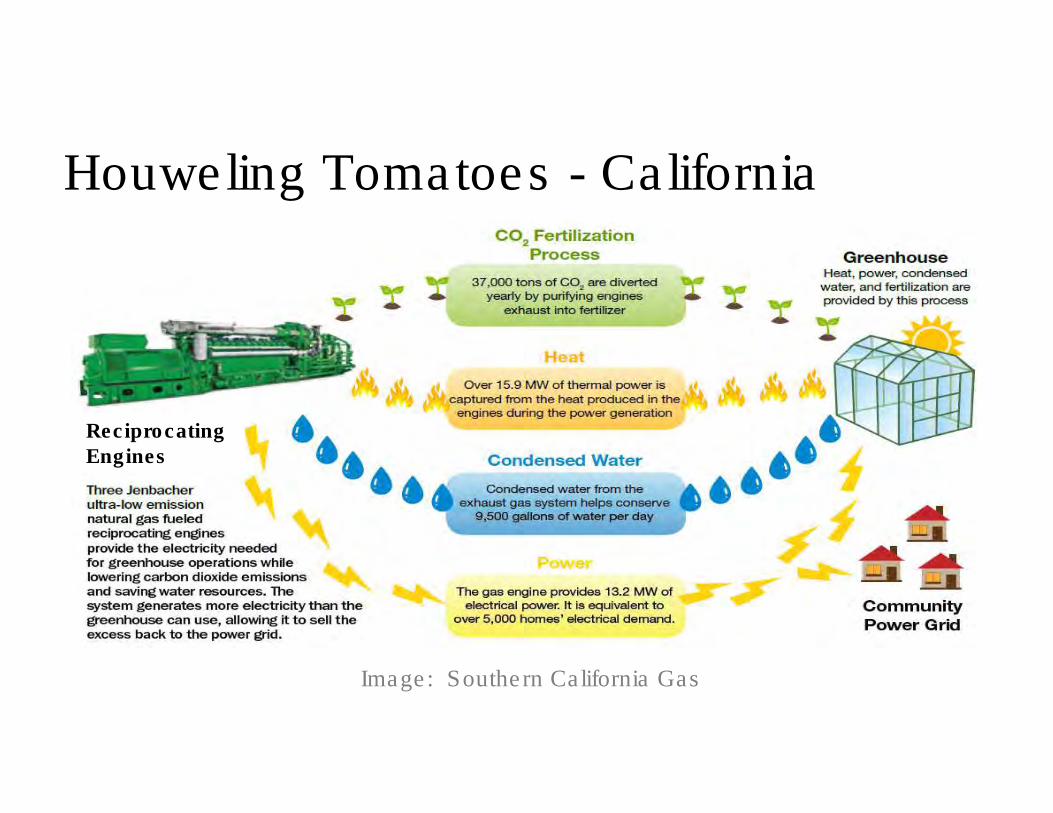
Houweling Tomatoes - California
Image: Southern California Gas
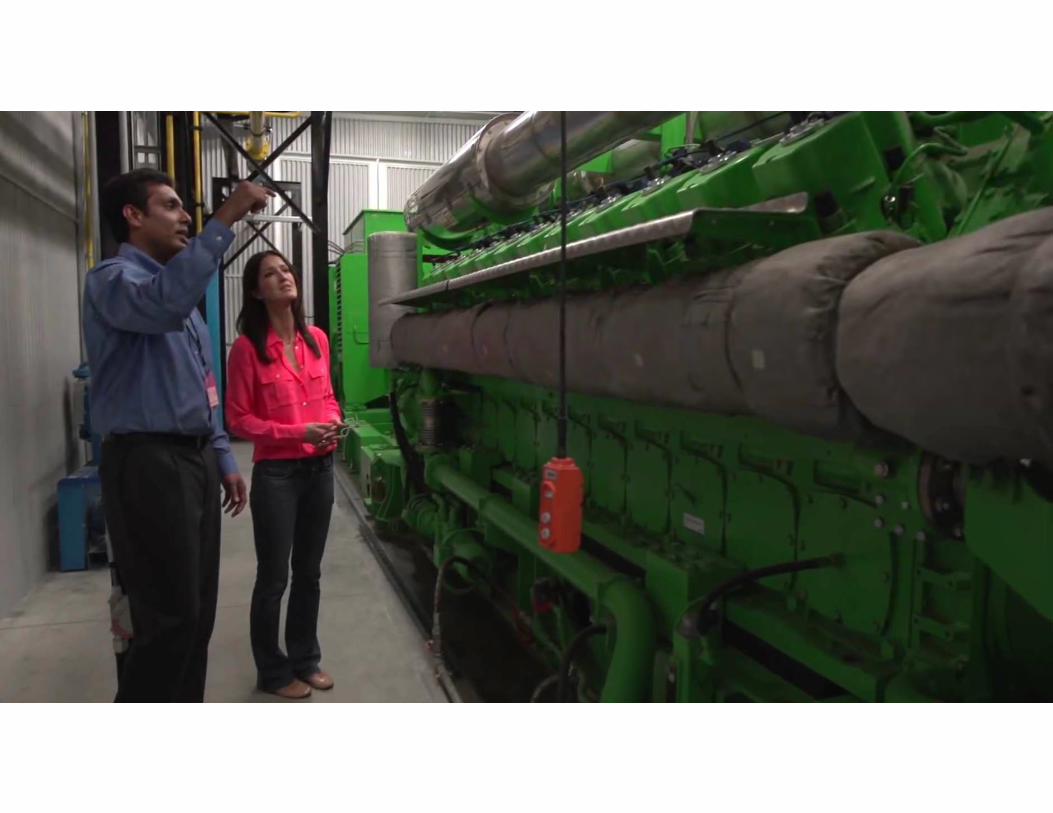
Reciprocating Engines
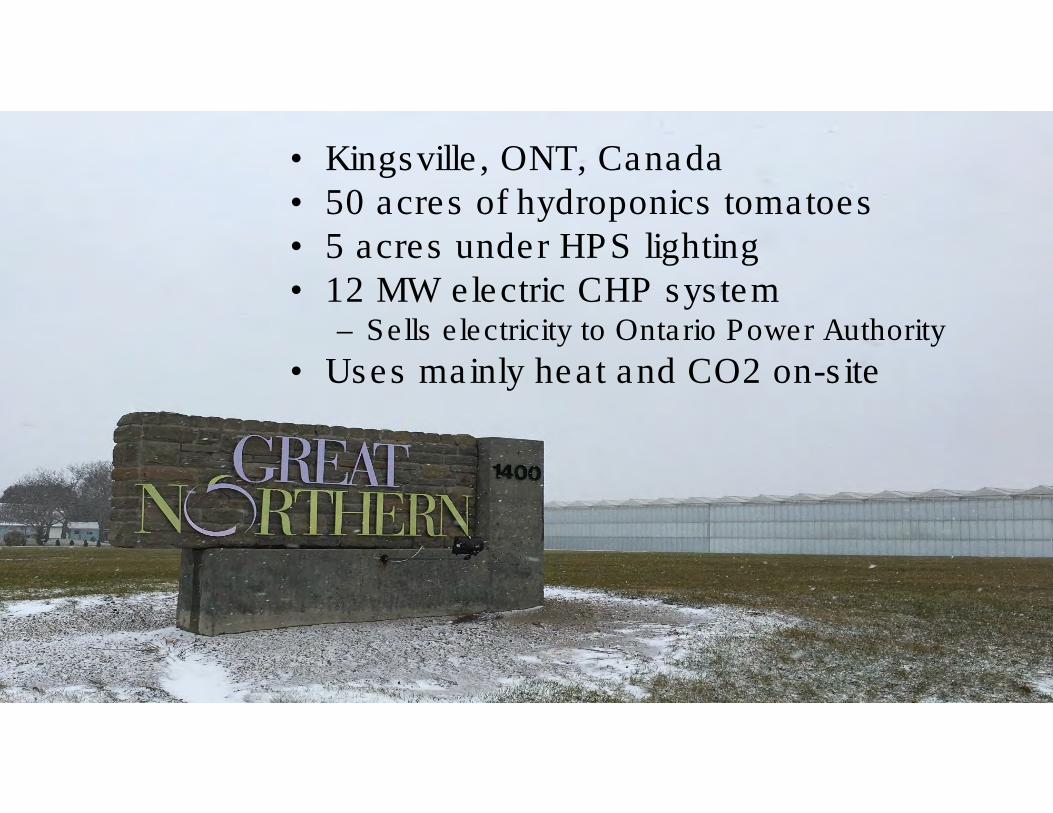
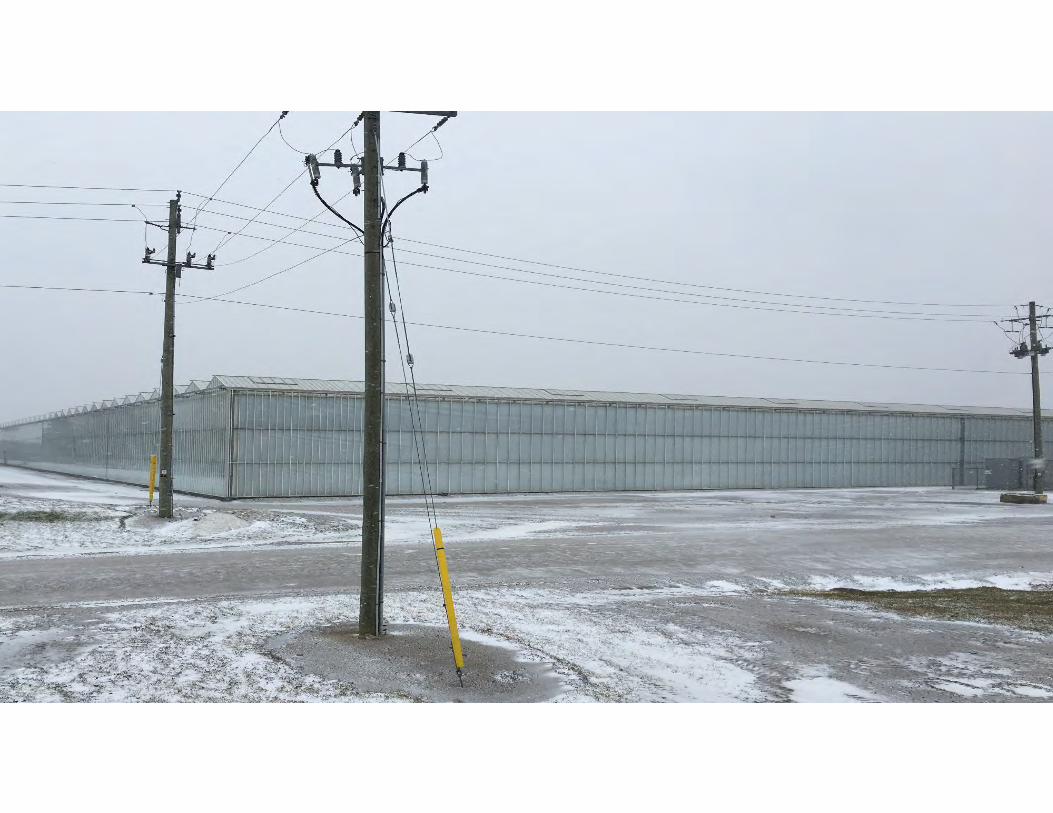
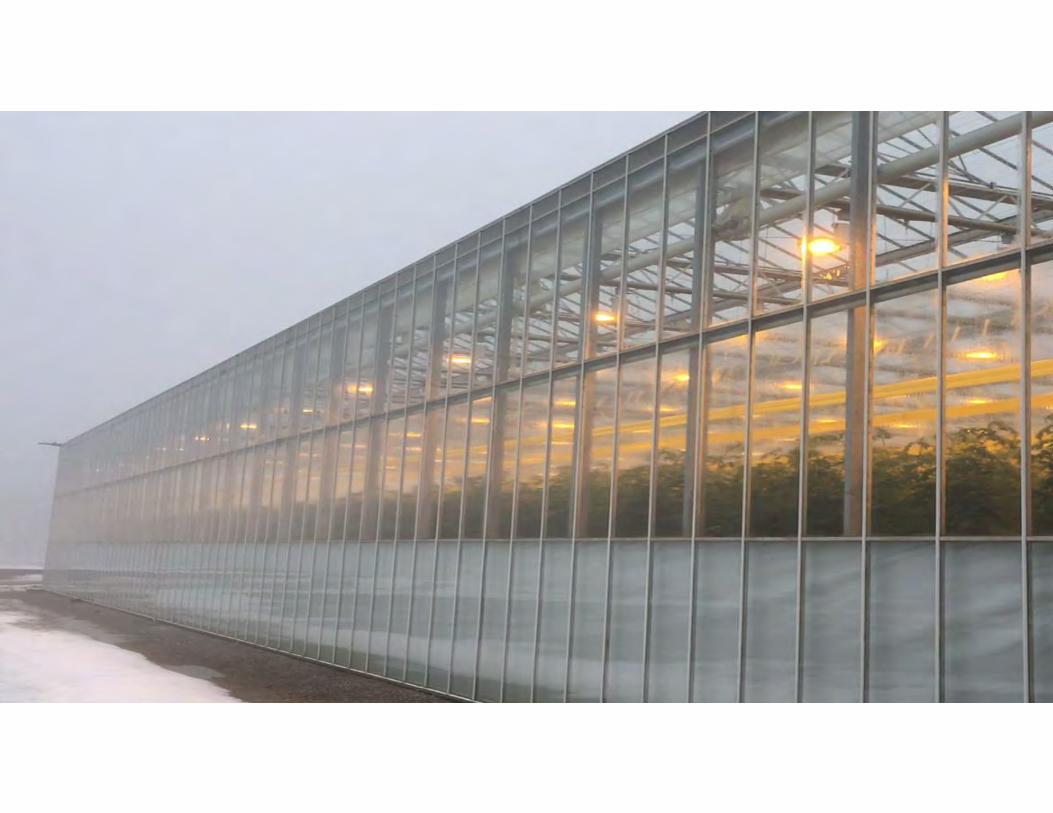
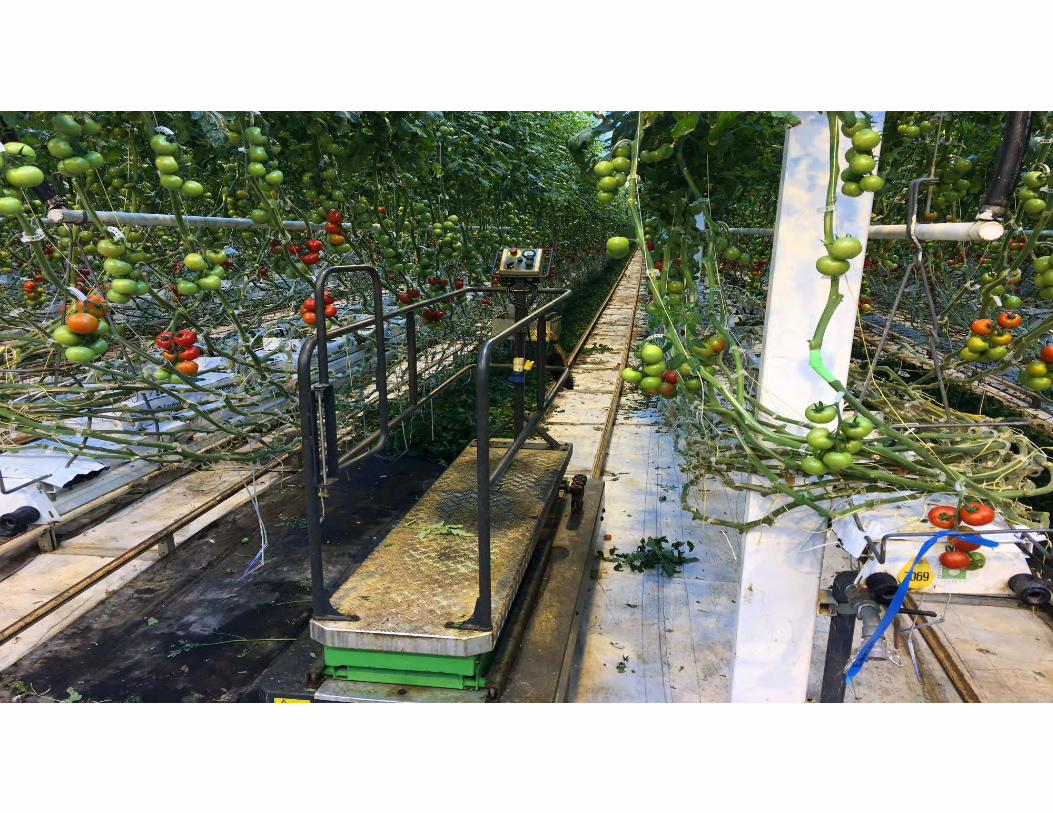
• Kingsville, ONT, Canada• 50 acres of hydroponics tomatoes• 5 acres under HPS lighting• 12 MW electric CHP system
– Sells electricity to Ontario Power Authority
• Uses mainly heat and CO2 on-site
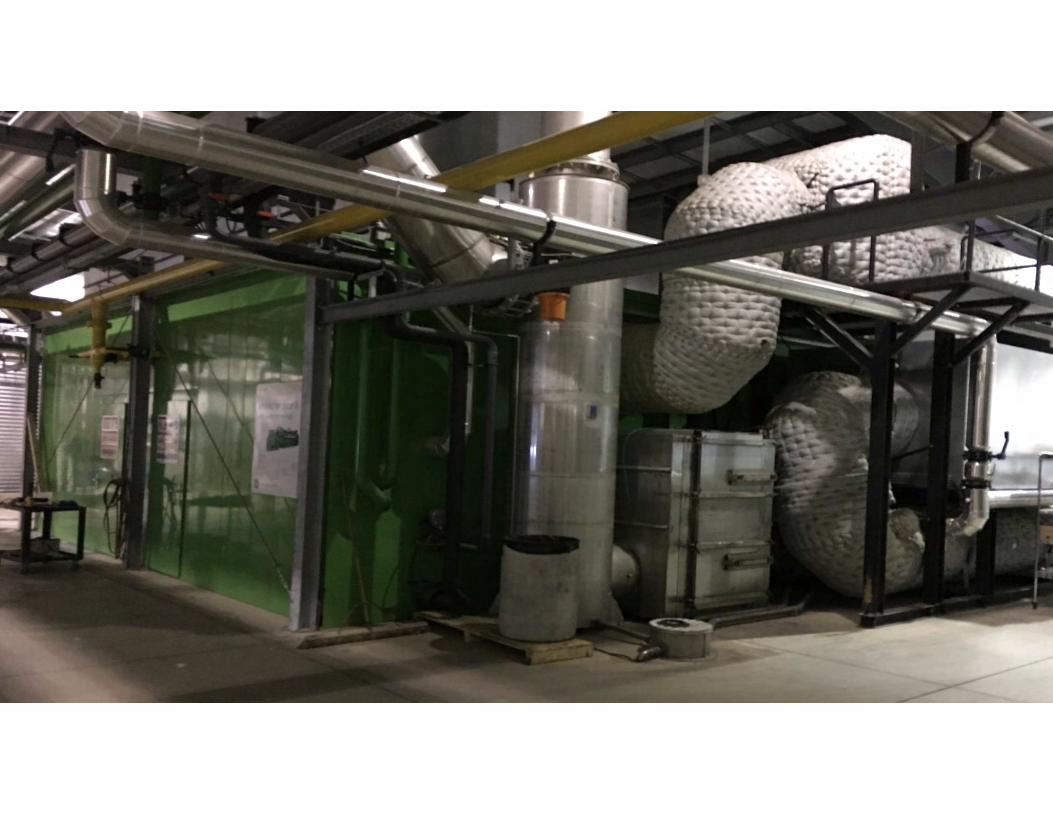
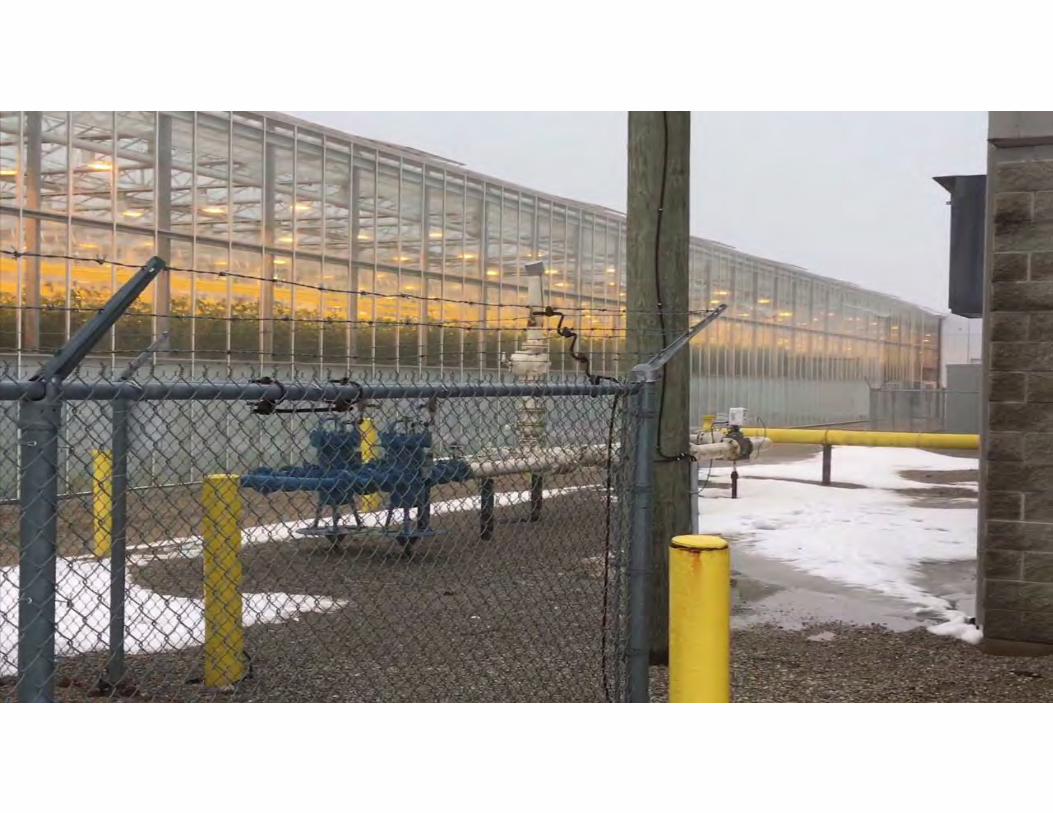
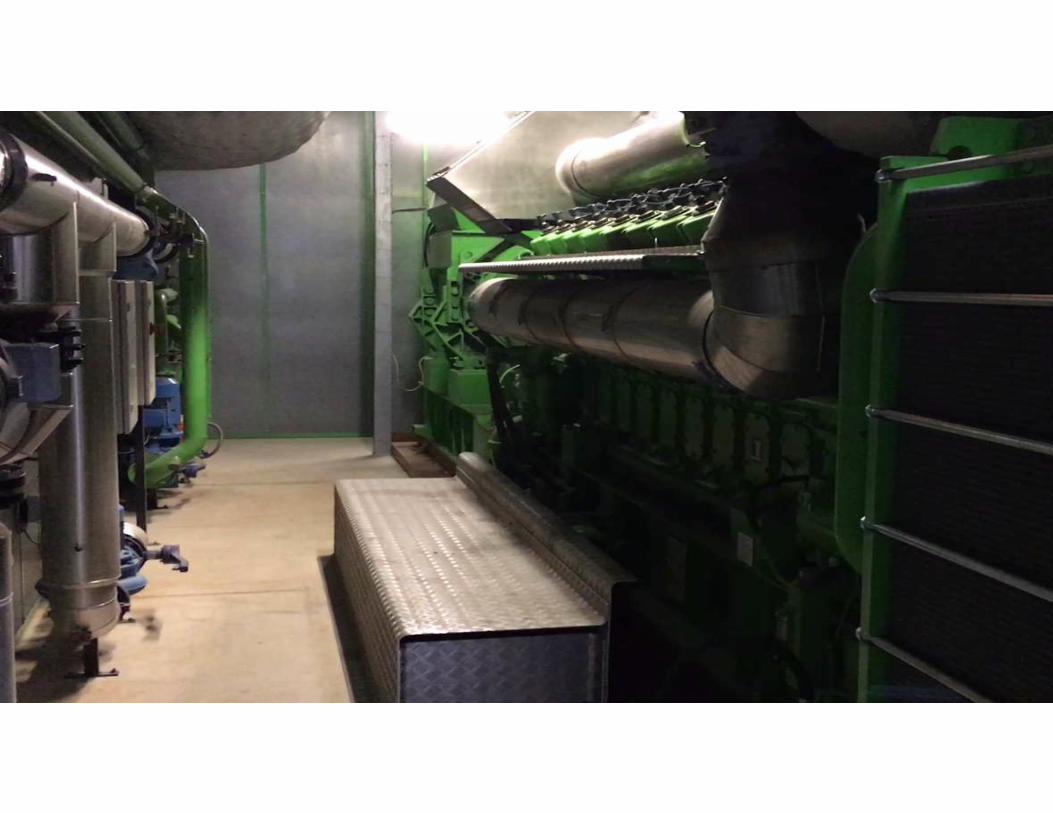
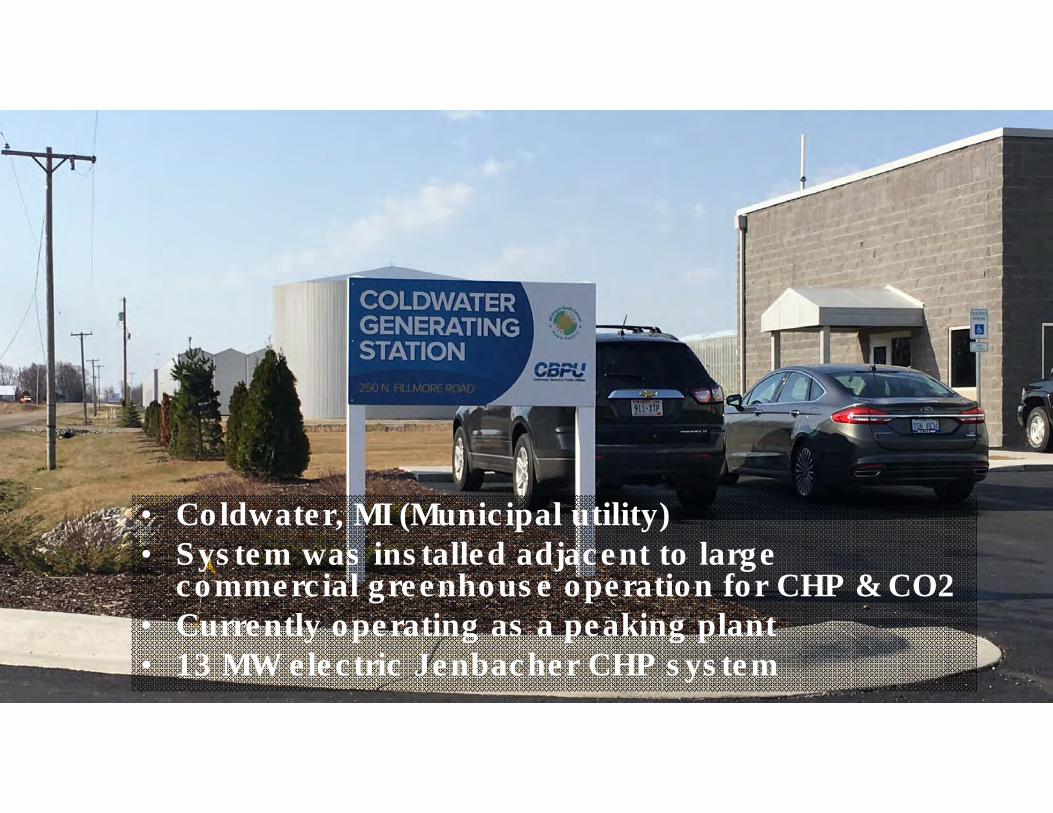
• Coldwater, MI (Municipal utility)• System was installed adjacent to large
commercial greenhouse operation for CHP & CO2 • Currently operating as a peaking plant• 13 MW electric Jenbacher CHP system
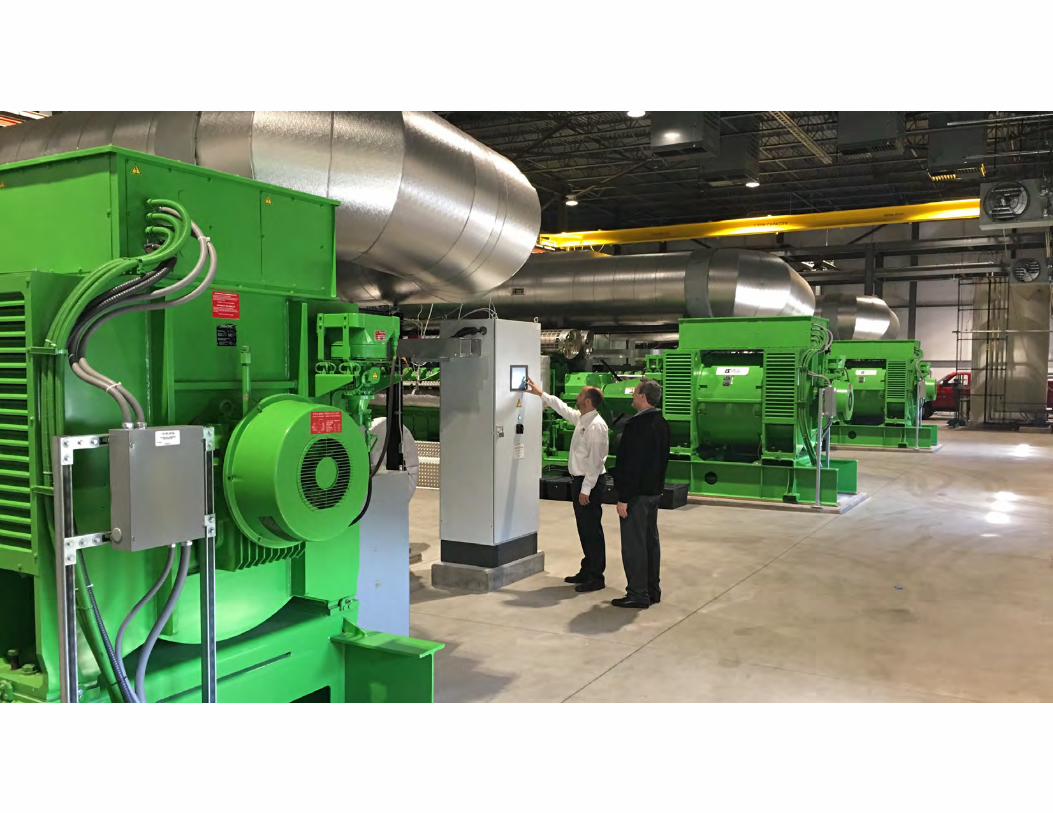
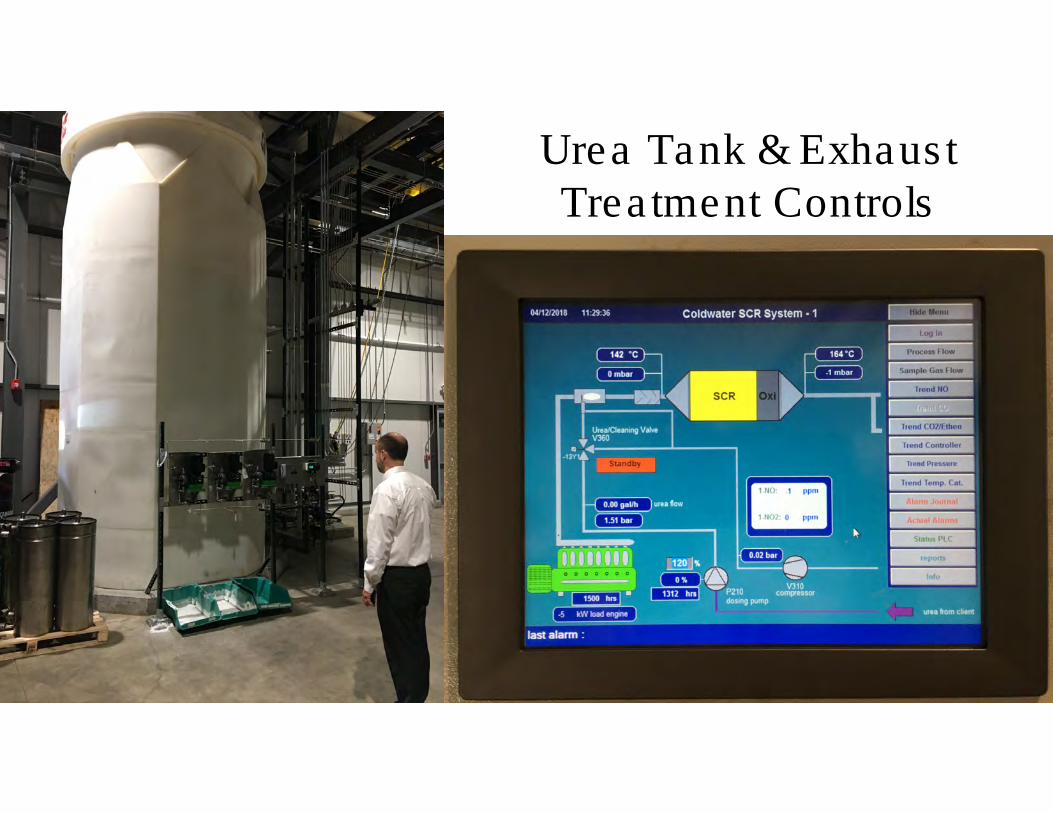
Urea Tank & Exhaust Treatment Controls
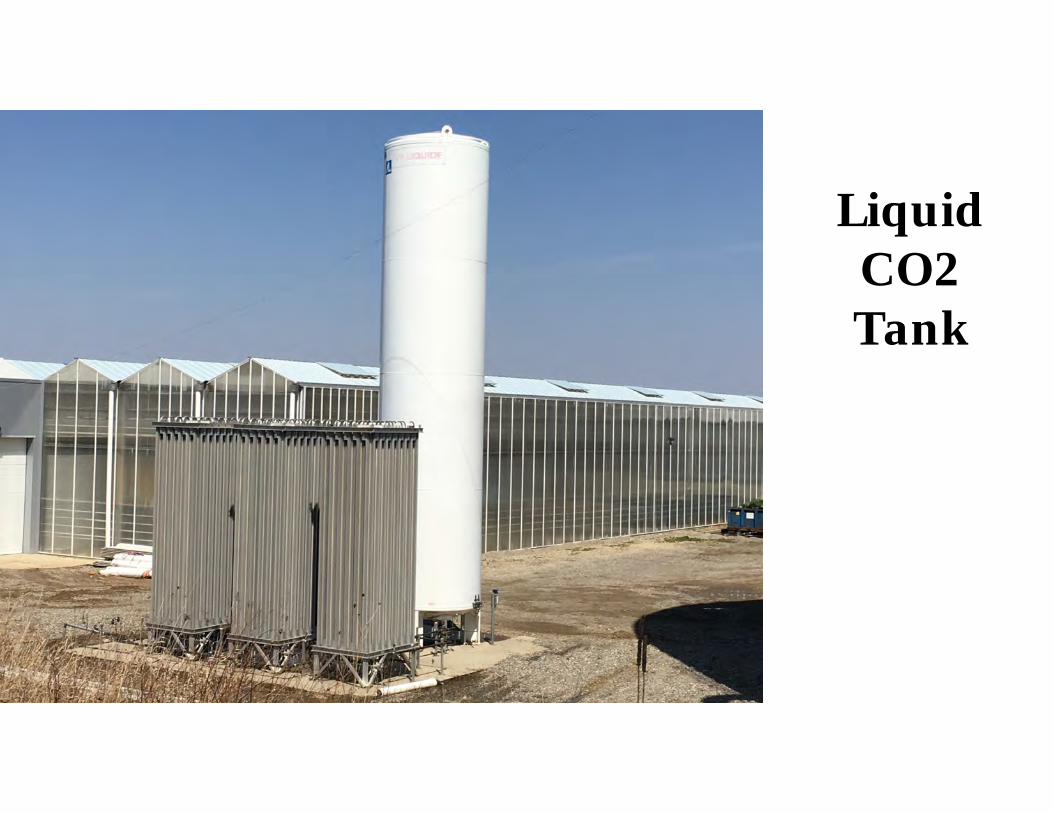
Liquid CO2Tank
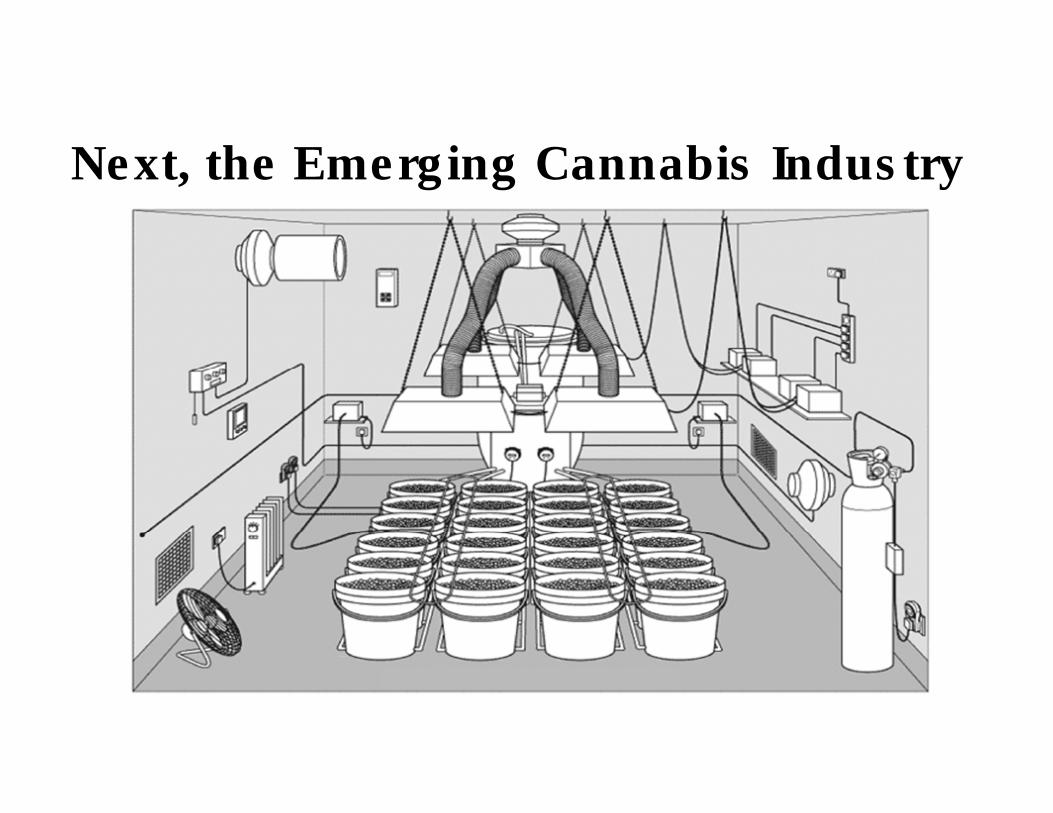
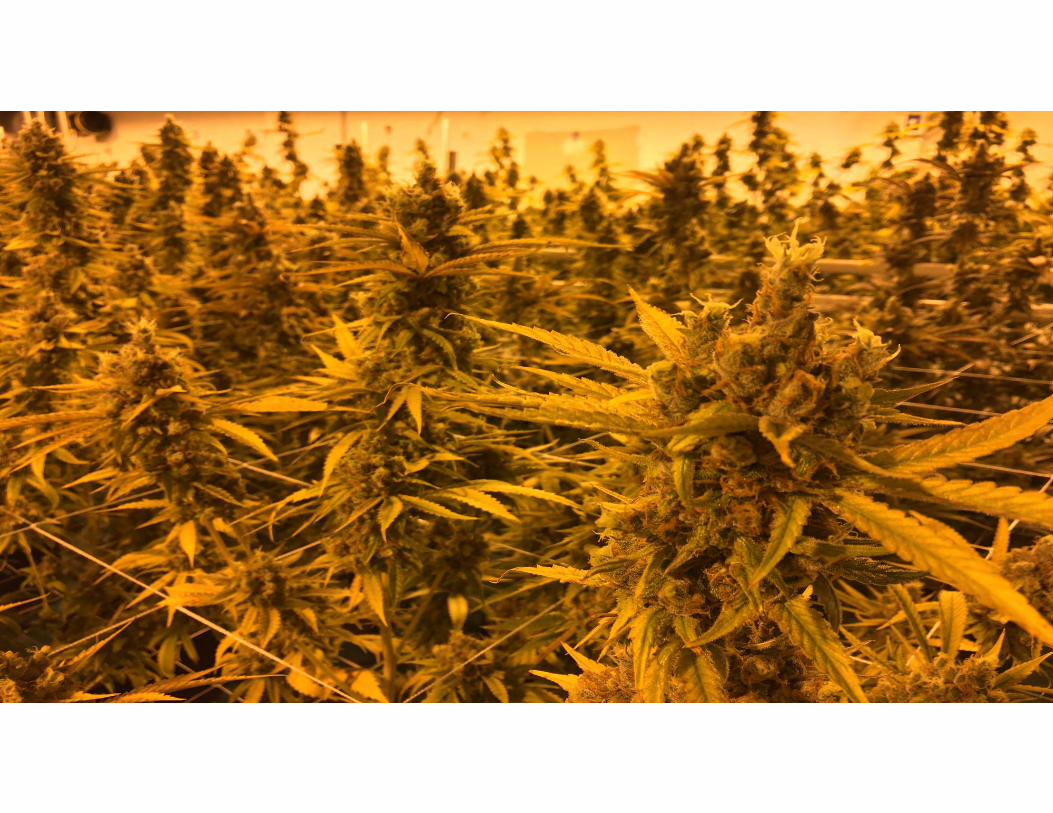
Next, the Emerging Cannabis Industry
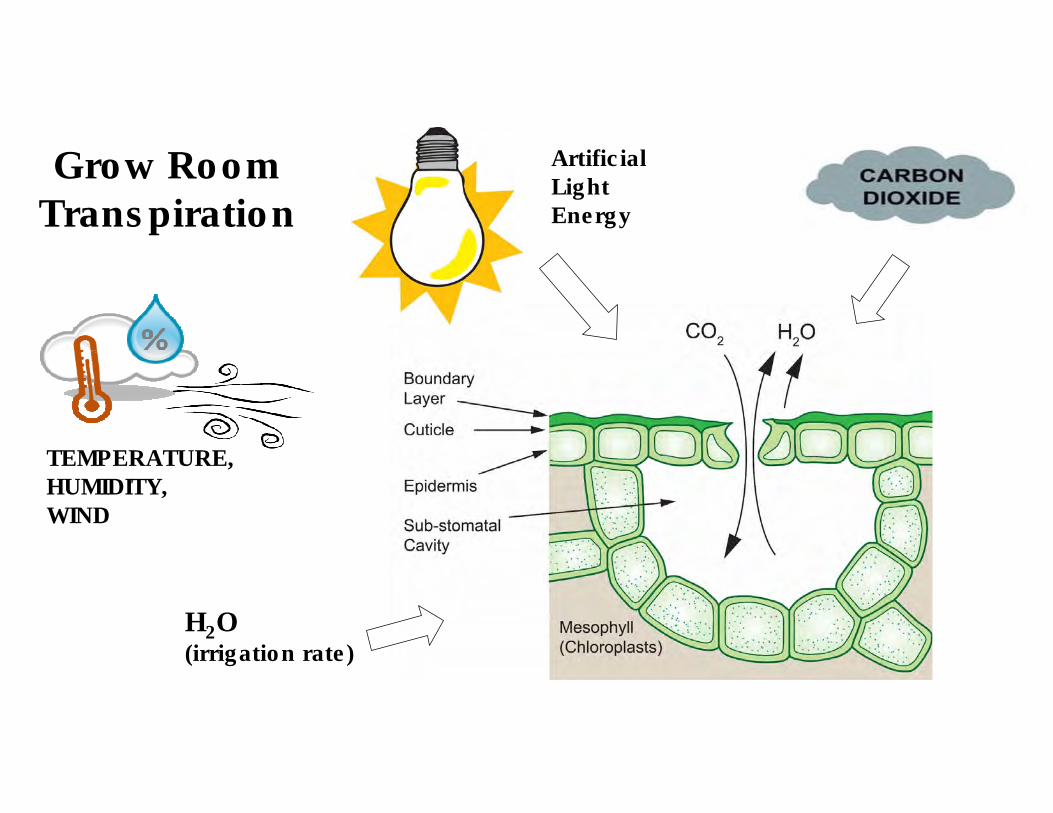
TEMPERATURE,HUMIDITY,WIND
Artificial Light Energy
H2O(irrigation rate)
Grow Room Transpiration
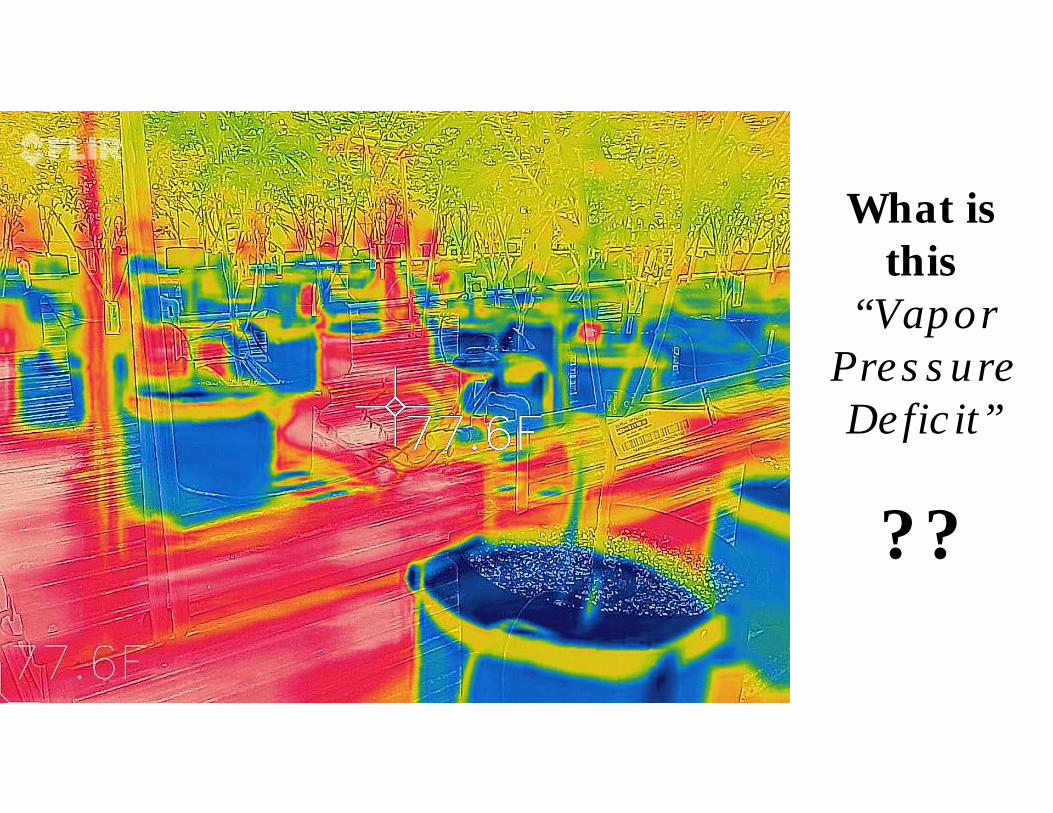
What is this
“Vapor
Pressure
Deficit”
??
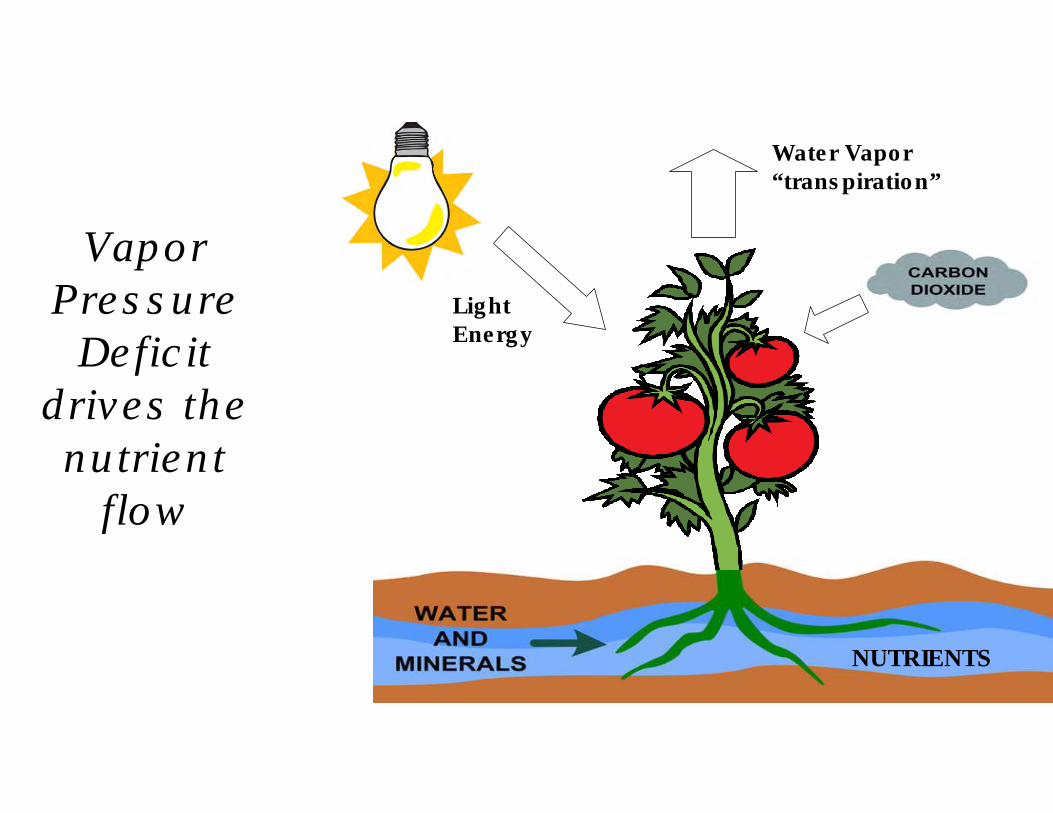
Light Energy
NUTRIENTS
Vapor
Pressure
Deficit
drives the
nutrient
flow
Water Vapor“transpiration”
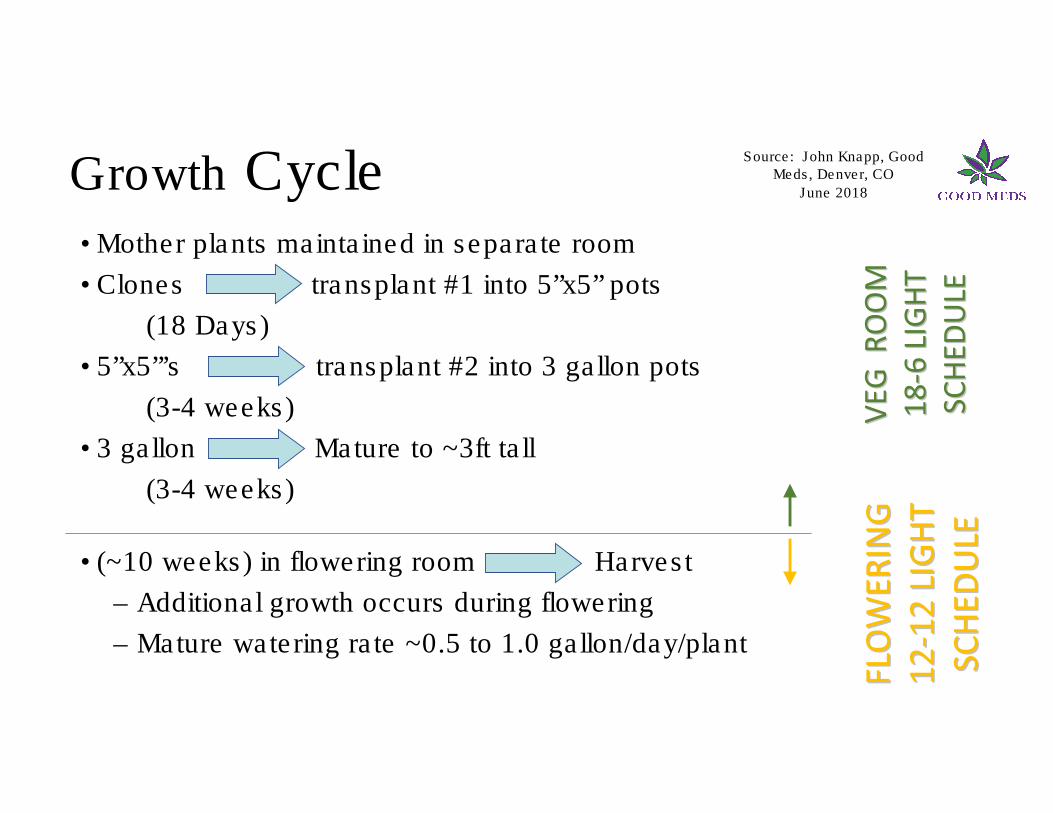
Growth Cycle• Mother plants maintained in separate room
• Clones transplant #1 into 5”x5” pots
(18 Days)
• 5”x5”’s transplant #2 into 3 gallon pots
(3-4 weeks)
• 3 gallon Mature to ~3ft tall
(3-4 weeks)
• (~10 weeks) in flowering room Harvest
– Additional growth occurs during flowering
– Mature watering rate ~0.5 to 1.0 gallon/day/plant
VE
G
RO
OM
VE
G
RO
OM
18
18
-- 6 L
IGH
T
6 L
IGH
T
SC
HE
DU
LE
SC
HE
DU
LE
FLO
WE
RIN
GF
LO
WE
RIN
G
12
12
-- 12
LIG
HT
12
LIG
HT
SC
HE
DU
LE
SC
HE
DU
LE
Source: John Knapp, Good Meds, Denver, CO
June 2018

John KnappExecutive
Manager
and Owner
Good Meds
Denver, CO
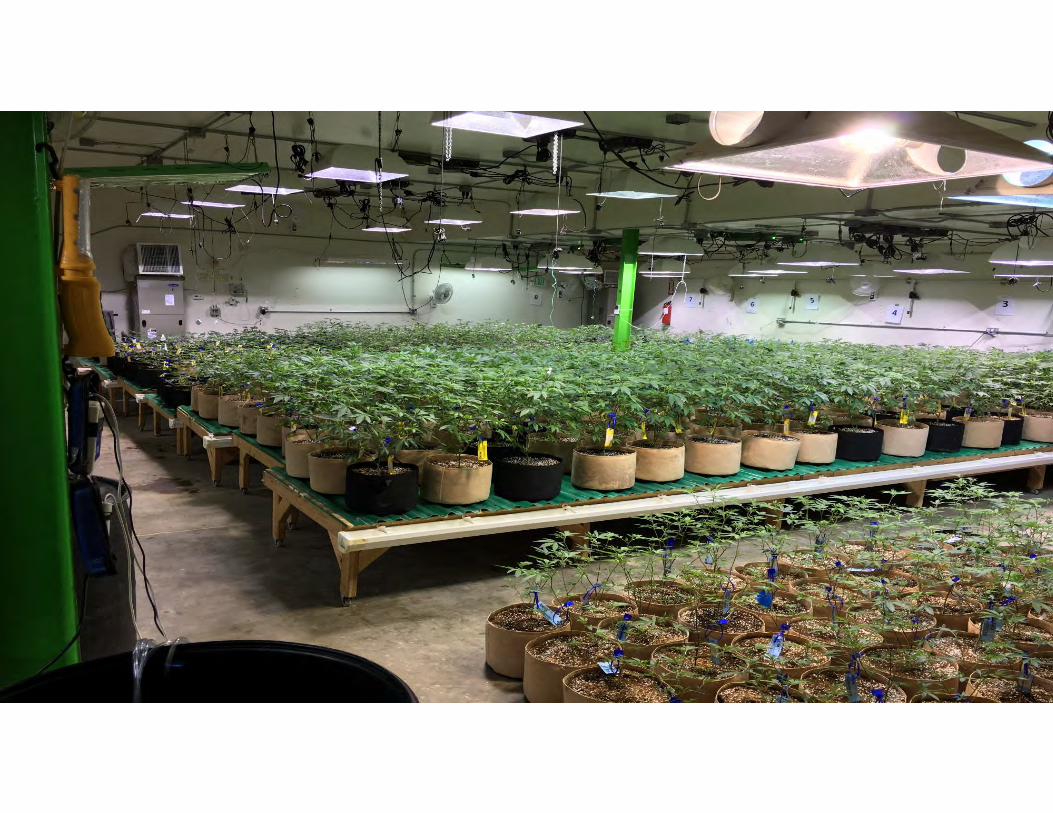
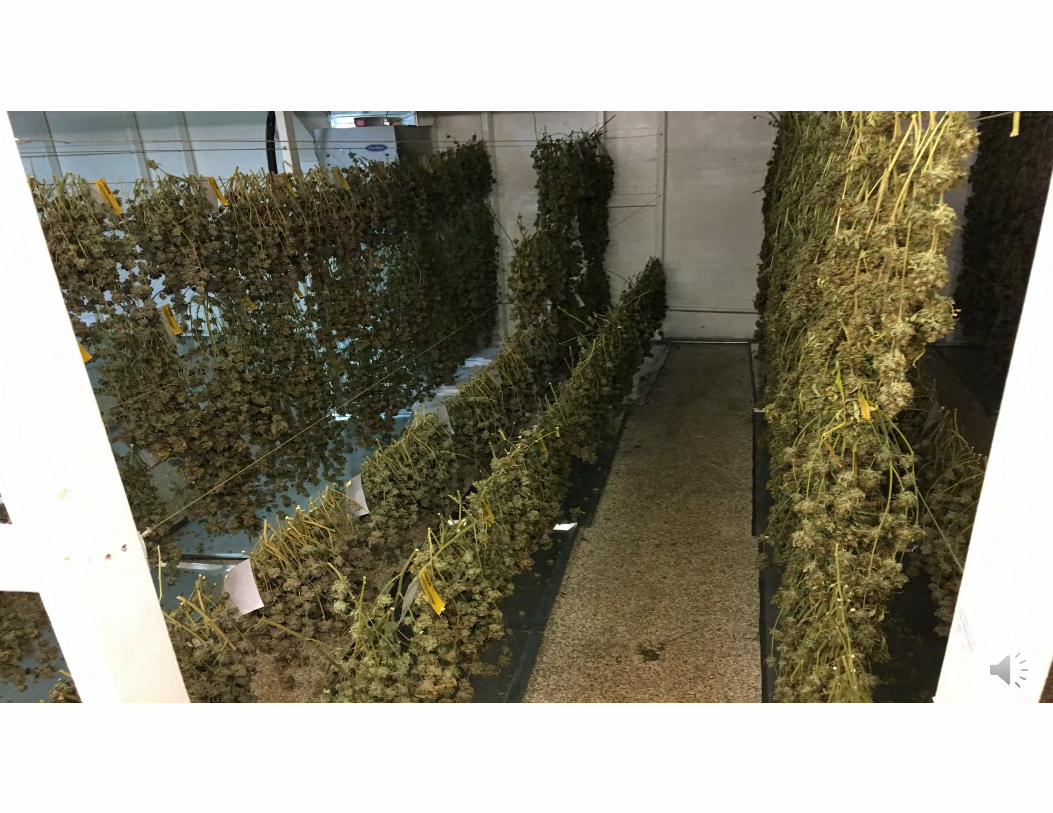
Good Meds: Cannabis Operation – Warehouse Retrofit
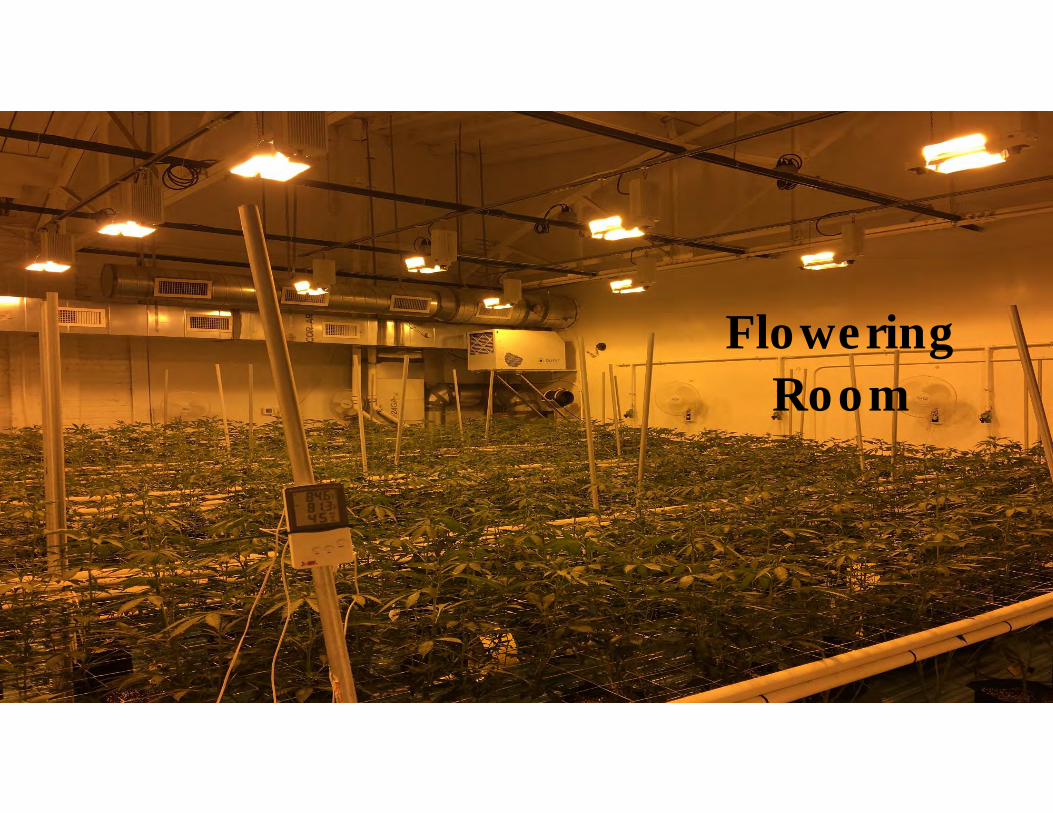
Flowering
Room
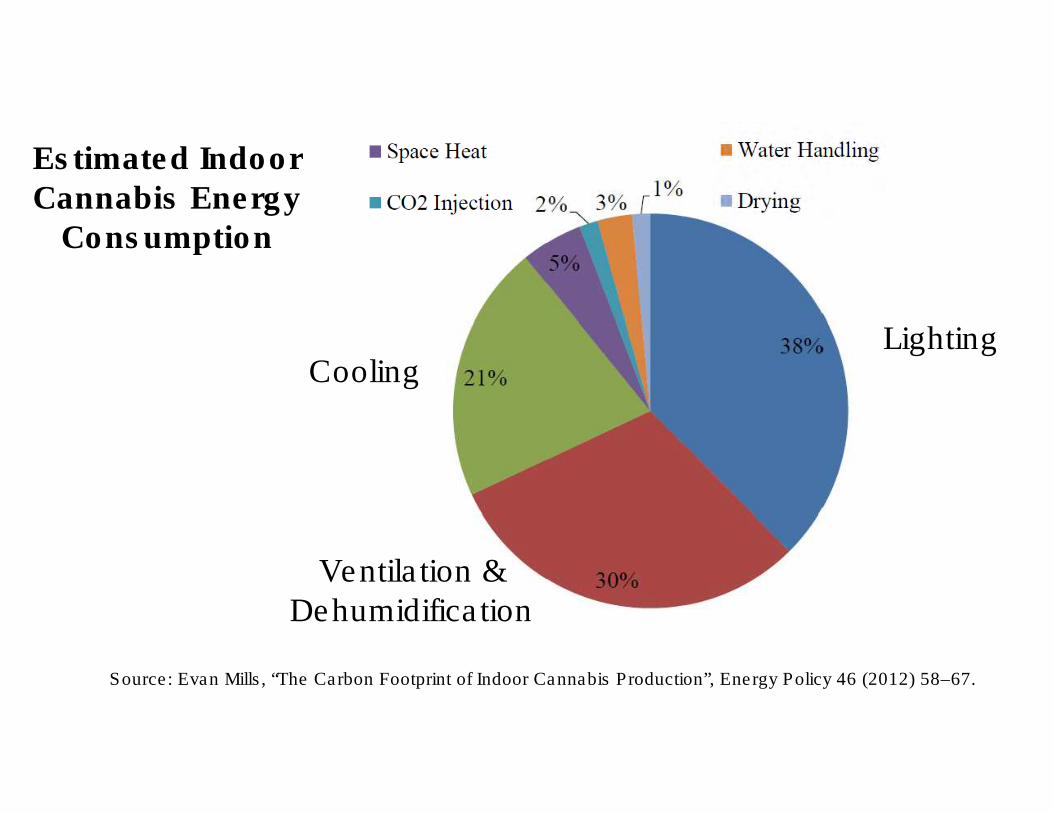
Source: Evan Mills, “The Carbon Footprint of Indoor Cannabis Production”, Energy Policy 46 (2012) 58–67.
Cooling
Ventilation & Dehumidification
Lighting
Estimated IndoorCannabis Energy
Consumption
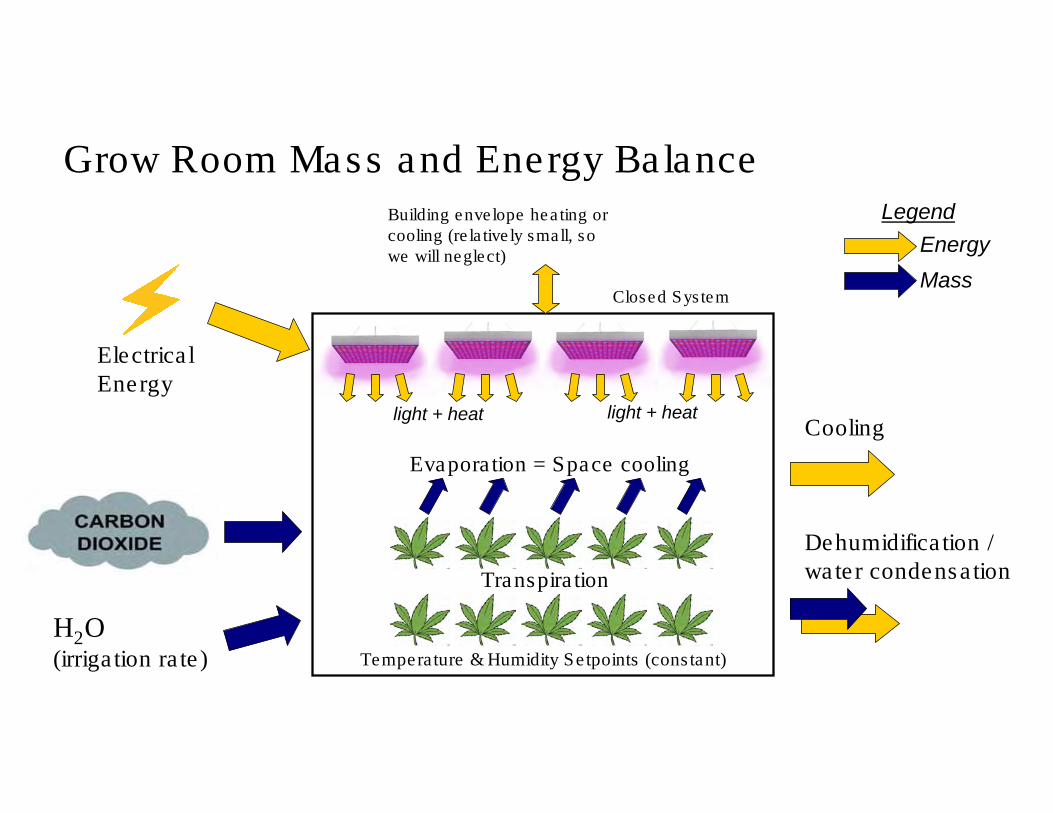
Temperature & Humidity Setpoints (constant)
H2O(irrigation rate)
Grow Room Mass and Energy Balance
Dehumidification / water condensation
Cooling
Building envelope heating or cooling (relatively small, so we will neglect)
Closed System
Evaporation = Space cooling
Legend
Energy
Mass
Transpiration
Electrical Energy
light + heat light + heat
Temperature & Humidity Setpoints (constant)
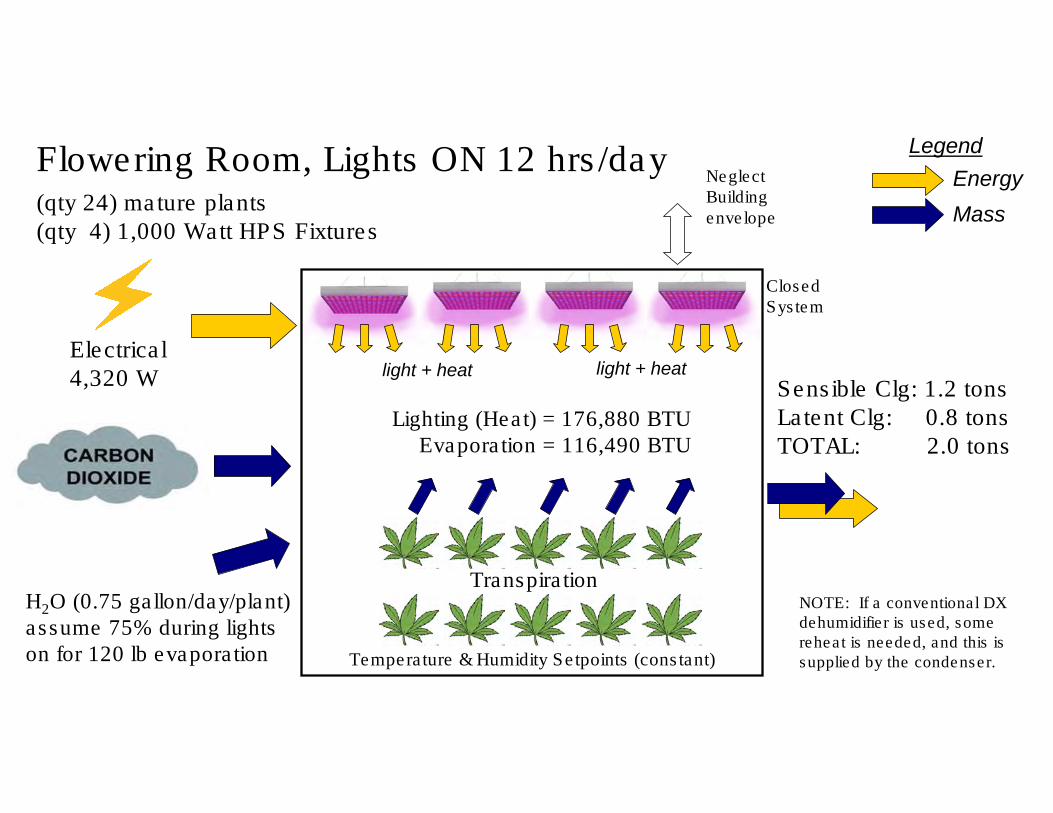
H2O (0.75 gallon/day/plant)assume 75% during lights on for 120 lb evaporation
Flowering Room, Lights ON 12 hrs/day
Sensible Clg: 1.2 tonsLatent Clg: 0.8 tonsTOTAL: 2.0 tons
Neglect Buildingenvelope
ClosedSystem
Legend
Energy
Mass
Transpiration
Lighting (Heat) = 176,880 BTUEvaporation = 116,490 BTU
Electrical 4,320 W light + heat light + heat
(qty 24) mature plants(qty 4) 1,000 Watt HPS Fixtures
NOTE: If a conventional DX dehumidifier is used, some reheat is needed, and this is supplied by the condenser.
Temperature & Humidity Setpoints (constant)
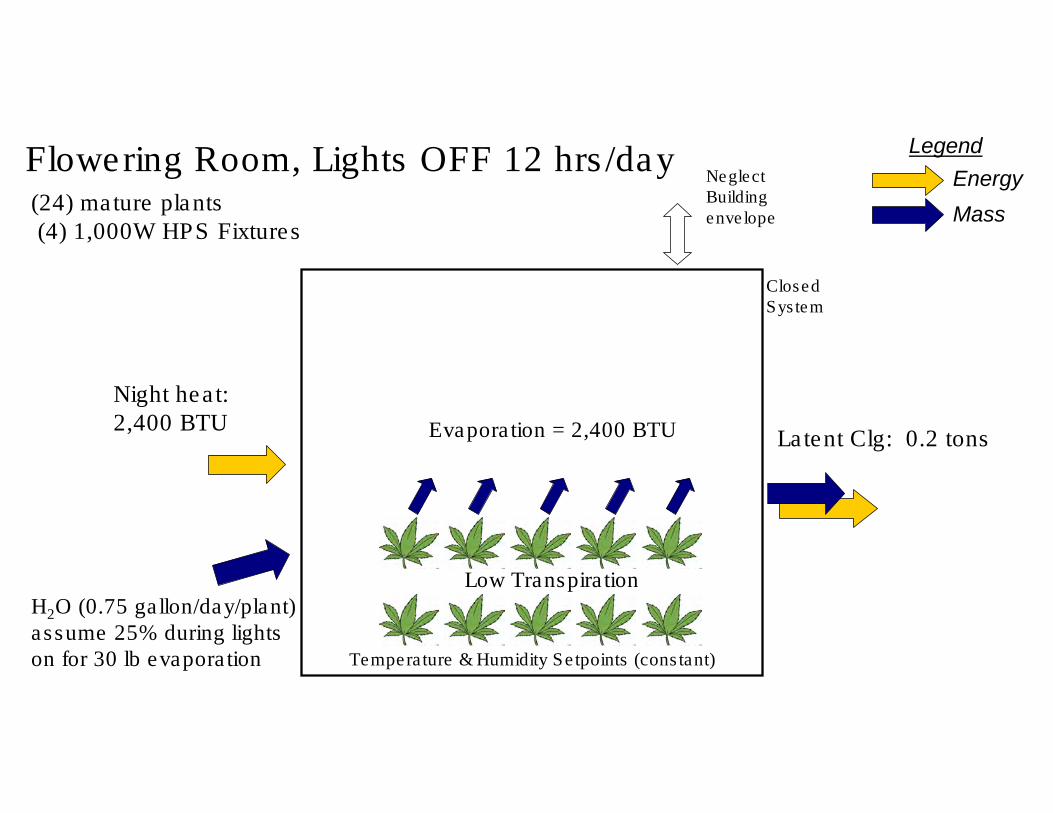
H2O (0.75 gallon/day/plant)assume 25% during lights on for 30 lb evaporation
Flowering Room, Lights OFF 12 hrs/day
Latent Clg: 0.2 tons
Neglect Buildingenvelope
ClosedSystem
Legend
Energy
Mass
Low Transpiration
Evaporation = 2,400 BTU
(24) mature plants(4) 1,000W HPS Fixtures
Night heat: 2,400 BTU
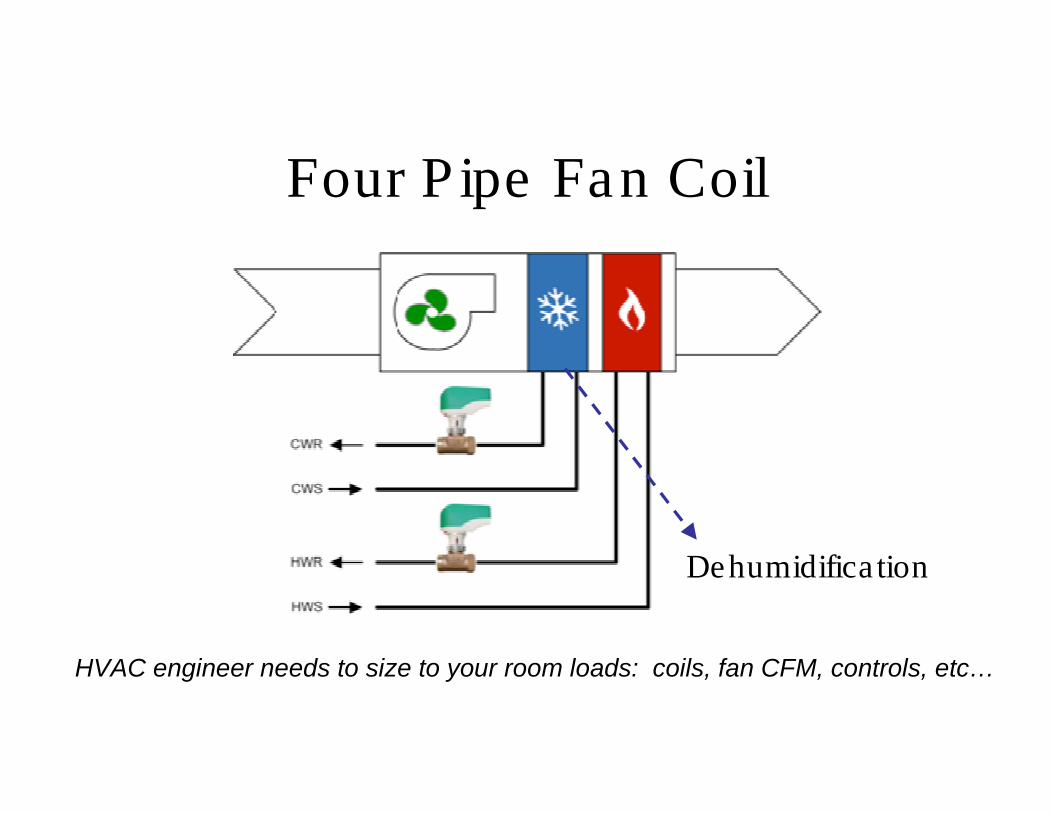
Four Pipe Fan Coil
Dehumidification
HVAC engineer needs to size to your room loads: coils, fan CFM, controls, etc…
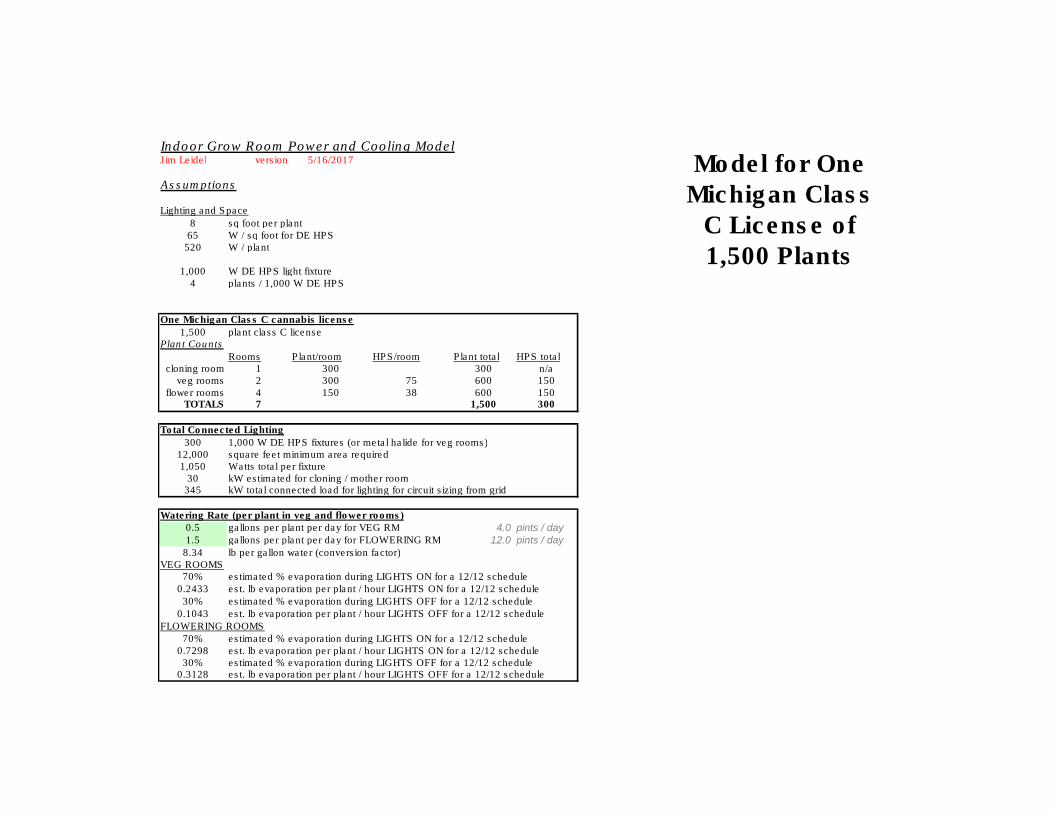
Indoor Grow Room Power and Cooling ModelJim Leidel version 5/16/2017
Assumptions Lighting Schedules 18/6 18/6 12/12 12/12 12/12 12/12
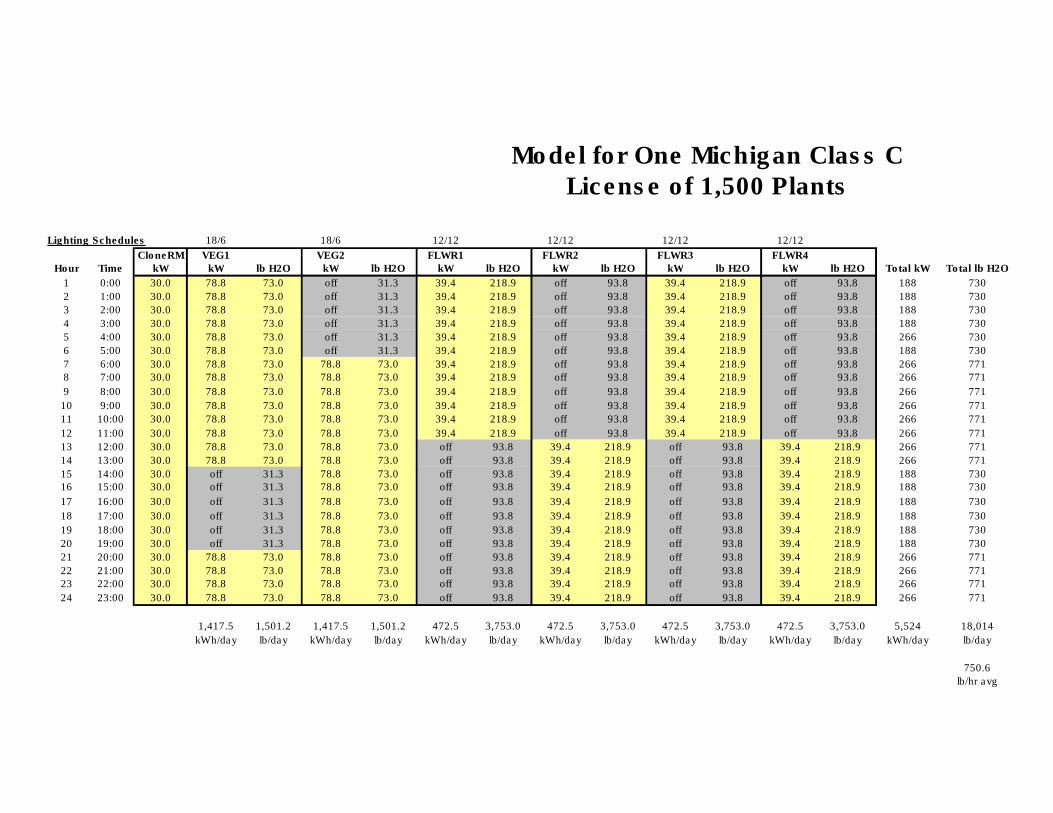
CloneRM VEG1 VEG2 FLWR1 FLWR2 FLWR3 FLWR4 Lighting Loads to Size CHP Notes:Lighting and Space Hour Time kW kW lb H2O kW lb H2O kW lb H2O kW lb H2O kW lb H2O kW lb H2O Total kW Total lb H2O Lighting total connected load 345 kW total for electrical circuit sizing, NOT CHP sizing
8 sq foot per plant 1 0:00 30.0 78.8 73.0 off 31.3 39.4 218.9 off 93.8 39.4 218.9 off 93.8 188 730 Max Lighting Power Load 266 kW max largest value from Total kW column X from lighting schedules65 W / sq foot for DE HPS 2 1:00 30.0 78.8 73.0 off 31.3 39.4 218.9 off 93.8 39.4 218.9 off 93.8 188 730 Add'l Power (pumps, fans, clone rm., etc...) 20% increase percentage for more safety factor520 W / plant 3 2:00 30.0 78.8 73.0 off 31.3 39.4 218.9 off 93.8 39.4 218.9 off 93.8 188 730 Add'l Power (pumps, fans, clone rm., etc...) 53 kW
4 3:00 30.0 78.8 73.0 off 31.3 39.4 218.9 off 93.8 39.4 218.9 off 93.8 188 730 Total Est. Power 320 kW total CHP load under full production, to minimum CHP capacity1,000 W DE HPS light fixture 5 4:00 30.0 78.8 73.0 off 31.3 39.4 218.9 off 93.8 39.4 218.9 off 93.8 266 730
4 plants / 1,000 W DE HPS 6 5:00 30.0 78.8 73.0 off 31.3 39.4 218.9 off 93.8 39.4 218.9 off 93.8 188 730 CHP units (sized to load) 2 recommend 2-3 units minimum for redundancy7 6:00 30.0 78.8 73.0 78.8 73.0 39.4 218.9 off 93.8 39.4 218.9 off 93.8 266 771 CHP uint size each 160 kW8 7:00 30.0 78.8 73.0 78.8 73.0 39.4 218.9 off 93.8 39.4 218.9 off 93.8 266 771 Extra redundant unit (+1) 160 kW one additional unit for maintenance and redundancy
One Michigan Class C cannabis license 9 8:00 30.0 78.8 73.0 78.8 73.0 39.4 218.9 off 93.8 39.4 218.9 off 93.8 266 771
1,500 plant class C license 10 9:00 30.0 78.8 73.0 78.8 73.0 39.4 218.9 off 93.8 39.4 218.9 off 93.8 266 771 Total Number of CHP units 3 number of CHP units (the base number +1)Plant Counts 11 10:00 30.0 78.8 73.0 78.8 73.0 39.4 218.9 off 93.8 39.4 218.9 off 93.8 266 771 CHP unit size each 160
Rooms Plant/room HPS/room Plant total HPS total 12 11:00 30.0 78.8 73.0 78.8 73.0 39.4 218.9 off 93.8 39.4 218.9 off 93.8 266 771 Total CHP plant capacity (including +1) 479 total CHP plant capacity including the +1cloning room 1 300 300 n/a 13 12:00 30.0 78.8 73.0 78.8 73.0 off 93.8 39.4 218.9 off 93.8 39.4 218.9 266 771
veg rooms 2 300 75 600 150 14 13:00 30.0 78.8 73.0 78.8 73.0 off 93.8 39.4 218.9 off 93.8 39.4 218.9 266 771 CHP Plant Thermal Output Calculations
flower rooms 4 150 38 600 150 15 14:00 30.0 off 31.3 78.8 73.0 off 93.8 39.4 218.9 off 93.8 39.4 218.9 188 730 CHP unit electrical output 320 kWTOTALS 7 1,500 300 16 15:00 30.0 off 31.3 78.8 73.0 off 93.8 39.4 218.9 off 93.8 39.4 218.9 188 730 CHP unit electrical efficiency 35.0%
17 16:00 30.0 off 31.3 78.8 73.0 off 93.8 39.4 218.9 off 93.8 39.4 218.9 188 730 CHP natural gas fuel input 913 kW
Total Connected Lighting 18 17:00 30.0 off 31.3 78.8 73.0 off 93.8 39.4 218.9 off 93.8 39.4 218.9 188 730 CHP natural gas input 3.11 MMBTU/hr natural gas fuel required at full load300 1,000 W DE HPS fixtures (or metal halide for veg rooms) 19 18:00 30.0 off 31.3 78.8 73.0 off 93.8 39.4 218.9 off 93.8 39.4 218.9 188 730 CHP natural gas input 3.11 MCF/hr natural gas fuel required at full load
12,000 square feet minimum area required 20 19:00 30.0 off 31.3 78.8 73.0 off 93.8 39.4 218.9 off 93.8 39.4 218.9 188 730 CHP thermal efficiency 45.0% assumed thermal HW heat recovery efficiency1,050 Watts total per fixture 21 20:00 30.0 78.8 73.0 78.8 73.0 off 93.8 39.4 218.9 off 93.8 39.4 218.9 266 771 CHP thermal output 1.40 MMBTU/hr hot water output for use in absorption chillers and heating coils.
30 kW estimated for cloning / mother room 22 21:00 30.0 78.8 73.0 78.8 73.0 off 93.8 39.4 218.9 off 93.8 39.4 218.9 266 771345 kW total connected load for lighting for circuit sizing from grid 23 22:00 30.0 78.8 73.0 78.8 73.0 off 93.8 39.4 218.9 off 93.8 39.4 218.9 266 771 typical single effect absorption chiller 0.70 COP coeficient of performance of thermally activated chiller
24 23:00 30.0 78.8 73.0 78.8 73.0 off 93.8 39.4 218.9 off 93.8 39.4 218.9 266 771 max possible absorption chiller capacity 0.98 MMBTU/hr
Watering Rate (per plant in veg and flower rooms) max possible absorption chiller capacity 82 tons max chiller tonnage that the CHP free waste heat can provide0.5 gallons per plant per day for VEG RM 4.0 pints / day 1,417.5 1,501.2 1,417.5 1,501.2 472.5 3,753.0 472.5 3,753.0 472.5 3,753.0 472.5 3,753.0 5,524 18,014
1.5 gallons per plant per day for FLOWERING RM 12.0 pints / day kWh/day lb/day kWh/day lb/day kWh/day lb/day kWh/day lb/day kWh/day lb/day kWh/day lb/day kWh/day lb/day Lighting + Dehumidification Loads to Size Absorption Chiller
8.34 lb per gallon water (conversion factor) Sensible heating from lighting 320 kW all electrical energy from lights must be removed by coolingVEG ROOMS 750.6 Sensible heating from lighting 1,090,134 BTU / hr
70% estimated % evaporation during LIGHTS ON for a 12/12 schedule lb/hr avg Avg. irrigation rate 750.6 lb / hr water average rate of water evaporation from plants0.2433 est. lb evaporation per plant / hour LIGHTS ON for a 12/12 schedule Latent heat of evaporation 970 BTU / lb unt conversion of one pound of water into BTU's of cooling30% estimated % evaporation during LIGHTS OFF for a 12/12 schedule Evaporative cooling from water 728,082 BTU / hr total evaporative cooling effect from plants
0.1043 est. lb evaporation per plant / hour LIGHTS OFF for a 12/12 schedule Net sensible heating (lights - evap.) 362,052 BTU / hr net cooling requiredFLOWERING ROOMS Net sensible heating (lights - evap.) 30 tons one ton of cooling = 12,000 BTU / hour (melt a ton of ice / day)
70% estimated % evaporation during LIGHTS ON for a 12/12 schedule0.7298 est. lb evaporation per plant / hour LIGHTS ON for a 12/12 schedule Dehumidification chilled water load 728,082 BTU / hr from above evaporative cooling. All water must be condensed30% estimated % evaporation during LIGHTS OFF for a 12/12 schedule Dehumidification chilled water load 61 tons
0.3128 est. lb evaporation per plant / hour LIGHTS OFF for a 12/12 schedule Total chilled water load 91 tons
Number of chillers sized to meet load 2
Chiller size each (absorption) 45 tons
15 ft ceilings Extra redundant unit (+1) 45 tons
180,000 ft3 grow space air volume15% additial grow room working space Total Numbe of Chillers 3
207,000 ft3 TOTAL room volume Chiller size each (absorption) 45 tons
13.8 ft3 / lb dry air specific volume Total absorption chiller plant capacity 136 tons
15,000 lb mass of dry air, total in the grow volumeBoiler Sizing
320 kW electrical input Backup boiler (sized to run one absorber) 778,667 BTU / hr currently, boiler is sized for one absorber (need to discuss)1,090,134 BTU/hr electrical input heating 72.68 BTU/hr/lb 1.211 BTU/lb per minute 0.78 MMBTU/hr
728,082 BTU/hr evaporative cooling 48.54 BTU/hr/lb 0.809 BTU/lb per minute System Notes: 0.78 MCF/hr
750.6 lb H2O / hr evaporation 0.05 lb H2O/hr/lb 0.001 lb H2O/lb per minute 1. the proposed system is a hot water & chilled water hydronic Redundancy boiler for absorbers 1.56 MMBTU/hr
5,254,200 grains H2O / hr evaporation 350.28 grains/hr/lb 5.838 grains H2O / lb per minute 2. a four pipe fan coil (shown here) is the terminal unit for space clg, htg & dehumidificaiton Est approx. boiler size 1.00 MCF/hr362,052 BTU/hr net (positive = heating) 24.14 BTU/hr/lb net 0.402 BTU/lb per minute net 3. the CHP unit supplies power and heat and a hot water buffer tank is recommended
4. abosorption chillers use hot water to make chilled water5. a low chilled water setpoint in the range of 38 deg F is recommended for strong dehumid.6. an experienced HVAC engineer needs to size the FC's properly for proper dehumid.7. redundancy is recommended in the number of CHP units AND chillers8. a closed circuit cooling tower is recommended for low maintenace 9. closed circuit cooling tower should be a hybird evaporaitve / dry type10. a hot water boiler should be included to allow for redundancy and peak reheat/chiller loads
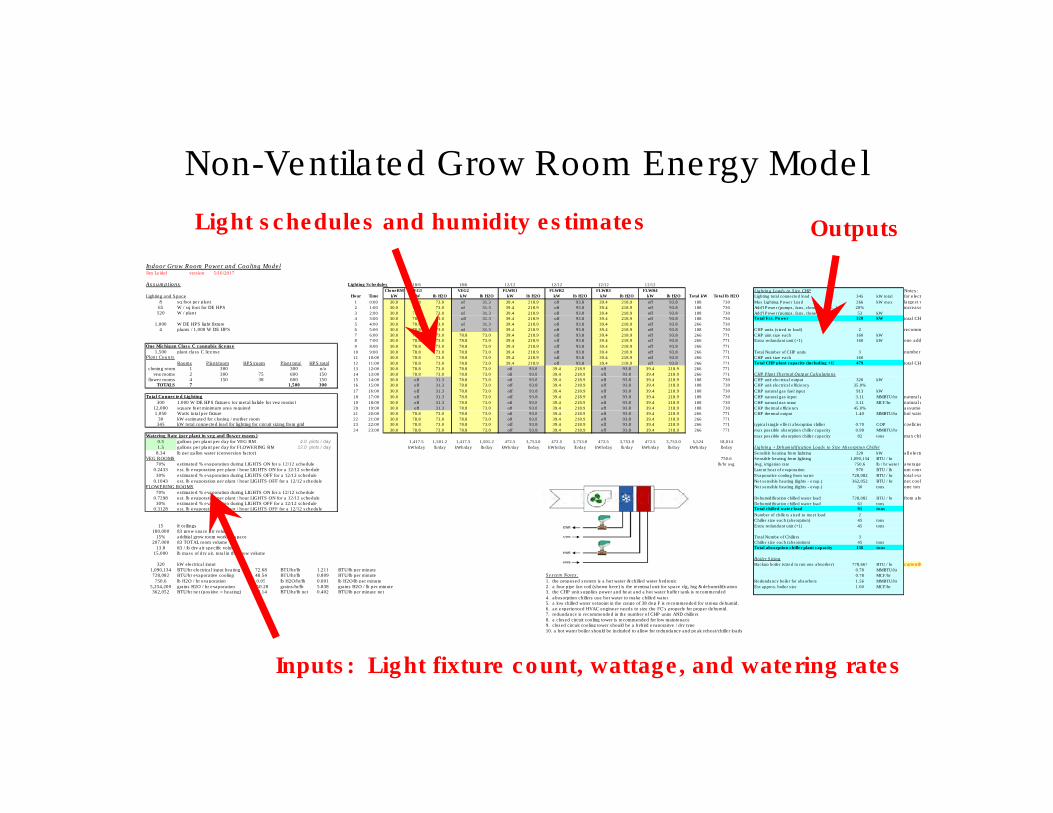
Non-Ventilated Grow Room Energy Model
Outputs
Inputs: Light fixture count, wattage, and watering rates
Light schedules and humidity estimates
Indoor Grow Room Power and Cooling ModelJim Leidel version 5/16/2017
Assumptions
Lighting and Space
8 sq foot per plant65 W / sq foot for DE HPS
520 W / plant
1,000 W DE HPS light fixture4 plants / 1,000 W DE HPS
One Michigan Class C cannabis license
1,500 plant class C licensePlant Counts
Rooms Plant/room HPS/room Plant total HPS totalcloning room 1 300 300 n/a
veg rooms 2 300 75 600 150flower rooms 4 150 38 600 150
TOTALS 7 1,500 300
Total Connected Lighting
300 1,000 W DE HPS fixtures (or metal halide for veg rooms)12,000 square feet minimum area required1,050 Watts total per fixture
30 kW estimated for cloning / mother room345 kW total connected load for lighting for circuit sizing from grid
Watering Rate (per plant in veg and flower rooms)0.5 gallons per plant per day for VEG RM 4.0 pints / day1.5 gallons per plant per day for FLOWERING RM 12.0 pints / day
8.34 lb per gallon water (conversion factor)VEG ROOMS
70% estimated % evaporation during LIGHTS ON for a 12/12 schedule0.2433 est. lb evaporation per plant / hour LIGHTS ON for a 12/12 schedule30% estimated % evaporation during LIGHTS OFF for a 12/12 schedule
0.1043 est. lb evaporation per plant / hour LIGHTS OFF for a 12/12 scheduleFLOWERING ROOMS
70% estimated % evaporation during LIGHTS ON for a 12/12 schedule0.7298 est. lb evaporation per plant / hour LIGHTS ON for a 12/12 schedule30% estimated % evaporation during LIGHTS OFF for a 12/12 schedule
0.3128 est. lb evaporation per plant / hour LIGHTS OFF for a 12/12 schedule
Model for One Michigan Class
C License of 1,500 Plants
Model for One Michigan Class C License of 1,500 Plants
Lighting Schedules 18/6 18/6 12/12 12/12 12/12 12/12
CloneRM VEG1 VEG2 FLWR1 FLWR2 FLWR3 FLWR4
Hour Time kW kW lb H2O kW lb H2O kW lb H2O kW lb H2O kW lb H2O kW lb H2O Total kW Total lb H2O
1 0:00 30.0 78.8 73.0 off 31.3 39.4 218.9 off 93.8 39.4 218.9 off 93.8 188 730
2 1:00 30.0 78.8 73.0 off 31.3 39.4 218.9 off 93.8 39.4 218.9 off 93.8 188 730
3 2:00 30.0 78.8 73.0 off 31.3 39.4 218.9 off 93.8 39.4 218.9 off 93.8 188 730
4 3:00 30.0 78.8 73.0 off 31.3 39.4 218.9 off 93.8 39.4 218.9 off 93.8 188 730
5 4:00 30.0 78.8 73.0 off 31.3 39.4 218.9 off 93.8 39.4 218.9 off 93.8 266 730
6 5:00 30.0 78.8 73.0 off 31.3 39.4 218.9 off 93.8 39.4 218.9 off 93.8 188 730
7 6:00 30.0 78.8 73.0 78.8 73.0 39.4 218.9 off 93.8 39.4 218.9 off 93.8 266 7718 7:00 30.0 78.8 73.0 78.8 73.0 39.4 218.9 off 93.8 39.4 218.9 off 93.8 266 771
9 8:00 30.0 78.8 73.0 78.8 73.0 39.4 218.9 off 93.8 39.4 218.9 off 93.8 266 771
10 9:00 30.0 78.8 73.0 78.8 73.0 39.4 218.9 off 93.8 39.4 218.9 off 93.8 266 771
11 10:00 30.0 78.8 73.0 78.8 73.0 39.4 218.9 off 93.8 39.4 218.9 off 93.8 266 771
12 11:00 30.0 78.8 73.0 78.8 73.0 39.4 218.9 off 93.8 39.4 218.9 off 93.8 266 771
13 12:00 30.0 78.8 73.0 78.8 73.0 off 93.8 39.4 218.9 off 93.8 39.4 218.9 266 771
14 13:00 30.0 78.8 73.0 78.8 73.0 off 93.8 39.4 218.9 off 93.8 39.4 218.9 266 771
15 14:00 30.0 off 31.3 78.8 73.0 off 93.8 39.4 218.9 off 93.8 39.4 218.9 188 73016 15:00 30.0 off 31.3 78.8 73.0 off 93.8 39.4 218.9 off 93.8 39.4 218.9 188 730
17 16:00 30.0 off 31.3 78.8 73.0 off 93.8 39.4 218.9 off 93.8 39.4 218.9 188 730
18 17:00 30.0 off 31.3 78.8 73.0 off 93.8 39.4 218.9 off 93.8 39.4 218.9 188 730
19 18:00 30.0 off 31.3 78.8 73.0 off 93.8 39.4 218.9 off 93.8 39.4 218.9 188 730
20 19:00 30.0 off 31.3 78.8 73.0 off 93.8 39.4 218.9 off 93.8 39.4 218.9 188 730
21 20:00 30.0 78.8 73.0 78.8 73.0 off 93.8 39.4 218.9 off 93.8 39.4 218.9 266 771
22 21:00 30.0 78.8 73.0 78.8 73.0 off 93.8 39.4 218.9 off 93.8 39.4 218.9 266 77123 22:00 30.0 78.8 73.0 78.8 73.0 off 93.8 39.4 218.9 off 93.8 39.4 218.9 266 771
24 23:00 30.0 78.8 73.0 78.8 73.0 off 93.8 39.4 218.9 off 93.8 39.4 218.9 266 771
1,417.5 1,501.2 1,417.5 1,501.2 472.5 3,753.0 472.5 3,753.0 472.5 3,753.0 472.5 3,753.0 5,524 18,014
kWh/day lb/day kWh/day lb/day kWh/day lb/day kWh/day lb/day kWh/day lb/day kWh/day lb/day kWh/day lb/day
750.6
lb/hr avg
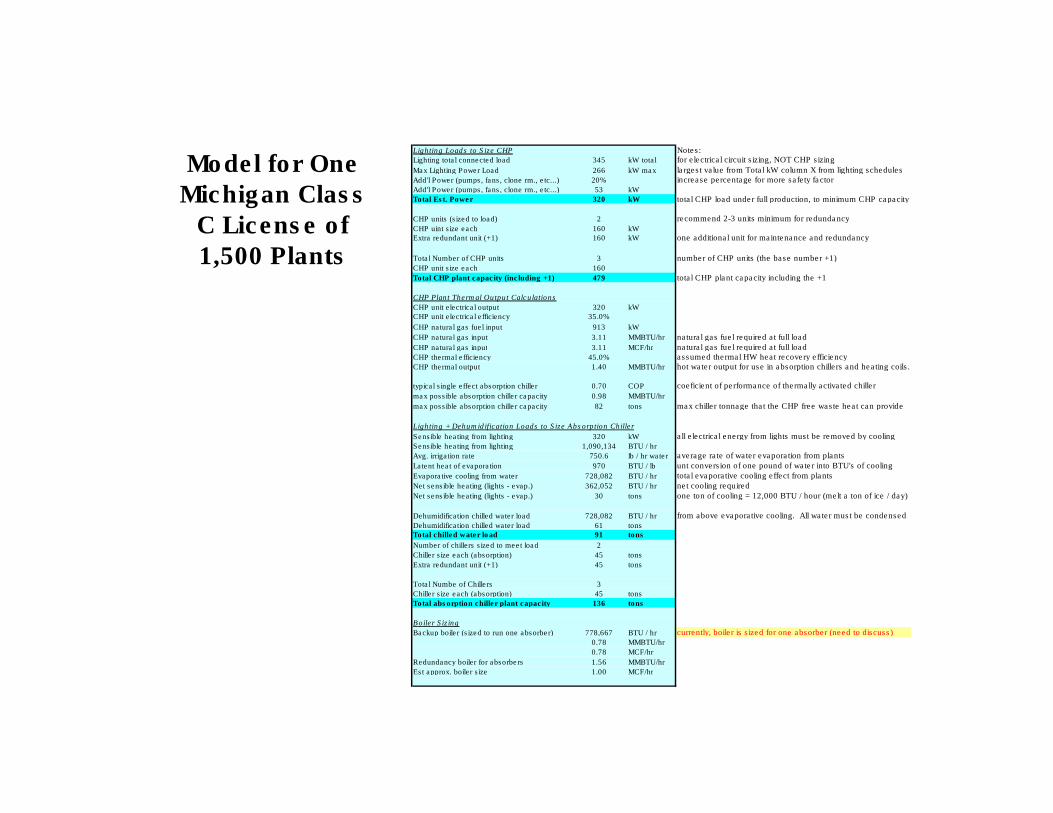
Lighting Loads to Size CHP Notes:Lighting total connected load 345 kW total for electrical circuit sizing, NOT CHP sizing
Max Lighting Power Load 266 kW max largest value from Total kW column X from lighting schedulesAdd'l Power (pumps, fans, clone rm., etc...) 20% increase percentage for more safety factorAdd'l Power (pumps, fans, clone rm., etc...) 53 kW
Total Est. Power 320 kW total CHP load under full production, to minimum CHP capacity
CHP units (sized to load) 2 recommend 2-3 units minimum for redundancyCHP uint size each 160 kWExtra redundant unit (+1) 160 kW one additional unit for maintenance and redundancy
Total Number of CHP units 3 number of CHP units (the base number +1)CHP unit size each 160
Total CHP plant capacity (including +1) 479 total CHP plant capacity including the +1
CHP Plant Thermal Output Calculations
CHP unit electrical output 320 kWCHP unit electrical efficiency 35.0%
CHP natural gas fuel input 913 kW
CHP natural gas input 3.11 MMBTU/hr natural gas fuel required at full loadCHP natural gas input 3.11 MCF/hr natural gas fuel required at full loadCHP thermal efficiency 45.0% assumed thermal HW heat recovery efficiencyCHP thermal output 1.40 MMBTU/hr hot water output for use in absorption chillers and heating coils.
typical single effect absorption chiller 0.70 COP coeficient of performance of thermally activated chillermax possible absorption chiller capacity 0.98 MMBTU/hr
max possible absorption chiller capacity 82 tons max chiller tonnage that the CHP free waste heat can provide
Lighting + Dehumidification Loads to Size Absorption Chiller
Sensible heating from lighting 320 kW all electrical energy from lights must be removed by coolingSensible heating from lighting 1,090,134 BTU / hr
Avg. irrigation rate 750.6 lb / hr water average rate of water evaporation from plantsLatent heat of evaporation 970 BTU / lb unt conversion of one pound of water into BTU's of coolingEvaporative cooling from water 728,082 BTU / hr total evaporative cooling effect from plantsNet sensible heating (lights - evap.) 362,052 BTU / hr net cooling requiredNet sensible heating (lights - evap.) 30 tons one ton of cooling = 12,000 BTU / hour (melt a ton of ice / day)
Dehumidification chilled water load 728,082 BTU / hr from above evaporative cooling. All water must be condensedDehumidification chilled water load 61 tonsTotal chilled water load 91 tons
Number of chillers sized to meet load 2
Chiller size each (absorption) 45 tons
Extra redundant unit (+1) 45 tons
Total Numbe of Chillers 3
Chiller size each (absorption) 45 tons
Total absorption chiller plant capacity 136 tons
Boiler Sizing
Backup boiler (sized to run one absorber) 778,667 BTU / hr currently, boiler is sized for one absorber (need to discuss)0.78 MMBTU/hr
0.78 MCF/hr
Redundancy boiler for absorbers 1.56 MMBTU/hr
Est approx. boiler size 1.00 MCF/hr
Model for One Michigan Class
C License of 1,500 Plants
90
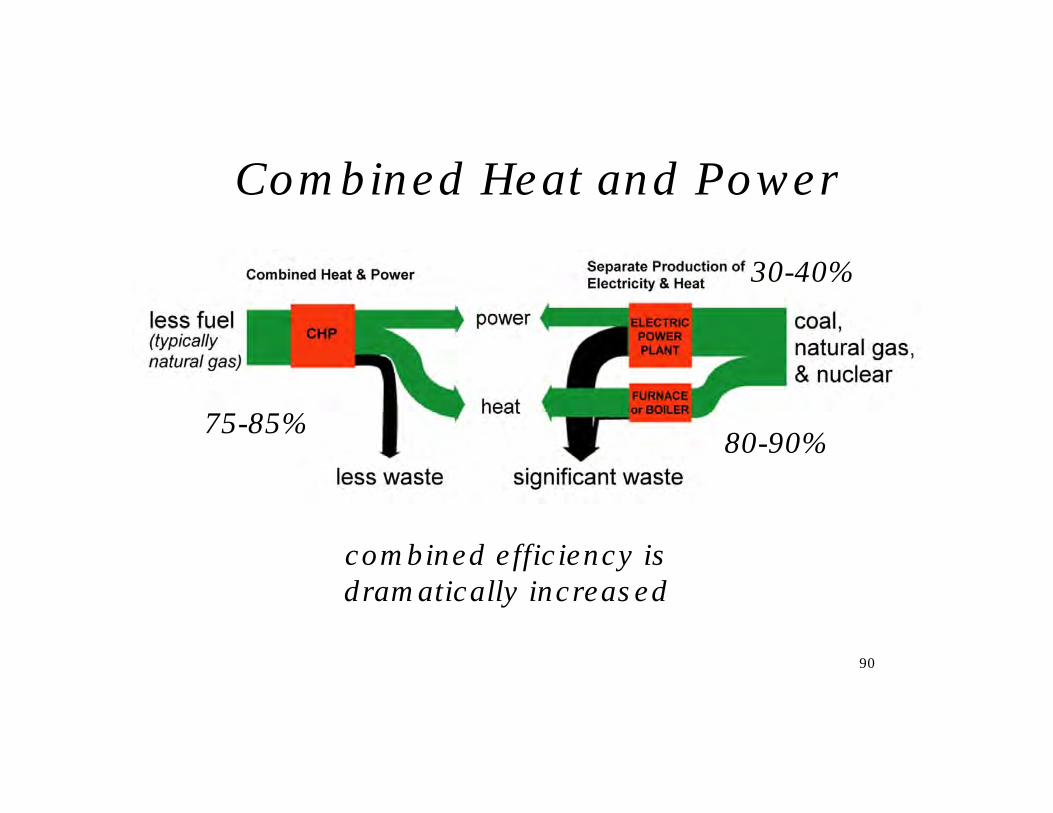
Combined Heat and Power
75-85%
30-40%
80-90%
combined efficiency is
dramatically increased
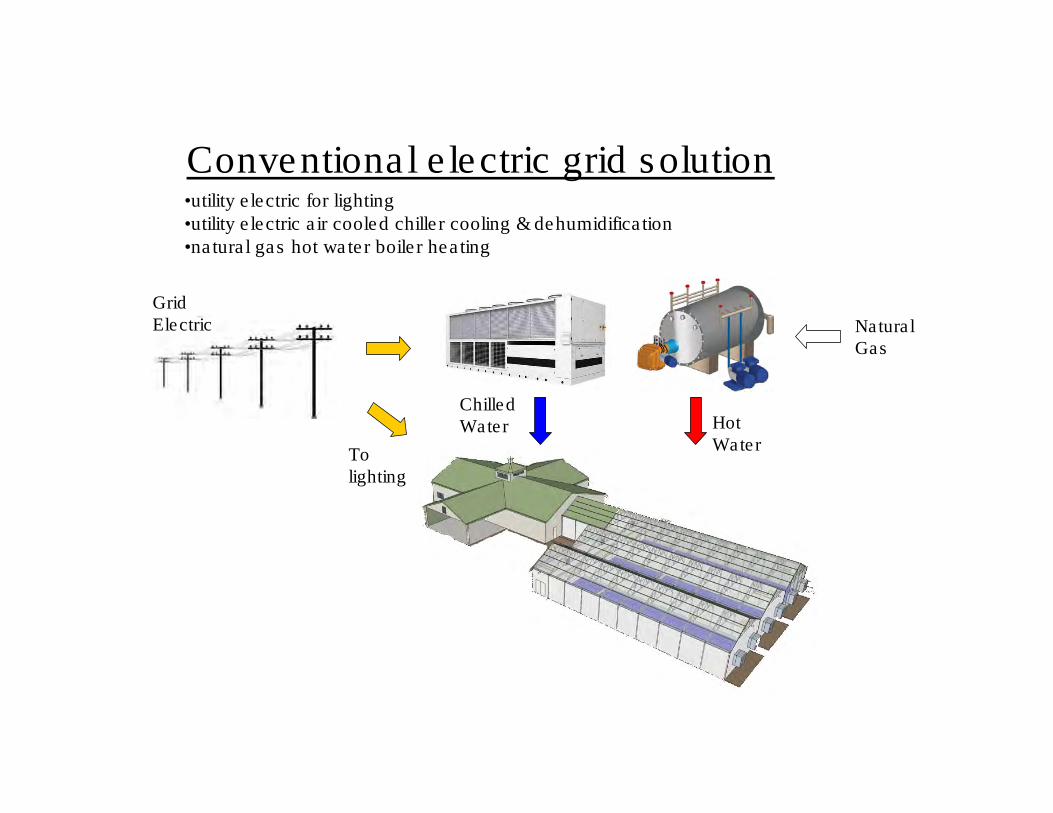
Conventional electric grid solution
Natural Gas
Chilled Water
Grid Electric
To lighting
Hot Water
•utility electric for lighting•utility electric air cooled chiller cooling & dehumidification•natural gas hot water boiler heating
TOWER
Natural Gas
HotWater
Chilled Water
Optional grid for backup
Power to Lighting
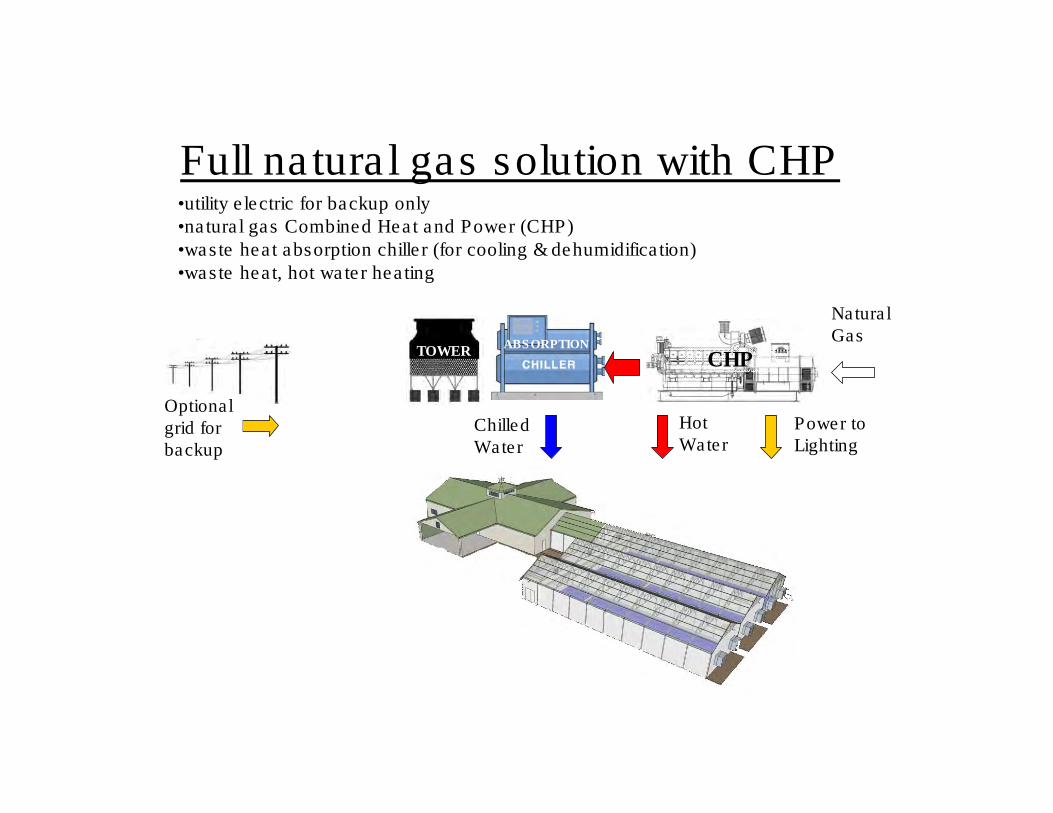
Full natural gas solution with CHP
CHPABSORPTION
•utility electric for backup only•natural gas Combined Heat and Power (CHP)•waste heat absorption chiller (for cooling & dehumidification)•waste heat, hot water heating
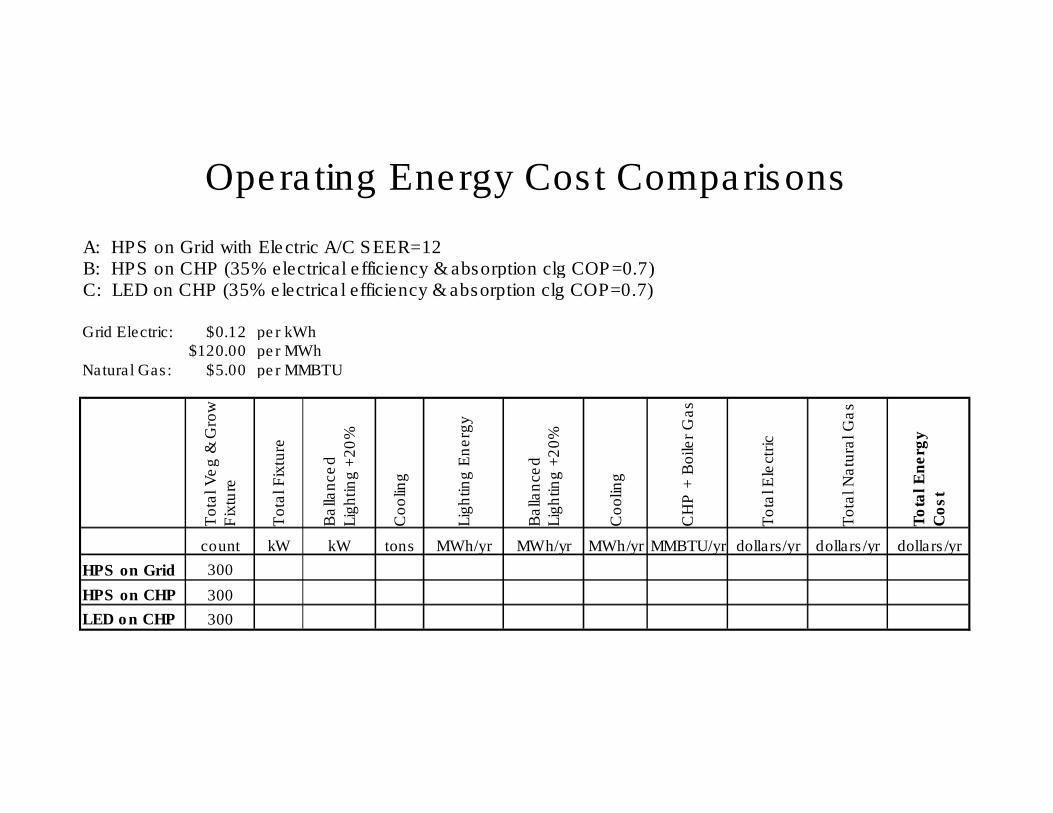
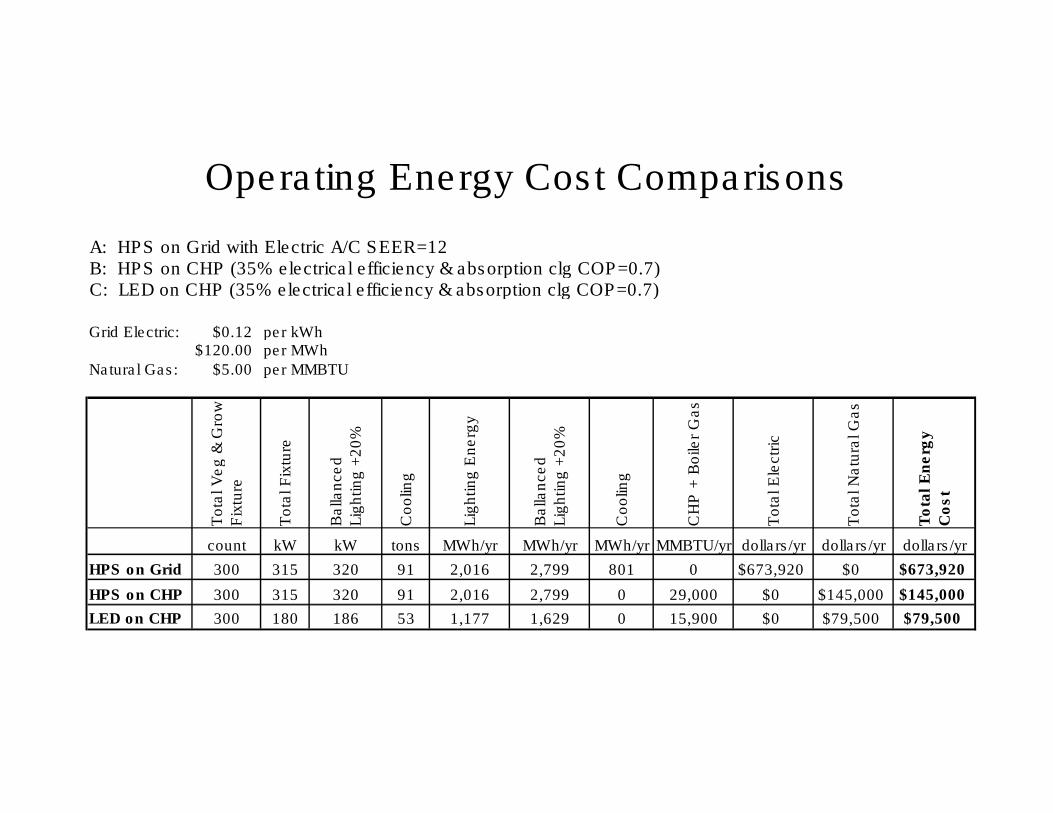
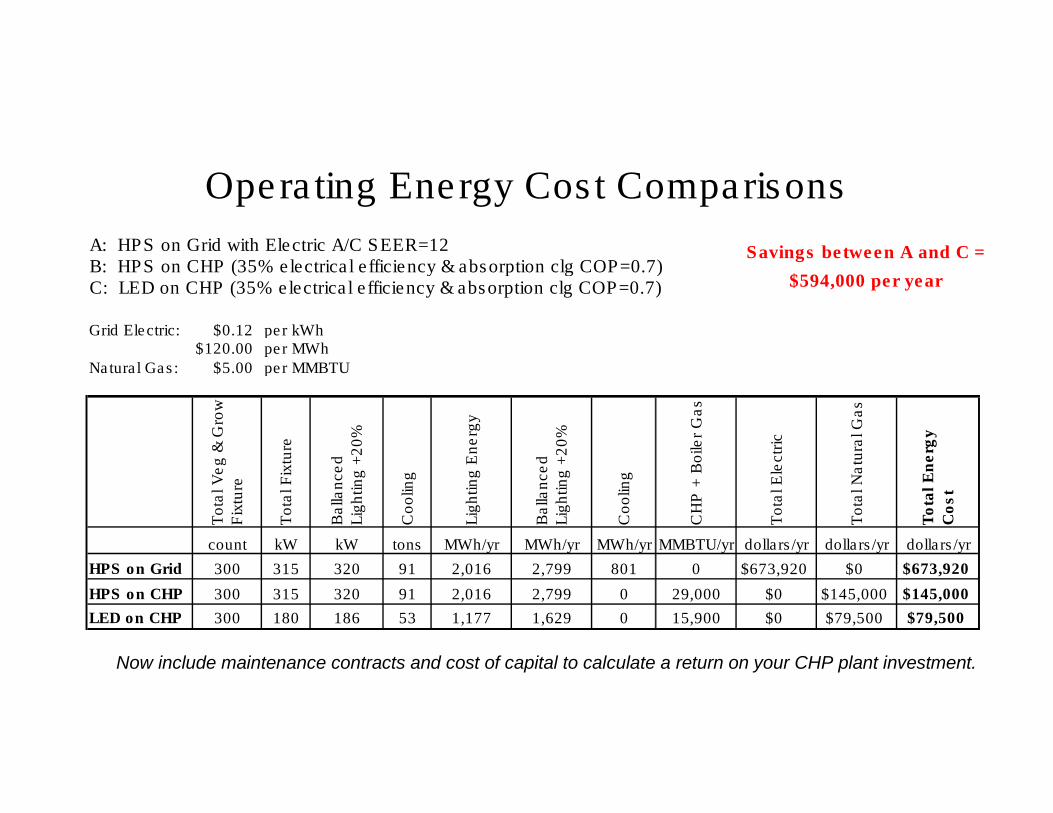
A: HPS on Grid with Electric A/C SEER=12B: HPS on CHP (35% electrical efficiency & absorption clg COP=0.7)C: LED on CHP (35% electrical efficiency & absorption clg COP=0.7)
Grid Electric: $0.12 per kWh$120.00 per MWh
Natural Gas: $5.00 per MMBTU
Tota
l V
eg &
Gro
w
Fix
ture
Tota
l F
ixtu
re
Ba
llance
d
Lig
htin
g +
20
%
Coo
ling
Lig
htin
g E
nerg
y
Balla
nce
d
Lig
htin
g +
20%
Coolin
g
CH
P +
Boile
r G
as
To
tal E
lect
ric
Tota
l N
atu
ral G
as
To
tal E
nerg
y
Co
st
count kW kW tons MWh/yr MWh/yr MWh/yr MMBTU/yr dollars/yr dollars/yr dollars/yr
HPS on Grid 300
HPS on CHP 300
LED on CHP 300
Operating Energy Cost Comparisons
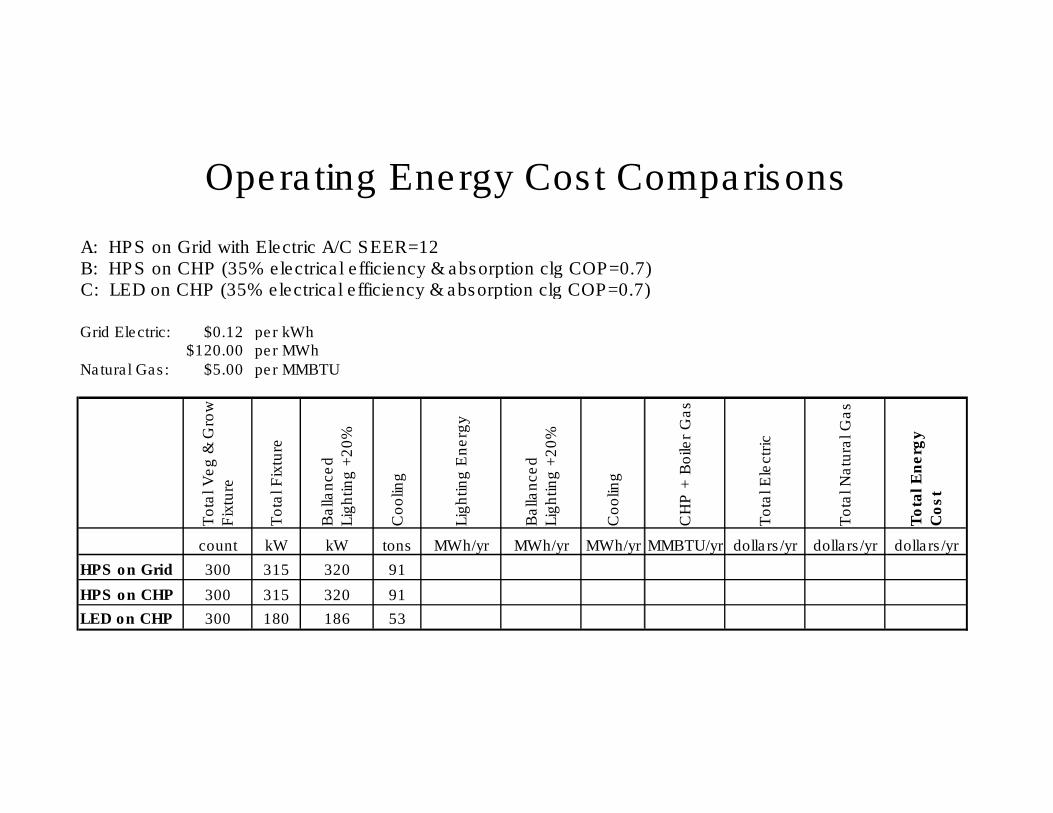
A: HPS on Grid with Electric A/C SEER=12B: HPS on CHP (35% electrical efficiency & absorption clg COP=0.7)C: LED on CHP (35% electrical efficiency & absorption clg COP=0.7)
Grid Electric: $0.12 per kWh$120.00 per MWh
Natural Gas: $5.00 per MMBTU
To
tal V
eg
& G
row
F
ixtu
re
To
tal F
ixtu
re
Balla
nce
d
Lig
htin
g +
20%
Coo
ling
Lig
htin
g E
nerg
y
Balla
nce
d
Lig
htin
g +
20%
Coo
ling
CH
P +
Boile
r G
as
To
tal E
lectr
ic
To
tal N
atu
ral G
as
To
tal
En
erg
y
Co
st
count kW kW tons MWh/yr MWh/yr MWh/yr MMBTU/yr dollars/yr dollars/yr dollars/yr
HPS on Grid 300 315 320 91
HPS on CHP 300 315 320 91
LED on CHP 300 180 186 53
Operating Energy Cost Comparisons
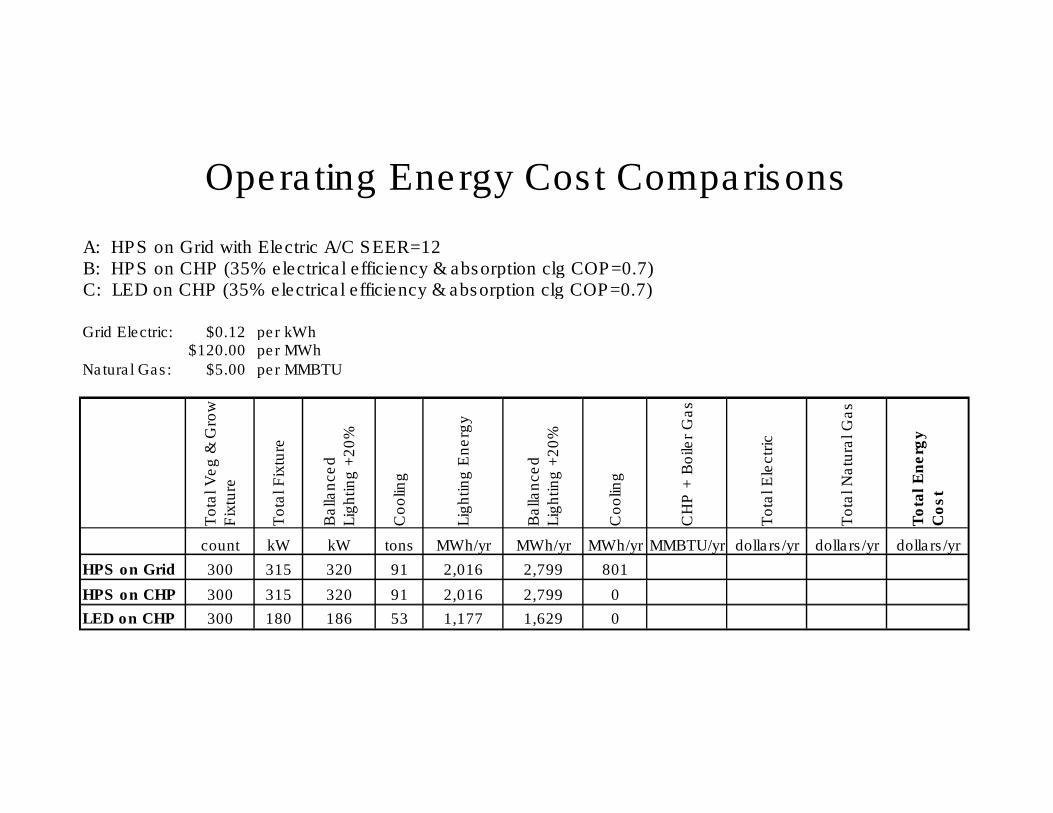
A: HPS on Grid with Electric A/C SEER=12B: HPS on CHP (35% electrical efficiency & absorption clg COP=0.7)C: LED on CHP (35% electrical efficiency & absorption clg COP=0.7)
Grid Electric: $0.12 per kWh$120.00 per MWh
Natural Gas: $5.00 per MMBTU
To
tal V
eg
& G
row
F
ixtu
re
To
tal F
ixtu
re
Ba
llan
ce
d
Lig
htin
g +
20
%
Co
olin
g
Lig
htin
g E
ne
rgy
Ba
llan
ce
d
Lig
htin
g +
20
%
Co
olin
g
CH
P +
Bo
iler
Ga
s
To
tal E
lectr
ic
To
tal N
atu
ral G
as
To
tal
En
erg
y
Co
st
count kW kW tons MWh/yr MWh/yr MWh/yr MMBTU/yr dollars/yr dollars/yr dollars/yr
HPS on Grid 300 315 320 91 2,016 2,799 801
HPS on CHP 300 315 320 91 2,016 2,799 0
LED on CHP 300 180 186 53 1,177 1,629 0
Operating Energy Cost Comparisons
Operating Energy Cost Comparisons
A: HPS on Grid with Electric A/C SEER=12B: HPS on CHP (35% electrical efficiency & absorption clg COP=0.7)C: LED on CHP (35% electrical efficiency & absorption clg COP=0.7)
Grid Electric: $0.12 per kWh$120.00 per MWh
Natural Gas: $5.00 per MMBTU
To
tal V
eg
& G
row
F
ixtu
re
To
tal F
ixtu
re
Ba
llan
ce
d
Lig
htin
g +
20
%
Co
olin
g
Lig
htin
g E
ne
rgy
Ba
llan
ce
d
Lig
htin
g +
20
%
Co
olin
g
CH
P +
Bo
iler
Ga
s
To
tal E
lectr
ic
To
tal N
atu
ral G
as
To
tal
En
erg
y
Co
st
count kW kW tons MWh/yr MWh/yr MWh/yr MMBTU/yr dollars/yr dollars/yr dollars/yr
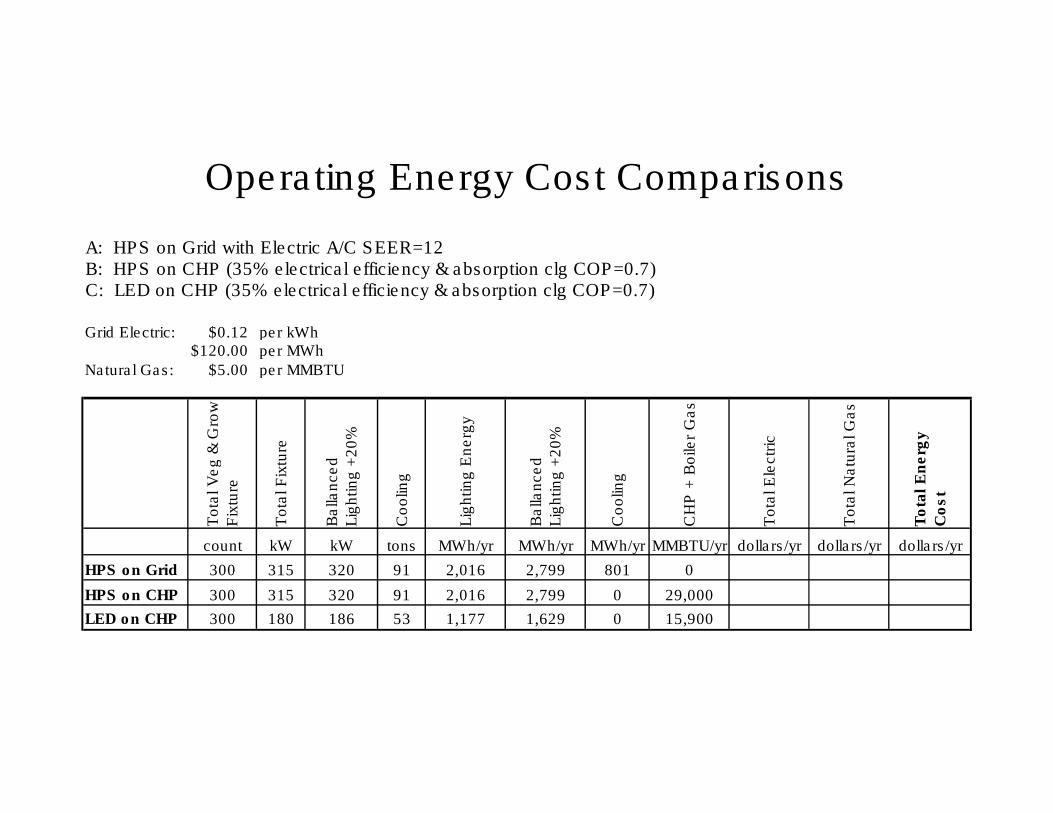
HPS on Grid 300 315 320 91 2,016 2,799 801 0
HPS on CHP 300 315 320 91 2,016 2,799 0 29,000
LED on CHP 300 180 186 53 1,177 1,629 0 15,900

Operating Energy Cost Comparisons
A: HPS on Grid with Electric A/C SEER=12B: HPS on CHP (35% electrical efficiency & absorption clg COP=0.7)C: LED on CHP (35% electrical efficiency & absorption clg COP=0.7)
Grid Electric: $0.12 per kWh$120.00 per MWh
Natural Gas: $5.00 per MMBTU
To
tal V
eg
& G
row
F
ixtu
re
To
tal F
ixtu
re
Ba
llan
ce
d
Lig
htin
g +
20
%
Co
olin
g
Lig
htin
g E
ne
rgy
Ba
llan
ce
d
Lig
htin
g +
20
%
Co
olin
g
CH
P +
Bo
iler
Ga
s
To
tal E
lectr
ic
To
tal N
atu
ral G
as
To
tal
En
erg
y
Co
st
count kW kW tons MWh/yr MWh/yr MWh/yr MMBTU/yr dollars/yr dollars/yr dollars/yr
HPS on Grid 300 315 320 91 2,016 2,799 801 0 $673,920
HPS on CHP 300 315 320 91 2,016 2,799 0 29,000 $0
LED on CHP 300 180 186 53 1,177 1,629 0 15,900 $0
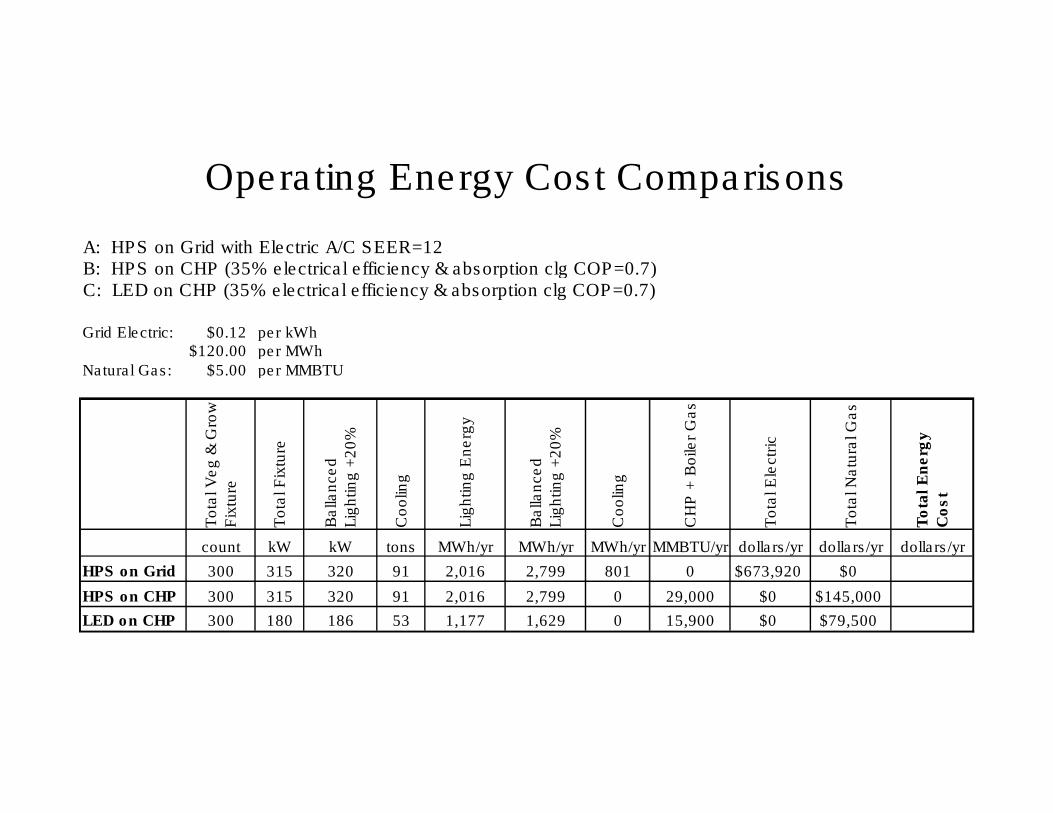
Operating Energy Cost Comparisons
A: HPS on Grid with Electric A/C SEER=12B: HPS on CHP (35% electrical efficiency & absorption clg COP=0.7)C: LED on CHP (35% electrical efficiency & absorption clg COP=0.7)
Grid Electric: $0.12 per kWh$120.00 per MWh
Natural Gas: $5.00 per MMBTU
To
tal V
eg &
Gro
w
Fix
ture
To
tal F
ixtu
re
Ba
llan
ce
d
Lig
htin
g +
20
%
Co
olin
g
Lig
htin
g E
ne
rgy
Ba
llan
ce
d
Lig
htin
g +
20
%
Co
olin
g
CH
P +
Boile
r G
as
To
tal E
lect
ric
To
tal N
atu
ral G
as
To
tal
En
erg
y
Co
st
count kW kW tons MWh/yr MWh/yr MWh/yr MMBTU/yr dollars/yr dollars/yr dollars/yr
HPS on Grid 300 315 320 91 2,016 2,799 801 0 $673,920 $0
HPS on CHP 300 315 320 91 2,016 2,799 0 29,000 $0 $145,000
LED on CHP 300 180 186 53 1,177 1,629 0 15,900 $0 $79,500
Operating Energy Cost Comparisons
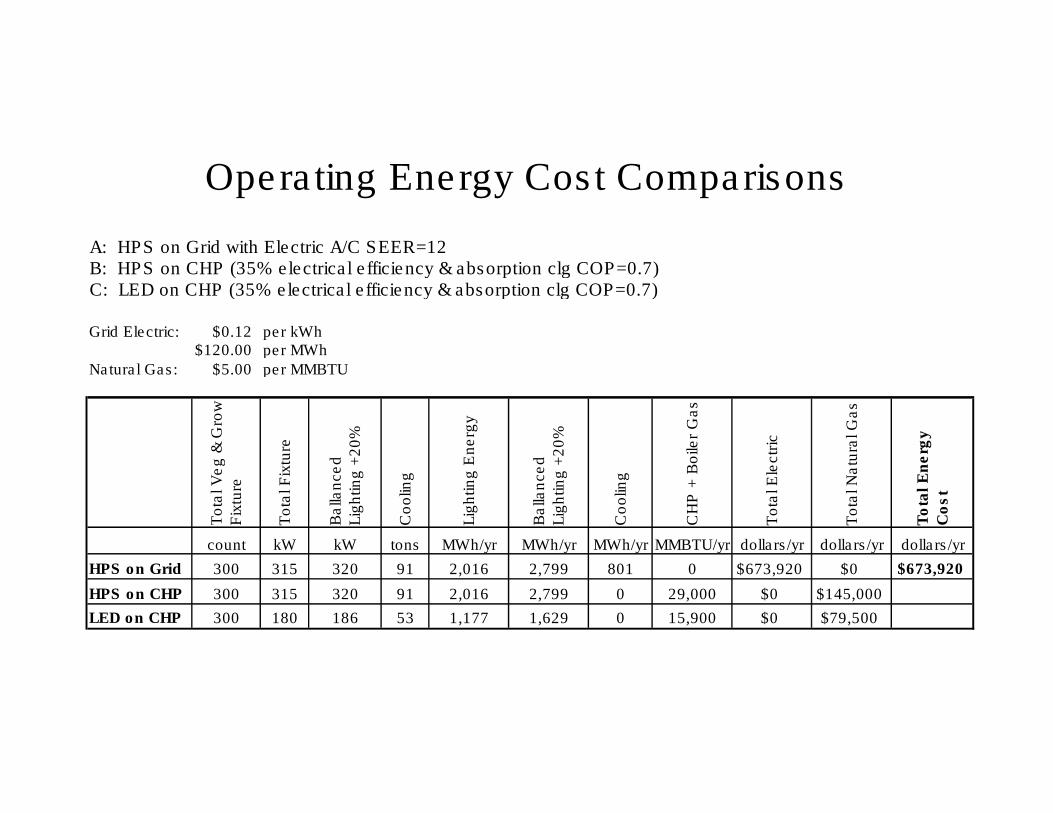
A: HPS on Grid with Electric A/C SEER=12B: HPS on CHP (35% electrical efficiency & absorption clg COP=0.7)C: LED on CHP (35% electrical efficiency & absorption clg COP=0.7)
Grid Electric: $0.12 per kWh$120.00 per MWh
Natural Gas: $5.00 per MMBTU
To
tal V
eg
& G
row
F
ixtu
re
To
tal F
ixtu
re
Ba
llan
ce
d
Lig
htin
g +
20
%
Co
olin
g
Lig
htin
g E
ne
rgy
Ba
llan
ce
d
Lig
htin
g +
20
%
Co
olin
g
CH
P +
Bo
iler
Ga
s
To
tal E
lectr
ic
To
tal N
atu
ral G
as
To
tal
En
erg
y
Co
st
count kW kW tons MWh/yr MWh/yr MWh/yr MMBTU/yr dollars/yr dollars/yr dollars/yr
HPS on Grid 300 315 320 91 2,016 2,799 801 0 $673,920 $0 $673,920
HPS on CHP 300 315 320 91 2,016 2,799 0 29,000 $0 $145,000
LED on CHP 300 180 186 53 1,177 1,629 0 15,900 $0 $79,500
Operating Energy Cost Comparisons
A: HPS on Grid with Electric A/C SEER=12B: HPS on CHP (35% electrical efficiency & absorption clg COP=0.7)C: LED on CHP (35% electrical efficiency & absorption clg COP=0.7)
Grid Electric: $0.12 per kWh$120.00 per MWh
Natural Gas: $5.00 per MMBTU
To
tal V
eg
& G
row
F
ixtu
re
To
tal F
ixtu
re
Ba
llan
ce
d
Lig
htin
g +
20
%
Co
olin
g
Lig
htin
g E
ne
rgy
Ba
llan
ce
d
Lig
htin
g +
20
%
Co
olin
g
CH
P +
Bo
iler
Ga
s
To
tal E
lectr
ic
To
tal N
atu
ral G
as
To
tal
En
erg
y
Co
st
count kW kW tons MWh/yr MWh/yr MWh/yr MMBTU/yr dollars/yr dollars/yr dollars/yr
HPS on Grid 300 315 320 91 2,016 2,799 801 0 $673,920 $0 $673,920
HPS on CHP 300 315 320 91 2,016 2,799 0 29,000 $0 $145,000 $145,000
LED on CHP 300 180 186 53 1,177 1,629 0 15,900 $0 $79,500 $79,500
Operating Energy Cost Comparisons
A: HPS on Grid with Electric A/C SEER=12B: HPS on CHP (35% electrical efficiency & absorption clg COP=0.7)C: LED on CHP (35% electrical efficiency & absorption clg COP=0.7)
Grid Electric: $0.12 per kWh$120.00 per MWh
Natural Gas: $5.00 per MMBTU
Tota
l V
eg &
Gro
w
Fix
ture
Tota
l F
ixtu
re
Balla
nce
d
Lig
hting
+2
0%
Coo
ling
Lig
hting
En
erg
y
Balla
nce
d
Lig
hting
+2
0%
Coo
ling
CH
P +
Boile
r G
as
Tota
l E
lect
ric
Tota
l N
atu
ral G
as
To
tal E
nerg
y
Co
st
count kW kW tons MWh/yr MWh/yr MWh/yr MMBTU/yr dollars/yr dollars/yr dollars/yr
HPS on Grid 300 315 320 91 2,016 2,799 801 0 $673,920 $0 $673,920
HPS on CHP 300 315 320 91 2,016 2,799 0 29,000 $0 $145,000 $145,000
LED on CHP 300 180 186 53 1,177 1,629 0 15,900 $0 $79,500 $79,500
Savings between A and C =
$594,000 per year
Now include maintenance contracts and cost of capital to calculate a return on your CHP plant investment.
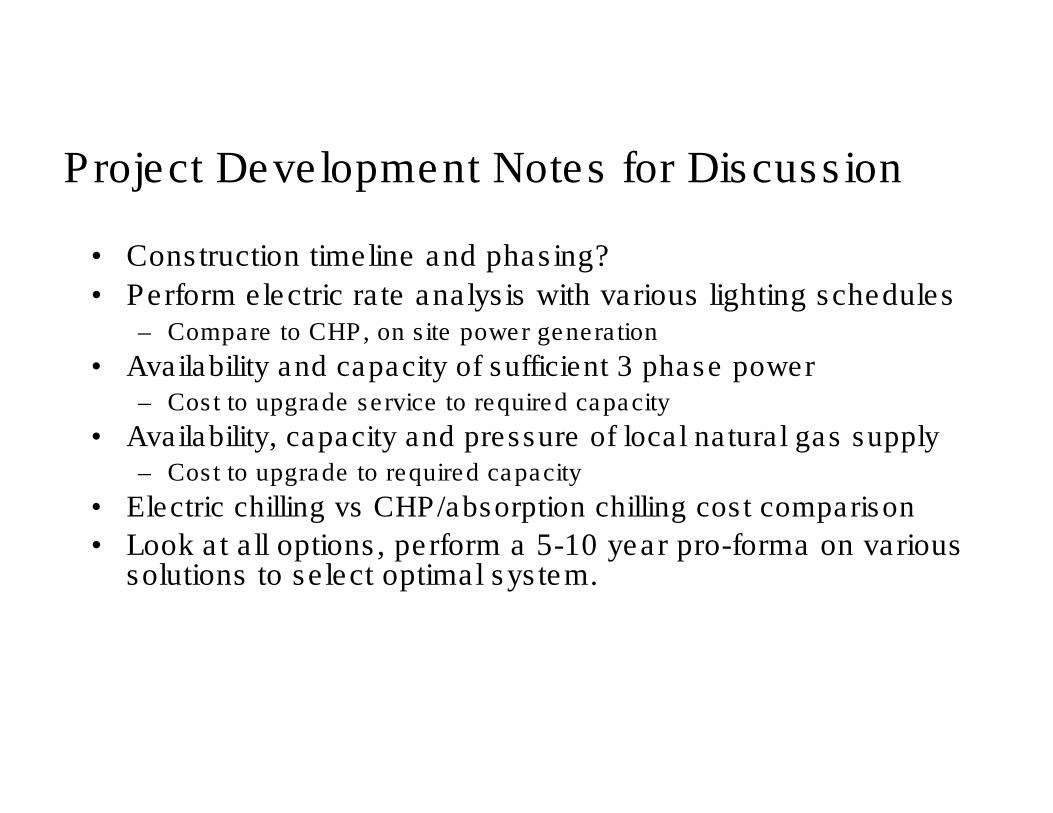
Project Development Notes for Discussion
• Construction timeline and phasing?
• Perform electric rate analysis with various lighting schedules– Compare to CHP, on site power generation
• Availability and capacity of sufficient 3 phase power – Cost to upgrade service to required capacity
• Availability, capacity and pressure of local natural gas supply– Cost to upgrade to required capacity
• Electric chilling vs CHP/absorption chilling cost comparison
• Look at all options, perform a 5-10 year pro-forma on various solutions to select optimal system.
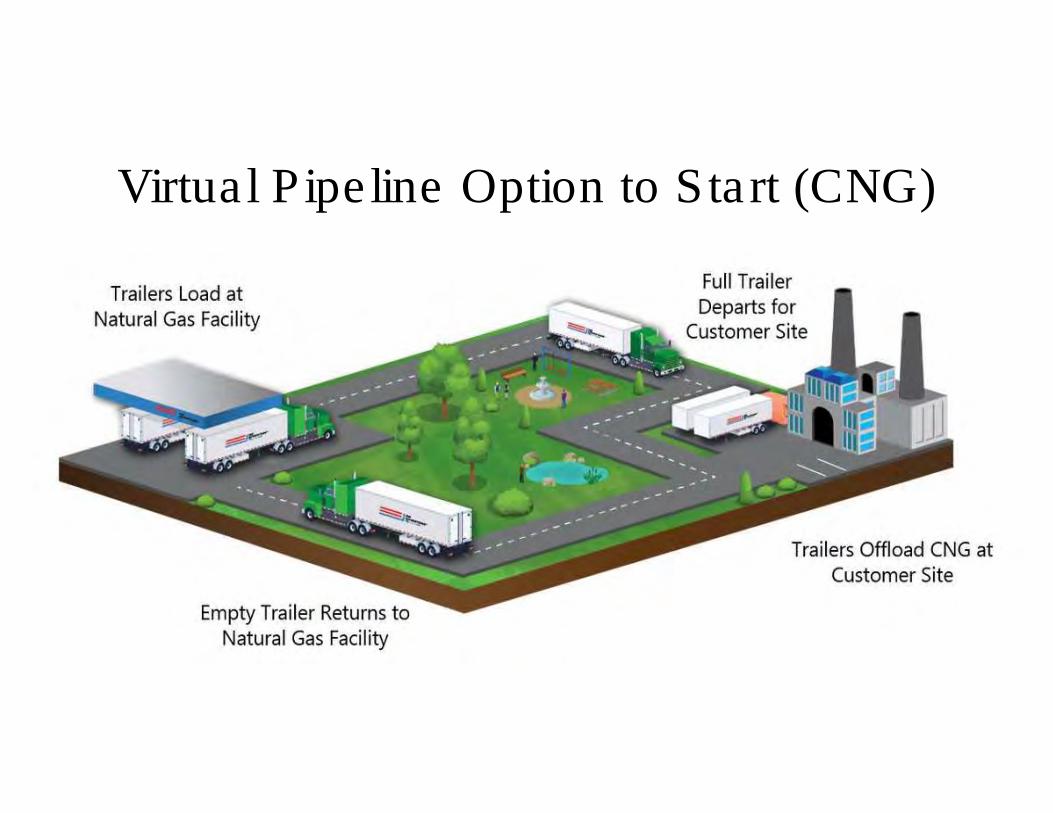
Virtual Pipeline Option to Start (CNG)
Conclusions
• LED tech is maturing and will be the most efficient and effective growing option for artificial light,
• Fully indoor grow environments have different load profiles and energy use requirements: cooling & dehumidification dominate,
• Supplying sufficient energy to serve your facility and operations can be done more cost effectively with Natural Gas,
• Low cost natural gas CHP can substantially lower your operating costs.


![[Psilocybin]Magic Mushrooms-A New Indoor Growing Technique[]](https://img.pdfslide.us/doc/110x75/5467beb3b4af9f533f8b59d8/psilocybinmagic-mushrooms-a-new-indoor-growing-techniquewwwerowidorg.jpg)