Embed Size (px)
Citation preview
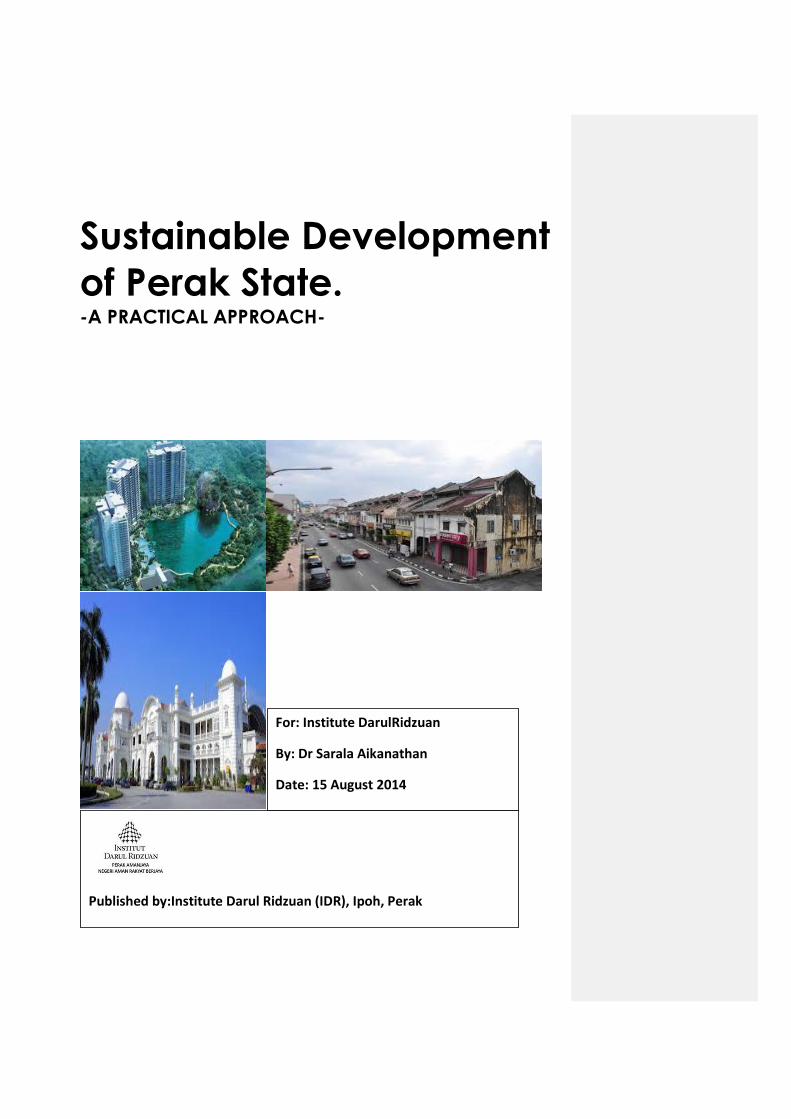
Sustainable Development
of Perak State. -A PRACTICAL APPROACH-
For: Institute DarulRidzuan
By: Dr Sarala Aikanathan
Date: 15 August 2014
Published by:Institute Darul Ridzuan (IDR), Ipoh, Perak
EXECUTIVE SUMMARY
This study entitled “Sustainable Development of Perak State: A Practical Approach”
wasdesigned to answer the following questions: Can the State of Perak Darul Rizduan attain
the status of sustainable?How does development relate to sustainability? Can we measure
sustainable growth? What are the major indicators in the main sectors of development?How
could social, economic and environmental values be incorporated into sustainable practices for
Perak Darul Ridzuan?
The Perak Darul Ridzuan is keen to undertake a comprehensive and sustainable socio-
economic development of Perak to improve the well-being and standard of living of the people.
The envisaged plan is based on three pillars of development - Creating Opportunities,
Increasing Incomes and Improving Living Standards. It prioritizes sustainability of
development by striking balance between human interaction and the environment at material,
spiritual and natural spheres. Perak has experienced the initial benefits of this overarching
development strategy but it has become evident a precise strategy is imperative for its long
term sustainability. Thus, the plan needs to be fine-tunedto provide clarity of objectives and
implementable plans and programs which could act as pivot to spearhead a balanced and
sustainable development in the State. It could also provide an overall guidance to the State on
the direction and trend of development.
“There are various stakeholders in the multi-sector groups in the State of Perak Darul Ridzuan
but not all of them adopt practices that ensure sustainable development, even though the
Malaysian policies provides for a sustainability code of conduct.” Therefore, gaps and divides
exist with regards to determinants of sustainable management and development amongst
stakeholders. The primary reason for this study is to examine the gaps that exist for sustainable
development in the State of Perak and to suggest progress in-line with Perak Amanjaya
blueprint
The government of Perak Darul Ridzuan and the Federal Government of Malaysia have
initiated several measures to promote sustainable development. Perak has instituted
sustainability related KRAs and related strategy. However,a sequential and timely strategy
implementation is now required. The primary sectors in Perak from the economic perspective
are manufacturing, agriculture and tourism. However the stakeholder survey indicated that
infra-structure development and tourism management are deemed as important. As the State
has adopted these KRAs strategies, it is imperative to proceed and advance sectoral
development based on KRAs based strategies.
This study reviewed the trends in the perception concerning the development sectors, and
analysed various important sectoral projects in Perak. The stakeholder groups that were
deemed relevant and important to the perception survey were:Public Sector, Private Sector,
Societies and NGOs, Media, Non-residents and Young Adults. Survey A results- Ranking of
Sectors: The survey of the 60 respondents from this study highlighted that the most important
sectors were tourism and infra-structure development. With this, it is now important to
specifically address tourism and infra-structure sectors for a detail and profound sustainability
KRAs as the next line of action. Survey B results – Important Projects for Stakeholders
Groups: The survey indicated that the stakeholders were aware of the sustainability
requirement for the State of Perak Darul Ridzuan. Their views on sectors highlight the need for
good infra-structure in Perak and also an determined thrust to promote tourism in the State.
Above all, it is imperative to ensure good governance.
Indicators for sustainability measurement are available but to be relevant these indicators need
to be locality-specific, and not be driven by generalities, unsubstantiated science or local
requirements. For Perak sustainability indicators are required for water, land and energy
sustainability measurements. Some of the indicators have emerged as important in recent times
and thus, need to be systematized and scaled further to ensure that the development of
sustainability progresses well.
Water: This resource must be developed and managed in a sustainable manner to preserve the
current social, economic and environmental development and to ensure the needs of future
generations are not jeopardized. The current indicators are: over-emphasis on Water Supply
Management (WSM), High rates of water wastage, High rates of Non-Revenue Water (NRW),
Destruction and degradation of water catchments, Legislation and Enforcement, Institutional
issues, Changing weather patterns, Privatization of the water sector, Low water tariffs,
Inefficient agricultural water use and Water pollution
Land:Land has finite limits to the supply of land resources. Land is becoming scarce as a
resource, and this is particularly true of land available for development or related purposes. The

current indicators are: Over-emphasis on land supply management, High rates of land wastage,
Destruction and degradation of “green lungs” and other land reserves, Legislation and
Enforcement, Institutional issues, Changing weather patterns, Inefficient agricultural land use
and Land contamination.
Energy:Energy has to be conserved to protect our environment from drastic changes and to
save the depleting resources for our future generations. The rate at which the energy is being
produced and consumed can damage our environment in a number of ways, especially, if not
planned sustainably. The current indicators are: Inadequate energy supply Management, High
rates of energy wastage, High rates of Non-Revenue Energy (NRE), Legislation and
Enforcement, Institutional issues, Privatization of the energy sector and Low energy tariffs.
This study has highlighted infra-structure and tourism sectors as important sectors which were
identified by Perak stakeholder groups and supports the “Perak smart growth plan.” The next
approach is to detail out the sustainability strategies for these sectors deemed important. Perak
resource indicators for sustainability that were identified are water, land and energy, and
principles for the use and management of these resources would require detail future research.
ACKNOWLEDGMENT
“Sustainable Development of Perak State- A Practical Approach” Report was
prepared with the Financial Support from IDR.The study would not be have been
possible without the following persons’ participation at different times in this last
one year. My appreciation and deep gratitude goes to Dr Asae Sayaka,
Nurulfarhana Sabri, Mohamad Azraf and Salina Nor Azam who gave me their
time, comments, advice and were patient with me throughout this work.
Numerous officials and stakeholders also contributed to the report through series
of interviews and workshops. The report also benefited from their comments and
inputs.
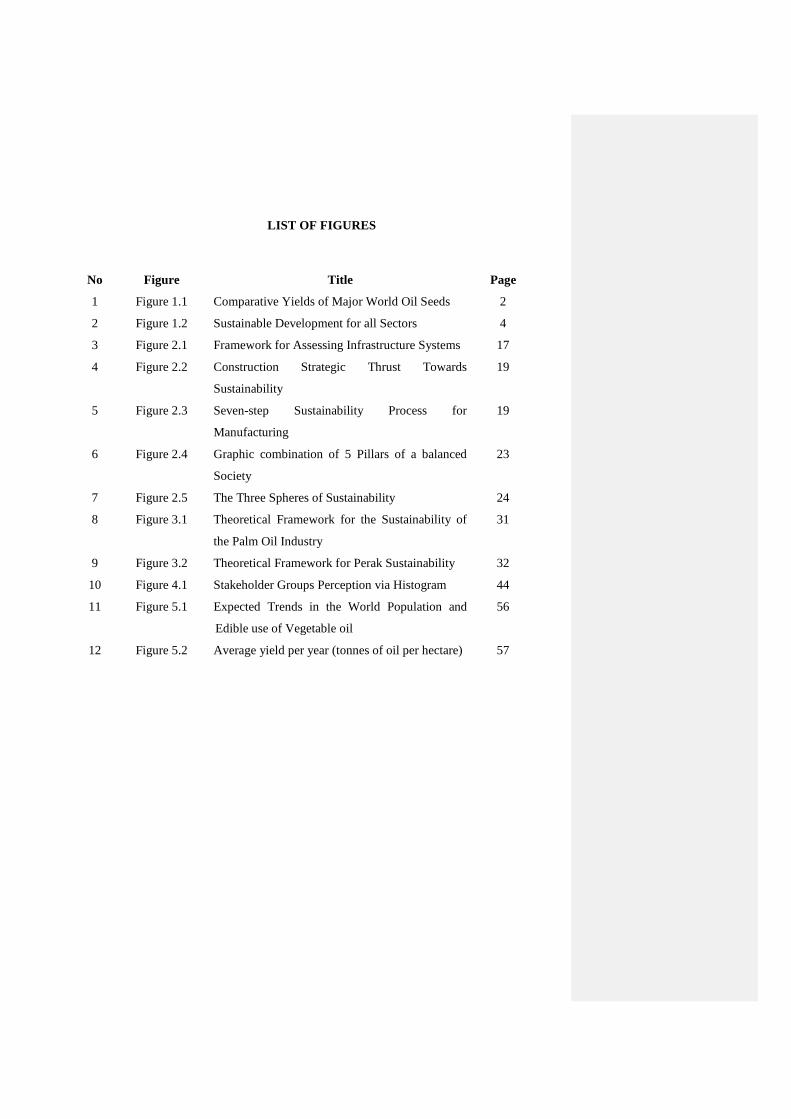
LIST OF FIGURES
No Figure Title Page
1 Figure 1.1 Comparative Yields of Major World Oil Seeds 2
2 Figure 1.2 Sustainable Development for all Sectors 4
3 Figure 2.1 Framework for Assessing Infrastructure Systems 17
4 Figure 2.2 Construction Strategic Thrust Towards
Sustainability
19
5 Figure 2.3 Seven-step Sustainability Process for
Manufacturing
19
6 Figure 2.4 Graphic combination of 5 Pillars of a balanced
Society
23
7 Figure 2.5 The Three Spheres of Sustainability 24
8 Figure 3.1 Theoretical Framework for the Sustainability of
the Palm Oil Industry
31
9 Figure 3.2 Theoretical Framework for Perak Sustainability 32
10 Figure 4.1 Stakeholder Groups Perception via Histogram 44
11 Figure 5.1 Expected Trends in the World Population and
Edible use of Vegetable oil
56
12 Figure 5.2 Average yield per year (tonnes of oil per hectare) 57

LIST OF TABLES
No Tables Title Page
1 Table 2.1 Perak Development Corridors 15
2 Table 2.2 The Proposed Green Growth Projects in Perak 16
3 Table 2.3 Main Areas Covered by Literature Review 25
4 Table 4.1 List of Variables Presented for Ranking 41
5 Table 4.2 Stakeholder Sector Preference 43
6 Table 4.3 Public Sector Important Projects 45
7 Table 4.4 Private Sector Important Projects 45
8 Table 4.5 Important Projects for the Societies and NGOs 46
9 Table 4.6 Important Projects for Media Groups 46
10 Table 4.7 Important Project for Non-residents 47
11 Table 4.8 Important Projects for Young Adults and Youth 47
12 Table 5.1 Major Water Issues Affecting Sustainable
Development in Malaysia
52
13 Table 6.3 Major Land Issues Affecting Sustainable Development
in Perak
58
14 Table 6.4 Major Energy Issues Affecting Sustainable
Development in Perak
62
TABLE OF CONTENT
Page No
Executive Summary I
Acknowledgement Iv
List of Figures V
List of Tables Vi
CHAPTER 1: INTRODUCTION
1.1 Introduction 1
1.2 Sustainability and the Overall Concept 3
1.3 What is Sustainable Development? 3
1.4 Study Motivation 5
1.5 Problem Statement 5
1.6 Research Questions 6
1.7 Objectives of Study 6
1.8 Significance of the Study and Its Contribution 7
1.9 Organization of the Study 7
CHAPTER 2: LITERATURE REVIEW
2.1 Introduction 9
2.2 Perak Amanjaya Development Plan 10
2.2.1 Sustainability Private Sector Foundation 11
2.2.1 Practicing Environmental Friendly and Sustainable
Resources
13
2.3 Ongoing Development Activities and Drawbacks 14
2.4 Selected Sectors and The Proposed Green Growth
Projects in Perak
15
2.5 Relevant Sustainability Literature for Perak 18
2.5.1 Sustainability in Infra-structure Development 18
2.5.2 Sustainability in Manufacturing Development 19
2.5.3 Sustainability in Service Industry Development 21
2.6 Theorization and Framework (Research & Conceptual) 22
2.7 Literature Summary, Analysis and Key Ideas 24

2.8 Synthesis and Evaluation of the Literature Reviewed 25
2.9 Research, Controversies and Gaps in Existence 26
2.10 Conclusion 29
CHAPTER 3: METHODOLOGY
3.1 Introduction 30
3.2 The Quantitative Approach 30
3.2.1 Theorisation of The Study and Supporting
Theories
30
3.3 Theoretical and Conceptual Framework 31
3.4 Linking Framework to Methodology 32
3.5 Survey, Primary Data Collection and Sample of Data 33
3.6 Survey and Construction of Questionnaire 33
3.7 Limitations 33
3.8 Analysis and Write-up 34
CHAPTER 4: PERCEPTION - REVIEW, FINDINGS AND
ANALYSIS
4.1 Introduction 35
4.2 Previous Work that Discusses Perceptions with Regards
to Perak and Malaysia
35
4.3 Current Perceptions or Mental Paradigms about Perak 37
4.4 Survey Set-up and Justification 39
4.5 Frequently Used Terms and Their Definitions 39
4.6 Identification of Stakeholder Groups and Their Priority
with Regards to Sectorial Indicators
41
4.7 Perception Survey Limitations and Operational Details 42
4.8 Questionnaire Administered for Assessing Stakeholder
Perceptions
43
4.9 Survey Results Part A 43
4.10 Survey Results from Part B: Import Project for Perak
Stakeholders
44
4.11 Discussion on the Findings: The Perception Survey 48

Analysis and Results
4.12 Overall Summary 49
CHAPTER 5: SUSTAINABILITY INDICATOR
5.1 Introduction 50
5.1.2 What is an indicator? What are sustainability
indicators?
50
5.1.3 Environmental Sustainability Index and
Environmental Performance Index
51
5.2 Malaysian Sustainability Measurements 51
5.3 Water as an Indicator 52
5.4 Land as Limiting Indicator 54
5.4.1 Availability of Land 55
5.4.2 Land Resource Demand 55
5.4.3 Ecosystem Condition 57
5.4.5 Land as Indicator 58
5.5 Energy as a Limiting Factor 60
5.5.1 Renewable Energy 60
5.5.2 The Malaysian Energy Demand Situation 60
5.5.3 The Malaysian Energy Supply Situation 60
5.5.5 Energy Indicator 61
5.6 Procedure for indicators development 63
5.7 Discussion on the Findings: Sustainability Indicator
Analysis
65
CHAPTER 6: CONCLUSION AND RECOMMENDATIONS
6.1 Introduction 67
6.2 The Framework and Sustainability Analysis of Perak
Darul Ridzuan
67
6.3 Perak Development Plan – The Sustainability Key Result
Areas (KRAs)
68
6.4 The Main Gaps and Controversies Concerning the 68
Sustainability Development
6.5 Perception Survey: Key Issues – Stakeholder Groups 70
6.6 Perception Survey 71
6.7 Indicator Analysis and Key Issues 72
6.8 Overall Recommendations from This Study 73
BIBLIOGRAPHY
APPENDIX 1: QUESTIONNAIRE
APPENDIX 2: CORE INDICATORS OF SUSTAINABLE TOURISM
CHAPTER 1
INTRODUCTION
1.1 Introduction
The Perak Darul Ridzuan is keen to undertake a comprehensive and sustainable socio-
economic development of Perak to improve the well-being and standard of living of the people.
The envisaged plan is based on three pillars of development-Creating Opportunities,
IncreasingIncomes and Improving Living Standards. It prioritizes sustainability of
development by striking balance between human interaction and the environmentat material,
spiritual and natural spheres. Perak has experienced the initial benefits of this overarching
development strategy but it has become evident a precise strategy is imperative for its long
term sustainability. Thus, the plan needs to be fine-tunedto provide clarity of objectives and
implementable plans and programs which could act as pivot to spearhead a balanced and
sustainable development in the State. It could alsoprovide an overall guidance to the State on
the direction and trend of development.Since2009, the State of Perak has been implemented the
following development plans:-
Equitable Development and Distribution: Raising living standards of low-income
households;
• Skilled, Ethical and Knowledgeable Society: Improving student outcomes;
• Strong, Catalytic and Inclusive Government: Improving government delivery systems;
• Network of Infrastructure and Public Facilities: Improving basic rural infra-structure;
• Participative Youth and Social Harmony: Improving knowledge levels and survival
skillsof youths;
• Vibrant Public Sector: Improving investment and business eco-systems; and
• Eco-friendly and Sustainable Development: Improving the quality of life and urban
public transport.
Natural resources would be the defining factor that dictates how well the human population
would progress and where the focal points of growth and development will be located. Similar

to human development,all natural resources such as forests, water supply and minerals are
very much land-dependent. The availability of land is the criticaldeterminant of upward
progressatevery stage of thehuman society’s development. It will emerge as the single most
limiting, non-renewable factor in most, if not all,forms of development.
Therefore, land has to be used at optimum levels for the benefit of all, including meeting the
consumption needsof the world. In such a scenario, palm oil emerges to become a significant
crop. Oil palm gives the highest yield per hectare among all oilseed crops (Oil World, 2010) as
indicated in Figure 1.1. It thus has great importance in terms of resource optimisation and
sustainability of productivity of land,as seen in the oil palm industry of Malaysia.
Source: Oil World, 2010
Figure 1.1: Comparative yields of major world oil seeds
Agriculture is an important sector in Perak as it contributes about 14% per annum of the Gross
Domestic Product (GDP) of Perak, and the main produce is palm oil. If we consider the GDP
of Malaysia, the agricultural sector in Malaysia contributes about 7.5% per annum. Palm oil is
the leading export earner among the primary commodities in Malaysia, and revenue for 2011
was estimated atRM80.4 billion, accounting for 11% of export earnings (MPOC, 2012).
1.2Sustainability and the Overall Concept

The Brundtland Commission of the United Nations, formally the World Commission on
Environment and Development (WCED) was created to address growing concern "about the
accelerating deterioration of the human environment and natural resources and the
consequences of that deterioration for economic and social development". The Brundtland
Commission's report in 1987, defined sustainable development as "development which meets
the needs of current generations without compromising the ability of future generations to meet
their own needs"(Brundtland Report, 1987).
The WCED’s aim was to meet the challenges of global warming, pollution, biodiversity and
the inter-relatedsocial problems of poverty, health and population. Hence, the integration of
environment anddevelopment concerns will lead to the fulfilment of basic needs, improved
standards for all, bettermanaged and protected ecosystems for a brighter future. Therefore,
global partnership for sustainabledevelopment is mandatory as no nation could achieve
sustainable development on its own.
At the 2005 World Summit, sustainability was redefined as a reconciliation of environmental
protection,social progress and economic growth. These three dimensions are best illustrated by
the interlockingcircles model to demonstrate the integration of three dimensions with actions to
redress the balancebetween dimensions of sustainability. These three circles of sustainability
are mutuallybeneficial and often act as reinforcing factors, (World Summit, 2005).
1.3 What is Sustainable Development?
There are many definitions of sustainable development, organic production, green growth and
ecological farming. Sustainable development is characterised by managing the land as a living
system in which the farmer/developer/policy makers act to support a dynamic but delicate
balance among the natural resources, human growth and production. In agriculture, the
essential characteristic of sustainable agriculture is to view the land as a living system
embedded in a broader ecosystem and in understanding how to manage all farm practices on
the basis of this holistic perception.
Sustainable Palm Oil: The Roundtable on Sustainable Palm Oil (RSPO) is an international
multi-stakeholder organization and certification scheme for sustainable palm oil; the
International Sustainability and Carbon Certification (ISCC), Indonesian Sustainable Palm Oil
(ISPO) and Malaysian Sustainable Palm Oil are entities that promote and certify sustainable
palm oil.TheRSPO was formed in 2004 by a diverse group of stakeholders in thepalm oil
industry to promote sustainable agriculture and address the environmental impacts of palm oil.
The RSPO practises the philosophy of the "roundtable" by giving equal rights to each
stakeholder group to bring group-specific agenda to the roundtable, facilitating traditionally
adversarial stakeholders and business competitors to work together towards a common
objective and making decisions by consensus (Aikanathan, 2010).
Like many other agencies and organizations, the RSPO adopted the Brundtland definition for
sustainable development and has put in place standards that focus on good environmental,
social and agricultural practices: from the point where the oil palmis first planted and grown to
its final destination, whether it is on the plate of a consumer or in other products.
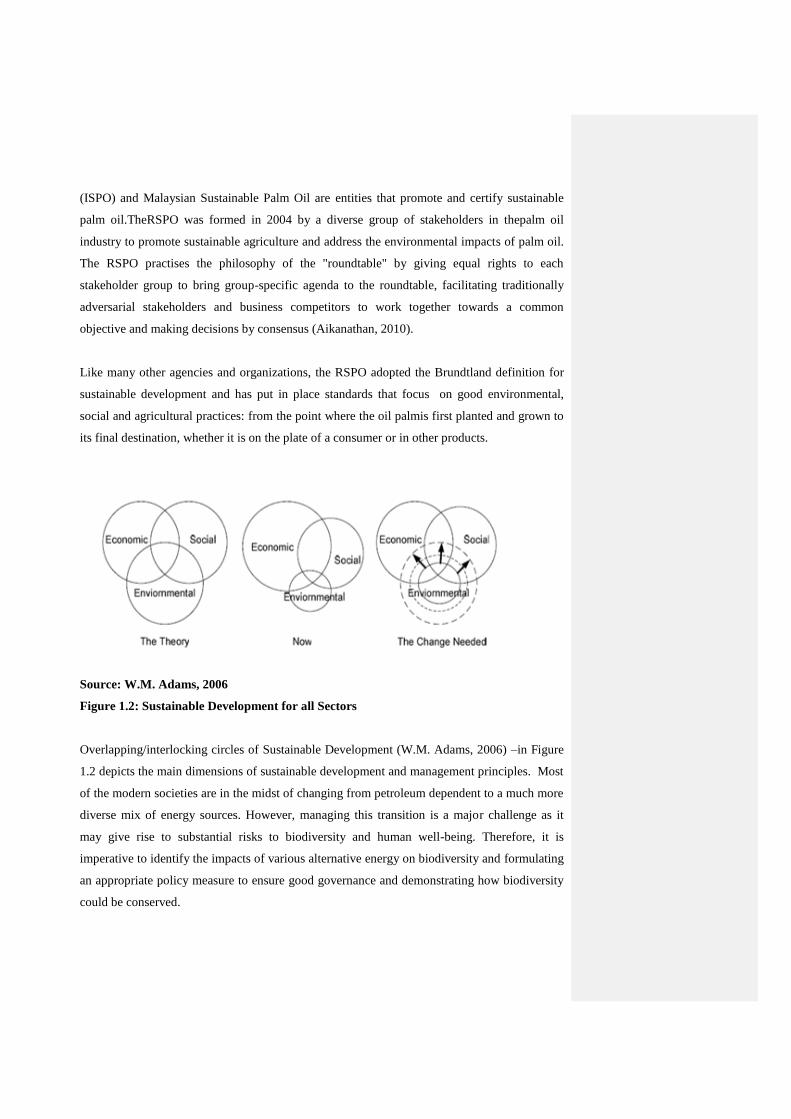
Source: W.M. Adams, 2006
Figure 1.2: Sustainable Development for all Sectors
Overlapping/interlocking circles of Sustainable Development (W.M. Adams, 2006) –in Figure
1.2 depicts the main dimensions of sustainable development and management principles. Most
of the modern societies are in the midst of changing from petroleum dependent to a much more
diverse mix of energy sources. However, managing this transition is a major challenge as it
may give rise to substantial risks to biodiversity and human well-being. Therefore, it is
imperative to identify the impacts of various alternative energy on biodiversity and formulating
an appropriate policy measure to ensure good governance and demonstrating how biodiversity
could be conserved.

Countries such as Germany have developed their own sustainability standards, propagated
through the ISCC (International Sustainability and Carbon Certification) system, and Indonesia
has its ISPO (Indonesian Sustainable Palm Oil). All these efforts are to ensure sustainable
development is adhered to in all sectors of growth worldwide.Technology will be one of the
critical issues during the transition from the ‘old economy’ (fossil fuel) to the ‘new economy’
(reuse, recycle, new energy). New technologies may be the frontiersto harness substantial
improvements in energy intensity.
1.4 Study Motivation
The government of Perak Darul Ridzuan and the Federal Government of Malaysia
haveinitiated several measures to promote sustainable development. The Malaysian
Government through the Malaysian Palm Oil agencies are in the process of establishingthe
“Malaysian Responsible Palm Oil” certification scheme. Indonesia is developing its own
standard. The palm oil industry is embarking on a pioneeringlead for the agricultural industry
to be sustainable and to adopt green practices. The endeavour is on-going but it seems a viable
means of overcoming the negativity surrounding the industry and for other sectors in Perak and
other states of Malaysia to emulate.
1.5 Problem Statement
The problem statement for this study is as follows: “There are various stakeholders in the
agricultural sector in the State of Perak Darul Ridzuan but not all of them adopt practices that
ensure sustainable development, even though the Malaysian legislation provides for a
sustainability code of conduct as determined by Malaysian authorities.” Therefore, gaps and
divides exist with regards to determinants of sustainable management and development
amongst stakeholders. Theprimary reason for this study is to examine the gaps that exist for
sustainable developmentin the State of Perak.
1.6 Research Questions
The questions that form the basis of this study include:
1. Can the State of Perak Darul Rizduan achieve the status of sustainability in development?
2. How does developmentrelate to sustainability?
Can we measure sustainable growth?
What are the major indicatorsof sustainability in the main sectors of
development?
Importance of Indicators: The indicators were evaluated according to the
following considerations:
i. Environmental indicators: minimum environmental impact;
ii. Social indicators: maximum development with minimum
energy/resource input; and
iii. Economic indicators: best financial return.
3. How do we incorporate important sustainable indicators into development practices in the
State of Perak Darul Rizduan?
1.7 Objectives of the study
The primary objective of this study is to develop a practical approach towards sustainable
development and green growth for the economic prosperity of Perak. In the process of
planning, the study would identify specific and appropriate policies that are crucial to
spearhead sustainable growth and highlightpossible recommendations based on indicators that
couldsatisfy the conditions for sustainable development and provide consistentsupport for the
achievement of the goal of Perak Darul Ridzuan.
1.8 Significance of the Study and its Contribution.
This study will position Perakon a sustainable growth trajectory and its significance lies in
providing the following:
a. Theoretical Contribution:
By linking economic theories and sustainability science throughoptimalresource allocation and
management, it provides atheoretical framework to support the establishment of sustainable
development in Perak.
b. Perception Management:
If sustainability principles are driven by perception in Perak Darul Ridzuan and Malaysia, this
study provides a means of measuring such perceptions, addressing the gaps in these
perceptions and using data to manage development issues.
c. Policy Contribution:
“Real value” management issues could emerge during stakeholder surveys and sustainable
indicator analysis. These issues could form the basis for planning purposesfor development and
management of Perak Darul Ridzuan.
d. Sustainability Indicator Contribution:
Sustainability Indicators are of economic importance for Perak and Malaysia andbased on this
study, each sustainability indicator can be given the appropriate weightand prioritized for
management purposes.
1.9 Organisation of the Study
The study consists of six chapters which include chapters that will coveroverall analysis and
review of the literatureand the evaluation of the stakeholder perception survey. The overall
organization of the report is arranged as follows:
Chapter 1: Introduction
Chapter 2: Literature Review
Chapter 3: Methodology

Chapter 4: Perception – Review, Findings and Analysis
Chapter 5: Sustainability Indicators
Chapter 6: Conclusion and Recommendations
CHAPTER 2
LITERATURE REVIEW
2.1Introduction
Sustainable development is a topic that has attracted much attention and is widely recognized
by all the leaders of the world as the dictum of all development efforts. It has become a
common topic of discussion among , environmentalists, economists, scientists, researchers,
agriculturists and other stakeholders. The push for sustainable development started 30 years
ago. The concept garnered momentum as a mainstream thrust of development through the
World Conservation Strategy (1980), the Brundtland Report (1987), and the United Nations
Conference on Environment and Development in Rio (1992).
Deliberations at the the United Nations Conference on Environment and Development in Rio
de Janeiro which was held from 3 to 14 June 1992 (also known as Rio Summit or the Rio
Conference or The Earth Summit) culminated with severalresolutions and declarations
(UNCED, 1992) that were well documented and known as the Rio Declaration on
Environment and Development which contains the following:
Agenda 21;
Convention on Biological Diversity;
Forest Principles; and
Framework Convention on Climate Change (UNFCCC).
The objective of the Rio Declaration is to address the challenges of sustainable development,
and tomanage and mitigate the impact of global warming, pollution, biodiversity and the inter-
relatedsocial problems of poverty, health and population. Hence, the integration of
environment concerns anddevelopment efforts will lead tobettermanaged and protected
ecosystems for a brighter future,(UNCED, 1992) ensuring the fulfillment of basic needs of
communities and improved standards of living for all.In the pursuit of such noble initiative, ,
global partnership is a prerequisite as no nation can achieve sustainable development on its
own.At the 2005 World Summit, sustainability was redefined as a reconciliation of
environmental protection,social progress and economic growth. The interdependence of these
three dimensions is best illustrated by presenting the interlockingcircles model to demonstrate
the integration of three aspects which neccessitate appropriate actions to redress and maintain
the balancebetween them. These three circles of sustainability are not only mutuallybeneficial
but also encompass reinforcing factors that are vital to preserve continuity and endurance.
Green growth is also considered as sustainable development, although there is yet a
universally accepted definition of green growth and economy. It primarily expounds the
principle of equitable and balanced growth which seek to increase the time horizon of the
utilization of natural resources so that future generations can also reap the benefit from the
ecosystem without hampering or denying the prosperity of the current generation. Green
Growth is a policy focus that emphasizes environmentally sustainable economic progress to
foster low-carbon and socially inclusive development (UNESCAP). In the context of the
development of Perak, Green Growth primarily means an inclusive growth which can
simultaneously enrich economic, social and environmental condition in the region. Thus, it is
imperative to realign and readjust the conventional sectorial growth policy to include
sustainable planning.
2.2 Perak Amanjaya Development Plan
In an effort to achieve the status of a sustainable state, and to adhere and abide by
international sustainability criteria, Perak Darul Ridzuan’s Executive Committee members
have to ensure that the overall developmentplan includes sustainability considerations
andarefocussed on selected designated “Key Result Areas’ or KRAs. For every development
plan that was redesigned to include themandatory sustainability criteria, the following path-
ways have been carved out:
a. Sustainability Private Sector Foundation: The intensive and committed involvement
of the private sector in all economic and social activities in a sustainable manner.
b. Practicing Environmental Friendly and Sustainable Resources:Sustainable
environmental and resourcesare safeguarded and protected through strong emphasis on
the awareness and cooperation of all parties by nurturing and practising lifestyles that
promote conservation and preservation of the environment.

In pursuit of these sustainability agenda, the Key Result Areas (KRAs) and forward strategies
has been defined.
2.2.1 Sustainability Private Sector Foundation
1. KRA – Implementing Quick Decision Making Process: Fast delivery system, responsive and
efficient in making decisions on all aspects of investment.
a) Develop monitoring systems that are interactive linking both the authorities and
clients, not overlapping or duplicating and easily accessible by all parties.
b) Apply the latest technologies and methods (simulations, scenario planning, forcasting)
in assisting the evaluation and assessment process to arrive at quick and correct
decisions.
c) Continuously enhancing the understanding of the private sector with regards to
procedures, regulations and other legal requirements.
d) Enhance the knowledge and skills of government officers in understanding the
operation of private organizations, their business models and industry requirements.
2. KRA –Provision of an efficient and comprehensive infrastructure: Integrated,
comprehensive and state-of-the-art physical and non-physical infrastructure that lend strong
support to investment activities.
a) Developing and upgrading strategic infrastructure that are catalytic in inducing large
multiplier effects on private investment.
b) Providing a stable and reliable broadband network (HSBB) at reasonable cost in all the
selected strategic growth areas.
c) Promoting the image and environment of existing industrial areas and related support
infrastructure.
d) Ensuring an integrated, seamless and efficient logistics system.
3. KRA –Adopting Dynamic R, D & Design: R, D & D intensive activities are critical to the
production of high-end products and valued findings and to stimulate a higher level of
competitiveness in global markets, especially among the small and medium industries (SMIs).
a) Identifying the main sources through the "R, D & D" for the development of niche
products.

b) Enhancing the research capabilities of the industry players by leveraging existing
research organizations and universities.
c) Creating the enabling ecosystems that support effective collaboration between the
private sector and local and foreign IPTs.
d) Providing incentives and support services to SMIs to develop and apply the latest
technology
a) 4. KRA –Ease of accessibility to information: Fast, detailed and accurate updated
information that catersto investor needs and requirements.Enhancing information
sharing platforms by creating a data system that can be accessed by all stakeholders.
b) Ensuring the provision of relevant information that are t private sector and business-
centric are made available to potential investors in timely and systematic manner.
c) Creating sources of information on investment as reliable and dependable portals of
facts and data that are trusted by potential investors.
d) Facilitating the matching of areas suitable for investments by creating a GIS data based
system.
5. KRA –Promoting the acceptance of local communities: Open mature communitiesshould
understand and accept the initiatives geared to bring about development to them by actively
participating at every stage of development.
a) Encouraging direct involvement of the private sector to dissipate and share information
with local communities through various forms of media.
b) Enhancing the comprehensive interaction between local community and private sector
through the social and community development programs.
c) Extending the benefits of private investment to local community by creating
opportunities for entrepreneurial activities.
2.2.1 Practicing Environmental Friendly and Sustainable Resources

a. Undertaking Environmental Friendly and Sustainable Resources Practices:Sustainable
environmental and resourcesare safeguarded and protected through strong emphasis on
the awareness and cooperation of all parties by nurturing and practising lifestyles that
promote conservation and preservation of the environment.
1. KRA –Promoting Resources Sustainability: Government at local, state and federal levels to
adopt e governance and sustainability in all their activities.
a) Establishing green codes of practice at all levels of government.
b) Introducing capacity building programs to instil and enrich the understanding and
appreciation of sustainability issues among government servants.
c) Developing comprehensive Green Governance System (plan, execute, monitor and
reporting enforcement improvements) that is applicable to sustainability.
d) Encouraging private sector to undertake lead role and to become a initiatives leader to
address and mitigate environmental problems.
e) Intensifying certification of good agricultural practices (APB) in the areas of crop
production, livestock and fisheries.
2. KRA –Identifying sustainable development resources as catalysts of growth: Sustainable
development can act as a catalyst of growth to safeguard and preserve natural resources.
a) Undertaking systematic enforcement of land-use zoning.
b) Introducing a special program to reduce and eradicate environmental pollution in the
communities and industries.
c) Creating innovative initiatives to optimize the use of available resources to produce
value.
d) Intensifying economic activities based on a healthy eco-environment and sustainability.
e) Exploring value creation initiatives based on environmental and natural resources.
3. KRA –Adopting a culture of sustainable living: Citizens to own and practise eco-friendly
values in every aspect of life to ensure sustainable well-being.
a) Inculcating a culture of love for environment atanearly age.

b) Making primary education as a civilizing agent of eco-friendly life.
c) Highlighting the relationship of environment,religion, spiritual and the living among
the people of the developed country.
d) Strengthening and expanding programs to promote environmental culture at all levels
of society and industry.
e) Enhancing the promotion and education on environment through various forms of
media to foster a spirit of lovefor the environment.
4. KRA –Promoting Green technology culture: Physical and non-physical activities
development undertaken by all stakeholders to be driven by effective and affordable green
technology.
a) Promoting the culture of using green technology among the private sectorentities and
government agencies.
b) Introducing incentives to private and government agencies to stimulate creative and
innovative green technologies.
c) Improving the effectiveness of enforcementof regulations and legal requirements on
environmental pollution.
d) Introducing competition program based on green technology.
Both the“Sustainability Private Sector Foundation” and “Practicing Environmental Friendly
and Sustainable Resources” form the foundation of the mandate for sustainabilityfor Perak
Darul Ridzuan. This current study has been commissioned to further explore and refine this
mandate.
2.3 Ongoing development activities and drawbacks
Five development corridors have been identified with specific development plans which are
based on the regions’ socio-economic, environmental and cultural background (Table 2.1).
However, they are premised on conventional economic growth principle. As a matter of fact,
these plans are standalone and independent in nature and needs growth inclusiveness. The
overall planning for sustainable development should also consider the issues of
implementability, consistency and coherence among all sectorial activities.
Comment [MF1]:
Corridors
Development target areas Proposed activities
Hulu Perak Industry/Housing/Tourism SME Development
Eco-agro tourism
Smart city development
Lembah Beriah
Agriculture / Eco-tourism/ Research
Manjung Tourism (nature)/maritime,
education/Agriculture (food
security/manufacturing
Establishment of
international institutes
Marine park development
Administrative activity
centers
Lembah Kinta Tourism (history &
nature)/agriculture (food security &
lifestyle)/Renewable energy
Setting up agriculture
institute, forestry and bio-
technology development
institute
Free trade zone
Ulu Bernam Education/Agriculture/Tourism/
Auto-industry
Car city
Set up university / technical
institutes
Paddy belt and other agro
product development
Source: IDR, 2013
Table 2.1: Perak Development Corridors
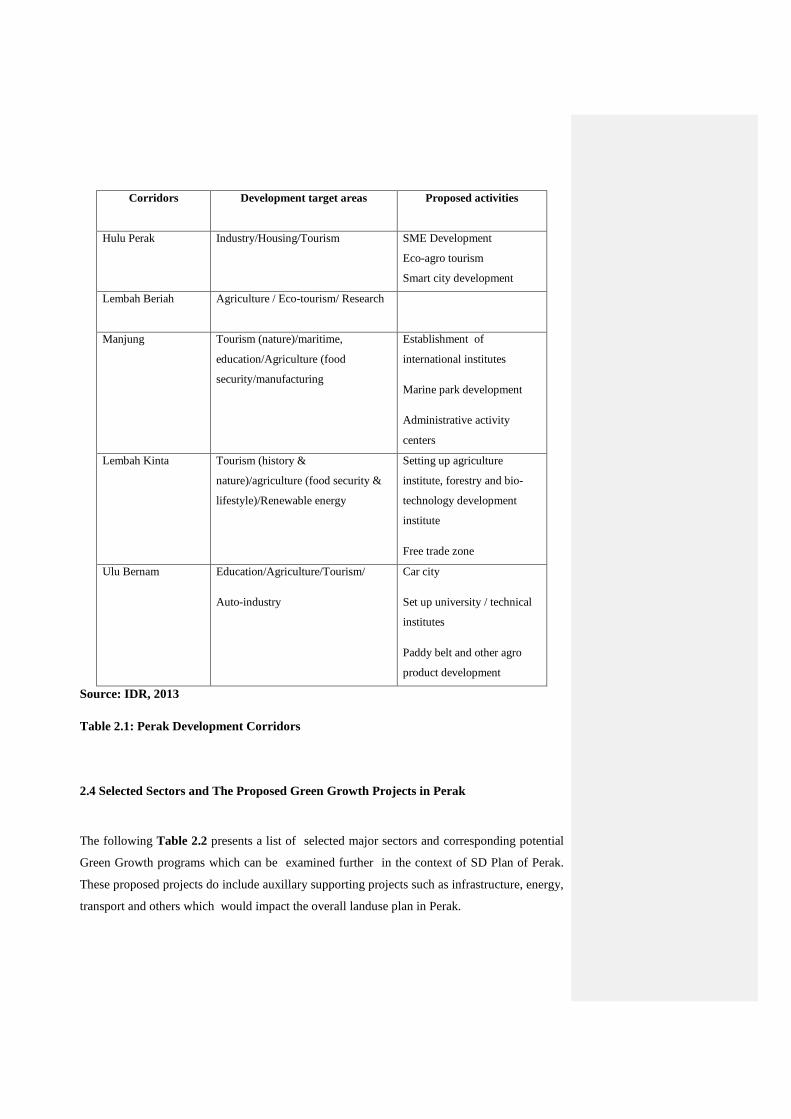
2.4 Selected Sectors and The Proposed Green Growth Projects in Perak
The following Table 2.2 presents a list of selected major sectors and corresponding potential
Green Growth programs which can be examined further in the context of SD Plan of Perak.
These proposed projects do include auxillary supporting projects such as infrastructure, energy,
transport and others which would impact the overall landuse plan in Perak.
Sector Name Programs under Perak Amanjaya Corresponding GG &SD Programs
Infrastructure Road projects Port development Power projects
Smart grid system Advanced power technology
Energy Coal/Oil/Gas exploration Coal/oil/gas Import Renewable energy (RE)
Distributed energy system FIT/RPS system for RE promotion Cost efficient energy systems planning
Transport Rail system Surface transport Water transport Eco transport
Mass transit system Electric vehicle
Mining Alternative mining Mine reclamation and alternative use
Eco-restoration of abandoned mines
Heavy Industry Automobile
Industrial energy efficiency improvement
SME
(small scale
enterprises)
Any local SME SME cluster development Micro/mini credit system for SME
development
Agriculture and Forestry Any specific crop planning Non timber forest produce Timber
Climate adaptive agriculture practices REDD+ project for rain forest
conservation Timber certification and sustainable
timber procurement
Tourism Eco-tourism and sustainable tourism programs
Healthcare Health care infrastructure (hospitals, specialty centers)
Health tourism Healthcare services
E-healthcare system (web portal based health care services)
Education/ Information Technology
E-governance ICT ( Information and Communication
Technology)
Source: IDR, 2013
Table 2.2: The Proposed Green Growth Projects in Perak
“Green Growth” or sustainable development shall be a driver to accelerate the national
economy and promote sustainable development and it should incorporate the four pillars of
Malaysian National Green Technology Policies which are as follows:
i. Energy: energy independence and efficient utilization;
ii. Environment: conservation and minimal impact on environment;

iii. Economy: enhance economy through use of technology; and
iv. Social: improve the quality of life for all.
The need for sustainable management in infra-structure can be observed from the experience of
Canada, where the research in sustainable urban infrastructure reflects the prerequisite to
design and manage engineeringsystems by taking into consideration both environmental and
socioeconomic factors. It is a daunting task and major challenge for the engineer to develop
practical tools for measuring and monitoring the continued sustainability of urban
infrastructure over its life cycle.The present study develops such a framework for the
sustainability assessment of urban infrastructure systems. Theframework focuses on key
interactions and feedback mechanisms between infrastructure and surrounding
environmental,economic, and social systems. One way of understanding and quantifying these
interacting effects is through the use ofsustainability criteria and indicators. A generic set of
sustainability criteria and subcriteria and system-specific indicatorsis presented in this study.
Selected indicators are quantified in a case study of the urban water system of the City of
Toronto,Ontario, Canada (Sahely et al., 2005), as depicted in Figure 2.1
Source: Sahely et al., 2005
Figure 2.1: Framework for Assesing Infrastructure Systems
2.5 Relevant Sustainabilitity Literature for Perak
The State of Perak Darul Ridzuan in order to achieve sustainability status has to scrutinize and
examine closely all its sector based development. Relevantsustainability related literature was
identified and compiled to provide background information and experiences of other countries,
to assist in the refinement of these development plans. Discussions and deliberations were
confined and focused on important sectors such as :
a. Infra-structure development;
b. Manufacturingindustry ; and
c. Service sector.
2.5.1 Sustainability in Infra-structure Development
In theory, a sustainable design can lead to the development of sustainable communities by
sensitizing citizens by exposing and explaining that infrastructural improvements can be
undertaken without depleting or diminishing natural resources. Consequently, the transition
and mass adoption of renewable resourcesfeatures heavily in sustainable
infrastructure.The design emphasis for a sustainable urban infrastructure is on localization
and sustainable living. The objective is to reduce an individual'secological footprint by
adhering to the principles of sustainable development in areas with a high population
density.The criteria to determine what could be included in this kind of urban environment
varies from place to place, given the differences in existing infrastructure and built
form, climate and availability of local resources or talents.
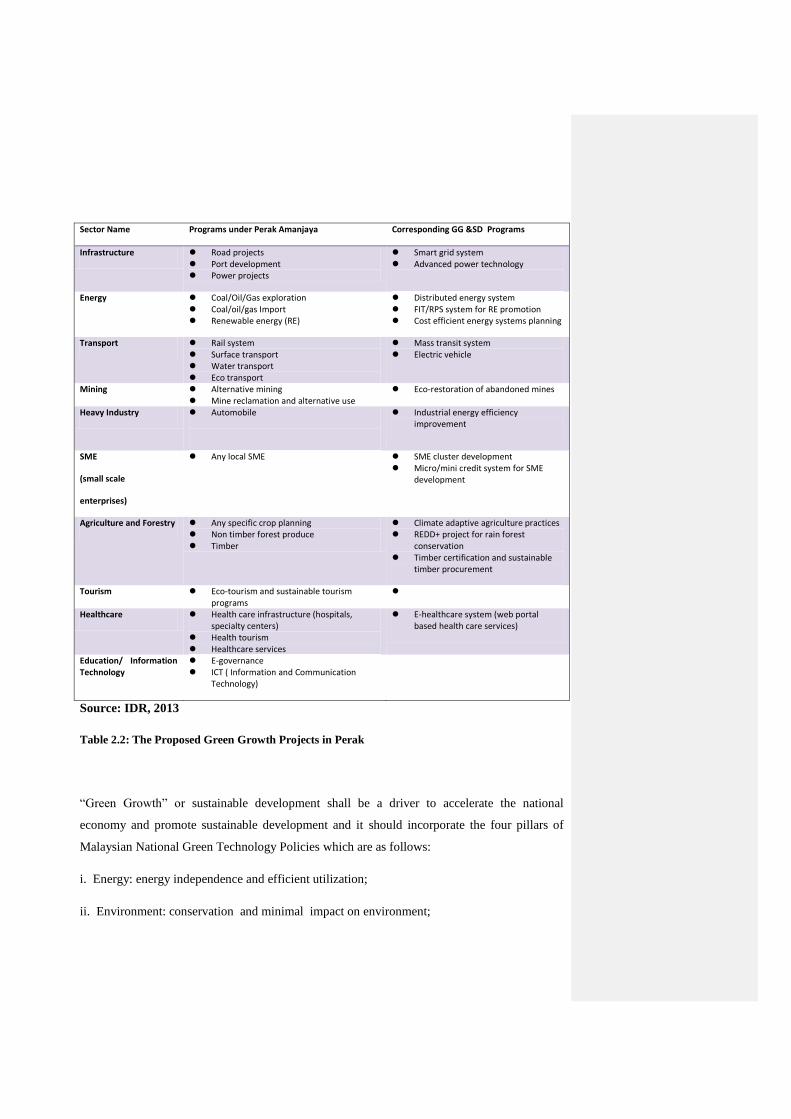
The Engineering Association of Malaysia have developed the overall masterplan for
construction as depicted in Figure 2. 2
Source: Board of Engineers Malaysia, 2010
Figure 2.2 Construction Straetegic Thurst Towards Sustainability
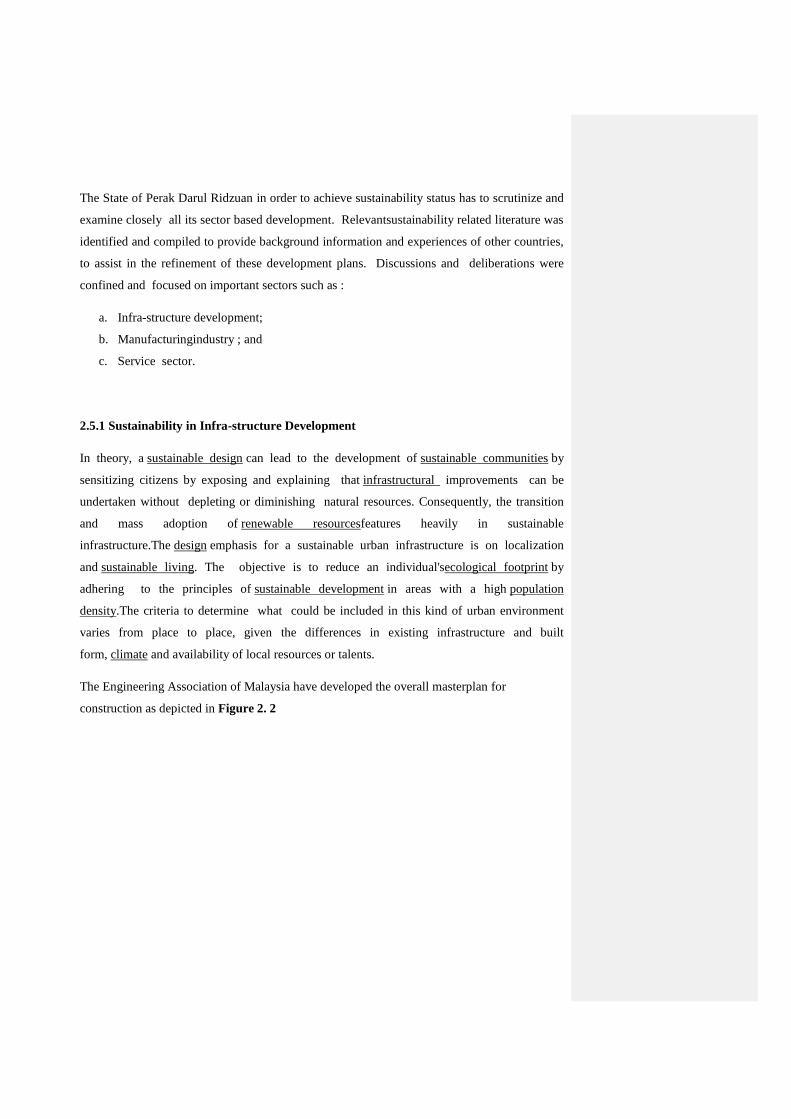
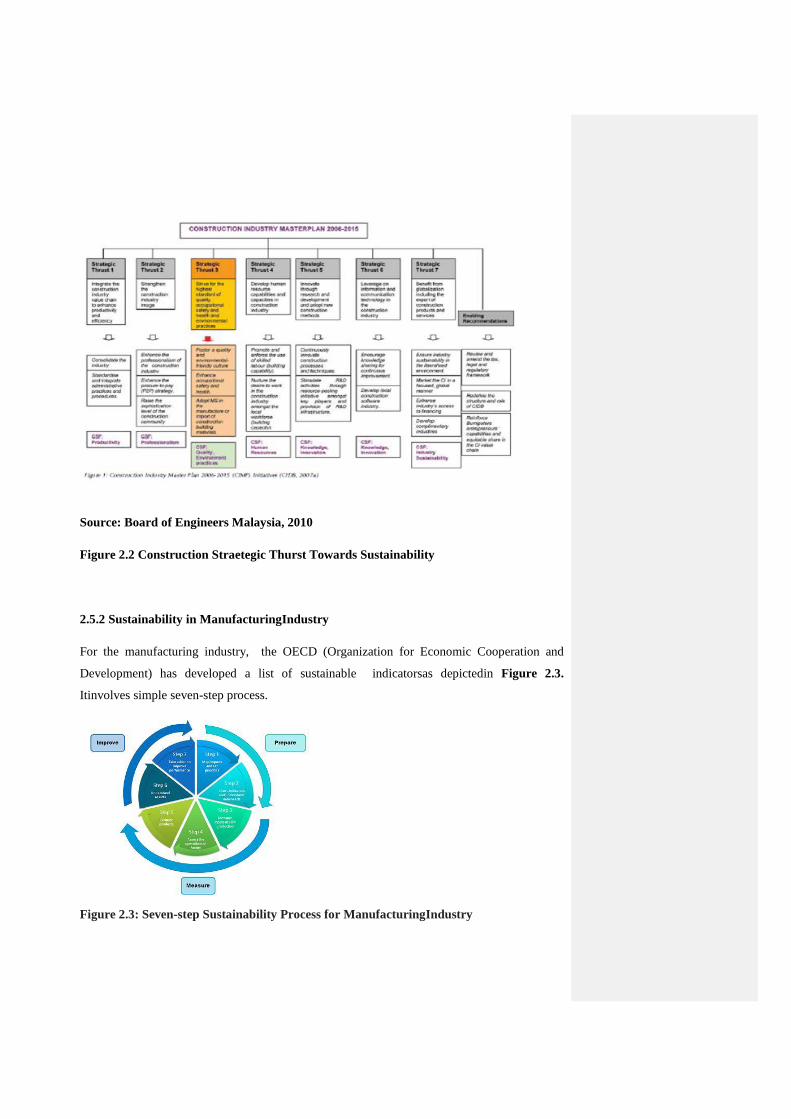
2.5.2 Sustainability in ManufacturingIndustry
For the manufacturing industry, the OECD (Organization for Economic Cooperation and
Development) has developed a list of sustainable indicatorsas depictedin Figure 2.3.
Itinvolves simple seven-step process.
Figure 2.3: Seven-step Sustainability Process for ManufacturingIndustry
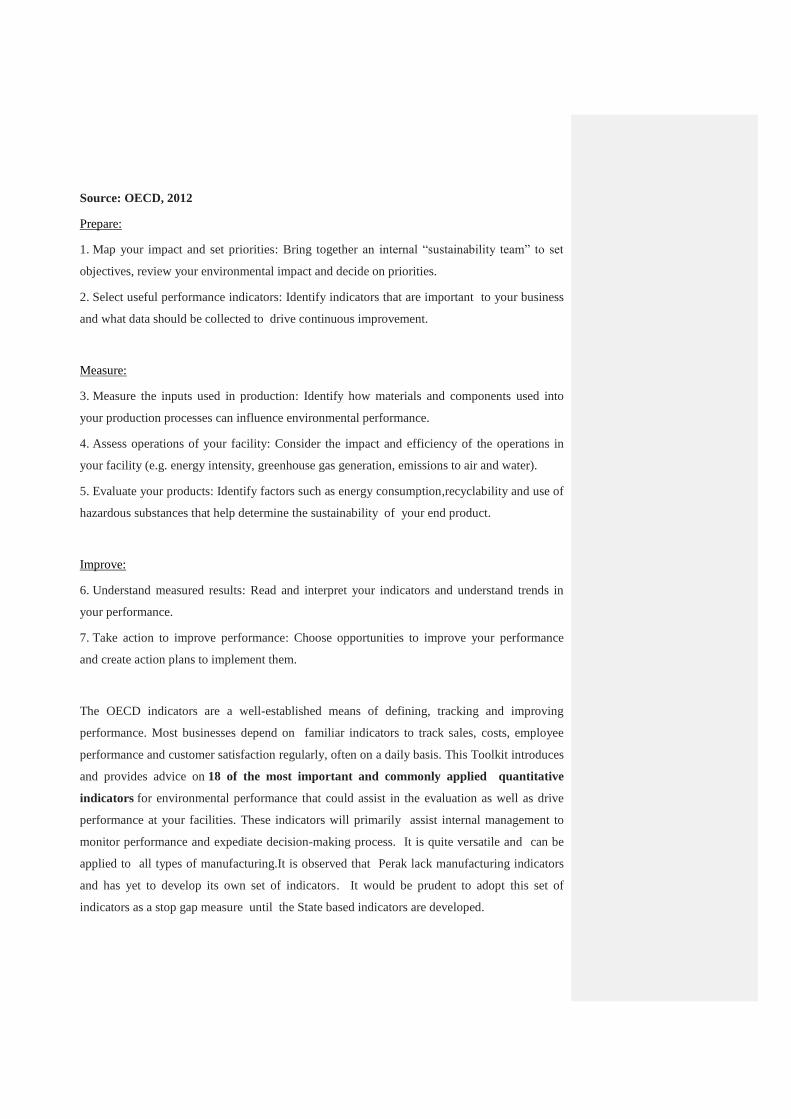
Source: OECD, 2012
Prepare:
1. Map your impact and set priorities: Bring together an internal “sustainability team” to set
objectives, review your environmental impact and decide on priorities.
2. Select useful performance indicators: Identify indicators that are important to your business
and what data should be collected to drive continuous improvement.
Measure:
3. Measure the inputs used in production: Identify how materials and components used into
your production processes can influence environmental performance.
4. Assess operations of your facility: Consider the impact and efficiency of the operations in
your facility (e.g. energy intensity, greenhouse gas generation, emissions to air and water).
5. Evaluate your products: Identify factors such as energy consumption,recyclability and use of
hazardous substances that help determine the sustainability of your end product.
Improve:
6. Understand measured results: Read and interpret your indicators and understand trends in
your performance.
7. Take action to improve performance: Choose opportunities to improve your performance
and create action plans to implement them.
The OECD indicators are a well-established means of defining, tracking and improving
performance. Most businesses depend on familiar indicators to track sales, costs, employee
performance and customer satisfaction regularly, often on a daily basis. This Toolkit introduces
and provides advice on 18 of the most important and commonly applied quantitative
indicators for environmental performance that could assist in the evaluation as well as drive
performance at your facilities. These indicators will primarily assist internal management to
monitor performance and expediate decision-making process. It is quite versatile and can be
applied to all types of manufacturing.It is observed that Perak lack manufacturing indicators
and has yet to develop its own set of indicators. It would be prudent to adopt this set of
indicators as a stop gap measure until the State based indicators are developed.
2.5.3 Sustainability in Service Sector Development
Service is an action or an activity which can be offered by one party to another, which is
basically intangible and do not affect any ownership or entail any propriety rights. Service
may be also related to tangible products or intangible products. Sustainable services are
“offerings that satisfy customer needs and significantly improve the social and environmental
performance along the whole life cycle in comparison to conventional or competing offers“.
Thus, a service is environmentally favorable when the total amount of environmental impact is
prevented as compared to an alternative where the amount of environmental impact generated
by the service is larger in comparison. .Related concepts include eco services, eco-efficient
services, product-service systems, sustainable service systems and sustainable product service-
systems.
An eco-efficient service (EES) is a certain product-service mix which has a higher added value
(economics) and a smaller environmental impact compared to a similar product-service mix or
a situation in which the activity was not performed at all. Added value applies to consumers
as well as producers. It is usually defined in terms of higher profit margins, improved image or
the ability to comply with legal standards and stipulations, regulations and rules for producers.
Added value to consumers denotes the perceived extent to which consumer needs are satisfied.
Some examples of added value to consumers are lower costs, increased flexibility, shifted
responsibility or increased convenience. On the product-service-mix there are three main
categories of sustainable services: product, use and result oriented.Each of them is
characterized by a different composition of product and service components.
Product Oriented Services :Product oriented services represent a business model which
focuses primarily on product sales. They can also be described as “product-life-extending
services” as they enhance the utility of product through warranties or maintenance services. As
a consequence for the increasing lifespan of a product,less energy, materials and machines are
needed for production, which means a positive impact on the environment. However, besides
this environmental motivation there is also an economic incentive as the usage of less resources
is also connected to lower production costs and higher business profits.Product oriented
services harmonise especially well with products that are difficult to handle and require
skilled technical expertise, or to products that require regular maintenance or supporting
infrastructure.The ownership of the product meanwhile remains completely with customer.
Therefore these services also only represent a small variation of the classical buyer-seller
relationship.
Use Oriented Services: Use oriented services differ from product oriented services as the focus
is not on selling products. As in classical renting systems, the physical good resides in the
provider’s ownership and is only made available to the consumer in different forms.
Sometimes usage is even shared by several users. Car pooling is a typical example. However,
while the consumers derive the service from the product’s function, the responsibility for
maintenance and disposal remains with the provider. The eco-efficiency impact of these
services depends on the intensity of the product’s high usage. This reduces the total number
of the required products and consequently, also lowers the material and energy inputs required
for production. Furthermore,with regards to the payment system in which customers only pay
according to the units of service used, thus this leads to an additional economic incentive for
producers to decrease the amount of resources for production.
Result Oriented Services: In the case of result related services, the sales of product not only
becomes less important but even the product itself plays minor role. Here client and provider
both focus and agree on result instead. There is no determined product involved. Instead the
focus is on the achievement of the level of satisfaction of the consumer’s need, irrelevant of
how it is satisfied. The product is owned and operated by the service provider. Profits are
therefore, correlated to efficiency and providers get a high return based on the optimized and
efficient product use to achieve a lifelong service. In addition, the offering of a result instead
of a pre-specified product makes it possible that sustainable solutions (e.g. low material and
energy consumption) can be included from the beginning.
2.6Theorization and Framework (Research & Conceptual)
This study looks at the possibility that Perak Darul Ridzuan can operate under sustainable
conditions, depicting a balanced society. A balanced society is depicted in Prescott-Allen’s
model as one where social and economic conditions are optimised through good governance,
the promotion of human wellbeing and the sound management of resource demands (Prescott-

Allen, 2006). The Prescott Allen’s Modelis highlighted in Figure 2.4: The Figure presents
the performance scores of a hypothetical country: human wellbeing 68, economy 88,
governance 59, resource demand 40, and ecosystem condition 28.As depicted in Figure 2.4,
such a balanced society draws a wider rim around these parameters of sustainability. This
wider rim involves regional programmes for water management, watershed conservation,
rebuilding soil quality, ecosystem restoration, and reforestation. Thus, all activities and sector
developmentshould to be considered within the whole human paradigm of sustainable
management, and it should contribute and elevate human progress.
Sourc: Prescott -Allen, 2006
Figure 2.4: Graphic combination of 5 pillars of a balanced society
The University of Michigan in 2002, further theorized and developed “The Three Spheres of
Sustainability” concept that is illustrated in Figure 2.5. Thistheoretical frameworkforms the
basisof this study.In the preceding section, the subject of sustainability was further
rationalisedbased on other research work carried outto ascertain the validity of the
sustainability needs that underlie the research and this outlines the analytical framework of
this study.
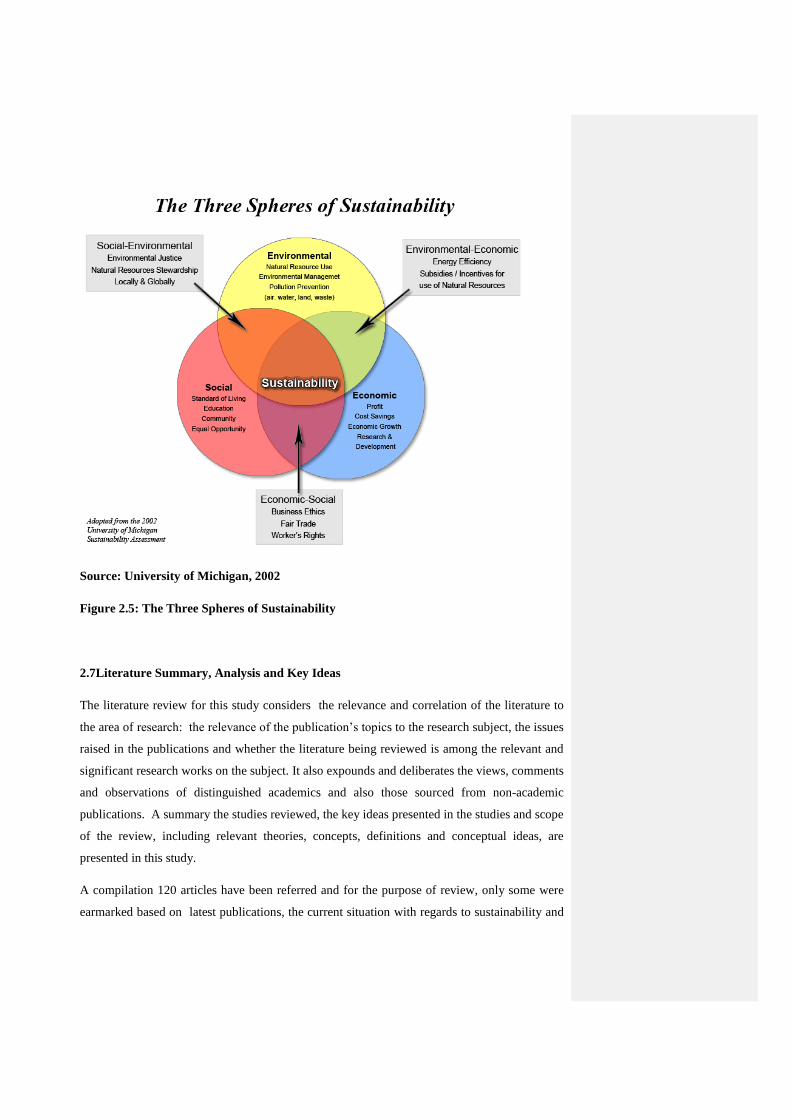
Source: University of Michigan, 2002
Figure 2.5: The Three Spheres of Sustainability
2.7Literature Summary, Analysis and Key Ideas
The literature review for this study considers the relevance and correlation of the literature to
the area of research: the relevance of the publication’s topics to the research subject, the issues
raised in the publications and whether the literature being reviewed is among the relevant and
significant research works on the subject. It also expounds and deliberates the views, comments
and observations of distinguished academics and also those sourced from non-academic
publications. A summary the studies reviewed, the key ideas presented in the studies and scope
of the review, including relevant theories, concepts, definitions and conceptual ideas, are
presented in this study.
A compilation 120 articles have been referred and for the purpose of review, only some were
earmarked based on latest publications, the current situation with regards to sustainability and
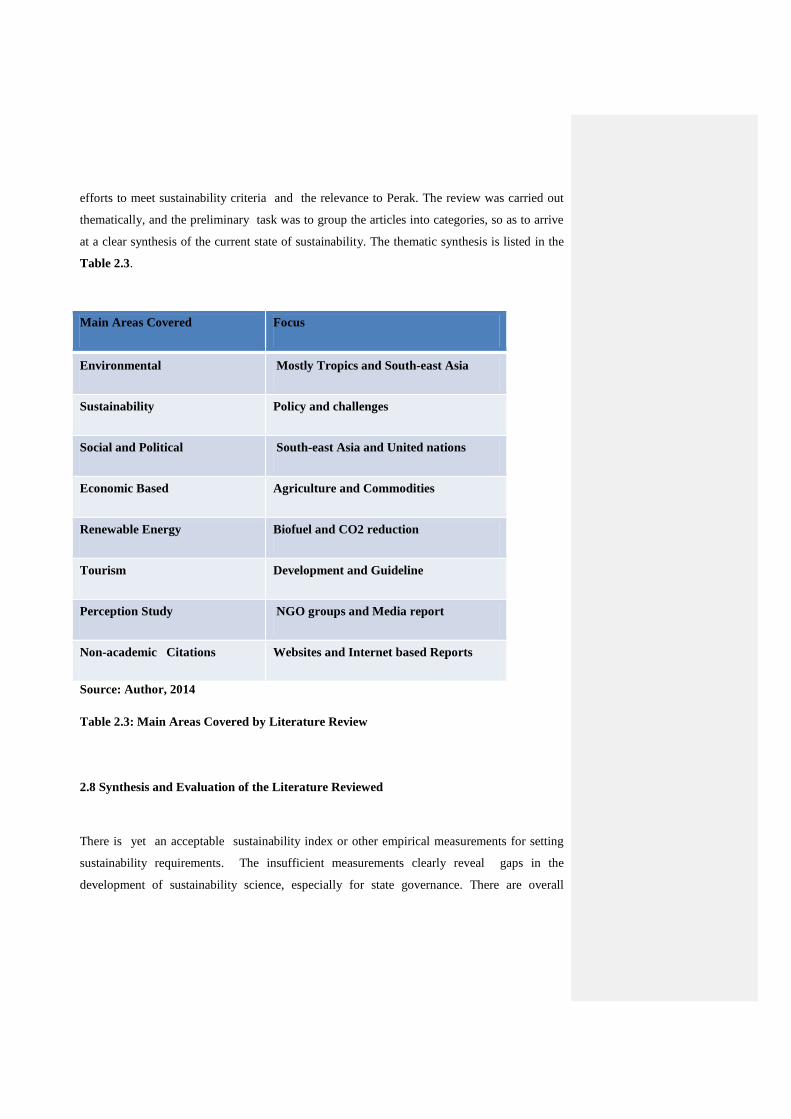
efforts to meet sustainability criteria and the relevance to Perak. The review was carried out
thematically, and the preliminary task was to group the articles into categories, so as to arrive
at a clear synthesis of the current state of sustainability. The thematic synthesis is listed in the
Table 2.3.
Main Areas Covered Focus
Environmental Mostly Tropics and South-east Asia
Sustainability Policy and challenges
Social and Political South-east Asia and United nations
Economic Based Agriculture and Commodities
Renewable Energy Biofuel and CO2 reduction
Tourism Development and Guideline
Perception Study NGO groups and Media report
Non-academic Citations Websites and Internet based Reports
Source: Author, 2014
Table 2.3: Main Areas Covered by Literature Review
2.8 Synthesis and Evaluation of the Literature Reviewed
There is yet an acceptable sustainability index or other empirical measurements for setting
sustainability requirements. The insufficient measurements clearly reveal gaps in the
development of sustainability science, especially for state governance. There are overall
principles and criteriapostulated and propagated by international agencies, yet these differ
among stakeholder groups, according to geographical locations and stakeholders’ priorities.
In the case of Perak the important sustainability criteria would include: set-up of sector based
indicators and effective stakeholder communication of sustainability efforts. However, some of
these indicators are recent in their importance and do not have sufficient historical records for a
meaningful analysis.
2.9Research, Controversies and Gaps in Existence
The challenges in setting up a system of viable sustainability scheme for the Perak Darul
Ridzuan will not be simple, as the Perak is yet to be ready and geared towards such
transparency and scrutiny in its style of functioning. Review of journals, reports and also
personal communications have brought forth and highlighted various controversies and gaps.
Some of the main controversies and gaps that have emerged are as follows:
Future Sustainability Requirements:
Scientific Tools and International Standards:
Lack of Data for Sustainability Challenges and Empirical Values for Sustainability
Measurement:
Understanding Tropical Biodiversity:
The Role of Perception:
Need for Indicators & Measurement:
Establish Credibility and Removal of Green-washing:
Future Sustainability Requirements: Most of the requirements are based on principles and
criteria adopted by stakeholder groups, but there are significant differences between the
measurements prescribed and those accepted by practitioners. This is especially true with
regards to soil management, issues relating to greenhouse gas management and also about
river and watershed management within and near plantations. All these requirements are
necessary for sustainability, and the practitioners need to be motivated and geared up to address
these gaps between the requirements and their practices.

Scientific Tools and International Standards: Scientific tools come with assumptions and
limitations, so these parameters must be accounted fairly in all calculations, and not be used
for manipulation of outcomes. International standards must be adapted and realigned to
harmonise with local conditions of each locality where they are used. They cannot be adopted
“wholesale” as discrepancies due to local conditions may become an issue later.Scientific tools
and standards such as ISO are important in international trade because incongruent standards
become barriers to trade, giving some organisations the advantage to capture and carve out
large segments of markets in certain parts of the world. Scientific tools and standards provide
clear identifiable references that are recognised internationally and encourage fair competition
in free market economies. Standards facilitate trade through enhanced product quality and
reliability, greater interoperability and compatibility, greater ease of maintenance and reduced
costs.
Lack of Data for Sustainability Challenges and Empirical Values for Sustainability
Measurement: Even though sustainability science has been propagated for more than two
decades, and the sustainability drive within the Perak is less than a decade in progress. There
are still many crucial deficiencies in the measurement regime and most criteria are based on
verbal discourses. Most important of all, there is still no acceptable index for sustainability that
has beenestablished for the State. The lack of data to support the implementation of
sustainability criteria is apparent. There has been a perpetual predicament among policy
makers and developers to meet the challenges to implement practices that are economically
viable and simultaneously adopt methods that are environment friendly, acceptable and
compliant to sustainability criteria. Yet there is no sustainability index and other empirical
measurements that determine and set sustainability requirements for the industry.
Understanding Tropical Biodiversity: For sustainability criteria to be relevant to tropical
ecosystems, the scientific tools and biodiversity database/ information that are relied upon, as
well as the policy outcomes that are sought, must be in harmony with the climatic conditions
of the tropics. Overstating its fragility or the expected loss of biodiversity just creates
unnecessary resistance from those who are already working within the tropical zone to optimise
the balance between development and conservation. On the other hand, underestimating or
denying the climatic changes that could occur also puts all stakeholders in danger of losing the
biodiversity forever.
In an article: "Have we overstated the tropical biodiversity crisis?” Laurance (2007) queries
whether the tropical biodiversity crisis has been over emphasised and blown out of proportion.
His work is supported by the vigorous debate following a study by Wright and Muller-Landau
(2006) that challenges the notion of large-scale tropical extinctions, at least over the next
century. Laurance (2007) describes this controversy and how the debate is stimulating a
serious examination of the causes and biological consequences of future tropical deforestation.
Out of the 20 studiesreviewed, seven reported higher species richness/diversity in undisturbed
(or the least disturbed) forests than in disturbed habitats, nine reported the opposite trend, three
reported no difference and one reported a strong influence of seasonality on the impacts of
logging. Some of these studies may contain inherent methodological biases resulting from the
failure to control for sampling effects, the lack of consideration for the spatial scale of analysis
and incomplete sampling of the vertical strata in tropical rainforests (Koh, 2007).
The current knowledge of coextinction is derived by: (i) considering plausible explanations for
the discrepancy between predicted and observed coextinction rates; (ii) exploring the potential
consequences of coextinctions; (iii) discussing the interactions and synergies between
coextinction and other drivers of species loss, particularly climate change; and (iv) suggesting
the way forward for understanding the phenomenon of coextinction, which may well be the
most insidious threat to global biodiversity. Paradoxically, few historical or contemporary
coextinction events have actually been recorded (Dunn et al. 2009).
The Role of Perception: Eventhough perception has been the main driver behind the
sustainability debates, perception itself has yet to be gauged well. A framework for the
management of perception-based criteria is yet to be agreed upon and proclaimed. Perception
has been used as an instrumental tool in the setting of sustainability principles and criteria in
the last decade. However, the perceptions of each stakeholder varies.
Currently, sustainability is just based on principles and criteria designed by some individual
stakeholders. There is a need for the stakeholders to understand the need for sustainability and
to reach a consensus by taking into account each other’s views. However, sustainable criteria
are to be managed with scientific and economic tools, guided by good empirical measurements,

and perception needs to managed and not manipulated for inconsistent criteria or requirement
setting.
Need for Indicators & Measurement: Unless sustainability lends itself to be measured, it will
always remain an arbitrary term that can never achieve consensus and meet stakeholder views.
Initial indicators that are important for Perak has been discussed , but further consultations with
the stakeholders is required to define these measures specifically for the locality.
Establish Credibility and Removal of Green-washing: For all sustainability related work,
certain amount of accountability between the State and its stakeholders is imperative. This is
especially true in the palm oil sector , as international perception on this industry has to
improve.
2.10 Conclusions
This study aims to address gaps and issues pertaining to sustainable development of Perak.
However, the boundaries of this study are limited and do not include political or moral issues.
The focus of the study will include:
a. Priority issues with regards to land management in the Perak, so as to lay a scientific
foundation to meet sustainability challenges and address gaps and controversies in the
development industry in Perak, and recommend possible solutions;
b. Explore stakeholder perceptions and the reality of managing sustainability for Perak;
and
c. Environmental indicators that are importnat to develop sustainable management.
CHAPTER 3
METHODOLOGY
3.1 Introduction
This chapter discusses the methodsemployed which include a stakeholder survey and
theoretical framework set-up, and description of theirrelevance to this study.The chapter also
highlights the parameters that were utilizedto design and frameboth the primary data collection
and the methods employed to analyze the data. The theoretical framework that underliesthis
study and its linkto the methodology employed is also presented here.
3.2 The Quantitative Approach
The methodology of this study is based onquantitative research. At the preliminary stage, it is
necessary to examine the models of sustainability that have been postulated in an effort to
understand their scope and recognise the implications of adopting sustainability criteria.
3.2.1 Theorisation of The Study and Supporting Theories
In recent years,sustainability science has emerged as a focus area of cross-disciplinary inquiry.
Sustainability science is yet tobecome established as an autonomous field or discipline of its
own, and is more inclined to be problem-driven and oriented towards guiding the decision-
making process.Currently, theories of sustainability have attempted to prioritise and integrate
social responses to environmental and cultural problems. For example, economic models of
sustainabilityexplore the viability of natural and financialcapital, ecological modelsexamine
biological diversity and ecological integrity, whereas political modelsscrutinizes social systems
that promote human dignity. Religion has entered the debate with symbolic, critical, and
motivational resources that aim to effectcultural change. The main economic theories that
support this work are the Neo-Malthusian theory, Kuznet’s Hypothesis and Hardin’s Tragedy
of the Commons.

3.3 Theoretical and Conceptual Framework
The analytical framework to ascertain the validity of the sustainability needs that underlie the
research, is based on the palm oil industry, as it is reckoned as the best example that exists to-
date. In Figure 3.1a visual map is presented to highlight the relationship between the
conceptual framework andthe oil palm industry.It depicts how themanagement of oil palm
plantations is linked to the Neo-Malthusian Theory,which is acknowledged as most relevant to
palm oil production, the stakeholder groups and the economic, environmental and social
rationale for the current state of the oil palm industry. Thisprovides the clarity to indicate the
link between sustainable production of palm oil and the growth of oil palm plantations,with the
Neo-Malthusian Theory as the basis for the increasing production of palm oil.
Source: Aikanathan, et. al., 2014
Figure 3.1: Theoretical Framework for the Sustainability of the Palm Oil Industry
There are two elements of interest in relation to the sustainable development of the State of
Perak.The first is the requirement thatsustainably managed land (as a natural resource) and the
second is the ever-changing demands of stakeholders that are increasing imposed on the State’s
natural resources. For good governanceto prevail in sustainable development, it is crucial to
manage the following: product demand, stakeholder perceptions of sustainability and the
variables or indicators or determinants for sustainable management and development of the
State. Figures 3.2presents the graphic linkagesamong all the identifiedelements.

Source: Author, 2013
Figure 3.2: Theoretical Framework for Perak Sustainability
3.4 Linking Framework to Methodology
In the endeavour to establish the research methodologies, the literaturethat was reviewed was
correlated to economic theories to validate the choice of suitable indicators that would form the
basis for data collection. Since this study encompassesthe environment, social and economic
sectors, a qualitative method isrelied upon to analyze both the primary data (from a stakeholder
survey) and secondary data (from literature review), using the determinants/variables derived
from the social, economic and environmental sectors.
3.5 Survey, Primary Data Collection and Sample of Data
The design of the survey form was based on the literature review and guided by other survey
forms.The detailed survey form is enclosed in Appendix 1
3.6Survey and Construction of Questionnaire
The questionnaire was constructed and administered at focus group meetings organised by
representatives of the Perak Darul Ridzuan stakeholder groups. Questionnaires were
administered to the respondents by research staff and volunteers. Clear, detailed instructions
were given in each case, matching the needs of each group of audience.The construction of the
questionnaire was based on examples of survey work carried out by University Malaya and the
Malaysian Palm Oil Council. The questionnaire comprisedclose-ended questions,
whererespondents’ answers were limited to a defined set of responses.The types of closeended
questions include:
Yes/no questions - The respondent answers with a “yes” or a “no”.
Scaled questions - Responses are graded on a continuum (example: Rate the
appearance of the product on a scale from 1 to 10, with 10 being the most preferred
appearance).
3.7Limitations
The research is confined to the largest and more visible component of the State of Perak in
Malaysia. Quantitative focus group surveyswere conducted on Perak’ssix main stakeholder
groups, namely private sector, public sector, NGOs, local communities and media. The data
from this quantitative study will depict a three-dimensionalperspective of managing the
resources of Perak. The results from this survey were used to run a social sciences statistical
package (SPSS).
The focus group survey of the industries was targeted at the six main stakeholder groups in
Malaysia. The data from this quantitative study depicts six-point views of managing the palm
oil industry. Data collection was carried out byinterviewer-administered questionnaires through
focal group surveys. The study population consists ofsix stakeholder groups, namely:Public
Sector(government employees), Private Sector (local community & self), Societies & NGOs
(local community), Media(networks/press/internet), Non-Resident (Living Short term in
Perak), Young Adults/Youth/Children(schooling/college).Itis necessary to highlight that the
focus areaof this study was limited, and the data was collected essentially from Perak only, and
confined to Malaysian perspective only.
3.8 Analysis and Write-up
The data analysis was divided according to the tools that could be utilised to process the
information gathered.The methods of analysis also differed for the primary and secondary
information.
In order to undertake the analysis,the following tasks were performed:
i. An evaluation was conducted to select a suitable method of analysis to meet the
objectives of the study
ii. The frame of reference was assessed to ensure correct interpretation of the results
iii. The relevance and significance of the findings of the data analysis were examined.

Chapter 4
PERCEPTION - REVIEW, FINDINGS AND ANALYSIS
4.1 Introduction
This chapter focuses on perceptionswith regards to the State of Perak DarulRidzuanand the
influence of development on sustainability. It includes a review of current and previous articles
that may have impacted perceptions. In the course of this study, surveys were conducted
amongthe industry stakeholders to obtain their perceptionson sustainability, their level of
awareness about sustainable development and their observations about the concept.
4.2 Previous Work that Discusses Perceptionswith Regards to Perak and Malaysia
A series of publications and articles which examine and deliberate views and perceptionswith
regards to sustainability has been compiled in this study.They encompass varying
opinionsaboutthe sustainability and development, especially sustainability in palm oil industry
and health-related issues. A selection of the articles is discussed below, to indicate the wide
spectrum of perceptions and views that exist among writers.
McNamara claims in his paper entitled “Palm Oil and Health: A Case of Manipulated
Perception and Misuse of Science” that national campaigns were successfullyundertaken to
persuade and induce food manufacturers to cease the inclusion of tropical oils, including palm
oil, in the production of their products and to replace them with hydrogenated vegetable oils,
resulting in increased intakes of trans-fatty acids. Later, however, these oils became the target
of the same advocacy groups over the health concerns associated with trans-fatty acids.
Currently, palm oil is touted as a suitable replacement for hydrogenated vegetable oil
(McNamara, 2013).
MPOC in their publication,“A Fair Trade Approach for Promoting Food Security and Ensuring
Supply Sustainability in Oils & Fats Trade” commented on the need for fair trade practices and
regulations to be applied to the trade in oils and fats. . It is the view that if unfair practices and
regulations are allowed to be practised , such as measures to limit deforestationof tropical
jungles which essentially would curb and restrict the growth of the oil palm industry. Thus,
this strategy can manifest by lowering food production and consequently driving up food prices
and jeopardisingfood security (Basiron, 2011). Unwarranted perception about the palm oil has
prompted the industry to adopt a hard-line approach” with many of the consuming nations.
Perception management is found to be necessary to promote the “fair trade approach” to the
product.Agriculture is an important sector in Perak as this sector contributes around 14% per
annum to the Gross Domestic Product (GDP) of Perak, and important sector for achieving
sustainability status as adherence and compliance to sustainability standards will bring about much
impact.
Perak is a land of immense natural diversity, stunning nature landscape, attractive national
heritage and fabulous food. For instance, Perak owns Malaysia most important archaeological
site, oldest botanical garden, tallest waterfall, oldest rainforest, and abundance of limestone
hills and caves that are reputed to be between 250 and 350 million years old in Kinta Valley.
Besides, the capital city – Ipoh is seen as a popular rest stop on the North-South Highway
between Kuala Lumpur and Penang. All these advantages make Perak - a state with a bright
potential to become one of the country’s major tourist and visitor destination.For the State of
Perak, acknowledgement of sustainable management of the state tourism icons has been the
primary motivation, spurring and leading the path in sustainability drive. In this context,
Tourism Perak has beenrewarding and awarding NGOs on their sustainable tourism work, to
acknowledge their work, responsible policies and sustainable activities. These NGOs have
formed partnerships with the State and “we have managed to stay relevant to the cause through
adaptation and achieved our objectives with strategic action and the spirit of volunteerism”
(Perakheritage, 2014).
The Malaysia Sustainable Cities Program (MSCP) is a five-year effort, initiated and managed
by faculty at the Massachusetts Institute of Technology (MIT) and the Universiti of Teknologi
of Malaysia (UTM) with the support of the Ministry of Education Malaysia. The MSCP
mission is to study and document sustainable city development efforts in Malaysia
(http://malaysiacities.mit.edu/about).
The program has been established to understand national and state-level policies and
legislations that shape the scope and quality of urban development. It includes regulations and
procedures governing the ways in which stakeholders and the public-at-large are allowed or
encouraged to participate in infrastructure and development planning. The strategies pursued
by private interests based on financial, political and technical considerations to proceed with
development projects should be harmonised with the role that civil society plays in promoting
sustainability as a goal in Malaysia. The MalaysiaSustainable Cities Program is focused on
four major cities:
Johor Bahru: A vibrant coastal city on the southernmost tip of peninsular Malaysia,
with close proximity and economic ties to Singapore.
Kuala Lumpur: The federal capital and most populous city of Malaysia.
Putrajaya: The federal capital’s nearby, planned government administrative center.
George Town: A historically important island port city, UNESCO World Heritage Site
and the capital of Penang.
The definite lack of participationin a national scale program like this by other towns in Perak
is a clear indicator that the State has toupscaleits sustainability efforts, to be in the same league
as Penang, Johor and Selangor.
From these articles alone, it can be seen that the conclusions and perceptions derived from each
paper is very much geared towards the directionthat the author wishes to emphasiseand the
viewpointthat is aimed to be propagated. The diversity of opinionsas seen in thedifferent
articles, show that perceptions can be shaped according to the inclination of the writers, and the
targeted audience could be persuaded to accept such views in the long run.
4.3Current Perceptions or Mental Paradigms about Perak
There are many stakeholders or players or “actors” in the various sectors that impact
sustainability and in Perak, they would include:
I. Federal Government Agencies: The Prime Minister’s Office, The Federal Economic
Planning Unit, Ministry of Plantation Industries and other federal agencies.
II. State Government Agencies: The MenteriBesar’s Office, The State Economic Planning
Unit, The State Development Corporation (SEDC) and other state agencies.
III. Sectoral Groups: the public sectors, the private sectors and related companies, media
and its related agencies, youth and school-going citizens.
IV. Work Force Groups: the various sectors and their workforce including workers’union,
executive staff, non-executive staff, and foreign labour.
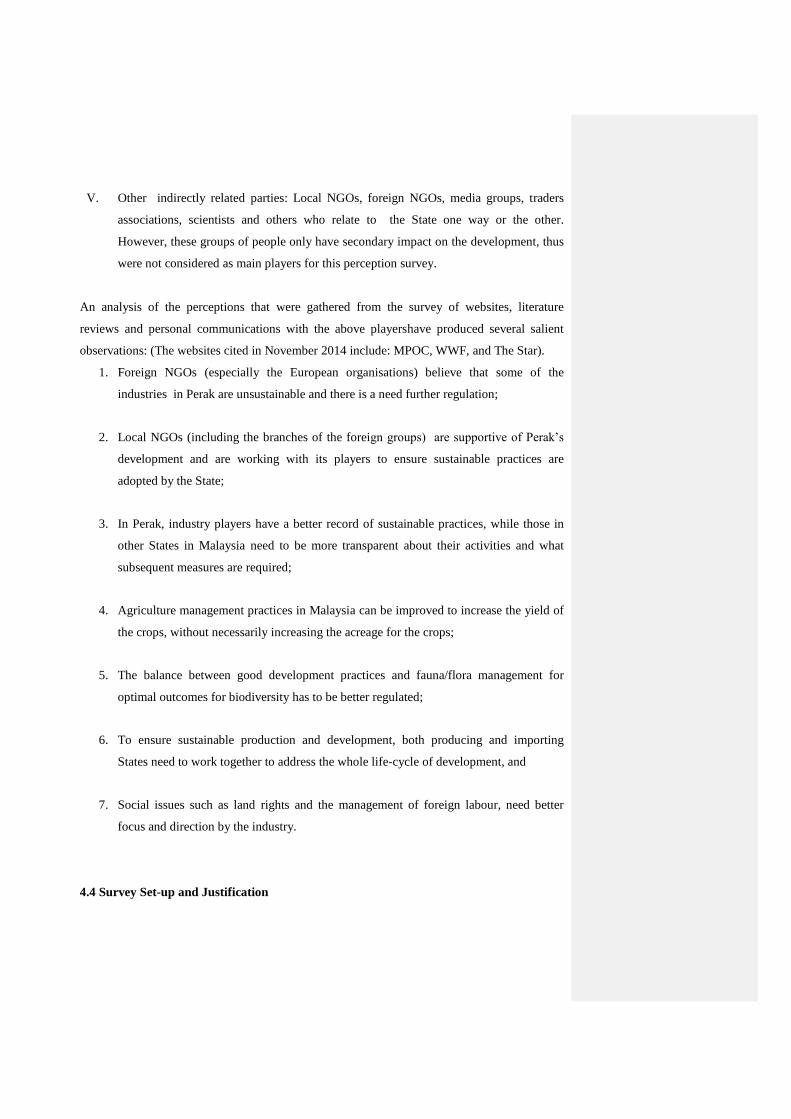
V. Other indirectly related parties: Local NGOs, foreign NGOs, media groups, traders
associations, scientists and others who relate to the State one way or the other.
However, these groups of people only have secondary impact on the development, thus
were not considered as main players for this perception survey.
An analysis of the perceptions that were gathered from the survey of websites, literature
reviews and personal communications with the above playershave produced several salient
observations: (The websites cited in November 2014 include: MPOC, WWF, and The Star).
1. Foreign NGOs (especially the European organisations) believe that some of the
industries in Perak are unsustainable and there is a need further regulation;
2. Local NGOs (including the branches of the foreign groups) are supportive of Perak’s
development and are working with its players to ensure sustainable practices are
adopted by the State;
3. In Perak, industry players have a better record of sustainable practices, while those in
other States in Malaysia need to be more transparent about their activities and what
subsequent measures are required;
4. Agriculture management practices in Malaysia can be improved to increase the yield of
the crops, without necessarily increasing the acreage for the crops;
5. The balance between good development practices and fauna/flora management for
optimal outcomes for biodiversity has to be better regulated;
6. To ensure sustainable production and development, both producing and importing
States need to work together to address the whole life-cycle of development, and
7. Social issues such as land rights and the management of foreign labour, need better
focus and direction by the industry.
4.4 Survey Set-up and Justification
The survey covered the citizensof Perak and its main stakeholders. It was administered
through focus group meetingssince December 2013. The survey respondents were made of
stakeholdergroupsas listed on the questionnaire (Appendix 1). There were 40questionnaires
which were answered bytop and middle management respondents from among the
stakeholders.The survey results were coded and the SPSS package was used to determine the
correlations among the responses.
4.5Frequently Used Terms and TheirDefinitions
There are many terms used in this chapter that may give rise to varied interpretations. In the
interest of standardising what they stand for, the following list of definitions has been compiled
for this study in particular:
Stakeholder: A citizen or person or group of persons with an interest in or concern for the
State of Perak DarulRizduan. The term includes individuals involved in the industry and
companies related to the State development, progress and overall stability.
Indicators: An element, feature, or factor that is liable to vary or change or affect the State’s
development, growth and establishment.
Issue: An important topic or problem for debate or discussion in the State of Perak
DarulRidzuan.
Sector: An area or portion that is distinct from others. For this study, the divisionsamong the
issues are manufacturing, tourism, services and agriculture.
Environmental Issues: Negative aspects of human activity on the biophysical
environment.For the State, they would include deforestation, water and air pollution and
greenhouse gas emissions.
Social Issues: Matters which directly or indirectly affect a person or many members of a
society and are considered to be problems.For the State, they would include transgression of
traditional land rights, low and inconsistent wages and the disregard of cultural rights.
Economic Issues:Problems faced by society and business operators on how to allocate scarce
resources for the provision of goods and services. For the State, this would include the price of
land, the cost of development, workers’ wages andthe price of goods.
Governance Issues: Problems related to governing or managing the State. Good governance
relates to consistent management, cohesive policies, guidance, processes and decisions for the
sustainability of the State development.
Local Community: A group of interacting people sharing or affected by the environment or
development in Perak.
Non-governmental Organisations (NGOs):Legally constituted organisations created to
operate independently from any form of government, sometimes considered as watch-
dogs. NGOs, depending upon their constitution, may or may not be charitable and propagate
issues related to environmental, social and economic matters. Examples of NGOs that deal with
the Perak are Global Environmental Center (GEC), Transparency Internationaland World
Wildlife Fund (WWF).
Manufacturer:A person or groups of individuals, including corporations, involved in
organised actions forthe production of goods and providing services.
Media: Those involved in communication channels via broadcasting and narrowcasting
medium such as newspapers, magazines, TV, radio, billboards, telephone, internet, etc.
4.6 Identification of Stakeholder Groups and Their Priority with Regards to Sectorial
Indicators
The stakeholders were given a list of indicators to prioritise, as listed in Table 4.1. The
stakeholders interviewed were asked to rank the indicators according to their prioritiesin their

sector. These indicators were chosen based on the literature review and secondary data
collected.
Table 4.1: List of Indicators Presented for Ranking
Indicators Description of Indicators with State Development
Infra-structure
Development
The basic physical systems of the State. Transportation,
communication, sewage, water and electric systems are all
examples of infrastructure. These systems tend to be high-cost
investments, however, they are vital to a country's economic
development and prosperity. Infrastructure projects may be
funded publicly, privately or through public-private partnerships.
Mining Industry Mining as the action, process, or industry of extracting ores and
other materials from mines. It includes any activity that fits the
definition of mining, irrespective of whether the activity relates
to private individuals, organisations whose principal business is
not mining (for example, companies involved in diverse
industries), or organisations whose principal business is mining.
In some instances, the first stage of processing, known as
primary processing, is included. Examples of primary processing
include the refining and transformation of ores to basic forms.
Tourism Industry The industry of providing customer service to travellers or
strangers. Hospitality professionals generally work in
administrative or management positions in a service-based
environment, and they are responsible for overseeing the
operations and success of an establishment, such as a hotel or
restaurant. The hospitality and tourism industry is diverse, and
includes many locations including RV parks, food
establishments, recreational facilities, campgrounds, boarding
houses and youth hostels. While the overall goal of a hospitality
professional is to ensure that guests and customers have
pleasurable experiences, they can also be responsible for
operations, such as hiring and training new staff; supervising
office and financial administration; housekeeping, maintenance,

and security staff; and marketing.
Political
Governance
Politics is the practice and theory of influencing other people on
a global, civic or individual level. More narrowly, it refers to
achieving and exercising positions of governance — organized
control over a human community, particularly a state.
Furthermore, politics is the study or practice of the distribution of
power and resources within a given community (a hierarchically
organized population) as well as the interrelationship(s) between
communities.
Governance refers to "all processes of governing, whether
undertaken by a government, market or network, whether over a
family, tribe, formal or informal organization or territory and
whether through laws, norms, power or language." It relates to
processes and decisions that seek to define actions, grant power
and verify performance.
Source: Author, 2013
4.7Perception Survey Limitations and Operational Details
As there have not been many perception surveys conducted previouslyon sustainability of
Perak DarulRidzuan and almost none on land matters, this survey was designed to obtain
structured input from the stakeholders identified. The survey was designed with close-ended
questions, so that the results would be easier to tabulate. (The detailed questionnaire is attached
in Appendix 1.)
The surveys were also focused on Perak and Perakian issues with regards to sustainable
development, with the six main stakeholder groups as respondents, namely private sector,
public sector, NGOs and the media. They survey was designed to find out whether the industry
knew about sustainability issues, whether they were keen to participate in advancing
sustainable development and how they related to matters that affect the State of Perak
DarulRidzuan.
4.8Questionnaire Administered for Assessing Stakeholder Perceptions

The questionswere administeredin 2 parts to find out thestakeholders’ exposureto the issue of
sustainability and theirprojects by importance in Perak.
Part A: Information was sought aboutthe stakeholders and how they rankedthe
sectorsaccording to their perceived importance, and;
Part B: This part was aimed at establishing the priority of the stakeholders’ project in Perak.
4. 9Survey Results Part A
There were 60 respondents interviewed during the survey period, from the focus group
gatherings carried out at meetings organised by the State. The breakdown of the stakeholders
interviewed were 10 persons for each category.
Table 4.2: Stakeholder’s sector preference
Representation
Sectors Public Sector
Private Sector NGOs Media
Non- Resident
Young Adult
Infra-structure Development
5 6 3 2 5 4
Mining Industry
2 1 2
Tourism Industry
2 3 5 3 5 4
Political Governance 1
2 3
2
Table 4.2depicts the sectoral preference for each of the stakeholder groups interviewed. This
result was also tabulated into a histogram in Figure4.1 for easier visualization.

Figu
re
4.1:
Stak
ehol
der
Gro
ups
Perc
epti
on
via Histogram
The number of persons surveyed for each stakeholder group is depicted in Figure 4.1. All the
surveys were carried out in Perak, largely with a Malaysian perspective. Thestakeholders were
asked to rank their perceptions on important sectors: infra-structure development, mining,
tourism, and governance sectors. (The issues relating to each of these sectors have been
described in Table 4.1). Theoverall results of the stakeholders’rankings aredepicted in Figure
4.1.
From Figure 4.1, it can be derived that the public and private sectors felt that the infra-
structure development was most important for them. The young adults and non-residents
gave equal weightage to infra-structure and tourism. The NGOs and non-residents felt that
tourismsector is most important for them, while the local media’s attention was distributed
evenly on all sectors listed for the State. .
4. 10 Survey Results from Part B: Import Project for Perak Stakeholders
This part of the survey was aimed at establishing the priority of the stakeholders’ projects in
Perak. The stakeholders were required to list the projects that they felt were important
according to each one’s perception. The projects are enumerated in the tables below.
0
1
2
3
4
5
6
Public Sector
Private Sector
NGOs Media Non-Resident
Young Adult
Stakeholder's Ranking of Important Issues
Infra-structure Development
Mining Industry
Tourism Industry
Political Governance
Stakeholder Groups
No of Persons

Table 4.3: Public Sector Important Projects
Stakeholder: Public Sector
Sector Infra-structure
Sector Manufacturing Industry
Sector Mining
Sector Tourism Industry
Political governance
Sector Others
1. Housing Latex
2 Public transport Tyre factory
3 Road Biotechnology for waste water treatment plant
4 Telecommunications system
5 Solid waste plant
6 Bird watching
7 Hotel & homestay
8 Corruption network
9 tin mining
Iron Ore (Vale)
Table 4.3 indicates that the public sector in Perak views the development of infra-structure as
most important. However, projects in the other sectors are viewed as equally important but
require good governance.
Table 4.4: Private Sector Important Projects
Stakeholder: Private Sector
Sector Infra-structure
Sector Manufacturing Industry
Sector Mining
Sector Tourism Industry
Political governance
Sector Others
1 Housing Eco-town (Taiping)
2 Gas pipeline to factory in Kemunting/ Taiping
Community based tourism
Udanggalah rearing
3 housing Transport for tourist destinations
Poultry processing plant
4 Road
5 Port
6 International Airport
Table 4.4 indicates that the private sector in Perak views the development of infra-structure,
tourism and farming as important but arenot concerned about good governance. The mining
and manufacturing sectors were not considered.

Table 4.5: Important Project for the Societies and NGOs
Stakeholder: Societies/ NGOs
Sector Infra-structure
Sector Manufacturing Industry
Sector Mining
Sector Tourism Industry
Political governance
Sector Others
1 Tourism facilities e.g. hotel, tourism information center
2 Medical tourism
3 Responsible tourism
4 Restaurant
5 Tourist information center
6 Heritage building
7 Affordable housing
8 Public transport
9 Law enforcement on corrupted people
10 Awareness campaign on the concept of Good Governance
Table 4.5 indicates that the societies and NGOs in Perak view the development of infra-
structure and tourism as most important and were very concerned about good governance. The
mining and manufacturing sectors were not considered.
Table 4.6: Important Projects for media Groups
Stakeholder: Media
Sector Infra-structure
Sector Manufacturing Industry
Sector Mining
Sector Tourism Industry
Political governance
1 Telecommunications system
2 Hydro power plant
3 Bird watching
4 Health tourism
5 Iron Ore (Vale)
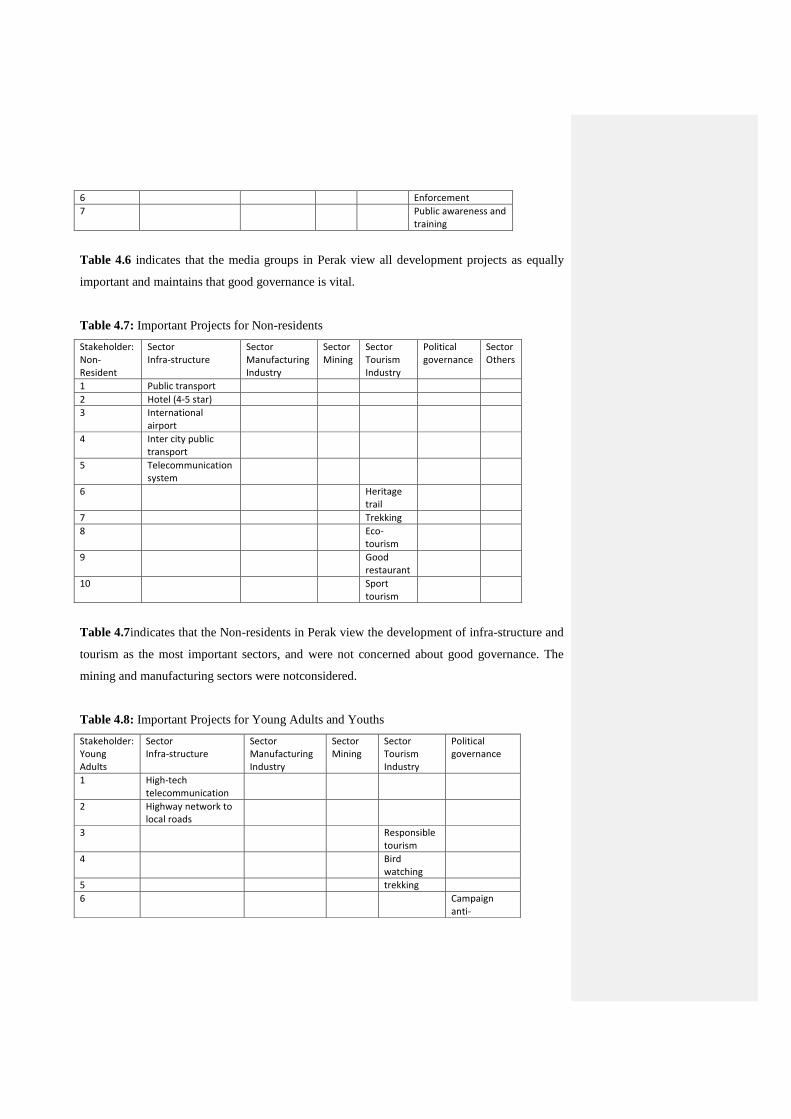
6 Enforcement
7 Public awareness and training
Table 4.6 indicates that the media groups in Perak view all development projects as equally
important and maintains that good governance is vital.
Table 4.7: Important Projects for Non-residents
Stakeholder: Non-Resident
Sector Infra-structure
Sector Manufacturing Industry
Sector Mining
Sector Tourism Industry
Political governance
Sector Others
1 Public transport
2 Hotel (4-5 star)
3 International airport
4 Inter city public transport
5 Telecommunication system
6 Heritage trail
7 Trekking
8 Eco-tourism
9 Good restaurant
10 Sport tourism
Table 4.7indicates that the Non-residents in Perak view the development of infra-structure and
tourism as the most important sectors, and were not concerned about good governance. The
mining and manufacturing sectors were notconsidered.
Table 4.8: Important Projects for Young Adults and Youths
Stakeholder: Young Adults
Sector Infra-structure
Sector Manufacturing Industry
Sector Mining
Sector Tourism Industry
Political governance
1 High-tech telecommunication
2 Highway network to local roads
3 Responsible tourism
4 Bird watching
5 trekking
6 Campaign anti-
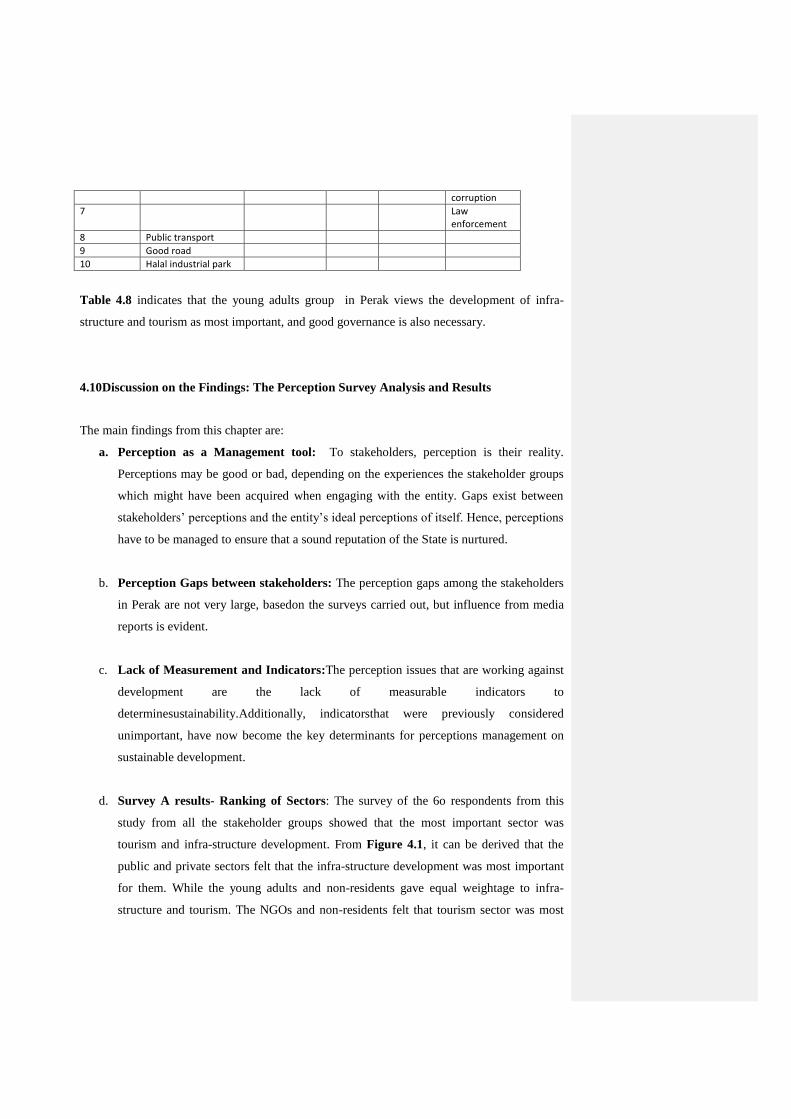
corruption
7 Law enforcement
8 Public transport
9 Good road
10 Halal industrial park
Table 4.8 indicates that the young adults group in Perak views the development of infra-
structure and tourism as most important, and good governance is also necessary.
4.10Discussion on the Findings: The Perception Survey Analysis and Results
The main findings from this chapter are:
a. Perception as a Management tool: To stakeholders, perception is their reality.
Perceptions may be good or bad, depending on the experiences the stakeholder groups
which might have been acquired when engaging with the entity. Gaps exist between
stakeholders’ perceptions and the entity’s ideal perceptions of itself. Hence, perceptions
have to be managed to ensure that a sound reputation of the State is nurtured.
b. Perception Gaps between stakeholders: The perception gaps among the stakeholders
in Perak are not very large, basedon the surveys carried out, but influence from media
reports is evident.
c. Lack of Measurement and Indicators:The perception issues that are working against
development are the lack of measurable indicators to
determinesustainability.Additionally, indicatorsthat were previously considered
unimportant, have now become the key determinants for perceptions management on
sustainable development.
d. Survey A results- Ranking of Sectors: The survey of the 6o respondents from this
study from all the stakeholder groups showed that the most important sector was
tourism and infra-structure development. From Figure 4.1, it can be derived that the
public and private sectors felt that the infra-structure development was most important
for them. While the young adults and non-residents gave equal weightage to infra-
structure and tourism. The NGOs and non-residents felt that tourism sector was most
important, while the local media’s attention was distributed evenly on all sectors listed
for the State. This perception differsfrom the media group and other stakeholder groups
surveyed.
e. Survey B results – Important Projectsfor Stakeholders Groups:The survey showed
that the stakeholders were aware of the sustainability requirements for the State of
Perak DarulRidzuan. Their views on sectors indicate the need for good infra-structure
in Perak and also an overall push to promote tourism in the State. Good governance is
also deemed as vital.
f. The Forward Plan:With the obvious gap between what the stakeholders perceivedand
what is actually required for sustainability in managing the Perak State affairs, there is a
need to accelerate intensive awareness for all categories of stakeholders. As for the
differing media perception, if it is deemed as skewed,it should be corrected with
strategic communications via research and government outreach programs.
There is also a need to bridge the gap among the four key groups of industry
stakeholders via data from this study, outreach and awareness campaigns. The
perception survey has clearly shown the difference in opinion amongst the stakeholders
and also the lack of knowledge.The need for the government or the State to ensure
balanced growth via key agencies e.g. MBInc, IDR, SEDC and MPOA is also apparent,
especially in the area of greater environmental awareness. This surveyalso indicate that
there is a need to balance out the skewed viewsemerging from third party information
sources.
4.11Overall Summary
Sustainable science is an important element ofmanagement.Theissues are linked with the lack
of measurable indictors and differing needs amongst stakeholders. The perception of the media
also important as it can create impressions among the stakeholders which could impact the
acceptability of State related matters.

Perception is an important tool in sustainability and the lack of measurable indicators for
sustainability creates unwarranted demandsby the stakeholders. The need for acceptable and
scientifically unbiased measurementis clear, especially for new requirements or measurements.

CHAPTER 5
SUSTAINABILITY INDICATORS
5.1 Introduction
There is a need to measure sustainability, and for this indicators are commonly used. There is
nothing wrong with measuring and comparing. We all set goals and use indicators to measure
our progress towards those goals. The problem with measurement is that sometimes we forget
what the goal is and just worry about the indicators. The measurement becomes more
meaningful than the goal and we start to define ourselves in terms of what we measure, not
what we want to be.
5.1.2 What is an indicator? What are sustainability indicators?
Sustainability measurement is the quantitative basis for the informed management
of sustainability. The metrics used for the measurement of sustainability are still evolving: they
include indicators, benchmarks, audits, indexes and accounting, as well as assessment,
appraisal and other reporting systems. They are applied over a wide range of spatial and
temporal scales.
The principal objective of sustainability indicators is to inform public policy-making as part of
the process of sustainability governance. Sustainability indicators can provide information on
any aspect of the interplay between the environment and socio-economic activities.
Indicators are a way to measure. Measuring isn't new and we measure all the time. Other
studies or sciences would use variables for measurements. Some of the best known and most
widely used sustainability measures include corporate sustainability reporting, such as Triple
Bottom Line accounting, and estimates of the quality of sustainability governance for
individual countries using the Environmental Sustainability Index and Environmental
Performance Index. (Wikipedia, 2014)
Sustainable development indicators [SDIs] provide an empirical and numerical basis for
evaluating performance, for calculating the impact of our activities on the environment and
society, and for connecting past and present activities to attain future goals. These indicators
should be able to give a broader, clearer state of the phenomenon. Hence, sustainable
development should address not only economic growth but also social progress and
environmental protection, the three pillars of sustainable development being interdependent.
Without a proper measurement to track all types of valuable assets, we will lose these assets
without realizing it (WWF, 2010).
5.1.3 Environmental Sustainability Index and Environmental Performance Index
The Environmental Sustainability Index (ESI) was a composite index published from 1999 to
2005 that tracked 21 elements ofenvironmental sustainability covering natural resource
endowments, past and present pollution levels, environmental management efforts,
contributions to protection of the global commons, and a society's capacity to improve its
environmental performance over time.The ESI was published between 1999 to 2005 by Yale
University's Centre for Environmental Law and Policy in collaboration withColumbia
University's Centre for International Earth Science Information Network (CIESIN), and
the World Economic Forum.The Environmental Sustainability Index was developed to evaluate
environmental sustainability relative to the paths of other countries.
Due to a shift in focus by the teams developing the ESI, a new index was developed,
the Environmental Performance Index (EPI) that uses outcome-oriented indicators, then
working as a benchmark index that can be more easily used by policy makers, environmental
scientists, advocates and the general public.The EPI has been published in 2006, 2008, and
2010.
5.2 Malaysian Sustainability Measurements
Since the concept of sustainable development arose, the Malaysian governmenthas sought to
promote holistic development. It began to implement proactive policies and strategies
atdifferent levels from the 7th Malaysia Plan onwards. In the Malaysian context, assessments
of sustainable development have beenattempted firstly by a Malaysian group of non-
governmentalorganizations (NGOs) to establish its own set of SDIs to assess Malaysia’s
sustainabledevelopment performance.
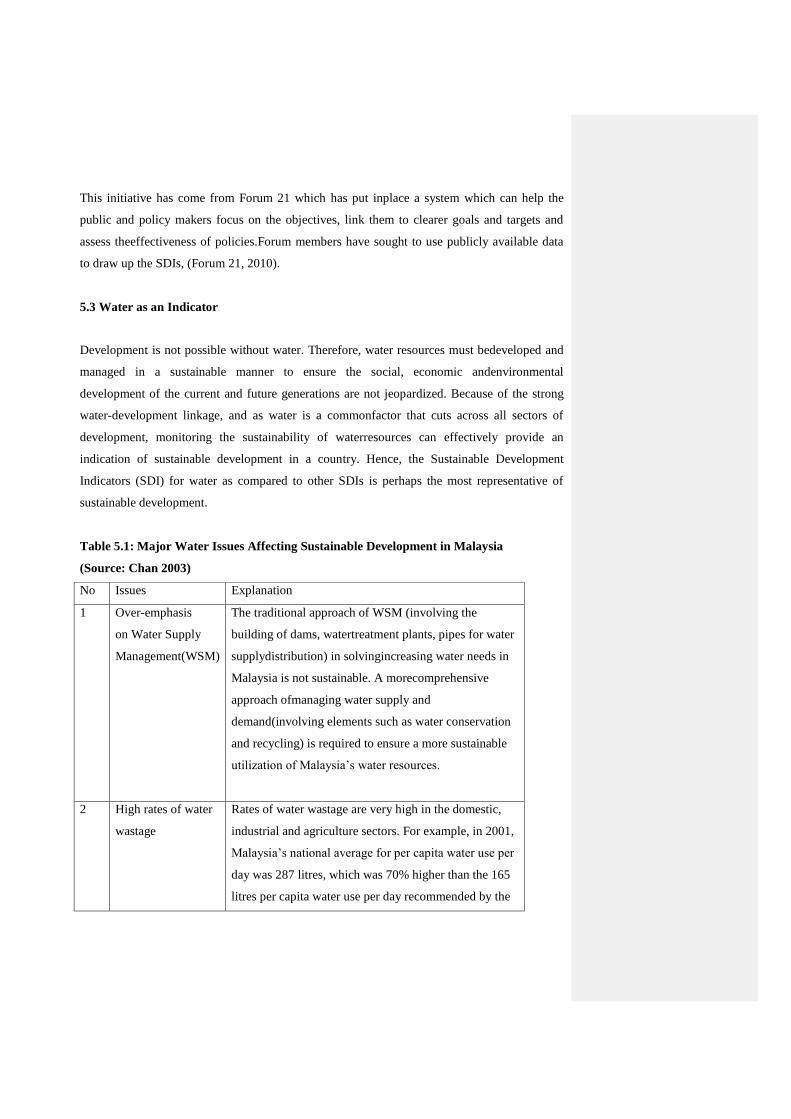
This initiative has come from Forum 21 which has put inplace a system which can help the
public and policy makers focus on the objectives, link them to clearer goals and targets and
assess theeffectiveness of policies.Forum members have sought to use publicly available data
to draw up the SDIs, (Forum 21, 2010).
5.3 Water as an Indicator
Development is not possible without water. Therefore, water resources must bedeveloped and
managed in a sustainable manner to ensure the social, economic andenvironmental
development of the current and future generations are not jeopardized. Because of the strong
water-development linkage, and as water is a commonfactor that cuts across all sectors of
development, monitoring the sustainability of waterresources can effectively provide an
indication of sustainable development in a country. Hence, the Sustainable Development
Indicators (SDI) for water as compared to other SDIs is perhaps the most representative of
sustainable development.
Table 5.1: Major Water Issues Affecting Sustainable Development in Malaysia
(Source: Chan 2003)
No Issues Explanation
1 Over-emphasis
on Water Supply
Management(WSM)
The traditional approach of WSM (involving the
building of dams, watertreatment plants, pipes for water
supplydistribution) in solvingincreasing water needs in
Malaysia is not sustainable. A morecomprehensive
approach ofmanaging water supply and
demand(involving elements such as water conservation
and recycling) is required to ensure a more sustainable
utilization of Malaysia’s water resources.
2 High rates of water
wastage
Rates of water wastage are very high in the domestic,
industrial and agriculture sectors. For example, in 2001,
Malaysia’s national average for per capita water use per
day was 287 litres, which was 70% higher than the 165
litres per capita water use per day recommended by the
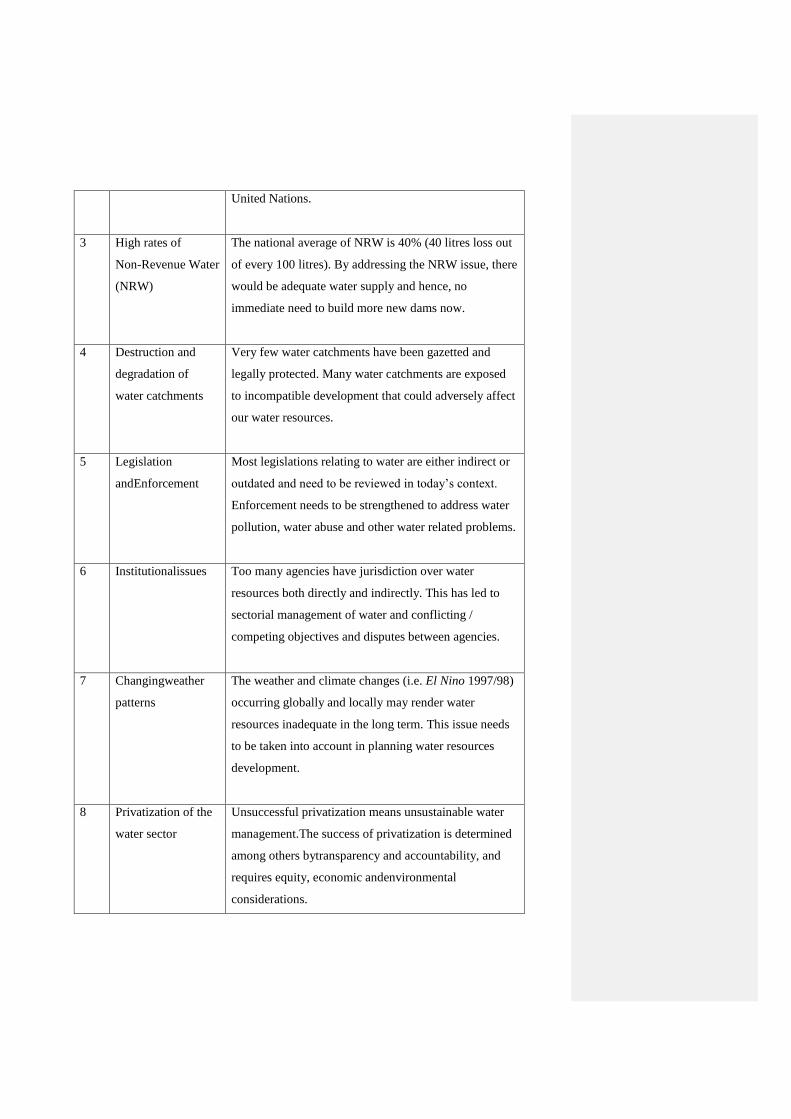
United Nations.
3 High rates of
Non-Revenue Water
(NRW)
The national average of NRW is 40% (40 litres loss out
of every 100 litres). By addressing the NRW issue, there
would be adequate water supply and hence, no
immediate need to build more new dams now.
4 Destruction and
degradation of
water catchments
Very few water catchments have been gazetted and
legally protected. Many water catchments are exposed
to incompatible development that could adversely affect
our water resources.
5 Legislation
andEnforcement
Most legislations relating to water are either indirect or
outdated and need to be reviewed in today’s context.
Enforcement needs to be strengthened to address water
pollution, water abuse and other water related problems.
6 Institutionalissues Too many agencies have jurisdiction over water
resources both directly and indirectly. This has led to
sectorial management of water and conflicting /
competing objectives and disputes between agencies.
7 Changingweather
patterns
The weather and climate changes (i.e. El Nino 1997/98)
occurring globally and locally may render water
resources inadequate in the long term. This issue needs
to be taken into account in planning water resources
development.
8 Privatization of the
water sector
Unsuccessful privatization means unsustainable water
management.The success of privatization is determined
among others bytransparency and accountability, and
requires equity, economic andenvironmental
considerations.
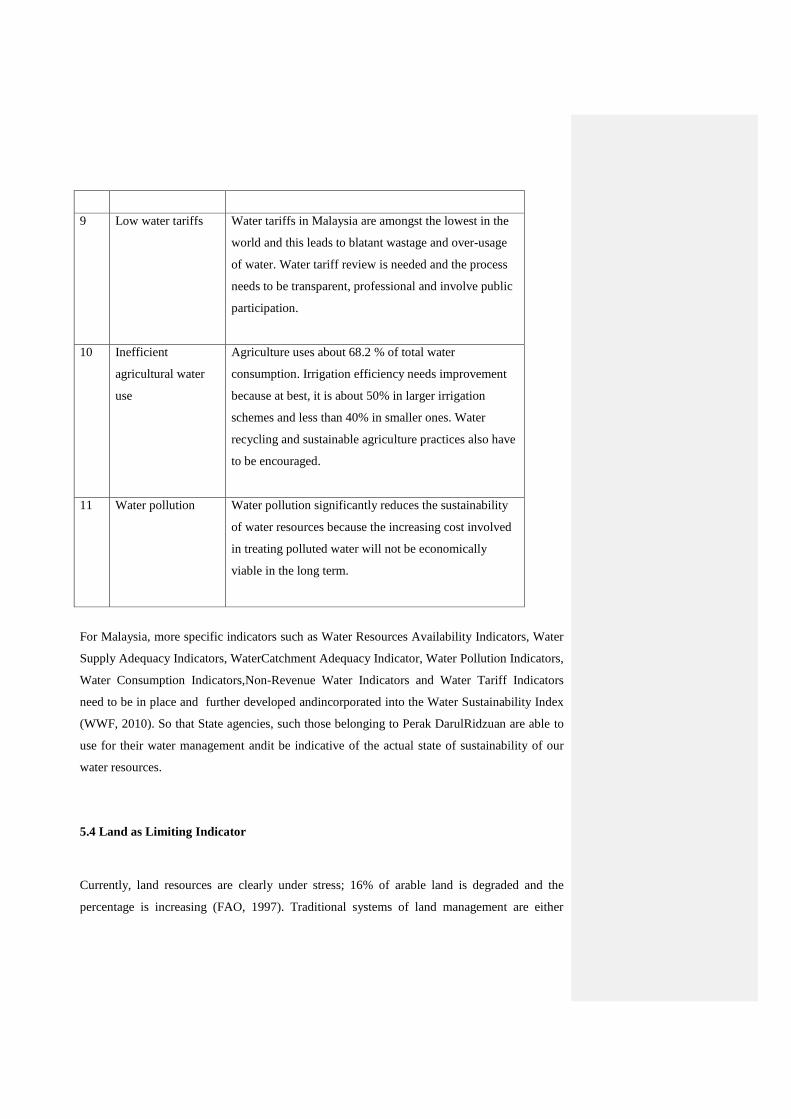
9 Low water tariffs Water tariffs in Malaysia are amongst the lowest in the
world and this leads to blatant wastage and over-usage
of water. Water tariff review is needed and the process
needs to be transparent, professional and involve public
participation.
10 Inefficient
agricultural water
use
Agriculture uses about 68.2 % of total water
consumption. Irrigation efficiency needs improvement
because at best, it is about 50% in larger irrigation
schemes and less than 40% in smaller ones. Water
recycling and sustainable agriculture practices also have
to be encouraged.
11 Water pollution Water pollution significantly reduces the sustainability
of water resources because the increasing cost involved
in treating polluted water will not be economically
viable in the long term.
For Malaysia, more specific indicators such as Water Resources Availability Indicators, Water
Supply Adequacy Indicators, WaterCatchment Adequacy Indicator, Water Pollution Indicators,
Water Consumption Indicators,Non-Revenue Water Indicators and Water Tariff Indicators
need to be in place and further developed andincorporated into the Water Sustainability Index
(WWF, 2010). So that State agencies, such those belonging to Perak DarulRidzuan are able to
use for their water management andit be indicative of the actual state of sustainability of our
water resources.
5.4 Land as Limiting Indicator
Currently, land resources are clearly under stress; 16% of arable land is degraded and the
percentage is increasing (FAO, 1997). Traditional systems of land management are either
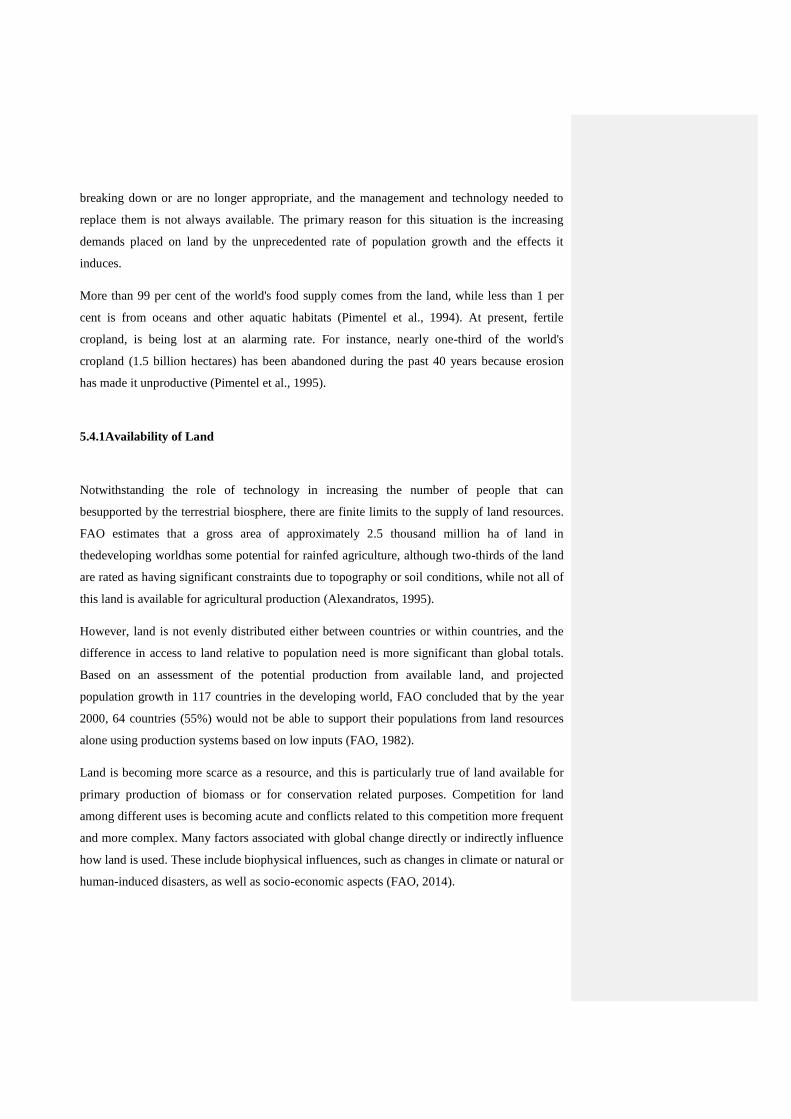
breaking down or are no longer appropriate, and the management and technology needed to
replace them is not always available. The primary reason for this situation is the increasing
demands placed on land by the unprecedented rate of population growth and the effects it
induces.
More than 99 per cent of the world's food supply comes from the land, while less than 1 per
cent is from oceans and other aquatic habitats (Pimentel et al., 1994). At present, fertile
cropland, is being lost at an alarming rate. For instance, nearly one-third of the world's
cropland (1.5 billion hectares) has been abandoned during the past 40 years because erosion
has made it unproductive (Pimentel et al., 1995).
5.4.1Availability of Land
Notwithstanding the role of technology in increasing the number of people that can
besupported by the terrestrial biosphere, there are finite limits to the supply of land resources.
FAO estimates that a gross area of approximately 2.5 thousand million ha of land in
thedeveloping worldhas some potential for rainfed agriculture, although two-thirds of the land
are rated as having significant constraints due to topography or soil conditions, while not all of
this land is available for agricultural production (Alexandratos, 1995).
However, land is not evenly distributed either between countries or within countries, and the
difference in access to land relative to population need is more significant than global totals.
Based on an assessment of the potential production from available land, and projected
population growth in 117 countries in the developing world, FAO concluded that by the year
2000, 64 countries (55%) would not be able to support their populations from land resources
alone using production systems based on low inputs (FAO, 1982).
Land is becoming more scarce as a resource, and this is particularly true of land available for
primary production of biomass or for conservation related purposes. Competition for land
among different uses is becoming acute and conflicts related to this competition more frequent
and more complex. Many factors associated with global change directly or indirectly influence
how land is used. These include biophysical influences, such as changes in climate or natural or
human-induced disasters, as well as socio-economic aspects (FAO, 2014).

5.4.3Land Resource Demand
The world population has grown tremendously over the past two thousand years. In 1999, the
world population passed the six billion mark. Latest world population estimate are 7 billion
people by mid-year 2009. As the world’s appetite for edible oils grow, fuelled by demand for
everything from food to detergents, it is very apparent from Figure 5.1, the need for edible oils
will continue to increase.
Figure5.1: Expected trends in world population and edible use of vegetable oil. Population
from UNDP(2006)
Almost, 30% of the world’s edible oil supply comes from 1 crop, palm oil and this high-
yielding crop is critical to the world’s food and possibly energy supply. Over 2 million people
derive their livelihood from this crop, and it generates over $200 billion dollars in revenues
(Aikanathan et al., 2011). In the two countries responsible for over 80% of world oil palm
production, Indonesia and Malaysia, smallholders account for 35–40% of the total area of
planted oil palm and as much as 33% of the output. Elsewhere, as in West African countries
that produce mainly for domestic and regional markets, smallholders produce up to 90% of the
annual harvest.
However, oil palms are highly efficient producers of oil, requiring less land than any other oil-
producing crop (Figure 5.2). Some oil palm plantations yield more than 6 tonnes of oil per
hectare per year (Jothiratnam, 2010).
Figure 2: Average yield per year (tonnes of oil per hectare)
(Source: RSPO, 2008)
5.4.4 Ecosystem Condition
According to UNEP (UNEP, 2007), at the current rate of intrusion into South-east Asian’s
protected rain forests will be severely degraded by 2012 through illegal hunting and trade,
logging, and forest fires, including those associated with the rapid spread of palm oil
plantations. Palm oil production has been documented as a cause of substantial and often
irreversible damage to the natural environment. Its impacts include: deforestation, habitat loss
of critically endangered species such as the Orang Utan and Sumatran Tiger.
Southeast Asia’s annual deforestation rate the highest in the tropics, this could result in
projected losses of 13–85% of biodiversity by 2100. Secondary habitat restoration, at least in
certain countries, would allow for some amelioration of biodiversity loss and thus potentially
lower the currently predicted extinction rates. Nonetheless, urgent conservation actions are
needed. Conservation initiatives should include public education, sustaining livelihoods, and
ways to enhance the sustainability of agriculture and increase the capacity of the local
communities (Sodhi et al., 2008).
At the same time, the large-scale deforestation and harm caused to the environment has raised
the concerns of consumers and Non-Government Organizations (NGOs) across the world. This
pressure created lots of friction between producers and NGOs. The earth is under threat from a
growing population and scarce natural resources, and sustainable agriculture is a means of
balancing the environmental degradation (Sheil et al., 2009).
Soybean: 0.36
Sunflower: 0.42
Rapeseed: 0.59
Oil palm: 3.68

Expansion in agriculture activities and other government expenditure in a country are planned
in view of GDP, and The Gross Domestic Product (GDP) or Gross Domestic Income (GDI) is
the amount of goods and services produced in a year, in a country. The appropriateness of GDP
to evaluate the status of a country was challenged by the Human Development Index developed
by Haq in 1990. The Human Development Index (HDI) is a composite statistic used to rank
countries by level of "human development" and separately developed (high development),
developing (middle development), and underdeveloped (low development) countries. The
statistic is composed from data on life expectancy, education and per-capita GDP (as an
indicator of standard of living). The HDI has been used since 1990 by the United Nations
Development Programme for its annual Human Development Reports.
5.4.5 Land as Indicators
Because of the strong land-development linkages and land is also a common factor that cuts
across all sectors of development, monitoring the sustainability of land resources can
effectively provide an indication of sustainable development in a country. Hence, the
Sustainable Development Indicators (SDI) for land is the next most representative of
sustainable development after water.
Table 5.2: Major Land Issues Affecting Sustainable Development in Perak
(Source, Author 2014)
No Issues Explanation
1 Over-emphasis
on land supply
management
The traditional approach to land supply management in
solving increasing land needs in Perak is not
sustainable. A more comprehensive approach of
managing land supply and demand (involving elements
such as use of degraded and abandoned land) is required
to ensure a more sustainable utilization of Perak’s land
resources.
2 High rates of
land wastage
Rates of land wastage are very high in the domestic
development, industrial and agriculture sectors. For

example, the number of “brown fields” of palm oil
plantations in Perak is not managed but left for
incidental harvest only. Wasted land opportunity from
accumulated “brown fields” and other neglected sites
could change the overall dynamics of the land resources
in Perak..
3 Destruction and
degradation of
“green lungs”
and other land
reserves.
Very few “green lungs” have been gazetted and legally
protected. Many water catchments are exposed to
incompatible development that could adversely affect
other natural resources. And overall assessment of green
space to ensure overall land sustainability is necessary.
4 Legislation and
Enforcement
Most legislations relating to land are either indirect or
outdated and need to be reviewed in today’s context.
Enforcement needs to be strengthened to address land
pollution, land degradation and other land related
problems.
5 Institutional
issues
Too many agencies have jurisdiction over land
resources both directly and indirectly. This has led to
sectorial management of land and conflicting /
competing objectives and disputes between agencies.
6 Changing
weather patterns
The weather and climate changes and sea level rise
occurring globally and locally may render land
resources inadequate in the long term. This issue needs
to be taken into account in planning land resources
development.
7 Inefficient
agricultural land
use
Perak’s agriculture landuse contribute to 13% its’ GDP,
and is the highest land use sector. Water recycling and
sustainable agriculture practices have to be encouraged
to increase productivity and maintain high land returns.
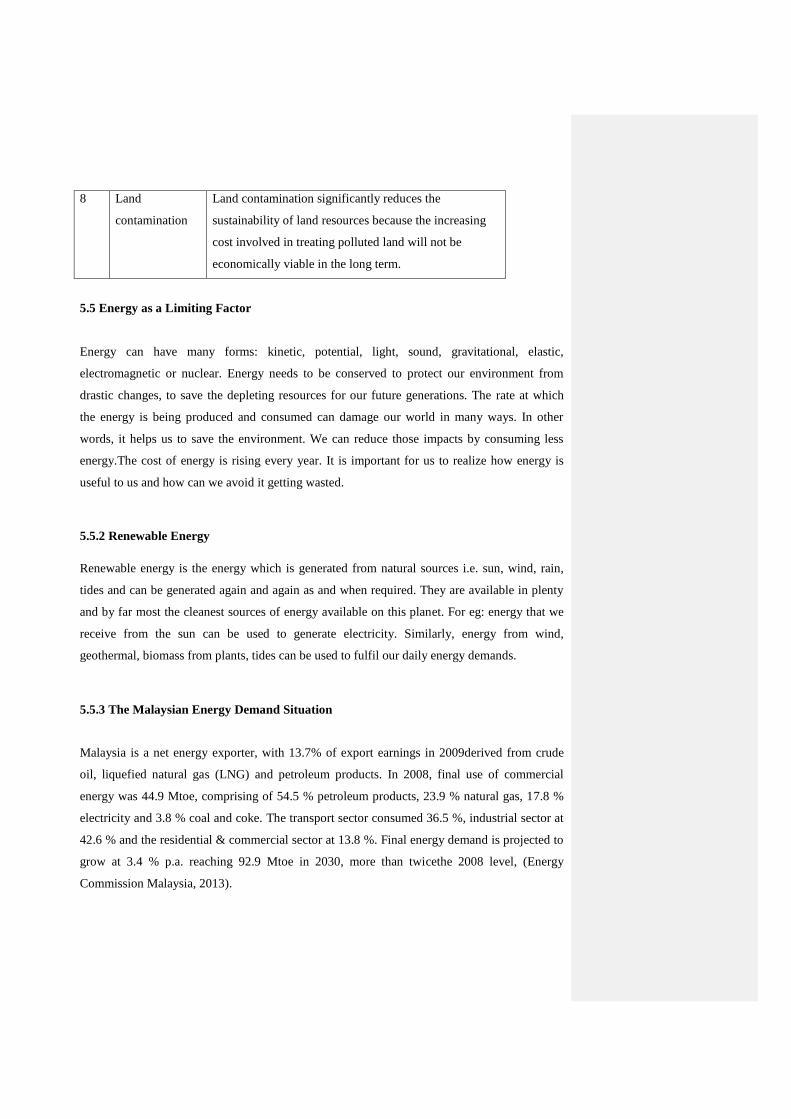
8 Land
contamination
Land contamination significantly reduces the
sustainability of land resources because the increasing
cost involved in treating polluted land will not be
economically viable in the long term.
5.5 Energy as a Limiting Factor
Energy can have many forms: kinetic, potential, light, sound, gravitational, elastic,
electromagnetic or nuclear. Energy needs to be conserved to protect our environment from
drastic changes, to save the depleting resources for our future generations. The rate at which
the energy is being produced and consumed can damage our world in many ways. In other
words, it helps us to save the environment. We can reduce those impacts by consuming less
energy.The cost of energy is rising every year. It is important for us to realize how energy is
useful to us and how can we avoid it getting wasted.
5.5.2 Renewable Energy
Renewable energy is the energy which is generated from natural sources i.e. sun, wind, rain,
tides and can be generated again and again as and when required. They are available in plenty
and by far most the cleanest sources of energy available on this planet. For eg: energy that we
receive from the sun can be used to generate electricity. Similarly, energy from wind,
geothermal, biomass from plants, tides can be used to fulfil our daily energy demands.
5.5.3 The Malaysian Energy Demand Situation
Malaysia is a net energy exporter, with 13.7% of export earnings in 2009derived from crude
oil, liquefied natural gas (LNG) and petroleum products. In 2008, final use of commercial
energy was 44.9 Mtoe, comprising of 54.5 % petroleum products, 23.9 % natural gas, 17.8 %
electricity and 3.8 % coal and coke. The transport sector consumed 36.5 %, industrial sector at
42.6 % and the residential & commercial sector at 13.8 %. Final energy demand is projected to
grow at 3.4 % p.a. reaching 92.9 Mtoe in 2030, more than twicethe 2008 level, (Energy
Commission Malaysia, 2013).
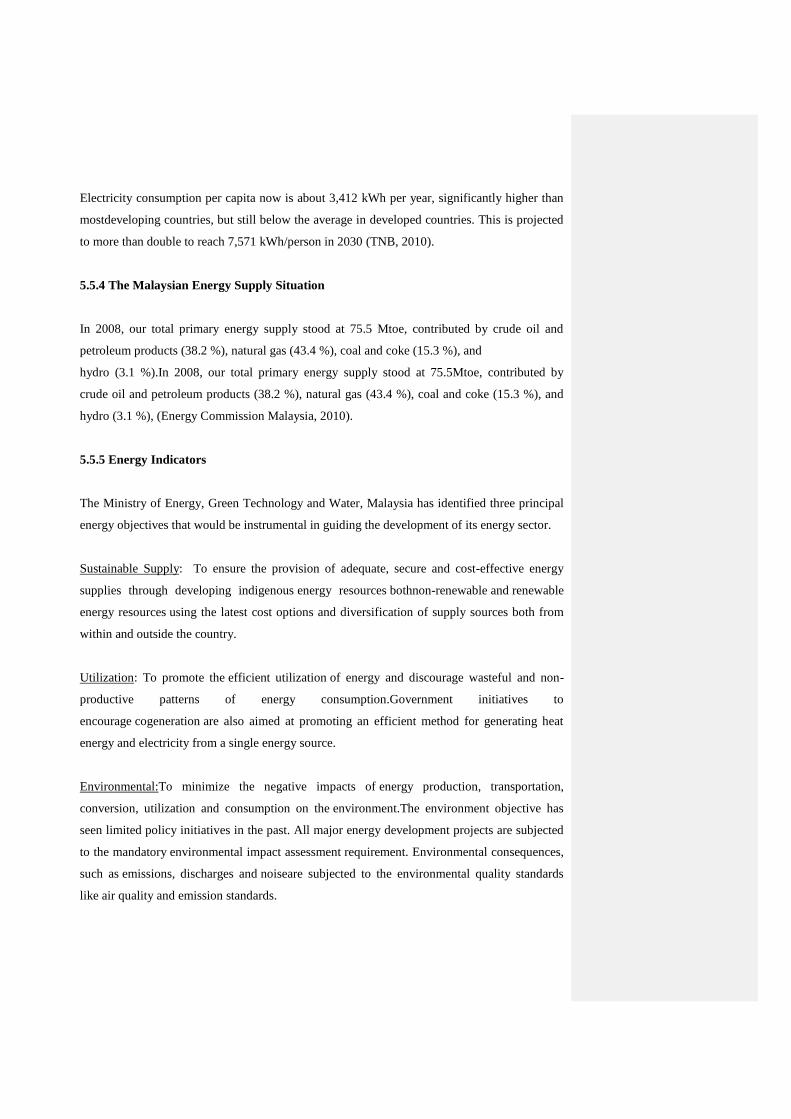
Electricity consumption per capita now is about 3,412 kWh per year, significantly higher than
mostdeveloping countries, but still below the average in developed countries. This is projected
to more than double to reach 7,571 kWh/person in 2030 (TNB, 2010).
5.5.4 The Malaysian Energy Supply Situation
In 2008, our total primary energy supply stood at 75.5 Mtoe, contributed by crude oil and
petroleum products (38.2 %), natural gas (43.4 %), coal and coke (15.3 %), and
hydro (3.1 %).In 2008, our total primary energy supply stood at 75.5Mtoe, contributed by
crude oil and petroleum products (38.2 %), natural gas (43.4 %), coal and coke (15.3 %), and
hydro (3.1 %), (Energy Commission Malaysia, 2010).
5.5.5 Energy Indicators
The Ministry of Energy, Green Technology and Water, Malaysia has identified three principal
energy objectives that would be instrumental in guiding the development of its energy sector.
Sustainable Supply: To ensure the provision of adequate, secure and cost-effective energy
supplies through developing indigenous energy resources bothnon-renewable and renewable
energy resources using the latest cost options and diversification of supply sources both from
within and outside the country.
Utilization: To promote the efficient utilization of energy and discourage wasteful and non-
productive patterns of energy consumption.Government initiatives to
encourage cogeneration are also aimed at promoting an efficient method for generating heat
energy and electricity from a single energy source.
Environmental:To minimize the negative impacts of energy production, transportation,
conversion, utilization and consumption on the environment.The environment objective has
seen limited policy initiatives in the past. All major energy development projects are subjected
to the mandatory environmental impact assessment requirement. Environmental consequences,
such as emissions, discharges and noiseare subjected to the environmental quality standards
like air quality and emission standards.
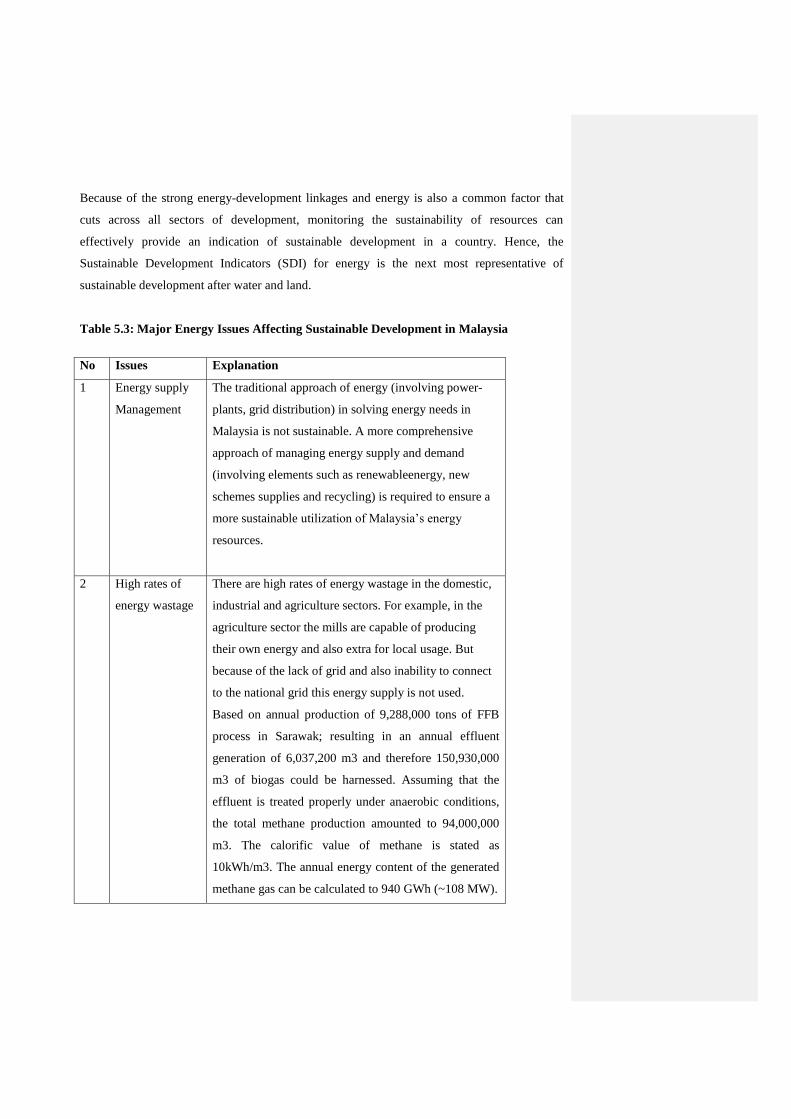
Because of the strong energy-development linkages and energy is also a common factor that
cuts across all sectors of development, monitoring the sustainability of resources can
effectively provide an indication of sustainable development in a country. Hence, the
Sustainable Development Indicators (SDI) for energy is the next most representative of
sustainable development after water and land.
Table 5.3: Major Energy Issues Affecting Sustainable Development in Malaysia
No Issues Explanation
1 Energy supply
Management
The traditional approach of energy (involving power-
plants, grid distribution) in solving energy needs in
Malaysia is not sustainable. A more comprehensive
approach of managing energy supply and demand
(involving elements such as renewableenergy, new
schemes supplies and recycling) is required to ensure a
more sustainable utilization of Malaysia’s energy
resources.
2 High rates of
energy wastage
There are high rates of energy wastage in the domestic,
industrial and agriculture sectors. For example, in the
agriculture sector the mills are capable of producing
their own energy and also extra for local usage. But
because of the lack of grid and also inability to connect
to the national grid this energy supply is not used.
Based on annual production of 9,288,000 tons of FFB
process in Sarawak; resulting in an annual effluent
generation of 6,037,200 m3 and therefore 150,930,000
m3 of biogas could be harnessed. Assuming that the
effluent is treated properly under anaerobic conditions,
the total methane production amounted to 94,000,000
m3. The calorific value of methane is stated as
10kWh/m3. The annual energy content of the generated
methane gas can be calculated to 940 GWh (~108 MW).

Based on a conversion efficiency of 38 % (gas engine),
the potential annual electrical power generation would
be 360 GWh. Assuming 100 % availability of the
conversion system shall results in an installed power
generation capacity of 41 MW from POME derived
methane gas.
3 High rates of
Non-Revenue
Energy (NRE)
By addressing the NRE issue, there would be adequate
and more than enough energy supply and hence, there is
a need to use energy from non-conventional resources
e.g. home based solar energy, surplus from palm oil
mills and other non-conventional resources.
4. Legislation and
Enforcement
Most legislations relating to energy are either indirect or
outdated and need to be reviewed in today’s context.
Enforcement needs to be strengthened to address energy
abuse and other energy related problems.
5 Institutional
issues
TNB and PETRONAS are the only agencies have
jurisdiction over energy resources both directly and
indirectly. This has led to sectorial management of
energy, with very little consideration towards
independent and non-conventional power producers.
6 Privatization of
the energy
sector
Unsuccessful privatization means unsustainable water
management. The success of privatization is determined
among others by transparency and accountability, and
requires equity, economic and environmental
considerations.
7 Low energy
tariffs
Energy tariffs in Malaysia are amongst the lowest in the
world and this leads to blatant wastage and over-usage
of energy. Energy tariff review is needed and the
process needs to be transparent, professional and
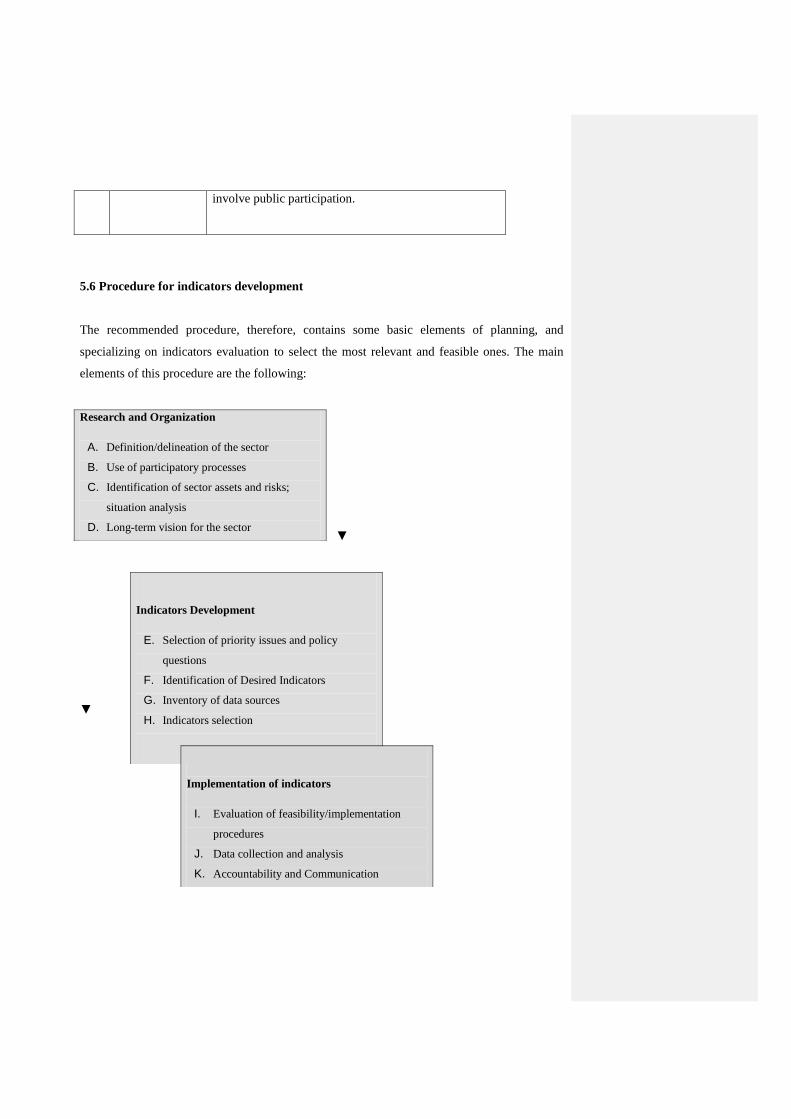
involve public participation.
5.6 Procedure for indicators development
The recommended procedure, therefore, contains some basic elements of planning, and
specializing on indicators evaluation to select the most relevant and feasible ones. The main
elements of this procedure are the following:
▼
▼
Research and Organization
A. Definition/delineation of the sector
B. Use of participatory processes
C. Identification of sector assets and risks;
situation analysis
D. Long-term vision for the sector
Indicators Development
E. Selection of priority issues and policy
questions
F. Identification of Desired Indicators
G. Inventory of data sources
H. Indicators selection
Implementation of indicators
I. Evaluation of feasibility/implementation
procedures
J. Data collection and analysis
K. Accountability and Communication

The main criteria for selecting sustainability indicators are:
Relevance of the indicator to the selected issue
Feasibility of obtaining and analysing the needed information
Credibilityof the information and reliability for users of the data
Clarityand understand ability to users
Comparabilityover time and across jurisdictions or regions
In summary, responsible decision-making has to be based on reliable information, and this is
why managers have to work with well-defined indicators. Besides supporting planning and
monitoring processes, indicators are also important tools of communication. Even at a local
level, the complexity of stakeholder and interest groups cannot be underestimated, and they all
need to understand the implications of development and other related activities. Indicators can
provide them with the necessary information that supports their active involvement and
commitment towards an urgent and unavoidable responsibility of public and private managers:
to achieve a more sustainable sector and to contribute more strongly to sustainable
development and poverty alleviation, the two major challenges of our contemporary
societies.
5.7 Discussion on the Findings: Sustainability Indicator Analysis
L. Monitoring and Evaluation of Results
In this chapter, explores the threemostresourcesimportant for development in Perak and to
assess their importance for sustainable development. The main findings from this chapter are:
a. Data Management and Transparency: Even though the sectors in Perak and have been
highly institutionalized, for sustainable development, the availability of data for
research and development is the greatest hurdle faced. The transparency and availability
of information is one of the requirements for sustainability, without which improvement
and development are greatly hindered.
b. Sustainability Indicators and Measurements: These are based on principles and
procedures found in practises found internationally, and the governing values for
important indicators for sustainability in Malaysia. Though the selection of indicators
for sustainability is extensive, many of the important indicators did not have sufficient
data for statistical testing. Also, some indicators are new ideas and concepts of
measurements, for which the State does not have extensive records.
c. Macro and Micro Economic Indicators: This study on the Perak DarulRidzuanprovides
the initial charted analysis which paves the way for the next stage of research, based on
the prioritization of important indicators for the sustainable development. This will
substantiate the validity or significance of the indicators to each other in the regression
and correlation test. Macroeconomic indicators such as GDP, unemployment rates,
and price indices were not considered.
d. The Plantation Industry: this is the third largest sector in Perak, but using the greatest
land resource. In all respects, it is observed that palm oil production has plateaued in
the last few years as the national development policy has moved to other focus areas for
local development. Introduction of new technology, mechanization, new clones
introduced into the plantations have not increased Perak’s productivity, even with the
new advancement in oil palm breeding technology which has shown that a palm oil
yield of 7.7 tonnes per hectare per year is possible (Crop Science, 2012).
CHAPTER 6
CONCLUSION AND RECOMMENDATIONS
6.1 Introduction
Perak has a robust and thriving economy, and growth has been steady and interruptedfor the
last few decades. The State’s stakeholders have established various schemes of sustainability,
but none have achievedinternational benchmark yet. This studyentitled“Sustainable
Development of Perak State: A Practical Approach” was designed to answer the following
questions:Can the State of Perak DarulRizduanattain the status of sustainable?How does
development relate to sustainability? Can we measure sustainable growth? What are the major
indicators in the main sectors of development?
How could social, economic and environmental valuesbe incorporated into sustainable
practices for Perak DarulRidzuan? Can all the values from the social, economic and
environmental indicators for sustainable development be used by all decision makers to get the
best optimal output from their management practices?
In order to seek to these questions, the following objectives wereidentified in Chapter 1:to
develop a practical approach towards sustainable development and green economic prosperity
of Perak. In the process of doing so, the study identified specific policies that were imperative
to be in place for sustainable growth and also propose possible recommendations based on
indicators which can satisfy the conditions of sustainable development and provideconsistent
support towards the achievement of the goal of Perak DarulRidzuan.
6.2 The Framework and SustainabilityAnalysis of Perak DarulRidzuan
Perak’sresources must be sustainably managed to meet the needs of its growing economy. The
meeting of sustainability requirements are not a matter of choice, and the gaps and
controversies in sustainability related issues should be confronted with resolve to be addressed
and solved, not ignored or disregarded.
Sustainable management is the only option forward to prevent the “crash” predicted by the
Neo- Malthusian. As demand for food keeps increasing due to population expansion
pressuresand growing markets causing agricultural systems to respond with the over-
production of food. Eventually the Earth will not be able to carry and sustain this ever-
increasing demand on its capacity, and t is expected a “crash” will occur in the system.
As for Perak, the Theoretical Framework as set-up in Chapter 3(Figure 3.2) clearly indicated, a
comprehensive land management is central to good overall productivity. Thus, this coupled
with good governance, Perak would able to stand in the leagues of international sustainable
champions.
6.3 Perak Development Plan – The Sustainability Key Result Areas (KRAs)
The Perak State has already set up KRAs to achieve sustainability in its overall development
plan, and this strategy contains two main focuses:
c. Sustainability Private Sector Foundation: The intensive involvement of the private
sector in all economic and social activities in a sustainable manner
d. Practicing Environmental Friendly and Sustainable Resources: Sustainable
environmental and resource protected through strong emphasis on the awareness and
cooperation practiced by all parties involved in the conservation and preservation work.
Details of this strategy have also been drawn out for each of this sustainability drive, and
overall plan has been plotted. Implementation at sectoral level may be the effective way to
follow through this designed policy.
6.4The Main Gaps and Controversies Concerning the SustainabilityDevelopment
Based on a review of journals, reports and also personal communications with stakeholders,
various controversies and gapson sustainable management have been identified. The main
controversies and gaps that have emerged were:
Future Sustainability Requirements: Most of the requirementsare based on principles
and criteriaadopted by stakeholder groups, but there aresignificant differences between

the measurements prescribed and those accepted by practitioners. This is especially true
with regards to soil management, issues relating to greenhouse gasmanagement and
there are also differences in views about river and watershed management within and
near plantations. All these requirements are mandatory for sustainability, and the
practitioners need to gear up to address these gaps between the requirements and their
practices.
Scientific Tools and International Standards:Scientific tools come with assumptions and
limitations, so these parameters must be accounted for fairly in all calculations, and not
for manipulationto achieve desired outcomes. International standards must be adapted
and made feasible for implementation at each selected locality. They cannot be adopted
“wholesale” and replicated in its entirety as discrepancies could arise due tovaried local
conditionswhich can lead to problems and restrict the smooth implementation and
achievementof objectives.
Lack of Data for Sustainability Challenges and Empirical Values for Sustainability
Measurement:Even though sustainability science has been propagated for more than
two decades, and the sustainability drive within the Perak is less than a decade in
progress. There are still many crucial deficiencies in the measurement regime and most
criteria are based on verbal discourses. Most important of all, there is still no acceptable
index for sustainability that has been established for the State.
Understanding Tropical Biodiversity:In the endeavour to ensure the sustainability
criteria is e applicable and relevant to tropical ecosystems, the scientific tools and
biodiversity database/information that are used, as well as the policy outcomes that are
sought, must be harmony with the climatic conditions of the tropics. Overstating its
fragility or the expected lossof biodiversity just creates unnecessary resistance from
those who are already working within the tropical zone to optimise the balance between
development and conservation. On the other hand, underestimating the climatic changes
that could occur also putsall stakeholders in a vulnerable position of danger of losing
the biodiversity forever.

The Role of Perception:Until now,even though perception has been the main driver
behindthe sustainability debates, perception itself has yet to be gauged well or a
framework for the management of perception-based criteria setup.
Need for Indicators & Measurement: Unless sustainability is measured, it will
otherwise always be an arbitrary term that can never meet stakeholder measurements.
Initial indicators that are important for Perak has been deliberated but further
consultations with the stakeholders are required to ensurethe measures harmonize with
the specific conditions of the locality.
Establish Credibility and Remove Green-washing: In all sustainability related work, the
is a need for certain level of accountability between the State and its stakeholders. This
is especially true in the palm oil industry, as perception of internationalcommunity with
regards to this industry has to improve.
6.5Perception Survey: Key Issues – Stakeholder Groups
This study reviewed the trends in the perception concerningthe development sectors, and
analysed various important sectoral projectsin Perak.The stakeholder groups thatwere deemed
relevant and important to the perception survey were:
a. Public Sector
b. Private Sector
c. Societies and NGOs
d. Media
e. Non-residents
f. Young Adults
Other groups, such as consumers and retailers, were not included in this evaluation, as the main
focus was on the determinants related to State based activities and these two groups were
thought to be too far removed to impact, apart from giving their opinions based on information
gathered from the media. Moreover, the overall opinion of the media was already included in
the survey.
6.6 Perception Survey
Sustainable science is an important element of management. The the lack of measurable
indictors and diverse needs amongst stakeholders for Perak has to be examined and the role and
perception of the media on Perak has to be further explored and examined to ascertain
sustainability issues. .
Perception is an important tool in sustainability and the lack of measurable indicators for
sustainability creates unwarranted demands by the stakeholders. The need for acceptable and
scientifically unbiased measurement is clear, especially for new requirements or measurements,
and thereby the initial perception was conducted and the main findings are listed below.
Perception as a Management tool: As far as stakeholders are concerned, perception is their
reality. Gaps exist between stakeholders’ perceptions and the entity’s ideal perceptions of
itself. Hence, perceptions have to be managed to ensure that a sound reputation of the State is
nurtured. The perception gaps among the stakeholders in Perak are not very large. However,
based on the surveys, it cannot be denied that perceptions do create impressions that can
influence decisions.
Survey A results- Ranking of Sectors: The survey of the 60 respondents from this study
highlighted that the most important sectors were tourism and infra-structure development. With
this, it is now important to specifically address tourism and infra-structure sectors for a detail
and profound sustainability KRAs as the next line of action.
Survey B results – Important Projects for Stakeholders Groups: The survey indicated that
the stakeholders were aware of the sustainability requirement for the State of Perak
DarulRidzuan. Their views on sectors highlight the need for good infra-structure in Perak and
also andetermined thrust to promote tourism in the State. Above all, it is imperative to ensure
good governance. The listof projects for these sectors were made available in Chapter 4.
In similar relation to section A of the survey, the tourism and infra-structure sectors need detail
planning to spur further progress in a sustainable manner for the Perak DarulRidzuan.
There is also a need to bridge the gap among the four key groups of stakeholders via data from
this study, outreach and awareness campaigns. The perception survey has clearly revealed the
difference in opinion amongst the stakeholders and also the presence of deficiency in
knowledge.The need for the government or the state to ensure balanced growth via key
agencies e.g. MBInc., IDR, SEDC and MPOA is also apparent, especially in the area of greater
environmental awareness. There is an urgent need to counteract and defuse the skewed views
emerging from third party information sources.
6.7Indicator Analysis and Key Issues
This chapter explores the three most resources that are deemed important for development in
Perak and to assess their importance for sustainable development. The main findings from this
chapter are:
Water: This resource must be developed and managed in a sustainable manner to preserve the
current social, economic and environmental development and to ensure the needs of future
generations are not jeopardized. The current indicators suggest:
Over-emphasis on Water Supply Management (WSM)
High rates of water wastage
High rates of Non-Revenue Water (NRW)
Destruction and degradation of water catchments
Legislation and Enforcement
Institutional issues
Changing weather patterns
Privatization of the water sector
Low water tariffs
Inefficient agricultural water use
Water pollution
Land:Land has finite limits to the supply of land resources. Land is becoming scarce as a
resource, and this is particularly true of land available for development or related purposes. The
current indicators suggest:
Over-emphasis on land supply management
High rates of land wastage
Destruction and degradation of “green lungs” and other land reserves
Legislation and Enforcement
Institutional issues
Changing weather patterns
Inefficient agricultural land use
Land contamination
Energy:Energy has to be conserved to protect our environment from drastic changes and to
save the depleting resources for our future generations. The rate at which the energy is being
produced and consumed can damage our environment in a number of ways, especially, if not
planned sustainably. The current indicators suggest:
Inadequate energy supply Management
High rates of energy wastage
High rates of Non-Revenue Energy (NRE)
Legislation and Enforcement
Institutional issues
Privatization of the energy sector
Low energy tariffs
6.8OverallRecommendations from This Study
The following recommendations can be deduced from this study:
Key Result Areas (KRAs)
Perak has instituted sustainability related KRAs and related strategy. However,a sequential
and timely strategy implementation is now required. The primary sectors in Perak from the
economic perspective are manufacturing, agriculture and tourism. However the stakeholder
survey indicated that infra-structure development and tourism management are deemed as
important. As the State has adopted these KRAs strategies, it is imperative to proceed and
advance sectoral development based on KRAs based strategies.
Perception Management
Perception can be viewed as a “new” determinant or indicator for sustainabledevelopment in
Perak. Stakeholder perceptions towards the industry were captured, analyzed and assessed with
regards to the sustainability issues in the State.The area of perception and indicator analysis
advanced in this study can be further expanded in future research. As for the indicators, detail
econometric work can be carried out to establish a sustainability index while perceptionscan be
examined further as a specific tool for expanded r economic research. Insufficient
measurements clearly reveal gaps in the requirements for sustainability science, especially for
the agricultural sector. Hence, perceptions have to be managed to ensure that a sound
reputation for the palm oil industry is nurtured.
Sustainability indicators
Indicators for sustainability measurement are available but to be relevant these indicators need
to be locality-specific, and not be driven by generalities, unsubstantiated science or local
requirements. For Perak sustainability indicators are required forwater, land and energy
sustainabilitymeasurements. The initial indicator measurements for each of these have been
identified in Chapter 5. However, some of theindicators have emerged as important in recent
times and thus, need to be systematized and scaledfurther to ensure that the development of
sustainability progresses well.
Future Research Recommendations:
This study has highlighted infra-structure and tourism sectors asimportant sectorswhich were
identified by Perak stakeholder groups. The next approach is to detail out the sustainability
strategies for these sectors. Important resource indicators for sustainabilitythat were identified
for Perak are water, land and energy, and principles for the use and management of these
resources would require detail future research.

BIBILIOGRAPHY
Aikanathan, S. (2010, November 8). Roundtable on Sustainable Palm, Wikipedia. Retrieved
from http://en.wikipedia.org/wiki/Roundtable_on_Sustainable_Palm_OilAccessed on
November 8, 2010.
Aikanathan, S., Chenayah, S., & Sasekumar, A. (2011). Sustainable Agriculture: A Case Study
on the Palm Oil Industry. Malaysian Journal of Science, 30 (1), 66-75.
Basiron, Y. (2012). Palm Oil Industry Transformation: Techno-Ecological Economic
Perspectives. A Presentation made at the Malaysian Economic Association Seminar, 2012,
University Malaya, Kuala Lumpur.
Basiron, Y. (2011). A Fair Trade Approach for Promoting Food Security and Ensuring Supply
Sustainability in Oils & Fats Trade. Journal of Oil Palm & the Environment (2), 15-24.
Blomquist, W., Dinar, A., and Kemper, K. E. (2010). A Framework for Institutional Analysis
of Decentralization Reforms in Natural Resource Management. Society & Natural Resources,
Vol. 23 (Issue 7), 620-635, 616p.
Brundtland Report, (1987). Brundtland Commission.
http://en.wikipedia.org/wiki/Brundtland_Commission. Retrieved on 15 July 2014.
Council, N. E. M. (2009). New Economic Model for Malaysia Part I: Strategic Policy
Directions. Government of Malaysia Publication.
Crop Science, (2012). Oil Palm - Achievements and Potential. Retrieved from
http://www.cropscience.org.au/icsc2004/symposia/2/4/187_wahidmb.htm.
Dunn, R. R., Harris, N. C., Colwell, R. K., Koh, L. P., and Sodhi, N. S. (2009). The Sixth Mass
Coextinction: Are Most Endangered Species Parasites and Mutualists? Environmental
Conservation 35 (1): 160–172.
Energy Commission Malaysia, (2010). Renewable Energy Status in Malaysia.
http://www.st.gov.my/. Retrieved on 15 July 2014.
Foo-Yuen Ng, Yew, F.-K., Basiron, Y., and Sundram, K. (2011). A Renewable Future Driven
with Malaysian Palm Oil-based Green Technology Journal of Oil Palm & the Environment
2011, 2(1).
Forum 21, (2010).Sustainable Development Indicators Report for Malaysia. Retrieved on 15
July 2014.
Ghazoul, J., Butler, R. A., Mateo-Vega, J., and Koh, L. P. (2010). REDD: A Reckoning of
Environment and Development Implications. Trends in Ecology &Evolution, 25(7), 396-402.
Gopal, J. (2001). The Development of Malaysia’s Palm Oil Refining Industry: Obstacles,
Policy and Performance. A thesis submitted for the degree of Doctor of Philosophy, University
of London and Diploma of Imperial College.
Greenpeace, (2010, April, 7). Deforestation for Palm Oil. Retrieved from:
http://www.greenpeace.org/usa/en/campaigns/forests/forests-worldwide/paradise-forests/palm-
oil/
Haas, H. D. (2009). Human Development: Report 2009 Overcoming Barriers: Human Mobility
and Development. Human Development Research Paper (HDRP) Series, Vol. 01, No. 2009
New York, USA.
Haq, M. u. (1990). Human Development Index. United Nations Development Programme's
(UNDP) Human Development Reports (HDRs): United Nations Development Programme
Publications.
Henson, I. E. (2008). The Carbon Cost of Palm Oil Production in Malaysia.The Planter 84,
(988) 445-464.
IOI Group, (2011). Consumer Perception of Trans Fat and Their Replacement. Retrieved
fromhttp://www.americanpalmoil.com/pdf/
The Jakarta Post, (2010, November 10).The Issues of Perception and Reality. Retrieved from
http://Perception/The/ Perception/and/TheJakartaPost.htm
Jothiratnam, S. S. (2010). Population, Energy, Food and Garbage: Their Potential Impact on
Global Agriculture. Journal of Oil Palm &the Environment 2010, 1:1-16.
Koh, L. P. (2007). Impacts of Land Use Change on South-east Asian Forest Butterflies: A
Review.Journal of Applied Ecology 2007 (44), 703–713.
Larson, K. L. (2010). An Integrated Theoretical Approach to Understanding the Socio cultural
Basis of Multi-dimensional Environmental Attitudes. Society & Natural Resources, 23 (9),
898-907.
Laurance, W. F. (2007). Have We Overstated the Tropical Biodiversity Crisis? Trends in
Ecology & Evolution, 22(2), 65-70.
Laurance, W. F. (2010). The Politics of Conservation: Using international carbon trading to
protect forests and biodiversity Social Alternatives, Third Quarter, Vol. 29 (3), 20.
MNRE, (2011). Malaysia Second National Communication to the UNFCCC. Ministry of
Natural Resources and Environment, Malaysia.
MPOC, (2012, November 5). RSPO has Failed the Growers. Retrieved from.
http://www.mpoc.org.my/RSPO_Has_Failed_Oil_Palm_Growers.aspx

McNamara, J.D. (2013). Palm Oil and Health: A Case of Manipulated Perception and Misuse
of Science. Journal of the American College of Nutrition. Vol. 29 No. 3, 1240S-244S.
Ministry of Industry and Trade, M. (2010). Oil Pam-Based Industry. Chapter 18. Annual
Report.
NEP, (1970). The New Economic Policy: Goals and Strategy. Government of Malaysia
Publication.
OECD, (2012).
Oil and Fats, (2009). Malaysian Palm Oil. Industry Performance 2009. Retrieved from:
http://www.americanpalmoil.com/publications/GOFB/GOFB_Vol7_Iss1-pullout1.pdf
Oil World, (2010). Comparative Yields of Major Oil Seeds. Oil World Annual Report 2010.
Retrieved from: http://www.oilworld.biz
Oil World, (2012). Palm Oil Exporters and Importers ,World Wide. Oil World Annual Report
2012. Retrieved from: http://www.oilworld.biz
Pimentel, D., Harvey, C., Resosudarmo, R., Sinclair, K., Kurz, K., and Blair, R. (1995).
Environmental and Economic Cost of Soil Erosion and Conservation Benefits. Science New
Series, Vol. 267, Iss. 5201, 1117-1123.
Perakheritage, (2014). http://perakheritage.wordpress.com/. Retrieved on 15 July 2014.
Prescott-Allen, R. (2006). The Structure of a Wellbeing Index. Paper presented at the
JRC/OECD Workshop, June 2006, Milano, Milano.
RSPO (2010, April 7). Roundtable on Sustainable Palm Oil Promoting the Growth and Use of
Sustainable Palm Oil. Retrieved from http://www.rspo.org/files/resource_centre
Rasiah, R. (2006) Explaining Malaysia s Export Expansion in Palm Oil and Related Products ,
Vandana Chandra (ed), The How and the Why of Technology Development in Developing
Economies, Washington DC: World Bank, pp 163-192.
Rasiah, R., and Shahrin, A. (2006). Development of Palm Oil and Related Products in
Malaysia and Indonesia.University Malaya Publication.
Sahely, et. al., (2005). Developing sustainability criteria for urban infrastructure systems.
Canadian Journal of Civil Engineering, 2005, 32(1): 72-85, 10.1139/l04-072
Sheil, D., Casson, A., Meijaard, E., Van Noordwjik, M., Gaskell, J., Sunderland-Groves, J.,
and Wertz, K., M. (2009). The Impacts and Opportunities of Oil Palm in Southeast Asia: What
do We Know and What do We Need to Know? Occasional paper no. 51, presented at CIFOR,
Bogor, Indonesia.
Shuit, S. H., Tan, K. T., Lee, K. T., and Kamaruddin, A. H. (2009). Oil Palm Biomass as a
Sustainable Energy Source: A Malaysian Case Study. Energy, 34(9), 1225-1235.
Sodhi, N. S. (2008). Tropical Biodiversity Loss and People – A brief Review. Basic and
Applied Ecology, 9 (2008) 93–99.
Sodhi, N. S., Lee, T. M., Koh, L. P., & Brook, B. W. (2009). A Meta-Analysis of the Impact of
Anthropogenic Forest Disturbance on Southeast Asia’s. Biotropica 41(1): 103–109.
Sundram, K (2011) Lack of Harmonization of LCA Methodologies Restricts the Use of Oil
Palm Industry Biomass and Bioenergy as Renewable Energy Sources. Malaysian Palm Oil
Council. (in press).
Suharto, R. (2012). The Development and Implementation of ISPO. A paper presented at
International Palm Oil Sustainability Conference 2012, Kuala Lumpur.
Tan, K. T., Lee, K. T., Mohamed, A. R., and Bhatia, S. (2009). Palm Oil: Addressing Issues
and Towards Sustainable Development. Renewable and Sustainable Energy Reviews, 13(2),
420-427.
The Star Online, (2012, November 17). MPOC: Counters Negative Perception of Palm Oil.
Retrieved from http://thestar.com.my/news/story.asp?file=/2012/11/17/nation/
The Express Tribune, (2010, October 14). Palming Death Off on Us. Retrieved from
http://tribune.com.pk/story/62203/palming-death-off-on-us/
UNCED, (1992). The Rio Earth Summit.
http://www.worldsummit2002.org/index.htm?http://www.worldsummit2002.org/guide/unced.h
tm. Retrieved 15 July 2014
UNDP, (2006). World Population Prospects: The 2006 Revision.United Nations Development
Programme, Publications.
UNEP. (2007). The Last Stand of the Orang Utan - State of Emergency: Illegal Logging, Fire
and Palm Oil in Indonesia's National Parks. United Nations Environment Programme,
Publications.
UNEP. (2009).Guidelines for Social Life Cycle Assessment of Products. The UNEP/SETAC
Life Cycle Initiative at UNEP, CIRAIG, FAQDD and the Belgium Federal Public Planning
Service Sustainable Development. United Nations Environment Programme, Publications.
Vijaya, S., Ma, A.N., and Choo, Y.M. (2009) A Gate to Gate Assessment of Environmental
Performance for Production of Crude Palm Kernel Oil Using Life Cycle Assessment Approach.
American Journal of Environmental Sciences, 5 (3): 267-272.
Wara, M. W., and Victor, D. G. (2008). A Realistic Policy on International Carbon Offsets.
Retrieved from http://pesd.stanford.edu.
WCED, (1987). World Commission on Environment and Development. Brundtland
Commission's. Retrieved from http://en.wikipedia.org/wiki/Brundtland_Commission
WWF, (2010). Water Futures. Working together for a Secure Water Future.

http://www.waterfootprint.org/Reports/SABMiller-GTZ-WWF-2010-WaterFutures.pdf.
Retrieved on 15 July 2014.
World Bank, (2012). Metadata of the World Bank. http://data.worldbank.org/about/data-programs. Accessed: January 2012.
World Summit, (2005). World Summit on Sustainable Development.
http://www.worldsummit2002.org/index.htm?http://www.worldsummit2002.org/guide/unced.h
tm
Wikipedia. (2014, November, 3). Environmental Performance Index. Retrieved
fromhttp://en.wikipedia.org/wiki/environmental_performance_index