Embed Size (px)
Citation preview
Sustainable Development Goals in the Republic of Korea
: Progress Report 2019
Government Publications Registration Number
11-1240245-000057-14 KOGL Korea Open Government License
BY ND
Sustainable Development Goals in the Republic of Korea
: Progress Report 2019
Publisher Statistics Research Institute
35220 Statistics Center 6 ~ 8F, 713, Hanbatdae-ro, Seo-gu Daejeon
Author Youngshil Park·Youngmi Lee·Ingyeom Kim
Published date April 30, 2019
Sustainable Development Goals in the Republic of Korea
: Progress Report 2019


Preface
I feel like it yesterday that the ”Sustainable Development Goals (SDGs)“ was adopted at the 70th United Nations
(UN) General Assembly in September 2015. Accomplishing the SDGs is due 2030, pursuing social development,
economic growth, and environmental sustainability for a better future. It is already 2020, by which we have reached
about one-third of the SDG milestones. How much progress have we made so far?
This spring, there were many days when it was too hard to see the crystal-clear blue sky of Korea. It was due to dust.
We used to have four distinctive seasons in Korea, no longer is it the case. Spring and autumn are getting shorter;
summer and winter are getting longer. It is a pity if the next generation would have to rely on YouTube to enjoy such
a beautiful nature.
What should Statistics Korea do to achieve sustainable development in Korea? We do need collective wisdom,
asking questions, “Are we heading in the right direction? How long must we make efforts to reach our goals based
on indicators?”
In response, the UN Statistical Commission has created a Global Indicator Framework for monitoring the SDGs.
However, some indicators require methodological improvement while others are hard to monitor due to lack of data.
The national statistical office in each country has a mission to develop relevant statistics and establish a transparent
reporting system to effectively monitor SDGs.
This report has resulted from rigorous analysis of the current status of SDGs implementation in Korea. It is based
on the statistics currently available in Korea. We have assessed the level of such an implementation in Korea with
that of major countries around the world. In light of global standards, we have identified what additional data is
necessary and what statistical capacity is required to improve it.
I hope that this report will be useful for enhancing official statistics to accurately monitor the status of the SDGs
implementation. We have set aside research on the linkage between indicators and policies that will be carried out
in the near future. I reiterate that monitoring all domains covered by the SDGs requires the cooperation of various
stakeholders, including government ministries, academia, research institutions and civil society. I would like to
extend heart-felt gratitude to subject matter experts for their generous feedback without which this report would not
have reached your hands.
April 2019
Director-General Asaph Young CHUN

Contents
Chapter 1 • Overview 7
Chapter 2 • SDGs and the Role of Data 9
Chapter 3 • The ROK’s Data in Global DB 13
Chapter 4 • The Progress of SDGs in the ROK 15
Chapter 5 • Strategies to Reduce the SDGs Data Gap 59
Chapter 6 • Conclusion 73
References 74
Abbreviations 75
List of Collaborating Institutions and Participants 76
List of UN SDG Indicators 77
Chapter 1. Overview • 7
1. Background
In September 2015, “Transforming Our World: 2030
Agenda for Sustainable Development” was adopted
at the UN General Assembly.1 The agenda contains
17 goals and 169 targets. These are the Sustainable
Development Goals. Since the adoption of the SDGs,
UN Member States and International Organizations
(IOs) have been busy implementing it. The Republic
of Korea (ROK) has also been working to establish an
implementation system through consultation among
relevant ministries, and finally Korean SDGs (K-SDGs)
were established at the end of December 2018. Having
actively participated in the process of selecting UN
SDG indicators to monitor the goal implementation,
Statistics Korea (KOSTAT) has continuously reviewed
the domestic statistics on global indicators2, and the
results have provided the basis for the K-SDGs indicator
selection.
Based on the SDG indicators selected by the UN,
this report deals with the implementation of SDGs in
the ROK and explores the areas for improving and
developing official statistics required to produce future
global indicators. Half of the 232 global indicators are
available in the Korean context. In addition, there are
indicators that have already achieved their goals or are
not relevant to the Korean context. Therefore, we are
currently bridging the data gap between the local level
to the global level by monitoring the situation based on
the indicators where data are available and exploring
proxy indicators to expand monitoring.
2. Scope of the Analysis
This report consists of six chapters in total, including
overview and conclusions. Chapter 2 describes the
Overview
meaning of data in the adoption process of SDGs. In
Chapter 3, we review the current data status of SDGs
in the ROK from a global perspective. In particular,
we review how much data the ROK has obtained in
Asia. Chapter 4 uses data to present the results of the
analysis of the implementation of SDGs in the ROK. By
comparing and analyzing G7 countries with the global
indicators, we can understand the ROK’s current status
and then decide where best to focus development.
Chapter 5 identifies the areas that need statistical
improvement and development in the future to support
the implementation of SDGs and examines the efforts
required to support them.
3. Implication of the Report
This is comprehensive report covering all 17 goals. So
far, the relevant authorities have published the SDGs
reports for specific subjects such as SDG6 (water),
SDG4 (education), and SDG3 (health). The contents
of each report differed from response strategy for
SDG6 (Korea Water Resources Corporation, 2017)
to monitoring SDG4 (Korean National Commission
for UNESCO, 2018) and establishing metadata on
Health and Gender indicators (Ko Kyung-hwan et
al., 2016; Jang Eun-ha et al., 2017). Some IOs, such
as the Organization for Economic Cooperation and
Development (OECD) and the Sustainable Development
Solution Network (SDSN), are also analyzing the status
of implementation of SDGs in Member States for policy
support (OECD, 2017; SDSN, 2018). However, due to
difference in the indicator and methodology used in the
analysis depending on the IOs, it is hard to compare the
results. Therefore, the report is of significance in that it
examines the implementation of all 17 goals through
global perspectives.
1 The official document is composed of a preamble, declaration, the sustainable development goals and targets, the means of implementation and global partnership, and the follow-up and review.
2 In this report, global indicators and national indicators refer to the SDG indicators selected by the UN and the indicators selected by each country respectively.
Chapter 1

8 • Sustainable Development Goals in the Republic of Korea: Progress Report 2019
Also, this report is differentiated in that it deals with
data strategies to improve the monitoring. It is expected
to serve as a cornerstone for establishing the SDGs
monitoring system in the ROK. However, we did not
present any policy relevance in selecting the indicators
for monitoring and presenting the results. This should
be carried out through consultation with the relevant
ministries in the future.
Chapter 2. SDGs and the Role of Data • 9
1. The Blueprint of the Future We Want: SDGs
The concept of sustainable development first appeared
in the official UN document, “Our Common Future”
published by the World Commission for Environment
and Development (WCED) in 1987,3 but the SDGs have
contributed the most to the popularization of the term.
Taking a step forward from the Millennium Development
Goals (MDGs), which focus on social development
in developing countries, the SDGs emphasize social
development, economic growth and environmental
sustainability in an integrated framework. As a result,
the goals and targets also expanded from eight to 17
and 21 to 169, respectively. The 17 goals are as follows:
17 Goals
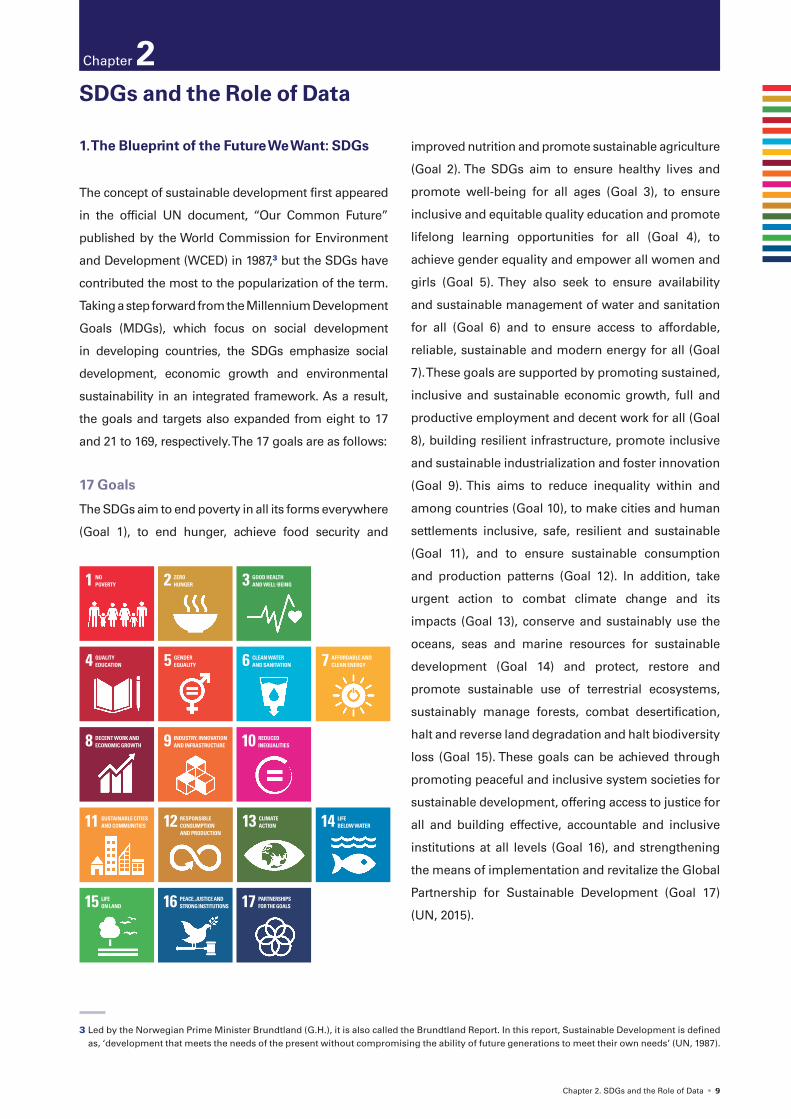
The SDGs aim to end poverty in all its forms everywhere
(Goal 1), to end hunger, achieve food security and
SDGs and the Role of Data
improved nutrition and promote sustainable agriculture
(Goal 2). The SDGs aim to ensure healthy lives and
promote well-being for all ages (Goal 3), to ensure
inclusive and equitable quality education and promote
lifelong learning opportunities for all (Goal 4), to
achieve gender equality and empower all women and
girls (Goal 5). They also seek to ensure availability
and sustainable management of water and sanitation
for all (Goal 6) and to ensure access to affordable,
reliable, sustainable and modern energy for all (Goal
7). These goals are supported by promoting sustained,
inclusive and sustainable economic growth, full and
productive employment and decent work for all (Goal
8), building resilient infrastructure, promote inclusive
and sustainable industrialization and foster innovation
(Goal 9). This aims to reduce inequality within and
among countries (Goal 10), to make cities and human
settlements inclusive, safe, resilient and sustainable
(Goal 11), and to ensure sustainable consumption
and production patterns (Goal 12). In addition, take
urgent action to combat climate change and its
impacts (Goal 13), conserve and sustainably use the
oceans, seas and marine resources for sustainable
development (Goal 14) and protect, restore and
promote sustainable use of terrestrial ecosystems,
sustainably manage forests, combat desertification,
halt and reverse land degradation and halt biodiversity
loss (Goal 15). These goals can be achieved through
promoting peaceful and inclusive system societies for
sustainable development, offering access to justice for
all and building effective, accountable and inclusive
institutions at all levels (Goal 16), and strengthening
the means of implementation and revitalize the Global
Partnership for Sustainable Development (Goal 17)
(UN, 2015).
NOPOVERTY1 ZERO
HUNGER2 GOOD HEALTHAND WELL-BEING3
QUALITYEDUCATION4 GENDER
EQUALITY5 CLEAN WATERAND SANITATION6 AFFORDABLE AND
CLEAN ENERGY7
DECENT WORK AND ECONOMIC GROWTH8 INDUSTRY, INNOVATION
AND INFRASTRUCTURE9 REDUCEDINEQUALITIES10
SUSTAINABLE CITIES AND COMMUNITIES11 RESPONSIBLE
CONSUMPTIONAND PRODUCTION
12 CLIMATEACTION13 LIFE
BELOW WATER14
LIFEON LAND15 PEACE, JUSTICE AND
STRONG INSTITUTIONS16 PARTNERSHIPSFOR THE GOALS17
3 Led by the Norwegian Prime Minister Brundtland (G.H.), it is also called the Brundtland Report. In this report, Sustainable Development is defined as, ‘development that meets the needs of the present without compromising the ability of future generations to meet their own needs’ (UN, 1987).
Chapter 2

10 • Sustainable Development Goals in the Republic of Korea: Progress Report 2019
Governance
The implementation of the SDGs at the global level
is accomplished through the implementation at the
national and regional levels. As a result, goals and
targets which are consistent with each context are
being established at several levels. The governance of
implementing SDGs varies from country to country,
but in most cases the Prime Minister's Office plays
the greatest role in this. According to SDSN (2018),
14 out of the G20 (Group of 20) countries have SDGs
governance. Among the G20 countries, each ministries
responsible are as follows; the Prime Minister's Office
is the main department in charge of eight countries, the
Ministry of Economic Development is in control of five
countries, the Ministry of Foreign Affairs directs four
countries, and the Ministry of Environment oversees
three countries. However, there are also many cases in
which the ministries join together. On the other hand,
it was determined that the NSO is given roles and
responsibilities related to indicators to lead the work
within the SDGs governance.
The ROK announced the establishment of K-SDGs
in March 2018 under the leadership of the Sustainable
Development Committee and the Ministry of
Environment. After 9 months of open working group
discussion, 214 indicators were selected. It became a
practical starting point for the integrated implementation
of the SDGs at the government level. KOSTAT serves as
a coordinator to reduce the gap between the global and
national levels. By closely monitoring the development
and improvement of global indicators, the standardized
method of preparing indicators agreed at the global
level can be applied to domestic statistics and the
national context can be reflected in the global indicator
development process at the same time.
2. How to Monitor the SDGs?
The Development and Improvement Process of
the Global Indicators
Reasonable indicator selection is essential for
monitoring the SDGs. Thus, the UN Statistical
Commission (UNSC) launched the Inter-agency and
Expert Group for Sustainable Development Goal
Indicators (IAEG-SDGs)4 in March 2015 in order to
support the development of indicator frameworks and
the implementation of SDGs. Based on the principle of
open and transparent decision making, the IAEG-SDGs
strive to ensure objectivity and reliability by inviting
all stakeholders, including the NSO, IOs, civil society,
academia and the private sector, to participate in the
process of selecting indicators. Two meetings are held
each year and the results are reported to UNSC.
The indicator selection goes back prior to the
adoption of the SDGs. Based on the SDGs draft
proposed by the Open Working Group in September
2014, the UN Statistics Division (UNSD) gathered and
reviewed opinions of IOs and countries and prepared
over 300 indicators. Since then, the IAEG-SDGs have
selected 241 indicators (230 excluding duplicate
indicators5) through face-to-face meetings and online
consultation. The IAEG-SDGs then submitted them to
the 47th UNSC in March 2016. The UNSC agreed to
the indicator framework on the premise of technical
improvement, and the IAEG-SDGs submitted a revision
composed of 244 indicators (232 excluding duplicate
indicators) to the 48th UNSC (March 2017) to further
review for a year. This revision was finally adopted by
the UN General Assembly in July by the UN Economic
and Social Council (UNECOSOC) in June 2017.
The IAEG-SDGs are working to develop an indicator
framework by continuously monitoring data availability
and methodology development. In particular, the
4 Members of this group are elected through the regional mechanism of the UN and act on behalf of each region for two years. As of 2018, the representatives of NSO are participating as members. The Asia-Pacific Member States include China, Kyrgyzstan, Fiji, Samoa, the Philippines and India.
5 The IAEG-SDGs allowed duplication only for some indicators in order to take into account the linkages between goals and to minimize the burden of national reporting. These are called multipurpose indicators.
Chapter 2. SDGs and the Role of Data • 11
indicators will be revised, deleted and added in the
Comprehensive Review (2020/2025) which is conducted
every five years when development of Tier 3 indicator
methodology has stalled, and the current indicator does
not map well to the target or only partially monitors it.
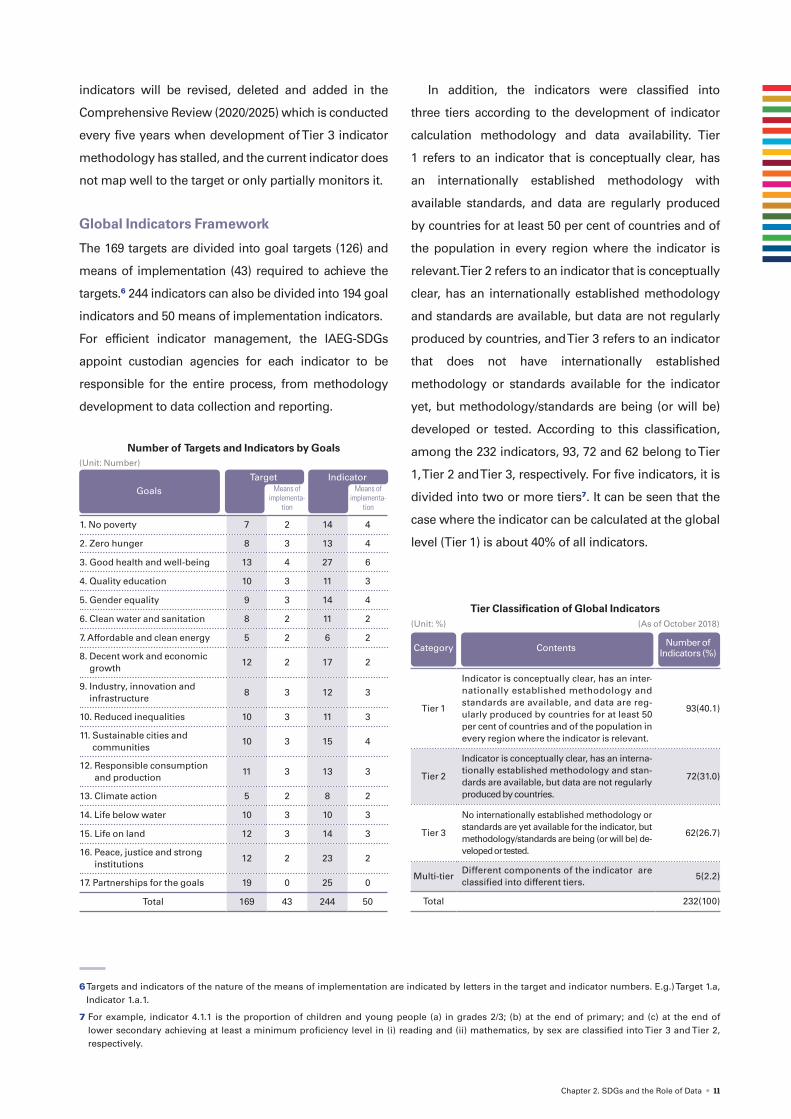
Global Indicators Framework
The 169 targets are divided into goal targets (126) and
means of implementation (43) required to achieve the
targets.6 244 indicators can also be divided into 194 goal
indicators and 50 means of implementation indicators.
For efficient indicator management, the IAEG-SDGs
appoint custodian agencies for each indicator to be
responsible for the entire process, from methodology
development to data collection and reporting.
In addition, the indicators were classified into
three tiers according to the development of indicator
calculation methodology and data availability. Tier
1 refers to an indicator that is conceptually clear, has
an internationally established methodology with
available standards, and data are regularly produced
by countries for at least 50 per cent of countries and of
the population in every region where the indicator is
relevant. Tier 2 refers to an indicator that is conceptually
clear, has an internationally established methodology
and standards are available, but data are not regularly
produced by countries, and Tier 3 refers to an indicator
that does not have internationally established
methodology or standards available for the indicator
yet, but methodology/standards are being (or will be)
developed or tested. According to this classification,
among the 232 indicators, 93, 72 and 62 belong to Tier
1, Tier 2 and Tier 3, respectively. For five indicators, it is
divided into two or more tiers7. It can be seen that the
case where the indicator can be calculated at the global
level (Tier 1) is about 40% of all indicators.
6 Targets and indicators of the nature of the means of implementation are indicated by letters in the target and indicator numbers. E.g.) Target 1.a, Indicator 1.a.1.
7 For example, indicator 4.1.1 is the proportion of children and young people (a) in grades 2/3; (b) at the end of primary; and (c) at the end of lower secondary achieving at least a minimum proficiency level in (i) reading and (ii) mathematics, by sex are classified into Tier 3 and Tier 2, respectively.
Tier Classification of Global Indicators(Unit: %) (As of October 2018)
Category Contents Number of Indicators (%)
Tier 1
Indicator is conceptually clear, has an inter-nationally established methodology and standards are available, and data are reg-ularly produced by countries for at least 50 per cent of countries and of the population in every region where the indicator is relevant.
93(40.1)
Tier 2
Indicator is conceptually clear, has an interna-tionally established methodology and stan-dards are available, but data are not regularly produced by countries.
72(31.0)
Tier 3
No internationally established methodology or standards are yet available for the indicator, but methodology/standards are being (or will be) de-veloped or tested.
62(26.7)
Multi-tierDifferent components of the indicator are classified into different tiers.
5(2.2)
Total 232(100)
Number of Targets and Indicators by Goals(Unit: Number)
Means of implementa-
tion
Means of implementa-
tion
1. No poverty 7 2 14 4
2. Zero hunger 8 3 13 4
3. Good health and well-being 13 4 27 6
4. Quality education 10 3 11 3
5. Gender equality 9 3 14 4
6. Clean water and sanitation 8 2 11 2
7. Affordable and clean energy 5 2 6 2
8. Decent work and economic growth
12 2 17 2
9. Industry, innovation and infrastructure
8 3 12 3
10. Reduced inequalities 10 3 11 3
11. Sustainable cities and communities
10 3 15 4
12. Responsible consumption and production
11 3 13 3
13. Climate action 5 2 8 2
14. Life below water 10 3 10 3
15. Life on land 12 3 14 3
16. Peace, justice and strong institutions
12 2 23 2
17. Partnerships for the goals 19 0 25 0
Total 169 43 244 50
GoalsTarget Indicator
12 • Sustainable Development Goals in the Republic of Korea: Progress Report 2019
Monitoring and Evaluation
Goals and targets are monitored based on indicators,
and the results are provided as basic information to
the High Level Political Forum (HLPF), which monitors
the implementation of SDGs at the global level. To this
end, the SDG Progress Report, which is prepared under
the UN Secretary-General and the Global Sustainable
Development Report (published every four years) are
published. In addition, each country submits a Voluntary
National Review (VNR), which includes the degree to
which goals and targets are achieved based on specific
statistical figures, providing policy makers with the
driving force for policy making to achieve their goals.
3. The Role of Data in the SDGs
The importance of data is unprecedentedly emphasized
in the process of implementing the SDGs. First of all,
the SDGs did not just declare their goals, but provided
a means to achieve their goals as a separate 17th goal,
presenting ‘data’ with resources and technology as the
means of implementation. The related targets are as
follows:
• 17.18 By 2020, enhance capacity-building support
to developing countries, including for least
developed countries and small island developing
States, to increase significantly the availability of
high-quality, timely and reliable data disaggregated
by income, gender, age, race, ethnicity, migratory
status, disability, geographic location and other
characteristics relevant in national contexts
• 17.19 By 2030, build on existing initiatives to
develop measurements of progress on sustainable
development that complement gross domestic
product, and support statistical capacity-building
in developing countries
8 Although still controversial, sex refers to women and men according to biological characteristics, and gender refers to women and men according to social factors (Mikkola, 2017). During the translation of the SDGs indicators, those were translated into female and woman based on the English original text. In other cases, one of the two terms was used depending on the context.
9 Some of the content from Park Youngshil et al. (2017) were summarized.
These targets address two important issues that need
to be pursued in the statistical development process
over the next 15 years. First, data disaggregation is
to break away from practices that have been so far
focused on producing and interpreting mean at the
national level.
The mean is a representative statistic, but a larger
variance can lead to greater distortion of society.
Data disaggregation focuses on distribution rather
than growth. In other words, it is to show vulnerable
groups such as low-income, women8, children, the
elderly, immigrants, and the disabled who have been
hidden behind the national average, and draw them
to policy targets by producing statistics disaggregated
depending on income, sex, age, migration status,
disability, region, etc. This is a strategy that implements
the 2030 Agenda principle of inclusiveness which seeks
to ‘leave no one behind’.
The second is about the development of measures
for sustainable development performance. Since the
1990s, quality of life and sustainability have emerged as
important issues, and international efforts to overcome
the economic centered GDP limits are actively underway.
The OECD's ‘Better Life Initiative’ and the European
Union’s ’GDP and Beyond’ are the examples. The SDGs
can be said to be on this extension line. Developing
measures of sustainable development performance to
disaggregate data and complement GDP is likely to be
the norm in the process of developing official statistics.9
In addition, the SDGs were prepared by the
IAEG-SDGs, a group of NSO based on the position
that the Indicator Framework should be developed
independently and scientifically. The proposals
developed by this group are being strengthened by
adoption by the ECOSOC and the General Assembly,
beyond the UNSC.

Chapter 3. The ROK’s Data in Global DB • 13
The SDGs Global Database contains data for 2000-2018
from countries around the world. As of September 10,
2018, there are 356 data and 1,0723,285 observations
for 144 of the 232 indicators.10 The data is classified
into five types depending on how it is created. IOs may
use data produced in the country as they are originally
provided. In some cases, however, they adjust,
estimate, or model individual country data according to
international standards and definitions. The data nature
of the SDGs indicators is classified based on the above
is as follows:
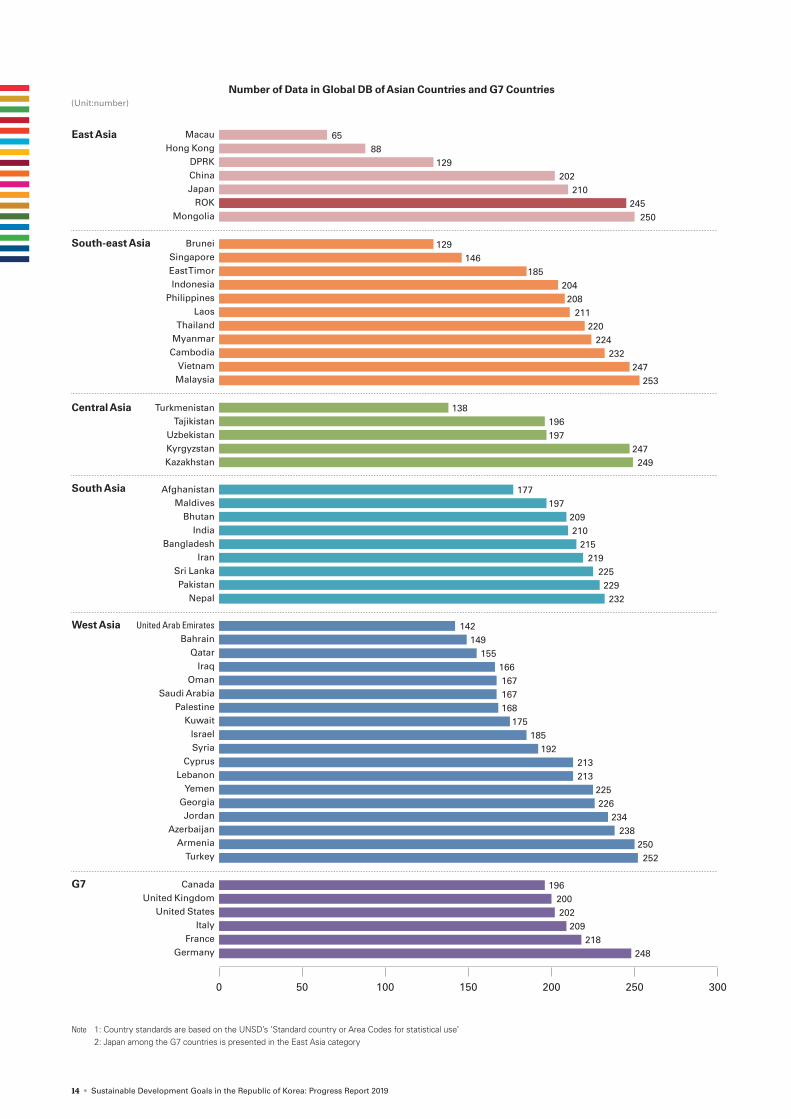
The ROK has 245 data and 5,558 observations for 109
indicators. In the nature of 245 data, C, CA, E, M and G
have 91, 12, 45, 6 and 12, respectively. The methodology
for 44 of the remaining data is still unknown, and 35
are unclassified. How much is the ROK's 245 data are
compared to that of other countries? To understand
the current situation, we observed Asian countries and
G7(Group of 7) countries as well (see the graph on the
next page). The data gap between countries in East Asia
where the ROK belongs was found to be larger than that
of other regions, and the ROK belongs with countries
The ROK’s Data in Global DB
Type of Data Nature
Type Definition
C(Country Data)
The figure is the one produced and dissemi-nated by the country
CA (Country Adjusted)
The figure is the one produced and provided by the country, but adjusted by the interna-tional agency for international comparability
E (Estimated)
The figure is estimated by the international agency, when corresponding country data on a specific year or set of years are not avail-able, or when multiple sources exist, or there are issues of data quality.
M (Modeled)
The figure is by the agency when there is a complete lack of data on the variable being estimated.
G(Global Monitoring)
The figure is regularly produced by the desig-nated agency for the global monitoring, based on country data.
10 Since data is constantly updated, the number of available data, the number of observations, and the year of retention may vary depending on when the site is accessed (https://unstats.un.org/sdgs/indicators/database).
(74.5%)
(59.3%)
(90.2%)
(81.8%)
(57.1%)
(38.5%)
(100.0%)
(69.6%)(87.5%)(40.0%)
(39.1%)
(40.0%)
(0%)
(50.0%)
(91.3%)
(33.3%)
(62.5%)Goal17
Number of the global level data
Number of the ROK’s data
Goal16
Goal15
Goal14
Goal13
Goal12
Goal11
Goal10 Goal9
Goal8
Goal7
Goal6
Goal5
Goal4
Goal3
Goal2
Goal1
Number and Accumulation Rate of Data in Global DB
Note: Accumulation rate is calculated as (Number of the ROK’s data / Number of the global level data) X 100
Chapter 3
with a large number of data. On the other hand, the
Democratic People’s Republic of Korea has 129 data,
about half that of the ROK. G7 countries have about 200
data, showing the relatively even distribution.
Can the ROK be called a data-developed country
because its number of data is at the top of the countries
compared? It is difficult to assess the country's statistical
capacity based on the number of data. This is because
there is a difference in the content of data required for
each country. As can be seen below, the amount of data
that ROK possesses varies considerably by each of the 17
goals. Comparing the number of the ROK's data to that
of the global level, it shows more than 80% of the data
accumulation rate in Goal 3, Goal 4, Goal 7, Goal 9, and
Goal 15. On the other hand, the data accumulation rates
of Goal 6, Goal 10, Goal 11, Goal 12, Goal 13, Goal 14, and
Goal 16 are less than 50%.
14 • Sustainable Development Goals in the Republic of Korea: Progress Report 2019
Number of Data in Global DB of Asian Countries and G7 Countries (Unit:number)
0 50 100 150 200 250 300
65 88 129 202 210 245 250
129 146 185 204 208 211 220 224 232 247 253
138 196 197 247 249
177 197 209 210 215 219 225 229 232
142 149 155 166 167 167 168 175 185 192 213 213 225 226 234 238 250 252
196 200 202 209 218 248
Note 1: Country standards are based on the UNSD’s ’Standard country or Area Codes for statistical use’ 2: Japan among the G7 countries is presented in the East Asia category
East Asia
South-east Asia
Central Asia
South Asia
West Asia
G7
MacauHong Kong
DPRKChinaJapan
ROKMongolia
Brunei
United Arab Emirates
Singapore
Bahrain
East Timor
Qatar
Afghanistan
Indonesia
Iraq
Maldives
Myanmar
Kuwait
Jordan
United States
Iran
Tajikistan
Philippines
Oman
Lebanon
Bhutan
Cambodia
Israel
Azerbaijan
Italy
Sri Lanka
Uzbekistan
Laos
Saudi Arabia
Yemen
Canada
India
Vietnam
Syria
Armenia
France
Pakistan
Kyrgyzstan
Thailand
Palestine
Georgia
United Kingdom
Bangladesh
Turkmenistan
Malaysia
Cyprus
Turkey
Germany
Nepal
Kazakhstan

Chapter 4. The Progress of SDGs in the ROK • 15
This report used data contained in the DB to examine
the implementation of SDGs in the ROK. The analysis
indicators were limited to cases where the data can be
compared between time points since there are data
from at least two points in time after 2000 among
the data with Korean data in the global DB. However,
qualitative indicators asking if and how law, institutions
and policies are enforced (e.g. the number of countries
adopting and implementing constitutions, laws and
policies that ensure public access to information). Also,
cases with no recent data since 2010 were excluded
from the analysis. Through this process, 30 global
indicators were finally selected for the analysis. This
allowed for proxy statistics to be used to help measure
the corresponding concept, either in combination with
Korean data in the global DB or in the absence of Korean
data in the global DB. Proxy statistics were used in 24
indicators. The table below specifically summarizes
The Progress of SDGs in the ROK
the number of indicators used in the implementation
analysis for each goal.
The international comparison was carried out for
Canada, France, Germany, Italy, Japan, the United
Kingdom (U.K.) and the United States (U.S.), which are
the G7 countries (in alphabetical order). A comparison
with the OECD and the G20 countries to which the ROK
belongs can also be considered, but there is a concern
that the analysis will be inconsistent because not all
this organization’s member states data are included.
Although questions about the political disposition of the
G7 countries may be raised, we performed comparisons
with the G7 countries only for the statistical purpose.
In interpreting the results of the analysis, note the
following:
First, since the analysis is based only on the statistics
available for each goal, the analysis results should
not be interpreted as an evaluation of the overall
implementation of the goal. In order to reduce such
misunderstandings, the indicators used in the analysis
were displayed in a diagram and presented before each
goal analysis. Second, the ROK’s data contained in the
global DB is sometimes used as it is, but sometimes
it is adjusted, estimated, and modeled for international
comparison. This data is different from the domestic
statistics. Third, if there are multiple sources of data in
one indicator, the data with long time series and high
possibility of disaggregation among official statistics
was analyzed. Fourth, in the case of international
comparison, the year of comparison and source may
differ depending on the time of data availability and
the type of survey. Fifth, the figures used in this report
are rounded, and the sum and total of the details are
inconsistent in some cases.
Number of Indicators used in the Analysis(Unit: number)
Data avail-able
Global data Proxy
1. No poverty 14 6 3 1 2
2. Zero hunger 13 6 5 1 4
3. Good health and well-being 27 22 6 6 0
4. Quality education 11 7 4 4 3
5. Gender equality 14 4 3 3 0
6. Clean water and sanitation 11 7 3 1 2
7. Affordable and clean energy 6 4 2 2 1
8. Decent work and economic growth
17 9 3 3 0
9. Industry, innovation and infrastructure
12 9 4 4 0
10. Reduced inequalities 11 3 1 1 1
11. Sustainable cities and communities
15 5 3 1 2
12. Responsible consumption and production
13 2 3 0 3
13. Climate action 8 3 1 0 1
14. Life below water 10 2 2 0 2
15. Life on land 14 6 2 1 1
16. Peace and justice 23 5 3 1 2
17. Partnerships for the goals 25 9 1 1 0
Total 244 109 49 30 24
Goals
Total number of indicators
Number of analysis indicators
Chapter 4

16 • Sustainable Development Goals in the Republic of Korea: Progress Report 2019
Eliminating poverty is as important in the global development agenda as in the national development agenda. The
absolute poverty rate based on the international standards was reduced by more than half, 25.6% in 2002 to 10.0%
in 2015. But one out of ten still lives on less than $ 1.9 a day. Thus, SDGs are pushing ahead with No Poverty as their
first goal. In particular, it is trying to eliminate poverty at various levels as well as poverty based on income. To this
end, they are trying to build a social security system and protect the poor and vulnerable by strengthening access
to social services, and reduce vulnerabilities from risk factors such as disasters by building a resilience mechanism.
End poverty in all its forms everywhere
NOPOVERTY1
1.1 By 2030, eradicate extreme poverty for all people everywhere, currently measured as people living on less than $1.25 a day
1.1.1 Proportion of population below the international poverty line, by sex, age, employment status and geographical location (urban/rural)
1.2 By 2030, reduce at least by half the proportion of men, women and children of all ages living in poverty in all its dimensions ac-cording to national definitions
1.2.1 Proportion of population living below the national poverty line, by sex and age Relative poverty rate
1.2.2 Proportion of men, women and children of all ages living in poverty in all its dimensions according to national definitions
1.3 Implement nationally appropriate social protection systems and measures for all, including floors, and by 2030 achieve substan-tial coverage of the poor and the vulnerable
1.3.1 Proportion of population covered by social protection floors/systems, by sex, distinguishing children, unemployed persons, older persons, persons with disabilities, pregnant women, newborns, work-injury victims and the poor and the vulnerable
Recipient rate of national basic living security
1.4 By 2030, ensure that all men and women, in particular the poor and the vulnerable, have equal rights to economic resources, as well as access to basic services, ownership and control over land and other forms of property, inheritance, natural resources, appropriate new technology and financial services, including microfinance
1.4.1 Proportion of population living in households with access to basic services
1.4.2 Proportion of total adult population with secure tenure rights to land, (a) with legally recognized documentation, and (b) who perceive their rights to land as secure, by sex and type of tenure
1.5 By 2030, build the resilience of the poor and those in vulnerable situations and reduce their exposure and vulnerability to cli-mate-related extreme events and other economic, social and environmental shocks and disasters
1.5.1 Number of deaths, missing persons and directly affected persons attributed to disasters per 100,000 population
1.5.2 Direct economic loss attributed to disasters in relation to global gross domestic product (GDP)
1.5.3 Number of countries that adopt and implement national disaster risk reduction strategies in line with the Sendai Framework for Disaster Risk Reduction 2015–2030
1.5.4 Proportion of local governments that adopt and implement local disaster risk reduction strategies in line with national disaster risk reduc-tion strategies
1.a Ensure significant mobilization of resources from a variety of sources, including through enhanced development cooperation, in order to provide adequate and predictable means for developing countries, in particular least developed countries, to imple-ment programmes and policies to end poverty in all its dimensions
1.a.1 Proportion of domestically generated resources allocated by the government directly to poverty reduction programmes
1.a.2 Proportion of total government spending on essential services (education, health and social protection)
1.a.3 Sum of total grants and non-debt-creating inflows directly allocated to poverty reduction programmes as a proportion of GDP
1.b Create sound policy frameworks at the national, regional and international levels, based on pro-poor and gender-sensitive de-velopment strategies, to support accelerated investment in poverty eradication actions
1.b.1 Proportion of government recurrent and capital spending to sectors that disproportionately benefit women, the poor and vulnerable groups
ROK’s data updated in global DB Indicator used for analysis Proxy indicator11
11 Official title of individual targets may somewhat different. The exact name of each targets or indicators can be found in the appendix, list of UN SDG indicators.

Chapter 4. The Progress of SDGs in the ROK • 17
Establishment of Social Security System
Social protection, or social security, is a human
right and is defined as the set of policies and
programmes designed to reduce and prevent poverty
and vulnerability throughout the life cycle (ILO,
2018). National Basic Living Security System is a
representative public assistance system in the ROK
that provides living expenses, housing expenses,
medical expenses, and education expenses to poor
households. The minimum cost of living was used
as a criterion for selecting recipients, but the concept
of relative poverty was introduced from July 2015
(Ministry of Health and Welfare, 2018). The recipient
rate of the National Basic Living Security System
has declined since 2009, down to 2.6% in 2014, but
rebounded to 3.2% in 2015 due to revision of system.
According to the age distribution of general recipients,
the sum of those under 20 and those aged 70 or older
accounted for almost half of the total recipients, and
female accounted for more than male.
Recipient Rate of National Basic Living Security(Unit: %)
Source: Ministry of Health and Welfare, Social Security Fact Book 2017Note : Recipient rate is calculated by summing ordinary and facility recipients
3.0
3.1
3.2
2.6
2001
2003
2002
2005
2004
2007
2006
2009
2008
2010
2011
2012
2013
2015
2014
2017
20160
2.5
5.0
Ordinary Recipients by Sex and Age: 2017(Unit: %)
Source: Ministry of Health and Welfare, Social Security Fact Book 2017
FemaleMale
20 or younger 20-29
40-4950-5960-69
70 or older
45.8
25.9
6.2
3.911.3
16.414.3
22.0
54.2
0 25 50 75 100
30-39
Relative Poverty Rate based on Disposable Income (Unit: %)
Source: KOSTAT, Combined data between Household Income and Expenditure Survey and Farm Household Economy Survey
Not 1: Based on the equivalized income calculated by dividing household in-come by the square root of the number of members of household, so that the welfare level can be compared between households with differ-ent number of household members
2: Disposable Income = Market Income + Public Transfer Income - Public Transfer Expenditure
3: From 2016, official distribution indicator data source was changed to Sur-vey of Household Financial and Living Conditions
2006
2007
2008
2009
2010
2011
2012
2013
2014
2015
2016
2006
2007
2008
2009
2010
2011
2012
2013
2014
2015
20160
10
20
30
40
50
Female Total Male 18-65 years old 66 or older
By sex By age
15.514.313.0
16.814.712.3
47.743.9
11.19.0
Proportion of Population below International Poverty Line of 1.9 USD per Day
(Unit: %)
Source: World Bank, World Development Indicators Database
0.0
1.0
1.5
0.5
2006
2012
2000
2013
2003
2015
2000
2015
2003
2014
2008
2004
2015
2000
2016
ROK Canada France Germany Italy Japan U.K. U.S.
0.2
0.2
0.2
0.7
1.2
0.7
1.2
0.2
0.5
0.2
0.5
0 0 0 0
Poverty
The relative poverty rate based on below 50% of
median income was found to be 14.7% based on
disposable income in 2016. It is up 0.4%p compared to
2006, 10 years ago. By age group, the relative poverty
rate for retired people aged 66 or older was 47.7% in
2016, more than five times higher than working age
group aged 18-65 (9.0%). On the other hand, female's
relative poverty rate was found to be consistently
higher than male's in all years.
Poverty is also being tracked at the global level.
The World Bank defines the poverty line as $ 1.9 a
day, based on 2011 international prices (IAEG-SDGs,
2018a). According to this, the poverty rate in the ROK
was estimated to be 0.2% in 2012. Compared with
major countries, the poverty rate of France (2015),
Germany (2015), Canada (2013), U.S. (2016) and Italy
(2014) was found to be 0%, 0%, 0.5%, 1.2% and 1.2%,
respectively.

18 • Sustainable Development Goals in the Republic of Korea: Progress Report 2019
SDG2 aims to overcome starvation and malnutrition, which are fundamental issues to be resolved for sustainable
development. According to ”The State of Food Security and Nutrition in the World (2018)“ co-published by the Food
and Agriculture Organization (FAO) and the World Food Program (WFP), 821 million people, more than 10% of the
world's population, have chronic food shortages as of 2017 and this hunger population is increasing every year.
Beyond simply supplying and consuming sufficient food, SDGs also address increasing food access, providing
sustainable and sufficient quality nutrition, and securing a food production system to end hunger.
End hunger, achieve food security and improved nutrition and promote sustainable agriculture
ZEROHUNGER2
2.1 By 2030, end hunger and ensure access by all people, in particular the poor and people in vulnerable situations, including in-fants, to safe, nutritious and sufficient food all year round
2.1.1 Prevalence of undernourishment Prevalence of nutrition deficiency
2.1.2 Prevalence of moderate or severe food insecurity in the population, based on the Food Insecurity Experience Scale (FIES) Percentage of households with food security
2.2 By 2030, end all forms of malnutrition, including achieving, by 2025, the internationally agreed targets on stunting and wasting in children under 5 years of age, and address the nutritional needs of adolescent girls, pregnant and lactating women and older persons
2.2.1 Prevalence of stunting (height for age <-2 standard deviation from the median of the World Health Organization (WHO) Child Growth Standards) among children under 5 years of age
2.2.2 Prevalence of malnutrition (weight for height >+2 or <-2 standard deviation from the median of the WHO Child Growth Standards) among children under 5 years of age, by type (wasting and overweight)
2.3 By 2030, double the agricultural productivity and incomes of small-scale food producers, in particular women, indigenous peo-ples, family farmers, pastoralists and fishers, including through secure and equal access to land, other productive resources and inputs, knowledge, financial services, markets and opportunities for value addition and non-farm employment
2.3.1 Volume of production per labour unit by classes of farming/pastoral/forestry enterprise size Agricultural labour productivity
2.3.2 Average income of small-scale food producers, by sex and indigenous status Farm household income
2.4 B y 2030, ensure sustainable food production systems and implement resilient agricultural practices that increase productivity and production, that help maintain ecosystems, that strengthen capacity for adaptation to climate change, extreme weather, drought, flooding and other disasters and that progressively improve land and soil quality
2.4.1 Proportion of agricultural area under productive and sustainable agriculture
2.5 By 2020, maintain the genetic diversity of seeds, cultivated plants and farmed and domesticated animals and their related wild species, including through soundly managed and diversified seed and plant banks at the national, regional and international levels, and promote access to and fair and equitable sharing of benefits arising from the utilization of genetic resources and as-sociated traditional knowledge, as internationally agreed
2.5.1 Number of plant and animal genetic resources for food and agriculture secured in either medium- or long-term conservation facilities
2.5.2 Proportion of local breeds classified as being at risk, not at risk or at unknown level of risk of extinction
2.a Increase investment, including through enhanced international cooperation, in rural infrastructure, agricultural research and extension services, technology development and plant and livestock gene banks in order to enhance agricultural productive ca-pacity in developing countries, in particular least developed countries
2.a.1 The agriculture orientation index for government expenditures
2.a.2 Total official flows (official development assistance plus other official flows) to the agriculture sector
2.b Correct and prevent trade restrictions and distortions in world agricultural markets, including through the parallel elimination of all forms of agricultural export subsidies and all export measures with equivalent effect, in accordance with the mandate of the Doha Development Round
2.b.1 Agricultural export subsidies
2.c Adopt measures to ensure the proper functioning of food commodity markets and their derivatives and facilitate timely access to market information, including on food reserves, in order to help limit extreme food price volatility
2.c.1 Indicator of food price anomalies
ROK’s data updated in global DB Indicator used for analysis Proxy indicator

Chapter 4. The Progress of SDGs in the ROK • 19
Frui
ts
Vege
tabl
es
Spec
ializ
ed C
rops
Flor
icul
ture
Gene
ral F
ield
Cro
ps
Live
stoc
k
Othe
rs
19,9
64
18,0
4815
,962
15,3
62
17,0
17
41,9
37
27,1
32
0.5h
a or
less
0.5-
1.0h
a
1.0-
1.5h
a
1.5-
2.0h
a
2.0-
3.0h
a
3.0-
5.0h
a
5.0-
7.0h
a
7.0-
10.0
ha
8,11
616
,470 19
,107
19,6
84
25,5
16 29,1
94
40,5
83
42,1
59
0
50,000
40,000
30,000
20,000
10,000
Pad
dy ri
ce
10.0
ha o
r mor
e41
,947
Cultivated Land Size
28,3
87
Farmland Size
Labor Productivity by Farm Type and Cultivated Land Size: 2017(Unit: won/ hour)
Nutrition and Food Supply
The percentage of nutrition deficiency population
calculated based on nutrient intake of Koreans was
10.2% in 2016, 6.9%p down compared to 17.1% in
2007. However, the percentage of female's nutrition
deficiency was 14.6%, more than twice that of
male. By age group, the percentage was highest in
adolescence. During the same period the percentage
of households with food security increased from
89.0% in 2007 to 95.8% in 2016, which means that the
percentage of households that are economically hard
and lack food sometimes or often has decreased from
11.0% to 4.2%.
Agricultural Labor Productivity and Farm
Household Income
Labor productivity is the ratio of added value to the
working hours, which is an indicator of comparing
economic productivity between industries or
between farms. According to the Farm Household
Economy Survey, labor productivity of agriculture
increased from 12,839 won per hour in 2007 to 21,444
won in 2017. In terms of farm type, labor productivity
was highest in the livestock industry (41,937
won), followed by paddy rice (28,387 won). Labor
productivity of agriculture also varied depending
on the size of the cultivated land. Labor productivity
Percentage of Nutrition Deficiency Population by Sex and Age: 2016(Unit: %)
Source: Korea Centers for Disease Control and Prevention, 2016 National Health Statistics
0 25 50 75 100
14.6
5.9
5.4
7.1
4.9
19.8
17.3
11.6
4.3
6.9
Female
Male
1-2
3-5
6-11
12-18
19-29
30-49
50-64
65 or older
Agricultural Labor Productivity(Unit: won/ hour)
2017
12,839
21,444
2007
2008
2009
2010
2011
2012
2013
2014
2015
20160
25,000
20,000
15,000
10,000
5,000
Source: KOSTAT, Farm Household Economy SurveyNote 1: Labor productivity of agriculture = value added of agriculture / labor hour
in operating farms 2: Value added of agriculture = Gross farm receipt – (intermediate material
– depreciation)
Source: KOSTAT, Farm Household Economy Survey
2007
2008
2009
2010
2011
2012
2013
2014
2015
2016
Households with food securityNutrition de�ciency population
89.095.8
17.110.2
0
50
100
Source: Korea Centers for Disease Control and Prevention, 2016 2016 National Health Statistics
Note 1: The nutrition deficiency population means that the energy intake is less than 75% of the required estimate and the intake of calcium, iron, vita-min A and riboflavin is less than the average requirement according to 2015 Korean Nutrient Intake of the Ministry of Health and Welfare
2: Households with food security mean those who answered to the ques-tion about the household’s eating habits in the last year as ’all of my fam-ily could eat as much as we wanted and various kinds of food’ and ’we could have had enough food, but not many kinds of food’
Percentage of Nutrition Deficiency Population and Households with Food Security
(Unit: %)
20 • Sustainable Development Goals in the Republic of Korea: Progress Report 2019
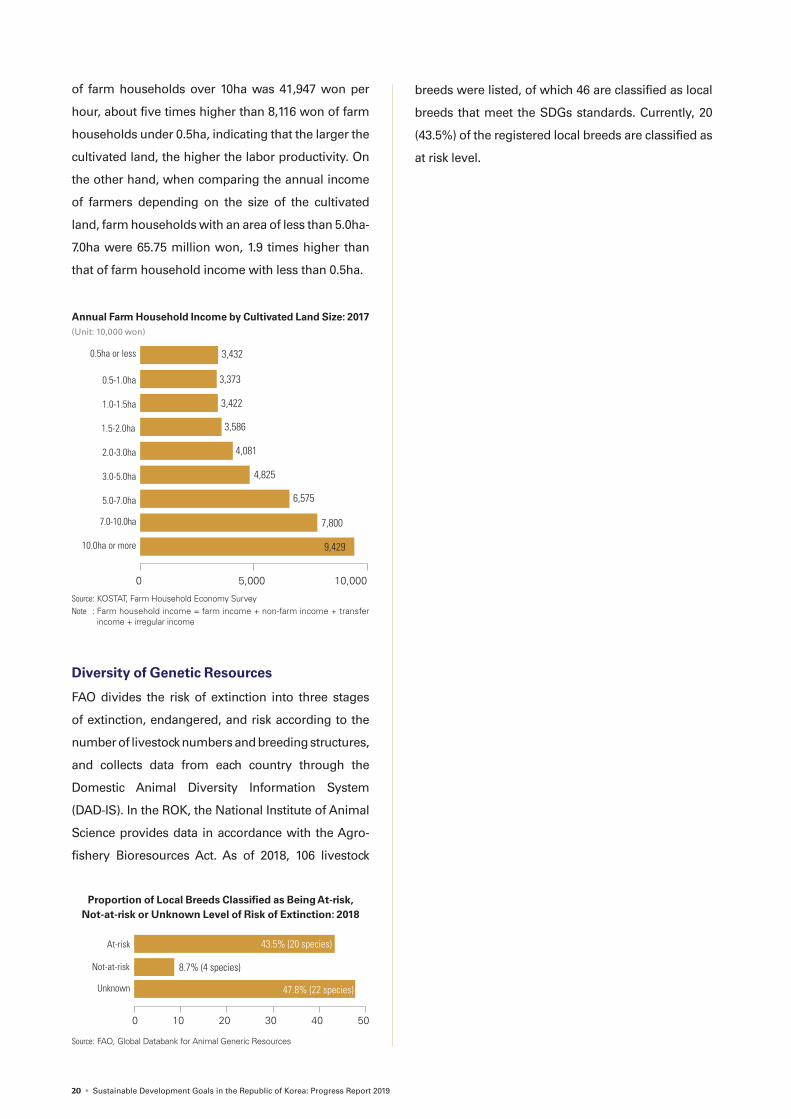
Diversity of Genetic Resources
FAO divides the risk of extinction into three stages
of extinction, endangered, and risk according to the
number of livestock numbers and breeding structures,
and collects data from each country through the
Domestic Animal Diversity Information System
(DAD-IS). In the ROK, the National Institute of Animal
Science provides data in accordance with the Agro-
fishery Bioresources Act. As of 2018, 106 livestock
Proportion of Local Breeds Classified as Being At-risk, Not-at-risk or Unknown Level of Risk of Extinction: 2018
Source: FAO, Global Databank for Animal Generic Resources
At-risk
Not-at-risk
Unknown
0 10 20 30 40 50
8.7% (4 species)
47.8% (22 species)
43.5% (20 species)
Annual Farm Household Income by Cultivated Land Size: 2017 (Unit: 10,000 won)
0 5,000 10,000
0.5ha or less
0.5-1.0ha
1.0-1.5ha
1.5-2.0ha
2.0-3.0ha
3.0-5.0ha
5.0-7.0ha
3,432
3,373
3,422
3,586
4,081
4,825
6,575
7,800
9,42910.0ha or more
7.0-10.0ha
Source: KOSTAT, Farm Household Economy SurveyNote : Farm household income = farm income + non-farm income + transfer
income + irregular income
of farm households over 10ha was 41,947 won per
hour, about five times higher than 8,116 won of farm
households under 0.5ha, indicating that the larger the
cultivated land, the higher the labor productivity. On
the other hand, when comparing the annual income
of farmers depending on the size of the cultivated
land, farm households with an area of less than 5.0ha-
7.0ha were 65.75 million won, 1.9 times higher than
that of farm household income with less than 0.5ha.
breeds were listed, of which 46 are classified as local
breeds that meet the SDGs standards. Currently, 20
(43.5%) of the registered local breeds are classified as
at risk level.
Chapter 4. The Progress of SDGs in the ROK • 21
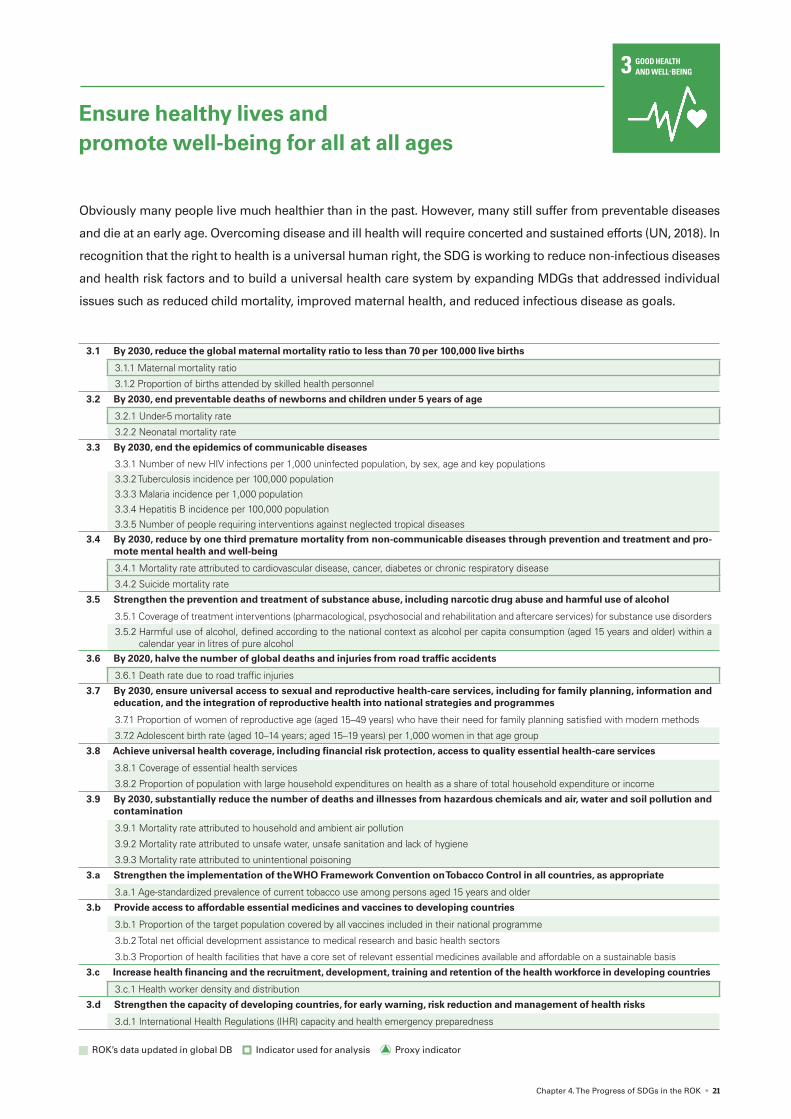
Obviously many people live much healthier than in the past. However, many still suffer from preventable diseases
and die at an early age. Overcoming disease and ill health will require concerted and sustained efforts (UN, 2018). In
recognition that the right to health is a universal human right, the SDG is working to reduce non-infectious diseases
and health risk factors and to build a universal health care system by expanding MDGs that addressed individual
issues such as reduced child mortality, improved maternal health, and reduced infectious disease as goals.
Ensure healthy lives and promote well-being for all at all ages
GOOD HEALTHAND WELL-BEING3
3.1 By 2030, reduce the global maternal mortality ratio to less than 70 per 100,000 live births
3.1.1 Maternal mortality ratio
3.1.2 Proportion of births attended by skilled health personnel
3.2 By 2030, end preventable deaths of newborns and children under 5 years of age
3.2.1 Under-5 mortality rate
3.2.2 Neonatal mortality rate
3.3 By 2030, end the epidemics of communicable diseases
3.3.1 Number of new HIV infections per 1,000 uninfected population, by sex, age and key populations
3.3.2 Tuberculosis incidence per 100,000 population
3.3.3 Malaria incidence per 1,000 population
3.3.4 Hepatitis B incidence per 100,000 population
3.3.5 Number of people requiring interventions against neglected tropical diseases3.4 By 2030, reduce by one third premature mortality from non-communicable diseases through prevention and treatment and pro-
mote mental health and well-being
3.4.1 Mortality rate attributed to cardiovascular disease, cancer, diabetes or chronic respiratory disease
3.4.2 Suicide mortality rate
3.5 Strengthen the prevention and treatment of substance abuse, including narcotic drug abuse and harmful use of alcohol
3.5.1 Coverage of treatment interventions (pharmacological, psychosocial and rehabilitation and aftercare services) for substance use disorders
3.5.2 Harmful use of alcohol, defined according to the national context as alcohol per capita consumption (aged 15 years and older) within a calendar year in litres of pure alcohol
3.6 By 2020, halve the number of global deaths and injuries from road traffic accidents
3.6.1 Death rate due to road traffic injuries
3.7 By 2030, ensure universal access to sexual and reproductive health-care services, including for family planning, information and education, and the integration of reproductive health into national strategies and programmes
3.7.1 Proportion of women of reproductive age (aged 15–49 years) who have their need for family planning satisfied with modern methods
3.7.2 Adolescent birth rate (aged 10–14 years; aged 15–19 years) per 1,000 women in that age group
3.8 Achieve universal health coverage, including financial risk protection, access to quality essential health-care services
3.8.1 Coverage of essential health services
3.8.2 Proportion of population with large household expenditures on health as a share of total household expenditure or income
3.9 By 2030, substantially reduce the number of deaths and illnesses from hazardous chemicals and air, water and soil pollution and contamination
3.9.1 Mortality rate attributed to household and ambient air pollution
3.9.2 Mortality rate attributed to unsafe water, unsafe sanitation and lack of hygiene
3.9.3 Mortality rate attributed to unintentional poisoning
3.a Strengthen the implementation of the WHO Framework Convention on Tobacco Control in all countries, as appropriate
3.a.1 Age-standardized prevalence of current tobacco use among persons aged 15 years and older
3.b Provide access to affordable essential medicines and vaccines to developing countries
3.b.1 Proportion of the target population covered by all vaccines included in their national programme
3.b.2 Total net official development assistance to medical research and basic health sectors
3.b.3 Proportion of health facilities that have a core set of relevant essential medicines available and affordable on a sustainable basis
3.c Increase health financing and the recruitment, development, training and retention of the health workforce in developing countries
3.c.1 Health worker density and distribution
3.d Strengthen the capacity of developing countries, for early warning, risk reduction and management of health risks
3.d.1 International Health Regulations (IHR) capacity and health emergency preparedness
ROK’s data updated in global DB Indicator used for analysis Proxy indicator

22 • Sustainable Development Goals in the Republic of Korea: Progress Report 2019
Death from Non-Communicable Diseases
According to the trends in the number of deaths
from cancer, diabetes, the cardiovascular system and
chronic respiratory disease, the number of deaths
from diseases, except for diabetes, has increased
compared to 2000. By sex, the number of female
deaths was higher in cardiovascular system disorders,
while the number of male deaths was higher in cancer
and chronic respiratory disease. The probability of
death from all four types of disease estimated by
the World Health Organization (WHO) has decreased
from 16.5% in 2000 to 7.8% in 2016. During the same
period (2016), the probability was 8.4%, 9.5% and 9.8%
in Japan, Italy and Canada, respectively. On the other
hand, the mortality rate of male was higher than that
of female in all countries to be compared.
Maternal and Child Mortality
As of 2017, the maternal mortality ratio in the ROK
is 7.8 per 100,000 live births. Compared with 13.5 in
2009, this is a decrease of nearly half. According to
the data estimated for international comparison, only
the U.S. has a higher maternal mortality ratio than
the ROK in 2015. And the mortality ratio of the U.S.
increased compared to 2000 unlike other countries.
The mortality rate for children under the age of 5 is
3.3 per 1,000 live births in 2017, down from 2000.
Japan had the lowest mortality rate of 2.6, followed
by Italy (3.4), Germany (3.7), France (4.2), the U.K.
(4.3), Canada (5.1) and the U.S. (6.6). Disaggregation
by sex, the mortality rate of boys was consistently
higher than that of girls in all countries.
International Comparison of Under-five Mortality Rate(Unit: per 1,000 live births)
Source: United Nations Inter-agency Group for Child Mortality Estimation
Female All
Male
ROK Canada France Germany Italy Japan U.K. U.S.
2000
2017
2000
2017
2000
2017
2000
2017
2000
2017
2000
2017
2000
2017
2000
20170
5
10
6.97.58.0
3.53.33.0
5.14.7
5.5
4.23.8
4.6
3.73.4
4.1
3.13.43.6
2.62.4
2.7
4.33.9
6.66.0
7.2
4.7
6.25.6
6.8
5.44.7
6.05.44.8
5.95.65.1
6.0
4.54.1
4.9
6.54.9
7.2
8.47.6
9.3
Maternal Mortality Ratio
(Unit: Deaths per 100,000 live births)
Source: KOSTAT, Death Cause StatisticsNote: Maternal mortality ratio is death caused by direct or indirect obstetrical
causes during pregnancy or within 42 days after delivery, and is calculat-ed by dividing the number of maternal deaths by the number of live births
2009 2010 2011 2012 2013 2014 2015 2016 2017
13.5
7.8
0
5
10
15
20
ROK
Canada
France
Germany
Italy
Japan
U.K.
U.S.20002015
0 5 10 15 20
16
9
12
8
5
11
7
8
6
10
12
4
5
9
12 14
International Comparison of Maternal Mortality Ratio
(Unit: Deaths per 100,000 live births)
Source: WHO, UNICEF, UNFPA, World Bank Group and the UNPD, Trends in ma-ternal mortality: 1990 to 2015
0
20,000
40,000
60,000
80,000
2000 2017 2000 2017 2000 2017 2000 2017Cancer Diabetes Cardiovascular
System DiseaseChronic
Respiratory Disease
All
Female
Male
20,973
28,485
28,674
10,8085,4075,401
9,1844,6704,514
11,3936,6564,737
12,9077,9194,988
29,997
58,197
78,86348,866
37,224
58,827
61,266
30,342
32,592
Number of Deaths Attributed to Cancer, Diabetes, Cardiovascular Disease, Chronic Respiratory Disease
(Unit: person)
Source: KOSTAT, Death Cause StatisticsNote: In the case of chronic respiratory disease, the numbers corresponding
to disease / death cause classification code J30-J98 are compiled from microdata according to the definition of SDG indicator (3.4.1)

Chapter 4. The Progress of SDGs in the ROK • 23
Mental Health and hazardous Environment
Suicide and traffic accidents account for the highest
proportion of deaths by external factors other than
diseases in the ROK (KOSTAT, 2018a). According to
the WHO's adjusted results for comparison of each
country's data, the ROK's suicide mortality rate
increased from 14.8 per 100,000 population in 2000
to 26.9 in 2016, which is more than three times higher
than that of Italy (8.2 people in 2016), which has the
lowest suicide mortality rate among the countries
to be compared. On the other hand, the suicide
mortality rate of male is higher than that of female in
all countries.
All
Female
Male
0
10
20
30
40
2000
2016
2000
2016
2000
2016
2000
2016
2000
2016
2000
2016
2000
2016
2000
2016
ROK Canada France Germany Italy Japan U.K. U.S
20.314.89.3
38.426.915.4
19.613.06.5
18.112.57.0
19.713.67.7
26.018.511.4 23.6
15.37.2
35.824.713.9 17.9
11.34.9
13.58.94.4
13.79.14.8
22.114.77.7 11.7
7.84.1
12.18.24.5
23.917.711.7
30.522.314.4
International Comparison of Death Rate due to Road Traffic Injuries
(Unit: per 100,000 population)
Source: WHO, Global Health Estimates 2016: Deaths by cause, age, sex, by country and by region 2000-2016
Mortality Rate Attributed to Cancer, Diabetes, Cardiovascular Disease, Chronic Respiratory Disease (probability)
(Unit: %)
Source: WHO, Global Health Estimates 2016; Deaths by cause, age, sex, by coun-try and by region 2000-2016
Note: Probability of death from cancer, diabetes, cardiovascular disease, or chronic respiratory disease between the ages of 30 and 70, which is cal-culated using life table methods
All Female Male
2000
2016
2000
2016
2000
2016
2000
2016
2000
2016
2000
2016
2000
2016
2000
2016
Canada ROK France Germany Italy Japan U.K. U.S
22.916.510.6
17.614.411.2
11.59.88.1
19.013.88.6
14.110.67.2
15.212.18.9
21.116.111.2
17.913.59.3
12.09.57.2
15.511.47.5
20.016.412.9
21.618.014.6
11.28.45.7
12.910.99.0
17.514.611.8
10.97.84.7
0
10
20
30
40
The death rate due to road traffic injuries in the
ROK has declined in general, but is relatively higher
than that of the countries to be compared. As of 2013,
12 per 100,000 population are four times that of the
U.K., which has the lowest death rate (2.9population)
during the same period.
Source: WHO, Global Status Report on Road Safety 2015
International Comparison of Death Rate due to Road Traffic Injuries
(Unit: per 100,000 population)
2000
2013
2000
2013
2000
2013
2000
2013
2000
2013
2000
2013
2000
2013
2000
2013
ROK Canada France Germany Italy Japan U.K. U.S.
0
10
20
30
40
26.4
12.0
6.0 5.1 4.36.1
4.7
10.6
2.9
9.5
12.9
9.4
13.912.3
6.9
15.5
Health Workforce
According to the status of health workforce in the
ROK in 2016, the number of physicians, including
oriental physicians, was 117,450, and the number of
nurses was 348,401, an increase of 28.4% and 42.6%,
respectively, compared to 2007. However, when
compared to the number of physicians per 1,000
population in other countries, the density of medical
personnel is still low. In 2016, there were 2.3 per
1,000 population in the ROK, compared with 4.2 in
Germany, 4.0 in Italy and 3.2 in France. The number
of nurses was 6.9 per 1,000 population in the ROK,
about half that of Germany (13.8).

24 • Sustainable Development Goals in the Republic of Korea: Progress Report 2019
0 5 10 15
ROK
Canada
France
Germany
Italy
Japan
U.K.
Physician Nurse
2.36.9
2.59.8
3.210.6
4.213.8
4.05.7
2.411.2
2.88.4
International Comparison of Health Worker Density
(Unit: per 1,000 population)
Source: WHO, Global Health Workforce Statistics DatabaseNote: Data on Japan, Canada·France·Germany and Korea·U.K.·Italy was collect-
ed in 2014, 2015 and 2016, respectively
Number of Health Worker(Unit: persons)
Source: WHO, Global Health Workforce Statistics Database
Physician Nurse
2007
2008
2009
2010
2011
2012
2013
2014
2015
2016
0
100,000
200,000
300,000
400,000
91,475
117,450
244,274
348,401

Chapter 4. The Progress of SDGs in the ROK • 25
Ensure inclusive and equitable quality education and promote lifelong learning opportunities for all
Education is the driving force of development. The achievement of education itself is a goal, and it is also a key
means for implementing the other goals of the SDGs (Korean National Commission for UNESCO, 2018). Therefore,
unlike the MDGs, which focus on achieving primary education, the target of the SDGs is to ensure inclusive and fair
high quality education throughout the entire process from early childhood education to higher education. It also
promotes lifelong learning opportunities in various areas, including school education, vocational education and
sustainable development education.
QUALITYEDUCATION4
4.1 By 2030, ensure that all girls and boys complete free, equitable and quality primary and secondary education leading to relevant and effective learning outcomes
4.1.1 Proportion of children and young people (a) in grades 2/3; (b) at the end of primary; and (c) at the end of lower secondary achieving at least a minimum proficiency level in (i) reading and (ii) mathematics, by sex
Percentage of students above basic level in (i) reading and (ii) math (a) at the second or third year of elementary school, (b) at the end of elementary school, and (c) at the end of middle school
4.2 By 2030, ensure that all girls and boys have access to quality early childhood development, care and pre-primary education so that they are ready for primary education
4.2.1 Proportion of children under 5 years of age who are developmentally on track in health, learning and psychosocial well-being, by sex
4.2.2 Participation rate in organized learning (one year before the official primary entry age), by sex
4.3 By 2030, ensure equal access for all women and men to affordable and quality technical, vocational and tertiary education, in-cluding university
4.3.1 Participation rate of youth and adults in formal and non-formal education and training in the previous 12 months, by sex Formal and non-formal education participation rate
4.4 By 2030, substantially increase the number of youth and adults who have relevant skills, including technical and vocational skills, for employment, decent jobs and entrepreneurship
4.4.1 Proportion of youth and adults with information and communications technology (ICT) skills, by type of skill
4.5 By 2030, eliminate gender disparities in education and ensure equal access to all levels of education and vocational training for the vulnerable, including persons with disabilities, indigenous peoples and children in vulnerable situations
4.5.1 Parity indices (female/male, rural/urban, bottom/top wealth quintile and others such as disability status, indigenous peoples and con-flict-affected, as data become available) for all education indicators on this list that can be disaggregated
4.6 By 2030, ensure that all youth and a substantial proportion of adults, both men and women, achieve literacy and numeracy
4.6.1 Proportion of population in a given age group achieving at least a fixed level of proficiency in functional (a) literacy and (b) numeracy skills, by sex Percentage of population with sufficient literacy necessary for everyday life
4.7 By 2030, ensure that all learners acquire the knowledge and skills needed to promote sustainable development, including, among others, through education for sustainable development and sustainable lifestyles, human rights, gender equality, pro-motion of a culture of peace and non-violence, global citizenship and appreciation of cultural diversity and of culture’s contribu-tion to sustainable development
4.7.1 Extent to which (i) global citizenship education and (ii) education for sustainable development, including gender equality and human rights, are mainstreamed at all levels in (a) national education policies; (b) curricula; (c) teacher education; and (d) student assessment
4.a Build and upgrade education facilities that are child, disability and gender sensitive and provide safe, non-violent, inclusive and effective learning environments for all
4.a.1 Proportion of schools with access to (a) electricity; (b) the Internet for pedagogical purposes; (c) computers for pedagogical purposes; (d) adapted infrastructure and materials for students with disabilities; (e) basic drinking water; (f) single-sex basic sanitation facilities; and (g) basic handwashing facilities (as per the WASH indicator definitions)
4.b By 2020, substantially expand globally the number of scholarships available to developing countries, in particular least devel-oped countries, small island developing States and African countries, for enrolment in higher education, including vocational training and information and communications technology, technical, engineering and scientific programmes, in developed countries and other developing countries
4.b.1 Volume of official development assistance flows for scholarships by sector and type of study
4.c By 2030, substantially increase the supply of qualified teachers, including through international cooperation for teacher training in developing countries, especially least developed countries and small island developing States
4.c.1 Proportion of teachers in: (a) pre-primary; (b) primary; (c) lower secondary; and (d) upper secondary education who have received at least the minimum organized teacher training (e.g. pedagogical training) pre-service or in-service required for teaching at the relevant level in a given country
ROK’s data updated in global DB Indicator used for analysis Proxy indicator

26 • Sustainable Development Goals in the Republic of Korea: Progress Report 2019
Adult Education
The participation rate of lifelong learning among
Korean adults increased from 27.6% in 2007 to
34.4% in 2017. In terms of formal education and non-
formal education, formal education decreased from
2.3% to 1.9% during the same period, while non-
formal education increased from 26.1% to 33.4%. In
particular, the latter increased in all groups subdivided
by sex and age. According to the Programme for the
International Assessment of Adult Competencies
(PIAAC), the ROK's participation rate in formal and
non-formal education and training is 49.7%, which
is lower than that of the U.K. (59.1%) and Canada
(57.7%). In terms of sex, countries other than the U.K.
showed similar male and female participation rates
or higher male participation rate.
International Comparison of Minimum Proficiency in Reading and Math: 2015
(Unit: %)
Source: OECD, PISANote: Targeting the students in their first half of secondary education, and data
on Italy and Japan in math was collected in 2012
0 20 40 60 80 100
ROK
Canada
France
Germany
Italy
Japan
U.K.
U.S.
ROK
Canada
France
Germany
Italy
Japan
U.K.
U.S.
86.3
89.3
78.5
84.0
79.1
87.1
82.1
81.0
84.5
85.6
76.5
83.1
75.3
88.9
78.1
70.4
0 20 40 60 80 100
Reading
Math
From Early Childhood Education to
Secondary Education
The advancement rate of middle school and high
school in the ROK is almost 100%, and the enrollment
rate of kindergartens and daycare centers for 3-5
year-olds has continued to exceed 90.0% since
2014, indicating that universal education has been
performed (Jo Ji-min, 2018). However, quality is
just as important as the quantitative expansion of
educational opportunities in the education system.
According to the results of the evaluation of academic
achievement among the students, the percentage of
students above the minimum level in 2017 was 97.5%
(Korean language) and 93.1% (math), 95.3% and
90.8% in third grade of middle school, the second
grade of high school, respectively. Based on major
countries and their levels using Programme for
International Student Assessment, the ROK has the
highest rate of attainment of minimum proficiency in
both reading and math following Canada and Japan.
Percentage of Students above Minimum Level (Unit: %)
2008
2009
2010
2011
2012
2013
2014
2015
2016
2017
2008
2009
2010
2011
2012
2013
2014
2015
2016
2017
91.0
97.594.5
95.3
2nd grade of high school
3rd grade of middle school
87.1
93.191.1
90.8
Korean Language
Math
0
25
50
75
100
0
25
50
75
100
2008
2009
2010
2011
2012
2013
2014
2015
2016
2017
2008
2009
2010
2011
2012
2013
2014
2015
2016
2017
91.0
97.594.5
95.3
2nd grade of high school
3rd grade of middle school
87.1
93.191.1
90.8
Korean Language
Math
0
25
50
75
100
0
25
50
75
100
Source: Ministry of Education, National Level Academic Achievement Assess-ment Results
Note: The National Level Academic Achievement Assessment is carried out for third graders of middle school, the second graders of high school nation-wide in Korean, English, and Math in accordance with Elementary and Secondary Education Act and announced by the Ministry of Education as three levels of above average education, basic education, and lack of basic education

Chapter 4. The Progress of SDGs in the ROK • 27
Source: OECD, 2012, PIAAC (ROK, Canada, Japan, USA); Eurostat, 2011, Adult Education Survey (France, Italy, Germany, U.K.)
International Comparison of Participation Rates in Formal and Non-formal Education and Training
(Unit: %)
ROK
Canada
France
Germany
Italy
Japan
U.K.
U.S.
0 25 50 75 100
49.7 54.045.4
58.457.1
52.847.6
37.334.0
48.135.4
33.6 37.9
59.1 59.2
50.2 50.8
57.7
50.5
50.2
35.6
41.8
35.8
59.1
MaleFemale Total
1.9
27.6 34.4
4.1 5.6
2.11.7
2.31.2
0.70.6
0.2
2.3Formal education
Total
25-34 years old
35-44 years old
Female
Total
Male
45-54 years old
55-64 years old
65-79 years old
0 2 4 6 8 10
0 10 20 30 40 50
1.9 2.1
2.62.0
Adult Lifelong Learning Participation Rate(Unit: %)
0 10 20 30 40 50
33.426.1
38.825.8
38.028.3
33.525.5
28.623.5
26.9
Non-formal education
25-34 years old
35-44 years old
Female
Total
Male
45-54 years old
55-64 years old
65-79 years old
31.424.3
35.428.0
2007 2017
Source: Korean Educational Development Institute, Korean Adult Lifelong Learn-ing Survey
Note 1: Until 2016, the survey has been conducted for 25-64 year-olds, but from 2017, the target was changed to 25-79 year-olds.
2: Formal education refers to education for obtaining a diploma or degree through formal curriculum such as elementary, middle and high school or university (graduate school), and non-formal education is structured learn-ing activities other than formal education. It refers to education through programs or curricula operated by lifelong education institutions.
Literacy
Literacy in the SDGs is defined as the ability to
recognize, understand, interpret, create, and
communicate using printed and other written
materials created in a variety of contexts (Cho Sun-
ok, 2018). According to the results of the PIAAC,
the percentage of population achieving at least a
fixed level of proficiency in functional skills of the
ROK in 2012 was 97.8% for literacy and 95.8% for
numeracy, the second highest after Japan (99.4% and
98.8%, respectively). However, the results of further
disaggregation using domestic data show differences
between groups. According to the Adult Literacy
Survey, the percentage of people with sufficient
literacy was higher in 2017 than in 2014. However, the
percentage was lower in female than in male and the
percentage of literacy was decreased rapidly with age
after the 50s.
International Comparison of Percentage of Population Achieving at Least a Fixed Level of Proficiency in Functional
Skills: 2012(Unit: %)
Source: OECD, PIAAC
0 80 90 100
ROK
Canada
France
Germany
Italy
Japan
U.S.
Literacy Numeracy
97.895.8
96.294.0
94.690.8
94.491.9
96.795.4
99.498.8
95.990.5

28 • Sustainable Development Goals in the Republic of Korea: Progress Report 2019
ROK
ROK
ROK
ROK
ROK
ROK
Cana
da
Fran
ce
Italy
Ge
rman
y U.
K.Ja
pan
U.S.
Cana
da
Fran
ce
Italy
Ge
rman
y U.
K.Ja
pan
U.S.
Cana
da
Fran
ce
Italy
Ge
rman
y U.
K.Ja
pan
U.S.
Cana
da
Fran
ce
Italy
Ge
rman
y U.
K.Ja
pan
U.S.
Cana
da
Fran
ce
Italy
Ge
rman
y U.
K.Ja
pan
U.S.
Cana
da
Fran
ce
Italy
Ge
rman
y U.
K.Ja
pan
U.S.
0
1
2
Sex Socioeconomic Status
Reading
Urban-Rural
Sex Socioeconomic Status Urban-Rural
Math
0
1
2
International Comparison of Parity Indexes for Achievement in Reading and Math: 2015
Source: OECD, PISANote 1: Targeting the students in their first half of secondary education, and data
on Italy in math was collected in 2012. There is no comparison data be-tween city and country in France and Japan
2: The reference group for each index is male, the rich and city
Equity
The UN Educational, Scientific and Cultural
Organization (UNESCO) has developed a parity
index to identify equity in education. The index
means that the gap grows as the value moves away
from 1. According to sex, socioeconomic status, and
urban-rural parity indexes for the minimum level of
proficiency in reading and math, the urban-rural parity
indexes in all the comparison countries are close to
1, but parity indexes according to socioeconomic
status are further away from 1 to 0. This means that
the level of educational attainment is also low in the
low socioeconomic status in both reading and math.
Among them, the U.K. had the lowest socioeconomic
parity index in math, 0.59. In the ROK, the gap by
socioeconomic status is greater than the male-female
and urban-rural gap.
77.671.5
93.6
92.6
91.384.0
89.1
87.1
80.4
54.0
27.6
12.57.9
21.1
45.1
69.7
18-29 years old
30-39 years old
Female
Total
Male
40-49 years old
50-59 years old
60-69 years old
70-79 years old
80 or older
0 20 40 60 80 100
2014 2017
81.977.0
73.466.0
Percentage of Population with Sufficient Literacy for Everyday Life
(Unit: %)
Source: National Institute for Lifelong Education, Adult Literacy SurveyNote: The adult literacy survey categorizes literacy levels from complete literacy
(level 1) to sufficient literacy (level 4). Illiteracy refers to level 3, which lacks the basic literacy skills necessary for daily life. Here, the percentage of level 4 is presented
Chapter 4. The Progress of SDGs in the ROK • 29
Achieve gender equality and empower all women and girls
Gender is known as one of the most deep-rooted hierarchies in human society. People divide themselves into men
and women everywhere, and men have a better share almost everywhere (Harari, 2018). That's why the SDGs are
working to set and improve gender inequality as the independent goal. We aim to achieve sustainable development
by strengthening our capacity to achieve gender equality, meet women's rights, and expand political, social
and economic rights. To this end, specific targets include the establishment of a legal basis for gender equality,
eradication of harmful practice against women, valuation of unpaid domestic work and participation in decision-
making in the political and economic domains, securing sexual self-determination, and enhancement of economic
and social rights.
GENDEREQUALITY5
5.1 End all forms of discrimination against all women and girls everywhere
5.1.1 Whether or not legal frameworks are in place to promote, enforce and monitor equality and non-discrimination on the basis of sex
5.2 Eliminate all forms of violence against all women and girls in the public and private spheres, including trafficking and sexual and other types of exploitation
5.2.1 Proportion of ever-partnered women and girls aged 15 years and older subjected to physical, sexual or psychological violence by a current or former intimate partner in the previous 12 months, by form of violence and by age
5.2.2 Proportion of women and girls aged 15 years and older subjected to sexual violence by persons other than an intimate partner in the previous 12 months, by age and place of occurrence
5.3 Eliminate all harmful practices, such as child, early and forced marriage and female genital mutilation
5.3.1 Proportion of women aged 20–24 years who were married or in a union before age 15 and before age 18
5.3.2 Proportion of girls and women aged 15–49 years who have undergone female genital mutilation/cutting, by age
5.4 Recognize and value unpaid care and domestic work through the provision of public services, infrastructure and social protec-tion policies and the promotion of shared responsibility within the household and the family as nationally appropriate
5.4.1 Proportion of time spent on unpaid domestic and care work, by sex, age and location
5.5 Ensure women’s full and effective participation and equal opportunities for leadership at all levels of decision-making in politi-cal, economic and public life
5.5.1 Proportion of seats held by women in (a) national parliaments and (b) local governments
5.5.2 Proportion of women in managerial positions
5.6 Ensure universal access to sexual and reproductive health and reproductive rights as agreed in accordance with the Programme of Action of the International Conference on Population and Development and the Beijing Platform for Action and the outcome documents of their review conferences
5.6.1 Proportion of women aged 15–49 years who make their own informed decisions regarding sexual relations, contraceptive use and re-productive health care
5.6.2 Number of countries with laws and regulations that guarantee full and equal access to women and men aged 15 years and older to sexual and reproductive health care, information and education
5.a Undertake reforms to give women equal rights to economic resources, as well as access to ownership and control over land and other forms of property, financial services, inheritance and natural resources, in accordance with national laws
5.a.1 (a) Proportion of total agricultural population with ownership or secure rights over agricultural land, by sex; and (b) share of women among owners or rights-bearers of agricultural land, by type of tenure
5.a.2 Proportion of countries where the legal framework (including customary law) guarantees women’s equal rights to land ownership and/or control
5.b Enhance the use of enabling technology, in particular information and communications technology, to promote the empower-ment of women
5.b.1 Proportion of individuals who own a mobile telephone, by sex
5.c Adopt and strengthen sound policies and enforceable legislation for the promotion of gender equality and the empowerment of all women and girls at all levels
5.c.1 Proportion of countries with systems to track and make public allocations for gender equality and women’s empowerment
ROK’s data updated in global DB Indicator used for analysis Proxy indicator
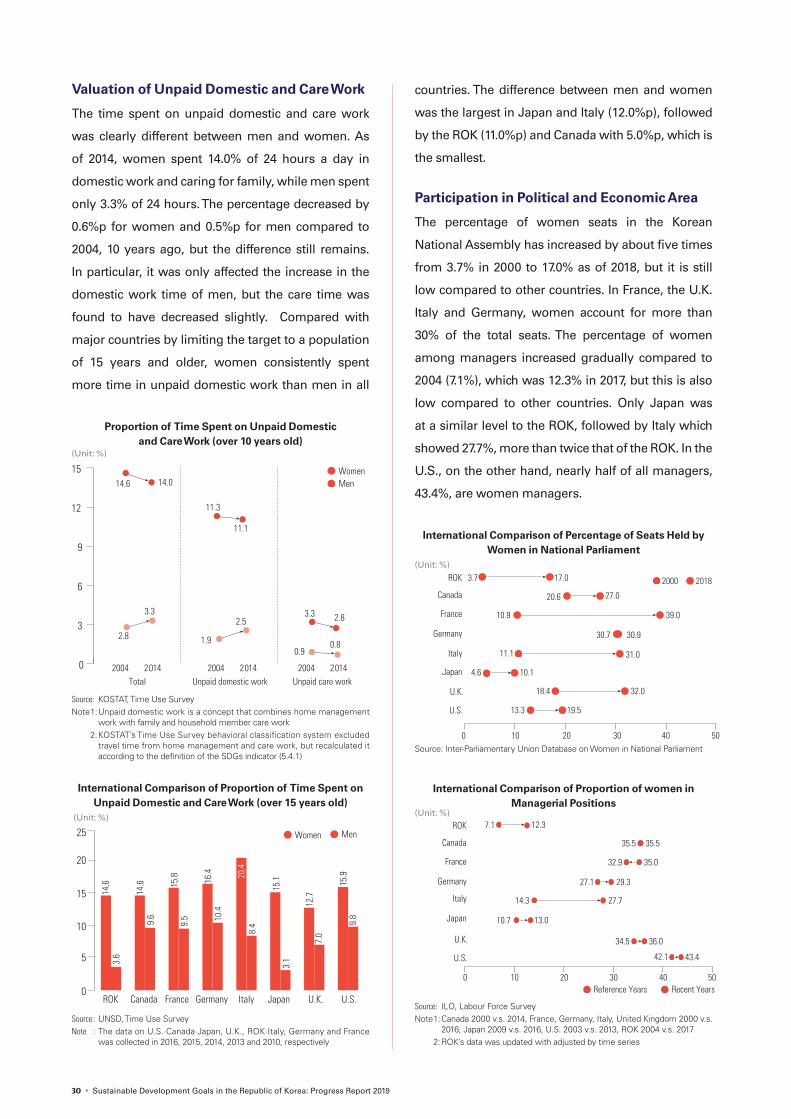
30 • Sustainable Development Goals in the Republic of Korea: Progress Report 2019
countries. The difference between men and women
was the largest in Japan and Italy (12.0%p), followed
by the ROK (11.0%p) and Canada with 5.0%p, which is
the smallest.
Participation in Political and Economic Area
The percentage of women seats in the Korean
National Assembly has increased by about five times
from 3.7% in 2000 to 17.0% as of 2018, but it is still
low compared to other countries. In France, the U.K.
Italy and Germany, women account for more than
30% of the total seats. The percentage of women
among managers increased gradually compared to
2004 (7.1%), which was 12.3% in 2017, but this is also
low compared to other countries. Only Japan was
at a similar level to the ROK, followed by Italy which
showed 27.7%, more than twice that of the ROK. In the
U.S., on the other hand, nearly half of all managers,
43.4%, are women managers.
2000 2018
0 10 20 30 40 50
3.7 17.0
27.0
39.0
30.7
31.0
10.1
32.0
19.5
20.6
10.9
11.1
4.6
18.4
13.3
30.9
ROK
Canada
France
Germany
Italy
Japan
U.K.
U.S.
International Comparison of Percentage of Seats Held by Women in National Parliament
(Unit: %)
Source: Inter-Parliamentary Union Database on Women in National Parliament
International Comparison of Proportion of women in Managerial Positions
(Unit: %)
Source: ILO, Labour Force SurveyNote 1: Canada 2000 v.s. 2014, France, Germany, Italy, United Kingdom 2000 v.s.
2016, Japan 2009 v.s. 2016, U.S. 2003 v.s. 2013, ROK 2004 v.s. 2017 2: ROK’s data was updated with adjusted by time series
0 10 20 30 40 50Reference Years
ROK
Canada
France
Germany
Italy
Japan
U.K.
U.S.
Recent Years
7.1
35.5
35.0
27.1
14.3
10.7
34.5
42.1
12.3
35.5
29.3
32.9
27.7
13.0
36.0
43.4
Proportion of Time Spent on Unpaid Domestic and Care Work (over 10 years old)
(Unit: %)
Source: KOSTAT, Time Use SurveyNote 1: Unpaid domestic work is a concept that combines home management
work with family and household member care work 2: KOSTAT’s Time Use Survey behavioral classification system excluded
travel time from home management and care work, but recalculated it according to the definition of the SDGs indicator (5.4.1)
WomenMen
Total Unpaid domestic work Unpaid care work
0
3
6
9
12
15
2004 2014 2004 2014 2004 2014
14.6 14.0
3.3
2.8
11.1
2.5
1.9
2.8
0.90.8
3.3
11.3
International Comparison of Proportion of Time Spent on Unpaid Domestic and Care Work (over 15 years old)
(Unit: %)
Source : UNSD, Time Use SurveyNote : The data on U.S.·Canada·Japan, U.K., ROK·Italy, Germany and France
was collected in 2016, 2015, 2014, 2013 and 2010, respectively
Women Men
ROK Canada France Germany Italy Japan U.K. U.S.0
10
15
25
5
20
14.6
3.6
9.6
9.5 10
.4
8.4
3.1
7.0
9.8
14.6 15
.8 16.4 20
.4
15.1
12.7
15.9
Valuation of Unpaid Domestic and Care Work
The time spent on unpaid domestic and care work
was clearly different between men and women. As
of 2014, women spent 14.0% of 24 hours a day in
domestic work and caring for family, while men spent
only 3.3% of 24 hours. The percentage decreased by
0.6%p for women and 0.5%p for men compared to
2004, 10 years ago, but the difference still remains.
In particular, it was only affected the increase in the
domestic work time of men, but the care time was
found to have decreased slightly. Compared with
major countries by limiting the target to a population
of 15 years and older, women consistently spent
more time in unpaid domestic work than men in all

Chapter 4. The Progress of SDGs in the ROK • 31
SDG6 aims to ensure clean and safe water and sanitation for all. According to a report by the WHO and the UN
International Children's Emergency Fund (UNICEF) (2017), as of 2015, 71% of the World's population has access to
safely managed drinking water, and 39% of the population uses safe, well-managed sanitation facilities, indicating
that many people live without clean water and adequate sanitation facilities. Access to safe drinking water and
sanitation facilities is a fundamental human right and an essential goal that must be achieved to eradicate poverty
and hunger and ensure health and education for all. Thus, the targets include not only ensuring the access to safe
drinking water and sanitation facilities, but also improving water quality and water resource-use efficiency, and
protecting and restoring marine ecosystems.
Ensure availability and sustainable management of water and sanitation for all
CLEAN WATERAND SANITATION6
6.1 By 2030, achieve universal and equitable access to safe and affordable drinking water for all
6.1.1 Proportion of population using safely managed drinking water services Waterworks penetration rate
6.2 By 2030, achieve access to adequate and equitable sanitation and hygiene for all and end open defecation, paying special atten-tion to the needs of women and girls and those in vulnerable situations
6.2.1 Proportion of population using (a) safely managed sanitation services and (b) a hand-washing facility with soap and water Sewerage penetration rate
6.3 By 2030, improve water quality by reducing pollution, eliminating dumping and minimizing release of hazardous chemicals and materials, halving the proportion of untreated wasteswater and substantially increasing recycling and safe reuse globally
6.3.1 Proportion of wasteswater safely treated
6.3.2 Proportion of bodies of water with good ambient water quality
6.4 By 2030, substantially increase water-use efficiency across all sectors and ensure sustainable withdrawals and supply of fresh-water to address water scarcity and substantially reduce the number of people suffering from water scarcity
6.4.1 Change in water-use efficiency over time
6.4.2 Level of water stress: freshwater withdrawal as a proportion of available freshwater resources
6.5 By 2030, implement integrated water resources management at all levels, including through transboundary cooperation as ap-propriate
6.5.1 Degree of integrated water resources management implementation (0–100)
6.5.2 Proportion of transboundary basin area with an operational arrangement for water cooperation
6.6 By 2020, protect and restore water-related ecosystems, including mountains, forests, wetlands, rivers, aquifers and lakes
6.6.1 Change in the extent of water-related ecosystems over time
6.a By 2030, expand international cooperation and capacity-building support to developing countries in water- and sanitation-relat-ed activities and programmes, including water harvesting, desalination, water efficiency, wasteswater treatment, recycling and reuse technologies
6.a.1 Amount of water- and sanitation-related official development assistance that is part of a government-coordinated spending plan
6.b Support and strengthen the participation of local communities in improving water and sanitation management
6.b.1 Proportion of local administrative units with established and operational policies and procedures for participation of local communities in water and sanitation management
ROK’s data updated in global DB Indicator used for analysis Proxy indicator

32 • Sustainable Development Goals in the Republic of Korea: Progress Report 2019
Water-Use Efficiency
Water stress is a percentage of the amount used of
the total amount of water resources that can be used
for one year. The value exceeding 10% is regarded as
water stress state, and 10-20%, 20-40% and more than
40% are regarded as low stress, moderate stress, and
serious stress, respectively (Korea Water Resources
Corporation, 2017). Increased efficiency can reduce
water stress by reducing water usage and increasing
available water resources. The ROK's Level of Water
Stress, which was measured by FAO, is 57.6% as of
International Comparison of Water Stress Levels: 2014(Unit: %)
Source: FAO
57.6
22.8
2.2
41.5
44.8
28.5
9.7
22.6
0 20 40 60 80 100
ROK
Canada
France
Germany
Italy
Japan
U.K.
U.S.
Waterworks Leakage Rate(Unit:100 million m3) (Unit: %)
Source: Ministry of Environment, Statistics of WaterworksNote: Leakage ratio = (leakage quantity/ total water supply) X100
0
4
8
0
5
10
15
Leakage quantity Leakage rate
2007
2008
2009
2010
2011
2012
2013
2015
2016
2014
7.3 6.8
12.8
10.6
Universal Access to Drinking Water and
Sanitation Facilities
According to the result of WHO and UNICEF's
monitoring of drinking water supply and sanitation
(2017), 98.0% of people use drinking water safely
and 98.5% of people use safe sanitation facilities
in the ROK, which are relatively high levels.12 It is
closely related to the ROK's waterworks and sewage
penetration rate. Throughout the country, the
waterworks and sewage penetration rate has steadily
increased to 98.9% and 93.2%, respectively as of 2016.
However, there is a significant gap among local unit.
The waterworks rate in rural areas increased from
10 years ago, but there was room for improvement,
92.7% in 2016. During the same period, the sewerage
penetration rate was significantly low, 68.7%.
Waterworks and Sewerage Penetration Rate(Unit: %)
0
5
10
15
20
Waterworks penetration rate
Nationwide Agricultural and �shing villages
Nationwide Agricultural and �shing villages
Sewerage penetration rate
96.4 98.9
77.8
92.7 87.1
45.7
68.793.2
0
25
50
75
100
2007 2016 2007 2016 2007 2016 2007 2016
Source: Ministry of Environment, Statistics of waterworks, Statistics of sewerage
2014, which is serious stress level and higher than in
all countries to be compared. In particular, the water
stress levels in Canada and the U.K. were 2.2% and
9.7%, respectively, which means there is no stress.
Reducing water leakage is one way to increase the
efficiency of water use. As of 2016, the amount of
water leakage was 680million m3, which is 10.6% of
the total water supply. Compared to 2007, 2.2%p was
reduced.
12 ’Use of safe drinking water’ herein refers to an improved drinking water source that is accessible, available when needed, and free of fecal contamination, and ’use of a safely managed sanitation facility’ means the use of a basic sanitation facility where wastes is safely disposed of or discharged out of place without sharing the sanitary facilities of other households (IAEG-SDGs, 2018b).

Chapter 4. The Progress of SDGs in the ROK • 33
SDG7 aims to ensure that everyone has access to reliable, clean energy at an affordable price. The energy sector has
emerged as an important issue of the international community in the last two decades, and its importance has been
addressed and has become an independent goal in the SDGs. Specifically, the goals are to ensure universal access
to modern energy, increase the use of renewable energy, and improve energy efficiency.
Ensure access to affordable, reliable, sustainable and modern energy for all
AFFORDABLE ANDCLEAN ENERGY7
7.1 By 2030, ensure universal access to affordable, reliable and modern energy services
7.1.1 Proportion of population with access to electricity
7.1.2 Proportion of population with primary reliance on clean fuels and technology
7.2 By 2030, increase substantially the share of renewable energy in the global energy mix
7.2.1 Renewable energy share in the total final energy consumption New and renewable energy production and supply
7.3 By 2030, double the global rate of improvement in energy efficiency
7.3.1 Energy intensity measured in terms of primary energy and GDP
7.a By 2030, enhance international cooperation to facilitate access to clean energy research and technology, including renewable energy, energy efficiency and advanced and cleaner fossil-fuel technology, and promote investment in energy infrastructure and clean energy technology
7.a.1 International financial flows to developing countries in support of clean energy research and development and renewable energy produc-tion, including in hybrid systems
7.b By 2030, expand infrastructure and upgrade technology for supplying modern and sustainable energy services for all in devel-oping countries, in particular least developed countries, small island developing States and landlocked developing countries, in accordance with their respective programmes of support
7.b.1 Investments in energy efficiency as a proportion of GDP and the amount of foreign direct investment in financial transfer for infrastructure and technology to sustainable development services
ROK’s data updated in global DB Indicator used for analysis Proxy indicator

34 • Sustainable Development Goals in the Republic of Korea: Progress Report 2019
International Comparison of Energy Intensity: 2015(Unit: MJ/USD)
6.55
7.34
4.10
3.60
3.07
3.74
3.02
5.41
0 2 4 6 8 10
ROK
Canada
France
Germany
Italy
Japan
U.K.
U.S.
Source: IEA, World Energy Balances 2017Note : GDP is based on 2011 PPP
Percentage of Renewable Energy Share in the Total Final Energy Consumption
(Unit: %)
0
5
10
15
20
2.7
1.0
0
5
2007 2008 2009 2010 2011 2012 2013 2014 2015
Source: IEA, World Energy Balances 2017
Source: IEA, World Energy Balances 2017
2.7
22.0
13.5
14.2
16.5
6.3
8.7
8.7
0 5 10 15 20 25
ROK
Canada
France
Germany
Italy
Japan
U.K.
U.S.
International Comparison of Renewable Energy Share in the Total Final Energy Consumption: 2015
(Unit: %)
Energy Efficiency
The energy intensity, which represents the national
energy efficiency level, is 0.194 toe / million won in
2017, steadily decreasing except 2009-2011, indicating
that the efficiency is improving. The deterioration in
efficiency in 2009-2011 is analyzed to be attributed to
the increase in energy and power consumption for
raw materials due to the expansion of facilities and
production activities in the energy glutton industry
(Korea Energy Economics Institute, 2018). Estimates
from the International Energy Agency (IEA) indicate
that the ROK is still less energy efficient than major
countries.
Energy Intensity(Unit: toe/million won)
0
5
10
15
20
0.206
0.194
2007 2008 2009 2010 2011 2012 2013 2014 2016 201720150.18
0.19
0.20
0.21
0.22
Source: Ministry of Trade, Industry and Energy / Korea Energy Economics Insti-tute, 2018 Yearbook of Energy Statistics
Note 1: It is the value of primary energy divided by GDP, expressed in units of energy source in the ROK. Primary energy refers to the energy supplied to the ROK by production, import and export, and inventory increase/ de-crease. Here, it is calculated as the sum of energy input to be converted to other energy and final energy consumed for industry, transportation, household, and business
2: GDP is based on chain prices 3: Toe (ton of oil equivalent) refers to a unit that standardizes different types
of energy sources such as oil, gas, and electricity based on 107kcal, which is a calorie of 1 ton (t) of crude oil However, the ROK's renewable energy supply is
on the rise due to government investment and private
sector’s participation in responding to Framework
Convention on Climate Change. The difference is
that the ROK uses a slightly different concept, which
combines renewable energy with new energy such as
fuel cells, coal liquefaction and gasification, vacuum
residue gasification and hydrogen energy on a policy
basis. The supply of new and renewable energy was
2,127,303 toe in 2000 and increased by about 6.7 times
to 14,178,408 toe in 2016. As a result, the share of new
and renewable energy in primary energy was 1.1% in
2000 to 4.8% in 2016. As of 2016, the share of energy
Use of Renewable Energy
As an indicator to monitor the expansion of renewable
energy use, the percentage of renewable energy of
the final energy consumption was found to be 2.7%
in the ROK in 2015. It is a steadily increasing, but still
far lower than Canada's 22.0%, Italy's 16.5% and
Germany's 14.2%.

Chapter 4. The Progress of SDGs in the ROK • 35
Production and Supply Share of New and Renewable Energy
(Unit: toe) (Unit: %)
Source: Korea Energy Agency, Survey on deployment New & Renewable energyNote 1: Renewable energy is energy used by converting renewable energy such
as sunlight, water, geothermal heat, precipitation, and biological organ-isms and includes solar energy (solar photovoltaic and solar thermal), bio, wind power, hydro power, ocean, waste, geothermal heat, etc. New energy is energy that converts existing fossil fuels or uses electricity or heat through chemical reactions such as hydrogen and oxygen and in-cludes hydrogen energy, fuel cells, integrated gasification combined cycle (IGCC), etc.
2: The share of supply is the share of new and renewable energy of primary energy
2000
2001
2002
2003
2004
2005
2006
2007
2008
2009
2010
2011
2012
2013
2014
2015
2016
0
5,00
0,00
010
,000
,000
15,0
00,0
00
0
5
10
1.1
4.8
2,12
7,30
3
14,1
78,4
08
Production Supply Share
Source: Korea Energy Agency, Survey on Deployment of New & Renewable Energy
Solar photovoltaicSolar thermal Bio Wind powerHydro power Ocean Waste Geothermal heatHydrogen & Fuel cell .
Integrated gasi�cation combined cycle (IGCC)
61.7
19.5
7.7
4.3
2.51.1
0.7
0.5
0.2
New energy
1.7
New and Renewable Energy Composition: 2016(Unit: %)
sources consisting of new and renewable energy was
in the order of waste (61.7%), bio (19.5%) and solar
photovoltaic(7.7%).
36 • Sustainable Development Goals in the Republic of Korea: Progress Report 2019
Promote sustained, inclusive and sustainable economic growth, full and productive employment and decent work for all
SDG8 is based on three axes: economic growth, full and productive employment and decent work. It should lead
sustainable economic growth through technology improvement and innovation, but in the process, it should be
able to embrace vulnerable groups in society such as children, women and migrant workers. This will ultimately
provide everyone with decent work that will satisfy their quality of life. To achieve SDG8, the targets are to promote
economic growth by diversifying industries and improving resource efficiency through innovation-oriented
policies, ensure productive employment by achieving equal pay for equal work, ending child labour, and protecting
labour rights for migrant workers and create decent work by reducing youth unemployment rate and encouraging
sustainable tourist industry.
DECENT WORK AND ECONOMIC GROWTH8
8.1 Sustain per capita economic growth in accordance with national circumstances
8.1.1 Annual growth rate of real GDP per capita
8.2 Achieve higher levels of economic productivity through diversification, technological upgrading and innovation
8.2.1 Annual growth rate of real GDP per employed person
8.3 Promote development-oriented policies that support productive activities, decent job creation, entrepreneurship, creativity and innovation, and encourage the formalization and growth of micro-, small- and medium-sized enterprises, including through ac-cess to financial services
8.3.1 Proportion of informal employment in non-agriculture employment, by sex
8.4 Improve progressively, through 2030, global resource efficiency in consumption and production and endeavour to decouple eco-nomic growth from environmental degradation
8.4.1 Material footprint, material footprint per capita, and material footprint per GDP
8.4.2 Domestic material consumption, domestic material consumption per capita, and domestic material consumption per GDP
8.5 By 2030, achieve full and productive employment and decent work for all women and men, including for young people and per-sons with disabilities, and equal pay for work of equal value
8.5.1 Average hourly earnings of female and male employees, by occupation, age and persons with disabilities
8.5.2 Unemployment rate, by sex, age and persons with disabilities
8.6 By 2020, substantially reduce the proportion of youth not in employment, education or training
8.6.1 Proportion of youth (aged 15–24 years) not in education, employment or training
8.7 Take immediate and effective measures to eradicate forced labour, end modern slavery and human trafficking and secure the pro-hibition and elimination of the worst forms of child labour and end child labour in all its forms
8.7.1 Proportion and number of children aged 5–17 years engaged in child labour, by sex and age
8.8 Protect labour rights and promote safe and secure working environments for all workers
8.8.1 Frequency rates of fatal and non-fatal occupational injuries, by sex and migrant status
8.8.2 Level of national compliance with labour rights based on ILO textual sources and national legislation
8.9 By 2030, devise and implement policies to promote sustainable tourism that creates jobs and promotes local culture and products
8.9.1 Tourism direct GDP as a proportion of total GDP and in growth rate
8.9.2 Proportion of jobs in sustainable tourism industries out of total tourism jobs8.10 Strengthen the capacity of domestic financial institutions to encourage and expand access to financial services for all
8.10.1 (a) Number of commercial bank branches per 100,000 adults and (b) number of automated teller machines (ATMs) per 100,000 adults
8.10.2 Proportion of adults (15 years and older) with an account at a bank or other financial institution or with a mobile-money-service provider8.a Increase Aid for Trade support for developing countries, in particular least developed countries, including through the Enhanced
Integrated Framework for Trade-related Technical Assistance to Least Developed Countries
8.a.1 Aid for Trade commitments and disbursements
8.b By 2020, develop and operationalize a global strategy for youth employment and implement the Global Jobs Pact of the Interna-tional Labour Organization
8.b.1 Existence of a developed and operationalized national strategy for youth employment, as a distinct strategy or as part of a national em-ployment strategy
ROK’s data updated in global DB Indicator used for analysis Proxy indicator

Chapter 4. The Progress of SDGs in the ROK • 37
Annual Growth Rate of Real GDP per capita: 2016(Unit: %)
Source: United Nations, Department of Economic and Social Affairs, Statistics Division (AMA)
-10
-5
0
5
10
2006
2007
2008
2009
2010
2011
2000
2001
2002
2003
2004
2005
2012
2013
2014
2015
2016
ROK Canada France Germany
Italy Japan U.K. U.S.
Unemployment Rate(Unit: %)
Source: KOSTAT, Economically Active Population Survey
2006
2007
2008
2009
2010
2011
2000
2001
2002
2003
2004
2005
2012
2013
2014
2015
2017
2016
0
5
10 All Female Male
5.04.43.6
3.83.73.6
3.83.73.5
Economic Growth
It is a common phenomenon that the growth rate is
slow as the economic development stage goes higher
(Yoon Yoon-kyu, 2017). Of the seven major countries,
Canada, France and the U.S. showed annual GDP per
capita growth rate of less than 1% in 2016, and the
remaining countries also showed the growth rate of
1%. During the same period, the ROK's annual GDP
growth rate per capita was 2.4%. After rapid growth,
the ROK's growth rate slowed down during the 1997
economic crisis, and recorded another low point of
the growth rate (0.4%) due to the global financial
crisis in 2009. Since then, the ROK has recovered,
showing a recent growth rate of around 2%.
Decent Work
The unemployment rate in the ROK has been
maintained in the 3% range overall, but has been
increasing since 2013. By sex, the unemployment
rate of male is consistently higher than that of female.
In 2014, the gap was narrowed due to the increase
in the unemployment rate of female, but recently
the unemployment rate of male has increased
slightly compared to that of female. By age, the
unemployment rate of 20-29 year-olds has increased
significantly since 2000 compared to that of other age
groups. The unemployment rate of the seven major
countries was the lowest in Japan (3.1%), with 4%
in Germany, the U.K. and the U.S., and more than
10% in Italy and France. On the other hand, the
unemployment rate of male was higher than that of
female in all countries except Italy.
Unemployment Rate by Age Group(Unit: %)
Source: KOSTAT, Economically Active Population Survey
0
5
10
15
20
15-19 years old
14.5
7.5
9.9
3.6 3.5 3.2 2.9
2.22.13.3
8.7
1.5
20-29 years old
30-39 years old
40-49 years old
50-59 years old
60 or older
2000
2017
2000
2017
2000
2017
2000
2017
2000
2017
2000
2017
International Comparison of Unemployment Rate: 2016(Unit: %)
Source: ILOSTAT, Labour Force Survey
0 5 10 15
7.0
3.73.6
3.8
6.27.7
10.19.9
10.34.1
3.74.5
11.712.8
10.93.1
2.83.4
4.84.7
4.94.94.84.9
ROK
Canada
France
Germany
Italy
Japan
U.K.
U.S.
All Female Male

38 • Sustainable Development Goals in the Republic of Korea: Progress Report 2019
Safe Working Condition
The fatalities from fatal occupational injuries in the
ROK have continued to decline, down to 5.3 per
100,000 employees in 2016. However, compared to
major countries, it is still higher than France (3.0 in
2013), Italy (3.2 in 2011) and Germany (1.6 in 2014).
International Comparison of Fatal Occupational Injuries among Employees
(Unit: per 100,000 employees)
Source: ILOSTAT, Occupational Accidents and Injuries RecordsNote : Data on Italy, France and Germany was collected in 2011, 2013 and 2014,
respectively
2007
2008
2009
2010
2011
2012
2013
2015
2016
2014
9.1
3.03.2
5.3
1.6
0
6
8
2
4
10ROK
France
Germany
Italy
Chapter 4. The Progress of SDGs in the ROK • 39
Build resilient infrastructure, promote inclusive and sustainable industrialization and foster innovation
Infrastructure, industrialization and innovation are key driving force of economic growth, and if combined with
inclusiveness, resilience and sustainability, sustainable development can be achieved. To achieve inclusive and
sustainable industrialization, economic growth should create employment and income, international trade should
be activated and resources should be used efficiently (UN, 2017; 2018). Globally, the percentage of manufacturing
added value increased by 1.1%p in 2017 compared to 2005 and carbon intensity decreased by 19%p in 2015
compared to 2000, but this trend is not observed in all regions. It is a point where technological innovation is
required for inclusive development embracing developing countries.
INDUSTRY, INNOVATION AND INFRASTRUCTURE9
9.1 Develop quality, reliable, sustainable and resilient infrastructure, including regional and transborder infrastructure, to support economic development and human well-being, with a focus on affordable and equitable access for all
9.1.1 Proportion of the rural population who live within 2 km of an all-season road
9.1.2 Passenger and freight volumes, by mode of transport
9.2 Promote inclusive and sustainable industrialization and, by 2030, significantly raise industry’s share of employment and gross domestic product, in line with national circumstances, and double its share in least developed countries
9.2.1 Manufacturing value added as a proportion of GDP and per capita
9.2.2 Manufacturing employment as a proportion of total employment
9.3 Increase the access of small-scale industrial and other enterprises, in particular in developing countries, to financial services, in-cluding affordable credit, and their integration into value chains and markets
9.3.1 Proportion of small-scale industries in total industry value added
9.3.2 Proportion of small-scale industries with a loan or line of credit
9.4 By 2030, upgrade infrastructure and retrofit industries to make them sustainable, with increased resource-use efficiency and greater adoption of clean and environmentally sound technologies and industrial processes, with all countries taking action in accordance with their respective capabilities
9.4.1 CO2 emission per unit of value added
9.5 Enhance scientific research, upgrade the technological capabilities of industrial sectors in all countries, in particular developing countries, including, by 2030, encouraging innovation and substantially increasing the number of research and development workers per 1 million people and public and private research and development spending
9.5.1 Research and development expenditure as a proportion of GDP
9.5.2 Researchers (in full-time equivalent) per million inhabitants
9.a Facilitate sustainable and resilient infrastructure development in developing countries through enhanced financial, technolog-ical and technical support to African countries, least developed countries, landlocked developing countries and small island de-veloping States
9.a.1 Total official international support (official development assistance plus other official flows) to infrastructure
9.b Support domestic technology development, research and innovation in developing countries, including by ensuring a conducive policy environment for, inter alia, industrial diversification and value addition to commodities
9.b.1 Proportion of medium and high-tech industry value added in total value added
9.c Significantly increase access to information and communications technology and strive to provide universal and affordable ac-cess to the Internet in least developed countries by 2020
9.c.1 Proportion of population covered by a mobile network, by technology
ROK’s data updated in global DB Indicator used for analysis Proxy indicator
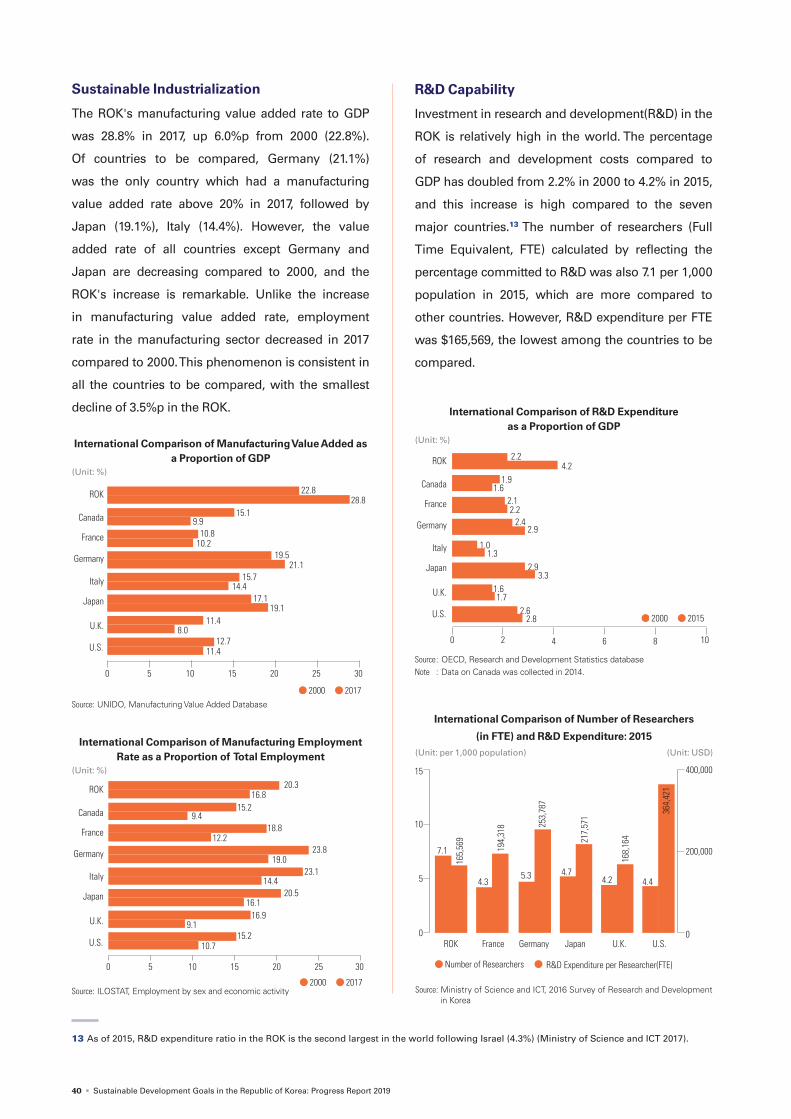
40 • Sustainable Development Goals in the Republic of Korea: Progress Report 2019
Sustainable Industrialization
The ROK's manufacturing value added rate to GDP
was 28.8% in 2017, up 6.0%p from 2000 (22.8%).
Of countries to be compared, Germany (21.1%)
was the only country which had a manufacturing
value added rate above 20% in 2017, followed by
Japan (19.1%), Italy (14.4%). However, the value
added rate of all countries except Germany and
Japan are decreasing compared to 2000, and the
ROK's increase is remarkable. Unlike the increase
in manufacturing value added rate, employment
rate in the manufacturing sector decreased in 2017
compared to 2000. This phenomenon is consistent in
all the countries to be compared, with the smallest
decline of 3.5%p in the ROK.
Source: UNIDO, Manufacturing Value Added Database
0 5 10 15 20 25 30
22.8
15.128.8
9.910.8
10.219.5
21.115.7
14.417.1
19.111.4
8.012.7
11.4
2000 2017
ROK
Canada
France
Germany
Italy
Japan
U.K.
U.S.
International Comparison of Manufacturing Value Added as a Proportion of GDP
(Unit: %)
International Comparison of Number of Researchers
(in FTE) and R&D Expenditure: 2015(Unit: per 1,000 population) (Unit: USD)
0
200,000
400,000
0
5
10
15
7.1
4.35.3 4.7
4.2 4.4
364,
421
253,
787
217,
571
194,
318
165,
569
168,
164
Number of Researchers R&D Expenditure per Researcher(FTE)
ROK France Germany Japan U.K. U.S.
Source: Ministry of Science and ICT, 2016 Survey of Research and Development in Korea
Source: ILOSTAT, Employment by sex and economic activity
0 5 10 15 20 25 30
20.3
15.216.8
9.418.8
12.223.8
19.023.1
14.420.5
16.116.9
9.115.2
10.7
2000 2017
ROK
Canada
France
Germany
Italy
Japan
U.K.
U.S.
International Comparison of Manufacturing Employment Rate as a Proportion of Total Employment
(Unit: %)
R&D Capability
Investment in research and development(R&D) in the
ROK is relatively high in the world. The percentage
of research and development costs compared to
GDP has doubled from 2.2% in 2000 to 4.2% in 2015,
and this increase is high compared to the seven
major countries.13 The number of researchers (Full
Time Equivalent, FTE) calculated by reflecting the
percentage committed to R&D was also 7.1 per 1,000
population in 2015, which are more compared to
other countries. However, R&D expenditure per FTE
was $165,569, the lowest among the countries to be
compared.
0 2 4 6 8 10
2.22.1
4.22.2
2.92.4
3.32.9
1.31.0
1.71.6
2.82.6
1.61.9
2000 2015
ROK
Canada
France
Germany
Italy
Japan
U.K.
U.S.
International Comparison of R&D Expenditure as a Proportion of GDP
(Unit: %)
Source : OECD, Research and Development Statistics databaseNote : Data on Canada was collected in 2014.
13 As of 2015, R&D expenditure ratio in the ROK is the second largest in the world following Israel (4.3%) (Ministry of Science and ICT 2017).
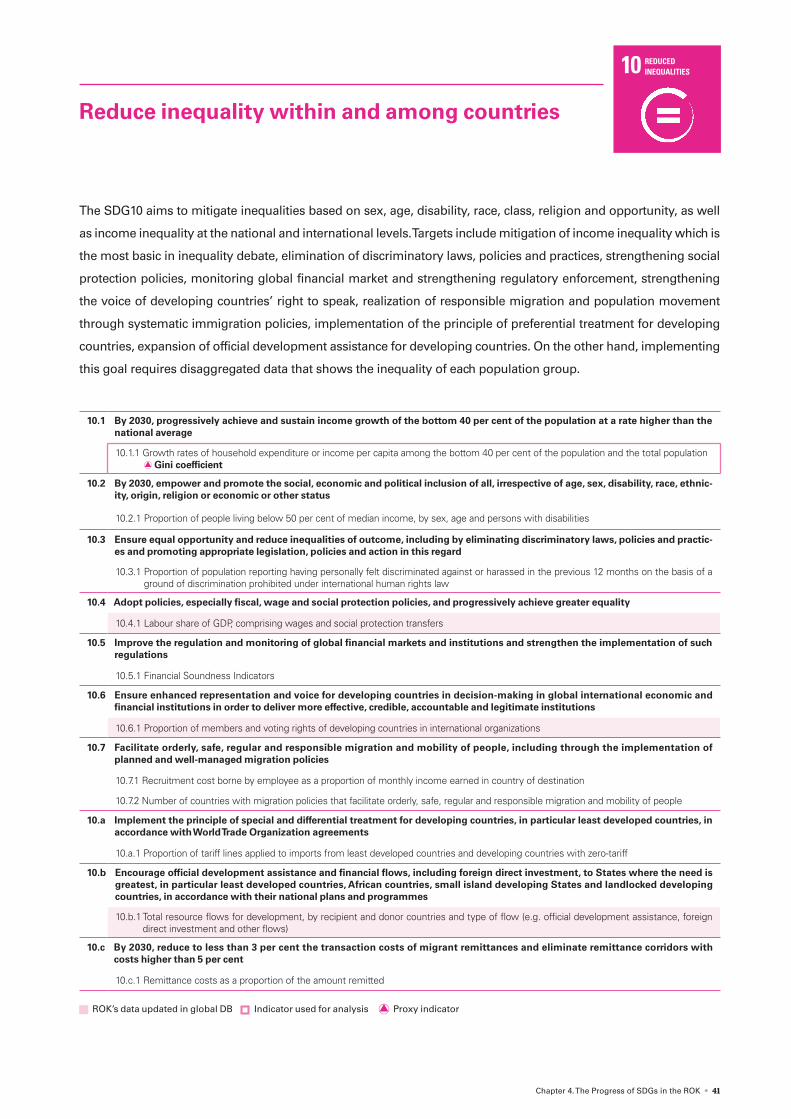
Chapter 4. The Progress of SDGs in the ROK • 41
Reduce inequality within and among countries
The SDG10 aims to mitigate inequalities based on sex, age, disability, race, class, religion and opportunity, as well
as income inequality at the national and international levels. Targets include mitigation of income inequality which is
the most basic in inequality debate, elimination of discriminatory laws, policies and practices, strengthening social
protection policies, monitoring global financial market and strengthening regulatory enforcement, strengthening
the voice of developing countries’ right to speak, realization of responsible migration and population movement
through systematic immigration policies, implementation of the principle of preferential treatment for developing
countries, expansion of official development assistance for developing countries. On the other hand, implementing
this goal requires disaggregated data that shows the inequality of each population group.
REDUCEDINEQUALITIES10
10.1 By 2030, progressively achieve and sustain income growth of the bottom 40 per cent of the population at a rate higher than the national average
10.1.1 Growth rates of household expenditure or income per capita among the bottom 40 per cent of the population and the total population Gini coefficient
10.2 By 2030, empower and promote the social, economic and political inclusion of all, irrespective of age, sex, disability, race, ethnic-ity, origin, religion or economic or other status
10.2.1 Proportion of people living below 50 per cent of median income, by sex, age and persons with disabilities
10.3 Ensure equal opportunity and reduce inequalities of outcome, including by eliminating discriminatory laws, policies and practic-es and promoting appropriate legislation, policies and action in this regard
10.3.1 Proportion of population reporting having personally felt discriminated against or harassed in the previous 12 months on the basis of a ground of discrimination prohibited under international human rights law
10.4 Adopt policies, especially fiscal, wage and social protection policies, and progressively achieve greater equality
10.4.1 Labour share of GDP, comprising wages and social protection transfers
10.5 Improve the regulation and monitoring of global financial markets and institutions and strengthen the implementation of such regulations
10.5.1 Financial Soundness Indicators
10.6 Ensure enhanced representation and voice for developing countries in decision-making in global international economic and financial institutions in order to deliver more effective, credible, accountable and legitimate institutions
10.6.1 Proportion of members and voting rights of developing countries in international organizations
10.7 Facilitate orderly, safe, regular and responsible migration and mobility of people, including through the implementation of planned and well-managed migration policies
10.7.1 Recruitment cost borne by employee as a proportion of monthly income earned in country of destination
10.7.2 Number of countries with migration policies that facilitate orderly, safe, regular and responsible migration and mobility of people
10.a Implement the principle of special and differential treatment for developing countries, in particular least developed countries, in accordance with World Trade Organization agreements
10.a.1 Proportion of tariff lines applied to imports from least developed countries and developing countries with zero-tariff
10.b Encourage official development assistance and financial flows, including foreign direct investment, to States where the need is greatest, in particular least developed countries, African countries, small island developing States and landlocked developing countries, in accordance with their national plans and programmes
10.b.1 Total resource flows for development, by recipient and donor countries and type of flow (e.g. official development assistance, foreign direct investment and other flows)
10.c By 2030, reduce to less than 3 per cent the transaction costs of migrant remittances and eliminate remittance corridors with costs higher than 5 per cent
10.c.1 Remittance costs as a proportion of the amount remitted
ROK’s data updated in global DB Indicator used for analysis Proxy indicator

42 • Sustainable Development Goals in the Republic of Korea: Progress Report 2019
Income Inequality
The representative indicator of income distribution
is the Gini coefficient. The Gini coefficient, which
is created based on equivalized income according
to OECD recommendations using KOSTAT's
Household Income and Expenditure Survey, have
been repeatedly increasing and decreasing since
2006, with 0.204 in 2015 and 0.304 in 2016. The Gini
coefficient based on disposable income reflects the
effect of the government's redistribution policy by
taking into account public transfer income and public
transfer expenditure in market income. It is founded
that the effect of government policy increased from
0.024 in 2006 to 0.049 in 2016. In 2016, the Gini
coefficient based on disposable income was 0.391 in
the U.S. and 0.351 in the U.K.
Source: OECD, Income Distribution and Poverty DatabaseNote : Data on ROK, Germany and Japan was collected in 2015
0.307
0.295
0.291
0.293
0.328
0.339
0.351
0.391
0.0 0.3 0.60.00.30.6Disposable Income Market Income
0.431
0.341
0.516
0.504
0.517
0.504
0.506
0.507
ROK
Canada
France
Germany
Italy
Japan
U.K.
U.S.
International Comparison of Gini Coefficient: 2016
Gini Coefficient
0
5
10
15
20
0.304
0.3530.330
0.306
20072006 2008 2009 2010 2011 2012 2013 2014 2015 2016
Market Income Disposable Income
0.0
0.3
0.6
Source: KOSTAT, Combined Data of Household Income and Expenditure SurveyNote 1: The Gini coefficient has a ratio between 0 and 1, the closer to 1, the high-
er the inequality 2: Prepared based on equivalized income divided by the square root of the
number of households, so that the welfare level can be compared be-tween households with different number of households
3: Market income = Wage and salary income + Business income + Proper-ty income + Private transfer expenditure
Disposable income = Market income + Public transfer income - Public transfer expenditure
Government policy effect = Market income - disposable income 4: From 2016, Official data source was changed to Survey of Household
Finances and Living Conditions
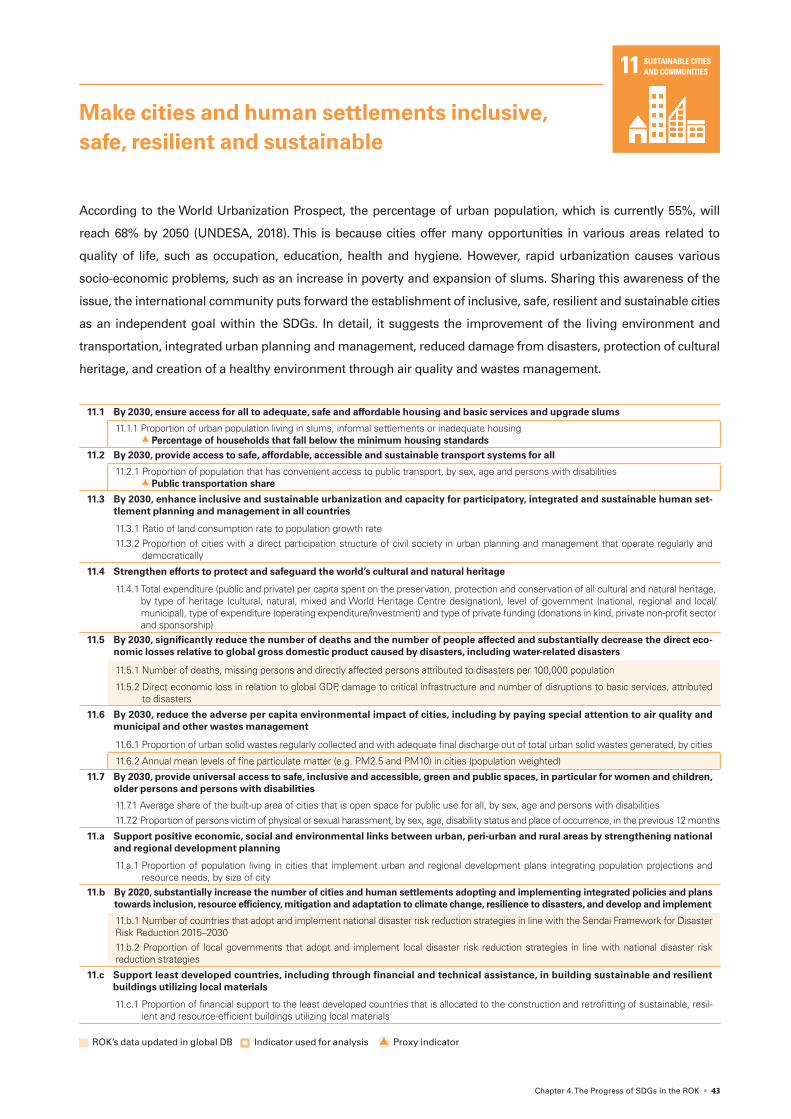
Chapter 4. The Progress of SDGs in the ROK • 43
Make cities and human settlements inclusive, safe, resilient and sustainable
According to the World Urbanization Prospect, the percentage of urban population, which is currently 55%, will
reach 68% by 2050 (UNDESA, 2018). This is because cities offer many opportunities in various areas related to
quality of life, such as occupation, education, health and hygiene. However, rapid urbanization causes various
socio-economic problems, such as an increase in poverty and expansion of slums. Sharing this awareness of the
issue, the international community puts forward the establishment of inclusive, safe, resilient and sustainable cities
as an independent goal within the SDGs. In detail, it suggests the improvement of the living environment and
transportation, integrated urban planning and management, reduced damage from disasters, protection of cultural
heritage, and creation of a healthy environment through air quality and wastes management.
SUSTAINABLE CITIES AND COMMUNITIES11
11.1 By 2030, ensure access for all to adequate, safe and affordable housing and basic services and upgrade slums
11.1.1 Proportion of urban population living in slums, informal settlements or inadequate housing Percentage of households that fall below the minimum housing standards
11.2 By 2030, provide access to safe, affordable, accessible and sustainable transport systems for all
11.2.1 Proportion of population that has convenient access to public transport, by sex, age and persons with disabilities Public transportation share
11.3 By 2030, enhance inclusive and sustainable urbanization and capacity for participatory, integrated and sustainable human set-tlement planning and management in all countries
11.3.1 Ratio of land consumption rate to population growth rate11.3.2 Proportion of cities with a direct participation structure of civil society in urban planning and management that operate regularly and
democratically
11.4 Strengthen efforts to protect and safeguard the world’s cultural and natural heritage
11.4.1 Total expenditure (public and private) per capita spent on the preservation, protection and conservation of all cultural and natural heritage, by type of heritage (cultural, natural, mixed and World Heritage Centre designation), level of government (national, regional and local/municipal), type of expenditure (operating expenditure/investment) and type of private funding (donations in kind, private non-profit sector and sponsorship)
11.5 By 2030, significantly reduce the number of deaths and the number of people affected and substantially decrease the direct eco-nomic losses relative to global gross domestic product caused by disasters, including water-related disasters
11.5.1 Number of deaths, missing persons and directly affected persons attributed to disasters per 100,000 population
11.5.2 Direct economic loss in relation to global GDP, damage to critical infrastructure and number of disruptions to basic services, attributed to disasters
11.6 By 2030, reduce the adverse per capita environmental impact of cities, including by paying special attention to air quality and municipal and other wastes management
11.6.1 Proportion of urban solid wastes regularly collected and with adequate final discharge out of total urban solid wastes generated, by cities
11.6.2 Annual mean levels of fine particulate matter (e.g. PM2.5 and PM10) in cities (population weighted)
11.7 By 2030, provide universal access to safe, inclusive and accessible, green and public spaces, in particular for women and children, older persons and persons with disabilities
11.7.1 Average share of the built-up area of cities that is open space for public use for all, by sex, age and persons with disabilities
11.7.2 Proportion of persons victim of physical or sexual harassment, by sex, age, disability status and place of occurrence, in the previous 12 months
11.a Support positive economic, social and environmental links between urban, peri-urban and rural areas by strengthening national and regional development planning
11.a.1 Proportion of population living in cities that implement urban and regional development plans integrating population projections and resource needs, by size of city
11.b By 2020, substantially increase the number of cities and human settlements adopting and implementing integrated policies and plans towards inclusion, resource efficiency, mitigation and adaptation to climate change, resilience to disasters, and develop and implement
11.b.1 Number of countries that adopt and implement national disaster risk reduction strategies in line with the Sendai Framework for Disaster Risk Reduction 2015–203011.b.2 Proportion of local governments that adopt and implement local disaster risk reduction strategies in line with national disaster risk reduction strategies
11.c Support least developed countries, including through financial and technical assistance, in building sustainable and resilient buildings utilizing local materials
11.c.1 Proportion of financial support to the least developed countries that is allocated to the construction and retrofitting of sustainable, resil-ient and resource-efficient buildings utilizing local materials
ROK’s data updated in global DB Indicator used for analysis Proxy indicator

44 • Sustainable Development Goals in the Republic of Korea: Progress Report 2019
Residential Environment
Slum is a representative indicator that shows extreme
poverty. It is defined as a living space lacking water,
sanitation facilities, adequate living space, home
durability and ownership (IAEG-SDGs, 2018c).
Although there is no official data in the ROK that
perfectly meets this standard, Korea Housing Survey
have annually released statistics on households that
fall below the minimum housing standards under the
Framework Act on Residence. Over the last decade,
the percentage of households that have not met
the minimum housing standards has declined by
10.7%p from 16.6% in 2006 to 5.9% in 2017. In terms
of capital area, metropolitan cities, and provincial
Percentage of Households that Fall Below the Minimum Housing Standards
(Unit: %)
Source: Ministry of Land, Infrastructure, and Transport, Korea Housing SurveyNote 1: Households that fall below the minimum housing standards means those
that do not meet the standards of bedrooms, area, and facilities among the minimum housing standards under the Framework Act on Residence
2: Incheon and Gyeonggi-do were excluded from metropolitan cities and provincial areas, respectively as the capital areas include Seoul, Incheon, and Gyeonggi-do
3: The items for ordinary household has been surveyed every two years since 2006, but every year since 2017
Nationwide Capital area
Metropolitan city
Provincial area
2006 2008 2010 2012 2014 2016 20170
15
30
16.6
5.96.7
5.64.5
13.2
17.4
21.4
Households under the Minimum Housing Standards by Region
(Unit: %)
Source: Ministry of Land, Infrastructure, and Transport, Korea Housing Survey
2006 2008 2010 2012 2014 2016 20170
50
100
36.4
21.8
41.8
33.7
21.2
45.2
41.7
19.9
38.4
43.7
14.6
41.7
41.7
18.4
39.9
51.7
18.5
29.8
54.5
15.1
30.4
Capital area Metropolitan city Provincial area
16.620.3
2016
16.6%
26.2%
42.8%
54.3%
Public Transportation
2.9%
200336.8%
Car
Taxi
Railway
Bus
Share of Transport by Modes of Transport
Source: Ministry of Land, Infrastructure, and Transport, Performance of TransportNote 1: Share of public transport = (Public transport passenger traffic perfor-
mance / total passenger traffic performance of means of land transport) X100
2: The modes of transport includes cars, taxis, railways (including subways), among which means of public transport are buses and railways
3: Transport performance is the product of the distance traveled by the number of people using the transport (unit: person-km)
areas, the percentage of households that fall below
the minimum housing standards is decreasing in
all regions. However, the distribution by region has
changed within the households below the minimum
housing standards. In 2006, the percentage of
households that fall below the minimum housing
standards was high in the order of provincial areas,
capital areas, and metropolitan cities. In 2017,
however, it was changed to the order of capital areas,
provincial areas and metropolitan cities.
This is due to the increase of single-person
households in the capital area and the supply of small-
sized housing (Korea Research Institute for Human
Settlements, 2017).
Public Transport Accessibility
Public transport is important not only for the low-
income class and the transport vulnerable group, but
also for the environment by mitigating the negative
effects of traffic congestion and pollutant emissions.
Accessibility to public transport is thus used as an
indicator to monitor inclusive and sustainable urban
development. In the ROK, the share of public transport
continued to increase from 36.8% in 2003 to 42.8% in
2016 according to the expansion of public transport
networks such as railways and buses. Among them,

Chapter 4. The Progress of SDGs in the ROK • 45
Change in Annual Particulate Matter Concentrations Nationwide
(Unit: μg/m3)
Source: National Institute of Environmental Research, Annual Report of Air Quali-ty in Korea 2016
Note 1: P M 2.5 has been measured since 2015
2008 2009 2010 2011 2012 2013 2014 2015 2016
47
48
45
49
26 26
54
PM10 PM2.50
30
60
Average Particulate Matter Concentrations in Seoul and Other Metropolitan Cities: 2016
(Unit: μg/m3)
Source: National Institute of Environmental Research, Annual Report of Air Quality in Korea 2016
Seoul Incheon Busan Daegu Gwangju Daejeon Ulsan0
25
50
48 49 44 43 40 44 43
26 26 27 24 23 21 23
PM10 PM2.5
Particulate Matter Concentrations in Major Cities around the World: 2016
(Unit: μg/m3)
Source: National Institute of Environmental Research, Annual Report of Air Quali-ty in Korea 2016
Note : The PM2.5 concentration in LA is the value from the official US-EPA web-site, which is not correspond with value of Annual Report of Air Quality in Korea 2016
London Tokyo ParisLA0
25
50
34.0
14.712.0
20.017.0
12.6
22.0
14.0
PM10 PM2.5
Seoul
48.0
26.0
railways and buses accounted for 16.6% and 26.2%,
respectively, and the bus utilization rate mainly
increased.
Air Quality Management
Attention on particulate matter has recently been
rising. This is due to the negative effects of particulate
matter on health. Particulate matter is divided into
PM10 and PM2.5 depending on the diameter. PM10
is dust smaller than 10/1000mm, and PM2.5 is dust
smaller than 2.5mm / 1000. The recent change in
concentrations of PM10 showed 45μg/m3 in 2012
and increased to 49μg/m3 in 2013 and decreased to
47μg/m3, which was 1μg/m3 lower than in 2016. The
concentration of PM2.5, which began to be measured
in 2015, was 26 μg/m3 in 2016 without change. In terms
of major cities in the world, Seoul's annual average
of particulate matter concentration is about twice that
of London, Tokyo and Paris. This is similar not only in
Seoul but in all six metropolitan cities.
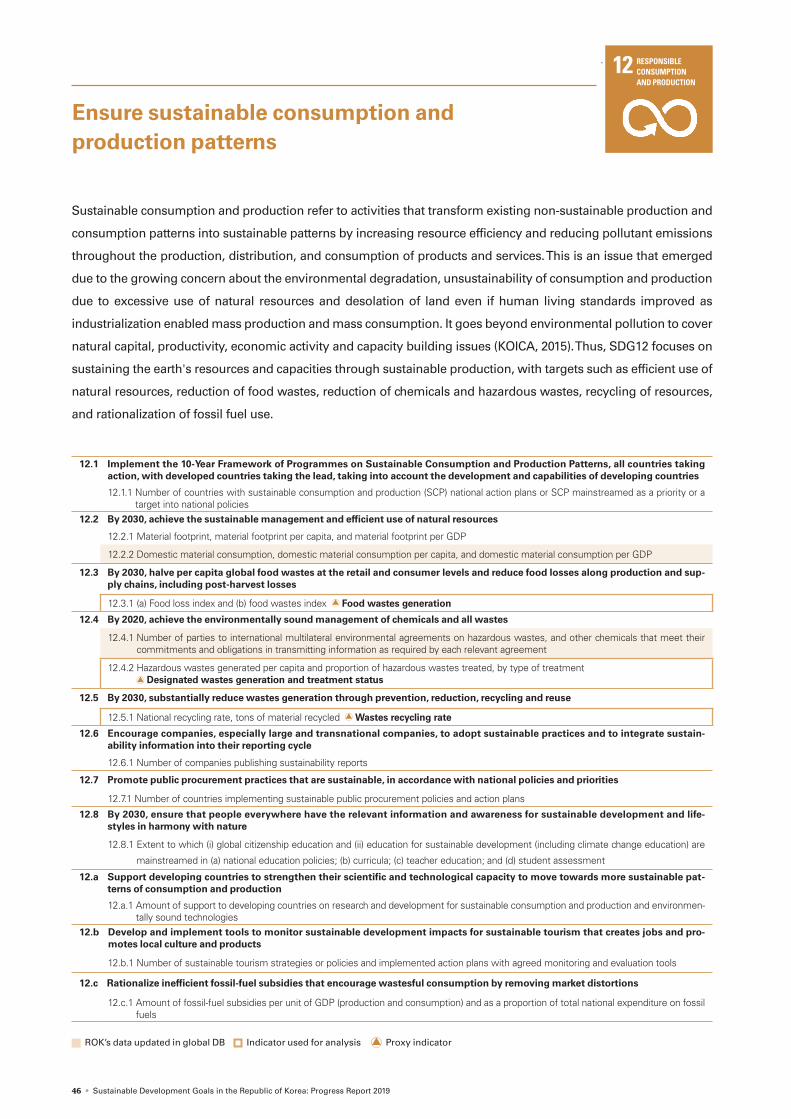
46 • Sustainable Development Goals in the Republic of Korea: Progress Report 2019
Ensure sustainable consumption and production patterns
Sustainable consumption and production refer to activities that transform existing non-sustainable production and
consumption patterns into sustainable patterns by increasing resource efficiency and reducing pollutant emissions
throughout the production, distribution, and consumption of products and services. This is an issue that emerged
due to the growing concern about the environmental degradation, unsustainability of consumption and production
due to excessive use of natural resources and desolation of land even if human living standards improved as
industrialization enabled mass production and mass consumption. It goes beyond environmental pollution to cover
natural capital, productivity, economic activity and capacity building issues (KOICA, 2015). Thus, SDG12 focuses on
sustaining the earth's resources and capacities through sustainable production, with targets such as efficient use of
natural resources, reduction of food wastes, reduction of chemicals and hazardous wastes, recycling of resources,
and rationalization of fossil fuel use.
RESPONSIBLECONSUMPTIONAND PRODUCTION
12
12.1 Implement the 10-Year Framework of Programmes on Sustainable Consumption and Production Patterns, all countries taking action, with developed countries taking the lead, taking into account the development and capabilities of developing countries
12.1.1 Number of countries with sustainable consumption and production (SCP) national action plans or SCP mainstreamed as a priority or a target into national policies
12.2 By 2030, achieve the sustainable management and efficient use of natural resources
12.2.1 Material footprint, material footprint per capita, and material footprint per GDP
12.2.2 Domestic material consumption, domestic material consumption per capita, and domestic material consumption per GDP
12.3 By 2030, halve per capita global food wastes at the retail and consumer levels and reduce food losses along production and sup-ply chains, including post-harvest losses
12.3.1 (a) Food loss index and (b) food wastes index Food wastes generation
12.4 By 2020, achieve the environmentally sound management of chemicals and all wastes
12.4.1 Number of parties to international multilateral environmental agreements on hazardous wastes, and other chemicals that meet their commitments and obligations in transmitting information as required by each relevant agreement
12.4.2 Hazardous wastes generated per capita and proportion of hazardous wastes treated, by type of treatment Designated wastes generation and treatment status
12.5 By 2030, substantially reduce wastes generation through prevention, reduction, recycling and reuse
12.5.1 National recycling rate, tons of material recycled Wastes recycling rate
12.6 Encourage companies, especially large and transnational companies, to adopt sustainable practices and to integrate sustain-ability information into their reporting cycle
12.6.1 Number of companies publishing sustainability reports
12.7 Promote public procurement practices that are sustainable, in accordance with national policies and priorities
12.7.1 Number of countries implementing sustainable public procurement policies and action plans
12.8 By 2030, ensure that people everywhere have the relevant information and awareness for sustainable development and life-styles in harmony with nature
12.8.1 Extent to which (i) global citizenship education and (ii) education for sustainable development (including climate change education) are
mainstreamed in (a) national education policies; (b) curricula; (c) teacher education; and (d) student assessment
12.a Support developing countries to strengthen their scientific and technological capacity to move towards more sustainable pat-terns of consumption and production
12.a.1 Amount of support to developing countries on research and development for sustainable consumption and production and environmen-tally sound technologies
12.b Develop and implement tools to monitor sustainable development impacts for sustainable tourism that creates jobs and pro-motes local culture and products
12.b.1 Number of sustainable tourism strategies or policies and implemented action plans with agreed monitoring and evaluation tools
12.c Rationalize inefficient fossil-fuel subsidies that encourage wastesful consumption by removing market distortions
12.c.1 Amount of fossil-fuel subsidies per unit of GDP (production and consumption) and as a proportion of total national expenditure on fossil fuels
ROK’s data updated in global DB Indicator used for analysis Proxy indicator

Chapter 4. The Progress of SDGs in the ROK • 47
Food Wastes
Reducing food loss at the food production and supply
stages is a key to sustainable consumption and
production. Reducing the amount of food waste is a
typical activity, but as of 2017, the average amount of
food waste generated in the ROK was 14,400 tons, up
4.7% from 13,754 tons in 2007. If the amount of food
waste is converted to per capita, it is 0.27kg per day
in 2017.
Hazardous Wastes
In accordance with the Wastes Control Act,
governments designates substances that may pollute
the surrounding environment such as waste oil, waste
acid, or harm human body such as medical wastes
among industrial wastes as designated wastes to
identify the generation amount and treatment status
each year. The amount of designated wastes has
been increasing every year, and 5,034,948 tons was
generated in 2016, up 45% from 2007 (3,471,461 tons).
There are 4,813,356 tons of designated wastes(95.6%),
and 221,592 tons of medical wastes(4.4%). In 2016,
the designated wastes treatment status showed
that 58.5% of the designated industrial wastes
was recycled and the rest was landfilled (22.0%) or
incinerated (13.4%). On the other hand, medical waste
is mostly incinerated (92.4%), and the rest is sterilized,
grinded or treated by waste water treatment facilities.
Food Wastes Generation(Unit: ton/ day) (Unit: kg/ day)
Source: Ministry of Environment, Status of Waste Generation and TreatmentNote : Separate discharge of food wastes means wastes that is contained in
food waste bags or containers for the purpose of recycling remaining food wastes
2007
2008
2009
2010
2011
2012
2013
2014
2015
2016
2017
0
10,000
20,000
0.0
0.5
1.0
Food Wastes Separate Discharge
Per capita Food Wastes Discharge
13,7
54
0.28 0.27
14,4
00
Designated Wastes Generation(Unit: ton/ year)
Source: Ministry of Environment, Status of Hazardous Waste Generation and Treatment
0
2,000,000
4,000,000
6,000,000
2007
2008
2009
2010
2011
2012
2013
2014
2015
2016
Designated Industrial Wastes
Medical Wastes
Total Designated Wastes
3,471,461
5,034,948
4,81
3,35
6
3,38
8,82
7
221,
592
82,6
34
Status of Designated Wastes Treatment: 2016(Unit: %)
Source: Ministry of Environment, Status of Waste Generation and TreatmentNote : Others = (other treatment amount + final storage amount)-The value
of carryover amount of last year, which is processed by sterile grinding (self) and wastewater treatment facilities, etc.
Designated Industrial Wastes Medical Wastes
58.5
92.4
13.4
6.1 7.6
22.0
recycle land�ll etcincinerate
Wastes Recycling
Wastes is mostly treated landfilled, incinerated or
recycled. Excluding the designated wastes, the total
amount of waste generated per day in 2017 was
414,626 tons and 358,271 tons (86.4%) was recycled.
The waste recycling rate is on the rise. On the other
hand, in the case of daily-life wastes 61.6% were
recycled per day in 2017.

48 • Sustainable Development Goals in the Republic of Korea: Progress Report 2019
Source: Ministry of Environment, Status of Waste Generation and Treatment
Wastes Generation and Recycling Rate(Unit: ton/ day) (Unit: %)
2007
2008
2009
2010
2011
2012
2013
2014
2015
2016
2017
0
150,000
300,000
450,000
0
20
40
60
80
100
Wastes generation Recycling Rate
81.186.4
337,
158
414,
626
Household Wastes Generation and Recycling Rate (Unit: ton/ day) (Unit: %)
Source: Ministry of Environment, Status of Waste Generation and TreatmentNote : Daily-life wastes are figures including household wastes, industrial dai-
ly-life wastes, and construction daily-life wastes
2007
2008
2009
2010
2011
2012
2013
2014
2015
2016
2017
0
20,000
40,000
60,000
0
25
50
75
100
Daily-life wastes Generation Recycling Rate
57.8 61.6
50,3
46
53,4
90

Chapter 4. The Progress of SDGs in the ROK • 49
Take urgent action to combat climate change and its impacts
Climate change is a critical threat to human survival and sustainable development. The Intergovernmental Panel on
Climate Change (IPCC) argues that global average temperatures have risen by 0.74℃ compared to 1906, and that a
2℃ increase in global mean temperature will have a devastating impact on the global ecosystem. The international
community has agreed to action to reduce climate change and its impacts by adopting the Paris Agreement in
December 2015 as a follow-up to the Kyoto Protocol, which is due to expire in 2020. Paying attention to the increase
of greenhouse gases and climate change caused by human activities, SDG13 recognizes the impact as an important
task to be urgently addressed. Targets include resilience and adaptive capacity to climate change and natural
disasters, integration of climate change response measures in national plans and strategies, education and capacity
building.
CLIMATEACTION13
13.1 Strengthen resilience and adaptive capacity to climate-related hazards and natural disasters in all countries
13.1.1 Number of deaths, missing persons and directly affected persons attributed to disasters per 100,000 population
13.1.2 Number of countries that adopt and implement national disaster risk reduction strategies in line with the Sendai Framework for Disaster Risk Reduction 2015–2030
13.1.3 Proportion of local governments that adopt and implement local disaster risk reduction strategies in line with national disaster risk reduction strategies
13.2 Integrate climate change measures into national policies, strategies and planning
13.2.1 Number of countries that have communicated the establishment or operationalization of an integrated policy/strategy/plan which in-creases their ability to adapt to the adverse impacts of climate change, and foster climate resilience and low greenhouse gas emissions development in a manner that does not threaten food production (including a national adaptation plan, nationally determined contribu-tion, national communication, biennial update report or other) GHG Emissions
13.3 Improve education, awareness-raising and human and institutional capacity on climate change mitigation, adaptation, impact reduction and early warning
13.3.1 Number of countries that have integrated mitigation, adaptation, impact reduction and early warning into primary, secondary and tertiary curricula
13.3.2 Number of countries that have communicated the strengthening of institutional, systemic and individual capacity-building to implement adaptation, mitigation and technology transfer, and development actions
13.a Implement the commitment undertaken by developed-country parties to the United Nations Framework Convention on Climate Change to a goal of mobilizing jointly $100 billion annually by 2020 from all sources to address the needs of developing coun-tries in the context of meaningful mitigation actions and transparency on implementation and fully operationalize the Green Climate Fund through its capitalization as soon as possible
13.a.1 Mobilized amount of United States dollars per year between 2020 and 2025 accountable towards the $100 billion commitment
13.b Promote mechanisms for raising capacity for effective climate change-related planning and management in least developed countries and small island developing States, including focusing on women, youth and local and marginalized communities
13.b.1 Number of least developed countries and small island developing States that are receiving specialized support, and amount of support,
including finance, technology and capacity-building, for mechanisms for raising capacities for effective climate change-related planning
and management, including focusing on women, youth and local and marginalized communities
ROK’s data updated in global DB Indicator used for analysis Proxy indicator
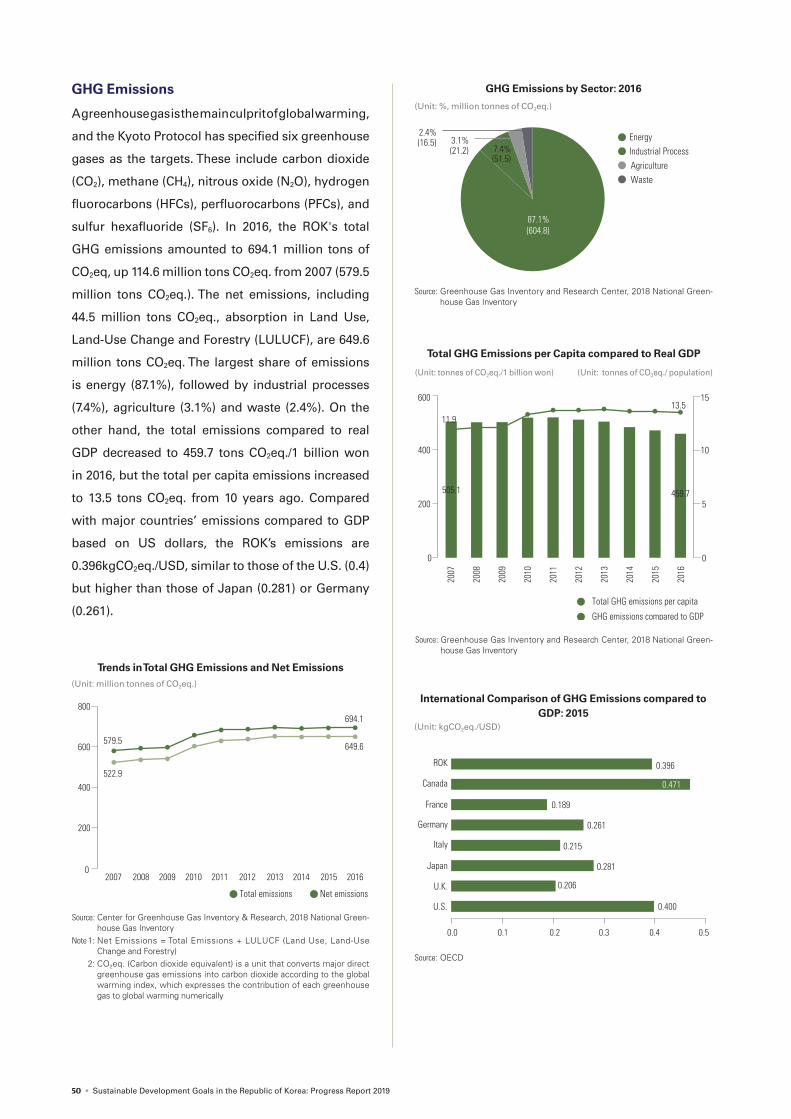
50 • Sustainable Development Goals in the Republic of Korea: Progress Report 2019
GHG Emissions
A greenhouse gas is the main culprit of global warming,
and the Kyoto Protocol has specified six greenhouse
gases as the targets. These include carbon dioxide
(CO2), methane (CH4), nitrous oxide (N2O), hydrogen
fluorocarbons (HFCs), perfluorocarbons (PFCs), and
sulfur hexafluoride (SF6). In 2016, the ROK's total
GHG emissions amounted to 694.1 million tons of
CO2eq, up 114.6 million tons CO2eq. from 2007 (579.5
million tons CO2eq.). The net emissions, including
44.5 million tons CO2eq., absorption in Land Use,
Land-Use Change and Forestry (LULUCF), are 649.6
million tons CO2eq. The largest share of emissions
is energy (87.1%), followed by industrial processes
(7.4%), agriculture (3.1%) and waste (2.4%). On the
other hand, the total emissions compared to real
GDP decreased to 459.7 tons CO2eq./1 billion won
in 2016, but the total per capita emissions increased
to 13.5 tons CO2eq. from 10 years ago. Compared
with major countries’ emissions compared to GDP
based on US dollars, the ROK’s emissions are
0.396kgCO2eq./USD, similar to those of the U.S. (0.4)
but higher than those of Japan (0.281) or Germany
(0.261).
2007 2008 2009 2010 2011 2012 2013 2014 2015 2016
2016
0
200
400
600
800
579.5
522.9
694.1
649.6
Net emissionsTotal emissions
Trends in Total GHG Emissions and Net Emissions(Unit: million tonnes of CO2eq.)
Source: Center for Greenhouse Gas Inventory & Research, 2018 National Green-house Gas Inventory
Note 1: Net Emissions = Total Emissions + LULUCF (Land Use, Land-Use Change and Forestry)
2: CO2eq. (Carbon dioxide equivalent) is a unit that converts major direct greenhouse gas emissions into carbon dioxide according to the global warming index, which expresses the contribution of each greenhouse gas to global warming numerically
International Comparison of GHG Emissions compared to GDP: 2015
(Unit: kgCO2eq./USD)
Source: OECD
0.396
0.0 0.1 0.2 0.3 0.4 0.5
0.189
0.261
0.215
0.281
0.206
0.400
0.471
ROK
Canada
France
Germany
Italy
Japan
U.K.
U.S.
2007
2008
2009
2010
2011
2012
2013
2014
2015
2016
2016
0
5
10
15
0
200
400
600
11.9
505.1
13.5
459.7
GHG emissions compared to GDP
Total GHG emissions per capita
Total GHG Emissions per Capita compared to Real GDP
(Unit: tonnes of CO2eq./1 billion won) (Unit: tonnes of CO2eq./ population)
Source: Greenhouse Gas Inventory and Research Center, 2018 National Green-house Gas Inventory
GHG Emissions by Sector: 2016
(Unit: %, million tonnes of CO2eq.)
Source: Greenhouse Gas Inventory and Research Center, 2018 National Green-house Gas Inventory
Industrial Process Energy
Agriculture Waste
87.1%(604.8)
7.4%(51.5)
3.1%(21.2)
2.4%(16.5)
Chapter 4. The Progress of SDGs in the ROK • 51
Conserve and sustainably use the oceans, seas and marine resources for sustainable development
The ocean, which occupies three quarters of the earth's surface, plays a key role in ecosystems. In this regard,
marine acidification is emerging as an important issue. Ocean acidification is a phenomenon in which the hydrogen
ion concentration index (pH) of the ocean is lowered as carbon dioxide in the atmosphere is absorbed into the
ocean. Compared to the Industrial Revolution, the acidity has increased by approximately 26%. This may affect
the marine ecosystem and fisheries as a whole and even lead to food crises. Reflecting this importance of the
ocean, SDG14 challenges two seemingly conflicting goals of ocean protection and sustainable use of resources
for the sustainable development of the earth. More specifically, it proposes to reduce marine pollution, increase
biodiversity and increase the use of resources through sustainable fishing.
LIFE BELOW WATER14
14.1 By 2025, prevent and significantly reduce marine pollution of all kinds, in particular from land-based activities, including marine debris and nutrient pollution
14.1.1 Index of coastal eutrophication and floating plastic debris density Coastal litter status, distribution of water quality index (WQI) across the coast
14.2 By 2020, sustainably manage and protect marine and coastal ecosystems to avoid significant adverse impacts, including by strengthening their resilience, and take action for their restoration in order to achieve healthy and productive oceans
14.2.1 Proportion of national exclusive economic zones managed using ecosystem-based approaches
14.3 Minimize and address the impacts of ocean acidification, including through enhanced scientific cooperation at all levels
14.3.1 Average marine acidity (pH) measured at agreed suite of representative sampling stations
14.4 By 2020, effectively regulate harvesting and end overfishing, illegal, unreported and unregulated fishing and destructive fishing practices and implement science-based management plans, in order to restore fish stocks in the shortest time feasible, at least to levels that can produce maximum sustainable yield as determined by their biological characteristics
14.4.1 Proportion of fish stocks within biologically sustainable levels
14.5 By 2020, conserve at least 10 per cent of coastal and marine areas, consistent with national and international law and based on the best available scientific information
14.5.1 Coverage of protected areas in relation to marine areas
14.6 By 2020, prohibit certain forms of fisheries subsidies which contribute to overcapacity and overfishing, eliminate subsidies that contribute to illegal, unreported and unregulated fishing and refrain from introducing new such subsidies, recognizing that ap-propriate and effective special and differential treatment for developing and least developed countries should be an integral part of the World Trade Organization fisheries subsidies negotiation
14.6.1 Degree of implementation of international instruments aiming to combat illegal, unreported and unregulated fishing
14.7 By 2030, increase the economic benefits to small island developing States and least developed countries from the sustainable use of marine resources, including through sustainable management of fisheries, aquaculture and tourism
14.7.1 Sustainable fisheries as a proportion of GDP in small island developing States, least developed countries and all countries
14.a Increase scientific knowledge, develop research capacity and transfer marine technology, taking into account the Intergovern-mental Oceanographic Commission Criteria and Guidelines on the Transfer of Marine Technology, in order to improve ocean health and to enhance the contribution of marine biodiversity to the development of developing countries, in particular small island developing States and least developed countries
14.a.1 Proportion of total research budget allocated to research in the field of marine technology
14.b Provide access for small-scale artisanal fishers to marine resources and markets
14.b.1 Degree of application of a legal/regulatory/ policy/institutional framework which recognizes and protects access rights for small-scale fisheries
14.c Enhance the conservation and sustainable use of oceans and their resources by implementing international law as reflected in the United Nations Convention on the Law of the Sea, which provides the legal framework for the conservation and sustainable use of oceans and their resources, as recalled in paragraph 158 of “The future we want”
14.c.1 Number of countries making progress in ratifying, accepting and implementing through legal, policy and institutional frameworks,
ocean-related instruments that implement international law, as reflected in the United Nations Convention on the Law of the Sea, for
the conservation and sustainable use of the oceans and their resources
ROK’s data updated in global DB Indicator used for analysis Proxy indicator
13 Korea JoongAng Daily October 23, 2017 “26% increase in global seawater acidification after industrial revolution”

52 • Sustainable Development Goals in the Republic of Korea: Progress Report 2019
Marine Pollution
Marine pollutants are very diverse, not only
household wastes, but also sewage, wastewater and
garbage from industrial activities such as agriculture
and fisheries. Coastal eutrophication15 indexes
and floating plastic density, which are presented as
global indicators, can be a measure of pollution from
land activities. The Ministry of Oceans and Fisheries
and the Korea Marine Environment Management
Corporation have selected 40 sites along the East,
West and South Sea coasts to conduct regular surveys
every two months and monitor the state of coastal
waste. As of 2017, the coastal litter weighed 9,793kg
and had a volume of 63,781L. And plastics accounted
for 3,835kg, 39.2% of total weight and 22,407L, 35.1%
Source: Korea Marine Environment Management Corporation, Marine ecosystem information(www.malic.or.kr)
0
50,000
100,000
2008
2009
2010
2011
2012
2013
2014
2015
2016
2017
Plastic weightPlastic volume
Total weight Total volume
0
10,000
20,000
48,5
63
63,7
819,
793
9,36
214
,722 22
,407
2,75
7 3,83
5
Coastal Litter Status(Unit: kg) (Unit: L)
2013
2014
2015
2016
2017
Grade 1 (very good)
Grade 5 (very bad)
Grade 2 (good) Grade 3 (moderate)
Grade 4 (bad)
30.2
46.8
40.8 5.80.822.3
13.9 0.938.4
Source: Ministry of Oceans and Fisheries, Annual Report on Marine Environment Monitoring in Korea
Note 1: Seawater quality grades are divided into five grades based on a combi-nation of five water quality indicators (dissolved oxygen concentration, phytoplankton concentration, transparency, nitrogen, and phosphorus) to assess the quality of seawater
2: The numbers of survey peaks are 377 in 2013, 417 in 2014, 417 in 2015, 417 in 2016 and 425 in 2017
WQI Distribution across National Coasts(Unit: %)
Cumulative Designated Places and Cumulative Area of Protected Marine Areas
(Unit: place) (Unit: km2)
Source: Statistical Yearbook of Oceans & Fisheries
2008
2009
2010
2011
2012
2013
2014
2015
2016
2017
2018
0
1,000
2,000
251.
1
12
28
1,77
7.4
0
15
30
15 Eutrophication refers to a phenomenon in which algae grows rapidly due to the increase of nutritive salts such as nitrogen and phosphorus due to the inflow of livestock manure and domestic sewage into rivers, seas and lakes
of total volume.
According to the Water Quality Index (WQI),
which reflects the characteristics of the ROK’s marine
environment, the percentage of Grades 1 and 2, which
mean that the water quality is very good and good,
is about 85% of the 425 peaks across the national
coasts. According to the measurement result for the
recent five years (2013-2017), the percentage of water
quality grades 1 and 2 was over 70%, the grade 4 was
between 1-9% and the grade 5 was less than 2%. In
particular, after 2016, Grade 5 water quality no longer
appeared, and Grade 4 also continued to decline
since 2014.
Biodiversity
Protected marine areas are areas designated by the
state or local governments for specific public water
surface because of a special need to conserve the
marine ecosystem and the marine landscape. In
accordance with Article 25 of the Conservation and
Management of Marine Ecosystems Act and Article 8
of the Wetlands Conservation Act, those are divided
into areas for protecting marine ecosystems, areas
for protecting marine organisms, areas for protecting
marine landscape and coastal wetlands protection
area. There are currently 28 protected marine areas
in the ROK, with a total area of 1777.4 km2. Protected
marine areas have continued to expand, an increase
of about 7.1 times from 251.1km2 in 2008.

Chapter 4. The Progress of SDGs in the ROK • 53
Protect, restore and promote sustainable use of terrestrial ecosystems, sustainably manage forests, combat desertification, and halt and reverse land degradation and halt biodiversity loss
SDG15 aims to maintain biodiversity and conserve terrestrial ecosystems. Since humans depend on various
services provided by ecosystems, maintaining biodiversity and ecosystem is very important for human survival and
sustainable development. Under the Convention on Biological Diversity (CBD), the international community has put
a lot of efforts into maintaining the ecosystem by establishing strategies and detailed goals for biodiversity. Failure
to achieve the goal of preventing biodiversity reduction in MDGs has resulted in more detailed and comprehensive
targets in SDGs. The contents are to conserve and restore biodiversity and habitats, block inflow of foreign species,
and to mobilize the country's plans and resources for each ecosystem type, such as forests, wetlands, mountains,
drylands, and lake ecosystems.
LIFEON LAND15
15.1 By 2020, ensure the conservation, restoration and sustainable use of terrestrial and inland freshwater ecosystems and their ser-vices, in particular forests, wetlands, mountains and drylands, in line with obligations under international agreements
15.1.1 Forest area as a proportion of total land area
15.1.2 Proportion of important sites for terrestrial and freshwater biodiversity that are covered by protected areas, by ecosystem type
15.2 By 2020, promote the implementation of sustainable management of all types of forests, halt deforestation, restore degraded for-ests and substantially increase afforestation and reforestation globally
15.2.1 Progress towards sustainable forest management
15.3 By 2030, combat desertification, restore degraded land and soil, including land affected by desertification, drought and floods, and strive to achieve a land degradation-neutral world
15.3.1 Proportion of land that is degraded over total land area
15.4 By 2030, ensure the conservation of mountain ecosystems, including their biodiversity, in order to enhance their capacity to pro-vide benefits that are essential for sustainable development
15.4.1 Coverage by protected areas of important sites for mountain biodiversity
15.4.2 Mountain Green Cover Index
15.5 Take urgent and significant action to reduce the degradation of natural habitats, halt the loss of biodiversity and, by 2020, protect and prevent the extinction of threatened species
15.5.1 Red List Index The ROK’s Red List
15.6 Promote fair and equitable sharing of the benefits arising from the utilization of genetic resources and promote appropriate ac-cess to such resources, as internationally agreed
15.6.1 Number of countries that have adopted legislative, administrative and policy frameworks to ensure fair and equitable sharing of benefits
15.7 Take urgent action to end poaching and trafficking of protected species of flora and fauna and address both demand and supply of illegal wildlife products
15.7.1 Proportion of traded wildlife that was poached or illicitly trafficked
15.8 By 2020, introduce measures to prevent the introduction and significantly reduce the impact of invasive alien species on land and water ecosystems and control or eradicate the priority species
15.8.1 Proportion of countries adopting relevant national legislation and adequately resourcing the prevention or control of invasive alien species
15.9 By 2020, integrate ecosystem and biodiversity values into national and local planning, development processes, poverty reduction strategies and accounts
15.9.1 Progress towards national targets established in accordance with Aichi Biodiversity Target 2 of the Strategic Plan for Biodiversity 2011–2020
15.a Mobilize and significantly increase financial resources from all sources to conserve and sustainably use biodiversity and ecosystems
15.a.1 Official development assistance and public expenditure on conservation and sustainable use of biodiversity and ecosystems
15.b Mobilize significant resources from all sources and at all levels to finance sustainable forest management and provide adequate incentives to developing countries to advance such management, including for conservation and reforestation
15.b.1 Official development assistance and public expenditure on conservation and sustainable use of biodiversity and ecosystems
15.c Enhance global support for efforts to combat poaching and trafficking of protected species, including by increasing the capacity of local communities to pursue sustainable livelihood opportunities
15.c.1 Proportion of traded wildlife that was poached or illicitly trafficked
ROK’s data updated in global DB Indicator used for analysis Proxy indicator

54 • Sustainable Development Goals in the Republic of Korea: Progress Report 2019
Conservation of Land Ecosystems and
Guarantee of Sustainable Use
Forests serve as the provision of wood and non-wood
products, habitats for biodiversity and conservation of
soil and water resources. As of 2015, the ROK’s forest
area was 6,334,615 ha, which is 63.2% of the total land
area, about twice that of the U.S (33.9%) and Canada
(38.2%).16 However, forests are steadily decreasing
due to changes in land use for other purposes such
as road construction, housing construction, and
industrial complexes. The Korea Forest Service
estimates that forests decreased by 0.54% compared
to 6,368,843 ha in 2010 and will be about 6,230,000
ha by 2030 in case that the forest management is
maintained at the same level as now.
Source: FAOSTAT
International Comparison of Forest Area as a Proportion of Total Land Area : 2015
(Unit: %)
ROK Canada France Germany Italy Japan U.S.
63.2
38.231.0 32.7 31.6
68.5
33.9
0
50
100
Source: Korea Forest Service, Basic Forest Statistics
Forest Area(Unit: ha)
1990 1995 2000 2005 2010 2015
6,476,030
6,334,615
6,300,000
6,400,000
6,500,000
Endangered Species Protection
The International Union for Conservation of Nature
and Natural Resources (IUCN) manages wildlife’s
extinction risk levels by category through the Red list.
According to the ROK’s Red List, which supplemented
the categories and standards according to the
situation in the ROK, there are threatened 533 species
that combined the categories of Critically Endangered
(58 species), Endangered (169 species) and Vulnerable
(306 species). It was found that there are 268 species
of wildlife in the near threatened state, which may be
evaluated as a threatened species in the near future.
The ROK's Red List Assessment: 2018
Category Mammals Birds Amphibians, reptiles Fish Insects Mollusks Land plants Arachnid Totalㅈ
Extinct (EX) 1 1
Extinct in the Wild (EW)
Regionally Extinct (RE) 5 3 1 1 2 12
Critically Endangered (CR) 1 1 4 12 4 28 8 58
Endangered (EN) 4 18 5 13 22 19 86 2 169
Vulnerable (VU) 9 36 5 9 74 57 110 6 306
Near Threatened (NT) 1 8 2 14 34 82 56 71 268
Least Concern (LC) 11 28 23 20 511 583 97 487 1,760
Data Deficient (DD) 4 4 5 380 923 40 128 1,484
Not Evaluated (NE) 4 3 10 3,491 264 126 11 3,909
Not Applicable (NA) 1 1 1 28 31 62
Total 41 95 43 76 4,553 1,963 543 715 8,029
Source: National Institute of Biological Resources homepage (www.nibr.go.kr)Note 1: Extinct (EX): There is no reasonable doubt that the last object is dead 2: Extinct in the Wild (EW): The taxon has been extinct in its natural habitat or
has only lived or grown in a botanical garden 3: Regionally Extinct (RE): There is no reason to doubt that the last object with
potential reproductive potential in the area has died or has disappeared from the wild state, or a taxon, formerly a visitor taxon but whose last object died or disappeared in the wild state within the region
4: Critically Endangered (CR): A condition considered to face an extremely high extinction crisis in the wild
5: Endangered (EN): A condition considered to face a very high extinction crisis in the wild
6: Vulnerable (VU): A condition considered to face a high extinction crisis in the wild
7: Near Threatened (NT): Currently not a Critically Endangered, Endangered, or Vulnerable and a condition that can be assessed or approached to extinction in the near future
8: Least Concern (LC): A taxa that is widespread and has a large population without currently being in a Critically Endangered, Endangered, Vulnerable, and Near Threatened state
9: Data Deficient (DD): A taxon that lacks information to make certain state as-sessments
10: Not Evaluated (NE): A category applied to a taxon that has not yet been evaluated according to the Red List criteria. Data Deficient and Not Evaluated categories do not reflect the threat of taxon
11: Not Applicable (NA): A taxon considered to be inadequate for evaluation at the regional level
16 Forest area ranks fourth among OECD countries following Finland (73.1%), Japan (68.5%) and Sweden (68.4%) (www.mdex.go.kr).

Chapter 4. The Progress of SDGs in the ROK • 55
Promote peaceful and inclusive societies for sustainable development, provide access to justice for all and build effective, accountable and inclusive institutions at all levels
A peaceful and just society, an effective, responsible and inclusive system is the cornerstone of the sustainable
development process. SDG16 sets targets for reducing violence, in particular ending violence against children and
promoting the rule of law, reducing corruption, developing transparent, effective and reliable institutions, ensuring
participatory decision making, and human rights and freedoms.
PEACE, JUSTICE AND STRONG INSTITUTIONS16
16.1 Significantly reduce all forms of violence and related death rates everywhere
16.1.1 Number of victims of intentional homicide per 100,000 population, by sex and age Sexand age distribution of murder victims
16.1.2 Conflict-related deaths per 100,000 population, by sex, age and cause
16.1.3 Proportion of population subjected to (a) physical violence, (b) psychological violence and (c) sexual violence in the previous 12 months
16.1.4 Proportion of population that feel safe walking alone around the area they live Percentage of population who feels fear of crime
16.2 End abuse, exploitation, trafficking and all forms of violence against and torture of children
16.2.1 Proportion of children aged 1–17 years who experienced any physical punishment and/or psychological aggression by caregivers in the past month
16.2.2 Number of victims of human trafficking per 100,000 population, by sex, age and form of exploitation
16.2.3 Proportion of young women and men aged 18–29 years who experienced sexual violence by age 18
16.3 Promote the rule of law at the national and international levels and ensure equal access to justice for all
16.3.1 Proportion of victims of violence in the previous 12 months who reported their victimization to competent authorities or other officially recognized conflict resolution mechanisms
16.3.2 Unsentenced detainees as a proportion of overall prison population
16.4 By 2030, significantly reduce illicit financial and arms flows and combat all forms of organized crime
16.4.1 Total value of inward and outward illicit financial flows (in current United States dollars)
16.4.2 Proportion of seized, found or surrendered arms whose illicit origin
16.5 Substantially reduce corruption and bribery in all their forms
16.5.1 Proportion of persons who had at least one contact with a public official and who paid a bribe to a public official, or were asked for a bribe by those public officials, during the previous 12 months
16.5.2 Proportion of businesses that had at least one contact with a public official and that paid a bribe to a public official, or were asked for a bribe by those public officials during the previous 12 months
16.6 Develop effective, accountable and transparent institutions at all levels
16.6.1 Primary government expenditures as a proportion of original approved budget, by sector (or by budget codes or similar)
16.6.2 Proportion of population satisfied with their last experience of public services
16.7 Ensure responsive, inclusive, participatory and representative decision-making at all levels
16.7.1 Proportions of positions in national and local institutions by sex, age, persons with disabilities and population groups
16.7.2 Proportion of population who believe decision-making is inclusive and responsive, by sex, age, disability and population group
16.8 Broaden and strengthen the participation of developing countries in the institutions of global governance
16.8.1 Proportion of members and voting rights of developing countries in international organizations
16.9 By 2030, provide legal identity for all, including birth registration
16.9.1 Proportion of children under 5 years of age whose births have been registered with a civil authority, by age16.10 Ensure public access to information and protect fundamental freedoms, in accordance with national legislation and interna-
tional agreements
16.10.1 Number of verified cases of killing, kidnapping, enforced disappearance, arbitrary detention and torture of journalists, associated media personnel, trade unionists and human rights advocates in the previous 12 months
16.10.2 Number of countries that adopt and implement constitutional, statutory and/or policy guarantees for public access to information
16.a Strengthen relevant national institutions to prevent violence and combat terrorism and crime
16.a.1 Existence of independent national human rights institutions in compliance with the Paris Principles
16.b Promote and enforce non-discriminatory laws and policies for sustainable development
16.b.1 Proportion of population reporting having personally felt discriminated against or harassed in the previous 12 months on the basis of a ground of discrimination prohibited under international human rights law
ROK’s data updated in global DB Indicator used for analysis Proxy indicator

56 • Sustainable Development Goals in the Republic of Korea: Progress Report 2019
Reduced Violence
The number of murder case has declined from 427
in 2011 to 301 in 2017. According to the characteristics
of the victims, the percentage of female victim
was consistently higher than that of male and the
percentage of victim tends to be higher as the age
increases. In particular, the proportion of those under
the age of six increased from 3.8% in 2011 to 8.3% in
2017.
Number of Murder Case(Unit: case)
0
5
10
15
20
427
356 301
2011 2012 2013 2014 2015 2016 20170
100
200
300
400
500
Source: National Police Agency, 2017 Police Statistics Annual ReportNote : Murder crimes are divided into murder and attempted murder, but mur-
der cases that resulted in actual death were presented according to the definition of the SDG indicator (16.1.1)
Percentage of Population Who Have Fear of Crime(Unit: %)
42.4
20.7
1996 1998 2003 2006 2009 2011 2013 2015 20170
10
20
30
40
50
Source: Korean Institute of Criminology, 2017 National Public Safety SurveyNote : Fear of crime is the sum of responding to the question of being afraid
when walking alone in a neighborhood alley at night as ‘a little scared’ and ‘very scared’
Victims of Murder by Sex and Age(Unit: %)
6 or younger 7-12 years old 13-15 years old
16-20 years old 21-30 years old
31-40 years old
41-50 years old 51-60 years old 60 or older
2011
2012
2013
2014
2015
2016
2017
52.5 47.5
51.0 49.0
0 25 50 75 100
0 25 50 75 100
2011
2012
2013
2014
2015
2016
2017
Female Male
Gender
Age
20.018.8
23.024.38.3
3.8
Source: National Police Agency, 2017 Police Statistics Annual ReportNote : The percentages of sex and age are calculated without unknown
Status of Unsentenced Detainees
An unsentenced detainee is a person who is held in
a correctional facility at the stage of an investigation
or trial in a criminal case. According to the Universal
Declaration of Human Rights, he/she should be
presumed and treated innocent because he/she is
not convicted yet (Choi Youngshil et al, 2014). In terms
of the percentage of unsentenced detainees in the
ROK, there has been no significant change in the
past 10 years from 34.2% in 2005 to 35.6% in 2016.
This is similar to that of Canada. The percentage of
unsentenced detainees declined in all countries
except the ROK and Canada, with the largest decline
in Italy.
International Comparison of Unsentenced Detainees as a Proportion of Overall Prison Population
(Unit: %)
34.2
35.6
29.1
36.6
23.7
21.7
37.1
18.215.0
11.3
22.1
21.527.0
36.4
0
10
20
30
40
50
ROK Canada France Germany Italy Japan U.S.
2005
2016
2005
2016
2005
2016
2005
2016
2005
2016
2005
2016
2005
2016
Source : United Nations Survey on Crime Trends and Operations of Criminal Jus-tice Systems
Note : 2005 is the mean of 2003-2005 and 2016 is the mean of 2014-2016
Fear of crime has also declined since the survey
was conducted. It was the highest at 42.4% in 1996,
and it has been steadily decreasing since 2009 after
repeating increase and decrease, and has fallen to
20.7% in 2017 (Choi Soo-hyung·Cho Young-oh, 2017).
Chapter 4. The Progress of SDGs in the ROK • 57
Strengthen the means of implementation and revitalize the global partnership for sustainable development
SDG17 emphasizes the need for inclusive participation and active partnerships of government, civil society, private
sector and other relevant actors to achieve a successful 2030 Agenda. It also aims to expand support for developing
countries, especially least-developed countries, small islands and inland developing countries, to achieve equal
growth throughout the world through the full implementation of the Addis Ababa Action Agenda.
PARTNERSHIPSFOR THE GOALS17
17.1 Strengthen domestic resource mobilization for developing countries to improve domestic capacity for tax and other revenue collection
17.1.1 Total government revenue as a proportion of GDP, by source
17.1.2 Proportion of domestic budget funded by domestic taxes
17.2 Developed countries to implement fully their official development assistance commitments, including the commitment by many developed countries to achieve the target of 0.7 per cent of gross national income for official development assistance (ODA/GNI) to developing countries
17.2.1 Net official development assistance, total and to least developed countries, as a proportion of the Organization for Economic Cooperation and Development (OECD) Development Assistance Committee donors’ gross national income (GNI)
17.3 Mobilize additional financial resources for developing countries from multiple sources
17.3.1 Foreign direct investment (FDI), official development assistance and South-South cooperation as a proportion of total domestic budget
17.3.2 Volume of remittances (in United States dollars) as a proportion of total GDP
17.4 Assist developing countries in attaining long-term debt sustainability
17.4.1 Debt service as a proportion of exports of goods and services
17.5 Adopt and implement investment promotion regimes for least developed countries
17.5.1 Number of countries that adopt and implement investment promotion regimes for least developed countries
17.6 Enhance North-South, South-South and triangular regional and international cooperation on and access to science, technology and inno-vation and enhance knowledge-sharing on mutually agreed terms
17.6.1 Number of science and/or technology cooperation agreements and programmes between countries, by type of cooperation
17.6.2 Fixed Internet broadband subscriptions per 100 inhabitants, by speed
17.7 Promote the development of environmentally sound technologies to developing countries on favourable terms
17.7.1 Total amount of approved funding for developing countries to promote the development, transfer, dissemination and diffusion of environmentally sound technologies
17.8 Fully operationalize the technology bank and science, technology and innovation capacity-building mechanism for least developed countries
17.8.1 Proportion of individuals using the Internet
17.9 Enhance international support for implementing effective and targeted capacity-building in developing countries to support national plans to implement all the SDGs, including through North-South, South-South and triangular cooperation
17.9.1 Dollar value of financial and technical assistance (including through North-South, South-South and triangular cooperation) committed to developing countries
17.10 Promote equitable multilateral trading system including through the conclusion of negotiations under its Doha Development Agenda
17.10.1 Worldwide weighted tariff-average
17.11 Significantly increase the exports of developing countries, in particular with a view to doubling the least developed countries’ share of global exports by 2020
17.11.1 Developing countries’ and least developed countries’ share of global exports
17.12 Realize timely implementation of duty-free and quota-free market access on a lasting basis for all least developed countries
17.12.1 Average tariffs faced by developing countries, least developed countries and small island developing States17.13 Enhance global macroeconomic stability, including through policy coordination and policy coherence
17.13.1 Macroeconomic Dashboard
17.14 Enhance policy coherence for sustainable development
17.14.1 Number of countries with mechanisms in place to enhance policy coherence of sustainable development
17.15 Respect each country’s policy space and leadership to establish and implement policies for poverty eradication
17.15.1 Extent of use of country-owned results frameworks and planning tools by providers of development cooperation
17.16 Enhance the Global Partnership for Sustainable Development, complemented by multi-stakeholder partnerships
17.16.1 Number of countries reporting progress in multi-stakeholder development effectiveness monitoring frameworks that support the achievement of the SDGs
17.17 Encourage and promote effective public, public-private and civil society partnerships
17.17.1 Amount of United States dollars committed to (a) public-private partnerships and (b) civil society partnerships
17.18 By 2020, enhance capacity-building support to developing countries to increase significantly the availability of high-quality, timely and reliable data
17.18.1 Proportion of sustainable development indicators produced at the national level with full disaggregation when relevant to the target
17.18.2 Number of countries that have national statistical legislation that complies with the Fundamental Principles of Official Statistics
17.18.3 Number of countries with a national statistical plan that is fully funded and under implementation, by source of funding
17.19 Build on existing initiatives to develop measurements of progress on sustainable development that complement GDP in developing countries
17.19.1 Dollar value of all resources made available to strengthen statistical capacity in developing countries
17.19.2 Proportion of countries that (a) have conducted at least one population and housing census in the last 10 years; and (b) have achieved 100 per cent birth registration and 80 per cent death registration
ROK’s data updated in global DB Indicator used for analysis Proxy indicator

58 • Sustainable Development Goals in the Republic of Korea: Progress Report 2019
Official Development Assistance
The percentage of official development assistance
(ODA) to the ROK’s Gross National Income (GNI) is
0.14% in 2017. Since 2000, when a recipient country
became a donor country, ODA percentage has been
on the rise, but is still below the target of 0.2% at
the time joining OECD Development Assistance
Committee (DAC). In 2017, the average percentage of
all DAC member countries was 0.31%, with Sweden
(1.01%) and Luxembourg (1.00%) having the highest
ODA rates. The ROK is the 25th of 29 countries.
ODA as a percentage of GNI in the ROK(Unit: %)
Source: OECD, DAC Statistics database
2007
2008
2009
2010
2011
2012
2013
2014
2015
2016
2017
0.07
0.14
0.0
0.1
0.2
ODA as a percentage of OECD-DAC donors’ GNI : 2017(Unit: %)
Source: OECD, DAC Statistics database
Average
Sweden
Luxembourg
Norway
Denmark
U.K.
Germany
Netherlands
Switzerland
Belgium
France
Finland
Austria
Ireland
Italy
Iceland
Canada
New Zealand
Japan
Australia
Spain
U.S.
Portugal
Slovenia
Greece
ROK
Czech Republic
Poland
Slovakia
Hungary
0.0 0.5 1.0 1.5
0.31
1.01
1.00
0.99
0.72
0.70
0.66
0.60
0.46
0.45
0.43
0.41
0.30
0.30
0.29
0.29
0.26
0.23
0.23
0.23
0.19
0.18
0.18
0.16
0.16
0.14
0.13
0.13
0.12
0.11

Chapter 5. Strategies to Reduce the SDGs Data Gap • 59
Strategies to Reduce the SDGs Data Gap
1. SDG Indicators as Future Direction
Often data are unavailable when creating policy. Can we
anticipate policy needs in advance and produce data?
This is why statistical production guidelines are needed
from a future-oriented perspective. In this respect, the
SDGs are likely to give statisticians ideas.
The most frequently asked question in the localization
of the SDGs is, "SDGs contain a number of targets and
indicators that are not relevant with the Korean context.
Should these cases be also implemented in the ROK?"
Since the SDGs are universal to all countries around
the world, there are certainly areas that the ROK has
already achieved or are out of the Korean context.
However, what is the criteria for the assessment?
Let’s think of the proportion of girls and women aged
15-49 years who have undergone female genital
mutilation/cutting, an indicator that evaluates the
implementation of the target of ‘eliminating all harmful
practices such as ‘child marriage, early marriage and
forced marriage, and Female Genital Mutilation/Cutting
(FGM/C). In the current trend of increasing migration,
this target and indicator cannot be seen as irrelevant to
the domestic context. Therefore, without recognizing a
global relationship, the achievement and evaluation of
the target cannot be carried out. We agreed that the 232
indicators are the minimum we should monitor those
for sustainable development.
In order to derive future-oriented data strategies,
the current situation must be reviewed first. Metadata,
which can be said to be a concept definition of 232 global
indicators, is the basis for situational review. In this
chapter, we diagnosed domestic data availability based
on the concept and methods at the global level. In the
process, we established our own classification system
that is distinct from the UN's tier system. The criteria
of data availability, one axis of the UN tier system, is
whether more than 50% of the countries or populations
in the region provide data on a regular basis. Even
when domestic data is available, the indicator may be
classified as Tier 2, and even when domestic data is not
available, it may be classified as Tier 1. Thus, in order to
establish SDGs data strategy, it is effective to operate
the domestic tier system with UN tier system.
The Statistics Research Institute at KOSTAT classified
232 indicators into three tiers of A, B, and C, based on the
availability of data and the provision of data to the IOs,
that is, whether Korean data was included in the global
DB. If domestic statistics are produced and provided to
IOs, they are classified as A. The cases where there are
proxy statistics in the ROK and where it is necessary to
develop new statistics for the indicator definition were
classified as B and C, respectively. A was subdivided
again into A1 if the statistics fully meet the definition
of the indicator according to the extent to which they
meet international standards and A2 if only part of the
indicator definitions is met. On the other hand, if A, B,
and C are quantitative indicators, qualitative indicators
related to the presence or absence of laws, institutions
and policies at the individual level or policy monitoring
at the global level were classified separately as D.
Chapter 5
Standard of classification Result
A. Provide data to IOs because there are relevant statistics
71
A 1. If fully meeting the indicator definition 59
A 2. If partially meeting the indicator definition 12
B. Proxy indicators in the ROK 25
C. Need to develop statistics and indicators 82
D. Qualitative indicators 54
SDG Indicators Classification System Tailored in the ROK
This classification system shows that many of the
indicators need to be improved and developed at present.
During the data verification process, it was found that
even A1 has plenty of room for improvement. In the
process of verifying the source and figures of Korean
data contained in the global DB, some issues are raised.
Although data meeting the definition of indicators were
provided, there were cases where the figures used in

60 • Sustainable Development Goals in the Republic of Korea: Progress Report 2019
IOs differed from those in the ROK, and the quality of
the data provided was not controlled in some cases.
If this occurs repeatedly in several cases, not just one,
we will have to approach it as a structural problem.
Therefore, this chapter summarized the major issues
derived from the data verification process, and then
classified the issues into methodology development,
data collection, and quality control procedure to derive
the SDGs data responsive strategies. We also reviewed
the specific means required for the certain procedures.
2. Data Verification Procedure and Key Findings
Verification procedure
For data verification, 232 SDG indicators were
reclassified according to subjects since SDGs are
interconnected between goals and it is an efficient
way to review similar subjects simultaneously.17 Data
verification was conducted with various stakeholders
including relevant ministries, academia and research
institutes, civic groups, and IOs in the ROK. When the
stakeholders overlap or when it is judged to be efficient
to consult together, the working group was integrated.
For example, the gender equality indicator group
meeting and the criminal indicator group meeting
were conducted at the same time, because there are
common indicators related to sexual violence. The
nutrition indicator and the health indicator working
group were also operated together. The working group
was operated from February to June 2018.
The logistic is shown in the following figure. Based
on the SDGs indicator metadata, the group reviewed
the concept, definition, and calculation method of
indicators, identified the Korean data sources and
figures in the global DB, and checked their consistency
with the relevant domestic statistics. If there is a
difference in comparison with domestic statistics, we
tracked the causes. We also examined whether there
are better domestic statistics that fit the concept of
indicators in addition to Korean data in the global DB.
In this process, we excluded the Tier 3 indicator, which
methodology is still developed, and the indicators that
metadata has not been prepared from the verification
targets.
17 Economy, Employment, Tourism, Education, Transportation, International Relations, Homeland, Climate Change, Agriculture, Atmosphere, Trade, Cultural Property, Water and Hygiene, Health, Welfare, Crime, Social Integration, Forests, Biodiversity, Gender Equality, Energy, Resources, Disaster, Justice, Policy, Statistics, Waste, Ocean, IT, ODA, R&D (in alphabetical order). The list of participating institutions and participants in the indicator council is provided in the Appendix
Verification of Korean data consistency in
global DB
Problem diagnosis and
identification of improvement
area
Checks for implementation
means
Steps for Deriving SDGs Data Strategy
SDGs Data Verification Procedure
Check proxy indicator
Not subject to verification
Whether to update SDGs
metadata
Whether to contain Korean
data in the global DB
Comparison with domestic
statistics
Verification results
Identify causes of
discrepancies, Check proxy
indicator
No
Identify sources and
matches
No
NoYes
Key findings
It is the utmost role of the NSO to produce reliable data
and to provide this data to IOs. However, the following
points found during the data verification process raise
concerns about the reliability of the Korean data of the
global DB.
First, some Korean data in the global DB are not
approved official statistics by KOSTAT. IOs obtain
their data through various channels. They acquire
data by downloading from the NSO’s website as
well as by making requests to the statistics agency
directly. Surprisingly, it was found that in some cases
they also receive data from third parties (individuals
or institutions), not from statistical agencies, or cite
statistics in research papers. In the process, most are

Chapter 5. Strategies to Reduce the SDGs Data Gap • 61
approved statistics, and some are not. The examples
include unapproved statistics created by a statistics
agency, statistics created by the private sector and re-
citation of Korean data used by other IOs. Why is this a
problem?
KOSTAT only ensures the data reliability for approved
statistics by systematically managing quality18.
However, there is no official quality assurance plan for
data from other sources, so the quality may depend on
the capacity of the institution producing the data.
Second, the data of the global DB were compared
with the domestic data, which is source of global data.
As a result, the figures matched in some cases, but did
not match in other cases. It happened that same data
were used under indicators using different definitions
of global and national data. So, if we do not examine
the data carefully, false comparisons can be made
due to different standards. Even though individual
countries have developed domestic classification
systems according to the international classification
system, the classification codes do not match perfectly.
For example, in international classification systems
such as occupations, industries, crimes, etc., it is
sometimes difficult to calculate according to the SDG
metadata because of differences in classification.
The percentage of female managers (indicator 5.5.2)
is defined as the percentage of women employed in
middle and senior management and it is calculated
according to the International Standard Classification
of Occupations (ISCO).19 However, this classification
system is not exactly consistent with the Korean
Standard Classification of Occupations (KSCO).
Therefore, it is necessary to be aware of the differences
when comparing data.
Third, many cases of data mismatch were found. In
the case of the suicide mortality rate (Indicator 3.4.2),
18 The Statistics Act requires that statistics agencies obtain approval from KOSTAT before they try to produce new statistics. KOSTAT determines whether to produce statistics by examining similar duplication, lack of reliability, and profit purposes. This is called approved statistics, which are subject to regular and irregular quality control. KOSTAT conducts periodic diagnosis every five years for the approved statistics. The agency should also carry out annual self-diagnosis, and occasionally quality diagnosis is conducted if the quality diagnosis obligation is not fulfilled or if quality deterioration is suspected. The six criteria considered in quality control are relevance, accuracy, timeliness, comparability, consistency and accessibility
19 The formula according to the global indicator definition is as follows: [(Female Population ISCO08 Classification 1-ISCO08 Classification 14) / (All Population ISCO08 Classification 1-ISCO08 Classification 14)] × 100 or [(Female Population ISCO88 Classification 1-ISCO88 Classification 13) / (All Population ISCO88 Classification 1-ISCO88 Classification 13)] × 100
both KOSTAT and the WHO follow the same definition,
which is number of deaths per 100,000 population, but
the calculated figures are different. The main reason
Population size in the ROK: which population data should we use?
Based on the type of statistics used, the population of Ko-rea is divided into the census population, the estimated population and the resident registration population. Each population differs in the scope, the baseline, and the cycle, so it is necessary to use a population suitable for the pur-pose of use (KOSTAT, 2015).
The Census Population is for all Koreans and foreigners residing in Korea as of 0:00, November 1st. Until 2010, the enumerator visited the site and conducted interviewing, but since 2015, the resident registration population data has been supplemented based on the concept of the resi-dent population to create an annual population. In the case of Koreans, overseas residents and delayed death notices are excluded from and delayed birth registrations are added to the resident registration population. Foreigners are calculated by supplementing with immigration data based on alien registration data, reports of foreign national residence, and short-term illegal alien data. The census population is used as a basis for policymaking and evalua-tion because it has a lot of information on the structure and characteristics as well as the size of the population.
Like the census population, the estimated population is for the population residing in the ROK. However, it is esti-mated on July 1 every year to reflect population variability factors (birth, death, and international population move-ment). It is divided into population estimates for the past population and population projections that are created in consideration of future population changes. It is a correc-tion for the missing population in the census and is used to indicate the scale and structure of Korea's population. The resident registration population is for those who are reported in the resident registration place as of the end of each month. That is, it includes registered nationals and foreign nationals, but excludes an individual deleted from the public registration, otherwise known as de-registration population.
The resident registration population is counted monthly, and the mid-year population representing the year is used to calculate a rate that represents the number of occurrenc-es per population, such as birth rate and death rate. The mid-year population is the population as of July 1st, which is the middle of the year and is calculated by calculating an arithmetic mean of the resident registration population as of December 31 of the previous year and the resident regis-tration population as of December 31 of the year.
62 • Sustainable Development Goals in the Republic of Korea: Progress Report 2019
for the inconsistency is that IOs apply adjustment,
estimation and modeling methods for international
comparability. In the adjustment process, data collected
on international standards, rather than on domestic
raw data, are often used for denominator statistics.
IOs prioritize comparisons between different countries
according to the same standard.
The estimated Korean population of the UN
Population Division (UNPD) is a prime example, which
is different from the population calculated in the ROK
(see box). UNPD provides data on age and gender
population, fertility, mortality and migration from 1950
to 2100 through the World Population Prospects for
223 countries. 12 of the 17 SDGs targets use UNPD
population. Among the indicators of the goals, the
number of indicators using the UNPD population
exceeds 50% in Goal 3 (19, 79%), Goal 4 (9, 100%),
and Goal 5 (7, 58%) (IAEG-SDGs, 2018d). In the case of
GDP as a comparison of the economic unit as well as
population, GDP based on Purchasing Power Parities
(PPP) is used in the process of adjusting by IOs. In
the case of land and marine areas, differences were
found between the areas measured in each country
and those of global standards. Especially in the case of
the Exclusive Economic Zone (EEZ), it is also linked to
political issues.
In addition to these causes, the numerical difference
was caused by the difference in the data update
cycle. An example of this could be the proportion of
women in managerial positions. Its source is from
the Economically Active Population Survey data and
it is regularly provided to the International Labour
Organization (ILO). After data provision from KOSTAT to
ILO, the past time series data (2000-2017) were adjusted
as the five-year cycle of Population and Housing Census
changed into Register-Based Census and the results
were released. However, adjustment of result was not
immediately reflected on ILO’s data base.
Fourth, although data is not currently presented
to the global DB, there was domestic data that met
the concept of SDGs in some cases. For example, the
percentage of people who feel safe when walking alone
in an area where they live (indicator 16.1.4) is not yet
available in the DB, but it can be provided as the fear
of crime statistics currently measured by the National
Criminal Victimization Survey. Only, there is a need for
improvement because fear of crime statistics does not
fully meet the SDGs indicators’ criteria.
The issues found so far through data verification
are summarized as follows: Whether the data source
is official or not, Whether the concept of indicator is
the same or different between national and global, the
reason for data discrepancies, and possible domestic
proxy indicators. In the next chapter, we will examine
how these issues can be addressed in the process of
data collection and management.
3. Type of Data Gap
1) Indicator requiring methodology development
• Indicators under methodology development at a
global level
The inclusion of Tier 3 indicators that the methodology
has not yet been developed is a feature that
distinguishes the SDG indicators framework from
others. It reflects the ambition of the SDGs. There are 62
indicators under Tier 3 as of October 2018. Goal 5 and 6
have no Tier 3 indicators, while Goal 12, 13, and 14 have
more than 50% of the indicators in Tier 3. These goals
are categorized as environmental areas, indicating that
overall development of environmental indicators is
lagging. Monitoring sustainable development of the
environmental sector is inevitable. Statistical capacity
and investment are needed in this field
In the list of Tier 3 indicators, the following
characteristics can be found: First, the concept definition
of 'sustainability' is not clear yet. Although the term
sustainability is used in many fields, the measurement
is still ambiguous. Some examples of this are: Indicator
2.4.1 (proportion of agricultural area under productive
and sustainable agriculture), indicator 3.5.1 (coverage of
treatment interventions (pharmacological, psychosocial
and rehabilitation and aftercare services) for substance
use disorders), indicator 4.7.1 (extent to which (i) global
citizenship education and (ii) education for sustainable
development, including gender equality and human

Chapter 5. Strategies to Reduce the SDGs Data Gap • 63
20 The national ODA head and coordinating body is the International Development Cooperation Committee. The Framework Act on International Development Cooperation stipulates the submission of ODA statistics to an institution designated by the committee, and the Korea Export-Import Bank Foreign Economic Cooperation Fund plays the role. In accordance with the related laws, ODA statistics are reported from domestic aid agencies, and the reports are reviewed, modified, collected and finally reported to the OECD.
track in health, learning and psychosocial wellbeing, by
sex), indicator 16.6.2 (proportion of population satisfied
with their last experience of public services), indicator
16.7.2 (proportion of population who believe decision-
making is inclusive and responsive, by sex, age,
disability and population group), and indicator 16.b.1
(proportion of population reporting having personally
felt discriminated against or harassed in the previous 12
months on the basis of discrimination prohibited under
international human rights law).
The IOs are a developing methodology, but it
is not just the role of IOs. NSO can participate in the
entire process, from concept definition through pilot
testing. It reflects the national context in methodology.
The indicator is not the standalone product. KOSTAT
has participated in the methodology development
of indicator 16.6.2 (proportion of population satisfied
with their last experience of public services) and
indicator 16.7.2 (proportion of population who believe
decision-making is inclusive and responsive, by sex,
age, disability and population group), which are the
indicators under UN Development Programme (UNDP).
• Indicators that require methodological consensus
Although the methodologies have been confirmed at the
global level, there are some cases where adjustments
to concepts with domestic contexts are inevitable.
First, there are indicators requiring country-specific
definitions in the indicators themselves. For example,
Indicator 1.2.1 (proportion of population living below
the national poverty line, by sex and age) and indicator
1.2.2 (proportion of men, women and children of all
ages living in poverty in all its dimensions according
to national definitions require the criterion of poverty
line, i.e. the definition of multidimensional poverty at
the individual country level).
Recently, developed countries have used the median
income instead of average income as a poverty line.
The ROK also applies a relative poverty line to its
Percentage of Tier 3 Indicators(Unit: %)
Goal 1
Goal 2
Goal 3
Goal 4
Goal 5
Goal 6
Goal 7
Goal 8
Goal 9
Goal 10
Goal 11
Goal 12
Goal 13
Goal 14
Goal 15
Goal 16
Goal 17
total 24.2
28.0
30.4
7.1
21.4
7.7
18.2
16.7
23.5
8.3
45.5
69.2
62.5
40.0
50.5
rights, are mainstreamed at all levels in (a) national
education policies; (b) curricula; (c) teacher education;
and (d) student assessment), indicator 8.9.2 (proportion
of jobs in sustainable tourism industries out of total
tourism jobs), indicator 12.a.1 (amount of support for
developing countries on research and development
for sustainable consumption and production and
environmentally sound technologies) and indicator
14.7.1 (Sustainable fisheries as a proportion of GDP in
small island developing states, in the least developed
countries and in all countries).
Second, regarding ODA related indicators,20 Other
Official Flows (OOFs) beyond traditional sources and the
concept of ODA for the environment and sustainability
(indicator 12.a.1, indicator 17.7.1) are emerging issues.
Therefore, there is a need for a consensus on how to
improve the code of the current Creditor Reporting
System (CRS) field.
Third, there are many indicators that measure
subjective status: indicator 4.2.1 (proportion of children
under five years of age who are developmentally on

64 • Sustainable Development Goals in the Republic of Korea: Progress Report 2019
List of Indicators (tier 3) under Methodology Development at the Global Level
1.a.1 Proportion of domestically generated resources allocated by the government directly to poverty reduction pro-grammes
1.a.3 Sum of total grants and non-debtcreating inflows directly allocated to poverty reduction programmes as a propor-tion of GDP
1.b.1 Proportion of government recurrent and capital spending to sectors that disproportionately benefit women, the poor and vulnerable groups
2.4.1 Proportion of agricultural area under productive and sus-tainable agriculture 3.5.1 Coverage of treatment interven-tions (pharmacological, psychosocial and rehabilitation and aftercare services) for substance use disorders
3.5.1 Coverage of treatment interventions (pharmacological, psychosocial and rehabilitation and aftercare services) for substance use disorders
3.b.3 Proportion of health facilities that have a core set of rel-evant essential medicines available and affordable on a sustainable basis
4.2.1 Proportion of children under 5 years of age who are devel-opmentally on track in health, learning and psychosocial wellbeing, by sex
4.7.1 Extent to which (i) global citizenship education and (ii) education for sustainable development, including gender equality and human rights, are mainstreamed at all levels in (a) national education policies; (b) curricula; (c) teacher education; and (d) student assessment
7.b.1 Investments in energy efficiency as a proportion of GDP and the amount of foreign direct investment in financial transfer for infrastructure and technology to sustainable development services
8.4.1 Material footprint, material footprint per capita, and mate-rial footprint per GDP
8.8.2 Level of national compliance with labour rights (freedom of association and collective bargaining) based on Inter-national Labour Organization (ILO) textual sources and national legislation, by sex and migrant status
8.9.2 Proportion of jobs in sustainable tourism industries out of total tourism jobs
9.1.1 Proportion of the rural population who live within 2 km of an all-season road
10.3.1 Proportion of population reporting having personally felt discriminated against or harassed in the previous 12 months on the basis of a ground of discrimination prohib-ited under international human rights law
10.5.1 Financial Soundness Indicators
10.7.1 Recruitment cost borne by employee as a proportion of monthly income earned in country of destination
11.3.2 Proportion of cities with a direct participation structure of civil society in urban planning and management that oper-ate regularly and democratically
11.4.1 Total expenditure (public and private) per capita spent on the preservation, protection and conservation of all cultur-al and natural heritage, by type of heritage (cultural, nat-ural, mixed and World Heritage Centre designation), level of government (national, regional and local/municipal), type of expenditure (operating expenditure/investment) and type of private funding (donations in kind, private non-profit sector and sponsorship)
11.7.1 Average share of the built-up area of cities that is open space for public use for all, by sex, age and persons with disabilities
11.7.2 Proportion of persons victim of physical or sexual harass-ment, by sex, age, disability status and place of occur-rence, in the previous 12 months
11.a.1 Proportion of population living in cities that implement urban and regional development plans integrating popu-lation projections and resource needs, by size of city
11.c.1 Proportion of financial support to the least developed countries that is allocated to the construction and retrofit-ting of sustainable, resilient and resource-efficient build-ings utilizing local materials
12.3.1 (a) Food loss index and (b) food wastes index
12.4.2 Hazardous wastes generated per capita and proportion of hazardous wastes treated, by type of treatment
12.5.1 National recycling rate, tons of material recycled
12.8.1 Extent to which (i) global citizenship education and (ii) education for sustainable development (including climate change education) are mainstreamed in (a) national edu-cation policies; (b) curricula; (c) teacher education; and (d) student assessment
12.a.1 Amount of support to developing countries on research and development for sustainable consumption and pro-duction and environmentally sound technologies
14.1.1 Index of coastal eutrophication and floating plastic debris density
14.2.1 Proportion of national exclusive economic zones managed using ecosystembased approaches
14.3.1 Average marine acidity (pH) measured at agreed suite of representative sampling stations
14.7.1 Sustainable fisheries as a proportion of GDP in small is-land developing States, least developed countries and all countries
16.1.2 Conflict-related deaths per 100,000 population, by sex, age and cause
16.4.1 Total value of inward and outward illicit financial flows (in current United States dollars)
16.4.2 Proportion of seized, found or surrendered arms whose illicit origin or context has been traced or established by a competent authority in line with international instruments
16.6.2 Proportion of population satisfied with their last experi-ence of public services
16.7.1 Proportions of positions in national and local public insti-tutions, including (a) the legislatures; (b) the public ser-vice; and (c) the judiciary, compared to national distribu-tions, by sex, age, persons with disabilities and population groups
16.7.2 Proportion of population who believe decision-making is inclusive and responsive, by sex, age, disability and popu-lation group
16.b.1 Proportion of population reporting having personally felt discriminated against or harassed in the previous 12 months on the basis of a ground of discrimination prohib-ited under international human rights law
17.7.1 Total amount of approved funding for developing coun-tries to promote the development, transfer, dissemination and diffusion of environmentally sound technologies
17.13.1 Macroeconomic Dashboard
17.17.1 Amount of United States dollars committed to (a) pub-lic-private partnerships and (b) civil society partnerships
17.18.1 Proportion of sustainable development indicators pro-duced at the national level with full disaggregation when relevant to the target, in accordance with the Fundamental Principles of Official Statistics
Note: Among the indicators in Tier 3, qualitative indicators that measure the presence of institutions, policies and strategies are excluded. On the other hand, the methodology development of the Tier 3 indicators has been com-pleted as of December 31, 2018 and indicators for which Tier upgrade are approved by IAEG-SDGs (2.4.1 / 3.b.3 / 8.8.2 / 9.1.1 / 10.5. 1 / 10.7.1 / 11.3.2 / 11.7.1 / 14.3.1 / 17.13.1) are included

Chapter 5. Strategies to Reduce the SDGs Data Gap • 65
Methodology development process of the indicator of percentage of population who think decision making is inclusive and responsive
Organization responsible for indicatorsUNDP
Main scheduleAfter completion of methodology development by October 2018, results will be submitted to the 9th IAEG-SDGs meeting in March 2019
Indicator Methodology Development ProcessDevelop under the direction of the Praia city group, which is building international methodology guidelines for the produc-tion of governance statistics, in collaboration with the NSO and international research experts
① Preliminary frame building through expert meetings (April 2017): Review of existing survey questions with a long tra-dition internationally (e.g. Afrobarometer and World Value Survey)
② Test surveys conducted in 33 countries (NSO) to measure the inclusiveness and responsiveness of the decision-mak-ing process: Investigate fairness, government inclusivity and responsiveness, and public participation in elections
③ 1st Expert Group Meeting (May 2017): Three key aspects to be considered in the indicators are emphasized. First, it should mean decision making at the formal institutional lev-el, not at the informal level. Second, it should be evaluated in terms of policy viability. Third, it should be empirically correlated with 16.7 targets
④ Elaboration of the conceptual framework by examining survey questions used in 10 countries (NSO) and 11 African countries
⑤ 2nd Expert Group Meeting (October 2017): Discussion of similarities with theoretically well-established political efficacy indicators in the field of political science since the 1950s. Through this, it is comprised of questions about the individual's participation ability (inclusiveness) and the pol-icy maker's response (responsiveness) in the decision-mak-ing process
⑥ Revision of European Social Survey (ESS), UNDP’s survey items (January-June 2018): In this process, participants agreed that political efficacy should be measured with in-ternal efficacy (subjective confidence) and external efficacy (systemic response) and selected related items
⑦ Collaboration with expert groups to measure social desir-ability errors: Suggestions for items directly measuring political efficacy and experiment method of indirectly mea-suring it
⑧ Pilot testing of 11 countries' NSO (July - October 2018) and World Value Survey: Participation of Korea
⑨ Final modification of methodology (September - October 2018)
Participating organizationsQuestionnaire of NSO (including KOSTAT), regional level Afrobarometer, Asian / Arab / Latino barometer and review of ESS. Review of OECD How ’s life? and PIAAC, EU-SILC, other international governance experts
customized payment system, which has been in effect
since July 2015 (Social Security Committee, 2018). Multi-
dimensional poverty indicators are still underway at the
research level in the ROK. It is still difficult to combine
and consider various areas to set a poverty indicator
and even more so to come to a consensus about the
selection of the main areas on which to base research.
(Kim Mun-gil et al., 2017).
Second, methodology consensus between IOs and
the domestic is needed if the country data are adjusted
and estimated by IOs. Among the Korean data in the
global DB, 25 indicators are estimates of country data
and four indicators were modeled.
In the case of indicator 3.8.2 (percentage of
population with health experience overburden relative
to total household spending and income), IOs have used
the Household and Income and Expenditure Survey
to estimate the data. However, in the ROK, data from
surveys such as the Korea Welfare Panel Survey and the
Korea Health Panel Survey are reviewed simultaneously
(Shin Hyung-woong et al., 2010). In addition, in the
case of indicator 8.3.1 (informal employment rate in
the non-agricultural sector), although the definition
of informal employment is clear, the agreement
is needed because a variety of methods exist in
calculating informal employment rates for certain types
of production units, such as self-employed persons.
Indicator 14.2.1 (percentage of Exclusive Economic
Zones (EEZ) managed by ecosystem-based approach)
needs to be discussed again between countries after
the development of methodologies by IOs because the
area of EEZ claimed by each country differs according
to the interests of each country. In fact, there are cases
where no data has been provided because domestic
agreement has not been reached on methodologies
proposed by IOs. Although this was the case before the
SDG indicators framework was built. It is worth noting
that the indicator is also within the current framework.
An example of this is indicator 8.6.1 (proportion of
youth (aged 15–24 years) not in education, employment
or training), known as Not in Education, Employment
or Training (NEET). The OECD requested for the agency
to provide the data, but KOSTAT did not agree with the
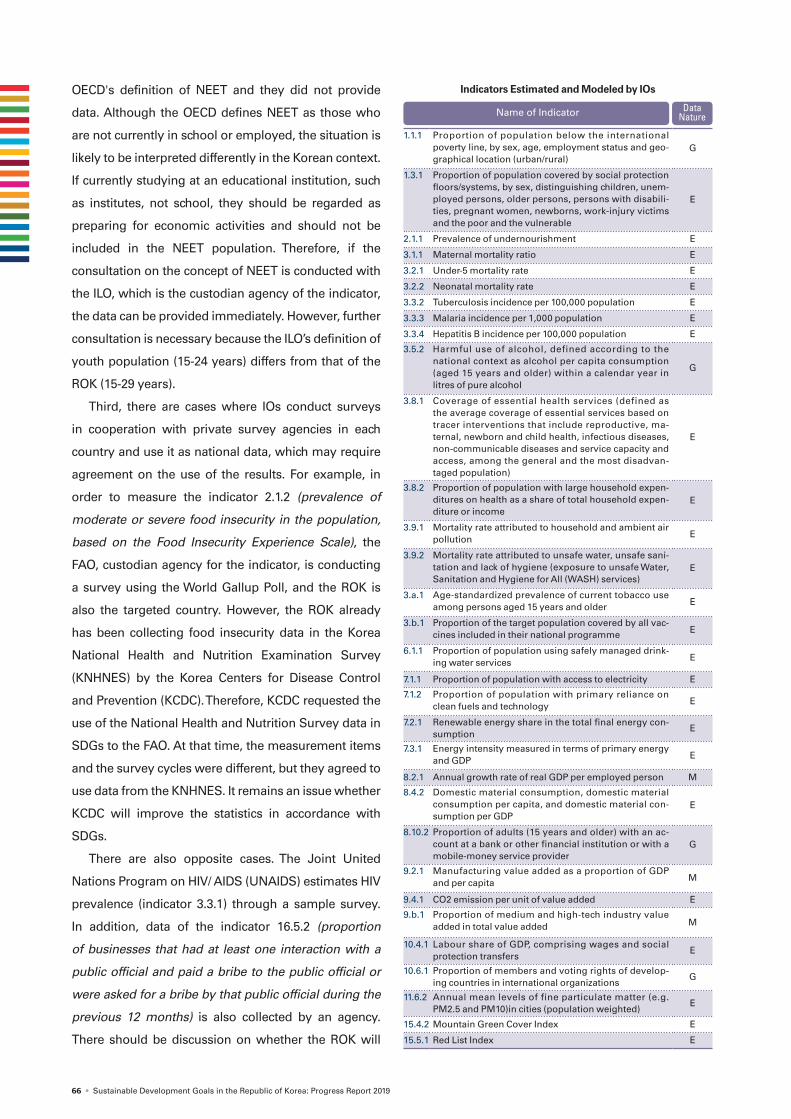
66 • Sustainable Development Goals in the Republic of Korea: Progress Report 2019
OECD's definition of NEET and they did not provide
data. Although the OECD defines NEET as those who
are not currently in school or employed, the situation is
likely to be interpreted differently in the Korean context.
If currently studying at an educational institution, such
as institutes, not school, they should be regarded as
preparing for economic activities and should not be
included in the NEET population. Therefore, if the
consultation on the concept of NEET is conducted with
the ILO, which is the custodian agency of the indicator,
the data can be provided immediately. However, further
consultation is necessary because the ILO’s definition of
youth population (15-24 years) differs from that of the
ROK (15-29 years).
Third, there are cases where IOs conduct surveys
in cooperation with private survey agencies in each
country and use it as national data, which may require
agreement on the use of the results. For example, in
order to measure the indicator 2.1.2 (prevalence of
moderate or severe food insecurity in the population,
based on the Food Insecurity Experience Scale), the
FAO, custodian agency for the indicator, is conducting
a survey using the World Gallup Poll, and the ROK is
also the targeted country. However, the ROK already
has been collecting food insecurity data in the Korea
National Health and Nutrition Examination Survey
(KNHNES) by the Korea Centers for Disease Control
and Prevention (KCDC). Therefore, KCDC requested the
use of the National Health and Nutrition Survey data in
SDGs to the FAO. At that time, the measurement items
and the survey cycles were different, but they agreed to
use data from the KNHNES. It remains an issue whether
KCDC will improve the statistics in accordance with
SDGs.
There are also opposite cases. The Joint United
Nations Program on HIV/ AIDS (UNAIDS) estimates HIV
prevalence (indicator 3.3.1) through a sample survey.
In addition, data of the indicator 16.5.2 (proportion
of businesses that had at least one interaction with a
public official and paid a bribe to the public official or
were asked for a bribe by that public official during the
previous 12 months) is also collected by an agency.
There should be discussion on whether the ROK will
Name of Indicator Data Nature
1.1.1 Proportion of population below the international poverty line, by sex, age, employment status and geo-graphical location (urban/rural)
G
1.3.1 Proportion of population covered by social protection floors/systems, by sex, distinguishing children, unem-ployed persons, older persons, persons with disabili-ties, pregnant women, newborns, work-injury victims and the poor and the vulnerable
E
2.1.1 Prevalence of undernourishment E
3.1.1 Maternal mortality ratio E
3.2.1 Under-5 mortality rate E
3.2.2 Neonatal mortality rate E
3.3.2 Tuberculosis incidence per 100,000 population E
3.3.3 Malaria incidence per 1,000 population E
3.3.4 Hepatitis B incidence per 100,000 population E
3.5.2 Harmful use of alcohol, defined according to the national context as alcohol per capita consumption (aged 15 years and older) within a calendar year in litres of pure alcohol
G
3.8.1 Coverage of essential health services (defined as the average coverage of essential services based on tracer interventions that include reproductive, ma-ternal, newborn and child health, infectious diseases, non-communicable diseases and service capacity and access, among the general and the most disadvan-taged population)
E
3.8.2 Proportion of population with large household expen-ditures on health as a share of total household expen-diture or income
E
3.9.1 Mortality rate attributed to household and ambient air pollution E
3.9.2 Mortality rate attributed to unsafe water, unsafe sani-tation and lack of hygiene (exposure to unsafe Water, Sanitation and Hygiene for All (WASH) services)
E
3.a.1 Age-standardized prevalence of current tobacco use among persons aged 15 years and older E
3.b.1 Proportion of the target population covered by all vac-cines included in their national programme E
6.1.1 Proportion of population using safely managed drink-ing water services E
7.1.1 Proportion of population with access to electricity E
7.1.2 Proportion of population with primary reliance on clean fuels and technology E
7.2.1 Renewable energy share in the total final energy con-sumption
E
7.3.1 Energy intensity measured in terms of primary energy and GDP E
8.2.1 Annual growth rate of real GDP per employed person M
8.4.2 Domestic material consumption, domestic material consumption per capita, and domestic material con-sumption per GDP
E
8.10.2 Proportion of adults (15 years and older) with an ac-count at a bank or other financial institution or with a mobile-money service provider
G
9.2.1 Manufacturing value added as a proportion of GDP and per capita M
9.4.1 CO2 emission per unit of value added E
9.b.1 Proportion of medium and high-tech industry value added in total value added M
10.4.1 Labour share of GDP, comprising wages and social protection transfers
E
10.6.1 Proportion of members and voting rights of develop-ing countries in international organizations
G
11.6.2 Annual mean levels of fine particulate matter (e.g. PM2.5 and PM10)in cities (population weighted)
E
15.4.2 Mountain Green Cover Index E
15.5.1 Red List Index E
Indicators Estimated and Modeled by IOs

Chapter 5. Strategies to Reduce the SDGs Data Gap • 67
participate in the survey, and if not, consultation is
needed on how to provide relevant data.
Fourth, due to the changes in social environments,
the indicator needs to be included in the national
indicator’s framework. These are typical examples;
Indicator 3.7.2 (adolescent birth rate (aged 10–14 years;
aged 15–19 years) per 1,000 women in that age group),
indicator 5.3.2 (proportion of girls and women aged 15–
49 years who have undergone female genital mutilation/
cutting(FGM/C)), indicator 8.7.1 (proportion and number
of children aged 5–17 years engaged in child labour).
The statistics were not produced because there was little
FGM/C practice in the ROK. As international migration
has increased, there are people who have experienced
FGM/C. In addition, children’s economic activity in the
entertainment sector has increased recently in the ROK.
In the case of indicator 3.3.5 (number of people requiring
interventions against neglected tropical diseases (NTD),
items under the disease that require treatment for NTD
defined by the WHO are often not necessarily measured
in the ROK. Therefore, the KCDC suggests an alternative
as the number of infected people from abroad.21
2) Indicator groups that need to improve
existing statistics
In order to produce data that meets the concept and
methods of the SDG indicators, it is necessary to
improve the existing statistics.
First, among the provided data, the definition is
only partially satisfied in the current statistics system in
the ROK. In the case of indicator 8.8.1 (frequency rates
of fatal and non-fatal injuries), only fatal injuries data
are provided in spite of the fact that the SDGs require
both fatal and non-fatal occupational injuries. Data
from Labour’s Statistics of Industrial Accident, which
measures only fatal injuries, is provided by the Ministry
of Employment. Indicator 2.5.1 (number of plant and
animal genetic resources for food and agriculture
secured in either medium- or long-term conservation
facilities), statistics on plant genetic resources are
lacking. Disaster-related indicators also need to be
further improved. For the Indicator 1.5.1 (number of
deaths, missing persons and directly affected persons
attributed to disasters per 100,000 population),
statistics on populations directly affected are
insufficient. Regarding indicator 1.5.2 (direct economic
loss attributed to disasters in relation to global gross
GDP) and indicator 11.5.2 (direct economic loss in
relation to global GDP, damage to critical infrastructure
and number of disruptions to basic services, attributed
21 It was raised at the meeting of Gender Equality and Crime Indicators working group (March 28, 2018) and the Nutrition and Health Indicators working group (May 14, 2018)
The Indicator Partially Covered by Existing Statistics
1.3.1 Proportion of population covered by social protection floors/systems, by sex, distinguishing children, unemployed per-sons, older persons, persons with disabilities, pregnant women, newborns, work-injury victims and the poor and the vulnerable
1.5.1 Number of deaths, missing persons and directly affected per-sons attributed to disasters per 100,000 population
1.5.2 Direct economic loss attributed to disasters in relation to global gross domestic product (GDP)
2.5.1 Number of plant and animal genetic resources for food and agriculture secured in either medium- or long-term conserva-tion facilities
3.3.5 Number of people requiring interventions against neglected tropical diseases
3.7.2 Adolescent birth rate (aged 10–14 years; aged 15–19 years) per 1,000 women in that age group
4.1.1 Proportion of children and young people (a) in grades 2/3; (b) at the end of primary; and (c) at the end of lower secondary achieving at least a minimum proficiency level in (i) reading and (ii) mathematics, by sex
4.3.1 Participation rate of youth and adults in formal and non-for-mal education and training in the previous 12 months, by sex
4.4.1 Proportion of youth and adults with information and commu-nications technology (ICT) skills, by type of skill
4.5.1 Parity indices (female/male, rural/urban, bottom/top wealth quintile and others such as disability status, indigenous peo-ples and conflict-affected, as data become available) for all education indicators on this list that can be disaggregated
5.5.1 Proportion of seats held by women in (a) national parlia-ments and (b) local governments
8.5.1 Average hourly earnings of female and male employees, by occupation, age and persons with disabilities
8.5.2 Unemployment rate, by sex, age and persons with disabili-ties
8.8.1 Frequency rates of fatal and non-fatal occupational injuries, by sex and migrant status
11.5.2 Direct economic loss in relation to global GDP, damage to critical infrastructure and number of disruptions to basic ser-vices, attributed to disasters
17.2.1 Net official development assistance, total and to least devel-oped countries, as a proportion of the Organization for Eco-nomic Cooperation and Development (OECD) Development Assistance Committee donors’ gross national income (GNI)

68 • Sustainable Development Goals in the Republic of Korea: Progress Report 2019
to disasters), statistics on economic losses such as
agriculture and cultural heritage are lacking and it is
especially not difficult to convert financially. For these
indicators, the existing statistics need to be improved
to fully meet the definition.
Second, data disaggregation is also a driving force
for the improvement of the current statistical system.
In particular, data disaggregation by migration status
and disability is challenging.22 : Indicator 8.5.1 (average
hourly earnings of female and male employees, by
22 With regard to data segmentation, IAEG-SDGs define dimensions and categories as follows: Dimensions refer to the characteristics of the data segmented, such as gender and age, and categories are different attributes under certain segmentation dimensions, with the category of men and women for gender (IAEG-SDGs, 2017).
occupation, age and persons with disabilities), indicator
8.5.2 (unemployment rate, by sex, age and persons
with disabilities), indicator 8.8.1 (frequency rates of fatal
and non-fatal occupational injuries, by sex and migrant
status), and indicator 10.2.1 (proportion of people living
below 50 per cent of median income, by sex, age and
persons with disabilities).
For disaggregation by disability and migration status,
agreement on definition and category on the relevant
items must be preceded. Expert Group on Migration
Statistics is under discussion of migration concept,
while the Washington Group has developed disability
survey items for use in census and sample surveys (see
the box). However, the disabled and migrant groups are
one of the hardest to survey groups. In-depth studies on
sampling, data collection, and estimation are needed to
capture these groups in the survey (Park Youngshil et
al., 2016).
Third, among the indicators, there are statistics that
can be provided immediately through some revisions.
For the indicator 5.3.1 (proportion of women aged 20–24
years who were married or in a union before age 15 and
before age 18), it could be explained by the Population
and Housing Census when asked about the age of
first marriage including living-together. For example,
indicator 3.7.1 (proportion of women of reproductive
age (aged 15–49 years) who have their need for family
planning satisfied with modern methods (indicator
3.7.1) and indicator 5.6.1 (proportion of women aged
15–49 years who make their own informed decisions
regarding sexual relations, contraceptive use and
reproductive health care). These two indicators could be
produced by supplementing the items in the National
Fertility and Family Health and Welfare Survey.
Indicators related to criminal victimization and fear
of crime can also be provided by the Korean Institute
of Criminology’s National Criminal Victimization Survey
which is highly comparable internationally. However,
some items may not be collected with international
standards.
Disability Measurement and Monitoring using the Washington Group Disability Questions
Data disaggregation by disability requires a clear defini-
tion of disability. Disability is a relative concept that may
vary depending on who a society defines as a person
with a disability. In other words, the concept of disability
depends on the socioeconomic level and cultural expecta-
tion of the individual society and may also be changed by
the environment. For this reason, the definition of disabil-
ity differs from country to country, making international
comparison of disability statistics very difficult.
UNSC established the Washington Group on Disability
Statistics in 2001, an international expert group, to facili-
tate cross-border comparison of disability measurement
and disability-related data. Based on the classification
system called the International Classification of Function-
ing, Disability and Health (ICF) developed by the WHO, the
Washington Group has developed the Washington Group
Short Set on Functioning, which consists of six questions
for use in a census and a sample survey, and recommends
that this item be used for disaggregation of disability sta-
tus in the SDGs.
The Washington Group selects six areas with restricted
activities due to health problems and asks the extent of
the difficulties. The selected six areas include: ① Do you
have difficulty seeing, even if wearing glasses?, ② Do you
have difficulty hearing, even if using a hearing aid?, ③ Do
you have difficulty walking or climbing steps?, ④ Do you
have difficulty remembering or concentrating?, ⑤ Do you
have difficulty (with self-care such as) washing all over or
dressing?, ⑥ Using your language, do you have difficulty
communicating, for example understanding or being un-
derstood by others? The response categories include; ‘No,
no difficulty’, ‘Yes, some difficulty’, ‘Yes, a lot of difficulty’,
‘Cannot do it at all’. Finally, disability is determined by re-
sponding a lot of difficulty in at least one of the six areas.
The ROK will include the Washington Group items in the
2020 Census and is currently testing them.

Chapter 5. Strategies to Reduce the SDGs Data Gap • 69
Source of Proxy Indicator in the ROK(both approved and unapproved statistics)
Name of Indicator Source of Proxy indicator in the ROK
1.2.1 Proportion of population living below the national poverty line, by sex and age
KOSTAT Household Trend Survey
1.a.2 Proportion of total government spending on essential services (education, health and social protection)
Ministry of Economy and Finance
National Budgeting Overview
2.1.2 Prevalence of moderate or severe food insecurity in the population, based on the Food Insecurity Experience Scale (FIES)
KCDC Korean National Health and Nutrition Examination Survey
2.3.1 Volume of production per labour unit by classes of farming/pastoral/forestry enterprise size
KOSTAT Farm household economy survey
2.3.2 Average income of small-scale food producers, by sex and indigenous status
KOSTATKorea Forest Service
Farm household economy survey Forest Household Economic Survey
3.3.1 Number of new HIV infections per 1,000 uninfected population, by sex, age and key populations
KCDC HIV REPORTER STATUS
3.7.1 Proportion of women of reproductive age (aged 15–49 years) who have their need for family planning satisfied with modern methods
Korea Institute for Health and Social Affairs
National Birth and Family Health and Welfare Survey
4.b.1 Volume of official development assistance flows for scholarships by sector and type of study
Export-Import Bank of Korea
OECD DAC REPORT
4.c.1 Proportion of teachers in: (a) preprimary; (b) primary; (c) lower secondary; and (d) upper secondary education who have received at least the minimum organized teacher training (e.g. pedagogical training) pre-service or in-service required for teaching at the relevant level in a given country
Korean Educational Development Institute
Korean Education Longitudinal Survey
5.3.1 Proportion of women aged 20–24 years who were married or in a union before age 15 and before age 18
KOSTAT Census
5.6.1 Proportion of women aged 15–49 years who make their own informed decisions regarding sexual relations, contraceptive use and reproductive health care
Korea Institute for Health and Social Affairs
National Birth and Family Health and Welfare Survey
6.3.1 Proportion of wasteswater safely treated Ministry of Environment Industrial Wasteswater Generation and Treatment Status
10.2.1 Proportion of people living below 50 per cent of median income, by sex, age and persons with disabilities
KOSTAT Household Trend Survey
11.1.1 Proportion of urban population living in slums, informal settlements or inadequate housing
Ministry of Land, Infrastructure, and Transport
Housing Survey
11.3.1 Ratio of land consumption rate to population growth rate Korea Land & Housing Corporation
City planning status
11.6.1 Proportion of urban solid wastes regularly collected and with adequate final discharge out of total urban solid wastes generated, by cities
Ministry of Environment National Wastes Generation and Treatment Status
11.7.2 Proportion of persons victim of physical or sexual harassment, by sex, age, disability status and place of occurrence, in the previous 12 months
Korean Institute of Criminology
National Living Safety Survey
12.4.2 Hazardous wastes generated per capita and proportion of hazardous wastes treated, by type of treatment
Ministry of Environment Status of designated wastes generation and treatment
12.5.1 National recycling rate, tons of material recycled Ministry of Environment National Wastes Generation and Treatment Status
14.3.1 Average marine acidity (pH) measured at agreed suite of representative sampling stations
Ministry of Maritime Affairs and Fisheries
Seawater Quality Report
15.4.1 Coverage by protected areas of important sites for mountain biodiversity
Korea National Park Service
Korea Protected Area Integrated Database
15.7.1 Proportion of traded wildlife that was poached or illicitly trafficked National Institute of Biological Resources
Red list status in Korea
16.1.4 Proportion of population that feel safe walking alone around the area they live
Korean Institute of Criminology
National Safety Survey
16.2.2 Number of victims of human trafficking per 100,000 population, by sex, age and form of exploitation
National Police Agency Police Statistics Yearbook
16.3.1 Proportion of victims of violence in the previous 12 months who reported their victimization to competent authorities or other officially recognized conflict resolution mechanisms
National Police Agency Police Statistics Yearbook

70 • Sustainable Development Goals in the Republic of Korea: Progress Report 2019
For example, indicator 16.1.4 (proportion of
population that feel safe walking alone around the area
they live) is recommended to be measured on a four-
point scale (very safe-very unsafe), but in the Korean
Survey, it on a five-point scale. In addition, indicator
16.1.3 (proportion of population subjected to (a) physical
violence, (b) psychological violence and (c) sexual
violence in the previous 12 months) is produced in the
same survey, but for the case of sexual violence, the
standard error is so large that it does not guarantee the
reliability of the statistics. (Choi Soo-hyung·Cho Young-
oh 2017). Indicator 16.2.2 (number of victims of human
trafficking per 100,000 population) and indicator 16.5.1
(proportion of persons who had at least one contact with
a public official and who paid a bribe to a public official,
or were asked for a bribe by those public officials,
during the previous 12 months) can be also calculated
partially through the statistics from the National Police
Agency and Supreme Prosecutors’ Office. There are
also statistics to look at carefully. For the indicator 16.1.1
(Number of victims of intentional homicide per 100,000
population), the ROK currently collects the information
on only representative victim per murder case, which
underestimates the actual number of victims. This part
needs to be improved in the future.
There are a few indicators that can be produced
during administrative processing: Indicator 6.3.1
(proportion of wastewater safely treated), indicator 11.6.1
(proportion of urban solid waste regularly collected and
with adequate final discharge out of total urban solid
waste generated, indicator 12.4.2 (hazardous waste
generated per capita and proportion of hazardous
waste treated, by type of treatment), and indicator 12.5.1
(national recycling rate, tons of material recycled). For
waste-related indicators, Nationwide Waste Generation
and Treatment Status statistics by the Ministry of
Environment can be used to produce indicators on
total waste volume, hazardous waste volume, recycling
volume and rate. For hazardous waste, there are
statistics on the Status of Designated Waste Generation
and Disposal, and the waste is collected in accordance
with relevant laws from administrative data.23
Interagency coordination is another issue. Crime
related indicators are produced by the National Police
Agency, the Supreme Prosecutors' Office, KOSTAT,
and the Korean Institute of Criminology. It should be
decided in advance on which agency will provide data
to IOs. Indicator 16.1.1 (number of victims of intentional
homicide per 100,000 population) is currently provided
with National Police Agency’s statistics, but it should
be noted that there are differences from the numbers
compiled by the Supreme Prosecutors' Office. The
number of those killed is also provided in KOSTAT’s
Death Cause Statistics. Inter-agency coordination should
be established even if the data is not produced yet. For
indicator 12.2.2 (domestic material consumption), the
Ministry of Environment and the Ministry of Commerce,
Industry and Energy are involved, and for indicator 3.9.1
(mortality rate attributed to household and ambient air
pollution), the Ministry of Environment, Ministry of
Health and Welfare, and KOSTAT are related. Therefore,
it should be clarified to establish a system for providing
the data.
3) Indicators necessary for data quality
management
Data quality should be maintained through on-going
management. In this respect, the quality management
system of KOSTAT is essential for the coordination of the
data ecosystem but it targets the government-approved
statistics only. In fact, statistics provided to IOs and
used by IOs include statistics other than government-
approved statistics. The statistics in the global DB are
categorized according to the kind of sources. There
are not only approved statistics but also include many
statistics that are prepared by unapproved statistics
23 However, these statistics are generator based, so the rate is almost 100%. Therefore, it was raised by the Indicator Working group (May 2, 2018) that it is effective to set trends as indicators and monitor them rather than treatment rate.
Chapter 5. Strategies to Reduce the SDGs Data Gap • 71
24 Domestic statistics are largely divided into statistics by statistical agencies and those by non-designated statistics agencies. The former is subdivided again into approved statistics and unapproved statistics. Statistics by non-designated statistics agencies may include statistics by private agency etc.
agencies like private institutions, research data, and
statistics having unclear data sources.24
In terms of data quality in the SDGs, the key is to
manage the quality remaining statistics except for
official statistics. Even if data has been collected by a
public authority, sometimes it is not a government-
approved statistic. Many indicators under Goal
4(indicator 4.1.1, 4.3.1, 4.4.1, 4.6.1) are representative.
Trends in International Mathematics and Science Study
(TIMSS) organized by IEA and PISA, PIAAC organized
by the OECD. Korea Institute for Curriculum and
Evaluation and Korea Research Institute for Vocational
Education and Training collect and provide data for
PISA and TIMSS and PIAAC, respectively.
Indicator 2.1.2 (prevalence of moderate or severe
food insecurity in the population) and indicator 15.5.1
(the Red List index) utilized and collected through
the private agency. In addition, data source of two
indicators, indicator 2.2.1 (prevalence of stunting among
children under five years of age) and indicator 2.2.2
(prevalence of malnutrition among children under five
years of age) were cited from the research paper. Also,
the data source of some indicators, including indicator
3.d.1 (International Health Regulations (IHR) capacity
and health emergency preparedness) is unclear.
4. Means to Reduce the Data Gap
In order to improve the domestic statistics for the SDGs
monitoring, the following was identified as necessary:
development of methodologies such as concept
definition and methods, improvement of statistics that
are the source of indicators, strict quality control. What
are the means of implementation necessary to develop
methodologies, improve statistics and control quality?
First, the indicators that need to develop
methodologies such as concept, definition and methods
can be divided into the case the methodology which is
still under development at the global level, the case
where agreement between IOs and countries is needed
for methodologies such as estimation and modeling at
the global level and the case where it is necessary to
judge relevance with domestic context. Methodological
development can be implemented to bring into line
global and national standards. What is emphasized
here is KOSTAT's coordinating roles. In the future, it
is expected that KOSTAT will play an important role in
coordinating between international organizations and
domestic agencies.
Meanwhile, it is necessary to understand how
global standards are constructed. The participation
of the NSO and relevant ministries is required. Apart
from the unilateral business practices of requesting
and responding to data from IOs to countries. Whole
processes including provision of data are monitored
and evaluated. The NSO and related ministries should
actively request the disclosure of methodologies used
by IOs to determine whether the data is appropriate
to assess the domestic policy environment. On the
other hand, indicators that need to be defined at the
national level require research and investment in
methodologies. In particular, it is necessary to evaluate
whether the indicators are accepted officially through
communication with the policy department.
Second, indicators requiring statistics improvement
are as follows: If existing statistics only partially meet
the definition of the SDGs and if further disaggregation
such as migration status and disability has not been
achieved. The development of statistics covers, not
only the improvement of existing statistics, but also
the use of various data sources. Administrative data,
big data, geographic information data, as well as
survey data should be reviewed. Meanwhile, the
scope of application can be extended to private data.
It can be also proposed to include survey items such as
migration status and disability, which are not dealt with

72 • Sustainable Development Goals in the Republic of Korea: Progress Report 2019
as core items in traditional survey. It requires statistical
decision-making and investment for success.
Finally, indicators require quality assurance. Once
data is provided to IOs, the data are continuously
reused by other IOs and individual researchers.
Therefore, quality assurance of the statistics should
be thoroughly carried out and the statistics should
be provided according to transparent procedures. It
requires improvement of the current quality assurance
system limited to the government-approved statistics.
We should develop inclusive quality assurance system
beyond official statistics.
The procedures of providing data to IOs also
need to be enhanced. Currently, statistical agencies
provide data directly to the IOs and report to the NSO
afterwards.25 KOSTAT regularly monitors the ROK’s
data published by IOs. At present, however, it is only
managed in terms of volume such as how much data is
provided rather than methodology used. The SDGs data
provision guideline states that the NSO should review
the figures and the validity of methodology of the
statistics produced by ministries other than the NSO
as a coordinator (IAEG-SDGs, 2018e). Of course, under
the decentralized statistical system, it may be difficult
for the NSO to guarantee expertise for statistics for all
subjects. To strengthen coordination role of KOSTAT,
subject matter expertise is needed.
A platform will help to coordinate among ministries
and multiple stakeholders. This is done to provide
and manage data and monitor SDGs transparently
and systematically. Interactive conversation through
the platform contributes to assure data quality and it
leads to statistics development for the SDGs. It is an
opportunity for national statistics growth.
25 The statistics provided to international organizations are increasing, with 99 in 2015, 113 in 2016, and 121 in 2017 and expected to increase further based on the opportunity of SDGs (KOSTAT, 2018b).
Chapter 6. Conclusion • 73
Conclusion
The SDGs monitoring should be based on reliable
data. However, monitoring is limited to indicators
that are available data. It has been three years since
the adoption of the SDGs. Cynics joke that it may
be 2030 when all indicators are ready to monitor.
It is not necessary to rush, but will time wait for
us? Where can we get evidence for sustainable
development if we cannot carry out monitoring due
to the absence of data? This is why the NSO's role in
the implementation of the SDGs is emphasized. The
NSO is involved in the whole process from defining
the concept of indicators, developing methodologies,
controlling data quality and even selecting targets.
All processes should open and transparent. We
must avoid ‘silo’ by collaborating with relevant
ministries. In order to achieve principles of “Leaving
No One Behind”, we must also listen to the voices of
stakeholders, including civil society organizations.
To produce more than 200 indicators, it is
inevitable to use data from various sources, and
even non-official data are a valuable source to
explore data availability. Experiments that combine
big data with official statistics are now part of the
NSO’s work, and citizen-generated data also just
started to be discussed. If you look at the poem
'Arabic Numbers in the Sky' by Minbok Han, our
daily lives are composed of numbers such as
resident registration numbers, accounting numbers,
passwords, and telephone numbers, as well as the
classification number of diseases and the license
plate numbers. Like it or not, we live in a world
dominated by numbers and these numbers come
together as statistics. However, how much does
each citizen understand the working principle of
these numbers? Accumulated data with low data
literacy will pollute the data ecosystem, which, in
turn, can distort the lens that observes the world. In
addition to the NSO, statisticians in each ministry,
policy makers who use those statistics, and citizens
Chapter 6
who are the targets of those policies need to invest
in improving data literacy. This is ultimately what
makes the data ecosystem stronger.

74 • Sustainable Development Goals in the Republic of Korea: Progress Report 2019
References
Korea Research Institute for Human Settlements, 2017, 『Housing Survey Summary Report 2017』.
Ko Kyung-hwan∙Jang Young-sik∙Im Dal-oh∙Choi Young-jun∙Ko Geum-ji∙Kim Sol-hwi, 2016, 『A Study on the Establishment of UN SDGs Health
and Welfare Indicator Management System』, Korea Institute for Health and Social Affairs.
Ministry of Science and ICT(MSIT), 2017, 『2016 R&D Activity Survey Report』.
Kim Mun-gil∙Kim Tae-wan∙Lim Wan-sup∙Jung Eun-hee∙Kim Jae-ho∙Ahn Joo-young∙Kim Seong-ah∙Lee Ju-mi∙Jeong Hee-sun∙Choi Jun-young,
2017, 『Multidimensional Characteristics of Youth Poverty and Policy Responses』, Korea Institute for Health and Social Affairs.
Park Young-sil∙Park Hyo-min∙Lee Young-mi∙Kim Wol-hwa, 2016, 『A Study on Data Disaggregation and Item Standardization of SDGs Indicators』,
Statistics Research Institute.
Park Youngshil∙Lee Young-mi∙Kim Seok-ho∙Cha Eun-ji, 2017, “Establishment of UN Framework for Sustainable Development (SDGs) Indicator
Framework and the Role of Statistics”, Survey Study, 18(3): 77-96.
Park Jun-hwi and 30 others, 2018, 『Crime Phenomena and Criminal Policy in Korea』, Korean Institute of Criminology.
Ministry of Health and Welfare, 2018, 『Recipients of National Basic Livelihood Security in 2017』.
Social Security Committee, 2018, 『Social Security 2017 based on Statistics』.
Shin Hyung-woong∙Shin Young-seok∙Hwang Do-gyung∙Yoon Pil-kyung, 2010, 『Impact of Overburden of Medical Costs on Poverty』, Korea Insti-
tute for Health and Social Affairs.
Mari Mikkola, 2017, 『Feminism’s Perspectives on Sex and Gender』, Translated by Kang Eun-gyo et. al, Electric Ray.
Korean National Commission for UNESCO, 2018, 『Korean Education and SDG4-Education 2030』.
Yubal Harari, 2018, 『Sapiens: From Apes to Cyborgs, Bold and Great Questions of Human History』, Translated by Cho Hyun-wook, Gimmyoung.
Yun Yun-gyu, 2017, “Enhancement of Job Creation and Assessment of Job Impact”, Labour Review December Issue: pp.1-2.
Korea Energy Economics Institute, 2018, 『KEEI Mid-Term Energy Demand Forecast (2017-2022)』.
Jang Eun-ha∙Mun Yu-gyung∙Jo Hyu-seung∙Kim Jeong-soo∙Kim Ji-hyun, 2017, 『Domestic Status and Policy Tasks of Gender Equality Indicators in
the SDGs』, Korean Women’s Development Institute.
Cho Sun-ok, 2018, “Basic Literacy and Numeracy to Achieve Sustainable Development Goals”, Korean National Commission for UNESCO sec-
tion, 『Korean Education and SDG4-Education 2030』, pp.45-58.
Cho Ji-min, 2018, “High Quality Elementary and Secondary Education: Implementation Status and Priorities at Home and Abroad”, Korean
National Commission for UNESCO section, 『Korean Education and SDG4-Education 2030』, pp.23-32.
Choi Soo-hyung·Cho Young-oh, 2017, 『National Crime Victim Investigation 2016』, Korean Institute of Criminology.
Choi Youngshil, Lee Seung-ho, Yoon Ok-gyung, Geum Yong-myung, 2014, 『A Study on Advancement of Corrective Protection for Prevention of
Recidivism(Ⅲ)』, Korean Institute of Criminology.
KOSTAT, 2015, 『History of Great Numbers』.
_____, 2018a, Death Cause Statistics Press Release in 2017.
_____, 2018b, 『International Organization Data and Monitoring Status Report for 2nd Half of 2017』, Internal data.
Korea International Cooperation Agency (KOICA), 2015, 『Establishment of SDGs and Countermeasures』.
Korea Water Resources Corporation (K-WATER), 2017, 『A Study on SDGs, Korea and K-water’s Response Strategies』.
The Korean Statistical Society, 1987, 『Statistics Glossary』, Freedom Academy.
FAO, 2018, The state of Food Security and Nutrition in the world: Building Climate Resilience for Food Security and Nutrition.
UNDESA, 2018, World Urbanization Prospect.
IAEG-SDGs, 2017, IAEG-SDG Workstream on Data Disaggregation. https://unstats.un.org/sdgs/iaeg-sdgs/.
_________, 2018a, Metadata of indicator 1.1.1. https://unstats.un.org/sdgs/iaeg-sdgs/.
_________, 2018b. Metadata of indicator 6.1.1. and 6.2.1. https://unstats.un.org/sdgs/iaeg-sdgs/.
_________, 2018c. Metadata of indicator 11.1.1. https://unstats.un.org/sdgs/iaeg-sdgs/.
_________, 2018d, Survey on using UNPD data for global monitoring of SDG indicators, https://unstats.un.org/sdgs/iaeg-sdgs/.
_________, 2018e, Criteria for the implementation of the Guidelines on Data Flows and Global Data Reporting for SDGs. https://unstats.un.org/
sdgs/iaeg-sdgs/.
ILO, 2018, World Social Protection Report 2017-2019.
OECD, 2017, Measuring Distance to the SDG Targets: An assessment of where OECD Countries stand.
SDSN, 2018, Global Responsibilities: Implementing the goals.
UN, 1987, Our Common Future.
___, 2015, Transforming our world: the 2030 Agenda for Sustainable Development.
___, 2017, The Sustainable Development Goals Report.
___, 2018, The Sustainable Development Goals Report.
WHO and UNICEF, 2017, Progress on Drinking Water, Sanitation and Hygiene: 2017 update and SDG baselines.

References & Abbreviations • 75
Abbreviations
CBD Convention on Biological Diversity
CRS Creditor Reporting System
DAC Development Assistance Committee
DAD-IS Domestic Animal Diversity Information System
EEZ Exclusive Economic Zone
ESS European Social Survey
FAO Food and Agriculture Organization
FGM/C Female Genital Mutilation/Cutting
FIES Food Insecurity Experience Scale
GDP Gross Domestic Product
GNI Gross National Income
HIV Human Immunodeficiency Virus
HLPF High Level Political Forum
IAEG-SDGs Inter-agency and Expert Group for Sustainable Development Goal Indicators
ICF International Classification of Functioning, Disability and Health
IEA International Energy Agency
ILO International Labour Organization
IPCC Intergovernment Panel on Climate Change
ISCO International Standard Classification of Occupations
IUCN International Union for Conservation of Nature and Natural Resources
LULUCF Land Use, Land-Use Change and Forestry
MDGs Millennium Development Goals
ODA Official Development Assistance
OECD Organization for Economic Cooperation and Development
OOF Other Official Flows
PIAAC Programme for the International Assessment of Adult Competencies
PISA Programme for International Student Assessment
SDGs Sustainable Development Goals
SDSN Sustainable Development Solutions Network
TIMSS Trends in International Mathematics and Science Study
UN United Nations
UNAIDS The Joint United Nations Programme on HIV/AIDS
UNDESA United Nations Department of Economic and Social Affairs
UNDP United Nations Development Programme
UNECOSOC United Nations Economics and Social Council
UNESCO United Nations Educational, Scientific and Cultural Organization
UNICEF United Nations International Children’s Emergency Fund
UNPD United Nations Population Division
UNSC United Nations Statistical Commission
UNSD United Nations Statistics Division
VNR Voluntary National Review
WCED World Commission for Environment and Development
WFP World Food Programme
WHO World Health Organization
WQI Water Quality Index
76 • Sustainable Development Goals in the Republic of Korea: Progress Report 2019
List of Collaborating Institutions and Participants
Ministries and Affiliates
• Anti-Corruption & Civil Rights Commission
• Ministry of Employment and Labour, Ministry of Education, Ministry of Culture, Sports and Tourism, Ministry
of Health and Welfare, Ministry of Gender Equality and Family, Ministry of Foreign Affairs and Trade, Ministry of
Maritime Affairs and Fisheries
• National Police Agency, Cultural Heritage Administration, Korea Forest Service
• Korea National Park Research Institute Heo Hak-young, Korea Forest Research Institute Lim Jong-soo, National
Institute of Biological Resources Seo Jae-hwa, Yeom Jin-hwa, Lee So-hee, Lee Soo-yeon, Greenhouse Gas
Inventory and Research Center Choi Hyung-wook, Korea Centers for Disease Control and Prevention Kwon Sang-
hee, Korea Culture and Tourism Institute Park Geun-hwa, Korea Water Resources Corporation Moon Gyung-ho,
Min Jeong-eun, Export-Import Bank of Korea Ahn Joo-hyuk, Yoon So-dam, Korea Environment Corporation Lee
Tae-joo, Jang Se-hoon, Jeong Young-ran
Academia and Research Institutions
• Konkuk University Park Hyo-min, Seoul National University Hong Moon-suk, Inha University Im Jong-han
• Korea Energy Economics Institute Shin Him-chul, Lee Bo-hye, Korea Information Society Development Institute
Jeong Hyun-joon, Korea Development Institute Lee Tae-seok, Jeong Dae-hee, Science & Technology Policy Institute
Lee Woo-seong, Korean Educational Development Institute Park Seong-ho, Korea Labour Institute Bang Hyung-
joon, Son Yeong-jeong, Korea Institute for Health and Social Affairs Jang Young-sik, Choi Hyun-soo, Korean
Women’s Development Institute Jang Eun-ha, Joo Jae-seon, Korea Maritime Institute Yook Geun-hyung, Korea
Institute of Public Administration Jeong So-yoon, Korean Institute of Criminology Kim Ji-seon, Choi Soo-hyung
• The Seoul Institute Jeong Byung-soon, People’s Health Institute Kim Sae-rom, Migration Research & Training
Center Kang Dong-gwan, Korea Customs and Trade Development Institute Ha Jeong-joo, The Korea Social Policy
Institute Byun Yong-chan
Civil Groups and Korean Committees for IOs
• Dangjin Environmental Movement Federation Yoo Jong-jun, Daejeon Environmental Movement Federation Lee
Gyung-ho, Development Alternative Pida Han Jae-kwang, Green Umbrella Park Jin-yi, Son Hee-kyung, Lee Soo-
jin, The Center for Freedom of Information and Transparent Society Kang Seong-guk, Korea Women’s Association
United Jo Young-sook, Korea Institute Center for Sustainable Development Yoon Gyung-hyo, Citizens’ Action
Network Chae Yeon-ha, Korean Federation For Environmental Movement Kim Chun-yi, Yangi Won-young
• UNESCO Seo Hyun-sook, UNICEF Seong Jong-eun
(in alphabetical order, position omitted)
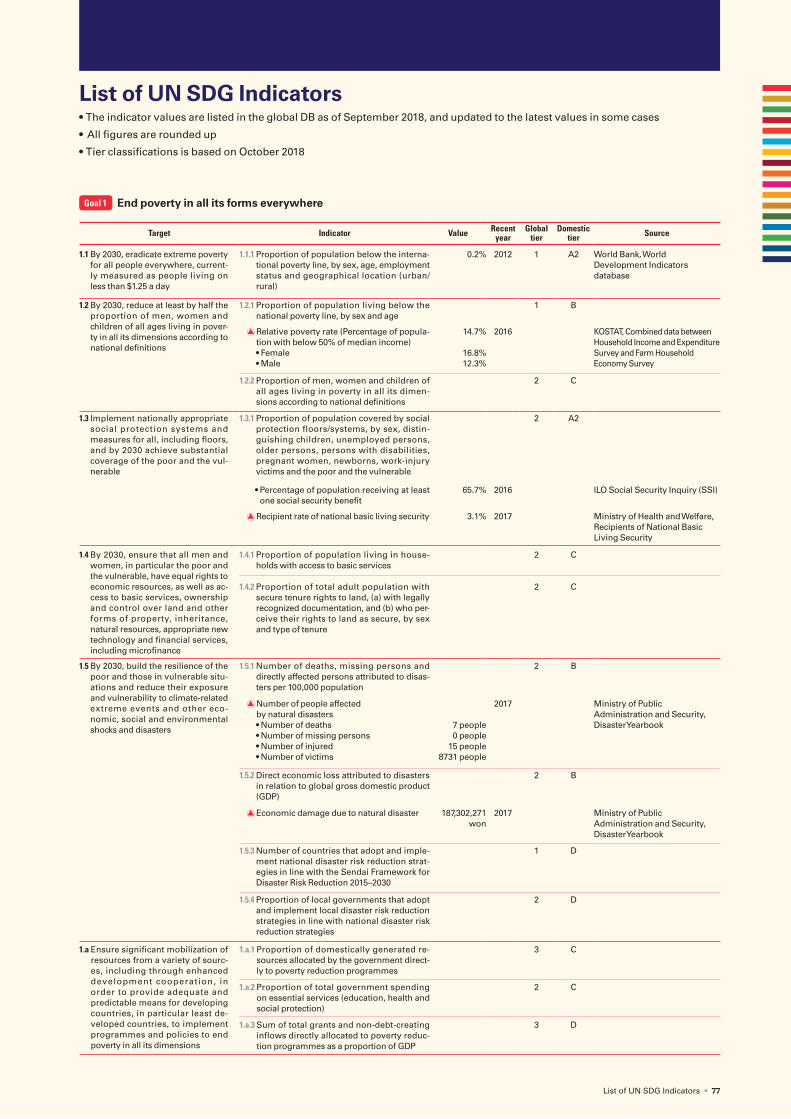
List of UN SDG Indicators • 77
List of UN SDG Indicators • The indicator values are listed in the global DB as of September 2018, and updated to the latest values in some cases
• All figures are rounded up
• Tier classifications is based on October 2018
Goal 1 End poverty in all its forms everywhere
Target Indicator Value Recent year
Global tier
Domestic tier Source
1.1 By 2030, eradicate extreme poverty for all people everywhere, current-ly measured as people living on less than $1.25 a day
1.1.1 Proportion of population below the interna-tional poverty line, by sex, age, employment status and geographical location (urban/rural)
0.2% 2012 1 A2 World Bank, World Development Indicators database
1.2 By 2030, reduce at least by half the proportion of men, women and children of all ages living in pover-ty in all its dimensions according to national definitions
1.2.1 Proportion of population living below the national poverty line, by sex and age
1 B
Relative poverty rate (Percentage of popula-tion with below 50% of median income)
• Female • Male
14.7%
16.8%12.3%
2016 KOSTAT, Combined data between Household Income and Expenditure Survey and Farm Household Economy Survey
1.2.2 Proportion of men, women and children of all ages living in poverty in all its dimen-sions according to national definitions
2 C
1.3 Implement nationally appropriate social protection systems and measures for all, including floors, and by 2030 achieve substantial coverage of the poor and the vul-nerable
1.3.1 Proportion of population covered by social protection floors/systems, by sex, distin-guishing children, unemployed persons, older persons, persons with disabilities, pregnant women, newborns, work-injury victims and the poor and the vulnerable
2 A2
• Percentage of population receiving at least one social security benefit
65.7% 2016 ILO Social Security Inquiry (SSI)
Recipient rate of national basic living security 3.1% 2017 Ministry of Health and Welfare, Recipients of National Basic Living Security
1.4 By 2030, ensure that all men and women, in particular the poor and the vulnerable, have equal rights to economic resources, as well as ac-cess to basic services, ownership and control over land and other forms of property, inheritance, natural resources, appropriate new technology and financial services, including microfinance
1.4.1 Proportion of population living in house-holds with access to basic services
2 C
1.4.2 Proportion of total adult population with secure tenure rights to land, (a) with legally recognized documentation, and (b) who per-ceive their rights to land as secure, by sex and type of tenure
2 C
1.5 By 2030, build the resilience of the poor and those in vulnerable situ-ations and reduce their exposure and vulnerability to climate-related extreme events and other eco-nomic, social and environmental shocks and disasters
1.5.1 Number of deaths, missing persons and directly affected persons attributed to disas-ters per 100,000 population
2 B
Number of people affected by natural disasters
• Number of deaths • Number of missing persons • Number of injured • Number of victims
7 people0 people
15 people8731 people
2017 Ministry of Public Administration and Security, Disaster Yearbook
1.5.2 Direct economic loss attributed to disasters in relation to global gross domestic product (GDP)
2 B
Economic damage due to natural disaster 187,302,271 won
2017 Ministry of Public Administration and Security, Disaster Yearbook
1.5.3 Number of countries that adopt and imple-ment national disaster risk reduction strat-egies in line with the Sendai Framework for Disaster Risk Reduction 2015–2030
1 D
1.5.4 Proportion of local governments that adopt and implement local disaster risk reduction strategies in line with national disaster risk reduction strategies
2 D
1.a Ensure significant mobilization of resources from a variety of sourc-es, including through enhanced development cooperation, in order to provide adequate and predictable means for developing countries, in particular least de-veloped countries, to implement programmes and policies to end poverty in all its dimensions
1.a.1 Proportion of domestically generated re-sources allocated by the government direct-ly to poverty reduction programmes
3 C
1.a.2 Proportion of total government spending on essential services (education, health and social protection)
2 C
1.a.3 Sum of total grants and non-debt-creating inflows directly allocated to poverty reduc-tion programmes as a proportion of GDP
3 D

78 • Sustainable Development Goals in the Republic of Korea: Progress Report 2019
Target Indicator Value Recent year
Global tier
Domestic tier Source
1.b Create sound policy frameworks at the national, regional and internation-al levels, based on pro-poor and gen-der-sensitive development strategies, to support accelerated investment in poverty eradication actions
1.b.1 Proportion of government recurrent and capital spending to sectors that dispropor-tionately benefit women, the poor and vul-nerable groups
3 C
Goal 2 End hunger, achieve food security and improved nutrition and promote sustainable agriculture
Target Indicator Value Recent year
Global tier
Domestic tier Source
2.1 By 2030, end hunger and ensure access by all people, in particular the poor and people in vulnera-ble situations, including infants, to safe, nutritious and sufficient food all year round
2.1.1 Prevalence of undernourishment < 2.5 2015 1 A1 FAO, Statistics Division
Prevalence of nutrition deficiency 10.2%2016
Korea Centers for Disease Control and Prevention, Korea National Health and Nutrition Examination Survey
2.1.2 Prevalence of moderate or severe food insecurity in the population, based on the Food Insecurity Experience Scale (FIES)
2 B
Percentage of households with food se-curity
95.8% 2016 Korea Centers for Disease Control and Prevention, Korea National Health and Nutrition Examination Survey
2.2 By 2030, end all forms of malnu-trition, including achieving, by 2025, the internationally agreed targets on stunting and wasting in children under 5 years of age, and address the nutritional needs of adolescent girls, preg-nant and lactating women and older persons
2.2.1 Prevalence of stunting (height for age <-2 standard deviation from the median of the World Health Organization (WHO) Child Growth Standards) among children under 5 years of age
1 C
2.2.2 Prevalence of malnutrition (weight for height >+2 or <-2 standard deviation from the median of the WHO Child Growth Standards) among children under 5 years of age, by type (wasting and overweight)
1 C
2.3 By 2030, double the agricultural productivity and incomes of small-scale food producers, in particular women, indigenous peoples, family farmers, pas-toralists and fishers, including through secure and equal access to land, other productive re-sources and inputs, knowledge, financial services, markets and opportunities for value addition and non-farm employment
2.3.1 Volume of production per labour unit by classes of farming/pastoral/forestry en-terprise size
2 B
Agricultural labour productivity (by farmland size)
• 0.5 ha or less• 0.5-1.0 ha • 1.0-1.5 ha • 1.5-2.0 ha • 2.0-3.0 ha • 3.0-5.0 ha • 5.0-7.0 ha • 7.0-10.0 ha • 10.0 ha or more
8.1 thousand won / hour16.5 thousand won / hour19.1 thousand won / hour19.7 thousand won / hour25.5 thousand won / hour29.2 thousand won / hour40.6 thousand won / hour42.2thousand won / hour41.9thousand won / hour
2017 KOSTAT , Farm Household Economy Survey
2.3.2 Average income of small-scale food pro-ducers, by sex and indigenous status
2 B
Annual farm household income (by farmland size)• 0.5ha or less• 0.5-1.0 ha • 1.0-1.5 ha • 1.5-2.0 ha • 2.0-3.0 ha • 3.0-5.0 ha • 5.0-7.0 ha • 7.0-10.0 ha • 10.0 ha or more
34,319 thousand won33,731 thousand won34,216 thousand won35,857 thousand won40,811 thousand won48,246 thousand won65,746 thousand won78,000 thousand won94,291 thousand won
2017 KOSTAT , Farm Household Economy Survey
2.4 By 2030, ensure sustainable food production systems and imple-ment resilient agricultural prac-tices that increase productivity and production, that help main-tain ecosystems, that strengthen capacity for adaptation to cli-mate change, extreme weather, drought, flooding and other disasters and that progressively improve land and soil quality
2.4.1 Proportion of agricultural area under pro-ductive and sustainable agriculture
3 C

List of UN SDG Indicators • 79
Target Indicator Value Recent year
Global tier
Domestic tier Source
2.5 By 2020, maintain the genetic diversity of seeds, cultivated plants and farmed and domesti-cated animals and their related wild species, including through soundly managed and diversi-fied seed and plant banks at the national, regional and interna-tional levels, and promote access to and fair and equitable sharing of benefits arising from the utilization of genetic resources and associated traditional knowl-edge, as internationally agreed
2.5.1 Number of plant and animal genetic re-sources for food and agriculture secured in either medium- or long-term conserva-tion facilities
46 species 2018 1 A1 FAO, Domestic Animal Diversity Information System(DAD-IS)
2.5.2 Proportion of local breeds classified as being at risk, not at risk or at unknown level of risk of extinction• Dangerous• Non- dangerous• Unknown
43.5% (20 species)8.7% (4 species)
47.8% (22 species)
2018 1 A1 FAO, Domestic Animal Diversity Information System(DAD-IS)
2.a Increase investment, including through enhanced international cooperation, in rural infrastruc-ture, agricultural research and extension services, technology development and plant and livestock gene banks in order to enhance agricultural productive capacity in developing countries, in particular least developed countries
2.a.1 The agriculture orientation index for gov-ernment expenditures
2.23 2016 2 A1 FAO Questionnaire;UNSD national account estimates
2.a.2 Total official flows (official development assistance plus other official flows) to the agriculture sector
1 D
2.b Correct and prevent trade restric-tions and distortions in world agricultural markets, including through the parallel elimination of all forms of agricultural export subsidies and all export mea-sures with equivalent effect, in accordance with the mandate of the Doha Development Round
2.b.1 Agricultural export subsidies 1 A1
Agricultural export logistics cost subsi-dies
31.05 billion won 2013 WTO database
2.c Adopt measures to ensure the proper functioning of food com-modity markets and their deriva-tives and facilitate timely access to market information, including on food reserves, in order to help limit extreme food price volatility
2.c.1 Indicator of food price anomalies 2 C
Goal 3 Ensure healthy lives and promote well-being for all at all ages
Target Indicator Value Recent year
Global tier
Domestic tier Source
3.1 By 2030, reduce the global maternal mortality ratio to less than 70 per 100,000 live births
3.1.1 Maternal mortality ratio 11 people 2015 1 A1 WHO, UNICEF, UNFPA, World Bank Group and the UNPD, Trends in maternal mortality: 1990 to 2015
Maternal mortality ratio (per 100,000 newborns)
7.8 people 2017 KOSTAT, Death Cause Statistics
3.1.2 Proportion of births attended by skilled health personnel
100% 2015 1 A1 Korea Institute for Health and Social Affairs, National Fertility and Family Health and Welfare Survey
3.2 By 2030, end preventable deaths of newborns and chil-dren under 5 years of age, with all countries aiming to reduce neonatal mortality to at least as low as 12 per 1,000 live births and under-5 mortality to at least as low as 25 per 1,000 live births
3.2.1 Under-5 mortality rate• All• Female• Male
3.3 people3.0 people3.5 people
2017 1 A1 UNIGME
3.2.2 Neonatal mortality rate 1.5 people 2016 1 A1 UNIGME

80 • Sustainable Development Goals in the Republic of Korea: Progress Report 2019
Target Indicator Value Recent year
Global tier
Domestic tier Source
3.3 By 2030, end the epidemics of AIDS, tuberculosis, malaria and neglected tropical diseases and combat hepatitis, water-borne diseases and other communi-cable diseases
3.3.1 Number of new HIV infections per 1,000 unin-fected population, by sex, age and key popula-tions
2 B
Status of HIV-infected Koreans• All• Female• Male
1,009 people50 people
959 people
2017 Korea Centers for Disease Control and Prevention, Annual report on the notified HIV/AIDS in Korea
3.3.2 Tuberculosis incidence per 100,000 population 77 people 2016 1 A1 WHO, Global Tuberculosis Report
Tuberculosis incidence (per 100,000 people) 54.4 people 2017 Korea Centers for Disease Control and Prevention, Infectious disease surveillance yearbook
3.3.3 Malaria incidence per 1,000 population 0.3 person 2016 1 A1 DHS2000
Malaria incidence (per 100,000 people) 1.0 person 2017 Korea Centers for Disease Control and Prevention, Infectious disease surveillance yearbook
3.3.4 Hepatitis B incidence per 100,000 population 0.7 person 2015 2 A1 WHO, Based on serosurveys at city, subnational or national level.
Hepatitis B (Acute) incidence (per 100,000 people)
0.8 person 2017 Korea Centers for Disease Control and Prevention, Infectious disease surveillance yearbook
3.3.5 Number of people requiring interventions against neglected tropical diseases
323 people 2016 1 A1 WHO, Global Health Observatory
3.4 By 2030, reduce by one third premature mortal i ty f rom non-communicable diseases through prevention and treat-ment and promote mental health and well-being
3.4.1 Mortality rate attributed to cardiovascular dis-ease, cancer, diabetes or chronic respiratory disease• All• Female• Male
7.8%4.7%
10.9%
2016 1 A1 WHO, Global Health Estimates 2016: Deaths by Cause, Age, Sex, by Country and by Region 2000-2016
cardiovascular disease mortality rate (per 100,000 people)
119.6 people 2017 KOSTAT , Death Cause Statistics
Cancer mortality rate (per 100,000 people) 153.9 people
Diabetes mortality rate (per 100,000 people) 17.9 people
Respiratory system mortality rate (per 100,000 people)
63.7 people
3.4.2 Suicide mortality rate• All• Female• Male
26.9 people15.4 people38.4 people
2016 1 A1 WHO, Global Health Estimates 2016: Deaths by Cause, Age, Sex, by Country and by Region 2000-2016
Suicide mortality rate (per 100,000 people)• All• Female• Male
24.3 people13.8 people34.9 people
2017 KOSTAT , Death Cause Statistics
3.5 Strengthen the prevention and treatment of substance abuse, including narcotic drug abuse and harmful use of alcohol
3.5.1 Coverage of treatment interventions (pharma-cological, psychosocial and rehabilitation and aftercare services) for substance use disorders
3 C1
3.5.2 Harmful use of alcohol, defined according to the national context as alcohol per capita con-sumption (aged 15 years and older) within a calendar year in litres of pure alcohol
10.2 liters 2016 1 A1 WHO, Global Information System on Alcohol and Health
3.6 By 2020, halve the number of global deaths and injuries from road traffic accidents
3.6.1 Death rate due to road traffic injuries 12 people 2013 1 A1 Global Status Report on Road Safety,
Traffic accident mortality rate (per 100,000 people)
8.1 people 2017 National Police Agency, Police Statistics Yearbook
3.7 By 2030, ensure universal access to sexual and repro-ductive health-care services, including for family planning, information and education, and the integration of reproductive health into national strategies and programmes
3.7.1 Proportion of women of reproductive age (aged 15–49 years) who have their need for family planning satisfied with modern meth-ods
1 B
Contraception practice rate of married women 79.6% 2015 Korea Institute for Health and Social Affairs, National Fertility and Family Health and Welfare Survey
3.7.2 Adolescent birth rate (aged 10–14 years; aged 15–19 years) per 1,000 women in that age group
2 A2
Birth rate of 15-19 year-olds (Per 1,000 people) 1.3 people 2016 KOSTAT, Population Trend Survey

List of UN SDG Indicators • 81
Target Indicator Value Recent year
Global tier
Domestic tier Source
3.8 Achieve universal health cov-erage, including financial risk protection, access to quality essential health-care services and access to safe, effective, quality and affordable essential medicines and vaccines for all
3.8.1 Coverage of essential health services (defined as the average coverage of essential services based on tracer interventions that include reproductive, maternal, newborn and child health, infectious diseases, non-communica-ble diseases and service capacity and access, among the general and the most disadvan-taged population)
> = 80 2015 2 A1 WHO, Tracking universal health coverage: 2017 Global Monitoring Report
3.8.2 Proportion of population with large household expenditures on health as a share of total household expenditure or income More than 10% of expenditure More than 25% of expenditure
13.5%4.0%
2008 2 A1 Key Indicator of the2017 Global Reporton Tracking UniversalHealth Coverage
3.9 By 2030, substantially reduce the number of deaths and illnesses from hazardous chem-icals and air, water and soil pollution and contamination
3.9.1 Mortality rate attributed to household and am-bient air pollution
20 people 2016 1 A1 WHO, Global Health Observatory (GHO)
3.9.2 Mortality rate attributed to unsafe water, un-safe sanitation and lack of hygiene (exposure to unsafe Water, Sanitation and Hygiene for All (WASH) services)
1.8 people 2016 1 A1 WHO, Global Health Observatory (GHO)
3.9.3 Mortality rate attributed to unintentional poi-soning• All• Female• Male
0.5 person0.3 person0.7 person
2016 1 A1 WHO, Global Health Estimates 2016: Deaths by Cause, Age, Sex, by Country and by Region 2000-2016
3.a Strengthen the implementation of the World Health Organiza-tion Framework Convention on Tobacco Control in all coun-tries, as appropriate
3.a.1 Age-standardized prevalence of current to-bacco use among persons aged 15 years and older• All• Female• Male
23.9%6.2%
42.0%
2015 1 A1 WHO Department of the Prevention of Noncommunicable Diseases; Secretariat of the WHO Framework Convention on Tobacco Control
Smoking rate of population aged 19 or older• All• Female• Male
22.6%6.1%
39.4%
2016 Korea Centers for Disease Control and Prevention, Korea National Health and Nutrition Examination Survey
3.b Support the research and devel-opment of vaccines and medi-cines for the communicable and non-communicable diseases that primarily affect developing countries, provide access to affordable essential medicines and vaccines, in accordance with the Doha Declaration on the TRIPS Agreement and Public Health, which affirms the right of developing countries to use to the full the provisions in the Agreement on Trade-Related Aspects of Intellectual Property Rights regarding flexibilities to protect public health, and, in particular, provide access to medicines for all
3.b.1 Proportion of the target population covered by all vaccines included in their national pro-gramme• Diphtheria, Tetanus, Pertussis Vaccine (DTP3)• Pneumococcal vaccine (PCV3)• Measles secondary vaccine (MCV2)
98%98%97%
2016 2 A1 WHO/UNICEF coverage estimates 2016 revision, July 2017
3.b.2 Total net official development assistance to medical research and basic health sectors
1 D
3.b.3 Proportion of health facilities that have a core set of relevant essential medicines available and affordable on a sustainable basis
3 C
3.c Substantially increase health financing and the recruitment, development, training and retention of the health work-force in developing countries, especially in least developed countries and small island de-veloping States
3.c.1 Health worker density and distribution• Nurse• Doctor• Dentist• Pharmacist
6.9 people2.3 people0.5 people0.7 people
2016 1 A1 WHO, Global Health Workforce Statistics database
3.d Strengthen the capacity of all countries, in particular de-veloping countries, for early warning, risk reduction and management of national and global health risks
3.d.1 International Health Regulations (IHR) capacity and health emergency preparedness
97.9% 2017 1 C WHO, Global Health Observatory (GHO)
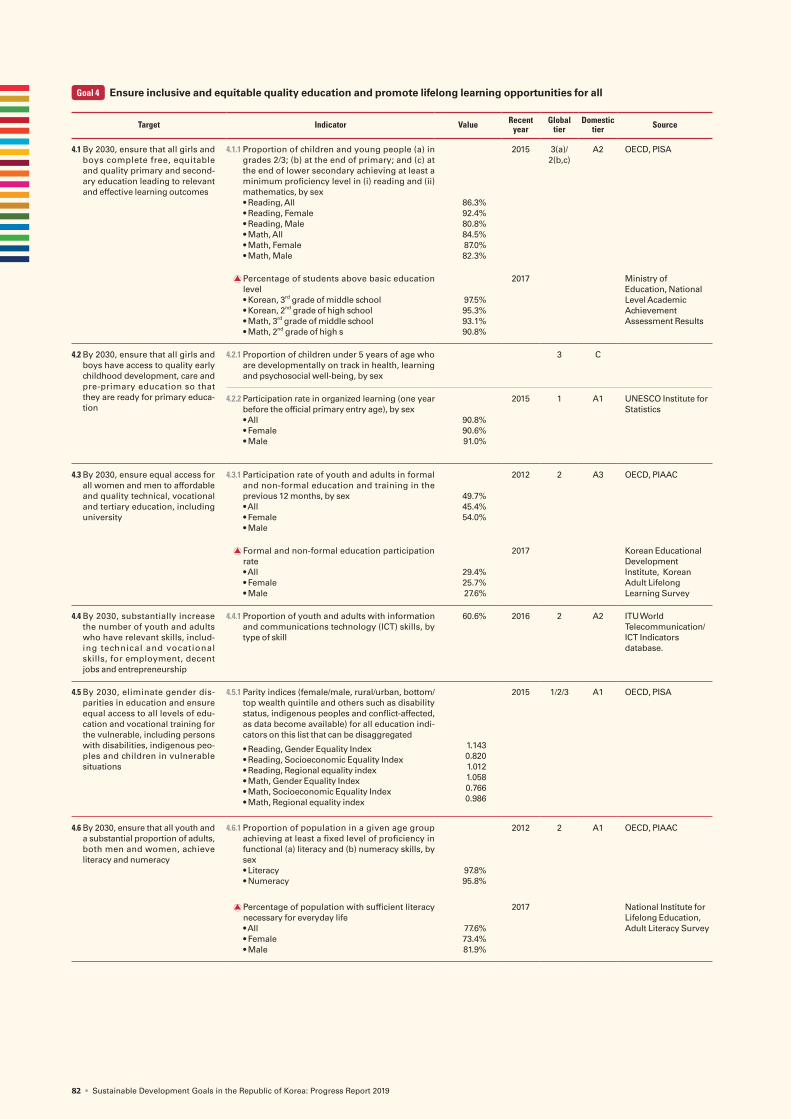
82 • Sustainable Development Goals in the Republic of Korea: Progress Report 2019
Goal 4 Ensure inclusive and equitable quality education and promote lifelong learning opportunities for all
Target Indicator Value Recent year
Global tier
Domestic tier Source
4.1 By 2030, ensure that all girls and boys complete free, equitable and quality primary and second-ary education leading to relevant and effective learning outcomes
4.1.1 Proportion of children and young people (a) in grades 2/3; (b) at the end of primary; and (c) at the end of lower secondary achieving at least a minimum proficiency level in (i) reading and (ii) mathematics, by sex• Reading, All • Reading, Female• Reading, Male• Math, All• Math, Female• Math, Male
86.3%92.4%80.8%84.5%87.0%82.3%
2015 3(a)/2(b,c)
A2 OECD, PISA
Percentage of students above basic education level• Korean, 3rd grade of middle school• Korean, 2nd grade of high school• Math, 3rd grade of middle school• Math, 2nd grade of high s
97.5%95.3%93.1%90.8%
2017 Ministry of Education, National Level Academic Achievement Assessment Results
4.2 By 2030, ensure that all girls and boys have access to quality early childhood development, care and pre-primary education so that they are ready for primary educa-tion
4.2.1 Proportion of children under 5 years of age who are developmentally on track in health, learning and psychosocial well-being, by sex
3 C
4.2.2 Participation rate in organized learning (one year before the official primary entry age), by sex• All• Female• Male
90.8%90.6%91.0%
2015 1 A1 UNESCO Institute for Statistics
4.3 By 2030, ensure equal access for all women and men to affordable and quality technical, vocational and tertiary education, including university
4.3.1 Participation rate of youth and adults in formal and non-formal education and training in the previous 12 months, by sex• All• Female• Male
49.7%45.4%54.0%
2012 2 A3 OECD, PIAAC
Formal and non-formal education participation rate• All• Female• Male
29.4%25.7%27.6%
2017 Korean Educational Development Institute, Korean Adult Lifelong Learning Survey
4.4 By 2030, substantially increase the number of youth and adults who have relevant skills, includ-ing technical and vocational skills, for employment, decent jobs and entrepreneurship
4.4.1 Proportion of youth and adults with information and communications technology (ICT) skills, by type of skill
60.6% 2016 2 A2 ITU World Telecommunication/ICT Indicators database.
4.5 By 2030, eliminate gender dis-parities in education and ensure equal access to all levels of edu-cation and vocational training for the vulnerable, including persons with disabilities, indigenous peo-ples and children in vulnerable situations
4.5.1 Parity indices (female/male, rural/urban, bottom/top wealth quintile and others such as disability status, indigenous peoples and conflict-affected, as data become available) for all education indi-cators on this list that can be disaggregated
• Reading, Gender Equality Index• Reading, Socioeconomic Equality Index• Reading, Regional equality index• Math, Gender Equality Index• Math, Socioeconomic Equality Index• Math, Regional equality index
1.1430.8201.0121.0580.7660.986
2015 1/2/3 A1 OECD, PISA
4.6 By 2030, ensure that all youth and a substantial proportion of adults, both men and women, achieve literacy and numeracy
4.6.1 Proportion of population in a given age group achieving at least a fixed level of proficiency in functional (a) literacy and (b) numeracy skills, by sex• Literacy• Numeracy
97.8%95.8%
2012 2 A1 OECD, PIAAC
Percentage of population with sufficient literacy necessary for everyday life• All• Female• Male
77.6%73.4%81.9%
2017 National Institute for Lifelong Education, Adult Literacy Survey
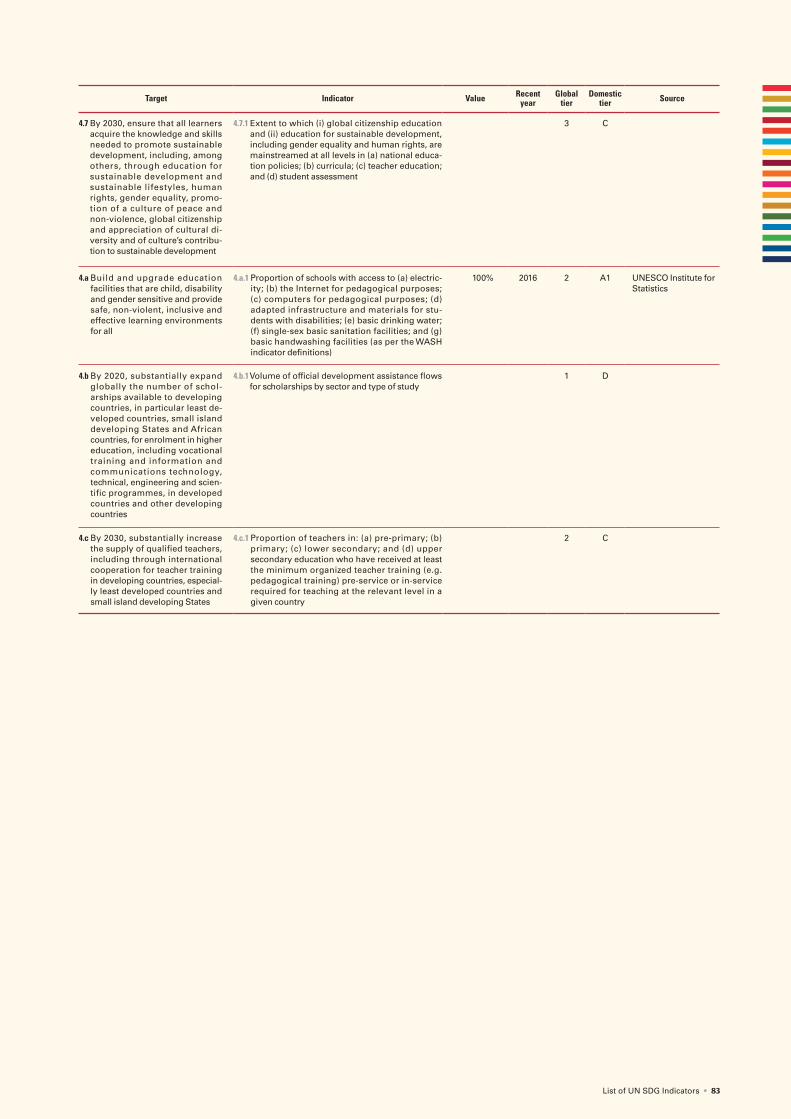
List of UN SDG Indicators • 83
Target Indicator Value Recent year
Global tier
Domestic tier Source
4.7 By 2030, ensure that all learners acquire the knowledge and skills needed to promote sustainable development, including, among others, through education for sustainable development and sustainable lifestyles, human rights, gender equality, promo-tion of a culture of peace and non-violence, global citizenship and appreciation of cultural di-versity and of culture’s contribu-tion to sustainable development
4.7.1 Extent to which (i) global citizenship education and (ii) education for sustainable development, including gender equality and human rights, are mainstreamed at all levels in (a) national educa-tion policies; (b) curricula; (c) teacher education; and (d) student assessment
3 C
4.a Build and upgrade education facilities that are child, disability and gender sensitive and provide safe, non-violent, inclusive and effective learning environments for all
4.a.1 Proportion of schools with access to (a) electric-ity; (b) the Internet for pedagogical purposes; (c) computers for pedagogical purposes; (d) adapted infrastructure and materials for stu-dents with disabilities; (e) basic drinking water; (f) single-sex basic sanitation facilities; and (g) basic handwashing facilities (as per the WASH indicator definitions)
100% 2016 2 A1 UNESCO Institute for Statistics
4.b By 2020, substantially expand globally the number of schol-arships available to developing countries, in particular least de-veloped countries, small island developing States and African countries, for enrolment in higher education, including vocational training and information and communications technology, technical, engineering and scien-tific programmes, in developed countries and other developing countries
4.b.1 Volume of official development assistance flows for scholarships by sector and type of study
1 D
4.c By 2030, substantially increase the supply of qualified teachers, including through international cooperation for teacher training in developing countries, especial-ly least developed countries and small island developing States
4.c.1 Proportion of teachers in: (a) pre-primary; (b) primary; (c) lower secondary; and (d) upper secondary education who have received at least the minimum organized teacher training (e.g. pedagogical training) pre-service or in-service required for teaching at the relevant level in a given country
2 C

84 • Sustainable Development Goals in the Republic of Korea: Progress Report 2019
Goal 5 Achieve gender equality and empower all women and girls
Target Indicator Value Recent year
Global tier
Domestic tier Source
5.1 End all forms of discrimination against all women and girls every-where
5.1.1 Whether or not legal frameworks are in place to promote, enforce and monitor equality and non-discrimination on the basis of sex
2 D
5.2 El iminate al l forms of violence against all women and girls in the public and private spheres, including trafficking and sexual and other types of exploitation
5.2.1 Proportion of ever-partnered women and girls aged 15 years and older subjected to physical, sexual or psychological violence by a current or former intimate partner in the previous 12 months, by form of violence and by age
2 C
5.2.2 Proportion of women and girls aged 15 years and older subjected to sexual violence by persons other than an intimate partner in the previous 12 months, by age and place of occurrence
2 C
5.3 Eliminate all harmful practices, such as child, early and forced marriage and female genital mutilation
5.3.1 Proportion of women aged 20–24 years who were married or in a union before age 15 and before age 18
2 B
5.3.2 Proportion of girls and women aged 15–49 years who have undergone female genital mutilation/cutting, by age
2 C
5.4 Recognize and value unpaid care and domestic work through the provision of public services, infrastructure and social protection policies and the promotion of shared responsibility within the household and the family as nationally appropriate
5.4.1 Proportion of time spent on unpaid domestic and care work, by sex, age and location• Female• Male
14.0%3.3%
2014 2 A2 KOSTAT, Time Use Survey
5.5 Ensure women’s full and effective participation and equal opportunities for leadership at all levels of deci-sion-making in political, economic and public life
5.5.1 Proportion of seats held by women in (a) na-tional parliaments and (b) local governments
2018 1(a)/2(b)
A2 Inter-Parliamentary Union (IPU), the database on Women in National ParliamentPercentage of women seats in the National
Assembly17%
5.5.2 Proportion of women in managerial posi-tions
12.3% 2017 1 A1 KOSTAT , Economically Active Population Survey
5.6 Ensure universal access to sexual and reproductive health and reproductive rights as agreed in accordance with the Programme of Action of the Inter-national Conference on Population and Development and the Beijing Platform for Action and the outcome documents of their review confer-ences
5.6.1 Proportion of women aged 15–49 years who make their own informed decisions regard-ing sexual relations, contraceptive use and reproductive health care
2 C
5.6.2 Number of countries with laws and regula-tions that guarantee full and equal access to women and men aged 15 years and older to sexual and reproductive health care, infor-mation and education
2 D
5.a Undertake reforms to give women equal rights to economic resources, as well as access to ownership and control over land and other forms of property, financial services, inheri-tance and natural resources, in accor-dance with national laws
5.a.1 (a) Proportion of total agricultural population with ownership or secure rights over agri-cultural land, by sex; and (b) share of women among owners or rights-bearers of agricul-tural land, by type of tenure
2 C
5.a.2 Proportion of countries where the legal framework (including customary law) guar-antees women’s equal rights to land owner-ship and/or control
2 D
5.b Enhance the use of enabling tech-nology, in particular information and communications technology, to pro-mote the empowerment of women
5.b.1 Proportion of individuals who own a mobile telephone, by sex• All• Female• Male
90.0%87.6%92.4%
2016 1 A1 ITU World Telecommunication, ICT Indicators database
5.c Adopt and strengthen sound policies and enforceable legislation for the promotion of gender equality and the empowerment of all women and girls at all levels
5.c.1 Proportion of countries with systems to track and make public allocations for gender equality and women’s empowerment
2 D

List of UN SDG Indicators • 85
Goal 6 Ensure availability and sustainable management of water and sanitation for all
Target Indicator Value Recent year
Global tier
Domestic tier Source
6.1 By 2030, achieve universal and eq-uitable access to safe and affordable drinking water for all
6.1.1 Proportion of population using safely man-aged drinking water services
98.0% 2015 2 A1 WHO/UNICEF,Joint Monitoring Programme for Water Supply, Sanitation and Hygiene
Waterworks penetration rate• Nationwide• Country
98.9%92.7%
2016 Ministry of Environment, Statistics of waterworks
6.2 By 2030, achieve access to adequate and equitable sanitation and hygiene for all and end open defecation, pay-ing special attention to the needs of women and girls and those in vulner-able situations
6.2.1 Proportion of population using (a) safely managed sanitation services and (b) a hand-washing facility with soap and water
98.5% 2015 2 A1 WHO/UNICEF, Joint Monitoring Programme for Water Supply, Sanitation and Hygiene
Sewerage penetration rate• Nationwide• Country
93.2%68.7%
2016 Ministry of Environment, Statistics of sewerage
6.3 By 2030, improve water quality by reducing pollution, eliminating dumping and minimizing release of hazardous chemicals and materials, halving the proportion of untreat-ed wasteswater and substantially increasing recycling and safe reuse globally
6.3.1 Proportion of wasteswater safely treated 2 B Ministry of Environment, Statistics of sewerage
Sewerage penetration rate• Nationwide• Country
93.2%68.7%
2016
6.3.2 Proportion of bodies of water with good ambient water quality
87.3% 2017 2 A1 Environment Live
6.4 By 2030, substantially increase wa-ter-use efficiency across all sectors and ensure sustainable withdrawals and supply of freshwater to address water scarcity and substantially re-duce the number of people suffering from water scarcity
6.4.1 Change in water-use efficiency over time 2 C
6.4.2 Level of water stress: freshwater withdraw-al as a proportion of available freshwater resources
57.6% 2014 1 A1 FAO
6.5 By 2030, implement integrated water resources management at all levels, including through transboundary co-operation as appropriate
6.5.1 Degree of integrated water resources man-agement implementation (0–100)
1 D
6.5.2 Proportion of transboundary basin area with an operational arrangement for water cooperation
2 D
6.6 By 2020, protect and restore wa-ter-related ecosystems, including mountains, forests, wetlands, rivers, aquifers and lakes
6.6.1 Change in the extent of water-related eco-systems over time
2 C
6.a By 2030, expand international coop-eration and capacity-building support to developing countries in water- and sanitation-related activities and pro-grammes, including water harvest-ing, desalination, water efficiency, wasteswater treatment, recycling and reuse technologies
6.a.1 Amount of water- and sanitation-related of-ficial development assistance that is part of a government-coordinated spending plan
1 D
6.b Support and strengthen the par-ticipation of local communities in improving water and sanitation man-agement
6.b.1 Proportion of local administrative units with established and operational policies and procedures for participation of local communities in water and sanitation man-agement
1 D
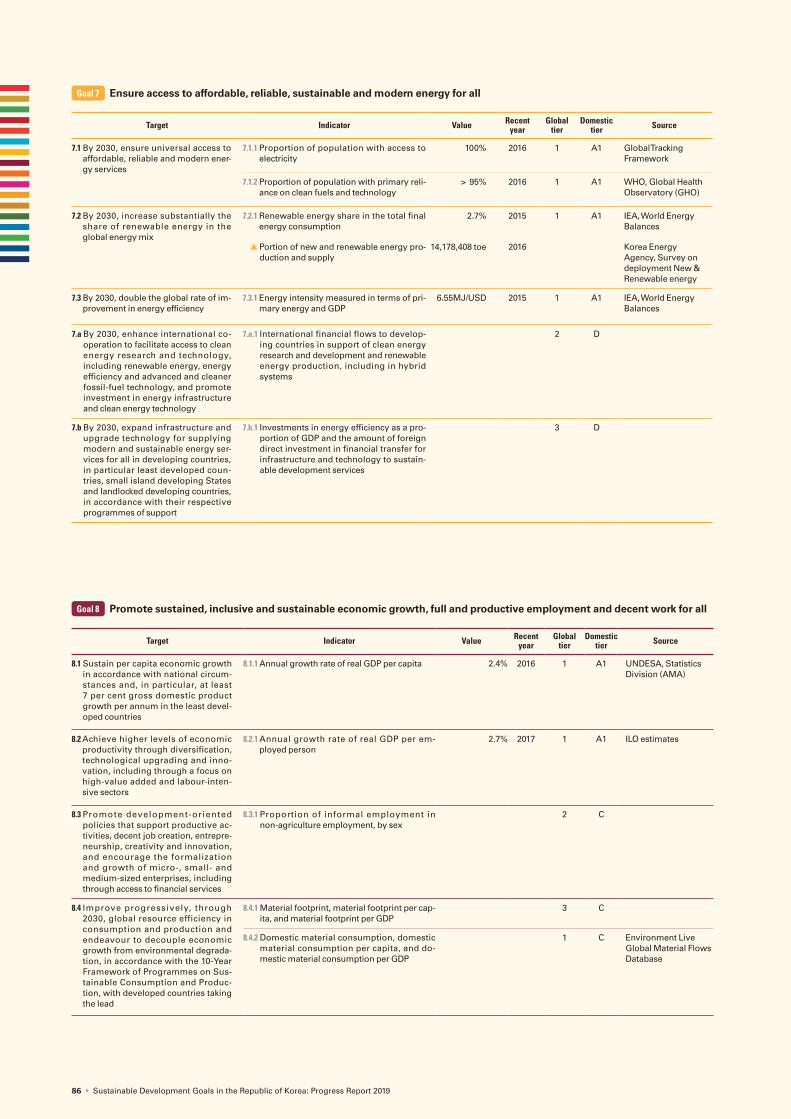
86 • Sustainable Development Goals in the Republic of Korea: Progress Report 2019
Goal 7 Ensure access to affordable, reliable, sustainable and modern energy for all
Target Indicator Value Recent year
Global tier
Domestic tier Source
7.1 By 2030, ensure universal access to affordable, reliable and modern ener-gy services
7.1.1 Proportion of population with access to electricity
100% 2016 1 A1 Global Tracking Framework
7.1.2 Proportion of population with primary reli-ance on clean fuels and technology
> 95% 2016 1 A1 WHO, Global Health Observatory (GHO)
7.2 By 2030, increase substantially the share of renewable energy in the global energy mix
7.2.1 Renewable energy share in the total final energy consumption
2.7% 2015 1 A1 IEA, World Energy Balances
Portion of new and renewable energy pro-duction and supply
14,178,408 toe 2016 Korea Energy Agency, Survey on deployment New & Renewable energy
7.3 By 2030, double the global rate of im-provement in energy efficiency
7.3.1 Energy intensity measured in terms of pri-mary energy and GDP
6.55MJ/USD 2015 1 A1 IEA, World Energy Balances
7.a By 2030, enhance international co-operation to facilitate access to clean energy research and technology, including renewable energy, energy efficiency and advanced and cleaner fossil-fuel technology, and promote investment in energy infrastructure and clean energy technology
7.a.1 International financial flows to develop-ing countries in support of clean energy research and development and renewable energy production, including in hybrid systems
2 D
7.b By 2030, expand infrastructure and upgrade technology for supplying modern and sustainable energy ser-vices for all in developing countries, in particular least developed coun-tries, small island developing States and landlocked developing countries, in accordance with their respective programmes of support
7.b.1 Investments in energy efficiency as a pro-portion of GDP and the amount of foreign direct investment in financial transfer for infrastructure and technology to sustain-able development services
3 D
Goal 8 Promote sustained, inclusive and sustainable economic growth, full and productive employment and decent work for all
Target Indicator Value Recent year
Global tier
Domestic tier Source
8.1 Sustain per capita economic growth in accordance with national circum-stances and, in particular, at least 7 per cent gross domestic product growth per annum in the least devel-oped countries
8.1.1 Annual growth rate of real GDP per capita 2.4% 2016 1 A1 UNDESA, Statistics Division (AMA)
8.2 Achieve higher levels of economic productivity through diversification, technological upgrading and inno-vation, including through a focus on high-value added and labour-inten-sive sectors
8.2.1 Annual growth rate of real GDP per em-ployed person
2.7% 2017 1 A1 ILO estimates
8.3 Promote development-oriented policies that support productive ac-tivities, decent job creation, entrepre-neurship, creativity and innovation, and encourage the formalization and growth of micro-, small- and medium-sized enterprises, including through access to financial services
8.3.1 Proportion of informal employment in non-agriculture employment, by sex
2 C
8.4 Improve progressively, through 2030, global resource efficiency in consumption and production and endeavour to decouple economic growth from environmental degrada-tion, in accordance with the 10-Year Framework of Programmes on Sus-tainable Consumption and Produc-tion, with developed countries taking the lead
8.4.1 Material footprint, material footprint per cap-ita, and material footprint per GDP
3 C
8.4.2 Domestic material consumption, domestic material consumption per capita, and do-mestic material consumption per GDP
1 C Environment Live Global Material Flows Database
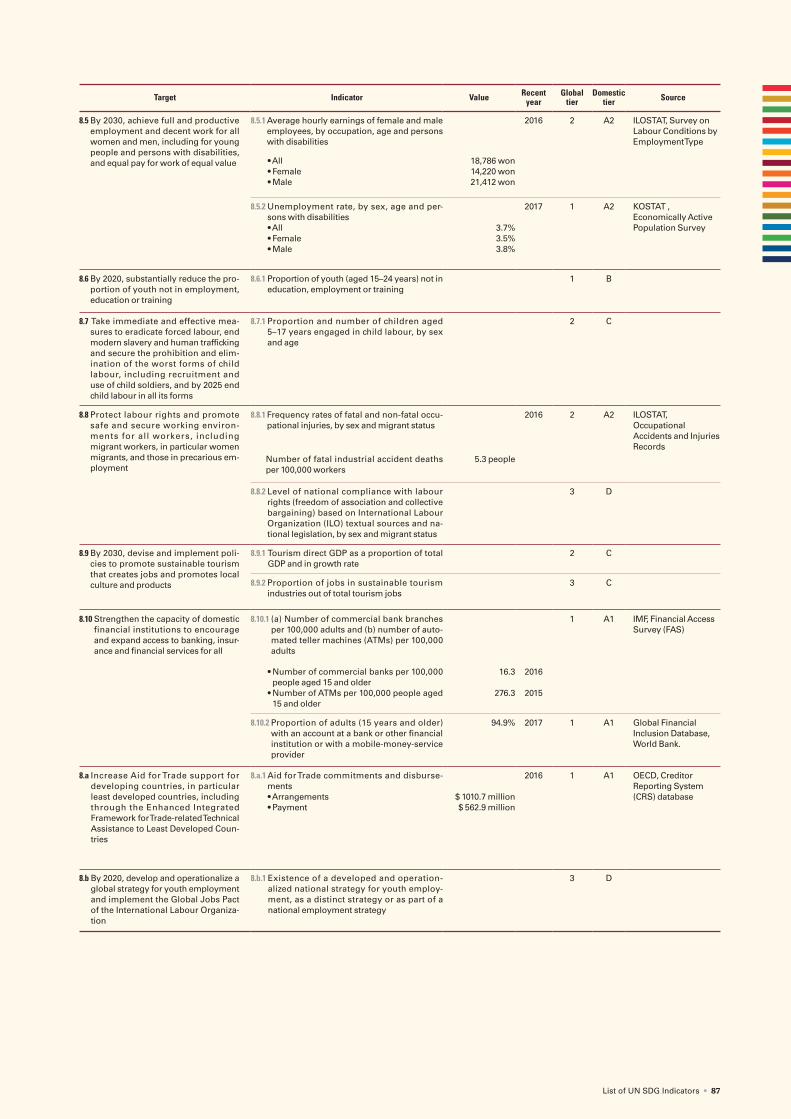
List of UN SDG Indicators • 87
Target Indicator Value Recent year
Global tier
Domestic tier Source
8.5 By 2030, achieve full and productive employment and decent work for all women and men, including for young people and persons with disabilities, and equal pay for work of equal value
8.5.1 Average hourly earnings of female and male employees, by occupation, age and persons with disabilities
2016 2 A2 ILOSTAT, Survey on Labour Conditions by Employment Type
• All• Female• Male
18,786 won14,220 won21,412 won
8.5.2 Unemployment rate, by sex, age and per-sons with disabilities• All• Female• Male
3.7%3.5%3.8%
2017 1 A2 KOSTAT , Economically Active Population Survey
8.6 By 2020, substantially reduce the pro-portion of youth not in employment, education or training
8.6.1 Proportion of youth (aged 15–24 years) not in education, employment or training
1 B
8.7 Take immediate and effective mea-sures to eradicate forced labour, end modern slavery and human trafficking and secure the prohibition and elim-ination of the worst forms of child labour, including recruitment and use of child soldiers, and by 2025 end child labour in all its forms
8.7.1 Proportion and number of children aged 5–17 years engaged in child labour, by sex and age
2 C
8.8 Protect labour rights and promote safe and secure working environ-ments for all workers, including migrant workers, in particular women migrants, and those in precarious em-ployment
8.8.1 Frequency rates of fatal and non-fatal occu-pational injuries, by sex and migrant status
2016 2 A2 ILOSTAT, Occupational Accidents and Injuries Records
Number of fatal industrial accident deaths per 100,000 workers
5.3 people
8.8.2 Level of national compliance with labour rights (freedom of association and collective bargaining) based on International Labour Organization (ILO) textual sources and na-tional legislation, by sex and migrant status
3 D
8.9 By 2030, devise and implement poli-cies to promote sustainable tourism that creates jobs and promotes local culture and products
8.9.1 Tourism direct GDP as a proportion of total GDP and in growth rate
2 C
8.9.2 Proportion of jobs in sustainable tourism industries out of total tourism jobs
3 C
8.10 Strengthen the capacity of domestic financial institutions to encourage and expand access to banking, insur-ance and financial services for all
8.10.1 (a) Number of commercial bank branches per 100,000 adults and (b) number of auto-mated teller machines (ATMs) per 100,000 adults
1 A1 IMF, Financial Access Survey (FAS)
• Number of commercial banks per 100,000 people aged 15 and older
• Number of ATMs per 100,000 people aged 15 and older
16.3
276.3
2016
2015
8.10.2 Proportion of adults (15 years and older) with an account at a bank or other financial institution or with a mobile-money-service provider
94.9% 2017 1 A1 Global Financial Inclusion Database, World Bank.
8.a Increase Aid for Trade support for developing countries, in particular least developed countries, including through the Enhanced Integrated Framework for Trade-related Technical Assistance to Least Developed Coun-tries
8.a.1 Aid for Trade commitments and disburse-ments• Arrangements• Payment
$ 1010.7 million$ 562.9 million
2016 1 A1 OECD, Creditor Reporting System (CRS) database
8.b By 2020, develop and operationalize a global strategy for youth employment and implement the Global Jobs Pact of the International Labour Organiza-tion
8.b.1 Existence of a developed and operation-alized national strategy for youth employ-ment, as a distinct strategy or as part of a national employment strategy
3 D

88 • Sustainable Development Goals in the Republic of Korea: Progress Report 2019
Goal 9 Build resilient infrastructure, promote inclusive and sustainable industrialization and foster innovation
Target Indicator Value Recent year
Global tier
Domestic tier Source
9.1 Develop quality, reliable, sustainable and resilient infrastructure, including regional and transborder infrastruc-ture, to support economic develop-ment and human well-being, with a focus on affordable and equitable access for all
9.1.1 Proportion of the rural population who live within 2 km of an all-season road
3 C
9.1.2 Passenger and freight volumes, by mode of transport
2016 1 A1
• Airline- Passenger- Freight
131,890,017,373(T_km)11,484,878,507(T_km)
International Civil Aviation Organization (ICAO)
• Railway- Passenger- Freight
71,325,055,642(P_km)10,086,403,518(P_km)
The International Transport Forum at the OECD (ITF-OECD)
9.2 Promote inclusive and sustainable industrialization and, by 2030, sig-nificantly raise industry’s share of employment and gross domestic product, in line with national circum-stances, and double its share in least developed countries
9.2.1 Manufacturing value added as a propor-tion of GDP and per capita
28.6% 2017 1 A1 UNIDO MVA 2018 Da-tabase.
9.2.2 Manufacturing employment as a propor-tion of total employment
16.8% 2017 1 A1 ILOSTAT, Employment by sex and economic activity
9.3 Increase the access of small-scale industrial and other enterprises, in particular in developing countries, to financial services, including afford-able credit, and their integration into value chains and markets
9.3.1 Proportion of small-scale industries in total industry value added
7.3% 2013 2 C OECD Structural and Demographic Busi-ness Statistics (SDBS) database
9.3.2 Proportion of small-scale industries with a loan or line of credit
2 C
9.4 By 2030, upgrade infrastructure and retrofit industries to make them sus-tainable, with increased resource-use efficiency and greater adoption of clean and environmentally sound technologies and industrial process-es, with all countries taking action in accordance with their respective capabilities
9.4.1 CO2 emission per unit of value added 1 A1
CO2 emissions relative to GDP 0.34kg/US dollar
2015 IEA, CO2 Emissions from Fuel Combustion Statistics 2017
9.5 Enhance scientific research, upgrade the technological capabilities of industrial sectors in all countries, in particular developing countries, including, by 2030, encouraging in-novation and substantially increasing the number of research and develop-ment workers per 1 million people and public and private research and development spending
9.5.1 Research and development expenditure as a proportion of GDP
4.2% 2015 1 A1 OECD, Research and Development Statis-tics
9.5.2 Researchers (in full-time equivalent) per million inhabitants
7,045people 2015 1 A1 OECD, Research and Development Statis-tics
9.a Facilitate sustainable and resilient infrastructure development in devel-oping countries through enhanced financial, technological and technical support to African countries, least developed countries, landlocked de-veloping countries and small island developing States
9.a.1 Total official international support (official development assistance plus other official flows) to infrastructure
1 C
9.b Support domestic technology de-velopment, research and innovation in developing countries, including by ensuring a conducive policy en-vironment for, inter alia, industrial diversification and value addition to commodities
9.b.1 Proportion of medium and high-tech in-dustry value added in total value added
63.7% 2015 1 C UNIDO CIP 2016 Data-base
9.c Significantly increase access to infor-mation and communications technol-ogy and strive to provide universal and affordable access to the Internet in least developed countries by 2020
9.c.1 Proportion of population covered by a mo-bile network, by technology
99.9% 2016 1 C Korea Communica-tions Commission
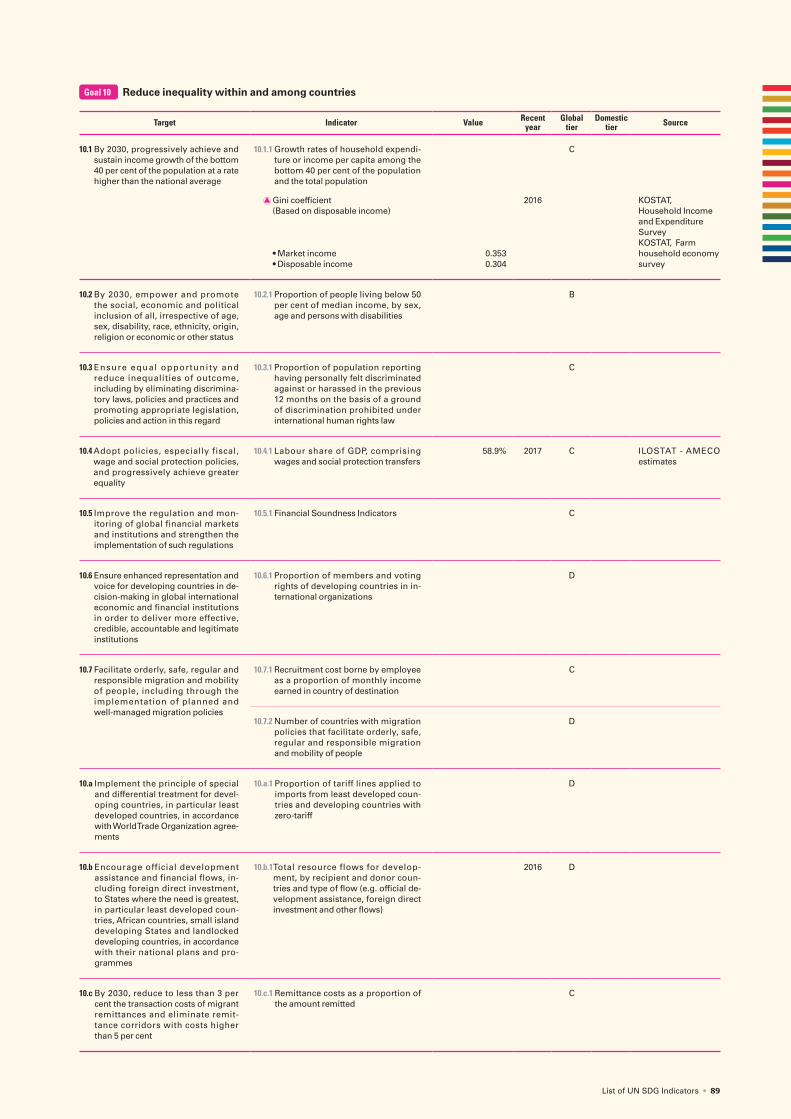
List of UN SDG Indicators • 89
Goal 10 Reduce inequality within and among countries
Target Indicator Value Recent year
Global tier
Domestic tier Source
10.1 By 2030, progressively achieve and sustain income growth of the bottom 40 per cent of the population at a rate higher than the national average
10.1.1 Growth rates of household expendi-ture or income per capita among the bottom 40 per cent of the population and the total population
C
Gini coefficient (Based on disposable income)
• Market income• Disposable income
0.3530.304
2016 KOSTAT, Household Income and Expenditure SurveyKOSTAT, Farm household economy survey
10.2 By 2030, empower and promote the social, economic and political inclusion of all, irrespective of age, sex, disability, race, ethnicity, origin, religion or economic or other status
10.2.1 Proportion of people living below 50 per cent of median income, by sex, age and persons with disabilities
B
10.3 Ensure equal opportunity and reduce inequalities of outcome, including by eliminating discrimina-tory laws, policies and practices and promoting appropriate legislation, policies and action in this regard
10.3.1 Proportion of population reporting having personally felt discriminated against or harassed in the previous 12 months on the basis of a ground of discrimination prohibited under international human rights law
C
10.4 Adopt policies, especially fiscal, wage and social protection policies, and progressively achieve greater equality
10.4.1 Labour share of GDP, comprising wages and social protection transfers
58.9% 2017 C ILOSTAT - AMECO estimates
10.5 Improve the regulation and mon-itoring of global financial markets and institutions and strengthen the implementation of such regulations
10.5.1 Financial Soundness Indicators C
10.6 Ensure enhanced representation and voice for developing countries in de-cision-making in global international economic and financial institutions in order to deliver more effective, credible, accountable and legitimate institutions
10.6.1 Proportion of members and voting rights of developing countries in in-ternational organizations
D
10.7 Facilitate orderly, safe, regular and responsible migration and mobility of people, including through the implementation of planned and well-managed migration policies
10.7.1 Recruitment cost borne by employee as a proportion of monthly income earned in country of destination
C
10.7.2 Number of countries with migration policies that facilitate orderly, safe, regular and responsible migration and mobility of people
D
10.a Implement the principle of special and differential treatment for devel-oping countries, in particular least developed countries, in accordance with World Trade Organization agree-ments
10.a.1 Proportion of tariff lines applied to imports from least developed coun-tries and developing countries with zero-tariff
D
10.b Encourage official development assistance and financial flows, in-cluding foreign direct investment, to States where the need is greatest, in particular least developed coun-tries, African countries, small island developing States and landlocked developing countries, in accordance with their national plans and pro-grammes
10.b.1 Total resource flows for develop-ment, by recipient and donor coun-tries and type of flow (e.g. official de-velopment assistance, foreign direct investment and other flows)
2016 D
10.c By 2030, reduce to less than 3 per cent the transaction costs of migrant remittances and eliminate remit-tance corridors with costs higher than 5 per cent
10.c.1 Remittance costs as a proportion of the amount remitted
C
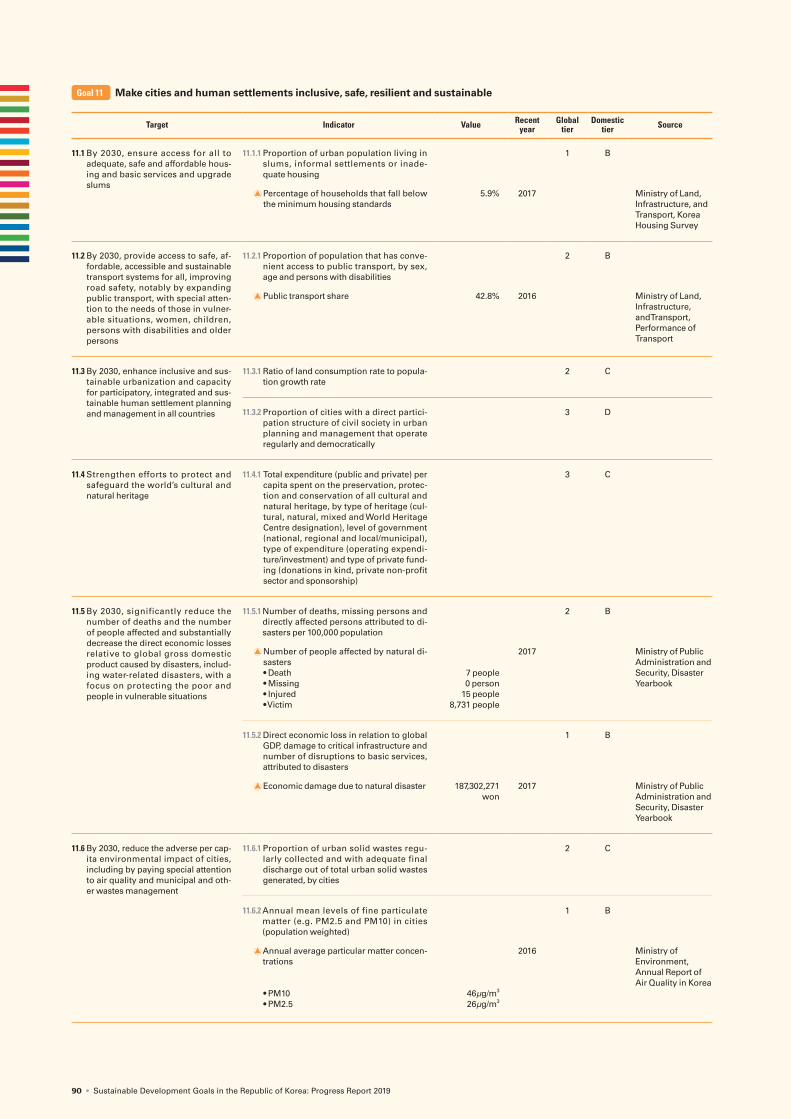
90 • Sustainable Development Goals in the Republic of Korea: Progress Report 2019
Goal 11 Make cities and human settlements inclusive, safe, resilient and sustainable
Target Indicator Value Recent year
Global tier
Domestic tier Source
11.1 By 2030, ensure access for all to adequate, safe and affordable hous-ing and basic services and upgrade slums
11.1.1 Proportion of urban population living in slums, informal settlements or inade-quate housing
1 B
Percentage of households that fall below the minimum housing standards
5.9% 2017 Ministry of Land, Infrastructure, and Transport, Korea Housing Survey
11.2 By 2030, provide access to safe, af-fordable, accessible and sustainable transport systems for all, improving road safety, notably by expanding public transport, with special atten-tion to the needs of those in vulner-able situations, women, children, persons with disabilities and older persons
11.2.1 Proportion of population that has conve-nient access to public transport, by sex, age and persons with disabilities
2 B
Public transport share 42.8% 2016 Ministry of Land, Infrastructure, and Transport, Performance of Transport
11.3 By 2030, enhance inclusive and sus-tainable urbanization and capacity for participatory, integrated and sus-tainable human settlement planning and management in all countries
11.3.1 Ratio of land consumption rate to popula-tion growth rate
2 C
11.3.2 Proportion of cities with a direct partici-pation structure of civil society in urban planning and management that operate regularly and democratically
3 D
11.4 Strengthen efforts to protect and safeguard the world’s cultural and natural heritage
11.4.1 Total expenditure (public and private) per capita spent on the preservation, protec-tion and conservation of all cultural and natural heritage, by type of heritage (cul-tural, natural, mixed and World Heritage Centre designation), level of government (national, regional and local/municipal), type of expenditure (operating expendi-ture/investment) and type of private fund-ing (donations in kind, private non-profit sector and sponsorship)
3 C
11.5 By 2030, significantly reduce the number of deaths and the number of people affected and substantially decrease the direct economic losses relative to global gross domestic product caused by disasters, includ-ing water-related disasters, with a focus on protecting the poor and people in vulnerable situations
11.5.1 Number of deaths, missing persons and directly affected persons attributed to di-sasters per 100,000 population
2 B
Number of people affected by natural di-sasters• Death• Missing• Injured• Victim
7 people0 person
15 people8,731 people
2017 Ministry of Public Administration and Security, Disaster Yearbook
11.5.2 Direct economic loss in relation to global GDP, damage to critical infrastructure and number of disruptions to basic services, attributed to disasters
1 B
Economic damage due to natural disaster 187,302,271 won
2017 Ministry of Public Administration and Security, Disaster Yearbook
11.6 By 2030, reduce the adverse per cap-ita environmental impact of cities, including by paying special attention to air quality and municipal and oth-er wastes management
11.6.1 Proportion of urban solid wastes regu-larly collected and with adequate final discharge out of total urban solid wastes generated, by cities
2 C
11.6.2 Annual mean levels of fine particulate matter (e.g. PM2.5 and PM10) in cities (population weighted)
1 B
Annual average particular matter concen-trations
• PM10• PM2.5
46μg/m3
26μg/m3
2016 Ministry of Environment, Annual Report of Air Quality in Korea

List of UN SDG Indicators • 91
Target Indicator Value Recent year
Global tier
Domestic tier Source
11.7 By 2030, provide universal access to safe, inclusive and accessible, green and public spaces, in particular for women and children, older persons and persons with disabilities
11.7.1 Average share of the built-up area of cities that is open space for public use for all, by sex, age and persons with disabilities
3 C
11.7.2 Proportion of persons victim of physical or sexual harassment, by sex, age, dis-ability status and place of occurrence, in the previous 12 months
3 C
11.a Support positive economic, social and environmental links between urban, peri-urban and rural areas by strengthening national and regional development planning
11.a.1 Proportion of population living in cities that implement urban and regional de-velopment plans integrating population projections and resource needs, by size of city
3 D
11.b By 2020, substantially increase the number of cities and human settle-ments adopting and implementing integrated policies and plans to-wards inclusion, resource efficiency, mitigation and adaptation to climate change, resilience to disasters, and develop and implement, in line with the Sendai Framework for Disaster Risk Reduction 2015–2030, holistic disaster risk management at all lev-els
11.b.1 Number of countries that adopt and implement national disaster risk reduc-tion strategies in line with the Sendai Framework for Disaster Risk Reduction 2015–2030
1 D
11.b.2 Proportion of local governments that adopt and implement local disaster risk reduction strategies in line with national disaster risk reduction strategies
2 D
11.c Support least developed countries, including through financial and tech-nical assistance, in building sustain-able and resilient buildings utilizing local materials
11.c.1 Proportion of financial support to the least developed countries that is allocated to the construction and retrofitting of sus-tainable, resilient and resource-efficient buildings utilizing local materials
3 D
Goal 12 Ensure sustainable consumption and production patterns
Target Indicator Value Recent year
Global tier
Domestic tier Source
12.1 Implement the 10-Year Framework of Programmes on Sustainable Con-sumption and Production Patterns, all countries taking action, with developed countries taking the lead, taking into account the development and capabilities of developing coun-tries
12.1.1 Number of countries with sustainable consumption and production (SCP) na-tional action plans or SCP mainstreamed as a priority or a target into national poli-cies
2 D
12.2 By 2030, achieve the sustainable management and efficient use of natural resources
12.2.1 Material footprint, material footprint per capita, and material footprint per GDP
3 C
12.2.2 Domestic material consumption, domes-tic material consumption per capita, and domestic material consumption per GDP
1 C
12.3 By 2030, halve per capita global food wastes at the retail and consumer levels and reduce food losses along production and supply chains, in-cluding post-harvest losses
12.3.1 (a) Food loss index and (b) food wastes index
3 B
Food wastes generation (1 day) 14,389tons 2016 Ministry of Environment, Status of Waste Generation and Treatment
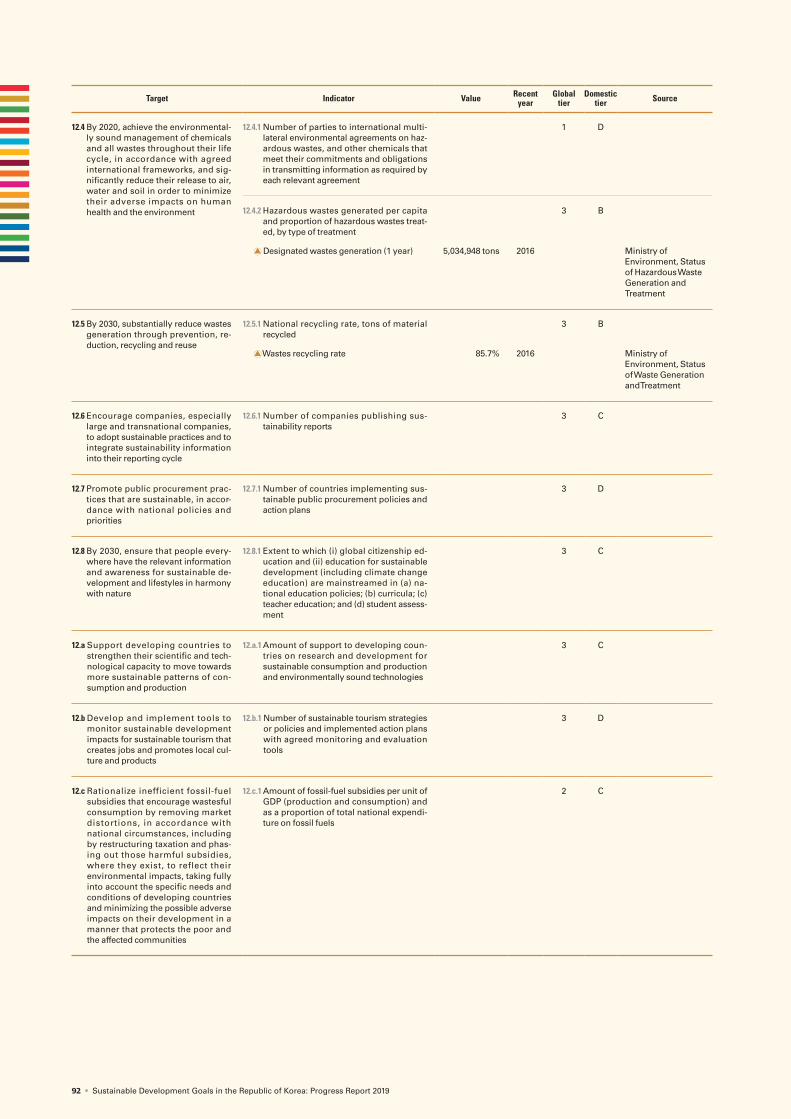
92 • Sustainable Development Goals in the Republic of Korea: Progress Report 2019
Target Indicator Value Recent year
Global tier
Domestic tier Source
12.4 By 2020, achieve the environmental-ly sound management of chemicals and all wastes throughout their life cycle, in accordance with agreed international frameworks, and sig-nificantly reduce their release to air, water and soil in order to minimize their adverse impacts on human health and the environment
12.4.1 Number of parties to international multi-lateral environmental agreements on haz-ardous wastes, and other chemicals that meet their commitments and obligations in transmitting information as required by each relevant agreement
1 D
12.4.2 Hazardous wastes generated per capita and proportion of hazardous wastes treat-ed, by type of treatment
3 B
Designated wastes generation (1 year) 5,034,948 tons 2016 Ministry of Environment, Status of Hazardous Waste Generation and Treatment
12.5 By 2030, substantially reduce wastes generation through prevention, re-duction, recycling and reuse
12.5.1 National recycling rate, tons of material recycled
3 B
Wastes recycling rate 85.7% 2016 Ministry of Environment, Status of Waste Generation and Treatment
12.6 Encourage companies, especially large and transnational companies, to adopt sustainable practices and to integrate sustainability information into their reporting cycle
12.6.1 Number of companies publishing sus-tainability reports
3 C
12.7 Promote public procurement prac-tices that are sustainable, in accor-dance with national policies and priorities
12.7.1 Number of countries implementing sus-tainable public procurement policies and action plans
3 D
12.8 By 2030, ensure that people every-where have the relevant information and awareness for sustainable de-velopment and lifestyles in harmony with nature
12.8.1 Extent to which (i) global citizenship ed-ucation and (ii) education for sustainable development (including climate change education) are mainstreamed in (a) na-tional education policies; (b) curricula; (c) teacher education; and (d) student assess-ment
3 C
12.a Support developing countries to strengthen their scientific and tech-nological capacity to move towards more sustainable patterns of con-sumption and production
12.a.1 Amount of support to developing coun-tries on research and development for sustainable consumption and production and environmentally sound technologies
3 C
12.b Develop and implement tools to monitor sustainable development impacts for sustainable tourism that creates jobs and promotes local cul-ture and products
12.b.1 Number of sustainable tourism strategies or policies and implemented action plans with agreed monitoring and evaluation tools
3 D
12.c Rationalize inefficient fossil-fuel subsidies that encourage wastesful consumption by removing market distortions, in accordance with national circumstances, including by restructuring taxation and phas-ing out those harmful subsidies, where they exist, to reflect their environmental impacts, taking fully into account the specific needs and conditions of developing countries and minimizing the possible adverse impacts on their development in a manner that protects the poor and the affected communities
12.c.1 Amount of fossil-fuel subsidies per unit of GDP (production and consumption) and as a proportion of total national expendi-ture on fossil fuels
2 C

List of UN SDG Indicators • 93
Goal 13 Take urgent action to combat climate change and its impacts
Target Indicator Value Recent year
Global tier
Domestic tier Source
13.1 Strengthen resilience and adaptive capacity to climate-related hazards and natural disasters in all countries
13.1.1 Number of deaths, missing persons and directly affected persons attributed to disasters per 100,000 population Number of people affected by natural disasters• Death• Missing• Injured• Victim
7people0person
15people8,731people
2017 B Ministry of Public Administration and Security, Disaster Yearbook
13.1.2 Number of countries that adopt and implement national disaster risk reduc-tion strategies in line with the Sendai Framework for Disaster Risk Reduction 2015–2030
D
13.1.3 Proportion of local governments that adopt and implement local disaster risk reduction strategies in line with national disaster risk reduction strategies
D
13.2 Integrate climate change measures into national policies, strategies and planning
13.2.1 Number of countries that have commu-nicated the establishment or operation-alization of an integrated policy/strate-gy/plan which increases their ability to adapt to the adverse impacts of climate change, and foster climate resilience and low greenhouse gas emissions development in a manner that does not threaten food production (including a national adaptation plan, nationally determined contribution, national com-munication, biennial update report or other)
D
GHG Emissions• Total emissions• Net emissions• Energy• Industrial process• Agriculture• Wastes
2016 Greenhouse Gas Inventory and Research Center, 2018 National Greenhouse Gas Inventory
GHG emissions per capita 13.5 tons CO2eq.
GHG emissions relative to real GDP
13.3 Improve education, awareness-rais-ing and human and institutional ca-pacity on climate change mitigation, adaptation, impact reduction and early warning
13.3.1 Number of countries that have integrat-ed mitigation, adaptation, impact re-duction and early warning into primary, secondary and tertiary curricula
D
13.3.2 Number of countries that have com-municated the strengthening of institu-tional, systemic and individual capac-ity-building to implement adaptation, mitigation and technology transfer, and development actions
D
13.a Implement the commitment under-taken by developed-country parties to the United Nations Framework Convention on Climate Change to a goal of mobilizing jointly $100 billion annually by 2020 from all sources to address the needs of developing countries in the context of meaning-ful mitigation actions and transpar-ency on implementation and fully operationalize the Green Climate Fund through its capitalization as soon as possible
13.a.1 Mobilized amount of United States dollars per year between 2020 and 2025 accountable towards the $100 billion commitment
D
13.b Promote mechanisms for rais-ing capacity for effective climate change-related planning and man-agement in least developed coun-tries and small island developing States, including focusing on wom-en, youth and local and marginalized communities
13.b.1 Number of least developed countries and small island developing States that are receiving specialized support, and amount of support, including finance, technology and capacity-building, for mechanisms for raising capacities for effective climate change-related plan-ning and management, including fo-cusing on women, youth and local and marginalized communities
D
694.1million tons CO2eq.649.6 million tons CO2eq.604.8 million tons CO2eq.
51.5 million tons CO2eq.21.2 million tons CO2eq.16.5 million tons CO2eq.
459.7 tons CO2eq./1 billon won

94 • Sustainable Development Goals in the Republic of Korea: Progress Report 2019
Goal 14 Conserve and sustainably use the oceans, seas and marine resources for sustainable development
Target Indicator Value Recent year
Global tier
Domestic tier Source
14.1 By 2025, prevent and significantly reduce marine pollu-tion of all kinds, in particular from land-based activities, including marine debris and nutrient pollution
14.1.1 Index of coastal eutrophi-cation and floating plastic debris density
3 B
Coastal litter status• Plastics• Others
3,835kg5,958kg
2017 Marine Environment Management Corporation, Marine ecosystem information(Coastal Litter Status_
14.2 By 2020, sustainably manage and protect marine and coastal ecosystems to avoid significant adverse impacts, including by strengthening their resilience, and take action for their restoration in order to achieve healthy and productive oceans
14.2.1 Proport ion o f na t iona l exclusive economic zones managed using ecosys-tem-based approaches
3 C
14.3 Minimize and address the impacts of ocean acidifica-tion, including through enhanced scientific cooperation at all levels
14.3.1 Average marine acidity (pH) measured at agreed suite of representative sampling stations
8.16 2017 3 A1 Ministry of Oceans and Fisheries, Seawater Quality
14.4 By 2020, effectively regulate harvesting and end over-fishing, illegal, unreported and unregulated fishing and destructive fishing practices and implement sci-ence-based management plans, in order to restore fish stocks in the shortest time feasible, at least to levels that can produce maximum sustainable yield as deter-mined by their biological characteristics
14.4.1 Proportion of fish stocks within biologically sustain-able levels
1 C
14.5 By 2020, conserve at least 10 per cent of coastal and marine areas, consistent with national and internation-al law and based on the best available scientific infor-mation
14.5.1 Coverage of protected areas in relation to marine areas
1 B
Protected marine area 1777.4km2 2018 Marine Environment Management Corporation,Marine Ecological Information Nara Protected Marine Area Status
14.6 By 2020, prohibit certain forms of fisheries subsidies which contribute to overcapacity and overfishing, elim-inate subsidies that contribute to illegal, unreported and unregulated fishing and refrain from introducing new such subsidies, recognizing that appropriate and effective special and differential treatment for develop-ing and least developed countries should be an integral part of the World Trade Organization fisheries subsidies negotiation
14.6.1 Degree of implementation of international instruments aiming to combat illegal, unreported and unregulated fishing
2 D
14.7 By 2030, increase the economic benefits to small island developing States and least developed countries from the sustainable use of marine resources, including through sustainable management of fisheries, aqua-culture and tourism
14.7.1 Sustainable fisheries as a proportion of GDP in small island developing States, least developed countries and all countries
3 C
14.a Increase scientific knowledge, develop research capac-ity and transfer marine technology, taking into account the Intergovernmental Oceanographic Commission Criteria and Guidelines on the Transfer of Marine Technology, in order to improve ocean health and to enhance the contribution of marine biodiversity to the development of developing countries, in particular small island developing States and least developed countries
14.a.1 Proportion of total research budget allocated to research in the field of marine tech-nology
0.3% 2013 2 A1 Country submission for Ocean Science data and UIS for R&D
14.b Provide access for small-scale artisanal fishers to ma-rine resources and markets
14.b.1 Degree of application of a legal/regulatory/ policy/in-stitutional framework which recognizes and protects access rights for small-scale fisheries
2 D
14.c Strengthen the conservation and sustainable use of the ocean and its 14.c Enhance the conservation and sustainable use of oceans and their resources by im-plementing international law as reflected in the United Nations Convention on the Law of the Sea, which provides the legal framework for the conservation and sustainable use of oceans and their resources, as recalled in paragraph 158 of “The future we want” by implementing international law reflected in the UN Convention on the Law of the Sea, which provides a legal framework for the conservation and sustainable use of the ocean and its resources while recalling sec-tion 158 of the ”Future We Want“ report
14.c.1 Number of countries mak-ing progress in ratifying, ac-cepting and implementing through legal, policy and institutional frameworks, ocean-related instruments that implement internation-al law, as reflected in the United Nations Convention on the Law of the Sea, for the conservation and sus-tainable use of the oceans and their resources
3 D
List of UN SDG Indicators • 95
Goal 15 Protect, restore and promote sustainable use of terrestrial ecosystems, sustainably manage forests, combat desertification, and halt and reverse land degradation and halt biodiversity loss
Target Indicator Value Recent year
Global tier
Domestic tier Source
15.1 By 2020, ensure the conservation, restoration and sustainable use of terrestrial and inland freshwater ecosystems and their services, in particular forests, wetlands, mountains and drylands, in line with obli-gations under international agreements
15.1.1 Forest area as a proportion of total land area
63.2% 2015 1 A1 FAO
15.1.2 Proportion of important sites for terrestrial and freshwater biodiversity that are covered by pro-tected areas, by ecosys-tem type• Land• Freshwater
36.6%36.8%
2017 1 C Birdlife International
15.2 By 2020, promote the implementation of sustainable management of all types of forests, halt deforestation, restore degraded forests and substantially increase afforestation and reforestation globally
15.2.1 Progress towards sustain-able forest management
1 D
15.3 By 2030, combat desertification, restore degraded land and soil, including land affected by desertifica-tion, drought and floods, and strive to achieve a land degradation-neutral world
15.3.1 Proportion of land that is degraded over total land area
2 C
15.4 By 2030, ensure the conservation of mountain ecosys-tems, including their biodiversity, in order to enhance their capacity to provide benefits that are essential for sustainable development
15.4.1 Coverage by protected areas of important sites for mountain biodiversity
1 C
15.4.2 Mountain Green Cover Index
96.3 2017 1 A1 FAO
15.5 Take urgent and significant action to reduce the deg-radation of natural habitats, halt the loss of biodiversi-ty and, by 2020, protect and prevent the extinction of threatened species
15.5.1 Red List Index 1 B
The ROK’s Red List• Fear of extinction 533 species
2018 National Institute of Biological Resources
15.6 Promote fair and equitable sharing of the benefits arising from the utilization of genetic resources and promote appropriate access to such resources, as in-ternationally agreed
15.6.1 Number of countries that have adopted legislative, administrative and policy frameworks to ensure fair and equitable sharing of benefits
1 D
15.7 Take urgent action to end poaching and trafficking of protected species of flora and fauna and address both demand and supply of illegal wildlife products
15.7.1 Proportion of traded wild-life that was poached or illicitly trafficked
2 C
15.8 By 2020, introduce measures to prevent the introduc-tion and significantly reduce the impact of invasive alien species on land and water ecosystems and con-trol or eradicate the priority species
15.8.1 Proportion of countries adopting relevant national legislation and adequately resourcing the prevention or control of invasive alien species
2 D
15.9 By 2020, integrate ecosystem and biodiversity values into national and local planning, development pro-cesses, poverty reduction strategies and accounts
15.9.1 Progress towards national targets establ ished in accordance with Aichi Biodiversity Target 2 of the Strategic Plan for Biodi-versity 2011–2020
3 D
15.a Mobilize and significantly increase financial resources from all sources to conserve and sustainably use bio-diversity and ecosystems
15.a.1 O ff i c ia l deve lopment assistance and public ex-penditure on conservation and sustainable use of bio-diversity and ecosystems
1/3 D
15.b Mobilize significant resources from all sources and at all levels to finance sustainable forest management and provide adequate incentives to developing coun-tries to advance such management, including for conservation and reforestation
15.b.1 O ff i c ia l deve lopment assistance and public ex-penditure on conservation and sustainable use of bio-diversity and ecosystems
1/3 D
15.c Enhance global support for efforts to combat poach-ing and trafficking of protected species, including by increasing the capacity of local communities to pur-sue sustainable livelihood opportunities
15.c.1 Proportion of traded wild-life that was poached or illicitly trafficked
2 C

96 • Sustainable Development Goals in the Republic of Korea: Progress Report 2019
Goal 16 Promote peaceful and inclusive societies for sustainable development, provide access to justice for all and build effective, accountable and inclusive institutions at all levels
Target Indicator Value Recent year
Global tier
Domestic tier Source
16.1 Significantly reduce all forms of violence and relat-ed death rates everywhere
16.1.1 Number of victims of intentional homicide per 100,000 population, by sex and age
0.72 person 2015 1 A2 United Nations Survey on Crime Trends and Operations of Criminal Justice System
Violent crime damage rate 415people 2017 KOSTAT, Death Cause Statistics
16.1.2 Conflict-related deaths per 100,000 popula-tion, by sex, age and cause
3 C
16.1.3 Proportion of population subjected to (a) physical violence, (b) psychological violence and (c) sexual violence in the previous 12 months
2 B
Violent crime damage rate 0.4% 2016 Korean Institute of Criminology, Public Safety Survey(Former, National criminal victimization survey)
16.1.4 Proportion of population that feel safe walk-ing alone around the area they live
3 B
Percentage of population who feels fear of crime
20.7% 2017 Korean Institute of Criminology, Public Safety Survey(Former, National criminal victimization survey)
16.2 End abuse, exploitation, trafficking and all forms of violence against and torture of children
16.2.1 Proportion of children aged 1–17 years who experienced any physical punishment and/or psychological aggression by caregivers in the past month
2 C
16.2.2 Number of victims of human trafficking per 100,000 population, by sex, age and form of exploitation
2 C
16.2.3 Proportion of young women and men aged 18–29 years who experienced sexual vio-lence by age 18
2 C
16.3 Promote the rule of law at the national and interna-tional levels and ensure equal access to justice for all
16.3.1 Proportion of victims of violence in the previous 12 months who reported their victimization to competent authorities or other officially recognized conflict resolution mechanisms
2 C
16.3.2 Unsentenced detainees as a proportion of overall prison population
35.6% 2016 1 A1 United Nations Survey on Crime Trends and Operations of Criminal Justice Systems(UN-CTS)
16.4 By 2030, significantly re-duce illicit financial and arms flows, strengthen the recovery and return of sto-len assets and combat all forms of organized crime
16.4.1 Total value of inward and outward illicit financial flows (in current United States dol-lars)
3 C
16.4.2 Proportion of seized, found or surrendered arms whose illicit origin or context has been traced or established by a competent author-ity in line with international instruments
3 C
16.5 Substantially reduce cor-ruption and bribery in all their forms
16.5.1 Proportion of persons who had at least one contact with a public official and who paid a bribe to a public official, or were asked for a bribe by those public officials, during the previous 12 months
2 B
Number of civil servants who took bribes 297 people 2017 National Police Agency, Police Statistics Yearbook
16.5.2 Proportion of businesses that had at least one contact with a public official and that paid a bribe to a public official, or were asked for a bribe by those public officials during the previous 12 months
2 C
16.6 Develop effective, account-able and transparent insti-tutions at all levels
16.6.1 Primary government expenditures as a proportion of original approved budget, by sector (or by budget codes or similar)
1 C
16.6.2 Proportion of population satisfied with their last experience of public services
3 C

List of UN SDG Indicators • 97
Target Indicator Value Recent year
Global tier
Domestic tier Source
16.7 Ensure responsive, inclu-sive, participatory and rep-resentative decision-mak-ing at all levels
16.7.1 Proportions of positions in national and local institutions, including (a) the legislatures; (b) the public service; and (c) the judiciary, compared to national distributions, by sex, age, persons with disabilities and population groups
3 C
16.7.2 Proportion of population who believe deci-sion-making is inclusive and responsive, by sex, age, disability and population group
3 C
16.8 Broaden and strengthen the participation of developing countries in the institutions of global governance
16.8.1 Proportion of members and voting rights of developing countries in international organi-zations
1 D
16.9 By 2030, provide legal iden-tity for all, including birth registration
16.9.1 Proportion of children under 5 years of age whose births have been registered with a civil authority, by age
1 C
16.10 Ensure public access to information and protect fundamental freedoms, in accordance with national legislation and internation-al agreements
16.10.1 Number of verified cases of killing, kidnap-ping, enforced disappearance, arbitrary detention and torture of journalists, associ-ated media personnel, trade unionists and human rights advocates in the previous 12 months
2 C
16.10.2 Number of countries that adopt and imple-ment constitutional, statutory and/or policy guarantees for public access to information
2 D UNESCO World Trends in Freedom of Expression and Media Development
16.a Strengthen relevant nation-al institutions, including through international coop-eration, for building capac-ity at all levels, in particular in developing countries, to prevent violence and com-bat terrorism and crime
16.a.1 Existence of independent national human rights institutions in compliance with the Paris Principles
1 2017 1 D OHCHR and GANHRI.
16.b P r o m o t e a n d e n f o r c e non-discriminatory laws and policies for sustainable development
16.b.1 Proportion of population reporting having personally felt discriminated against or ha-rassed in the previous 12 months on the ba-sis of a ground of discrimination prohibited under international human rights law
3 C
Goal 17 Strengthen the means of implementation and revitalize the Global Partnership for Sustainable Development
Target Indicator Value Recent year
Global tier
Domestic tier Source
17.1 Strengthen domestic resource mobili-zation, including through international support to developing countries, to improve domestic capacity for tax and other revenue collection
17.1.1 Total government revenue as a propor-tion of GDP, by source
1 C
17.1.2 Proportion of domestic budget funded by domestic taxes
1 C
17.2 Developed countries to implement fully their official development assistance commitments, including the commit-ment by many developed countries to achieve the target of 0.7 per cent of gross national income for official development assistance (ODA/GNI) to developing countries and 0.15 to 0.20 per cent of ODA/GNI to least developed countries; ODA providers are encouraged to con-sider setting a target to provide at least 0.20 per cent of ODA/GNI to least devel-oped countries
17.2.1 Net official development assistance, total and to least developed countries, as a proportion of the Organization for Economic Cooperation and Develop-ment (OECD) Development Assistance Committee donors’ gross national income (GNI)
0.14% 2017 1 A2 OECD, DAC Statistics database
17.3 Mobilize additional financial resources for developing countries from multiple sources
17.3.1 Foreign direct investment (FDI), official development assistance and South-South cooperation as a proportion of total domestic budget
1 C
17.3.2 Volume of remittances (in United States dollars) as a proportion of total GDP
0.45% 2016 1 A1 World Bank, World Development Indicators

98 • Sustainable Development Goals in the Republic of Korea: Progress Report 2019
Target Indicator Value Recent year
Global tier
Domestic tier Source
17.4 Assist developing countries in attaining long-term debt sustainability through coordinated policies aimed at fostering debt financing, debt relief and debt re-structuring, as appropriate, and address the external debt of highly indebted poor countries to reduce debt distress
17.4.1 Debt service as a proportion of exports of goods and services
1 C
17.5 Adopt and implement investment pro-motion regimes for least developed countries
17.5.1 Number of countries that adopt and implement investment promotion re-gimes for least developed countries
3 D
17.6 Enhance North-South, South-South and triangular regional and international cooperation on and access to science, technology and innovation and enhance knowledge-sharing on mutually agreed terms, including through improved co-ordination among existing mechanisms, in particular at the United Nations level, and through a global technology facilita-tion mechanism
17.6.1 Number of science and/or technology cooperation agreements and pro-grammes between countries, by type of cooperation
3 C
17.6.2 Fixed Internet broadband subscrip-tions per 100 inhabitants, by speed
40.5 people 2016 1 A1 Ministry of Science and ICT(MSIT)
17.7 Promote the development, transfer, dis-semination and diffusion of environmen-tally sound technologies to developing countries on favourable terms, including on concessional and preferential terms, as mutually agreed
17.7.1 Total amount of approved funding for developing countries to promote the development, transfer, dissemination and diffusion of environmentally sound technologies
3 C
17.8 Fully operationalize the technology bank and science, technology and innovation capacity-building mechanism for least developed countries by 2017 and en-hance the use of enabling technology, in particular information and communica-tions technology
17.8.1 Proportion of individuals using the Internet
92.8% 2016 1 A1 Ministry of Science and ICT(MSIT), Korea Communications Commission
17.9 Enhance international support for im-plementing effective and targeted ca-pacity-building in developing countries to support national plans to implement all the Sustainable Development Goals, including through North-South, South-South and triangular cooperation
17.9.1 Dollar value of financial and technical assistance (including through North-South, South-South and triangular cooperation) committed to developing countries
1 C
17.10 Promote a universal, rules-based, open, non-discriminatory and equitable mul-tilateral trading system under the World Trade Organization, including through the conclusion of negotiations under its Doha Development Agenda
17.10.1 Worldwide weighted tariff-average 1 D
17.11 Significantly increase the exports of developing countries, in particular with a view to doubling the least developed countries’ share of global exports by 2020
17.11.1 Developing countries’ and least de-veloped countries’ share of global exports
1 D
17.12 Realize timely implementation of du-ty-free and quota-free market access on a lasting basis for all least developed countries, consistent with World Trade Organization decisions, including by ensuring that preferential rules of origin applicable to imports from least devel-oped countries are transparent and sim-ple, and contribute to facilitating market access
17.12.1 Average tariffs faced by developing countries, least developed countries and small island developing States
1 D
17.13 Enhance global macroeconomic stabil-ity, including through policy coordina-tion and policy coherence
17.13.1 Macroeconomic Dashboard 3 C
17.14 Enhance policy coherence for sustain-able development
17.14.1 Number of countries with mecha-nisms in place to enhance policy co-herence of sustainable development
3 D
17.15 Respect each country’s policy space and leadership to establish and implement policies for poverty eradication and sus-tainable development
17.15.1 Extent of use of country-owned re-sults frameworks and planning tools by providers of development cooper-ation
2 C
List of UN SDG Indicators • 99
Target Indicator Value Recent year
Global tier
Domestic tier Source
17.16 Enhance the Global Partnership for Sus-tainable Development, complemented by multi-stakeholder partnerships that mobilize and share knowledge, expertise, technology and financial resources, to support the achievement of the Sustainable Development Goals in all countries, in particular developing countries
17.16.1 Number of countries reporting prog-ress in multi-stakeholder develop-ment effectiveness monitoring frame-works that support the achievement of the sustainable development goals
1 2017 2 D OECD and UNDP
17.17 Encourage and promote effective pub-lic, public-private and civil society part-nerships, building on the experience and resourcing strategies of partner-ships
17.17.1 Amount of United States dollars committed to (a) public-private part-nerships and (b) civil society partner-ships
3 C
17.18 By 2020, enhance capacity-building support to developing countries, in-cluding for least developed countries and small island developing States, to increase significantly the availability of high-quality, timely and reliable data disaggregated by income, gender, age, race, ethnicity, migratory status, disabil-ity, geographic location and other char-acteristics relevant in national contexts
17.18.1 Proportion of sustainable develop-ment indicators produced at the national level with full disaggregation when relevant to the target, in accor-dance with the Fundamental Princi-ples of Official Statistics
3 D
17.18.2 Number of countries that have na-tional statistical legislation that com-plies with the Fundamental Principles of Official Statistics
1 2017 2 D PARIS 21
17.18.3 Number of countries with a national statistical plan that is fully funded and under implementation, by source of funding
1 2017 1 D PARIS 21
17.19 By 2030, build on existing initiatives to develop measurements of progress on sustainable development that com-plement gross domestic product, and support statistical capacity-building in developing countries
17.19.1 Dollar value of all resources made available to strengthen statistical ca-pacity in developing countries
1 C
17.19.2 Proportion of countries that (a) have conducted at least one population and housing census in the last 10 years; and (b) have achieved 100 per cent birth registration and 80 per cent death registration
1 2015 1 D UNSD

• Goal 1. NO POVERTY • Goal 2. ZERO HUNGER • Goal 3. GOOD HEALTH AND WELL-BEING • Goal 4. QUALITY EDUCATION • Goal 5. GENDER EQUALITY
• Goal 6. CLEAN WATER AND SANITATION • Goal 7. AFFORDABLE AND CLEAN ENERGY • Goal 8. DECENT WORK AND ECONOMIC GROWTH • Goal 9. INDUSTRY, INNOVATION AND INFRASTRUCTURE
• Goal 10. REDUCED INEQUALITIES • Goal 11. SUSTAINABLE CITIES AND COMMUNITIES • Goal 12. RESPONSIBLE CONSUMPTION AND PRODUCTION • Goal 13. CLIMATE ACTION
• Goal 14. LIFE BELOW WATER • Goal 15. LIFE ON LAND • Goal 16. PEACE, JUSTICE AND STRONG INSTITUTIONS • Goal 17. PARTNERSHIPS FOR THE GOALS