Embed Size (px)
Citation preview

Sustainable Development and Low Emission Development StrategiesBertrand MagnéOECD Environment Directorate
International Conference in Commemoration ofthe 25th Anniversary of Korea Energy Economics InstituteGreen Growth and Climate Change Negotiations: Now and FutureSeoul, September 6th, 2011

Presentation Outline
• Link between Green Growth and low carbon development
• OECD/IEA vision of Low-Emission Development Strategies
Þ The Institutional Framework
• Illustration of low-carbon emissions pathways
Þ Preliminary results from forthcoming OECD Environmental Outlook to 2050
2

Green growth• Low-carbon development is closely linked to green growth
• The OECD Green Growth Strategy, delivered at the 2011 OECD Ministerial Council Meeting (MCM), supports national and international efforts to achieve green growth
• Green growth aims to help countries foster economic growth and development while ensuring that natural assets continue to provide the resources and environmental services on which our well-being relies
• Green growth develops a flexible policy framework that can be tailored to different national circumstances and stages of development.
3

Green growth and energy• Challenges
– Change is required due to countries being locked into polluting and greenhouse gas emitting energy sources
– Fossil fuel dominate energy supply and innovation in cleaner technologies will take time
• Opportunities– Clean energy growth enables opportunities for new green industries, jobs
and technologies, while managing the structural changes associated with the transition to a low-carbon economy
• Current energy trends– Unsustainable to achieve a low-carbon growth due to rising energy
demand in coal-based economies and increased coal-fired power generation in response to higher oil and natural gas prices.
4

Integrating climate change into development co-operation
Integrating climate change in development co-operation can help developing countries
– Deal with climate risks and become more resilient to climate change
– Develop on a low-carbon path
– Innovate or adopt cleaner technologies to reduce present and future GHG emissions
5Source: OECD (2009), Integrating Climate Change Adaptation into Development Co-operation: Policy Guidance
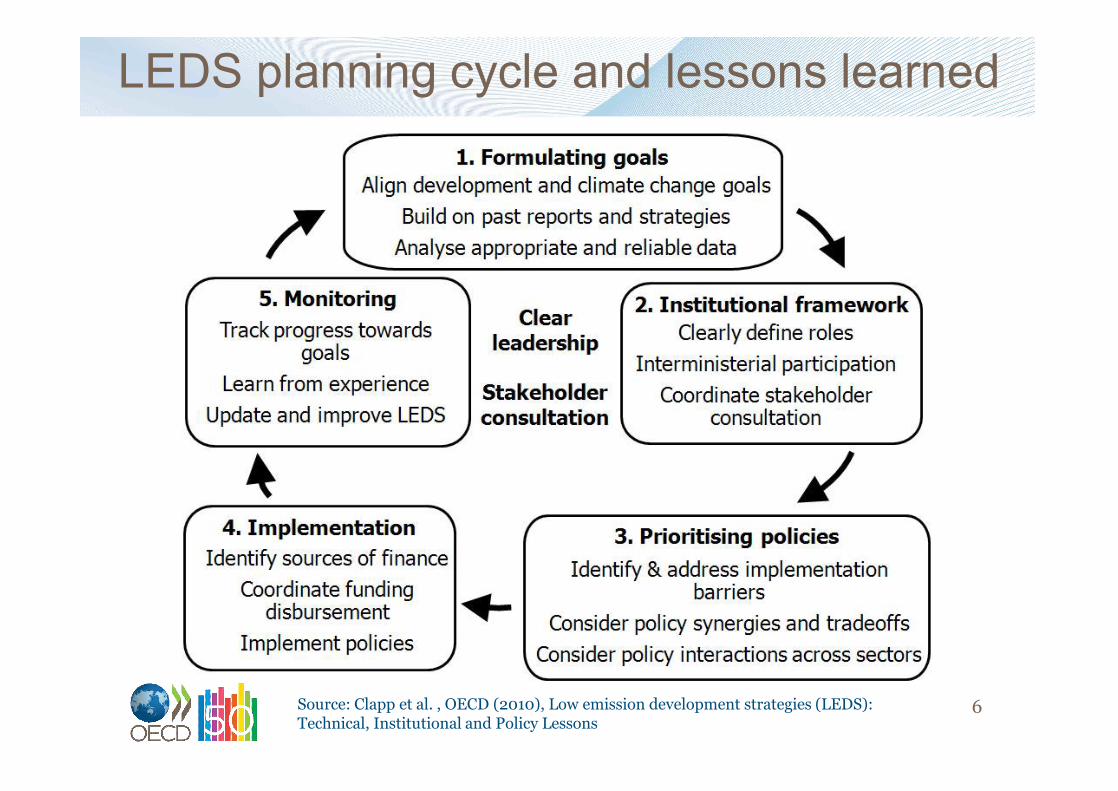
LEDS planning cycle and lessons learned
6Source: Clapp et al. , OECD (2010), Low emission development strategies (LEDS): Technical, Institutional and Policy Lessons

7
Potential benefits and challenges
Benefits
• Policy integration• Coordination• Communication• Early signals for private sector• Global emissions trajectory• Financing needs
Challenges
• Agreement across government• Data issues• Barriers to implementation• Capacity
© danielschoenen / Fotolia.com
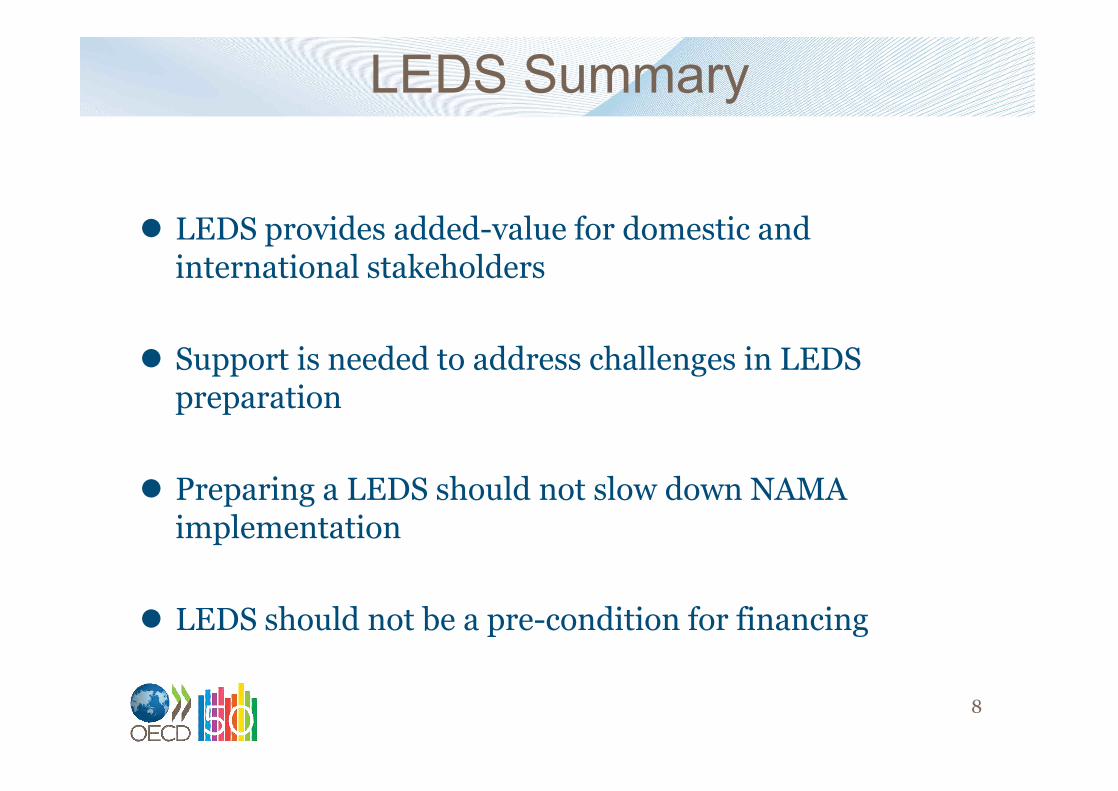
LEDS Summary
l LEDS provides added-value for domestic and international stakeholders
l Support is needed to address challenges in LEDS preparation
l Preparing a LEDS should not slow down NAMA implementation
l LEDS should not be a pre-condition for financing
8

Contrasted trends on recent decouplingbetween GDP growth and GHG emissions
Change in production- and demand-based CO2 emissions
9
1.1%1.6%
3.8%3.3%
0%
1%
2%
3%
4%
5%
Production-based CO2 Demand-based CO2
OECD BRIICS
Average annual rate of change, 1995-2005
-4.9%-6.1%
-7.3%
5.0% 5.2%7.0%
-10%
-5%
0%
5%
10%
1995 2000 2005
OECD BRIICS
Trade balance (production - consumption) in CO2 emissionsas % of global CO2 emissions
Demand-based measures reflect direct and indirect emission contents in final demand, but the link with policy is more complex than with production-based accounting.

GHG emissions by gas – Baseline
Insights from OECD Environmental Outlook to 2050
10
CO2 emissions are projected to remain the largest contributor to global GHG emissions.
Global average temperature would likely reach 3.6-5.6oC.
0
10
20
30
40
50
60
70
80
90
2010
2012
2014
2016
2018
2020
2022
2024
2026
2028
2030
2032
2034
2036
2038
2040
2042
2044
2046
2048
2050
GtCO
2e
CO2 (energy+industrial) CO2 (Land use) CH4 N2O HFC+PFC+SF6

GHG emissions by country – Baseline
Insights from OECD Environmental Outlook to 2050
11BRIICS emissions grow at rate exceeding +2% p.a. to 2050
while OECD emissions tend to level off.
0
10
20
30
40
50
60
70
80
90
2010
2012
2014
2016
2018
2020
2022
2024
2026
2028
2030
2032
2034
2036
2038
2040
2042
2044
2046
2048
2050
GtCO
2e
OECD (24% in 2050) BRIICS (49%) ROW (28%)

Need to reverse current trendsAlternative emission pathways
12
-30-20-10
0102030405060708090
100110120
2010
2015
2020
2025
2030
2035
2040
2045
2050
2055
2060
2065
2070
2075
2080
2085
2090
2095
2100
GtCO2eUNEP (2010) rangeOutlook Baseline450 Core450 Delayed Action450 Accelerated Action
Cumulative GHG emissions (GtCO2e)2010 -2020
2020 -2030
2030 -2050
2050 -2100
450 Core
Concentrations of GHGs limited to 450 ppm by the end of the 21st century; policy starts in 2013; full flexibility across time, sources and
gases; global carbon market
485 450 635 405
450 Accelerated Action
As 450 Core, plus additional mitigation efforts until 2030 480 435 560 430
450 Delayed Action
As 450 Core, but until 2020 no mitigation action beyond Copenhagen pledges &
fragmented carbon markets505 495 655 335
550 Core As 450 Core, but aiming at 550 ppm by the end of the century 505 525 985 1400

Low emission development: The issue of timing
13

450ppm Core - Emissions and cost of mitigation
14Note: Emission projections are before permit trading, i.e. reflect emission allowances.Source: OECD Environmental Outlook to 2050 projection, based on the ENV-Linkages model.

Impact of phasing out fossil fuels subsidies as a stand-alone policy on GHG emissions in 2050
15Phasing-out fossil fuel subsidies could reduce global
GHG emissions by almost 6% globally by 2050
-45%
-40%
-35%
-30%
-25%
-20%
-15%
-10%
-5%
0%
5%
ME
NA
* (
1)
Ru
ssia
*
Mex
ico
*
Res
t of
An
nex
I *
Ind
ones
ia *
Oth
er c
oun
trie
s *
Sou
th A
fric
a *
Ind
ia *
Bra
zil
Ch
ina
*
Oce
ania
USA
Can
ada
EU
27 &
EF
TA
Jap
an &
Kor
ea
OE
CD
-A1
Res
t of
BR
IIC
S
Ru
ssia
& r
est
of A
1
RO
W
WO
RL
D
All GHG CO2 Other Gases
Note: Emissions exclude LULUCF.* Regions in which fossil fuel subsidies have been removed(1) Middle-East and Northern AfricaSource: OECD ENV-Linkages model using IEA fossil-fuel subsidies data (IEA,2010)

Impact of phasing out fossil fuels subsidies as a stand-alone policy on GHG emissions in 2050
Real income impacts (in % deviation from baseline)
16
Removing fossil fuel subsidies lower the global cost of stabilising GHG concentrations but income gains are
lower than stand-alone policy
Region
2020 2050
Only FFS reform
450 Core no reform
450 Core with FFS reform
Only FFS reform
450 Core no reform
450 Core with FFS reform
WORLD 0.1 -0.1 -0.1 0.3 -6.3 -6.0
OECD A1 0.2 0.0 0.2 0.2 -4.8 -4.5
Rest of BRIICS 0.6 -0.3 0.3 1.1 -11.4 -10.7
Russia & rest of A1 -0.6 -0.4 -1.0 0.2 -14.6 -13.8
Rest of World -1.2 -0.4 -1.4 -0.3 -2.8 -2.6
Source: OECD ENV-Linkages model using IEA fossil-fuel subsidies data (IEA, 2010)

Low emission pathways: The case of South Korea
Insights from OECD Environmental Outlook to 2050
17
Economy-wide indicators for South Korea and Japan in the OECD Baseline simulation
2010 2020 20502010-2050 annual
growth rateGDP PPP (Million US$2010) 5600 6900 9800 1.4%Population (Million) 175 173 146 -0.5%GHG Emission (MtCO2eq) 1904 1849 2116 0.3%Share of CO2 90% 88% 84% -0.2%
Relative decoupling between economic growth and GHG emissions.By 2050, CO2 emissions still represent the bulk of GHGs
emissions.

The importance of energy policies in South KoreaInsights from IEA World Energy Outlook 2010
18Upcoming policies will make a dent.Energy savings and power sector decarbonization are key.

Power generation capacity in South Korea
Insights from IEA World Energy Outlook 2010
19Low carbon technologies need to increase by 50% in the next 25 years. Wind and solar additions more than double.
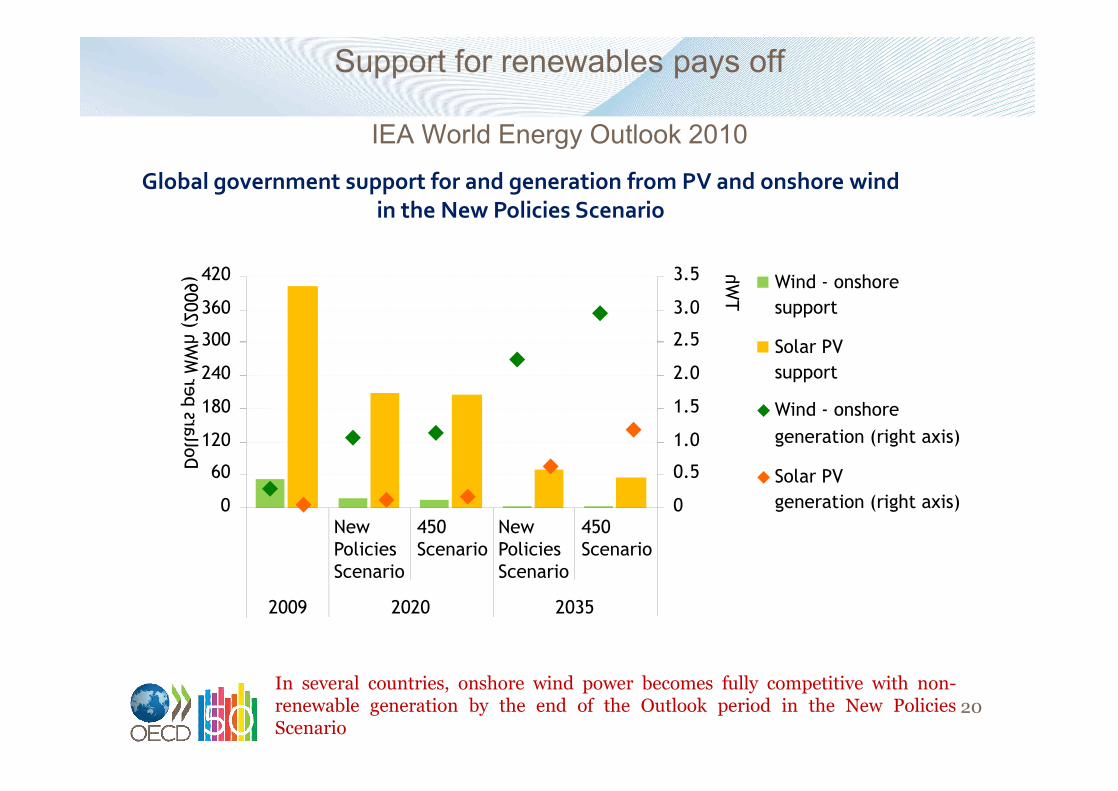
Support for renewables pays off
IEA World Energy Outlook 2010
20In several countries, onshore wind power becomes fully competitive with non-renewable generation by the end of the Outlook period in the New PoliciesScenario
Global government support for and generation from PV and onshore wind in the New Policies Scenario
0
60
120
180
240
300
360
420
New PoliciesScenario
450Scenario
2009 2020 2035
Dollars per MWh (2009)
0
0.5
1.0
1.5
2.0
2.5
3.0
3.5
TWh Wind - onshore
support
Solar PVsupport
Wind - onshoregeneration (right axis)
Solar PVgeneration (right axis)
450Scenario
New PoliciesScenario
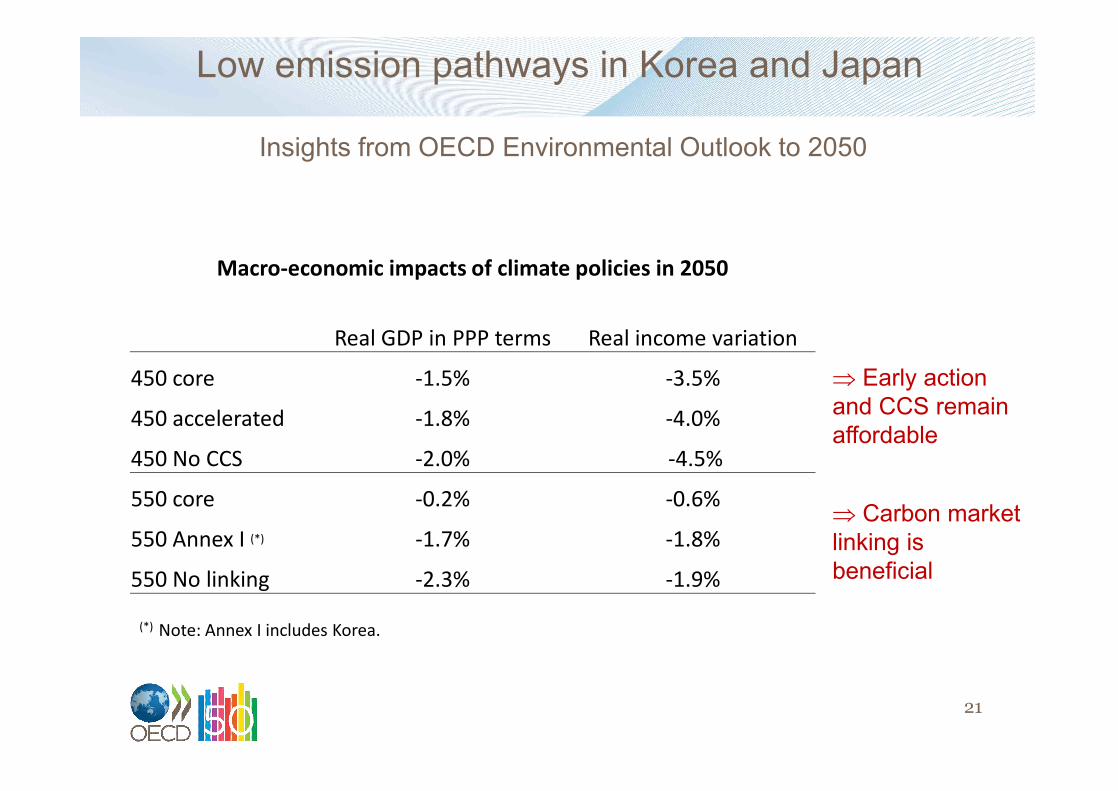
Low emission pathways in Korea and Japan
Insights from OECD Environmental Outlook to 2050
21
Macro-economic impacts of climate policies in 2050
Real GDP in PPP terms Real income variation
450 core -1.5% -3.5%
450 accelerated -1.8% -4.0%
450 No CCS -2.0% -4.5%
550 core -0.2% -0.6%
550 Annex I (*) -1.7% -1.8%
550 No linking -2.3% -1.9%
Þ Early action and CCS remain affordable
Þ Carbon market linking is beneficial
(*) Note: Annex I includes Korea.

The role of policy making• Policies can support the development low-carbon technologies
• There are reasons for optimism in pursuing a greener energy sector– Policy-makers and businesses are making commitments
– National targets for renewable energy are spreading
– More than 70 governments around the world, including all IEA member countries, have put in place targets and policies to support development of renewable energy technologies
• There is still an urgent need to accelerate change– Put a price on carbon
– Mainstreaming low-carbon energy technologies
– Fostering innovation
– Creating the right conditions for markets to work establishing sound regulatory frameworks, eliminating harmful subsidies, investing in education and strengthening environmental governance
– Plan and react: sector- and location-specific adaptation policies 22
Contact information
23
www.oecd.org/env/
Dr. Bertrand MagnéOECD Environment Directorate
+33 (0)1 45 24 97 32