Embed Size (px)
Citation preview

Sustainable Building Services Systems Management
Thesis submitted to the UCL Bartlett Faculty of Built
Environment, School of Construction and Project
Management, for the award of Doctor of Philosophy,
PhD in Management of Projects
University College London
2013
By
Okon, Bassey Bassey (843368)
Supervisor: Dr. Taha Elhag

Bassey B. Okon Declaration
2
Declaration
Programme: Management of Projects (PhD)
Supervisor: Dr. Taha Elhag
I, Bassey Bassey Okon confirm that the work presented in this thesis is my own. Where
information has been derived from other sources, I confirm that this has been indicated
in this thesis.
I, confirm that I have read and understood the guidelines on plagiarism, that I
understand the meaning of plagiarism and that I may be penalised for submitting work
that has been plagiarised.
I declare that all material presented in the accompanying thesis is entirely my own work
except where explicitly and individually indicated and that all sources used in its
preparation and all quotations are clearly cited.
I have submitted an electronic copy of this thesis through turnitin. Should this statement
prove to be untrue, I recognise the right of the Board of Examiners to recommend what
action should be taken in line with UCL‟s regulations.
Signature: Date:

Bassey B. Okon Abstract
3
Abstract
The rapid expansion in the construction industry worldwide has placed more pressure
on the available natural resources, as the various construction activities and the services
they require, increasingly draw on supplies of water and energy. The provision of these
utilities and their continual maintenance activites within a building, promote human
daily sustenance, and economic development generally, but the exploitation of these
resources, their environmental impact, socio-economic implications, and sustainability,
all necessitate proper management. Indeed, sustainability has now become the
cornerstone for effective building services infrastructure and building construction
management. It is against this backdrop that this study, which focuses on building
services infrastructure and construction activities management, is set.
The study aims to integrate the sustainability agenda in this context as a basis for
achieving sustainable development goals. Increasingly, building services infrastructure
processes and the interdisciplinary engineering fields cannot operate optimally without
the incorporation of the sustainability agenda as a core management consideration. In
pursuit of its aims, the study has employed various theoretical propositions, suitable
methods, and frameworks, all aimed at addressing the sustainability issues as a way
forward. The current technologies and management techniques related to building
management do already offer sustainable and good quality service delivery, but the
findings from this study have yielded value added contributions capable of promoting
greater success in the drive for sustainability, by employing the sustainable engineering
infrastructure (SEI) model, sustainability index matrix (SIM), and partial differential
equation techniques. The SEI model was used in evaluating building services
infrastructure characteristics within the UK and Nigeria in the study phases I– IV, and
the outcomes are presented.
Life cycle assessment (LCA) and life cycle costs (LCC) methods were also applied to
examine building services infrastructure systems and their performance in the study
phase V. The LCA phase in this study considered ten environmental impacts during the
construction, operation (use), maintenance, and the end-of-life phases of six buildings.

Bassey B. Okon Abstract
4
The LCC technique appraised the use of construction materials, water, energy, and
utilities to avoid duplication that leads to unnecessary costs in the aforementioned
phases of buildings. The results of the different analyses are presented. Energy and
utilities usage, together with carbon footprint management evaluation in both the
healthcare and education sectors in the UK are also shown in the study phase VI. In
appraising these scenarios, the partial differential equation method was adopted,
generating results for the healthcare and education sectors of 0.74 and 0.62 respectively,
which expresses a good degree of reliability of performance within these two particular
contexts. In phase VII of the study, interviews with experts from academia and industry
have corroborated the evidence secured from other phases of the research.
There is also a novel discovery in this study, in its use of the SIM function which is able
to provide a corresponding sustainability index result for buildings/facilities
performance in respect of critical and strategic management decisions. The SIM has
defined the sustainability index from probability theory within the limits of 0 ≤ Suv ≤ 1
for any given system function. The SIM and SEI models have been applied within some
phases in this study based on the acquired data and the results are indicated.
Additionally, there is a proposed algorithmic project life cycle framework with an
allowance for either on/offsite recycling processes in managing building infrastructure
challenges.
In its scope, the study focuses on buildings (facilities) only, since the non-integration of
sustainability ethics represents the major challenge undermining the building services
infrastructure success. With this focus in mind, this study has delivered improved
knowledge and understanding of the proper applications and management of building
services infrastructure systems. This has been underpinned by the three themes of
sustainable development for the present and future generations.
Keywords: Building (facility) services systems, carbon footprint, energy and utilities
management, engineering sustainability, environmental impact assessment, LCA, LCC,
sustainable building, sustainable development, sustainability index

Bassey B. Okon Table of Contents
5
Table of Contents
Declaration .................................................................................................................................... 2
Abstract ......................................................................................................................................... 3
Table of Contents .......................................................................................................................... 5
List of Tables ............................................................................................................................... 14
List of Figures.............................................................................................................................. 17
List of Acronyms/Abbreviations ................................................................................................. 20
Nomenclature .............................................................................................................................. 24
Copyright Statement .................................................................................................................... 26
Acknowledgements ..................................................................................................................... 27
Definition of key terms ................................................................................................................ 28
Publications ................................................................................................................................. 29
Chapter One ................................................................................................................................. 30
1.0 Introduction to building services infrastructure systems management .................................. 30
1.1 Sustainability in building services infrastructure .................................................................. 30
1.2 Sustainability in building construction .................................................................................. 32
1.3 Problem statement ................................................................................................................. 33
1.4 Aim and objectives of the research ........................................................................................ 34
1.5 Research questions ................................................................................................................ 34
1.6 Scope of the research ............................................................................................................. 35
1.7 Relationship among the entire phases of study, I – VII ......................................................... 36
1.8 Gaps in the literature ............................................................................................................. 37
1.9 Significance and benefits of the research .............................................................................. 38
1.10 Structure of the thesis .......................................................................................................... 39
1.11 Summary.............................................................................................................................. 41
Chapter Two ................................................................................................................................ 43
2.0 Sustainability and sustainable development in building services infrastructure systems
management ................................................................................................................................. 43
2.1 Introduction ........................................................................................................................... 43
2.2 Sustainability and sustainable development .......................................................................... 43
2.2.1 Review of the triple bottom line of sustainable development ............................................ 44
2.2.2 The context of the research ................................................................................................. 46
2.3 Ecological modernisation in building services practice ........................................................ 48

Bassey B. Okon Table of Contents
6
2.4 Corporate sustainability and knowledge transfer in building services management ............. 49
2.5 Building services infrastructure systems management .......................................................... 50
2.6 Contemporary challenges in building services practice ........................................................ 52
2.7 Sustainable building services in the interests of economic growth ....................................... 53
2.8 Policy frameworks and drivers for sustainable building services development .................... 55
2.8.1 Project life cycle framework - building services management ........................................... 57
2.8.2 Principles of sustainable building construction framework ................................................ 59
2.8.3 Framework for sustainable building and management ....................................................... 62
2.9 Life cycle assessment framework for building services infrastructure management ............ 65
2.9.1 The life cycle assessment framework ................................................................................. 66
2.9.2 The life cycle assessment techniques ................................................................................. 67
2.10 Review of the life cycle cost (LCC) framework for building services management ........... 70
2.10.1 The life cycle cost technique ............................................................................................ 71
2.10.2 Evaluating building services performance - life cycle cost .............................................. 73
2.10.3 The barriers in the life cycle cost application ................................................................... 75
2.11 Engineering sustainability in building services management .............................................. 77
2.11.1 The green growth model ................................................................................................... 78
2.11.2 Engineering sustainability through eco-efficiency methods ............................................. 80
2.11.3 The 3R approach ............................................................................................................... 81
2.11.4 Public-private partnership ................................................................................................. 82
2.11.5 The use of mathematical modelling theories .................................................................... 83
2.11.5.1 The sustainable engineering infrastructure (SEI) model ............................................... 83
2.11.6 Summary........................................................................................................................... 84
Chapter Three .............................................................................................................................. 85
3.0 Research methods: sustainable building services infrastructure systems management......... 85
3.1 Introduction ........................................................................................................................... 85
3.2 Research design ..................................................................................................................... 86
3.3 Presenting the research methods............................................................................................ 87
3.4 Survey information in study phases I – IV ............................................................................ 88
3.5 Research method in study phases I – IV ................................................................................ 89
3.6 Research process used in study phases I–IV ......................................................................... 89
3.6.1 Pilot study in phases I–IV ................................................................................................... 90
3.6.2 The structured survey administration in study phases I–IV ............................................... 90
3.6.3 Survey feedback and methods used for analyses, phases I–IV........................................... 90

Bassey B. Okon Table of Contents
7
3.6.3.1 Analysis and ranking of determinant management factors .............................................. 91
3.6.3.2 Measuring respondents‟ concordance ............................................................................. 92
3.7 Other research approaches used in study phases I–IV........................................................... 93
3.7.1 The set theory method ........................................................................................................ 93
3.7.2 The probability theory method ........................................................................................... 96
3.7.3 The sustainable engineering infrastructure (SEI) model use .............................................. 97
3.7.4 Partial differential equation method ................................................................................... 99
3.8 Research methods used in study phase V ............................................................................ 100
3.8.1 Pilot study in phase V ....................................................................................................... 101
3.8.2 The structured survey administration in study phase V .................................................... 101
3.8.3 Survey information and feedback in study phase V ......................................................... 101
3.8.4 Methods used for sustainability evaluation in study phase V ........................................... 102
3.8.5 Method used for the LCA study in phase V ..................................................................... 103
3.8.6 Methods used for the LCC in study phase V .................................................................... 104
3.9 Research methods used in study phase VI ........................................................................... 106
3.9.1 Pilot study in phase VI ..................................................................................................... 107
3.9.2 The structured survey administration in study phase VI .................................................. 107
3.9.3 Survey information and feedback in study phase VI ........................................................ 107
3.9.4 Averaging method ............................................................................................................ 108
3.9.5 Percentages method .......................................................................................................... 109
3.9.6 Carbon footprint analysis method ..................................................................................... 109
3.9.7 The concept of probability theory .................................................................................... 109
3.9.8 Sustainability index model with permutations and combinations functions .................... 110
3.10 Interviews: Qualitative method – study phase VII ............................................................ 110
3.10.1 Interview approach in study phase VII ........................................................................... 111
3.10.2 Summary......................................................................................................................... 112
Chapter Four .............................................................................................................................. 114
4.0 Results and discussion of the research ................................................................................ 114
4.1Introduction .......................................................................................................................... 114
4.2 Study Phase I: Commercial Buildings - O&M evaluation .................................................. 114
4.2.1 Presenting the phase of study ........................................................................................... 114
4.2.2 Goal and scope definition ................................................................................................. 115
4.3 Results and discussion in study phase I ............................................................................... 115
4.3.1 Energy resources management characteristics ................................................................. 115

Bassey B. Okon Table of Contents
8
4.3.2 Water resources management characteristics ................................................................... 116
4.3.3 Maintenance management practices ................................................................................. 117
4.3.4 Infrastructure design characteristics ................................................................................. 118
4.3.5 Infrastructure project characteristics................................................................................. 119
4.3.6 External factors affecting sustainable infrastructure management (SIM) ........................ 120
4.4 Constraints in study phase I ................................................................................................. 121
4.5 Conclusion to study phase I ................................................................................................. 122
4.6 Study Phase II: Building construction companies (BCC) ................................................... 123
4.6.1 Presenting the phase of study ........................................................................................... 123
4.6.2 Goal and scope definition ................................................................................................. 125
4.7 Results and discussion in study phase II ............................................................................. 126
4.7.1 Energy resources management characteristics ................................................................. 126
4.7.2 Water resources management characteristics ................................................................... 127
4.7.3 Maintenance management practices ................................................................................. 128
4.7.4 Infrastructure design characteristics ................................................................................. 130
4.7.5 Infrastructure project characteristics................................................................................. 131
4.7.6 External factors affecting SIM ......................................................................................... 132
4.8 Constraints in study phase II ............................................................................................... 133
4.9 Conclusion to study phase II ............................................................................................... 133
4.10 Comparative analysis between O&M and BCC studies .................................................... 135
4.10.1 Severity indices analysis (SIA) ....................................................................................... 135
4.10.2 Coefficient of variation (COV) analysis ......................................................................... 136
4.10.3 Category ranking (CR) analysis ..................................................................................... 138
4.10.4 Overall ranking (OR) analysis ........................................................................................ 140
4.10.5 Top marked factors ......................................................................................................... 141
4.10.6 Bottom Marked Factors .................................................................................................. 142
4.11 Validating the two phases of study using the SEI model .................................................. 143
4.12 Study Phase III: ALSCON Company ................................................................................ 144
4.12.1 Presenting the phase of study ......................................................................................... 144
4.12.2 Goal and scope definition ............................................................................................... 144
4.12.3 Results and discussion in study Phase III ....................................................................... 145
4.12.4 Energy resources management characteristics ............................................................... 145
4.12.5 Water resources management characteristics ................................................................. 146
4.12.6 Maintenance management practices ............................................................................... 147

Bassey B. Okon Table of Contents
9
4.12.7 Infrastructure design characteristics ............................................................................... 148
4.12.8 Infrastructure project characteristics .............................................................................. 150
4.12.9 External factors affecting SIM ....................................................................................... 151
4.13 Study Phase IV: MPN Unlimited ...................................................................................... 152
4.13.1 Presenting the phase of study ......................................................................................... 152
4.13.2 Goal and scope definition ............................................................................................... 152
4.13.3 Results and discussion in study phase IV ....................................................................... 152
4.13.4 Energy resources management characteristics ............................................................... 153
4.13.5 Water resources management characteristics ................................................................. 154
4.13.6 Maintenance management practices ............................................................................... 155
4.13.7 Infrastructure design characteristics ............................................................................... 157
4.13.8 Infrastructure project characteristics .............................................................................. 158
4.13.9 External factors affecting SIM ....................................................................................... 159
4.14 Comparative analysis study between ALSCON and MPN ............................................... 160
4.14.1 Severity indices analysis (SIA) ....................................................................................... 160
4.14.2 Coefficient of variation (COV) analysis ......................................................................... 162
4.14.3 Category ranking (CR) analysis ..................................................................................... 164
4.14.4 Overall ranking (OR) analysis ........................................................................................ 165
4.14.5 Top marked factors ......................................................................................................... 165
4.14.6 Bottom marked factors ................................................................................................... 167
4.15 Constraints in phase IV...................................................................................................... 168
4.16 Sustainability index (SI) matrix ......................................................................................... 168
4.17 Validating the two study phases using the SEI model ....................................................... 170
4.18 Comparison between the Nigerian and UK scenarios ....................................................... 171
4.19 Contributions to knowledge in study phase I–IV .............................................................. 173
4.20 Summary of study phase I–IV ........................................................................................... 174
Chapter Five .............................................................................................................................. 175
5.0 Life cycle assessment and life cycle costs ........................................................................... 175
5.1 Introduction ......................................................................................................................... 175
5.1.1 Presenting the study in phase V ........................................................................................ 175
5.1.2 Goal and scope definition ................................................................................................. 176
5.1.3 The life cycle analysis ...................................................................................................... 177
5.1.4 Functional unit .................................................................................................................. 177
5.2 Goal and scope of the research ............................................................................................ 177

Bassey B. Okon Table of Contents
10
5.3 Life cycle inventory ............................................................................................................. 179
5.4 Review of data acquired for Buildings A–F ........................................................................ 179
5.5 Building A ........................................................................................................................... 181
5.5.1 Background of the contractor ........................................................................................... 181
5.5.2 Type of building ............................................................................................................... 182
5.5.3 Construction phase ........................................................................................................... 182
5.5.4 Operation/maintenance phases ......................................................................................... 183
5.5.5 End-of-Life (EoL) phase .................................................................................................. 183
5.6 Building B ........................................................................................................................... 184
5.6.1 Background of the contractor ........................................................................................... 184
5.6.2 Type of building ............................................................................................................... 184
5.6.3 Construction phase ........................................................................................................... 185
5.6.4 Operation/maintenance phases ......................................................................................... 185
5.6.5 EoL phase ......................................................................................................................... 185
5.7 Building C ........................................................................................................................... 186
5.7.1 Background of the contractor ........................................................................................... 186
5.7.2 Type of building ............................................................................................................... 186
5.7.3 Construction phase ........................................................................................................... 187
5.7.4 Operation/maintenance phases ......................................................................................... 187
5.7.5 EoL phase ......................................................................................................................... 188
5.8 Building D ........................................................................................................................... 188
5.8.1 Background of the contractor ........................................................................................... 188
5.8.2 Type of building ............................................................................................................... 189
5.8.3 Construction phase ........................................................................................................... 189
5.8.4 Operation/maintenance phases ......................................................................................... 190
5.8.5 EoL phase ......................................................................................................................... 190
5.9 Building E ............................................................................................................................ 191
5.9.1 Background of the contractor ........................................................................................... 191
5.9.2 Type of building ............................................................................................................... 192
5.9.3 Construction phase ........................................................................................................... 192
5.9.4 Operation/maintenance phases ......................................................................................... 193
5.9.5 EoL phase ......................................................................................................................... 193
5.10 Building F .......................................................................................................................... 194
5.10.1 Background of the contractor ......................................................................................... 194

Bassey B. Okon Table of Contents
11
5.10.2 Type of building ............................................................................................................. 194
5.10.3 Construction phase ......................................................................................................... 194
5.10.4 Operation/Maintenance Phases ....................................................................................... 195
5.10.5 EoL Phase ....................................................................................................................... 195
5.11 Assumptions in the study phase V ..................................................................................... 196
5.12 Life cycle impact ............................................................................................................... 197
5.12.1 Abiotic depletion potential [Sb equivalent] .................................................................... 198
5.12.2 Acidification potential [SO2 equivalent] ......................................................................... 199
5.12.3 Eutrophication potential [phosphate (PO4-) equivalent] ................................................. 200
5.12.4 Freshwater aquatic ecotoxicity potential [DCB] ............................................................ 201
5.12.5 Global warming potential [carbondioxide equivalent] ................................................... 203
5.12.6 Human toxicity potential [DCB equivalent] ................................................................... 204
5.12.7 Marine aquatic ecotoxicity potential [DCB equivalent] ................................................. 205
5.12.8 Ozone layer depletion potential [RII equivalent] ........................................................... 206
5.12.9 Photochem ozone creation potential [C2H4 equivalent] ................................................. 208
5.12.10 Terrestric ecotoxicity potential [DCB equivalent] ....................................................... 209
5.12.11 Review of the building phases analysis results............................................................. 210
5.13 Normalisation of the calculated results ............................................................................. 210
5.14 Total environmental impacts results .................................................................................. 213
5.15 Percentages distribution analysis ....................................................................................... 214
5.16 General interpretation: percentages distribution test ......................................................... 217
5.17 Constraints in the study phase V ....................................................................................... 218
5.18 Summary of study phase V ................................................................................................ 218
5.19 The life cycle cost analysis ................................................................................................ 219
5.20 Landfill and recycling costs ............................................................................................... 220
5.21 Buildings A–F and the associated costs (£/FU) ................................................................. 221
5.21.1 Life cycle costs for Building A ....................................................................................... 221
5.21.2 Life cycle costs for Building B ....................................................................................... 222
5.21.3 Life cycle costs for Building C ....................................................................................... 223
5.21.4 Life cycle costs for Building D ....................................................................................... 224
5.21.5 Life cycle costs for Building E ....................................................................................... 226
5.21.6 Life cycle costs for Building F ....................................................................................... 227
5.22 General interpretation of the LCC analysis ....................................................................... 228
5.23 Contributions to knowledge in study phase V ................................................................... 229

Bassey B. Okon Table of Contents
12
5.24 Conclusion in study phase V ............................................................................................. 229
Chapter Six ................................................................................................................................ 231
6.0 Energy and utilities management, study phase VI ............................................................... 231
6.1 Introduction ......................................................................................................................... 231
6.2 Presenting the study in phase VI ......................................................................................... 232
6.3 Goal and scope definition .................................................................................................... 232
6.4 Results and discussion ......................................................................................................... 232
6.5 Operations phase in the healthcare and education sectors ................................................... 233
6.5.1 Energy and utilities consumption in the healthcare sector ............................................... 233
6.5.2 Energy and utilities consumption in the education sector ................................................ 234
6.5.3 Comparative analysis between the health and education sectors ..................................... 236
6.6 Maintenance phase in the health and education sectors ...................................................... 237
6.7 Waste management phase - health and education sectors ................................................... 239
6.7.1 Waste management phase in the health sector ................................................................. 239
6.7.2 Waste management phase in the education sector ............................................................ 242
6.8 Carbon footprint analysis..................................................................................................... 244
6.8.1 Carbon footprint analysis in the healthcare sector ............................................................ 244
6.8.2 Carbon footprint analysis in the education sector ............................................................. 245
6.8.3 Comparative analysis between the healthcare and education sectors ............................... 246
6.9 Probability analysis ............................................................................................................. 248
6.9.1 Probability analysis result ................................................................................................. 249
6.10 Sustainability index ........................................................................................................... 250
6.11 Comparison between the healthcare and education sectors via sustainability index ......... 252
6.12 Constraints in study phase VI ............................................................................................ 254
6.13 Contributions to knowledge in study phase VI.................................................................. 254
6.14 Summary of study phase VI .............................................................................................. 255
Chapter Seven ............................................................................................................................ 256
7.0 Interviews in study phase VII .............................................................................................. 256
7.1 Introduction ......................................................................................................................... 256
7.2 Presenting the study ............................................................................................................. 256
7.3 Goal and scope definition .................................................................................................... 256
7.4 Interview with the Director of programme LJMU .............................................................. 257
7.5 Interview with the Director of sustainability BDP Company .............................................. 261
7.6 Results and discussion in study phase VII ........................................................................... 266

Bassey B. Okon Table of Contents
13
7.7 Constraints in study phase VII............................................................................................. 266
7.8 Contributions to knowledge in study phase VII .................................................................. 267
7.9 Summary of study phase VII ............................................................................................... 267
7.10 Relationship among the entire phases of study, I–VII ....................................................... 268
7.11 Benefits derived from the entire phases of study, I–VII .................................................... 269
7.11.1 Benefits derived from the study in phases I–IV ............................................................. 269
7.11.2 Benefits derived from the study in phase V.................................................................... 270
7.11.3 Benefits derived from the study in phase VI .................................................................. 270
7.11.4 Benefits derived from the study in phase VII ................................................................. 271
Chapter Eight ............................................................................................................................. 272
8.0 Conclusions and recommendations ..................................................................................... 272
8.1 Introduction ......................................................................................................................... 272
8.2 Discussion on the research objectives ................................................................................. 272
8.3 Overall conclusion ............................................................................................................... 277
8.4 Contributions to knowledge................................................................................................. 280
8.5 Limitations of the research .................................................................................................. 282
8.6 Recommendations for practical implementation ................................................................. 283
8.7 Recommendations for future research ................................................................................. 284
8.8 Recommendations for policy-makers .................................................................................. 285
References ................................................................................................................................. 287
Appendices ................................................................................................................................ 307

Bassey B. Okon List of Tables
14
List of Tables
Table 2.1: Impact phases of an LCA and definition ....................................................... 69
Table 2.2: The LCC evaluation methods. ....................................................................... 73
Table 2.3: Principles for promoting eco-efficiency of building infrastructure ............... 81
Table 3.1: Phases of study and the applied methods. ..................................................... 86
Table 3.2: Summary of survey distribution within Commercial Buildings .................... 88
Table 3.3: Summary of survey distribution in Buildings Construction Companies ....... 88
Table 3.4: Summary of survey distribution within ALSCON Building/Facility............ 88
Table 3.5: Summary of survey distribution in MPN Building/Facility .......................... 88
Table 3.6: Summary of survey distribution in Buildings Construction Companies. .... 101
Table 3.7: Features of sustainability and evaluation approach. .................................... 102
Table 3.8: Summary of survey distribution- healthcare and education sectors. ........... 108
Table 4.1: Energy resources management characteristics. ........................................... 115
Table 4.2: Water resources management characteristics. ............................................. 116
Table 4.3: Maintenance management practices. ........................................................... 117
Table 4.4: Infrastructure design characteristics. ........................................................... 118
Table 4.5: Infrastructure project characteristics. .......................................................... 119
Table 4.6: External factors affecting SIM. ................................................................... 120
Table 4.7: Energy resources management characteristics. ........................................... 126
Table 4.8: Water resources management characteristics. ............................................. 127
Table 4.9: Maintenance management practices. ........................................................... 129
Table 4.10: Infrastructure design characteristics. ......................................................... 130
Table 4.11: Infrastructure project characteristics. ........................................................ 131
Table 4.12: External factors affecting SIM. ................................................................. 132
Table 4.13: Energy resources management characteristics. ......................................... 145
Table 4.14: Water resources management characteristics. ........................................... 147
Table 4.15: Maintenance management practices. ......................................................... 148
Table 4.16: Infrastructure design characteristics. ......................................................... 149
Table 4.17: Infrastructure project characteristics. ........................................................ 150
Table 4.18: External factors affecting SIM. ................................................................. 151
Bassey B. Okon List of Tables
15
Table 4.19: Energy resources management characteristics. ......................................... 153
Table 4.20: Water resources management characteristics. ........................................... 154
Table 4.21: Maintenance management practices. ......................................................... 156
Table 4.22: Infrastructure design characteristics. ......................................................... 157
Table 4.23: Infrastructure project characteristics. ........................................................ 158
Table 4.24: External factors affecting SIM. ................................................................. 159
Table 4.25: The sustainability index matrix. ................................................................ 169
Table 4.26: The sustainability index (SI) results. ......................................................... 171
Table 5.1: Basic research parameters. .......................................................................... 176
Table 5.2: Materials quantity information. ................................................................... 182
Table 5.3: Energy requirements during the construction phase. .................................. 182
Table 5.4: Materials requirements for minor maintenance, construction phase. .......... 183
Table 5.5: Energy requirements during the operation/maintenance phases. ................ 183
Table 5.6: Waste management phase. ........................................................................... 183
Table 5.7: Energy requirements during the EoL phase. ............................................... 183
Table 5.8: Materials quantity information. ................................................................... 185
Table 5.9: Energy requirements during the construction phase. .................................. 185
Table 5.10: Energy requirements during the operation/maintenance phases. .............. 185
Table 5.11: Waste management phase. ......................................................................... 185
Table 5.12: Energy requirements during the EoL phase. ............................................. 186
Table 5.13: Materials quantity information. ................................................................. 187
Table 5.14: Energy requirements during the construction phase. ................................ 187
Table 5.15: Materials requirements during the maintenance, construction phase. ....... 187
Table 5.16: Energy requirements the building operation/maintenance phases. ........... 188
Table 5.17: Waste management phase. ......................................................................... 188
Table 5.18: Energy requirements during the EoL phase .............................................. 188
Table 5.19: Materials quantity information. ................................................................. 190
Table 5.20: Energy requirements during the construction phase. ................................ 190
Table 5.21: Materials requirements during the operation/maintenance phases. ........... 190
Table 5.22: Energy requirements during the operation/maintenance phases. .............. 190
Table 5.23: Energy requirements during the EoL phase. ............................................. 191

Bassey B. Okon List of Tables
16
Table 5.24: Energy requirements during the EoL phase. ............................................. 191
Table 5.25: Materials quantity information. ................................................................. 192
Table 5.26: Energy requirements during the construction phase. ................................ 192
Table 5.27: Materials requirements during the operation phase. .................................. 193
Table 5.28: Energy requirements during the operation/maintenance phases. .............. 193
Table 5.29: Waste management phase. ......................................................................... 193
Table 5.30: Energy requirements during the waste management phase. ...................... 193
Table 5.31: Materials quantity information. ................................................................. 195
Table 5.32: Energy requirements during the construction phase. ................................ 195
Table 5.33: Materials requirements for minor maintenance, construction phase. ........ 195
Table 5.34: Energy requirements during the operation/maintenance phases. .............. 195
Table 5.35: Waste management phase .......................................................................... 196
Table 5.36: Energy requirements during the waste management phase. ...................... 196
Table 5.37: Normalisation factors. ............................................................................... 211
Table 5.38: Impact weighting factors . ......................................................................... 212
Table 5.39: Environmental impact causes or contributing processes Buildings A- F...216
Table 5.40: Landfill and recycling costs (£/tonne) of materials. .................................. 220
Table 5.41: Relationship between buildings and costs (£/FU) within the phases. ....... 221
Table 6.1: Energy and utilities consumption in healthcare sector. ............................... 233
Table 6.2: Energy and utilities consumption in education sector. ................................ 235
Table 6.3: Maintenance/refurbishment data in healthcare and education sectors. ....... 237
Table 6.4: Waste management information in healthcare sector. ................................. 239
Table 6.5: Waste management information in education sector. .................................. 242
Table 6.6: Carbon footprint appraisal in healthcare sector. .......................................... 244
Table 6.7: Carbon footprint appraisal in education sector ............................................ 246
Table 6.8: Analysis parameters..................................................................................... 249
Table 6.9: Energy and utilities with parameters in healthcare sector. .......................... 251
Table 6.10: Energy and utilities with parameters in education sector. ......................... 252
Bassey B. Okon List of Figures
17
List of Figures
Figure 1.1: The structure of the thesis………………………………………………… 43
Figure 2.1: The study process. ........................................................................................ 43
Figure 2.2: The TBL of sustainable development . ........................................................ 45
Figure 2.3: The research contextual model. .................................................................... 47
Figure 2.4: Corporate sustainability agenda for construction industry........................... 50
Figure 2.5: The contribution of sustainable infrastructure to economic growth. ........... 54
Figure 2.6: Optional policy tools in promoting sustainable buildings. ........................... 56
Figure 2.7: Project life cycle framework ........................................................................ 58
Figure 2.8: Principles of sustainable construction. ......................................................... 61
Figure 2.9: A Framework for sustainable construction. ................................................. 63
Figure 2.10: Life cycle assessment model. ..................................................................... 67
Figure 2.11: Life cycle assessment framework . ............................................................ 68
Figure 2.12: Algorithmic process of LCC framework. ................................................... 72
Figure 2.13: The major barriers in LCC application. ..................................................... 76
Figure 2.14: Eco-efficiency and its impact on the economy. ......................................... 79
Figure 2.15: Best practice in waste management. .......................................................... 82
Figure 3.1: The research design approach. ..................................................................... 86
Figure 3.2: Weight for each rating. ................................................................................. 92
Figure 3.3: Venn diagram showing the intersection and union of set elements. ............ 95
Figure 3.4: Construction and operational phases of building infrastructure. ............... 100
Figure 3.5: LCA inventory analysis process. ................................................................ 103
Figure 4.1: The results and discussion pattern of the study. ......................................... 114
Figure 4.2: Relationship between factors and severity indices ranking. ...................... 136
Figure 4.3: Relationship between factors and COV ranking. ....................................... 137
Figure 4.4: Relationship between factors and CR. ....................................................... 139
Figure 4.5: Correlation between top marked factors and OR. ...................................... 141
Figure 4.6: Correlation between bottom marked factors and OR. ................................ 143
Figure 4.7: Relationship between factors and severity indices ranking. ...................... 161
Figure 4.8: Relationship between factors and COV ranking. ....................................... 163

Bassey B. Okon List of Figures
18
Figure 4.9: Relationship between factors and CR. ....................................................... 164
Figure 4.10: Correlation between top marked factors and OR. .................................... 166
Figure 4.11: Correlation between bottom marked factors and OR. .............................. 167
Figure 4.12: SI and time in investigated buildings at the critical level of operations. . 172
Figure 5.1: System boundaries. .................................................................................... 178
Figure 5.2: Analysed LCA environmental impact. ....................................................... 197
Figure 5.3: Abiotic depletion potential (ADP) life cycle impact results. ..................... 198
Figure 5.4: Acidification potential (AP) life cycle impact results. ............................... 200
Figure 5.5: Eutrophication potential (EP) impact results. ............................................ 201
Figure 5.6: Freshwater aquatic ecotoxicity potential (FAETP) impact results. ........... 202
Figure 5.7: Global warming potential (GWP100) impact results. .................................. 203
Figure 5.8: Human toxicity potential (HTP) impact results. ........................................ 205
Figure 5.9: Marine aquatic ecotoxicity potential (MAETP) impact results. ................ 206
Figure 5.10: Ozone layer depletion potential (ODP) impact results. ........................... 207
Figure 5.11: Photochem ozone creation potential (POCP) impact results. .................. 208
Figure 5.12: Terrestric ecotoxicity potential (TETP) impact results. ........................... 209
Figure 5.13: Total environmental impact results. ......................................................... 213
Figure 5.14: Environmental impact distribution curve in Buildings A–F, case I……..215
Figure 5.15: Environmental impact distribution curve in Buildings A–F, case II ....... 215
Figure 5.16: Life cycle phases and the LCC (£/FU) for Building A. ........................... 222
Figure 5.17: Life cycle phases and the LCC (£/FU) for Building B. ........................... 223
Figure 5.18: Life cycle phases and the LCC (£/FU) for Building C. ........................... 224
Figure 5.19: Life cycle phases and the LCC (£/FU) for Building D. ........................... 225
Figure 5.20: Life cycle phases and the LCC (£/FU) for Building E. ............................ 226
Figure 5.21: Life cycle phases and the LCC (£/FU) for Building F. ............................ 227
Figure 6.1: The process of study. .................................................................................. 231
Figure 6.2: Percentages contribution on energy and utilities use, healthcare sector. ... 234
Figure 6.3: Percentages contribution on energy and utilities use, education sector. .... 235
Figure 6.4: Waste generated in healthcare sector. ........................................................ 241
Figure 6.5: Waste generated in education (schools) sector. ......................................... 243
Figure 6.6: Carbon footprint result in healthcare sector. .............................................. 245

Bassey B. Okon List of Figures
19
Figure 6.7: Carbon footprint result in education sector. ............................................... 246
Figure 6.8: Correlation between healthcare and education sectors on CO2 emission. . 247
Figure 6.9: Probability result from carbon footprint in the investigated sectors. ......... 249
Figure 6.10: SI and time within investigated NHS and education sectors buildings ... 253
Bassey B. Okon List of Acronyms/Abbreviations
20
List of Acronyms/Abbreviations
ABCDE Annual Bank Conference on Development Economics
ADP Abiotic Depletion Potential
ALSCON Aluminium Smelter Company of Nigeria
AP Acidification Potential
ASHRAE American Society of Heating, Refrigeration and Air-conditioning Engineers
BC Building Construction
BCC Building Construction Company
BRE Building Research Establishment
BREEAM Building Research Establishment Environmental Assessment Method
BRI Building Research Institute
BSI British Standards Institution
CBO Community Based Organisation
CBPP Construction Industry Best Practice Programme
CCA Climate Change Acts
CcalC Carbon Calculator
CCCC Copenhagen Climate Change Conference
CCT Crown Carbon Trust
CHP Combined Heat and Power
CII Construction Industry Institute
CIOB Chartered Institute of Building
CIRC Construction Industry Review Committee
CIRIA Construction Industry Research Information Association
COV Coefficient of Variance
CR Category Ranking
CRC Carbon Reduction Commitment
Bassey B. Okon List of Acronyms/Abbreviations
21
DEA Department of Environmental Affairs
DEFRA Department for Food and Rural Affairs
DP Discount Payback
EA Environmental Assessment
EAC Equivalent Annual Cost
EIA Environmental Impact Assessment
ELC Environmental Literacy Council
ELCC Economic Life Cycle Cost
EMS Environmental Management Systems
EoL End-of-Life
EP Eutrophication Potential
ESCAP Economic and Social Commission for Asia and the Pacific
ETBP Environmental Technology Best Practice
FAETP Freshwater Aquatic Ecotoxicity Potential
FU Functional Unit
GBC Green Building Council
GHG Green House Gas
GPG Green Practice Guide
GWP Global Warming Potential
HTP Human Toxicity Potential
HVAC Heating, Ventilation and Air-Conditioning
ICME International Conference of Mechanical Engineers
IEM Integrated Environmental Management
IEMS Integrated Environmental Management Systems
IRR Internal Rate Return
ISM Infrastructure Systems Management
IS Infrastructure Systems

Bassey B. Okon List of Acronyms/Abbreviations
22
ISO International Organisation for Standardisation
LC Life Cycle
LCA Life Cycle Assessment
LCC Life Cycle Cost
LCPT Low Carbon Plan Transition
MAEP Marine Aquatic Ecotoxicity Potential
MDG Millennium Development Goal
MPN Mobil Producing Nigeria (Multi National Oil and Gas Company)
NAO National Audit Office
NGO Non–governmental Organisation
NHBC National House-Building Council
NHS National Health Service
NPV Net Present Value
OCED Organisation for Economic Co-operation and Development
ODP Ozone Depletion Potential
OHSAS Occupational Health and Safety Assessment Series
OPS Operations
OR Overall Ranking
POCP Photochem Ozone Creation Potential
PPP Public-Private Partnership
R&D Research and Development
RICS Royal Institute of Chartered Surveyors
RNCM Royal Northern College of Music
RON Return on Investment
SC Sustainable Construction
SD Sustainable Development
SEI Sustainable Engineering Infrastructure

Bassey B. Okon List of Acronyms/Abbreviations
23
SI Sustainability Index
SID Sustainable Infrastructure Development
SIM
SIMM
Sustainablility Index Matrix
Sustainable Infrastructure Management Model
SIR Saving to Investment Ratio
SP Simple Payback
SRM Sustainable Resources Management
SWG Sustainable Working Group
TBL Triple Bottom Line
TCF Total Carbon Footprint
TETP Terrestic Ecotoxicity Potential
TG Task Group
UK United Kingdom
UKGSD United Kingdom Government Sustainable Strategy Development
UKSC United Kingdom Sustainable Construction
UNCTAD United Nations Conference on Trade and Development
UNEP United Nations Environmental Programme on Industry Environment
UNFCCC United Nations Framework Convention on Climate Change
USDD
VE
United States Department of Defence
Value Engineering
WBCSD
WB
World Bank Commission on Sustainable Development
World Bank
WCE World Congress on Engineering
WCED World Commission on Environment and Development
WHO World Health Organisation
WWF Working With the Future

Bassey B. Okon Nomenclature
24
Nomenclature
AC Complement
Collection of elements
E Element of set
Є Real element of numbers
(£/FU) Cost in pounds per functional unit
(£/ton) Cost in pounds per ton of materials
fi Frequency of response
wi Weight of each rating
i Rating
X Weight of sample mean
Not element
3R Reduce, reuse and recycle materials
f Function
U Universal
P Probability
∑ Summation
∩ Intersection
Union
Ø Null set
σ2 Variance in data population
≤ Less than equal to
MJ Mega joule
Bassey B. Okon Nomenclature
25
kgm-3
Kilogram per cubic metre
PO4-
GWP100
Phosphate emission
Global warming potential
eq
Suv
Equivalent
Sustainability value
CO2 Carbon dioxide
n Numbers
kWh Kilo Watt hour
m2 Square metres
m3 Cubic metres
l Litres
∫
Integral function

Bassey B. Okon Copyright Statement
26
Copyright Statement
The author of this thesis (including any appendices and/or schedules to this thesis)
owns any copyright in it (the “Copyright”) and has given The University College
London (UCL) the right to use such Copyright for any administrative, promotional,
educational and/or teaching purposes. Copies of this thesis, either in full or in extracts,
may be made only in accordance with the regulations of the UCL‟s Library. Details of
these regulations may be obtained from the Librarian. This page must form part of any
such copies made. The ownership of any patents designs, trademarks and any and all
other intellectual property rights except for the Copyright (the “Intellectual Property
Rights”) and any reproductions of copyright works, for instance, graphs and tables
(“Reproductions”), which may be described in this thesis, may not be owned by the
author and may be owned by third parties. Such Intellectual Property Rights and/or
Reproductions cannot and must not be made available for use without the prior written
permission of the owner(s) of the relevant Intellectual Property Rights and/or
Reproductions. Further information on the conditions under which disclosure,
publications and exploitation of this thesis, the Copyright and any Intellectual Property
Rights and/or Reproductions described in it may take place is available from the School
of Construction and Project Management, UCL.

Bassey B. Okon Acknowledgements
27
Acknowledgements
The author hereby expresses his profound gratitude to the Almighty God for
providing him with the enabling grace in the pursuit of this research. The author
remains highly indebted to his Supervisors, Dr. Taha Elhag and Dr. Aeli Roberts for
their invaluable support and encouragement which enhanced the successful completion
of this study. Additionally, the author‟s token of appreciation goes to the entire
members of Dr Taha‟s research group in the UCL, whose pieces of advice and
assistance have counted immensely.
I sincerely appreciate the efforts of my late parents, Mr and Mrs Bassey E. Okon for
their goodwill in my career. In addition, my siblings along with Etini and Kindness are
well appreciated for their love and support throughout my period of stay in the UK.
Deacon Edem Esara is equally acknowledged for his labour of love and encourgement
in the course of this programme. Moreover, the author‟s sponsor, Akwa Ibom State
University of Technology (AKUTECH), Nigeria is lauded for sustaining this staff
development programme.
Finally, the author commends the collaborative efforts of Messrs. David Litter,
Director of Sustainability, DBP Company, Manchester Office, UK, and Brady Lurie,
Director of Projects Management and Building Services Programme, Liverpool John
Moores University. However, the inputs of Jacobs Engineering Limited, and Davis
Langdon (AECOM) Company, UK are acknowledged in this thesis. Also, the
management and staff of the ALSCON and MPN, Nigeria are appreciated for their
contributions and co-operation in the course of this study. The management and staff of
the participating hospitals (NHS) and schools among other organisations within the UK
that contributed to the success of this study are equally acknowledged for their
assistance.
Bassey B. Okon Definition of key terms
28
Definition of key terms
The key terms as applied in this thesis are clearly defined. They include:
Building services infrastructure performance: Explains the services delivery and the
measure of the related activities to include resources use within a building (facility).
Coefficient of Variation: Expesses the percentage difference in one variable relating
to another variable in data analysis (Field, 2006).
Factor: Another name for an independent variable and is typically used when
describing experimental designs in analysis (Field, 2006).
Frequency: Defines the number of repetitions of sample distribution in a data test.
Matrix: Expresses a collection of numbers arranged in columns and rows. The values
within a matrix are typically referred to as components or elements in a numerical test.
Normalisation: Arranging sustainablity values limit to unity or sorting of variables
for the ease of computation (Heidi et al., 2005).
Reliability: Describes the ability of a measure to produce consistent results when the
same entities are considered under the same conditions (Field, 2006).
Sustainability index: Explains the ratio of the global bio-capacity of the earth to the
ecological footprint in building infrastructure (Cleveland, 2013; Knoepfel, 2001).
Sustainability: The practice of sustainability in this context explains the creation of
new techniques in the exploitation of available resources to promote equitable, bearable
and viable values with a healthy future for every individual and the planet.
Severity Index: Explains the level of impact or influence.
Weighting: Describes the number by which variables are multiplied in data analysis.
The weight assigned to a variable determines the influence that the variable has within a
mathematical equation (Field, 2006).

Bassey B. Okon Publications
Publications
This study has resulted in the following publications.
Refereed Journals:
Okon, B. B., Ekpo, S., and Elhag, T. S. M., (2010), A Sustainable Engineering
Infrastructure (SEI) Model for the 21st Century. Journal: Lecture Notes in Engineering
and Computer Science, 2184, 1 pp. 1101–1105.
Okon, B. B., and Elhag, T. S. M., (2011), Sustainability Index: An Application into
Sustainable Engineering Infrastructure Management and Assessment. Journal of
Mechanics Engineering and Automation, 1, 1 pp. 18 – 31.
Okon, B. B., and Elhag, T. M. S., (2011), Infrastructure Assessment: A Case Study of
Aluminium Smelting Plant, Nigeria. Journal: Lecture Notes in Engineering and
Computer Science, 2192, pp. 2052–2056.
Refereed Conferences:
Okon, B. B., and Elhag, T. M. S., (2011), Sustainable Engineering and Innovative
Technology in Managing Infrastructure Systems, 10th International Research Conference
on Quality, Innovation & Knowledge Management, Malaysia.
Okon, B. B., and Elhag, T. M. S., (2011), The Role of Education for Sustainable
Engineering and Technology in Construction Infrastructure. Proceedings of the
Engineering Sustainability (ES) Conference, University of Pittsburgh, USA.
Okon, B. B., and Elhag, T. M. S., (2012), The Sustainable Infrastructure Management
Model (SIMM): International Conference on Systems Engineering and Engineering
Management. World Congress on Engineering and Computer Science (WCECS), San
Francisco, USA.

Bassey B. Okon Introduction to Building Services Infrastructure
Systems Management
30
Chapter One
1.0 Introduction to building services infrastructure systems
management
This study overviews the management practices regarding building (facility) services
infrastructure and building construction activities in the UK. In addition, there are also
some comparative elements in this study between the UK and Nigerian scenarios. The
aim of this study is to investigate the key management practices concerning the
highlighted background activities and to address such problems with a view to
achieving a more sustainable and good quality services delivery in buildings. The
Chapter begins with an introduction to the general context of the research. This is
followed with a synopsis of the situation regarding sustainability in building services
infrastructure and building construction management practices. In this Chapter also, the
associated management practices are assessed from the „cradle to grave‟ processes in
terms of their integration of the sustainability agenda as a means to realise sustainable
development. Additionally, this chapter presents a statement of the research problem
with is concerned with exploring how to deliver the appropriate management practices.
Furthermore, the Chapter contains the research questions, aim and objectives, and
indicates the scope of study. The significance and benefits of the research are also
considered briefly, and the way in which the thesis is structured is shown.
1.1 Sustainability in building services infrastructure
The building services infrastructure utility resources and their application within the
built environment is of great concern. Energy and water resources are the basic utilities
commonly used in every home and all facilities around the world (Killip, 2005; NSF,
2005; Kintner-Meryer, 1999). The sustainability of these resources is now becoming a
topical issue in the global economy (UNFCCC, 2012; Eco Homes, 2003; Doka, 2007).
Contemporary researchers have established that one of the greatest challenges of the
present era is anchored on the issue of resources exploitation and sustainable
development. But, there are huge implications of the exploitation of resources for

Bassey B. Okon Introduction to Building Services Infrastructure
Systems Management
31
human activities (WCED, 1987; Ellis, 2007; GSGF, 2010). In this respect, BREEAM
(2008) notes that the rapid industrialisation, as witnessed through building services
infrastructure growth in various emerging economies worldwide, has a negative impact
on the available resources and the environment (Bardos, et al., 2009; CIOB, 2011).
Fundamentally:
Building services infrastructure in this context spreads across water,
wastewater, energy and utilities, heat, air-conditioning and ventilation (HVAC), fume
extraction, fire protection and alarm systems. Additionally, elevators (lifts), waste
management systems and information technology (IT) systems are needed for the proper
functioning of buildings (facilities). Other building services responsibilities are the in-
house predictive, corrective and ancillary maintenance practices undertaken on the
listed equipment within the buildings (facilities) for effective services delivery (Grigg,
1988; Armstrong, 1987; Okon et al., 2010; ASHRAE, 2004).
The overall aim in this case is to provide sustainable, economic and reliable
management practices to support the buildings (facilities) use. However, these building
services infrastructure practices and their development have placed the issue of resource
availability and the environmental implications of current spread strategies at the centre
stage in economic expansion activities (BSI, 2006; GSGF, 2010). Indeed, recent studies
from (Cuellar and Adisa, 2011; Darby et al., 2011) have also revealed the impact of
building services infrastructure activities. More often than not, these impacts are seen
through the application of cooking gas, coal, fossil fuel, and oil, within the construction
and operational (use) phases of the building. In this situation, it is noted (see ASHRAE,
2004; Armstrong, 1987) that the release of these burnt products into the atmosphere
means that toxins are caught up in the air, thus giving rise to the global warming threat
(BREEAM, 2008; Smith, 2009). Consequently, some researchers have proposed the
regulation of building services activities through the integration of the sustainability
agenda within corporate business strategies as a means of achieving sustainable
development goals (Welford, 2003; KPMG, 2008).
The incorporation of the sustainability agenda into building services activities is
tailored towards achieving best practices in the field of resource consumption (CIOB,

Bassey B. Okon Introduction to Building Services Infrastructure
Systems Management
32
2010; CIOB, 2011; CCT, 2008), and management of the buildings with a view to
realising sustainable development. It is in this direction that regulatory changes (KPMG,
2008; Loosemore and Phua, 2011) concerning the social, economic and environmental
reputation of building services infrastructure management activities could be attained
(Epstein, 2006; Lelyveld and Woods, 2010).
1.2 Sustainability in building construction
In the 21st century, much emphasis has been placed on the concept of sustainability
within building construction activities. The construction industry has been identified as
one of the major drivers of economic development within the built environment (Oritz,
et al., 2009; OCED, 2003) but the activities undertaken within that industry need to be
appraised for their sustainability (Cheshire, 2007; BREEAM, 2008). In fact, Boyle,
(2005) noted that the overall concept of sustainability relating to buildings is still poorly
defined. However, to a large extent, the focus of sustainability is on the utilisation of
energy in buildings. In the UK, approximately 66% of the total energy consumption is
accounted for by buildings and building construction activities (Boyle, 2005). That said,
Winther and Hestnes (1999), and Eaton and Amato (1998) have argued that the energy
consumed in the operational phase of a building overshadows that of the construction
phase. Typically, 90% of the energy is consumed in the operational phase over the
lifespan of the building. As a result, much research has focused on sustainability and the
reduction of energy use in respect of house and water heating (ASTM, 2002; Ashworth,
1999; ASHRAE, 2004).
In respect of the integration of sustainability within construction activities, Boyle‟s
(2005) study revealed that this has become imperative due to the growing concern that
human activities are affecting global and local ecosystems (Bellandi, 2004; Sabol,
2008). These human activities within the construction industry have severe
environmental impacts and potentially cause permanent changes to some ecosystems
and to natural resources generally (Lorenz, 2008; Killip, 2005). For instance, Lippiatt
(1999) indicates that buildings consume 40% of the gravel, stone and sand, 25% of the
timber, 40% of the energy and 16% of the water used globally per year. In the UK
alone, it has been estimated that about 6 tons of building materials per every member of
Bassey B. Okon Introduction to Building Services Infrastructure
Systems Management
33
the population are used annually (Cooper et al., 1997). Clearly, such statistics show the
need for a sustainability check (Bardos, et al., 2009; Ding, 2008; CIOB, 2010).
It is true that the principles and benefits of sustainability and other frameworks as
applied to the construction industry have been discussed (Cheshire and Maunsell, 2007;
BREEAM, 2008; BSI, 2008; CCT, 2008; Hill and Bowen, 1997; ISO, 1997; Dutil et al.,
2011). And it has been argued that within the context of the construction industry,
sustainability could be promoted through corporate social responsibility (KPMG, 2008;
Mior, 2001; Welford, 2003). In fact, this is a crucial requirement as sustainable
practices promote value added for building construction activities in terms of their long-
term viability (Pedersen, 2006). It is noted by KPMG (2008), that the integration of
sustainability as a corporate business strategy within the construction industry, provides
the necessary framework for the success of building developments (Aaronson, 2009;
Loosemore and Phua, 2011). Generally, the efforts expended in response to that strategy
encourage building construction activities that are in harmony with the idea of
sustainable socio-economic and environmental success (ESCAP, 2006; Clift, 2003).
1.3 Problem statement
Building services infrastructure management and evaluation in contemporary society
is very challenging. Increasingly, building services infrastructure users are finding it
difficult to adjust to the rates of water and energy use, among other resources, at the
same time as attempting to introduce sustainability measures (Kintner-Meyer, 1999;
Eco Homes, 2003; ASHRAE, 2004). This study recognises the pressure associated with
building services infrastructure and the need for sustainability, and consequently aims to
explore the challenges, mitigating situations, and the current best practice implemented
in the hope of a 0practical solution. There are already many studies that have considered
the current design of building services infrastructure systems and models to incorporate
various innovative models to promote quality of services whilst also achieving the
economical management of utilities resources (RICS, 2010; PMPCB, 2010; DEFRA,
2011).
And in this study, the building construction activities are similarly appraised from
the „cradle to grave‟ as found in the work of various authors (see for example, Clift and

Bassey B. Okon Introduction to Building Services Infrastructure
Systems Management
34
Bourke, 1999; Lorenz, 2008; Clift, 2003). However, it is acknowledged, that regardless
of the breakthroughs that have been made by the various modelling activities conducted
by previous researchers, there remains a need for more emphasis on the expansion of
tools that can be implemented, and on the need to create more awareness concerning the
use of building services, and building construction activities. These challenges provide
the rationale for examining the entire range of building management practices in order
to arrive at possible solutions to the research problem.
1.4 Aim and objectives of the research
This study aims to examine the barriers to the implementation of best practices in
managing sustainable building services systems. It focuses on the building services
infrastructure and building construction activities within the UK and Nigeria.
The main objectives of the study are as follows:
To identify the problems influencing sustainable infrastructure management
practices within the building services and building construction activities.
To investigate the obstacles to the achievement of the best practices within the
context of this study.
To appraise the current standard of performance within the building services
infrastructure systems and management practices in both the public and private
sectors.
To develop suitable models and frameworks for addressing problems associated
with building services management and building construction activities.
To compare the developed models and frameworks with the existing ones and to
verify the results using different phases of study.
1.5 Research questions
This study is concerned with the delivery of building services infrastructure systems
that aim to produce sustainability within UK and Nigerian buildings (facilities). As a
result, the following questions are formulated:
Bassey B. Okon Introduction to Building Services Infrastructure
Systems Management
35
Are building services infrastructure systems and building construction projects
properly managed according to the sustainability criteria?
Is the concept of sustainability integrated into building services infrastructure
systems and construction projects?
Is the sustainability agenda appropriately incorporated in both the public and
sectors in this context?
Is it possible for clients to manage, verify and validate sustainability processes
together with other important activities relating to building services infrastructure
systems and building construction projects?
What are the private and public sectors‟ attitudes towards integrating the concept
of sustainability within building services infrastructure and building construction
projects in the 21st century?
Does the awareness regarding the concept of sustainability in this context have
any positive impact upon practical applications?
1.6 Scope of the research
This research reviews an extensive body of literature concerned with building
services infrastructure, including that relating to energy, water, and wastewater among
others, and the management practices associated with these services. The building
construction aspect is also reviewed. This approach is necessary as the major areas of
interest in this study centre on the current management practices and standards of
performance associated with success in terms of sustainability. Building services
infrastructure characteristics are considered within the UK and Nigerian scenarios.
Additionally, the LCA and LCC among other techniques, are employed to measure the
performance of services delivery in this study.
Energy and utilities management and their carbon footprint within hospitals and
schools in UK are also studied and a comparative analysis is made between the two
sectors. An SEI model, the sustainable index matrix, and the partial differential equation
method are also developed to verify the sustainability indices of the building services
infrastructure studied. The existing knowledge, identification of problem areas and

Bassey B. Okon Introduction to Building Services Infrastructure
Systems Management
36
applications are addressed in this study. Generally, the management practices within
building services and construction projects in the UK and Nigeria are considered.
1.7 Relationship among the entire phases of study, I – VII
The study in phase I, relates to the building services infrastructure characteristics
associated with the operation and maintenance management of commercial buildings
(Shopping Malls) within the UK. In study phase II, construction activities are examined
within five building construction companies in the UK. The study in phase III focuses
on the building services infrastructure characteristics in respect of the operation and
maintenance management within the Aluminium Smelter Company of Nigeria
(ALSCON) facilities. In phase IV, the study addresses the building services infrastrcture
characteristics associated with the operation and maintenance management within the
Mobil Producing Nigeria (MPN) facilities in Nigeria.
All the phases of this study are related in terms of their architecture, components and
engineering design for optimum services delivery. Classically, the building services
infrastructure characteristics in the study phases I – IV are designed with holistically
provide services in buildings (facilities) settings from the cradle to grave. That is, from
the design, construction, operation (use) and maintenance stages of buildings and
facilities (RICS, 2008; Grigg, 1988; NSF, 2005). As such, this pattern houses all the
building services infrastructure components in the study phase V which LCA and LCC
examined. Therefore, the environmental impact arising from the equipment and
operation, energy and utilities use, together with their related costs can be evaluated to
ascertain the quality of performance in buildings and facilities.
In the case of the energy and utilities appraisal in study phase VI, the activities
involved are within buildings and facilities as elements of the infrastructure systems.
The energy and utilities use gradually constitutes environmental impact. Hence, the
impact arising from energy and utilities consumption contributes towards the climate
change threat (PMPCB, 2010; RICS, 2008; Ellis, 2007; CCT, 2008). With the
integration of sustainability programmes into building services infrastructure and
building construction activities as core management strategies, this problem could be
appropriately addressed. However, such integration can only be effectively achieved

Bassey B. Okon Introduction to Building Services Infrastructure
Systems Management
37
through suitable innovative design and construction, the installation of quality
equipment, and the implementation of standard maintenance culture practices in study
phases I – V, as revealed in data from various surveys (Horner et al., 1997; Bayer et al.,
2010). The study in phase VII is also related to the other phases of the research
activities. In phase VII of this study, structured interviews are held to evaluate the
perception of sustainability in the current management practices and implementation
processes in building projects. The interview findings are used to corroborate the survey
information contained in Chapter Seven of this thesis.
1.8 Gaps in the literature
Sustainability ethics and their incorporation within activities concerned with building
services infrastructure, and building construction projects represent a challenge for
building services engineers, and therefore, the entire topic requires more study. The
sustainability agenda is defined as meeting the needs of the present generation without
compromising the ability of the future generation to satisfy its own needs (WCED,
1978; UM, 2002) and this agenda has had a very significant impact across the whole
range of different economic activities. It has been progressively noted (see for example,
KMPG, 2008; Wood, 2006; OCED, 2003) that the sustainability agenda and its
implementation within this context represent a paradigm shift in respect of social,
environmental and economic activities (Yudelson, 2008; UKSC, 2006; Turner, 2006).
The notion of the sustainability programme as requiring innovative building
management strategies has brought much transformation into the construction sector
over the years (Ding, 2008; Shah, 2007), and recent studies (see for example, Wood,
2006; GSGF, 2010; Girouard, 2011; Dutil et al., 2011) can be identified in this area.
However, so far, the studies produced have considered sustainability from a qualitative
approach.
There is little or no information from researchers who have addressed impacts upon
sustainability using quantitative methods. Furthermore, studies exploring the
sustainability impact from quantitative approaches, are not common within this context.
Hence, there is a lack of rigorous information concerned with the measurement of the
sustainability impact caused by building activities in the UK and Nigerian contexts.
Bassey B. Okon Introduction to Building Services Infrastructure
Systems Management
38
This study will concentrate on providing literature in this respect, thereby producing
information concerning sustainability impact within building services infrastructure
activities, which is obtained using both qualitative and quantitative methods. Recent
studies (Okon et al., 2010; Okon and Elhag, 2012) have established the SEI model and
sustainable infrastructure management model as implementable tools for appraising
quantitative sustainability impact in respect of building activities goals. This study will
also explore the sustainability drivers, policies, challenges, and the factors affecting the
appropriate implementation of the sustainability agenda within building management.
Moreover, various building management strategies will be considered to add valuable
contributions to the debate about sustainable development success.
1.9 Significance and benefits of the research
The research outcomes are significant for a wide range of practitioners (experts)
concerned with sustainability programmes in the general area of building services
infrastructure and building construction activities. In particular, the benefits will be
through the identification of management problems, characteristics, gaps, the major
policy drivers, and the provision of implementation tools for sustainability goals. The
indicators in respect of sustainability goals are identified through the SEI model and a
partial differential equation method. A sustainability index matrix (SIM) is also
established through this study as a management technique for appraising building
services infrastructure performance. Also, a project life cycle frameworkis developed
and applied in measuring the sustainability indices of the building projects examined in
the study. These models are innovative management strategies aimed at supporting
sustainable development success in this context. In the same vein, other new approaches
towards the mitigation of building services infrastructure systems problems are
established in this thesis. Moreover, all the phases of study address the building
management problems in both the public and private sectors of the economy.
Findings from this study will provide appropriate platforms for building experts
(building services, facility managers, building contractors, architects) and financiers
amongst others. These findings will raise awareness among both public and private
sector clients‟ of how they can employ the SEI model for sustainable building

Bassey B. Okon Introduction to Building Services Infrastructure
Systems Management
39
management. The incorporation of the sustainable infrastructure management model
and sustainability index matrix model will also offer a better approach in evaluating
building project delivery. Also, the project life cycle framework will create a
competitive advantage in appraising the cradle to grave activities in building
management processes. It is worthwhile to mention that this study will also deliver
improved knowledge and understanding in respect of the integration of the
sustainability agenda into building management activities.
1.10 Structure of the thesis
The structure of the thesis is illustrated in Figure 1.1.
Figure 1.1: The structure of the thesis
This study is structured into eight Chapters and the appendices. Chapter One presents
the introduction to building services infrastructure and building construction activities
and management. It further includes sustainability integration within the context of this
study, the statement of the research problem, and the questions that have been
formulated to address this. The aim and objectives of the study, scope, significance and
benefits, together with the structure of the thesis, and an overall summary of the chapter,
are also presented.

Bassey B. Okon Introduction to Building Services Infrastructure
Systems Management
40
Chapter Two provides a review of the related literature and gives an introduction to
sustainability and sustainable development in respect of building services infrastructure
systems management. The triple bottom line (TBL) of sustainable development is also
discussed. Again, the overall context of the study and the ecological modernisation
regarding building services infrastructure management are examined. Corporate
sustainability and knowledge transfer in respect of building services infrastructure
systems management are also considered, as are the associated challenges. Sustainable
building services infrastructure in the context of economic growth in contemporary
society is also analysed and discussed in this Chapter. The various frameworks for
building services infrastructure and building construction development are explored,
and proactive measures for addressing sustainable building services infrastructure
management and engineering are indicated as best practice.
Chapter Three presents the research methods concerned with sustainable
infrastructure systems management. Additionally, the design for this study is
introduced, presented in an algorithmic flow chart which shows the sequence of the
processes undertaken. Information regarding the surveys conducted in the different
phases of study is also provided, and details of the pilot study, administration, feedback,
and techniques of analysis are also given. Additionally, the Chapter includes details of
the SEI model development and the methods used for the interviews and analysis.
Chapter Four explores the results and discussions relating to study phases I – IV. The
study phases are commercial buildings (operation and maintenance), building
construction companies, UK and ALSCON with MPN facilities in Nigeria. This
basically addresses the findings from the examination of the characteristics of the
building services infrastructure associated with these companies and facilities. The
building services infrastructure in the UK contains shopping malls among other
commercial buildings, and the building construction industry. In the Nigerian situation,
ALSCON and MPN buildings (facilities) are examined. This Chapter also accounts for
the sustainability index matrix used in the determination of the building services
infrastructure performance. Results from the comparative analysis of the UK and
Nigerian scenarios, and the sustainability indices for both cases in respect of the

Bassey B. Okon Introduction to Building Services Infrastructure
Systems Management
41
building services infrastructure characteristics, and the management techniques that are
used to ascertain the performance of individual organisations, are also presented.
Chapter Five considers the results and offers a discussion concerning the LCA
appraisal of ten environmental impacts of the infrastructure of six buildings within the
UK, study phase V. Furthermore, the LCC evaluation of these six buildings‟
infrastructure, and the findings from the statistical examination of the findings in this
respect, are also reported.
Chapter Six presents the results and a discussion of the energy and utilities
management, together with a carbon footprint study, of the healthcare and education
sectors within the UK. This investigation is conducted in phase VI of the study. The
Chapter also incorporates information about the study process and data acquisition. The
results and a discussion concerning the operation (use), maintenance and waste
management activities within the investigated sectors are also presented. This Chapter
includes carbon footprint management, probability analysis, sustainability index results
and a comparative analysis through the application of a partial differential equation
method in ascertaining building services performance.
Chapter Seven presents the concept of sustainability and its integration within
building services infrastructure management as perceived by industry-specific experts
with whom structured interviews are held. This section of the study represents phase
VII. Also contained in this Chapter is a discussion of the relationship and the benefits
derived from all the phases of the study.
Chapter Eight highlights the conclusions of the study and the recommendations
made. It also discusses the contributions to knowledge made by the study, the
limitations it encountered, and makes recommendations in respect of further research.
Several appendices are attached to the thesis for reference purposes.
1.11 Summary
This Chapter of the thesis has provided a detailed insight into the background to the
study, and has given an introduction to the overall context of the research. The need for
the integration of sustainability objectives within building services infrastructure and
building construction projects activities has been presented, and from this, a statement

Bassey B. Okon Introduction to Building Services Infrastructure
Systems Management
42
of the problem, the aim and objectives of the study, and the research questions
associated with it, have been formulated. The gaps in the current literature have been
identified, and the significance and benefits of this study are noted. In addition the way
in which the research study is structured has been shown. It has been noted that the
benefits of this study are specifically through its application of the SEI model and other
strategic management methods. Furthermore, however, the other contributions made by
the study are also noted. Having produced this background information, the necessary
theoretical foundations of the research have been identified.

Bassey B. Okon Sustainability and Sustainable Development in Building
Services Infrastructure Systems Management
43
Chapter Two
2.0 Sustainability and sustainable development in building
services infrastructure systems management
2.1 Introduction
Issues relating to sustainability in the 21st century are increasingly gaining
prominence in interdisciplinary engineering applications within building services
infrastructure systems, sub-systems and technologies, as the aim of achieving
sustainable development goals gathers momentum. Indeed, all economic development
frameworks rest on sustainability for future advancement (WCED, 1987; UM, 2002). It
therefore becomes imperative for the sustainability agenda to be incorporated within
building services management as a core business strategy and best practice (KPMG,
2008). This study requires the exploration of different themes as shown in Figure 2.1.
Figure 2.1: The study process
2.2 Sustainability and sustainable development
Sustainability and its wider application is quite an innovative advancement, which, in
part, seeks to address the poor management of existing natural resources. The recent
application of sustainability pervades every facet of economic, material and human
endeavours regarding the sustainable development goals (Bardos et al., 2009). More
interestingly, Drexhage and Murphy (2010) argued that the concept of sustainability is
perhaps best described as a measure of how well a particular endeavour is able to meet
Bassey B. Okon Sustainability and Sustainable Development in Building
Services Infrastructure Systems Management
44
these goals of sustainable development. It can also be defined as meeting the needs of
the present without compromising the ability of future generations to satisfy their own
needs (WCED, 1987; Elkington, 1997). Certainly, it has grown in significance across
many business organisations. Indeed, increasingly, organisations including the
construction industry are becoming more concerned with the impact of their business
activities on economic, social and environmental sustainability (Elmualim et al., 2012).
The impact of sustainability issues on building construction activities is topical and
challenging, and consequently debates on the way forward are needed (UNFCCC, 2009;
CIOB, 2011; Cheshire and Maunsell, 2007). The overall debate has culminated in the
discovery of the issues and drivers that can offer guidance in relation to sustainability
appraisal and the improvement of building construction activities to ensure sustainable
development (Cheshire, 2007; Elmualim et al., 2012; Eco Homes, 2003). However,
Dutil et al. (2011) argue that guidance in itself is not enough and that sustainability
imperatives must be integrated with building management policy, and recognised as key
ingredients (OECD, 2003). Such an approach will curtail a significant amount of the
social, economic and environmental impact arising from building activities. Moreover,
the compulsory integration of sustainability criteria will demand regulatory compliance
with the recurrent issues concerning resources use and climate change (RICS, 2008;
GSGF, 2010; GBPC, 2010; UNFCCC, 2012; Lazarus, 2005).
In a related development, the UNFCCC (2012) argued that issues concerning the
recurrent use of resources, and climate change (ozone depletion, pollution, ecosystem
destruction and global warming) amongst others, can be managed through sustainability
programmes (Rio Summit, 1992). Environmental concern about the economic and
social outcomes of resources over-utilisation is a must if sustainable development is to
be achieved. Nonetheless, such concern in itself is not sufficient, since as several studies
in this context have shown, sustainable development cannot function without actual
sustainability goals (WCED, 1987; Sattertherwaite, 2001; Pope et al., 2004; WB, 2010).
2.2.1 Review of the triple bottom line of sustainable development
The triple bottom line (TBL) principles of sustainable development emphasise the
need for an inseparable framework to support sustainability goals (Elkington, 1997;

Bassey B. Okon Sustainability and Sustainable Development in Building
Services Infrastructure Systems Management
45
KPMG, 2008). Increasingly, the TBL framework in this context incorporates a highly
inter-related and equally important relationship among the three values regarding the
use of natural resources in building management. Furthermore, due to the significance
of the TBL model in achieving sustainability, Hacking and Guthrie (2008) have noted
that the framework is gradually gaining acceptability in the global building industry as a
vehicle for realising sustainability objectives. Indeed, recently, business communities
worldwide have adopted the TBL paradigm as a framework for corporate reporting
practices to comply with regulatory changes, and to improve their social, economic and
environmental reputation in respect of sustainable development goals (WCED, 1987;
Elkington, 1997; KPMG, 2008). Figure 2.2 depicts the TBL model of sustainable
development.
Figure 2.2: The TBL model of sustainable development (UM, 2002: Okon et al.,
2010).
In practical terms, the TBL framework expresses a set of environmental values that
include natural resources utilisation, environmental management, and pollution
prevention and controls (air, land waste, and water resources) (Annecke and Swilling,
2005). Elkington (1997) includes the notion that the social set focuses on the standards
of living, equal opportunity, community, governance, institutions, inclusion,

Bassey B. Okon Sustainability and Sustainable Development in Building
Services Infrastructure Systems Management
46
consultations, and empowerment of citizenry. The economic set outlines cost savings,
profits, research and development, economic growth, efficiency, and stability. Within
the sustainability model, the spheres of sustainability intersect (socio-environmental)
values yielding a new set of sustainable engineering infrastructure (SEI) model values
(WCED, 1987: UM, 2002; Okon et al., 2010).
On the other hand it is maintained (Young, 1997; Elkington, 1997; UM, 2002) that
the socio-environmental values are: environmental justice, natural resources, and
stewardship. Moreover, where sustainability intersections occur between economic and
social values, they can be seen to promote the equitability standards of business ethics,
fair trades, and workers right. The intersection between environmental and economics
values supports the viability values of energy efficiency, subsidies, and incentives
through the use of natural resources, as shown in Figure 2.2 (UM, 2002; Okon et al.,
2010).
However, due to the rapid industrialisation witnessed throughout the building
industry in various emerging economies in the world, it is necessary for all available
resources to be suitably managed. This is vital, particularly because of the human-
induced threat of global warming, and the fact that with more controls, the natural
environment could be better protected. The TBL model is capable of integrating
sustainability into corporate building industry strategies to achieve for sustainable
development goals (Bardos et al., 2009; Keller, 2009). In this respect, it is valuable for
testing sustainability practices, thus adding value to building services activities and their
evaluation, as reported in this thesis.
2.2.2 The context of the research
In this study, the main area of interest is the establishment of best practices through
integrating sustainability principles into building services infrastructure management as
core business strategy for sustainable development. The literature reviewed in this
chapter identifies the key sustainability issues, policy drivers and frameworks, and
incorporates the concept of sustainability into building services activities within a wider
framework of sustainable development. The challenges associated with the
environmental, economic, and social values are also investigated in the light of the ever-

Bassey B. Okon Sustainability and Sustainable Development in Building
Services Infrastructure Systems Management
47
increasing building development and urban sprawl witnessed in the built environment.
Basically, this study provides an overview of:
The services delivery within the building services (infrastructure) utilities
management, and building construction projects activities generally. The infrastructure
services include energy, water, heating, waste management, materials consumption, and
their carbon footprint. Also, the life cycle analysis and life cycle costs evaluation
associated with building services performance are studied (ASHRAE, 2004; Armstrong,
1997; GSGF, 2010; Bayer et al., 2010).
The built environment‟s potential as a major contributor to the achievement of
sustainability initiatives cannot be over-emphasised. These potential contributions in
terms of sustainability principles can be seen in the promotion of sustainable building
industry activities (BREEAM, 2008; ASHRAE, 1999; ASHRAE, 2004). The principles
themselves rest on gradual adoption by eco-efficient building services management of
integrated and multi-disciplinary innovative approaches that will ultimately produce
effective building performance. Current innovative and sustainability management
protocols regarding building practices are well documented (PMPCB, 2010; Eco
Homes, 2003; CCT, 2008). Figure 2.3 illustrates how sustainability principles are
incorporated into the various processes involved in building construction.
Figure 2.3: The research contextual model.

Bassey B. Okon Sustainability and Sustainable Development in Building
Services Infrastructure Systems Management
48
There is a need to incorporate sustainability principles within building construction
processes because these principles evolve through active participation of building
services experts, who through this involvement, directly influence building management
(NIBS, 2006; Shah, 2007; BSI, 2008).
2.3 Ecological modernisation in building services practice
Ecological modernisation accounts for the generic polices hitherto formulated to
address sustainability issues and practices in building services management, and the
construction industry (Nebel, 2006; BREEAM, 2008). In this connection, a study by
Pope et al., (2004) has revealed that the concept of ecological modernisation within the
building sector is primarily focused on the integration of sustainability goals within
building practices. This is most likely because the building services and building
professionals have the best opportunity to promote ecological modernisation ethics
through implementing sustainability practices in the early stages of building projects
(CIOB, 2008; Eco Homes, 2003; CIOB, 2011). Also, the theory and practices
concerning ecological modernisation in the building services context, have overlapping
significance in the social, economic and environmental (triple) values, and these
overlaps strengthen sustainable development goals (Lazarus, 2005; ASHRAE, 2004;
WCED, 1987).
Turner (2006) has argued that the theory underpinning ecological modernisation and
its promotion of sustainable building services practice, is tailored to incorporate the
technological and innovative models that will improve the triple line of sustainable
development (Norris, 2006; UKSC, 2006). And other scholars (see for example, Pope et
al., 2004; Horner et al., 1997; Wood, 2006) have noted that the non-compliance of
building services experts with the theory and practices of ecological modernisation will
weaken the entire success of sustainability processes. In fact, the ecological
modernisation practices required to achieve sustainability objectives are well
documented (IPMVP, 2002; PMPCB, 2010; UKGSD, 2005), and include information
regarding protocols for assessing energy utilities, water use, wastewater, and the
building services practices for sustainability attainment (Wood, 2006; ASHRAE, 2004).
The ecological modernisation practices in this case, will engender a balance in the

Bassey B. Okon Sustainability and Sustainable Development in Building
Services Infrastructure Systems Management
49
utilisation of the available resources and promote eco-friendly building services
infrastructure management (GSGF, 2010).
2.4 Corporate sustainability and knowledge transfer in
building services management
Breakthroughs in existing technological advancements have integrated corporate
sustainability and knowledge transfer within building services management, and
interdisciplinary engineering practices (Landman, 1999; ASTM, 2002). With increasing
energy, water and maintenance costs currently experienced in various homes, offices
and the construction industry, the integration of corporate sustainability policies
becomes crucial (Moir, 2011; CIOB, 2011; CCT, 2008). In a study conducted by
Kintner-Meyer (1999) on building services infrastructure, it was found that energy,
water and other utilities all have a significant influence over how buildings are used,
thereby necessitating corporate sustainability policies and implementation (KPMG,
2008; BREEAM, 2008).
Corporate sustainability and knowledge transfer related to building industry activities
explain the paradigm shift in theory associated with the dynamic policy changes
directed towards best practices within the building services domain (CIOB, 2010;
OECD, 2009a; NSF, 2005). In recent times, the building industry, through the corporate
sustainability agenda, has established carbon reduction targets, waste recycling, and
water and energy conservation techniques amongst other policies (CCT, 2008;
Pederson, 2006; Thompson, 2008). Figure 2.4 depicts the corporate sustainability
agenda as reviewed in this study. Corporate sustainability policies in the construction
context are aimed at establishing codes of conduct, auditing and monitoring strategies,
and social principles with eco labels that will add value to sustainable growth (Moir,
2001; Welford, 2003; Aaronson, 2009).
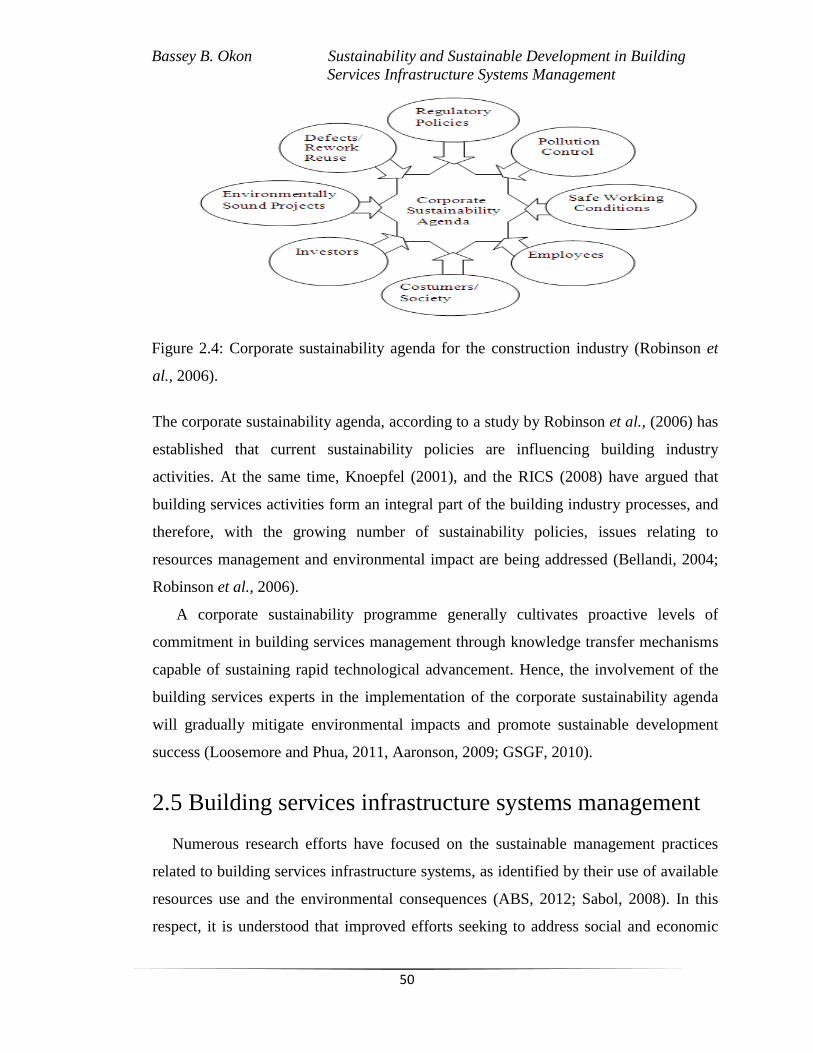
Bassey B. Okon Sustainability and Sustainable Development in Building
Services Infrastructure Systems Management
50
Figure 2.4: Corporate sustainability agenda for the construction industry (Robinson et
al., 2006).
The corporate sustainability agenda, according to a study by Robinson et al., (2006) has
established that current sustainability policies are influencing building industry
activities. At the same time, Knoepfel (2001), and the RICS (2008) have argued that
building services activities form an integral part of the building industry processes, and
therefore, with the growing number of sustainability policies, issues relating to
resources management and environmental impact are being addressed (Bellandi, 2004;
Robinson et al., 2006).
A corporate sustainability programme generally cultivates proactive levels of
commitment in building services management through knowledge transfer mechanisms
capable of sustaining rapid technological advancement. Hence, the involvement of the
building services experts in the implementation of the corporate sustainability agenda
will gradually mitigate environmental impacts and promote sustainable development
success (Loosemore and Phua, 2011, Aaronson, 2009; GSGF, 2010).
2.5 Building services infrastructure systems management
Numerous research efforts have focused on the sustainable management practices
related to building services infrastructure systems, as identified by their use of available
resources use and the environmental consequences (ABS, 2012; Sabol, 2008). In this
respect, it is understood that improved efforts seeking to address social and economic

Bassey B. Okon Sustainability and Sustainable Development in Building
Services Infrastructure Systems Management
51
needs while minimising the potential negative environmental impacts, could promote
and further sustainable development (WCED, 1987; Hill and Bowen, 1997). However,
the concept of sustainability incorporation within building services management is open
to a wide range of interpretations based on its vast applications. Hence, it is appropriate
to summarise this concept within the context of the environmental movement. This
necessitates practical frameworks for the attainment of sustainability (Ding, 2008;
UNFCCC, 2009; Hill and Bowen, 1997).
Accordingly, Grigg (1988) describes building services infrastructure management
activities as those activities pervading the construction sector, building industry, and
facilities operations (Armstrong, 1987; ASHRAE, 1999). Building services
infrastructure management also involves the processes and practices of creating,
planning, and maintaining building infrastructure systems for optimum services delivery
(Elmualim et al., 2012; Cooke and Williams, 2004). Therefore, a sustainable building
services infrastructure system must integrate sustainability models from the cradle of
building design through to the completion stages in order to ensure efficient
performance as best practice (CIOB, 2011; LCI, 2007). Basically:
Building services infrastructure systems account for the water supply,
wastewater treatment, and energy use. They also include among the services: sewage
management, transport (elevators), digital (IT) services, and ancillary maintenance
practices within (buildings) facilities. Increasingly, the greatest building services
challenges are the managerial expertise associated with the multidisciplinary
applications of these systems after the design, construction, and operation activities in
buildings for sustainability goals (Grigg, 1988; ASTM, 2002; Grigg, 1999; Horner et
al., 1997; OECD, 2003: Broers, 2005).
The potential contribution of building services infrastructure management and the
constraints to the achievement of sustainability in the building construction sector are
generally are well documented (BREEAM, 2008; Kehily and Hore, 2012; ASHRAE,
2004). In a study of sustainable management practices in building services infrastructure
systems, the OCED (2003), and Sabol (2008), observed that building services experts
are responsible for the integration, implementation and management of sustainability as

Bassey B. Okon Sustainability and Sustainable Development in Building
Services Infrastructure Systems Management
52
a core building services management policy (Smith, 2009; WB, 2004). This
development during the building construction processes will certainly offer the best
opportunity to add value to building services infrastructure management through the
resourceful use of sustainability practices. However, this cannot be achieved without a
proper paradigm shift in building services management processes, which sometimes
requires thoughtful integration of sound engineering judgment and economics analysis
(CIOB, 2010, Grigg, 1999; Armstrong, 1987).
2.6 Contemporary challenges in building services practice
The environmental impact often arising from the style of building services
management, and especially during the construction stage, is significant, thereby
necessitating proper evaluation (Clift, 2003; Landman, 1999). Such environmental
impacts increasingly cause problems ranging from resource depletion, pollution, and
other environmental hazards, all of which do not support sustainability goals (NIBS,
2006; CIOB, 2011). Apart from the highlighted indicators driving the environmental
impact in building services infrastructure activities, the use of fossil fuels by heavy duty
equipment during the implementation stages also counts (DEIS, 2010; Killip, 2005).
Building services infrastructure activities frequently result in large amounts of fossil
fuels consumption at different phases of building implementation (Clift, 2003). This
obviously causes some environmental impact and increasingly places more pressure on
resource use, in turn being responsible for climate change challenges (UN, 2003;
UNFCCC, 2009). In practical terms, when cooking gas, coal, and oil, are put to use in
building services operations, these products release gases, including carbon dioxide,
which trap heat in the atmosphere, thereby causing climate change. This situation
creates great management challenges to building services professionals in respect of
their desire to achieve success in their sustainability initiatives (BREEAM, 2008;
Bellandi, 2004).
Lazarus (2005) has revealed the most significant environmental impact to come from
building services infrastructure networks. Buildings (facilities) such as schools,
shopping malls, hospitals, factories, airports, railway stations, homes, and the building
services activities associated with these all constitute sources of environmental impact

Bassey B. Okon Sustainability and Sustainable Development in Building
Services Infrastructure Systems Management
53
(Grigg, 1998; Halfawy, 2008). Indeed, it is noted that the building and construction
sectors have produced about 19% of the UK‟s embodied environmental impact within
the built environment (OECD, 2003; Killip, 2005). In this context, the RICS (2000) has
maintained that the entire notion of sustainability should address the whole building
services infrastructure life cycle processes. These processes involve all the stages in the
building process, these being: pre-design and design, procurement, construction, use and
maintenance, and the final commissioning and decommissioning stages (Lazarus, 2005;
RICS, 2000, RICS, 2008).
The concept of sustainability integration within building services delivery has placed
more challenges before both the public and private sectors due to the poor attitude of
building users and the overall administrative practices (Armstrong, 1987; Horner et al.,
1997; Cooke and Williams, 2004). In this respect, it is crucial to create a partnership to
ensure innovative, cost-effective solutions with integrated models in the building
services infrastructure management systems, since only by following such a practice
will sustainability goals be achieved. This collaborative development will address the
overall building services infrastructure performance life cycle for the present and future
generations (BREEAM, 2008; Cheshire and Maunsell, 2007; Nebel, 2006).
2.7 Sustainable building services in the interests of
economic growth
Sustainability and the ways to achieve this, have been a major focus in the building
construction industry and in infrastructure management within the built environment.
As a result, numerous research efforts have been inclined towards sustainability,
concentrating on the rate of resources consumption in the environment. Efforts which
seek to address the social needs, while minimising potentially negative environmental
impact contribute towards the aim of delivery sustainable building services (Hill et al.,
1994). Landman (1999) argued that the contributions of sustainable buildings towards
achieving sustainability goals cannot be over-emphasised. Indeed, sustainable buildings
and the entire services systems have been the main anchor supporting the socio-
economic transformation, thus promoting economic growth (BREEAM, 2008; GSGF,
2010).

Bassey B. Okon Sustainability and Sustainable Development in Building
Services Infrastructure Systems Management
54
Progressively, the economic advancements which cut across building services
systems, and the construction sector with the three themes of sustainable development
are inextricably linked together in terms of services delivery. But these building services
systems cannot function without basic energy and utilities during the construction,
operation, and maintenance stages of a building (Sattertherwaite, 2001). It is also these
services systems that constitute part of the living environment which affects the living
conditions, social well-being, and health conditions generally (WB, 2004). Therefore, it
is important to explore the social, environmental, economic, and sound design
development techniques to ensure building services infrastructure systems are
sustainable, affordable and healthy for habitation (Hill and Bowen, 1997). A typical
model expressing the contributions regarding sustainable infrastructure services that
contribute towards economic advancement is shown in Figure 2.5.
Figure 2.5: The contribution of sustainable infrastructure to economic growth
(Prudhomme, 2004; WB, 2004).
Prudhomme‟s (2004) study clearly explains the significance of sustainable
infrastructure services to the economic development of the nation in general. In Figure
2.5, the most interesting aspect is the benefit of infrastructure services to the
development of households (buildings). The causality between infrastructure services,
households, and other social services like the millennium development goals (MDG),
operates through multiple channels. In this case, the delivery of building services, such
Bassey B. Okon Sustainability and Sustainable Development in Building
Services Infrastructure Systems Management
55
as energy, water, wastewater, sanitation, telecommunication, and transportation
(elevators), directly benefits households (buildings) and facilities. Sustainable buildings
and the services delivery associated with them also play a major role in achieving the
sustainable development goals, (Bohne, 2006; ESCAP, 2006a).
In order to attain the set goals of sustainability in building services management, all
the various stakeholders within the building industry are expected to simulate
environmental sustainability in their activities (Prudhomme, 2004; WB, 2004).
2.8 Policy frameworks and drivers for sustainable building
services development
In this study, the various policy frameworks and drivers associated with sustainable
building services infrastructure management are reviewed. Sustainability policy
frameworks in building services management encourage the use of best practices by
building managers (Smith, 2009; Eco Homes, 2003). These frameworks enable the
building industry to communicate its commitment to the sustainability programme and
simultaneously offer a road map for the implementation of sustainability gains.
However, the adoption of such frameworks requires that they are accepted by senior
management as workable models, and are supported both internally and externally
(Elmualim, 2010; Lorenz, 2008). It should also be noted that sustainability policy
frameworks necessitate an understanding of their overall dimensions. This means being
aware of the visions, aspirations, goals, and the areas of emphasis in building
organisations, but in actuality, commitment is often lacking and expectations are low
(Elmualim, 2010; ESCAP, 2006a).
According to Sioshansi (2011), the sustainability policies in building services are
data issues regarding water and energy consumption, waste disposal, and recycling
together with employee well-being. It is argued that proper knowledge regarding the
contents of sustainability policies is of greater importance as a determinant of
sustainable development activities (Pitt, 2005). The main motivation for using a
sustainability policy framework in promoting sustainable building expansion is to
maintain best practice as shown in Figure 2.6.

Bassey B. Okon Sustainability and Sustainable Development in Building
Services Infrastructure Systems Management
56
Figure 2.6: Optional policy tools in promoting sustainable buildings (ESCAP, 2006a).
In this thesis, the optional policy tool process is tailored towards improving the eco-
efficiency of building growth by creating more value with fewer resources and less
impact as revealed in Figure 2.6. The environmental impacts created from buildings and
other infrastructure systems within the built environment demand policy frameworks
and a debate on the proper issues and drivers capable of guiding the industry towards
sustainability evaluation and enhancement in this context.
The CIB (2004) has pointed out that the building industry has a significant impact on
the sustainability plan in that the natural resources used, and waste and greenhouse
gases are responsible for about 40% of all emissions (Killip, 2005). Additionally, the
existing buildings consume approximately 45% of the generated energy to produce heat
and power. Increasingly, the building services infrastructure utilities and maintenance
costs, along with the legislative and regulatory conditions on energy use and carbon
reduction, necessitate the formulation of sustainability policies. In recent times, many
building organisations have become committed to the sustainability agenda, thereby
developing sustainability policies as an integral part of their corporate social
requirement (Wood, 2006; Robinson et al., 2006; Walker et al., 2007; Loosemore and
Phua, 2011).
Sustainability policies and drivers directly influence building services and facilities
managers‟ activities in the UK. However, current research on sustainability policies and
drivers influencing the activities of building services and facilities managers are limited
(Elmualim et al., 2010). Identifying the key issues and drivers will help to estimate how

Bassey B. Okon Sustainability and Sustainable Development in Building
Services Infrastructure Systems Management
57
building managers are engaging with the sustainability agenda. Building managers
require appropriate knowledge and familiarity with the key sustainability issues and
drivers and they need to know how to implement the theory and practice of
sustainability in the context of their building services activities (Elmualim et al., 2010).
In this respect, the key sustainability issues to be addressed are the carbon footprint, and
waste management. In addition, the biodiversity and the triple themes responsibility and
community engagement must be approached as sustainability issues. Progress in this
respect will promote the ethics of sustainability programmes and help in the
construction of more sustainable buildings (Shah, 2007; Wood, 2006).
In a recent study, Elmualim et al. (2012) have identified legislative pressure as the
major driver of sustainability in building services and facilities management. This study
further reveals that energy efficiencies and consumption in buildings are regulated
through legal obligations. As such, legal obligations often play an influential role in
policy-making and implementation. In other words, to accomplish the established goals
of sustainability in building services and facilities management, government and
international bodies employ a wide range of legislation to influence how energy is used
and to promote efficiency in this case. Hence, building services activities, and the waste
management (recycling) and subsequent reduction of carbon emissions, are all
controlled through legislative actions (Pitt, 2005; Shah, 2007).
2.8.1 Project life cycle framework - building services management
A project life cycle framework illustrated in Figure 2.7 was developed and
subsequently applied to appraise the performance of sustainable building services. The
framework contains four major building activity verification phases considered
necessary to ensure the growth of a sustainable building services infrastructure.
Moreover, a step-by-step algorithmic approach concerning building management is
stated. Within the project life cycle framework, the following abbreviations are used for
clarity regarding building construction activities: acceptability standard is denoted by
STDS, and specification by SPECS. The materials handling requirement is marked by
REQ. These terms are used to qualify the attainment in the „cradle to grave‟ principles
and condition in each stage of the building project activities as presented in Figure 2.7.
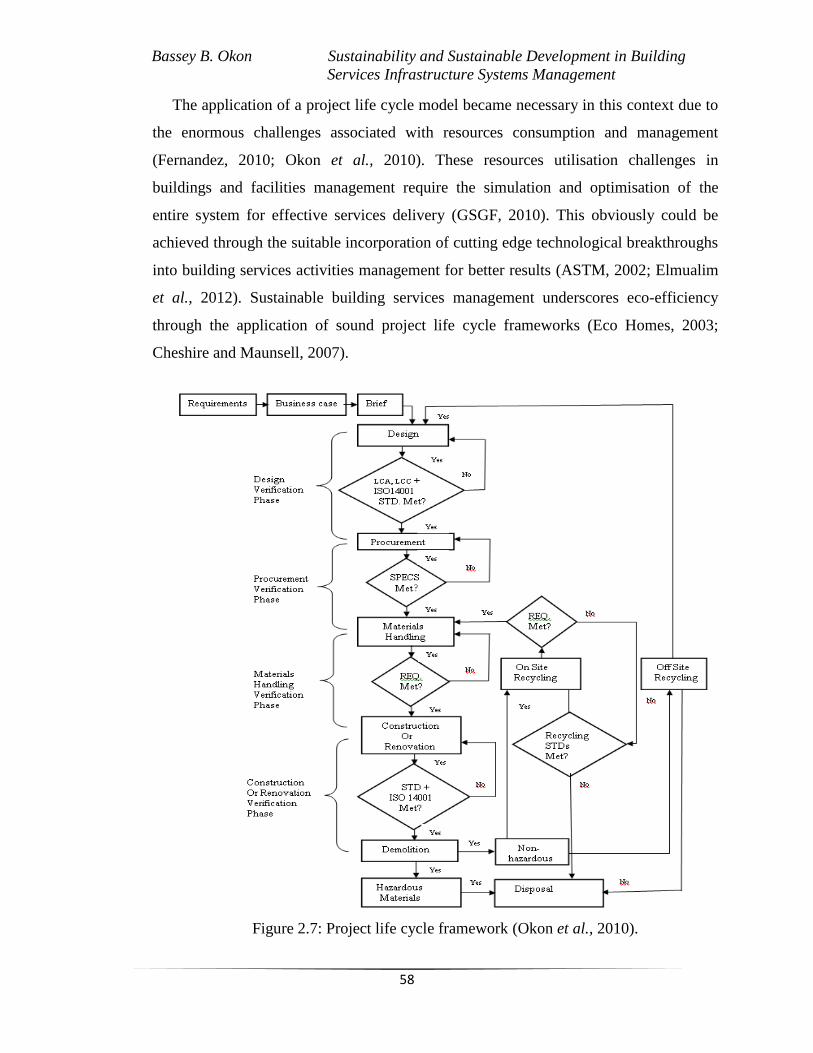
Bassey B. Okon Sustainability and Sustainable Development in Building
Services Infrastructure Systems Management
58
The application of a project life cycle model became necessary in this context due to
the enormous challenges associated with resources consumption and management
(Fernandez, 2010; Okon et al., 2010). These resources utilisation challenges in
buildings and facilities management require the simulation and optimisation of the
entire system for effective services delivery (GSGF, 2010). This obviously could be
achieved through the suitable incorporation of cutting edge technological breakthroughs
into building services activities management for better results (ASTM, 2002; Elmualim
et al., 2012). Sustainable building services management underscores eco-efficiency
through the application of sound project life cycle frameworks (Eco Homes, 2003;
Cheshire and Maunsell, 2007).
Figure 2.7: Project life cycle framework (Okon et al., 2010).

Bassey B. Okon Sustainability and Sustainable Development in Building
Services Infrastructure Systems Management
59
In Figure 2.7, the economic benefits from the building project life cycle framework
can be seen as the integrated environmental management systems (IEMS), ISO 14001,
and the life cycle assessment (LCA). Also, the life cycle costs (LCC) evaluation could
equally be verified from this model. It should be noted that this framework is able to
address the „cradle to grave‟ situation regarding sustainable buildings (facilities)
management. This involves cutting across the environmental impact, costs analysis,
recycling, and other related issues in building projects management for sustainability
success (Okon et al., 2010).
„Cradle to site‟ and „cradle to grave‟ assessments in buildings (facilities)
management are also made in a study by Darby et al. (2011). These authors have
highlighted some factors giving rise to greenhouse gas (GHG) emissions in buildings.
The factors include operational emissions, produced by buildings (facilities) during use,
and embodied emissions, produced during manufacture of materials and components. In
addition, the construction and demolition phases of buildings activities are indicated.
Darby et al. (2011) further argued that at the moment, there is lack of a consistent and
acceptable framework for the calculation of embodied emissions, the relationship and
interaction between the embodied and operational elements in buildings. However,
attempts have been made by the BSI (2006), to develop project life cycle analysis
frameworks for building management. This protocol among other things is capable of
handling statistics regarding the emission factors and other building management
processes (BSI, 2008).
Okon et al. (2010) maintain that there are significant paybacks in terms of prudent
resources use in sustainable buildings when suitable project life cycle frameworks are
integrated, since these allow for the „cradle to grave‟ activities to be evaluated, thereby
adding value to the overall buildings (facilities) services activities management
processes in terms of the likely success in securing sustainability (Lorenz, 2008).
2.8.2 Principles of sustainable building construction framework
A study from Hill and Bowen (1997) has also established a significant framework for
the building industry and infrastructure systems management practice. This framework
addresses the best practice and principles for the building industry, thus integrating the

Bassey B. Okon Sustainability and Sustainable Development in Building
Services Infrastructure Systems Management
60
concept of sustainability. In this framework also, a process-oriented principle regarding
sustainable building is contained and divided into four broad pillars. These include
economic, social, bio-physical and technical phases as illustrated in Figure 2.8. On this
basis, sustainable building construction practices account for the following stages of
activities:
Application of environmental impact assessment (EIA) during the planning and
design stages of building projects - provided the traditional EIA is expanded to
cover the assessment of all the four „pillars‟ of sustainable building construction
and is undertaken in accordance with the process-oriented principles.
Implementation of integrated environmental management systems (IEMS) as
described in the specification provides international standards for the building
industry. The international organisation for standardisation (ISO) is one of such
frameworks as applied in the building industry. The ISO overviews building
activities from the construction, and use perspectives. All these activities are
included within the four „pillars‟ of sustainable building framework as shown in
Figure 2.8.
Hill and Bowen (1997) argued that IEMSs can only be implemented as a framework
for attaining sustainable buildings if they are adopted by the construction industry.
However, the package as contained in the IEMSs provides for the construction activities
associated with new building projects, and existing ones as presented in Figure 2.8.
ISO, 1997 noted that usually all building construction activities are performed by the
client. However, the responsibility for a building upon completion and commissioning
is usually transferred to the facility management services. Therefore, another IEMS
could be developed to handle the operation (use) of the building/facility, and the final
decommissioning (EoL) stages. The application of IEMSs into building processes from
the construction, operation and EoL phases, constitutes an essential part of this
framework. It should be noted that the definition of a sustainable building includes
facility operation, maintenance, and the EoL (decomissioning) activities (BSI, 2008,
CIOB, 2003; Doke, 2007).

Bassey B. Okon Sustainability and Sustainable Development in Building
Services Infrastructure Systems Management
61
Figure 2.8: Principles of sustainable construction (Hill and Bowen, 1997).
Interestingly also, a study from Lorenz (2008) indicates that adopting the principles
highlighted in Figure 2.8 will sustain innovative and cost-effective solutions in this
context. These standards will facilitate a stable future in the fields of security, fire
protection, water, and wastewater. In addition, power (energy) distribution and comfort
in the buildings services delivery will be achieved, both promoting sustainability
(CIRIA, 2005; ISO, 2002). It could be argued that the theory behind sustainable
Bassey B. Okon Sustainability and Sustainable Development in Building
Services Infrastructure Systems Management
62
construction frameworks has provided the basic conditions for the mainstream
sustainable development. This is found in the building construction industry particularly
within European countries. At the same time, the major social and economic values of
these frameworks can significantly hasten the implementation of the sustainability
principles in the construction sectors and beyond. Generally, the outlined principles
regarding sustainable building will encourage socially responsible policy-makers with a
view to achieving the best practice for the present and future generations (OCED, 2003;
WCED, 1987; CIRIA, 2005).
2.8.3 Framework for sustainable building and management
As a means of appraising the framework for sustainable building and management,
Hill et al. (1994) developed a model which examines building projects, environmental
ethics, organisational structure, and environmental management programmes. The scope
of their model extends to cover the internal review, external audits, and the
environmental legislation associated with building construction, as presented in Figure
2.9. Later, a study conducted by Hill and Bowen (1997) corroborated the findings of the
earlier study by Hill et al. (1994), both studies seeking to achieve a standard and quality
of performance in the delivery of sustainable buildings. Within the model devised by
Hill et al. (1994), some environmental issues and management principles are
emphasised, these being the ISO 14001 environmental management systems (EMS),
and the easy access (EA). These principles are aimed at evaluating the entire phases of
operation within sustainable buildings as shown in Figure 2.9.
CIRIA (2005) notes the ISO 14001 EMS framework offers immeasurable assistance
regarding building construction practices and various environmental assessment tasks.
Undoubtedly, however, it requires collaboration by the building industry to ensure a
sustainable future (ISO, 2002), and in fact, the ISO 14001 EMS framework is a
voluntary rather than a compulsory standard. Nonetheless, its application enables the
building industry to have control over the impact of its activities in the environmental
area of operation (Bellandi, 2004). Contemporary researchers have found that
sustainable buildings cannot be achieved unless the building industry incorporates an
EMS outline alongside the ISO 14001 framework in Figure 2.9.

Bassey B. Okon Sustainability and Sustainable Development in Building
Services Infrastructure Systems Management
63
Figure 2.9: A Framework for sustainable construction (Hill et al., 1994).
One sophisticated techniques adopted by the building construction sector is the
integration of the environment within building plans. This process empowers the
building industry in managing the entire building construction processes for
sustainability (Koskela, 2009; Lundan, 2004; Petrovic-Lazarevic, 2006).
In a related development, Price and Newsome (2003) stressed that the application of
the ISO 14001 standard stems from achieving sustainable buildings in the construction

Bassey B. Okon Sustainability and Sustainable Development in Building
Services Infrastructure Systems Management
64
industry. In recent times „sustainable building‟ has become a catch-phrase within the
construction sectors and the built environment at large. However, the greatest challenge
in this respect is not to ensure the industry is familiar with and understands the phrase,
but to develop a practicable implementation framework (Lundan, 2004). In this respect,
the ISO 14001 model in Figure 2.9 is being adopted by many building companies that
are currently using the principle together with EMSs for their environmental auditing
and labelling.
Information from Figure 2.9 also demonstrates that the framework is capable of
addressing the building life cycle and evaluating environmental performance. The ISO
(2002) has argued that the environmental auditing undertaken through an EMS for
building construction projects could be conducted internally by the environmental
managers or externally by consultants. Typically, an external auditing activity would be
preferred for large building construction projects of extended duration with the potential
to cause significant environmental impact (RICS, 2008). In fact, such environmental
impact activities could be mitigated through a suitable ISO 14001 EMS framework,
which enables the construction companies to track their day-to-day operations. Not only
will the model deliver effective and efficient building performance but, it will also
promote prudent management by its integration of the ISO 14001 standard (Lundan,
2004; ELC, 2006).
Figure 2.9 also demonstrates a good quality framework for sustainable buildings.
Another significant benefit from the employment of the ISO 14001 EMS agenda is the
„green and lean‟ (GL) initiative (NIBS, 2006). This scheme enhances building
construction support as it provides for the protection of non-renewable natural resources
(Koskela, 2009). However, the ISO 14001 EMS framework in this study aims at
fostering the development of a reverse distribution system driven by the building
construction economics. This challenge has always presented problems for the building
sector but the most often cited reason for not rising to the challenge is the relatively
little demand for recycled and reclaimed materials. Particularly, this is experienced
within the building industry with low-cost and low-profit margins. So, with the
integration of the ISO 14001 EMS framework into this context, proper annual

Bassey B. Okon Sustainability and Sustainable Development in Building
Services Infrastructure Systems Management
65
environmental audits and reviews could be achieved for sustainable growth (NIBS,
2006; Klotz et al., 2007).
2.9 Life cycle assessment framework for building services
infrastructure management
Life cycle assessment (LCA) is the global procedure applied to determine the
environmental impact of building infrastructure systems. In recent times, research
efforts to achieve sustainability in building services delivery have resulted in integrating
the LCA framework within infrastructure systems management (ELC, 2006). LCA
applications in this perspective have become a desirable and implementable tool in the
current management of building infrastructure resources (MTP, 2009). Building
services activities and building construction infrastructure projects alike, employ
suitable LCA frameworks as indicators meant to provide effective evaluation of the
energy utility resources (ISO, 2002; Cuellar, and Adisa, 2011). Energy, water, and
wastewater resources utilisation are among other building services infrastructure
components appraised for optimum and sustainable benefits through the incorporation
of the LCA management.
Interestingly, the LCA frameworks due to their versatility provide useful and
efficient management information regarding building services infrastructure
performance with the ultimate aim of striking a balance among the three themes of
sustainable development. In addition, a cradle to grave assessment regarding building
services infrastructure services is made using the LCA technique (ISO, 1997; Blengini,
2009 Cuellar, and Adisa, 2011).
The integration of the LCA framework within this study has become imperative due
to the pressure associated with the growing population and the increasing consumption
of natural resources in the building sector. The pressures from the growing population
and the existing modern lifestyle have placed a great burden on building infrastructure
utilities, resulting in greenhouse gas (GHG) emissions, and climatic change (Eco
Homes, 2003; ASHRAE, 2004).
Bassey B. Okon Sustainability and Sustainable Development in Building
Services Infrastructure Systems Management
66
2.9.1 The life cycle assessment framework
A study by Nebel (2006) has revealed the use of the LCA framework as being a
standard practice in the building industry, as it provides a sound analytical framework
for the systematic evaluation of environmental impact. Additionally, it allows for the
examination of the raw materials processes, and the building services system throughout
all the various stages in their respective life cycles, with a view to establishing best
practice (Dutil et al., 2011). Hence, it can be seen that the scope of the LCA framework
extends from the extraction and processing of raw materials, right through to
manufacture, delivery, use, and finally, to waste management. This continuum of
processes, as indicated in the LCA framework, is often referred to as the „cradle to
grave‟ situation, and the LCA framework allows for its complete assessment (Nebel,
2006; ISO, 1997; Blengini, 2009; Cuellar and Adisa, 2011).
According to the ETBP (Environment Technology Best Practice, 2000), the building
industry should be alert to the general direction of environmental regulations. Consumer
pressure on building materials should be known and appreciated, and consequently, the
LCA framework is valuable in providing useful data for identifying potential problems
before they actually arise. Such an approach will promote the reduction in resources
consumption, thereby saving costs (ETBP, 2000; ISO, 2002; Oritz et al., 2009; GSGF,
2010). LCA appraisal in this situation considers building services infrastructure
products from their „cradle‟ stage, hence, paying attention to the natural resources from
where the virgin (raw) building materials are extracted or acquired.
The process continues through to the entire construction and operation (use) to its
„grave‟ (disposal), and end-of-life (EoL) phases (Dutil et al., 2011; GSGF, 2010).
Figure 2.10 explains the life cycle assessment model with the causalities indicating the
physical processes involved in the building materials life cycle stages. The flow
processes within the system boundaries from the raw (virgin) materials acquisition
through the EoL phases of building infrastructure activities. The LCA model as applied
in this study is shown in Figure 2.10.

Bassey B. Okon Sustainability and Sustainable Development in Building
Services Infrastructure Systems Management
67
Figure 2.10: Life cycle assessment model (Richard, 1996; ISO, 2002).
There is also an indication of gases emission released into the air, water and ground
(environment) generally. Environmental impact arising from the construction, operation
(use), and maintenance phases of buildings within this context are the most important
elements of sustainability in Figure 2.10. These environmental impact elements
necessitate the LCA study. Therefore, the LCA evaluation in this case aims to address
the environmental impact profile regarding building services infrastructure towards
sustainability success (ISO, 2002; Oritz et al., 2009).
2.9.2 The life cycle assessment techniques
This study adopted the generic LCA process (ISO, 1997) as shown in Figure 2.11.
The LCA methodology comprises five successive stages of operation, these being: the
goal and scope definition, inventory analysis, impact assessment, results interpretation,
and application. These stages are briefly explained as follows:
Goal and scope stage: This explains the intended application of the related
environmental impact group within building services infrastructure systems, the
rationale and the way of communicating the outcomes.

Bassey B. Okon Sustainability and Sustainable Development in Building
Services Infrastructure Systems Management
68
Figure 2.11: Life cycle assessment framework (ISO, 1997).
Inventory analysis phase: This is aimed at creating a systems model according to
the requirements of the goal and scope description. This stage also involves
gathering quantifiable statistics relating to the material flows and energy inputs.
Additionally, this analysis cuts across the whole life cycle of building materials
and their associated emissions, discharges and wastes. It relates to all stages of
the building life cycle from the „cradle to grave‟.
Impact assessment: This stage of analysis focuses on the impact of the
environmental loads quantified in the inventory study. The inventory result at
this point is processed into more environmentally relevant information. Again,
more focus on the environmental problem rather than emission or resources used
within the building is evaluated. In this scenario, cognisance is taken of human
health, resources, and the ecology factors (Richard, 1996).
Interpretation Phase: This produces the results and is dependent on the goal of the
study. It consists of three elements: identification of significant issues,
evaluation, and conclusion of test (Paulson, 2001; ISO, 1997; Home et al.,
2009).

Bassey B. Okon Sustainability and Sustainable Development in Building
Services Infrastructure Systems Management
69
Table 2.1 displays the impact phases of the LCA and definition as applied in this
study.
Table 2.1: Impact phases of LCA and definition (Guinea et al., 2001).
Impact Phases Definition
Selection of impact categories
Abiotic depletion, acidification, eutrophication,
fresh water aquatic ecotoxicity, global warming,
human toxicity, marine aquatic ecotoxicity, ozone
depletion, photochemical oxidation and terrestrial
ecotoxicity potentials.
Classification Essentially addresses the grouping of the data in an
inventory table into a number of impact categories.
Characterisation
Involves the quantification, aggregation and
analysis of impact data within the investigated
impact groups in the building.
Valuation phase
Accounts for the indicators result and can be further
elaborated in the analysis.
Normalisation: calculates the magnitude for each
indicator result relative to reference level.
Grouping: sorts or ranks the impact categories
Weighting: aggregates the indicator results based
on some value choice and numerical hierarchy (Cabal et al., 2005).
Guinea et al. (2001) maintained that as a common practice in the LCA method, the
impact assessment phase is often divided into four distinct stages as shown in Table 2.1.
The choices of impact categories as applicable for the visualisation of the environment
are chosen according to the scope and definition of the study.
Korkmaz et al. (2008) have researched decision-making frameworks for minimising
the life cycle impact of building infrastructure systems using the LCA technique,
primarily focusing upon building infrastructure examination and its benefits in realising
sustainability. Environmental impact examinations of sustainable buildings have been
studied using the LCA approach by the Environmental Literacy Council (ELC, 2006).
The appraisal in this study was conducted with the consideration of all the building
materials inputs and outputs throughout the life cycle of the building as a „cradle to
grave process‟. Additionally, the extraction of the raw materials, their production and
use, are considered. A further dimension comprises the occupancy, maintenance, finally
demolition and disposal of waste. The LCA approach in this situation accounts for the
environmental, economic and social impact of materials during their life cycle.

Bassey B. Okon Sustainability and Sustainable Development in Building
Services Infrastructure Systems Management
70
However, this framework focuses on the environmental impacts with specific targets on
emissions and waste management (ELC, 2006; Regal, 2005; Nebel, 2006).
An earlier study by the NSF (2005) overviewed the application of the LCA in
assessing the building services infrastructure for sustainability, and in this circumstance,
the concept of the LCA application was found adequate for evaluating the
environmental impact and performance of different system components within
buildings. Also, Bayer et al. (2010) have applied the LCA framework to examine both
commercial and residential buildings. Their study has established the LCA is an
emerging model that promises to aid in architectural decision-making. Moreover,
industrial ecologists, engineers and chemists seeking to understand and to reduce
environmental impact within the built environment have all developed the LCA
framework for such purposes (Guinea et al., 2001).
Recently, the LCA technique has been promoted as a paradigm for analysing the
environmental impact of buildings and making decisions to reduce these impacts. The
benefits of LCA advancement can offer a wide-ranging environmental footprint in
building services infrastructure. These gains from the LCA application include utilities
such as energy, water, and wastewater analysis. Other benefits of the LCA are the
assessment of global warming potential, resource depletion, and toxic emissions in
buildings (Patrick et al., 2002; ISO, 1997; Varun, et al., 2008).
2.10 Review of the life cycle cost (LCC) framework for
building services management
The history of the life cycle cost (LCC) framework began in the United States
Department of Defense (USDD) in the mid-1960s and 1980s (DIN EN, 2004). Later,
attempts were made to adapt this model into building services infrastructure investments
and construction projects. The LCC framework can be applied in many situations, and its
economic benefits in building services assessment cannot be over-emphasised.
LCC is a technique applied to establish the “total cost of ownership”, that
is, the sum of all the costs associated with an asset or part thereof, including acquisition
and installation. It also accounts for the operation (use), maintenance, refurbishment

Bassey B. Okon Sustainability and Sustainable Development in Building
Services Infrastructure Systems Management
71
and disposal costs related to the building services infrastructure and construction
projects generally (Epstein, 1996; Langdon, 2007).
Clift (2003) maintained that to a large extent, LCC is an estimation of the monetary
costs of funding, design, and construction of building services infrastructure for
sustainability success. However, it also involves the costs of operation, maintenance and
repair, component replacement, and sometimes, the demolition of (facilities) buildings
(Clift, 2003). The LCC application can deliver a new design, existing buildings, or can
assess the residual life and value of a building. As such, with different maintenance,
repair and replacement operations taking place at various times, incremental costs are
converted to present-day value using a discounted cash flow approach (Flanagan et al.,
1989; ASTM, 2002).
2.10.1 The life cycle cost technique
The life cycle cost model could be applied at any stage of the building services
infrastructure project management. Indeed, at the inception stage of building services
infrastructure, the use of the LCC model can provide choices among alternatives in the
design of sustainable homes (DIN, 2004; Flanagan et al., 1989). Sustainability is now a
critical consideration affecting the design, construction, operation and disposal of
constructed building services infrastructure assets, and therefore, the LCC method is a
key element in supporting improvements in the sustainability of buildings by providing
a common means for all costs related to building assets (Klotz et al., 2007). In LCC
analysis, the selection of investment costs at the inception stage of the building services
infrastructure project is a necessity and should be based on the client requirements and
the services delivery. The costs are estimated in broad terms depending on the „costs
incurred‟ in similar historical building services infrastructure projects. Given differences
in the design of the particular building services infrastructure involved, more detail is
accumulated, and then the LCCs are estimated in view of the added or different features
(Bakis, et al., 2003). Figure 2.12 presents the algorithmic LCC process used in this
study for the estimation of building services performance.

Bassey B. Okon Sustainability and Sustainable Development in Building
Services Infrastructure Systems Management
72
Figure 2.12: Algorithmic process of LCC framework (Home et al., 2009).
Much later in the design phase, when the individual building components and
fixtures are established, the LCC analysis is performed according to service delivery
and costs data. In practical terms, LCC tests are performed when all the facts about the
price and life expectancy of the building infrastructure components and fixtures and
their associated costs are collated. But the process should also involve the maintenance
and operation frequencies of the building services infrastructure generally. That is, the
LCC of all the components together with the building services infrastructure costs such
as energy, water, wastewater consumption and building data (Kirk and Dell‟Isola, 1995;
Bakis et al., 2003, Flanagan et al., 1989; Langdon, 2007).
In their LCC study, Flanagan et al. (1989) maintained that when appraising building
services infrastructure, the estimated costs at each year of the building‟s life must be
discounted. This to create proper allowance for time value of investment costs.
Additionally, such provision will enable the comparison of the alternatives on a
common basis using the LCC technique. This suggests the time value of money which
is the amount of money spent to fix the building services infrastructure which is most

Bassey B. Okon Sustainability and Sustainable Development in Building
Services Infrastructure Systems Management
73
likely to increase yearly by the relevant net inflation interest rate (DIN, 2004; Parnell,
2008).
2.10.2 Evaluating building services performance - life cycle cost
Economic life cycle costing related to building services infrastructure is a necessary
component of the effort to achieve sustainable buildings, and in recent times, LCC
analysis has become increasingly essential in the determination of building services
infrastructure performance. Indeed, the introduction of LCC tests into building services
infrastructure projects has offered best value for money in attempts to manage assets in
the long term (Ellis, 2007). On this particular issue, Ashworth (1999) has argued that
when investigating LCCs, analysts should set less money aside for current building
services infrastructure projects, in order to meet higher expenditures in the future. In
actual fact, the calculation of the LCC of building services infrastructure merely
involves adding up the constituent costs. However, this is a simplistic evaluation since
the timing of particular costs needs to be taken into account. This means that the costs
of the building services infrastructure should first be converted into the present values
and then added up to compare the different options on a common basis. The most
familiar comparison measure used in the LCC analysis is the net present value (NPV)
method (Gulch and Baumann, 2004).
Bakis et al. (2003) maintained that depending on the choice of LCC method used,
the time perspective may differ, and this will affect the outcomes from the LCC
computation when discounted to a NPV. Other LCC techniques which could be adopted
in measuring the building services infrastructure performance, are the equivalent annual
cost (EAC), payback period (PP), return on investment (RON), and saving to
investment ratio (SIR). The five main economic evaluation methods for LCC, their
application, advantages and disadvantages for building services infrastructure
management are indicated in Table 2.2. It is evident from the literature that the most
suitable approach for the LCC in this context is the NPV method.
In the course of examining the building services infrastructure performance using the
LCC technique, the risk associated with each option should also be taken into account.
Various risk assessment techniques are employed to evaluate the possible failure of

Bassey B. Okon Sustainability and Sustainable Development in Building
Services Infrastructure Systems Management
74
attempts to achieve sustainability (Gulch and Baumann, 2004; Ellis, 2007; Dusart et al.,
2011). One way of performing such risk analysis is through the use of a sensitivity study
as presented in Table 2.2.
Table 2.2: The LCC evaluation methods (Dusart et al., 2011).
Method Application Advantage Disadvantage
Simple
payback (SP)
Rough estimation if
the investment is
profitable.
Quick and easy to
calculate and interpret
the results
Does not take inflation,
interest or cash flow data
into account.
Discount
payback
(DP)
Should only be used
as a screening tool
not a decision device.
Takes the time value
of money into account.
Ignores all cash flow
outside the payback period.
Net present
value (NPV)
Most LCC models
use the NPV. Not
usable if the options
incorporate different
lifespan.
Takes the time value
of money into account.
Make the return equal
to the market rate of
interest.
Not usable when the
compared options have
diverse lifespan. Not easy
to interpret.
Equivalent
annual cost
(EAC)
Different options
with varied period
can be compared
(ISO, 2004).
Different options with
diverse timescale can
be compared (ISO,
2004).
Just gives an average
number. But, it does not
indicate the actual cost.
Internal rate
of return
(IRR)
Can only be used if
the investments will
generate an income.
Result is given in
percentage which can
be helpful.
Calculations need a trial
and error procedure. IRR
can only be calculated if the
investments will produce an
income.
A sensitivity study could be applied to assess the impact of a change in an input
variable on the LCC of building services infrastructure projects. Monte-Carlo
simulation is capable of testing the sensitivity of building services infrastructure data to
obtain a range of possible values in this case. Another important benefit in the LCC
examination is the costs broken down structure (CBS). The CBS system represents the
method in which the LCCs of building services infrastructure are performed as
presented in Table 2.2. Hence, the aim of LCC analysis is the comparison of options,
since it enables information relating to costs involvement in the building to be shown in
a way that enables proper judgment (Whyte et al., 1999; Bakis et al., 2003).
Bakis et al (2003) study has found the integration of the LCC method within
building services infrastructure evaluation could yield more economic gain over several
years after construction and operation alike. Such dividends cut across the technical
lifetime of building services infrastructure, that is, the estimated number of years until

Bassey B. Okon Sustainability and Sustainable Development in Building
Services Infrastructure Systems Management
75
the installed components, fixtures and applicable technologies are considered obsolete
(Bakis et al., 2003). Similarly, the physical lifetime of building services infrastructure
explains the estimated period in which the building is physically assessed for use. The
LCC can also be applied in measuring the building services infrastructure utilities
lifetime as mentioned earlier. This aspect expresses the economic worth in estimating
the actual time, in which the building services infrastructure can satisfy the established
performance standards. Furthermore, LCC application is diverse in the quest for
sustainability success, as it can also be used when forecasting, in tendering documents,
and in bidding for building projects (TG4, 2003; Smith, 2008).
2.10.3 The barriers in the life cycle cost application
Recently, the building industry has relied heavily on the use of the LCC technique in
its efforts to achieve delivery of sustainable projects. However, despite its economic
importance and versatility in engineering and technology, there are still some limitations
to its application. Contemporary studies have discovered that the LCC approach is
commonly used in the implementation of building services infrastructure projects under
private finance initiative (PFI) schemes at the procurement phase (BPC, 2010).
Additionally, it is seen that most building construction organisations employ the LCC
method for costs appraisal during the design phase for bidding (Landon, 2010).
However, this is not to suggest that the LCC model cannot be successfully applied in
other phases of operation (use)/maintenance, and the end-of-life stages (Sterner, 2000;
Bakis et al., 2003; BPC, 2010). There are, however, a number of reasons for the limited
application of the LCC in building services infrastructure systems management so far.
Some of these are either practical or political, depending upon the precise circumstances
(Sterner, 2000; Bakis et al., 2003).
In the practical dimension of LCC application, Bull (1993) revealed that capital costs
and operating expenditure are usually met by different parties (client and contractors)
before contract execution, and that there is no incentive on behalf of those responsible
for building construction to reduce the subsequent costs-in-use (Bull, 1993). Figure 2.13
shows the two major constraints associated with the LCC application in building
industry.

Bassey B. Okon Sustainability and Sustainable Development in Building
Services Infrastructure Systems Management
76
Figure 2.13: The major barriers in LCC application.
Another practical barrier to the use of the LCC method, is noted by Ferry and
Flanagan (1991) as being the difficulty in forecasting building services infrastructure
projects over a long period of time. Other factors are cited as the future operating and
maintenance costs, and discount payback problem. Bakis et al. (2003) also itemised
several reasons for the reluctance of the public sector to invest in the LCC technique in
building construction. They include: (a) the tendency for the use of a building (facility)
infrastructure to change in the near future, meaning that the LCC application would later
be regarded as a waste of money; (b) the fact that building services infrastructure has a
longer services delivery period than its life span as envisaged by the clients; (c) the
unwillingness of government agencies to invest in the more expensive options when
there are no solid technical data to guarantee any future savings on such building
services infrastructure; and (d) the practice of many decision-makers using the LCC to
opt for minimum initial investment (MIN) either to increase the return on investment or
meet budgetary restrictions. These factors are considered as the practical obstacles in
this situation (Landon, 2010; Kehily and Hore, 2012).
Kehily and Hore (2012) have also disclosed other practical barriers to the adoption of
the LCC technique in building services infrastructure management. They are: (a) the
complexity associated with the LCC application, and (b) the lack of sufficient data for
computation. It is obvious that in such situations, a proper LCC evaluation could not be
performed. One of the major setbacks in this case is the absence of frameworks or
mechanisms for collecting and storing information. The accounting systems used by

Bassey B. Okon Sustainability and Sustainable Development in Building
Services Infrastructure Systems Management
77
building managers and contractors seldom provide an alternative means to accurately
identify the costs of maintenance and repair of specific components within a building.
Moreover, the estimation of the LCC model is a rather complex exercise when applied
manually, especially at the detailed design phase. An analyst has to estimate the LCC of
each option for each building element such as energy, water, or the infrastructure
utilities as a whole, and the LCC of each option might consist of several cost items. For
each cost item, the related performance and cost data have to be retrieved (Clift and
Bourke, 1999; NSA, 1999; Langdon, 2006).
Political barriers to LCC application lie in policy-making, and generally, the decision
to apply the LCC model in building services infrastructure projects delivery is based
purely on the client‟s inclination. Moreover, the lack of any legislative policy
framework promotes a situation whereby there is no compelling obligation upon the
client or the contractors to aim to deliver sustainable building services. Government
legislation may, however, sometime affect both clients and other parties in integrating
the LCC for cost analysis (Clift and Bourke, 1999; NSA, 1999; Bakis et al., 2003;
Langdon, 2007; Kehily and Hore, 2012).
2.11 Engineering sustainability in building services
management
Engineering sustainability is a catalyst for building services infrastructure growth.
The promotion of its principles yields economic benefits and resources which all help in
the effort to achieve sustainable development. However, such sustainability depends
upon the development of business strategies that can be effectively implemented. Two
main factors underpin the demand and rationale for eco-buildings believed to be
achieved through green growth incorporation within building services infrastructure
advancement goals. These factors are: (a) the growing concerns about the environmental
unsustainability of past and current economic growth patterns; and, (b) the risk of
irreversibly altering the environmental base needed to sustain economic prosperity
(ESCAP, 2011). Increased awareness of a potential future climate crisis has made it
clear that the environment and the economy can no longer be considered in isolation.
Bassey B. Okon Sustainability and Sustainable Development in Building
Services Infrastructure Systems Management
78
These concerns point to the need for substantial change of consumption behaviour,
industry structures, and technologies (OECD, 2010; OCED, 2011; ESCAP, 2011).
2.11.1 The green growth model
Within the built environment, the green growth model is now commonplace in
sustainable building services infrastructure systems development (ESCAP, 2006). Green
buildings could be defined as building services infrastructure that promotes the
reduction of harmful effects on the environment and construction activities as a whole
(Eco Homes, 2003). The sustainability model has been the beacon for sustainable
development. Moreover, the interdisciplinary engineering fields and social science are
included in the drive to integrate innovative models into the management of building
services infrastructure systems for sustainability purposes (Yudelson, 2008; Broers,
2005).
It is an established fact that much benefit has resulted from engineering sustainability
approaches within the context of building services infrastructure, but there still remains
a demand for more progress in this respect. Consequently, other proactive measures are
adopted, including: (a) concepts of reduce, reuse and recycle, (b) eco-efficiency, (c) the
public–private partnership drive, (d) educational awareness, and (e) the use of
mathematical modelling tools (OCED, 2003; ESCAP, 2006; Girouard, 2011). In this
study, the concept of green growth could better be described as:
Green growth practice is capable of maintaining the economic expansion
necessary for enhancing the quality of life in this context. This practice will
simultaneously minimise pressure on the available resources consumption, thereby,
improving the eco-efficiency within building industry (WBCSD, 2000; ESCAP, 2006).
The green growth approach to sustainable building services infrastructure
management has been found effective in promoting engineering sustainability.
Consequently, it fosters eco-efficiency of building services infrastructure development,
creating more value with fewer resources and less impact (ESCAP, 2006b). Building
services infrastructure development has traditionally been the responsibility of the

Bassey B. Okon Sustainability and Sustainable Development in Building
Services Infrastructure Systems Management
79
public sector, and in measuring eco-efficiency, it is necessary to enlist government
efforts. Government must determine both economic and environment-related issues in
respect of building services infrastructure expansion since these are the major elements
of eco-efficiency schemes in engineering sustainability. Such determination is essential
during each stage of building services infrastructure development, such as planning,
design, and construction (OECD, 2009a). Typical of the measures adopted, are those
indicated in Figure 2.14.
Figure 2.14: Eco-efficiency and its impact on the economy (WBCSD, 2000).
Figure 2.14 demonstrates the governmental measures of eco-efficiency schemes
considering engineering sustainability objectives in respect of building services
infrastructure advancement. The notion that there is an upward pressure on the economy
and quality of life, with much emphasis on the resources utilisation and pollution
released to the environment, underpins the model. As such, the green growth approach
can facilitate the viable recovery of building services infrastructure development with
environmentally and socially-stable economic growth (WBCSD, 2000). The WBCSD
(2000) study indicates that eco-efficiency involves increasing services while reducing
material and energy intensity. This approach has hitherto been mainly applied in
building services infrastructure (water and energy) management, but it may also offer
far greater sustainability benefits when applied to other economic aspects. For example,
it may provide increased energy, water, and wastewater utilities, with less use of

Bassey B. Okon Sustainability and Sustainable Development in Building
Services Infrastructure Systems Management
80
material and other resources, thereby, enabling „green growth‟ and socio-economic
development as shown in Figure 2.14 (OECD, 2009b; OCED, 2011; ABS, 2012).
Several frameworks have been identified for the promotion of the green growth
strategy. In this respect, policy mixes with research and developments (R&D) need to
be closer to the best practice from the concept of green growth (OECD, 2010; GSGF,
2010). The factors are being identified as key elements of the economic framework to
determine the profitable efficiency and sustainable development integrity (WBCSD,
2000). Legislative policy formulation with appropriate educational awareness through
R&D could simulate a trade-off at both national and international levels (OECD, 2010).
2.11.2 Engineering sustainability through eco-efficiency methods
Eco-efficiency is achieved in building services infrastructure by the integration of
environmentally-sound technologies and fundamentally new systems solutions for the
services delivery. Progressively, such principles will reduce the ecological impacts and
resource intensity throughout the life cycle of building services infrastructure systems to
the bare minimum level. Hence, more value is created at the same time as there is less
use of the building services infrastructure utilities, and less environmental impact
(WBCSD, 2000; Eco Homes, 2003). UNCTAD (2003) has argued that the term eco-
efficiency can be expressed as the ratio of the added value to the building infrastructure
network and its environmental impacts.
It can be seen, therefore, that the concept of eco-efficiency when successfully
implemented with the building industry, is capable of yielding financial benefits.
Indeed, it can also support government in deriving a national strategy for the success of
the sustainable development agenda. The practices associated with eco-efficiency could
establish healthy frameworks to promote innovation, and transparency that allows for
responsibility sharing among the stakeholders. Furthermore, the initiative can amplify
eco-efficiency ethics for the economy and deliver progress in respect of sustainability
goals (WBCSD, 2000; ESCAP, 2011; Eco Homes, 2003; Janssen and Hendriks, 2002;
WB, 2010). The basic principles needed for the promotion of eco-efficiency in building
services infrastructure are shown in Table 2.3.

Bassey B. Okon Sustainability and Sustainable Development in Building
Services Infrastructure Systems Management
81
Table 2.3: Principles for promoting eco-efficiency of building infrastructure (ESCAP, 2006).
Factors Benefits of eco-efficiency Use resources efficiently To obtain greater value from fewer resources and to reduce
waste and impacts within the building.
Minimise externalities When considering market failures, including life cycle costs and
the social benefits of policy tools such as utility bills.
Use both mandatory and
voluntary systems For assessing and reducing environmental impacts, including
raising awareness of policy makers and the public on building
infrastructure usage.
Promote the use of eco-
efficient indicators To measure environmental sustainability for building
infrastructure development.
Promote appropriate
technology tools For eco-efficient infrastructure in the region focusing on local
and renewal energy, climate responsive design for building,
waste management and treatment.
Promote effective multi-
stakeholder partnership Involving key actors in the building industry.
Use innovative financing
and procurement methods Such as cost sharing and partnering in building industry.
Promote demand-side
management Targeted at service-focused approach keeping in mind the end
users‟ needs for building infrastructure sustainability.
On the whole, the employment of eco-efficient policies will sustain a long-term
building services infrastructure lifespan and green growth initiative. This drive is
capable of maintaining sound and healthy building services infrastructure systems for
the present and future generations (WCED, 1987; ESCAP, 2011).
2.11.3 The 3R approach
The reduction, reuse, and recycling of materials within the context of this study is
termed the 3R approach. Environmentally-sound practices achieved through 3R can be
considered and applied as best practice in building services infrastructure development.
Minimising waste generation through source reduction, separation, reuse, recycling, and
recovering goods and materials, will promote sustainability success. This approach not
only responds to the problems of increasing waste generation, but may also provide
significant gains from the reuse and recycling of waste (Eco Homes, 2003). Promoting
this approach requires establishing 3R-related policies along with environmentally-
sound recycling mechanisms that will support and improve informal waste recycling
(DEFRA, 2011).

Bassey B. Okon Sustainability and Sustainable Development in Building
Services Infrastructure Systems Management
82
The use of financial incentives in the form of government subsidies for recycling
technologies and harnessing market forces is another engineering sustainability measure
that is adopted in the development of building services infrastructure. The 3R approach
could also involve public awareness and waste composting practices for energy
generation (Eco Homes, 2003; ESCAP, 2006b; Sabol, 2008; DEFRA, 2010; WRAP,
2011). Figure 2.15 depicts a typical 3R process in engineering sustainability through
waste management.
Figure 2.15: Best practice in waste management (WRAP, 2011).
2.11.4 Public-private partnership
The public-private partnership (PPP) scheme has been found to deliver sustainable
buildings, and therefore this is one of the robust approaches currently employed in
engineering sustainability efforts in respect of building services infrastructure
development (Friesecke, 2006). A study by Tetrevova (2006) has established the PPP
contribution towards sustainable building services infrastructure as being significant and
laudable. Indeed, the gain from this practice includes investment projects implemented
in the public interest using financial resources from the private sector. To implement
these projects, not only do the financial resources from private companies count, but the
expertise, managerial know-how, organisational and innovational potentials are also
used (Broers, 2005; ASHRAE, 2004). Expert abilities and experience relating to
building services management and funding are the core mechanisms in the delivery of
the sustainability agenda. Consequently, PPP has become a ground-breaking, and

Bassey B. Okon Sustainability and Sustainable Development in Building
Services Infrastructure Systems Management
83
strategic approach in the services delivery of sustainable building services infrastructure
worldwide (ESCAP, 2006).
PPP programmes can be developed through co-operation between governments, non-
governmental organisations (NGOs), community-based organisations (CBOs), and other
private entities in managing building projects for sustainability. The PPP agenda can
also deliver in the procurement of the public building sector, thereby increasingly
gaining more ground in the effort to achieve sustainability (ESCAP, 2011). The synergy
of the PPP initiative in the building services industry is evident, especially in an
economic climate where fewer resources (utilities) are available for public service needs
(Friesecke, 2006; Fernandez, 2010).
2.11.5 The use of mathematical modelling theories
Engineering sustainability in the context of building services infrastructure
development can be delivered through suitable mathematical modelling. Contemporary
studies have revealed the integration of mathematical methods in measuring the
economic, social, and environmental values that can enhance the potential of achieving
sustainability. Such techniques contribute to a variety of decision-making processes,
ranging from the planning, design, and construction stages of the building services
infrastructure (Gulch and Baumann, 2004). These analytical techniques can also offer
efficient managerial pathways in appraising the maintenance, operation, and EoL of
building infrastructure projects (Yudelson, 2008; Nebel, 2006; Langdon, 2007).
2.11.5.1 The sustainable engineering infrastructure (SEI) model
The SEI model is one of the latest mathematical models applied in analysing
building services infrastructure performance. A recent study by Okon et al. (2010)
found such novelty through the integration of an SEI model in evaluating a shopping
mall. The SEI model analyses the total building services infrastructure project life cycle
with an allowance for on/offsite recycling processes. All aspects of conceptual design,
procurement, materials handling, construction, renovation, disposal, decommissioning,
hazardous materials, and demolition with recycling procedures, are addressed for their
sustainability impacts. Additionally, appropriate metrics for the engineering project life

Bassey B. Okon Sustainability and Sustainable Development in Building
Services Infrastructure Systems Management
84
cycle are incorporated in the SEI model functions to manage issues bordering on
building services infrastructure project viability, performance, reliability, and
deliverability. Furthermore, the maintenance and use of buildings, EIA and the return-
on-investment among other parameters, are integrated into a common design and
analysis pool function for the overall building services infrastructure growth (Hill and
Bowen, 1997; Ellis, 2007).
Interestingly however, the SEI model also addresses and normalises sustainability
values (Suv) within ranges of 0 ≤ Suv ≤ 1 by applying the probability (P) and set theory
paradigm into sustainability. Thus, accurate and reliable indices of sustainability can be
qualified and quantified. Typically, for an ideal building services infrastructure project
situation, the Suv is 1. But this is impracticable in the real engineering projects
situation. Similarly, the reliability and regression analysis models (RRAM) are among
the effective methods integrated in assessing building services infrastructure growth
(Stroud, 2001). These theories have been applied in evaluating building services
infrastructure utilities (water, energy maintenance), and other ancillary practices. The
outcomes from these methods are reliable (Okon et al., 2010; Okon and Elhag, 2011).
2.11.6 Summary
In this Chapter of the thesis, a comprehensive coverage of the literature related to the
aims and objectives of the study has been provided. Consequently, a full review of
literature concerning building services infrastructure and building construction activities
has been made. The review has concentrated on issues relating to sustainability-driven
buildings, and has identified the theoretical basis, gaps, drivers and limitations in
sustainability practices in order to create more awareness regarding the study. Through
reviewing the related literature, the researcher has identified several appropriate
sustainability management frameworks (ISO 14001 EMS, LCA and LCC) and
engineering sustainability models that have been established and used in the context of
building services development and management. Chapter Three presents detailed
information concerning the methodology adopted for the empirical work in the study.

Bassey B. Okon Research Methods on Sustainable Building Services
Infrastructure Systems Management
85
Chapter Three
3.0 Research methods: sustainable building services
infrastructure systems management
3.1 Introduction
Building services infrastructure systems are typically characterised by complexity,
diversity, operational context, and their non-standardised nature (CIOB, 2003; CIB,
2004; Wood, 2006). Consequently, it becomes necessary to design suitable and
implementable frameworks for the proper determination and review of the extent to
which sustainability is integrated in this context (NSA, 1991; ASTM, 2002). The CIB
(2004) has maintained that building services infrastructure systems constructed in a
well-planned and designed manner, will account for the well-being of people, natural
resources, and the environmental impact (Koskela, 2009; ASHRAE, 2004; BREEAM,
2008; Gigg, 1988). However, the effective management of such building infrastructure
systems upon completion and during use, is currently posing great challenges (Boyle,
2005). Problems arising in this respect, are the lack of prudent management regarding
the infrastructure resources, and environmental impact issues resulting in the threat of
climate change (GSGF, 2010; Shah, 2007). Building services infrastructure resources
are water, energy, and wastewater, all of which need to be properly maintained and
require more strategic appraisal due to worldwide insatiable demands (Cheshire and
Maunsell, 2007; GSGF, 2010; ASHRAE, 1999).
However, it is not possible to effectively appraise building services infrastructure use
and their impact upon sustainability without clearer and more consistent standards and
principles of performance (BREEAM, 2008; CIB, 2004; ASTM, 2002). These ethics
and frameworks must be developed for use by the practitioners in this context. The
building planners, engineers, architects, and other experts who are all involved in
encouraging sustainability are therefore, responsible for considering the long and short-
term economic, social and the environmental implications (BREEAM, 2008; GSGF,
2010). There is also need for a mix of technological, political and innovative models.
Such models need to be tailored so that they can achieve best practices in the
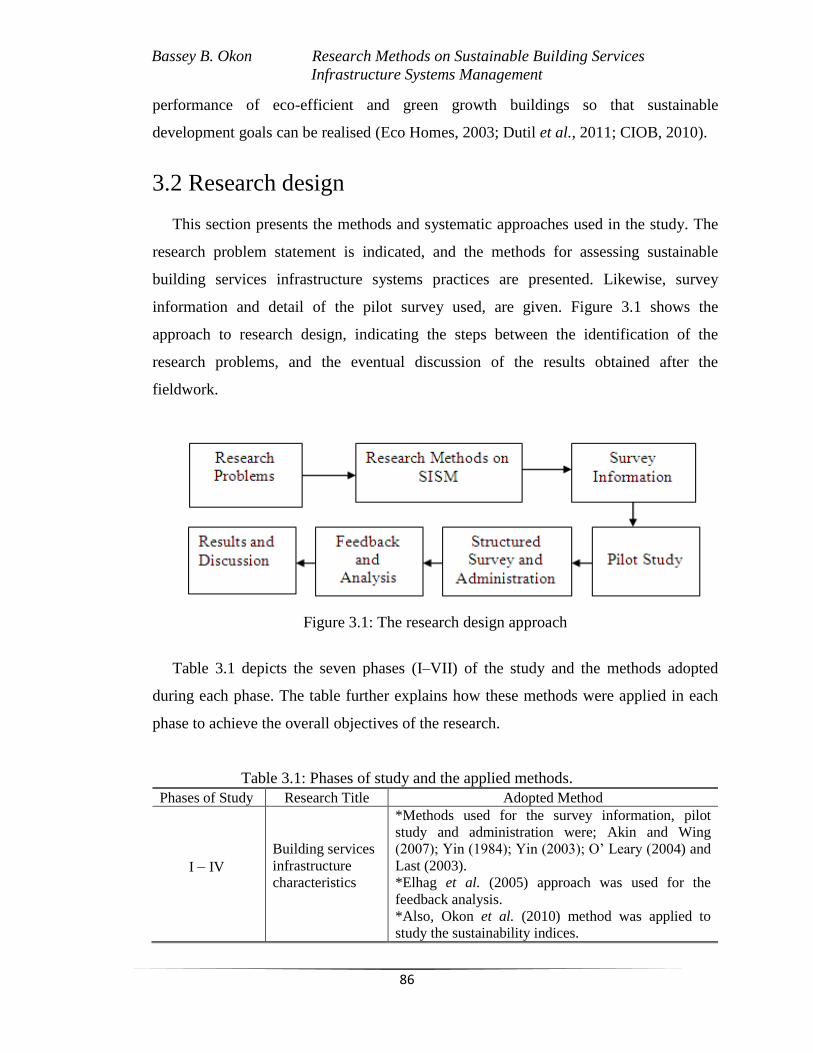
Bassey B. Okon Research Methods on Sustainable Building Services
Infrastructure Systems Management
86
performance of eco-efficient and green growth buildings so that sustainable
development goals can be realised (Eco Homes, 2003; Dutil et al., 2011; CIOB, 2010).
3.2 Research design
This section presents the methods and systematic approaches used in the study. The
research problem statement is indicated, and the methods for assessing sustainable
building services infrastructure systems practices are presented. Likewise, survey
information and detail of the pilot survey used, are given. Figure 3.1 shows the
approach to research design, indicating the steps between the identification of the
research problems, and the eventual discussion of the results obtained after the
fieldwork.
Figure 3.1: The research design approach
Table 3.1 depicts the seven phases (I–VII) of the study and the methods adopted
during each phase. The table further explains how these methods were applied in each
phase to achieve the overall objectives of the research.
Table 3.1: Phases of study and the applied methods.
Phases of Study Research Title Adopted Method
I – IV
Building services
infrastructure
characteristics
*Methods used for the survey information, pilot
study and administration were; Akin and Wing
(2007); Yin (1984); Yin (2003); O‟ Leary (2004) and
Last (2003).
*Elhag et al. (2005) approach was used for the
feedback analysis.
*Also, Okon et al. (2010) method was applied to
study the sustainability indices.

Bassey B. Okon Research Methods on Sustainable Building Services
Infrastructure Systems Management
87
V
LCA and LCC
evaluation
*The method according to O‟Leary (2004) and Last
(2003) were adopted for the pilot study and the
structured survey administration respectively.
*The LCA study employed ISO (1997) and Home et
al. (2009) methods.
*Impact assessment study was conducted via CML
(2007) approach.
*Guinea et al. (2001) and Cabal et al. (2005)
methods were applied to normalise the environmental
impact test.
*The statistical analysis on the LCA was studied
using Devellis‟ (1991), and Field‟s (2006) methods.
*LCC study was conducted through Landon, (2007)
method and Romm (1994) approaches were applied
for the LCC analysis. Also, the statistical software
package version (SPSS 19.0) was employed for the
LCC study.
VI
Energy & utilities
management
*The UK, FOI medium was used for contacts within
the health and education sectors before a pilot study.
*The methods used for the pilot study and structured
survey were O‟Leary (2004) and Last (2003).
*The averaging study were according to Smith
(1998) and Stroud (2001) methods.
*In studying the percentages outcomes, Stroud
(2001) approach was used.
*Carbon footprint evaluation was conducted in line
with Azapagic (2010) method.
*Also, the probability analysis study was carried out
using Hansen (2005) and Montgomery et al. (1998)
methods.
*However, permutations and combinations function
alongside the statistical analysis were studied to
establish the sustainability indices through Stroud,
(2001) approach.
VII
Interviews
*Interviews approaches as used in the study were
according to Kumar (1999); Kvale (1996) and
McCracken (1988).
3.3 Presenting the research methods
Suitable methods were decided upon, and later applied within the seven phases of the
study as shown in Chapters Four, Five, Six and Seven respectively. These methods were
focused on achieving the overall aim and objectives of the research in each scenario.
Four phases (I–IV) implement a common approach in addressing the building services
infrastructure characteristics evaluation. Phases V and VI employ different methods for

Bassey B. Okon Research Methods on Sustainable Building Services
Infrastructure Systems Management
88
the studies as specified in the subsequent sections. The interview sessions as contained
in Chapter Seven (phase VII) and details of the methods used and their application are
also reported in the appropriate sections of this thesis.
3.4 Survey information in study phases I – IV
Tables 3.2–3.5 present a summary of the survey distribution within study phases I–
IV as contained in Appendix I. The achievable data from these surveys were later
analysed and used for the investigation. Information in these tables provides an
overview of the different survey cases within the UK and Nigeria. The analyses arising
from the surveys are contained in Chapter Four of this thesis.
Table 3.2: Summary of survey distribution within Commercial Buildings
Survey Inventory Lot Period of administration Response time (month)
Survey produced 100 September, 2009 -
Survey administered 100 September, 2009 -
Survey received after completion 25 September, 2009 January, 2010
Survey returned unanswered 22 December, 2010 February, 2010
Table 3.3: Summary of survey distribution in Buildings Construction Companies
Survey Inventory Lot Period of administration Response time (month)
Survey produced 100 September, 2009 -
Survey administered 100 September, 2009 -
Survey received after completion 35 September, 2009 January, 2010
Survey returned unanswered 16 December, 2009 March, 2010
Table 3.4: Summary of survey distribution within ALSCON Building/Facility
Survey Inventory Lot Period of administration Response time (month)
Survey produced 100 May, 2010 -
Survey administered 100 May, 2010 -
Survey received after completion 48 September, 2010 January, 2011
Survey returned unanswered 8 March, 2011 February, 2011
Table 3.5: Summary of survey distribution in MPN Building/Facility
Survey Inventory Lot Period of administration Response time (month)
Survey produced 100 May, 2010 -
Survey administered 100 May, 2010 -
Survey received after completion 30 September, 2010 March, 2011
Survey returned unanswered 17 March, 2011 March, 2011

Bassey B. Okon Research Methods on Sustainable Building Services
Infrastructure Systems Management
89
3.5 Research method in study phases I – IV
The research method is tailored towards contributing to the overall body of
knowledge regarding building services infrastructure systems management and building
construction activities. In this context, the UK and Nigerian scenarios were appraised.
Atkin and Wing (2007) explained that in order to achieve such a contribution in a
systematic way, it is necessary to approach a study with suitable and logically accepted
techniques. At the same time, Yin (1984, 2003) argues that a case study method
provides a rational approach to a research project. Consequently, the research method
consists of a combination of strategies, which involve a two-stage method: an in-depth
literature search of previous studies concerning current practices in this field, and a
survey to collect primary data.
The literature review was aimed at identifying the gaps within the management
procedures. The survey was aimed at obtaining the views of the experts in the practical
situation. As already shown in Chapter Two, the literature search was focused on
illuminating all the background issues relating to the sustainability agenda and
identifying best practices in terms of policy and implementation in respect of
sustainable building development. The evaluation of the sustainability agenda and its
application in respect of building services infrastructure systems and building
construction activities have been thoroughly studied.
The survey was administered through email, regular mail, and personal contact. The
regular mail survey was found to be more productive, due to its wider coverage (BAJR,
2007). Building services and building construction experts were the major respondents
to the survey.
3.6 Research process used in study phases I–IV
This section addresses the research processes employed. The three different
processes involved in administering the questionnaire are presented, these being: the
pilot study, the survey itself, and the methods of analysis.

Bassey B. Okon Research Methods on Sustainable Building Services
Infrastructure Systems Management
90
3.6.1 Pilot study in phases I–IV
A pilot survey was prepared and administered within two shopping malls and five
building construction companies in the UK. This was aimed at investigating the key
parameters affecting the management of building services infrastructure systems in both
the private and public sector. The pilot study was meant to provide background
information for the restructuring of suitable surveys for the main study. The pilot survey
was comprised of structured questions to capture respondents‟ observations on the
suitability of the proposed methods. The potential usefulness of the survey approach in
research is indicated by O‟Leary (2004), and Last (2003) who suggested its suitability
for use within the social sciences. In total, 400 paper copies of the main survey were
produced and administered by hand and through the mail. Soft copies of the survey
were also emailed to the organisations indicated in Tables 3.2–3.5. Appendix I is a
sample copy of the survey for study in phases I–IV respectively.
3.6.2 The structured survey administration in study phases I–IV
The feedback from the pilot study established a group of six characteristics which
were subsequently structured into survey and administered within the four phases, I–IV
of study, Appendix I. These characteristics include: energy, water resources
management, maintenance management practices, infrastructure design, projects
characteristics, and external factors. Provisions were also made for the respondents to
return the survey either by hand or email as indicated in the appendices. More details on
these surveys are indicated in Section 3.6.3.
3.6.3 Survey feedback and methods used for analyses, phases I–IV
Within the main survey 50 characteristics were found, and grouped into the six
different categories already identified, and as contained in Appendix I. These are:
Energy resources management characteristics;
Water resources management characteristics;
Maintenance management practices;
Bassey B. Okon Research Methods on Sustainable Building Services
Infrastructure Systems Management
91
Infrastructure design characteristics;
Infrastructure project characteristics; and,
External factors affecting infrastructure management.
The method employed for the survey in Appendix I was to rank and evaluate these
factors according to their influence and significance in terms of this study. The survey
in Section 3.4 was produced and specifically administered to the maintenance/
operations managers within the chosen organisations. The response rates for the survey
in the four sectors studied are within 25–48%, Tables 3.2–3.5. This rate is higher than
the normal rate of 20–30% for most surveys posted through the regular mail or hand-
delivered (Elhag et al., 2005). More interestingly, the survey feedback indicated that
65% of respondents had between 5 and 20 years, and over 20 years, of related
professional working experience. The remaining respondents had between 1 and 4 years
such experience. This wealth of experience was in the organisations studied or within a
related building/facility or company.
All respondents were happy with the survey technique, and some recommended
ways for improvement as presented in the results and discussion section. To calculate
the degree of influence of each variable from the survey feedback, a three-point scale
was used (Elhag et al., 2005), as follows:
1 = not significant
2 = moderately significant
3 = highly significant
For further analysis, the determinant factors described in sub-sections 3.6.3.1 and
3.6.3.2 were applied.
3.6.3.1 Analysis and ranking of determinant management factors
The factors were ranked according to their significance in examining energy and
water resources management characteristics. Also, maintenance management practices,
infrastructure design, project characteristics, and external factors influencing the proper
delivery of sustainable building projects were investigated. A severity index (SI)

Bassey B. Okon Research Methods on Sustainable Building Services
Infrastructure Systems Management
92
computation was used for ranking the associated factors according to their significance
(Elhag et al., 2005). Mathematically, the severity index analysis is given by Equation
(1):
SI =n
xxfwi
ii
1003
1
(1)
Where i represents the ratings 1 – 3, fi, the frequency of the responses, n, the total
number of responses and wi, the weights for each rating. Appendix II is the worked
examples for the severity index analysis. Chapter Four outlines the summary of findings
regarding the statistical analysis for the severity index results.
3.6.3.2 Measuring respondents‟ concordance
This was targeted at determining the variation of responses for each factor. The
coefficient of variance (COV) allows for the comparison of variables between two or
more different variables. Therefore, Elhag et al. (2005) defined the coefficient of
variation as the ratio of standard deviation to the mean of a given data set. This is shown
in Equation (2). The respondents‟ concordances were analysed using Figure 3.2.
Figure 3.2: Weight for each rating (Elhag et al., 2005).
The characteristics in Tables 3.2–3.5 were determined through the application of the
COV in the analysis as indicated in Equation (2).
COV = %100x
X
S
(2)
where COV represents the coefficient of variation, S denotes the standard deviation and
X the weighting mean sample. The COV in this case, expresses the standard deviation

Bassey B. Okon Research Methods on Sustainable Building Services
Infrastructure Systems Management
93
as a percentage of the mean and is useful in comparing the relative variability of
different responses with values calculated using Equation (2). Appendix II is the worked
examples for the coefficient of variation analysis.
In computing for the category ranking analysis, this is usually the product of the
severity index results. As such, the order of sequence of 1st, 2nd, 3rd, are followed. But,
a constant of 1.5 is usually added onto the prceeding order of sequence when similar
(overlapping) results are achieved. For instance, in category ranking analysis where the
order of sequence is 4th, then, the next overlapping severity index results of two value
equal to 5th. This order of sequence will eventually change to 6th considering the
specified constant (Elhag et al., 2005). The overall ranking accounts for the evaluation
of the severity index results in order of their magnitude. Interestingly, the different
methodologies as applied in this study have already been presented in internationally
refereed journals (Okon et al., 2010; Okon and Elhag, 2011). The rationale behind this
approach was to provide an in-depth understanding of the benefits of incorporating
sustainability into the context of this study. It is also tailored at more widely improving
the building infrastructure project performance.
3.7 Other research approaches used in study phases I–IV
In this study, some basic theoretical models were incorporated for analysing building
services infrastructure performance. This becomes necessary as other researchers have
not exploited these fundamental mathematical components in addressing sustainability
generally. They include: (a) the set theory; (b) the probability theory: and, (c) the SEI
model development. Information regarding the application of these models in this
research is presented in the relevant sections of this thesis.
3.7.1 The set theory method
Set theory application attempts to test the veracity of the data in this study. The use
of set theory in data analyses is to provide for the suitable management of the acquired
information in any given circumstance or event (E), (Stroud, 2001: Hansen, 2005). A set
theory has wider application ranging from engineering, science and humanities settings

Bassey B. Okon Research Methods on Sustainable Building Services
Infrastructure Systems Management
94
just to mention but a few. The sustainable development theme revolves around the
economic, social, and environmental values. These trio factors reveal a balance among
the three themes of sustainability and can be appraised through the set theory. Indeed, a
set theory is a collection of elements (Hansen, 2005). Also, if an element x is contained
in or belongs to the set E: it could be expressed as,
x Є E (3)
Then, if A is a collection of elements all belonging to E; the expression is as follows:
A E (4)
Equation (4) indicates A is a sub-set of E. Thus, A in itself is a set included in the largest
set of E. Therefore, the complement of A, denoted as AC within E, is a set of elements in
E that do not belong to A. This argument, however, has yielded:
AC
= {x Є E│x A} (5)
But, if A, B E are two sub-sets of E, this will define a union. Hence;
A U B ={x Є E│x Є A} or {x Є B} (6)
From Equation (6) the intersection gives:
A ∩ B = {x Є E │ x Є A and x Є B} (7)
Also, A/B = A ∩ BC (8)
Equation (8) defines the set of elements in A that do not belong to B.
The set theory according to James et al. (1996), explains it is basically concerned
with the identification of one or more common characteristics among objects called
elements (members of the set). These members of the sets are usually presented in
capital letters, typically: A, B, C and the sub-sets, a, b, c respectively. Smith (1998),
argues that set theory has been one of the fundamental means of sorting objects into
certain similar groupings. In addition, the letter (U) denoting universal is always applied
for the set theory in the Venn diagram. Therefore, a finite set is one that contains only a

Bassey B. Okon Research Methods on Sustainable Building Services
Infrastructure Systems Management
95
finite number of elements (1, 2, 3…….n) while an infinite set is one consisting of an
infinite number of elements (Stroud, 2001). These infinite sets in this case are
economic, social and environmental values of sustainable development.
In this thesis, environmental values are represented by (Env), social values (Soc),
economic values (Eco) and sustainable development is denoted by (S.D). However, the
two Venn diagrams in Figure 3.3 depict the set theory representation.
Figure 3.3: Venn diagram showing the intersection and union of set elements.
Hence from Figure 3.3, the set theory equation is expressed in Equation (9):
Env ∩ (Soc ∩ Eco) (9)
It is indicative from Equation (9) that the triple factors of sustainable development
belong to the same universal set theory. Consequently, set theory also holds as indicated
in Equation (10):
Soc ∩ (Eco U Env) = (Soc ∩ Eco) U (Soc ∩ Env) (10)
The incorporation of set theory into sustainability originates from the inter-relation
among the three themes of sustainable development. The economic, social, and
environmental values are classified as sets. The sub-sets are equitability, viability, and
bearability values of sustainability. Evidently, set theory is capable of evaluating
sustainability along with the building services infrastructure systems management as
contained in Figure 2.2 on page 44 (Okon et al., 2010). The set theory model has

Bassey B. Okon Research Methods on Sustainable Building Services
Infrastructure Systems Management
96
generated into the Venn diagram given in Figure 3.3 and is used for evaluating building
infrastructure services delivery.
3.7.2 The probability theory method
Probability theory aims to measure the achievable data in this study. The increasing
use of probability theory is to quantify the chance or possibility that sample test
measurement results or data fall within some set of values (Hansen, 2005). Probability
theory is usually expressed in terms of random variables during information presentation
(Montgomery et al., 1998). Accordingly, probability theory can provide the foundation
for evaluating statistical inference in any research. Probability theory is found as the
main conceptual origin of statistics and a mathematical framework for discussing
experiments with an outcome that is uncertain (Smith, 1998; Stroud, 2001). However,
probability theory is used to address the mathematical aspects of uncertainties and is
calculated theoretically by specifying what properties such quantification represents
(Hansen, 2005).
The application of probability (P) theorems from the Venn diagram in Figure 3.3 is
expressed as follows:
P(X Є R) = 1 (11)
where (P) is the probability of random variables, (R) is the set of real variables (E)
elements and (X) denotes data information from this study;
0 ≤ P(X Є R) ≤ 1 for any set E (12)
Contextually, it be could stated that the environmental, social and economic values still
hold with the sustainability values (Suv). Then the boundary condition in Equation (14)
was applied within the entire study analysis. Hence,
P(X Є E) = Suv = P(Ecv ∩ Env∩ Sov) (13)
Therefore, the model as applied in this study becomes:

Bassey B. Okon Research Methods on Sustainable Building Services
Infrastructure Systems Management
97
P(X Є E) = 0 ≤ Suv ≤ 1 (14)
3.7.3 The sustainable engineering infrastructure (SEI) model use
The research aim and objectives concern the proper management of building services
infrastructure resources, and a generic model has been produced to assist in this respect.
Specifically, the SEI model is developed through the interpretation of the three themes
of sustainable development, and it addresses the inter-disciplinary engineering fields,
systems, sub-systems, devices along with components application, technologies and
architectures requiring sustainability success. The term values in this case can also
imply indices. Hence, the following abbreviations are applied in this study:
Sov – Social values
Eqv – Equitability values
Env – Environmental values
Ecv – Economic values
Vv – Viability values
Bv – Bearability values
Suv – Sustainability values
The Venn diagram intersection in Figure 3.3 yielding sustainable development
among the three themes is translated into a mathematical model called the SEI model.
This application is found in Chapter Four of Appendix III. Thus;
n(Ecv) U n(Env) U n(Sov) = n(Ecv) + n(Env) + n(Sov) – n(Ecv ∩ Env) –
n(Ecv ∩ Sov) – n(Env ∩ Sov) + n(Ecv ∩ Env ∩ Sov) (15)
But:
n(Ecv ∩ Env) = n(Vv)
n(Env ∩ Sov) = n(Bv)
(16)
n(Ecv ∩ Sov) = n(Eqv)
n(Ecv ∩ Env ∩ Sov) = n(Suv)

Bassey B. Okon Research Methods on Sustainable Building Services
Infrastructure Systems Management
98
Therefore, substituting Equations (16) into (15) yields;
n(Ecv) U n(Env) U n(Sov) = n(Ecv) + n(Env) + n(Sov) – n(Vv) –
n(Bv) – n(Eqv) + n n(Suv) (17)
Equation (17) is the final mathematical representation of the sustainability model by
the application of set theory. It implies that in order for the sustainability goals of
engineering projects to be attained, relevant indices or values of sustainability must be
defined and modelled as a set of integrated systems. Then, the sustainability engineering
standpoint should promote a rigorous interaction for a balance amongst the three themes
of sustainable development. The SEI model also addresses and normalises sustainability
within the ranges of 0 ≤ Suv ≤ 1 by applying the probability (P) theory into sustainability
(Stroud, 2001). The SEI model limits [0 ≤ Suv ≤ 1], thereby explaining the underlying
principles associated with the efficiency of a machine, including building services
operations. The building services operation contains systems, sub-systems (equipment)
installation which can be measured in performance terms (RICS, 2008; Ashworth, 1999;
IPMVP, 2002; Cheshire and Maunsell, 2007). The efficiency of a building in this case
underscores the ratio of measured and ideal services delivery within a building (Cengel
et al., 2008; ABS, 2012; Stroud, 2001; NIBS, 2006).
Once constructed, and fitted with equipment, a building yields the efficiency of 1.
This logically expresses the ideal condition of such a building. But, when a building is
put to use (operation), the efficiency will increasingly reduce over time tending towards
0. Also, this situation accounts for the fact that when the installed equipment is
measured within the building, depreciation occurs due to deformation, friction, wear and
tear, and that parts require maintenance if services are to be delivered (Cengel et al.,
2008; CIOB, 2010; BREEAM, 2008; RICS, 2000). With the SEI model limits, accurate
and reliable indices of sustainability can be qualified and quantified. An ideal building
project is expected to have the Suv value of 1. However, this is found impracticable in
the real engineering project context (Smith, 2008; BREEAM, 2008; Cengel et al.,
2008). The proposed SEI model reported in this study has defined and normalised Suv
values to unity for building services infrastructure application. The SEI model is
expected to serve as a design, development, implementation, and management platform

Bassey B. Okon Research Methods on Sustainable Building Services
Infrastructure Systems Management
99
for the sustainable engineering community. Indeed, the different methods as applied in
this study have been discussed earlier (Okon et al., 2010; Okon and Elhag, 2011).
3.7.4 Partial differential equation method
The partial differential equation method, according to Stroud (2001), has also been
applied to study buildings (facilities) as shown in Chapter Four. This method was used
for the determination of the sustainability index (SI) and the building infrastructure
performance (IP) within the investigated buildings (facilities) services. The application
of this technique accounts for the initial and temporal (final) boundary conditions in the
analysed buildings (facilities) with respect to their lifespan. The considered boundary
conditions are:
Initial building lifespan (t) boundary condition, (t = 0);
Temporal (final) building lifetime boundary condition, (t = α).
where α expresses the infinity status within the investigated buildings (facilities) and the
building services infrastructure activities during the construction phase is represented by
(E). In addition, the building services infrastructure activities during use (operations)
and maintenance are denoted by (IU) and the sustainability index is represented by (SI)
in this analysis. It is also noted that all parameters in this analysis are normalised values,
therefore:
SI(t) = IP(t) + E.IU (18)
Let μ = buildings (facilities) infrastructure capacity (variables) factors, then;
[0 ≤ μ ≤ 1] (19)
But, α = buildings (facilities) infrastructure usage (variables) factors, then;
[0 ≤ α ≤ 1] (20)
For the sustainability index analysis within the investigated building (facilities)
infrastructure at the initial construction (c) time, before operation (o) or use:

Bassey B. Okon Research Methods on Sustainable Building Services
Infrastructure Systems Management
100
[0 ≤ SIo ≤ 1] (21)
Considering the highlighted parameters for the investigated buildings (facilities), the
governing model for the analyis was established as presented in Equation (21).
SI C
1
0(t) = SI 0
t
(22)
In this situation, represents the exponential constant in the analysis. The model in
equation (22) was derived and subsequently applied for the analysis. Plots in Figure 3.4
illustrate the building services infrastructure at the construction and operational phases.
Figure 3.4: Construction and operational phases of building infrastructure.
In Figure 3.4, the point marked TBSI signifies the targeted building sustainability
index at the construction phase of the building infrastructure (Barret, 1995; Chanter and
Swallow, 2000; Bayer, et al., 2010). The critical point in the operational phase of a
building is where decommissioning is suggested as applicable in this study. More
details regarding this analysis are reported in Appendix III.
3.8 Research methods used in study phase V
The research evaluates sustainable building services infrastructure systems within
residential and office buildings. In this study also, the life cycle analysis (LCA) and life
cycle cost (LCC) within six ongoing constructed buildings in the UK were appraised.
This investigation was performed on six new high-rise buildings, and focused on their

Bassey B. Okon Research Methods on Sustainable Building Services
Infrastructure Systems Management
101
building infrastructure services delivery and management procedures. The results are
presented in Chapter Four of this thesis.
3.8.1 Pilot study in phase V
The pilot study was conducted with three project managers handling building
construction project activities. The feedback from these experts was able to provide
very useful and important information leading to the preparation of structured surveys
for the study (O‟Leary, 2004). The various materials supply chains involved in this
study were the energy utilities, water, waste, and building materials consumed at the
construction, operation, maintenance, and end-of-life phases. Other details regarding
this phase of the study are considered in the results and discussion section.
3.8.2 The structured survey administration in study phase V
Structured surveys were prepared and administered to twelve project managers
within the building construction industry across the UK. Out of this number, six project
managers were able to give measured field data from their organisation inventory for
the analysis as shown in study phase V in Chapter Five. The suggested research
methods by Last (2003), and O‟Leary (2004), were adopted for the study, as they were
believed to assist in achieving the study‟s goals. In the main, the research sought
information on the construction, operation (use), maintenance, and EoL phases of the
buildings services infrastructure systems. It was possible for respondents to return their
surveys either by hand, email and regular mail as shown in Appendix IV. More details
of this phase of tests are reported in Chapter Five.
3.8.3 Survey information and feedback in study phase V
Table 3.6: Summary of survey distribution in Buildings Construction Companies
Survey Inventory Lot Period of administration Response time (month)
Survey produced 10 July, 2010 -
Survey administered 10 July, 2010 -
Survey received after completion 6 September, 2010 August, 2011
Survey returned unanswered
Participating companies
4
6
August, 2011
See *A – F
September, 2011
-

Bassey B. Okon Research Methods on Sustainable Building Services
Infrastructure Systems Management
102
*A –Wates Construction Company, UK
*B –GallifordTry Construction Company, UK
*C –John Turner Construction Company, UK
*D –Northern Group Build Limited, UK
*E – Overburry Construction Company, UK
*F –Shepherd Building Group, UK
3.8.4 Methods used for sustainability evaluation in study phase V
This study found it necessary to find suitable methods to evaluate the data obtained
from the survey feedback presented in Section 3.8.3. The features of sustainability were
analysed in three parts each using a different method as indicated in Table 3.7.
Table 3.7: Features of sustainability and evaluation approach.
Features of
Sustainability Methods Environmental Impact
Environmental Values
LCA
Energy Demand: * ADP, AP, EP, FAETP,
GWP, HTP, MAETP, ODP, POCP, TETP.
Economic Values LCC/value added Life cycle costs and value added potentials.
Social Values
LCA
This will be adopted as related to the sector.
It may include the building infrastructure
delivery and benefits to the users generally.
*ADP –Abiotic Depletion Potential
*AP –Acidification Potential
*EP –Eutrophication Potential
*FAEP –Freshwater Aquatic Ecotoxicity potential
*GWP –Global Warming Potential
*HTP –Human Toxicity Potential
*MAETP –Marine Aquatic Ecotoxicity Potential
*ODP –Ozone Layer Depletion Potential
*POCP –Photochem Ozone Creation Potential
*TETP – Terrestric Ecotoxicity Potential

Bassey B. Okon Research Methods on Sustainable Building Services
Infrastructure Systems Management
103
3.8.5 Method used for the LCA study in phase V
In this phase of study, the methods of ISO (1997), and Home et al. (2009) were used
in the investigation. In the LCA analysis, the bills of materials data were exported and
modelled using the Gabi 4 software package (Guinee et al., 2001; CML, 2007). The
rationale behind this approach was to identify the „hot spots‟ (impact) and data gaps
across the supply chain from the measured field data. The process flow diagram used
for the LCA inventory analysis is shown in Figure 3.5.
Figure 3.5: LCA inventory analysis process.
In this research, ten listed environmental impacts associated with the supply chain
regarding building services infrastructure systems were evaluated using the CML
assessment method in Guinee et al. (2001). CML is a method developed in the Centre of
Environment Science of Leiden University in the Netherlands and is the best fit for
impact examination study. The impact evaluation was studied and these include both
characterisation and weighting steps in accordance with the ISO 14044 standard
(Guinee et al., 2001; REGENER, 1997; ISO, 2002) This standard is the EU‟s
normalisation technique in Appendix V according to the CML package (Guinee et al.,
2001; Szalay et al., 2011; Bayer et al., 2010; Cabal et al., 2005). The LCA appraisal
also employs a mathematical approach according to ACLCA (2008), and Stroud (2001)
to evaluate each characteristic‟s impact on the analysis as shown in Equation (23):
Impact analysis = 100),...(
xHHB
XBnLHBHHB (23)
where HHB is the high hot spot in the studied buildings, LHB is the low hot spot, and
XBn signifies any of the buildings in this situation (Lee and Burnett, 2008). The overall
impact results in each case are presented as a percentage of the total estimation.

Bassey B. Okon Research Methods on Sustainable Building Services
Infrastructure Systems Management
104
3.8.6 Methods used for the LCC in study phase V
In this study, the Langdon (2007) approach was used for the costs examination. This
method was essential to evaluate the total cost of the building services infrastructure
/facility ownership and to integrate the economic value for sustainability benefits. The
appraisal in this context accounts for the cost of acquisition, owning, and disposing of
the entire building services infrastructure systems. Furthermore, it addresses the overall
costs of building services infrastructure projects alternatives, and selects the suitable
design for the services delivery (Epstein, 1996). The LCC also aimed to ensure that the
buildings infrastructure services will deliver at the lowest cost of ownership, whilst
keeping its quality and function steady over the life cycle (Romm, 1994).
Romm (1994) maintained that in practical terms, over a 50 year period of a
building‟s lifetime, the initial cost should account for just 2% of the total expenditure.
At the same time, the operation (use) and maintenance costs should be worth about 6%,
and the personnel costs equal to 92% of the total investment (Muto et al., 2006). LCC
appraisal in this case was based on the supplied field data as contained in Tables 5.40
and 5.41 that appear in Section 5.22. Davis Langdon and Jacobs‟ engineering costs
assessment companies assisted in providing the current materials valuation for this
study as shown in Appendix IV. In analysing the building infrastructure services, the
related costs usually fall into the following classes (Muto et al., 2006; Romm, 1994;
Epstein, 1996):
Initial costs – purchase, acquisition costs
Fuel costs – operation, maintenance and repairs
Replacement costs (Residual values – resale or salvage values or disposal cost)
Finance charges – loan, interest payments and the non-monetary benefits or
costs
At this stage in the study, the mathematical expression shown in Equation (24) was
employed for the LCC analysis:
LCC = Acquisition costs + Ownership costs + Disposal costs (24)

Bassey B. Okon Research Methods on Sustainable Building Services
Infrastructure Systems Management
105
Similarly, considering the total life cycle costs analysis in the investigated buildings
infrastructure, Equation (25) was applied in the study:
LCC = I + Repl. – Res. + E + W + OM&R + O (25)
Where:
I = Investment cost
Repl. = Replacement cost
Res. = Residual cost
E = energy cost
W = water cost
OM & R = operation, maintenance and repairs
O = other associated costs incurred.
Similarly,
LCC = Total economic life cycle costs (£) in present value (PV) of a given alternative
regarding the building infrastructure. Therefore, in terms of present value the
component can be defined as follows:
I = PV of investment costs if incurred at the base date, they do not need to be
discounted.
Then;
Repl. = PV of capital replacement costs
Res. = PV of residual value (resale value, salvage value) less disposal costs
E = PV of energy costs
W = PV of water costs
OM & R = PV of non-fuel operating, maintenance and repair costs
O = PV of other costs especially the contract cost (Muto et al., 2006 and Romm,
1994).

Bassey B. Okon Research Methods on Sustainable Building Services
Infrastructure Systems Management
106
Further analysis in this study also accounts for the other building infrastructure
evaluation criteria. Thus, the lowest economic LCC for the purpose of finding costs
effectiveness associated with the building infrastructure considering the indicated
parameters. Then, the following parameters are defined for the building infrastructure
(Epstein, 1996; Park and Tippett, 1999 and Muto et al., 2006). The abbreviations are:
NS – Net savings: operational savings less difference in capital investment costs.
SIR – Saving-to-investment ratio: ratio of operational savings to difference in
capital investment costs. However, other parameters include:
AIRR – Adjusted internal rate of return: annual yield of alternative over the study
period, taking into account reinvestment of interim returns at discount rate.
SPB – Simple payback: time required for the cummulative savings from an
alternative to recover its initial investment cost and other accrued costs without
taking into account, time value of money (TG4, 2003). Also;
DPB – Discounted payback time required for the cummulative savings from an
alternative to recover its initial investment cost and other accrued costs, taking
into account the time value of money (Gulch and Baumann, 2004; Ellis, 2007).
3.9 Research methods used in study phase VI
This study evaluates sustainable building services infrastructure management to
include water and energy utilities, waste, and carbon emissions, within hospitals and
schools in the UK. Hospitals are regarded as the National Healthcare Services (NHS)
and schools are generally considered as the Education sector. In addition, the study
employed a two-stage method that being an initial literature review, subsequent
empirical work in the form of the administration of surveys. The literature review was
aimed at discovering the gaps within the management procedures and the survey
targeted the experts‟ views on the issues raised in the literature. The research was
tailored to determine the building services infrastructure management professionals‟
opinions on the existing standards and best practices for improved services delivery.
Other methods applied in this phase of study are also indicated.

Bassey B. Okon Research Methods on Sustainable Building Services
Infrastructure Systems Management
107
3.9.1 Pilot study in phase VI
Pilot surveys were prepared and administered to two facility managers in a college
and university within the UK. Additionally, three operation and estate managers within
the hospitals (NHS) were contacted for information regarding this context. These
experts were able to supply very useful and significant information leading to the
preparation of structured surveys for this research (O‟Leary, 2004). This method was
tailored towards achieving the overall aim of the study. The energy and utilities
consumption together with the waste and other data from these organisations are
presented under the structured survey in Section 5.4.
3.9.2 The structured survey administration in study phase VI
The structured survey produced in Appendix VI was produced and administered to
the facilities, and operation and estate managers within hospitals and schools (colleges
and universities) across the UK. These professionals were able to supply measured data
from their individual organisations‟ inventories for the analysis. In the operation and
maintenance phases of the activities, the focus was on the energy utilities such as water,
electricity, natural gas, heating and fuel/oil use. The statistics from the maintenance and
refurbishment phases centred on the materials flow and their recycling contents
respectively. The waste management list includes segregated and non-segregated waste,
recyclable, landfill, incinerated and other waste. On this basis, O‟Leary‟s (2004) method
was adopted as it sought to achieve the same overall goals as the study‟s objectives.
Last (2003) is supportive of the survey approach, observing that it is often applied,
and particularly so in social science research. In this study, respondents were able either
to return their completed survey by hand, email and regular postal mail as indicated in
Appendix VII. More details regarding this phase of the study are contained in Tables 6.2
and 6.3 of Section 5.4.
3.9.3 Survey information and feedback in study phase VI
The statistical information in Table 3.8 presents a summary of the survey distribution
in study phase VI as the requisite data was subsequently analysed and used for the
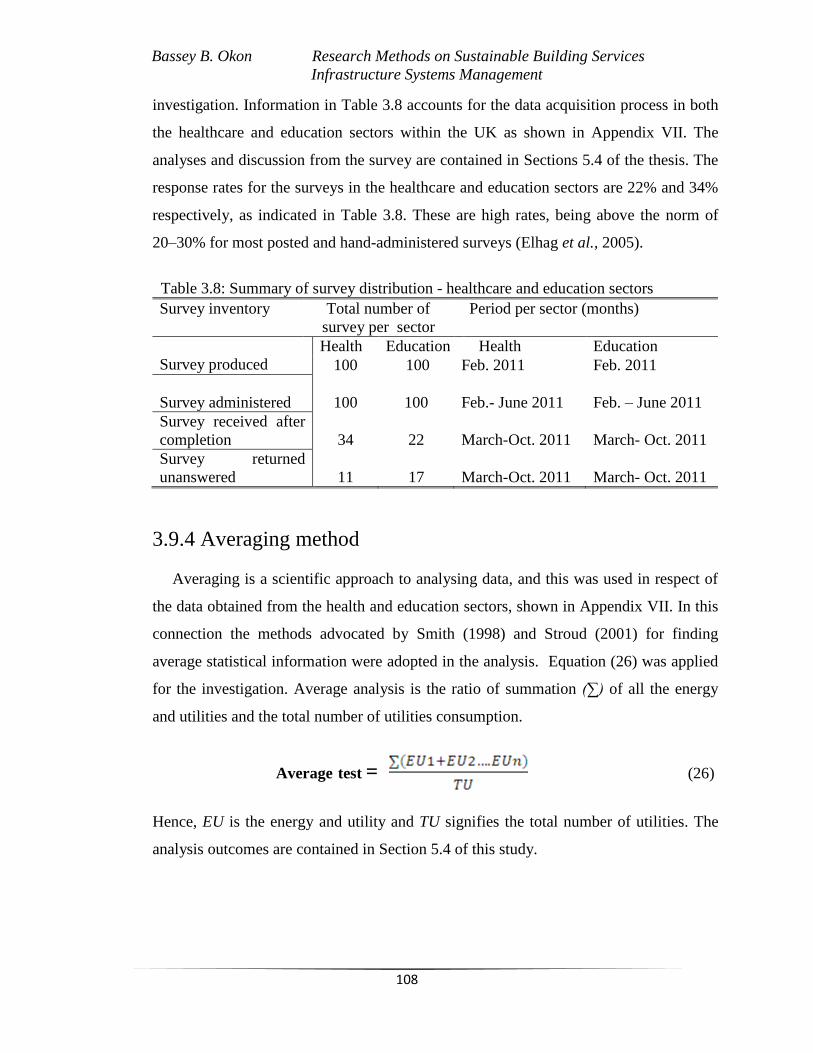
Bassey B. Okon Research Methods on Sustainable Building Services
Infrastructure Systems Management
108
investigation. Information in Table 3.8 accounts for the data acquisition process in both
the healthcare and education sectors within the UK as shown in Appendix VII. The
analyses and discussion from the survey are contained in Sections 5.4 of the thesis. The
response rates for the surveys in the healthcare and education sectors are 22% and 34%
respectively, as indicated in Table 3.8. These are high rates, being above the norm of
20–30% for most posted and hand-administered surveys (Elhag et al., 2005).
Table 3.8: Summary of survey distribution - healthcare and education sectors
Survey inventory Total number of
survey per sector
Period per sector (months)
Survey produced
Health Education Health Education
100 100 Feb. 2011 Feb. 2011
Survey administered
100
100
Feb.- June 2011
Feb. – June 2011
Survey received after
completion
34
22
March-Oct. 2011
March- Oct. 2011
Survey returned
unanswered
11
17
March-Oct. 2011
March- Oct. 2011
3.9.4 Averaging method
Averaging is a scientific approach to analysing data, and this was used in respect of
the data obtained from the health and education sectors, shown in Appendix VII. In this
connection the methods advocated by Smith (1998) and Stroud (2001) for finding
average statistical information were adopted in the analysis. Equation (26) was applied
for the investigation. Average analysis is the ratio of summation (∑) of all the energy
and utilities and the total number of utilities consumption.
Average test = (26)
Hence, EU is the energy and utility and TU signifies the total number of utilities. The
analysis outcomes are contained in Section 5.4 of this study.

Bassey B. Okon Research Methods on Sustainable Building Services
Infrastructure Systems Management
109
3.9.5 Percentages method
The application of the percentages method becomes imperative for analysing the
individual energy and utility consumption within the healthcare and education sectors as
shown in Appendix VII. Stroud‟s (2001) method in determining the percentages
analysis was used in this study. Percentages evaluation of energy and utilities
consumption was also calculated using Equation (27) thus:
Percentage = (27)
The results obtained from this method are reported in Section 5.4.
3.9.6 Carbon footprint analysis method
In this study, a carbon footprint evaluation was also conducted using the carbon
calculator (CcalC) software package formulated by Azapagic (2010) as shown in
Section 5.8.2. The study adopted this method as contained in the CcalC package due to
its wide application within the building industry and other field activities. The CcalC
tool is a user friendly package allowing for quick and easy estimations of environmental
impacts and value added along the supply chain in this research. Appendix VIII of this
thesis contains the analysis from the CcalC software package.
3.9.7 The concept of probability theory
Probability theory applications in this study seek to quantify the data acquired from
the health and education sectors. Hansen (2005) explains that probability theory is used
to quantify the chance or possibility that sample test, and measurement results or data
fall within some set of values. The methods suggested by Hansen (2005), and
Montgomery et al. (1998) were used in examining the data, and the results obtain are
presented in Section 5.9.1.

Bassey B. Okon Research Methods on Sustainable Building Services
Infrastructure Systems Management
110
3.9.8 Sustainability index model with permutations and
combinations functions
This study employed the sustainability index (SI) model with the permutations and
combinations functions (PCF) methods for data analysis. The sustainability index model
was applied due to its ability in arranging and sorting of the obtained data in this phase
of study. Moreover, the achievable data from the healthcare and education sectors were
measured through this approach. Stroud‟s (2001) method was then used to verify the
best match energy utilities among the variables. In buttressing the test, the SEI model
approach of Okon et al. (2010) was adopted alongside the PCF methods for addressing
the sustainability index evaluation in this phase of study. Equation (28) is the governing
principle of PCF in this analysis. Thus:
NCm = !m
NPm =1 (29)
5C5 = !5
5 5P= 1 (30)
5C3 = !3
5 3P=1 (31)
where N is the number of energy and utilities = 5, and C is the combination factors = 3.
Also, P denotes the permutation factor = 3. The outcomes of these methods are reported
in Section 5.10 of this thesis.
3.10 Interviews: Qualitative method – study phase VII
Chapter seven of this thesis reports on the structured interview sessions that were
conducted with two sustainability professionals within the UK as indicated in
Appendices IX and X. The individuals involved were: (a) the Director of Building
Services and Construction Projects Management Programme at the Liverpool John
Moores University; and (b) the Director of Sustainability at the company BDP. The
interview evaluation was in line with the aim and objectives of this research. In

Bassey B. Okon Research Methods on Sustainable Building Services
Infrastructure Systems Management
111
addition, the structured interviews were expected to validate the results from the
administered surveys discussed elsewhere in the thesis. The achievable information
(data) in this phase of study was of a qualitative type which adds value to all the
objectives of the research (Maxwell, 1996; McCraken, 1998).
3.10.1 Interview approach in study phase VII
The associated problems or research issues connected with engineering management
in building services infrastructure systems and building construction activities, involve
the measurement of data that are not easily quantified. Building infrastructure projects‟
scope definition, management capability, project complexity, and delivery services are
all concepts that have proven to be essential for the successful management system
(Armstrong, 1987; Grigg, 1987; GSGF, 2010; Ding, 2008). However, these constructs
have posed difficulties for researchers in evaluation efforts. As a consequence, the
research intention was to assess the parameters affecting building services infrastructure
and building construction.
Maxwell‟s (1996) method was applied in this case as it offers a qualitative
investigation approach to data collection through person-to-person interaction. This
medium of data acquisition was adopted with two different management experts as
indicated in Chapter Seven of this thesis. A tape recording system was also used by the
interviewer to document the entire conversations for reference purposes. According to
Kumar (1999), the advantages of the interview are as follows: the interview is more
appropriate for complex analysis; hence, in situations where in-depth information is
required, interviewing is the preferred method of data collection. Interviews can also
vary in their form, ranging from the highly structured, to the unstructured type,
distinguished by the degree of flexibility in the interview session. The unstructured
interview is extremely useful in situations where either in-depth information is needed
or little is known about the area. As this approach provides detailed information, many
researchers use the technique for gathering rich background information, and
subsequently developing a structured research instrument. This form of interview
achieves its desire for flexibility, broad and detailed information from the responses.

Bassey B. Okon Research Methods on Sustainable Building Services
Infrastructure Systems Management
112
In contrast, “In a structured interview the investigator asks a pre-determined set of
questions, using the same wording and order of questions as specified in the interview
schedule. One of the main advantages of the structured interview is that it provides
uniform information, which assures the comparability of data” (Kumar, 1999).
Both methods have their advantages, but the semi-structured interview is
characterised by the best of both worlds, and was, therefore, adopted in the study. The
interview session was conducted by inviting the interviewees to share their opinions in
an honest encounter with the researcher.
In accordance with Kvale (1996), “The interviewee should be provided with a
context of the interview by a briefing before. The context is introduced with a briefing in
which the interviewer defines the situation for the subject; briefly tells about the
purpose of the interview, the use of tape recorder; and asks if the subject has any
question before starting the interview”. Consequently, written lists of questions were
sent to the interviewees in advance together with a clear explanation by the researcher
of the need for conducting interviews (McCracken, 1988). The interview questions were
open-ended with the purpose of achieving integrated information from the experts.
Obviously, the different method as applied in this study had previously been
presented at the internationally-refereed conference (Okon and Elhag, 2011).
3.10.2 Summary
In this Chapter, the research methods employed for the study have been presented
and discussed. This Chapter began with a short introduction regarding sustainable
infrastructure systems management and proceeded to illustrate the approach taken to
research design. In order to clarify the situation, the methods applied in the different
phases of the study have been tabulated. Additionally, general information concerning
the research processes in study phases I–IV, V, VI and VII have been highlighted, from
which it is understood that a mixed methods approach has been adopted, with
quantitative research methods being employed in phases I–IV, V and VI of the study,
and a qualitative method being adopted in phase VII. This qualitative dimension to the
empirical work has been indicated as a method to test the veracity of the results from the
other phases of study (I–IV, V and VI) respectively.
Bassey B. Okon Research Methods on Sustainable Building Services
Infrastructure Systems Management
113
Interestingly, various sustainability management models (LCA and LCC) are among
those techniques that were identified through the related literature survey and have been
applied in this study. The SEI model and a partial differential equation method were
developed and subsequently used in the research. These management models have
offered systematic advancement towards the attainment of sustainability success in
buildings (facilities) projects and implementation.

Bassey B. Okon Building Services Infrastructure Characteristics, Study Phases I - IV
114
Chapter Four
4.0 Results and discussion of the research
4.1Introduction
The results and discussion are presented in two broad phases as revealed in Figure
4.1. Sections 4.2–4.6 consider the building services infrastructure characteristics in
commercial buildings (facilities), these being mainly, the operations and maintenance
(OM) practices, and building construction companies within the UK. In Sections 4.12–
4.13, the buildings (facilities) services infrastructure characteristics analysis from the
Aluminium Smelter Company of Nigeria (ALSCON), and Mobil Producing Nigeria
(MPN) scenarios are presented. The four phases of this study are namely; 1)
Commercial buildings: the operations and maintenance (OM) – Phase I; 2) Building
construction companies (BCC) – Phase II; 3) ALSCON – Phase III; and 4) MPN –
Phase IV. The comparative analyses results from the UK and Nigerian scenarios are
also reported. The pattern of the study is shown in Figure 4.1.
Figure 4.1: The results and discussion pattern of the study.
4.2 Study Phase I: Commercial Buildings - O&M evaluation
4.2.1 Presenting the phase of study
Commercial buildings: the operations and maintenance (O&M) activities of the
building services infrastructure in the Arndale Centre, and Liverpool One (shopping
malls in Manchester, and Liverpool respectively), in the United Kingdom were
examined. The maintenance/operations and information desk managers provided the

Bassey B. Okon Building Services Infrastructure Characteristics, Study Phases I - IV
115
building services infrastructure statistics through the survey, and the results obtained
appear in Sections 4.3–4.20 of the thesis.
4.2.2 Goal and scope definition
The goals were specifically concerned with the operations and maintenance stages of
the building services infrastructure performance. Basically, water, energy, heating, and
the maintenance culture, were the services addressed. Additionally, the characteristics
leading to effective services delivery and the sustainability of the building infrastructure
over its life cycle were appraised.
4.3 Results and discussion in study phase I
In this study, the following abbreviations are used: severity indices (SI), coefficient
of variation (COV), category ranking (CR), and the overall ranking (OR).
The outcomes from the energy resources management characteristics in phase I are
presented in Table 4.1.
4.3.1 Energy resources management characteristics
Table 4.1: Energy resources management characteristics
FACTORS SI COV CR OR
1)Use of efficient and energy saving fixtures 82.7 19.2 3 11
2)Use of modern technological (energy) concepts 80.0 26.6 4 15
3)Use of sensor based lighting systems for energyconservation
in building/facility 79.7 27.5 5 16
4)Use of the renewable energy source in building/facility 68.0 36.0 10 31
5)Use of HVAC for energy efficiency/conservation 72.7 30.5 9 26
6)Employment of solar panels/photovoltaic technology 55.6 45.7 11 36
7)Installation of modern energy saving accessories in building/
facility 78.8 30.4 6.5 17
8)Energy management via good operating efficiency in
buildings /facility 87.5 18.8 1 6
9)Energy management via good maintenance policy framework
in building/facility 86.9 19.1 2 7
10)Educational awareness drive on the sustainable energy usage
in building/facility 78.8 24.6 6.5 17
11) Application of building regulation Part L for energy
conservation in building/facility 75.8 33.8 8 22

Bassey B. Okon Building Services Infrastructure Characteristics, Study Phases I - IV
116
From Table 4.1 it can be seen that the group of respondents identified 11 factors. The
severity indices range from 55–88%. The result shows that these factors have relatively
weighty degrees of influence on building infrastructure energy and utilities management
in terms of cost and service delivery. For instance, 87% of the respondents strongly
agreed with (a) the use of efficient and energy saving fixtures in building infrastructure
for cost savings. The class maintained coefficients varying between 18% and 46%
which are relatively low and show a good concordance level between the respondents.
The category ranking range is 1st–11th.
This indicates strong agreement on (b) the application of energy management
through good operating efficiency and maintenance policy factors. However, (c) the
employment of solar panels, and (d) the renewable energy source in the building, are
ranked least in the category scale. Their overall ranking ranges are 6th–36th. There are
exceptions of nine variables perceived by most respondents as not being highly
significant in this investigation, as shown in Table 4.1.
4.3.2 Water resources management characteristics
Findings from the water resources management characteristics in study phase I, are
shown in Table 4.2.
Table 4.2: Water resources management characteristics
FACTORS SI COV CR OR
1)Use of efficient water fixtures, sensor flow taps 66.7 39.2 6.5 32
2)Use of modern technological concepts; water recycling
practice in building/facility 59.1 41.8 9 35
3)Use of water conservation techniques; grey water in
building/facility 59.4 46.5 8 33
4)Installation of automatic shut-off faucets for water
conservation in building/facility 69.6 41.3 4 29
5)Installation of accessories/dual flush toilet/wireless urinals in
building/facility 78.3 27.9 2 18
6)Prevention of water wastage/losses via leakages in the
building/facility 81.2 24.5 1 14
7)Achieving DEFRA standard 2007/use of 125 litres of
water/head/day in building/facility 68.2 40.2 5 30
8)Educational awareness drive towards sustainable water usage
in building/facility 77.3 36.9 3 20
9)Building of On-site/Off-site (sewage) effluent plant in
building/facility 67.7 46.3 6.5 32

Bassey B. Okon Building Services Infrastructure Characteristics, Study Phases I - IV
117
This category includes nine factors, as indicated in Table 4.2. Seven of these factors
achieved severity indices within the range 60–81%. Some of these factors are: (a) the
use of efficient water fixtures (sensor flow taps), (b) the installation of automatic shut-
off faucets for water conservation, (c) the educational awareness drive on the
sustainable water usage, and, (d) the prevention of water wastage. This shows these
variables have higher degrees of influence and they are considered to be of top priority
in water resources management delivery. The category maintained a coefficient of
variation between 24% and 46% which is relatively low, signifying a strong level of
agreement between respondents.
Two factors recorded a coefficient of variation of 46%. These are: (a) the use of grey
water concept, and (b) the provision of an effluent treatment plant. This indicates that
these factors are less important among others. Moreover, in the category ranking they
are 1st–9th. Hence, a good level of concordance is revealed from the respondents‟
perspective. However, the overall ranking category contains the top two of the 10
factors, these being: (a) the prevention of water wastages/losses through leakages, and
(b) installation of accessories and dual flush toilet and wireless urinals. These results
demonstrate that priority should be given to these factors in the quest for sustainability
and improved services delivery in the infrastructure systems (Table 4.2).
4.3.3 Maintenance management practices
The statistics from the maintenance management practices in study phase I, appear
in Table 4.3.
Table 4.3: Maintenance management practices
FACTORS SI COV CR OR
1)Employment of technical /skilful expertise 82.7 26.3 4 12
2)Adoption of team working approach 89.5 23.3 1 3
3)Adoption of innovative driven concepts 73.6 35.3 6 25
4)Predictive maintenance practice 82.6 26.9 5 13
5)Preventive maintenance practice 88.9 19.1 2 4
6)Corrective maintenance practice 86.1 25.8 3 8
7)Maintain as-we-go philosophy 57.6 47.9 7 34

Bassey B. Okon Building Services Infrastructure Characteristics, Study Phases I - IV
118
The questionnaire consists of seven factors as shown in Table 4.3. In this category,
six factors achieved severity indices ranging between 73% and 89%, thereby revealing a
relatively high degree of influence from these factors on the maintenance management
practices. The other factor, (a) the maintain-as-we-go philosophy, gained a severity
index of 57%. There are indications from the respondents that this factor is insignificant
and should be discarded during planning and policy implementation. In this category,
the coefficient of variation for the six most influential factors ranged between 19% and
35%. These coefficients of variation are relatively low and indicate a strong agreement
level between respondents in their ranking. Hence, it could be adduced these factors are
crucial in enabling proper maintenance practices in all factors except for the maintain-
as-we-go approach.
At the top of the category ranking is: the adoption of a team working approach in
addressing the maintenance culture. This demonstrates a strong agreement amongst the
respondents on the influence of this factor. Furthermore, the preventive, and the
corrective maintenance factors were ranked 2nd and 3rd respectively, whereas the other
factors in this category were considered more subjective and less influential. The top
overall ranked factor in this group (see Table 4.3) still remains (d) the team working
approach in addressing infrastructure management systems. The remaining factors
within this category do not obtain results that show them as having a strong degree of
influence. However, the entire results are consistent throughout the scale of
examination.
4.3.4 Infrastructure design characteristics
In this thesis, data obtained from the infrastructure design characteristics in study
phase I are presented in Table 4.4.
Table 4.4: Infrastructure design characteristics
FACTORS SI COV CR OR
1)Design/drawings/envelope/specification 74.6 37.1 4 24
2)Feasibility of the design framework 75.8 36.4 3 22
3)Variation orders/cost/interference 69.8 36.7 6 28
4)Design quality/specification 80.0 36.8 2 15
5)Inspection/testing/approval/commissioning 83.3 29.6 1 10
6)Infrastructure/design/planning 73.3 37.1 5 25

Bassey B. Okon Building Services Infrastructure Characteristics, Study Phases I - IV
119
The category has six factors as shown in Table 4.4. Two of these factors attained
severity indices between 80% and 83%, these being: (a) the design/quality/specification
and, (b) the inspection/testing/approval/commissioning. This outcome reveals the high
degree of influence held by these variables in respect of the decision-making concerning
the infrastructure design characteristics. Moreover, the severity indices of the other four
remaining factors are between 69% and 75%, showing that their levels of influence are
also strong in this respect. However, their perceived importance from the respondents‟
perspective should not be ignored, and in this connection, the coefficients of variation
range from 29–37%, meaning that the effects of these factors are low in the pursuit of
infrastructure systems design, as seen in the overall ranking.
The implication of an infrastructure design that has appropriate characteristics is that
it enhances effective service delivery, and the just-in-time maintenance culture. In the
category ranking, the top ranked factor within the group was: the inspection/testing and
commissioning, and the second top ranked factor was: the design quality/specification
and feasibility of the design framework (see Table 4.4). Clearly, these two factors are
accorded high importance in building services infrastructure systems. In the overall
ranking, this category generally came low since the factors included are considered to
be expensive, time-consuming, and harder to implement in building projects.
4.3.5 Infrastructure project characteristics
The results from the infrastructure project characteristics in phase study I are
presented in Table 4.5.
Table 4.5: Infrastructure project characteristics
FACTORS SI COV CR OR
1)Type of building/facility /industrial/residential/
commercial/ offices 76.2 34.3 5 21
2)Size of building/facility area 74.2 33.8 7 25
3)Height/number of stories 71.4 39.8 9 27
4)Complexity of building/facility 77.8 31.3 2.5 19
5)Structure type (steel, brick etc) 74.6 37.1 6 24
6)Construction method/technology 77.3 36.2 4 20
7)Accessibility to the building/facility 72.7 34.4 8 26
8)Intensity/complexity of the building/facility 77.8 34.1 2.5 19
9)Site topography/location 76.2 34.3 5 21
10)Quality of finishing 78.8 35.9 1 17

Bassey B. Okon Building Services Infrastructure Characteristics, Study Phases I - IV
120
Table 4.5 outlines ten factors, with severity indices ranging between 71% and 79%,
thereby revealing that more than 70% of all respondents strongly agreed with the need
to tackle all these factors. These are quite clearly perceived as having a substantial
degree of influence on infrastructure project characteristics in terms of time
management, materials, cost, and service delivery. However, in this category the
coefficients of variation of the entire range of factors is between 31% and 40%,
indicating that they have gained a very low level of influence within this context. The
category ranking ranges from 1st–9th, thereby showing a good level of concordance on
the influencing factors regarding the sustainable infrastructure projects characteristics.
The category ranking contains three of the top 10 factors ranked 1st–3rd.
These factors are: 1) the quality of finishing, 2) the complexity of building, and 3)
the intensity of the building/facility (Table 4.5). Hence, the respondents are in strong
agreement in their ranking of these factors. The overall ranking scale expresses more
concern on: the quality of finishing, the complexity of the building alongside, and the
intensity of the building/facility. The quality of finishing as highlighted by the
respondents promotes aesthetics in the engineering infrastructure projects delivery
systems. The other two overlapping results also play vital roles in the building
infrastructure systems domain.
4.3.6 External factors affecting sustainable infrastructure
management (SIM)
Survey information regarding the external factors affecting SIM in study phase I, is
presented in Table 4.6.
Table 4.6: External factors affecting SIM
FACTORS SI COV CR OR
1)Users‟ attitude towards the building/facility 84.9 26.4 4.5 9
2)Availability of safety equipment/fume extractors installation 88.9 21.7 3 5
3)Supply performance 84.9 26.4 4.5 9
4)Weather condition 75.4 33.3 6 23
5)Government policies (OHSAS, EMS) 84.9 26.4 4.5 9
6)Quality of equipment/installation 90.5 20.7 2 2
7)Sustainability of the building/facility 90.9 20.2 1 1

Bassey B. Okon Building Services Infrastructure Characteristics, Study Phases I - IV
121
The questions in this category referred to seven factors as indicated in Table 4.6.
This group demonstrates high severity indices ranging between 75% and 91%,
confirming that the degree of influence of these variables is extensive after the
commissioning, operation and maintenance of building infrastructure systems delivery.
The two topmost severity indices are over 90% score, these being 1) the quality of
equipment/installation, and 2) the sustainability of the building/facility. In addition, the
severity indices of the other remaining five factors are between 75% and 89%, meaning
their levels of influence are also very strong. Obviously, three of these factors have
severity indices of 85% overlapping each other.
The group include: (a) the users‟ attitude towards the building; (b) the supply
performance; and (c) the implementation of government policies. This signifies a strong
correlation between the degree of their influence on building infrastructure systems
from the respondents‟ viewpoints. In the coefficient of variation ranking, the top ranked
factors are: 1) the weather conditions; 2) the users‟ attitude towards the building; and, 3)
the supply performance. The implementation of government policies has also made this
list. Similarly, this group category ranking is from 1st–6th. Apart from: the
sustainability of the building, and the quality of equipment and installation factors,
which are ranked 1st and 2
nd respectively, three other characteristics have corresponding
rankings as shown in Table 4.6. These outcomes indicate a strong degree of
concordance and the fact that these factors have significant impacts.
Furthermore, on the overall ranking list within this category, first is the sustainability
of the building, and second is the quality of equipment and installation factors. Three
other factors have overlapping results within the ranking of 9th as shown in Table 4.6.
This demonstrates their significant impacts upon the standard practices and safety of the
building services infrastructure system. The entire results emerge from the respondents‟
perceptions of the infrastructure system management success.
4.4 Constraints in study phase I
Certain factors affected the data acquisition process during the research as follows:

Bassey B. Okon Building Services Infrastructure Characteristics, Study Phases I - IV
122
Difficulties in gaining access to some offices and members of staff for audience
and subsequent administration of the survey.
Delays from some respondents in completing and subsequently returning the
questionnaire for data analysis and evaluation.
Administrative bureaucracies within organisations which posed difficulties in the
acquisition of data for evaluation.
Data disclosure and information brokering as a result of which some members of
staff expressed fear of divulging the company‟s confidential information in the
process of completing the survey.
4.5 Conclusion to study phase I
The analysis indicates that 15 factors maintained severity indices ranging from 80–
90%, and that 36 factors sustained severity indices in the range 55–79%. This shows
that 15 factors are regarded as being highly relevant for improved, efficient and
sustainable infrastructure systems delivery. They include: (a) energy management
through good policy; (b) prevention of water/wastage/losses through leakages in the
building/facility; and (c) the preventive maintenance practices. The other remaining
factors gaining severity indices between 80–90% also count.
At the same time, 36 factors need to be improved upon to realise efficient
infrastructure management practices. The results further revealed the coefficient of
variation indices for 22 factors were 78–90% with: (a) the sustainability of the building
infrastructure characteristic factor being ranked first, and the second and third ranking
factors being: (b) the quality of equipment/installation, and (c) the availability of safety
equipment within the shopping malls, respectively. In the respondents‟ opinions, these
factors require more prioritisation if enhanced service delivery is to follow.
The category ranking in this phase of study emphasised those characteristics in each
group placed first and second, since these are very strongly rated in terms of their
necessity for building services and construction management success.
On the overall ranking scale, it is observed that the top priority was the sustainability
of the building infrastructure characteristic factor. The second priority was the quality of

Bassey B. Okon Building Services Infrastructure Characteristics, Study Phases I - IV
123
equipment/installation; and the third was the adoption of team working approach
factors. Therefore, the research suggests very strong agreement on the part of the
respondents regarding the high level of significance on these factors. At the same time,
the „maintain-as-we-go‟ philosophy achieved 47% indicating a good degree of
conformity on the negative impact of this factor from the respondents‟ point of view.
The result further signifies a strong correlation on the identifiable and outstanding
factors in the building services infrastructure decision-making and implementation
processes.
Generally, the result is akin to the views of Grigg (1988), and Hill and Bowen
(1997), although there are substantial indications of this position from the results on the
implementation of government policies on the sustainability programme, preventive
maintenance practices, technical/skilful expertise, and the building infrastructure users‟
attitude. Moreover, the design quality/specification, supply performance and prudent
resources management need a more pragmatic approach to guarantee optimum services
delivery within this context.
4.6 Study Phase II: Building construction companies (BCC)
4.6.1 Presenting the phase of study
The research also investigated the building construction sector and identified five
major construction/engineering/design companies within the UK involved in sustainable
construction projects. These companies are front line practitioners regarding sustainable
construction and development. They are: Laing O‟ Rourke Group, Atkins Global,
MWH, BDP and BAM Company. A brief description of these companies is presented
together with the results of the surveys administered within them.
(I) Laing O‟Rourke construction group is the largest privately owned construction firm
in the UK and was established in 2001. The company‟s offices are located in various
countries which include Germany, India, Australia, United Arab Emirates, and the UK
and it has over 31,000 employees worldwide. The organisation uses an integrated

Bassey B. Okon Building Services Infrastructure Characteristics, Study Phases I - IV
124
method of delivery with capabilities across all elements of the projects life cycle within
the built and infrastructure environment.
The company‟s projects expertise extends to feasibility studies, to development
options, and investment opportunities. Additionally, it is expert in technical fields, for
example in delivering excellent design, engineering, innovative construction, and
manufacturing of products. Moreover, activities such as testing, commissioning,
handing over, operations, maintenance, and decommissioning of the sustainable
infrastructure services, are also undertaken by the company. Through self-delivery
capabilities, the Laing O‟Rourke group is able to deliver a broad range of services that
drive out waste, mitigate risk management, and allow for the integration of efficient and
effective project resources, thereby increasing productivity (Laing O‟Rourke, 2012).
(II) Atkins Global is the UK‟s largest engineering and design consultancy and the
world‟s 11th largest design firm. The organisation possesses a depth and breadth of
expertise to respond to the most technically challenging and time-critical infrastructure
projects. Moreover, the urgent transition to a low-carbon economy is a specific area of
focus with the company‟s policy. Issues regarding construction, from the concept for a
new skyscraper, upgrading of infrastructure, modelling of a water system, improvement
of a management process, and many more are undertaken by the organisation. Its
capabilities span planning, designing, construction, and building, and enable solutions
within the built environment (Atkinsglobal, 2012).
(III) The MWH global organisation is driving the wet infrastructure sector globally, and
is leading the world in results-oriented management, technical engineering and
construction services to build a better world. The wet infrastructure sector encompasses
a variety of water-related projects and programmes ranging from water supply,
treatment and storage, to water resources management, and coastal restoration. The
company embarks on the design and construction of hydropower and renewable energy
facilities to full environmental services.
Furthermore, it recognises wet infrastructure covers a broader range than simply
water. Therefore, global mega trends including climate change, scarcity of resources,
aging infrastructure and technical innovation are all tied to the firm‟s efforts in

Bassey B. Okon Building Services Infrastructure Characteristics, Study Phases I - IV
125
providing sustainable solutions that reflect the best practices in wet infrastructure
knowledge, experience and innovation (MHW, 2012).
(IV) BDP is the largest interdisciplinary practice of architects, designers, engineers and
urbanists in Europe. The organisation was founded in 1961 and currently employs more
than 1,000 architects, designers, engineers, urbanists, sustainability experts, lighting
designers, and acoustics specialists in 16 studios across the UK, France,
Ireland, Netherlands, and United Arab Emirates. The firm works closely with users,
clients and the community to create special places for living, working, shopping, culture
and learning across Europe, Africa, Asia, and Australia.
BDP has a leading track record in all major sectors including health, education,
workplace, retail, urbanism, heritage, housing, transport and leisure. The organisation
combines expertise across disciplines, locations, sectors and all major building types to
deliver a truly integrated way of working, resulting in high quality, effective and
inspiring built spaces. In addition, BDP Company has won numerous accolades
including sustainable designer and consultant of the year in the 2008 Sustainable
Building Awards. The firm‟s delivery of a holistic sustainable design remains its
topmost design philosophy within the built environment (BDP, 2012).
(V) The Royal BAM Group has been a European construction enterprise since 1847.
The organisation‟s expertise provides a seamless service in construction, property
development, design, engineering, facilities management and plant hiring services.
Moreover, BAM Company has a large network of offices covering England, Scotland
and Wales, and projects in the education, retail, mixed-use development, health, office,
leisure, and the law and order sectors. The Company has a strong commitment to
collaboration and offers unique benefits of health and safety, sustainability, innovation
and end users‟ satisfaction legacy for future generations (Royal BAM Group, 2012).
4.6.2 Goal and scope definition
As the main aim of the study is to examine and value five building construction
companies within the UK (Section 4.2.2), with a specific focus on the design and

Bassey B. Okon Building Services Infrastructure Characteristics, Study Phases I - IV
126
construction stages of the building infrastructure, the scope of this dimension of the
empirical work concerns the infrastructure services performance. That is to say, water,
energy, heating, quality of equipment installation, and the maintenance culture in all
these areas were considered in the study. Additionally, the characteristics leading to
effective services delivery and the sustainability of the infrastructure over its life cycle
were evaluated.
4.7 Results and discussion in study phase II
4.7.1 Energy resources management characteristics
The findings from the energy resources management characteristics in phase II are
presented in Table 4.7.
Table 4.7: Energy resources management characteristics
FACTORS SI COV CR OR
1)Use of efficient and energy saving fixtures 96.5 21.4 3 6
2)Use of modern technological (energy) concepts 98.4 20.1 1 1
3)Use of sensor based lighting systems for energy/ conservation
in building/facility 96.4 22.8 4.5 7
4)Use of the renewable energy source in building/facility 94.7 26.1 7.5 14
5)Use of HVAC for energy efficiency/ conservation 92.4 28.9 11 24
6)Employment of solar panels/photovoltaic technology 95.4 33.4 6 13
7)Installation of modern energy saving accessories in building
facility 94.7 25.6 7.5 14
8)Energy management via good operating efficiency in
buildings /facility 98.3 20.1 2 2
9)Energy management via good maintenance policy framework
in building/facility 92.6 28.4 10 22
10)Educational awareness drive on the sustainable energy usage
in building/facility 96.4 23.8 4.5 7
11)Application of building regulation Part L for energy
conservation in building/facility 92.9 26.5 9 21
It can be seen in Table 4.7, that 11 separate factors are identified, with severity
indices ranging between 92% and 98%. These factors can be appreciated as having
relatively high degrees of influence on building infrastructure management in terms of
the cost and service delivery. In fact, more than 92% of the respondents strongly agreed
that all the identified characteristics in the building construction industry had an impact
upon cost savings. Within this overall categorisation, coefficients of variation between

Bassey B. Okon Building Services Infrastructure Characteristics, Study Phases I - IV
127
20% and 33% were maintained, representing a relatively low percentage, and thereby
indicating a good level of concordance among respondents. The category ranking
suggests strong agreement on the use of modern energy concepts and management
factors, and very low agreement on the employment of HVAC.
However, their overall rankings are 1st–24th. There are exceptions of three variables
perceived by most respondents as not being highly significant in this investigation. They
include: (a) the building regulation Part L for energy conservation in the
building/facility; (b) the energy management through good maintenance policy/policy
framework; and (c) the application of HVAC for energy efficiency/conservation within
the building/facility. The other remaining factors in the study are rather significant in
this perspective as demonstrated in Table 4.7.
4.7.2 Water resources management characteristics
Data collected from the water resources management characteristics in study phase II
are presented in Table 4.8.
Table 4.8: Water resources management characteristics
FACTORS SI COV CR OR
1)Use of efficient water fixtures, sensor flow taps 92.8 28.7 3.5 22
2)Use of modern technological concepts; water recycling
practice in building/facility 98.2 22.8 1 4
3)Use of water conservation techniques; grey water in
building/facility 92.8 28.7 3.5 22
4)Installation of automatic shut-off faucets for water
conservation in building/facility 81.9 38.2 6 35
5)Installation of accessories/dual flush toilet/wireless urinals in
building/facility 92.8 28.7 3.5 22
6)Prevention of water wastage/losses via leakages in the
building/facility 90.9 30.5 5 27
7)Achieving DEFRA standard 2007/use of 125 litres of
water/head/day in building/facility 79.1 38.1 7 36
8)Educational awareness drive towards sustainable water usage
in building/facility 96.3 25.1 2 9
9)Building of On-site/Off-site (sewage) effluent plant in
building/facility 75.6 39.5 8 38
This category includes nine factors as shown in Table 4.8. Six of these factors
achieved severity indices within the range 90–98%. Included in these factors are: (a) the
prevention of water wastage/losses through leakages; (b) the use of energy saving

Bassey B. Okon Building Services Infrastructure Characteristics, Study Phases I - IV
128
fixtures (sensor flow taps); and (c) the grey water techniques. This demonstrates these
variables have higher degrees of influence and are considered to be of top priority in
water resources management delivery. Moreover, the other remaining three factors have
severity indices ranging from 75–81%. Among these characteristics are: (a) the DEFRA
standard 2007, and (b) the provision of effluent treatment plant.
The list also contains: (c) the installation of automatic shut-off faucets within the
building/facility. The group has coefficients of variation between 22% and 39%, which
are relatively low, signifying a strong agreement level between respondents. Four
factors were recorded with the coefficient of variation ranked 30–39%, indicating these
factors are of less importance. They are: (a) the DEFRA standard 2007, (b) the
provision of effluent treatment plant, (c) the installation of automatic shut-off faucets,
and (d) the prevention of water wastage/losses through leakages. Category ranking
ranges from 1st–8th with the use of water recycling technology leading, and the
educational awareness drives on the sustainability success coming next. The other
remaining factors in this class are shown in Table 4.8. These results indicate a good
level of concordance from the respondents‟ perspective regarding building construction
management goals.
The overall ranking category contains two of the top 10 factors. The top two ranked
factors within this group are: the water recycling concepts, and the educational
awareness drive on sustainable water usage in the building construction projects sites.
This result emphasises the significance of these factors in the search for sustainable
water management practice.
4.7.3 Maintenance management practices
Information gathered from the maintenance management practice characteristics
study in phase II is presented in Table 4.9, which shows seven factors. In this category,
five factors achieved severity indices ranging between 92% and 94%. Among these
factors are: (a) the innovative driven concepts, and (b) the team working approach
between the maintenance personnel. Furthermore, (c) the employment of
technical/skilful expertise, (d) the adoption of preventive maintenance, and (e) the
predictive maintenance culture are also listed. This indicates a relatively high degree of
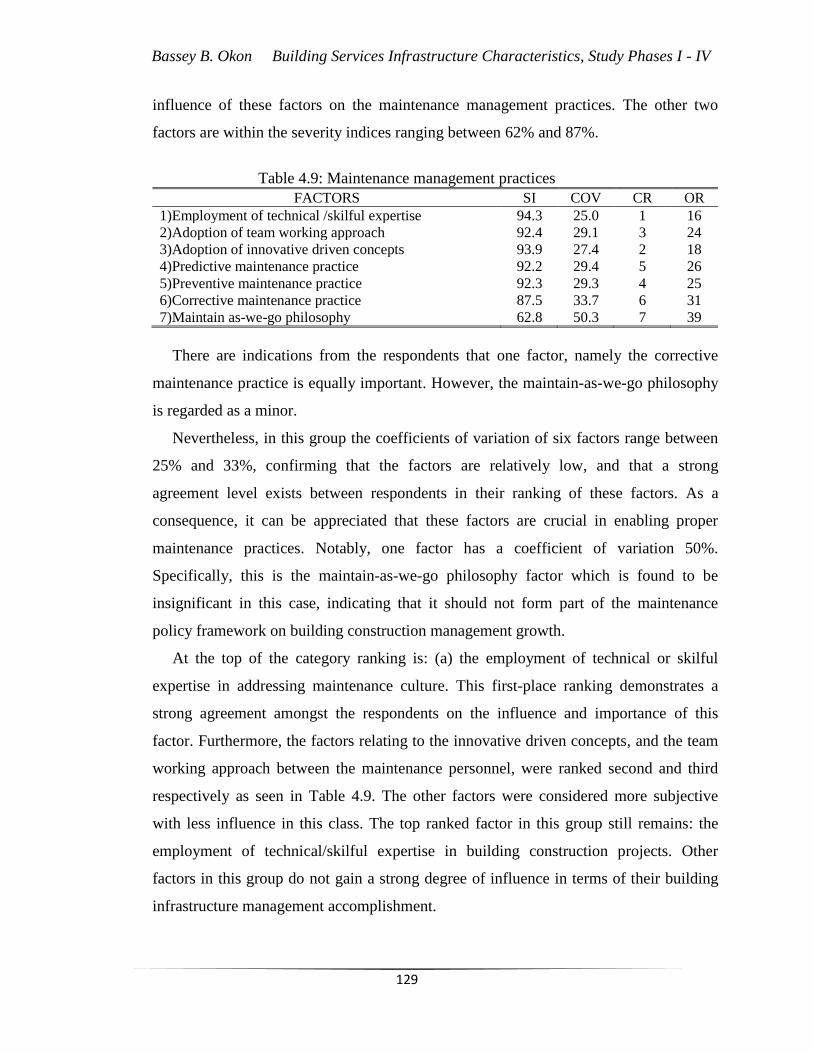
Bassey B. Okon Building Services Infrastructure Characteristics, Study Phases I - IV
129
influence of these factors on the maintenance management practices. The other two
factors are within the severity indices ranging between 62% and 87%.
Table 4.9: Maintenance management practices
FACTORS SI COV CR OR
1)Employment of technical /skilful expertise 94.3 25.0 1 16
2)Adoption of team working approach 92.4 29.1 3 24
3)Adoption of innovative driven concepts 93.9 27.4 2 18
4)Predictive maintenance practice 92.2 29.4 5 26
5)Preventive maintenance practice 92.3 29.3 4 25
6)Corrective maintenance practice 87.5 33.7 6 31
7)Maintain as-we-go philosophy 62.8 50.3 7 39
There are indications from the respondents that one factor, namely the corrective
maintenance practice is equally important. However, the maintain-as-we-go philosophy
is regarded as a minor.
Nevertheless, in this group the coefficients of variation of six factors range between
25% and 33%, confirming that the factors are relatively low, and that a strong
agreement level exists between respondents in their ranking of these factors. As a
consequence, it can be appreciated that these factors are crucial in enabling proper
maintenance practices. Notably, one factor has a coefficient of variation 50%.
Specifically, this is the maintain-as-we-go philosophy factor which is found to be
insignificant in this case, indicating that it should not form part of the maintenance
policy framework on building construction management growth.
At the top of the category ranking is: (a) the employment of technical or skilful
expertise in addressing maintenance culture. This first-place ranking demonstrates a
strong agreement amongst the respondents on the influence and importance of this
factor. Furthermore, the factors relating to the innovative driven concepts, and the team
working approach between the maintenance personnel, were ranked second and third
respectively as seen in Table 4.9. The other factors were considered more subjective
with less influence in this class. The top ranked factor in this group still remains: the
employment of technical/skilful expertise in building construction projects. Other
factors in this group do not gain a strong degree of influence in terms of their building
infrastructure management accomplishment.

Bassey B. Okon Building Services Infrastructure Characteristics, Study Phases I - IV
130
4.7.4 Infrastructure design characteristics
Statistics from the infrastructure design characteristics in phase II are provided in
Table 4.10.
Table 4.10: Infrastructure design characteristics
FACTORS SI COV CR OR
1)Design/drawings/envelope/specification 98.2 18.2 1 3
2)Feasibility of the design framework 96.1 24.9 3 12
3)Variation orders/cost/interference 87.9 33.0 6 30
4)Design quality/specification 96.4 21.1 2 7
5)Inspection/testing/approval/commissioning 94.6 25.2 4 15
6)Infrastructure/design/planning 89.2 31.2 5 29
This category has six factors, Table 4.10. Four of these characteristics attained
severity indices between 94% and 98%. Among these factors are: (a) the inspection/
testing/approval/commissioning, (b) the design quality/specification, and (c) the
feasibility of the design framework. The group also includes: (d) the design/drawings
/envelope/specification in handling building infrastructure challenges. These variables
have a high degree of influence in the decision-making process in the building
infrastructure design stages. Moreover, the severity indices of the two other remaining
factors are in the range 87–89%. These factors are: (e) the variation
orders/cost/interference, and (f) the infrastructure/design/planning. Consequently, it can
be understood that their level of influence is equally very strong within this context.
However, according to the respondents‟ opinions, they should not be discarded. The
coefficient of variation is between 18% and 33% (Table 4.10), showing that the effects
of these factors are comparatively low. The implications are that in terms of
infrastructure design characteristics, they enhance effective building service delivery
and promote a just-in-time maintenance culture in respect of infrastructure systems
management.
In the category ranking, the top ranked factors include: the design/drawings envelope
and specification, and the design quality/specification, which were ranked first and
second respectively, and hence regarded as highly important. In the overall ranking
scale, three factors came top, which are: (a) the building infrastructure design/planning,
(b) the quality/specification, and, (c) the feasibility of the design framework.

Bassey B. Okon Building Services Infrastructure Characteristics, Study Phases I - IV
131
Accordingly, it can be seen that the remaining factors are considered to be expensive,
time-consuming and more difficult for implementation in the building construction
projects.
4.7.5 Infrastructure project characteristics
Data from the infrastructure project characteristics in study phase II are presented in
Table 4.11, from which it can be seen that ten factors are identified. The severity indices
range from 86–96%. Specifically, characteristics such as the construction
method/technology, and the complexity of the building/facility, represented the two top
identifiable factors in this group. Others such as: the intensity/complexity of the
building, the building type, and site topography, were also cited. Over 86% of all
respondents strongly agreed with the need to address these factors.
Table 4.11: Infrastructure project characteristics
FACTORS SI COV CR OR
1)Type of building/facility / industrial/ residential/
commercial/ offices 94.1 27.0 6 17
2)Size of building/facility area 92.6 28.9 5 23
3)Height/number of stories 86.7 34.9 9 33
4)Complexity of building/facility 96.2 34.2 2 10
5)Structure type (steel, brick etc) 86.3 24.4 10 34
6)Construction method/technology 96.3 35.1 1 8
7)Accessibility to the building/facility 90.9 24.6 7 28
8)Intensity/complexity of the building/facility 94.3 27.3 4 16
9)Site topography/location 94.6 26.4 3 15
10)Quality of finishing 87.0 34.1 8 32
Only three factors recorded severity indices ranging from 86–87%. They are: (a) the
structure type, (b) the height/number of storeys, and (c) the quality of finishing
characteristics. The results show these factors to have a relatively substantial degree of
influence on building services infrastructure projects quality in terms of time, materials
and costs.
In this category the range in the variation of the coefficients of all the factors is 24–
35% (Table 4.11). Hence, these factors can be understood to have an important impact
on the building construction industry. The categories are ranked from 1st-10
th thereby
indicating a good level of agreement on the factors influencing the sustainable building

Bassey B. Okon Building Services Infrastructure Characteristics, Study Phases I - IV
132
construction projects characteristics. The category ranking contains two of the top 10
factors ranked 1st and 2nd, these being: (a) the construction method/technology, and (b)
the complexity of the building/facility. The reason why the construction
method/technology achieved the top rank was because it serves costs, materials, and
wastage among others.
4.7.6 External factors affecting SIM
Statistics regarding the external factors affecting SIM in study phase II are shown in
Table 4.12, from which it can be seen that the questions in this group concerned seven
factors. This category demonstrates high severity indices ranging between 79% and
94%, indicating that the variables have a wide-ranging degree of influence after the
commissioning, operation (use), and maintenance of building infrastructure systems
delivery. The topmost severity index at 94% and ranked first is the sustainability of the
building/facility, while the second highest ranked in the category is users‟ attitude (see
Table 4.12).
Table 4.12: External factors affecting SIM
FACTORS SI COV CR OR
1)Users‟ attitude towards the building/facility 87.2 23.3 2 16
2)Availability of safety equipment/fume extractors installation 86.0 24.3 3 19
3)Supply performance 82.5 22.2 6 26
4)Weather condition 79.2 26.4 7 31
5)Government policies (OHSAS, EMS) 82.9 24.0 5 25
6)Quality of equipment/installation 85.2 13.3 4 22
7)Sustainability of the building/facility 94.4 19.4 1 2
The severity indices of the remaining five factors range between 79% and 86%, also
indicating that their levels of influence are relatively strong. Four of these factors have
severity indices overlapping each other. These factors include the supply performance,
and the implementation of government policies, signifying the respondents‟ perception
that they have a strong influence on the building construction industry.
In the coefficient of variation ranking, the top ranked factors are: (a) the weather, and
(b) the availability of safety equipment/fume extractors as shown in Table 4.12. Also
included is (c) the implementation of government policies. After the weather, the
sustainability of the building/facility factor is ranked first, with other factors gaining

Bassey B. Okon Building Services Infrastructure Characteristics, Study Phases I - IV
133
individual ranks of 2nd–7th indicating a strong degree of concordance, and their
significant impact within this group regarding the building services and construction
management.
On the overall ranking list the sustainability of the building/facility is ranked second.
The other factors are considered very prominent, but were perceived as less significant
in this study. Generally, the other remaining factors have less influence on the building
services and construction practices as shown in the study.
4.8 Constraints in study phase II
There were limiting factors affecting the data acquisition during the study, these
being:
Delays from some respondents in completing and subsequently returning the
survey for data analysis and evaluation.
Expression of lack of time in their work schedule for either holding interviews or
completion of the survey by the experts, technical directors, and stakeholders
within these organisations.
Administrative bureaucracies within the organisations posed difficulties in the
acquisition of the envisaged data for evaluation.
Some members of staff expressed fear of divulging the company‟s confidential
information in the process of completion of the questionnaire.
4.9 Conclusion to study phase II
The analysis of the results showcases 20 factors maintaining severity indices
between 93% and 98%. Nonetheless, 31 factors gained severity indices in the range 75–
92%. This indicates that 20 factors are perceived by the respondents as being relevant
for achieving improved, efficient, and sustainable building construction. Similarly, 31
factors are considered very important characteristics within this case study. Therefore,
the respondents‟ remarks are based on their degree of severity indices and at 75% and
over, these are high. Hence, their level of influence is significant for the building
construction industry and these factors should be promoted, with the once exception of

Bassey B. Okon Building Services Infrastructure Characteristics, Study Phases I - IV
134
the build/maintain as-we-go philosophy. The analysis further indicates the coefficients
of variation resulting in 36 factors being in the range of 17–30%. The remaining
characteristics gained 31–41% in this respect, signifying a strong degree of agreement
in the study on these factors.
Notably, the build/maintain as-we-go philosophy achieving 50% indicates a good
degree of concordance from the respondents‟ viewpoints, and remains an insignificant
factor in building construction practice. In the category ranking, five factors obtained
94–98%. Some factors have overlapping results within the highlighted range although
they were placed second. Interestingly, five factors were very exceptional, gaining a
category ranking of 98%. These are: (a) the quality of equipment/installation, (b) the
sustainability of the building and the design/drawings/envelope/specification, (c) the
water recycling technology, (d) energy management through good operating efficiency,
and (e) the use of modern technological energy concepts within the building
construction industry.
The overall ranking scale recorded: (a) the use of modern technological energy
concepts, and (b) the energy management through good operating efficiency. Moreover,
(c) the design/drawings/envelope/specification has been identified within the top scale
1st–3rd, while (d) the maintain as-we-go philosophy is found as the least in this class.
The research shows a very strong degree of conformity in the respondents‟ views
concerning the high level of significance of these factors in sustainable building
practices.
On this premise, this finding suggested that in recent times, the building construction
industry has been making a more progressive impact on the integration of the
sustainability model. Also, the utilisation and management of resources in this sector
incorporates synergies of new hi-tech measures towards sustainable building
construction success. This confirms the situation outlined in the literature, particularly
by Miyatake (1996), and Hill and Bowen (1997) on the need to adopt sustainability in
building construction projects for the present and future generations (WCED, 1987).

Bassey B. Okon Building Services Infrastructure Characteristics, Study Phases I - IV
135
4.10 Comparative analysis between O&M and BCC studies
The research illustrates (in Figures 4.2–4.6), the comparative analysis outcomes
between the commercial buildings - (O&M) infrastructure and the building construction
companies (BCC) in the UK. Additionally, the graphs of parameter rankings (%) against
the identified factors (-) are plotted to examine their level of significance in each case.
4.10.1 Severity indices analysis (SIA)
Severity indices results are shown in Figure 4.2. The O&M respondents‟ evaluation
is not strongly in favour of four characteristics, which scored 50–60%. These
characteristics are: (a) the employment of solar panel/photovoltaic technology, (b) the
water recycling practice application within the building/facility, (c) the use of grey
water technology, and (d) the maintain-as-we-go philosophy approach. On the 60–70%
benchmarks, the O&M respondents identified six factors, which are: (a) the use of
renewable energy source in the building, (b) the use of efficient water fixtures; sensor
flow tap, (c) the installation of automatic shut-off faucets for water conservation, (d)
the use of DEFRA standard 2007, (e) the provision of effluent treatment plant, and (f)
the variation orders/cost/interference at the execution stages of the building/facility. On
the other hand, the BCC respondents‟ rated one factor within this scale, which being the
maintain-as-we-go philosophy approach, in handling building infrastructure challenges.
There are strong indications from the respondents‟ perception that the factors in the 60–
70% band have a significant impact in this matter.
The severity index ranking information on the 70–80% score shows the O&M and
BCC have achieved 23 and four factors respectively. This result from the O&M is
accounted for by: (a) the use of sensor-based lighting systems, and (b) the use of HVAC
for energy efficiency and conservation within the buildings. Also in this class, and
among other factors are: (c) the installation of modern energy saving accessories, (d) the
use of innovative driven concepts, and the (e) complexity of the building/facility.
Similarly, factors identified in the BCC scenario include: (a) the use of DEFRA
standard 2007 for water management, (b) the provision of effluent treatment plant, and
(c) the weather condition. Accordingly, a strong degree of influence is noticed within

Bassey B. Okon Building Services Infrastructure Characteristics, Study Phases I - IV
136
these factors in concordance with the respondents‟ views towards the services delivery
in building infrastructure systems as shown in Figure 4.2.
Certainly, the O&M and BCC respondents have ranked 18 and 45 factors
respectively with the sustainability index scale 80–90% above. On this basis, some of
the characteristics appearing from both result trends are: (a) the use of efficient and
energy saving fixtures within the building/facility, (b) the prevention of water
wastages/losses through leakages in building/facility, and (c) the adoption of preventive
maintenance culture.
Figure 4.2: Relationship between factors and severity indices ranking
Other factors are (d) the design quality/specification, (e) the implementation of
government polices (OHSAS, EMS), and (f) the quality of equipment and installation.
The other remaining factors in this group are highly rated and are crucial to this
research.
4.10.2 Coefficient of variation (COV) analysis
The result in this phase of the study (Figure 4.3) demonstrates that the O&M and
BCC respondents ranked the COV factor as COV 10–20% respectively. However, the
O&M respondents proposed four characterises as: (a) the application of energy
management through good operating efficiency, (b) the maintenance policy framework,

Bassey B. Okon Building Services Infrastructure Characteristics, Study Phases I - IV
137
(c) the use of efficient and energy saving fixtures, and (d) the preventive maintenance
culture. These were considered to be the best practices to lead to the achievement of
sustainability goals. The BCC respondents identified factors such as: (a) the proper
design/drawing/envelope/specification, and (b) the sustainability of the building
/facility. This indicates that the characteristics with lower COV strongly encourage
sustainability principles in the building infrastructure services delivery as depicted in
Figure 4.3.
Figure 4.3: Relationship between factors and COV ranking
The COV analysis further expresses the O&M and BCC opinions, achieved 18 and
35 factors with 20–30% marks respectively. Some of the characteristics identified by
the O&M respondents are: (a) the use of sensor-based lighting systems for
energy/conservation in the building facility (as shown in Figure 4.3), (b) the installation
of accessories/dual flush toilet/wireless urinals in building/facility, (c) the corrective
maintenance practice, (d) the users‟ attitude towards the building/facility, and (e) the
quality of equipment installation among others. BCC respondents have likewise noted
some factors to include: (a) the use of efficient and energy saving fixtures, (b) the
prevention of water wastages/losses through leakages in building/facility, (c) the
employment of technical/skilful expertise, (d) the accessibility of the building/facility,
and (e) the supply performance of the installed equipment. These outcomes express the

Bassey B. Okon Building Services Infrastructure Characteristics, Study Phases I - IV
138
level of consciousness of the respondents from both scenarios regarding the importance
of sustainability success relative to building infrastructure systems goals.
In the COV scale of 30–40%, the O&M and BCC have achieved 20 and 11 factors
The O&M respondents indicated characteristics such as: (a) the use of HVAC for
energy efficiency/conservation, (b) the educational awareness drive on the sustainable
water usage in building/facility, (c) the adoption of innovative driven concepts, (d) the
construction method, and (e) the weather condition among others factors in this group.
Further analysis shows the BCC respondents indicated characteristics to include: (a) the
employment of solar panels/photovoltaic technology, (b) the use of DEFRA standard
2007 for water management, (c) the implementation of corrective maintenance practice,
(d) the construction method, and (e) the complexity of building/facility, as shown in
Figure 4.3.
There are strong perceptions from the respondents‟ viewpoints that factors within
this benchmark are very significant and the scores are quite reasonable. The COV
statistics at 40–50% grades indicate that the O&M and BCC have gained eight and two
characteristics respectively. The O&M identifiable factors in this case are: (a) the
employment of solar panels/photovoltaic technology, (b) the use of water conservation
techniques; grey water in building/facility, (c) the provision of effluent treatment plant,
(d) the maintain-as-we-go philosophy, and (d) the grey water conservation technique.
BCC respondents have maintained characteristics such as: (a) the maintain-as-we-go
philosophy approach, and (b) the weather condition, but these are not encouraged as
such. Hence, these factors are either moderately or less significant to the study as
illustrated in Figure 4.3.
4.10.3 Category ranking (CR) analysis
In the category ranking evaluation, the O&M respondents produced four factors with
a score of 50% as shown in Figure 4.4. These include: (a) the employment of solar
panels/photovoltaic technology, (b) the grey water conservation technique, (c) the use of
modern technological concepts, water recycling practice in the building/facility, and (d)
the maintain-as-we-go philosophy approach. The statistics on the 60% ranking indicate

Bassey B. Okon Building Services Infrastructure Characteristics, Study Phases I - IV
139
that the O&M respondents have achieved six characteristics, which are: (a) the use of
renewable energy sources in the building/facility, (b) the use of efficient water fixtures
and sensor flow taps, (c) the installation of automatic shut-off faucets for water
conservation in building/facility, (d) the provision of effluent treatment plant, (e) the
variation orders/cost/interference, and (f) the use of DEFRA standard 2007 for water
management also made this list. However, the BCC respondents only scored one factor
in this category, which was the maintain-as-we-go philosophy approach in the execution
of building infrastructure. Nonetheless, the result established a very good correlation
between the two scores of the different experts in assessing these characteristics as
shown in Figure 4.4.
Figure 4.4: Relationship between factors and CR
The O&M respondents were leading on the 70% benchmark with 21 factors. The
characteristics among these include: (a) the installation of modern energy saving
accessories, (b) the installation of accessories/dual flush toilet/wireless urinals in
building /facility, (c) the adoption of innovative driven concepts, (d) the type of
building/facility, and (e) the feasibility of the design framework. Similarly, the BCC
respondents identified: (a) the use of DEFRA standard 2007 for water management, (b)
the provision of effluent treatment plant, and (c) the weather condition, as

Bassey B. Okon Building Services Infrastructure Characteristics, Study Phases I - IV
140
characteristics within the 70% grade. These results confirm that according to the
appraisals of both types of expert, these factors are crucial.
The analysis in Figure 4.4 further explains that the O&M respondents gained 18
factors on the 80% score. Some of these factors are: (a) the use of modern technological
(energy) concepts, (b) the prevention of water wastages/losses via leakages in building
/facility, (c) the adoption of predictive maintenance practice, (d) the design
quality/specification, and (e) the provision of safety equipment in the building/facility.
The BCC respondents achieved eight characteristics. Among these are: (a) the
installation of automatic shut-off faucets for water conservation in the building/facility,
(b) the application of corrective maintenance practice, (c) the variation
orders/cost/interference, (d) the structure type, and (e) the availability of safety
equipment in the building/facility. This result explains the level of significance between
these factors and their role within the building services infrastructure and building
construction field.
On the 90% scale, the O&M and BCC respondents have two and 38 characteristics
respectively. From the O&M perspective, these factors are: (a) the quality of
equipment/installation and, (b) the sustainability of the building. From the BCC
viewpoint, the factors include: (a) the use of HVAC for energy efficiency/conservation,
(b) the educational awareness drive on the sustainable water usage in the
building/facility, (c) the adoption of innovative driven concepts, (d) the construction
method, and (e) the installation/design quality/ specification. Accordingly, a strong
degree of influence is noticed within these factors in concordance with the views of the
respondents from both scenarios. These results further reveal a very high correlation
between the scores of the two types of professional in respect of their level of awareness
of sustainability concepts. The application of these concepts and the quality of
equipment installed with a view towards improving service delivery within the
infrastructure systems is explained in Figure 4.4.
4.10.4 Overall ranking (OR) analysis
An examination of the overall ranking was conducted in order to gain a comparison
of outcomes from the O&M and BCC companies. In this evaluation, the correlations
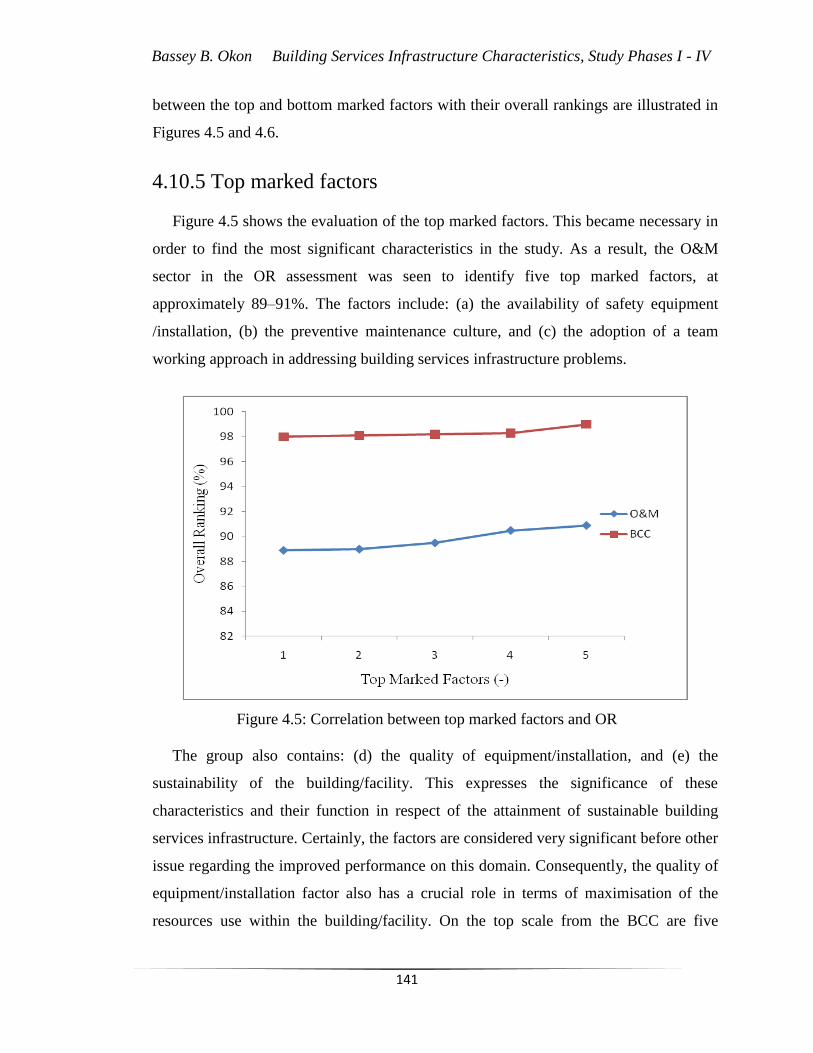
Bassey B. Okon Building Services Infrastructure Characteristics, Study Phases I - IV
141
between the top and bottom marked factors with their overall rankings are illustrated in
Figures 4.5 and 4.6.
4.10.5 Top marked factors
Figure 4.5 shows the evaluation of the top marked factors. This became necessary in
order to find the most significant characteristics in the study. As a result, the O&M
sector in the OR assessment was seen to identify five top marked factors, at
approximately 89–91%. The factors include: (a) the availability of safety equipment
/installation, (b) the preventive maintenance culture, and (c) the adoption of a team
working approach in addressing building services infrastructure problems.
Figure 4.5: Correlation between top marked factors and OR
The group also contains: (d) the quality of equipment/installation, and (e) the
sustainability of the building/facility. This expresses the significance of these
characteristics and their function in respect of the attainment of sustainable building
services infrastructure. Certainly, the factors are considered very significant before other
issue regarding the improved performance on this domain. Consequently, the quality of
equipment/installation factor also has a crucial role in terms of maximisation of the
resources use within the building/facility. On the top scale from the BCC are five

Bassey B. Okon Building Services Infrastructure Characteristics, Study Phases I - IV
142
characteristics scoring 98–99%. They include: (a) the use of modern technology energy
concepts; (b) the energy management through good operating efficiency in
building/facility (Figure 4.5); (c) the design/drawings/envelope/specification; (d) the
quality of equipment/installation; and (e) the sustainability of the building/facility. The
outcomes again emphasised the significance of these characteristics when trying to
provide for quality equipment installation in the building/facility. With these features in
place, sustainable building services infrastructure delivery can be achieved.
4.10.6 Bottom Marked Factors
The bottom marked factors are depicted in Figure 4.6, from which it is seen that the
O&M placed five factors with scores of 67–56% at the bottom. They are: (a) the
provision of an effluent treatment plant; (b) the use of efficient water fixtures (the
sensor flow taps factor gained overlapping results); (c) the application of the grey water
technology; (d) the maintain-as-we-go philosophy approach; and (d) the employment of
solar panels/photovoltaic technology in the building/facility. The BCC respondents
identified five characteristics with 82–63% as the bottom scores. These factors are: (a)
the installation of automatic shut-off faucets for water conservation in building/facility;
(b) the use of DEFRA standard 2007 for water management; (c) the weather condition;
(d) the provision of effluent treatment plant; and (e) the maintain-as-we-go philosophy
approach.
This result demonstrates an overlapping interest between these factors and their level
of significance within the building services infrastructure management. In these two
sectors, the O&M and BCC experts perceived that these characteristics are either
moderately or less significant to the study. The result further identifies that the
build/maintain as-we-go philosophy approach in both cases is unacceptable and should
be totally avoided if sustainability success is to be achieved (Figure 4.6).

Bassey B. Okon Building Services Infrastructure Characteristics, Study Phases I - IV
143
Figure 4.6: Correlation between bottom marked factors and OR.
Notwithstanding, this result is reasonable expressing a very strong degree of
agreement between these factors in comparative terms. Also, sustainability is
increasingly becoming the watchword for building services infrastructure delivery
within building/facilities at large. On this basis, it could be concluded that the research
methodology is capable of validating the two phases of the study. This discovery is akin
to the views expressed by Hill and Bowen (1997), and Grigg (1988).
4.11 Validating the two phases of study using the SEI model
In validating the two phases of study, the SEI model was applied to determine the
level of building infrastructure management performance within these companies. This
implies that for the sustainability goals of building services infrastructure systems to be
achieved relevant indices must be met. These indices and values of sustainability must
be defined and modelled as a set of integrated systems parameters. Hence, the
sustainability engineering stand-point should promote rigorous interaction to achieve a
balance amongst the components on the triple bottom line of sustainable development.
The SEI model also concentrates on, and normalises sustainability to be within
ranges of 0 ≤ Suv ≤ 1 by applying the probability (P) theory concept. Thus, accurate and
reliable indices of sustainability can be qualified and quantified. On this basis, an ideal

Bassey B. Okon Building Services Infrastructure Characteristics, Study Phases I - IV
144
project will have the Suv value of 1, although, this is found to be impracticable in the
real engineering infrastructure systems context as presented in Section 3.7.3 of this
thesis. Hence, for the O&M sector, the probability function of 5/6, 4/5 and 6/7 from the
economic, environmental and social values respectively give a Suv factor of 0.54 as the
sustainability index result. From the BCC sector, the probability function of 8/9, 6/7 and
7/8 from the economic, environmental and social values correspondingly give a Suv
factor of 0.70 as the sustainability index result.
The study contributions from both the O&M and BCC sectors have presented results
that could be regarded as the acceptable sustainability indices for the building
infrastructure systems performance given the intervening factors of interest.
4.12 Study Phase III: ALSCON Company
4.12.1 Presenting the phase of study
The building services infrastructure characteristics were studied in the Aluminium
Smelting Company of Nigeria, ALSCON. The company is located in Ikot Abasi local
government area of Akwa Ibom State in Nigeria. ALSCON Company is the major
producer of aluminium metal ingots, which are consumed locally within Nigeria and
sent for export to other parts of the world. The study objectives related to the company‟s
maintenance, operation, project managers, and design engineers.
4.12.2 Goal and scope definition
The main goal of the study is to examine and value the building services
infrastructure in ALSCON in Nigeria (Section 4.2.2). The services relate to the
ALSCON smelting facility, water pumping station, harbour house, power station, and
production areas, among other buildings. The goals are specifically targeted at the
operations and maintenance stages of the building services infrastructure performance.
Water, energy, and the maintenance culture are some of the services addressed with
factors leading to effective services delivery and the sustainability of the infrastructure
over their life cycle also being appraised.

Bassey B. Okon Building Services Infrastructure Characteristics, Study Phases I - IV
145
4.12.3 Results and discussion in study Phase III
In this phase of the study, the results and discussion regarding ALSCON are
reported. Statistics from the energy resources management characteristics in study phase
III are shown in Table 4.13.
4.12.4 Energy resources management characteristics
Table 4.13 presents 11 factors, showing severity indices ranging from 69–91%. The
result shows that these factors have relatively weighty degrees of influence on the
building infrastructure systems in terms of costs and building services delivery. About
91% of the respondents strongly agreed with the use of modern technological energy
concepts as being crucial, and 87% believed that energy management via good
maintenance policy frameworks in buildings/facilities for cost savings is also very
significant.
Table 4.13: Energy resources management characteristics
FACTORS SI COV CR OR
1)Use of efficient and energy saving fixtures 85.7 19.5 3 20
2)Use of modern technological (energy) concepts 90.8 16.6 1 7
Use of sensor based lighting systems for energy/ conservation in
building/facility 82.9 22.4 6 25
3)Use of the renewable energy source in building/facility 76.7 33.0 8 37
4)Use of HVAC for energy efficiency/ conservation 70.5 35.9 9 39
5)Employment of solar panels/photovoltaic technology 70.1 34.1 10 40
6)Installation of modern energy saving accessories in building/
facility 78.3 28.2 7 33
7)Energy management via good operating efficiency in
buildings /facility 83.7 25.4 5 24
8)Energy management via good maintenance policy framework
in building/facility 87.4 20.6 2 15
9)Educational awareness drive on the sustainable energy usage
in building/facility 85.4 23.2 4 21
10)Application of building regulation Part L for energy
conservation in building/facility 69.0 38.0 11 41
The other remaining characteristics are, however, also important as the least index is
almost 70%. The class maintained coefficients of variation ranging between 16% and
38%, which are relatively low and reveal a good level of concordance between the
respondents. In this category ranking are 1st–11th. This indicates strong agreement on
Bassey B. Okon Building Services Infrastructure Characteristics, Study Phases I - IV
146
factors to include: (a) the use of modern technological energy concepts; (b) the energy
management via good maintenance policy framework in building/facility; (c) the use of
efficient and energy saving fixtures; (d) the application of building regulation part L for
energy conservation in building/facility (which was the least ranked among the entire
factors).
Although this standard is common practice within the UK and other parts of the
world, it is not very important in the Nigerian context. However, the overall rankings
are 7th–41st, with the use of modern technological energy concepts leading. Apart from
the use of efficient and energy saving fixtures, the other remaining factors are perceived
by most respondents as being moderately significant. The overall results are very
reliable based on the experts‟ perception of the investigated characteristics.
4.12.5 Water resources management characteristics
Statistics from the water management characteristics in study phase III are displayed
in Table 4.14. This category includes 10 factors, eight of which achieved severity
indices within the range 78–91%. This shows these variables have higher degrees of
influence and are considered to be of top priority in water resources management
delivery. One factor scored a severity index slightly below 70%, that is, (a) the use
DEFRA standard 2007 for water resource practice. Findings revealed the entire
characteristics are very highly rated from the respondents‟ feedback.
The category maintained coefficients of variation in the range 18–38% which are
relatively low, signifying a strong agreement level between the respondents. Three
factors also recorded the coefficient of variation 30–38%, these being: (a) the
installation of accessories/dual flush toilet/wireless urinals in building/facility; (b) the
use DEFRA standard 2007 for water resource practice; and (c) the educational
awareness drive towards sustainable water usage in building/facility. The indication is
that these factors are of importance to sustainable water resource management.
Moreover, the category rankings are 1st–10th. This points towards a good level of
concordance from the respondents standpoint, showing (a) the prevention of water
wastages/leakages being the top marked factor. However, (b) the use of DEFRA

Bassey B. Okon Building Services Infrastructure Characteristics, Study Phases I - IV
147
standard 2007 for water resource practice was classed as the bottom marked
characteristic.
Table 4.14: Water resources management characteristics
FACTORS SI COV CR OR
1)Use of efficient water fixtures, sensor flow taps 89.1 22.7 2 11
2)Use of modern technological concepts; water recycling
practice in building/facility 81.8 28.4 4 27
3)Use of water conservation techniques; grey water in
building/facility 78.0 29.6 7 35
4)Installation of automatic shut-off faucets for water
conservation in building/facility 84.6 25.1 3 23
5)Installation of accessories/dual flush toilet/wireless urinals in
building/facility 77.8 31.6 8 36
6)Prevention of water wastage/losses via leakages in the
building/facility 90.8 18.6 1 7
7)Achieving DEFRA standard 2007/use of 125 litres of
water/head/day in building/facility 68.5 38.5 10 42
8)Educational awareness drive towards sustainable water usage
in building/facility 79.2 31.2 6 31
9)Building of On-site/Off-site (sewage) effluent plant in
building/facility 81.0 29.0 5 30
The overall ranking category contains one of the top 10 factors - (a) the prevention of
water wastages/leakages, showing the belief that it represents a crucial factor in this
group. The other remaining characteristics are ranked to show a moderate influence
according to the respondents. The results suggest that priority should be given to these
factors in the quest for sustainability and improved services delivery within the building
infrastructure systems.
4.12.6 Maintenance management practices
Data received from the maintenance management practices in phase III is presented
in Table 4.15, which reveals seven factors, six of which achieved severity indices
ranging from 88–97% while one obtained only 68%. This presents the belief that a
relatively high degree of influence of these factors is brought to bear the maintenance
management practice.

Bassey B. Okon Building Services Infrastructure Characteristics, Study Phases I - IV
148
Table 4.15: Maintenance management practices
FACTORS SI COV CR OR
1)Employment of technical /skilful expertise 93.8 14.0 2 3
2)Adoption of team working approach 91.9 17.7 3 5
3)Adoption of innovative driven concepts 90.0 19.1 4 9
4)Predictive maintenance practice 84.6 28.4 6 23
5)Preventive maintenance practice 97.6 9.0 1 1
6)Corrective maintenance practice 88.9 19.7 5 12
7)Maintain as-we-go philosophy 68.4 33.9 7 43
The factor with the least severity index of 68% is the maintain as-we-go philosophy,
indicating the respondents perceived this to be insignificant. Indeed, there are
indications from the respondents that this factor should be discarded during the planning
and policy implementation. The coefficients of variation range of six of the factors are
9–34, confirming that the factors are relatively low, and pointing to strong agreement
between respondents in their ranking. Hence, these characteristics are essential in
facilitating proper maintenance practices (Table 4.15).
The category ranking list is as follows: (a) the preventive maintenance practice, (b)
the employment of technical/skilful expertise in addressing infrastructure systems, (c) the
adoption of a team working approach, (d) the implementation of innovative driven
concepts. All of these factors were considered as being effective in tackling infrastructure
challenges. The maintain as-we-go philosophy was rated least in this group, thus
confirming the earlier views of the respondents.
This outcome demonstrates a strong agreement amongst the respondents on the
influence and importance of the factors, with the maintain as-we-go philosophy being
further confirmed as being the least influential.
4.12.7 Infrastructure design characteristics
Data from the infrastructure design characteristics in study phase III are shown in
Table 4.16.
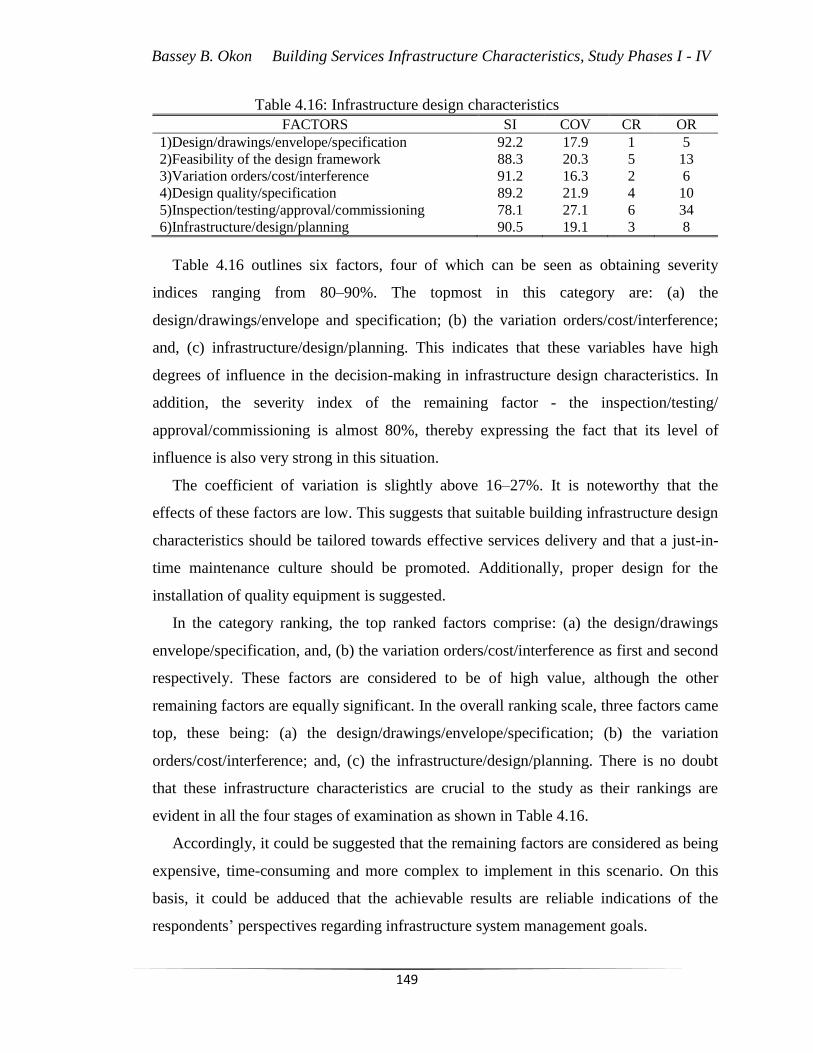
Bassey B. Okon Building Services Infrastructure Characteristics, Study Phases I - IV
149
Table 4.16: Infrastructure design characteristics
FACTORS SI COV CR OR
1)Design/drawings/envelope/specification 92.2 17.9 1 5
2)Feasibility of the design framework 88.3 20.3 5 13
3)Variation orders/cost/interference 91.2 16.3 2 6
4)Design quality/specification 89.2 21.9 4 10
5)Inspection/testing/approval/commissioning 78.1 27.1 6 34
6)Infrastructure/design/planning 90.5 19.1 3 8
Table 4.16 outlines six factors, four of which can be seen as obtaining severity
indices ranging from 80–90%. The topmost in this category are: (a) the
design/drawings/envelope and specification; (b) the variation orders/cost/interference;
and, (c) infrastructure/design/planning. This indicates that these variables have high
degrees of influence in the decision-making in infrastructure design characteristics. In
addition, the severity index of the remaining factor - the inspection/testing/
approval/commissioning is almost 80%, thereby expressing the fact that its level of
influence is also very strong in this situation.
The coefficient of variation is slightly above 16–27%. It is noteworthy that the
effects of these factors are low. This suggests that suitable building infrastructure design
characteristics should be tailored towards effective services delivery and that a just-in-
time maintenance culture should be promoted. Additionally, proper design for the
installation of quality equipment is suggested.
In the category ranking, the top ranked factors comprise: (a) the design/drawings
envelope/specification, and, (b) the variation orders/cost/interference as first and second
respectively. These factors are considered to be of high value, although the other
remaining factors are equally significant. In the overall ranking scale, three factors came
top, these being: (a) the design/drawings/envelope/specification; (b) the variation
orders/cost/interference; and, (c) the infrastructure/design/planning. There is no doubt
that these infrastructure characteristics are crucial to the study as their rankings are
evident in all the four stages of examination as shown in Table 4.16.
Accordingly, it could be suggested that the remaining factors are considered as being
expensive, time-consuming and more complex to implement in this scenario. On this
basis, it could be adduced that the achievable results are reliable indications of the
respondents‟ perspectives regarding infrastructure system management goals.

Bassey B. Okon Building Services Infrastructure Characteristics, Study Phases I - IV
150
4.12.8 Infrastructure project characteristics
The infrastructure project characteristics information in study phase III is illustrated
in Table 4.17, which indicates ten factors and their analysis. The severity indices range
is approximately 80–94%. Eight characteristics achieved very top marks and the top
three of these are: (a) the quality of finish; (b) the site topography/location; (c) the
structure type. Two factors obtained the bottom scores, these being the type of building,
and the height and number of storeys. That said, the respondents believed that all the
factors had a very strong influence in managing building services infrastructure project
activities.
Table 4.17: Infrastructure project characteristics
FACTORS SI COV CR OR
1)Type of building/facility / industrial/ residential/
commercial/ offices 78.8 29.2 9 32
2)Size of building/facility area 81.5 23.3 8 29
3)Height/number of stories 77.8 24.6 10 36
4)Complexity of building/facility 81.6 29.2 7 28
5)Structure type (steel, brick etc) 86.8 19.5 4 17
6)Construction method/technology 87.7 21.2 3 14
7)Accessibility to the building/facility 86.3 21.6 5.5 18
8)Intensity/complexity of the building/facility 86.3 24.1 5.5 18
9)Site topography/location 88.9 20.4 2 12
10)Quality of finishing 93.5 15.6 1 4
On the coefficient of variation appraisal, all the factors are in the range 16–29%,
showing that they all have an important impact on the building infrastructure systems
and construction generally. Two characteristics gained the topmost and similar
outcomes and were: (a) the height/number of storeys, and (b) the complexity of
building/facility. The quality of finish scored the least. These results demonstrate a
good level of concordance among respondents on the influencing factors in terms of the
sustainable building construction projects characteristics. The category ranking contains
four of the top 10 factors ranked 1st–4th. These factors are: (a) the quality of finish, (b)
the site topography/location, (c) the construction methods, and (d) the structure type
(Table 4.17). This again demonstrated the strong degree of agreement between the
respondents in their ranking of these factors. On the top of the overall ranking scale,
was the quality of finish, whereas the other remaining factors were not highly rated.

Bassey B. Okon Building Services Infrastructure Characteristics, Study Phases I - IV
151
These outcomes represent the experts‟ opinions regarding the building infrastructure
project characteristics implementation.
4.12.9 External factors affecting SIM
Information received concerning the external factors affecting SIM in phase III is
shown in Table 4.18.
Table 4.18: External factors affecting SIM
FACTORS SI COV CR OR
1)Users‟ attitude towards the building/facility 87.2 23.3 2 16
2)Availability of safety equipment/fume extractors installation 86.0 24.3 3 19
3)Supply performance 82.5 22.2 6 26
4)Weather condition 79.2 26.4 7 31
5)Government policies (OHSAS, EMS) 82.9 24.0 5 25
6)Quality of equipment/installation 85.2 13.3 4 22
7)Sustainability of the building/facility 94.4 19.4 1 2
The study in Table 4.18 presents seven characteristics, with severity indices in the
range of 80–94%. In this category: (a) the sustainability of the building/facility, and (b)
the users‟ attitude towards the building services infrastructure were perceived by most
respondents as being very significant. Also (c) the availability of safety equipment, and
(d) the quality of equipment/installation were rated highly. The indication is that these
factors are paramount in the building services infrastructure success. On the coefficient
of variation analysis, all results are in the range 13–26%.
Topmost in this group include: (a) weather condition, (b) the availability of safety
equipment, and (c) the implementation of government regulated polices. Accordingly,
the least scores went to the following factors: (a) the quality of equipment/installation,
and (b) the sustainability of the building/facility. This result is reasonable because the
respondents‟ accorded priority to these factors based on their experience on the
infrastructure management.
The category ranking reveals three factors at the top, these being: (a) the
sustainability of the building/facility; (b) the users‟ attitude towards the building; and (c)
the availability of safety equipment installation. The weather condition achieved the
lowest evaluation as the respondents from the company considered it insignificant given
that in Akwa Ibom State, Nigeria, the temperature remains stable, being on average, 15

Bassey B. Okon Building Services Infrastructure Characteristics, Study Phases I - IV
152
degrees Celsius throughout the year. Therefore, this factor does not really have much
impact on the investigated scenario.
However, whilst the overall ranking for the weather condition was not found to be
significant, the respondents did observe that the rainfall may be problematic. In most
cases, heavy rainfall occurs between the months of May and August, and this is likely to
affect the pace of construction activities. However, the other remaining characteristics
in this class achieved moderate rating, all being of equal significance.
4.13 Study Phase IV: MPN Unlimited
4.13.1 Presenting the phase of study
A case study regarding the building services infrastructure characteristics was
undertaken in the oil and gas sector, using Mobil Producing Nigeria (MPN) as the
company for investigation. This company has facilities (platforms) located in Eket and
Ibeno local government areas in Akwa Ibom State, Nigeria. MPN is involved in oil and
gas exploration and has several facilities (platforms) situated on land and at sea. The
study sites involved both on and off-shore oil facilities within the company‟s
operational base. The individuals targeted by the survey were the maintenance,
operation, and project managers, and the design engineers, among others.
4.13.2 Goal and scope definition
The main purpose of the study was to analyse and value the MPN Nigeria facility as
indicated in Section 4.2.2. The goals were mainly to address the operation and
maintenance stages of the building services infrastructure performance within the
company. Therefore, the building services infrastructure operations such as water,
energy, heating, maintenance culture and the ancillary activities at these stages were
measured in the study. Furthermore, the features leading to effective services delivery
and the sustainability of the infrastructure over their life cycle were assessed.
4.13.3 Results and discussion in study phase IV
The results and discussion from this phase of study are presented.

Bassey B. Okon Building Services Infrastructure Characteristics, Study Phases I - IV
153
4.13.4 Energy resources management characteristics
The energy management resources characteristics data within study phase IV are
shown in Table 4.19, which shows that 11 factors were explored. High severity indices
ranging from 61–79% were obtained, with the top marked factors being: (a) the energy
management through good maintenance policy framework, and (b) the energy
management via good operating efficiency in building/facility. The inventory also
includes: (c) the educational awareness drive on the sustainable energy usage, and (d)
the use of modern technological energy concepts, among other factors.
These ranges verify that the variables have a wide-ranging degree of influence on the
operation and maintenance of the building services infrastructure delivery. The bottom
marked factor with the severity index of 61% was: (e) the use of renewable energy
sources in the building/facility. Obviously, the result is logical because this innovative
concept is not commonly practised in Nigeria, as confirmed by the respondents.
The class in Table 4.19 also maintained coefficients of variation about 30–42%,
which are relatively low and state a good conformity level between the respondents‟
opinions. The two topmost characteristics are: (a) the application of building regulation
part L for energy conservation; and (b) the use of renewable energy sources in the
building/facility.
Table 4.19: Energy resources management characteristics
FACTORS SI COV CR OR
1)Use of efficient and energy saving fixtures 68.9 31.0 9 33
2)Use of modern technological (energy) concepts 77.4 36.9 3 21
3)Use of sensor based lighting systems for energy/conservation
in building/facility 72.0 29.5 6 29
4)Use of the renewable energy source in building/facility 61.1 40.7 11 36
5)Use of HVAC for energy efficiency/ conservation 71.4 32.7 7 30
6)Employment of solar panels/photovoltaic technology 66.7 37.4 10 35
7)Installation of modern energy saving accessories in building
facility 73.6 32.9 5 26
8)Energy management via good operating efficiency in
buildings /facility 78.5 33.9 2 18
9)Energy management via good maintenance policy framework
in building/facility 78.9 35.9 1 17
10)Educational awareness drive on the sustainable energy usage
in building/facility 76.2 34.9 4 24
11)Application of building regulation Part L for energy
conservation in building/facility 70.7 41.6 8 31

Bassey B. Okon Building Services Infrastructure Characteristics, Study Phases I - IV
154
The bottom scale comprises: (c) the use of sensor-based lighting systems; and (d) the
application of efficient and energy saving fixtures within the building/facility. The result
is consistent because some respondents within the company expressed lack of
knowledge regarding the use of part L standard of practice in energy management.
Category ranking information also emphasised: (a) the energy management through
good maintenance policy framework; and (b) the energy management via good
operating efficiency in building/facility. At the same time: (c) the use of modern
technological energy concepts; and (d) the educational awareness drive on the
sustainable energy usage were maintained as crucial On the other hand, the lowest in
this category was: (a) the use of renewable energy source; and (b) the employment of
solar panels photovoltaic technology in the building/facility. The interpretation to be
made from these outcomes is that the models discussed are not commonplace in this
company. In the overall ranking assessment, all the factors are 17th–36th. Energy
management through a good maintenance policy framework and operating efficiency
infacilities is regarded as essential, but the other remaining factors are less, important.
4.13.5 Water resources management characteristics
Information received concerning the water management resources characteristics in
study phase IV is presented in Table 4.20.
Table 4.20: Water resources management characteristics
FACTORS SI COV CR OR
1)Use of efficient water fixtures, sensor flow taps 79.0 30.2 2 16
2)Use of modern technological concepts; water recycling
practice in building/facility 69.9 41.5 8 32
3)Use of water conservation techniques; grey water in
building/facility 72.4 37.0 7 28
4)Installation of automatic shut-off faucets for water
conservation in building/facility 78.9 32.3 3 17
5)Installation of accessories/dual flush toilet/wireless urinals in
building/facility 72.8 38.2 6 27
6)Prevention of water wastage/losses via leakages in the
building/facility 80.5 30.4 1 15
7)Achieving DEFRA standard 2007/use of 125 litres of
water/head/day in building/facility 68.2 38.4 9 34
8)Educational awareness drive towards sustainable water usage
in building/facility 76.5 31.5 4 23
9)Building of On-site/Off-site (sewage) effluent plant in
building/facility 73.8 35.5 5 25
Bassey B. Okon Building Services Infrastructure Characteristics, Study Phases I - IV
155
Table 4.20 indicates nine factors associated with the sustainable water resources
management, with severity indices between 68% and 81%. Prevention of water
wastage/losses through leakages in the building/facility gained a severity index 81%.
This is followed by: (a) the use of efficient water fixtures (sensor flow taps); and (b) the
installation of automatic shut-off faucets in the company buildings. On the whole, the
other remaining characteristics are very strongly considered as important by the
respondents in view of this evaluation. Also, the coefficient of variance shows a range
of 30–42%, signifying strong agreement among the respondents in their appraisal of
these factors. Specifically, they see the necessity for: (a) the prevention of water
wastage/losses through leakages in the building/facility, and the use of water recycling
technology; (b) the use of efficient water fixtures (sensor flow taps); and (c) the
installation of dual flush toilet accessories as the best practice.
In the category ranking, the results are 1st–9th. The prevention of water wastage/
losses through leakages in the building/facility leads in the overall rating, and is
followed by: the use of efficient water fixtures (sensor flow taps), and the installation of
automatic shut-off faucets within the company facility. The use of DEFRA standard
2007 attained the lowest score. The respondents maintained that the practice is not very
common within the area of study, as shown in Table 4.20. The overall ranking was
15th-34th, thereby indicating strong agreement on factors such as: (a) the prevention of
water wastage/losses through leakages; (b) the use of efficient water fixtures; and (c) the
installation of automatic shut-off faucets in the company facility, since these practices
were believed to promote effective building services success.
The lowest mark was awarded to: (a) the application of DEFRA standard 2007
procedure factor, which is not surprising given that the respondents confirmed this as an
unusual company practice in respect of buildings (facilities) management.
4.13.6 Maintenance management practices
The maintenance management practices data in study phase IV are shown in Table
4.21.

Bassey B. Okon Building Services Infrastructure Characteristics, Study Phases I - IV
156
Table 4.21: Maintenance management practices
FACTORS SI COV CR OR
1)Employment of technical/skilful expertise 89.8 18.4 1 4
2)Adoption of team working approach 84.4 24.5 4 10
3)Adoption of innovative driven concepts 77.4 32.2 5 21
4)Predictive maintenance practice 85.6 24.0 3 9
5)Preventive maintenance practice 87.8 23.0 2 6
6)Corrective maintenance practice 83.9 29.3 6 11
7)Maintain as-we-go philosophy 68.9 39.6 7 33
The study showcases seven factors (Table 4.21) with severity indices in the range of
69–90% for all the factors. The leading characteristics are: (a) the employment of
technical/skilful expertise, and (b) the application of preventive maintenance culture in
handling infrastructure challenges. Apart from these two factors, (c) the adoption of
predictive maintenance practice, is also perceived by most respondents as achieving
greater impact. The only characteristic with less influence within this category is the
maintain-as-we-go philosophy. Statistics concerning the coefficient of variation
demonstrate that the variables are in the range 18–40%. Whilst the scores are very small
comparatively, this indicates a good concordance level between the respondents in
ranking these characteristics.
Specifically, the most favoured coefficient of variation factors are: (a) the
employment of technical/skilful expertise, and (b) the preventive maintenance culture.
The maintain-as-we-go philosophy is not strongly supported in this case, essentially not
being encouraged within the company in the quest for sustainable building services
infrastructure. In respect of the category ranking, (a) the employment of
technical/skilful expertise, and (b) the application of preventive maintenance culture are
highlighted. Also, included in this category are: (c) the adoption of predictive
maintenance practice; and (d) the adoption of a team working approach. The maintain-
as-we-go philosophy was again reflected as a minor factor in the study.
The overall ranking of the group presents three characteristics gaining the topmost
impacts (Table 4.21). They are: (a) the employment of technical/skilful expertise; (b)
the application of preventive maintenance culture; and (c) the adoption of predictive
maintenance practice in managing infrastructure systems. The result is reasonable as the
incorporation of these measures will make the infrastructure network sustainable and
reliable over the life cycle of the network.

Bassey B. Okon Building Services Infrastructure Characteristics, Study Phases I - IV
157
4.13.7 Infrastructure design characteristics
The infrastructure design characteristics information in study phase IV is highlighted
in Table 4.22.
Table 4.22: Infrastructure design characteristics
FACTORS SI COV CR OR
1)Design/drawings/envelope/specification 86.2 28.3 4.5 8
2)Feasibility of the design framework 88.5 23.1 3 5
3)Variation orders/cost/interference 90.8 19.4 1 2
4)Design quality/specification 90.5 22.1 2 3
5)Inspection/testing/approval/commissioning 81.0 26.1 6 14
6)Infrastructure/design/planning 86.2 26.4 4.5 8
The six factors analysed demonstrated severity indices ranging between 81% and
91%. The top marked factors are: (a) the variation orders/cost/interference; (b) the
quality/specification; and (c) the feasibility of the design framework. In reality, the other
remaining characteristics gained higher marks. This is an expression of consistency on
the respondents in assessing these factors. The coefficient of variation is in the range
19–28%. Notably, the influence of these factors is very low. Consequently, the experts
believe that building services infrastructure design should address the need for
successful services delivery, and therefore, encourage the efficient installation of
equipment, and a just-in-time maintenance culture.
The category ranking statistics showed the three top factors as being: (a) the
variation orders/cost/interference; (b) the design quality/specification; and (c) feasibility
of the design framework. Also, in this class are: (d) the design/drawings/envelope with
specification; and (e) the infrastructure/design/planning, both of which achieved
overlapping results. Inspection/testing/approval/commissioning gained the least score in
the category ranking evaluation. The overall ranking analysis indicates three factors
coming top with: (a) the variation orders/cost/interference; (b) the quality/specification;
and (c) the feasibility of the design framework, occupying these positions. The outcome
in the overall raking appraisal is a true reflection of the category ranking as contained in
Table 4.22. This result is reliable, confirming a strong degree of concordance from the
respondents in the study.

Bassey B. Okon Building Services Infrastructure Characteristics, Study Phases I - IV
158
4.13.8 Infrastructure project characteristics
In this study, the infrastructure project characteristics record in phase IV is presented
in Table 4.23. This result accounts for the investigation of 10 characteristics, with
severity indices ranging from 77–84%. The result shows that these factors have
relatively weighty degrees of influence on building infrastructure project management
in terms of cost and service delivery. In addition, 84% of the respondents strongly
concur with: (a) the intensity/complexity; and (b) the quality of finishing of the
building/facility as significant factors.
Similarly: (a) the construction methods/technology; (b) the accessibility to the
building; and (c) site topography/location gained approximately 83%. The other
remaining factors results are far greater than 70%.
Table 4.23: Infrastructure project characteristics
FACTORS SI COV CR OR
1)Type of building/facility/industrial/residential/
commercial/offices/other 78.2 32.2 4.5 19
2)Size of building/facility area 76.7 34.1 7.5 22
3)Height/number of stories 78.2 32.1 4.5 19
4)Complexity of building/facility 76.7 25.5 7.5 22
5)Structure type (steel, brick etc) 77.8 29.7 6 20
6)Construction method/technology 82.8 25.2 3 12
7)Accessibility to the building/facility 82.8 24.4 3 12
8)Intensity/complexity of the building/facility 83.9 25.8 1.5 11
9)Site topography/location 82.8 26.9 3 12
10)Quality of finishing 83.9 24.3 1.5 11
This shows a good level of agreement from the respondents regarding the impacts of
these characteristics towards the success of building services infrastructure delivery.
Also, in the coefficient of variance records are 24 – 34%. The trend of the result is
declining signifying a strong agreement from the respondents in their assessment
concerning these factors. The group maintained: (a) the size of building/facility area; (b)
the type; and, (c) the height of building are highly rated. But, less emphasis was
attached to (d) the quality of finish the building/facility.
In this category the ranking range is 3rd–7th, indicating strong agreement on factors
to include: (a) the intensity/complexity; (b) the quality of finishing of the
building/facility; (c) the construction methods /technology; (d) the accessibility to the

Bassey B. Okon Building Services Infrastructure Characteristics, Study Phases I - IV
159
building; and (e) the site topography/location of the building/facility. The other
remaining factors in this class gained corresponding results. The overall rankings are
11th–22nd with: (a) the intensity/complexity, and (b) the quality of finishing in the
building/facility having the same results. Three factors in this group had overlapping
results, these being: (c) the construction methods/technology, (d) the accessibility to the
building, and (e) the site topography/location of the building/facility.
The bottom marked factors in this case are: (f) the size, and (g) the complexity of the
building/facility (Table 4.23). Most respondents perceived the top marked
characteristics as being significant and the bottom group as less significant. This is
because the most significant named factors are crucial for building services operations,
whereas, the less significant factors are sometimes regarded as being hard to envisage in
the execution of infrastructure systems project activities.
4.13.9 External factors affecting SIM
Data related to the external factors affecting SIM in study phase IV are presented in
Table 4.24.
Table 4.24: External factors affecting SIM
FACTORS SI COV CR OR
1)Users‟ attitude towards the building/facility 85.6 25.9 4 9
2)Availability of safety equipment/fume extractors installation 81.6 28.8 7 13
3)Supply performance 85.1 22.4 5 10
4)Weather condition 86.2 23.1 3 8
5)Government policies (OHSAS, EMS) 86.7 22.4 2 7
6)Quality of equipment/installation 84.4 22.1 6 10
7)Sustainability of the building/facility 93.3 14.5 1 1
The data comprises seven factors with severity indices in the range of 80–90%. In
this group the top rated are: (a) the sustainability of the building/facility; (b) the
implementation of government policies; and (c) the weather condition factors. In the
lowest score band is: (d) the availability and installation of safety equipment within the
building/facility. The respondents contend that the other remaining characteristics are
equally significant. In the coefficient of variation analysis, all results are within the
range 15–29%. Uppermost in this group are: (a) the availability and installation of

Bassey B. Okon Building Services Infrastructure Characteristics, Study Phases I - IV
160
safety equipment, (b) the users‟ attitude towards the building/facility, and (c) the
weather conditions.
The lowest grade is achieved by: (d) the sustainability of the building/facility. A
consistent and strong agreement in ranking has been established by the respondents in
this assessment. The results are reasonably low and declare a good conformity level
between the respondents.
The category ranking test discloses three topmost factors. They include: (a) the
sustainability of the building/facility; (b) the implementation of government policies;
and (c) the weather condition. The lowest grades within this class are: (d) the
availability of safety equipment; and (e) the quality of equipment/installation. This
presents the respondents‟ perception that these factors, especially the lowest grades,
have little influence. The topmost survey results in the overall ranking are: (a) the
sustainability of the building/facility; (b) the implementation of government policies;
and (c) the weather condition factors, as shown in Table 4.24.
The lowest marks within this category relate to: (d) the availability and installation of
safety equipment; (e) supply performance; and (f) the quality equipment/installation
characteristics. The findings reveal the sustainability of the building/facility is rated first
by the respondents in the overall ranking analysis, thereby demonstrating the perceived
importance of achieving sustainable building infrastructure in the company‟s services
delivery.
4.14 Comparative analysis study between ALSCON and MPN
A comparative study was conducted between the ALSCON and MPN organisations.
This was aimed at appraising the severity indices, coefficients of variation, category and
the overall rankings results. Details of the results in this perspective are illustrated in
Figures 4.7–4.11.
4.14.1 Severity indices analysis (SIA)
The comparison of the severity indices shows a very high correlation between the
two companies, with a 60–70% interval group, as illustrated in Figure 4.7. The ratings

Bassey B. Okon Building Services Infrastructure Characteristics, Study Phases I - IV
161
from the ALSCON respondents show that they are not in support of three factors in this
band, which are: (a) the application of building regulation part L for energy
conservation in building/facility; (b) the use DEFRA standard 2007 for water resource
practice; and (c) the maintain as-we-go philosophy. The indication is that these factors
are either moderately or less significant in achieving sustainable building services
infrastructure. The MPN respondents perceived six factors as not being very commonly
practised in their company. They are: (a) the use of renewable energy sources; (b) the
employment of solar panels photovoltaic technology; (c) the water recycling practice
inside the building/facility; (d) the DEFRA standard 2007 for water resource practice;
(e) the use of renewable energy source; and (f) the installation of energy saving devices.
These perceptions could be interpreted as indicating a low level of sustainability
awareness and its application within the two organisations regarding these
characteristics. Furthermore, the benefits to be derived from sustainable building
infrastructure services delivery may not have been fully understood by the two
companies (Figure 4.7).
Figure 4.7: Relationship between factors and severity indices ranking
Evidently, the ALSCON and MPN respondents ranked 13 and 20 factors
respectively with the severity indices ranging between 70–80%. Among the list of these
characteristics in both companies are: (a) the installation of modern energy saving

Bassey B. Okon Building Services Infrastructure Characteristics, Study Phases I - IV
162
accessories, and (b) the use of HVAC for energy efficiency and conservation within the
buildings. The inventory also consists of: (c) the installation of dual flush toilet/wireless
urinals; (d) the building type; and (e) the adoption of innovative driven concepts in
managing the infrastructure systems.
This outcome is consistent with high ratings from the respondents and expresses the
significance of the highlighted factors concerning the infrastructure services delivery.
Interestingly, the ALSCON and MPN respondents have further ranked 34 and 24 factors
correspondingly with severity indices ranging between 80–90% (Figure 4.7). Some of
these factors are: (a) the prevention of water wastage/losses through leakage; and (b) the
installation of automatic shut-off faucets for water conservation within the facilities.
The list also includes: (c) the employment of technical/skilful expertise; (d) the
design/drawing/envelope/specification; and (e) the quality of finishing among others.
The result reflects the fact that the other remaining factors in this group are strongly
encouraged for implementation in the quest to achieve sustainability goals. On the
whole, the respondents in both companies scored more than 40 factors in the range of
70–90% benchmark. In relative terms, the ALSCON organisation is taking the lead in
the severity indices appraisal. This result demonstrates a very high correlation in the
respondents‟ views regarding the influence of these characteristics in attempting to
achieve sustainable infrastructure management.
4.14.2 Coefficient of variation (COV) analysis
Information concerning the comparison of COV results is indicated in Figure 4.8.
The preventive maintenance practice factor received 9% from the ALSCON
respondents within the benchmark 0–10%. The ALSCON and MPN respondents rated
14 and 3 factors respectively within the COV range 10–20%. The most common
characteristics within this band in both companies are: (a) the employment of
technical/skilled expertise in handling maintenance challenges; (b) the variation
orders/cost/interference; and (c) the sustainability of the building/facility. The other
non-listed factors in this class all achieved equally lower COV.
The outcome suggests that the factors in the lower band strongly encourage the
sustainability ethics in the direction of building services infrastructure delivery. In the
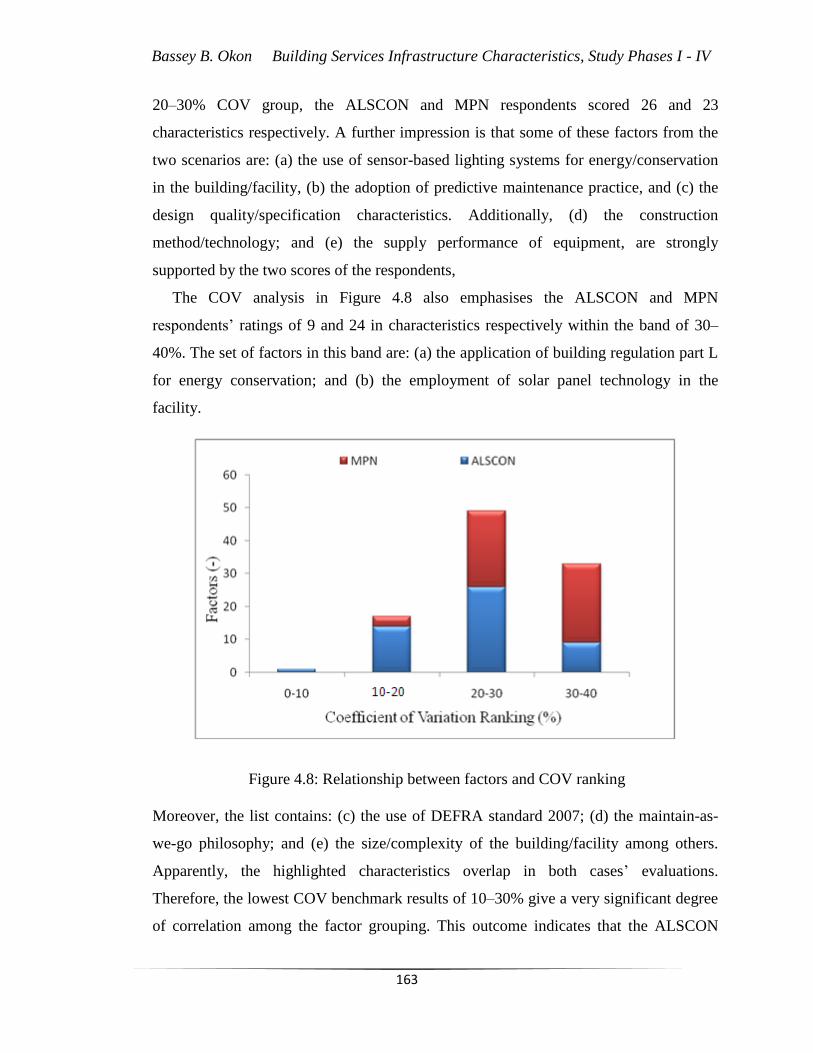
Bassey B. Okon Building Services Infrastructure Characteristics, Study Phases I - IV
163
20–30% COV group, the ALSCON and MPN respondents scored 26 and 23
characteristics respectively. A further impression is that some of these factors from the
two scenarios are: (a) the use of sensor-based lighting systems for energy/conservation
in the building/facility, (b) the adoption of predictive maintenance practice, and (c) the
design quality/specification characteristics. Additionally, (d) the construction
method/technology; and (e) the supply performance of equipment, are strongly
supported by the two scores of the respondents,
The COV analysis in Figure 4.8 also emphasises the ALSCON and MPN
respondents‟ ratings of 9 and 24 in characteristics respectively within the band of 30–
40%. The set of factors in this band are: (a) the application of building regulation part L
for energy conservation; and (b) the employment of solar panel technology in the
facility.
Figure 4.8: Relationship between factors and COV ranking
Moreover, the list contains: (c) the use of DEFRA standard 2007; (d) the maintain-as-
we-go philosophy; and (e) the size/complexity of the building/facility among others.
Apparently, the highlighted characteristics overlap in both cases‟ evaluations.
Therefore, the lowest COV benchmark results of 10–30% give a very significant degree
of correlation among the factor grouping. This outcome indicates that the ALSCON

Bassey B. Okon Building Services Infrastructure Characteristics, Study Phases I - IV
164
organisation is more sustainability conscious in managing its building services
infrastructure systems than the MPN organisation.
4.14.3 Category ranking (CR) analysis
The category ranking examination in Figure 4.9 presents four sets of results 60–90%.
In the 60% class, the ALSCON and MPN respondents‟ ratings are of three and seven
characteristics correspondingly. These factors among others include: (a) the application
of building services regulation part L for energy conservation; (b) the use of DEFRA
standard 2007; (c) the maintain-as-we-go philosophy; (d) the use of energy saving
fixtures; and (e) the employment of solar panel technology within the building/facility
among other remaining characteristics. On the 70% benchmark are 11 and 20 factors
from the ALSCON and MPN respondents‟ scores respectively.
The overlapping factors are: (a) the use of renewable energy concept; (b) the
installation of dual flush toilet/wireless urinals; (c) the size of the building/facility area;
(d) the educational awareness drive towards sustainable water usage; and (e) the
employment of innovative driven concept among others. The outcome shows these
factors are very significant to the aim of study as rated by the respondents and shown in
Figure 4.9.
Figure 4.9: Relationship between factors and CR.

Bassey B. Okon Building Services Infrastructure Characteristics, Study Phases I - IV
165
The result trend on 80% CR demonstrates that the ALSCON and MPN respondents‟
marks are correspondingly 25 and 20 factors. This explains the degree of significance of
these characteristics. They include: (a) the feasibility of the design framework; (b) the
construction method; (c) accessibility; and (d) the complexity of the building/facility.
Within this band also are: (e) the users‟ attitude towards the building; (f) the availability
of safety equipment; (g) the supply performance; and (h) the implementation of
government policies, among others in this class. In the 90% group, the ALSCON and
MPN respondents‟ grades are respectively 11 and 3 factors (Figure 4.9). The topmost
characteristics in each case are: (a) the implementation of predictive maintenance
culture; (b) achieving the sustainability of the building; and (c) the employment of
skilful/technical expertise.
These key factors are strongly regarded by the ALSCON respondents among others
in this band. Also, the MPN respondents have maintained these factors as crucial to this
study indicating that they are within the most significant characteristics. They include:
(a) achieving the sustainability of the building; (b) the variation orders/cost/interference;
and, (c) the design quality/specification. This reveals a very strong degree of agreement
between these factors in comparison. The sustainability of the building services
infrastructure is considered as a very significant factor from the two scores of
respondents. Therefore, this stresses the benefits of the concept of sustainability
regarding improved services delivery on building services infrastructure generally.
4.14.4 Overall ranking (OR) analysis
The overall ranking test was conducted to achieve a comparison between the
ALSCON and MPN companies. In this appraisal, the correlations between the top and
bottom marked factors with their overall rankings are depicted in Figures 4.10 and 4.11.
4.14.5 Top marked factors
Figure 4.10 presents the top marked characteristics and the overall ranking results.
The ALSCON organisation in the OR evaluation identified five top marked factors at
approximately 92–98%. These factors are: (a) the implementation of suitable design
/drawings/envelope/specification; (b) achieving the sustainability of the building; and
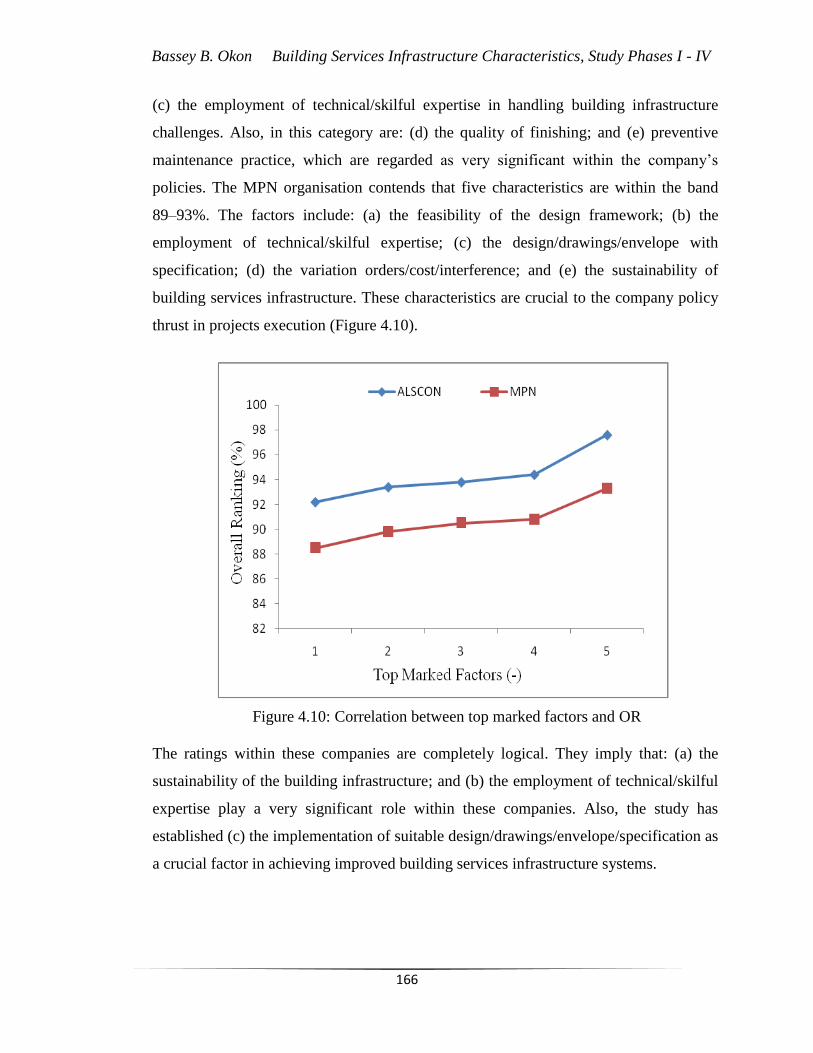
Bassey B. Okon Building Services Infrastructure Characteristics, Study Phases I - IV
166
(c) the employment of technical/skilful expertise in handling building infrastructure
challenges. Also, in this category are: (d) the quality of finishing; and (e) preventive
maintenance practice, which are regarded as very significant within the company‟s
policies. The MPN organisation contends that five characteristics are within the band
89–93%. The factors include: (a) the feasibility of the design framework; (b) the
employment of technical/skilful expertise; (c) the design/drawings/envelope with
specification; (d) the variation orders/cost/interference; and (e) the sustainability of
building services infrastructure. These characteristics are crucial to the company policy
thrust in projects execution (Figure 4.10).
Figure 4.10: Correlation between top marked factors and OR
The ratings within these companies are completely logical. They imply that: (a) the
sustainability of the building infrastructure; and (b) the employment of technical/skilful
expertise play a very significant role within these companies. Also, the study has
established (c) the implementation of suitable design/drawings/envelope/specification as
a crucial factor in achieving improved building services infrastructure systems.

Bassey B. Okon Building Services Infrastructure Characteristics, Study Phases I - IV
167
4.14.6 Bottom marked factors
The result in Figure 4.11 illustrates the bottom marked factors and the overall
ranking for the study phase III–IV. In this scenario, the ALSCON organisation in the
OR assessment has recognised four bottom marked factors in the range 68–70%. They
include: (a) the employment of solar panels/photovoltaic technology; (b) the application
of building regulation part L for energy conservation in building/facility; (c) the use of
DEFRA standard 2007 for water resource management; and (d) the maintain as-we-go
philosophy approach in tackling the building infrastructure problems. These
characteristics are considered as unfamiliar practices with the organisation in its search
for sustainability success.
[[
Figure 4.11: Correlation between bottom marked factors and OR
The MPN company in the OR appraisal acknowledged six bottom marked factors in
the range 61–69%. They include: (a) the use of water recycling concept; (b) the use of
efficient and energy saving fixtures within the building/facility; (c) the use of DEFRA
standard 2007 for water resource management; (d) the employment of solar
panel/photovoltaic technology within building/facility; (e) the maintain as-we-go

Bassey B. Okon Building Services Infrastructure Characteristics, Study Phases I - IV
168
philosophy approach; and (f) the use of the renewable energy source (Figure 4.11).
However, the outcome is very reasonable in comparative terms.
This is because factors such as: (a) the maintain as-we-go philosophy; and (b) the use
of DEFRA standard 2007 for water resource management are reflected in both scenarios
as minor to the study. The research reveals these factors are not commonly practised
within the organisations as routes to the achievement of sustainability. Nonetheless, the
results are consistent across the two companies, and accordingly, it could be concluded
that the research method as applied is capable of validating the two phases of study.
4.15 Constraints in phase IV
There were limiting factors affecting the data acquisition during the study. These are:
Delays from some respondents in completing and subsequently returning the
survey for data analysis and evaluation from both companies.
Expression of lack of time in their work schedule for either holding interviews or
completing the survey by the professionals, technical directors and stakeholders
within these organisations.
Administrative bureaucracies within these organisations posed difficulties in the
acquisition of the envisaged data for assessment.
Some members of staff expressing fear of divulging the company‟s confidential
information in the process of completion of the survey.
4.16 Sustainability index (SI) matrix
This research also developed a sustainability index matrix aimed to ascertain the
overall performance of the studied building services infrastructure systems within the
UK and Nigeria. The sustainability index value from the probability theory is expressed
as 0 ≤ Suv ≤ 1 for any given system. Therefore, the infrastructure systems (IS)
performance could be measured based on this parameter. Table 4.25 presents the
sustainability index matrix (SIM) as applied in the study.
The infrastructure performance category (IPC) contained nine categories from A to
K (Table 4.25). Each IPC phase is mapped to a corresponding infrastructure system‟s

Bassey B. Okon Building Services Infrastructure Characteristics, Study Phases I - IV
169
performance status based on the sustainability index matrix domain. Then, infrastructure
performance analysis (IPA) can be studied through a systematic identification of the
systems parameters in a given setting.
Table 4.25: The sustainability index matrix
SI *IPC Remarks on IS performance status
0 K The entire IS at total collapse stage
0.1 J The entire IS require utmost attention before failure (downtime) occur
0.2 I IS performance are very poor, unsustainable and needs corrective measures
0.3 H IS performance are poor demanding for rehabilitation and *TAM culture
0.4 G IS performance are fairly but require more scrutiny for upgrade
0.5 F IS performance are moderate but require more critical and preventive attention
0.6 E IS performance are good but require more preventive maintenance culture
0.7 D IS performance are good but require preventive attention
0.8 C IS performance are very good and reliable but need to be sustained
0.9 B IS performance are excellent and sustainable for optimum operation
1.0 A IS, is exceptionally outstanding but practically impossibly to attain worldwide
*IPC– Infrastructure performance category; *TAM – Turn around maintenance
The observations reported in Table 4.25 regarding building services infrastructure
systems and facilities management are also well documented by other authors (see
Barret, 1995; BREEAM, 2008; RICS, 2000; RICS, 2008; Grigg, 1988; Chanter and
Swallow, 2000). Hence, the following processes or combinations are appraised in this
context:
Address building services infrastructure systems with the corrective measures in
worst facilities state; along the sustainability index (SI) range 0 – 0.2.
Perform crisis-related building services infrastructure systems upgrade only.
Perform critical building services infrastructure systems analysis and employ the
best management techniques and innovative models to offer solutions when
related operations are scheduled.
Apply pre-specified life cycle frameworks and strategic building services
infrastructure systems management techniques.
Perform the repair of those building infrastructure systems components with the
highest risk of failure for optimum operation and sustainability success.
Adopt a preventive maintenance culture on the building infrastructure systems as
a sustainable measure to avoid downtime.

Bassey B. Okon Building Services Infrastructure Characteristics, Study Phases I - IV
170
Reduce the demand for more resources use in the building services infrastructure
systems through reduce, reuse and recycle (3R) or innovative models.
Compare the economic advantages of the building services infrastructure systems
strategies in view of sustainability accomplishment at large (Table 4.25).
The highlighted procedures in managing building services infrastructure and
facilities management have also been reported (ABS, 2012; Armstrong, 1987; GSGF,
2010; Shah, 2007; Cheryl, 2008; Barret, 1995; GBPC, 2010; Grigg, 1988; Sabol, 2008).
Indeed, studies by Grigg (1988), and Chanter and Swallow (2000), on building and
infrastructure systems management have also revealed a similar result in measuring
effective performance. This system approach using the sustainability index matrix will
guarantee value engineering (VE), (Smith, 2008; Muto et al., 2006) related to the
building services infrastructure and building construction performance in pursuit of
sustainability goals. The VE is regarded as a scientific approach in analysing systems
performance to determine the overall quality of services delivery achieved at the lowest
cost (Smith, 2008; Parnel et al., 2008; Dutil et al., 2011).
4.17 Validating the two study phases using the SEI model
In this study, the SEI model was applied to ascertain the level of infrastructure
management activities within the ALSCON and MPN organisations:
From the ALSCON company evaluation, the research contributions regarding the
economic, environmental and social values (in terms of system probability)
yielded 5/6, 5/7 and 4/5 respectively. These outcomes present the building
services infrastructure system with Suv factor of 0.47 as the sustainability index
result.
From the MPN company appraisal, the study input concerning the economic,
environmental and social values (in terms of system probability) offered a mix
of 6/7, 2/3 and 3/4 respectively. These results yield the building services
infrastructure system with Suv factor of 0.43 as the sustainability index.

Bassey B. Okon Building Services Infrastructure Characteristics, Study Phases I - IV
171
These sustainability indices are acceptable, given the intervening factors of interest.
Based on the sustainability index results, it could be adduced that the ALSCON
organisation is more inclined towards sustainable building services infrastructure
systems than the MPN counterpart. More details regarding these results are indicated in
subsequent sections of this thesis.
4.18 Comparison between the Nigerian and UK scenarios
The comparative analysis conducted between the Nigeria and UK settings was
performed using the SEI model, and the results from the four phases of study I–IV
within the two countries were compared as presented in Table 4.26.
Table 4.26: The sustainability index (SI) results
Country Case Study SI Results
United Kingdom O&M 0.54
BCC 0.70
Nigeria ALSCON 0.47
MPN 0.43
The SEI model concentrates on normalising sustainability within the range 0 ≤ Suv ≤
1 through the application of the probability (P) theory model. This explains that the
BCC has gained the highest sustainability index over the other companies. It further
indicates that the BCC is more sustainability driven than the O&M sector in the UK
setting. The Nigerian situation is also shown in Table 4.26.
The critical point in building services infrastructure (BSI) in this context is the
operational phase of a building when the services delivery are no longer achieved as
expected, thereby suggesting decommissioning (UKGBC, 2009; Zulkarnain, et al.,
2011; Chanter and Swallow, 2000). A further explanation could be that more resources
(energy, water) are expected to be consumed and huge amounts of money anticipated to
address refurbishment within a preventive maintenance culture (Shah, 2007; Barret,
1995; White, 2008). To get rid of such expenditure, a building having served for many
years will depreciate in its value and the services delivery gradually declined (LCI,
2007; Langdon, 2007; Ellis, 2007).

Bassey B. Okon Building Services Infrastructure Characteristics, Study Phases I - IV
172
Having identified such potential risk associated with the resources exploitation in a
building, this analysis could mitigate and inform the building services and facility
managers in their decision-making (RICS, 2000; Grigg, 1988; Shah, 2007; RICS, 2008;
Barret, 1995). A normalised lifetime expresses the sorting of variables (data) for ease of
computation (Heidi et al., 2005). Figure 4.12 illustrates the curve of these results by
means of a partial differential equation method given in Equation (22) to determine the
BSI critical level of performance.
Figure 4.12: SI and time in investigated buildings at their critical level of operation
Figure 4.12 shows the BSI suitable performance attained through the application of
the model expressed in Equation (36). This considers the normalised lifetime of the
building in years and the sustainability index (SI) on the x and y axes respectively.
Then, the BSI area of performance (A) will ultimately yield approximately:
(32)
(33)
)(BSIfSI (34)
1
0)(BSISIdA (35)

Bassey B. Okon Building Services Infrastructure Characteristics, Study Phases I - IV
173
)()(1
BSIdBSIfAo (36)
The critical level of the investigated buildings (facilities) regarding the individual
organisation‟s performance (Figure 4.12) was determined through Equation (22). The
following results were obtained from the four phases of study I–IV as the buildings‟
critical situations. Appendix III contains the detailed analysis of this computation.
O&M = 0.20
BCC = 0.26
ALSCON = 0.17
MPN = 0.16
The interpretations of the outcomes present the relationship between the sustainability
indices and the normalised lifetime within the investigated buildings at their critical
level of operation. This further reveals the ranking of the studied building services
infrastructure systems and their sustainability attainment. These results are very
reasonable as a Matlab software technique was employed for the computation of the
field data to enhance accuracy and reliability.
Certainly, these results are consistent with extant literatures as the BCC within the
UK has embraced the sustainability ethics (Turner, 2006; UKSC, 2006; UKGBC, 2009;
UKGSD, 2005; GSGF, 2010). As such, accurate and reliable indices of sustainability
information can be qualified and quantified in real engineering cases. In the Nigerian
situation, ALSCON Company is more sustainability conscious than the MPN as shown
from the overall analysis (Table 4.26). On the whole, the BCC is leading in the overall
appraisal. This perhaps may be because the other three organisations are more involved
in the operations and maintenance of the building services infrastructure systems.
4.19 Contributions to knowledge in study phase I–IV
The study has developed the SEI model and subsequently applied it to determine the
level of building services infrastructure management performance within the four
phases of study under consideration. This is yet another breakthrough in measuring the
indices of sustainability from the engineering perspective. As contained in Sections

Bassey B. Okon Building Services Infrastructure Characteristics, Study Phases I - IV
174
4.16–4.18, the sustainability index of the examined organisations is shown through the
integration of probability theory, and the SEI model into sustainability. Also, the
application of the partial differential equation method has offered a great benefit in
normalising the sustainable development values (indices) for the strategic management
decisions in the building infrastructure systems domain.
4.20 Summary of study phase I–IV
The research outcomes have established that building services infrastructure delivery
could be achieved through a suitable design, construction, operation, and maintenance
culture. This drive becomes imperative due to the resources utilisation challenges facing
the task of achieving optimum and sustainable benefits. Against this background, the
findings revealed that the following factors are crucial across all the phases of study.
They are: (a) the implementation of appropriate design/drawings/envelope/specification;
(b) the availability of safety equipment/installation within the building/facility; and (c)
the employment of technical/skilful expertise, all of which are seen to play very
significant roles within these companies in tackling maintenance challenges.
The: (d) adoption of a team working approach; (e) the preventive maintenance
culture; and (f) the sustainability of the building infrastructure, are among the list in this
category. The lowest group are: (a) the maintain as-we-go philosophy approach; (b) the
use of water recycling concept; and (c) the weather conditions.
Conclusions could be drawn that characteristics with higher severity indices have
been assessed as having a significant influence, whereas those with lower severity
indices are either less significant, or indeed completely insignificant in the drive for
sustainability. It could be further stated that the formulated SEI model, and partial
differential equation method, and their applications, are able to deliver the research
objectives.

Bassey B. Okon Life Cycle Assessment and Life Cycle Costs, Study Phase V
175
Chapter Five
5.0 Life cycle assessment and life cycle costs
5.1 Introduction
This phase overviews the life cycle assessment (LCA) and the economic life cycle
costs (LCC) of the building services infrastructure systems in terms of performance.
LCA is a generic procedure used to verify the environmental impacts of building
infrastructure systems (Dutil et al., 2011; Bayer et al., 2010). Building infrastructure
appraisal is shown for six buildings within the UK. LCC is a technique applied to
establish the total costs of ownership of building services infrastructure network. Thus:
LCC in this study appraises the sum of all the costs associated with an asset or
part thereof, including acquisition and installation. It also accounts for the operation
(use), maintenance, refurbishment and disposal costs related to the building services
infrastructure and construction projects (Sterner, 2000; Landon, 2007; Landon, 2010).
5.1.1 Presenting the study in phase V
The research evaluates sustainable infrastructure systems management within
residential and office buildings. Basically, efforts in the survey were directed towards
the building services infrastructure and construction sectors. This study specifically
presents the LCA and LCC evaluation within six ongoing constructed buildings in the
UK. Six new high-rise buildings were appraised on their services delivery and
management. The owners of these buildings are four universities, a college, and one
multi-occupant residential building. The evaluated buildings were of variable heights
between four-to-six-storey towers and in each case, 100m2 was considered as a
functional unit for this study. The main structural frames of the buildings were made of
cast-in-place concrete and steel frames (Junnila and Horvath, 2003; Blengini, 2009).
The estimated building services infrastructure utilities included water, heating, energy
use, maintenance and their services over the life cycle (Home et al., 2009; Bayer et al.,
2010). Other details regarding this phase of the study inventory are shown in Table 5.1.

Bassey B. Okon Life Cycle Assessment and Life Cycle Costs, Study Phase V
176
Table 5.1: Basic research parameters
Building Parameters Related information
Location United Kingdom
Lifespan 50 years
Type: Six- buildings/No. University/4, College/1 and Residential/1 buildings
Height Four-to-six-storey towers
Envelope Bricks/blocks, steel frames and curtain wall combination
Operating energy and utilities HVAC, heating, electricity, water and other resources
Life cycle analysis (LCA) phases Construction, use/maintenance and end-of-life (EoL)
Life cycle cost (LCC) Economic benefits analysis in each case
Functional Unit (FU) 100m2
Other Analysed factors
The data used for the entire supply chain analysed were provided by six different
organisations, one for each of the building envelopes. Data from the college and
universities were provided by the estate, maintenance, and facilities managers.
Additionally, the site‟s project managers within these schools supported the study by
providing more valuable information. In the residential building situation, data used for
this study were supplied by the site project managers. For that reason, the bills of
materials quantities (data) were later exported into a Gabi 4 software pacakge and
modelled with the aim of identifying „hot spots‟ and data gaps across the materials
supply chain.
The supply chain in this case consists of the construction, operation (use) and
maintenance, and the decommissioning-EoL phases of the building infrastructure. The
life cycle inventory and life cycle impact address the global warming potential (GWP)
and other environmental impacts over the lifespan in these buildings.
5.1.2 Goal and scope definition
The main goal of the research is to analyse and value the life cycle environmental
impacts associated with the building services infrastructure and building construction
within the UK. This study goals are tailored viz:
To calculate and compare the life cycle environmental impacts of buildings
To identify the „hot spots‟ along the building supply chain, and
To analyse the data and suggest possible improvements and recommendations.

Bassey B. Okon Life Cycle Assessment and Life Cycle Costs, Study Phase V
177
5.1.3 The life cycle analysis
The LCA activities of a six-building infrastructure and their services delivery were
studied from the generic stages of design/construction, operation (use) and maintenance,
and the EoL phase. During this analysis, records of the lists of materials and other
parameters were obtained in each case from the companies as illustrated in Buildings
(A–F) for modelling and optimisation. Thus, a summary of water, energy utilities and
other material flows was subsequently produced.
5.1.4 Functional unit
Typically, the main functional unit as applied in the study was 100m2 specification
of building over a 50-year lifespan. This functional unit was chosen in order to provide
a common basis for appraisal and comparability within the investigated buildings
(Peuportier and Herfray, 2011; Gorree et al., 2002). Blengini (2009) explains that more
often than not, a functional unit is the unitary internal-usable floor area, sometimes with
reference to the entire building infrastructure lifespan (Borg and Erlandssona, 2003). As
such, the reference unit is considered as a single flat, a living unit, or it might even
pertain to the number of occupants living within the building (REGENER, 1997).
Therefore, such an option is found arbitrary but for comparison purposes the
standardisation might be very useful (Peuportier and Herfray, 2011). This is also
relevant to the function of the building under review.
5.2 Goal and scope of the research
The overall scope of the study is seen to encompass the LCA and LCC of the
projects activities related to the building services and building construction. It further
overviews the pre-use phase of manufacturing, transportation of the raw materials, and
their utilisation within the building construction sites (Blengini, 2009; Thompson,
2001). At the same time, this phase includes the erection, installation activities, and
services delivery within the building envelope (Thompson, 2001; Zablza et al., 2009;
Home et al., 2009). The supply chains are primarily in three distinct stages, namely:
construction, operation (use) and maintenance, and EoL, as shown in Figure 5.1.

Bassey B. Okon Life Cycle Assessment and Life Cycle Costs, Study Phase V
178
Figure 5.1: System boundaries (Blengini, 2009)
Specifically, in the building services aspect, efforts were directed towards appraising
the operation/use and maintenance stages of the building services infrastructure systems
in Figure 5.1. As a result, the interest focuses on the energy embodied in the materials
and equipment fixtures within the buildings (Boyles, 2005; CIOB, 2011). These account
for water, sanitary ware items, heat ventilation and air conditioning (HVAC) systems,
radiators, and other equipment (Horner et al., 1997; CIOB, 2010; Cheshire and
Maunsell, 2007). This process reviews the building infrastructure when the services
delivery is no longer usable and considered for demolition management (Blengini,
2009). At this stage, the building materials will either be recycled at the on-site/off-site
recycling station or conveyed to landfill (Coyle and Turner, 2008; UKSC, 2006; White,
2008). This development is commonly described a „cradle to grave‟ assessment.

Bassey B. Okon Life Cycle Assessment and Life Cycle Costs, Study Phase V
179
The field data obtained from six different organisations was employed for the
analysis. This was studied within the system boundaries of cradle to grave as shown in
Figure 5.1, and the indicated supply chain was modelled for optimum results. The
following energy requirements were considered in the course of this examination:
Raw materials production;
Raw materials transport (conveyance) to the six different construction sites;
Transport of the waste for disposal off-site (assumed);
Disposal of the waste to the landfill (assumed);
Transport of waste to the recycling facilities (assumed); and,
Waste water treatment.
5.3 Life cycle inventory
The life cycle analyses of each of the six buildings and their infrastructure services
delivery were conducted from the generic stages of construction, operation
/maintenance, through to the EoL. During the investigation, the lists of materials and
other parameters were obtained in each case from the companies (shown as Buildings
A–F) for modelling and optimisation. Therefore, the summaries of water, energy
utilities, and material flows were used in the LCA phase of this research. In the LCC
part, data regarding the materials quantification was supplied by two leading UK cost
engineering companies. These were Jacobs Engineering Limited, and Davis Langdon
(AECOM) Company, and the details are presented in tabular form in each phase of this
study.
5.4 Review of data acquired for Buildings A–F
A review of the data acquired from the buildings‟ project and estate managers was
made in each case. It became necessary to conduct a review based on the acquired data
provided for the study in order to ascertain the veracity of the overall information.
During this review, efforts were made to contact the buildings‟ project managers who
supplied data for the LCC study. It was difficult to reach all of them except one of the

Bassey B. Okon Life Cycle Assessment and Life Cycle Costs, Study Phase V
180
project managers who confirmed some details regarding the data provided earlier. It was
assumed that some of these managers may have changed their jobs considering the
period when the survey information was sought (Appendix IV). Furthermore, it was
found that some of them were no longer willing to assist in the research. Missing
information in each stage of the supply chain was noticed and the following reasons
were given:
The data earlier provided were generic and for the overall buildings specification;
Some details in these data are confidential and not for public consumption;
It was difficult to provide accurate data since construction of these buildings was
ongoing in all the investigated sites;
The surveys were completed by these managers and later returned as feedback.
Also, from the two cost engineering companies - Jacobs Engineering Limited, and
Davis Langdon - the following information was noted: Only one person from these
organisations could confirm certain details about the cost estimation, which was more
than two years‟ old, and as a result it became difficult to establish some of the details.
One of the estimators could not be reached to confirm some of the statistics provided
earlier. It was established that the costs evaluation in each case took cognisance of the
1.4% UK inflationary rate at the time, but due to insufficient data, several other
important factors were not considered. Obviously, these indications have posed some
difficulties as the achievable result does not repesent a true practical situation.
Furthermore, during the costs evaluation, bills were not drawn on various sub-heads
during the construction stage to include:
Hiring of equipment to sites;
Equipment services as provided by the operators on sites;
Labour charges for the installation of equipment and other construction activities;
Haulage of construction materials to sites; and,
Contingency costs were not integrated into this computation;
The other phases (use and maintenance) and the EoL were not properly estimated.

Bassey B. Okon Life Cycle Assessment and Life Cycle Costs, Study Phase V
181
Given these facts, it could be stated that data provided for the LCC analysis were not
comprehensive enough for computation. Therefore, it is suggested that the LCC analysis
findings may not represent a true picture of the buildings investigated, and rather that
the study findings are only capable of providing a platform for the future research
regarding LCC use within building infrastructure management (Appendix XI).
5.5 Building A
Client: Liverpool John Moores University, (LJMU), UK.
Contractor: Wates Construction Company, UK.
5.5.1 Background of the contractor
Wates Construction Group (WCG) specialises in maximising value by finding the
most intelligent and creative ways to deliver outstanding building infrastructure. The
organisation has gained many years‟ of building experience; thereby developing a real
understanding of the customers‟ needs with a proven track record in all core markets.
These include education, prisons, local authority frameworks, heritage, commercial and
mixed-use developments. As a UK-wide contractor, the WCG offers national delivery
through experienced experts in well-resourced local offices. However, as part of a
company with a £1 billion turnover, this represents trusted financial security and
stability in turbulent economic times. The organisation is a frontline sustainability
promoter and BREEAM compliant within and outside the UK.
In fact, WCG is one of the UK‟s biggest privately owned construction companies,
receiving the Queen‟s Award for Enterprise in April, 2011. This accolade came in
recognition of its continuous improvement in sustainable development in the past five
years. Furthermore, the WCG has been awarded the contract for the construction of a
landmark new six-storey academy of 10,000m2 at the cost of £22 million pounds for the
LJMU building project (WCG, A new landmark for Liverpool, 2012).
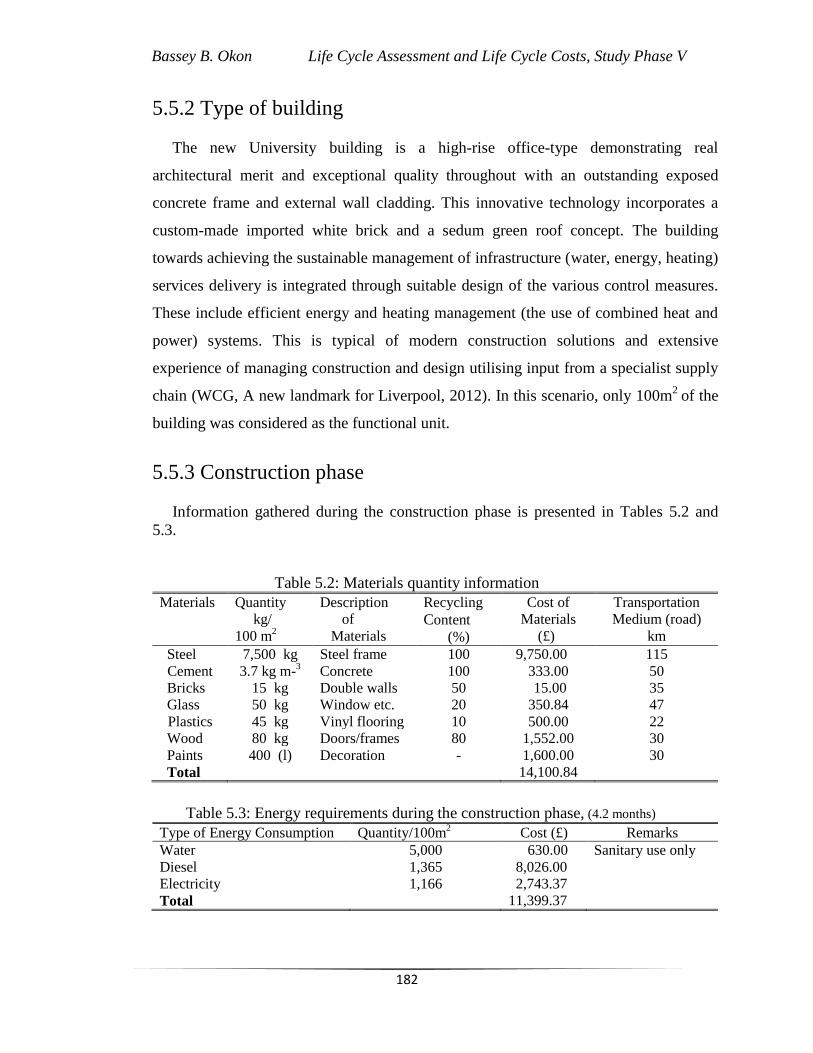
Bassey B. Okon Life Cycle Assessment and Life Cycle Costs, Study Phase V
182
5.5.2 Type of building
The new University building is a high-rise office-type demonstrating real
architectural merit and exceptional quality throughout with an outstanding exposed
concrete frame and external wall cladding. This innovative technology incorporates a
custom-made imported white brick and a sedum green roof concept. The building
towards achieving the sustainable management of infrastructure (water, energy, heating)
services delivery is integrated through suitable design of the various control measures.
These include efficient energy and heating management (the use of combined heat and
power) systems. This is typical of modern construction solutions and extensive
experience of managing construction and design utilising input from a specialist supply
chain (WCG, A new landmark for Liverpool, 2012). In this scenario, only 100m2
of the
building was considered as the functional unit.
5.5.3 Construction phase
Information gathered during the construction phase is presented in Tables 5.2 and
5.3.
Table 5.2: Materials quantity information
Materials Quantity
kg/
100 m2
Description
of
Materials
Recycling
Content
(%)
Cost of
Materials
(£)
Transportation
Medium (road)
km
Steel 7,500 kg Steel frame 100 9,750.00 115
Cement 3.7 kg m-3 Concrete 100 333.00 50
Bricks 15 kg Double walls 50 15.00 35
Glass 50 kg Window etc. 20 350.84 47
Plastics 45 kg Vinyl flooring 10 500.00 22
Wood 80 kg Doors/frames 80 1,552.00 30
Paints 400 (l) Decoration - 1,600.00 30
Total 14,100.84
Table 5.3: Energy requirements during the construction phase, (4.2 months)
Type of Energy Consumption Quantity/100m2 Cost (£) Remarks
Water 5,000 630.00 Sanitary use only
Diesel 1,365 8,026.00
Electricity 1,166 2,743.37
Total 11,399.37
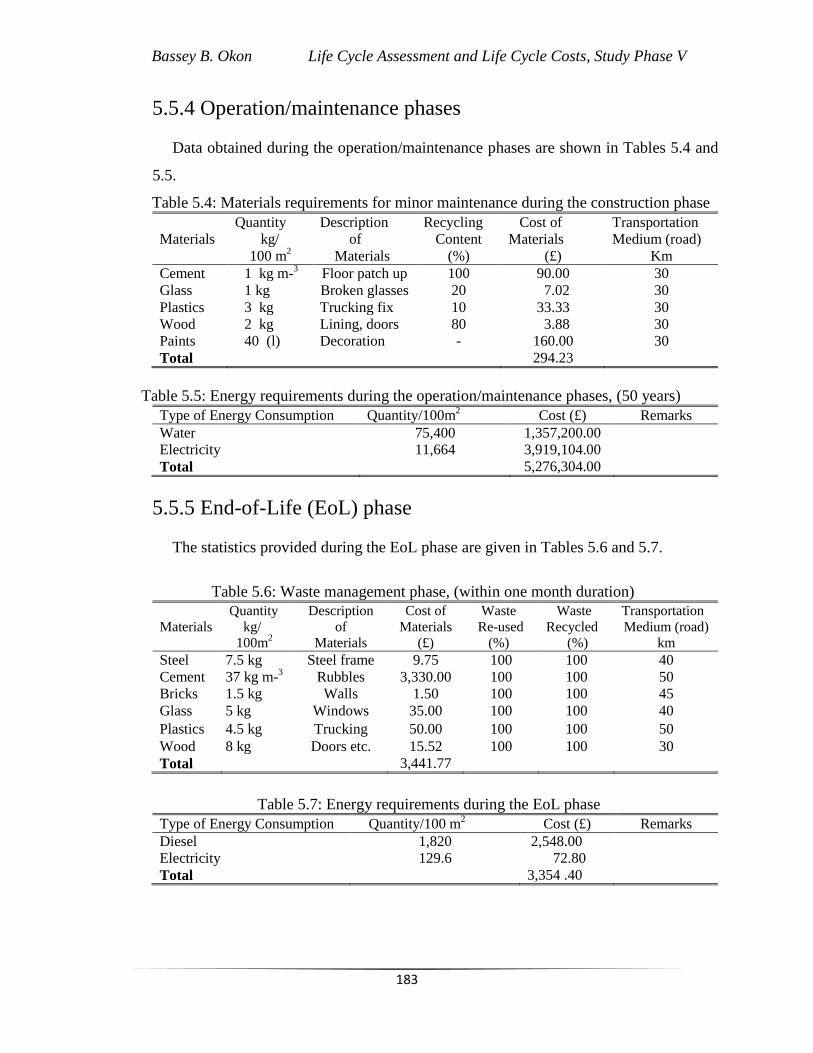
Bassey B. Okon Life Cycle Assessment and Life Cycle Costs, Study Phase V
183
5.5.4 Operation/maintenance phases
Data obtained during the operation/maintenance phases are shown in Tables 5.4 and
5.5.
Table 5.4: Materials requirements for minor maintenance during the construction phase
Materials
Quantity
kg/
100 m2
Description
of
Materials
Recycling
Content
(%)
Cost of
Materials
(£)
Transportation
Medium (road)
Km
Cement 1 kg m-3 Floor patch up 100 90.00 30
Glass 1 kg Broken glasses 20 7.02 30
Plastics 3 kg Trucking fix 10 33.33 30
Wood 2 kg Lining, doors 80 3.88 30
Paints 40 (l) Decoration - 160.00 30
Total 294.23
Table 5.5: Energy requirements during the operation/maintenance phases, (50 years)
Type of Energy Consumption Quantity/100m2 Cost (£) Remarks
Water 75,400 1,357,200.00
Electricity 11,664 3,919,104.00
Total 5,276,304.00
5.5.5 End-of-Life (EoL) phase
The statistics provided during the EoL phase are given in Tables 5.6 and 5.7.
Table 5.6: Waste management phase, (within one month duration)
Materials
Quantity
kg/
100m2
Description
of
Materials
Cost of
Materials
(£)
Waste
Re-used
(%)
Waste
Recycled
(%)
Transportation
Medium (road)
km
Steel 7.5 kg Steel frame 9.75 100 100 40
Cement 37 kg m-3 Rubbles 3,330.00 100 100 50
Bricks 1.5 kg Walls 1.50 100 100 45
Glass 5 kg Windows 35.00 100 100 40
Plastics 4.5 kg Trucking 50.00 100 100 50
Wood 8 kg Doors etc. 15.52 100 100 30
Total 3,441.77
Table 5.7: Energy requirements during the EoL phase
Type of Energy Consumption Quantity/100 m2 Cost (£) Remarks
Diesel 1,820 2,548.00
Electricity 129.6 72.80
Total 3,354 .40

Bassey B. Okon Life Cycle Assessment and Life Cycle Costs, Study Phase V
184
5.6 Building B
Client: University of Manchester, UK.
Contractor: GallifordTry Construction Company (GCC), UK.
5.6.1 Background of the contractor
GallifordTry is one of the leading construction companies implementing building
and infrastructure works across the UK. Projects undertaken by the company spread
across the public and private sectors. The group is renowned for the ability to provide
whole-life solutions with capital base revenues of £1.2 billion. GCC has evolved
through the decades to become one of the UK‟s foremost infrastructure and construction
groups. Apart from the UK offices, the organisation has set up a business in Qatar
focusing on infrastructure projects in private and regulated sectors of the economy. The
company is recognised for high standards of project delivery approach through
innovation, sustainability, and a diversity of activities as the company delivers seamless
integrated and sustainable solutions.
This effort contributes towards the enhancement of the built environment. Some of
the most significant milestones in the corporation‟s journey include the Centre Court‟s
retractable roof at Wimbledon, and civil works at the Olympic Park in London. Also, in
this list is the infrastructure work at Whitelee Wind Farm, Europe‟s largest onshore
project of this kind (GCC, Strength in Diversity, 2012).
5.6.2 Type of building
The building in this case is a new high-end type located at the University of
Manchester in UK. The gross estimated functional unit of the building in this study is
100m2. The constructed building is meant to house the chemical engineering department
of the school upon completion. It consists of five-storey office towers with exposed
steel frame, brick/block walls, green roof, and external wall cladding. The building is
characterised by efficient lighting systems such as sensor-based dimmable controllers
and good heating installation. The design and installation of sustainable technologies in
this building enhance management performance.

Bassey B. Okon Life Cycle Assessment and Life Cycle Costs, Study Phase V
185
5.6.3 Construction phase
The statistics obtained during the construction phase are presented in Tables 5.8 and
5.9.
Table 5.8: Materials quantity information
Materials Quantity
kg/
100 m2
Description
of
Materials
Cost of
Materials
(£)
Recycling
Content
(%)
Transportation
Medium (road)
km
Steel 15,000 kg Mild steel 19,500.00 80 100
Cement 5.0 kg m-3 Concrete (PFA) 450.00 100 12
Glass 200 kg Curtain walls 1,404.00 20 50
Plastics 30 kg Cavity tray DPM 333.00 10 10
Wood 250 kg Doors/frames 485.00 70 20
Paints 100 (l) Painting works 400.00 0 10
Total 22,572.00
Table 5.9: Energy requirements during the construction phase, (4.2 months)
Type of Energy Consumption Quantity/100m2 Cost (£) Remarks
Water 75,000 945.00 Drilling operation
Diesel 379 2,228.52
Electricity 1,260 2,963.52
Total 6,137.04
5.6.4 Operation/maintenance phases
The data gathered during the operation/maintenance phases are shown in Table 5.10.
Table 5.10: Energy requirements during the operation/maintenance phases, (50 years)
Type of Energy Consumption Quantity/100m2 Cost (£) Remarks
Water 60,000 1,080,000.00
Electricity 12,600 4,233,600.00
Total 5,313,600.00
5.6.5 EoL phase
Statistics obtained during the EoL phase are illustrated in Tables 5.11 and 5.12.

Bassey B. Okon Life Cycle Assessment and Life Cycle Costs, Study Phase V
186
Table 5.11: Waste management phase, (within 1month duration)
Materials
Quantity
kg/
100 m2
Description
of
Materials
Cost of
Materials
(£)
Waste
Re-
used
(%)
Waste
Recycled
(%)
Transportation
Medium (road)
km
Steel 500 kg Steel frame 650.00 - 80 50
Cement 250 kg m-3 Foundation 22,500.00 - 90 50
Bricks 500 kg Walls 500.00 - 80 50
Wood 33.75 kg Doors 65.48 - 100 50
Total 23,715.48
Table 5.12: Energy requirements during the EoL phase
Type of Energy Consumption Quantity/100 m2 Cost (£) Remarks
Diesel 2,000 2,800.00
Electricity 140 78.40
Total 2,878.40
5.7 Building C Client: University of Liverpool, UK.
Contractor: John Turner Construction Company, UK.
5.7.1 Background of the contractor
John Turner Construction Company (JTCC) established in 1907 is based in the North
West of the UK. The organisation is a building and civil engineering contractor
specialising in new build and refurbishment of commercial, cultural, education, health,
industrial, and other infrastructure systems. The company expertise is seen in
developments and refurbishment, joinery, manufacturing, electrical services, and many
more activities. The JTCC has a reputation as one of the leading building contractors in
Liverpool, Manchester, and Preston, as well as in other cities in the UK. The company
is involved in the cutting-edge sustainability drive towards achieving best construction
practice delivery success (JTCC, Home page, 2012).
5.7.2 Type of building
The studied building is a new laboratory facility located within the University of
Liverpool. It is also a multi-storey building designed to accommodate laboratory
equipment for research purposes, and some offices. Only 100m2
of the building is

Bassey B. Okon Life Cycle Assessment and Life Cycle Costs, Study Phase V
187
investigated as the functional unit of interest. The building consists of a structural frame
and a cast-in-place concrete with brick/block walls and a long-spanned roof. The
building is provided with the following infrastructure services: heat, ventilation, water
supply, fire alarms, and energy management systems.
5.7.3 Construction phase
Statistics collected during the construction phase are presented in Tables 5.13 and
5.14.
Table 5.13: Materials quantity information
Materials
Quantity
kg /
100 m2
Description
of
Materials
Cost of
Materials
(£)
Recycling
Content
(%)
Transportation
Medium (road)
km
Steel 15,500 kg Steel frames 20,150.00 10 60
Cement 12.5 kg m-3 Concrete 1,125.00 12 40
Bricks 35 kg Facing bricks 35.00 60 150
Glass 76 kg Foundations 533.00 30 60
Plastics 55 kg Walls/uPVC 611.00 50 30
Wood 168 kg Windows/door 326.00 60 50
Paints 710 (l) General painting 2,840.00 - 40
Total 25,620.00
Table 5.14: Energy requirements during the construction phase, (4.2 months)
Type of Energy Consumption Quantity/100m2 Cost (£) Remarks
Water 5,175 652.05
Diesel 1,866 10,972.10
Electricity 1,377 3,238.70
Total 14,862.85
5.7.4 Operation/maintenance phases
Data obtained during the operation/maintenance phases are shown in Tables 5.15– 5.16.
Table 5.15: Materials requirements for minor maintenance during the construction phase
Materials
Quantity
kg/
100 m2
Description
of
Materials
Cost of
Materials
(£)
Recycling
Content
(%)
Transportation
Medium (road)
Km
Cement 5 kg m-3 Repairs 450.00 90 50
Glass 8 kg Replacement 56.14 80 50
Plastics 2 kg Replacement 22.00 60 50
Wood 5 kg Repair floor 9.70 70 30
Paints 40 (l) Painting works 160.00 60 50
Total 697.84

Bassey B. Okon Life Cycle Assessment and Life Cycle Costs, Study Phase V
188
Table 5.16: Energy requirements the building operation phase, (50 years)
Type of Energy Consumption Quantity/100m2 Cost (£) Remarks
Water 82,000 1,476,000.00
Electricity 13,770 4,626,720.00
Total 6,102,720.00
5.7.5 EoL phase
The statistics gathered during the EoL phase are provided in Tables 5.17 and 5.18.
Table 5.17: Waste management phase, (within one month duration)
Materials
Quantity
kg/
100 m2
Description
of
Materials
Cost of
Materials
(£)
Waste
Re-used
(%)
Waste
Recycled
(%)
Transportation
Medium (road)
km
Steel 8.5 kg Steel frame 11.05 100 100 50
Cement 11.3 kg m-3 Concrete 1,017.00 80 80 50
Bricks 4 kg Walls 4.00 100 70 60
Glass 3 kg Windows 21.00 90 80 30
Plastics 4 kg uPVC 44.00 - 100 60
Wood 8 kg - 15.52 100 100 50
Total 1,134.57
Table 5.18: Energy requirements during the EoL phase
Type of Energy Consumption Quantity/100m2 Cost (£) Remarks
Diesel 580 812.00
Electricity 153 85.68
Total 897.68
5.8 Building D
Client: Manchester City Council, UK.
Contractor: Northern Group Build Limited, UK.
5.8.1 Background of the contractor
Northern Group Build Limited (NGBL) is a frontline organisation with expertise
covering a diversity of infrastructure sectors ranging from education, sports, leisure and
healthcare. It also undertakes residential, commercial, and recreational parks facilities
amongst others. The company is deeply involved in sustainability ethics in the delivery
of viable projects. In addition, the construction team has completed some of the most

Bassey B. Okon Life Cycle Assessment and Life Cycle Costs, Study Phase V
189
prestigious projects in Greater Manchester and the North West of the UK. Remarkably,
infrastructure projects such as the City of Manchester Stadium, Manchester United
Training Ground, the Preston Temple Complex, and a wide range of top specification
residential developments are managed by this organisation.
The company‟s projects‟ expertise spans from the performance of feasibility studies
to proposals for development options and investment opportunities. It also possesses
know-how in a wide range of technical areas: delivering excellent design, engineering,
and innovative construction. Activities such as testing, commissioning, handing over,
operation, maintenance, and decommissioning of sustainable building infrastructure
services are undertaken by this company. Through its self-delivery capabilities NGBL is
able to deliver broad services that drive out waste and mitigate risk management. This
allows for the integration of efficient and effective project resources, thereby increasing
productivity. The company is keen to explore sustainable growth and infrastructure
which will leave a legacy for the future generations (NGBL, New Build, 2012).
5.8.2 Type of building
The investigated building in this phase of the study is a six-storey high-rise
residential (multi-occupant) type, located within the Manchester city centre. This
building is constructed with steel frame, brick/block walls, and green roofing.
Additionally, it is fitted with good quality and sustainable materials to include
partitioning boards, HVAC, heating installation, efficient lighting systems, fire alarms
and sensor-based dimmable devices. This building is designed and constructed with the
integration of grey water management and sustainable technologies to provide quality
services to the occupants. The functional unit of interest in this building during the
research was 100m2.
5.8.3 Construction phase
Statistics obtained during the construction phase are displayed in Tables 5.19 and
5.20.

Bassey B. Okon Life Cycle Assessment and Life Cycle Costs, Study Phase V
190
Table 5.19: Materials quantity information
Materials
Quantity
kg/
100 m2
Description
of
Materials
Cost of
Materials
(£)
Recycling
Content
(%)
Transportation
Medium (road)
km
Steel 17,500 kg Steel frame 22,750.00 80 150
Cement 14.8 kg m-3 Concrete, other 1,332.00 100 50
Bricks 33 kg Single face 33.00 90 35
Glass 80 kg Window/Doors 561.60 20 40
Plastics 60 kg Trucking generally 666.67 10 30
Wood 180 kg Doors/frames 349.20 80 30
Paints 800 (l) Painting/decorating 3,200.00 - 30
Total 28,891.87
Table 5.20: Energy requirements during the construction phase, (4.2 months)
Type of Energy Consumption Quantity/100m2 Cost (£) Remarks
Water 100,000 1,260.00 Sanitary use
Diesel 2,366 13,912.10
Electricity 1,548 3,640.90
Total 18,813.00
5.8.4 Operation/maintenance phases
Data gathered during the operation/maintenance phases are shown in Tables 5.21 and
5.22.
Table 5.21: Materials requirements for minor maintenance during the construction phase
Materials
Quantity
kg/
100 m2
Description
of
Materials
Cost of
Materials
(£)
Recycling
Content
(%)
Transportation
Medium (road)
km
Cement 2 kg m-3 Masonry work 180.00 100 30
Glass 3 kg Replacement 90.00 90 50
Plastics 3 kg Broken pipes 17.70 80 40
Wood 8 kg Wooden work 15.52 80 30
Paints 60 (l) Decoration etc. 240.00 - 30
Total 543.22
Table 5.22: Energy requirements during the operation/maintenance phases, (50 years)
Type of Energy Consumption Quantity/100m2 Cost (£) Remarks
Water 86,000 1,540,000.00
Electricity 15,480 5,201,280.00
Total 6,741,280.00
5.8.5 EoL phase

Bassey B. Okon Life Cycle Assessment and Life Cycle Costs, Study Phase V
191
The information obtained during the EoL phase is illustrated in Tables 5.23 and 5.24.
Table 5.23: Energy requirements during the EoL phase (within 1month duration)
Materials
Quantity
kg/
100 m2
Description
of
Materials
Cost of
Materials
(£)
Waste
Re-
used
(%)
Waste
Recycled
Transportation
Medium
(road) km
Steel 19,500 kg Structural
joists
12,250.
00
- 80 30
Cement 22,202 kg
m-3
General
works
1,998,180.00 - 80 30
Bricks 33 kg Walls 16.50 - 90 30
Glass 83 kg Doors,
windows
2,490.00 - 100 30
Plastics 88 kg Accessories 372.00 - 80 30
Wood 488 kg Doors 375.00 - 100 30
Total 2,013,684.00
Table 5.24: Energy requirements during the EoL phase
Type of Energy Consumption Quantity/100m2 Cost (£) Remarks
Diesel 2,050 2,870.00
Electricity 172 96.32
Total 2,966.32
5.9 Building E
Client: Royal Northern College of Music (RNCM) Manchester, UK.
Contractor: Overburry Construction Company, UK.
5.9.1 Background of the contractor
Overbury Construction Company, (OCC) UK is passionate about sustainability
and focuses on three key elements of responsibility: social, environmental and economic
goals. The organisational activities cover education, health and safety, through to
diversity, equality, and corporate community involvement. The firm is not only
committed to making a great place for all employees, but also looks after employees‟
general welfare. This includes clients, sub-contractors, suppliers, residents, and local
communities.
OCC is dedicated to reducing the environmental impacts associated with industry
activities. Indeed, it is the only construction company to have a carbon footprint

Bassey B. Okon Life Cycle Assessment and Life Cycle Costs, Study Phase V
192
calculator (CFC) developed by AMEE. This calculator allows for the establishment of
the carbon impact of any refurbishment projects. It thereby improves the efficiency of
an organisation through procurement and supply chain processes. As a best practice,
communication and information security can not only deliver more sustainable results to
a project and organisation, but can also help to reduce costs (OCC, 2012).
5.9.2 Type of building
A two-storey building was examined at the Royal Northern College of Music within
a functional unit of 100m2. The building envelope is made of a structural frame and
cast-in-place concrete, brick/block walls and external wall cladding. In addition, the
building is furnished with efficient lighting systems such as sensor-based dimmable
controllers, water distribution network, and good heating installation. The design and
installation of sustainable technologies within this building promote better management
performance of the infrastructure services delivery.
5.9.3 Construction phase
The information obtained during the construction phase in this study is depicted in
Tables 5.25 and 5.26.
Table 5.25: Materials quantity information
Materials
Quantity
kg/
100 m2
Description
of
Materials
Cost of
Materials
(£)
Recycling
Content
(%)
Transportation
Medium (road)
km
Steel 15,400 kg Steel frames 20,020.00 100 80
Cement 12 kg m-3 Concrete work 1,080.00 100 20
Bricks 28 kg Old/New build 28.00 100 200
Glass 74 kg Old/New build 519.48 100 30
Plastics 57 kg Old/New build 336.30 10 20
Wood 172 kg Old/New build 333.68 - 20
Paints 700 (l) Old/New build 2,800.00 - 20
Total 25,117.46
Table 5.26: Energy requirements for during the construction phase, (4.2 months)
Type of Energy Consumption Quantity/100m2 Cost (£) Remarks
Diesel 1,820 10,710.60
Water 1,910 240.66
Electricity 1,116 2,624.83
Total 13,576.09
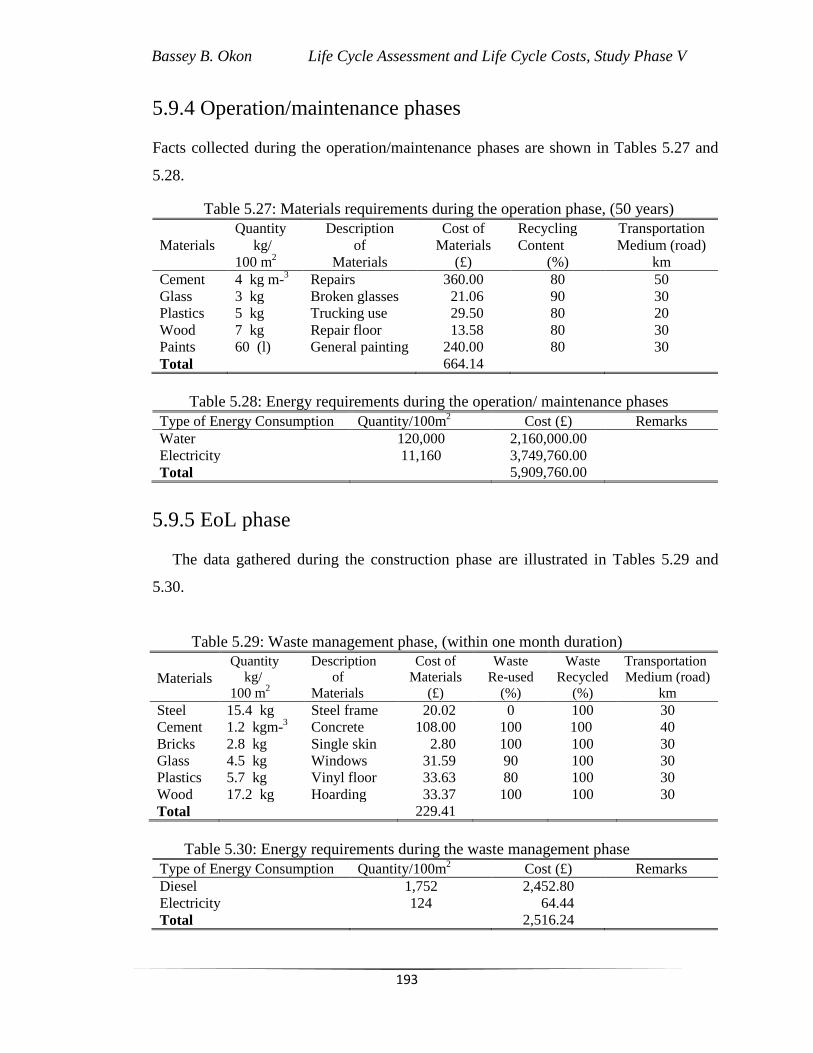
Bassey B. Okon Life Cycle Assessment and Life Cycle Costs, Study Phase V
193
5.9.4 Operation/maintenance phases
Facts collected during the operation/maintenance phases are shown in Tables 5.27 and
5.28.
Table 5.27: Materials requirements during the operation phase, (50 years)
Materials
Quantity
kg/
100 m2
Description
of
Materials
Cost of
Materials
(£)
Recycling
Content
(%)
Transportation
Medium (road)
km
Cement 4 kg m-3 Repairs 360.00 80 50
Glass 3 kg Broken glasses 21.06 90 30
Plastics 5 kg Trucking use 29.50 80 20
Wood 7 kg Repair floor 13.58 80 30
Paints 60 (l) General painting 240.00 80 30
Total 664.14
Table 5.28: Energy requirements during the operation/ maintenance phases
Type of Energy Consumption Quantity/100m2 Cost (£) Remarks
Water 120,000 2,160,000.00
Electricity 11,160 3,749,760.00
Total 5,909,760.00
5.9.5 EoL phase
The data gathered during the construction phase are illustrated in Tables 5.29 and
5.30.
Table 5.29: Waste management phase, (within one month duration)
Materials
Quantity
kg/
100 m2
Description
of
Materials
Cost of
Materials
(£)
Waste
Re-used
(%)
Waste
Recycled
(%)
Transportation
Medium (road)
km
Steel 15.4 kg Steel frame 20.02 0 100 30
Cement 1.2 kgm-3 Concrete 108.00 100 100 40
Bricks 2.8 kg Single skin 2.80 100 100 30
Glass 4.5 kg Windows 31.59 90 100 30
Plastics 5.7 kg Vinyl floor 33.63 80 100 30
Wood 17.2 kg Hoarding 33.37 100 100 30
Total 229.41
Table 5.30: Energy requirements during the waste management phase
Type of Energy Consumption Quantity/100m2 Cost (£) Remarks
Diesel 1,752 2,452.80
Electricity 124 64.44
Total 2,516.24

Bassey B. Okon Life Cycle Assessment and Life Cycle Costs, Study Phase V
194
5.10 Building F
Client: University of Liverpool, Apex Project, UK.
Contractor: Shepherd Building Group, UK.
5.10.1 Background of the contractor
Shepherd Building Group (SBG) is one of the leading family-owned private
businesses in the UK. The organisation was founded in 1890 with its head office in
York. The company‟s operations in both national and international markets include
substantial companies in the construction, engineering, sustainability, manufacturing
and property development. Furthermore, the SBG services cover construction across the
private and public sectors within mechanical and electrical engineering, air
conditioning, and process services engineering. The company also manufactures
modular building systems, park and leisure homes, integrated equipment housing, and
bulk solids material handling systems. Additionally, it undertakes modular building
hires, infrastructure and commercial property development. Success recorded by this
company from inception has been characterised by high professional standards,
innovations, and multi-disciplinary solutions to market demands (SGB, 2012).
5.10.2 Type of building
The building considered in this study is a newly constructed four-storey high-rise
type located within the University of Liverpool. Basically, the functional unit of interest
in this building during the research was 100m2. The building is made of a structural
steel frame, brick/block walls and long-spanned roof. In this building, there are several
installations of systems utilities to include heat, ventilation, HVAC, water supply, fire
alarms, and sensor-based dimmable energy delivery among others. The provision of
these infrastructure components aids in achieving sustainability within this building.
5.10.3 Construction phase
The statistics obtained relating to the construction phase are shown in Tables 5.31
and 5.32.

Bassey B. Okon Life Cycle Assessment and Life Cycle Costs, Study Phase V
195
Table 5.31: Materials quantity information
Materials
Quantity
kg/
100m2
Description
of
Materials
Cost of
Materials
(£)
Recycling
Content
(%)
Transportation
Medium (road)
km
Steel 10,000 kg Structural frame 13,000.00 100 50
Cement 5 kg m-3 Concrete C30 450.00 100 50
Bricks 25 kg Double walls 25.00 100 35
Glass 60 kg Window other 421.20 20 40
Plastics 50 kg Trucking, doors 295.00 10 22
Wood 150 kg Doors/frames 291.00 90 30
Paints 600 (l) Painting works 2,400.00 - 20
Total 16,882.20
Table 5.32: Energy requirements during the construction phase, (4.2 months)
Type of Energy Consumption Quantity/100m2 Cost (£) Remarks
Water 5,000 630.00 Sanitary use
Diesel 1,051 1,471.14
Electricity 1,818 4,275.94
Total 6,377.08
5.10.4 Operation/Maintenance Phases
The data gathered during the operation/maintenance phases are presented in
Tables 5.33 and 5.34.
Table 5.33: Materials requirements for minor maintenance during the construction phase
Materials
Quantity
kg/
100 m2
Description
of
Materials
Cost of
Materials
(£)
Recycling
Content
(%)
Transportation
Medium (road)
km
Cement 10 kg m-3 Concrete/mortar 900.00 100 30
Glass 1 kg Double glazing 7.02 20 40
Plastics 3 kg Doors, trucking 1,770.00 10 22
Wood 2 kg Doors/frames 3.88 80 30
Paints 56 (l) Decoration matt 224.00 - 30
Total 2,904.90
Table 5.34: Energy requirements during the operation/maintenance phases, (50 years)
Type of Energy Consumption Quantity/100 m2 Cost (£) Remarks
Water 110,000 1,980,000.00
Electricity 18,180 6,018,480.00
Total 7,898,480.00
5.10.5 EoL Phase
The statistics obtained during the EoL phase are given in Tables 5.35 and 5.36.

Bassey B. Okon Life Cycle Assessment and Life Cycle Costs, Study Phase V
196
Table 5.35: Waste management phase, (within one month duration)
Materials
Quantity
kg/
100 m2
Description
of
Materials
Cost of
Materials
(£)
Waste
Re-used
(%)
Waste
Recycled
(%)
Transportation
Medium (road)
km
Steel 500 kg Steel works 650.00 - 100 50
Cement 250 kg m-3 Concrete 22,500.00 - 90 50
Wood 33.8 kg IPS Panels 65.57 - 100 50
Total 23,215.57
Table 5.36: Energy requirements during the waste management phase
Type of Energy Consumption Quantity/100m2 Cost (£) Remarks
Diesel 2,730 3,822.00
Electricity 202 113.12
Total 3,945.12
Table 5.41 on page 219 provides a summary of all these costs. More information
about this examination at each stage of the activities in each building unit is presented in
Appendix XI.
5.11 Assumptions in the study phase V
The following assumptions have been made in this study:
All the recyclable materials in the waste stream are returned into the same
system over the life cycle;
The cost indicated is exclusive of the labour, fixing, hiring of equipment and
haulage of materials to the various construction sites;
The recycling cost of waste materials is not included in this phase of analysis;
The material quantities related to Buildings A–F were as provided by the estate,
facilities and project managers in these construction companies, universities and
college;
The cost analysis as applied in this situation is in accordance with the current UK
standard; and,
Higher impact in terms of carbon emission is associated with the fossil fuel
consumption and electricity in all cases over the life cycle.

Bassey B. Okon Life Cycle Assessment and Life Cycle Costs, Study Phase V
197
5.12 Life cycle impact
In this research, the LCA of ten characteristics associated with the supply chain
within building infrastructure using the CML (2007) impact assessment method were
examined. CML is a method developed in the Centre of Environment Science of the
Leiden University in Netherlands for impact analysis study. The impact evaluation was
conducted to encompass both characterisation and weighting steps in accordance with
the ISO 14044 standard (Szalay et al., 2011; Guinea et al., 2001). The achievable results
show the significance of the life cycle within the investigated buildings with reference
to the employable functional unit. Detailed information regarding the individual impact
analysis and other methods are provided in the subsequent sections of this thesis.
The ten environmental impacts that were analysed are depicted in Figure 5.2.
Thereafter, Figures 5.3–5.12 illustrate the analysed LCA impact results and provide a
discussion in each case.
Figure 5.2: Analysed LCA environmental impacts (Guinee et al., 2001)

Bassey B. Okon Life Cycle Assessment and Life Cycle Costs, Study Phase V
198
5.12.1 Abiotic depletion potential [Sb equivalent]
The total abiotic depletion potential (ADP) impact assessment of the buildings
ranges are 2,000–3,300 (Sb –eq.) per 100m2. As shown in Figure 5.3, Building D has
the highest ADP of those considered. Moreover, the total ADP of Building D 3,300 (Sb
–eq.) is about 40% higher than that of Building B, which has the lowest ADP compared
to all the buildings considered. The operation and maintenance stages are the major
contributor to the total ADP in all the building options assessed, accounting for over
90% of the total ADP. This is mainly as a result of energy (electricity and heat)
consumption in the buildings over the life cycle. Similarly, the construction stage
accounts for between 3–16% of the total ADP in all the buildings considered; this
contribution is mainly from the production of materials used for the construction.
Figure 5.3: Abiotic depletion potential (ADP) life cycle impact results
However, the credits from materials recycling at the EoL reduce the total ADP by 1–
9.5% as revealed in Figure 5.3. Therefore, it has been assumed in this analysis that all
the construction materials used are recycled at the EoL. Typically, the total ADP of
Building D is decreased by about 8% due to credits from recycling of materials at EoL

Bassey B. Okon Life Cycle Assessment and Life Cycle Costs, Study Phase V
199
stage. Thus, this highlights the importance of recycling materials at the end-of-life
rather than disposing of them. The outcome of this study is valid and supports
discussions in the literature (Guinee, et al., 2001; Junnila and Horvath, 2003).
5.12.2 Acidification potential [SO2 equivalent]
The impact examination went further with the acidification potentials (AP).
Consequently, the six buildings were evaluated. The results noted the total AP of the
buildings range is 1,200–3,300 (SO2 –eq.) per 100m2 of sulphur dioxide as indicated in
Figure 5.4. In this analysis, Building D is leading with the AP of about 3,300 SO2 –eq.
Therefore, 64% of this (SO2 –eq.) is achieved between Buildings D and B in contrast
within this background. In the operation and maintenance stages, the research observed
that over 90% of the entire AP is obtained within this phase. This outcome however
explains the energy utilisation in terms of electricity and heat within these buildings
over the life cycle of this study. In this situation, the result is very consistent with the
literatures of Guinea et al. (2001), and Blengini (2009) on the energy, water and other
resources management at the maintenance and operation phases of any sustainable
building project.
In addition, the construction stage of these buildings account for 2–11% of the
overall AP in this scenario. The indication shows the main impact provider is associated
with the materials processes during the construction activities. From Figure 5.4 also, the
benefits accrued at the EoL phase yield 0–0.4% AP from the materials recycling, hence
reducing the related impacts. Accordingly, the results suggest virtually all the
construction materials employed in this case are recycled at the EoL stage of the
buildings. On the whole, the total AP of Building D is declined to about 3% in view of
the gains from the recycling of materials at the EoL phase. This reveals the significance
of recycling materials at the EoL stage of any sustainable infrastructure other than
disposal at the landfill. Nonetheless, studies previously conducted (by Junnila and
Horvath, 2003; Cabal et al., 2005; Zabalza et al., 2009) also confirm this result.

Bassey B. Okon Life Cycle Assessment and Life Cycle Costs, Study Phase V
200
Figure 5.4: Acidification potential (AP) life cycle impact results
5.12.3 Eutrophication potential [phosphate (PO4-) equivalent]
The results analysis in this scenario is depicted in Figure 5.5. From the
eutrophication (EP) outcome, it is revealed that Building D gained the highest hot-spots.
However, the overall EP of the buildings varies from 90–200 (PO4- -eq.) per 100m
2 of
phosphate emission in all the cases. Also, Building D is topmost with the EP above 200
PO4- -eq. This explains 55% (PO4
- -eq.) in the analysis between Buildings D and C
gaining the highest and lowest EP compared to other buildings in this context. At the
operation and maintenance phases, the research discovered crucial project actions were
involved with over 90% of the total EP. These activities are basically utilities services
delivery (water, energy, heating, and wastewater) among others within the building
services infrastructure life cycle.
On the other hand, the construction phase accounts for between 5–29% of the total
EP in all the buildings considered in this class. This contribution is principally from the
production of materials used for the construction projects.

Bassey B. Okon Life Cycle Assessment and Life Cycle Costs, Study Phase V
201
Figure 5.5: Eutrophication potential (EP) impact results
Further indications from the results are that the credits from materials recycling at the
EoL reduce the total EP between 1–15% (Figure 5.5). In fact, the analysis revealed that
almost all the construction materials used in this perspective are recycled at the EoL.
Although, the total EP of Building D is decreased by 15% due to derivable benefits
from recycling of materials at the EoL, it is nevertheless adduced that Building E is not
likely to promote phosphates wastewater and other waste substances discharged into the
environment comparatively during construction activities.
Generally, the waste released as a consequence, if not properly managed, can
encourage environmental menace to both life and property at large. This result is
consistent with the views of Junnila and Horvath (2003).
5.12.4 Freshwater aquatic ecotoxicity potential [DCB]
From Figure 5.6, the freshwater aquatic ecotoxicity potential analysis (DCB-eq.) per
100m2 is seen. It is suggested within all the buildings, that the highest and lowest
activities are 1,600–11,200 (DCB-eq.). Building D is marked with the highest impact
potential in this class.
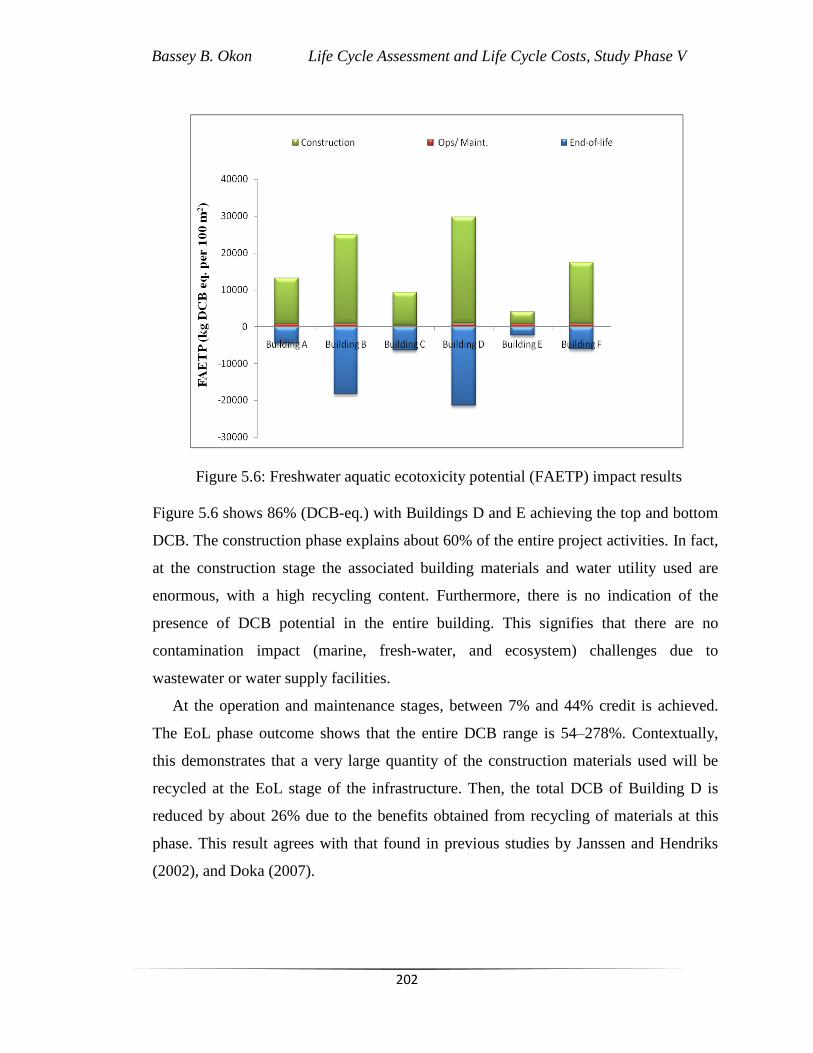
Bassey B. Okon Life Cycle Assessment and Life Cycle Costs, Study Phase V
202
Figure 5.6: Freshwater aquatic ecotoxicity potential (FAETP) impact results
Figure 5.6 shows 86% (DCB-eq.) with Buildings D and E achieving the top and bottom
DCB. The construction phase explains about 60% of the entire project activities. In fact,
at the construction stage the associated building materials and water utility used are
enormous, with a high recycling content. Furthermore, there is no indication of the
presence of DCB potential in the entire building. This signifies that there are no
contamination impact (marine, fresh-water, and ecosystem) challenges due to
wastewater or water supply facilities.
At the operation and maintenance stages, between 7% and 44% credit is achieved.
The EoL phase outcome shows that the entire DCB range is 54–278%. Contextually,
this demonstrates that a very large quantity of the construction materials used will be
recycled at the EoL stage of the infrastructure. Then, the total DCB of Building D is
reduced by about 26% due to the benefits obtained from recycling of materials at this
phase. This result agrees with that found in previous studies by Janssen and Hendriks
(2002), and Doka (2007).

Bassey B. Okon Life Cycle Assessment and Life Cycle Costs, Study Phase V
203
5.12.5 Global warming potential [carbondioxide equivalent]
Figure 5.7: Global warming potential (GWP100) impact results.
The investigated global warming potential carbondioxide (CO2) impacts related to
the buildings are (300,000–600,000 CO2- eq.) per 100m2. However, the result shows
94% GWP100 within all the buildings. It is also revealed in this study that Building D is
leading with the highest GWP100 above 600,000 (CO2- eq.). Consequently, Building D is
about 45% higher than Building C, which has the lowest GWP100 compared to all the
buildings considered. Apparently, the operation and maintenance stages are the major
contributors to the total GWP100 in all the building options assessed, accounting for over
97% of the total GWP100. This is largely as a result of energy utilities (electricity and
heat) consumption per 100m2 over the life cycle of the buildings.
The construction phase accounts for between 3–12% (CO2- eq.) of the entire GWP100
within all the buildings (Figure 5.7). The GWP100 analysis revealed that this
contribution is primarily from the production of materials used for the construction
activities. In essence, the GWP100 from the remaining ancillary raw materials with the
rest of the life cycle chain is very small in this scenario. The credits from materials
recycling at the EoL stage, reduced the total GWP100 by 0.3–3%. Therefore, it has been

Bassey B. Okon Life Cycle Assessment and Life Cycle Costs, Study Phase V
204
suggested that all the construction materials utilised in this investigation are recycled at
the EoL. In this scenario, the total GWP100 of Building D drops by about 0.3% due to
credits from the recycling of materials at the EoL stage of the building.
This emphasises the importance of recycling materials at the EoL instead of
depositing them as waste at the dump site. The result is very reliable given that the
buildings will probably not promote global warming emissions. The GWP100 index
usually occurs due to the greenhouse gases (carbon dioxide) emitted through burnt
natural cooking gas, fossil fuels, chemicals and electricity supply within the buildings.
This finding is in agreement with the earlier studies conducted by Guinea et al. (2001)
and Cabal et al. (2005) in managing building infrastructure systems.
5.12.6 Human toxicity potential [DCB equivalent]
The human toxicity potential (HTP) impact of the entire buildings is in the range
33,000–350,000 (DCB-eq.) per 100m2. Building C takes the lead with the HTP (DCB-
eq.) impact. The findings signify that Building C is 91% over Building E considering
the highest and lowest hot spots from Figure 5.8. In this situation, the construction stage
gained 10–226% (DCB-eq.) in all the buildings. This result explains the involvement of
mostly virgin raw materials (aggregates) and their transportation during the construction
phase of the building infrastructure. At the operation and maintenance phase, Building
C achieved over 300,000 (DCB- eq.), showing a considerable difference in comparison
with the other buildings. The result may also be mainly due to the energy utilities
(electricity and heating) expended on the building over the life cycle. Within this
category, the other remaining buildings‟ HTP are very low as illustrated in Figure 5.8.
Inventory analysis at the EoL phase is top marked by Building D ahead of B.
Therefore, the reuse benefits from materials recycling at the EoL stage have brought the
total DCB to 3–195%. The investigation revealed that in all the buildings, less than 4%
of the construction materials were sent to the landfill and that over 96% were converted
into recycled materials.

Bassey B. Okon Life Cycle Assessment and Life Cycle Costs, Study Phase V
205
Figure 5.8: Human toxicity potential (HTP) impact results
This further stresses the significance of recycling of materials rather than final disposal
as waste. Notably, the HTP impact towards infrastructure management underscores the
reduction of pollution arising from human waste, physical, biological, radiological and
chemical effects on the ecosystems generally. The results demonstrated that these
indices are mitigated at the EoL period. This discovery is in support with the literatures
of Junnila and Horvath (2003), and Blengini (2009).
5.12.7 Marine aquatic ecotoxicity potential [DCB equivalent]
The marine aquatic ecotoxicity potential (MAETP) study shows Building D to be on
the top scale with over 6.00E+07 (DCB-eq.) per 100m2. From Figure 5.9 also, the
results present the total MAETP of the buildings range 16.00E+06 – 41.00E+06
yielding 61% (DCB-eq.). Within this background, therefore Building D is 61% over
Building C considering the totality of top and bottom marked project activities. The
construction stage constitutes a relative contribution of the usable building materials to
the impacts relevant to the pre-use phase of the entire building infrastructure. As a
result, it accounts for 19–127% (DCB- eq.) in all the evaluated buildings. This shows

Bassey B. Okon Life Cycle Assessment and Life Cycle Costs, Study Phase V
206
the amount of raw materials consumption and energy (transportation) associated within
the buildings life cycle.
Figure 5.9: Marine aquatic ecotoxicity potential (MAETP) impact results
The operation and maintenance scenarios range is 57–92% (DCB- eq.) throughout
the entire buildings. At this phase also, Building E is leading with 92% (DCB- eq.)
comparatively. This becomes obvious due to the amount of credit gains at the EoL
phase. The study further reveals that the EoL stage is within 10–89 % (DCB- eq.), as
shown in Figure 5.9. Therefore, the outcome indicates that over 80% of the exploitable
raw materials used in the infrastructure, will be recycled at the EoL stage and that very
little will be deposited at the landfill. Moreover, it is suggested that the buildings impact
of toxic substances emission due to MAETP and the ecosystems will be negligible. The
results are in accord with those of Cabal et al. (2005) and D‟Souza et al. (2011) in
evaluating building infrastructure systems.
5.12.8 Ozone layer depletion potential [RII equivalent]
The analysis of the ozone layer depletion potential (ODP) was conducted. Figure 10
shows that the total ODP in all the buildings is between 0.03–0.1 (RII- eq) per 100m2.

Bassey B. Okon Life Cycle Assessment and Life Cycle Costs, Study Phase V
207
With this evidence, it can be seen that 70% of (RII- eq) within Buildings D and C as the
maximum and minimum hot spots in terms of project activities.
Figure 5.10: Ozone layer depletion potential (ODP) impact results
The construction stage contributes the least in building operations with only 2–7% (RII-
eq). As a consequence, the research suggests many infrastructure construction materials
are not applicable, thereby creating very low ODP impacts in this scenario. It is also an
indication that the construction materials were recyclable. In the operation and
maintenance situations, findings revealed 93–98% (RII-eq) information between
Buildings C and D in all the buildings considered. The operation and maintenance
stages have been responsible for over 98% of the whole activities within the
infrastructure. This maintained the amount of energy and utilities usage during the
buildings‟ life cycles (Figure 5.10).
The total credits from the materials recycling at the EoL stage are in the ODP range
0.1–2%. Hence, it is inferred by this examination that all the construction materials used
in this study are recycled at the EoL phase. Specifically, the total ODP of Building D is
decreased by about 1% due to credits from the recycling of materials at the EoL. In this
case, the result further shows the importance of recycling of materials at the EoL rather
than disposal. Similarly, the potential effects of ozone layer depletion as a consequence

Bassey B. Okon Life Cycle Assessment and Life Cycle Costs, Study Phase V
208
of these buildings will be very insignificant to both man and the environment. These
findings are in agreement with the views of the CIOB (2003), and Blengini (2009) in
their appraisal of buildings‟ sustainability (Figure 5.10).
5.12.9 Photochem ozone creation potential [C2H4 equivalent]
The research analysis in Figure 5.11 shows that all the buildings reach 82–192
ethylene C2H4-eq. per 100m2. Also, Building D has the highest POCP of those
considered. The overall POCP of Building D (192 C2H4 –eq.) is about 57% higher than
that of Building C, which has the lowest POCP relatively to all the buildings. In the
same manner, the construction stage accounts for between 4–24% of the entire POCP in
all the buildings examined. Ultimately, this contribution is mainly from the production
of materials used for the construction activities. This demonstrates that over 20% of
these of construction materials are recyclable.
Figure 5.11: Photochem ozone creation potential (POCP) impact results
Operation and maintenance phases are the major contributor to the total POCP in all
the building options assessed, accounting for over 96% of the total. This is primarily as
a result of energy utilities (electricity and heat) consumption in the buildings over the
life cycle. Considering the EoL history, the analysis found that the total POCP has

Bassey B. Okon Life Cycle Assessment and Life Cycle Costs, Study Phase V
209
declined between 1–11% suggesting that almost all the construction materials are
potentially reusable. It is apparent that Building D has decreased by about 11% due to
benefits accrued from the recycling of materials at the EoL stage (Figure 5.11). These
indices underscore the economic importance of using sustainable and recyclable
materials for building infrastructure systems delivery. This result is akin to that obtained
by Guinea et al. (2001).
5.12.10 Terrestric ecotoxicity potential [DCB equivalent]
In Figure 5.12, findings of the entire buildings range are 332 –1150 Ethene –eq. per
100m2. The category gained a TETP impact of 71% Ethene –eq. representing the total
buildings highest and lowest marked activities. The construction phase describes the
project operation TETP contribution as being between 82–387% of the whole TETP
within this context. Further examinations of the related activities indicate that a huge
volume of the construction materials was applicable during the buildings project at this
stage. Hence, the raw (virgin) materials aggregates and their transportation with other
construction materials are recyclable. Having obtained these high proportions of
construction materials, the TETP impact at this phase is maximally controlled.
Figure 5.12: Terrestric ecotoxicity potential (TETP) impact results

Bassey B. Okon Life Cycle Assessment and Life Cycle Costs, Study Phase V
210
Operation and maintenance stages in this study illustrate the total buildings TETP
range as 28–84%. This is mainly as a result of energy utilities (electricity and heat)
consumption in the buildings over the life cycle. The EoL record shows that TETP
achieved less than 66–300% explaining the credits from recycling of materials at this
stage. That is, approximately 1% of the materials used during the construction activities
will be recovered. This indication demonstrates a good degree of the life cycle potential
of the TETP at these stages of the building infrastructure (Figure 5.12). On this premise,
the analysed buildings are found likely not to emit pollution of toxic substances. This
result is similar to that found by the NSF (2005), and Doka (2007), in evaluating the
building infrastructure.
5.12.11 Review of the building phases analysis results
A review of the ten investigated impacts at the construction, operation (use)
/maintenance, and the end-of-life (EoL) phases, was undertaken. In this analysis, it is
found that the most significant impact within the six buildings occurs during the
construction and operation (use)/maintenance phases (BREEAM, 2008; Minx, 2008).
Previous studies (see NIBS, 2006; Ding, 2008; Oritz, et al., 2009; Nebel, 2006;
Peuportier and Herfray, 2011) have also confirmed that construction, and operation
(use) with maintenance phases of building, carry higher impact. The EoL stage in all
cases, shows the economic benefits derived from recycling materials (Flapper et al.,
2005; GSGF, 2010). This indication further explains the gains associated with the
selection of recyclable materials for construction instead of non-recyclable materials
which will eventually be disposed in a landfill at the EoL stage (WRAP, 2011; Wyatt,
1994; GBPC, 2010).
5.13 Normalisation of the calculated results
This research further normalises the results as indicated in Table 5.37. Normalisation
provides for the distribution of the individual impact results (Peuportier and Herfray,
2011). Szalay et al. (2011) and ARUP (n.d) note that normalisation is the sum of the
magnitude of the category indicator results relative to reference data. Cabal et al. (2005)

Bassey B. Okon Life Cycle Assessment and Life Cycle Costs, Study Phase V
211
maintained that normalisation is a more robust step aimed at identifying the relative
significance and magnitude of the investigated outcomes as best practice. In this study it
is necessary to determine particular impact results for comparison with the
environmental benefits regarding the recyclable credits or damages analysis. For that
reason, the normalisation stage addresses the characterisation pattern relative to such
situation. The magnitudes of the indicator results were calculated alongside the supplied
and measured field data (Appendix V). This reference information was analysed in
relation to the individual buildings over a period of 50 years life cycle.
In this situation, since the measured field data were obtained within the UK, a
normalisation method applicable to the European Union (EU) was chosen for the
investigation (Table 5.37). Typical of the EU‟s normalisation method is the CML
version previously used in similar studies (see Bayer et al., 2010; Guinee et al., 2001;
Cabal et al., 2005). Nonetheless, the EU factors normalisation was considered necessary
for the quantification of data in this investigation. These factors are presented in the
impact column against the examined buildings (BLG‟s).
Table 5.37: Normalisation factors
Impact BLG A BLG B BLG C BLG D BLG E BLG F
ADP 2.55E+03 2.00E+03 2.25E+03 3.33E+03 2.78E+03 2.71E+03
AP 2.47E+03 2.02E+03 1.20E+03 3.26E+03 2.71E+03 2.62E+03
EP 1.36E+02 1.41E+02 8.61E+01 1.81E+02 1.38E+02 1.44E+02
FAETP 8.53E+03 6.57E+03 2.84E+03 8.20E+03 1.64E+03 1.11E+04
GWP 4.51E+05 3.52E+05 3.48E+05 5.96E+05 4.94E+05 4.76E+05
HTP 3.80E+04 3.32E+04 3.47E+04 5.20E+04 3.55E+04 4.22E+04
MAETP 3.14E+02 2.66E+02 1.61E+02 4.07E+02 2.56E+02 3.59E+02
ODP 6.48E+02 4.96E+02 2.63E+02 8.42E+02 7.16E+02 6.89E+02
POCP 1.45E+02 1.32E+02 8.25E+01 1.92E+02 1.56E+02 1.53E+02
TETP 9.35E+02 6.29E+02 3.32E+02 8.85E+02 4.08E+02 1.15E+03
The impact weighting appraisal of the individual factors was conducted. That is, the
normalised indicator results for each impact category were assigned numerical factors in
conformity with their relative significance (Guinee et al., 2001, Heidi, et al., 2005).
Then, these factors were subsequently multiplied and aggregated into a single score that
represents the environmental performance as illustrated in Table 5.38. Therefore, the
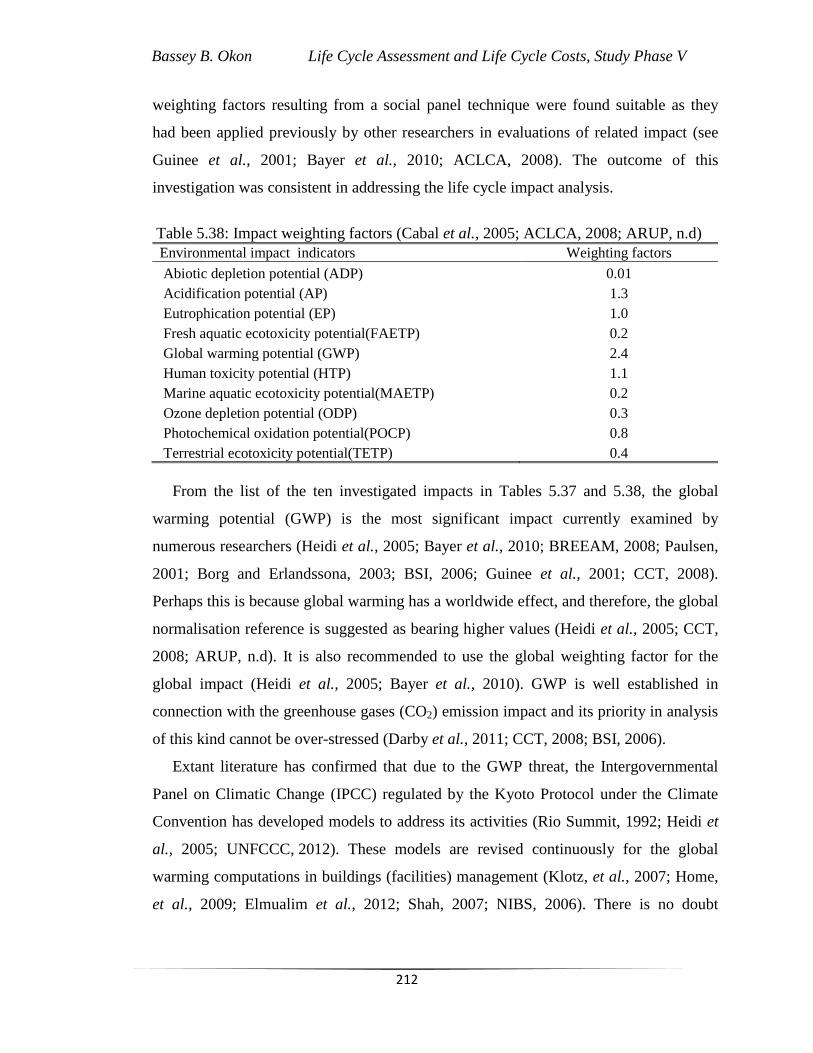
Bassey B. Okon Life Cycle Assessment and Life Cycle Costs, Study Phase V
212
weighting factors resulting from a social panel technique were found suitable as they
had been applied previously by other researchers in evaluations of related impact (see
Guinee et al., 2001; Bayer et al., 2010; ACLCA, 2008). The outcome of this
investigation was consistent in addressing the life cycle impact analysis.
Table 5.38: Impact weighting factors (Cabal et al., 2005; ACLCA, 2008; ARUP, n.d)
Environmental impact indicators Weighting factors
Abiotic depletion potential (ADP) 0.01
Acidification potential (AP) 1.3
Eutrophication potential (EP) 1.0
Fresh aquatic ecotoxicity potential(FAETP) 0.2
Global warming potential (GWP) 2.4
Human toxicity potential (HTP) 1.1
Marine aquatic ecotoxicity potential(MAETP) 0.2
Ozone depletion potential (ODP) 0.3
Photochemical oxidation potential(POCP) 0.8
Terrestrial ecotoxicity potential(TETP) 0.4
From the list of the ten investigated impacts in Tables 5.37 and 5.38, the global
warming potential (GWP) is the most significant impact currently examined by
numerous researchers (Heidi et al., 2005; Bayer et al., 2010; BREEAM, 2008; Paulsen,
2001; Borg and Erlandssona, 2003; BSI, 2006; Guinee et al., 2001; CCT, 2008).
Perhaps this is because global warming has a worldwide effect, and therefore, the global
normalisation reference is suggested as bearing higher values (Heidi et al., 2005; CCT,
2008; ARUP, n.d). It is also recommended to use the global weighting factor for the
global impact (Heidi et al., 2005; Bayer et al., 2010). GWP is well established in
connection with the greenhouse gases (CO2) emission impact and its priority in analysis
of this kind cannot be over-stressed (Darby et al., 2011; CCT, 2008; BSI, 2006).
Extant literature has confirmed that due to the GWP threat, the Intergovernmental
Panel on Climatic Change (IPCC) regulated by the Kyoto Protocol under the Climate
Convention has developed models to address its activities (Rio Summit, 1992; Heidi et
al., 2005; UNFCCC, 2012). These models are revised continuously for the global
warming computations in buildings (facilities) management (Klotz, et al., 2007; Home,
et al., 2009; Elmualim et al., 2012; Shah, 2007; NIBS, 2006). There is no doubt

Bassey B. Okon Life Cycle Assessment and Life Cycle Costs, Study Phase V
213
whatsoever that the GWP in both cases (Tables 5.37 and 5.38) are with the leading
results. This indication is also shown in the entire analysis results.
5.14 Total environmental impacts results
In this research, an appraisal was made of six buildings within the UK. Ten impact
indicators characteristics were addressed by the application of LCA, Gabi 4 software
package in line with the research objectives. From Figure 5.13, the appraisal results
indicate the highest impact corresponds to the GWP factor (Heidi et al., 2005; Bayer et
al., 2010) in all the buildings and this is followed by the HTP characteristic. Within this
category also, the AP and EP are found to have less significant impacts respectively.
The EP impact result in this case is particularly exceptional in building C. This result
however, suggests the involvement of potential greenhouse gases (GHG) emission in all
the buildings (ACLCA, 2008; Heidi et al., 2005).
Figure 5.13: Total environmental impacts results.
Without proper mitigation, the HTP and AP impact from these buildings can
influence water supply facilities and the ecosystem alike (Peuportier and Herfray, 2011;
Szalay et al., 2011). Actually, the AP factor within this scenario reveals much impact on
Building D as this has the highest compared to other buildings (Figure 5.13). The AP

Bassey B. Okon Life Cycle Assessment and Life Cycle Costs, Study Phase V
214
impact value is, therefore, not very much in comparison to the GWP impact (Heidi et
al., 2005; Guinee et al., 2001; Darby et al., 2011). Analysing further, the EP impact is
established in Building C as result of the high levels of phosphorous and nitrogen
elements within the building. This suggests the other remaining factors are being over-
shadowed as they exist equally in the individual analysis.
In Figure 5.13, it is seen that impact characteristics such as MAETP, ODP, TETP
and FAETP, have gained lower results. This indication demonstrates that the examined
buildings are not driven by the highlighted environmental impact indicators, but rather
by GWP. Inclusive in the category of the least environmental impact are the ADP and
POCP factors. The outcome shows their impact assessment results are not very
significant comparatively with the other factors (Szalay et al., 2011; Guinee et al., 2001;
Heidi et al., 2005; Shah, 2007).
5.15 Percentages distribution analysis
Percentages distribution analysis (PDA) of the ten investigated environmental impact
within Buildings A–F was studied. In this study, the enviromental impacts are separated
into the „higher‟ and „lower‟ impact categories. The total of all the environmental
impacts category is set at 100%. The aim of this analysis was to show the extent
(influence) of individual impacts and their main drivers in Buildings A–F. The
mathematical term in Equation (37) according to Stroud (2001) and Smith (1998) was
used for this analysis and more details are found in Appendix XI.
PDA = Component impact per building / Total no. of impacts per building x100 (37)
The investigated buildings and the environmental impact category distribution in (%)
results through the application of Equation (37) are shown in Figures 5.14 and 5.15.

Bassey B. Okon Life Cycle Assessment and Life Cycle Costs, Study Phase V
215
Figure 5.14: Environmental impacts distribution curve in Buildings A–F, case I.
The percentages distribution of the global warming potential (GWP) within the
investigated buildings is more than 80% of the total impact as indicated in Figure 5.14.
The percentages distributions of other investigated environmental impact in each case
are less than 10%. This result shows the global warming potential achieved higher
impact across all the buildings examined. The percentages distributions of other
remaining environmental impacts are regarded as minor in this analysis (Figure 5.15).
Figure 5.15: Environmental impacts distribution curve in Buildings A–F, case II.
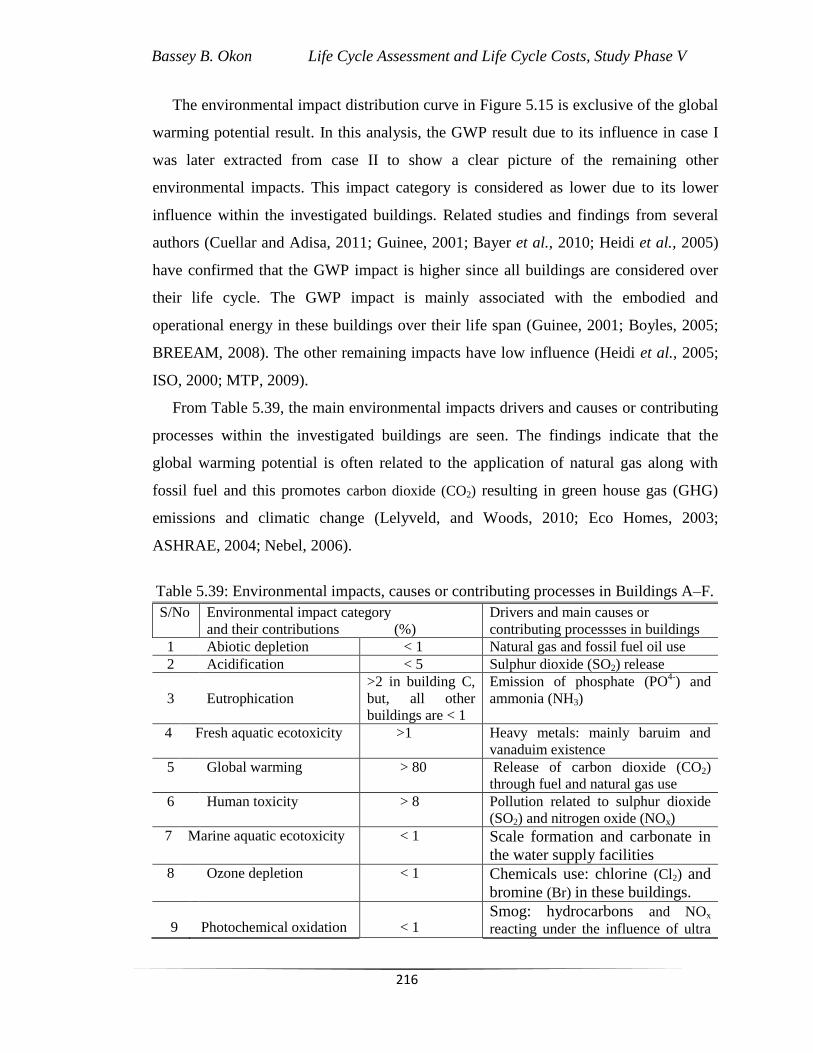
Bassey B. Okon Life Cycle Assessment and Life Cycle Costs, Study Phase V
216
The environmental impact distribution curve in Figure 5.15 is exclusive of the global
warming potential result. In this analysis, the GWP result due to its influence in case I
was later extracted from case II to show a clear picture of the remaining other
environmental impacts. This impact category is considered as lower due to its lower
influence within the investigated buildings. Related studies and findings from several
authors (Cuellar and Adisa, 2011; Guinee, 2001; Bayer et al., 2010; Heidi et al., 2005)
have confirmed that the GWP impact is higher since all buildings are considered over
their life cycle. The GWP impact is mainly associated with the embodied and
operational energy in these buildings over their life span (Guinee, 2001; Boyles, 2005;
BREEAM, 2008). The other remaining impacts have low influence (Heidi et al., 2005;
ISO, 2000; MTP, 2009).
From Table 5.39, the main environmental impacts drivers and causes or contributing
processes within the investigated buildings are seen. The findings indicate that the
global warming potential is often related to the application of natural gas along with
fossil fuel and this promotes carbon dioxide (CO2) resulting in green house gas (GHG)
emissions and climatic change (Lelyveld, and Woods, 2010; Eco Homes, 2003;
ASHRAE, 2004; Nebel, 2006).
Table 5.39: Environmental impacts, causes or contributing processes in Buildings A–F.
S/No Environmental impact category
and their contributions (%)
Drivers and main causes or
contributing processses in buildings
1 Abiotic depletion < 1 Natural gas and fossil fuel oil use
2 Acidification < 5 Sulphur dioxide (SO2) release
3
Eutrophication
>2 in building C,
but, all other
buildings are < 1
Emission of phosphate (PO4-
) and
ammonia (NH3)
4 Fresh aquatic ecotoxicity >1 Heavy metals: mainly baruim and
vanaduim existence
5 Global warming > 80 Release of carbon dioxide (CO2)
through fuel and natural gas use
6 Human toxicity > 8 Pollution related to sulphur dioxide
(SO2) and nitrogen oxide (NOx)
7 Marine aquatic ecotoxicity < 1 Scale formation and carbonate in
the water supply facilities 8 Ozone depletion < 1 Chemicals use: chlorine (Cl2) and
bromine (Br) in these buildings.
9
Photochemical oxidation
< 1 Smog: hydrocarbons and NOx
reacting under the influence of ultra

Bassey B. Okon Life Cycle Assessment and Life Cycle Costs, Study Phase V
217
violet (UV) light 10 Terrestrial ecotoxicity < 1 Existence of heavy metals:
especially mercury
Global warming potential and other analysed environmental impacts arising from
buildings and facilities are well documented by several researchers (see Scott et al.,
2008; Shah, 2007; Serb, 2008). This outcome points to the fact that CO2 is the main
driver followed by SO2 and NOx gases within the investigated buildings. The
contributions of other processses in this case have been studied earlier (see Guinee,
2001; Gorree et al., 2001).
5.16 General interpretation: percentages distribution test
It is evident from Table 5.39 that the processes involved with the use of natural gas
and fossil fuel emit CO2 and contribute to the highest impact from the analysed
environmental impacts category. Apart from this, only a limited number of processes
are responsible for the highest contributions to most impact categories; these are the
application of SO2 and NOx gases. Also, the utilisation of phosphate (PO4-
) and ammonia
(NH3) is likely to contribute to the release of these gases within the investigated
buildings. This explains that excluding global warming, eutrophication has a potential
impact on Building C in particular. There is no doubt whatsoever about this result
because Building C is meant to accommodate a laboratory facility with some offices as
noted in Section 5.7.2. Hence, the building services infrastructure delivery is explained
due to its peculiar nature when compared with the other investigated buildings as shown
in Figure 5.15.
The general explanation from Figure 5.15 indicates that since the primary function of
this building is to accommodate laboratory equipment for academic research purposes,
its overall purpose is different from that of other buildings (Yu and Mclaren, 1995;
Walker et al., 2007; Slater, 1995; Zalbalza, 2009). The type and purpose of a building
informs its design, construction, installation of equipment, management of the building
services, and appointment of facilities managers (Shah, 2007; Peuportier and Herfray,
2011; Elmualim et al., 2012; Pitt, 2005; RICS, 2008; Romm, 1994; CIB, 2004). The
investigation further suggests that the results from other environmental impacts with

Bassey B. Okon Life Cycle Assessment and Life Cycle Costs, Study Phase V
218
low contribution processses should be considered with care as their effects could pose
problems at the EoL stage in these buildings (Blengini, 2009; Armbruster, 1990; Smith,
2009; Thompson, 2001; Petts and Eduljee, 1994; Kim and Qi, 1995; Demsey and
Oppelt, 1993; Feuillade et al., 2008).
5.17 Constraints in the study phase V
There were limiting factors affecting data acquisition during this study. These are:
Delays from some respondents in completing and subsequently returning the
surveys for data analysis and evaluation.
Expression of lack of time in their work schedule for completing the questionnaire
by the experts, technical directors, and stakeholders within these establishments.
Some members of staff expressing fear of divulging the companies‟ confidential
information in the process of completing the survey.
Inability to acquire all the needed data in the supply chain for the LCC analysis.
5.18 Summary of study phase V
The outcomes from this research have explained the LCA evaluation of the
environmental impacts within six buildings in the UK. This study also overviews water,
energy (heating and electricity), with other materials consumption necessary for the
success of the building infrastructure systems. The area of focus was mainly on the
building services and construction activities. In this study, three key stages of impact
activities construction, operation (use) and maintenance alongside the EoL phases are
addressed. The Gabi 4 software CML package (Guinee et al., 2001) was employed in
the building infrastructure analysis. This software is the most comprehensive and
detailed package increasingly undertaken for the LCA examination and it provides the
benchmark for future studies in the area of building infrastructure sustainability.
The impact assessment results within the construction stage typically account for the
largest impacts. This outcome suggests that large quantities of raw (virgin) aggregates
materials and their transportation were involved during the construction stage of the
buildings activities (Ding, 2008; Boyles, 2005; CIB, 2004). The transportation of

Bassey B. Okon Life Cycle Assessment and Life Cycle Costs, Study Phase V
219
construction materials to the various sites provides a very significant contribution to the
overall life cycle impacts of the analysed buildings. This contributes to quite a
considerable GWP impact (Bayer et al., 2010, Darby et al., 2011). The operation and
maintenance phases have the largest impacts associated with energy utilities (electricity
and heating) consumption in the buildings over the life cycle (BREEAM, 2008; Minx,
2008; Heidi et al., 2005; RICS, 2008). Therefore, the impact is highly important in
comparison to the entire life cycle stages. The EoL phase shows considerable impacts in
various categories and normally credit the product system (CIOB, 2010; Borg and
Erlandssona, 2003; Blengini, 2009). Given the benefits accrued from the high recycling
rate of materials achieved for the entire building infrastructure systems (Flapper et al.,
2005).
From Figures 5.13–5.15 the overall impacts from the characteristics considered are
clearly seen, and it is observed that the GWP impact achieved the highest result in the
analysis. Indeed, the GWP impact value for all the six investigated buildings in
comparison to the other factors is very significant. GWP impact is primarily caused by
the consumption rate of fossil fuel and natural gas within the examined buildings (Heidi
et al., 2005; Shah, 2007). In this situation, the GWP is promoting CO2 trace and is likely
to be driven in all the appraised cases (Szalay et al., 2011; Guinee et al., 2001). So, the
achievable result concerning this factor is very consistent and reliable over the life cycle
period. HTP, AP and EP results are moderately significant in the study overall.
It is further revealed that the MAETP, ODP and TETP impacts gained the least
results. Also within the lowest marks group are the FAETP, POCP and ADP
environmental impacts. The results of some of the least impact factors are clearly
displayed, but showed hardly any difference. It is worth mentioning that this study was
reported in a consistent and transparent manner. Therefore, the findings are in
agreement with studies conducted earlier (see Bayer et al., 2010; Cabal et al., 2005:
Blengini, 2009).
5.19 The life cycle cost analysis
The economic life cycle cost appraisal of the infrastructure services delivery within
Buildings A–F was conducted according to the methods outlined by Langdon (2007),

Bassey B. Okon Life Cycle Assessment and Life Cycle Costs, Study Phase V
220
and TG4 (2003). This becomes necessary in establishing the LCC for each phase of the
building services infrastructure systems. The LCC examination considered the system
as a closed-loop recycling process per functional unit (FU) and did not account for the
inflation of materials over the life cycle. As a consequence, the percentages of waste
materials recycled and re-used were calculated based on the current UK standards as
depicted in Table 5.41. Basically, the analysis as contained in this table was applied at
the waste stream of the EoL phase of the entire building infrastructure.
5.20 Landfill and recycling costs
The landfill and recycling costs of materials are often quantified in pounds per
tonnes as demonstrated in Table 5.40. It is obvious that the landfill cost (£/tonne) of
materials is quite high in comparison with the recycling costs. This is because the UK
landfill tax regime per tonne of waste is put at £48-£56. However, this is in a push to
reduce and divert more construction waste materials from the landfill towards recycling
composting (WRAP, 2012). On this basis, the outcomes of the LCC are as presented.
Table 5.40: Landfill and recycling costs (£/tonne) of materials.
Materials Landfill Cost £/tonne Recycling cost £/tonne Source
Steel 56.00(Depending on grade) 4.00 (Depending) WRAP, 2012
Cement (concrete) 50.50 7.25 WRAP, 2012
Bricks 50.50 6.50 WRAP, 2012
Glass 56.00 8.00 WRAP, 2012
Plastics 56.00 5.50 WRAP, 2012
Wood 56.00 2.00 WRAP, 2012
The information included in Table 5.40 was extrapolated into this study at the
construction, operation (use)/maintenance, and the EoL phases of the buildings
activities. Particularly, the research employed the data for evaluating the percentages of
the building materials recycling (waste re-used) content and landfill waste at the EoL
phase. This becomes imperative since the research was conducted in building services
infrastructure systems within the UK, meaning the UK proper tax regime could be
applied.

Bassey B. Okon Life Cycle Assessment and Life Cycle Costs, Study Phase V
221
5.21 Buildings A–F and the associated costs (£/FU)
The study has established the related cost (£/FU) of the investigated Buildings A–F
and the correlations are presented. The data in Table 5.41 provided by the companies
handling projects in Buildings A–F do not include information on the plant hiring,
haulage, labour and the overhead costs. Therefore, the evaluation in each case was
based on the supplied data. Also, Davis Langdon, and Jacob‟s Costs Engineering
companies, UK, assisted in providing the materials valuation analysis. More details
regarding the LCC examination are indicated in Figures 5.19–5.24 respectively.
Table 5.41: Relationship between buildings and costs (£/FU) within the phases.
Buildings
Construction
Phase-Total
LCC (£/FU)
Ops/Maint.
Phases-Total
LCC (£/FU)
EoL Phase- Total LCC
waste management
(£/FU)
A 25,5001.21 5,276,598.23 6,795.17
B 28,664.04 5,313,600.00 26,593.88
C 40,482.85 6,102,720.00 2,032.25
D 47,704.87 6,741,823.22 2,016,650.32
E 38,683.55 5,910,424.14 2,745.65
F 23,259.08 7,901,384.90 27,150.69
5.21.1 Life cycle costs for Building A
The life cycle phases and the LCC (£/FU) for Building A are shown in Figure 5.16.
In this figure, it is evident the materials and utilities used during the construction phase
are far above £25 thousand pounds. It also appears that a great amount of the
construction materials utilised are recyclable, and that the method and technology
adopted for the building is effective over the life cycle (Clift, 2003; ARUP, n.d). This
development will certainly encourage sustainability through the exploitation of
recyclable materials rather than the use of virgin resources (Flapper et al., 2005; BPC,
2010). Operation and maintenance phases over 50 years lifespan have recorded more
than £6 million pounds.

Bassey B. Okon Life Cycle Assessment and Life Cycle Costs, Study Phase V
222
Figure 5.16: Life cycle phases and the LCC (£/FU) for Building A.
In fact, this forecast does not take into cognisance, the inflationary rate associated
with the building services infrastructure utilities (energy, water, gas) and the
maintenance culture within this period. The EoL phase depicts the credits from the
recyclable and landfill materials over the life cycle. Also, the total LCC of over £6
thousand pounds accounts for the overall amount spent and the benefits over the life
cycle as shown in Building A (Figure 5.16). The outcome from Building A shows a
good pay back trend towards the concept of sustainability in managing building services
infrastructure systems (Kehily and Hore, 2012; Flapper et al., 2005). The findings also
revealed conformity with the literature (Gulch and Baumann, 2004; Bakis, et al., 2003,
Langdon, 2007).
5.21.2 Life cycle costs for Building B
In Figure 5.17, it is seen that over £28 thousand pounds per FU was expended at the
construction phase. This is a reflection of the huge quantity of materials and utilities
consumed during that phase. Consequently, the measured field data used for this
examination shows that reasonable percentages of the materials employed in the
building process are recyclable (Wyatt, 1994; ASTM, 2002, Clift, 2003). Given that the

Bassey B. Okon Life Cycle Assessment and Life Cycle Costs, Study Phase V
223
materials applied are re-usable over the building‟s life cycle, there will be some
considerable gains accrued (Flapper et al., 2005; Blengini, 2009).
Figure 5.17: Life cycle phases and the LCC (£/FU) for Building B.
The operation and maintenance phases are very exceptional with more than £5
million pounds spending over the 50 year period. This prediction is exclusive of any
tariff rises in utilities and maintenance management activities. The EoL phase basically
showcases over £26 thousand benefits from the recyclable materials and landfill costs
associated with the building per functional unit. From the above indication, the LCC
(£/FU) of Building B is explained at different stages of activities with the cost
involvement and benefits overall. Ellis (2007), Langdon (2010), and Langdon (2007),
all find similar LCC values in building infrastructure system management.
5.21.3 Life cycle costs for Building C
The analysis for Building C signifies the LCC (£/FU) at the construction phase as
being over £40 thousand pounds. The materials costs and the recycling contents as
applied in the construction stage over its life cycle (Janssen and Henddriks, 2002,
Blengini, 2009; Flapper et al., 2005; Wyatt, 1995). The operation and maintenance
stages have recorded over £6 million pound as shown in Figure 5.18.

Bassey B. Okon Life Cycle Assessment and Life Cycle Costs, Study Phase V
224
Figure 5.18: Life cycle phases and the LCC (£/FU) for Building C.
The estimate presented does not consider any increase associated with utilities and
materials throughout the 50 year life span. However, the EoL phase does include the
credits from the recyclable materials utilised in the building (Figure 5.18). The total
LCC explains that more than £2 thousand pounds is anticipated at this phase of the
infrastructure over its life cycle. Generally, the examination is consistent with the
quality of materials application during the construction stage and the equipment
provided within the building for services delivery. This result agrees with that found by
several researchers (see Zimmermann, 2005; Parnell, 2008; Gluch and Baumann, 2004)
who have appraised building infrastructure serviceability and engineering management.
5.21.4 Life cycle costs for Building D
The LCC analysis for Building D is indicated in Figure 5.19. In this investigation,
the building infrastructure at the construction phase has consumed more than £47
thousand pounds. During this construction stage also, the recycling contents of materials
used are reasonable over its life cycle (Sterner, 2000; Wyatt, 1994; Flapper et al., 2005).
The operation and maintenance stages account for over £6 million pounds.

Bassey B. Okon Life Cycle Assessment and Life Cycle Costs, Study Phase V
225
Figure 5.19: Life cycle phases and the LCC (£/FU) for Building D.
This prediction is without consideration of the price increments in the building
services infrastructure (water, gas and electricity) equipment upkeep and other ancillary
operations during the 50 year period. Notwithstanding, a good policy framework
through suitable design for the HVAC, energy efficiency and conservation with suitable
maintenance management underscored its functionality. This becomes realistic when the
facility within building D is put to use.
At the EOL phase, Building D shows more than £2 million pounds accruing from the
reuse of materials over its life cycle. This result is a strong indication of the vast amount
of recyclable materials utilisation during the design and implementation phases of the
building (Figure 5.19) (Sterner, 2000; Kehily and Hore, 2012). Obviously, this
demonstrates the quality and quantity of recyclable materials consumption within the
building (Flapper et al., 2005; Janssen and Hendriks, 2002). Accordingly, in Building D
the economic evaluation from the engineering sustainability perspective suggests the
involvement of materials that are probably recyclable at the EoL phase (Blengini, 2009;
Clift, 2003). In related studies, Gulch and Baumann (2004), and Ellis (2007), have made
similar observations regarding engineering cost evaluation.
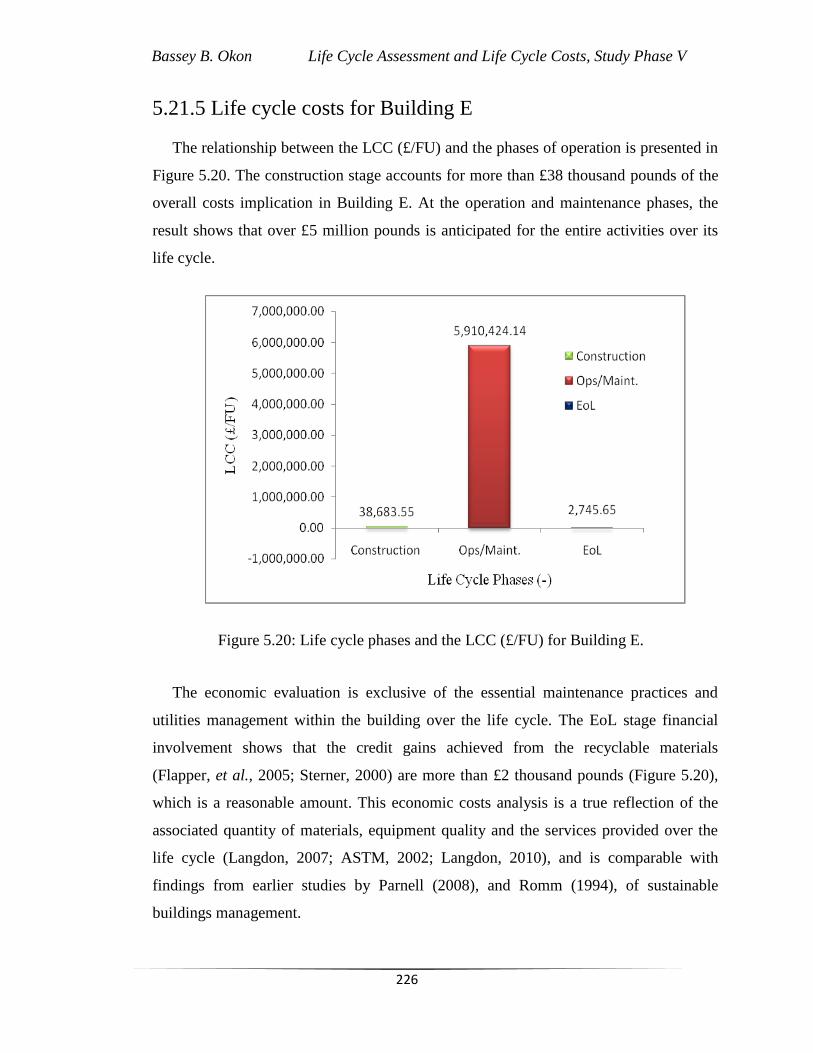
Bassey B. Okon Life Cycle Assessment and Life Cycle Costs, Study Phase V
226
5.21.5 Life cycle costs for Building E
The relationship between the LCC (£/FU) and the phases of operation is presented in
Figure 5.20. The construction stage accounts for more than £38 thousand pounds of the
overall costs implication in Building E. At the operation and maintenance phases, the
result shows that over £5 million pounds is anticipated for the entire activities over its
life cycle.
Figure 5.20: Life cycle phases and the LCC (£/FU) for Building E.
The economic evaluation is exclusive of the essential maintenance practices and
utilities management within the building over the life cycle. The EoL stage financial
involvement shows that the credit gains achieved from the recyclable materials
(Flapper, et al., 2005; Sterner, 2000) are more than £2 thousand pounds (Figure 5.20),
which is a reasonable amount. This economic costs analysis is a true reflection of the
associated quantity of materials, equipment quality and the services provided over the
life cycle (Langdon, 2007; ASTM, 2002; Langdon, 2010), and is comparable with
findings from earlier studies by Parnell (2008), and Romm (1994), of sustainable
buildings management.

Bassey B. Okon Life Cycle Assessment and Life Cycle Costs, Study Phase V
227
5.21.6 Life cycle costs for Building F
Figure 5.21 illustrates the LCC (£/FU) and the life cycle phases for Building F. In
this economic costing, the construction stage is seen to cost more than £23 thousand
pounds. Operation and maintenance phases account for over £7 million pounds, less the
increase in tariff on utilities, maintenance, and the ancillary activities in the building
infrastructure.
Figure 5.21: Life cycle phases and the LCC (£/FU) for Building F.
At these stages of the building, the economic analysis reveals the use of efficient
energy saving fixtures and regular maintenance practices as being crucial (Horner et al.,
1997; CIOB, 2003). In addition, proper design through HVAC for energy efficiency and
water networking within the building services infrastructure explains the economic
functionality for Building F (BREEAM, 2008; CIOB, 2011; Cheshire and Maunsell,
2007).
Figure 5.21 further indicates that at the EoL phase, about £27 thousand will be
achieved from the recyclable materials over the life cycle (Flapper et al., 2005; Kehily
and Hore, 2012; Sterner, 2000). This result discloses the economic costs benefit analysis

Bassey B. Okon Life Cycle Assessment and Life Cycle Costs, Study Phase V
228
in correlation with the materials, quality of equipment installed in the building and the
services offered over the life cycle. The finding is akin to the views expressed by
Hormer et al. (1997), and the DIN (2004) concerning the management of the economic
functionality of building infrastructure systems.
5.22 General interpretation of the LCC analysis
The study has reviewed the economic estimates associated with the different life
cycle stages of six Buildings A–F and their activities. LCC investigation of building
infrastructure sustainability and management is an innovative technique for appraising
the total cost (£/FU) of the facility possession. The method used in the LCC addresses
the overall cost of acquisition, ownership and disposal within the six building
infrastructure systems. Hence, it is crucial to incorporate the method when assessing
alternatives so that sustainability imperatives are properly pursued.
In addition, from Figures 5.16–5.21, it is evident that the LCC method is able to
present the cost appraisal at the different life cycle stages within these buildings‟
infrastructures. It is important to note the construction costs in this study are without
various sub-heads as reported earlier in Section 5.4, page 179. At the construction
phase, the estimates associated with the overall costs of building materials and design
that will ensure the infrastructure services, are provided at the lowest costs. These
details are as indicated in the discussion sections of this study. Similarly, at the
operation and maintenance stages, the building sustainability through the incorporation
of the LCC addresses the general performance. These include providing a guide and
predicting a sustainable economic model and blueprint for the quality of equipment and
installation in the investigated scenarios.
The LCC forecast further supplied the preventive and other mode of maintenance
practices pathway in building services infrastructure, for the complete life span
(Buildings A–F). These efforts will assist in selecting the best alternative, hence
maximising net savings at the various phases of the building infrastructure (Langdon,
2007; Clift, 2003; Sterner, 2000; CIOB, 2003). This analysis is inclined towards
guaranteeing that the entire ownership of the infrastructure performance is consistent

Bassey B. Okon Life Cycle Assessment and Life Cycle Costs, Study Phase V
229
with its quality and functionality over the life cycle (Horner, et al., 1997; DIN, 2004;
Parnell, 2008).
5.23 Contributions to knowledge in study phase V
The research conducted through the current best LCA and LCC practices and in
accordance with the ISO 14001 standards, has established significant contributions in
this field. This is occasioned by the collection and collation of quality measured field
data, and their subsequent analysis. In this study, the data quality was found insufficient
for the LCC analysis, but adequate for the LCA study. This study has also offered a
value-added potential in the course of appraising the various stages of life cycle stages
in relation to building infrastructure performance within the examined buildings. It is
expected that suitable building services infrastructure systems should account for the
materials recyclability and the probable impacts (Blengini, 2009; Borg and Erlandssona,
2003; Bayer et al., 2010; Flapper et al., 2005).
The application of the various software techniques in examining the buildings
services infrastructure sustainability is yet another landmark. In particular, the
combination of LCA and LCC methods in this study is new, since this approach has not
been used by other researchers in their explorations of building services infrastructure.
5.24 Conclusion in study phase V
The study and findings derived from the research results will assist in the eradication
of wastage of energy and utilities, and water, together with other materials usage and
duplication that leads to unnecessary costs associated with the building performance.
Also, the evaluation confirms the economic importance of reducing wastage at the
various life cycle stages, and the impacts and contribution from doing this to the
improvement of the entire life value of the building infrastructure. This analysis is able
to appraise the life cycle impact and performance of building infrastructure practices in
delivering the necessary results. Indeed, a fully progressive model agenda in measuring
impacts associated with the buildings life cycle supply chain is contained in this study.

Bassey B. Okon Life Cycle Assessment and Life Cycle Costs, Study Phase V
230
Building services infrastructure sustainability underscores innovative technologies
characterised by efficient lighting systems to include sensor-based dimmable
controllers. Good quality HVAC, heating installations, safety gadgets (fire alarms) and
water supply networks among others, also promote sustainability goals. Additionally,
the design and furnishing of sustainable technologies within these buildings will
enhance management performance. The outcomes of this study are capable of
addressing the overall objectives regarding building infrastructure management. Hence,.
this result will serve as a beacon for future studies in building infrastructure systems that
are examined from the sustainability and related perspectives.

Bassey B. Okon Energy and Utilities Management, Study Phase VI
231
Chapter Six
6.0 Energy and utilities management, study phase VI
6.1 Introduction
In this Chapter, energy and utilities consumption, waste management, and the carbon
footprint were studied in the hospital and education sectors within the UK. The UK‟s
Freedom of Information (FOI) Act 2000 was the main source of data acquisition for
both sectors. This data is reliable as individual organisations certify its validity
(Appendix VII). Information regarding the participating hospitals (NHS) and schools in
this study is in the appendices.
This study contains three broad phases. These are the energy and utilities
consumption at the operational phase, and the materials flows during the maintenance
and refurbishment stages in the organisations (presented in Sections 6.5–6.6). Generally,
waste management practice was also studied and is reported in Section 6.7. Carbon
footprint analysis was conducted within the two environments (hospitals and education)
and a partial differential equation method also applied to determine the results as shown
in Sections 6.8 and 6.10. The study consists of various stages as displayed in Figure 6.1.
Figure 6.1: The process of study.

Bassey B. Okon Energy and Utilities Management, Study Phase VI
232
6.2 Presenting the study in phase VI
The study evaluates sustainable building infrastructure systems management
including energy and utilities, waste, and carbon emissions, within hospitals and schools
in the UK. A structured questionnaire was administered to building (facilities),
operations and estate managers within hospitals (NHS) and schools across the UK.
These experts were able to supply measured data from their organisations‟ inventory for
the analysis. Operations and maintenance phases of activities were examined with a
focus on energy and utilities such as water, electricity, natural gas, heating and fuel
oil/lubricant consumption. The waste management list also includes segregated and
non-segregated waste, recyclable, landfill, incinerated, and other waste.
6.3 Goal and scope definition
The scope of the study consists of evaluating energy and utilities, materials
consumption, waste management, and the carbon footprint from the healthcare and
education sectors. As indicated, the system is modelled to consider all relevant
processes related to these scenarios. Accordingly, from the healthcare and education
sectors a functional unit of 100m2 was used in conducting the analysis (Blengini, 2009;
Peuportier and Herfray, 2011; Gorree et al., 2002). The functional unit was chosen in
order to provide a common basis for evaluation within the investigated healthcare and
education organisations. This size of building is considered adequate for examining the
building services infrastructure activities. The achievable results are discussed at the
different phases of this investigation.
6.4 Results and discussion
The results and discussion of the investigation from these sectors are presented in the
subsequent Sections 6.5.1–6.11 of this thesis. The various models developed for this
study are also included. It should be noted that, the research information as contained in
the thesis is the product of statistics provided by the participating NHS and schools
within the UK. Hence, the questionnaire feedback in energy and utilities consumption

Bassey B. Okon Energy and Utilities Management, Study Phase VI
233
may not demonstrate a true practical situation as observed in this analysis. Appendix
VII contains this information.
6.5 Operations phase in the healthcare and education sectors
The energy infrastructure (utilities) management and other relevant information from
these sectors is revealed in Tables 6.1 and 6.2 respectively. Energy and utilities
consumption data from the NHS in Table 6.1 is reported in two separate perspectives,
these being the totality of utilities consumption, and their percentages contribution. The
aim is to show the rate of energy and utilities consumption in each case.
6.5.1 Energy and utilities consumption in the healthcare sector
Table 6.1 accounts for the energy and utilities consumption from the operational
phase in the healthcare sector.
Table 6.1: Energy and utilities consumption in healthcare sector.
Energy Utilities Units Functional Unit Total Consumption
Electricity kWh 100m2 10,404,963.0
Natural gas m3 100m
2 142,254,033.6
Water Ltrs 100m2 8,230,925.0
Heating kWh 100m2 7,048.2
Fuel oil/lubricant kWh 100m2 149,177.3
Total 161,046,147.1
In this analysis, natural gas accounts for 88% of the energy and utilities
consumption. Research showed this huge amount of gas use as being because some
NHS hospitals employ a combined heat and power station to generate electricity on site.
As a consequence, a reasonable quantity of gas has been expended for the electricity
generation used for the services delivery in this domain. In addition, electricity
consumption from this phase of study is 6% of the overall utilities. This indicates that
there is less evidence of electricity utilisation for the energy used within the hospitals
than that supplied to the various sites. Although the result on electricity consumption
generally shows that there is more apparent electricity usage. Water consumption in this

Bassey B. Okon Energy and Utilities Management, Study Phase VI
234
study is 5% of the total utility data. This outcome explains the rate at which water is
utilised in the healthcare organisation (Table 6.1).
Obviously, water is commonly used in this sector but the result is based on the data
supplied from the respondents. Fuel oil/lubricant consumption accounts for less than 1%
of the overall energy and utilities. This fuel oil/lubricant is normally used in the power
station on site and equipment (machine) maintenance activities. Fuel oil/lubricant is
probably used in equipment operations within this organisation generally.
Figure 6.2: Percentages contribution on energy and utilities use, health sector.
The consumption rate of fuel oil/lubricant in this case is not large since its application is
limited to few operations. Also heating energy within this sector is less than 1% of the
entire investigated utilities. This is because the entire facility does not require space
heating at the same time during all of the season (Figure 6.2). On this basis, heating
energy utility within the hospital facilities is mainly associated with the occupant spaces
and that becomes necessary especially during the winter season.
6.5.2 Energy and utilities consumption in the education sector
Table 6.2 accounts for the energy and utilities consumption from the operational
phase in the education sector.

Bassey B. Okon Energy and Utilities Management, Study Phase VI
235
Table 6.2: Energy and utilities consumption in the education sector.
Energy Utilities Units Functional Unit Total Consumption
Electricity kWh 100m2 349,911.9
Natural gas m3 100m
2 784,375.9
Water L 100m2 1,143,433.3
Heating kWh 100m2 23,852.6
Fuel oil/lubricant kWh 100m2 6,158.6
Total 2,307,732.3
The energy and utilities consumption statistics from the education sector are shown
in Table 6.2. In this analysis, the report is presented in two groups. The first category is
the total consumption of the individual utility and the other group is their percentage
contribution in each case. Water consumption in the education sector is top marked with
almost 50% of the total energy and utilities. This is attributed to the frequent use of
water for sanitary services, drinking, laboratory use, cooking and other applications. In
actual fact, this result is reasonable as water plays a very significant role in the school
systems on a daily basis as indicated in Figure 6.3. This research noted that most of the
feedback is exclusive of dormitories (students‟ halls) whose population is relatively
high during term time regarding utilities usage.
Figure 6.3: Percentages contribution on energy and utilities use in education sector.

Bassey B. Okon Energy and Utilities Management, Study Phase VI
236
Natural gas usage is 34% of the overall energy and utilities consumption. The main
reason for the increase in use of natural gas is because some schools utilise the
combined heat and power station to generate electricity on site. Therefore, this index
accounts for the huge amount of gas used for the electricity generation within the
education sector. Certainly, this suggests what is tenable in the other sector previously
investigated. Energy consumption from the electricity supply is slightly above 15% of
the total energy utilities application (Figure 6.3). The research reveals that the use of a
combined heat and power station to produce electricity on site is aimed at reducing the
energy bill from the electricity power supplier. The analysis clearly shows that the
education sector consumes electricity based on the available data. The result is in
agreement with the views of Cheshire (2007), and Cheshire and Maunsell (2007),
regarding the management of sustainable building infrastructure activities.
Heating contributes only 1% in this context. It is evident that since the investigation
was not targeted at the halls of residence, the result is logical. Presumably, the entire
educational facility does not require space heating except where occasionally occupied.
Therefore, energy emanating from heating is basically used in the schools facilities
when the need arises and most especially during the winter season for cost savings. The
least used energy utility is fuel oil/lubricant achieving less than 1%. Fuel oil/lubricant
use, primarily in this perspective, is specifically used in equipment, power plant and
other machines. The consumption rate of this energy utility is not frequently
comparative to other energy and utilities use as shown in Figure 6.3. As such, the result
is reasonable from the respondents‟ opinion and the supplied data (MTP, 2009).
6.5.3 Comparative analysis between the health and education
sectors
In a comparative analysis between the two sectors, natural gas usage within the NHS
is over 80% of the investigated energy and utilities. This is followed by electricity and
water utilisation. The least in this category are correspondingly, heating and fuel/oil
lubricant. However, in the education sector, water is leading with almost 50% of the
examined energy and utilities being accounted for in this way. Natural gas utilisation is
over 30% of the expended resources. Also, electricity consumption accounts for more

Bassey B. Okon Energy and Utilities Management, Study Phase VI
237
than 15% of the energy usage. Heating energy and fuel/oil lubricant in this case are less
than 2% of the total utility usage. The results from both sectors reflect similarities in
percentage classifications among natural gas, electricity, and water utilities
consumption. The same indication is found in both energy and utilities with heating and
fuel/oil lubricant statistics. This outcome is quite realistic based on the common
functional space unit measuring 100m2 and was examined from both organisations, using
information supplied by the respondents.
6.6 Maintenance phase in the health and education sectors
Table 6.3 presents the maintenance and refurbishment statistics from the two
investigated sectors.
Table 6.3: Maintenance/refurbishment data in the health and education sectors.
Materials
Use
Health Sector- Maintenance Phase Education Sector-Maintenance Phase
Total
Recycling
Contents
(%)
Distance
(km) Total
*Recycling
Contents
(%)
*Distance
(km)
Steel kg 3,970 100 250 1,800 90 40
Cement kg 5,500 85 240 400 100 20
Bricks kg 41,650 85 245 1,200 100 20
Glass m3 2,351 90 90 700 100 30
Plastics kg 21,430 90 70 275 100 25
Wood kg 8,900 100 50 2,100 100 45
Water l 6,000 - - - - -
Paints l 6,600 - 80 160 40 55
Blocks kg 1,280 90 230 350 80 15
Tiles m2 11,050 50 20 200 15 10
Vinyl kg 20,600 100 30 - - -
*Distance shows the area of coverage for the delivery of materials to the building sites.
*Recycling contents signify the percentages of individual materials recyclability over
the EoL stage.
The maintenance phase indicates the flow of materials and their recycling contents in
each case. In the hospital (NHS) sector, the demand for construction materials such as
bricks, plastics, vinyl, and tiles is very high. Also, the research information discloses

Bassey B. Okon Energy and Utilities Management, Study Phase VI
238
that other materials including wood, paint, cement, steel and glass are among those
often required for immediate use. It is also observed that the recycling contents of most
of these materials are reasonable and encouraging (Williams, 1999; Holmes, 1995). This
demonstrates that a greater percentage of these materials will be recycled over their life
cycle and put back to use as contained in Table 6.3.
Certainly, this development will yield many benefits to the system considered as a
close-loop supply chain process (Flapper et al., 2005) that promotes the concept of
sustainability. That covers the situation where some of these materials (demolished
concrete) will be converted into a secondary aggregate and later re-used for infilling
activities in construction sites. This effort will prevent the production of virgin
aggregates and their transportation to the various construction sites (WW, 2005; WRAP,
2011; WMS, 2012). Then, a greater percentage of plastics, wood, bricks, steel and other
materials will be totally recovered and employed for subsequent use over the life cycle.
By so doing, the recovering processes through recycling will forestall the production of
virgin and primary materials and their freighting issue (Williams, 1995; WRAP, 2011;
WBCSD, 2000; WMS, 2012; WW, 2005).
The inventory analysis from the education sector reveals three construction materials
with higher rates of supply: these are wood, bricks, and steel. In addition, their recycling
contents are rather high signifying that these materials will be recycled and reused at the
end-of-life (EoL) (Table 6.3). Additionally, the demands of the other remaining
construction materials are moderate. Undoubtedly, with the high recycling contents
associated with these materials, a reasonable amount will be recovered for further
application over the life cycle (GBPC, 2010; WW, 2005; UKGSD, 2005; GSGF, 2010).
This reveals the significance of recycling materials at the EoL stage of any sustainable
building infrastructure rather than disposal at the landfill. Furthermore, the carbon
emissions evolving in the process of producing virgin raw materials and transportation
to the various construction sites will be prevented. The views of Flapper et al. (2005)
and Baillie (2008) regarding managing closed-loop supply chains in pursuit of
sustainability success are echoed in this finding.

Bassey B. Okon Energy and Utilities Management, Study Phase VI
239
6.7 Waste management phase - health and education sectors
6.7.1 Waste management phase in the health sector
Waste generated from the healthcare activities usually comprises a broad variety of
materials ranging from used needles, syringes, to soiled dressings. The list includes
body parts, diagnostic samples, blood, chemicals, pharmaceuticals, medical devices and
radioactive materials (BMA, 1991; WMP, 1995). In this study, healthcare sector (NHS)
waste management data is categorised into six waste streams as indicated in Table 6.4.
It is apparent that some waste generated by the healthcare sector is either only suitable
for high temperature incineration, or is non-recyclable in nature. Some waste is
recyclable, landfill, non-burnt or regarded as general waste from a number of products
(WMP, 1995; Slater, 1995).
High temperature waste accounts for 1.1% of the overall statistics within the
healthcare sector. This is a small volume of waste generated compared to the other
waste streams. Landfill waste from the data accounts for more than 60% in this order.
The non-burnt waste contributes less than 14% of the total waste stream. Also, the
incinerated waste within this category is below 16%. The recyclable waste stream is 3%
of the overall waste produced by the healthcare sector.
Table 6.4: Waste management information in the healthcare sector.
Waste Type Tonnes Percentages Contribution (%)
High temperature waste 53.48 1.1
Landfill waste 2,986.30 60.7
Non-burnt waste 678.52 13.8
Incinerated clinical waste 773.70 15.7
Recyclable waste 102.52 3.0
General waste 279.90 5.7
Total 4,917.56 100
The general waste statistics show that almost 6% of the entire waste is produced in
this phase of the study (Appendix VII). This result is a true reflection of the fact that
most of the investigated hospitals are associated with disposable materials. Non-burnt
and incinerated waste (equipment and tools) are within the category of waste that must
be treated with extra care (Ambruster, 1990, Hall, 2008). The equipment and appliances
when no longer put to use are considered as waste and are characterised with the toxic

Bassey B. Okon Energy and Utilities Management, Study Phase VI
240
substances emission, as presented in Table 6.4. Waste generated from the healthcare
sector due to poor management is capable of producing harmful effects to humans and
the environment (Dempsey and Oppelt, 1993; BMA, 1991).
The NHS waste stream produces quite a reasonable amount of landfill and non-
decomposable materials which are not reusable. Thus, this flow of landfill waste can
potentially expose the health care workers, patients and the waste handlers to severe
infections (Hall, 2008; Feuillade, 2008). Frequently, large volumes of landfill waste
impacts arise from inadequate management, and enhance toxic effects, pollution to the
atmosphere, and health infection (Willams, 1999; Almuneef and Memish, 2003).
Recyclable waste is quite environmentally-sound as it can be recovered for further
economic applications (WMS, 2012; WRAP, 2011; GSGF, 2010; Hall, 2008). Some
waste obtained from the hospital equipment is probably recyclable and can be reused
with effective management (WRAP, 2011; Lelyveld and Woods, 2010)(Table 6.4).
General waste from the healthcare sector suggests segregated and non-segregated waste
(Hall, 2008; Holmes, 1995; GSGF, 2010). Such waste, if properly separated at the
source of generation, can invariably yield a reasonable payback, thus encouraging
environmentally-sound solutions that contribute to sustainability goals (RCN, 2007;
Willams, 1999; Hall, 2008).
The research outcome from the NHS activities is an expression of the current waste
management classification and their percentage contributions from the supplied field
data. In this scenario, the merits and demerits of the individual waste impacts are
presented, and from this understanding it can be argued that more effort should be made
within NHS sites to build more waste collection and management stations with a view
to segregating waste materials (WRAP, 2011; WW, 2005). The incinerated and the non-
burnt waste require expert management of the entire process (Figure 6.4). Improper
handling of this waste can result in several environmental health hazards (pollution) and
infection (Feuillade, 2008; RCN, 2007; Willams, 1999). But, good quality waste
management ethics will guarantee safety of lives and yield more economic benefits (Ki
and Qi, 1995). This result is consistent with several evaluation reports on healthcare
waste management policy (see WHO, 2004 and WHO, 2007). More details relating to
the waste generated in the health sector are presented graphically in Figure 6.4.

Bassey B. Okon Energy and Utilities Management, Study Phase VI
241
Figure 6.4: Waste generated in the healthcare sector.
The relationship between the quantity of waste produced in tonnes, and the type of waste in
NHS activities, is depicted in Figure 6.4. From this plot, it is established that the high
temperature waste (A) is slightly above 50 tonnes, and the non-burnt waste (B) is almost
680 tonnes. Landfill waste (C), accounts for the highest in this category with more than
2,900 tonnes of the waste generated for the NHS facilities. The incinerated waste (D) is
shown as above 750 tonnes of the total waste stream in the NHS statistics. The trend
shows that recyclable waste (E) is little above 100 tonnes, whilst the general waste (F) is
almost 280 tonnes of the overall waste information, as shown in Figure 6.4.
Basically, this points towards the need for proper scrutiny regarding the volume of
landfill waste generated from the healthcare sector. This high volume of landfill, non-
burnt, and the incinerated waste streams within the healthcare sector obviously
necessitate suitable appraisal in pursuit of the sustainability agenda. Related studies
have also confirmed waste management activities in the healthcare sector and facilities
operations (Shah, 2007; Tudor, et al., 2005; Hall, 2008; Willams, 1999; Feuillade,
2008).

Bassey B. Okon Energy and Utilities Management, Study Phase VI
242
6.7.2 Waste management phase in the education sector
The study information regarding the waste management phase within the education
sector is shown in Table 6.5.
Table 6.5: Waste management information in education sector.
Waste Type Tonnes Percentages Contribution (%)
Recyclable waste 9.1 58
General waste 4.8 31
Other waste 1.7 11
Total 15.6 100
The education sector waste management activities records are shown in Table 6.5.
Only three classes of waste activities were identified. Waste management policy
generally in this sector is tailored towards reducing, reusing, and recycling. The
recyclable waste consists of glass, plastics, packaging, papers, items of furniture and
toners. The list also includes chemical bottles, drinks and food cans/containers, lighting
bulbs, construction and miscellaneous waste (Shah, 2007; WRAP, 2011). There is no
doubt that the percentage contribution of recyclable waste is almost 60% of the total
waste produced from the education sector. Interestingly, it indicates a huge volume of
waste is recyclable and put back into use thereby saving the exploitation of virgin raw
materials (Williams, 1995; WMS, 2012; Holmes, 1995, WRAP, 2011).
Table 6.5 also revealed that the percentage contribution of general waste is a little
above 30% of the entire waste stream. Obviously, this suggests the general waste is
comprised of either segregated or non-segregated materials. Considering such an
amount of waste is produced by the education sector, a proper management system is
desired. From this it can be appreciated that it is necessary to effectively manage the
waste at the generation point as certain amounts could be made recyclable upon
segregation. In essence, the other waste represents a contribution of slightly above 10%,
expressing a mix between the biodegradable (grasses), compostable, and other waste
substances. There is no strong indication of the existence of landfill waste from this
sector based on the acquired information. Studies findings according to (WW, 2005;
Coyle and Turner, 2008) are similar to this result in managing waste activities within
the education sector.
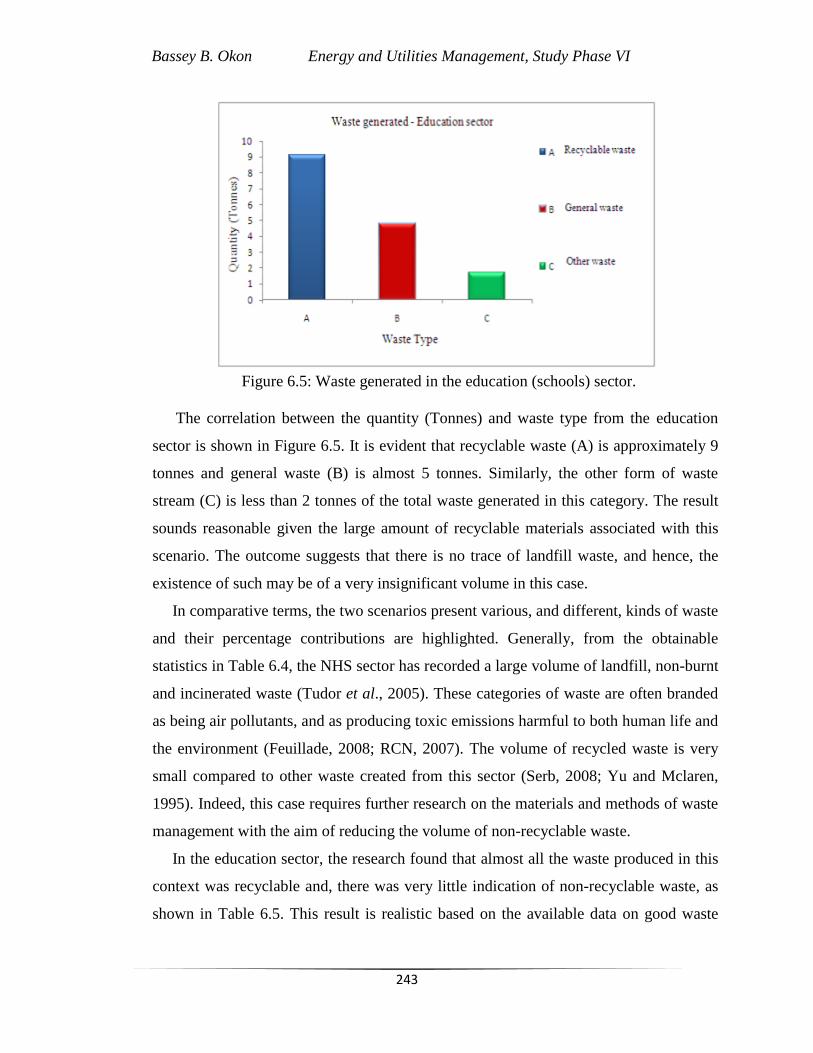
Bassey B. Okon Energy and Utilities Management, Study Phase VI
243
Figure 6.5: Waste generated in the education (schools) sector.
The correlation between the quantity (Tonnes) and waste type from the education
sector is shown in Figure 6.5. It is evident that recyclable waste (A) is approximately 9
tonnes and general waste (B) is almost 5 tonnes. Similarly, the other form of waste
stream (C) is less than 2 tonnes of the total waste generated in this category. The result
sounds reasonable given the large amount of recyclable materials associated with this
scenario. The outcome suggests that there is no trace of landfill waste, and hence, the
existence of such may be of a very insignificant volume in this case.
In comparative terms, the two scenarios present various, and different, kinds of waste
and their percentage contributions are highlighted. Generally, from the obtainable
statistics in Table 6.4, the NHS sector has recorded a large volume of landfill, non-burnt
and incinerated waste (Tudor et al., 2005). These categories of waste are often branded
as being air pollutants, and as producing toxic emissions harmful to both human life and
the environment (Feuillade, 2008; RCN, 2007). The volume of recycled waste is very
small compared to other waste created from this sector (Serb, 2008; Yu and Mclaren,
1995). Indeed, this case requires further research on the materials and methods of waste
management with the aim of reducing the volume of non-recyclable waste.
In the education sector, the research found that almost all the waste produced in this
context was recyclable and, there was very little indication of non-recyclable waste, as
shown in Table 6.5. This result is realistic based on the available data on good waste

Bassey B. Okon Energy and Utilities Management, Study Phase VI
244
management practice and it conforms to the findings of other studies (see Coyle and
Turner, 2008; Serb, 2008; WMS, 2012).
6.8 Carbon footprint analysis
The carbon footprint examination mainly addresses the energy and utilities
consumption statistics from the NHS and education sectors as contained in Tables 6.6
and 6.7. The carbon footprint analysis explains the amount of greenhouse gas (GHG)
emissions caused by a particular activity or entity from which organisations and
individuals could assess their contributions to the climate change (CCT, 2008; Minx et
al., 2008; MTP, 2009). In this manner, the energy and utilities consumption data from
these sectors were modelled to show their contributions. This was done bearing in mind
the need to control such emissions for the realisation of sustainability. Carbon footprint
evaluation was conducted using a carbon calculator (CCalC) software package
formulated by Azapagic (2010). It should be noted that the CcalC software is made
available in the public domain for application and a snap shot of this package is
presented in Appendix VIII.
This analysis captures five different aspects of energy and utilities consumption in
both phases of the study and their carbon footprint results are indicated. The details of
the results are presented in Figures 6.6 and 6.7 respectively.
6.8.1 Carbon footprint analysis in the healthcare sector
The results show the trend that natural gas is the major driver of the GHG emissions
within the healthcare organisation. That said, electricity and water are also within the
higher carbon footprint band-width of the leading energy and utilities within this
scenario as presented in Table 6.6.
Table 6.6: Carbon footprint appraisal in the healthcare sector.
Energy Utilities
Consumption
Quantity
(kWh/FU)
CO2-equivalent
(Tonnes/kWh energy)
CO2- equivalent
(Tonnes/FU)
Electricity 1.04E+07 6.25E-04 6,501.41
Natural Gas 1.42E+08 5.04E-05 7,167.04
Heating 7.05E+02 2.46E-04 1.74
Water 8.23E+06 2.60E-04 2,141.10
Fuel oil/lubricant 1.49E+05 3.29E-04 49.03
TCF 1.59E+04

Bassey B. Okon Energy and Utilities Management, Study Phase VI
245
*TCF denotes Total carbon footprint
The carbon footprint impact from these three utilities is considerably high and the
emissions so far generated require proper scrutiny. Fuel oil/lubricant and heating energy
and utilities produced quite low carbon emissions across the entire phases of the
analysed building infrastructure systems. The study by Scott et al. (2008) within the
NHS also confirms this result. More information in relation to this study is shown in
Figure 6.6.
Figure 6.6: Carbon footprint result in health sector.
The graph of CO2 eq (Tonnes/FU) and energy utilities (kWh) is shown in Figure 6.6.
The results concerning the individual energy and utilities with total carbon footprint are
also presented.
6.8.2 Carbon footprint analysis in the education sector
The results of the carbon footprint primarily captured the five energy and utilities
impacts, with water and electricity leading the GHG emissions in the education sector as
presented in Table 6.7. In this case, the other remaining energy and utilities have low
carbon emission values. Table 6.7 illustrates the carbon footprint examination in the
education sector.

Bassey B. Okon Energy and Utilities Management, Study Phase VI
246
Table 6.7: Carbon footprint appraisal in the education sector.
Energy Utilities
Consumption
Quantity
(kWh/FU)
CO2-equivalent
(Tonnes/kWh energy)
CO2- equivalent
(Tonnes/FU)
Electricity 3.50E+05 6.25E-04 218.64
Natural Gas 7.84E+05 5.04E-05 39.52
Heating 2.38E+04 2.46E-04 5.87
Water 1.14E+06 2.60E-04 297.53
Fuel oil/lubricant 6.16E+03 3.29E-04 2.02
TCF 5.64E+02
From Table 6.7, it can also be seen that natural gas has produced quite a reasonable
emissions impact within this class of energy and utilities. Notably, fuel oil/lubricant and
heating energy produced very low emissions among the other examined cases (Figure
6.7).
Figure 6.7: Carbon footprint result in the education sector.
The relationship between the CO2 eq (Tonnes/FU) and the energy and utilities (kWh) is
shown in Figure 6.7. As a result, the individual energy and utilities chart with the total
carbon footprint is clearly presented for more information.
6.8.3 Comparative analysis between the healthcare and education
sectors

Bassey B. Okon Energy and Utilities Management, Study Phase VI
247
This study further examines the current carbon footprint management performance
between the healthcare and education sectors. The drive was to ascertain the
requirements of the Kyoto protocol with the long-term reduction of carbon dioxide
emissions to 80% by 2050 (CCT, 2008; UNFCCC, 2012; UNFCCC, 2009). Figure 6.8
is the correlation between the two investigated sectors and their CO2 emission ranking.
Figure 6.8: Correlation between healthcare and education sectors on CO2 emission.
The result suggests that energy usage as a result of its demand for electricity, is
slightly higher in the healthcare sector than in the education sector. This is probably
because the healthcare sector operates throughout the year without any downtime or
closing of its facilities, whereas the reverse is true in the education sector. Since, the
education sector predominantly operates during term time, the outcome is somewhat
reasonable. The natural gas utility consumption result shows that the healthcare sector is
leading (Figure 6.8) in this respect. Obviously, this outcome demonstrates the fact that
hospitals generally consume natural gas more than schools as they operate throughout
the year. Water utility consumption is led by the education sector. This is a reflection of
a huge water use especially in the schools‟ laboratories, hostels and offices (RICS,
2008; Shah, 2007; Hall, 2008).
Bassey B. Okon Energy and Utilities Management, Study Phase VI
248
Within term time, schools often consume a great volume of water and generate
wastewater resources, which is not surprising given that the population density of a
university is in the range 10,000–25,000 people. These figures include the members of
staff, students, visitors and other users within these buildings, which are more likely to
use the water facilities (Figure 6.3), and hence the result is realistic. At the same time,
the outcomes regarding energy and utilities (heating and fuel oil/lubricant) are negligible
demonstrating that their consumption rates are very low in both scenarios. Generally,
this study revealed that both the health and education sectors are performing well in
respect of the UK carbon reduction plan (CCT, 2008; OCED, 2003; OCED, 2010).
6.9 Probability analysis
Probability analyses related to the two sectors of healthcare and education were
studied using Matlab software. In this case, the energy and utilities statistics from
Tables 6.6 and 6.7 were exported into the Matlab software to generate data for the
graphical plots and evaluation. The rationale behind this analysis was to show the
forecast of aggregate carbon footprint from energy and utilities use within the
investigated case study (Scott, 2008; Shah, 2007). An effort in this direction is also
capable of informing the buildings (facilities) services managers about the carbon
footprint activities through energy and utilities consumption (Darby, 2011; Walker,
2007; RICS, 2008; CCT, 2008). The probability analysis algorithm used in this phase of
study is given as follows:
Identify the variables for the individual case in the health and education sectors;
Develop model equations;
Create a relationship for the two investigated scenarios;
Evaluate the data parameters;
Perform a probability analysis for the carbon footprint examination;
Plot the graph of the outcomes and verify the results.
The operational boundaries were determined by applying the concept and scope of
this study as expressed in Table 6.8. Boundary conditions for both axes were given as:

Bassey B. Okon Energy and Utilities Management, Study Phase VI
249
Table 6.8: Analysis parameters.
Axes Assigned boundary conditions
x- axis (0; 297.53; 7167.04)
y- axis l0 = 0.75.*x.*(x - 7167.04)./(3583.52 - 7167.04)
l1 = 0.65.* x1.*(x1 - 297.53)./(149.52 - 297.53)
These boundary conditions were assigned based on the results obtained from this
phase of study and to provide for modelling and evaluation in the probability analysis.
The generated Matlab information during the study and the outcome of this analysis
yielded a snap shot and other details of the carbon footprint plots as illustrated in
Appendix VIII.
6.9.1 Probability analysis result
The probability analysis of the carbon footprint in the investigated sectors is shown
in Figure 6.9. The probability analysis has delivered the most likely uncertainties
associated with the energy and utilities with their carbon footprint impact in both the
healthcare (NHS) and education (EDU) sectors. In addition, the energy and utilities
consumption rate from the healthcare sector has covered a wider range along the carbon
footprint (CO2 eq Tonnes/FU) compared to the education sector.
Figure 6.9: Probability result from the carbon footprint in the investigated sectors.

Bassey B. Okon Energy and Utilities Management, Study Phase VI
250
From the probabilistic model anaysis, the healthcare and education sectors are
correspondingly estimated at 65–70% of the carbon footprint forecast. Findings also
reveal that carbon footprint emissions through the energy and utilities consumption
from the healthcare sector achieve higher uncertainty than the education sector. It is
further suggested that the carbon footprint produced from the total energy and utilities
consumed in both sectors over their life cycle GHG emissions is huge, and therefore, a
proper check on these is required. The studies conducted earlier by Killip (2005), and
DEFRA (2011) also confirm a related situation. However, the outcomes in this study are
based on the data provided through the participatory schools and hospitals in the survey
within the UK. They are consistent with several reports in the literature (CCT, 2008;
Lelyveld and Woods, 2010).
6.10 Sustainability index
The sustainability index (SI) model as applied in this study aims to address and
normalise the three themes of sustainability (values) associated with the carbon
footprint of the energy and utilities. On this basis, accurate and reliable indices of
sustainability can be qualified and quantified within the healthcare and education
sectors. This study employs a combinations (C) and permutations function method in
Equation (33) of Section 3.9.8 for the examination. Parameters and symbols were
assigned to the energy and utilities in Tables 6.6 and 6.7 of this thesis. The governing
equations in this investigation are stated in Section 3.9.8. It became expedient to label
the energy and utilities with x and y as shown in Tables 6.9 and 6.10, to enable further
analysis. From the SEI model analysis in Section 3.7.3 the mathematical expression in
Equation (17) is translated into Equation (38).
(X1 X2 X3) = n(X1) + n(X2) + n(X3) – n(X1 ∩ X2) – n(X1 ∩ X3) – n(X2 ∩ X3) +
n(X1 ∩ X2 ∩ X3) (38)

Bassey B. Okon Energy and Utilities Management, Study Phase VI
251
Table 6.9: Energy and utilities with parameters in the healthcare sector.
Energy Utilities Consumption Rating Symbols (Xn) Total SI Result
Electricity 6,501.41 X1
Natural Gas 7,167.04 X2
Heating 1.74 X3 15,809.55 0.74
Water 2,141.10 X4
Fuel oil/lubricant 49.03 X5
Putting in all the parameters as illustrated in Table 6.9 into the combinations and
permutations function application gives the mathematical term in Equation (39).
[X1, X2, X3] [X1, X3, X4]
[X1, X4, X5] [X2, X3, X4]
[X2, X3, X5] [X3, X4, X5]
[X1, X3, X5] [X1, X2, X5]
[X2, X4, X5] [X1, X2, X4] (39)
Therefore, from the above expression; for an N number of energy and utilities, the
sustainability index function satisfies the NCn number of sustainable energy and utilities
indices derivations.
Taking the last function [X1, X2, X4] in the healthcare sector, these are electricity,
natural gas and water as the energy and utilities Hence, the sustainability index
examination implies the grouping of these energy sources and utilities from Equation
(40) for comparison in both sectors;
(X1 X2 X4) (40) Therefore:
SI Healthcare Sector (6501.41 7167.04 2141.10) = 15,809.55
Also, a similar analysis is performed in Table 6.10 for the education sector scenario to
ascertain the sustainability index result.
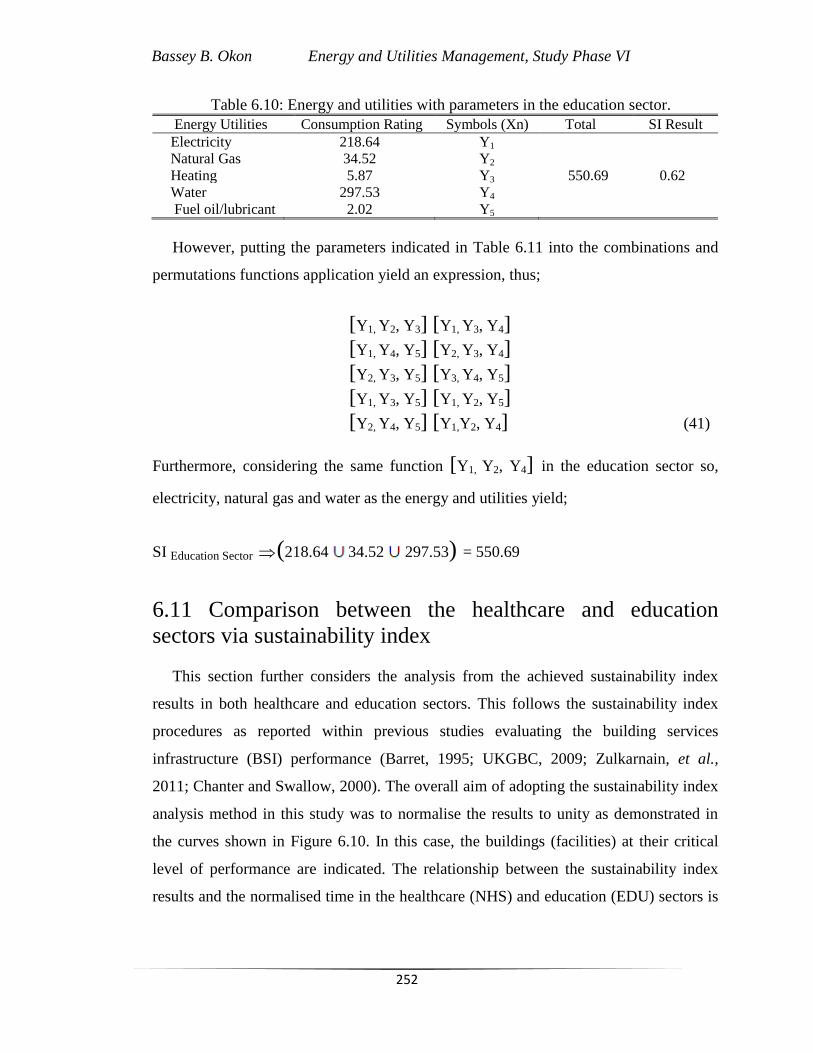
Bassey B. Okon Energy and Utilities Management, Study Phase VI
252
Table 6.10: Energy and utilities with parameters in the education sector.
Energy Utilities Consumption Rating Symbols (Xn) Total SI Result
Electricity 218.64 Y1
Natural Gas 34.52 Y2
Heating 5.87 Y3 550.69 0.62
Water 297.53 Y4
Fuel oil/lubricant 2.02 Y5
However, putting the parameters indicated in Table 6.11 into the combinations and
permutations functions application yield an expression, thus;
[Y1, Y2, Y3] [Y1, Y3, Y4]
[Y1, Y4, Y5] [Y2, Y3, Y4]
[Y2, Y3, Y5] [Y3, Y4, Y5]
[Y1, Y3, Y5] [Y1, Y2, Y5]
[Y2, Y4, Y5] [Y1,Y2, Y4] (41)
Furthermore, considering the same function [Y1, Y2, Y4] in the education sector so,
electricity, natural gas and water as the energy and utilities yield;
SI Education Sector (218.64 34.52 297.53) = 550.69
6.11 Comparison between the healthcare and education
sectors via sustainability index
This section further considers the analysis from the achieved sustainability index
results in both healthcare and education sectors. This follows the sustainability index
procedures as reported within previous studies evaluating the building services
infrastructure (BSI) performance (Barret, 1995; UKGBC, 2009; Zulkarnain, et al.,
2011; Chanter and Swallow, 2000). The overall aim of adopting the sustainability index
analysis method in this study was to normalise the results to unity as demonstrated in
the curves shown in Figure 6.10. In this case, the buildings (facilities) at their critical
level of performance are indicated. The relationship between the sustainability index
results and the normalised time in the healthcare (NHS) and education (EDU) sectors is

Bassey B. Okon Energy and Utilities Management, Study Phase VI
253
presented through the application of a partial differential equation method and Matlab
analysis in Appendix VIII.
These methods have been able to determine the critical levels at which the building
services infrastructure operations are not be exceeded. The plots in Figure 6.10 show
clearly the outcomes of these techniques and the additional feature associated with the
aforementioned analysis is also presented.
Figure 6.10: SI and time within investigated NHS and education sectors buildings.
The research results indicated in Figure 6.10 are related to the energy and utilities
management from the NHS and education sectors. However, more details adduced from
these results are presented:
The analysis of the results shows that the NHS has gained 0.74 and education 0.62
as their sustainability indices respectively as contained in Figure 6.10.
There is a marked difference between the two sectors as the sustainability index in
NHS is 8% higher than the education sector (Tables 6.9 and 6.10).

Bassey B. Okon Energy and Utilities Management, Study Phase VI
254
The result from this model parameter best describes the three themes of
sustainable development which includes economic, social and environmental
values. Hence, the combinations and permutations function adopted the same
order in selecting from the list of the energy and utilities.
The findings also indicate the application of combined heat and power (CHP) in
energy utility management is explained by the selection approach as effective
means of energy mix. However, the sustainability indices results in both sectors
are quite good in terms of the services delivery.
These results demonstrate consistency and to further enhance accuracy in this case, a
Matlab software technique was used for the computation of the measured field
information as presented in Figure 6.10.
6.12 Constraints in study phase VI
The problems encountered during the data acquisition in the research were:
Difficulties in getting information from the targeted managers in the healthcare
and education sectors.
Delays from some respondents within the investigated sectors in completing and
subsequently returning the survey for data analysis.
Administrative bureaucracies within these organisations, which posed difficulty in
the acquisition of data for evaluation.
Data disclosure and information brokering from some managers and members of
staff from these organisations. As a result, they expressed fear of divulging the
confidential information in the process of completing the survey.
6.13 Contributions to knowledge in study phase VI
The research outcomes from the sustainability perspective have identified three top
energy types and utilities: electricity, natural gas and water. They are found to be the
main drivers of the GHG emissions within the investigated sectors. Also, it became
necessary to categorise these energies and utilities in order of their carbon footprint
magnitude for ease of qualification, quantification, proper control, and management.
Bassey B. Okon Energy and Utilities Management, Study Phase VI
255
Certainly, this effort will assist in the discovery and mitigation of energy and utilities
with higher GHG emissions. The application of the combinations and permutations
function in addressing the sustainable index in this case is a novel concept in managing
building infrastructure systems. Increasingly, the carbon footprint, probability analysis
and the sustainability index appraisal approaches will offer a feasibility awareness and
resources engineering. Again, a suitable framework for planning building services
infrastructure activities and budgeting in the NHS and education sectors is achieved.
6.14 Summary of study phase VI
In this study, the gains of materials recyclability are emphasised. Also, the
achievable results from the carbon footprints examination are capable of providing more
profitable insight towards the reduction of the GHG emissions within the case study.
Besides, the sustainability index result has presented a carbon footprint indicator
showing the current situations and the future reduction prospects across the investigated
scenarios. This development obviously is very informative not only to the healthcare
and education sectors in benchmarking emission targets, but also to the facilities
managers. In other words, the operators, consumers and every other facet associated
within these sectors can be aware of the impact created from the energy and utilities
along with emissions control strategies. Based on the adduced inference from this study,
the findings have been able to address the related objectives for sustainability success.

Bassey B. Okon Interviews, Study Phase VII
256
Chapter Seven
7.0 Interviews in study phase VII
7.1 Introduction
Two professionals were interviewed as part of the research as shown in the study
presentation in Section 7.2. Also in Section 7.3, the goal and scope definition of the
research is stated. An excerpt from the interview session with a professional in
sustainability within the building services infrastructure is highlighted in Section 7.4.
Section 7.5 presents an analysis of an interview conducted with the Director of
Sustainability in BDP Company about building construction projects. The results and
discussion arising from the two interviews together with the constraints in this phase of
study are indicated in Sections 7.6 and 7.7 respectively. And the contributions to
knowledge, conclusion, and the benefits derived from all the phases of this study are
presented in Sections 7.8–7.11.4 of this thesis.
7.2 Presenting the study
This chapter reports the interview sessions conducted with two sustainability
professionals within the UK. They are (a) the Director of Building Services and
Construction Projects Management programme at Liverpool John Moores University
(LJMU), and (b) the Director of Sustainability at the BDP Company. Appendices IX
and X contain the structured interview questions asked of these interviewees. The
interviews were undertaken in line with the research aim and objectives.
7.3 Goal and scope definition
The goal of this study includes appraising the efforts to achieve sustainability in the
integration of building services infrastructure systems, and among other areas of
interest, the energy and water utilities, materials consumption, and waste management
are important. Additionally, the building construction infrastructure systems were also
evaluated in view of the sustainability ethics associated with thesein recent times. The
Bassey B. Okon Interviews, Study Phase VII
257
scope of the study allows for the inclusion of both private and public sector enterprises
within the UK, and their respective infrastructure performance. It is assumed that given
the contributions made by the experts, directions for a rigorous approach in the
implementation of viable engineering projects for the present and future generations,
could be forthcoming.
7.4 Interview with the Director of programme LJMU
This interview was conducted by telephone with a list of structured questions being
sent in advance to the interviewee (Appendix IX). The interview was held on the
17/12/09 and lasted for 45 minutes. It was focused on the research aim and objectives
with a view to addressing the problems affecting sustainable infrastructure systems and
sustainability ethics within the building services infrastructure. The interview analysis is
as presented:
The interview began with mutual introductions, after which the interviewer
introduced the research topic, “sustainable infrastructure systems management” and
sustainability integration within this context.
Q1. As an academic expert in the building services and construction projects
management, what are your views regarding sustainability ethics?
As sustainability ethics generally concentrates on the needs of the present without
compromising the ability of future generations in every field of human endeavours,
basically, the building services and construction projects management are not left out.
The implication is that, building services infrastructure has much to do with the life
support and security of occupants within the infrastructure systems. As a consequence,
this has put much pressure on the resources use such as energy (fuel) and water to
mention but just a few. Notwithstanding, from the academic perspective the global
warming issues have necessitated more awareness creation and knowledge transfer
approach towards this field. Against this backdrop, the requirements of sustainability
must be met for any sustainable development to take place.

Bassey B. Okon Interviews, Study Phase VII
258
Q2. What are your views regarding sustainability ethics in the project management and
services delivery generally?
Sustainability ethics with a view to the infrastructure projects and service delivery
processes start from the philosophy of „good engineering‟. The term good engineering is
very broad but this could be found on a typical projects life cycle framework in this
context. However, a good engineer should think of sustainability values in the
implementation of projects and services delivery by incorporating sustainability models.
On a realistic note, the sustainability focus should be perceived throughout the entire
projects life cycle. This has become more imperative in the current trend towards the
attainment of sustainability practices in engineering projects management.
Q3. Please, what is your opinion towards the adoption of sustainability ethics in both
private/public sectors project delivery?
The outlook of sustainability theory and application into the private sector is now
gaining momentum as a driving agenda for purposeful economic development.
Furthermore, the public sector in the same vein cannot ignore the sustainability
programme for the overall success of building infrastructure growth. Therefore, the
recognition of sustainability values within the building services projects need not be
overstressed. In general, both private and public sectors have acknowledged the
pressure on resources depletion due to absence of sustainability practice in engineering
projects. As a result, the agenda in recent times takes a centre stage in the service
delivery of projects activities.
Q4. What are the effects of the above on:
(a) Building Services Infrastructure particularly?
The building services infrastructure domain has to be properly integrated into the
sustainability as the projects undertaken in this sector cannot be separated from others.
On that note, the total projects life cycle in this background should be considered as
being fully part of the scheme. Nevertheless, the expert reiterated that there is no

Bassey B. Okon Interviews, Study Phase VII
259
meaningful development contextually without the wide acceptability of the
sustainability paradigm as the benefits facilitate improved services delivery.
(b) Building Construction projects management scenario?
On the building construction projects management, the idea of sustainability should
involve all the factors in engineering plans and feasibility studies generally. That is, the
bills of engineering measurement and evaluation (BEME) have to address cost, energy
and materials utilisation. Also, the unidentified factors such as sustainable framework
with regards to sustainability must be addressed. Consequently, detail analysis of the
engineering progress schedule will provide for proper verification of construction work
from the inception through completion stages.
Q5. What are the identifiable problems affecting the management practices within this
scope?
The identifiable problems are:
(i) Sustainability education awareness: This has posed a lot of problems on the
sustainability agenda. However, most people need further learning for the overall
success of sustainability values. Therefore, efforts inclined towards this direction
will enhance smooth transition of the notion from theory to practice.
(ii) Process identification: It involves the general ethics of the sustainability
paradigm and the applications on projects. On this premise, the life cycle analysis
and sustainability framework have to be established for a particular project. This will
guard against unethical practices within the building services infrastructure projects
delivery.
(iii) Economic shift: Explains the eco-energy and financial involvement due to the
global warming danger. The experts further corroborate on the inclination towards
sustainability has become very important as research reveals on the energy (fossil)
fuel depletion in the near future. As a consequence, the energy (fossil) fuel
diversification to other energy sources such as biomass, wind and solar becomes

Bassey B. Okon Interviews, Study Phase VII
260
innovative concepts. Moreover, wastewater and the grey water resources within
some building infrastructure are being recycled. This water management process
(recycling) is a sustainability approach in harnessing water resources. Nevertheless,
the attitudes of building infrastructure users need to be changed for the realisation of
sustainability objectives.
Q6. How can the identifiable problems in Q5 be addressed?
The identifiable problems could be addressed viz:
(i) International and national conferences: This should be encouraged for the
awareness creation and propagation of the sustainability values. The Rio de Janeiro
earth‟s summit in (1992), the Kyoto and the Copenhagen conferences were aimed at
disseminating information on the eco-shifts and the sustainability principles.
(ii) Academic perspective: The academic sector has a lot to deliver regarding the
sustainability practices. As a result, more education awareness has to be encouraged
and the curriculum structured to contain the sustainability ideology. An attempt in
this direction will facilitate the practice of sustainability ethics within building
services infrastructure and construction projects at large.
(iii) Collaboration: On a general note, more collaborative efforts need to be sustained
nationally and internationally within the construction industry regarding
sustainability. Considering the highlighted facts, the driving forces have to integrate
both private and the public sectors in the quest for sustainability attainment in this
perspective.
From this interview it was observable that for the building services infrastructure
systems to be sustainable, efforts should be made in creating more awareness on the
sustainability values. This could be achieved through conferences both nationally and
internationally along with a suitable research and development (R&D) drive. Building
services infrastructure and construction projects could offer improved service delivery
when the users‟ attitudes are inclined towards sustainability goals. Collaborative efforts
Bassey B. Okon Interviews, Study Phase VII
261
in this direction will engender the sustainability principles in building infrastructure
systems goals.
7.5 Interview with the Director of sustainability BDP Company
Another interview was carried out with the Director of Sustainability in the BDP
Company, Manchester Office, UK. In this case, the interviewer and interviewee met
face to face with a list of structured questions as contained in Appendix X of this report.
The interview took place on the 23/03/10 and lasted for 1 hour 12 minutes at the
company‟s conference room in Manchester. The agenda for the interview was in line
with the research aim and objectives. This interview was performed within the context
of sustainability integration into the building construction industry, and it addressed
both private and public sector perspectives on sustainability success within the
construction sector.
As is common practice, the interview commenced with mutual introductions, and the
researcher then introduced the research topic as “sustainable infrastructure systems
management” and sustainability integration within the building construction sector.
Q1. As a sustainability expert in building infrastructure projects management, what are
your views regarding sustainability ethics in this context?
The sustainability ideal focuses on the needs of the present without compromising
the ability of the future generations. The term „sustainability‟ within the construction
industry generally involves the design, management and operation of the building
infrastructure stages. Furthermore, from the design through operation stages,
sustainability principles need to be integrated. Buildings in recent time are aimed at
achieving low carbon emissions on the full life cycle. Therefore, upon successful design
of a low carbon house, the management regarding set targets must be maintained and
operated in accordance with the given parameters.
Q2. What are your views regarding the sustainability agenda in the current projects and
services delivery?

Bassey B. Okon Interviews, Study Phase VII
262
The importance of sustainability in projects delivery is to improve the economic,
environmental and social quality of life as found in the trio themes. That is, the design
principles, management and operation earlier mentioned have greater impacts on the
resources as a consequence of global warming. But, having integrated sustainability into
building construction projects; this global warming could be addressed for improved
service delivery.
Q3. What is your opinion towards the adoption of the sustainability scheme in both
private/public sector projects delivery?
Observably, lots of progress has been made in these sectors. In the public sector,
experiences have shown that for the past five to ten years; funding of projects is driven
by: government, regulations, and policies with a focus on sustainability. On the other
hand, the private sector is more conscious about public relations, business benefits and
the overall interest from the clients. But, both sectors are slightly driven in different
ways. However, the duo adopts sustainability-driven approach in the service delivery of
projects on this background.
Q4. What are the effects of sustainability scheme on:
(a) infrastructure utilities (i) energy (ii) water management
The sustainablility of energy infrastructure (utilities) focuses on the renewable
(biomass) energy schemes, energy conservation, use of solar, photovoltaic and generally
for low carbon projects delivery. Consequently, as a sustainability drive, the local
energy resources such as wind, sun are efficiently utilised for energy production. This
sustainability technology will reduce the dependency of energy from the national grid.
Moreover, the local districts can generate and distribute the energy produced locally
from this innovative concept to boost the economy.
On water management setting within the building infrastructure systems, the
sustainability interests underscore: the minimisation of water (reuse) and grey water
technology. It also addresses the prevention of water run-off from flood menace and the
efficient management of water resources. However, the application of the highlighted
Bassey B. Okon Interviews, Study Phase VII
263
management methods will promote sustainability goals in pursuit of optimising the
urban water infrastructure.
(b) Building construction projects management?
In light of the building construction projects, the sustainability know-how focuses on
the ecological on-site practice, carbon footprint and generally the building research
establishment assessment method (BREEAM). Therefore, the design of building
services infrastructure must be in consonance with the guidelines of BREEAM‟s
construction scheme, which increases the sustainability engineering scheme.
Q5. What are the identifiable problems affecting the management practices within this
scope?
The identifiable problems in this case are:
The principles of good quality engineering orientation;
Good bills of engineering materials and evaluation (BEME) or bills of quantity
(BOQ);
More holistic views of costs associated with the construction materials;
Knowledge barrier;
People;
Risk management;
Over engineering;
Knowledge of facilities management activities and the general management
approach; and;
Inexperience on the side of some clients.
The indicated factors from experience have hindered the overall success regarding
sustainability management progress within this context.
Q6. Based on (5) above; how can these be addressed?
Consequently, the following suggestions can solve these problems:

Bassey B. Okon Interviews, Study Phase VII
264
(i) Academic awareness: The understanding of sustainability idea is very important
as a medium of sensitising the populace on it goals. As a result, the realisation of
sustainability principles depends on proper design, educational training, re-training
and networking with the building construction industry.
(ii) Cost management: Involves either over or under estimation of cost of projects
without taking cognisance of sustainability implications. This is a significant factor
that requires proper scrutiny during bidding of contract processes and periodical
reviews.
(iii) Improved skills: Sustainability objectives can only be achieved through
collaboration; use of suitable frameworks, research and development (R&D). It
encompasses technology shift among the three themes of sustainability from
academic perspective to the construction industry. Therefore, efforts have to be
developed to accommodate this transfer arrangement for quality services delivery.
Q7. What are the government policies regarding sustainability within this context?
Government policies (UK) regarding sustainability could be obtained in the Energy
White Paper. Nevertheless, government under the carbon reduction commitment (CRC)
target has placed the CO2 energy emission target at 80% by the year 2050. That is, the
industrial sectors have to agree with government energy production benchmark of
600MW as a reduction commitment. Contrary to this target attracts payment of fine to
the government from such an organisation. Furthermore, these policies are formulated at
the central government level; however, the local government planning authorities are
meant for the implementation process. The package contains different standards for the
hospitals (NHS), defence, schools and other public facilities with carbon reduction plan
targets of 33% by 2020 in this background.
In addition, the performance blueprint regarding water serving management as a
sustainability strategy is very rewarding. The government policies drive in this regard
ensures that water have to be sustainably managed in the construction sites, homes,
facilities and other building services infrastructure. As a result, the overall efforts of

Bassey B. Okon Interviews, Study Phase VII
265
government aimed at preventing the menace of water over flooding the buildings or the
entire city due to lack of controlling measures.
Q8.What are your views regarding the Copenhagen earth summit (2009) conference on
sustainability?
The Copenhagen summit 2009 was unproductive, demonstrating irresponsibility of
the leadership in the affected nations to agree on round table deliberations. However,
the global warming, energy crisis and the downward eco-shifts have posed threats to the
economy and sustainability principles. Therefore, it is becoming more imperative for
proactive steps to be taken in addressing these anomalies. It is envisaged that the world
leaders on realisation of these problems will rise to the expected challenges and sign up
to common consensus. Hence, contentious issues regarding sustainability and economic
development have to be addressed through a forum of this nature for the general interest
and well-being of citizenry.
Q9. What is the progress made so far from the Kyoto (Japan) conference regarding the
sustainability policies till date?
Basically, from the Kyoto conference agreement the United Kingdom government
has been able to set some strategic targets (DEFRA, 2006). For instance, the
interdisciplinary design of low carbon buildings ought to meet 10% target by 2020.
Also, the industrial energy efficiency on equipment usage and the global consumer
growth have equally been addressed to meet the aspiration of the forum.
Notwithstanding, the endless growth towards targetting the services delivery on energy
utilities (electricity, heating) bills is being reduced. On a practical note, the summit is
more rewarding concerning sustainability programme on the carbon footprint in energy
management.
Q10. What do think that could be achieved now from the integration of sustainability
agenda into building infrastructure management generally?

Bassey B. Okon Interviews, Study Phase VII
266
The integration of sustainability into building infrastructure systems management is
to improve the quality of life. It could be regarded as a common vision on the resources
use, materials consumption, waste minimisation and products recycling. Fundamentally,
the overall idea about sustainability in this context is rethinking on the life cycle of
resources. Typically, the construction companies through this innovative concept on
sustainability are becoming more conscious towards energy utilisation and waste
minimisation. Therefore, the entire process of sustainability is a continuity of supply
chain knowledge transfer as it cuts across the product life cycle in all facets of
development.
Q11. Suggested valuable contributions during the interview session were:
The research should thoroughly investigate on the sustainability gaps and
recommend positive ways of addressing the global warming crisis within this sector.
More academic awareness should be tailored towards educating the masses on
sustainability agenda and its benefits for the present and future generations.
7.6 Results and discussion in study phase VII
The research interviews addressed several issues regarding the sustainability
incorporation from the academic and construction industry perspectives. Moreover, the
two interviewed experts critically highlighted the benefits of sustainability as measures
for improving the quality of life through sustainable development. Some factors were
identified as major barriers viz: educational awareness, economic shifts, costs
management, and knowledge barriers. The major players for the promotion of the
sustainability programme are seen as educational awareness creation, and technology
transfer, in respect of sustainability practices. International and national summits are
also indicated as a means for policy formulation and implementation.
7.7 Constraints in study phase VII
The constraints were basically administrative bureaucracy in these organisations. It
was a difficult task to arrange an interview with these directors. Initially, it was
Bassey B. Okon Interviews, Study Phase VII
267
necessary for the researcher to make repeated calls and exchange mail correspondence
before any personal contact was made with the director at LJMU. After securing
agreement it took two more weeks before the interview was scheduled. In the case of
meeting with the director of sustainability at BDP company, the situation was similar.
Both interviewees mentioned that their work schedules were busy and that neither
would be able to grant any form of interview during working hours except with the
approval of their organisations. Generally, there were perceptions that the interviewees
were afraid of divulging confidential or sensitive information on the standard of
practices to outsiders.
7.8 Contributions to knowledge in study phase VII
There were many benefits deriving from the interviews conducted with these two
experts, and the salient points complementing the survey information are noted as
follows:
Identification of gaps between the theory and practice of the sustainability values
and mitigation,
The current trend in respect of the sustainability programme in both building
services and building construction infrastructure systems generally,
The paradigm shift associated with the current sustainable infrastructure systems
management,
The obligatory need to promote the sustainability programme into viable
engineering projects,
The research has established a correlation between the academics and field
practice in terms of integrating sustainability schemes into projects management.
7.9 Summary of study phase VII
Findings from both academic and construction industry perceptions have shown a
very strong correlation on the significance of the sustainability ethics on the likelihood
of sustainable growth. Additionally, the professionals observed that sustainability has

Bassey B. Okon Interviews, Study Phase VII
268
become imperative in all fields of human endeavour and that its ideals must be
encouraged for economic expansion. The interviewees suggested the following
measures for improvement in sustainability practices:
Educational awareness creation of sustainability ethics;
Collaborative networking between government and the construction experts;
Inclination on government policies;
Cost management education between the client and the contractors;
Technology transfer on sustainability practice; and;
Co-operation to engender the cross-fertilisation of ideas through international and
national summits.
However, the directors further reiterated the need for a positive change of attitude by
the infrastructure users. That is, the resources provided within an infrastructure system
have to be prudently managed for the sustainability realisation. Also, more holistic
approaches regarding the available resources in this context should be the watchword
for the present and future generations.
7.10 Relationship among the entire phases of study, I–VII
All the phases of this study are related in terms of the architecture, components and
engineering design for services delivery. Typically, the infrastructure characteristics
design in the study phases I–IV provides a holistic pattern of buildings (facilities)
settings from the cradle to grave - that is, from the design, construction, operation and
maintenance stages of buildings/facilities generally (Grigg, 1988; NSF, 2005). As such,
the pattern provided houses all the infrastructure components assessed in the study
phase V. Hence, the environmental impact from the installed equipment, energy and
utilities consumption and their related costs can be evaluated to ascertain the quality of
performance in buildings and facilities.
In the case of the energy and utilities appraisal in study phase VI, their activities are
within buildings and facilities as elements of the infrastructure systems. The energy and
utilities consumption gradually constitutes environmental impact. Hence, the resultant

Bassey B. Okon Interviews, Study Phase VII
269
effects of these energy types and utilities contribute towards the global warming and
climate change (PMPCB, 2010; RICS, 2008; Ellis, 2007; CCT, 2008). With the
integration of a sustainability programme into building services and building
construction activities as core management strategies, this situation could be
appropriately addressed. This can only be achieved through suitable innovative design,
construction, installation of quality equipment and standard maintenance culture
practices in study phases I–V as revealed in the survey data (Horner et al., 1997; Bayer
et al., 2010). Nevertheless, the study in phase VII is also related to the other phases of
the research activity. In phase VII of this study, structured interviews were used to
evaluate the perception of sustainability in the current management practices in building
projects and implementation processes. The interview findings were used to corroborate
the survey information. On the whole, this study has been able to address all facets of
building infrastructure performance from the cradle to grave in terms of sustainability
success.
7.11 Benefits derived from the entire phases of study, I–VII
So far, this study has produced many benefits and breakthroughs concerning the
concept of sustainability and its integration into building infrastructure systems
management in the 21st century generally. The noticeable gains from all the different
phases of the study are presented in each case. Moreover, due to the nature of the
research, credits from the individual phases of this study are clearly indicated in the
thesis. The rationale behind this presentation is to avoid confusing the information, and
to promote consistency in the study.
7.11.1 Benefits derived from the study in phases I–IV
Infrastructure characteristics study in phases I–IV have provided more insight into
the determination of the impact of the various factors by the use of statistical testing.
The benefit has culminated in results which could also enhance practical decisions
regarding building services infrastructure management. Moreover, the study in this
phase has yielded the development of a sustainable engineering infrastructure (SEI)

Bassey B. Okon Interviews, Study Phase VII
270
model, sustainability index matrix, and a partial differential equation method. These
techniques are capable of measuring the building infrastructure performance. This is
evident as the data were qualified and quantified for sustainability valuation. Obviously,
these methods have become innovative platforms for appraising the building
infrastructure performance on which corporate organisations can rely when making
strategic decisions. Furthermore, these models have become dependable platforms in the
engineering domain regarding building management activities.
7.11.2 Benefits derived from the study in phase V
This study in phase V has delivered a generic procedure to verify the environmental
impacts of the building infrastructure systems through the application of the LCA
method. The LCA technique has also been applied to establish the total costs of
ownership of building infrastructure network, and the outcomes with the economic
benefits are reported in this thesis. This is a beneficial and interesting discovery
concerning the building infrastructure systems management goals.
7.11.3 Benefits derived from the study in phase VI
In this phase of the study, many breakthroughs have emerged concerning the
building infrastructure energy and utilities. Basically, measured field data in five energy
utilities to include water, electricity, oil, natural gas and heating were obtained from the
healthcare and education sectors within the UK. Waste management and materials flows
statistics were also received from the above sectors for examination. This study has
benefited through the application of the latest version of the carbon emission calculator
software CcalC version formulated by Azapagic (2010) in performing the carbon
footprint appraisal.
The results obtained are very interesting, providing much insight regarding the type
of waste and the management strategies. Energy and utilities appraisal from the two
studied sectors is performed using the partial differential equation method. A high
achievement in this domain is the modelling of data using the SEI model, combinations
and permutations function to obtain results on energy and utilities. Notably, the
investigated sectors were examined and their sustainability indices determined through

Bassey B. Okon Interviews, Study Phase VII
271
the partial differential equation method, which stands as another innovative approach in
addressing sustainability in building infrastructure systems management.
7.11.4 Benefits derived from the study in phase VII
In phase VII of this overall study, the opinions of two experts, an academic, and a
practitioner, have been gathered through interviews with each. Both professionals
confirmed the need to embrace the sustainability ethics and to integrate these into the
building infrastructure, thereby presenting a need for a paradigm shift from the current
economic trend. One of the benefits from this phase of the study is the concordance in
the views drawn from these experts regarding the actualisation of sustainability success.
These include creating educational awareness, collaboration between government and
individuals, and good quality cost engineering evaluation.
Technology transfer in sustainability practice within infrastructure systems
management has been emphasised. Another gain from this study is the experts‟
combined belief in the need to address the sustainability challenges concerning the
building infrastructure systems management through international and national
conferences. This type of platform, they believe, will allow for the cross-fertilisation of
ideas for the practical implementation of the sustainability ideals into building projects.
Additionally, comments made by the interviewees have been able to bridge the gap
between the theory and practice in pursuit of the sustainability principles. On the whole,
the benefits are quite significant based on the latest discoveries in managing building
infrastructure systems for improved services delivery.

Bassey B. Okon Conclusions and Recommendations
272
Chapter Eight
8.0 Conclusions and recommendations
8.1 Introduction
This Chapter of the thesis presents the conclusions and recommendations. Section
8.1 considers the general background information regarding the research. In Sections
8.2 and 8.3, the research objectives are revisited, and the overall conclusions are
presented. In Sections 8.4 and 8.5, the research contributions to knowledge and
limitations are indicated. These contributions are followed by recommendations for
practical implementation (Section 8.6), and for future research and policy-making
respectively, in Sections 8.7 and 8.8.
Building services infrastructure systems are of great concern as the current practices
have placed pressure on natural resources, and indeed crisis, due to managerial
inefficiency in dealing with the available resources (Grigg, 1988; GSGF, 2010; Turner,
2006; Wood, 2006). Bearing this problem in mind, this study has produced valuable
insight regarding building services infrastructure and building construction projects in
the contemporary situation. Investigations in this context have identified the
applications, existing challenges, and areas of weakness which could be addressed in the
quest to achieve better performance (Okon et al., 2010; Kintner-Meyer, 1999;
ASHRAE, 2004). The existing literature in this area of consideration has pointed
towards the integration of the sustainability agenda into building services infrastructure
systems management as the best practice (Eco Homes, 2003; RICS, 2008; KMPG,
2008). The application of the acknowledged facts regarding building services
infrastructure systems management will assist in meeting the set objectives in this
research.
8.2 Discussion on the research objectives
The following research objectives on sustainable building services infrastructure
systems management are now discussed successively:

Bassey B. Okon Conclusions and Recommendations
273
First among the list in the study objectives is the identification of the problems
influencing building services infrastructure and building construction practices.
Buildings (facilities) in the UK and Nigerian scenarios were appraised.
In this aspect of the study, the emphasis was on reviewing the extant literature, and
on devising a questionnaire for piloting. The analysis of the related literature provided
the prerequisite information regarding the building infrastructure systems management,
the gaps, barriers, and the way forward. The pilot study allowed the researcher to
acquire substantial feedback from experts involved in building infrastructure systems
management. Using this feedback, the questionnaire was re-engineered, such that the
final instrument was based on a combination of information from the related literature
and pilot study results.
The second part of the research objective centered on investigating the parameters
militating against the achievement of best practices within the context of this
research.
Organisations associated with building services and building construction
infrastructure in Nigeria and UK were identified and asked to participate in the study.
The views of experts in various organisations that were involved in this pilot study
generated more insight and information on building infrastructure systems management.
Essentially, this part of the study benefited from the structured survey based on the pilot
study, literature analysis inputs, and experts‟ views. The organisations involved
represented both the public private sectors, and the breadth of opinion obtained is
featured in the results and discussions.
On this basis, several parameters regarding the building infrastructure systems
management in the seven phases of the study were identified, and their results simulated
toward achieving the best practice. Typically, in the building infrastructure
characteristics study, the survey established 50 characteristics and grouped them into six
different headings. These include: (a) energy resources management; (b) water
resources management; (c) maintenance management practices; (d) infrastructure design
characteristics; (e) infrastructure project characteristics; and (e) external factors

Bassey B. Okon Conclusions and Recommendations
274
affecting building infrastructure systems management. The Nigerian and UK standard
of practice were examined on building infrastructure systems management and their
outcomes presented.
The third objective involved appraising the current standard of building services
infrastructure systems management performance in both the private and public
sectors.
Many building infrastructure systems within the UK and Nigeria have been studied.
These include those in the Aluminium Smelting Company of Nigeria (ALSCON), Oil
and Gas sectors in Nigeria, shopping malls in the UK (the Manchester Arndale Centre,
and the Liverpool One Mall). In addition, organisations from the building construction
sector (the Laing O‟ Rouke Group, Atkins Global, and MHW) provided very useful
information, as did the BDP and BAM companies, which gave valuable data regarding
infrastructure systems management, particularly in the UK setting.
The evaluation of the current standards of practice in building infrastructure systems
management addresses the environmental impacts assessment (EIA), LCA and LCC in
respect of six ongoing building services infrastructure systems in the UK. Energy and
utilities (infrastructure), and carbon footprint management in the healthcare and
education sectors within the UK, were assessed in terms of their ethics as seen in
practice. Two interview sessions were also conducted with Directors in the BDP
Company, and the LJMU, with a view to benchmarking the current standards of
sustainable infrastructure management performance. This aspect of the study considered
performance and practice in both academia and industry. Having involved all the
organisations mentioned, the researcher analysed the data gathered by employing
various methods and software packages to obtain meaningful results, which have been
reported.
The fourth objective in the study focused on the development of models and
frameworks. The following were formulated and subsequently applied to test
building infrastructure systems in the course of this study.
Bassey B. Okon Conclusions and Recommendations
275
These are: (a) the sustainable engineering infrastructure (SEI) model on pages 81 and
95; (b) the partial differential equation method on page 97; (c) the sustainable index
matrix; 169 and (d) the project life cycle framework on page 57.
So far, the SEI model is being applied in testing several building infrastructure
systems within and outside the UK. The SEI model application contextually has been
able to qualify and quantify the triple themes of sustainability values for sustainable
development success. Recent refereed journal and conference publications generally on
sustainability and building infrastructure systems management give credit to the SEI
model as an innovative paradigm for sustainable development. It is noteworthy to
mention that the SEI model is currently being used as a platform in infrastructure
planning and implementation within the engineering community. Several researchers
have in recent times found the SEI model very useful in the infrastructure systems
management domain. The SEI model is capable of integrating the building services
infrastructure systems variables analysis in the interests of achieving improved
performance.
The partial differential equation method in this research is established and capable
of addressing the building infrastructure challenges in the bid to achieve sustainability.
The partial differential equation method application has been able to measure the
building infrastructure systems performance within the area (A) for the strategic
management decisions. Indeed, the partial differential equation method is a simple
approach as it could also analyse various building services infrastructure systems
scenarios range 0 ≤ Suv ≤ 1 as sustainability index. This information achieved through
the partial differential equation method and application will be valuable for the proper
evaluation of infrastructure systems.
In this study, the sustainability index matrix is among the developed models. This
model is packaged with a catalogue consisting of a sustainable index (SI), infrastructure
performance category (IPC) and the remarks on the building services infrastructure
systems performance. The mapping in each case in this model indicates the level of
building services infrastructure systems status and the potential expectations.
Furthermore, the novelty in this model rests on probability theory as it is used in
defining the sustainability index range as 0 ≤ Suv ≤ 1 for any given system, Table 4.25.

Bassey B. Okon Conclusions and Recommendations
276
It is found that several studies (see Cheryl, 2008; Grigg, 1988; BREEAM, 2008; RICS,
2000; RICS, 2008) on sustainable infrastructure management have discovered similar
findings in appraising services delivery levels. In the present study, building
infrastructure systems from different perspectives are considered. This model is
beneficial in determining the building infrastructure performance category (IPC) for
possible management actions.
The project life cycle framework is also well formulated in this study. The project
life cycle framework as proposed in this study addresses the infrastructure systems
performance from the cradle to grave. This framework incorporates the LCA, LCC and
the ISO 14001 standard to assess the building infrastructure systems services delivery. It
also verified the level of building infrastructure systems performance from the
construction phase through to decommissioning together with the on/off site recycling
processes. Indeed, this framework has been tested on the building services infrastructure
systems and also published in a refereed journal by the WCE (2010). The outlined
standards are able to measure the building services infrastructure systems performance
as this framework has added value to the present study.
The last objective in this study aimed to apply the developed models and project
life cycle framework to test building construction activities. This objective is
also tailored towards drawing a comparative analysis and validating the entire
phases of the research.
In this thesis, the developed models were applied to the study of several cases related
to building services infrastructure within and outside the UK, and their results are
presented. The formulated models and the project life cycle framework have hitherto
been accepted for publication in several refereed journals and conferences. Remarkably,
the developed models in this thesis have been used in studying different building
services infrastructure systems scenarios in the UK and Nigeria. The models and
framework have been tested and found reliable in evaluating building services
infrastructure systems generally. Comparative analyses have been made and their
outcomes in each case are presented in this thesis. On the whole, the system approaches

Bassey B. Okon Conclusions and Recommendations
277
as explained have been able to address the entire study challenges regarding building
services infrastructure performance.
8.3 Overall conclusion
Seven phases of study were performed within the UK and Nigerian contexts.
Basically, infrastructure systems performance has been the main focus in the study in
pursuit of sustainability success. The study has presented and discussed the aim,
background literature, survey administration, and methods used in conducting the
analysis. The results for each phase of the study together with discussions on the results,
are also presented. It is notable that the findings demonstrate variations in each case due
to the aim and objectives of the different facilities considered.
Phases I–IV address the building services infrastructure characteristics generally.
The study reviews different factors that militate against the proper implementation of a
sustainable infrastructure management within the UK and Nigerian scenarios. The
sustainability index (SI) outcomes indicate the following: O&M = 0.54, BCC = 0.70,
ALSCON = 0.47 and MPN = 0.43. But, the critical level of the investigated buildings
(facilities) results alternatively yields: O&M = 0.20, BCC = 0.26, ALSCON = 0.17 and
MPN = 0.16 in this appraisal.
It has been established that building services infrastructure delivery could be realised
through suitable design, construction, operation, and maintenance culture. This drive
becomes imperative due to the resources utilisation challenges in the pursuit for
optimum and sustainable benefits. On this premise, findings revealed that the following
factors are crucial across the entire phases of study: (a) the implementation of suitable
design/drawings/envelope/specification and; (b) the availability of safety equipment/
installation within the building/facility; (c) the employment of technical/skilled
expertise; (d) the adoption of team working approach; (e) the preventive maintenance
culture; and (f) the sustainability of the building services infrastructure. The least crucial
are: (a) the maintain as-we-go philosophy approach, (b) the use of water recycling
concept, and (c) the weather condition. The conclusion could be drawn that
characteristics with higher severity indices have a significant influence within the
context of the study, whereas those with lower severity indices are either less

Bassey B. Okon Conclusions and Recommendations
278
significant, or insignificant. It could be further stated the developed SEI model and its
application is able to deliver the research objectives.
In phase V of this study, environmental impact and economic life cycle costs of
building infrastructure are examined. Building C is leading in environmental impacts
and Building D takes the lead in cost evaluation. This study will aid in the eradication of
wastage associated with utilities (energy, water), materials, other usage and duplication
that leads to unnecessary cost related within the building services infrastructure
performance. Indeed, this evaluation confirms the economic importance at the various
life cycle stages, the related impacts and their contributions to improving the entire
building infrastructure value. This analysis has been able to appraise the life cycle
impacts and performance of modern building infrastructure practices in delivering the
necessary results. In reality, a fully progressive model agenda in measuring impacts
associated with the buildings life cycle supply chain are contained in this study.
However, it is further established that building services infrastructure sustainability
underscores innovative concepts characterised with technology mix. This cuts across
factors viz efficient lighting systems to include sensor-based dimmable controllers.
Good quality heat ventilation and air conditioning (HVAC), heating installation, safety
gadgets (fire alarms), and water among others, are in this group. Also, the design and
furnishing of sustainable technologies within these buildings will enhance management
performance. The outcome of this study is capable of addressing the overall objectives
regarding building services infrastructure management. It is hoped that this result will
serve as a beacon for future studies in building services infrastructure systems
examination generally and the related fields.
Study phase VI accounts for energy and utilities appraisal. Outcomes revealed that
energy and utilities consumption in the healthcare sector is higher than in the education
sector. The sustainability index results from the NHS and education sectors are
correspondingly 0.74 and 0.62. The healthcare sector has 8% in terms of the
sustainability index over the education sector based on the acquired data. Other results
in this phase of study are presented.
The achievable results from the carbon footprint examinations are capable of
providing more profitable insight towards the reduction of the GHG emissions within

Bassey B. Okon Conclusions and Recommendations
279
these sectors. Indeed, the sustainability index result has presented a carbon footprint
indicator showing the current situations and the future reduction prospects across the
investigated scenarios. This development obviously is very informative not only to the
healthcare and education sectors in benchmarking emission targets, but also to the
operators, consumers and every other facet associated within these sectors, since all
these parties can be aware of the impact created from the energy and utilities with the
emissions control strategies. Based on the inferences from this study, the findings have
been able to address the related objectives.
The study in phase VII involved the interviews as a measure to validate the other
cases. The results have confirmed a strong relationship between the industry and
academic perspective in pursuit of the sustainability performance. This is found in the
excerpts of the interviews between the researcher and the Directors of Sustainability in
the BDP organization, and the LJMU. The methods as applied when examining each
different phase of the entire study, are capable of justifying the results in each case.
Findings from both academia and the construction industry have shown strong
corroboration on the significant influence of sustainability in pursuit sustainable
development success. Also, the two professionals observed that the sustainability
agenda has become imperative in all fields of human endeavour and that its principles
have to be encouraged for economic expansion. The interviewees have suggested
certain measures for the improvement of sustainability practices. These include raising
awareness of the sustainability agenda, and collaborative networking between
government and the construction experts.
Support for sustainability practices in government policies, and good quality cost
management education between the client and the contractors are also suggested. At the
same time, the interviewees also identified the need for technology transfer on
sustainability practice, and co-operation through international and national conferences
since this was believed to engender cross-fertilisation of ideas. There was certainly
strong corroboration from this phase of the study for the outcomes of the other study
phases I–VI.
Having considered all its findings, the study has drawn several conclusions. These
are: (a) the UK Freedom of Information (FOI) Act is an effective source of acquiring
Bassey B. Okon Conclusions and Recommendations
280
quality data as applied in the healthcare and education sectors scenarios; (b) The SEI
model (on pages 81 and 95) and the partial differential equation method (on page 97)
can also be applied for the determination of building services infrastructure performance
other than those stated in this thesis; (c) The sustainability index matrix model
formulated in this study is capable of delivering high quality results in building
infrastructure utilities performance, and the application of this model could be extended
to other systems for critical management appraisal; (d) the sustainability ethics in
pursuit of building services management could be advanced through national and
international conferences since this effort will simulate the exchange of innovative ideas
and best practices towards sustainable development; (e) Mutual co-operation between
the industry and academic fields will promote a hybrid of knowledge and understanding
in addressing the building services infrastructure challenges for sustainability
accomplishment; and (f) The building services infrastructure systems experts should
take the centre stage in the design and implementation of standard systems for quality
services delivery.
8.4 Contributions to knowledge
In this study, efforts so far have culminated in several novel and technological
breakthroughs aimed at facilitating engineering infrastructure systems management
progress. This study has demonstrated a quantitative approach to the examination of
sustainability-driven building services infrastructure systems, rather than a descriptive
approach, and this is novel in this field. Notwithstanding, a qualitative method was also
applied to corroborate the quantitative sustainability technique in this thesis. There are
other several contributions to knowledge made in this study. Such advancement is
established in different phases of this thesis. The study phases I–IV have developed the
sustainable engineering infrastructure (SEI) model (on pages 81 and 85) together with
the sustainability index matrix for the building services infrastructure management
evaluation. These models have been subsequently applied to determine the level of
building infrastructure management performance within the four phases of study. In
effect, this is yet another discovery in measuring the indices of sustainability from the
engineering perspective.

Bassey B. Okon Conclusions and Recommendations
281
Sections 4.16–4.18 contained the sustainability index to explore the cases, developed
through the integration of probability theory and the SEI model into building
management for the sustainability success. Also, the application of the infrastructure
management model in this study has offered a great benefit in normalising the
sustainability values within limits of 0 ≤ Suv ≤ 1. Rationally, this development could aid
in the strategic management decisions on infrastructure systems generally.
The research in phase V conducted through the current best LCA, LCC practices and
in accordance with the ISO 14001 standards, has established very significant
contributions in this field. This is found in the course of measured field data collection
and collation and subsequent analysis. In this study, the data quality was recognised to
be adequate and the application of information was valid and defensible. The study has
also offered a value added potential in the course of appraising the various stages of life
cycle impacts regarding building infrastructure services delivery within the examined
buildings. It is expected that suitable building services infrastructure systems should
account for the materials recyclability and the probable impact at large. This finding has
contributed immensely to the literature regarding building services operations and
management. Apart from this, the study has been able to prove the significance of
analysing the life cycle of building services infrastructure delivery for sustainability
goals.
On the whole, the application of the various software techniques in examining the
buildings infrastructure sustainability is yet another landmark in this setting. Especially,
the use of LCA, LCC with the SEI model is not commonly investigated in the context of
building services infrastructure delivery, by other researchers in this field. The credits in
study phase VI from the sustainability perspective have been able to identify electricity,
natural gas and water as the main drivers of the GHG emissions within the investigated
sectors. Also, it became necessary to categorise these energy and utilities in order of
their carbon footprint magnitude for ease of qualification, quantification, proper control
and management. This effort has assisted in the discovery and mitigation of carbon
emissions from the energy and utilities achieving the higher GHG impact.
The application of the combinations and permutations function in the determination
of the sustainability index in this case is a novel concept in managing building services

Bassey B. Okon Conclusions and Recommendations
282
infrastructure systems. Increasingly, the carbon footprint, probability analysis and the
sustainability index evaluation approaches have offered feasibility awareness and
resources engineering. Again, suitable frameworks for planning building services
infrastructure activities and budgeting in the health and education sectors are achieved.
In phase VII of this study, many benefits are derived from the interviews conducted
with the experts. The interactions between the interviewer and the interviewees have
disclosed some salient information, which has added value to the study. There is the
identification of gaps between the theory and practice regarding the sustainability notion
and mitigation. Insight into the current trend of sustainability perception in both
building services and building construction infrastructure systems generally, is
provided. Other contributions to knowledge in this research are the paradigm shift
associated with the current building services infrastructure management and the
promotion of the sustainability programme within viable engineering projects. In any
case, this study has established a correlation between the academics and field
practitioners in terms of integrating the concepts of sustainability into projects
management.
Among other benefits from this research, and the contributions to knowledge, is a
project life cycle model formulated for building services infrastructure management
success. The contributions derived from this study generally have generated a lot more
payback within this area of interest. However, the studied scenarios will form the
starting point to develop other proactive measures for assessing building services
infrastructure systems management activities generally.
8.5 Limitations of the research
In the course of this research, certain factors have posed some limitations. Therefore,
it became necessary to present such challenges for consideration in subsequent cases.
These challenges are two-fold, beginning with those slightly affecting the study process.
They include generally: (a) the inability to acquire data promptly from the participating
organisations within the UK and Nigeria; (b) most members of staff expressed fear of
divulging the company‟s confidential facts in the process of completion of the survey;
(c) some managers, professionals, technical directors and stakeholders in the

Bassey B. Okon Conclusions and Recommendations
283
investigated organisations expressed lack of time in their work schedule for either
holding interviews or completing the survey; and (d) Lack of co-operation from some
organisations (healthcare and schools) within the UK to participate in the study.
Other limitations are associated with the formulated models as applied in this thesis.
These are: (a) the sustainable engineering infrastructure model and sustainable
infrastructure management model can only be applied to evaluate buildings (facilities)
sustainability index within the range 0 ≤ Suv ≤ 1. This boundary condition could be
applied for other projects of interest; (b) The sustainability index matrix model
formulated is used in measuring the building services infrastructure (utilities)
performance in this study, but, its application could be extended to other infrastructure
systems evaluation. (c) The cost analysis for energy and utilities along with materials as
contained in the study phase V were provided by the buildings projects managers; (d)
Inability to acquire all the needed data in the supply chain for LCC analysis study. In
this case, Davis Langdon and Jacobs Costs Engineering Companies, UK, only provide
the overall costs information based on the available data. Hence, the LCC analysis was
conducted with this valuation information.
Also, (e) the combinations and permutations function as applied in this study phase
VI only consider the selection of three arrays of energy and utilities mix from the list for
analysis; (f) The entire results as presented in this study (phase VI) are based on the
measured field data obtained from the various participating healthcare and schools as
acknowledged; (g) All analysis was conducted within definite boundary conditions for
accuracy and reliability of the results.
In phase VII of this study (interviews), the focus was on two sustainability experts;
one from the academic world, and the other from industry, within the UK.
8.6 Recommendations for practical implementation
This study has made the following recommendations for practical implementation
after addressing the current challenges facing building services infrastructure
management goals. The practical steps suggested are:
(a) There is need to adopt innovative technologies and breakthroughs such as water
recycling, energy conservation and just-in-time (JIT) management strategies.

Bassey B. Okon Conclusions and Recommendations
284
(b) The application of economic instruments in appraising building infrastructure
projects could guarantee high quality cost engineering management. Economic models
to include the LCC and sustainability index matrix among others are capable of making
proper forecasts.
(c) Building services experts should incorporate the use of cleaner technologies for
eco building systems management design. This explains the sustainable building
approach through the application of economically competitive and productive
technology with the use of less materials and energy utilities. This will generate less
waste, environmental damage than the alternatives as best practices.
(d) Awareness creation regarding the use of building service infrastructure utilities is
of necessity based on the current economic trends. Therefore, government and corporate
organisations should be actively involved in the promotion of the sustainability agenda
in respect of sustainable buildings.
(f) It becomes expedient to adopt economic efficiency strategies in the design and
implementation of building services infrastructure systems. This is with a view to
minimising the use of resources without compromising the standard of services
delivery. This study suggests that the practical implementation of this set of
recommendations will support eco-efficiency within building infrastructure utilities for
sustainability attainment.
8.7 Recommendations for future research
According to the results obtained in the seven phases of this study, certain
recommendations are made for further research. These are offered since it will be more
rewarding for future researchers to explore the current achievable results and then
develop these through adding value to building services infrastructure system
attainment. Hence:
(a) The formulated sustainability index matrix model and sustainability index
management model could be applied in testing other projects‟ performance for a
comparison of results.
(b) The combinations and permutations function method as used in the study analysis
could be extended to assess more energy and utilities beyond the present situation.
Bassey B. Okon Conclusions and Recommendations
285
(c) Data should be sought from other organisations to test for their sustainable index
regarding the building services infrastructure performance as this approach could guide
in strategic management decisions.
(d) More awareness creation through research and development (R&D) could assist
in promoting the ideals of sustainability. As such, academic curriculum development
should occur to incorporate the ethics and practices of sustainability in pursuit of sound
building services infrastructure system.
(e) Building services and facilities management experts, engineers and other players
in sustainability need adequate training and re-training to contend with the current
challenges in this context.
(f) The SEI model as proposed and applied in this study should be extended to verify
the sustainability indices of other systems [equation (17) on Pages 81 and 95].
(g) Due to the inability to acquire all the needed data in the supply chain for LCC
analysis study, efforts should be made to acquire sufficient data within the supply chain
for LCC analysis regarding building infrastructure systems management. Beyond this,
no meaningful advancement could be made in managing building services infrastructure
systems without the integration of innovative technologies through flexible design of
systems. This is with a view to improving the services delivery associated with energy,
water and waste management for eco-efficient building generally.
8.8 Recommendations for policy-makers
Policy-makers should address the following:
(a) Policy formulation through legislation and enforcement should be exercised
regarding the sustainability agenda with a view to achieving best practices in the search
for sustainable building services infrastructure management.
(b) Further legislative policy frameworks on the waste management activities and
implementation should be developed so that waste management policies can be
enforced through the use of the reduce, reuse and recycle (3R) model of waste
management in building services infrastructure system. It is noted that effort in this
direction will culminate in the establishment of 3R-related policies with
Bassey B. Okon Conclusions and Recommendations
286
environmentally sound recycling mechanisms for the promotion of sustainability
success.
(c) Political barriers to the LCC application should be removed by policy-making in
support of the implementable frameworks in the building industry. Therefore, legislative
policy framework and enforcement mechanism are recommended for implementation.
This will promote a situation whereby compelling obligations between the clients and
contractors are met in the interests of attaining sustainable building services delivery.
(d) An enabling environment for the pursuit of sustainable buildings should be
created through legislative policy formulation for the PPP model. This will assist in the
technological exchange and funding of building services infrastructure projects
activities.
The implementation of the highlighted strategies concerning the building services
infrastructure system will encourage the best practices and add value to the effort of
addressing the standard of management performance.

Bassey B. Okon References
287
References
Aaronson, S. A. (2009), Business and Development, Discussion Papers on Corporate
Strategy and Inadequate Governance: The Pitfalls of CSR, Paper II.
ABS, (2012), Australia Bureau of Statistics. Green Growth: Measuring the
Environmental Impact of Buildings.
ACLCA, (2008). Life Cycle Assessment Definitions. Available Internet:
http://www.lcacenter.org/LCA/LCAdefinitions.html. Accessed on 12/07/13.
Almuneef, M. Memish, Z. A. (2003), Effective Medical Waste Management: It can be
done. American Journal of Infection Control, 31, 3, pp 188 – 92.
Annecke, E. and Swilling, M. (2005), “Building Sustainable Communities in South
Africa”.
Armbruster, D. A. (1990), Hazardous Waste Disposal and the Clinical Laboratory.
Armstrong, J. H. (1987), Maintaining Building Services- A Guide to Good Practice, 3rd
Edition, BSI, United Kingdom.
ARUP, (n.d) Life Cycle Assessment and Life Cycle Cost Tool for Commercial Building
Developments in Hong Kong. China. Available Internet: Accessed on 20/08/13.
Ashworth, A. (1999), Cost Studies of Buildings, Third Edition, Longman, ISBN 0 582
36909 – 6.
ASHRAE, (1999), Thermal Environmental Conditions for Human Occupancy.
American Society of Heating Refrigerating, and Air-conditioning Engineers,
Incorporated.
ASHRAE, (2004), Thermal Environmental Conditions for Human Occupancy. Atlanta:
American Society of Heating Refrigerating, and Air-conditioning Engineers,
Incorporated, ANSI/ASHRAE standard 55.
ASTM, (2002), American Society for Testing Materials. Standard Practice for
Measuring Life-Cycle Costs of Buildings and Building Systems E 917- 02,
ASTM, Philadelphia.
Atkin, B., and Wing, R. (2007), Research Methodology, Unit 1: Research Models
Strategies and Methods. PhD-course literature in research methodology, Lund,
Sweden.

Bassey B. Okon References
288
Baillie J. (2008). Watch your Waste or Pay the Price. Health Estate. 62, 4 pp.47–51.
Bakis, N., Kagioglou, M., Amaratunga, D., Kishk, M and Hajj, A. A. (2003), An
Integrated Environment for Life Cycle Costing in Construction. Construction
Informatics Digital Library.
Bardos, P., Lazar, A., and Willenbrock, N. (2009), Sustainable Remediation Forum
United Kingdom. A Review of Published Sustainability Indicator Sets.
Barret, P. (1995), Facilities Management: Towards Best Practice, Oxford, Blackwell
Science.
Bayer, G., Gamble, M., Gentry, R and Joshi, S. (2010), AIA Guide to Life Cycle
Assessment of Buildings, United States of America.
BDP Company, Available Internet: http://www.bdp.com. Accessed on 21/01/12.
Bellandi, R. (2004), Strategic Environmental Management for Engineers, O‟ Brien &
Gere, John Wiley & Sons, Inc., Hoboken, New Jersey, Canada.
Blengini, G. A. (2009), Life Cycle of Buildings, Demolition and Recycling Potential: A
Case Study in Turin, Italy. Building and Environment, 44, pp. 319 – 330.
Bohne, R. A., (2006), “Sustainable Infrastructure”. Presentation at the First Policy
Consultation Forum of the Seoul Initiative on Green Growth, Seoul, Republic of
Korea.
Boyle, C. A., (2005) Sustainable buildings, Proceedings of the Institution of Civil
Engineers Engineering Sustainability 158 Issue ES1, pp. 41– 48.
Broers, L. (2005), Engineering for Sustainable Development: Guiding Principles. The
Royal Academy of Engineering, London, United Kingdom.
Borg, M and Erlandssona, M. (2003), Generic LCA-methodology applicable for
buildings, constructions and operation services – today practice and development
needs. Building and Environment, 38 pp. 919 – 938.
BREEAM, (2008), Buildings Building Research Establishment Environmental
Assessment Method, United Kingdom.
BSI, (2006), British Standard Institution, “BS EN ISO 14040:2006: Environmental
management – Life cycle assessment – Principles and framework”.

Bassey B. Okon References
289
BSI, (2008), British Standard Institution,”Publicly Available Specification PAS
2050:2008: Specification for the assessment of the life cycle greenhouse gas
emissions of goods and services”.
Cabal, H., Lechón, Y. and Sáez, R. (2005), European Sustainable Electricity,
EUSUSTEL; Comprehensive Analysis of Future European Demand and
Generation of European Electricity and its Security of Supply.
CCT, (2008), Crown and Carbon Trust, Guide to PAS 2050, United Kingdom.
Cengel, Y. A., Turner, R. B and Cimbala D. (2008), Fundamentals of Thermal- Fluid
Sciences. Third Edition with SI Units, McGraw Hill Higher Education, United
States of America.
Chanter, B and Swallow, P. (2000), Building Maintenanace Management, Blackwell
Science Limited.
Cheryl-Gomez, P. E. (2008), Energy & Utilities. University of Virginia, Facilities
Management, (2007–2008) Annual Reports, United States of America.
Cheshire, D. (2007), Sustainability and the Property Life cycle.
Cheshire, D., and Maunsell, F. (2007), Chartered Institution of Building Services
Engineers, CIBSE, Guide L: Sustainability meets ASHRAE Green Guide.
CIB, (2004), Performance Criteria of Buildings for Health and Comfort. Construction
Industres Board, CIB, Task Group 42, No. 292, Findland.
CIOB, (2003), “Sustainability and Construction”, Chartered Institute of Building,
Berkshire, United Kingdom.
CIOB, (2010), “Sustainability and Construction”, Chartered Institute of Building,
Berkshire. United Kingdom.
CIOB, (2011), Building in Construction, Chartered Institute of Building. Carbon Action
2050 White papers from the Chartered Institute of Building, United Kingdom.
CIRIA, (2005), Construction Industry Research and Information Association. Easy
Access, Environment Management Case Study 2. Available Internet:
www.ciria.org , Accessed on 20/04/12.
Connolly, D, (2007), British Archaeological Job Resource (BAJR): Field Walking and
Detecting Survey, Short Guide to Field Survey, United Kingdom.

Bassey B. Okon References
290
Cooke, B., and Williams, P. (2004), Construction Planning, Programming & Control,
Second Edition, Blackwell Publishing Limited, United Kingdom.
Cooper I. and Curwell S. (BEQUEST), (1997). Building Environmental Quality
Evaluation for Sustainability through Time. Proceedings of the 2nd International
Conference on Buildings and the Environment, CIB, 2, Paris, pp.515–523.
Coyle, L. and Turner, C. (2008), Waste and Resources Action Programme (WRAP).
Materials change for better environment, United Kingdom.
Cleveland, A. B. (2013), Sustainaing Infrastructure: A Brentley White Paper, Brently‟s
Applied Research Group.
Clift, M., and Bourke, K. (1999), Study on whole life costing, BRE Report 367, CRC.
Clift, M. (2003), Sustainable Building and Construction: Life-Cycle Costing in the
Construction Sector, Centre for Whole Life Performance, Building Research
Establishment, Garston, Watford, United Kingdom.
Cronbach, L. J., and Shavelson, R. J. (2004), My Current Thoughts on Coefficient
Alpha and Successor Procedures. Educational and Psychological Measurement,
64, 3, pp. 391 – 418.
Cuellar, R., and Adisa, A. (2011), Life Cycle Assessment Applied to the Residential
Construction Sector: A case study of a detached house in the United Kingdom.
Darby, H., Elmualim, A. A., and Kelly, F. (2011), Case study on the whole carbon cycle
in buildings. World Renewable Energy Congress, Sweden, pp. 1781–1788.
DEFRA, (2006), Department for Environment, Food and Rural Affairs, Guidance on
applying the Waste Hierarchy, United Kingdom.
DEFRA, (2010), Department for Environment, Food and Rural Affairs, Guidance on
applying the Waste Hierarchy, United Kingdom.
DEFRA, (2011a), Department for Environment, Food and Rural Affairs, Guidance on
applying the Waste Hierarchy, United Kingdom.
DEFRA, (2011b), Department for Environment, Food and Rural Affairs, Calculations
and Emission Factors, United Kingdom.
DEIS, (2010), Draft Environmental Impact Statement, SR 520 Pontoon Construction
Project Economics Technical Memorandum, United States of America.

Bassey B. Okon References
291
Demsey, C. R. and Oppelt, E. T. (1993). Incineration of hazardous waste: A critical
review update. Air and Waste, 43, pp. 25 –73.
Devellis, R. F. (1991), Scale Development. Newbury Park, NJ: SAGE Publications,
London, United Kingdom.
DIN EN, (2004), Dependability Management, Part 3 – 3: Application Guide – Life
Cycle Costing (IEC 60300-3-3).
Ding, G. K. C. (2008), “Sustainable Construction- The Role of Environmental
Assessment Tools”. Journal of Environmental Management, 19, 2, pp. 32 – 37.
Doka, G. (2007), “Life Cycle Inventories of Waste Treatment Service” Ecoinvent
Report, No.13, Swiss Center for Life Cycle Inventories, Dubendorf, Switzerland.
Drexhage, J., and Murphy, D. (2010), International Institute for Sustainable
Development (IISD). Sustainable Development: From Brundtland to Rio 2012.
D‟ Souza, N., and Shonfield, P. (2011), Life Cycle Assessment of Electricity Production
from a vestas V112 Turbine Wind Plant Infrastructure, Final Report, Randers,
Denmark.
Dusart, A., El-Deeb, H., Jaouhari, N., Ka, D., and Ruf, L. (2011), International Stainless
Steel Forum. Final Report, ISSF Workshop, Paris.
Dutil, Y., Rousse, D., and Quesada, G. (2011), Sustainable Buildings: An Ever
Evolving Target, 3, pp. 443 – 464.
Eaton K. J. and Amato A. A. (1998) Comparative life cycle assessment of steel and
concrete framed office buildings. Journal of Construction in Steel Research, 46,
1–3, pp. 286 –287.
Eco Homes, (2003), Sustainable Homes. A Guide to Eco Homes, an Environmental
Assessment Method for Homes. Innovation and Good Practice Programme,
United Kingdom.
ELC, (2006), Environmental Literacy Council, “Life Cycle Analysis.” Available
Internet http: //www.enviroliteracy.org/article.php/322.htm. Accessed on
25/04/2012.
Elhag, T. M. S., Boussabine, A. H. and Ballal, T. M. A. (2005), Critical determinant of
construction tendering costs: Quantity surveyors‟ standpoint International
Journal of Project Management 23, pp.538 – 545.

Bassey B. Okon References
292
Elkington, J. (1997), Cannibals with Folks: The Triple Bottom Line of 21st Century
Business. Capstone, Oxford.
Ellis, B. A. (2007), Life Cycle Cost, International Conference of Maintenance Societies.
Elmualim, A., Shockley, D., Valle, R. Ludlow, G., Shah, (2010), Barriers and
commitment of facilities management profession to the sustainability agenda.
Building and Environment, 45, 1, pp. 58 – 64.
Elmualim, A. A., Roberto, V., and Kwawu, W. (2012), Discerning policy and drivers
for sustainable facilities management practice. International Journal of
Sustainable Built Environment. 1, pp. 16 – 25.
Epstein, M. J. (1996), Measuring Corporate Environmental Performance. Chicago:
Irwin Professional Publishing.
ESCAP, (2006a), Economic and Social Commission for Asia and the Pacific:
Sustainable Infrastructure in Asia. Overview and Proceedings Seoul Initiative
Policy Forum on Sustainable Infrastructure, Republic of Korea.
ESCAP, (2006b), Economic and Social Commission for Asia and the Pacific,
Enhancing Regional Cooperation in Infrastructure Development Including that
Related to Disaster Management. Poverty and Development Division. New
York: United Nations.
ESCAP, (2011), Economic and Social Commission for Asia and the Pacific: A
Guidebook on Public-Private Partnership in Infrastructure, Bangkok.
Fay, M. and T. Yepes, (2003), „Investing in Infrastructure: What is Needed from 2000
to 2010?‟, World Bank Policy Research Working Paper 3102.
Fernandez, M. (2010) Impact of the Energy efficient Buildings PPP.
Feuillade F, Francois V, Matejka G, Skhiri N, L agier T. (2008). “Estimate of the
pollution removed by leaching of standard domestic waste”. Journal of Air
Waste Management Association, pp.1529 –38.
Field, A. (2006), Discovering Statistics Using SPSS, Second Edition.SAGE Publication,
London, United Kingdom.
Flapper, S. D. P., Van Nunen, J. A. E. E., and Wassenhove, L. N. V. (2005), Managing
Closed-loop Supply Chain. Springer Berlin, Heidelberg, New York. United
States of America.

Bassey B. Okon References
293
Flanagan, R., Norman, G., and Robinson, G., (1989), Life Cycle Costing – Theory and
Practice, BSP Professional Books.
Friesecke, F. (2006), The Increased Significance of Public Private Partnerships (PPP)
for Urban Development in Germany, pp. 1 – 18.
GBPC, (2010), Introductory Guide to Best Practice in Construction, United Kingdom.
Girouard, N. (2011), Green Growth Strategy. Global Green Growth Summit Seoul,
2020, Paris.
Gorree, M., Guinée, J. B., Huppes, G and Oers, L. (2002), Environmental Life Cycle
Assessment of Linoleum in Buildings. International Journal of LCA 7, pp. 158–
166.
Grigg, N. S. (1988), “Infrastructure Engineering and Management.” John Wiley & Sons
Incorporated, Canada.
Grigg, N. S. (1999), Infrastructure: Integrated Issue or Tower of Babel? Journal of
Infrastructure Systems, pp.115 – 117.
Gulch, P. and Baumann, H. (2004), “The Life Cycle Costing Approach: A conceptual
discussion of its usefulness for environmental decision-making” Building and
Environment, 39, 5, pp. 571 – 580.
GSGF, (2010), Green Skill for A Green Future, Strategies for Environmental
Technologies in Building Services Engineering Sector, 13.
Guinée, J. B., Bruijn, H., Duin, R., Huijbregts, M. A. J., Lindeijer, E., Roorda, A. A. H.,
and Ven, L. (2001). Life Cycle Assessment. An operational guide to the ISO
standards. Centre of Environmental Science, Leiden University (CML)
Netherlands. Final report.
Guinée, J. B., (2001): Handbook on life cycle assessment– Operational Guide to the
ISO Standards. International Journal of LCA 6, p.255.
Hacking, T and Guthrie, P. (2008) A framework for clarifying the meaning Triple
Bottom-Line, Integrated, and Sustainability Assessment. Environmental Impact
Assessment Review, 28, pp. 73 – 89.
Halfawy, M. R. (2008), Integration of Municipal Infrastructure Asset Management
Processes: Challenges and Solutions. Journal of Civil Engineering, 22, 3, pp. 216
– 229.
Bassey B. Okon References
294
Hall, A. G. (2008), Greening Healthcare: 21st Century and Beyond. Front Health
Service Manage. 25, 1, pp. 37– 43.
Hansen, N. R. (2005), Probability theory and Statistics, University of Copenhagen,
Denmark.
Heidi, K. Stranddorf, H. K., Hoffmann, L and Schmidt, A. (2005), Impact categories,
normalisation and weighting in LCA Environmental news, No. 78.
Hill, R. C and Bowen, P. A. (1997). “Sustainable Construction: Principles and
Framework for Attainment.” Journal of Construction management and
Economics, 15 pp. 223 – 239.
Hill, R. C., Bergman, J. C and Bowen, P. A. (1994), A framework for the attainment of
sustainable construction. In Proceedings of First International Conference of CIB
TG 16 on Sustainable Construction, Tampa, Florida, pp.13 – 25.
Holmes, J. (1995). The UK Waste Management Industry. Institute of Waste
Management, Northampton, United Kingdom
Home, R., Grant, T., and Varghese, K. (2009), Life Cycle Assessment, Principles,
Practice and Prospect. CSIRO Publishing, Australia.
Horner, R. M. W., Haram, M. A., and Munns, A. K. (1997), “Building Maintenance
Strategy: a New Management approach” Journal of Quality in Maintenance
Engineering, 3, 4, pp. 273.
InfraGuide, (2003), Investment Parameters for Municipal Infrastructure. National Guide
to Sustainable Municipal Infrastructure, Ottawa, ON, Canada.
IPMVP, (2002), International Performance Measurement and Verification Protocol,
United States Department of Energy Office of Scientific and Technical
Information.
ISO, (1997), International Organisation for Standardisation 14001 Environmental
Management - Life cycle assessment - Principles and Framework.
ISO, (2000), International Organisation for Standardisation, 14040: Environmental
management – Life cycle assessment: International Organisation for
Standardisation, Geneva.

Bassey B. Okon References
295
ISO, (2002), International Organisation for Standardisation, 14001: The basics: and
environmental management systems for busy Managers, Available Internet:
www.iso.ch/iso/en/iso 9000-14000.html Accessed on 21/06/12.
Janssen, G. M. T., and Hendriks, C. H. (2002), “Sustainable Use of Recycled Materials
in Building Construction” in Advances in Building Technology, pp. 1399 –
1406.
Junnila, S. and Horvath, A. (2003), Life-Cycle Environmental Effects of an Office
Building. Journal of Infrastructure Systems, 9, 4, pp. 157 – 166.
Kehily, D., Hore, A. (2012), Life Cycle Cost Analysis Under Ireland's Capital Works
Management Framework. Proceedings of the Joint CIB, International
Conference on Facilities Management, Procurement Systems and Public Private
Partnership. Delivering Value to the Community Department of Construction
Economics and Management. Cape Town, South Africa.
Keller, F., (2009) Triple Bottom Line Report on Cascade Engineering Fiscal Year.
Cascade‟s LEED-EB Platinum certified building, The Learning Community in
Grand Rapids, Michigan, United States of America.
Killip, G. (2005), Emission Factors and the Future of Fuel. Background Material M,
40% House Project, United Kingdom.
Kim, B. J and Qi, S. (1995). Hazardrous Waste Management, McGraw-Hill, New York,
United States of America.
Kintner-Meyer, M. (1999), Utility/Energy Management and Controls System (EMCS)
Communication Protocol Requirements. ASHRAE Research Project.
Klotz, L., Horman, M. and Bodenschatz, M. (2007), A Lean Modeling Protocol for
Evaluating Green Project Delivery. Lean Construction Journal, 3, 1.
Knoepfel, I. (2001), “Dow Jones Sustainability Group Index: A Global Benchmark for
Corporate Sustainability”, Corporate Environment Strategy, 8, 1, pp. 6 – 15.
Korkmaz, S., and Mrozowski, T. (2008), Proposal for the Development of a Decision
Making Framework for Minimising the Life Cycle Impacts of Buildings at
Michigan State University White Paper.

Bassey B. Okon References
296
Koskela, L. (2009), Lean Construction for Sustainable Business Joint CIEF and CPN
seminar held at the Centre for Construction Innovation, CUBE, pp.113 – 115,
United Kingdom.
KPMG, (2008), International Survey of Corporate Responsibility Reporting,
Amstelveen.
Kumar, R. (1999), Research Methodology: A step-by-step guide for beginners. London,
United Kingdom: SAGE Publication Limited.
Kvale, S. (1996), An Introduction to Quantitative Research-Interviewing. London,
United Kingdom, Sage Publication Limited.
Laing O‟Rourke, (2012), Construct and Manufacture Available Internet:/www.liang
gorourke.com/about/index.htm Accessed on 21/01/12.
Landman, M. (1999), “Breaking through the Barriers to Sustainable Building: Insights
from professional on government initiatives to promote environmentally sound
practices.”
Langdon, D. (2007), Final Guidance: Life Cycle Costing (LCC) as a Contribution to
Sustainable Construction, Davis Langdon Management Consulting, United
Kingdom.
Langdon, D. (2010), Final Report: Development of a Promotional Campaign for Life
Cycle Costing in Construction, United Kingdom.
Last, J. M. (2003), A Dictionary of Epidemiology, Oxford University Press, New York.
Launch, T. (2005), Connecting East Asia: A New Framework for Infrastructure Asian
Development Bank and Japan Bank for International Cooperation World Bank.
Lazarus, N. (2005), Potential for Reducing the Environmental Impact of Construction
Materials. Bio Regional Development Group, United Kingdom.
LCI, (2007), Life Cycle Initiative. Life Cycle Management: A Business Guide to
Sustainability, United Nations Environment Programme.
Lelyveld, T., and Woods, P. (2010), Carbon Compliance: Setting an appropriate limit
for zero carbon new homes United Kingdom.
Lee, W. L and Burnett, J. (2008), Benchmarking energy use assessment of HK-BEAM,
BREEAM and LEE, Building and Environment 43 pp.1882–1891.

Bassey B. Okon References
297
Lewis, M. K., and Grimsey, D. (2002), Evaluating the Risk of Public Private
Partnerships for Infrastructure Projects. International Journal of Project
Management, 20, pp.107 – 118.
Lippiatt, B. C. (1999), Selecting cost-effective green building products: BEES
approach. Journal of Construction Engineering and Management, pp. 448 – 455.
Liverpool One, Liverpool. Available internet: http://www.qype.co.uk/place/356822-
Liverpool-One-Liverpool. Accessed on 22/01/12.
Loosemore, M., Phua, F., (2011), Responsibility Corporate Strategy in Construction and
Engineering: Doing the Right Thing? Spon Press, Abingdon, United Kingdom.
Lorenz, D. (2008), Sustainable Property Investment and Management. Key Issues and
Major Challenges.
Lundan, S. M. (Ed.) (2004), Multinationals Environment and Global Competition.
Elsevier, London.
Manchester Arndale, the centre of the city. Available internet: http://www.manchester
arndale.com. Accessed on 21/01/12.
MTP, (2009), BNXS01, Market Transformation Programme: Carbon Dioxide Emission
Factors for United Kingdom, Energy Use.
Maxwell, J. A. (1996), Qualitative Research Design: An Interactive Approach, Applied
Social Research Methods Series, 41, SAGE Publications, Thousand Oaks, CA.
McCracken, G. (1988), The Long Interview, Thousand Oaks, CA.
Merriam, S. B. (1988), Case Study Research in Education: A Qualitative Approach. San
Francisco, CA: Jossey-Bass Publishers.
Miles, J., and Shevlin, M. (2001), Applying Regression and Correlation: A guide for
students and researchers, London. Sage.
Minx, J. Scott, K. Peters, G., and Barrett, J. (2008), An Analysis of Sweden‟s Carbon
Footprint.
Miyatake, Y. (1994), Sustainable Construction. Keynote address to First International
Conference of CIB TG 16 on Sustainable Construction, Tampa.
Moir, L. (2001), What do we Mean by Corporate Social Responsibility? Corporate
Governance, 1, 2, pp. 16 – 22.
Bassey B. Okon References
298
Montgomery, D. C., Runger, G. C and Hubele, N. F. (1998). Engineering Statistics,
John Wiley and Sons Incorporated, United States of America.
Muto, A. H. S., Petrosjan, L. A., and Raghavan, T. E. (2006), Advances in Dynamic
Games Applications to Economics, Management Science, Engineering, and
Environmental Management. Boston, MA: Birkhäuser Boston.
MWH, (2012), Building a Better World. Available internet: http://www.mwhglobal.com
Accessed on 22/01/12.
NIBS, (2006), National Institute of Building Sciences. The Whole Building Design
Guide. Available Internet: http://www.wbdg.org/index.php. Accessed on
25/04/12.
Nebel, B. (2006), White Paper – Life Cycle Assessment and the building and
construction industry. Prepared for Beacon Pathway Limited.
Norris, G. (2001), Integrating Life Cycle Cost Analysis and Life Cycle Assessment.
International Journal of LCA, 6, 2, pp.118 – 121.
NSA, (1991), Pay Now or Pay Later: Controlling Cost of Ownership from Design
Throughout the Service Life of Public Buildings, The National Academy of
Sciences, National Academy Press, Washington, D.C. Available Internet:
http://www.nap.edu/openbook/0309044812/html/R1.html.Accessed on 24/04/12.
NSF, (2005) Project Workshop, Rutgers University, “Life-Cycle Assessment of
Building Infrastructure”. Towards Self-Sustainaing High rise Buildings. United
States of America.
OECD, (2003), Organisation for Economic Co-operation and Development:
Environmentally Sustainable Buildings – Challenges and Policies, Publications,
Paris.
OECD, (2009a), Organisation for Economic Co-operation and Development. The
Economics of Climate Change Mitigation: Policies and Options for Global
Action beyond 2012, OECD, Paris.
OECD, (2009b), Organisation for Economic Co-operation and Development: Green
Growth Strategy – Beyond the Crisis: Discussion Paper for the Consultation
with the OECD Liaison Committee, Paris.

Bassey B. Okon References
299
OECD, (2010), Organisation for Economic Co-operation and Development: Green
Growth Strategy Interim Report: Implementing our Commitment for a
Sustainable Future, Paris.
Okon, B. B., Ekpo, S., and Elhag, T. S. (2010), A Sustainable Engineering
Infrastructure (SEI) Model for the 21st Century. Journal of Lecture Notes in
Engineering and Computer Science, 1, 2184, pp. 1101 – 1105.
Okon, B. B., and Elhag, T. S. (2011), Sustainability Index: An Application into
Sustainable Engineering Infrastructure Management and Assessment. Journal of
Mechanics Engineering and Automation 1, 1, pp.18 – 31.
Okon, B. B., and Elhag, T. M. S. (2011) Infrastructure Assessment: A Case Study of
Aluminium Smelting Plant, Nigeria. Journal: Lecture Notes in Engineering and
Computer Science, 2192, pp. 2052 – 2056.
Okon, B. B. and Elhag, T. M. S., (2011), Sustainable Engineering and Innovative
Technology in Managing Infrastructure Systems, 10th International Research
Conference on Quality, Innovation & knowledge Management, Malaysia.
Okon, B. B. and Elhag, T. M. S., (2011), The Role of Education for Sustainable
Engineering and Technology in Construction Infrastructure. Proceedings of the
Engineering Sustainability (ES) Conference, University of Pittsburgh, United
States of America.
Okon, B. B. and Elhag, T. M. S., (2012), The Sustainable Infrastructure Management
Model (SIMM): International Conference on Systems Engineering and
Engineering Management. World Congress on Engineering and Computer
Science (WCECS), San Francisco, United States of America.
O‟Leary, Z. (2004), The Essential Guide to doing Research. SAGE Publications,
London. United Kingdom.
Ortiz, O., Castells, F., and Sonnemann, G. (2009). Sustainability in the construction
industry: A review of recent developments based on LCA. Construction and
Building Materials, 23, pp.28 – 39.
Park, C. S., and Tippett, D. D. (1999), “Engineering Economics and Project
Management” Mechanical Engineering Handbook, Ed. Frank Kreith Boca
Raton: CRC Press LLC.
Bassey B. Okon References
300
Parnell, G. S., Driscoll, P. J., and Handerson, D. L. (2008), Decision Making in Systems
Engineering and Management, Hoboken.
Patrick, H., Barbara L., Bare, C. Jane, C., and Rushing, A. S. (2002). BEES User
Preferences for Life-Cycle Decision Support Tools: Evaluation of a Survey of
BEES Users, NISTIR 6874 (Gaithersburg, MD): National Institute of Standards
and Technology.
Paulsen, J. (2001), Life Cycle Assessment for Buildings Products: The significance of
the usage phase, Doctoral thesis, Sweden.
Pedersen, E. R. (2006), Making Corporate Social Responsibility (CSR) Operable: How
Companies Translate Stakeholder Dialogue into Practice. Business and Society
Review 111, 2, pp. 137–163.
Petrovic- Lazarevic, S. (2006), ISO 14001 Improving the Construction Industry‟s
Competitiveness, Working Paper 44.
Petts, J. and Eduljee, G. (1994). Environmental Impact Assessment for Waste Treatment
and Disposal Facilities. Wiley Chichester, United Kingdom.
Peuportier, B and Herfray, G. (2011), Low resource consumption within buildings and
constructions by use of LCA in design and decision making. Deliverable D3.1
Building LCA good practice report, Armines.
Pitt, M. (2005), Trend in Shopping Centre Waste Management. Facilities 23, 11/12. pp.
522 – 533.
PMPCB, (2010), Performance Measurement Protocol for Commercial Buildings,
Spatial Systems Associates, United States of America.
Pope, J. Annandale, D., and Morrison-Saunders, A. (2004). Conceptualising
Sustainability Assessment. Environmental Impact Assessment Review, 24, pp.
595 – 616.
Price, A. and Newsome, E. (2003), Strategic Management: Considerations of
Paradoxes, Process and Associated concepts as Applied to Construction. Journal
of Management in Engineering, 19, 4, pp.183 – 192.
Prudhomme, R. (2004), Infrastructure and Development, Paper prepared for the (Annual
Bank Conference on Development Economics, ABCDE). The World Bank and
Oxford University Press, pp.153 –181.
Bassey B. Okon References
301
RCN, (2007). Royal College of Nursing “Safe Management of Healthcare Waste” RCN
Guidance. pp. 1–17.
REGENER, (1997), Application of the Life Cycle Analysis to buildings European
methodology for the evaluation of environmental impact of buildings. Detailed
description and review, United Kingdom.
Revelle, W., and Zinbarg, R. E. (2008), Coefficients Alpha, Beta, Omega and the GLB:
Comments on Sijtsma 11. The Psychometrika.
Richard, W. (1996), Corporate Environmental Management Systems and strategies
second edition, Earthscan.
RICS, (2000), Royal Institution of Chartered Surveyors, Building Maintenance:
strategy, planning & procurement, RICS, Business Services Limited, United
Kingdom.
RICS, (2008), Royal Institution of Chartered Surveyors, Building Maintenance:
strategy, planning & procurement, RICS, Business Services Limited, United
Kingdom.
Rio Summit, (1992), Rio Declaration on Environment and Development. Institute for
Global Communications, http://habitat.igc.org/agenda21/rio-dec.htm.
Romm, J. J. (1994), Sustainable Building Technical Manual Lean and Clean
Management.
Royal BAM Group, (2012). Available Internet: www.bamgroup.com. Accessed on
10/01/12.
Sabol, L. (2008), Measuring Sustainability for Existing Buildings. The power of process
in the built environment. IFMA, World Workplace.
Sattertherwaite, D. (2001). “In The Earthscan Reader in sustainable Cities”.
Scott, K., Minx, J., and Barrett, J. (2008), NHS England Carbon Emissions Carbon Foot
printing Report, Sustainable Development Unit.
Serb, C. (2008), Think Green. Hospital Health Network; 82, 8, pp. 22 – 6, United
Kingdom.
Shah, S., (2007), Practice for Facilities Manager. Blackwell Publishing, Oxford, United
Kingdom.

Bassey B. Okon References
302
Shen, Y., and Spainhour, L. (2001), “IT: A Potential Solution for Managing the
Infrastructure Life Cycle,” Journal of Computing in Civil Engineering, 15, 1,
pp.1– 2.
Sioshani, F. (2011), Energy, Sustainability and the Environment: Technology,
Incentives, Behaviour. Butterworth Heinemann, Oxford.
Slater, D. (1995), Integrated Pollution Control and Waste Minimisation. The Royal
Society of Chemistry, Cambridge, United Kingdom.
Smith, J. K. (1998), The Nature of Mathematics, Eight Edition, Brooks/Cole Publishing
Company, England, United Kingdom.
Smith, N. J. (2008), Engineering Project Management, Third Edition, Blackwell
Publishing Limited, Oxford, United Kingdom.
Smith, K. (2009), “Climate Change and Radical Energy Innovation: The Policy Issues”,
TIK Working Papers on Innovation Studies, No. 20090101, Centre for
Technology, Innovation and Culture, University of Oslo, Unites States of
America.
Sterner, E. (2000), Life-Cycle Costing and its Use in the Swedish Building Sector,
Building Research & Information, 28, 5/6, pp. 387 – 393.
Stroud, K. A. (2001), Engineering Mathematics, Fifth Edition. Industrial Press
Incorporated, New York. United States of America.
Sunesh, R. H., and Egbu, C. O. (2004). “Knowledge Management: Issues, Challenges
and benefits for a sustainable urban environment.”
Szalay, Z., Budavari, Z., Brown, N., Malmqvist, T., Peuportier, B., Zabalza, I.,
Krigsvoll, G., Wetzel, C., Cai, X., Staller, H and Tritthart, W. (2011), Low
resource consumption buildings and constructions by use of LCA in design and
decision making. Indicators and weighting systems, including normalisation of
environmental profiles.
Tetrevova, (2006), Theoretical and practical aspects of PPP projects. Vadyba/
Management, pp. 105 – 110.
TG, (2003), Task Group, Life Cycle in Construction, Final Report, United Kingdom.

Bassey B. Okon References
303
Thompson, L. L. (2001), PATH Final Report on Life Cycle Assessment Tools to
Measure Environmental Impacts: Assessing Their Applicability to the Home
Building Industry. Available Internet: www.pathnet.org, Accessed on 10/02/12.
Tudor, T. L., Noonan, C .L, Jenkin, L. E. T. (2005). “Healthcare Waste Management a
case study from the national health service in Cornwall NHS, United Kingdom”.
Waste Management, 25, pp. 606 – 615.
Turner, R. K. (2006), Sustainability Auditing and Assessment Challenges. Building
Research and Information, 34, 3, pp.197 – 200.
UKGBC, (2009), United Kingdom Green Building Council: Code for Sustainable
Buildings, Campaign for a Sustainable Environment.
UKGSD, (2005), United Kingdom Sustainable Construction Government and
Sustainable Development HM Government, Securing the Future – The UK
Government Sustainable Development Strategy.
UKSC, (2006), United Kingdom Sustainable Construction Review. Available Internet:
http:// www.berr.gov.uk/files/file34979.pdf, Accessed on 27/02/12.
UM, (2002), University of Michigan, Sustainability Assessment Report. United States
of America.
UN, (2003), United Nations, „„World Urbanisation Project: the 2002 revision‟‟, New
York: The United Nations Population Division.
UNCTAD, (2003), United Nations Conference on Trade and Development, A Manual
for the Prepares and Users of Eco-Efficiency Indicators.
UNFCCC, (2009), The United Nations Framework Convention on Climate Change,
‘‘the draft of the Copenhagen Climate Change Treaty‟‟, pp. 3 – 181.
UNFCCC, (2012), The United Nations Framework Convention on Climate Change.
Available internet: http://unfccc.int/meetings/copenhagen_dec_2009/ meeting/62
95. php Accessed on 22/02/12.
Varun, B. I. K. and Prakash, R. (2008), LCA of renewable energy for electricity
generation systems-A review on Renew Sustain Energy.
Walker, D., Pitt, M., Thakur, U. J. (2007). Environmental management systems:
information management and corporate responsibility. Journal of Facilities
Management 5, 1, pp. 49 – 61.

Bassey B. Okon References
304
WB, (2004), World Bank Infrastructure Services in Developing Countries: Access,
Quality, Costs and Policy Reform. Policy Research Working Paper 3468.
WB, (2010), “About Us.” The World Bank. Available Internet: http://web.worldbank.
org/WBSITE/EXTERNAL/EXTABOUTUS/0,, contentMDK: 20040565~menu
PK: 1696892~page PK: 51123644~piPK: 329829~theSitePK: 29708, 00.html.
Accessed on 22/04/12.
WBCSD, (2000) World Business Council for Sustainable Development Eco-Efficiency:
Available Internet: Creating More Value with Less Impact,
WCED, (1987), World Commission on Environment and Development- Our Common
Future, 42, 427 World Commission on Environment and Development, United
Nations.
Welford, R. (2003), Corporate Environment Governance Programme, Project Report 5.
Corporate Social Responsible in Europe and Asia: Critical Elements and Best
Practice.
White, B. (2008), Rethinking Standards in Construction: BSI Constructing Excellence
in the Built Environment, United Kingdom.
WHO, (2004), World Health Organisation, Healthcare waste management. Fact sheet,
No. 281.
WHO, (2007), Waste from Healthcare Activities, Fact Sheet No. 253.
Williams, P. T. (1999) Waste Treatment and Disposal. John Wiley & Sons
Incorporated, United Kingdom.
Winther B. N. and Hestnes A. G. (1999) Solar versus green: the analysis of a
Norwegian row house. Solar Energy, 66, 6, pp. 387 – 393.
WMP, (1995), Waste Management Planning: Principles and Practice. Department of
Environment, London, United Kingdom.
WMS, (2012) Waste Management Strategy. City University London, United Kingdom.
Wood, B., (2006). The role of existing buildings in the sustainability agenda. Facilities
24, (1/2), pp. 61 – 67.
WRAP, (2011), Waste and Resources Action Programme, United Kingdom.
WW, (2005), Waste Watch, Resource Management in the Education Sector, United
Kingdom.
Bassey B. Okon References
305
Wyatt, D. P. (1994), Recycling and Serviceability: The Twin Approach to Securing
Sustainable Construction. In Proceedings of First International Conference of
CIB TG 16 on Sustainable Construction, Tampa, pp. 69 – 78.
Yin, R. K. (1984), Case study research: Design and Methods, Newbury Park, CA: Sage.
Publications, Incorporated.
Yin, R. K. (2003), Case study research: Design and methods. Thousand Oaks (Ca): Sage
Publications, Incorporated.
Young, J. W. S. (1997), A framework for the ultimate Environment index-putting
atmospheric change into context with sustainability. Environmental Monitoring
and Assessment, 46, pp. 135 – 149.
Yu, C.C and Mclaren, V. (1995), A Comparison of Two Waste Stream Quantification
and Characterisation Methodologies. Waste Management and Research, 13, pp.
343–361.
Yudelson, J. (2008), European Green Building Technologies: A Report on Research
Conducted for the Mechanical Contractors Education and Research Foundation,
United Kingdom.
Zabalza, I., Aranda, A. Scarpellini, S., and Diaz, S. (2009), Life Cycle Assessment in
Building Sectors: State of the Art and Assessment of Environmental Impact for
Building Materials. Ist International Energy, Life Cycle Assessment and
Sustainability Workshop and Symposium (ELCAS) NISYROS, Greece.
Zimmermann, M. (2005), Life Cycle Cost. Norderstedt.
Zulkernain, S. H., Zawawi, E. M. A., Rahman, M.Y. A and Mustafa, N. K. F. (2011), A
Review of Critical Success Factor in Building Maintenance Management
Practice for University Sector. World Academy of Science, Engineering and
Technology 53.

Bassey B. Okon References
306

Bassey B. Okon Appendices
307
Appendices
The content of the appendices are as follows:
Appendix I contains the manuscript of survey used in studying the infrastructure
characteristics in phase I – IV.
Appendix II provides some worked examples for the severity index and coefficient of
variation analysis within building infrastructuctre characteristics study, phases I – IV.
Appendix III holds the building services infrastructure characteristics analysis in
Chapter Four.
Appendix IV is the enclosure of questionnaire regarding the building infrastructure
material flows. The data were analysed for the environmental impacts and life cycle cost
evaluation in the study phase V.
Appendix V provides the normalisation and weighting factors analysis information in
Chapter Five.
Appendix VI presents the questionnaire information for the healthcare and education
sectors in the study phase VI.
Appendix VII gives statistics as feedback regarding the participating UK hospitals and
schools for the energy utilities (infrastructure) assessment in the study phase VI.
Appendix VIII shows the carbon footprint analysis from the healthcare and education
sectors in the study phase VI.
Appendix IX accounts for the structured interview questions during interview session
with the Director of programmes, LJMU, UK in the study phase VII.
Appendix X contains for the structured interview questions during interview session
with the Director of sustainability, BDP, company, UK in the study phase VII.