Embed Size (px)
Citation preview
INCLUSIVE AND SUSTAINABLE INDUSTRIAL DEVELOPMENT
Sustainable assessment of chemical industries for policy adviceThe case of the Philippines, Thailand, Indonesia and Viet Nam
WORKING PAPER 06/2014


UNITED NATIONS INDUSTRIAL DEVELOPMENT ORGANIZATIONVienna, 2015
RESEARCH, STATISTICS AND INDUSTRIAL POLICY BRANCHWORKING PAPER 06/2014
Sustainable assessment of chemical industries for policy advice
The case of the Philippines, Thailand, Indonesia and Viet Nam
Steve EvansInstitute of Manufacturing
Cambridge University
Smeeta FokeerUNIDO
Jae-Hwan ParkInstitute of Manufacturing
Cambridge University
Gorazd RezonjaUNIDO

The designations employed, descriptions and classifications of countries, and the presentation of the
material in this report do not imply the expression of any opinion whatsoever on the part of the Secretariat
of the United Nations Industrial Development Organization (UNIDO) concerning the legal status of any
country, territory, city or area or of its authorities, or concerning the delimitation of its frontiers or
boundaries, or its economic system or degree of development. The views expressed in this paper do not
necessarily reflect the views of the Secretariat of the UNIDO. The responsibility for opinions expressed
rests solely with the authors, and publication does not constitute an endorsement by UNIDO. Although
great care has been taken to maintain the accuracy of information herein, neither UNIDO nor its Member
States assume any responsibility for consequences which may arise from the use of the material. Terms
such as “developed”, “industrialized” and “developing” are intended for statistical convenience and do not
necessarily express a judgment. Any indication of, or reference to, a country, institution or other legal
entity does not constitute an endorsement. Information contained herein may be freely quoted or reprinted
but acknowledgement is requested. This report has been produced without formal United Nations editing.
This document reflects work in progress. Its distribution is limited for the purposes of eliciting comments
and reviews only.

iii
Table of Contents
1. Introduction ............................................................................................................................ 6
1.1 Industrialization in the context of a prospective AEC ................................................... 7
1.2 Profile of the chemical industry ..................................................................................... 8
1.3 An overview of the global chemical industry ................................................................ 9
2 Economic analysis ................................................................................................................ 11
2.1 Introduction/conceptual framework ............................................................................. 11
2.2 Economic methodological considerations .................................................................... 13
2.3 Economic assessment ................................................................................................... 14
2.4 Limitation of economic methodologies ........................................................................ 31
3 Environmental and social analysis ....................................................................................... 33
3.1 Introduction and conceptual framework....................................................................... 33
3.2 Methodological considerations .................................................................................... 36
3.3 Indonesia ...................................................................................................................... 39
3.4 The Philippines ............................................................................................................. 48
3.5 Thailand: ...................................................................................................................... 59
3.6 Viet Nam ...................................................................................................................... 71
3.7 Evolution of the methodologies: .................................................................................. 81
4 Synthesis of economic, environment and social analyses .................................................... 81
4.1 Indonesia ...................................................................................................................... 86
4.2 Philippines .................................................................................................................... 87
4.3 Thailand ........................................................................................................................ 88
4.4 Viet Nam ...................................................................................................................... 89
5 Policy recommendations ...................................................................................................... 90
6 Conclusions .......................................................................................................................... 95
7 References ............................................................................................................................ 97
iv
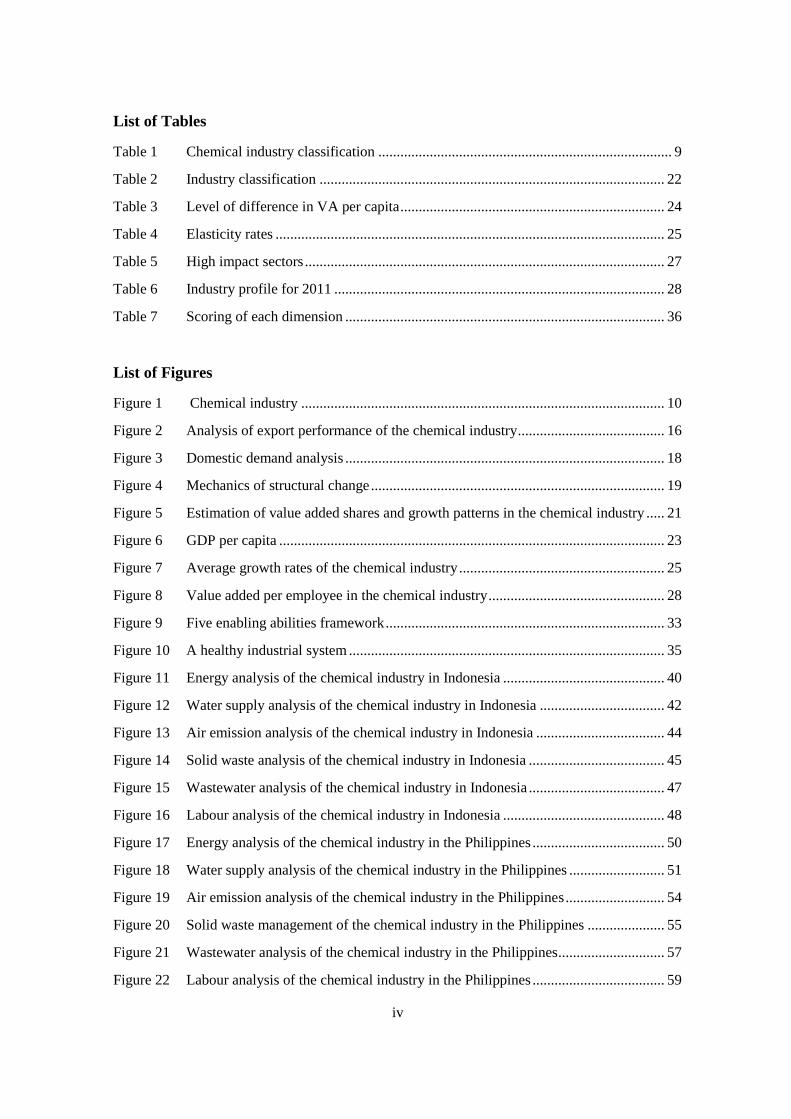
List of Tables
Table 1 Chemical industry classification ................................................................................ 9
Table 2 Industry classification .............................................................................................. 22
Table 3 Level of difference in VA per capita ........................................................................ 24
Table 4 Elasticity rates .......................................................................................................... 25
Table 5 High impact sectors .................................................................................................. 27
Table 6 Industry profile for 2011 .......................................................................................... 28
Table 7 Scoring of each dimension ....................................................................................... 36
List of Figures
Figure 1 Chemical industry ................................................................................................... 10
Figure 2 Analysis of export performance of the chemical industry ........................................ 16
Figure 3 Domestic demand analysis ....................................................................................... 18
Figure 4 Mechanics of structural change ................................................................................ 19
Figure 5 Estimation of value added shares and growth patterns in the chemical industry ..... 21
Figure 6 GDP per capita ......................................................................................................... 23
Figure 7 Average growth rates of the chemical industry ........................................................ 25
Figure 8 Value added per employee in the chemical industry ................................................ 28
Figure 9 Five enabling abilities framework ............................................................................ 33
Figure 10 A healthy industrial system ...................................................................................... 35
Figure 11 Energy analysis of the chemical industry in Indonesia ............................................ 40
Figure 12 Water supply analysis of the chemical industry in Indonesia .................................. 42
Figure 13 Air emission analysis of the chemical industry in Indonesia ................................... 44
Figure 14 Solid waste analysis of the chemical industry in Indonesia ..................................... 45
Figure 15 Wastewater analysis of the chemical industry in Indonesia ..................................... 47
Figure 16 Labour analysis of the chemical industry in Indonesia ............................................ 48
Figure 17 Energy analysis of the chemical industry in the Philippines .................................... 50
Figure 18 Water supply analysis of the chemical industry in the Philippines .......................... 51
Figure 19 Air emission analysis of the chemical industry in the Philippines ........................... 54
Figure 20 Solid waste management of the chemical industry in the Philippines ..................... 55
Figure 21 Wastewater analysis of the chemical industry in the Philippines ............................. 57
Figure 22 Labour analysis of the chemical industry in the Philippines .................................... 59

v
Figure 23 Energy analysis of the chemical industry in Thailand .............................................. 62
Figure 24 Water supply analysis of the chemical industry in Thailand .................................... 64
Figure 25 Air emission analysis of the chemical industry in Thailand ..................................... 65
Figure 26 Solid waste analysis of the chemical industry in Thailand....................................... 67
Figure 27 Wastewater analysis of the chemical industry in Thailand ...................................... 69
Figure 28 Labour analysis of the chemical industry in Thailand .............................................. 70
Figure 29 Energy analysis of the chemical industry in Viet Nam ............................................ 72
Figure 30 Water supply analysis of the chemical industry in Viet Nam .................................. 74
Figure 31 Air emission analysis of the chemical industry in Viet Nam ................................... 75
Figure 32 Solid waste analysis of the chemical industry in Viet Nam ..................................... 77
Figure 33 Wastewater analysis of the chemical industry in Viet Nam ..................................... 79
Figure 34 Labour analysis of the chemical industry in Viet nam ............................................. 81
Figure 35 Step-by-step analysis of economic aspects to environment-social aspects .............. 83
Figure 36 Reporting flows of solid waste and toxic waste ....................................................... 93

6
1. Introduction
Over the past decades, globalization and industrial development have fostered high economic
growth in several emerging countries in the ASEAN region. Since 1990, the region’s GDP has
grown more than 5 percent annually, much faster than the world’s average of around 3 percent.
Unfortunately, this economic growth was coupled with a rapid rise in energy demand, high
natural resources use as well as environmental degradation.
In order to meet energy and material demand for development and to ensure that pollutants and
unsustainable resource consumption decrease in total terms, economic growth must be
decoupled from environmental impacts. This can be achieved by applying an integrated
framework to support the greening of industries, consisting of industry-led initiatives, adoption
of best practice technologies, market-based policy instruments and regulations, backed by
political support and information flow. However, more often than not, the rule of the game is
damage limitation in the pursuit of continued economic growth.
This report presents a new methodology that aims to provide an effective assessment of
industries in an effort to provide an adequate analysis to inform policymaking. It hence focuses
on the chemical industry in five ASEAN countries, namely Indonesia, Malaysia, the Philippines,
Thailand and Viet Nam.
That “manufacturing” is the engine of growth is a commonly heard slogan. The internationally
acclaimed Cambridge economist Ha-Joon Chang devotes one full section to the importance of
manufacturing for economic growth in his book. He claims: “History has repeatedly shown that
the single most important thing that distinguishes rich countries from poor ones is basically their
higher capabilities in manufacturing, where productivity is generally higher, and, most
importantly, where productivity tends to (although does not always) grow faster than in
agriculture and services” (Chang, 2007:213). Hence, the case for industrial policy remains
strong and is becoming stronger yet with technological change and globalization (Lall, 2003) as
a means to attain the full potential of manufacturing sector growth in any country.
Industrial development depends on the international context, which is changing rapidly, and is
driven by globalization, liberalization and technological change. Specifically, it is characterized
by tighter linkages within global value chains based on close coordination between national and
international actors within integrated systems. The success of national industries thus
increasingly depends on a countries’ ability to be engaged in industries which are dynamic, fast
growing and have high returns. On the other hand, the national context also plays a role. On the
supply side, the fundamental changes that take place in any economy can, to a large degree, be

7
associated with the changes in a country’s factor endowment, which entails differences between
countries in terms of labour and capital stock. At the static level, this notion implies that a
country must align its productive capacities and labour with its current endowment structures. At
the dynamic level, this notion suggests that countries that excel in the production of goods as
services, which are in line with their endowment, can accumulate capital and knowledge and
thereby change and improve their endowment structures.
1.1 Industrialization in the context of a prospective AEC
Founded in 1967, the Association of Southeast Asian Nations (ASEAN) promotes economic and
political cooperation between member countries in East Asia, thereby facilitating their
interaction with the rest of the world. Following the Bali Concord II in 2003, the formation of an
ASEAN Economic Community (AEC) was deemed the end goal of regional economic
integration. Transforming ASEAN into a single market and production base by 2015, achieving
the free movement of goods, services, investment, skilled labour and a freer flow of capital
within the region, lies at the heart of the AEC concept.
The formation of AEC opens up a plethora of opportunities and challenges for various
industries. We list a few in this section.
The most ostensible opportunity is the enhanced market, which comprises over 600 million
people. Over the period of 1998-2012, the ASEAN’s average economic growth was 5.9 percent,
which exceeds that of most other regional blocks, signifying the ASEAN market’s expanding
purchasing power. Unfortunately, the desk study and fieldwork revealed insufficient information
data availability on air emission control tools, techniques, education programmes or best
practices in the chemical industry that are shared across authorities, industry and locals, and it is
therefore not possible to make any statements on energy-related education in Viet Nam.
Cheaper raw materials: most industries can tap into the cheaper raw materials stock
available elsewhere in the AEC. ASEAN is rich in natural resources, for instance,
ASEAN possesses over 40 percent of the oil and gas resources of the Asia-Pacific. This,
too, will enable industries to find cheaper and consistent supplies of resources.
Reduction in production costs: in addition to cheaper raw materials, industries can
further reduce their costs through improved logistics, a reduction in tariffs and
formalities. A McKinsey research report (2004) finds that firms in the electronic goods
industry have been able to cut up to 20 percent of their costs due to the establishment of
AEC. The report also finds similar cost reductions for other industries as well.

8
Increased competition: all industries must brace themselves for more competition. Firms
not only have to compete with their counterparts in other ASEAN economies, but with
foreign counterparts as well, as the formation of AEC makes the region a more lucrative
market.
Increased flow of foreign investments: Charumanee (2012) predicts that the formation of
AEC will result in an increased flow of foreign investments to the region. This will
definitely have an impact on the region’s industrial landscape.
The former Secretary General of ASEAN1 correctly identified its three strengths “We (ASEAN)
have abundant natural resources in our region. We have large supplies of professionals and
talented people. And, we have the capability to adopt, adapt and advance technology.” Effective
industrial policy is necessary to capitalize on these strengths and adapt to the opportunities and
challenges the AEC brings. This includes, but is not limited to, improving hard and soft
infrastructure to reduce logistic barriers, providing capacity building of domestic firms,
channelling skills development to cater to industries and creating opportunities for those
rendered unemployed due to increased competition. We provide certain guidelines on such
policy measures in this report to ensure the sustainability of the ASEAN industrialization
strategy.
1.2 Profile of the chemical industry
The profiling of the chemical industry under ISIC Rev 3.1 covers the manufacture of basic
chemicals and chemical products and that of man-made fibres. This division is based on the
transformation of organic and inorganic raw materials by a chemical process and the formation
of products. It distinguishes the production of basic chemicals, which comprises the first
industry group, from the production of intermediate and end products, which requires further
processing of basic chemicals and comprises the remaining industries.
1 Remarks by H.E. Ong Keng Yong, Secretary General of ASEAN, at the ASEAN Gala Dinner, London, 4
December 2006.

9
Table 1 Chemical industry classification
ISIC Rev.3.1 code 24: Manufacture of chemicals and chemical products
241 - Manufacture of basic chemicals
2411 - Manufacture of basic chemicals, except fertilizers and nitrogen compounds
2412 - Manufacture of fertilizers and nitrogen compounds
2413 - Manufacture of plastics in primary forms and of synthetic rubber
242 - Manufacture of other chemical products
2421 - Manufacture of pesticides and other agrochemical products
2422 - Manufacture of paints, varnishes and similar coatings, printing ink and
mastics
2423 - Manufacture of pharmaceuticals, medicinal chemicals and botanical products
2424 - Manufacture of soap and detergents, cleaning and polishing preparations,
perfumes and toilet preparations
2429 - Manufacture of other chemical products n.e.c.
243 - Manufacture of man-made fibres
2430 - Manufacture of man-made fibres
1.3 An overview of the global chemical industry
The chemical industry has been on a path of continuous expansion, with production spreading to
new destinations and products becoming increasingly diverse. Valued at US$ 171 billion in
1970, the industry’s gross output grew to US$ 4.12 trillion by 20102, with over 10,000 product
varieties. Looking at the global export of chemicals, Germany, USA and Belgium emerge as the
top exporters with a market share ranging from 7.7 percent to 11.5 percent, but the position of
developing countries in the production ladder, such as China, India and Brazil, is continuously
climbing, with China already claiming 6.45 percent of international chemical trade. The top
exporters in the chemical industry and their market share are presented in Figure 1. The
emergence of new producers and new product lines make the chemical industry particularly
dynamic.
2 UNEP (2012).

10
Figure 1 Chemical industry
Source: Author’s calculation using the WITS-COMTRADE dataset for 2011
The Asian region has been the chief driver of growth in the chemical industry in the last 25 years
with nearly 50 percent of global sales already taking place in the region3. In 2010, 43 percent of
the global chemicals market value was produced by Asia and the region is expected to expand
this share to 60 percent by 2030, which will coincide with the global chemical industry doubling
its turnover4. The presence of huge and expanding domestic markets lends distinct locational
advantages to most Asian producers. At the same time, many major global players have already
established their presence in Asia; this trend is expected to intensify in the near future, making
the Asian market highly competitive. The upstream chemical industry is the most important in
the value chain as it provides all the synthetic materials needed for further processing. The Asian
chemical industry is in a growing stage and is expected to continue to grow in the next decade.
Production capacities are expanding due to the high interlinkages in the economy, with chemical
products serving as inputs to other industries and the growing domestic market being
characterized by increasing spending power. There is thus a strong focus in Asian countries on
the growing domestic market.
The chemicals industry is one of the most regulated industries in the world, a natural
consequence of its potential adverse impact on the environment throughout its production value
chain. In the UNEP report titled ‘Priority products and materials: Assessing the environmental
impacts of consumption and production’, which assesses and ranks different product categories
based on their environmental impact, the figures for the chemical industry rank high on the list.
To address the challenge complex chemicals and associated chemical waste pose, the
Johannesburg Plan of Implementation adopted at the World Summit on Sustainable
Development 2002 sets out the target that ‘by 2020, chemicals are used and produced in ways
that lead to the minimization of significant adverse effects on human health and the
3 ATKearney (2012).
4 Roland Berger Consulting (2011).

11
environment’5. To achieve this objective, there is an urgent need to heighten efforts to minimize
the environmental impact of the domestic chemicals industry within national policy frameworks.
This is particularly relevant for ASEAN countries whose chemicals industries are ready to
commence on an expansive future path.
2 Economic analysis
2.1 Introduction/conceptual framework
To effectively design appropriate industrial policies, governments in developing countries must
be aware of their competitive position in comparison to other countries and the rest of the world,
given the current domestic and global demand trends. It is equally important for countries to
understand the domestic factors and conditions that impact their competitive position. Such
analysis not only benefits governments, but also the private sector as it provides the information
on which strategic decisions can be based.
Global integration through international trade and capital flows are the cornerstones of modern
economics. If an economy is to become competitive and to develop, it will need to actively
engage in trade with other economies –economies that can rely on catering to their domestic
markets only are few in number. In other words, it is important for a country to identify products
and industries that are:
in line with its current endowment structures;
growing dynamically at the global level due to current and future consumption trends.
The former represents the supply side of our analysis, i.e. the core competencies of a country,
and the latter represents the demand side of our analysis, i.e. whether there is a growing market
for the products of specific industries.
Understanding supply side constraints relates to understanding a country’s comparative
advantage, which is defined by its endowment structures. According to former chief economist
of the World Bank, Justin Lin, a country’s factor endowment entails differences between
countries in terms of labour and capital endowments as well as between countries’ ability to
create the necessary capabilities based on those endowments (Lin, 2011, 2012). These in turn
determine what products countries are able to produce. His theory builds on an integrated
approach, which emphasizes the role of markets for resource allocation, on the one side, and the
government’s role in actively coordinating investments for industrial upgrading and
5 Johannesburg Plan of Implementation, Chapter III, para. 23.

12
diversification, on the other, as well as in compensating for externalities generated by first
movers in the dynamic growth process.
One cannot look independently at the supply side of the coin and continue to produce goods that
are declining in terms of demand. Demand is driven by the international and domestic markets.
Some industries, such as food and beverages or construction materials, are inherently more
geared towards domestic market demand, while others focus more on the international market.
Products are increasingly becoming more complex, dependent on intermediate goods, which in
turn rely on further intermediate goods. The production of final goods is increasingly becoming
intrinsically linked to their degree of reliance on intermediate goods along their supply chain.
Consumption patterns and thus demand, whether domestic or international, affect the growth of
industries that produce intermediate as well as final goods. The entire value chain is influenced
by consumption and it is therefore important for an economy to identify the growing industries
in terms of international and domestic demand both for final as well as for intermediate goods.
Consolidating these two aspects to develop a rigorous approach for industry selection is a
challenging task, but may be paramount for a country to successfully undergo structural
transformation from poorly performing industries to dynamic ones, which generate high value
added and provide sufficient employment opportunities without damaging the environment.6
This opens up the following questions:
On the demand side: Which are the dynamically growing industries at the global level?
What is a country’s weight in globally growing industries and how has its position
changed compared to a decade ago? Can these industries also cater to domestic demand?
On the supply side: Are these industries in line with the country’s comparative
advantage and its endowment structures? Does the development of selected industries
guarantee positive spillovers to other industries of an economy through the supply
linkages?
These two aspects represent the basis of the analysis framework presented in this report.
6 In UNIDO, this approach is referred to as the “3 E’s” (“economy, employment and environment”).

13
2.2 Economic methodological considerations
Some important economic methodological considerations need to be outlined:
Use of quantitative and transparent data. This report does not rely on business perceptions to
assess countries’ industrial competitiveness. Notwithstanding their usefulness, perception-
based surveys generate partial indicators for inter-country comparisons, as the views of
individuals and companies are shaped not only by objective circumstances, but by subjective
and context sensitive factors as well. UNIDO’s methodology relies on a number of carefully
selected, objective, outcome-based indicators published by international organizations.
Although quantitative indicators will never be perfect proxies of what they intend to measure,
they provide a solid foundation for inter-country analyses.
Analysis of levels and trends. The report assesses countries’ industrial performance as well as
the overall trends for a specific period. Such an analysis is particularly useful for countries
experiencing high levels of growth and which have not yet achieved the rates of development
typical of industrialized countries. The analysis covers the period 2000–2009 for all
countries.
Macro and sectoral analysis. Macro analysis provides a general overview of a country’s
industrial competitiveness vis-à-vis other countries. By using UNIDO’s methodology, the
report combines macro with sectoral analysis, enabling policymakers to establish realistic and
applied parameters. The depth of sectoral analysis depends on various factors, including data
availability and the objective of the study. The report analyses sectoral performance at the 2-
digit level in SITC revision 3 and ISIC revision 3.
Data
- Value added data source. Value added is defined as the return to factors of production. It
is the difference between total output and total operating costs incurred in the production
of goods, where total operating costs refers to the sum of total materials and operating
costs. This data can be obtained from INDSTAT. The major limitation of INDSTAT is the
limited industry, country and year coverage. Data for a given country for a number of
years in a specific industry might be missing. Another limitation of the INDSTAT data
relates to the fact that some countries report data as a combination of two or more 2-digit
ISIC categories – this requires us to aggregate the data, which can result in a loss of
relevant information, which we would otherwise obtain at a more disaggregated level.
Moreover, the source of valued added data for the 2-digit ISC categories derives from
14
industrial surveys, which only include a representative subset of all the firms operating
within that industry.
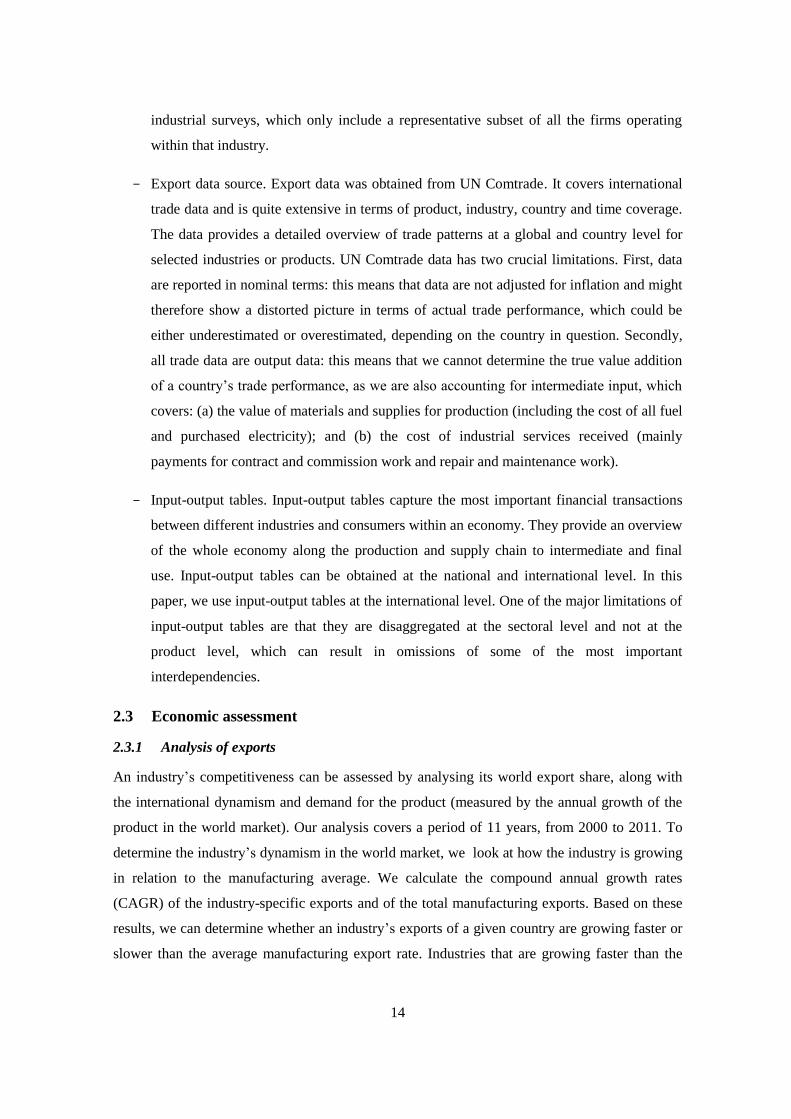
- Export data source. Export data was obtained from UN Comtrade. It covers international
trade data and is quite extensive in terms of product, industry, country and time coverage.
The data provides a detailed overview of trade patterns at a global and country level for
selected industries or products. UN Comtrade data has two crucial limitations. First, data
are reported in nominal terms: this means that data are not adjusted for inflation and might
therefore show a distorted picture in terms of actual trade performance, which could be
either underestimated or overestimated, depending on the country in question. Secondly,
all trade data are output data: this means that we cannot determine the true value addition
of a country’s trade performance, as we are also accounting for intermediate input, which
covers: (a) the value of materials and supplies for production (including the cost of all fuel
and purchased electricity); and (b) the cost of industrial services received (mainly
payments for contract and commission work and repair and maintenance work).
- Input-output tables. Input-output tables capture the most important financial transactions
between different industries and consumers within an economy. They provide an overview
of the whole economy along the production and supply chain to intermediate and final
use. Input-output tables can be obtained at the national and international level. In this
paper, we use input-output tables at the international level. One of the major limitations of
input-output tables are that they are disaggregated at the sectoral level and not at the
product level, which can result in omissions of some of the most important
interdependencies.
2.3 Economic assessment
2.3.1 Analysis of exports
An industry’s competitiveness can be assessed by analysing its world export share, along with
the international dynamism and demand for the product (measured by the annual growth of the
product in the world market). Our analysis covers a period of 11 years, from 2000 to 2011. To
determine the industry’s dynamism in the world market, we look at how the industry is growing
in relation to the manufacturing average. We calculate the compound annual growth rates
(CAGR) of the industry-specific exports and of the total manufacturing exports. Based on these
results, we can determine whether an industry’s exports of a given country are growing faster or
slower than the average manufacturing export rate. Industries that are growing faster than the

15
average manufacturing export rate are considered to be dynamic, and those industries that grow
slower than the average are considered to be static.
The share of manufacturing exports of the given country is then calculated for the period 2000 to
2011 to measure the country’s impact on world demand for the products of that particular
industry. The share of exports in world exports of a given industry indicates a country’s
competitive position relative to others in international markets. Gains in world market shares
reflect improved competitiveness, while losses signal a deteriorating competitive position. This
analysis provides us with a methodology for the classification of industries into four categories
based on their export performance.
Champions: a champion export is a highly dynamic product, which grows above the average of
world exports, with a world market share gain. Successful exporters tend to have an important
number of champion exports, reflecting a country’s ability to gain world market share in the
most dynamic and demanded products;
Underachievers: these exports are highly dynamic in world markets, but the country is losing
world market share. Such exports are considered ‘lost opportunities’ as the country is failing to
compete in fast growing products;
Champions in Adversity: overachiever exports are not very dynamic products — they grow
below the average of world exports — and yet the country is gaining world market share. This
tends to be a common feature of many resource-rich developing countries as their major exports
see sluggish growth in world demand;
Decline: products from this group are slow growing exports in world markets where the country
is losing world market share. It must be noted that it is not necessarily a bad sign for the country
to have declining exports if they are balanced out by champion exports. This is indeed a feature
of many industrialized countries that lose competitive edge in slow growing, labour-intensive
exports while strengthening the position of high value added and technology-intensive exports.
Figure 2 classifies the chemicals industry into the four respective categories in the five ASEAN
economies based on their export performance.

16
Figure 2 Analysis of export performance of the chemical industry
Manufacturing accounts for the bulk of world exports (78 percent in 2010), and is less exposed
to external shocks, price fluctuations, climatic conditions and unfair competition policies. The
price of manufactured goods tends to be more stable than that of commodities, as unfair
competition policies have distorted prices around the world, limiting the potential for export
growth in some commodities. Our figures also show that the growth in manufacturing exports is
a sustained one, with an average global growth of 10 percent between 2000 and 2011.
At the global level, the chemicals industry has fared even better than the average manufacturing
exports, with an average global growth in demand of 10 percent. This trend is set to continue
with the industry establishing extensive upstream and downstream links with growing industries
including agriculture and food manufacturing, construction, textiles, pharmaceuticals,
metallurgy, plastics, etc., which the chemical industry provides both intermediate and final
products to.
We also want to determine how the ASEAN region has responded to the increasing demand for
chemical products. Between 2000 and 2011, Thailand held the largest share of the world’s
growing market for chemical products, with a growth of 0.66 percent in the world market.
Malaysia and Indonesia follow with a growth of 0.36 percent and 0.16 percent, respectively. Viet
Nam and the Philippines lag behind with only a minor increase of 0.08 percent and 0.06 percent,
respectively.
- 7 %
- 2 %
3 %
8 %
13 %
18 %
23 %
- 0 . 5 % - 0 . 4 % - 0 . 3 % - 0 . 2 % - 0 . 1 % 0 . 0 % 0 . 1 % 0 . 2 % 0 . 3 % 0 . 4 % 0 . 5 % 0 . 6 % 0 . 7 % 0 . 8 % 0 . 9 % 1 . 0 %
Growth of world demand
Change in the country's contribution to world demand
Malaysia Philippines Thailand Indonesia Viet Nam
Champions Underachievers
Declining Champions in Adversity
Average world growth of manufacturing sector
Average world growth of chemical industry

17
Hence, the chemical industry is a “champion” industry in each of the countries examined in this
report. Global demand for products from the chemicals industry has been growing at a higher
rate than the average growth rate of the manufacturing sector on the whole, and all five countries
increased their share in world exports from the chemicals industry over the respective time
period.
2.3.2 Analysis of domestic demand
In the previous section, we analysed the chemical industry’s performance with respect to the
export performance dimension. In this section, we apply a similar analysis, but at the domestic
level.
This section explores how local demand for products of the chemical industry grew over time
and how the chemicals industry responded in terms of adjusting its production capacity.
Furthermore, we track the development of domestic demand for products of the chemicals
industry (measured by the industry’s annual growth in the domestic market) relative to domestic
demand for manufactured goods in general.
For this analysis, we use input-output tables to calculate the growth rate of domestic demand as
the sum of intermediate and final demand for products of the chemical industry. Unfortunately,
no input-output table was available for Viet Nam. Moreover, due to the reliance of our analysis
on input-output tables, it covers a period of 10 years, from 1990 to 2000. We used INDSTAT
data to determine the industry’s value added.
To conduct the analyses, we created a graph (Figure 3) with the following description: the y axis
indicates the changes in domestic demand for products of the chemicals industry and the x axis
shows the changes in the value added of the chemical industry in the country’s total
manufactured value added. The dotted line represents the average domestic growth of the
manufacturing sector demand during the same time period.

18
Figure 3 Domestic demand analysis
-2%
0%
2%
4%
6%
8%
10%
12%
14%
-4% -3% -2% -1% 0% 1% 2% 3% 4% 5%
Ch
ange
in d
om
est
ic d
em
and
Change in country's VA/MVA
Indonesia Thailand Malaysia Philippines
Those industries that registered a growth in demand relative to the manufacturing sector’s
average (i.e. above the dotted line) while simultaneously recording a positive change in the ratio
of the industry’s value added to total manufacturing value added, will be termed a ‘local
champion’. We find that the chemicals industry in Thailand and Indonesia emerges as a ‘local
champion’. Though the growth in domestic demand for products of the chemical industry is
highest in Malaysia, the domestic industry did not increase its production capacity considerably
(i.e. the share of the chemical industry’s value added in total MVA declined), suggesting a
possible import dependence to meet domestic demand. However, in contrast to Malaysia,
Indonesia’s chemical industry witnessed an increase (1.5 percent) in contribution to total
manufacturing value added over the reporting period. Thailand experienced the highest increase
in domestic demand and achieved the largest increase in the share of value added in total
manufacturing value added. In the Philippines, the relative industrial capacity of the chemicals
industry saw a decline in addition to stagnation in domestic demand.
2.3.3 Analysis of structural change
It is important to compare the evolution and performance of different manufacturing industries
with that of other countries that are in a similar stage of economic development or with countries
that have successfully transformed themselves through manufacturing growth and are therefore
considered a role model. The structural change analysis presented in this section is used to
conduct a comparative analysis. The analysis builds on a comparative advantage argument and is

19
based on the assumption that income level is associated with the country’s endowment structure,
which denotes differences between countries in terms of supply of labour and capital, as well as
the necessary capabilities. These in turn determine what countries are able to produce and relate
to structural change. If countries are able to perform well in industries that are aligned with their
endowment structure, they can accumulate capital and their income per capita grows. The
implication is that the country’s endowment structure also changes as the country accumulates
capital and its labour force acquires higher skills. As countries’ endowments change, they move
to more technologically sophisticated industries with higher capital intensity.
Figure 4 Mechanics of structural change
(GDP ranges are subject to change – this is just for illustrative purposes)
The figure above shows that in development stage 1 (which roughly corresponds to a GDP per
capita range of between US$ 1,000 and 3,000), a country’s endowment in terms of labour and
capital is more aligned with agriculture. As countries grow in agriculture, they are able to move
to the next development stage. The assumption is that during the growth of agriculture, countries
begin investing in hard and soft infrastructure which changes the country’s endowment structure,
aligning it more with manufacturing and later with services.
We apply this logic to the manufacturing sector and demonstrate how manufacturing industries
move through pre-takeoff, growth and decline at different income levels. It is assumed that more
labour-intensive industries have higher growth rates at lower income levels and that they start
declining as income grows, while more capital-intensive industries can sustain high growth rates
over a longer income range.

20
We identified the income stage of selected ASEAN economies which have suitable industries
given the countries’ income level and analysed the industries’ deviation from the benchmark
patterns in the given industries, which we identified above.
The structural change assessment methodology is based on the following steps:
1. Step: Identification of relevant country groups with similar exogenous characteristics based
on size, resource endowment and other relevant factors. Statistical testing indicates that three
major groups share similar patterns of structural change:
- Large countries: More than 12.5 million inhabitants
- Medium countries: More than 3 million and less than 12.5 million inhabitants
- Small countries: 3 million and less inhabitants.
All countries selected for this research fall into the large countries category.
2. Step: Estimation of value added shares and growth patterns of manufacturing industries at
different income levels (development stages) for the identified country groups using the
following model:
- Where X stands for dependent variable: value added share in MVA and value added
per capita.
- It is assumed that industries move through three development stages—pre-takeoff,
growth and decline—following a pattern of a cubic function. Therefore, we use the
cubic functional form with real GDP per capita (PPP adjusted): RGPD as the
independent variable.
- α represents any unobserved effects attributable to country-specific conditions.
- Both dependent and explanatory variables are expressed in logarithmic terms to
measure the elasticity of each variable.

21
The resulting pattern for the chemicals industry is shown in the following figure.
Figure 5 Estimation of value added shares and growth patterns in the chemical industry
3. Step: Classify industries into early, middle and late industries. The 18 manufacturing
industries covered in this report are classified into early, middle and late industries,
depending on whether an industry reaches its highest share in total manufacturing value
added before a GDP per capita of US$ 5,000, between US$ 5,000 and US$ 20,000 or after
US$ 20,000, respectively.
Given the income levels of the five selected ASEAN economies, we determine that the
Philippines, with a real GDP per capita of US$ 4,790.58, and Viet Nam, with a real GDP per
capita of US$ 3,742.71, have endowment structures that are more conducive to the development
of early industries. Indonesia (real GDP per capita of US$ 5,185.75) and Thailand’s (real GDP
per capita of US$ 5,185.75) endowment structures are more conducive to the development of
middle industries, while for Malaysia’s endowment structure, with a real GDP per capita of US$
1,789.27, is more conducive to late industries.

22
Table 2 Industry classification
Real GDP per capita (PPP adjusted)
range in US$ Industry
Early industries - real GDP per capita
(PPP adjusted): 0 - 5,000 US$
Food and beverages
Tobacco
Textiles
Wearing apparel
Wood products
Printing and publishing
Coke and refined petroleum
Non-metallic minerals
Furniture, n.e.c.
Middle industries - real GDP per capita
(PPP adjusted): 5,000 - 20,000 US$
Paper
Basic metals
Fabricated metals
Precision instruments
Late industries - real GDP per capita (PPP
adjusted): 20,000 US$ and onward
Chemicals
Rubber and plastic
Machinery and equipment
Electrical machinery and apparatus
Motor vehicles
By plotting the time series data of individual countries for GDP and value added per capita on
the same graph as that of their country group, we can compare the country’s performance
relative to the average benchmark of its country group in terms of levels and elasticity rates.

23
Figure 6 GDP per capita
The level difference is calculated by
latestbenchmarklatestcountry VApcVApcD ,,
The elasticity rate is calculated by
initia
initialatest
initia
initialatest
i
GDPpc
GDPpcGDPpc
VApc
VApcVApc
E
Interpretation:
If E>1, the industry is growing faster than the economy
If 1> E>0, the industry is growing, yet slower than the economy
If E<0, the industry is declining.
This methodology could only be applied to the chemicals industry of four of the five countries
reporting our study, since long time series data were not available for Viet Nam. On the other
hand, the Republic of Korea was included in our analysis as a “role model” in the region against
which to benchmark performance other than the average of all “large countries”. The analysis
was also limited to the time period for which data was available for the different countries.
Pattern for a specific industry
sector
Level
Elasticity rate = gradient

24
Table 3 Level of difference in VA per capita
Country
Last year
of available
data
For last year of available data
(measurement point of level)
Level
difference
(VApc in
US$) GDP per capita
(PPP adjusted) in
US$
Country's
VApc in US$
Country
group's
VApc in
US$
Indonesia 2003 4607 17 21 -3
Malaysia 2004 15875 128 155 -27
Philippines 1996 3481 25 12 13
Thailand 2002 7528 41 49 -8
Republic of
Korea 2004 21332 677 210 467
Table 3 analyses the level difference in the value addition per capita of each country with that of
its respective country group. In terms of levels, we find that for the last year of analysis, none of
the countries deviated much from the benchmark average of “large countries”. By contrast, the
value addition per capita of the “role model” country (the Republic of Korea) was found to be
much higher than the benchmark average by US$ 467 per capita.
In the time series analysis illustrated in Figure 7, the average growth rates of the chemicals
industry for Indonesia and the Republic of Korea were found to be significantly higher than that
of the benchmark average of “large countries”. During this period, the Republic of Korea
maintained a constant growth rate, while Indonesia started at a significantly lower value added
per capita level, but evened out its industry’s performance to the benchmark average of “large
countries” according to the last year of available data (2003). The chemical industries of
Malaysia, Thailand and the Philippines all had an elasticity rate that was relatively close to the
benchmark average of “large countries”. Indonesia and the Republic of Korea, on the other hand,
registered considerably higher elasticity rates in comparison with their country group average.

25
Figure 7 Average growth rates of the chemical industry
Table 4 Elasticity rates
Time period
analysed
Time period analysis of elasticity rates
GDP per capita (PPP
adjusted) range in
US$
Elasticity rates
of industry in
country
Elasticity rates
of industry in
country group
Indonesia 1970 – 2003 1236 - 4607 10 4
Malaysia 1970 – 2004 3041 - 15875 2 4
Philippines 1963 – 1996 2396 - 3481 3 2
Thailand 1968 – 2002 1712 - 7528 4 4
Republic of
Korea 1968 – 2004 2599 – 21332 9 4
2.3.4 Analysis of interdependence of industrial sectors
In addition to the above analysis, we seek to examine the impact of the chemical industry on
other manufacturing industries in the country. Which production linkages exist among
manufacturing industries, or whether any interdependencies between the manufacturing
industries exist at all is of crucial significance with regard to policy purposes.

26
Defining these linkages and their changes over time is only possible using input-output tables,
which contain a detailed account of the economic structure in terms of demand and supply at the
sub-industry level. Flows from one industry to another within the country can be examined as
well as inter-industry flows between one country and another.
Table 5 presents manufacturing linkages. The calculations are based on backward linkages.
Backward linkages exist when the growth of an industry leads to the growth of the industries that
supply it. Hence, the values in Table 5 indicate how much an increase of US$ 1 in the respective
industries’ output would increase demand for inputs from all other manufacturing industries,
including both direct and indirect effects. Direct effects are purchases of resources (inputs) by an
industry from all industries to produce one unit of output. Indirect effects are purchases of inputs
by an industry that influence the growth of another industry which in turn influences yet another
industry. There can be multiple chains of indirect linkages.
All manufacturing industries are complementary, and not a single industry has a negative effect
on the manufacturing sector as a result of its own growth. However, what we do notice is that
some industries have a bigger impact than others on the growth of the manufacturing sector as a
whole.
By contrasting the individual linkages with the average, it is possible to determine which
industries have higher than average linkages and are therefore more likely to generate higher
than average spillovers to the rest of economy. Industries with above average interlinkages are
classified as ‘high impact’ industries. In Table 5, we highlight the ‘high impact’ industries in
each country in yellow. The chemical industry emerges as a high impact industry in Malaysia,
the Philippines and Thailand, where a unit increase in the chemicals industry would trigger an
increase of 0.15, 0.11 and 0.13, respectively, in the countries’ manufacturing sectors on the
whole.

27
Table 5 High impact sectors
Indonesia Malaysia Philippines Thailand
Food, beverages and tobacco 1.18 1.19 1.18 1.18
Textiles, leather and their products 1.15 1.12 1.08 1.16
Lumber and wood products 1.17 1.16 1.13 1.10
Pulp, paper and printing 1.12 1.12 1.09 1.10
Chemical products 1.13 1.15 1.11 1.13
Petroleum and its products 1.10 1.14 1.04 1.03
Rubber products 1.13 1.15 1.06 1.17
Non-metallic mineral products 1.15 1.14 1.16 1.14
Metal products 1.15 1.09 1.11 1.09
Machinery 1.12 1.06 1.04 1.07
Transport equipment 1.14 1.10 1.13 1.11
Other manufacturing products 1.13 1.10 1.06 1.12
Average 1.14 1.13 1.10 1.12
All highlighted sectors are ‘high impact’ sectors.
2.3.5 Macroeconomic linkages
It is important to analyse the macroeconomic position of each industry. We do this by looking at
the industries’ contribution to exports, manufacturing value added and employment. Table 6
provides the data necessary for such a macroeconomic linkage analysis of the chemicals industry
in the five ASEAN countries.
In Thailand, the chemical industry accounted for 11 percent of the country’s total manufacturing
exports (23 billion USD) but only 6 percent of the country’s value added share (2.93 billion
USD). Such a phenomenon is typical of an industry with resource-based manufactured products
which have a high inherited value content, such as phosphate and gypsum-based chemical
fertilizers. Thailand is also rich in gypsum and fluorite, which is a raw material for the basic
chemical industry. An exports value that is higher than the value added is also common in
industries in which multi-nationals operate an export platform by importing intermediate goods,
adding minimal value and re-exporting the goods, such as packaging of pharmaceutical goods.
This also appears to be the case, albeit to a lesser extent, in Indonesia with 11 percent of the
country’s total manufacturing exports (US$ 13.29 billion) but only 7 percent of the country’s
value added share (US$ 4.25 billion). In Malaysia, the chemical industry accounts for a larger
share of the country’s manufacturing value added (12 percent, US$ 5.03 billion) than that of

28
manufacturing exports (10 percent, US$ 18.31 billion). The same is true for Viet Nam and the
Philippines, but to a much lesser extent.
Table 6 Industry profile for 2011
Figure 8 Value added per employee in the chemical industry
Country’s
chemical
industry
exports
(billion
USD)
Chemical
industry’s
share in
country's
manufac-
turing
exports (%)
Country’s
VA from
chemical
industry
(billion
USD)
Chemical
industry’s
share in
country's
manufac-
tured value
added (%)
Country’s
employment
in chemical
industry
(1000 of
people)
Chemical
industry’s
share in
country's
manufactured
employment
(%)
Thailand 22.94 11 2.93 6 155 4
Indonesia 13.29 11 4.25 7 76 2
Malaysia 18.31 10 5.03 12 69 4
Philippines 1.89 6 0.84 6 40 4
Viet Nam 1.617 3 0.27 6 57 4
0
10
20
30
40
50
60
70
80
0 50 100 150 200 250 300 Value added (
1000
USD) per empl oyee
Exports ( 1000 USD) per employee
Malaysia
Indonesia
Thailand
Philippines
Viet Nam

29
The chemical industry accounts for about 4 percent of total manufacturing employment in the
majority of countries considered here, except in Indonesia, where it is 2 percent. The chemical
industry in Thailand employs the highest number of workers, but is not the most labour-
intensive, which is claimed by Viet Nam with low exports and value addition per employee. At
the other end of the spectrum, Malaysia displays the highest labour productivity both in terms of
exports and value added. The country’s high exports and value addition per employee is
attributable to the vertical integration of the industry within the economy, whereby intermediate
goods downstream in the value chain are sourced from within the country itself. This is the case
in the chemical industry due to the operation of a cracker plant in Indonesia. The country is well
on its way to achieving high exports value and high value addition per employee for its chemical
industry.
2.3.6 Country level summary of the economic analyses of the chemical industry
1. Indonesia
The chemical industry emerges as a champion industry in terms of exports. It is
a dynamic industry in the world market and Indonesia has been expanding its
world market share.
The chemical industry emerges as a ‘local champion’ in terms of domestic
demand. Indonesia was able to improve its local production capacity in response
to increased local demand for chemical products.
Even though Indonesia’s value added per capita is lower than that of the country
group average, the elasticity rate of the industry’s value added per capita with
respect to GDP growth per capita has been quite high (even higher than that of
the role model country). This indicates the expansionary momentum of the
industry.
In terms of domestic demand, the industry displayed linkage effects that are
marginally lower than those of the manufacturing average.
2. Malaysia
The chemical sector emerges as a champion industry in terms of exports. It is a
dynamic sector in the world market and the country has been expanding its
world market share.

30
Although domestic demand for products of the chemical industry increased at a
rate proportional to that of the manufacturing average, the chemical industry did
not increase its capacity relative to manufacturing’s overall capacity (measured
by industry VA /total MVA). This could indicate increased dependence on
imports.
Malaysia’s value added per capita is lower than that of the country group
average; at the same time, the elasticity rate of the industry’s value added per
capita with respect to GDP growth per capita is lower than the country group
average, which implies that the value added per capita will in future drop further
than the country group average.
In terms of domestic demand, the industry displayed linkage effects that are
higher than those of the manufacturing average, hence, the chemical industry
emerges as a ‘high impact’ industry.
3. The Philippines
The chemical industry emerges as a champion industry in terms of exports. It is
a dynamic industry in the world market and the country has been expanding its
world market share.
In terms of domestic demand, the demand for products of the chemical industry
increased at a rate lower than that of the manufacturing average, and the
country’s domestic chemical industry decreased its capacity relative to that of
overall manufacturing (measured by industry VA /total MVA).
The Philippines’s value added per capita is higher than that of the country group
average, at the same time, the elasticity rate of the industry’s value added per
capita with respect to GDP growth per capita has been marginally higher than
the country group average, which implies that the value added per capital will in
future increase further than the country group average.
In terms of domestic demand, the industry displayed linkage effects that are
marginally higher than those of the manufacturing average, hence, the chemical
industry emerges as a ‘high impact’ industry.

31
4. Thailand
The chemical industry emerges as a champion industry in terms of exports. It is
a dynamic sector in the world market and the country has been expanding its
world market share.
In terms of domestic demand, demand for products of the chemical industry
increased at a rate that is much higher than that of the manufacturing average,
and the country’s domestic chemical industry increased its capacity relative to
that of overall manufacturing (measured by industry VA /total MVA).
Thailand’s value added per capita is marginally lower than that of the country
group average, while the elasticity rate of the industry’s value added per capita
with respect to GDP growth per capita is similar to that of the country group
average.
In terms of domestic demand, the industry displayed linkage effects that are
marginally higher than those of the manufacturing average, hence, the chemical
industry emerges as a ‘high impact’ industry.
5. Viet Nam
The chemical industry emerges as a champion industry in terms of exports. It is
a dynamic sector in the world market and the country has been expanding its
world market share.
Unfortunately, due to the lack of available data, we were not able to conduct
further economic analyses of Viet Nam’s chemical industry.
2.4 Limitation of economic methodologies
Analysis of exports
The methodology is useful to analyse industries that are already exporting. It does not
take into account potential industries that are producing goods but are currently not
exporting them. This means that only existing industries are considered, but not new
ones.
The methodology does not take into account the diversity of the industries. In cases in
which the products of an industry are very diverse, variations in the performance of

32
these products are expected relative to the average world growth of the manufacturing
sector.
Analysis of domestic demand:
Since it is not possible to identify the types of products for which there is growing
domestic demand when using this analysis, we cannot determine whether the country is
importing more intermediates or more finished goods.
It is also not possible to determine the share of an industry’s manufacturing output that
ends up on the domestic market when using this analysis.
Analysis of structural change
This analysis is based on benchmarking a country’s performance against the average of
countries with the same endowment structure. This methodology is criticized on two
issues. First, the fact that a country’s endowment structure is determined based solely on
income per capita, and secondly, that it implicitly sets the bar against the average
performance of a given country’s country group rather than against the performance of a
country in which the respective industry has excelled. This also raises the question
whether a recommendation should at all be made for countries to have a lower share in a
given industry and a higher share in another based on the average of the countries in
their country group. This analysis is therefore only used as a reference tool, not one from
which any recommendations are derived.
In addition to factor endowments, historical and socio-political factors, which can have
an impact on a country’s competitiveness, are not accounted for in this methodology.
Analysis of interdependence of industries
In one of his early papers, Carl F. Christ (1955) points out two major assumptions in input-
output analysis. These assumptions are still applicable today.
Constant returns to scale: this assumption is contested on the grounds that functions are
more complex and that production processes cannot be realistically described using
simple proportions.
No substitution of inputs in the production of any good or service is possible. According
to Carl F. Christ, “the second assumption is sufficient to exclude any optimizing from
the supply side, because it excludes all choice about the proportions in which inputs are

33
to be combined in the production of a given output. With such production function, all
inputs are perfect complements” (p. 140).
3 Environmental and social analysis
3.1 Introduction and conceptual framework
The five enabling abilities framework for analysing manufacturing processes
The structure of this analysis goes beyond the typical simple measurement of the scale of any
environmental or social issues. For each of the six dimensions of environmental and social
performance—energy supply, water supply, emissions to air, emissions to water, solid waste and
labour—we analyse data across all five enabling abilities (where data are available). The five
enabling abilities are 1) constraints, 2) planning, 3) operation, 4) monitoring and 5) education.
They provide a framework to identify aspects of performance that may strongly influence the
future ability to manage that aspect. For example, a country may currently be outperforming its
total capacity to deliver water, but a poor score in constraints, planning and education would
help identify a future water challenge for industry before it actually occurs. To understand the
environmental and social dimensions in detail, we have to explore the five enabling abilities
individually rather than characterize the entire industry using a single parameter.
Figure 9 Five enabling abilities framework
This more granular approach enables us to identify the potential for future problems, as well as
the specific abilities that strongly influence a given country’s manufacturing sector. It should be
noted that these enabling abilities are interdependent. Manufacturing’s five enabling abilities are
defined below:

34
Constraint of systems
The ability of industry X to understand current and future constraints:
This ability relates to knowledge. Competent industries will understand how close they are
currently operating at the limit of the natural system they are part of, and are able to extend
this knowledge into the future to get an idea of how close they will be operating at the limit
if a planned expansion or changes occur. This includes a need to understand system limits,
which is often provided by the government, NGOs or trade bodies. Limits may be national
or watershed, physical or legislative or mandated by customers; hence, awareness of limits is
complex and a pre-requisite for analysis and planning.
Planning of systems (design of systems)
The ability of industry X to develop a plan for a sustainable future:
This ability relates to the effectiveness of those institutional mechanisms that bring together
the many actors necessary for effective action. Solutions are developed and implemented by
multiple actors, for example, the government issues pollution regulations which address
industry and are monitored by NGOs or government bodies and felt by the local population.
The solutions designed must be sensible and workable. This enabling ability is crucial for
complex interactive systems.
Operation of systems
The ability of industry X to deliver current value within current national limits:
This enabling ability relates to an industry’s current situation and its performance in terms f
delivering an industrial system that can operate within the current limits. It emphasizes
proximity to actual limits. If the industry is currently producing beyond its limits, expansion
will be much more challenging. Equally, demonstrating competence at producing within
current limits is a good indicator of the industry’s ability to continue operating within the
limits in future.
Monitoring of systems
The ability of industry X to assess its own performance:
This enabling ability relates to the institutional mechanisms that exist for monitoring,
measuring and enforcing performance. These consist of government competence in
enforcing current legislation, scientific competence and the capacity to fully test and monitor
whether regulations are being implemented, combined with the industry’s competence to
monitor adherence to regulations at the plant level (to avoid failures). The ability to collect

35
this data and use it to guide future action is also taken into account, as there is little value in
accurate reports that lead nowhere.
Education for systems
The ability of industry X to organize and develop competence/knowledge:
This enabling ability relates to the longer term ability to deliver the four enabling abilities
already discussed. Without competent individuals, the design, operation, monitoring and
understanding of constraints will be severely limited. This ability analyses national
institutions’ ability to develop education programmes and to encourage enrolment. This
may refer to professional accreditation or degree level, and may be provided by academic
institutions, trade associations or private companies.
Analysis
This study focuses on physical constraints that can deter or enable an industry’s future progress.
‘Physical constraints’ are those national resources that are crucial for the given industry to
maintain its current and future manufacturing activities. This includes labour performance as
well as the use of resources and creation of waste that needs to be managed.
In addition, we analyse the relationships between government authorities, industry and the local
population (including NGOs). A functioning system of checks and balances between industry,
governments and citizens is helpful in establishing a robust licence for industry to operate. The
proper checks and balances should result in a better environmental and social performance, as
well as to an improved stewardship of national constraints.
Figure 10 A healthy industrial system

36
Analysis dimensions
To measure an industry’s environmental impact, five dimensions are selected: energy used, air
emissions, water used, solid waste and wastewater. Labour is selected for the social impact
analysis. The analysis dimensions allow for various situations across industries and countries to
be evaluated. Scores are given using the five-ranking index shown here (except in cases in which
no data are available, and which are termed ‘blank spots’ and result in a zero score).
Table 7 Scoring of each dimension
Scoring 0 1 2 3 4 5
(meaning) No data
available
Not
desirable Less desirable Acceptable Very desirable
Most
desirable
Constraint Blank
spots
Very close
or over
constraints
Close to
constraints
Neither
close nor
far from
constraints
Far from
constraints
Very far from
constraints
Planning Blank
spots
Not
desirable Less desirable Acceptable Very desirable
Most
desirable
Operation Blank
spots
Not
desirable Less desirable Acceptable Very desirable
Most
desirable
Monitorin
g
Blank
spots
Not
desirable Less desirable Acceptable Very desirable
Most
desirable
Education Blank
spots
Not
desirable Less desirable Acceptable Very desirable
Most
desirable
3.2 Methodological considerations
Lack of data
There is no institutional or international agreement on the list of data to be collected to determine
environment and social impacts, especially at industry level (i.e. our analysis). Countries have no
obligation to regularly report data to international entities, such as the World Bank or ADB in a
form that would assist in sectoral analyses (where reporting does exist, it is typically at national
level). Voluntary efforts are also extremely limited, making it difficult to create a data set for an
industry level analysis of environmental and social aspects from published reports.
Environmental data is known to be notoriously scarce as it is not yet common practice to
measure environmental variables, especially at different levels of aggregations. There have been
some attempts at national level measurements and estimations for some environmental variables,
but industry and sub-manufacturing industry level data with sufficient disaggregation and time
series coverage is almost impossible to come by, whether in international or national databases.
Of the variables of interest for our study, energy is the only exception, with data at the ISIC 2-
digit level disaggregation available in the IEA database.

37
This lack of data affects our ability to conduct a purely quantitative analysis of the
environmental and social impacts as originally envisaged. Qualitative research methods were
developed where we encountered a lack of data. In the long term, however, it would be desirable
for each country to establish its own data collection system and a centralized national
environmental database to enable an environmental and social assessment of its main industries.
Pre-fieldwork
Various chemical industry reports, national competitiveness reports and environmental
or social reports for the countries included in this study were obtained and studied.
International databases were checked for data availability.
The main concepts and analysis methodology were developed, including detailed
interview questions for government bodies, industry and NGOs.
Fieldwork of two weeks per country
National consultants were hired to carry out the fieldwork. The national consultant
helped in the process of scheduling interviews with the relevant parties and coordinating
the visits.
All researchers participated in the fieldwork to share common goals and to develop and
refine the detailed approach to the fieldwork.
Several interviews were conducted with the relevant government bodies, the private
sector, industry associations and NGOs.
A small number of forums were held to ensure that the views of firms across a wide
range of firms in terms of size were obtained.
Post-fieldwork
It was necessary to modify the research methodology to include a qualitative analysis of
the data collected during the fieldwork to compensate the lack of quantitative data.
The information provided in this paper was either collected through a desk study or during a
two-week fieldwork period in the countries. Ministry officials are generally in a better position
to gather higher quality data due to their networks and the fact that they are not constrained by a
two-weeks time limitation.

38
A note on Malaysia’s environmental and social data and analysis
After applying the above methodology in Malaysia (i.e. two weeks of data collection in the
country supported by local country experts, holding around 60 interviews and meetings with
over 100 people and reviewing reports published by the Malaysian government and NGOs), we
were not able to gather sufficient quantitative and/or qualitative data on the environmental
performance of the chemical industry in Malaysia to conduct a robust analysis. Therefore, our
report does not include an environmental analysis for Malaysia.
No comparison across countries
The objective of our research is to explore and understand the environmental and social
implications of deepening the activities of a specific manufacturing industry within a country in
order to inform future industrial policies and strategies. The data and information collected are
therefore very contextual to a specific industry in a specific country. As a result, the
methodology applied does not allow for cross-national comparison.
Reading this report
The subsequent sections follow a common format. First, each of the four countries studied is
presented in turn. The analysis is presented for each country for all six dimensions of
environmental and social performance – energy, water supply, emissions to air, solid waste,
emissions to water and labour. The report draws conclusions from the available data for each
dimension, starting with the constraints on the system (energy system, water system, etc.),
followed by planning, operation, monitoring and education abilities. Each of these is assigned a
score from the above table and a diagram is used to present the scores (5 = best, 1 = worst, 0 =
insufficient data). Summaries of the most important limits and enablers to the chemical
industry’s growth in each country are provided as well.
Next phase of the methodological development
The methodology presented here discusses the chemical industry’s hotspots in terms of
environmental and social aspects. Future developments could include the concept of industry
coolspots. Coolspots represent opportunities for a positive environmental or social impact and
are related to a particular industry. The newly developed methodology is applicable not only to
countries from the ASEAN region but also to other regions, including developed countries.
Finally, as this was the first attempt to obtain data for this type of methodology, it should be
noted that the identification and collection of data was challenging.

39
3.3 Indonesia
Environmental assessment
3.3.1 Energy
Analysis of enabling abilities
Constraints
Blank spots: The desk study and fieldwork illustrated that there is insufficient data relating to the
exchange of information between local and national authorities and between industry and the
local population about the capacity of the chemical industry to understand current and future
energy constraints. It is therefore not possible to make any conclusive statement on the energy
constraints of Indonesia.
Planning
Considerable efforts have been made on the part of the authorities to establish a national energy
plan, including subsidies, a pricing policy and the use of alternative energy sources. The
Indonesian government also acknowledges that much of the country’s clean coal is exported,
while dirty coal is used for domestic energy production. The National Energy Council is in
charge of the national energy policy and manages the types of energy available as well as their
utilization. It is unclear, however, to what extent industry and the local population are engaged in
addressing energy issues in the chemical industry. Beyond industrial committee meetings, it is
also not clear to what extent effective communication channels have been established between
Indonesian authorities and industry and the local population with regard to energy demand,
energy supply and energy saving within the chemical industry. As such, it appears that the
dominant influence on the domestic chemical industry is top down policy formulated by the
international community.
Operation
The Indonesian authorities have developed several policies in an attempt to encourage energy
saving in industry. These efforts include the establishment of a ‘green industry award’, a ‘new
environmental law for both new and existing industries’ and various activities of the ‘Centre for
Green Industry and Environmental Affairs’. Whilst the aforementioned policies and initiatives
appear to have an influence on large national and international firms, it is unclear to what extent
energy saving efforts (e.g. installing new energy facilities or general best practice operations) are
being implemented by SMEs in the chemical industry.

40
Monitoring
The GIZ is currently addressing energy efficiency. Companies are audited to determine whether
they are complying with the regulations, and compliant companies are rewarded with
preferential credit terms from the German Federal Bank. Furthermore, companies that collect
energy efficiency and waste minimization data are accorded the ‘Green status’, whilst more
advanced, high performing firms are awarded the ‘Gold status’.
Education
Blank spots: The desk study and fieldwork revealed insufficient data availability on energy
education in the chemical industry from the shared point of view of authorities, industry and the
local population . It is therefore not possible to make any conclusive statement on the energy
monitoring systems in Indonesia.
Summary
Figure 11 Energy analysis of the chemical industry in Indonesia
3.3.2 Water supply
Constraints
Blank spots: The desk study and fieldwork revealed insufficient data availability on the
exchange of information between authorities, industry and the local population concerning the
ability of the chemical sector to understand current and future water supply constraints. It is
therefore not possible to make any conclusive statement on the water constraints in Indonesia.

41
Planning
According to the report ‘Green Growth, Resources and Resilience’ (ESCAP/ADB/UNEP, 2012),
Indonesia faces an urgent sustainability challenge with regard to water supply. The rise in
demand for water is expected to continue into the next decade. The government is attempting to
improve key utilities and is undertaking efforts to address existing problems. However, the desk
study and fieldwork did not provide any reliable information on this issue, and it is therefore not
possible to make any conclusive statement on the water planning system in Indonesia. The
Directorate General for Water Resources, the Water Basin Authority within the Ministry of
Public Works, is responsible for ensuring adequate supply of water to industry. Working in
collaboration with the Ministry of Industry, the Directorate General for Water Resources is
responsible for determining priorities for the annual budgets in order to put together the annual
government work plan. Industrial zones are being considered for petrochemical companies based
on the industrial map. The provision of adequate water supplies to these zones is being planned.
Operation
Blank spots: The desk study and fieldwork revealed insufficient data availability relating to
efforts undertaken by government authorities, industry and the local population to better manage
and reduce water consumption. It is therefore not possible to make any conclusive statement on
the water operation systems in Indonesia.
Monitoring
Obtaining green labels for superior environmental performance can help companies capture
additional value. The Ciliwung river supplies 80 percent of the freshwater for Jakarta, but is
heavily used by industry, with 20 percent of Indonesian industry (mostly textiles) located on or
near the river. Recognizing the importance of clean water, the local population and NGOs have
introduced a ‘Toxic free water campaign’ to try to improve water quality. It should be noted that
this is an independent, non-governmental initiative.
Education
Blank spots: The desk study and fieldwork revealed insufficient data availability on efforts
undertaken by government authorities, industry and the local population to educate one another
with regard to water supply to the chemical industry. It is therefore not possible to make any
conclusive statement on the education system related to water in Indonesia.

42
Summary
Figure 12 Water supply analysis of the chemical industry in Indonesia
3.3.3 Air emissions
Constraints
Blank spots: According to the report ‘Resource Efficiency: Economic Outlook for Asia-Pacific’
(UNEP, 2012), high levels of sulphur ions were detected at several sites in Indonesia, but this
was mainly attributable to the large amounts of precipitation. The desk study and fieldwork
revealed insufficient data availability on air emissions from the chemical industry in Indonesia.
It is therefore not possible to make any conclusive statement on this issue.
Planning
The government authorities have developed a national action plan to reduce emissions
(Presidential Regulation number 61/2011). The plan focuses on problematic and energy
intensive industries, namely basic metals, cement, pulp and paper, glass and ceramics, fertilizers,
petrochemicals, food and beverages, textiles and basic chemicals. The Ministry of Industry and
the Ministry of the Environment have undertaken several studies on these issues and published
assessment reports on each industry. Transportation infrastructure and the effect on logistics is
one area that is particularly problematic. Any evidence of action being taken to date is very
limited.

43
Operation
Blank spots: The desk study and fieldwork revealed insufficient data availability on efforts to
reduce air emissions in the chemical industry in Indonesia. It is therefore not possible to make
any conclusive statement on air emission management in Indonesia.
Monitoring
Civil society and NGOs have raised concerns regarding the negative impact of coal plants, citing
health issues (respiratory diseases) and loss of livelihood. Indonesia used 3,280.000 metric tons
of coal in 2008, ranking fourth in the world for coal consumption by the chemical industry. Also,
Indonesia is the second largest coal exporter in the world – after Australia – and coal is hence
considered a driver of economic development by the government authorities. Eight-five percent
of Indonesia’s coal is exported, with the remainder being used domestically, although the
country’s reserves are depleting.
Companies that collect energy efficiency and waste minimization data are accorded the ‘Green
status’, whilst more advanced, high performing firms are awarded the ‘Gold status’.
Education
Blank spots: The desk study and fieldwork revealed insufficient data availability on instruments,
techniques, education programmes or best practices that are shared between government
authorities, industry and the local population. It is therefore not possible to make a conclusive
statement on air emission education in Indonesia.

44
Summary
Figure 13 Air emission analysis of the chemical industry in Indonesia
3.3.4 Solid waste
Constraints
Blank spots: The desk study and fieldwork revealed insufficient data availability on solid waste
management in the chemical industry in Indonesia. It is therefore not possible to make any
conclusive statement on the constraints Indonesia faces with regard to solid waste management.
Planning
From the authorities’ point of view, understanding the required domestic solid waste landfill
capacity necessitates two types of data from industry: future demand projections (future
constraints) and investment plans. Although this data is available, there is currently no adequate
system for collecting and collating such data and future projections are consequently
extrapolations from current states, which themselves are often poorly evidenced.
Operation
According to government authorities, the Basel Convention Regional Centre for South-East Asia
helps them manage the hazardous components of waste from all industries and other activities.
In addition, according to the Ministry of Environment, it is authorized to determine standards for
each industry with regard to waste. It is not clear how often this actually occurs across the
chemical sector.

45
Monitoring
According to the Centre for Green Industry within the Ministry of Industry, the enforcement of
waste management in the industrial sector is adequate.
Education
Blank spots: The desk study and fieldwork revealed insufficient data availability on instruments,
techniques, education programmes or best practices that are shared between government
authorities, industry and the local population. It is therefore not possible to make any conclusive
statement on solid waste education in Indonesia.
Summary
Figure 14 Solid waste analysis of the chemical industry in Indonesia
3.3.5 Wastewater
Constraints
Blank spots: The desk study and fieldwork revealed insufficient data availability on wastewater
management in the Indonesian chemical industry. It is therefore not possible to make any
conclusive statement on this issue.
Planning
From the authorities’ point of view, understanding the required domestic wastewater treatment
capacity necessitates two types of data from industry: future demand projections (future
constraints) and investment plans. Although this data is available, there is currently no adequate
system for collecting and collating such data and future projections are therefore extrapolations

46
from current states, which themselves are often poorly evidenced. Wastewater is particularly
challenging as the quantity and quality across many dimensions is estimated to obtain a licence
to operate, but is rarely checked. Therefore, emissions to local rivers or groundwater are poorly
understood, and forward planning is problematic.
Operation
According to the Ministry of Environment, it has introduced standards on wastewater, but it is
unclear how the standards are assessed, how frequently and whether the system of
rewards/punishment is effective.
Monitoring
According to the Centre for Green Industry within the Ministry of Industry, the enforcement of
regulations on wastewater management in industry is adequate. Industry can gain a good
reputation and marketing value locally through improved environmental performance and by
obtaining green labels. Recognizing the importance of clean water, NGOs and the local
population have been campaigning for ‘Toxic free water’. The campaign focuses on the
Ciliwung River, which accounts for 80 percent of Jakarta’s water supply. The region
surrounding the Ciliwung River is where 20 percent of Indonesia’s industry is located.
Education
Blank spots: The desk study and fieldwork revealed insufficient data availability on educational
programmes relating to wastewater management in Indonesia’s chemical industry. It is therefore
not possible to make any conclusive statement on this issue.

47
Summary
Figure 15 Wastewater analysis of the chemical industry in Indonesia
Social assessment
3.3.6 Labour
Constraints
The education system in Indonesia is deemed to be adequate for the country’s needs. However, it
was also reported that the country is facing a “brain drain” problem, especially to the Middle
East.
Planning
Blank spots: The desk study and fieldwork revealed insufficient data availability on the planning
of labour needs for Indonesia’s chemical industry. It is therefore not possible to make any
conclusive statement on this issue.
Operation
Blank spots: The desk study and fieldwork revealed insufficient data availability on the efforts
being undertaken by government authorities, industry and the local population to improve
working conditions. It is therefore not possible to make any conclusive statement on the labour
management system in Indonesia.

48
Monitoring
Blank spots: The desk study and fieldwork revealed insufficient data availability on the planning
of future labour management and skill needs for the Indonesian chemical industry. It is therefore
not possible to make any conclusive statement on this issue.
Education
Blank spots: The desk study and fieldwork revealed insufficient data availability on the level of
education required by the workforce of Indonesia’s chemical industry. It is therefore not possible
to make any conclusive statement on this issue.
Summary
Figure 16 Labour analysis of the chemical industry in Indonesia
3.4 The Philippines
Environmental assessment
3.4.1 Energy
Constraints
According toindustry, ‘reliability/availability of power’ and ‘energy costs’ may represent
potential constraints on national environmental and social aspects.
Planning
The Ministry of Energy is in charge of energy regulations and planning. Government authorities
have created industrial zones in which to concentrate industries, away from residential areas and
with adequate facilities. Industry reported that various energy efficiency programmes have been

49
implemented, such as ‘Waste Plastic to Fuel’, but little evidence of cooperation was found
between government authorities, industry and the local population in the development of energy
supply plans. No information on the use of any form of sustainability indices to monitor
environmental performance was found either at national or international level.
Local NGOs and international organizations produce energy research reports on energy use
patterns and energy efficiency at the country level, including ‘Resource Efficiency: Economic
Outlook for Asia-Pacific’ (UNEP, 2012) or ‘Shaping Policy Reform and Peer Review in
Southeast Asia: Integrating Economies amid Diversity’ (OECD, 2008).
According to ‘Resource Efficiency: Economic and Outlook for Asia-Pacific’ (UNEP, 2012), the region
should strengthen existing fiscal and financial instruments to incentivize renewable energy development
in the Asia-Pacific region. Tax incentives, while not prominent in China, are widely used in India to
attract investment. Renewable energy funds in various forms are used in economies such as China, India,
Australia, New Zealand and the Philippines to support renewable energy development. Various forms of
subsidies are also currently being implemented.
Furthermore, according to ‘Shaping Policy Reform and Peer Review in Southeast Asia: Integrating
Economies amid Diversity’ (OECD, 2008), the energy development package will develop biofuels and
renewables like wind, solar and geothermal energy. It will also promote oil and gas exploration, enhance
energy conservation through the use of energy-efficient technologies and optimize privatization of the
energy industry. In 2006, Congress passed the Philippine Biofuels Act which provides fiscal incentives
to companies producing and selling biofuel-blended petrol and diesel.
Operation
According to industry, energy is not a hotspot as it accounts for only 4 percent of national
demand. Some petrochemical producers have their own power plants to deal with blackouts due
to breakdowns of the national grid.
Monitoring
While a wide range of environmental regulations exist in the Philippines, government authorities
acknowledge that there is a lack of manpower to effectivley enforce the regulations. The country
therefore heavily relies on the role of CSOs to report environmental offences. In addition,
concern about being sued when violating environmental regulations is widespread and acts as a
deterrent.

50
Education
Blank spots: The desk study and fieldwork revealed insufficient data availability on the efforts
undertaken by government authorities, industry and the local population to educate one another
with regard to energy issues in the chemical industry. It is therefore not possible to make any
conclusive statement on the education system on energy in the Philippines.
Summary
Figure 17 Energy analysis of the chemical industry in the Philippines
3.4.2 Water supply
Constraints
Blank spots: The desk study and fieldwork revealed insufficient data availability on the chemical
industry’s water demand and how this information is shared among stakeholders. It is therefore
not possible to make any conclusive statement on the education system on water issues in the
Philippines.
Planning
The government authorities believe that if the chemical industry grows, water demand will rise,
increasing competition between industrial and household demand. The Philippines does not
apply any form of sustainability index for international comparison. According to the report
‘Green Growth, Resources and Resilience’ (ESCAP/ADB/UNEP, 2012), the Philippines faces
an urgent sustainability challenge with regard to water supply. Specific problems the Philippines
is facing include ‘increasing water scarcity’, ‘deteriorating water quality’ and the fact that the
Philippines is a ‘flood-prone’ and ‘Cyclone-prone’ country.

51
Operation
Blank spots: With reference to water supply planning, it is not clear to what extent knowledge
regarding operations in the chemical industry is shared between government authorities, industry
and the local population. Additional information is needed to understand how knowledge of
operations is shared among different stakeholders.
Monitoring
While a wide range of environmental regulations exists in the Philippines, government
authorities acknowledge that there is a lack of manpower to effectively enforce the regulations.
The country therefore heavily relies on the role of CSOs to report environmental offences. In
addition, concern about being sued when violating environmental regulations is widespread and
acts as a deterrent.
Education
Blank spots: The desk study and fieldwork revealed insufficient data availability on efforts being
undertaken by government authorities, industry and the local population to share information on
water issues in the chemical industry. It is therefore not possible to make any conclusive
statement on education systems related to water in the Philippines.
Summary
Figure 18 Water supply analysis of the chemical industry in the Philippines

52
3.4.3 Air emissions
Constraints
According to the report ‘Resource Efficiency: Economic and Outlook for Asia-Pacific’ (UNEP,
2012), a high level of deposits of sulphur ions were detected at several sites in the Philippines.
This is attributable in part by the use of coal in chemical plants, but the high concentrations were
mainly due to the large amounts of precipitation in those areas. This is likely to continue, unless
major changes are made and represents a limiting factor in the growth of the chemical industry
in the Philippines.
Planning
It was reported that the commitments made to reducing GHG emissions are felt to be too
stringent and may affect economic growth. It is not clear how the Philippine chemical industry
participates in the policymaking process and how involved the local population or NGOs are.
Despite the existence of international reports funded by UN agencies such as ‘Resource
Efficiency: Economic Outlook for the Asia-Pacific’ (UNEP, 2012), it is not clear to what extent
the local population and industry utilize the data from these international reports in the process
of designing policies on air emissions.
Operation
Blank spots: The desk study and fieldwork revealed insufficient data availability on the efforts
being undertaken by government authorities, industry and the local population to educate one
another and improve operational competence with regard to air emissions in the chemical
industry. It is therefore not possible to make any conclusive statement on the operation system
related to air emissions in the Philippines.
Monitoring
Government authorities tend to believe that the threat of legal action suffices to ensure that
industry and individuals conform to the regulations set down. In addition, the authorities are
aware that harassment and petty corruption is a feature of the energy industry.
While a wide range of environmental regulations exist in the Philippines, government authorities
acknowledge the lack of manpower to effectively enforce the regulations. The country therefore
heavily relies on the role of CSOs to report environmental offences. In addition, concern about
being sued when violating environmental regulations is widespread and acts as a deterrent. There
is a national monitoring programme for total suspended particulate (TSP), whilst other initiatives

53
include the Air Quality Management Fund and the Metro Manila Air Quality Improvement
Sector Development Program (MMAQISDP).
National total suspended particulate (TSP) monitoring from 2003 to 2007 showed a 33 percent
improvement over the four-year period, with concentrations decreasing from 144 micrograms per
normal cubic meter (µg/Ncu.m) to 97 µg/Ncu.m. Although the concentration of chemicals is
decreasing, TSP geometric mean concentrations are still above the 90 µg/Ncu.m. annual mean TSP
guideline value for one year averaged over time. As such, more efforts are necessary to comply with the
guidelines, as set out in the General Plan of Action for Air Quality Management.
The Air Quality Management Fund (AQMF) was established as a special account in the National
Treasury to be administered by the DENR to finance government containment, removal and clean-up
operations in air pollution cases; guarantee restoration of ecosystems and rehabilitate areas affected by
the acts of CAA violators; and support research, enforcement, monitoring activities and capabilities of
the relevant agencies pursuant to Section 14 of the Philippine Clean Air Act of 1999. The AQMF can
also be used by the Airshed Governing Boards. The AQMF was assigned Fund Code 155 by the
National Bureau of Treasury (BTr) in April 2004.
The Metro Manila Air Quality Improvement Sector Development Program (MMAQISDP) is an Asian
Development Bank (ADB) loan-financed programme implemented by various national government
agencies headed by the DENR. Its general objective is to promote policy reforms to improve air quality
through the reduction and control of mobile and stationary sources of air pollution. It focuses on the
Metro Manila air shed, the location of the main concentrations of air pollution, but policies developed
have nationwide implications and/or may be replicated in other airsheds.
Education
Blank spots: The desk study and fieldwork revealed insufficient data availability on the efforts
being undertaken by government authorities, industry and the local population to educate one
another on air emissions in the chemical industry. It is therefore not possible to make any
conclusive statement on the education system on air emissions in the Philippines.

54
Summary
Figure 19 Air emission analysis of the chemical industry in the Philippines
3.4.4 Solid waste
Constraints
There are some examples on the valorization of waste, e.g. fertilizer companies turning gypsum
into cement. However, as waste disposal is not very expensive, incentives to valorize waste are
also relatively low. Many open dumps were reported to still exist, despite the availability of
landfills.
Planning
Industry has implemented various efficiency programmes such as ‘Waste Plastic to Fuel’. It was,
however, reported that no guidance on waste minimization or waste management is offered to
industry; nor does a sustainability index exist that enables national and international comparison.
Operation
Although solid waste management is managed at the local government level, the Department of
Natural Resources has initiated the Responsible Care programme, requiring landfills to be
established. Yet many open dumps still exist because landfill sites are filling up quickly. It was
reported that the disposal of waste is not considered to be expensive and there is therefore little
incentive, other than the intrinsic value, to valorize waste.
Nevertheless, some general examples of waste valorization were noted, with schemes including
the resale of waste generated during shutdowns, the use of unconverted monomers as power
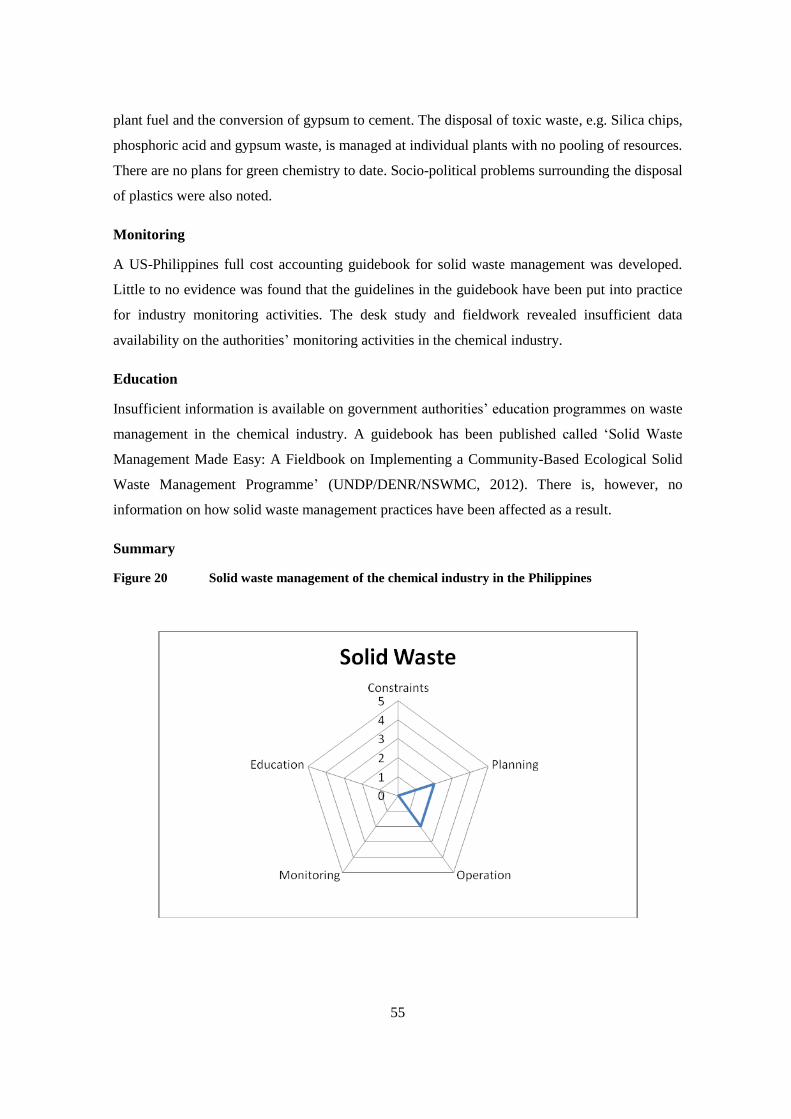
55
plant fuel and the conversion of gypsum to cement. The disposal of toxic waste, e.g. Silica chips,
phosphoric acid and gypsum waste, is managed at individual plants with no pooling of resources.
There are no plans for green chemistry to date. Socio-political problems surrounding the disposal
of plastics were also noted.
Monitoring
A US-Philippines full cost accounting guidebook for solid waste management was developed.
Little to no evidence was found that the guidelines in the guidebook have been put into practice
for industry monitoring activities. The desk study and fieldwork revealed insufficient data
availability on the authorities’ monitoring activities in the chemical industry.
Education
Insufficient information is available on government authorities’ education programmes on waste
management in the chemical industry. A guidebook has been published called ‘Solid Waste
Management Made Easy: A Fieldbook on Implementing a Community-Based Ecological Solid
Waste Management Programme’ (UNDP/DENR/NSWMC, 2012). There is, however, no
information on how solid waste management practices have been affected as a result.
Summary
Figure 20 Solid waste management of the chemical industry in the Philippines

56
3.4.5 Wastewater
Constraints
From the information collected, the water footprint was not being used as a marketing tool due
to a lack of interest/demand in the domestic market.
Planning
The Department of Natural Resources initiated the Responsible Care programme. Industrial
zones in which to concentrate industries, located away from residential areas with adequate
utilities, were also established by the authorities. No information was found during the desk
study or the fieldwork on the use of any form of sustainability indices to monitor environmental
performance, either at national or international level.
Operation
Saving wastewater with a closed loop water system was in place in some firms. Industry argues
that the regulatory landscape suffers from both over-regulation and overlap between
environmental regulations developed by the national and local governments.
Monitoring
Blank spots: The desk study and fieldwork revealed insufficient data availability on the methods
of monitoring wastewater management in the chemical industry. It is therefore not possible to
make any conclusive statement on the Philippine’s wastewater monitoring systems.
Education
Blank spots: The desk study and fieldwork revealed insufficient data availability on education
relating to water management in the chemical industry. It is therefore not possible to make any
conclusive statement on water management education programmes in the Philippines.

57
Summary
Figure 21 Wastewater analysis of the chemical industry in the Philippines
Social assessment
3.4.6 Labour
Constraints
Labour skills have been identified as a key issue in the chemical industry. Whilst the cost of
labour is considered relatively high, skill levels productivity and the general quality of labour is
low. These factors and the high turnover of personnel in chemical firms indicate that effective
training is a key requirement in the industry. Philippine salaries are considered non-competitive
because skilled workers, e.g. engineers, can obtain far higher salaries (by up to 4 times) working
abroad, resulting in ‘brain-drain’ to higher wage economies (e.g. the Middle East).
Planning
Government authorities plan to offer scholarships to support universities in the Philippines in
developing next generation industry leaders. However, little evidence was found of how the
government authorities, industry and the local population intend to collaborate to develop such a
plan.
International reports on the Philippines’ education system have been published, such as ‘Shaping
Policy Reform and Peer Review in Southeast Asia: Integrating Economies amid Diversity’
(OECD, 2008) and ‘Skills Development Pathways in Asia: Employment and Skills Strategies in
Southeast Asia’ (ESSSA) (OECD, 2012). The key recommendation with regard to labour based

58
on these reports is that under- and unqualified instructors and outdated training systems in the
Philippines require upgrading.
‘Shaping Policy Reform and Peer Review in Southeast Asia: Integrating Economies amid Diversity’
(OECD, 2008): the Philippines has long attempted to eradicate poverty in its poorest region of
Mindanao. Inequality has been persistent in countries that have the highest levels of poverty such as the
Philippines.
‘Skills Development Pathways in Asia: Employment and Skills Strategies in Southeast Asia’ initiative
(ESSSA) (OECD, 2012): Reducing skills mismatches and increasing the links between training and
industry needs: the Philippines is seeking to strengthen industry education and training linkages with a
focus on an enterprise-based training system.
The quality of skills training and creation of vocational pathways for high school leavers must be
guaranteed. In the Philippines, despite the high unemployment rate among college graduates, vocational
training paths are not chosen and high school graduates and their parents value academic studies over
vocational studies, aiming for white collar jobs unrelated to industry demands. There is also a high
share of low-skilled workers in the Philippines who are faced with demands to improve their skill level.
The share of micro, small and medium-sized enterprises (MSMEs) is large in the Philippines,
accounting for 70 percent of total employment, 30 percent of total sales and value-added in
manufacturing and 25 percent of total exports. The demand for training in the Philippines is two-fold:
existing and potential entrepreneurs need business skills and knowledge to be competitive in the world
market, particularly in financing, marketing, technology and human resources development; and the
MSME staff need to be trained in the skills required in technology intensive industries and in improving
productivity. The needs are even higher for smaller MSMEs. However, employer-provided training is
very limited and the following constraints have been cited: insufficient access to finance, poor
information on training needs, low perception of formal training and lack of training facilities.
Government and education and training institutions, both public and private, are the major providers of
the required skills training for MSMEs, with the Technical Education and Skills Development
Authority (TESDA) is the lead government agency for managing TVET.
Operation
From industry’s point of view, labour regulations are excessively stringent, limiting the
flexibility of operations by making it difficult to shift labour when necessary and making it
difficult to close companies. High workforce turnover of around 50 percent per annum puts
pressure on training programmes within firms to maintain a properly skilled workforce. Industry
would benefit from university researchers with stronger connections to industry.

59
Monitoring
Blank spots: The desk study and fieldwork revealed insufficient data availability on the
monitoring methods of labour requirements within the chemical industry. It is therefore not
possible to make any conclusive statement on the monitoring of labour needs in the Philippines.
Education
Blank spots: The desk study and fieldwork revealed insufficient data availability on training
methods in the chemical industry. It is therefore not possible to make any conclusive statement
on the need for employee training in the Philippines’ chemical industry.
Summary
Figure 22 Labour analysis of the chemical industry in the Philippines
3.5 Thailand:
Environmental assessment
3.5.1 Energy
Constraints
Independent power plant production is a government policy designed to help cope with demand.
It encourages private sector investment in power plants. A complicated tariff structure is
controlled by national energy, with prices based on the basis of demand.
Planning
Considerable efforts have been made on the part of the government authorities to establish a
national energy plan, including subsidies, a pricing policy and the use of alternative energy

60
sources. The Metropolitan Electricity Authority (MEA) analyses the load factors for customers
and helps improve them to ensure that the load is acceptable. The ten industries with poor energy
efficiency were identified as department stores (retail), automotive tyre production, metal for
construction, home appliance manufacture, paper, cardboard and packaging, wire, automotive
assembly, plastics and textiles. Government energy efficiency targets are set by industry in a 20-
year plan (2010-2030), with the aim of reducing energy intensity by 25 percent over the period,
although this has not yet been implemented.
It is generally considered easy to operate as energy capacity exceeds demand by over 10 percent.
The top energy consumers are commercial services and industry, representing approximately 30
percent of demand, and residential. Calls are being made to expand the grid to support
commercial services, but insufficient funds are available to invest. In total, Thailand has 400,000
manufacturing units with MEA covering around 10,000 medium and large units and 100,000
small units.
Department of Alternative Energy Development and Efficiency (DEDE)
The DEDE has set targets to reduce energy intensity by 25% over the 20-year period from
2010 to 2030. These targets vary across sectors, with industry and transport having to reduce
their energy intensity by 35% to meet the targets. An energy conservation programme based
on ISO15001 targets 3,500 factories that use more than 1 MW. These factories are required to
submit annual energy management reports, perform annual audits and designate a person
responsible for energy (PRE). Factory breakdowns by industry will be published. Accredited
consultants will recommend energy saving measures, although no targets will be set. The
Department will provide the PREs with energy efficiency trainings, including the
dissemination of benchmarks and good practices. In addition, an alternative energy
development plan sets a target of a 25% increase in alternative energy provision. Incentives
have also been introduced for small and very small power producers. The overall aim is to
reduce reliance on imported energy, although no specific target has been determined.
Operation
The Electricity Generating Authority of Thailand (EGAT) is responsible for electricity
generation in Thailand, although distribution is carried out regionally by the Metropolitan
Electricity Authority (MEA) and the Provincial Electricity Authority (PEA). Industry consumes
52 percent of total energy, and whilst GDP is growing at between 2 percent and 3 percent
annually, regular electricity demand has been growing 5 percent annually. Demand side

61
management aims to minimize energy consumption, and energy efficient appliances (level 5)
for the home are being encouraged. A time of use (TOU) tariff is also employed with a 30-40
percent variation in price/usage. The reliability of current electricity supply is very good, and is
actually higher than that in the USA. The first 50 units of electricity are free; prices then range
between 3.28 BHT for residential customers and 3.502 BHT for industrial consumers.
The maximum limit for imported electricity is 15 percent with current imports of electricity
(from Laos and Malaysia) at around 10 percent. Renewables (including small hydro, wind solar
and biomass) account for 5 percent of Thailand’s electricity supply and hydro accounts for a
further 10 percent. Local NGOs call for renewables to be given priority; others suggest that
growth opportunities in solar should be limited as this could increase tariffs by 10 percent.
Seventy percent of the country’s gas supply is purchased from Myanmar. Whilst the long-term
plan was to move towards nuclear energy, it has been postponed in the light of the Fukushima
crisis in Japan. The ASEAN’s masterplan is ultimately to connect the members’ grids together.
Monitoring
Local NGOs have pointed out the following problems:
a. Steel and petrochemicals, in particular, consume a lot of energy and cause environmental
damage, leading to destructions of local communities.
Thailand only has scarce natural resources available for those industries.
b. All those industries have a tendency to move towards coastal areas, which causes
environmental damage in those areas (fisheries) and leads to social problems, e.g., the
immigration of workers from neighbouring countries, who work for less than the
minimum wage.
Local NGOs also argue that environmental standards in Thailand are very low in comparison to
other countries’, and thus allow companies to ‘legally’ pollute. Companies do not provide full
public disclosure on how they comply with environmental standards. Moreover, the ‘policing’ of
industries is very weak, with penalties only having been imposed on a few industries. Local
NGOs assert that they support industrialization, but only if locals benefit from it.
Education
Blank spots: The desk study and fieldwork revealed insufficient data availability on energy
education in the chemical industry. It is therefore not possible to make any conclusive statement
on energy management education programmes in Thailand.

62
Summary
Figure 23 Energy analysis of the chemical industry in Thailand
3.5.2 Water supply
Constraints
Government departments, such as the Pollution Control Department, acknowledge the current
water problem: water extraction is close to carrying capacity in most areas, hence water intensive
industries are a key issue. Poor waste infrastructure for municipal waste means that there are
potential opportunities for new industries to take root in this field.
Water infrastructure poses a particular problem for small enterprises. However, government
authorities do not have specific industry-level water demand and supply data. Water authorities
have water data related to geography rather than industries. As in other countries, a firm that
wants to build factories in Thailand needs to submit a permit request to the Department of
Groundwater Resources. In the permit document, the firm needs to report its total water
consumption per day and identify its water source (i.e. provide a water supply plan). However, it
does not seem that these water consumption plans are being collected at the level of industry.
In Thailand there is no central unit that oversees water. Responsibility is divided for different
areas across multiple organizations, including the Irrigation Department, East Water, River
Basin Management and the Department of Industrial Works.

63
Planning
According to the report, ‘Green Growth, Resources and Resilience’ (ESCAP/ADB/UNEP,
2012), Thailand is one of the countries with the most urgent sustainability challenges in relation
to water.
The Department of Water Resources sets standards on effluent discharge and pollution control
for each industry. The Department is also responsible for monitoring these activities in the main
rivers. There are plans to increase water capacity by constructing more damsdespite the existing
physical constraints to this activity. Another option to increase capacity is to transfer water from
neighbouring countries, e.g. Myanmar and Cambodia. There is no fixed policy on water transfer,
but has been used before. In the period 2000 – 2005, there were serious water shortages in the
eastern part of the country (river basin Easter Coast). A scheme by East Water (a water
management company) was put in place to transfer water from other regions into this area. This
resulted in major protests. Transfer of water from the Mekong river basin is being considered to
supply Bangkok with water. Data for specific industries is not available, though the Institute for
Sustainable Water at the Federation of Thai Industries collects some data. Some industries use
groundwater and although there are plans to use different sources, these have not yet been
implemented.
Local NGOs underscore the following problems:
a. Steel and petrochemicals, in particular, cause environmental damage, leading to the
destruction of local communities.
b. Thailand has scarce natural resources available for those industries.
c. All those industries tend to move towards coastal areas, which causes environmental
damage in those areas (fisheries).
Local NGOs also argue that Thailand’s environmental standards are very weak in comparison to
other countries and that legalized pollution is common among companies in Thailand. Local
NGOs note that they support industrialization, but only if it benefits the local population.
Operation
Blank spots: The desk study and fieldwork revealed insufficient data availability on water supply
operation and maintenance activities in the chemical industry. It is therefore not possible to make
any conclusive statement on energy management education programmes in Thailand.
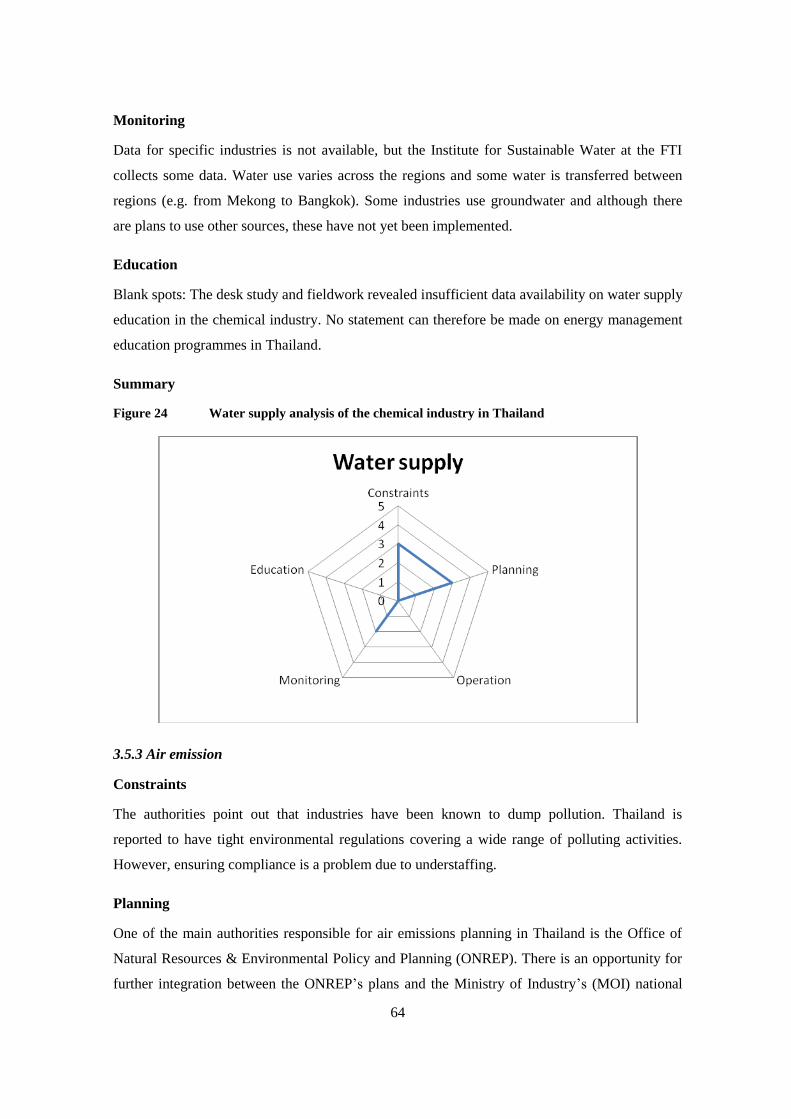
64
Monitoring
Data for specific industries is not available, but the Institute for Sustainable Water at the FTI
collects some data. Water use varies across the regions and some water is transferred between
regions (e.g. from Mekong to Bangkok). Some industries use groundwater and although there
are plans to use other sources, these have not yet been implemented.
Education
Blank spots: The desk study and fieldwork revealed insufficient data availability on water supply
education in the chemical industry. No statement can therefore be made on energy management
education programmes in Thailand.
Summary
Figure 24 Water supply analysis of the chemical industry in Thailand
3.5.3 Air emission
Constraints
The authorities point out that industries have been known to dump pollution. Thailand is
reported to have tight environmental regulations covering a wide range of polluting activities.
However, ensuring compliance is a problem due to understaffing.
Planning
One of the main authorities responsible for air emissions planning in Thailand is the Office of
Natural Resources & Environmental Policy and Planning (ONREP). There is an opportunity for
further integration between the ONREP’s plans and the Ministry of Industry’s (MOI) national

65
20-year plan. ONREP uses both policy and regulations to fulfil its mandate, with a clear priority
sequence in area planning: air pollution, water pollution, landfill and water extraction.
Operation
Blank spots: The desk study and fieldwork revealed insufficient data availability on efforts
undertaken by industry, authorities and the local population to reduce air emissions. It is
therefore not possible to make any conclusive statement on water operation systems in Thailand.
Monitoring
Emissions are continuously monitored by government departments, such as the Department of
Industrial Works and the Department of Pollution Control. Authorities are aware that industries
dump pollution. Thailand is reported to have tight environmental regulations covering a wide
range of polluting activities. However, ensuring compliance is a problem due to understaffing.
Education
Blank spots: The desk study and fieldwork revealed insufficient data availability on air emission
prevention tools, techniques, education programmes or best practices in the chemical industry,
which is shared between authorities, industry and the local population. It is therefore not possible
to make any conclusive statement on air emission education in Thailand.
Summary
Figure 25 Air emission analysis of the chemical industry in Thailand

66
3.5.4 Solid waste
Constraints
The authorities are aware that industries dump pollution. Thailand is reported to have tight
environmental regulations covering a wide range of polluting activities. However, ensuring
compliance is a problem due to understaffing.
Planning
A Strategic Impact Assessment has been developed for the area to encourage the waste recycling
industry to begin operating.
Operation
Large companies such as PTT undertake considerable efforts to reduce their solid waste: PTT
has achieved a reduction of approximately 60 percent; however, this requires a much more
extensive collaboration with every firm in the supply chain. It is unclear to what extent local
SMEs, in particular firms not supplying large companies, are undertaking efforts to reduce solid
waste to landfills.
Examples of waste treatment on industrial properties include:
o Central wastewater plant in each region
o Incinerators for general waste
o Central Disposal Unit in some areas for hazardous waste – IEA control
transportation to the facility.
Monitoring
The authorities are aware that industries dump waste. Thailand is reported to have tight
environmental regulations covering a wide range of polluting activities. However, ensuring
compliance is a problem due to understaffing.
The authorities are of the opnion that the amount of waste being collected and transported from
facilities is problematic. Moreover, the collection system itself is considered problematic. The
authorities think that better systems for the collection of waste and increases in the capacity of
waste treatment should be implemented to improve solid waste management. The Department of
Industrial Works has a system in place to collect data on how much waste a factory generates. It
also compiles data on the amounts of waste factories transport outside of their boundaries. The
Department of Industrial Works needs to define industrial waste in a way that is consistent with
industrial standards; currently, it is using a range of their own definitions.

67
Education
Blank spots: The desk study and fieldwork revealed insufficient data availability on solid waste
management tools, techniques, education programmes or best practices in the chemical industry
that are shared between authorities, industry and the local population. It is therefore not possible
to make any conclusive statement on energy-related education in Thailand.
Summary
Figure 26 Solid waste analysis of the chemical industry in Thailand
3.5.5 Wastewater
Constraints
The authorities are aware that industries dump pollution. Thailand is reported to have tight
environmental regulations covering a wide range of polluting activities. However, ensuring
compliance is a problem due to understaffing.
Planning
Government departments such as the Department of Water Resources, the Ministry of Natural
Resources and the Royal Irrigation Department have worked together to develop a water
management plan. Various elements of the plan include the centralization of water regulations,
the preservation of natural water resource areas, wet land preservation, general improvements
and the building of small reservoirs in rural areas. However, it is unclear to what extent the
chemical industry and local population, including NGOs, are participating in the planning
activities related to wastewater management. Moreover, the authorities do not have data to
analyse specific industries. Companies do not provide full public disclosure on how they comply

68
with environmental standards. At the same time, the ‘policing’ of industries is very weak,
demonstrated by the fact that penalties for pollution have only been imposed on a few industries.
Operation
There is a wastewater collection system in place: if a given factory breaches the applicable
regulations, the authorities can fine the offender and a number of other sanctions may be applied.
Monitoring
The authorities are aware that industries dump pollutants. Thailand is reported to have tight
environmental regulations covering a wide range of polluting activities. However, ensuring
compliance is a problem primarily due to understaffing, but also due to limitations in terms of
technical equipment and training.
Local NGOs argue that environmental standards in Thailand are very weak in comparison to
other countries, and opens the possibility of ‘legalized’ pollution. Companies do not provide full
public disclosure on how they comply with environmental standards. At the same time, the
‘policing’ of industry is very weak and only few industries have been penalized to date. Local
NGOs add that they support industrialization, but only where it benefits the local population.
Education
Blank spots: The desk study and fieldwork revealed insufficient data availability on wastewater
management tools, techniques, education programmes or best practices in the chemical industry
that are shared between authorities, industry and the local population. It is therefore not possible
to make any conclusive statement on energy-related education in Thailand.

69
Summary
Figure 27 Wastewater analysis of the chemical industry in Thailand
Social assessment
3.5.6 Labour
Constraints
University graduates have to settle for jobs for which they are overqualified. Some graduates
refuse to compromise and consequently either remain unemployed or migrate. Low-skilled jobs
are increasingly being performed by migrant workers, a situation which has the potential of
causing social problems in the future.
Planning
The Department of Skills Development (DSD) offers pre-employment training for school drop-
outs. This training programme is an alternative to secondary education but has poor recognition.
The DSD also provides the opportunity for employees to enhance their skills, e.g. training for
entrepreneurship for domestic staff. The authorities do not keep track of the educational profiles
of employees in the manufacturing industry, but keep track of how many people employed in
different industries have graduated from skills training programmes. Local NGOs add that they
support industrialization, but only where it benefits the local population.
Operation
Blank spots: The desk study and fieldwork revealed insufficient data availability on efforts
undertaken by industry, authorities and the local population to reduce deaths, accidents and child

70
labour and to provide generic training. It is therefore not possible to make any conclusive
statement on labour in Thailand’s operation systems.
Monitoring
Blank spots: The desk study and fieldwork revealed insufficient data on the efforts undertaken
by industry, authorities and the local population to monitor labour conditions and activities. It is
therefore not possible to make any conclusive statement on Thailand’s labour monitoring
systems.
Education
Blank spots: The desk study and fieldwork revealed insufficient data availability on efforts
undertaken by industry, authorities and the local population to monitor labour conditions and
activities. It is therefore not possible to make any conclusive statement on the labour education
systems in Thailand.
Summary
Figure 28 Labour analysis of the chemical industry in Thailand

71
3.6 Viet Nam
Environmental assessment
3.6.1 Energy
Constraints
The economy has an overall growth rate of 6 percent to 10 percent annually, with the chemical
industry being a major contributor. The production of nitrogenous and phosphate-based
fertilizers has increased from 100,000 tonnes/year up to 2,000,000 tonnes/year, with
diammonium phosphate (DAP) alone accounting for 300,000 tonnes/year. Domestic production
is able to supply 100 percent of nitrogenous and phosphate fertilizer and 30 percent of organic
fertilizer needed domestically. Petrochemical processing and production has developed rapidly
and petrochemicals are produced for input into other industries. Plastics production has a growth
rate of between 30 percent and 40 percent whilst an increase has also been observed in rubber,
battery and detergent production.
Petroleum chemical processing and production have developed rapidly and
petrochemicals produced supply production of other goods.
Many improvements have been made in other industries such as rubber, battery,
detergents, etc.
Plastic production achieved a growth rate of between 30 percent and 40 percent.
It seems that the government, industry and local population are very well aware of the increased
energy demand in the chemical industry.
Planning
The government has focussed considerable efforts on the development of energy plans across a
range of issues; however, there is little evidence of the authorities exchanging information with
the chemical industry and the local population, including NGOs on the issue of energy supply to
the chemical industry. The significance of the chemical industry is apparent, as it produces a
wide range of chemicals, such as fertilizers and nitrogenous fertilizers, which can replace
imported ones.
Operation
Chemical companies routinely seek to enhance their energy supply and energy efficiency.
Financial investments are often required to save energy or to improve energy supply. However,
the majority of SMEs do not have sufficient access to capital to adopt new energy saving
technologies.

72
The United Nations Industrial Development Organization (UNIDO) introduced an energy
productivity programme in various industries including Viet Nam’s rubber and pulp industries:
the project with a budget of US$ 62 million funded by the Global Environmental Fund was
launched in May 2011.
Monitoring
There are no financial incentives for companies to comply with the regulations issued by the
government authorities and there is little government monitoring of energy supply and
efficiency. There is also very little evidence of the involvement of the local population or NGOs
in the monitoring of the chemical industry’s energy saving activities, although international
entities do play a significant role.
Education
Blank spots: The desk study and fieldwork revealed insufficient data availability on energy
supply, energy efficiency tools, techniques, education programmes or best practices in the
chemical industry which are shared between government authorities, industry and the local
population. It is therefore not possible to make any conclusive statement on energy-related
education in Viet Nam.
Summary
Figure 29 Energy analysis of the chemical industry in Viet Nam

73
3.6.2 Water supply
Constraints
The chemical industry considers some of the government’s environmental policies and
regulations burdensome; as these are largely regarded as being “formalities”, they do not have a
significant practical impact. Industry asserts that a good policy can be helpful for enterprises but
that they sometimes also face financial burdens and tax problems related to environmental
regulations.
Planning
Although it seems that considerable efforts have been made by the government authorities to
formulate water supply plans, little evidence was found as to how the chemical industry and the
local population (including NGOs) are involved in the development of these plans. Water supply
data is only available according to local regions, not for the entire industry. This lack of data on
the chemical industry’s water demand represents an obstacle to planning water supply in the
chemical industry.
Operation
The industry representatives interviewed claimed that there is a gap between the government
authorities’ policies and industrial reality, citing the fact that environmental policies are rarely
consistently applied and do not have a clear direction. It was also noted that people working in
the chemical industry are of the opinion that some environmental regulations are too stringent
for most SMEs. It is also not clear what efforts are being undertaken by the chemical industry to
reduce their water use in operations, in particular in SMEs. Firms need to collaborate to achieve
better operation and maintenance of water supply and reduce water usage.
Monitoring
The industry representatives interviewed stated that the financial incentives for companies to
comply with regulations are low. Government monitoring of water supply is negligent. There is
also only little evidence of involvement of the local population or NGOs in the monitoring of the
chemical industry’s water supply or water usage, although international entities do play a
significant role in water supply research in general. The government authorities and the Vietnam
Chemical Industry Federation could potentially monitor or collect information on the annual
water supply or water usage of both large firms and SMEs in chemical industry, but it seems that
there is hardly any monitoring activity on SMEs’ water supply.

74
Education
Blank spots: The desk study and fieldwork revealed insufficient data availability on water
management tools, techniques, education programmes or best practices in the chemical industry,
which are shared between government authorities, industry and the local population. It is
therefore not possible to make any conclusive statement on energy-related education in Viet
Nam.
Summary
Figure 30 Water supply analysis of the chemical industry in Viet Nam
3.6.3 Air emissions
Constraints
The chemical industry considers some of the government’s environmental policies and
regulations on air emissions burdensome; however, as these are largely regarded as
“formalities”, they do not have a significant practical impact. In the interviews, industry
representatives highlighted the fact that good policies could be helpful for industry, but that
environmental taxes can be a financial burden for businesses.
Planning
Blank spots: The desk study and fieldwork revealed insufficient data availability on the
prevention of air emissions by Viet Nam’s chemical industry. It is therefore not possible to make
any conclusive statement on this issue.

75
Operation
The industry representatives interviewed are of the opinion that a gap exists between the
authorities’ policies and industries’ reality, citing environmental policies that are seldom
consistently applied and do not have a clear direction. It was also noted that people working in
the chemical industry believe that some environmental regulations are too stringent for most
SMEs.
Monitoring
The industry representatives interviewed observed that financial incentives for companies that
comply with regulations are low. Government monitoring of air emissions is negligent. There is
also only little evidence of involvement of the local population or NGOs in the monitoring of the
chemical industry’s environmental activities, although international entities do play a significant
role.
Education
Blank spots: The desk study and fieldwork revealed insufficient data availability on tools to
control air emissions, techniques, education programmes or best practices in the chemical
industry, which are shared between authorities, industry and the local population. It is therefore
not possible to make any conclusive statement on energy-related education in Viet Nam.
Summary
Figure 31 Air emission analysis of the chemical industry in Viet Nam

76
3.6.4 Solid waste
Constraints
The chemical industry considers some of the government’s environmental policies and
regulations on air emissions burdensome; however, as these are largely regarded as
“formalities”, they do not have a significant practical impact. In the interviews, industry
representatives highlighted the fact that good policies could be helpful for industry, but that
environmental taxes can be a financial burden for businesses.
Planning
It is reported that the authorities undertake considerable efforts to develop plans, strategies and
regulations on how to deal with solid waste, such as the “Policy on solid waste management in
urban and industrial areas of Viet Nam”, which was issued on 10 July 1999, in Decision
152/1999/QD-TTG of the Prime Minister and “The National Environmental Action Plan 2001 -
2005 (NEAP)”, which entails five programmes, including Programme 2 on the improvement of
solid waste management capacity, especially hazardous waste management in densely populated
urban areas and industrial zones (The Asia-Link Progamme, 2008) .
No finding was made how the authorities communicate with the chemical industry and the local
population, including NGOs, to formulate a solid waste plan for the chemical industry. The
Vietnam Institute of Industrial Chemistry is responsible for drawing up the list of chemicals
which the manufacturing and industrial sectors are allowed to use, as well as those which may be
used for food processing and agricultural production.
Operation
Many people working in industry think there is a gap between the authorities’ policies and the
needs of industry. For example, some environmental policies of the Ministry of Natural
Resources and Environment (MoNRE) are inconsistent with those of other ministries and no
clear strategy on solid waste issues has been elaborated. The chemical industry is also concerned
that some environmental parameters are too stringent for businesses to follow, and the majority
of SMEs struggle to comply with these regulations.
Monitoring
The Vietnamese government monitors the chemical industry’s hazardous waste in Viet Nam’s
major cities: 2,242 tonnes/year(Ha Noi), 3,300 tonnes/year (Hai Phong), 73 tonnes/year (Da
Nang), 5,571 tonnes/year (Ho Chi Minh City), 1,029 tonnes (Dong Nai) and 879 tonnes/year (Ba
Ria-Vung Tau) (Centre for Research Investment Consult for Rural Development, 1999).

77
There are no financial incentives for companies to comply with the regulations issued by the
government authorities. There is also limited government monitoring of solid waste.
Furthermore, there is very little evidence of how the local population or NGOs are involved in
monitoring the chemical industry’s environmental activities and the (local) solid waste it
produces.
Education
Blank spots: The desk study and fieldwork revealed insufficient data availability on solid waste
management tools, techniques, education programmes or best practices in the chemical industry,
which are shared between the government authorities, industry and the local population. It is
therefore not possible to make any conclusive statement on energy-related education in Viet
Nam.
Summary
Figure 32 Solid waste analysis of the chemical industry in Viet Nam
3.6.5 Wastewater
Constraints
The chemical industry considers some of the government’s environmental policies and
regulations on air emissions burdensome; however, as these are largely regarded as
“formalities”, they do not have a significant practical impact. In the interviews, industry
representatives highlighted the fact that good policies could be helpful for industry, but that
environmental taxes can be a financial burden for businesses.

78
Planning
Various government bodies, such as the Ministry of Industry and Trade (MOIT), the Ministry of
Agriculture and Rural Development (MARD), the Ministry of Health (MOH), the Ministry of
Science and Technology (MOST), the Ministry of Natural Resources and Environment
(MONRE), the Ministry of Defence (MOD) and the People’s Committee have participated in
chemical management policy in Viet Nam.
MONRE takes a leading role in developing the wastewater treatment plan. It is reported that the
authorities undertake considerable efforts to develop wastewater plans. However, no information
was available on how authorities communicate with the chemical industry and the local
population, including NGOs, on their wastewater plans for the chemical industry.
Operation
According to the chemical industry, there is a gap between the government authorities’ policies
and the practical realities in industry: some environmental policies are inconsistent across MOIT,
MARD, MOH, MOST, MONRE and MOD and do not provide a clear environmental strategy.
The chemical industry also deems that some environmental regulations are too restrictive, and
the majority of SMEs struggle to comply with these regulations.
Monitoring
According to the chemical industry, wastewater from the chemical sector can often be more
effectively dealt with by industry itself. People working in the private sector stated that the
authorities rarely carry out monitoring of wastewater in the chemical industry.
There are no financial incentives for companies to comply with the regulations issued by the
government authorities. Finally, there is also little evidence of how the local population or NGOs
are involved in monitoring the chemical industry’s environmental activities.
Education
Blank spots: The desk study and fieldwork revealed insufficient data availability on wastewater
management education programmes or best practices in the chemical industry, which are shared
between the authorities, industry and the local population. It is therefore not possible to make
any conclusive statement on energy-related education in Viet Nam.

79
Summary
Figure 33 Wastewater analysis of the chemical industry in Viet Nam
Social assessment
3.6.6 Labour
Constraints
Two issues are raised by the chemical industry: first, the available human resources do not meet
the demands of enterprises; and, secondly, the chemical industry considers some of the
government’s environmental policies and regulations in labour burdensome; however, as these
are laregely regarded as “formalities”, they do not have a significant practical impact. In the
interviews, industry representatives highlighted the fact that good policies can be helpful for
industry, but that environmental taxes can be a financial burden for businesses.
Planning
It is reported that there are well-established communication channels between the government
authorities, industry and the local population to develop labour plans.
Operation
Health and safety in operations have been improved, mostly because of recent efforts in these
areas. Viet Nam’s chemical industry has collaborated with international entities, including
APEC, AMEICC, UNIDO, KEMI (Sweden), METI (Japan) and KOICA (Republic of Korea).

80
Monitoring
Some national regulations on chemical safety and laws regulating the use of chemicals have
been issued:
Environmental Protection Law
Health Care Law
Safety Code for production, use, storage and transportation of:
dangerous chemicals
Narcotics (drug, heroin) Prevention Law
Radiation Safety Law
Ordinance on Plant Protection
Prime Minister’s Decision on Controlling Petrol, Oil and LPG.
However, no evidence was obtained on how the local population or NGOs are involved in the
monitoring of labour issues in the chemical industry.
Education
Blank spots: The desk study and fieldwork revealed insufficient data availability in the
improvement of working conditions, labour programmes or best practices in the chemical
industry, which are shared between the authorities, industry and the local population. It is
therefore not possible to make any conclusive statement on labour education in Viet Nam.

81
Summary
Figure 34 Labour analysis of the chemical industry in Viet nam
3.7 Evolution of the methodologies:
To promote an intense discussion on environmental and social constraints and enablers,
quantitative data for the energy, water supply, solid waste and wastewater systems needs to be
added to the qualitative data already collected. Data availability and quality are always the main
challenge in environmental analysis and our methodology has been deliberately designed to use
both quantitative and qualitative data to paint the richest possible picture. Where quantitative
data is missing – which is the case far too often – the methodology attempts to use qualitative
data only to assess the situation. Though this can often be done, it is insufficiently robust to
arrive at results. In these cases, the methodology relies on the researcher’s ability to remain as
subjective as possible during the course of the interviews and the forums.
Data gaps, referred to as ‘Blank Spots’ are highlighted to draw clear attention to this problem
and encourage local improvements in data collection. Over time, the methodology is designed to
encourage increased data availability and a shift to quantitative data where appropriate, and the
assessments can then be used over time to demonstrate a development path for that nation and
the given sector. Due to different levels and the diverse nature of data across countries and
industries, cross-nation or cross-industry comparisons are not suitable.
4 Synthesis of economic, environment and social analyses
In the previous sections, the methodologies were developed in order to conduct independent
analyses of the economic, environmental and social components of an industrial subsector. In

82
this section, a methodology to combine the earlier analyses is introduced to derive policy
recommendations that define potential pathways towards green growth. Bringing together these
diverse aspects into a single framework is challenging and there are multiple ways to perform
this task. Questions naturally arise about which aspects should be prioritized and whether these
priorities need to be homogenous across countries.
In formulating this synthesis methodology, we rely on the principle that any industry with a
promising potential in terms of any of the economic dimensions (namely export performance,
local demand and domestic multiplier impact) deserves further policy attention. We then screen
these industries looking through an environment and social lens in search of those industries that
offer the greatest positive impacts with the lowest negativeeffects. It should be noted that we do
not recommend the closure or withdrawal of an industry that has a very high positive economic
or social impact, unless it entails the possibility of an extremely adverse negative environmental
impact that cannot be mitigated. In addition, even the industries that do not emerge as clear
winners in economic and social dimensions are tested in order to determine whether they have
some potential environmental benefits that could distinguish them as a worthy investment. The
methodology is designed in such a way that none of the policy recommendations we propose
will lead to any major trade-off in the growth of the country’s industrial sector as a whole.
Finally, we by no means suggest a ‘one-size-fits-all’ policy tool; on the contrary, we have
developed a synthesis framework which incorporates the country-specific context and local
realities. The key advantage of this framework is the fact that the economic, environmental and
social dimensions can be incorporated into one framework, a practice that is currently far from
the norm in the policy arena. This incorporation is indispensable in the quest to achieve green
growth, and we expect this and similar methodologies to be developed significantly further as
we learn more about the practicalities of such incorporation. The overall structure of our
synthesis framework is depicted in the following flow chart.

83
Figure 35 Step-by-step analysis of economic aspects to environment-social aspects
Step 1: The first step in the synthesis exercise is to carry out an economic analysis to test the
industry’s economic potential. An industry is termed an ‘economic winner (‘positive economic
impacts’ in the figure) if the industry meets any of the following criteria:
The industry is classified as a ‘champion’ or ‘under-achiever’ in the export analysis
conducted in the section 2.3.1.
The industry has been classified as a ‘local champion’ based on the domestic
demand and production analysis conducted in section 2.3.2.
The industry is classified as a ‘high impact’ industry based on the domestic
interdependence analysis carried out in section 2.3.4.

84
For all countries under consideration, the chemical industry is a ‘champion’ according to the
export analyses (conducted in section 2.3.1), hence we can classify this industry as an ‘economic
winner’ (‘positive economic impacts’ in the figure) based on the synthesis framework described
above. It should be noted that the chemical industry is also a ‘local champion’ in Thailand and
Indonesia based on the domestic demand analyses, whilst at the same time, it is a ‘high impact’
sector in Malaysia, the Philippines and Thailand according to the domestic interdependence
analyses. Hence, the chemical industry qualifies as an ‘economic winner’ (‘positive economic
impacts’ in the figure) based on multiple dimensions. We therefore immediately proceed with
the environmental and social analyses.
Step 2: In the second step of the synthesis exercise, we carry out the environment and social
analysis to test the industry’s environmental and social potential. The environment and social
analysis focuses on physical constraints that can hinder or enable an industry’s future progress
and covers energy, material and water inputs, plus air, waste and water emissions as well as
labour. Classifying a sector as medium, high or very high indicates that the industry is operating
at near or over the national capacity and that there is a current or imminent event that may cause
a growth plan to be delayed or ceased.
If the industry is classified as very low or low in the environment and social analysis, the growth
of that industry will not be constrained by national capacity.
It should be noted that the analysis does not calculate future industry growth targets as the data
quality is insufficient in nearly all countries, and that the actual environmental and social
impacts occur as part of a larger system where multiple sectors influence national capacity.
Step 3: The third step in the synthesis exercise is establishing a recommendation category for
the industry (in this case, the chemical industry) in each country. This categorization is based on
the results of Step 1 and Step 2 and is described in the figure. Further analysis is recommended
to identify the opportunities for improving value creation in the country and industry concerned,
taking account of economic, environmental and social aspects.
The policy recommendations are classified into five growth categories: ‘Green
growth’, ‘Growth with care’, ‘Strong medicine’, ‘Double trouble’ and ‘Forget.’
Positive economic impacts lead to one of two categories ‘Green growth’ and
‘Growth with care’, depending on the environment and social impact analysis.

85
Negative economic impacts lead to one of three categories ‘Strong medicine’, ‘Double trouble’,
and ‘Forget’, depending on the environment and social impact analysis.

86
4.1 Indonesia
Indonesia Chemical industry
Economic analysis
Export
Yes
Domestic demand
Yes
Interdependence (interlinkages)
No
Result: Economic winner
Environment and social analysis
Energy 1 2 3 4 5
Air emissions
Water supply
Solid waste
Wastewater
Labour
No Yes
Result (Degree of constraints):
0 1 2 3 4 5 6
Yes Yes Yes Yes Yes
Very High High Moderate Low Very Low
Judgment:
‘Growth with Care’
These are sectors that emerged as an economic winner but are quite near the
constraints defined in our environmental and social analyses
Detail suggestions for ‘Green Growth’:
Please see the next section, ‘Policy recommendations’
Holistic view of environmental and social assessments:

87
4.2 Philippines
Philippines Chemical industry
Economic analysis
Export
Yes
Domestic demand
No
Interdependence (interlinkages)
Yes
Result: Economic winner
Environment and social analysisEnergy 1 2
3 4 5
Air emissions
Water supply
Solid waste
Wastewater
Labour
No Yes
Result (Degree of constraints):
0 1 2 3 4 5 6
Yes Yes Yes Yes Yes
Very High High Moderate Low Very Low
Judgement:
‘Growth with dare’
These industries emerged as economic winners, but are quite close to capacity as defined
in our environment and social analyses
Detailed suggestions for ‘Green growth’:
Please see next section, ‘Policy recommendations’
Holistic view of environmental and social assessments:

88
4.3 Thailand
Thailand Chemical industry
Economic analysis
Export
Yes
Domestic demand
Yes
Interdependence (interlinkages)
Yes
Result: Economic winner
Environmental and social analysis
Energy 1 2 3 4 5
Air emissions
Water supply
Solid waste
Wastewater
Labour
No Yes
Result (Degree of constraints):
0 1 2 3 4 5 6
Yes Yes Yes Yes Yes
Very High High Moderate Low Very Low
Judgement:
‘Growth with care’
These are industries that emerged as economic winners but are quite close to capacity as
defined in our environment and social analyses
Detailed suggestions for ‘Green Growth’:
Please see next section, ‘Policy recommendations’
Holistic view of environment and social assessments:

89
4.4 Viet Nam
Viet Nam Chemical industry
Economic analysis:
Export
Yes
Domestic demand
No data
Interdependence (interlinkages)
No data
Result: Economic winner
Environment and social analysis:
Energy 1 2 3 4 5
Air emissions
Water supply
Solid waste
Wastewater
Labour
No Yes
Result (Degree of constraints):
0 1 2 3 4 5 6
Yes Yes Yes Yes Yes
Very High High Moderate Low Very Low
Judgement:
‘Growth with care’
These are industries that emerged as economic winners, but are quite close to capacity as
defined in our environment and social analyses
Detail suggestions for ‘Green Growth’:
Please see the next section, ‘Policy recommendations’
Holistic view of environmental and social assessments:

90
5 Policy recommendations
The chemical industry has been identified as a ‘Growth with care’ industry: these
are industries that emerged as economic winners but are very close to capacity as
defined in our environment and social analyses. Policymakers should consider the
following actions:
Take measures to further improve the competitive positions of these industries
by taking strategic policy actions.
Conduct an ‘AEC scenario’ analysis of the industry to forecast how the
domestic sector will respond to the AEC formation in 2015. Take steps to
prepare the industry for possibly increased competition.
The industry is an ‘under-achiever’ in the export analysis, then the country
should try to improve the industry’s export performance through proactive
policy interventions to capture the increased world demand in this dynamic
industry.
It is important to study the sustainability of future demand growth for these
dynamic industries. If demand growth is found to be short-lived, then the
country should not invest too many resources into these industries.
The skill requirements in these industries need to be studied and the national
educational institutions must be encouraged to cater to these requirements.
A detailed industry-specific constraint analysis needs to be conducted and
policy measures adopted to mitigate these constraints to foster more rapid
sectoral growth. This is critical to ensuring that any growth policy is not
thwarted by an external constraint.
An industry level value chain analysis needs to be undertaken to explore
options of producing more value added goods within the industry.
Organize stakeholder consultations to explore options to minimize the hotspot
impact.
The use of global best practices should be encouraged. The leading companies
use less water and energy, and generate less waste per unit of added value. For

91
any growth sector, the government should promote a programme of learning
about the best global standards and support programmes to enhance the skills of
local staff.
National governments should consider using local government procurement to
support high levels of performance by setting clear environmental and social
standards for supply where such delivery performance is feasible. Government
should work with local trade associations to develop these standards.
Trade associations and leading companies in the industry should be encouraged
to develop a roadmap to adopt global levels of environmental and social
performance. Such roadmaps should be endorsed by the government and made
public.
Clearly, many companies in the chemical industry suffer from poor
infrastructure (at national level and at company level). Trade associations and
the government should seek ways to share infrastructure resources (such as two
plants jointly building one wastewater treatment facility), which may then
become economically feasible due to increased volume.
The chemical industry is failing to maximize the value generated per weight of
product. This is largely due to poor quality raw materials and to limited
technical competence. Poor quality processing also means that products may
need re-processing, which significantly increases the costs and environmental
impacts, but adds no value. Technical competence in process quality is a
minimum competence and again there is considerable opportunity to improve
skills and hence competitiveness.
Finally, the chemical industry has limited capacity for companies to coordinate
their use of by-products (where one plant’s waste is used as input material by
another). We have encountered excellent examples, but far too rarely. It is clear
from other nations’ experiences that government and trade associations play a
key role in brokering such industrial symbiosis and this must be supported.
Local best practice
We have noted that that there is at least one company in most of our case countries that is well
aware of global best practice and has has introduced an operational programme to deliver such
high performance. These companies are often part of global initiatives, such as the World

92
Business Council for Sustainable Development. Governments would benefit from identifying
these companies and encourage their participation in road-mapping at the national level.
The need for the development of measurement and monitoring competence is widespread, both
within industry and government; research & development competence in the emerging field of
green chemistry should also be supported.
Data collection improvement for better industry policy
To support better policy design for industry, each country needs to further develop their national
data collection system for environmental and social data. For example, if authorities want to
determine water demand of a given industry, authorities can ascertain total water demand from
one of two sources of information: factories’ annual water demand report (for local authorities)
or factories’ annual water consumption (which can also be collected by local water authorities).
All the necessary data cannot be collected this way and we therefore explore an alternative
approach to collect data. To measure the amount of solid waste in a certain industry is not a
simple task. Local authorities and central government collect solid waste data by region. The
collection of waste data at the level of industry, e.g. the chemical industry, is not only difficult,
but is also not necessarily important for local authorities. However, an indirect approach can
provide important evidence about the amount of solid waste and wastewater at the level of
industry.
During the process of establishing a new factory, the managing company is required to notify
the local authorities of the expected solid waste and wastewater production before a license to
operate can be issued. The managing company needs to annually update these figures to keep
their operating licence. Data that can be used for analysis exists in the countries, but is in many
cases is not collected nationally or processed at industry level.
If the government collects data from waste plans compiled by local authorities, a better picture
of regional and industry-based waste production can be established. The calculations based on
these waste plans are unlikely to correspond to actual waste production in a given region or by a
given industry, but nonetheless allows for an estimate.

93
Figure 36 Reporting flows of solid waste and toxic waste
There are three important implications: first, local authorities should monitor the waste
produced by local factories; second, local authorities need to monitor companies’ plans for
annual waste production. Third, firms should have the opportunity to review their waste
production amounts.
Communication between authorities, industry and the local population
This report found that there are opportunities to share information that can be used to set
environmental and social targets. We strongly recommendthe formal communication between
the three actors (authorities, industry and local population) across all manufacturing processes
from constraints, planning and operation to monitoring and education. The three parties should
understand that the five manufacturing processes are interlinked and interdependent in terms of
achieving environmental and social improvement. In addition, the authorities should be aware of
the fact that social awareness of environmental and social factors can help exert a positive
influence on the chemical industry in the long term.
Suggestions for ‘Growth with care’
‘Growth with care’ industries: These are industries that emerged as economic winners
but are quite close to capacity as defined in our environmental and social analyses.
Policymakers should consider the following actions:
Take measures to further improve these industries’ competitive positions by
taking strategic policy actions.
Conduct an ‘AEC scenario’ analysis of the industry to forecast how the
domestic sector will respond to the AEC formation in 2015. Take steps to
prepare the industry for possibly increased competition.

94
If the export analysis indicates that an industry is an ‘under-achiever’, the
country should try to improve the industry’s export performance through
proactive policy interventions to capture the increased world demand in this
dynamic industry.
It is important to study the sustainability of future demand growth for these
dynamic industries. If the demand growth is found to be short-lived, then the
country should not invest too many resources into these sectors.
The skill requirements in these sectors need to be identified and the national
educational institutions encouraged to cater to these needs.
Detailed industry-specific constraints analyses need to be carried out and policy
measures adopted to mitigate these constraints to foster more rapid growth in
the industry. This is crucial to ensure that any growth policy is not thwarted by
an external constraint.
An industry level value chain analysis needs to be conducted to explore options
of producing more value added goods within the industry.
Stakeholder consultations should be organized to explore options to minimize
hotspot impacts.
The use of global best practices should be encouraged. Leading companies are
using less water and energy, and generating less waste per unit of added value.
For any growth industry, the government should ensure a programme of
learning about what those best global standards are and support programmes to
upskill local staff to deliver such practices.
National governments should consider using local government procurement to
support high levels of performance by setting clear environmental and social
standards for supply, where such delivery performance is feasible. The
government should work with local trade associations to develop these
standards.
Trade associations and leading companies in the industry should be encouraged
to develop a roadmap to adopt global environmental and social standards. Such
roadmaps should be endorsed by the government and made public.

95
Many of the companies in the chemical industry suffer from poor infrastructure
(at national level and at company level). Trade associations and the government
should seek ways to share infrastructure resources (such as two plants jointly
building one wastewater treatment facility), which may then become
economically feasible due to increased volume.
The chemical industry is failing to maximize the value generated per weight of
product. This is largely due to poor quality raw materials and to limited
technical competence. Poor quality processing also means that products may
need re-processing, which significantly increases the costs and environmental
impacts, but adds no value. Technical competence in process quality is a
minimum competence and again there is considerable opportunity to improve
skills and hence competitiveness.
Finally, the chemical industry has limited capacity for companies to coordinate
their use of by-products (where one plant’s waste is used as input material by
another). We have encountered excellent examples, but far too rarely. It is clear
from other nations’ experiences that government and trade associations play a
key role in brokering such industrial symbiosis and this must be supported.
6 Conclusions
The chemical industry is a large part of the ASEAN nations’ economy and is expected to play a
key role in future green growth. All five nations studied face constraints that limit the ability of
their chemical industry to expand; in some cases, the constraints relate to water and/or
wastewater, in other cases to air emissions, etc. As such, the chemical industry has in each case
country been identified as a ‘Growth with care’ industry, hence, industry expansion must be
based on a comprehensive environment and social analysis of the growth plans. We have
identified actions that focus on skills and coordination, as long-term strategic advantages can
thus be achieved at low cost. However, this approach is not without challenge and should not be
rushed.
Excellent companies exist in many locations worldwide. These companies are proof that local
conditions are not a limiting factor for environmental or social performance (though local
infrastructure poses a major challenge in many cases as does the workforce’s technical
competence). Secondly, these companies demonstrate that higher value creation is correlated
with higher environmental performance (due to better process control). This indicates that there
is no structural reason for the ASEAN chemical industry to push for lower costs, lower quality

96
and lower environmental and social standards, albeit being a frequently used strategy. This
strategy is a ‘race to the bottom’ that is unnecessary and does not offer a route for increasing
added value, quality jobs and exports, while improving local conditions. Thirdly, and finally,
these excellent companies provide local access to knowledge, which should be sought,
promoted and used by the nation to support progressive policies and develop practice-sharing
education programmes that can help raise other companies’ performance as well.
We have found evidence that governments and industry – whether individual companies and/or
trade associations – are failing to produce future roadmaps. Roadmaps help industry and
government better understand each other’s aims and instruments and encourage efficient
allocation of resources. Roadmapping can identify critical constraints and challenges (for
example, skills) and offer a shared solution. Roadmaps can be negatively affected by intense
lobbying from industry or a short-term outlook by politicians, and must be conducted with care,
especially where there is little history of cooperative problem solving.
Many of the chemical companies in the region struggle with process quality control, which then
creates more scrap and more re-working and thus uses more energy and water and generates
more waste. This is both a company and national competitiveness issue, as a lack of capacity in
the energy, water or waste systems means that industry growth relies on infrastructure growth.
The cost of infrastructure growth is typically much higher than the cost of efficiency
programmes that can produce the same capacity. We strongly recommend the development of
process quality control skills and national provision of more sophisticated process quality
equipment. Such education and equipment availability will also enable the long-term
development of better research competence in this crucial area. These measures have the
additional benefit of helping to move the industry towards higher value adding outputs.
There is a strong economic logic for supporting the ASEAN countries’ chemical industry. None
of the countries studied exhibited critical environmental or social conditions that would
immediately limit the chemical industry’s growth. However, the chemical industry in each case
country is operating close to capacity in terms of resources and any growth plan must be
accompanied by an equally effective plan to increase the constraining capacity.

97
7 References
Centre for Research Investment Consult for Rural Development (1999), Statistics and prediction of
generated hazardous wastes and recommendation for Master Plan of HW treatments in Vietnam,
http://www.rrcap.ait.asia/pub/soe/vietnam/issues/state_and_impact/solid_waste_state_and_impa
ct.htm
Chang, H. J. (2007) Bad Samaritans: The Myths of Free Trade and the Secret History of
Capitalism, New York: Bloomsbury Press.
ESCAP, ADB, UNEP (2012), ‘Green Growth, Resources and Resilience’
Kuboon C. (2012), ‘ASEAN Economic Community (AEC) 2015 and its implication on APEC’,
The annual conference for the APEC Study Centers Consortium, held on May 26-27, 2012,
Kazan, Russia.
Lin, J. ( 2011), ‘From Flying Geese to Leading Dragons: New Opportunities and Strategies for
Structural Transformation in Developing Countries’, Policy Research Working Paper Series,
5702, The World Bank, Washington, D.C.
Lin, J. (2012). ‘New Structural Economic’, The World Bank, Washington, D.C..
McKinsey (2004), ‘Integrating Southeast Asia’s economies’, McKinsey Quarterly, February 2004
OECD (2008), ‘Shaping Policy Reform and Peer Review in Southeast Asia: Integrating Economies
amid Diversity’, OECD, Paris.
OECD (2012), ‘Skills Development Pathways in Asia: Employment and Skills Strategies in
Southeast Asia initiative (ESSSA)’, OECD, Paris.
UNEP (2012), ‘Resource Efficiency: Economic and Outlook for Asia-Pacific’, UNEP, Nairobi.
UNDP, DENR, NSWMC (2012), ‘Solid Waste Management Made Easy: A Field Book on
Implementing a Community-Based Ecological Solid Waste Management Programme’, UNDP,
New York.

Vienna International Centre · P.O. Box 300 · 1400 Vienna · AustriaTel.: (+43-1) 26026-0 · E-mail: [email protected]
V.15-01318—March 2015—275