Embed Size (px)
Citation preview

Members:Jason Bougie Kristin Cooper - Carter Tom DiGiovanni Chris GiampaoliJim Goodwin Ken Grossman Amelia Gulling Jon LuvaasDr. Scott G. McNall Jim Pushnik Tami Ritter Ann Schwab, ChairJim Stevens Scott Wolf Julian Zener
Sustainability Task ForceA Committee of the Chico City Council
Vice Mayor Schwab, Chair
Meeting of May 5, 2008 – 3:00 p.m. to 5:00 p.m.
Council Chamber Building, 421 Main Street
*** PLEASE NOTE ROOM CHANGE ***
AGENDA
1. Chico Bag Project
Bruce Jans will be presenting a video on the Chico Bag project for the Task Force’s information.
2. Greenhouse Gas and Criterial Air Pollutant Emissions Inventory (ICLEI Audit)
At the Task Force’s 4-21-08 meeting, CSU, Chico Research Foundation provided copies of the draft reporton the Greenhouse Gas and Criterial Air Pollutant Emissions Inventory for the City of Chico and thecommunity. The Task Force will be reviewing and providing comments on this report at today’s meeting.
3. Business from the Floor – Members of the public may address the Committee at this time on any matternot already listed on the agenda, with comments being limited to three minutes. The Committee cannottake any action at this meeting on requests made under this section of the agenda.
4. Reports and Communications - None
5. Adjournment – The meeting will adjourn no later than 5:00 p.m. The next meeting of the SustainabilityTask Force is scheduled for May 19, 2008 - unless cancelled. All meetings are held from 3:00 p.m. – 5:00p.m. in Conference Room No. 1 in the Council Chamber Building.
Distribution available in the office of the City Clerk:
Prepared: 4/29/08 Chico City Clerk’s Office Posted : 4/29/08 411 Main Street, Chico, CA 95928Prior to: 5:00 p..m. (530) 896-7250
Please contact the City Clerk at 896-7250 should you require an agenda in an alternative format or if you need to request adisability-related modification or accommodation in order to participate in a meeting. This request should be received at leastthree working days prior to the meeting in order to accommodate your request.

City of Chico
COMMUNITY AND MUNICIPAL GREENHOUSE GAS AND CRITERIA AIR POLLUTANT
EMISSIONS INVENTORY
April 2008
Project Director Mark Stemen
Project Manager
Daniel Salazar
Assistants Daniel DiMeo
Amelia Gulling Anthony Sudderth
The first step to reduce our carbon footprint.
DRAFT Greenhouse Gas Inventory ii
Acknowledgments Many individuals and organizations contributed to the completion of this report by providing guidance, data, and other general information. The following people helped in this endeavor to quantify the greenhouse gas emissions for the City of Chico and the Chico Community. City of Chico
Denice F. Britton Erik Gustafson Linda Herman Ruben Martinez
Kim Parks Marc Sulik Kirby White
City of Chico Sustainability Task Force
Ann Schwab, Chair Jason Bougie Kristin Cooper-Carter Tom DiGiovanni Chris Giampaoli Jim Goodman Amelia Gulling Ken Grossman
Scott McNall Jon Luvaas Jim Pushnik Tami Ritter Jim Stevens Anthony Watts Scott Wolf Julian Zener
Pacific Gas and Electric Jasmin Ansar
Tino Nava Andrew Yip Butte County Air Quality Management District Gail Williams Butte County Association of Governments
Andy Newsom Brian Lasagna
ICLEI USA
Brooke Lee Micah Lang
Xico Manarolla Alex Ramel
We would like to thank the above for their suggestions and corrections. Any errors that remain are solely those of the authors.

DRAFT Greenhouse Gas Inventory ii
TABLE OF CONTENTS
ACKNOWLEDGMENTS................................................................................................................................... II TABLE OF CONTENTS.................................................................................................................................... II 1. INTRODUCTION..................................................................................................................................... 3
1.1. CLIMATE CHANGE ...........................................................................................................................3 1.2. CARBON FOOTPRINTS AND GREENHOUSE GAS INVENTORIES ..........................................................4 1.3. LOCAL SOLUTIONS FOR A GLOBAL PROBLEM..................................................................................5 1.4. NINE REASONS TO TAKE ACTION ....................................................................................................5
2. PROJECT BACKGROUND AND PURPOSE.......................................................................................... 7 2.1. PROJECT BACKGROUND...................................................................................................................7
2.1.1. Mayors Climate Protection Agreement......................................................................................7 2.1.2. ICLEI’s Cities for Climate Protection Campaign......................................................................7
2.2. PURPOSE OF THE STUDY ..................................................................................................................8 2.3. METHODOLOGY AND ORGANIZATION..............................................................................................9
2.3.1. Software .....................................................................................................................................9 2.3.2. Project Organization and Baseline Year ...................................................................................9 2.3.3. Understanding Analysis Results...............................................................................................10
3. COMMUNITY ANALYSIS ...................................................................................................................... 11 3.1. COMMUNITY ANALYSIS SCOPE......................................................................................................11
3.1.1. Community Analysis Data Sources ..........................................................................................11 3.2. COMMUNITY ANALYSIS RESULTS..................................................................................................12
3.2.1. Overview ..................................................................................................................................12 3.2.2. Source of Community Greenhouse Gas Emissions ..................................................................14 3.2.3. Community Generated Air Pollutants ......................................................................................14 3.2.4. Residential Sector ....................................................................................................................15 3.2.4.1. Residential Emissions..........................................................................................................15 3.2.5. Commercial Sector...................................................................................................................16 3.2.5.1. Commercial Emissions ........................................................................................................16 3.2.6. Transportation Sector ..............................................................................................................18 3.2.6.1. Background .........................................................................................................................18 3.2.6.2. Transportation Sector Emissions ........................................................................................19 3.2.7. Solid Waste Sector ...................................................................................................................19 3.2.7.1. Background .........................................................................................................................19 3.2.7.2. Solid Waste Emissions.........................................................................................................20
3.3. COMMUNITY ANALYSIS FORECAST AND BACKCAST .....................................................................20 4. GOVERNMENT ANALYSIS ................................................................................................................... 22
4.1. GOVERNMENT ANALYSIS SCOPE ...................................................................................................22 4.2. GOVERNMENT ANALYSIS RESULTS ...............................................................................................22
4.2.1. Overview ..................................................................................................................................22 4.2.2. Source of Government Greenhouse Gas Emissions .................................................................23 4.2.3. Government Generated Air Pollutants.....................................................................................23 4.2.4. Vehicle Fleet Sector Analysis...................................................................................................24 4.2.5. Building Sector Analysis ..........................................................................................................26 4.2.6. Waste Sector Analysis ..............................................................................................................27 4.2.7. Streetlights Sector Analysis......................................................................................................27 4.2.8. Water and Sewage Sector Background ....................................................................................28 4.2.9. Sewage Sector Emissions .........................................................................................................29 4.2.10. Employee Commute Sector Analysis ...................................................................................29

DRAFT Greenhouse Gas Inventory iii
5. NEXT STEPS.......................................................................................................................................... 31 5.1. MILESTONE II: SETTING AN EMISSION REDUCTION TARGET.........................................................31 5.2. MILESTONE III: DEVELOP AN ACTION PLAN.................................................................................32
5.2.1. Research Phase ........................................................................................................................32 5.2.2. Creation of a Master List .........................................................................................................32 5.2.3. Selection of Policies and Programs .........................................................................................32 5.2.4. Development of GHG Emission Reduction Strategy ................................................................32
5.3. MILESTONE IV: IMPLEMENTATION PLAN......................................................................................33 5.4. MILESTONE V: MONITORING AND EVALUATION ..........................................................................33 5.5. CONCLUDING REMARKS ................................................................................................................33
6. APPENDIX A: LIST OF ACRONYMS ................................................................................................... 34 7. APPENDIX B: EMPLOYEE COMMUTER SURVEY ........................................................................... 36 8. APPENDIX C: EMISSIONS REDUCTION MEASURES BY SECTOR................................................. 37
8.1. COMMUNITY EMISSIONS REDUCTION MEASURES..........................................................................37 8.2. GOVERNMENT EMISSIONS REDUCTION MEASURES .......................................................................41

DRAFT Greenhouse Gas Inventory 2
List of Figures Figure 1.1: Average global temperate change (1880-2005)…………………………………. 4 Figure 2.1: Basic project organization……………………………………………………….. 9 Figure 3.1: Community analysis design flowchart……………………………...………........ 11 Figure 3.2: Community greenhouse gas emissions by sector (2005)……….…….................. 12 Figure 3.3: Community GHG emissions by source (2005)…………………………………. 14 Figure 3.4: Community air pollutants by sector…………………………………………….. 14 Figure 3.5: Residential sector GHG emissions (2003-2006)………………………………… 15 Figure 3.6: Residential criteria air pollutants by source……………………………………… 15 Figure 3.7: Commercial GHG emissions (2003-2006)…………………………………....…. 16 Figure 3.8: Commercial sector emissions by sub-sector (2005)……………………….…...... 16 Figure 3.9: Transportation sector greenhouse gas emissions (2004-2006)………………..… 18 Figure 3.10: City of Chico GHG emission projection (2005-2020)…………… ………….... 21 Figure 4.1: City of Chico government emissions analysis by sector…………………...….… 22 Figure 4.2: Government generated GHG emissions by sector………………………….…..... 22 Figure 4.3: Government GHG emissions by source…………………………………..……... 23 Figure 4.4: City of Chico government generated criteria air pollutants by sector………….... 24 Figure 4.5: Fleet sector GHG emissions by fleet and source (2005)…………………………. 25 Figure 4.6: Government fleet fuel usage in gallons by fiscal year…………………………… 25 Figure 4.7: Building sector GHG emissions (2005-2007)………………….………………… 26 Figure 4.8: City of Chico government GHG emissions by building and source (2005)……... 26 Figure 4.9: Percent of streetlight sector greenhouse gas emissions by type of light………..… 27 Figure 4.10: Water and Sewage GHG emissions…..…………...……………………………. 29 Figure 4.11: City employee commuter vehicle breakdown……………..…………………… 30 List of Tables Table 3.1: Energy, Air Pollutants, GHG emissions, and MMBtu per MTCO2E by sector…... 13 Table 3.2: Per capita GHG emissions of different regions...…….…………………………… 13 Table 3.3: End use sector National vs. Chico by sector……...……………………………….. 13 Table 3.4: Residential GHG and CAP emissions, energy, and MMBtu/MTCO2E by source.. 15 Table 3.5: Commercial sub-sector energy use and GHG emissions…………………………. 17 Table 3.6: Commercial sector: 2005 energy use, CAP & GHG emissions by fuel type…...... 17 Table 3.7: Chico commuter behavior………………...……………………………………… 18 Table 3.8: Transportation Sector: 2005 energy use, CAP & GHG emissions by fuel type…. 19 Table 3.9: Solid waste emission break down…………………………………...…………… 20 Table 4.1: Criteria air pollutants by sector………………………………………………….. 24 Table 4.2: Vehicle fleet GHG emissions, energy, gallons and cost……………………...….. 24 Table 4.3: Street lighting GHG emissions, energy and cost………………...………………. 27 Table 4.4: Findings from the employee commuter survey………………...………………... 30

DRAFT Greenhouse Gas Inventory 3
1. Introduction
1.1. Climate Change Over the past twenty years, the extent, cause and impacts of global climate change have been debated with some uncertainty. However, over 21,500 of the world’s top climate scientists have reached consensus that global climate change is a human-created environmental and economic challenge of significant scope. According to the report Climate Change 2007: The Physical Science Basis prepared by over 1,500 scientists of the International Panel on Climate Change (IPCC):
“Warming of the climate system is unequivocal, as is now evident from observations of increases in global average air and ocean temperatures, widespread melting of snow and ice, and rising global average sea level” (IPCC, 2007). "Most of the observed increase in global average temperatures since the mid-20thcentury is very likely1 due to observed increase in anthropogenic greenhouse gas concentrations" (IPCC, 2007). "Continued greenhouse gas emissions at or above current rates would cause further warming and induce many changes in the global climate system during the 21st century that would very likely be larger than those observed in the 20th
century" (IPCC, 2007).
While the effects of global climate change may be difficult to perceive in Chico, scientists have observed significant changes in seasonal timing, or phenology. In a recent article published by the Associated Press and printed in the Enterprise Record, science writer Seth Borenstein wrote that “Spring keeps coming early for birds, bees, trees, and sneezes because of global warming.”2 This phenomenon is coupled with early warm storms that threaten the snow pack of the Sierra Nevada on which Californians are dependent for drinking water, agriculture, and power production. Other broader indicators of climate change include3:
• The six hottest years of recorded history (looking at average global temperatures) have all occurred in the last eight years (see chart below).
• The year 2005 was the hottest on record for the global climate. The average global surface temperature of 14.77 degrees Celsius (58.6 degrees Fahrenheit) was the highest since recordkeeping began in 1880.
1 The IPCC defines Very likely as greater than 90 percent. 2 “Spring keeps coming earlier for birds, bees, trees, and sneezes because of global warming.” By Seth Borenstein—Associated Press Science Writer. Article Launched: 03/22/2008 3 “2005 Hottest Year on Record,” Joseph Florence, http://www.earth-policy.org/Indicators/Temp/2006.htm

DRAFT Greenhouse Gas Inventory 4
• Using records stored in ice, tree rings, and fossils, scientists have estimated that the northern hemisphere is warmer now than at any time in the past 1,200 years.
• Another study reported that atmospheric levels of CO2 and methane, another greenhouse gas, are higher today than at any time in the last 650,000 years.
• The rise in sea surface temperature has also contributed to a record-breaking Atlantic hurricane season, with 27 named storms and 15 hurricanes in 2005.
Chico is the largest city in Butte County, with over 70,000 people living within the city limits and over 100,000 people residing in the Greater Chico Area. Greenhouse Gas (GHG) emissions are generated in this locale and contribute to global warming.
The City government and, to a greater extent, the local community are primary contributors of GHG emissions and air pollutants
generated in the northern portion of the Central Valley.
The need for an emissions inventory of the Chico community and government is timely. By initiating one of the first emissions inventories in the region it is probable that similar studies will follow. Additional studies in the region will provide a more comprehensive understanding of Chico as an emissions generator.
1.2. Carbon Footprints and Greenhouse Gas Inventories The process of conducting a GHG inventory is relatively new. GHG inventories originated as an international response to mitigate global climate change. Fundamentally, a GHG inventory measures the amount of heat trapping gases that an entity contributes to the atmosphere. By
Figure 1.1: Average Global Temperate Change (1880-2005).

DRAFT Greenhouse Gas Inventory 5
quantifying emissions, GHG generators are able to benchmark their status as emissions producers defining their “carbon footprint.” In 2006 the United States Environmental Protection Agency (EPA) completed the “Inventory of U.S. Greenhouse Gas Emissions and Sinks: 1900-2004” which defined a GHG inventory as follows:
”A greenhouse gas inventory is an accounting of the amount of greenhouse gases emitted to or removed from the atmosphere over a specific period of time (e.g., one year). A greenhouse gas inventory also provides information on the activities that cause emissions and removals, as well as background on the methods used to make the calculations. Policy makers use greenhouse gas inventories to track emission trends, develop strategies and policies and assess progress. Scientists use greenhouse gas inventories as inputs to atmospheric and economic models” (EPA, 2006).
1.3. Local Solutions for a Global Problem While international and national efforts to mitigate global climate change have stalled, many cities and locales across the country and around the world have initiated local GHG emissions studies and programs to reduce GHG emissions. Bottom-up initiatives are taking root and growing rapidly in local places. Actions to abate GHG emissions are rarely global or national. Lasting reductions in GHG emissions are possible only when individuals and organizations change their behavior and activities, and employ different technologies. Monitoring GHG emissions is the critical first step to setting a goal for emissions reductions, developing polices and programs to achieve that goal, and measuring progress toward reductions. This work represents the first comprehensive effort to quantify GHG emissions generated by the City of Chico Municipal Government and the Chico community.
1.4. Nine Reasons to Take Action 1. Reduce our Contribution to Global Climate Change. The number one reason for
Greenhouse Gas Action Plans is to reduce the quantity of CO2 produced by the Greater Chico Area and thereby slow our contribution to climate change.
2. Improve Service Delivery. Energy efficiency initiatives will enable the City to offer
services more efficiently and economically.
3. Reduce Cost. By reducing energy consumption, the City and local citizens will save money on energy bills. While energy efficiency initiatives may require an initial capital investment, paybacks of between four and seven years can be expected in many cases and savings will continue beyond the payback period. Furthermore, by reducing energy consumption, the City and its citizens will be less vulnerable to fluctuations in the market price of energy.
DRAFT Greenhouse Gas Inventory 6
4. Energy Independence. By generating our own energy through the utilization of local energy resources (i.e., solar, wind, small hydro, etc.) Chico can reduce its dependence on remote and centralized sources that are susceptible to fluxes in market price and reliability.
5. Improve Air Quality and Public Health. Air quality in Chico has been identified as the
third worst in California.4 Combustion of fuel wood and fossil fuels used to produce electricity, heat buildings, and power vehicles emits a variety of pollutants that are known to have negative health impacts and reduce local air quality. Less energy consumption means less local air pollutants5. Additionally, climate change may lead to an increased spread of vector-borne and heat-related diseases, so taking steps to reduce GHG emissions reduces the likelihood of climate-related health problems.
6. Improve Asset Management. Asset management is a proactive approach to facility
management that includes a systematic review of the state of facility operations and implementation of a logical repair/upgrade schedule. Preventative maintenance improves the value of the City’s assets by reducing operating cost, modernizing equipment, and decreasing deferred maintenance. Furthermore, increasing the efficiency of facilities and operations leads to better-run operations, greater client satisfaction, along with increased energy efficiency and the resulting cost savings emission reductions.
7. Community Leadership. By taking concrete steps to address climate change, the City of
Chico will provide a solid example to the community, county, and northern California to follow.
8. Quality of Life for Citizens/Healthy Cities. The City can use savings generated by
improved efficiency to improve critical community services. Programs that reduce emissions, such as bike paths, public transit, and smart growth also increase the quality of life by improving air quality, also promoting active lifestyles and creating a more beautiful community. Together, these measures help build a healthier, more sustainable community.
9. Job Creation. The transition to a low emissions society will require innovation and
effort. The transition will create new jobs, as homes and businesses are retrofitted. The transition to a “climate friendly economy” will require new educational programs, new technologies and new businesses, which will in turn create new jobs in our community.
4 Chico Enterprise Record—Article ID: 8084706, Section: Local, January 26, 2008, Author: Steve Schoonover.
5 See Section 2.3.3: “Understanding Analysis Results” for a complete list of Criteria Air Pollutants.

DRAFT Greenhouse Gas Inventory 7
2. Project Background and Purpose
2.1. Project Background
2.1.1. Mayors Climate Protection Agreement In October 2006 City of Chico Mayor Scott Gruendl signed the Mayors Climate Protection Agreement. To date more than 600 mayors have signed the agreement, including more than 115 California cities6. Under the Mayors Climate Protection Agreement Chico has committed to take the following three actions:
• Strive to meet or beat the Kyoto Protocol targets, through actions ranging from anti-sprawl land-use policies to urban forest restoration projects to public information campaigns.
• Urge state and federal governments to enact policies and programs to meet or beat the greenhouse gas emission reduction target suggested for the United States in the Kyoto Protocol—7% below 1990 levels by 2012.
• Urge the U.S. Congress to pass the bipartisan greenhouse gas reduction legislation, which would establish a national emission trading system.
2.1.2. ICLEI’s Cities for Climate Protection Campaign In 1993, at the invitation of ICLEI, municipal leaders met at the United Nations in New York and adopted a declaration that called for the establishment of a worldwide movement of local governments to reduce greenhouse gas emissions, improve air quality, and enhance urban sustainability. The result was the Cities for Climate Protection (CCP) campaign.
The CCP campaign has proven that cumulative local
actions have a positive impact on global climate change. Since its inception, the CCP Campaign has grown to involve more than 650 local governments worldwide that are integrating climate change mitigation into their decision making processes. Based on recent analysis, CCP participants account for approximately 15% of global anthropogenic greenhouse gas emissions7. More specifically, cumulative nation-wide CCP members have reported a reduction of over twenty-three million MTCO2E greenhouse gas emissions8.
6 For a complete list of cities who have signed the Mayors Climate Protection Agreement or more information about the Agreement please visit http://www.ci.seattle.wa.us/mayor/climate/default.htm - who 7 http://www.iclei.org/index.php?id=811 8 Because CCP member cities only voluntarily report emission reductions to ICLEI the total number of reductions associated with the CCP campaign likely far exceeds the 23 million MTCO2E mentioned above. Source: Personal communication with Aryin Zahner, ICLEI USA, Program Associate.

DRAFT Greenhouse Gas Inventory 8
As a part of Chico’s participation in the CCP campaign, the City has voluntarily committed to complete the following milestones:
1. Conduct a baseline emissions inventory and forecast. 2. Set an emissions reduction target. 3. Develop an action plan to meet the emissions reduction target. 4. Implement the action plan. 5. Monitor and verify progress and results.
This report completes milestone I. Milestones II – V are explained in detail in Chapter Five: Next Steps.
2.2. Purpose of the Study Completion of the GHG inventory represents the first milestone of ICLEI’s CCP campaign. The purpose of this study is to inventory GHG and CAP emissions produced by the City of Chico’s government and the larger community of residents and businesses in the Greater Chico Area. Benchmarking the City’s emissions will aid policy makers to forecast emission trends, identify the point sources of emissions generated, and set goals for future reductions and mitigation.
If you don’t measure it, you can’t manage it. The underlying purpose of this study is to move the Chico community towards a sustainable future. A sustainable future requires a shift from valuing what we measure to measuring what we value. By measuring what we value we can produce meaningful indicators that can influence our current and future behaviors. A good indicator should be resonant, valid, and motivational.
• Resonant—clear and easy to interpret and within the sphere of understanding and relevance of the user.
• Valid—data from which the indicator is drawn need to be as comprehensive and credible as possible; and the method used to develop the indicator must be as transparent as possible.
• Motivational—reflect issues that are within the sphere of influence of the user, as to provoke and inspire change.
This project also aspires to assist in identifying and developing information that can improve and complete our understanding of GHG emissions. This includes the gap between knowledge of how emissions are generated locally and how those emissions contribute to global climate change. Furthermore, this investigation is intended to assist in finding common ground between operations and policy makers. The ultimate purpose of this study is to provide a starting point to help the City government and greater community lower their emissions.

DRAFT Greenhouse Gas Inventory 9
Figure 2.1: Basic project organization.
2.3. Methodology and Organization
2.3.1. Software This project was completed using Clean Air Climate Protection (CACP) Software developed by Torrie Smith Associates (2003) in conjunction with State and Territorial Air Pollution Program Administrators (STAPPA), Association of Local Air Pollution Control Officials (ALAPCO), and International Council for Local Environmental Initiatives (ICLEI). The CACP software is an
emissions management tool that allows the user to track emissions and reductions of greenhouse gas (GHG) and criteria air pollutant (CAP) emissions associated with electricity, fuel use and waste disposal.9 The software contains thousands of emission factors that are used to calculate emissions based on simple fuel and energy use data, or by using information on waste disposal. The CACP software is a flexible tool that allows the user to enter data in a number of different forms, utilize
information collected through other inventory tools, customize emission coefficients, and create new fuel and vehicle types10.
2.3.2. Project Organization and Baseline Year The CACP Software is divided into two distinct analyses: a government analysis and a community analysis. The community analysis creates an inventory of the GHG and CAP emissions produced in the Greater Chico Area. The government analysis creates an inventory of the GHG and CAP emissions produced by all municipal government operations. All GHG and CAP emissions that are detailed in the government analysis are included in, and not in addition to, the community analysis (Figure 2.1). In both analyses emissions are quantified on data derived from fuel use, electrical use, and waste. In both the government and community analyses
2005 was chosen as the baseline year. ICLEI recommended choosing 2005 as the baseline year since many Californian ICLEI members already decided to use the same year. By conforming to this regional consensus the City of Chico Community and Municipal Greenhouse and Criteria Air Pollutant Emissions Inventory will more easily be compared with similar analysis from other cities in the region. In addition to 2005, information for adjacent years has been compiled in this analysis enabling trend lines to be established.
9 See section 2.3.3 Understanding Analysis Results for a complete list of GHG and CAP. 10 For more information about the CACP software visit: http://www.cacpsoftware.org/

DRAFT Greenhouse Gas Inventory 10
2.3.3. Understanding Analysis Results There are six greenhouses gases that are typically measured and monitored in GHG inventories. They are: carbon dioxide (CO2), nitrous oxide (NO2), methane (CH4), sulfur hexafluoride (SF6), and hydrofluorocarbons (HFCs). The CACP software does not, however, quantify the amounts of these individual gases. Instead, the CACP software quantifies all GHG emissions in CO2 equivalency (CO2E). This is a convenient way to compare separate gases with
distinct global warming properties on the same playing field. Due to the scale of this project all results are conveyed in metric tonnes of carbon dioxide equivalency (MTCO2E). A metric tonne is equivalent to 2,205 pounds, and one pound of CO2 can fill approximately 120 party balloons. This means that one MTCO2E could fill more than 250,000 party balloons. There are five criteria air pollutant (CAP) emissions inventoried in this project. These pollutants harm both human health and the environment though they do not contribute directly to global climate change. They are: carbon monoxide, sulfur dioxide, nitrogen oxides, volatile organic compounds, and particulate matter smaller than 10mm.
1. Carbon monoxide (CO)—Can cause harmful health effects by reducing oxygen delivery to the body's organs (like the heart and brain) and tissues.
2. Sulfur dioxide (SO2)—Contributes to respiratory illness, particularly in children and the elderly, and aggravates existing heart and lung diseases. SO2 contributes to the formation of acid rain, which: damages trees, crops, historic buildings, and monuments; and makes soils, lakes, and streams acidic. SO2 also contributes to the formation of atmospheric particles that cause visibility impairment, most noticeably in national parks.
3. Nitrogen oxides (NOx)—Causes a wide variety of health and environmental impacts because of various compounds and derivatives in the family of nitrogen oxides, including nitrogen dioxide, nitric acid, nitrous oxide, nitrates, and nitric oxide.
4. Volatile organic compounds (VOCs)—Includes a variety of chemicals associated with short and long term adverse health effects. VOCs also participates in photochemical reactions.
5. Particulate matter (PM10)—Fine particles that contain microscopic solids or liquid droplets that are so small that they can get deep into the lungs. Particulate matter can cause respiratory health problems such as decreased lung function, aggravated asthma, development of chronic bronchitis, irregular heartbeat, non-fatal heat attacks, and premature death in people with heart or lung disease.11
Results concerning the listed CAP emissions will be conveyed in pounds (lbs.) and will be listed separately as there is currently no way to combine these distinct air pollutants for analysis.
11 US EPA, http://www.epa.gov/air/urbanair/

DRAFT Greenhouse Gas Inventory 11
3. Community Analysis
3.1. Community Analysis Scope The community analysis provides an estimate of all of the GHG and CAP emissions produced within the “Greater Chico Area” by residents, businesses, and agencies. Five primary sectors are included in the community analysis: Residential, Commercial, Industrial, Transportation, and Waste. Each of the five sectors may be broken down further into source sub-sectors as indicated in Figure 3.1.
Figure 3.1 Community analysis design flowchart
3.1.1. Community Analysis Data Sources The primary data used to determine the amount of emissions for the residential, commercial, and industrial sectors was obtained through the local utility—Pacific Gas and Electric (PG&E). Data provided by PG&E included four years (2003-2006) of electrical and natural gas information. Data for the transportation sector was obtained from the California Public Road Data—Highway Performance Monitoring System. This annual report provides daily vehicle miles traveled for the Greater Chico Area.12 Transportation data included three years (2004-2006). Data for the waste sector was provided by the City of Chico’s Management Analyst, Linda Herman and Butte County’s Solid Waste Manager, Bill Mannel. Additional information was also gathered from the California Integrated Waste Management Board website.13 Waste sector data includes three years (2005-2007). It is fortunate to have obtained multi-year data sets because they allowed for a more comprehensive analysis and aided in the forecasting/backcasting process. Boundaries for this study were an issue from the beginning. Attempts to include only emissions generated within city limits are typical in most inventories. Nonetheless after reviewing the
12 Source: http://ww.dot.ca.gov/hq/tsip/hpms/detalibrariy.php 13 http://www.ciwmb.ca.gov/Profiles/Juris/JurProfile2.asp?RG=C&JURID=80&JUR=Chico

DRAFT Greenhouse Gas Inventory 12
nature of the data available and listening to the aspirations of the Sustainability Task Force to include the “Greater Chico Area” the geographic boundaries of the project were expanded. Data provided by PG&E includes what they refer to as Chico’s “Town and Territory.” Despite multiple requests PG&E was unable to define the exact geographical parameters of what they refer to as the “Town and Territory.” In this section it is assumed that the “Town and Territory” roughly equates to the “Greater Chico Area.”
3.2. Community Analysis Results
3.2.1. Overview In 2005 the Chico community generated 610,951 MTCO2E. Fifty-four percent of those emissions were produced from the transportation sector. The commercial sector was second largest contributor, accounting for 23%, followed by the residential sector (19%), the waste sector (4%), and the industrial sector producing only less than 1% (Figure 3.2).
City of Chico Community GHG Emissions by Sector (2005)
Residential19%
Commercial23%
Transportation54%
Waste4%
Industrial<1%
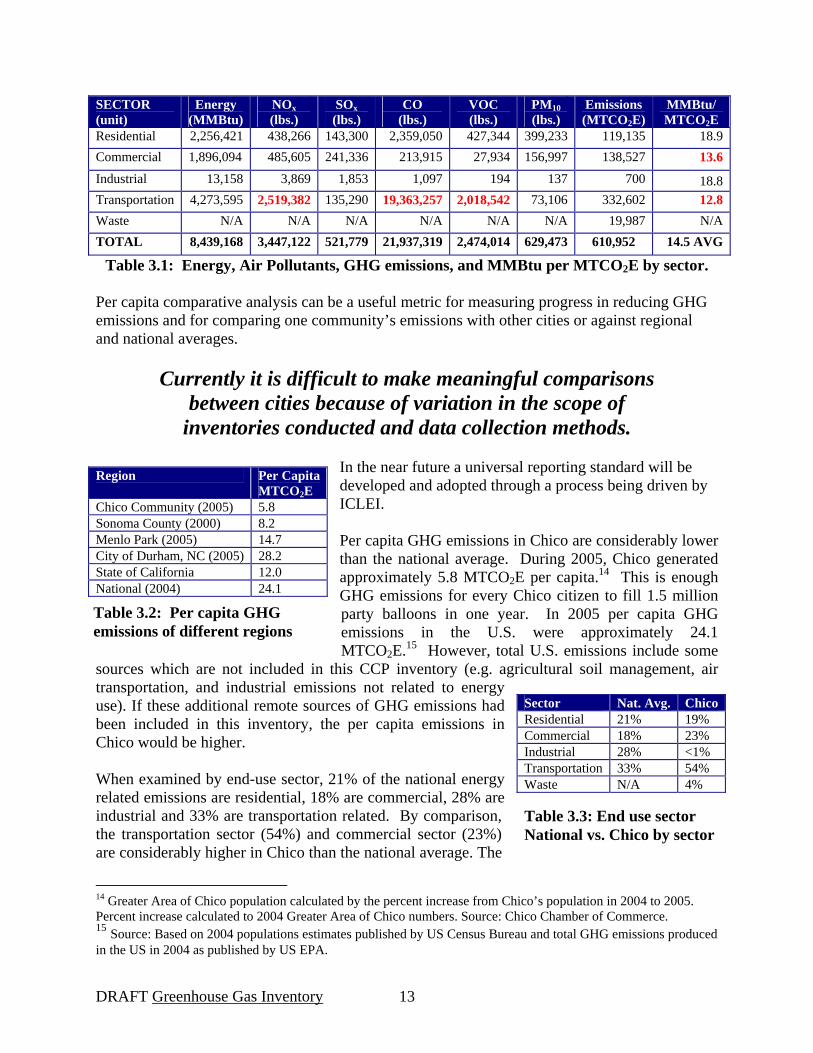
Table 3.1 provides a summary of energy use, CAP and GHG emissions produced by each sector. The number in the last column of Table 3.1 represents the amount of energy (MMbtu) per amount of GHG emissions (MTCO2E). This ratio provides an indicator that demonstrates the efficiency of each sector in terms of GHG emissions (a lower number indicates lower efficiency). The transportation sectors scored the lowest rating primarily because the burning of fossil fuels (especially gasoline and diesel) emits large amounts on CO2 per unit of energy combined by the relatively low efficiency of today’s automobile.
Figure 3.2: Community greenhouse gas emissions by sector (2005)
DRAFT Greenhouse Gas Inventory 13
Table 3.3: End use sector National vs. Chico by sector
Table 3.2: Per capita GHG emissions of different regions
SECTOR (unit)
Energy (MMBtu)
NOx (lbs.)
SOx (lbs.)
CO (lbs.)
VOC (lbs.)
PM10 (lbs.)
Emissions (MTCO2E)
MMBtu/ MTCO2E
Residential 2,256,421 438,266 143,300 2,359,050 427,344 399,233 119,135 18.9 Commercial 1,896,094 485,605 241,336 213,915 27,934 156,997 138,527 13.6 Industrial 13,158 3,869 1,853 1,097 194 137 700 18.8 Transportation 4,273,595 2,519,382 135,290 19,363,257 2,018,542 73,106 332,602 12.8 Waste N/A N/A N/A N/A N/A N/A 19,987 N/A TOTAL 8,439,168 3,447,122 521,779 21,937,319 2,474,014 629,473 610,952 14.5 AVG
Table 3.1: Energy, Air Pollutants, GHG emissions, and MMBtu per MTCO2E by sector. Per capita comparative analysis can be a useful metric for measuring progress in reducing GHG emissions and for comparing one community’s emissions with other cities or against regional and national averages.
Currently it is difficult to make meaningful comparisons between cities because of variation in the scope of
inventories conducted and data collection methods.
In the near future a universal reporting standard will be developed and adopted through a process being driven by ICLEI. Per capita GHG emissions in Chico are considerably lower than the national average. During 2005, Chico generated approximately 5.8 MTCO2E per capita.14 This is enough GHG emissions for every Chico citizen to fill 1.5 million party balloons in one year. In 2005 per capita GHG emissions in the U.S. were approximately 24.1 MTCO2E.15 However, total U.S. emissions include some
sources which are not included in this CCP inventory (e.g. agricultural soil management, air transportation, and industrial emissions not related to energy use). If these additional remote sources of GHG emissions had been included in this inventory, the per capita emissions in Chico would be higher. When examined by end-use sector, 21% of the national energy related emissions are residential, 18% are commercial, 28% are industrial and 33% are transportation related. By comparison, the transportation sector (54%) and commercial sector (23%) are considerably higher in Chico than the national average. The
14 Greater Area of Chico population calculated by the percent increase from Chico’s population in 2004 to 2005. Percent increase calculated to 2004 Greater Area of Chico numbers. Source: Chico Chamber of Commerce. 15 Source: Based on 2004 populations estimates published by US Census Bureau and total GHG emissions produced in the US in 2004 as published by US EPA.
Region Per Capita MTCO2E
Chico Community (2005) 5.8 Sonoma County (2000) 8.2 Menlo Park (2005) 14.7 City of Durham, NC (2005) 28.2 State of California 12.0 National (2004) 24.1
Sector Nat. Avg. Chico Residential 21% 19% Commercial 18% 23% Industrial 28% <1% Transportation 33% 54% Waste N/A 4%

DRAFT Greenhouse Gas Inventory 14
City of Chico Community GHG Emissions by Source (2005)
Waste3.7%
Diesel 9.4%
Fuel Wood 0.3%
Natural Gas18.4%
Gasoline 44.8%
Electricity23.3%
Figure 3.3: Community GHG emissions by source (2005)
Figure 3.4: Community air pollutants by sector
0%
20%
40%
60%
80%
100%
Perc
ent
NOX SOX CO VOC PM10
Critera Air Pollutants
Community Air Pollutants by Sector
Industrial
CSU, Chico
Commercial
Residential
Transportation
residential sector (19%) and industrial (<1%) is lower than the national average. It is worth noting that national end use data excludes GHG emissions derived from waste, so comparing other sectors can be misleading. Furthermore, because Chico possesses such a small amount of industry it is difficult to make meaningful comparisons to national averages where industry plays a large role in GHG emissions.
3.2.2. Source of Community Greenhouse Gas Emissions This section provides an analysis of GHG emissions by fuel type. The majority of GHG emissions generated by the Chico community originate from gasoline which generated nearly half of all community GHG emissions. The second largest source of GHG emissions was electricity (23.3%), followed by natural gas (18.4%), diesel (9.4%), waste (3.7%), and fuel wood (0.3)% (Figure 3.3).
3.2.3. Community Generated Air Pollutants According to the EPA, the air-shed Chico belongs to recently ranked third worst in California. A recent article in the Enterprise Record claimed that Chico was the only city in the air-shed that was out of compliance with recently adopted standards for particulate matter.16 In 2005 the Chico Community generated
602,576 lbs of particulate matter smaller than 10mm, 438,466 lbs of sulfur dioxide, 2,469,843 lbs of volatile organic compounds, 813,500 lbs of nitrogen oxides, and 21,903,351 lbs. of carbon monoxide. The transportation sector produced about 80% of all community generated nitrogen oxides, carbon monoxide, and volatile organic compounds. The residential sector was the largest emitter of particulate matter, generating roughly 60% (Figure 3.4).
16 Chico Enterprise Record—Article ID: 8084706, Section: Local , January 26, 2008, Author: Steve Schoonover
DRAFT Greenhouse Gas Inventory 15
Figure 3.6: Residential criteria air pollutants by source
0%10%20%30%40%50%60%70%80%90%
100%
Perc
ent
NOX SOX CO VOC PM10
Criteria Air Pollutants
Residental CAPs Emissions by Source
Natural Gas
Electricty
Fuelwood
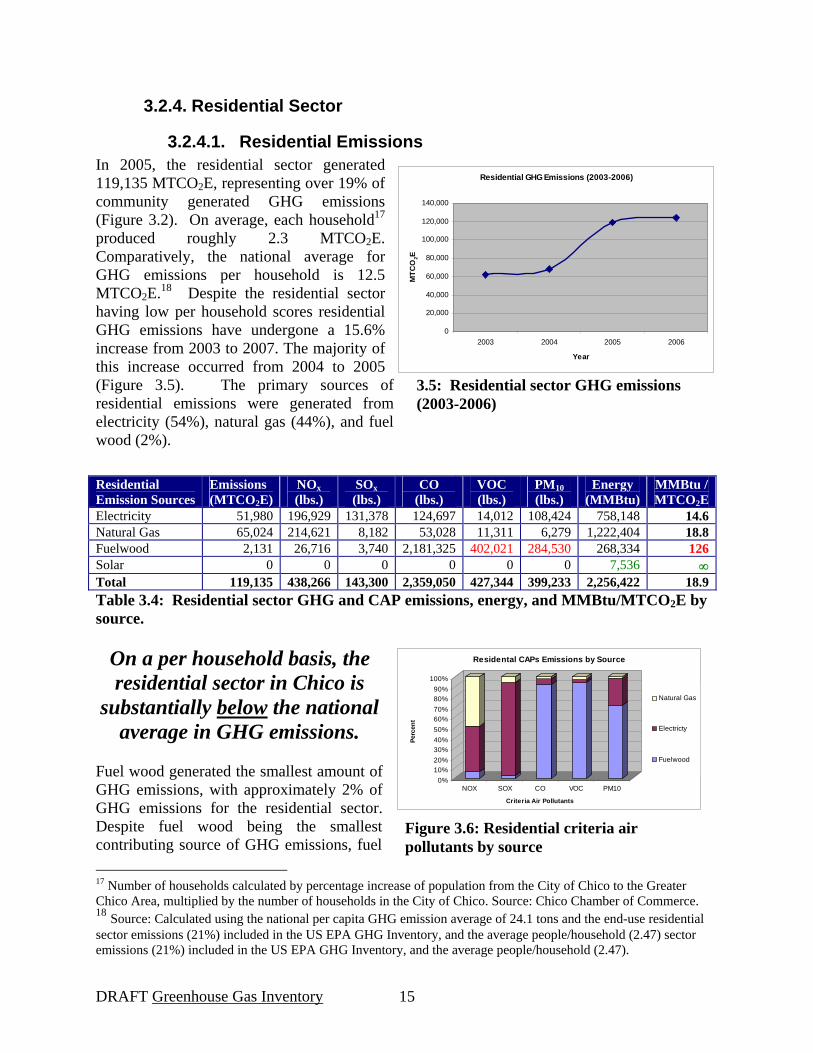
3.5: Residential sector GHG emissions (2003-2006)
Residential GHG Emissions (2003-2006)
0
20,000
40,000
60,000
80,000
100,000
120,000
140,000
2003 2004 2005 2006
Year
MTC
O2E
3.2.4. Residential Sector
3.2.4.1. Residential Emissions In 2005, the residential sector generated 119,135 MTCO2E, representing over 19% of community generated GHG emissions (Figure 3.2). On average, each household17 produced roughly 2.3 MTCO2E. Comparatively, the national average for GHG emissions per household is 12.5 MTCO2E.18 Despite the residential sector having low per household scores residential GHG emissions have undergone a 15.6% increase from 2003 to 2007. The majority of this increase occurred from 2004 to 2005 (Figure 3.5). The primary sources of residential emissions were generated from electricity (54%), natural gas (44%), and fuel wood (2%).
Table 3.4: Residential sector GHG and CAP emissions, energy, and MMBtu/MTCO2E by source.
On a per household basis, the residential sector in Chico is
substantially below the national average in GHG emissions.
Fuel wood generated the smallest amount of GHG emissions, with approximately 2% of GHG emissions for the residential sector. Despite fuel wood being the smallest contributing source of GHG emissions, fuel 17 Number of households calculated by percentage increase of population from the City of Chico to the Greater Chico Area, multiplied by the number of households in the City of Chico. Source: Chico Chamber of Commerce. 18 Source: Calculated using the national per capita GHG emission average of 24.1 tons and the end-use residential sector emissions (21%) included in the US EPA GHG Inventory, and the average people/household (2.47) sector emissions (21%) included in the US EPA GHG Inventory, and the average people/household (2.47).
Residential Emission Sources
Emissions (MTCO2E)
NOx (lbs.)
SOx (lbs.)
CO (lbs.)
VOC (lbs.)
PM10 (lbs.)
Energy (MMBtu)
MMBtu / MTCO2E
Electricity 51,980 196,929 131,378 124,697 14,012 108,424 758,148 14.6 Natural Gas 65,024 214,621 8,182 53,028 11,311 6,279 1,222,404 18.8 Fuelwood 2,131 26,716 3,740 2,181,325 402,021 284,530 268,334 126 Solar 0 0 0 0 0 0 7,536 ∞ Total 119,135 438,266 143,300 2,359,050 427,344 399,233 2,256,422 18.9

DRAFT Greenhouse Gas Inventory 16
Commercial GHG Emissions (2003-2006)
0
20,000
40,000
60,000
80,000
100,000
120,000
140,000
160,000
2003 2004 2005 2006
Year
MTC
O2E
wood does produce an enormous amount of air pollution. For example, fuel wood only generated 12% of total residential energy yet it generated 71% of particulate matter, 94% of volatile organic compounds, and 92% of carbon monoxide. Residential criteria air pollutants are illustrated in Figure 3.6.
3.2.5. Commercial Sector
3.2.5.1. Commercial Emissions The commercial sector generated 138,527 MTCO2E, representing 23% of community generated GHG emissions (Figure 3.2). In comparison, the commercial sector produces 17% of the total national fossil fuel derived GHG emissions or 4.1 MTCO2E per capita19. On average, each employee in Greater Chico Area produced 2.9 MTCO2E, or 1.3 MTCO2E per capita, which is lower than the national average.
19 Source: EPA National GHG Inventory.
Chico Residential Solar There are over 200 residential grid-tied solar projects in Greater Chico Area possessing an inverter capacity of 1.1 megawatts. These solar projects have the potential to produce roughly 2,000 MWh annually. By producing this electricity with energy from the sun rather than from the local utility the residential sector achieves over a 450 MTCO2E reduction. In addition to this considerable GHG emissions reduction, the solar projects also decrease air pollution and are impervious to electricity price increases.
Figure 3.7: Commercial GHG emissions (2003-2006)

DRAFT Greenhouse Gas Inventory 17
Commercial Sector Emissions by Sub-Sector (2005)
Other Commercial
69%
CSU, Chico26%
City Government5%
Analyzing commercial sector GHG emissions by end use sub-sectors reveal that only 5% were generated by the City of Chico municipal government. Sixty-nine percent were produced by other businesses and roughly one quarter of all commercial GHG emissions were produced by CSU, Chico.
Table 3.5: Commercial sub-sector energy use and GHG emissions
CSU, Chico generated GHG emissions were higher than all other sub-sectors in terms of energy per MTCO2E (Table 3.5). The University’s low energy to GHG emissions ratio results from the source of electricity purchased by CSU, Chico. CSU, Chico buys their electricity from Arizona Power Supply (APS). APS generates their electricity from a variety of sources, as do most utilities. What differentiates APS from PG&E and nearly all west coast utilities is that over 40% of their “grid-mix” originates from coal and coal-generated electricity produces large amounts of GHG and CAP emissions. GHG emissions from the commercial sector originated from two sources: electricity and natural gas. The majority of commercial sector emissions were produced from electricity (66%), with the remainder originating from natural gas (34%). Solar generated electricity was responsible for producing only 2% of electrical energy (MMBtu) but resulted in no GHG or CAP emissions.
Commercial Sub-sector
Energy (MMBtu)
GHG (MTCO2E)
MMBtu MTCO2E
Municipal Government 94,004 6,678 14.0 CSU, Chico 216,488 36,599 5.9 Other Commercial 1,585,542 95,250 17.1 TOTAL 1,895,994 138,527 13.7
Figure 3.8: Commercial sector GHG emissions by sub-sector (2005)

DRAFT Greenhouse Gas Inventory 18
Table 3.7: Chico commuter behavior
Fuel Type Total Energy (MMBtu)
NOx (lbs.)
SOx (lbs.)
CO (lbs.)
VOC(lbs.)
PM10 (lbs.)
GHGs (MTCO2E)
Electricity 988,054 32,465 22,113 20,201 2,260 16,844 91,178 Natural Gas 890,127 10,259 0 1,392 366 293 47,349 Solar 17,812 0 0 0 0 0 0 Total 1,895,993 45,155 29,688 22,085 2,709 17,427 138,527
Table 3.6: Commercial sector: 2005 energy use, CAP & GHG emissions by fuel type
3.2.6. Transportation Sector
3.2.6.1. Background Chico’s transportation network is characterized by two State Highways. California State Highway 99 runs north/south and California State Highway 32 runs east/west. Arterial streets provide regional and local access. The majority of Chico residents reside in the City of Chico limits. Compared to other cities, mobility within the City is generally good with an average commute time of 17.4 minutes. The low commute time results from the City’s compact form and the availability of commercial centers, educational institutions, medical facilities, and recreational sites within city limits. Despite efforts to create a balanced transportation system that serves bicyclists and pedestrians, roughly 70 percent of commuters commute in single-occupancy vehicles (Table 3.7).20 The transportation sector includes GHG emissions generated from privately and publicly owned passenger vehicles, transport trucks, public transit vehicles, and all other on-road vehicles associated with personal, commercial, industrial, and government activities. Information for this sector was obtained from the California Public Road Data—Highway Performance Monitoring System. This annual report provides daily vehicle miles traveled for the the Greater Chico Area.21
20 U.S Census for Chico, CA. 21 Source: http://ww.dot.ca.gov/hq/tsip/hpms/detalibrariy.php
Commuter Behavior Percent Drive Alone 70 Carpool/Vanpool 12.6 Public Transportation 1.9 Walk 5.5 Other 6.2 Work From Home 3.8
Chico Commercial Solar There are about 20 commercial grid-tied solar projects in Chico with an inverter capacity of 2.6 megawatts. These projects have the potential to produce over 5,000 MWh annually. By producing this electricity with energy from the sun rather than from the local utility the residential sector achieves over a 1,200 MTCO2E reduction. In addition to this considerable GHG emissions reduction, the solar projects also decrease air pollution and are impervious to electricity price increases.

DRAFT Greenhouse Gas Inventory 19
Community Transportation GHG Emissions(2004-2007)
280,000
290,000
300,000
310,000
320,000
330,000
340,000
2004 2005 2006
Year
MTC
O2E
3.2.6.2. Transportation Sector Emissions Overall, the transportation sector produced 332,602 MTCO2E, representing about 54% of all community GHG emissions (Figure 3.9). Eighty-three percent of transportation sector emissions were generated from the combustion of gasoline, while the remaining 17% originate from the combustion of diesel.
The transportation sector generates more GHG and CAP emissions than all other community sectors combined.
In addition, the transportation sector is responsible for roughly 83% of all community CAP emissions—claiming 73% of the nitrous oxides, 26% of sulfur dioxide, 88% of carbon monoxide, 81% of the volatile organic compounds, and 11% of particulate matter smaller than 10 millimeters (Figure 3.4). For a complete breakdown of transportation generated energy, CAP, and GHG emissions refer to Table 3.8.
Fuel Type Total Energy (MMBtu)
NOx (lbs.)
SOx (lbs.)
CO (lbs.)
VOC (lbs.)
PM10 (lbs.)
GHGs (MTCO2E)
Gasoline 1,020,558 468,907 28,531 5,404,700 552,563 10,444 79,180 Diesel 211,907 238,482 10,209 190,842 25,872 9,699 16,685 Total 1,232,465 707,389 38,740 5,595,541 578,435 20,143 95,865
Table 3.8: Transportation Sector: 2005 energy use, CAP & GHG emissions by fuel type.
3.2.7. Solid Waste Sector
3.2.7.1. Background There are currently two waste disposal companies serving the Chico urban area: NorCal Waste Systems and North Valley Waste Management. Each company disposes the majority of collected waste to two separate landfills22. North Valley Waste Management transports waste to the Neal Road Landfill while NorCal Waste Systems transports waste to Ostrum Road Landfill in Sutter County. Both landfills use similar methods of handling waste. Daily operations consist of covering waste with a minimum of six inches of soil23 and/or tarps. Eventually modules are closed and covered with twelve inches of soil and capped with a 40 mil geo-membrane followed by twelve inches of
22 Roughly 1.3% of Chico waste goes to the following landfills: Altamont L.F. (Alameda), Bakersfield S.L.F. (Kern), Azusa L.R. (Los Angeles), Sacramento County L.F., North County L.F (San Joaquin). 23 It is also common to use wastewater sludge/cake as an alternative to soil.
Figure 3.9: Transportation sector greenhouse gas emissions (2004-2006).
DRAFT Greenhouse Gas Inventory 20
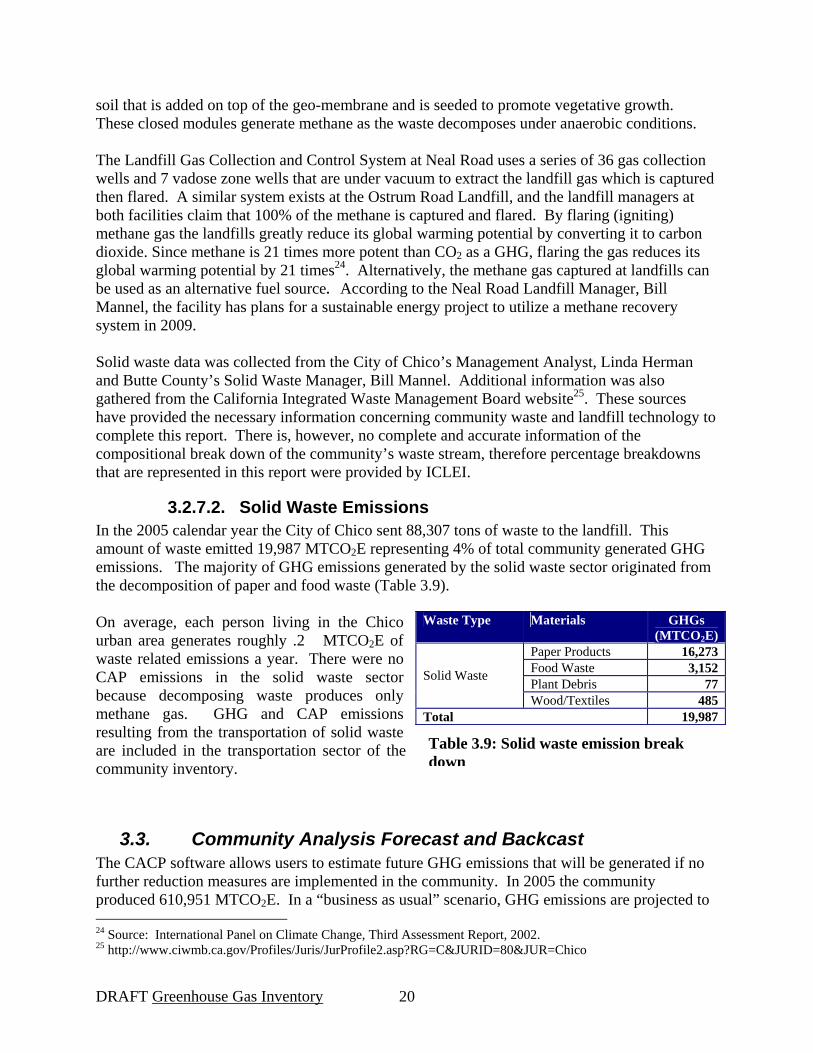
Table 3.9: Solid waste emission break down
soil that is added on top of the geo-membrane and is seeded to promote vegetative growth. These closed modules generate methane as the waste decomposes under anaerobic conditions. The Landfill Gas Collection and Control System at Neal Road uses a series of 36 gas collection wells and 7 vadose zone wells that are under vacuum to extract the landfill gas which is captured then flared. A similar system exists at the Ostrum Road Landfill, and the landfill managers at both facilities claim that 100% of the methane is captured and flared. By flaring (igniting) methane gas the landfills greatly reduce its global warming potential by converting it to carbon dioxide. Since methane is 21 times more potent than CO2 as a GHG, flaring the gas reduces its global warming potential by 21 times24. Alternatively, the methane gas captured at landfills can be used as an alternative fuel source. According to the Neal Road Landfill Manager, Bill Mannel, the facility has plans for a sustainable energy project to utilize a methane recovery system in 2009. Solid waste data was collected from the City of Chico’s Management Analyst, Linda Herman and Butte County’s Solid Waste Manager, Bill Mannel. Additional information was also gathered from the California Integrated Waste Management Board website25. These sources have provided the necessary information concerning community waste and landfill technology to complete this report. There is, however, no complete and accurate information of the compositional break down of the community’s waste stream, therefore percentage breakdowns that are represented in this report were provided by ICLEI.
3.2.7.2. Solid Waste Emissions In the 2005 calendar year the City of Chico sent 88,307 tons of waste to the landfill. This amount of waste emitted 19,987 MTCO2E representing 4% of total community generated GHG emissions. The majority of GHG emissions generated by the solid waste sector originated from the decomposition of paper and food waste (Table 3.9). On average, each person living in the Chico urban area generates roughly .2 MTCO2E of waste related emissions a year. There were no CAP emissions in the solid waste sector because decomposing waste produces only methane gas. GHG and CAP emissions resulting from the transportation of solid waste are included in the transportation sector of the community inventory.
3.3. Community Analysis Forecast and Backcast The CACP software allows users to estimate future GHG emissions that will be generated if no further reduction measures are implemented in the community. In 2005 the community produced 610,951 MTCO2E. In a “business as usual” scenario, GHG emissions are projected to 24 Source: International Panel on Climate Change, Third Assessment Report, 2002. 25 http://www.ciwmb.ca.gov/Profiles/Juris/JurProfile2.asp?RG=C&JURID=80&JUR=Chico
Waste Type Materials GHGs (MTCO2E)
Paper Products 16,273 Food Waste 3,152 Plant Debris 77
Solid Waste
Wood/Textiles 485 Total 19,987

DRAFT Greenhouse Gas Inventory 21
increase 64%, or to 1,004,161 MTCO2E, by the year 2020. This projection is based off annual percent increases in population, households, commercial establishments, waste tonnage, gasoline, diesel, natural gas and electricity. In most cases growth rates were derived from multiple year data sets that were gathered for this report. In addition to the future projection Figure 3.10 also includes a reverse projection, or backcast. In order to find 1990 GHG emissions levels ICLEI recommended using 25% below 2005 levels to find the Kyoto Protocol target. Seven percent above Kyoto levels represents the amount of GHG emissions generated by the Chico community in 1990, or 490,287 MTCO2E26.
Figure 3.10: City of Chico GHG emissions projection (2005-2020)
26 ICLEI USA.

DRAFT Greenhouse Gas Inventory 22
Figure 4.1: City of Chico government emissions analysis by sector.
Figure 4.2: Government generated GHG emissions by sector.
4. Government Analysis
4.1. Government Analysis Scope The government analysis covers all buildings and facilities, operations, programs, the employee commute, and vehicles owned and operated directly by the City of Chico municipal government. Data acquisition and results have been divided into the following sectors: buildings, vehicle fleet, employee commute, streetlights, water/sewage, and waste (Figure 4.1). The baseline year for the government analysis is 2005. Energy, fuel, and waste data were collected for 2005. Data for adjacent years was also collected based on availability. The government analysis is more detailed than the community analysis because the data is more refined as it includes detail for more sectors and identifies specific point sources of emissions and air pollutants.
4.2. Government Analysis Results
4.2.1. Overview In 2005, the City of Chico Government operations generated 6,678 MTCO2E and consumed approximately 94,000 MMBtu of energy. Cost associated with this energy use was near $1.9 million.
Government GHG Emissions by Sector (2005)
Buildings12%
Vehicle Fleet26%
Employee Commute
22%
Streetlights13%
Water/Sewage25%
Waste2%

DRAFT Greenhouse Gas Inventory 23
Figure 4.4: City of Chico government generated criteria air pollutants by sector
0%
20%
40%
60%
80%
100%
NOX SOX CO VOC PM10
Critera Air Pollutant
Government Criteria Air Pollutants by Sector (2005)
Water/Sew age
Streetlights
Commute
Vehicle Fleet
Buildings
Figure 4.3: Government GHG emissions by source
Goverment GHG Emissions by Source (2005)
Diesel10%
Electricity 37%
Waste2%
Gasoline38%
Natural Gas13%
Figure 4.2 shows the percentage of GHG emissions emitted from each sector. GHG emissions associated with the vehicle fleet and the Water Pollution Control Plant account for roughly half of all government generated GHG emissions. The third largest GHG emissions generating sector was the employee commute accounting for 22%, followed by the streetlights sector (13%), the buildings sector (12%), and the waste sector accounting for only 2% of all government generated emissions.
4.2.2. Source of Government Greenhouse Gas Emissions GHG emissions generated by the City of Chico government originate from five primary sources. Figure 4.3 shows that the majority of GHG emissions were generated from gasoline (38%), followed by purchased electricity (37%), natural gas (13%), diesel (10%), and waste (2%). Combined gasoline and diesel fuel emissions represent nearly half of all government generated emissions. GHG emissions resulting from the combustion of gasoline and diesel fuels are exclusively from the vehicle fleet and employee commute sectors. GHG emissions resulting from natural gas originate from the heating of government buildings and the heating of the digesters at the Water Pollution Control Plant (WPCP). GHG emissions resulting from electricity originate from the electrical use in government buildings and from electrical pump stations associated with the WPCP.
4.2.3. Government Generated Air Pollutants In 2005, the most abundant criteria air pollutant (CAP) emission generated from government operations was carbon monoxide. The second most emitted criteria air pollutant emissions were nitrogen oxides, followed by volatile organic compounds, sulfur dioxide, and particulate matter. Nearly all of the carbon monoxide and volatile organic compounds were emitted from the vehicle fleet and employee commute sector as a result of the combustion of gasoline and diesel (Figure 4.4).

DRAFT Greenhouse Gas Inventory 24
Table 4.1: Criteria air pollutants by sector.
Table 4.2 Vehicle fleet GHG emissions, energy, gallons and cost.
CAP emissions nitrogen oxides, sulfur dioxide, and particulate matter were more evenly distributed throughout the government sectors. For a complete breakdown of government generated criteria air pollutants refer to Table 4.1.
4.2.4. Vehicle Fleet Sector Analysis The vehicle fleet sector contributed 1,736 MTC02E, representing approximately 26%, of total government generated emissions (Figure 4.2). GHG emissions generated from this sector originate from the burning of gasoline and diesel in city owned/operated vehicles. In 2005 the city purchased approximately 120,600 gallons of gasoline costing $252,731. Additionally, the City purchased 59,558 gallons of diesel costing $139,460. Combined, the City purchased 180,158 gallons of transportation fuel costing over $390,000. The 2005 City of Chico fleet was composed of over 360 gasoline and diesel combusting vehicles and equipment that may be divided into sub-fleets as indicated in Figure 4.5. In addition to gasoline and diesel powered vehicles there is at least one WPCP vehicle that has flexible-fuel capability. More specifically this vehicle has the capacity to run on either gasoline or compressed natural gas (CNG). Because the amount of CNG is negligible it has been omitted in this report.
SECTOR NOX (lbs.)
SOX (lbs.)
CO (lbs.)
VOC (lbs.)
PM10(lbs.)
Buildings 2,740 1,301 1,420 181 1,072 Vehicle Fleet 15,210 734 78,077 8,224 500 Commute 7,848 517 87,273 9,168 224 Streetlights 3,352 2,236 2,123 239 1,846 Water/Sewage 6,028 2,832 3,106 398 2,332 TOTAL 35,178 7,620 171,999 18,210 5,974
Source MTCO2E MMBtu Gallons Cost Gasoline 1163 15,019 120,600 $252,730 Diesel 574 7293 59,588 $139,458 TOTAL 1737 22,312 180,188 $392,188

DRAFT Greenhouse Gas Inventory 25
Figure 4.5: Fleet sector GHG emissions by fleet and source (2005).
0 100 200 300 400 500 600 700
MTCO2E
City ManagerParking MetersBuilding Maint.
GarageAnimal Control
AviationBuilding
EngineerSewer
ST TreesParkCard
Street CleaningPublic Row
FirePolice
Dep
artm
ent
Vehicle Fleet GHG Emissions by Sector and Source (2005)
Gasoline Diesel
Figure 4.5 shows that of the sixteen sub-fleets, GHG emissions generated by the police department far exceeded those of other departments. The police department represents 37% of all vehicle fleet emissions and originated almost entirely from gasoline. The fire department ranked second, claiming 13% of all vehicle fleet sector emissions and over 40% of all diesel generated emissions within the sector.
0
50,000
100,000
150,000
200,000
250,000
Gal
lons
1998
-99
1999
-00
2000
-01
2001
-02
2002
-03
2003
-04
2004
-05
2005
-06
2006
-07
Fiscal Year
Government Fleet Fuel Usage in Gallons by Fiscal Year
Gasoline Diesel
Figure 4.6: Government fleet fuel usage in gallons by fiscal year.

DRAFT Greenhouse Gas Inventory 26
Building Sector GHG Emissions (2005-2007)
680
700
720
740
760
780
800
820
840
860
2005 2006 2007
Year
MTC
O2E
Figure 4.7: Building sector GHG emissions (2005-2007)
4.2.5. Building Sector Analysis In 2005 the building sector generated 768 MTC02E, representing about 11.5% of total government generated emissions (Figure 4.2). GHG emissions generated from this sector originate from purchased electricity and natural gas. Electricity is primarily used in City buildings for lighting and office equipment. In 2005 the City purchased $300,590 of electricity, which averages to $12,024 of electricity per each building. In addition, the City purchased $63,909 of natural gas, which averages to $2,556 of natural gas per building. Natural gas is primarily used to heat water and air in the buildings.
0 50 100 150 200 250 300 350
MTCO2E
Sweeney & Sweeny BldgGSD Administration Bldg
CMA Field OperationsOld Municipal Building
Amtrak/Chico Art CenterCMA Terminal Building
Parking StructureChico MuseumFire Station #4Fire Station #2Fire Station #3
City Council BldgFire Station #5
Chico Police Dept901 Fir St. Building Group
Chico Municipal Center
Bui
ldin
g
Building GHG Emissions by Location and Source (2005)
Electricity Natural Gas
Figure 4.8: City of Chico government GHG emissions by building and source (2005).
Greening the City Fleet The City has made efforts to improve the efficiency of its fleet by purchasing ten hybrid vehicles. Of the ten hybrids four were purchased in 2005 or prior and have been included in the 2005 analysis. The remaining six were purchased after 2005 and were not included in the 2005 analysis.

DRAFT Greenhouse Gas Inventory 27
Steetlight GHG Emissions by Sub-Sector
Streetlights (PG&E)
26%
Traffic Control8%
Park Lighting4%
Streetlights (City)62%
Figure 4.9: Percent of streetlight sector greenhouse gas emissions by type of light.
Table 4.3: Streetlight by type, GHG, energy, and cost.
The Chico Municipal Center generated the most GHG emissions of any City building. The 901 Fir St. Building Group contributed the second largest amount of GHG emissions followed by the Police Department. The 901 Fir St. Building Group includes GSD/Field Supervisor Office, Central Garage, Carpenter/Sign-Shop, GSD Warehouse, Fire Training Center, Fire Training Tower, Crime Lab Storage, and the Coverage Storage Shelters. It must be noted that all these building are grouped because there is no sub-metering for any of these facilities.
4.2.6. Waste Sector Analysis In 2005 the government produced 644 tons of waste which in turn generated 155 MTCO2E, representing only 2% of total government GHG emissions (Figure 4.2). Emissions from this sector include waste that was generated by local government operations. More specifically, this sector includes all waste generated from government operations, employee waste, and waste generated at municipal government facilities including parks and buildings. The majority of emissions generated in the waste sector originated from the decomposition of paper, claiming over 75% of all waste sector GHG emissions. This is likely due to the intensive use of paper products that is associated with many municipal governments. Food waste ranked second in GHG emission production generating nearly 15%, followed by plant debris (10%) and wood and textiles (about 2.5%).
4.2.7. Streetlights Sector Analysis In 2005 the streetlight sector generated 885 MTCO2E, representing 13.2% of total government generated GHG emissions (Figure 4.2). These emissions originate entirely from purchased electricity used to illuminate street and highway lights, traffic control signal lights, and various city park lighting costing the city $622,879. Eighty-eight percent of emissions generated by the streetlights sector were generated from streetlights either owned by the City or PG&E (Figure 4.9). Each streetlight uses about 1.5 MMBtu of energy, cost about $125, and generates one-tenth of a
MTC02E annually. The City currently uses high- pressure sodium vapor lamps which are one of the most energy-efficient street light technologies available. In contrast, traffic
Type of Streetlight MTCO2E MMBtu MMBtu/ MTCO2E
Cost
Streetlights (PG&E Owned) 230 3,354 14.6 $306,517 Streetlights (City Owned) 551 8,034 14.6 $247,134 Traffic Signal Control Lights 70 1,026 14.7 $49,683 Park Lighting 34 491 14.4 $19,545 Total 885 12,905 14.6 $622,879

DRAFT Greenhouse Gas Inventory 28
control signals are much more energy intensive, cost significantly more to operate and generate nearly seven times the amount of GHG emissions per light unit. The majority of the traffic control signal lights in the City of Chico are LED lights, again the most energy-efficient type of signal available.
4.2.8. Water and Sewage Sector Background The City of Chico operates one Water Pollution Control Plant (WPCP) on the east edge of town on Chico River Road (4827 Chico River Rd). In 2005 the WPCP treated over 7,000 million gallons per day (GMD). The WPCP is connected to over 28,000 homes. Wastewater from the city, with the help of 10 lift pump stations, flows downward to the WPCP where the wastewater goes through a process of being physically and chemically broken down and treated. The WPCP uses a secondary treatment process using anaerobic digestion to separate the toxic chemicals and solids from the water—this process creates methane as a byproduct. The captured methane can either be flared to reduce its harmful effects on the environment or can be used as fuel source in cogeneration. Once the liquids are separated from the solids, the water then undergoes a chemical process to treat the affected water. Once the water is cleaned to EPA standards, the secondary treated plant water is discharged into the Sacramento River. The remaining solid residuals are placed in large drying bins and the cake must be at a minimum of 50% dried before it can be hauled off to the landfill. Approximately 1,100 dried tons of cake (bio-solids) are produced each year at the WPCP and hauled off to the Neal Road Landfill where it is used as landfill cover material. In 1984 the WPCP was reusing its captured methane in a Co-generation process that was able to produce approximately 50% of the plant’s output during that year. This system went off line in 2004 due to mechanical problems. The WPCP is currently under process of expansion and the city is estimating that by November 2009 the plant should have a new co-generation system up and running to reduce its electricity even further. In October of 2005 the solar project came on line, with the installation of a 1.1 megawatt on-site solar photovoltaic power system providing approximately 40% of the WPCP’s electrical needs. Most cities find their wastewater treatment facilities have a high impact on the total level of GHG emissions. Due to the positive steps Chico has already taken, by installing an on-site solar photovoltaic power system, this sector does not have an outstanding impact on the total government generated emissions. The solar photovoltaic system installed in 2005 curbed 47 MTCO2E from being emitted into the atmosphere. The plant could take additional steps to make another leap forward by using its end byproducts for better use. More specifically the city could be reusing the treated water for irrigation, instead of discharging it into the Sacramento River. This could save millions of gallons of water from having to be pumped from the Tuscan Aquifer. Additionally, bio-solids could be composted instead of sent to the landfill and utilized as a nutrient rich fertilizer.

DRAFT Greenhouse Gas Inventory 29
Figure 4.10: Water and sewage GHG emissions (2005-2007).
Water/Sewage GHG Emissions (2005-2007)
1000
1100
1200
1300
1400
1500
1600
1700
1800
2005 2006 2007
Year
MTC
O2E
4.2.9. Sewage Sector Emissions The water and sewage sector is the second largest contributor of GHG emissions to the City government’s carbon footprint, having generated 1,691 MTCO2E in 2005. This represents about 25% of total government generated GHG emissions (Figure 4.2). Nearly all (99%) of the emissions originating from the water/sewage sector were generated from the Water Pollution Control Plant (WPCP). This is primarily due to the energy intensive process of wastewater treatment. However, it must be noted that the majority of local water services are provided by Cal Water. Emissions generated by Cal Water have been omitted from this analysis because the City has no ownership of or control over this entity. Sixty-four percent of GHG emissions generated in the water and sewage sector originated from purchased electricity. The remaining 36% originated from the combustion of natural gas used to heat digesters and other operations. In addition to GHG emissions generated by purchased electricity and natural gas the WPCP also emits methane from the digesters that decompose human waste. This methane is flared, or ignited, and never reaches the atmosphere, greatly reducing its global warming potential. Alternatively, the methane gas could potentially be utilized as an on-site fuel source to heat the digesters, reducing the WPCP’s natural gas consumption.
4.2.10. Employee Commute Sector Analysis Although not considered part of the direct city operations, emissions from the employee commute were assessed in this report because there are potential reduction measures that could influence employee commuting behavior. The employee commute sector has one characteristic that distinguishes it from all other government sectors:
The employee commute represents the only sector in which city employees have complete control over the amount of GHG
emissions and air pollution generated. Data for the employee commute sector was gathered by survey (see APPENDIX B). Out of 427 city employees, 157 (37%) completed and returned the survey. The survey results were extrapolated to represent the entire employee population. The primary aim of the survey was to determine the amount of miles driven by city employees for their respective vehicle types,

DRAFT Greenhouse Gas Inventory 30
City Employee Commuter Vehicle Breakdown
2.4%
3.0%
18.1%
10.7% 13.3%21.4%
19.7%
11.1%
0.1% Motorcycle Hybrid Auto: Compact
Auto: Mid-Size
Auto: Full-Size
Truck/SUV: Lg.
Truck/SUV: Med.
Truck/SUV: Sm.
Transit Bus
Figure 4.11: Employee commuter vehicles.
enabling the calculation of GHG and CAP emissions. Secondarily, the survey was also intended to have city employees think about their driving habits. Upon analyzing the survey results the following findings surfaced (Table 4.4).
Interesting Findings From the Employee Commuter Survey • The average distance from home to work = 13 miles. • 94.6 % of city employees drive and 90% of those employees drive alone. • Only 5.4% of city employees walk/bike to work. • 3% of city employees drive hybrids. • The most popular commuting vehicle is the medium size truck/sports utility vehicle. • 10 % of city employees carpool or vanpool. • Only .1 % of city employees use the transit bus service.
Table 4.4: Findings from the employee commuter survey. The City of Chico employee commute sector generates 1,443 MTCO2E of GHG emissions a year, representing 21% of total government generated emissions (Figure 3.2). While the employee commute sector ranks as only the third largest contributing sector of GHG emissions, it is the largest contributing sector in production of criteria air pollutants (Figure 4.4).

DRAFT Greenhouse Gas Inventory 31
5. Next Steps
5.1. Milestone II: Setting an Emissions Reduction Target The establishment of a community emissions baseline and projection prepares the City to complete the next step by setting an emissions reduction target. An emissions reduction target will allow the City to develop a reasonable policy and programmatic response to reduce its contribution to global climate change. A well developed emissions reduction goal should possess the following qualities:
• Ambitious—showcase Chico as a continuing sustainable city. • Attainable—set a goal that is achievable; consider what other cities have achieved. • Agreeable—establish a goal that people in the community can agree upon. After
all, it is the changes in their behavior that will make the goal attainable.
When choosing amongst these emissions reduction targets, some issues to consider include:
1. The State has accepted the following reduction targets: − 25% below 1990 levels by 2020 − 80% below 1990 levels by 2050
2. Setting a goal that is too distant can be dangerous because implementation may be put off.
3. Cities can typically reduce first year emissions by as much as 5% by pursuing the “low hanging fruit” while the next 5% may take years.
4. Setting intermittent goals is a good way to monitor progress and stay on track. Potential GHG Emissions Reduction Targets: The city council may consider the following as potential targets to set a reasonable and obtainable goal of emissions reductions for the City and the Community.
1. 25% by 2020 Twenty-five percent below 2005 levels by the year 2020 equates to lowering emissions 2.08% per year for the next 12 years.
2. 20% by 2020
Twenty percent below 2005 levels by the year 2020 equates to lowering emissions about 1.67% per year for the next 12 years.
3. 15% by 2015
Fifteen percent below 2005 levels by the year 2015 equates to lowering emissions about 2.14% per year for the next 7 years.
4. 10% by 2010
Ten percent below 2005 levels by the year 2010 equates to lowering emissions about 5% per year for the next 2 years.

DRAFT Greenhouse Gas Inventory 32
5.2. Milestone III: Develop an Action Plan After determining an agreed upon reduction target the City of Chico will develop a cohesive Action Plan based on the information revealed in this study. Development of an action plan will likely be a multi-step process that includes: 1) research of activities undertaken by other communities; 2) prioritization of GHG emission reduction actions by City Council and the community; 3) identification of costs and benefits associated with technological and behavior changes to reduce GHG emissions; 4) selection of policies and programs; and 5) development of an implementation and education program for GHG emissions reduction for City employees, businesses and community residents.
5.2.1. Research Phase The first step to developing an action plan is to research measures, policies and programs already developed by other communities. Efforts that were successful and seem applicable to Chico will be formulated into a master list. The tables in APPENDIX C outline many of the activities undertaken by other communities to reduce their production of GHG emissions.
5.2.2. Creation of a Master List Potential measures can be both broad and creative. In some cases the City has already adopted measures that are successfully being implemented to reduce GHG emissions; these measures will also be rolled into the final strategy. Now may also be a good time to reassess the effectiveness of already implemented measures.
5.2.3. Selection of Policies and Programs Preferred policies and programs to reduce greenhouse gas emissions should be selected through a community-based planning exercise that empowers and educates residents, business owners and City staff to take ownership of efforts to reduce GHG emissions. In addition, the preferred polices and programs should be based on the following criteria:
• GHG emissions reduction potential. • Cost. • Other feasibility issues. • Additional benefits associated with the measure (i.e., quality of life, city
beautification, etc.).
5.2.4. Development of GHG Emission Reduction Strategy Selected policies and programs will be rolled into a draft of the Chico Greenhouse Gas Reduction Action Plan. The Action Plan will be made available to the public for review through the City’s website and at City Hall. A public forum will also be held to present the draft plan to the community and to solicit input. Public input may also be received through regularly scheduled meetings, written submissions, or through the development of a task

DRAFT Greenhouse Gas Inventory 33
force/committee. All public input should be reviewed and incorporated into the plan as appropriate.
5.3. Milestone IV: Implementation Plan Measures that are selected for the Chico Greenhouse Gas Reduction Action Plan are likely to be too numerous and/or expensive to implement all at once. Instead, a small contingent of key measures should be chosen for implementation in the first year or two. Once these measures have been implemented, the Plan can be revisited and a second set of measures chosen for implementation. This process should be repeated on an annual basis until the City’s GHG and CAP goals are met. The implementation plan will include:
• What is to be done. • How it is to be accomplished. • Who is responsible for what. • Where the resources will come from. • When it will be accomplished by.
5.4. Milestone V: Monitoring and Evaluation As measures are implemented, efforts must be employed to track their progress in reducing GHG and CAP emissions. City staff will perform this work and will use the CACP software, following the methods recommended by the ICLEI/CCP for tracking reductions of GHG and CAP emissions. A Community Greenhouse Gas and Criteria Air Pollutant Emissions Inventory should be completed in five year increments starting in the year 2010.
5.5. Concluding Remarks This report has broken down a complex issue, revealed clear trends and opportunities to reduce carbon production through meaningful steps to change behaviors. The rest is up to Chico!

DRAFT Greenhouse Gas Inventory 34
6. Appendix A: List of Acronyms APS – Arizona Power Supply; a utility that provides electricity to CSU, Chico. Btu – British Thermal Units; a standard unit of measure equivalent to the quantity of heat required to raise the temperature of 1 pound of water by 1 degree Fahrenheit at the temperature at which water has its greatest density (approximately 39 degrees Fahrenheit). CACP – Clean Air Climate Protection; the software used by ICLEI to calculate GHG emissions. CAP – Criteria air pollutant; a category of air pollutants including: nitrogen oxides (NOx) sulfur oxides (SOx), carbon monoxide (CO), particulate matter (PM), and volatile organic compounds (VOC), which have adverse effects on human health. CCP – Cities for Climate Protection; a program developed by ICLEI – Local Governments for Sustainability to help local governments reduce GHG emissions from their operations and communities. CNG – Compressed gatural gas; a fuel primarily composed of methane. Used as an alternative fuel to gasoline and diesel in flex-fuel vehicles or converted vehicles. EPA – Environmental Protection Agency GHG – greenhouse gas; primarily consisting of: carbon dioxide (CO2), methane (CH4), and nitrous oxide (N2O). GMD – Million of gallons per day; terminology used in wastewater treatment and water services. ICLEI – Local Governments of Sustainability (formerly the International Council for Local Environmental Initiatives). IPCC – International Panel on Climate Change kWh – Kilowatt hours; a unit commonly used to measure electricity. Equivalent to 1000 Watts. LED – Light emitting diodes; a low energy demanding lighting technology. LPG – Liquid petroleum gas; commonly referred to as propane. Used as an alternative fuel to gasoline and diesel in flex-fuel vehicles or converted vehicles.

DRAFT Greenhouse Gas Inventory 35
MMBtu – Millions of British Thermal Units. MTCO2E – Metric Tonne of Carbon Dioxide Equivalent. WPCP – Water Pollution Control Plant VMT – Vehicle miles traveled; a measure of the total distance traveled within a community. This is used to estimate fuel consumption and GHG emissions.

DRAFT Greenhouse Gas Inventory 36
7. Appendix B: Employee Commuter Survey

DRAFT Greenhouse Gas Inventory 37
8. Appendix C: Emissions Reduction Measures by Sector
8.1. Community Emissions Reduction Measures
Community Reduction Measures Residential and Commercial Reduction Measures Reduction Measure Description Renewable energy Residential and Commercial renewable energy projects will decrease the amount of purchased electricity and
resulting emissions.
Green/reflective roofing Roofs are black, which absorbs the hot summer sun and creates higher cooling costs. Adding green or reflective coating on roofing material minimizes heat absorption and diminishes cooling costs in summer.
Housing/Building retrofits Increasing efficiency in older Chico homes and buildings will decrease the amount of purchased electricity and resulting emissions. Examples of retrofits may include increased insulation, double pane windows, insulated window coverings, sealing air leaks, etc.
Water conservation through residential and commercial ordinances
Every gallon conserved is one less gallon pumped, resulting in less purchased electricity. Examples of water conserving ordinances may include volume pricing, time of use restrictions, xero-landscaping, etc.
Water conservation through technological means
Encourage use of water conservation through technological improvements. (i.e., water catchment systems, low flow toilets (dual flush toilets), shower head replacement, drip line irrigation, water/energy efficient washing machines, etc.)
Lighting retrofits More efficient lighting results in less purchased electricity and resulting emissions. Examples include converting incandescent light bulbs to compact fluorescents or fluorescent tube lighting (T8’s and T5’s).
Appliance retrofits Replacing older, less efficient appliances with Energy Star appliances will result in less purchased electricity and associated emissions.
Go beyond title 24 Promote residential and commercial construction to exceed Title 24 energy efficiency standards. Solar hot water Solar hot water heaters will reduce electrical and natural gas usage and resulting emissions. Energy audits Require energy audits at time of sale of residential and commercial properties.

DRAFT Greenhouse Gas Inventory 38
Specific Residential Measures Reduction Measure Description Woodstove retrofits Replacing older woodstoves and fireplaces with EPA /BQAQMD approved woodstoves will reduce residentially
generated particulate matter. Christmas lights exchanged Offering a LED Christmas light trade-in to Chico residents.
Specific Commercial Measures Reduction Measure Description Energy tracking Promote commercial establishments to use energy tracking and management systems (i.e., sub-metering,
TEDs™, Energy Manager position.) Occupancy sensors Promote and educate about occupancy sensors in low use areas. Lights out at night policies Implement a lights out at night policy for all commercial buildings.
HVAC retrofits Promote or provide HVAC incentives for commercial buildings. Promote LEED certified or Green Buildings Provide technical assistance, financial assistance, or other significant incentives to commercial development.
Purchase RECs Reward commercial business for purchasing renewable energy certificates.
Waste Reduction Measures Reduction Measure Description
Improved compost facility
In 2005, the City of Chico diverted 1,296 MTCO2E by composting 7,084 tons of plant debris at the Cohasset Compost Facility. This facility is nearing capacity and is not equipped to handle food waste. The same year, over 11,000 tons of food waste was taken to landfills. By diverting this portion of the waste stream to a composting facility the community could drastically reduce its carbon footprint, create new jobs, and turn a profit as demonstrated by Jepson Prairie Organics (see inset below).
Restructure fee rates Currently, on a per ton basis commercial businesses that waste more pay less. This current fee rate structure does not offer incentive for commercial business to reduce its level of waste.

DRAFT Greenhouse Gas Inventory 39
Re-franchising
If the two waste disposal companies within the City were to bid for exclusive sales rights by neighborhood, this would not only reduce the City’s waste but also reduce the level of air pollution, noise pollution, costs associated with road maintenance, and the level of emissions that are created from the two companies covering the same neighborhoods. The City could divide areas up, so that each company could have complete control over specific blocks. This would reduce the need to have both waste disposal companies driving down the same blocks twice.
Recycling coordinator Appoint recycling coordinator to oversee all community waste-related programs. This position could also include government waste programs.
Compost wastewater sludge Utilize sludge material from the WPCP as nutrient rich compost for community athletic recreation fields.
Ban plastic bags. Plastic bags
Bring your own bag campaign.
Recycling programs Establish or expand recycling programs in the community (i.e., education, pamphlets).
Transportation Reduction Measures Reduction Measures Description Time traffic control lighting Timing traffic control lights can reduce idling and decrease commute time, reducing GHGs and CAPs.
Community bio-diesel purchasing co-op
Forming a biodiesel co-op can reduce diesel generated emissions and allow local restaurants to save on used oil disposal fees.
Gas tax By implementing a local gas tax the City could generate revenue that could be put toward sustainable projects. Improve public transit and rideshare facilities. Increasing bus route frequency would make the public transit system more convenient and could increase ridership. Promote public transit
Provide high school students with complimentary bus tickets. Electric fueling station—provide free or low-cost electric fueling stations for E.V.s Low emitting vehicle
Privileges Preferential parking—provide free or low-cost prime parking locations for L.E.V.s, E.V.s, and hybrids Community bicycle programs Synchronize bicycle trails with transit.
Improve bicycle infrastructure (i.e., routes, parking, etc.). Provide community (shared) bikes in high use areas. Promote purchase of
LEVs Promote community purchases of low emitting vehicles (i.e., electric vehicles, compacts and hybrids).

DRAFT Greenhouse Gas Inventory 40
Alternative fuels Promote alternative fuel vehicles and conversions for community residents. (i.e., CNG, biodiesel, LPG, ethanol, etc.) Encourage local buses and taxis to use alternative fuels by subsidizing conversion equipment.
Online services Offer services online and/or via phone at reduced rates to encourage trip reduction.
Pedestrian traffic Slow street traffic, improve sidewalks and safety, and develop pedestrian only areas.

DRAFT Greenhouse Gas Inventory 41
8.2. Government Emissions Reduction Measures
Government Reduction Measures Vehicle Fleet Reduction Measures Reduction Measure Description Police officers on bicycles Assigning a small contingent of police officers would reduce emissions, increase police presence, and
promote a healthy lifestyle.
Office bicycles If government facilities had “office bikes” employees could run local errands without using emissions generating vehicles.
Alternative fuels Both LPG and CNG are available in the Chico area and are barely utilized as a fleet fuel. Converting or purchasing vehicles to run on LPG or CNG fuels would cut emissions as they emit less GHGs and CAPs Trip Planning—City employees should take the time to plan out their routes in the most efficient manner possible. Driver efficiency training No idling—reducing idling reduces emissions, as an idling engine gets zero MPG.
Electronic conferencing When possible, meetings (especially out of town meetings) could be held over the phone or video conference. Efficiency standards Purchasing policy for future vehicle purchases should meet a predetermined MPG and emissions rating.
“Plug-in Chico” The city could join the “Plug-in Partners” campaign and make a “soft order” to show the auto industry that there is a municipal fleet market for plug-in vehicles. Visit http://www.pluginpartners.org for more information.
Building Reduction Measures Reduction Measure Description Lighting retrofits Lighting retrofits such as switching from T-12s to T-8s, T-5s, or Super T-8s can result in large energy savings;
there are many rebates for this. Energy audits Conduct an energy audit for each building, starting with the older ones. PG&E can provide this service.
Thermostat changes Change thermostats to a few degrees warmer in the summer and a few degrees cooler in the winter. Implement a policy on the temperature changes.
Windows Implement a policy that all new windows installed must be double-paned.

DRAFT Greenhouse Gas Inventory 42
Sub-metering for all buildings
Sub-metering is very important when tracking the energy consumption of a building in order to monitor usage. Specifically, this needs to be done in the 901 Fir Building group.
Government building Energy Manager Appoint an energy manager to monitor buildings and continuously retrofit the buildings.
Old Municipal Center Even though this building is not in use it cost the City $9,021 in electrical usage and $1,888 in natural gas usage from 2005 to 2007.
Water/Sewage Reduction Measures Reduction Measure Description Co-generation Use methane produced from the digesters as an alternative fuel source. Compost sludge/cake Use tested sludge/cake as a fertilizer rather than sending it to the landfill. Water reclamation Use treated water for irrigation. Equipment improvements Purchase most efficient pumps and other treatment facility equipment. Additional solar Increase the size (capacity) of current solar array.
Waste Reduction Measures Reduction Measure Description Recycling coordinator Appoint recycling coordinator to oversee all waste-related programs. This position could also include
community waste programs. Environmentally preferable purchasing
Purchase products or services that have a lesser or reduced effect on waste, human health, and the environment.
Facility waste analysis Assess each government facility for waste reduction potentials.
Recycling containers Increase the number, quality, and signage of recycling containers in parks, buildings, and other government facilities.
Reusable mugs/canteens Provide or promote the use of reusable beverage containers for city employees. Refillable ink cartridges Purchase/lease printers and copiers that use refillable ink cartridges.
One-sided printing Reload printers and copiers with reused paper.
Street Light Reduction Measures Reduction Measure Description Reduce usage time Reduce the amount of time streetlights operate by setting times or adjusting light sensors. Reduce number of lights Remove unnecessary lights.

DRAFT Greenhouse Gas Inventory 43
Convert Traffic Control Lights to light emitting diode (LED) technology. Lighting retrofits Convert street and highway lighting to either LED or high pressure sodium vapor (HPS). Policies Implement a policy standard for all new streetlights and traffic lights.
Employee Commute Reduction Measures Reduction Measure Description Parking spot rebates City employees could receive payment in exchange for the parking spot.
Bike/Walk incentives While the City already offers gift certificates for those who bike or walk, they could increase the amount or offer cash incentives.
Low emitting vehicle Privileges
The city could offer those who solely drive LEV’s to work prime parking locations.
Van pools The city could offer a service where employees living in adjacent neighborhoods ride to work in van pool vehicles.
Bus ridership incentives Flexible work schedule for those utilizing the transit bus service.
Free EV filling stations For employees who own electric vehicles the City could provide prime parking locations that offer free electric filling stations.

DRAFT Greenhouse Gas Inventory 44