Embed Size (px)
DESCRIPTION
For over a decade, many of the world's largest corporations have produced voluntary environmental and sustainability reports. The most common reason has been to assure stakeholders--employees, investors, customers--that the company takes environmental and social matters seriously and acts responsibly.Students and faculty at the Roberts Environmental Center have been studying these reports for several years and our methods and ongoing results are presented on this web site in graphical form, in published sector reports, technical papers, and a book. We analyze these reports using the Pacific Sustainability Index (PSI) and publish the results on this web site
Citation preview
Boston College, Brandeis University, Brown University, California Institute of Technology, Carnegie Mellon University, Case Western Reserve University, College of Will iam and Mary, Columbia University, Cornell University, Dartmouth College, Duke University, Emory University, Georgetown University, Georgia Institute of Technology, Harvard University, Johns Hopkins University, Lehigh University, Massachusetts Institute of Technology, New York Univers i ty , Northwestern Univers i ty , Pennsylvania State University--University Park, Princeton University, Rensselaer Polytechnic Institute, Rice University, Stanford University, Tufts University, Tulane University, University of California - Berkeley, University of California - Los Angeles, University of California--Davis, U n i v e r s i t y o f C a l i f o r n i a - - I r v i n e , U n i v e r s i t y o f California--San Diego, University of California--Santa Barbara, University of Chicago, University of Florida, University of Illinois--Urbana-Champagne, University of Michigan - Ann Arbor, University of North Carolina - Chapel Hill, University of Notre Dame, University of Pennsylvania, University of Rochester, University of Southern California, University of Texas--Austin, University of Virginia, University of Washington, University of Wisconsin--Madison, Vanderbilt University, Wake Forest University, Washington University in St. L o u i s , Y a l e U n i v e r s i t y
J. Emil Morhardt, Elgeritte Adidjaja, Ryan Anderson, Virginia Anton, Juliet Marie Archer, Dante Lamarr Benson, Sara Morgan Caldwell, Emily Aiko Coleman, Francisco Covarrubias, Jr., Blake Crawford, Kristin Almaz Dessie, Salif Doubare, Asha Nicole Gipson, Alexander Glassmann, Starrisha Marche Godfrey-Canada, Karina Gomez, Pooja Reddy Kanipakam, Rebecca Enid Lofchie, Jesse Maximilliano Madrigal, Natalya Ratan, Ravindra Wayne Reddy, Andre Garland Shepley, Timothy Kareem Smedley, and Alyson Noelle Stark, and Sabrina Nicole Williams
2010 Sustainability Reporting of the Top U.S. UniversitiesPacific Sustainability Index Scores: A benchmarking tool for online sustainability reporting
Contents Topics Page Company Rankings 3 Lead Analyst’s Commentary 4 Green Building 5 PSI Overview 6 PSI Scoring in a Nutshell 7 Environmental Intent Topics 8 Environmental Reporting Topics 9 Social Intent Topics 10 Social Reporting Topics 11 Environmental Intent Element of the PSI Scores 12 Environmental Reporting Element of the PSI Scores
13
Social Intent Element of the PSI Scores 14 Social Reporting Element of the PSI Scores 15 Environmental Intent Scores Ranking 16 Environmental Reporting Scores Ranking 17 Environmental Performance Scores Ranking 18 Social Intent Scores Ranking 19 Social Reporting Scores Ranking 20 Social Performance Scores Ranking 21 Human Rights Reporting Element 22 Visual Cluster Analysis 23 Company Rankings Based on the Number of Goals Reported
25
Company Rankings Based on the Better Performance Reported
26
Analyst’s Comments, alphabetically listed by company name
78
Appendix 1: PSI Questionnaire 50 Questions should be addressed to: Dr. J. Emil Morhardt, Director ([email protected]) Roberts Environmental Center Claremont McKenna College 925 N. Mills Ave. Claremont, CA 91711-5916, USA Direct line: (909) 621-8190 Elgeritte Adidjaja, Research Fellow: (909) 621-8698 ([email protected]) Departmental Secretaries: (909) 621-8298
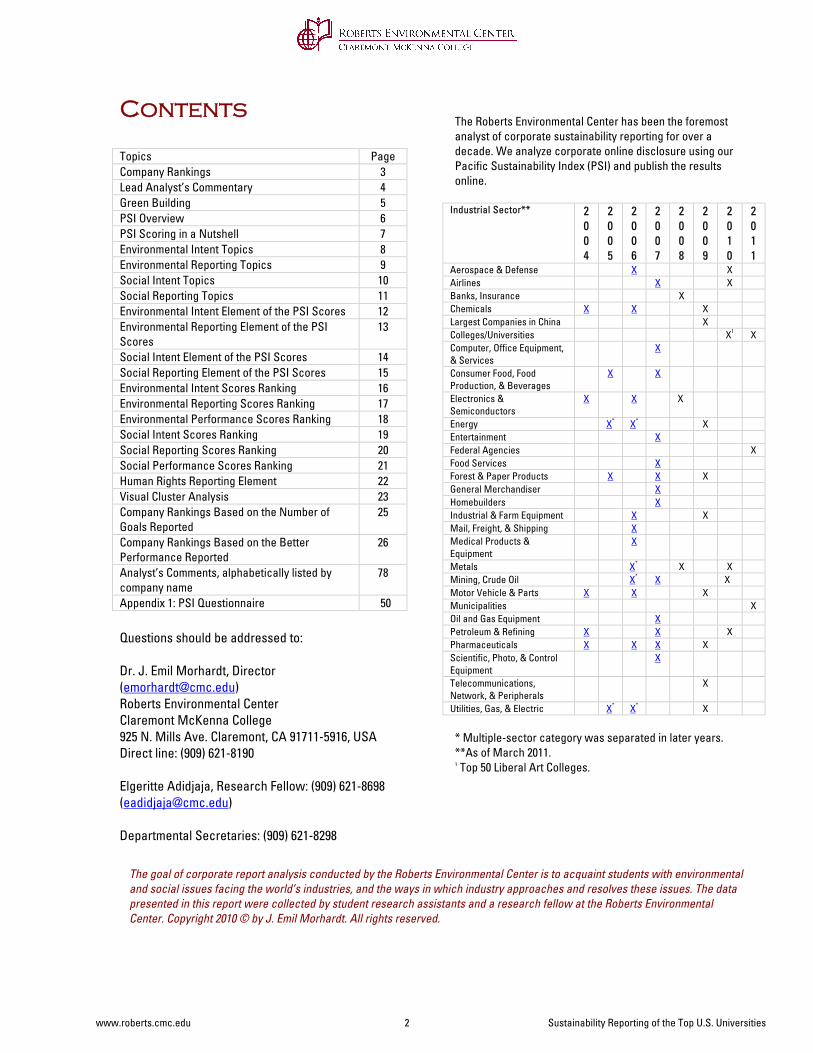
The Roberts Environmental Center has been the foremost analyst of corporate sustainability reporting for over a decade. We analyze corporate online disclosure using our Pacific Sustainability Index (PSI) and publish the results online.
Industrial Sector** 2004
2005
2006
2007
2008
2009
2010
2011
Aerospace & Defense X X Airlines X X Banks, Insurance X Chemicals X X X Largest Companies in China X Colleges/Universities X1 X Computer, Office Equipment, & Services
X
Consumer Food, Food Production, & Beverages
X X
Electronics & Semiconductors
X X X
Energy X* X* X Entertainment X Federal Agencies X Food Services X Forest & Paper Products X X X General Merchandiser X Homebuilders X Industrial & Farm Equipment X X Mail, Freight, & Shipping X Medical Products & Equipment
X
Metals X* X X Mining, Crude Oil X* X X Motor Vehicle & Parts X X X Municipalities X Oil and Gas Equipment X Petroleum & Refining X X X Pharmaceuticals X X X X Scientific, Photo, & Control Equipment
X
Telecommunications, Network, & Peripherals
X
Utilities, Gas, & Electric X* X* X * Multiple-sector category was separated in later years. **As of March 2011. 1 Top 50 Liberal Art Colleges.
The goal of corporate report analysis conducted by the Roberts Environmental Center is to acquaint students with environmental and social issues facing the world’s industries, and the ways in which industry approaches and resolves these issues. The data presented in this report were collected by student research assistants and a research fellow at the Roberts Environmental Center. Copyright 2010 © by J. Emil Morhardt. All rights reserved.
www.roberts.cmc.edu 2 Sustainability Reporting of the Top U.S. Universities
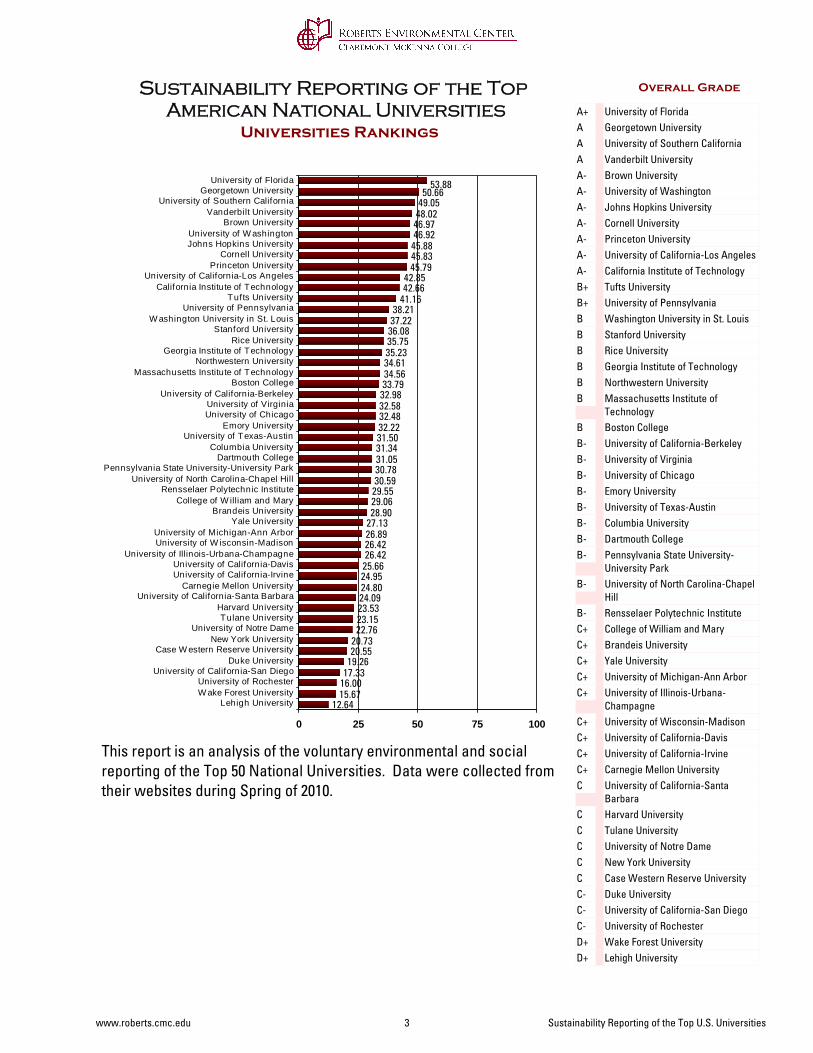
Universities Rankings
This report is an analysis of the voluntary environmental and social reporting of the Top 50 National Universities. Data were collected from their websites during Spring of 2010.
Sustainability Reporting of the Top American National Universities
Overall Grade
12.6415.6716.0017.3319.2620.5520.73
22.7623.1523.5324.0924.8024.9525.6626.4226.4226.8927.1328.9029.0629.5530.5930.7831.0531.3431.5032.2232.4832.5832.9833.7934.5634.6135.2335.7536.0837.2238.21
41.1642.6642.85
45.7945.8345.8846.9246.9748.0249.0550.66
53.88
0 25 50 75 100
Lehigh UniversityW ake Forest UniversityUniversity of Rochester
University of California-San DiegoDuke University
Case W estern Reserve UniversityNew York University
University of Notre DameTulane University
Harvard UniversityUniversity of California-Santa Barbara
Carnegie Mellon UniversityUniversity of California-IrvineUniversity of California-Davis
University of Illinois-Urbana-ChampagneUniversity of W isconsin-MadisonUniversity of Michigan-Ann Arbor
Yale UniversityBrandeis University
College of W illiam and MaryRensselaer Polytechnic Institute
University of North Carolina-Chapel HillPennsylvania State University-University Park
Dartmouth CollegeColumbia University
University of Texas-AustinEmory University
University of ChicagoUniversity of Virginia
University of California-BerkeleyBoston College
Massachusetts Institute of TechnologyNorthwestern University
Georgia Institute of TechnologyRice University
Stanford UniversityW ashington University in St. Louis
University of PennsylvaniaTufts University
California Institute of TechnologyUniversity of California-Los Angeles
Princeton UniversityCornell University
Johns Hopkins UniversityUniversity of W ashington
Brown UniversityVanderbilt University
University of Southern CaliforniaGeorgetown University
University of Florida
University of FloridaA+Georgetown UniversityAUniversity of Southern CaliforniaAVanderbilt UniversityABrown UniversityA-University of WashingtonA-Johns Hopkins UniversityA-Cornell UniversityA-Princeton UniversityA-University of California-Los AngelesA-California Institute of TechnologyA-Tufts UniversityB+University of PennsylvaniaB+Washington University in St. LouisBStanford UniversityBRice UniversityBGeorgia Institute of TechnologyBNorthwestern UniversityBMassachusetts Institute of Technology
B
Boston CollegeBUniversity of California-BerkeleyB-University of VirginiaB-University of ChicagoB-Emory UniversityB-University of Texas-AustinB-Columbia UniversityB-Dartmouth CollegeB-Pennsylvania State University-University Park
B-
University of North Carolina-Chapel Hill
B-
Rensselaer Polytechnic InstituteB-College of William and MaryC+Brandeis UniversityC+Yale UniversityC+University of Michigan-Ann ArborC+University of Illinois-Urbana-Champagne
C+
University of Wisconsin-MadisonC+University of California-DavisC+University of California-IrvineC+Carnegie Mellon UniversityC+University of California-Santa Barbara
C
Harvard UniversityCTulane UniversityCUniversity of Notre DameCNew York UniversityCCase Western Reserve UniversityCDuke UniversityC-University of California-San DiegoC-University of RochesterC-Wake Forest UniversityD+Lehigh UniversityD+
www.roberts.cmc.edu 3 Sustainability Reporting of the Top U.S. Universities
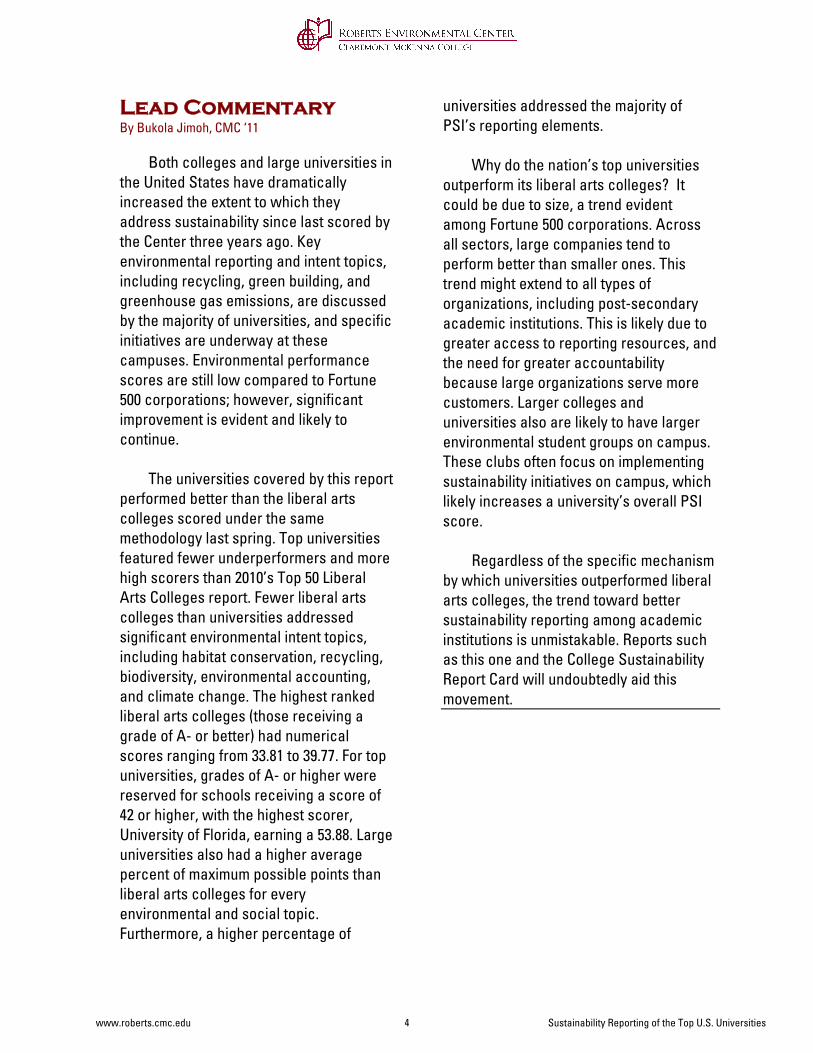
Lead Commentary By Bukola Jimoh, CMC ‘11
Both colleges and large universities in the United States have dramatically increased the extent to which they address sustainability since last scored by the Center three years ago. Key environmental reporting and intent topics, including recycling, green building, and greenhouse gas emissions, are discussed by the majority of universities, and specific initiatives are underway at these campuses. Environmental performance scores are still low compared to Fortune 500 corporations; however, significant improvement is evident and likely to continue.
The universities covered by this report performed better than the liberal arts colleges scored under the same methodology last spring. Top universities featured fewer underperformers and more high scorers than 2010’s Top 50 Liberal Arts Colleges report. Fewer liberal arts colleges than universities addressed significant environmental intent topics, including habitat conservation, recycling, biodiversity, environmental accounting, and climate change. The highest ranked liberal arts colleges (those receiving a grade of A- or better) had numerical scores ranging from 33.81 to 39.77. For top universities, grades of A- or higher were reserved for schools receiving a score of 42 or higher, with the highest scorer, University of Florida, earning a 53.88. Large universities also had a higher average percent of maximum possible points than liberal arts colleges for every environmental and social topic. Furthermore, a higher percentage of
universities addressed the majority of PSI’s reporting elements.
Why do the nation’s top universities outperform its liberal arts colleges? It could be due to size, a trend evident among Fortune 500 corporations. Across all sectors, large companies tend to perform better than smaller ones. This trend might extend to all types of organizations, including post-secondary academic institutions. This is likely due to greater access to reporting resources, and the need for greater accountability because large organizations serve more customers. Larger colleges and universities also are likely to have larger environmental student groups on campus. These clubs often focus on implementing sustainability initiatives on campus, which likely increases a university’s overall PSI score.
Regardless of the specific mechanism by which universities outperformed liberal arts colleges, the trend toward better sustainability reporting among academic institutions is unmistakable. Reports such as this one and the College Sustainability Report Card will undoubtedly aid this movement.
www.roberts.cmc.edu 4 Sustainability Reporting of the Top U.S. Universities

Green Building By Eva Landsberg, Roberts Environmental Center 2010 summer intern
Green building is a growing trend among colleges and universities aiming to reduce their carbon footprints and strengthen their sustainability policies. By making an effort to decrease greenhouse gas emissions, colleges and universities can demonstrate that they are forward-thinking and environmentally conscious. In accordance with these goals, many colleges are pledging to attain certifications and recognition from third-party environmental evaluators such as the U.S. Green Building Council’s LEED rating system and the U.S. EPA’s Energy Star program.
The United States Green Building Council
(USGBC) created the Leadership in Energy and Environmental Design (LEED) rating system in order to systematically evaluate buildings’ environmental sustainability. Using the LEED system, each building is assessed in nine categories, including sustainable site development, water efficiency, indoor environmental quality, innovation in the design process, and material and resources use. Based on the number of points achieved in each category, buildings may receive a rating of LEED certified, silver, gold, or platinum. LEED inspections are available for newly constructed buildings, existing buildings, schools, neighborhood developments, and a variety of other building projects.
Currently, a growing number of colleges
are taking advantage of the LEED rating system in order to ensure that their new construction projects meet green building design standards. Tufts University’s Sophia Gordon Hall, for example, was constructed of 10% recycled materials, and Stanford University’s Knight Management Center will exceed all water conservation LEED standards. In addition, many colleges are choosing to require all new construction to
achieve LEED certification. One such college, University of North Carolina-Chapel Hill, has over 150 upcoming construction projections, all of which will be built to attain LEED Silver.
Another way colleges seek to promote
green building is by promoting energy efficiency within each new and existing building. Energy and water efficiency can be achieved through multiple means, including through installation of efficient showers heads and toilets, green lighting, photovoltaic panels, and green roofs. For example, Tufts University’s Tisch Library’s green roof naturally cools the building and filters air pollution, greatly reducing energy use.
Colleges can ensure products such as the
aforementioned lighting and bathroom appliances meet energy efficiency standards through the use of the Energy Star certification system. Energy Star certifications are based on standards agreed upon by the United States Environmental Protection Agency and the United States Department of Energy, although specific criteria vary from product to product. By equipping buildings with Energy Star certified products, universities are ensuring that their buildings run efficiently, and with as little waste as possible.
The number of green buildings at colleges
across the United States is increasing rapidly each year. By investing in sustainable construction, colleges not only reap long-term financial benefits, but also gain recognition for their commitment to sustainable development.
www.roberts.cmc.edu 5 Sustainability Reporting of the Top U.S. Universities
The Pacific Sustainability Index (PSI) Overview
the PSI Scoring System The Pacific Sustainability Index (PSI) uses two systematic questionnaires to analyze the quality of the sustainability reporting—a base questionnaire for reports across sectors and a sector-specific questionnaire for universities. The Roberts Environmental Center The Roberts Environmental Center is an environmental research institute at Claremont McKenna College (CMC). Its mission is to provide students of all the Claremont Colleges with a comprehensive and realistic understanding of today’s environmental issues and the ways in which they are being and can be resolved--beyond the confines of traditional academic disciplines and curriculum--and to identify, publicize, and encourage policies and practices that achieve economic and social goals in the most environmentally benign and protective manner. The Center is partially funded by an endowment from George R. Roberts (Founding Partner of Kohlberg Kravis Roberts & Co. and CMC alumnus), other grants and gifts, and is staffed by faculty and students from the Claremont Colleges. Methodology Student analysts download relevant English language web pages from the main universities’ website for analysis. Our scoring excludes data independently stored outside the main university website or available only in hard copy. We archive these web pages as PDF files for future reference. Our analysts use a keyword search function to search reporting of specific topics, they fill out a PSI scoring sheet (http://www.roberts.cmc.edu/PSI/scoringsheet.asp), and track the coverage and depths of different sustainability issues mentioned in all online materials. Scores and Ranks When they are finished scoring, the analysts enter their scoring results into the PSI database. The PSI database calculates scores and publishes them on the Center’s website. This sector report provides an in-depth analysis on sustainability reporting of the largest universities of the sector, as listed in the U.S. News and World Report. What do the scores mean? We normalize all the scores to the potential maximum score. Scores of subsets of the overall score are also normalized to their potential maxima. The letter grades (A+, A, A-, B+, etc.), however, are normalized to the highest scoring university analyzed in the report. Universities with scores in the highest 4% get an A+ and any in the bottom 4% get an F. We assign these by dividing the maximum PSI score obtained in the sector into 12 equal parts then rounding fractional score up or down. This means that A+ and F are under-represented compared to the other grades. The same technique applies to the separate categories of environmental and social scores. Thus, we grade on the curve. We assume that the highest score obtained in the sector and any scores near it represent the state-of-the-art for that sector and deserve an A+.
www.roberts.cmc.edu 6 Sustainability Reporting of the Top U.S. Universities
PSI Scoring in a Nutshell
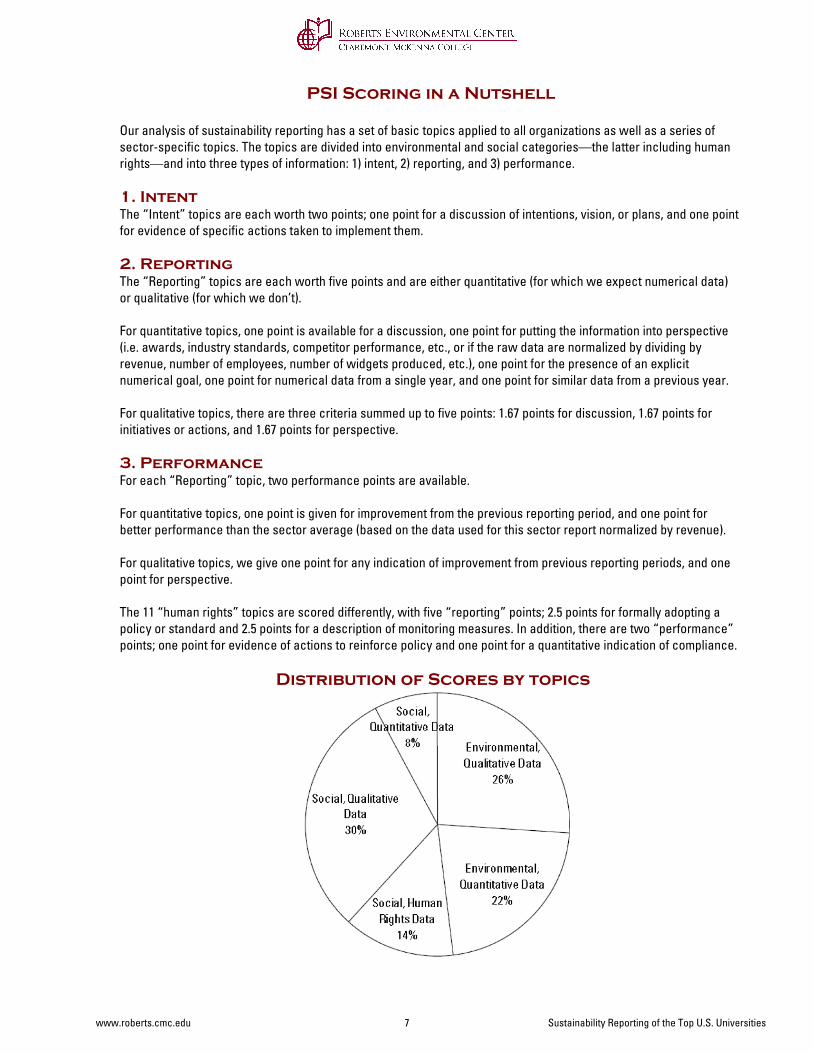
Our analysis of sustainability reporting has a set of basic topics applied to all organizations as well as a series of sector-specific topics. The topics are divided into environmental and social categories—the latter including human rights—and into three types of information: 1) intent, 2) reporting, and 3) performance. 1. Intent The “Intent” topics are each worth two points; one point for a discussion of intentions, vision, or plans, and one point for evidence of specific actions taken to implement them. 2. Reporting The “Reporting” topics are each worth five points and are either quantitative (for which we expect numerical data) or qualitative (for which we don’t). For quantitative topics, one point is available for a discussion, one point for putting the information into perspective (i.e. awards, industry standards, competitor performance, etc., or if the raw data are normalized by dividing by revenue, number of employees, number of widgets produced, etc.), one point for the presence of an explicit numerical goal, one point for numerical data from a single year, and one point for similar data from a previous year. For qualitative topics, there are three criteria summed up to five points: 1.67 points for discussion, 1.67 points for initiatives or actions, and 1.67 points for perspective. 3. Performance For each “Reporting” topic, two performance points are available. For quantitative topics, one point is given for improvement from the previous reporting period, and one point for better performance than the sector average (based on the data used for this sector report normalized by revenue). For qualitative topics, we give one point for any indication of improvement from previous reporting periods, and one point for perspective. The 11 “human rights” topics are scored differently, with five “reporting” points; 2.5 points for formally adopting a policy or standard and 2.5 points for a description of monitoring measures. In addition, there are two “performance” points; one point for evidence of actions to reinforce policy and one point for a quantitative indication of compliance.
Distribution of Scores by topics
www.roberts.cmc.edu 7 Sustainability Reporting of the Top U.S. Universities
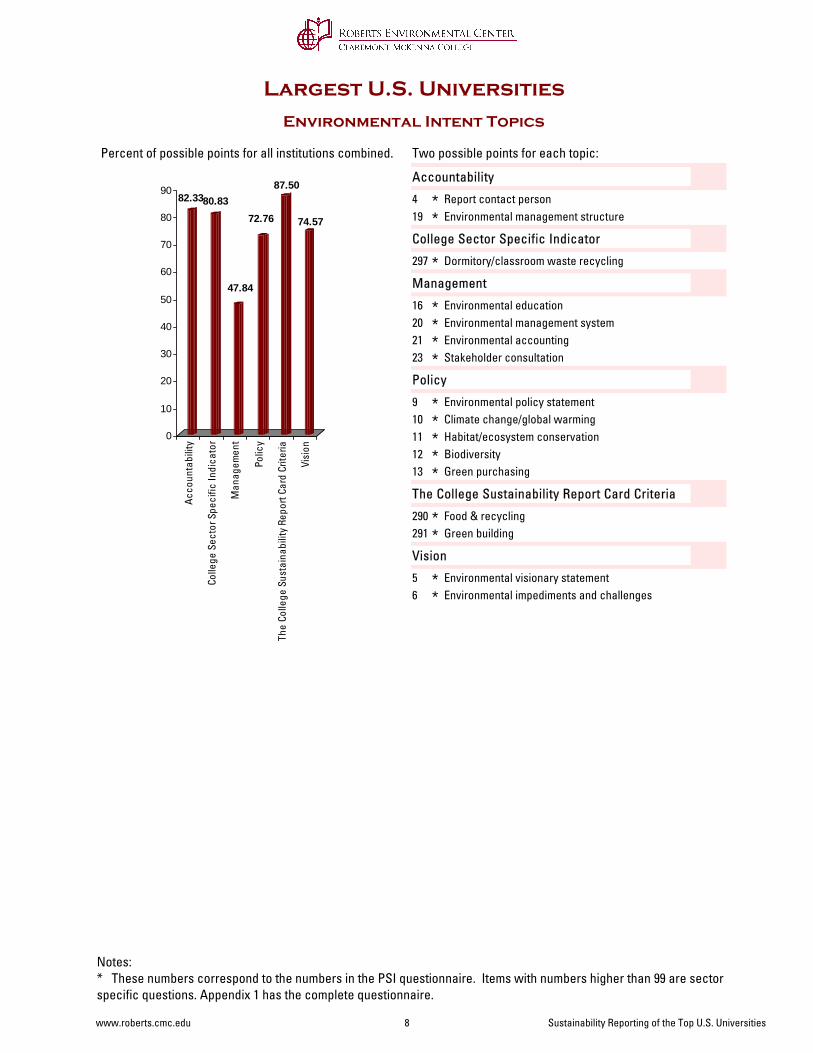
Percent of possible points for all institutions combined.
Environmental Intent Topics
Largest U.S. Universities
82.3380.83
47.84
72.76
87.50
74.57
0
10
20
30
40
50
60
70
80
90Ac
coun
tabi
lity
Colle
ge S
ecto
r Spe
cific
Indi
cato
r
Man
agem
ent
Polic
y
The
Colle
ge S
usta
inab
ility
Rep
ort C
ard
Crite
ria
Visi
on
Two possible points for each topic:
Accountability
Report contact person4 *Environmental management structure19 *
College Sector Specific Indicator
Dormitory/classroom waste recycling297 *Management
Environmental education16 *Environmental management system20 *Environmental accounting21 *Stakeholder consultation23 *
Policy
Environmental policy statement9 *Climate change/global warming10 *Habitat/ecosystem conservation11 *Biodiversity12 *Green purchasing13 *
The College Sustainability Report Card Criteria
Food & recycling290 *Green building291 *
Vision
Environmental visionary statement5 *Environmental impediments and challenges6 *
Notes: * These numbers correspond to the numbers in the PSI questionnaire. Items with numbers higher than 99 are sector specific questions. Appendix 1 has the complete questionnaire.
www.roberts.cmc.edu 8 Sustainability Reporting of the Top U.S. Universities
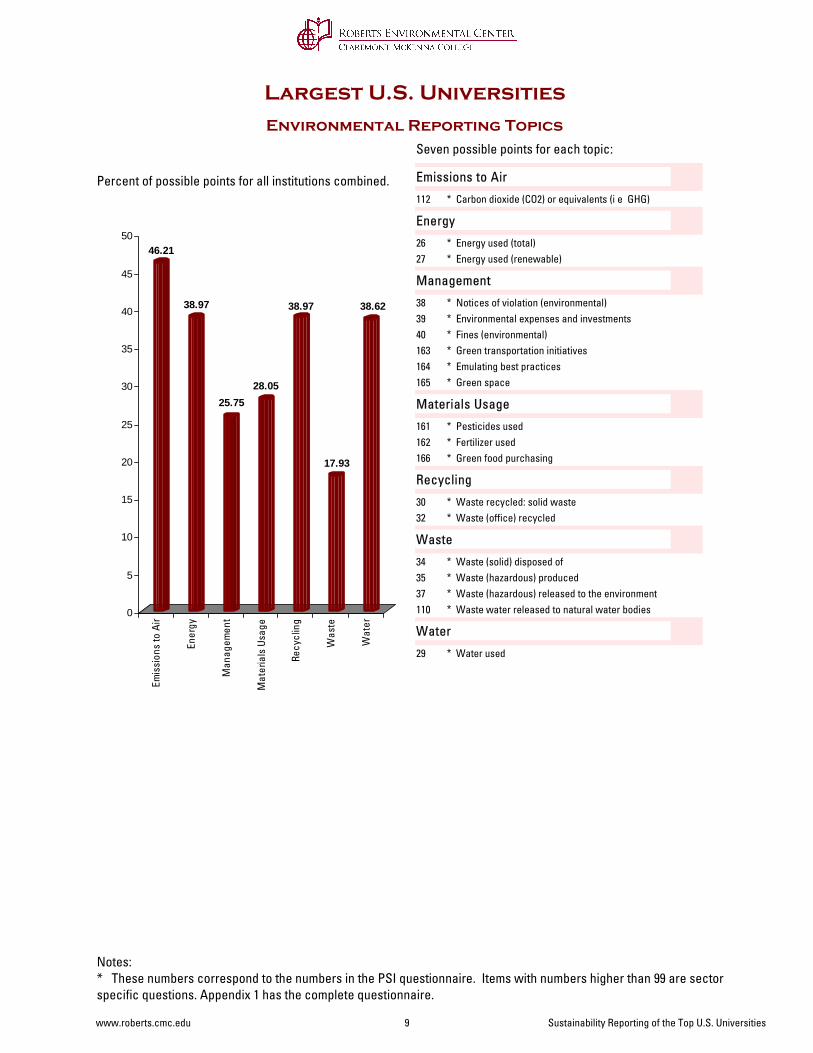
Environmental Reporting Topics
Largest U.S. Universities
Percent of possible points for all institutions combined.
46.21
38.97
25.7528.05
38.97
17.93
38.62
0
5
10
15
20
25
30
35
40
45
50
Emis
sion
s to
Air
Ener
gy
Man
agem
ent
Mat
eria
ls U
sage
Recy
clin
g
Was
te
Wat
er
Seven possible points for each topic:
Emissions to Air
Carbon dioxide (CO2) or equivalents (i e GHG)112 *
Energy
Energy used (total)26 *Energy used (renewable)27 *
Management
Notices of violation (environmental)38 *Environmental expenses and investments39 *Fines (environmental)40 *Green transportation initiatives163 *Emulating best practices164 *Green space165 *
Materials Usage
Pesticides used161 *Fertilizer used162 *Green food purchasing166 *
Recycling
Waste recycled: solid waste30 *Waste (office) recycled32 *
Waste
Waste (solid) disposed of34 *Waste (hazardous) produced35 *Waste (hazardous) released to the environment37 *Waste water released to natural water bodies110 *
Water
Water used29 *
Notes: * These numbers correspond to the numbers in the PSI questionnaire. Items with numbers higher than 99 are sector specific questions. Appendix 1 has the complete questionnaire.
www.roberts.cmc.edu 9 Sustainability Reporting of the Top U.S. Universities

Social Intent Topics
Largest U.S. Universities
Percent of possible points for all institutions combined.
58.6256.8056.03
67.24
47.84
53.88
0
10
20
30
40
50
60
70
Acco
unta
bilit
y
Man
agem
ent
Polic
y
Soci
al D
emog
raph
ic
The
Colle
ge S
usta
inab
ility
Rep
ort C
ard
Crite
ria
Visi
on
Two possible points for each topic:
Accountability
Health and safety, or social organizational structure
51 *
Third-party validation54 *Management
Workforce profile: ethnicities/race17 *Workforce profile: gender18 *Workforce profile: age52 *Emergency preparedness program53 *Employee training for career development82 *
Policy
Social policy statement 45 *Code of conduct or business ethics47 *Supplier screening based on social or environmental performance/ supplier management
49 *
Social Demographic
Employment for individuals with disabilities80 *The College Sustainability Report Card Criteria
Student involvement292 *Endowment transparency294 *Investment priorities295 *Shareholder engagement296 *
Vision
Social visionary statement 42 *Social impediments and challenges43 *
Notes: * These numbers correspond to the numbers in the PSI questionnaire. Items with numbers higher than 99 are sector specific questions. Appendix 1 has the complete questionnaire.
www.roberts.cmc.edu 10 Sustainability Reporting of the Top U.S. Universities
Social Reporting Topics
Largest U.S. Universities
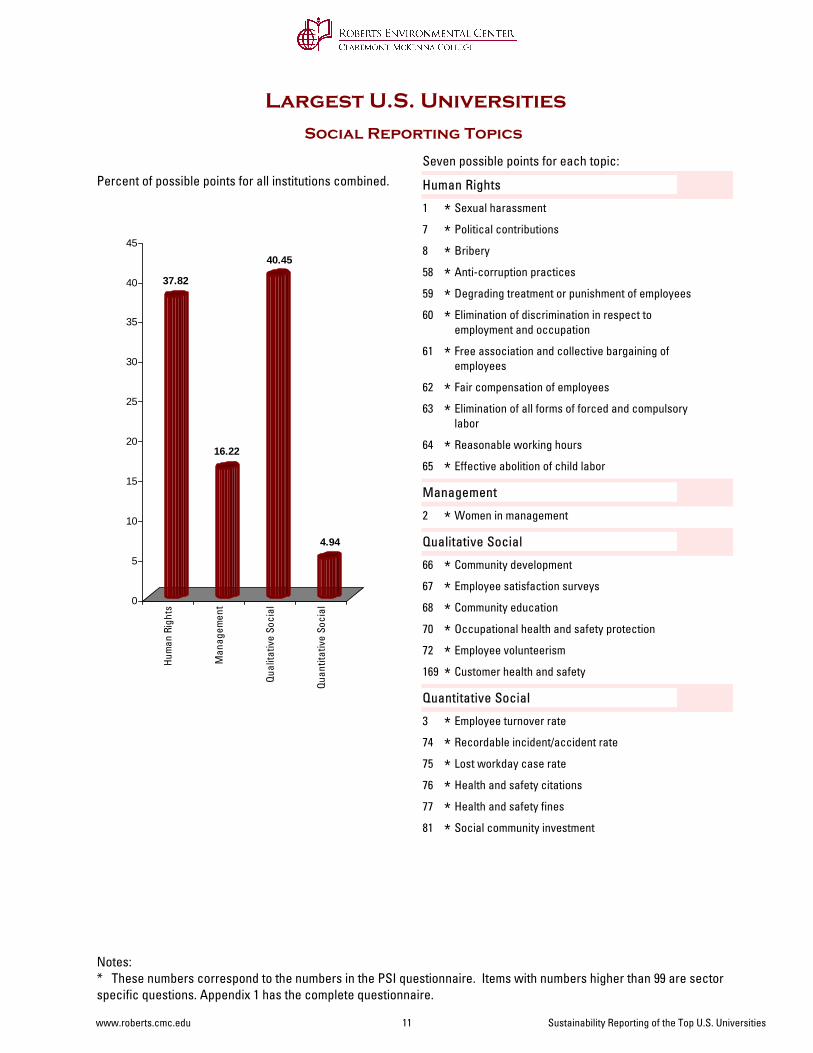
Percent of possible points for all institutions combined.
37.82
16.22
40.45
4.94
0
5
10
15
20
25
30
35
40
45
Hum
an R
ight
s
Man
agem
ent
Qual
itativ
e So
cial
Quan
titat
ive
Soci
al
Seven possible points for each topic:
Human Rights
Sexual harassment1 *Political contributions7 *Bribery8 *Anti-corruption practices58 *Degrading treatment or punishment of employees59 *Elimination of discrimination in respect to employment and occupation
60 *
Free association and collective bargaining of employees
61 *
Fair compensation of employees62 *Elimination of all forms of forced and compulsory labor
63 *
Reasonable working hours64 *Effective abolition of child labor65 *
Management
Women in management2 *Qualitative Social
Community development66 *Employee satisfaction surveys67 *Community education68 *Occupational health and safety protection70 *Employee volunteerism72 *Customer health and safety169 *
Quantitative Social
Employee turnover rate3 *Recordable incident/accident rate74 *Lost workday case rate75 *Health and safety citations76 *Health and safety fines77 *Social community investment81 *
Notes: * These numbers correspond to the numbers in the PSI questionnaire. Items with numbers higher than 99 are sector specific questions. Appendix 1 has the complete questionnaire.
www.roberts.cmc.edu 11 Sustainability Reporting of the Top U.S. Universities
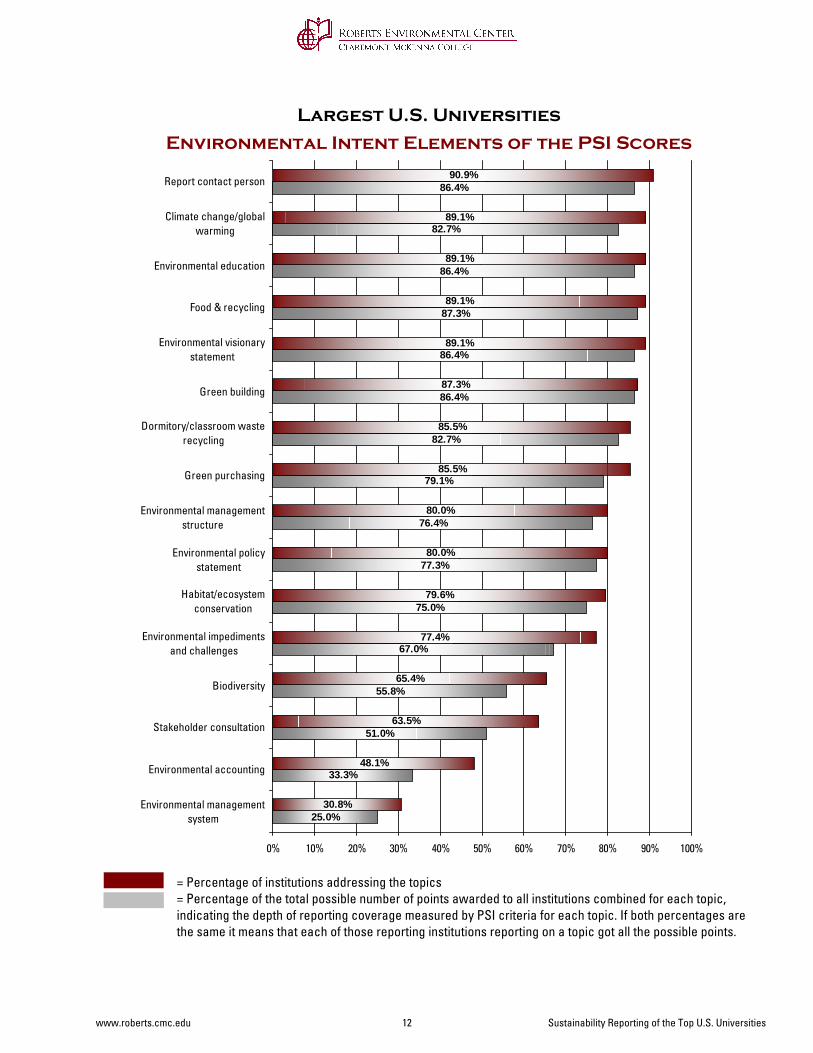
Environmental Intent Elements of the PSI Scores
= Percentage of institutions addressing the topics= Percentage of the total possible number of points awarded to all institutions combined for each topic, indicating the depth of reporting coverage measured by PSI criteria for each topic. If both percentages are the same it means that each of those reporting institutions reporting on a topic got all the possible points.
Largest U.S. Universities
25.0%
33.3%
51.0%
55.8%
67.0%
75.0%
77.3%
76.4%
79.1%
82.7%
86.4%
86.4%
87.3%
86.4%
82.7%
86.4%
30.8%
48.1%
63.5%
65.4%
77.4%
79.6%
80.0%
80.0%
85.5%
85.5%
87.3%
89.1%
89.1%
89.1%
89.1%
90.9%
0% 10% 20% 30% 40% 50% 60% 70% 80% 90% 100%
Environmental managementsystem
Environmental accounting
Stakeholder consultation
Biodiversity
Environmental impedimentsand challenges
Habitat/ecosystemconservation
Environmental policystatement
Environmental managementstructure
Green purchasing
Dormitory/classroom wasterecycling
Green building
Environmental visionarystatement
Food & recycling
Environmental education
Climate change/globalwarming
Report contact person
www.roberts.cmc.edu 12 Sustainability Reporting of the Top U.S. Universities
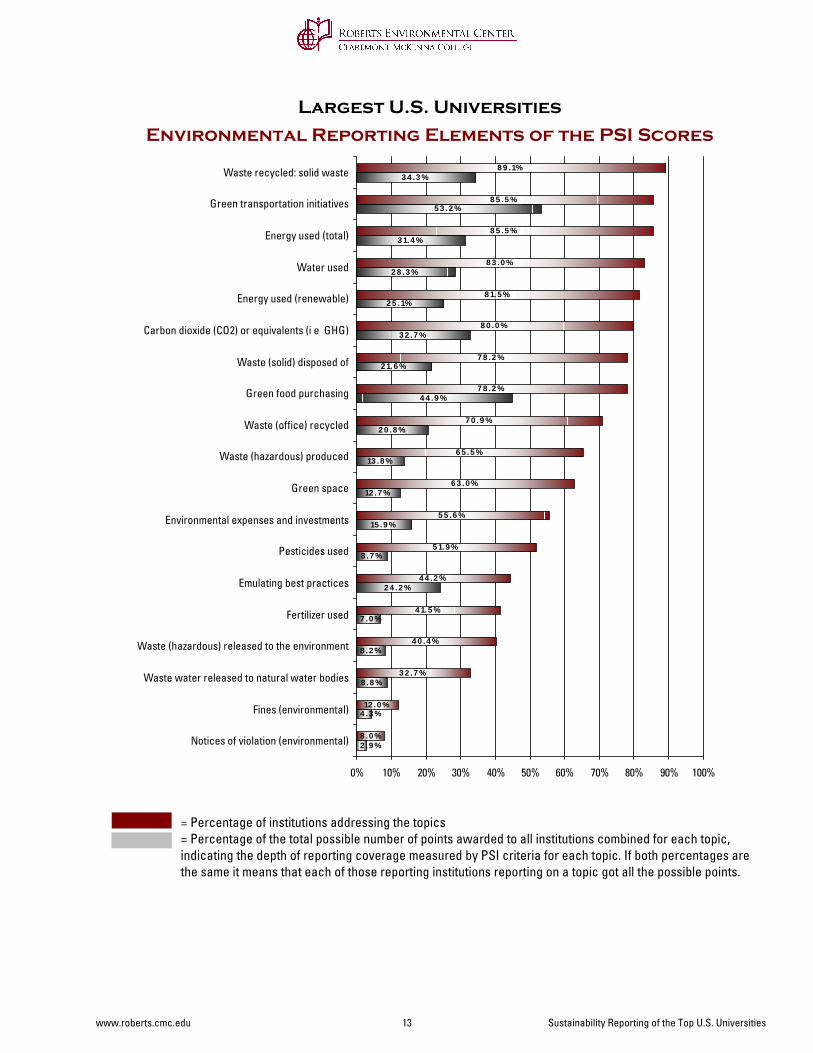
Environmental Reporting Elements of the PSI Scores
Largest U.S. Universities
= Percentage of institutions addressing the topics= Percentage of the total possible number of points awarded to all institutions combined for each topic, indicating the depth of reporting coverage measured by PSI criteria for each topic. If both percentages are the same it means that each of those reporting institutions reporting on a topic got all the possible points.
2 .9 %
4 .3 %
8 .8 %
8 .2 %
7 .0 %
2 4 .2 %
8 .7 %
15 .9 %
12 .7 %
13 .8 %
2 0 .8 %
4 4 .9 %
2 1.6 %
3 2 .7 %
2 5 .1%
2 8 .3 %
3 1.4 %
5 3 .2 %
3 4 .3 %
8 .0 %
12 .0 %
3 2 .7 %
4 0 .4 %
4 1.5 %
4 4 .2 %
5 1.9 %
5 5 .6 %
6 3 .0 %
6 5 .5 %
7 0 .9 %
7 8 .2 %
7 8 .2 %
8 0 .0 %
8 1.5 %
8 3 .0 %
8 5 .5 %
8 5 .5 %
8 9 .1%
0% 10% 20% 30% 40% 50% 60% 70% 80% 90% 100%
Notices of violation (environmental)
Fines (environmental)
Waste water released to natural water bodies
Waste (hazardous) released to the environment
Fertilizer used
Emulating best practices
Pesticides used
Environmental expenses and investments
Green space
Waste (hazardous) produced
Waste (office) recycled
Green food purchasing
Waste (solid) disposed of
Carbon dioxide (CO2) or equivalents (i e GHG)
Energy used (renewable)
Water used
Energy used (total)
Green transportation initiatives
Waste recycled: solid waste
www.roberts.cmc.edu 13 Sustainability Reporting of the Top U.S. Universities
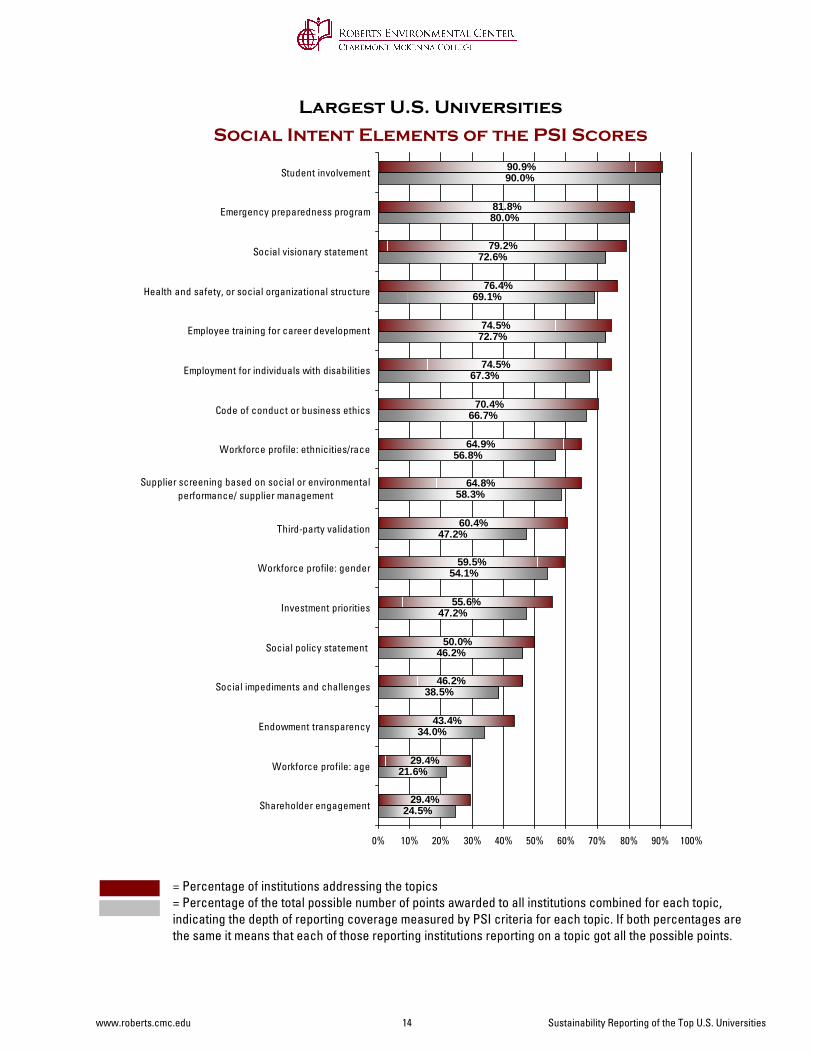
Social Intent Elements of the PSI Scores
Largest U.S. Universities
= Percentage of institutions addressing the topics= Percentage of the total possible number of points awarded to all institutions combined for each topic, indicating the depth of reporting coverage measured by PSI criteria for each topic. If both percentages are the same it means that each of those reporting institutions reporting on a topic got all the possible points.
24.5%
21.6%
34.0%
38.5%
46.2%
47.2%
54.1%
47.2%
58.3%
56.8%
66.7%
67.3%
72.7%
69.1%
72.6%
80.0%
90.0%
29.4%
29.4%
43.4%
46.2%
50.0%
55.6%
59.5%
60.4%
64.8%
64.9%
70.4%
74.5%
74.5%
76.4%
79.2%
81.8%
90.9%
0% 10% 20% 30% 40% 50% 60% 70% 80% 90% 100%
Shareholder engagement
Workforce profile: age
Endowment transparency
Social impediments and challenges
Social policy statement
Investment priorities
Workforce profile: gender
Third-party validation
Supplier screening based on social or environmentalperformance/ supplier management
Workforce profile: ethnicities/race
Code of conduct or business ethics
Employment for individuals with disabilities
Employee training for career development
Health and safety, or social organizational structure
Social visionary statement
Emergency preparedness program
Student involvement
www.roberts.cmc.edu 14 Sustainability Reporting of the Top U.S. Universities
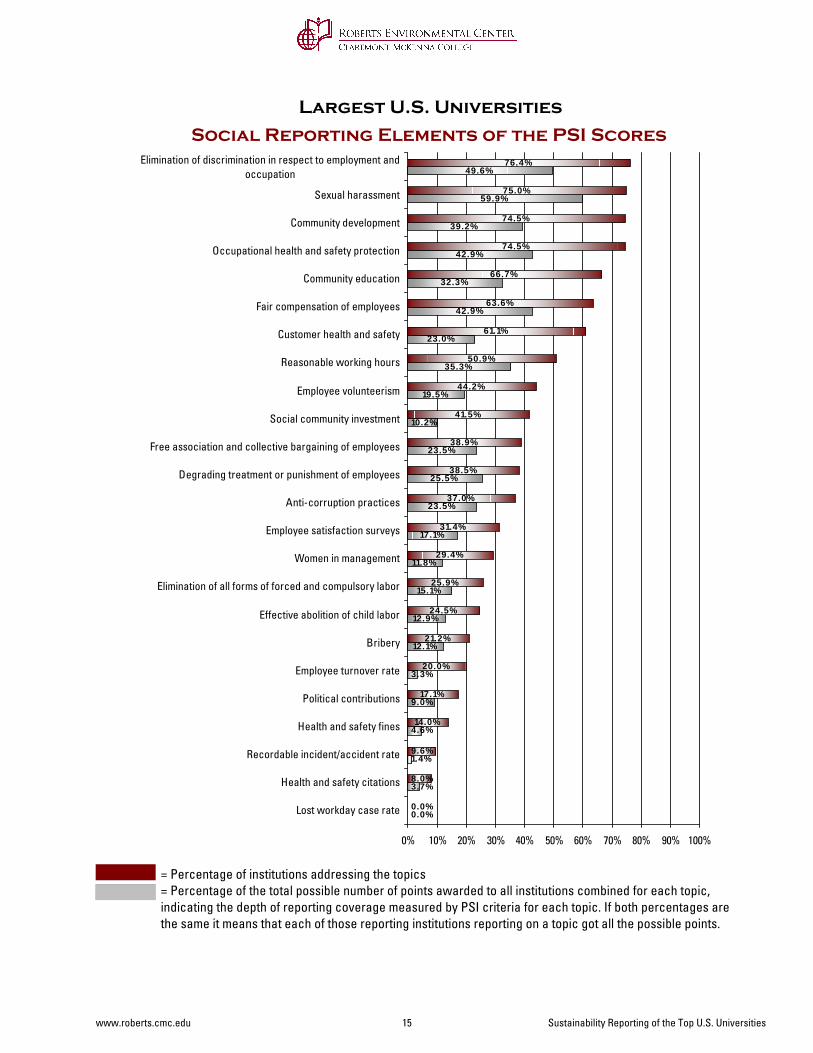
Social Reporting Elements of the PSI Scores
Largest U.S. Universities
= Percentage of institutions addressing the topics= Percentage of the total possible number of points awarded to all institutions combined for each topic, indicating the depth of reporting coverage measured by PSI criteria for each topic. If both percentages are the same it means that each of those reporting institutions reporting on a topic got all the possible points.
0.0%
3.7%
1.4%
4.6%
9.0%
3.3%
12.1%
12.9%
15.1%
11.8%
17.1%
23.5%
25.5%
23.5%
10.2%
19.5%
35.3%
23.0%
42.9%
32.3%
42.9%
39.2%
59.9%
49.6%
0.0%
8.0%
9.6%
14.0%
17.1%
20.0%
21.2%
24.5%
25.9%
29.4%
31.4%
37.0%
38.5%
38.9%
41.5%
44.2%
50.9%
61.1%
63.6%
66.7%
74.5%
74.5%
75.0%
76.4%
0% 10% 20% 30% 40% 50% 60% 70% 80% 90% 100%
Lost workday case rate
Health and safety citations
Recordable incident/accident rate
Health and safety fines
Political contributions
Employee turnover rate
Bribery
Effective abolition of child labor
Elimination of all forms of forced and compulsory labor
Women in management
Employee satisfaction surveys
Anti-corruption practices
Degrading treatment or punishment of employees
Free association and collective bargaining of employees
Social community investment
Employee volunteerism
Reasonable working hours
Customer health and safety
Fair compensation of employees
Community education
Occupational health and safety protection
Community development
Sexual harassment
Elimination of discrimination in respect to employment andoccupation
www.roberts.cmc.edu 15 Sustainability Reporting of the Top U.S. Universities
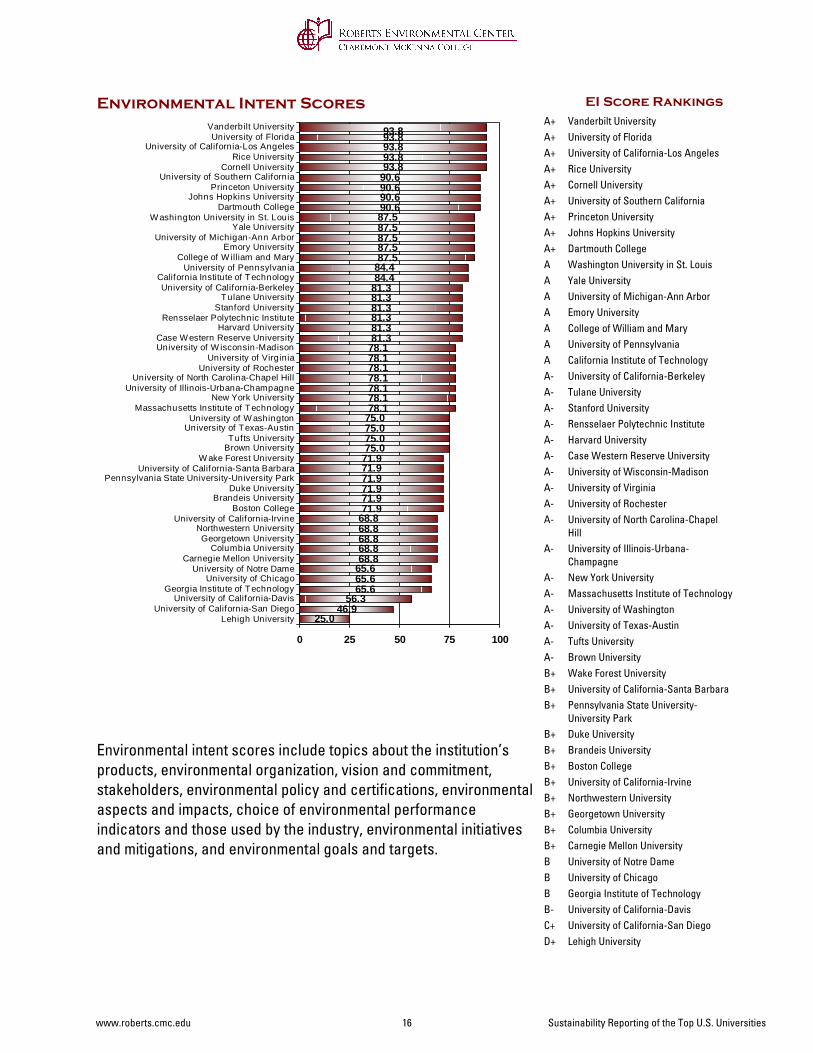
Environmental Intent Scores
Environmental intent scores include topics about the institution’s products, environmental organization, vision and commitment, stakeholders, environmental policy and certifications, environmental aspects and impacts, choice of environmental performance indicators and those used by the industry, environmental initiatives and mitigations, and environmental goals and targets.
EI Score RankingsVanderbilt UniversityA+University of FloridaA+University of California-Los AngelesA+Rice UniversityA+Cornell UniversityA+University of Southern CaliforniaA+Princeton UniversityA+Johns Hopkins UniversityA+Dartmouth CollegeA+Washington University in St. LouisAYale UniversityAUniversity of Michigan-Ann ArborAEmory UniversityACollege of William and MaryAUniversity of PennsylvaniaACalifornia Institute of TechnologyAUniversity of California-BerkeleyA-Tulane UniversityA-Stanford UniversityA-Rensselaer Polytechnic InstituteA-Harvard UniversityA-Case Western Reserve UniversityA-University of Wisconsin-MadisonA-University of VirginiaA-University of RochesterA-University of North Carolina-Chapel Hill
A-
University of Illinois-Urbana-Champagne
A-
New York UniversityA-Massachusetts Institute of TechnologyA-University of WashingtonA-University of Texas-AustinA-Tufts UniversityA-Brown UniversityA-Wake Forest UniversityB+University of California-Santa BarbaraB+Pennsylvania State University-University Park
B+
Duke UniversityB+Brandeis UniversityB+Boston CollegeB+University of California-IrvineB+Northwestern UniversityB+Georgetown UniversityB+Columbia UniversityB+Carnegie Mellon UniversityB+University of Notre DameBUniversity of ChicagoBGeorgia Institute of TechnologyBUniversity of California-DavisB-University of California-San DiegoC+Lehigh UniversityD+
25.046.9
56.365.665.665.668.868.868.868.868.871.971.971.971.971.971.975.075.075.075.078.178.178.178.178.178.178.181.381.381.381.381.381.384.484.487.587.587.587.587.590.690.690.690.693.893.893.893.893.8
0 25 50 75 100
Lehigh UniversityUniversity of California-San Diego
University of California-DavisGeorgia Institute of Technology
University of ChicagoUniversity of Notre Dame
Carnegie Mellon UniversityColumbia University
Georgetown UniversityNorthwestern University
University of California-IrvineBoston College
Brandeis UniversityDuke University
Pennsylvania State University-University ParkUniversity of California-Santa Barbara
W ake Forest UniversityBrown UniversityTufts University
University of Texas-AustinUniversity of W ashington
Massachusetts Institute of TechnologyNew York University
University of Illinois-Urbana-ChampagneUniversity of North Carolina-Chapel Hill
University of RochesterUniversity of Virginia
University of W isconsin-MadisonCase W estern Reserve University
Harvard UniversityRensselaer Polytechnic Institute
Stanford UniversityTulane University
University of California-BerkeleyCalifornia Institute of Technology
University of PennsylvaniaCollege of W illiam and Mary
Emory UniversityUniversity of Michigan-Ann Arbor
Yale UniversityW ashington University in St. Louis
Dartmouth CollegeJohns Hopkins University
Princeton UniversityUniversity of Southern California
Cornell UniversityRice University
University of California-Los AngelesUniversity of Florida
Vanderbilt University
www.roberts.cmc.edu 16 Sustainability Reporting of the Top U.S. Universities
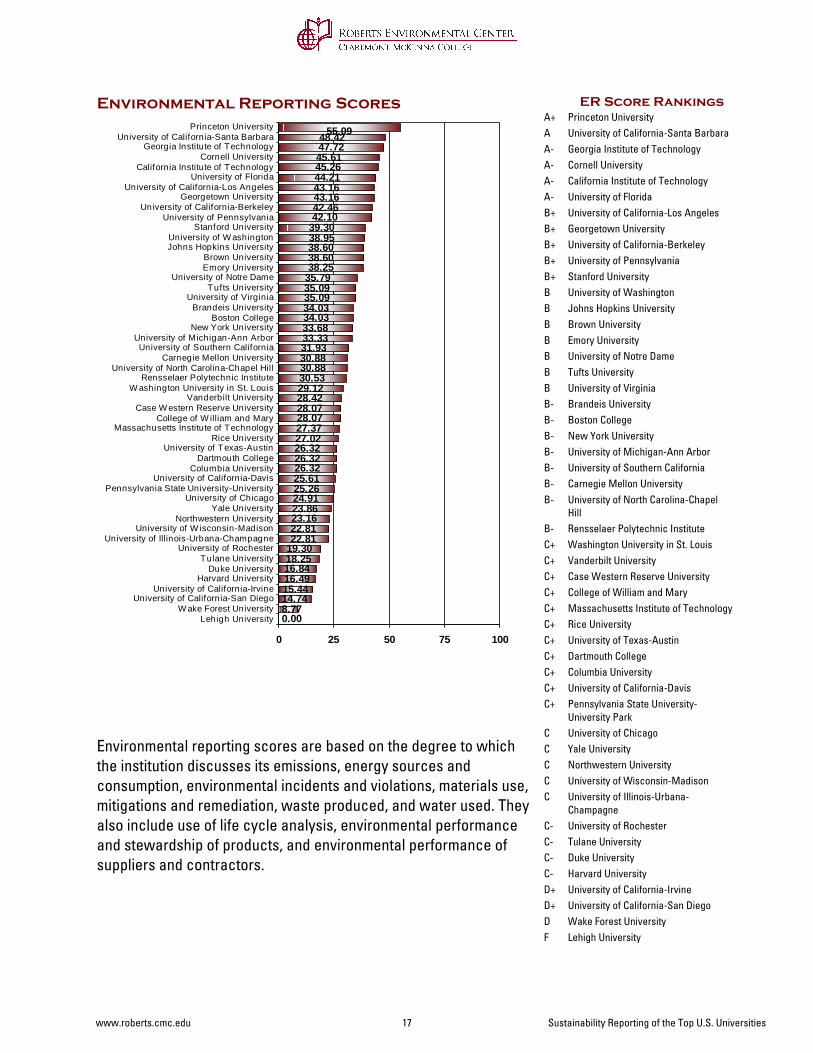
Environmental Reporting Scores
Environmental reporting scores are based on the degree to which the institution discusses its emissions, energy sources and consumption, environmental incidents and violations, materials use, mitigations and remediation, waste produced, and water used. They also include use of life cycle analysis, environmental performance and stewardship of products, and environmental performance of suppliers and contractors.
ER Score RankingsPrinceton UniversityA+University of California-Santa BarbaraAGeorgia Institute of TechnologyA-Cornell UniversityA-California Institute of TechnologyA-University of FloridaA-University of California-Los AngelesB+Georgetown UniversityB+University of California-BerkeleyB+University of PennsylvaniaB+Stanford UniversityB+University of WashingtonBJohns Hopkins UniversityBBrown UniversityBEmory UniversityBUniversity of Notre DameBTufts UniversityBUniversity of VirginiaBBrandeis UniversityB-Boston CollegeB-New York UniversityB-University of Michigan-Ann ArborB-University of Southern CaliforniaB-Carnegie Mellon UniversityB-University of North Carolina-Chapel Hill
B-
Rensselaer Polytechnic InstituteB-Washington University in St. LouisC+Vanderbilt UniversityC+Case Western Reserve UniversityC+College of William and MaryC+Massachusetts Institute of TechnologyC+Rice UniversityC+University of Texas-AustinC+Dartmouth CollegeC+Columbia UniversityC+University of California-DavisC+Pennsylvania State University-University Park
C+
University of ChicagoCYale UniversityCNorthwestern UniversityCUniversity of Wisconsin-MadisonCUniversity of Illinois-Urbana-Champagne
C
University of RochesterC-Tulane UniversityC-Duke UniversityC-Harvard UniversityC-University of California-IrvineD+University of California-San DiegoD+Wake Forest UniversityDLehigh UniversityF
0.008.7714.7415.4416.4916.8418.2519.3022.8122.8123.1623.8624.9125.2625.6126.3226.3226.3227.0227.3728.0728.0728.4229.1230.5330.8830.8831.9333.3333.6834.0334.0335.0935.0935.7938.2538.6038.6038.9539.3042.1042.4643.1643.1644.2145.2645.6147.7248.4255.09
0 25 50 75 100
Lehigh UniversityW ake Forest University
University of California-San DiegoUniversity of California-Irvine
Harvard UniversityDuke University
Tulane UniversityUniversity of Rochester
University of Illinois-Urbana-ChampagneUniversity of W isconsin-Madison
Northwestern UniversityYale University
University of ChicagoPennsylvania State University-University
University of California-DavisColumbia University
Dartmouth CollegeUniversity of Texas-Austin
Rice UniversityMassachusetts Institute of Technology
College of W illiam and MaryCase W estern Reserve University
Vanderbilt UniversityW ashington University in St. Louis
Rensselaer Polytechnic InstituteUniversity of North Carolina-Chapel Hill
Carnegie Mellon UniversityUniversity of Southern California
University of Michigan-Ann ArborNew York University
Boston CollegeBrandeis University
University of VirginiaTufts University
University of Notre DameEmory UniversityBrown University
Johns Hopkins UniversityUniversity of W ashington
Stanford UniversityUniversity of Pennsylvania
University of California-BerkeleyGeorgetown University
University of California-Los AngelesUniversity of Florida
California Institute of TechnologyCornell University
Georgia Institute of TechnologyUniversity of California-Santa Barbara
Princeton University
www.roberts.cmc.edu 17 Sustainability Reporting of the Top U.S. Universities
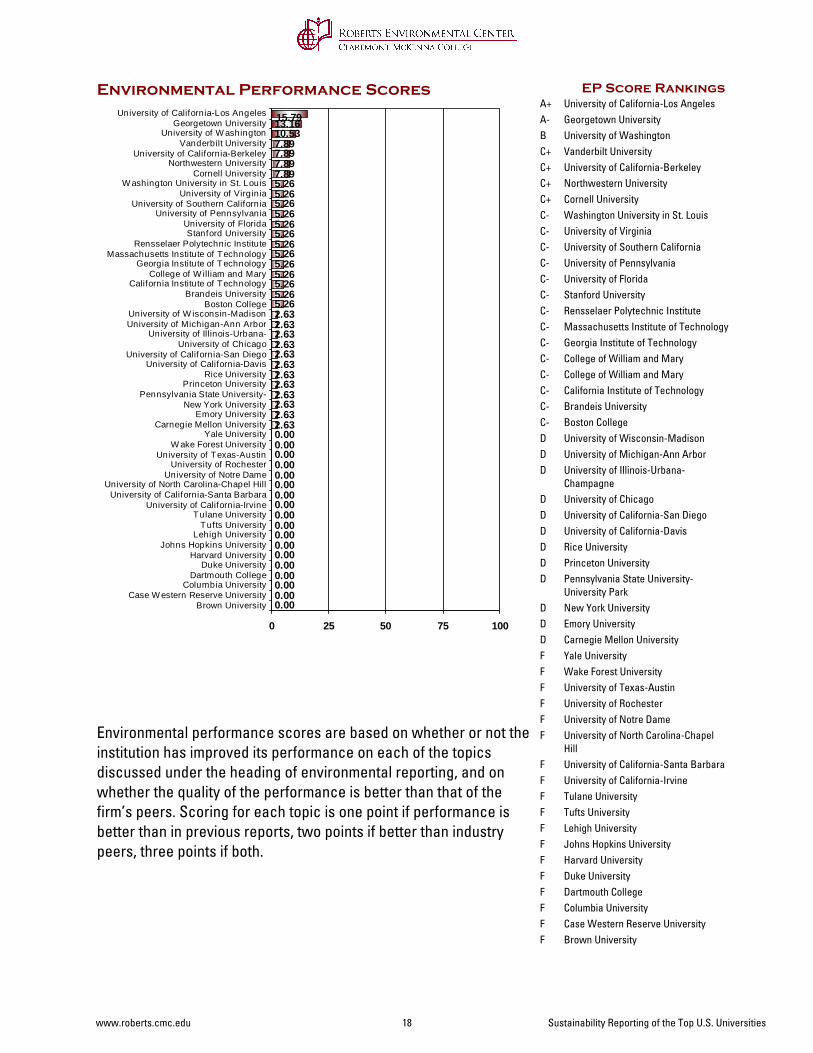
Environmental Performance Scores
Environmental performance scores are based on whether or not the institution has improved its performance on each of the topics discussed under the heading of environmental reporting, and on whether the quality of the performance is better than that of the firm’s peers. Scoring for each topic is one point if performance is better than in previous reports, two points if better than industry peers, three points if both.
EP Score RankingsUniversity of California-Los AngelesA+Georgetown UniversityA-University of WashingtonBVanderbilt UniversityC+University of California-BerkeleyC+Northwestern UniversityC+Cornell UniversityC+Washington University in St. LouisC-University of VirginiaC-University of Southern CaliforniaC-University of PennsylvaniaC-University of FloridaC-Stanford UniversityC-Rensselaer Polytechnic InstituteC-Massachusetts Institute of TechnologyC-Georgia Institute of TechnologyC-College of William and MaryC-College of William and MaryC-California Institute of TechnologyC-Brandeis UniversityC-Boston CollegeC-University of Wisconsin-MadisonDUniversity of Michigan-Ann ArborDUniversity of Illinois-Urbana-Champagne
D
University of ChicagoDUniversity of California-San DiegoDUniversity of California-DavisDRice UniversityDPrinceton UniversityDPennsylvania State University-University Park
D
New York UniversityDEmory UniversityDCarnegie Mellon UniversityDYale UniversityFWake Forest UniversityFUniversity of Texas-AustinFUniversity of RochesterFUniversity of Notre DameFUniversity of North Carolina-Chapel Hill
F
University of California-Santa BarbaraFUniversity of California-IrvineFTulane UniversityFTufts UniversityFLehigh UniversityFJohns Hopkins UniversityFHarvard UniversityFDuke UniversityFDartmouth CollegeFColumbia UniversityFCase Western Reserve UniversityFBrown UniversityF
0.000.000.000.000.000.000.000.000.000.000.000.000.000.000.000.000.000.002.632.632.632.632.632.632.632.632.632.632.632.635.265.265.265.265.265.265.265.265.265.265.265.265.267.897.897.897.8910.5313.1615.79
0 25 50 75 100
Brown UniversityCase W estern Reserve University
Columbia UniversityDartmouth College
Duke UniversityHarvard University
Johns Hopkins UniversityLehigh University
Tufts UniversityTulane University
University of California-IrvineUniversity of California-Santa Barbara
University of North Carolina-Chapel HillUniversity of Notre Dame
University of RochesterUniversity of Texas-Austin
W ake Forest UniversityYale University
Carnegie Mellon UniversityEmory University
New York UniversityPennsylvania State University-
Princeton UniversityRice University
University of California-DavisUniversity of California-San Diego
University of ChicagoUniversity of Illinois-Urbana-
University of Michigan-Ann ArborUniversity of W isconsin-Madison
Boston CollegeBrandeis University
California Institute of TechnologyCollege of W illiam and Mary
Georgia Institute of TechnologyMassachusetts Institute of Technology
Rensselaer Polytechnic InstituteStanford University
University of FloridaUniversity of Pennsylvania
University of Southern CaliforniaUniversity of Virginia
W ashington University in St. LouisCornell University
Northwestern UniversityUniversity of California-Berkeley
Vanderbilt UniversityUniversity of W ashington
Georgetown UniversityUniversity of California-Los Angeles
www.roberts.cmc.edu 18 Sustainability Reporting of the Top U.S. Universities
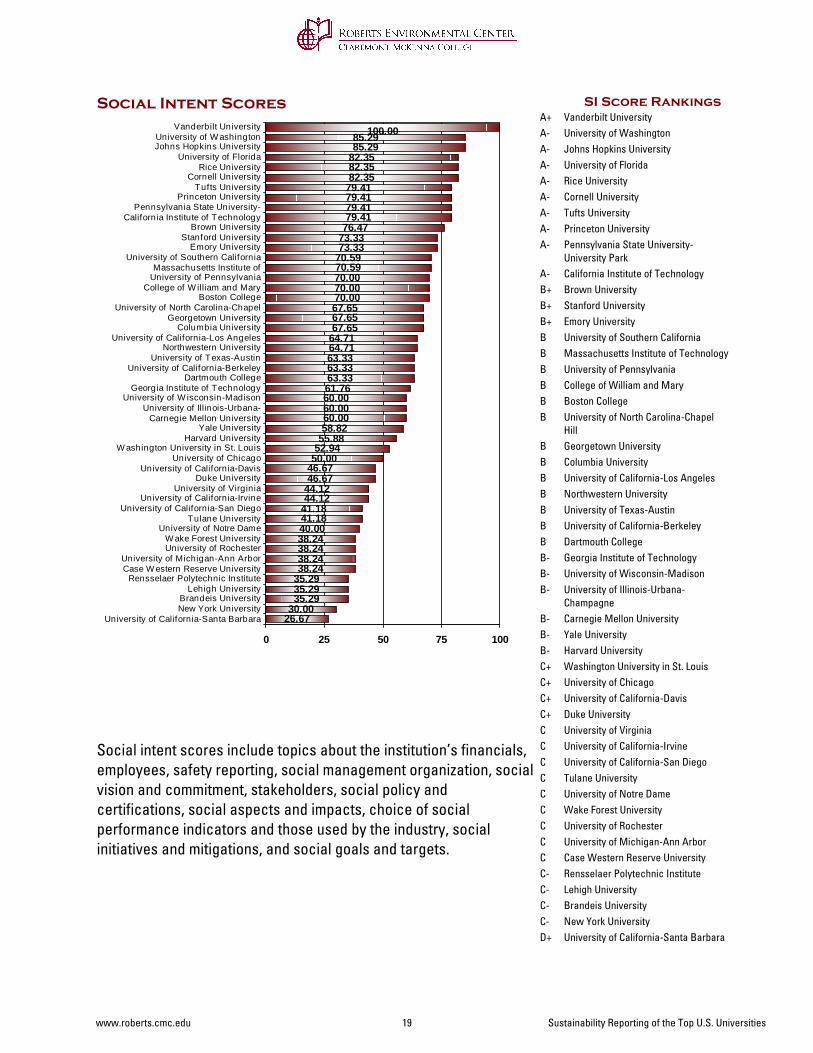
Social Intent Scores
Social intent scores include topics about the institution’s financials, employees, safety reporting, social management organization, social vision and commitment, stakeholders, social policy and certifications, social aspects and impacts, choice of social performance indicators and those used by the industry, social initiatives and mitigations, and social goals and targets.
SI Score RankingsVanderbilt UniversityA+University of WashingtonA-Johns Hopkins UniversityA-University of FloridaA-Rice UniversityA-Cornell UniversityA-Tufts UniversityA-Princeton UniversityA-Pennsylvania State University-University Park
A-
California Institute of TechnologyA-Brown UniversityB+Stanford UniversityB+Emory UniversityB+University of Southern CaliforniaBMassachusetts Institute of TechnologyBUniversity of PennsylvaniaBCollege of William and MaryBBoston CollegeBUniversity of North Carolina-Chapel Hill
B
Georgetown UniversityBColumbia UniversityBUniversity of California-Los AngelesBNorthwestern UniversityBUniversity of Texas-AustinBUniversity of California-BerkeleyBDartmouth CollegeBGeorgia Institute of TechnologyB-University of Wisconsin-MadisonB-University of Illinois-Urbana-Champagne
B-
Carnegie Mellon UniversityB-Yale UniversityB-Harvard UniversityB-Washington University in St. LouisC+University of ChicagoC+University of California-DavisC+Duke UniversityC+University of VirginiaCUniversity of California-IrvineCUniversity of California-San DiegoCTulane UniversityCUniversity of Notre DameCWake Forest UniversityCUniversity of RochesterCUniversity of Michigan-Ann ArborCCase Western Reserve UniversityCRensselaer Polytechnic InstituteC-Lehigh UniversityC-Brandeis UniversityC-New York UniversityC-University of California-Santa BarbaraD+
26.6730.0035.2935.2935.2938.2438.2438.2438.2440.0041.1841.1844.1244.1246.6746.6750.0052.9455.8858.8260.0060.0060.0061.7663.3363.3363.3364.7164.7167.6567.6567.6570.0070.0070.0070.5970.5973.3373.3376.4779.4179.4179.4179.4182.3582.3582.3585.2985.29100.00
0 25 50 75 100
University of California-Santa BarbaraNew York UniversityBrandeis University
Lehigh UniversityRensselaer Polytechnic Institute
Case W estern Reserve UniversityUniversity of Michigan-Ann Arbor
University of RochesterW ake Forest University
University of Notre DameTulane University
University of California-San DiegoUniversity of California-Irvine
University of VirginiaDuke University
University of California-DavisUniversity of Chicago
W ashington University in St. LouisHarvard University
Yale UniversityCarnegie Mellon University
University of Illinois-Urbana-University of W isconsin-Madison
Georgia Institute of TechnologyDartmouth College
University of California-BerkeleyUniversity of Texas-Austin
Northwestern UniversityUniversity of California-Los Angeles
Columbia UniversityGeorgetown University
University of North Carolina-ChapelBoston College
College of W illiam and MaryUniversity of PennsylvaniaMassachusetts Institute of
University of Southern CaliforniaEmory University
Stanford UniversityBrown University
California Institute of TechnologyPennsylvania State University-
Princeton UniversityTufts University
Cornell UniversityRice University
University of FloridaJohns Hopkins UniversityUniversity of W ashington
Vanderbilt University
www.roberts.cmc.edu 19 Sustainability Reporting of the Top U.S. Universities
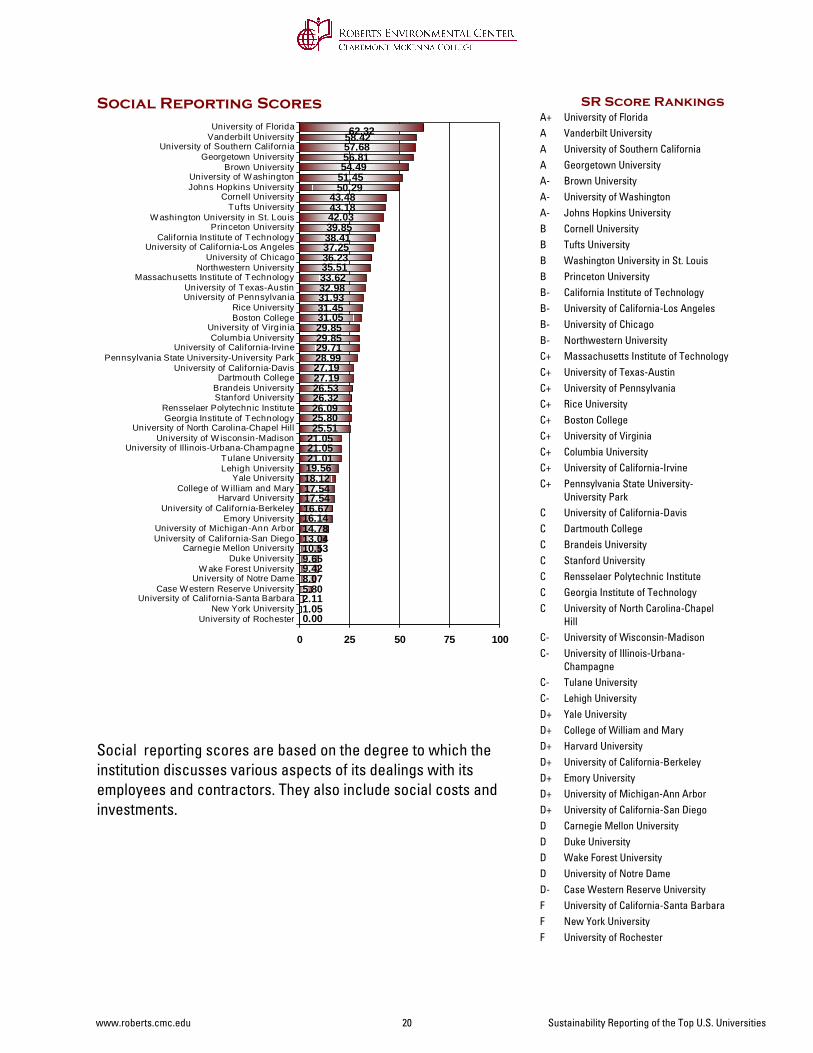
Social Reporting Scores
Social reporting scores are based on the degree to which the institution discusses various aspects of its dealings with its employees and contractors. They also include social costs and investments.
SR Score RankingsUniversity of FloridaA+Vanderbilt UniversityAUniversity of Southern CaliforniaAGeorgetown UniversityABrown UniversityA-University of WashingtonA-Johns Hopkins UniversityA-Cornell UniversityBTufts UniversityBWashington University in St. LouisBPrinceton UniversityBCalifornia Institute of TechnologyB-University of California-Los AngelesB-University of ChicagoB-Northwestern UniversityB-Massachusetts Institute of TechnologyC+University of Texas-AustinC+University of PennsylvaniaC+Rice UniversityC+Boston CollegeC+University of VirginiaC+Columbia UniversityC+University of California-IrvineC+Pennsylvania State University-University Park
C+
University of California-DavisCDartmouth CollegeCBrandeis UniversityCStanford UniversityCRensselaer Polytechnic InstituteCGeorgia Institute of TechnologyCUniversity of North Carolina-Chapel Hill
C
University of Wisconsin-MadisonC-University of Illinois-Urbana-Champagne
C-
Tulane UniversityC-Lehigh UniversityC-Yale UniversityD+College of William and MaryD+Harvard UniversityD+University of California-BerkeleyD+Emory UniversityD+University of Michigan-Ann ArborD+University of California-San DiegoD+Carnegie Mellon UniversityDDuke UniversityDWake Forest UniversityDUniversity of Notre DameDCase Western Reserve UniversityD-University of California-Santa BarbaraFNew York UniversityFUniversity of RochesterF
0.001.052.115.808.079.429.6510.5313.0414.7816.1416.6717.5417.5418.1219.5621.0121.0521.0525.5125.8026.0926.3226.5327.1927.1928.9929.7129.8529.8531.0531.4531.9332.9833.6235.5136.2337.2538.4139.8542.0343.1843.48
50.2951.4554.4956.8157.6858.4262.32
0 25 50 75 100
University of RochesterNew York University
University of California-Santa BarbaraCase W estern Reserve University
University of Notre DameW ake Forest University
Duke UniversityCarnegie Mellon University
University of California-San DiegoUniversity of Michigan-Ann Arbor
Emory UniversityUniversity of California-Berkeley
Harvard UniversityCollege of W illiam and Mary
Yale UniversityLehigh UniversityTulane University
University of Illinois-Urbana-ChampagneUniversity of W isconsin-Madison
University of North Carolina-Chapel HillGeorgia Institute of TechnologyRensselaer Polytechnic Institute
Stanford UniversityBrandeis UniversityDartmouth College
University of California-DavisPennsylvania State University-University Park
University of California-IrvineColumbia University
University of VirginiaBoston CollegeRice University
University of PennsylvaniaUniversity of Texas-Austin
Massachusetts Institute of TechnologyNorthwestern University
University of ChicagoUniversity of California-Los Angeles
California Institute of TechnologyPrinceton University
W ashington University in St. LouisTufts University
Cornell UniversityJohns Hopkins UniversityUniversity of W ashington
Brown UniversityGeorgetown University
University of Southern CaliforniaVanderbilt UniversityUniversity of Florida
www.roberts.cmc.edu 20 Sustainability Reporting of the Top U.S. Universities
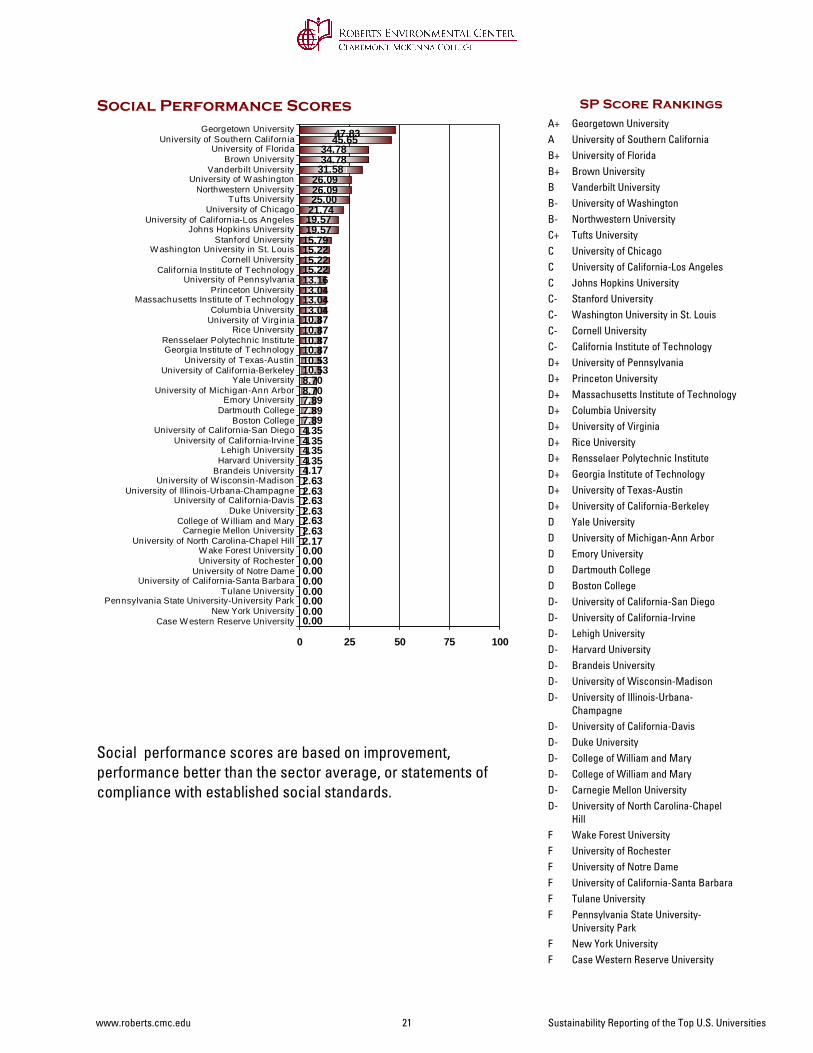
Social Performance Scores
Social performance scores are based on improvement, performance better than the sector average, or statements of compliance with established social standards.
SP Score RankingsGeorgetown UniversityA+University of Southern CaliforniaAUniversity of FloridaB+Brown UniversityB+Vanderbilt UniversityBUniversity of WashingtonB-Northwestern UniversityB-Tufts UniversityC+University of ChicagoCUniversity of California-Los AngelesCJohns Hopkins UniversityCStanford UniversityC-Washington University in St. LouisC-Cornell UniversityC-California Institute of TechnologyC-University of PennsylvaniaD+Princeton UniversityD+Massachusetts Institute of TechnologyD+Columbia UniversityD+University of VirginiaD+Rice UniversityD+Rensselaer Polytechnic InstituteD+Georgia Institute of TechnologyD+University of Texas-AustinD+University of California-BerkeleyD+Yale UniversityDUniversity of Michigan-Ann ArborDEmory UniversityDDartmouth CollegeDBoston CollegeDUniversity of California-San DiegoD-University of California-IrvineD-Lehigh UniversityD-Harvard UniversityD-Brandeis UniversityD-University of Wisconsin-MadisonD-University of Illinois-Urbana-Champagne
D-
University of California-DavisD-Duke UniversityD-College of William and MaryD-College of William and MaryD-Carnegie Mellon UniversityD-University of North Carolina-Chapel Hill
D-
Wake Forest UniversityFUniversity of RochesterFUniversity of Notre DameFUniversity of California-Santa BarbaraFTulane UniversityFPennsylvania State University-University Park
F
New York UniversityFCase Western Reserve UniversityF
0.000.000.000.000.000.000.000.002.172.632.632.632.632.632.634.174.354.354.354.357.897.897.898.708.7010.5310.5310.8710.8710.8710.8713.0413.0413.0413.1615.2215.2215.2215.7919.5719.5721.7425.0026.0926.0931.5834.7834.78
45.6547.83
0 25 50 75 100
Case W estern Reserve UniversityNew York University
Pennsylvania State University-University ParkTulane University
University of California-Santa BarbaraUniversity of Notre Dame
University of RochesterW ake Forest University
University of North Carolina-Chapel HillCarnegie Mellon University
College of W illiam and MaryDuke University
University of California-DavisUniversity of Illinois-Urbana-Champagne
University of W isconsin-MadisonBrandeis UniversityHarvard UniversityLehigh University
University of California-IrvineUniversity of California-San Diego
Boston CollegeDartmouth College
Emory UniversityUniversity of Michigan-Ann Arbor
Yale UniversityUniversity of California-Berkeley
University of Texas-AustinGeorgia Institute of TechnologyRensselaer Polytechnic Institute
Rice UniversityUniversity of VirginiaColumbia University
Massachusetts Institute of TechnologyPrinceton University
University of PennsylvaniaCalifornia Institute of Technology
Cornell UniversityW ashington University in St. Louis
Stanford UniversityJohns Hopkins University
University of California-Los AngelesUniversity of Chicago
Tufts UniversityNorthwestern University
University of W ashingtonVanderbilt University
Brown UniversityUniversity of Florida
University of Southern CaliforniaGeorgetown University
www.roberts.cmc.edu 21 Sustainability Reporting of the Top U.S. Universities
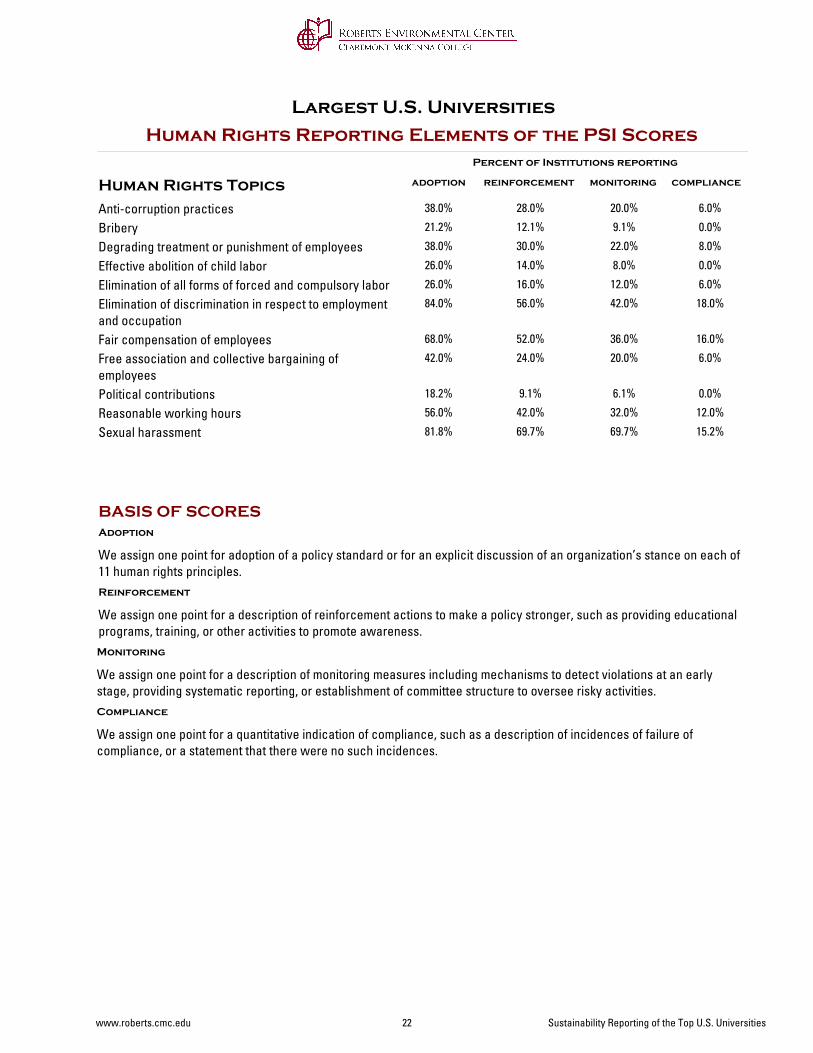
Human Rights Reporting Elements of the PSI Scores
Largest U.S. Universities
adoption reinforcement monitoring complianceHuman Rights Topics
Percent of Institutions reporting
Anti-corruption practices 38.0% 28.0% 20.0% 6.0%
Bribery 21.2% 12.1% 9.1% 0.0%
Degrading treatment or punishment of employees 38.0% 30.0% 22.0% 8.0%
Effective abolition of child labor 26.0% 14.0% 8.0% 0.0%
Elimination of all forms of forced and compulsory labor 26.0% 16.0% 12.0% 6.0%
Elimination of discrimination in respect to employment and occupation
84.0% 56.0% 42.0% 18.0%
Fair compensation of employees 68.0% 52.0% 36.0% 16.0%
Free association and collective bargaining of employees
42.0% 24.0% 20.0% 6.0%
Political contributions 18.2% 9.1% 6.1% 0.0%
Reasonable working hours 56.0% 42.0% 32.0% 12.0%
Sexual harassment 81.8% 69.7% 69.7% 15.2%
We assign one point for adoption of a policy standard or for an explicit discussion of an organization’s stance on each of 11 human rights principles.
Adoption
We assign one point for a description of reinforcement actions to make a policy stronger, such as providing educational programs, training, or other activities to promote awareness.
Reinforcement
We assign one point for a description of monitoring measures including mechanisms to detect violations at an early stage, providing systematic reporting, or establishment of committee structure to oversee risky activities.
Monitoring
We assign one point for a quantitative indication of compliance, such as a description of incidences of failure of compliance, or a statement that there were no such incidences.
Compliance
BASIS OF SCORES
www.roberts.cmc.edu 22 Sustainability Reporting of the Top U.S. Universities
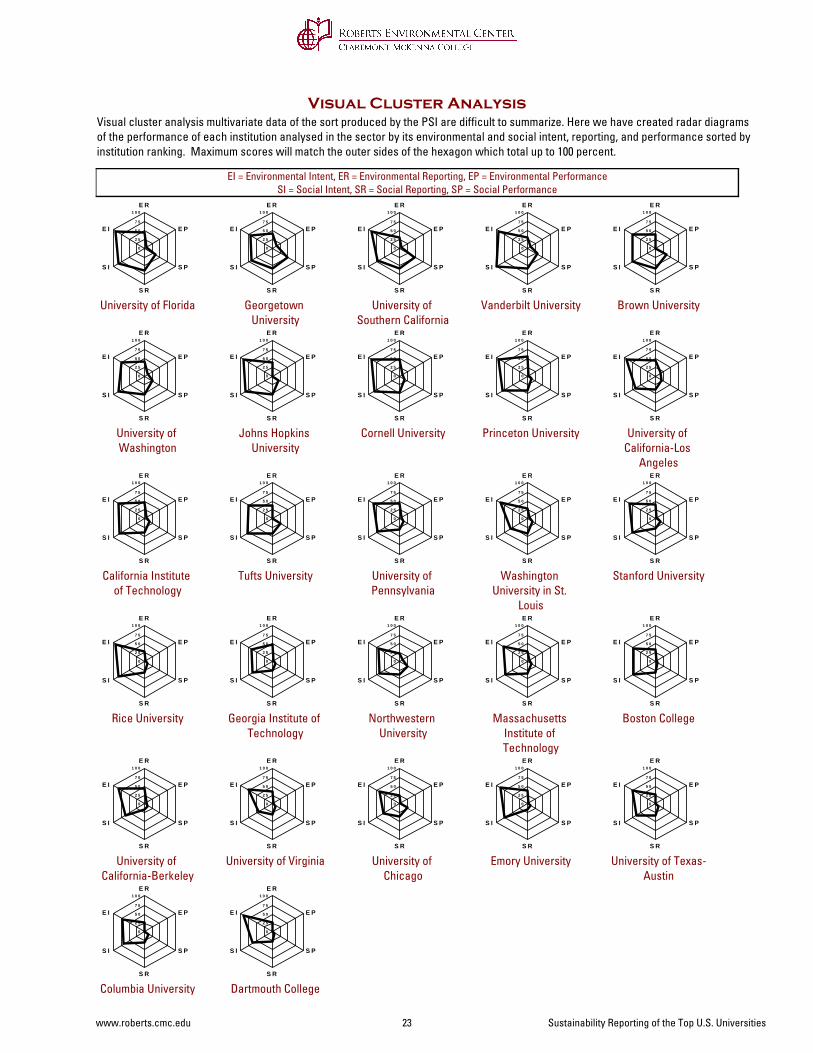
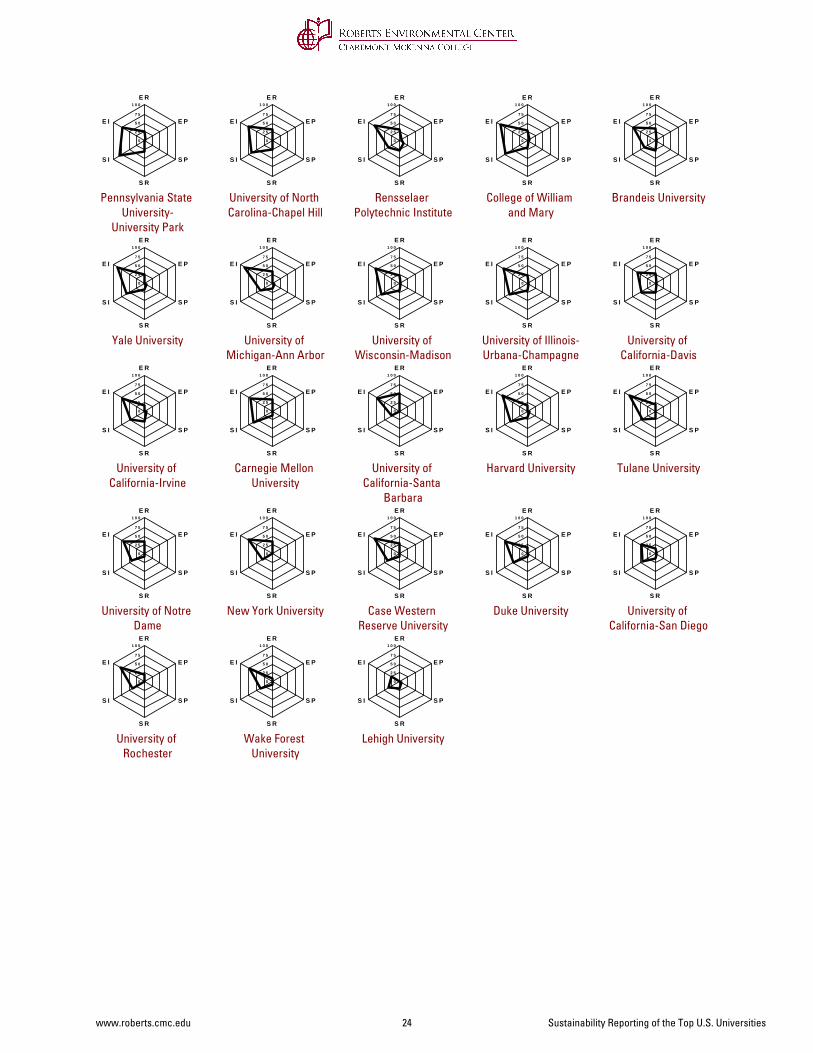
Visual cluster analysis multivariate data of the sort produced by the PSI are difficult to summarize. Here we have created radar diagrams of the performance of each institution analysed in the sector by its environmental and social intent, reporting, and performance sorted by institution ranking. Maximum scores will match the outer sides of the hexagon which total up to 100 percent.
Visual Cluster Analysis
EI = Environmental Intent, ER = Environmental Reporting, EP = Environmental PerformanceSI = Social Intent, SR = Social Reporting, SP = Social Performance
University of Florida
0
2 5
5 0
7 5
1 0 0E R
E P
S P
S R
S I
E I
Georgetown University
0
2 5
5 0
7 5
1 0 0E R
E P
S P
S R
S I
E I
University of Southern California
0
2 5
5 0
7 5
1 0 0E R
E P
S P
S R
S I
E I
Vanderbilt University
0
2 5
5 0
7 5
1 0 0E R
E P
S P
S R
S I
E I
Brown University
0
2 5
5 0
7 5
1 0 0E R
E P
S P
S R
S I
E I
University of Washington
0
2 5
5 0
7 5
1 0 0E R
E P
S P
S R
S I
E I
Johns Hopkins University
0
2 5
5 0
7 5
1 0 0E R
E P
S P
S R
S I
E I
Cornell University
0
2 5
5 0
7 5
1 0 0E R
E P
S P
S R
S I
E I
Princeton University
0
2 5
5 0
7 5
1 0 0E R
E P
S P
S R
S I
E I
University of California-Los
Angeles
0
2 5
5 0
7 5
1 0 0E R
E P
S P
S R
S I
E I
California Institute of Technology
0
2 5
5 0
7 5
1 0 0E R
E P
S P
S R
S I
E I
Tufts University
0
2 5
5 0
7 5
1 0 0E R
E P
S P
S R
S I
E I
University of Pennsylvania
0
2 5
5 0
7 5
1 0 0E R
E P
S P
S R
S I
E I
Washington University in St.
Louis
0
2 5
5 0
7 5
1 0 0E R
E P
S P
S R
S I
E I
Stanford University
0
2 5
5 0
7 5
1 0 0E R
E P
S P
S R
S I
E I
Rice University
0
2 5
5 0
7 5
1 0 0E R
E P
S P
S R
S I
E I
Georgia Institute of Technology
0
2 5
5 0
7 5
1 0 0E R
E P
S P
S R
S I
E I
Northwestern University
0
2 5
5 0
7 5
1 0 0E R
E P
S P
S R
S I
E I
Massachusetts Institute of Technology
0
2 5
5 0
7 5
1 0 0E R
E P
S P
S R
S I
E I
Boston College
0
2 5
5 0
7 5
1 0 0E R
E P
S P
S R
S I
E I
University of California-Berkeley
0
2 5
5 0
7 5
1 0 0E R
E P
S P
S R
S I
E I
University of Virginia
0
2 5
5 0
7 5
1 0 0E R
E P
S P
S R
S I
E I
University of Chicago
0
2 5
5 0
7 5
1 0 0E R
E P
S P
S R
S I
E I
Emory University
0
2 5
5 0
7 5
1 0 0E R
E P
S P
S R
S I
E I
University of Texas-Austin
0
2 5
5 0
7 5
1 0 0E R
E P
S P
S R
S I
E I
Columbia University
0
2 5
5 0
7 5
1 0 0E R
E P
S P
S R
S I
E I
Dartmouth College
0
2 5
5 0
7 5
1 0 0E R
E P
S P
S R
S I
E I
www.roberts.cmc.edu 23 Sustainability Reporting of the Top U.S. Universities
Pennsylvania State University-
University Park
0
2 5
5 0
7 5
1 0 0E R
E P
S P
S R
S I
E I
University of North Carolina-Chapel Hill
0
2 5
5 0
7 5
1 0 0E R
E P
S P
S R
S I
E I
Rensselaer Polytechnic Institute
0
2 5
5 0
7 5
1 0 0E R
E P
S P
S R
S I
E I
College of William and Mary
0
2 5
5 0
7 5
1 0 0E R
E P
S P
S R
S I
E I
Brandeis University
0
2 5
5 0
7 5
1 0 0E R
E P
S P
S R
S I
E I
Yale University
0
2 5
5 0
7 5
1 0 0E R
E P
S P
S R
S I
E I
University of Michigan-Ann Arbor
0
2 5
5 0
7 5
1 0 0E R
E P
S P
S R
S I
E I
University of Wisconsin-Madison
0
2 5
5 0
7 5
1 0 0E R
E P
S P
S R
S I
E I
University of Illinois-Urbana-Champagne
0
2 5
5 0
7 5
1 0 0E R
E P
S P
S R
S I
E I
University of California-Davis
0
2 5
5 0
7 5
1 0 0E R
E P
S P
S R
S I
E I
University of California-Irvine
0
2 5
5 0
7 5
1 0 0E R
E P
S P
S R
S I
E I
Carnegie Mellon University
0
2 5
5 0
7 5
1 0 0E R
E P
S P
S R
S I
E I
University of California-Santa
Barbara
0
2 5
5 0
7 5
1 0 0E R
E P
S P
S R
S I
E I
Harvard University
0
2 5
5 0
7 5
1 0 0E R
E P
S P
S R
S I
E I
Tulane University
0
2 5
5 0
7 5
1 0 0E R
E P
S P
S R
S I
E I
University of Notre Dame
0
2 5
5 0
7 5
1 0 0E R
E P
S P
S R
S I
E I
New York University
0
2 5
5 0
7 5
1 0 0E R
E P
S P
S R
S I
E I
Case Western Reserve University
0
2 5
5 0
7 5
1 0 0E R
E P
S P
S R
S I
E I
Duke University
0
2 5
5 0
7 5
1 0 0E R
E P
S P
S R
S I
E I
University of California-San Diego
0
2 5
5 0
7 5
1 0 0E R
E P
S P
S R
S I
E I
University of Rochester
0
2 5
5 0
7 5
1 0 0E R
E P
S P
S R
S I
E I
Wake Forest University
0
2 5
5 0
7 5
1 0 0E R
E P
S P
S R
S I
E I
Lehigh University
0
2 5
5 0
7 5
1 0 0E R
E P
S P
S R
S I
E I
www.roberts.cmc.edu 24 Sustainability Reporting of the Top U.S. Universities
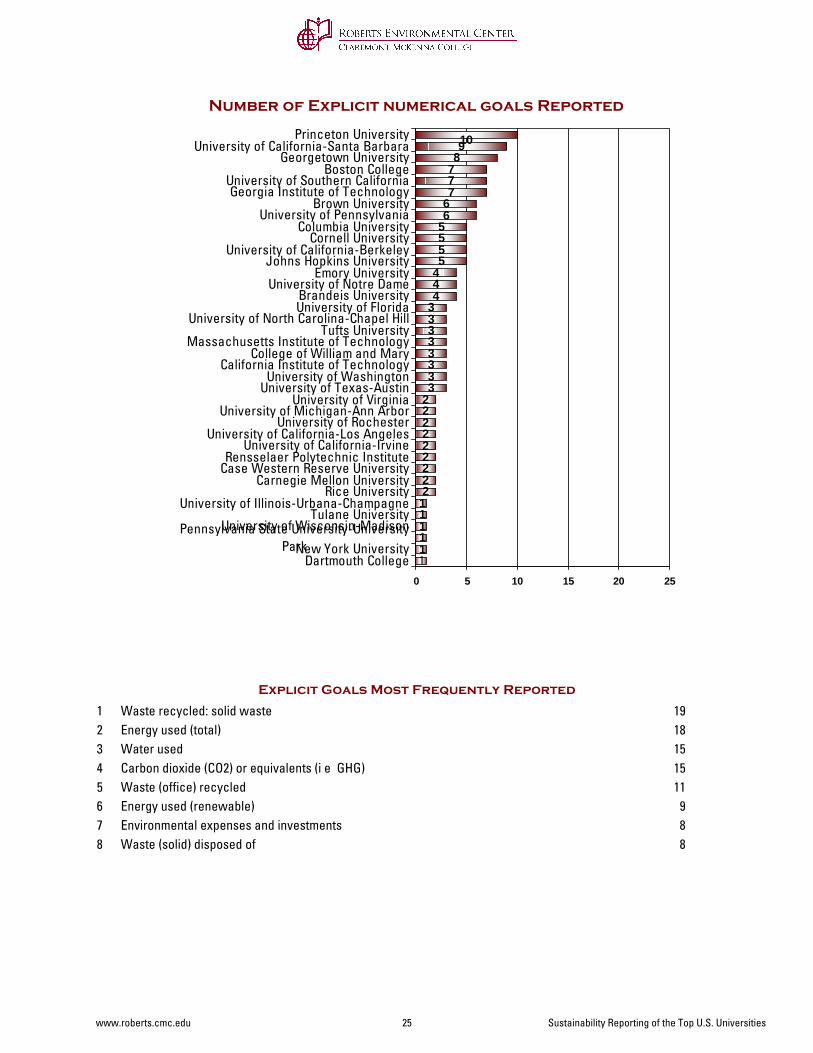
Number of Explicit numerical goals Reported
Explicit Goals Most Frequently Reported
11111222222222333333334445555667778910
1
0 5 10 15 20 25
Dartmouth CollegeNew York University
Pennsylvania State University-UniversityPark
University of Wisconsin-MadisonTulane University
University of Illinois-Urbana-ChampagneRice University
Carnegie Mellon UniversityCase Western Reserve UniversityRensselaer Polytechnic Institute
University of California-IrvineUniversity of California-Los Angeles
University of RochesterUniversity of Michigan-Ann Arbor
University of VirginiaUniversity of Texas-Austin
University of WashingtonCalifornia Institute of Technology
College of William and MaryMassachusetts Institute of Technology
Tufts UniversityUniversity of North Carolina-Chapel Hill
University of FloridaBrandeis University
University of Notre DameEmory University
Johns Hopkins UniversityUniversity of California-Berkeley
Cornell UniversityColumbia University
University of PennsylvaniaBrown University
Georgia Institute of TechnologyUniversity of Southern California
Boston CollegeGeorgetown University
University of California-Santa BarbaraPrinceton University
Waste recycled: solid waste1 19Energy used (total)2 18Water used3 15Carbon dioxide (CO2) or equivalents (i e GHG)4 15Waste (office) recycled5 11Energy used (renewable)6 9Environmental expenses and investments7 8Waste (solid) disposed of8 8
www.roberts.cmc.edu 25 Sustainability Reporting of the Top U.S. Universities
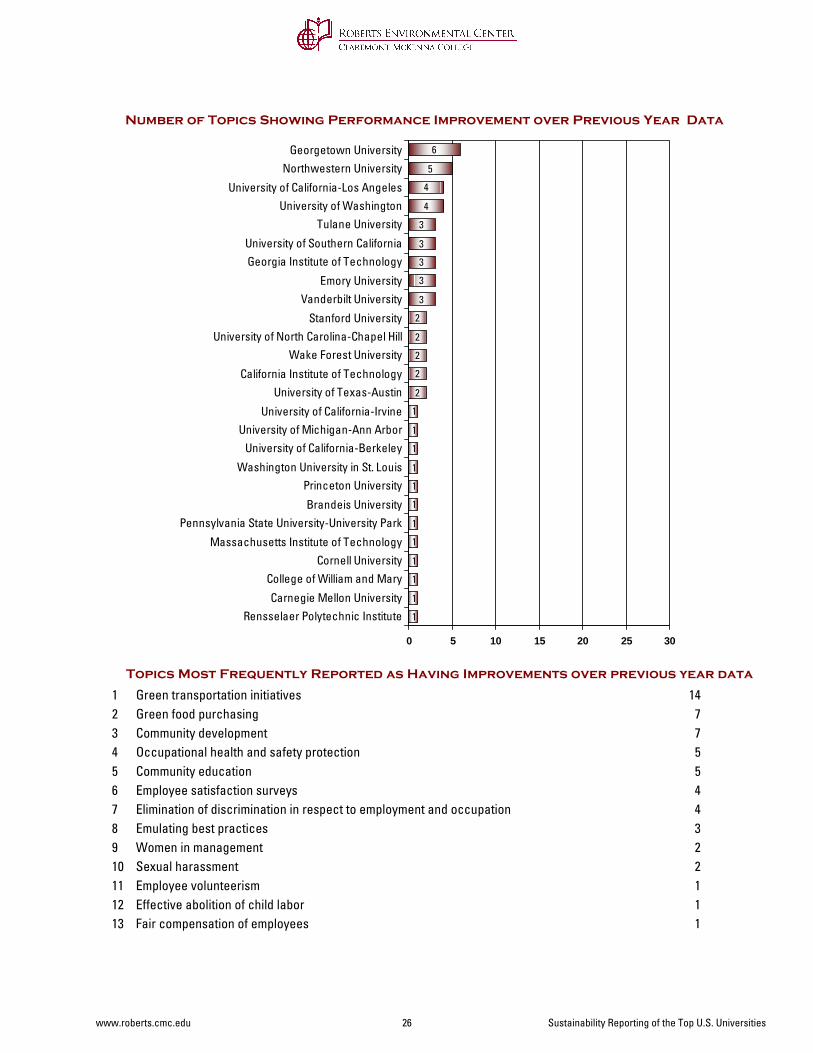
Number of Topics Showing Performance Improvement over Previous Year Data
Topics Most Frequently Reported as Having Improvements over previous year data
1
1
1
1
1
1
1
1
1
1
1
1
2
2
2
2
2
3
3
3
3
3
4
4
5
6
0 5 10 15 20 25 30
Rensselaer Polytechnic InstituteCarnegie Mellon University
College of William and MaryCornell University
Massachusetts Institute of Technology
Pennsylvania State University-University ParkBrandeis University
Princeton UniversityWashington University in St. Louis
University of California-BerkeleyUniversity of Michigan-Ann Arbor
University of California-Irvine
University of Texas-AustinCalifornia Institute of Technology
Wake Forest UniversityUniversity of North Carolina-Chapel Hill
Stanford University
Vanderbilt UniversityEmory University
Georgia Institute of TechnologyUniversity of Southern California
Tulane UniversityUniversity of Washington
University of California-Los Angeles
Northwestern UniversityGeorgetown University
Green transportation initiatives1 14Green food purchasing2 7Community development3 7Occupational health and safety protection4 5Community education5 5Employee satisfaction surveys6 4Elimination of discrimination in respect to employment and occupation7 4Emulating best practices8 3Women in management9 2Sexual harassment10 2Employee volunteerism11 1Effective abolition of child labor12 1Fair compensation of employees13 1
www.roberts.cmc.edu 26 Sustainability Reporting of the Top U.S. Universities
Boston College
0 2 5 5 0 7 5
SSA
SESA
E
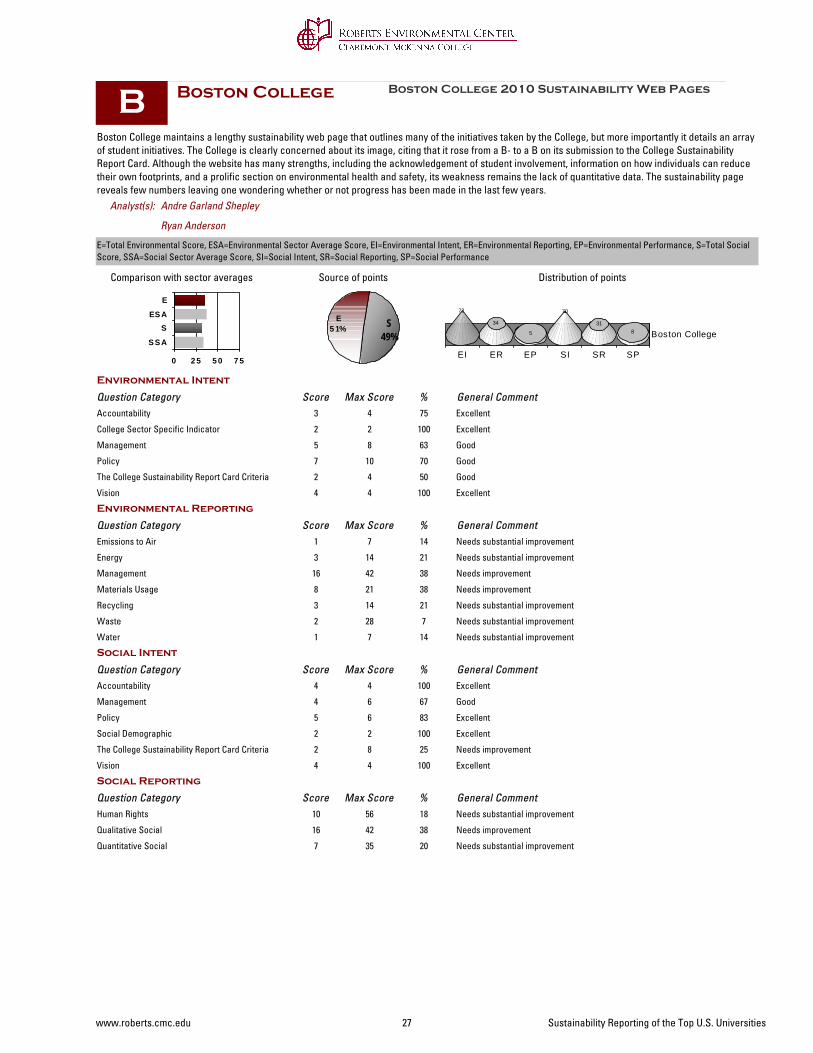
Boston College maintains a lengthy sustainability web page that outlines many of the initiatives taken by the College, but more importantly it details an array of student initiatives. The College is clearly concerned about its image, citing that it rose from a B- to a B on its submission to the College Sustainability Report Card. Although the website has many strengths, including the acknowledgement of student involvement, information on how individuals can reduce their own footprints, and a prolific section on environmental health and safety, its weakness remains the lack of quantitative data. The sustainability page reveals few numbers leaving one wondering whether or not progress has been made in the last few years.
S49%
E5 1%
Boston College 2010 Sustainability Web Pages
Comparison with sector averages Source of points
B
Ryan Anderson
Andre Garland Shepley
Distribution of points
E=Total Environmental Score, ESA=Environmental Sector Average Score, EI=Environmental Intent, ER=Environmental Reporting, EP=Environmental Performance, S=Total Social Score, SSA=Social Sector Average Score, SI=Social Intent, SR=Social Reporting, SP=Social Performance
EI ER EP SI SR SP
Boston College
72
34
5
70
318
Analyst(s):
Environmental Intent
Question Category Max Score General CommentScore %Accountability 4 Excellent3 75
College Sector Specific Indicator 2 Excellent2 100
Management 8 Good5 63
Policy 10 Good7 70
The College Sustainability Report Card Criteria 4 Good2 50
Vision 4 Excellent4 100
Environmental Reporting
Question Category Max Score General CommentScore %Emissions to Air 7 Needs substantial improvement1 14
Energy 14 Needs substantial improvement3 21
Management 42 Needs improvement16 38
Materials Usage 21 Needs improvement8 38
Recycling 14 Needs substantial improvement3 21
Waste 28 Needs substantial improvement2 7
Water 7 Needs substantial improvement1 14
Social Intent
Question Category Max Score General CommentScore %Accountability 4 Excellent4 100
Management 6 Good4 67
Policy 6 Excellent5 83
Social Demographic 2 Excellent2 100
The College Sustainability Report Card Criteria 8 Needs improvement2 25
Vision 4 Excellent4 100
Social Reporting
Question Category Max Score General CommentScore %Human Rights 56 Needs substantial improvement10 18
Qualitative Social 42 Needs improvement16 38
Quantitative Social 35 Needs substantial improvement7 20
www.roberts.cmc.edu 27 Sustainability Reporting of the Top U.S. Universities
Brandeis University
0 2 5 5 0 7 5
SSA
SESA
E
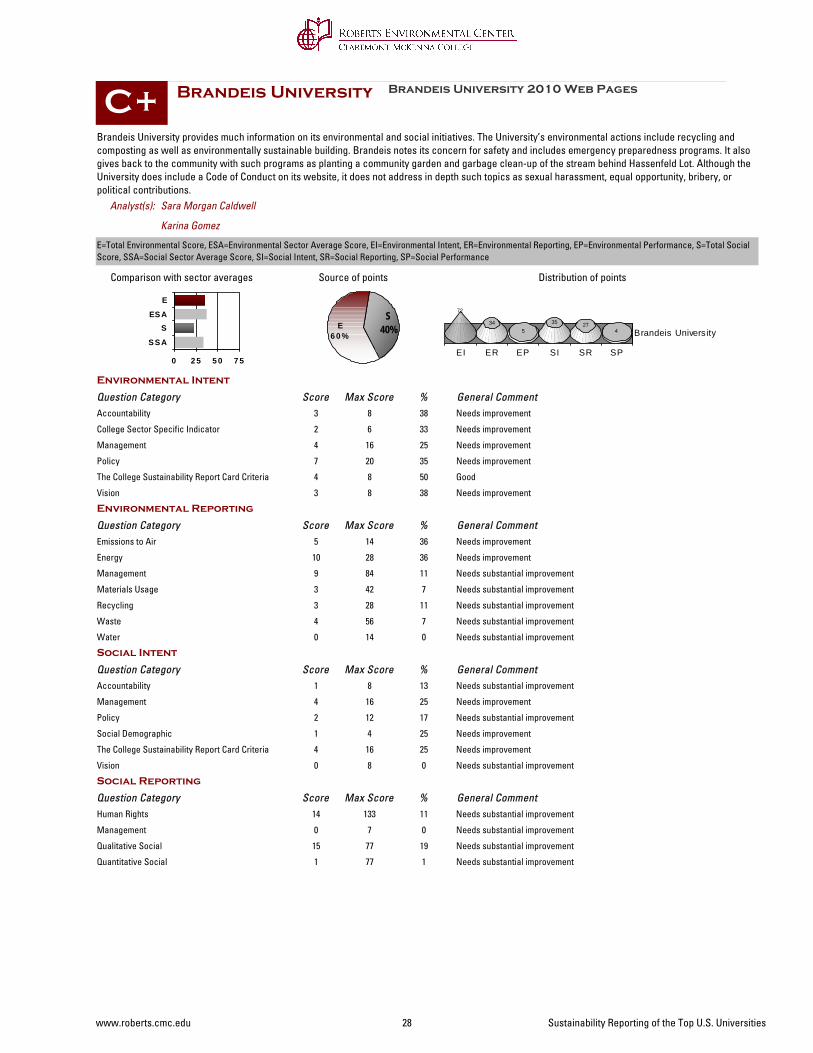
Brandeis University provides much information on its environmental and social initiatives. The University’s environmental actions include recycling and composting as well as environmentally sustainable building. Brandeis notes its concern for safety and includes emergency preparedness programs. It also gives back to the community with such programs as planting a community garden and garbage clean-up of the stream behind Hassenfeld Lot. Although the University does include a Code of Conduct on its website, it does not address in depth such topics as sexual harassment, equal opportunity, bribery, or political contributions.
S40%E
6 0 %
Brandeis University 2010 Web Pages
Comparison with sector averages Source of points
C+
Karina Gomez
Sara Morgan Caldwell
Distribution of points
E=Total Environmental Score, ESA=Environmental Sector Average Score, EI=Environmental Intent, ER=Environmental Reporting, EP=Environmental Performance, S=Total Social Score, SSA=Social Sector Average Score, SI=Social Intent, SR=Social Reporting, SP=Social Performance
EI ER EP SI SR SP
Brandeis University
72
345
35 274
Analyst(s):
Environmental Intent
Question Category Max Score General CommentScore %Accountability 8 Needs improvement3 38
College Sector Specific Indicator 6 Needs improvement2 33
Management 16 Needs improvement4 25
Policy 20 Needs improvement7 35
The College Sustainability Report Card Criteria 8 Good4 50
Vision 8 Needs improvement3 38
Environmental Reporting
Question Category Max Score General CommentScore %Emissions to Air 14 Needs improvement5 36
Energy 28 Needs improvement10 36
Management 84 Needs substantial improvement9 11
Materials Usage 42 Needs substantial improvement3 7
Recycling 28 Needs substantial improvement3 11
Waste 56 Needs substantial improvement4 7
Water 14 Needs substantial improvement0 0
Social Intent
Question Category Max Score General CommentScore %Accountability 8 Needs substantial improvement1 13
Management 16 Needs improvement4 25
Policy 12 Needs substantial improvement2 17
Social Demographic 4 Needs improvement1 25
The College Sustainability Report Card Criteria 16 Needs improvement4 25
Vision 8 Needs substantial improvement0 0
Social Reporting
Question Category Max Score General CommentScore %Human Rights 133 Needs substantial improvement14 11
Management 7 Needs substantial improvement0 0
Qualitative Social 77 Needs substantial improvement15 19
Quantitative Social 77 Needs substantial improvement1 1
www.roberts.cmc.edu 28 Sustainability Reporting of the Top U.S. Universities
Brown University
0 2 5 5 0 7 5
SSA
SESA
E
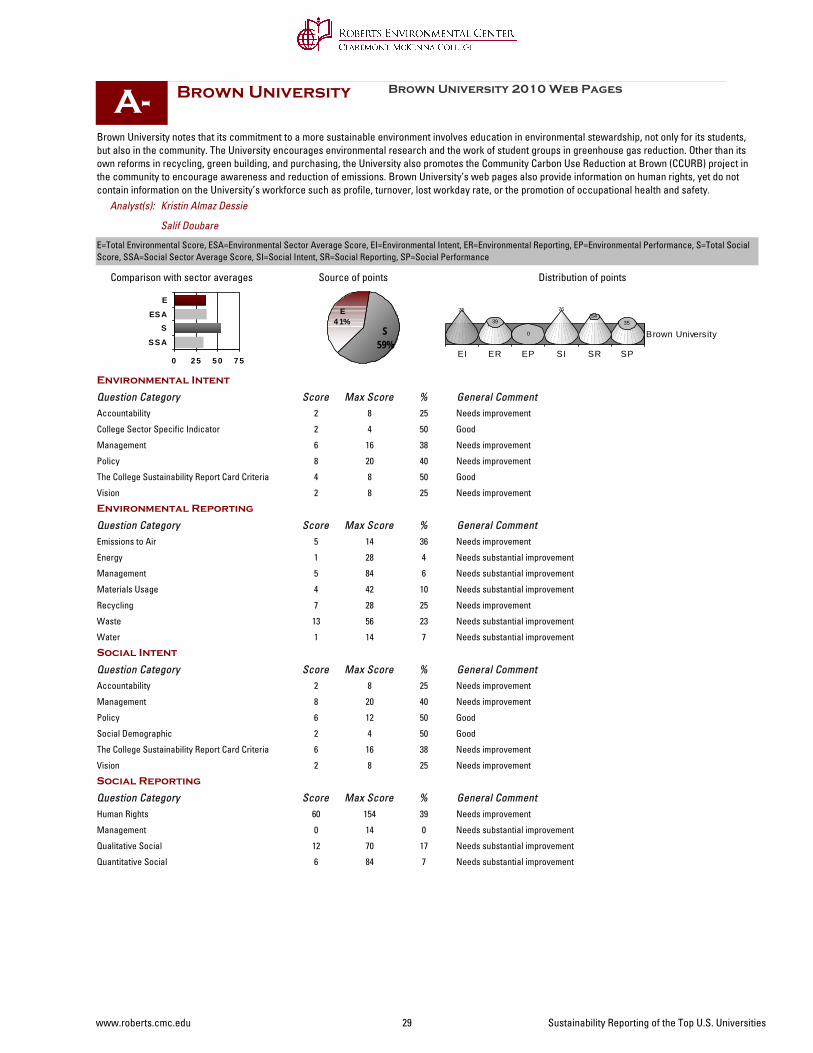
Brown University notes that its commitment to a more sustainable environment involves education in environmental stewardship, not only for its students, but also in the community. The University encourages environmental research and the work of student groups in greenhouse gas reduction. Other than its own reforms in recycling, green building, and purchasing, the University also promotes the Community Carbon Use Reduction at Brown (CCURB) project in the community to encourage awareness and reduction of emissions. Brown University’s web pages also provide information on human rights, yet do not contain information on the University’s workforce such as profile, turnover, lost workday rate, or the promotion of occupational health and safety.
S59%
E4 1%
Brown University 2010 Web Pages
Comparison with sector averages Source of points
A-
Salif Doubare
Kristin Almaz Dessie
Distribution of points
E=Total Environmental Score, ESA=Environmental Sector Average Score, EI=Environmental Intent, ER=Environmental Reporting, EP=Environmental Performance, S=Total Social Score, SSA=Social Sector Average Score, SI=Social Intent, SR=Social Reporting, SP=Social Performance
EI ER EP SI SR SP
Brown University
75
39
0
7654
35
Analyst(s):
Environmental Intent
Question Category Max Score General CommentScore %Accountability 8 Needs improvement2 25
College Sector Specific Indicator 4 Good2 50
Management 16 Needs improvement6 38
Policy 20 Needs improvement8 40
The College Sustainability Report Card Criteria 8 Good4 50
Vision 8 Needs improvement2 25
Environmental Reporting
Question Category Max Score General CommentScore %Emissions to Air 14 Needs improvement5 36
Energy 28 Needs substantial improvement1 4
Management 84 Needs substantial improvement5 6
Materials Usage 42 Needs substantial improvement4 10
Recycling 28 Needs improvement7 25
Waste 56 Needs substantial improvement13 23
Water 14 Needs substantial improvement1 7
Social Intent
Question Category Max Score General CommentScore %Accountability 8 Needs improvement2 25
Management 20 Needs improvement8 40
Policy 12 Good6 50
Social Demographic 4 Good2 50
The College Sustainability Report Card Criteria 16 Needs improvement6 38
Vision 8 Needs improvement2 25
Social Reporting
Question Category Max Score General CommentScore %Human Rights 154 Needs improvement60 39
Management 14 Needs substantial improvement0 0
Qualitative Social 70 Needs substantial improvement12 17
Quantitative Social 84 Needs substantial improvement6 7
www.roberts.cmc.edu 29 Sustainability Reporting of the Top U.S. Universities
California Institute of Technology
0 2 5 5 0 7 5
SSA
SESA
E
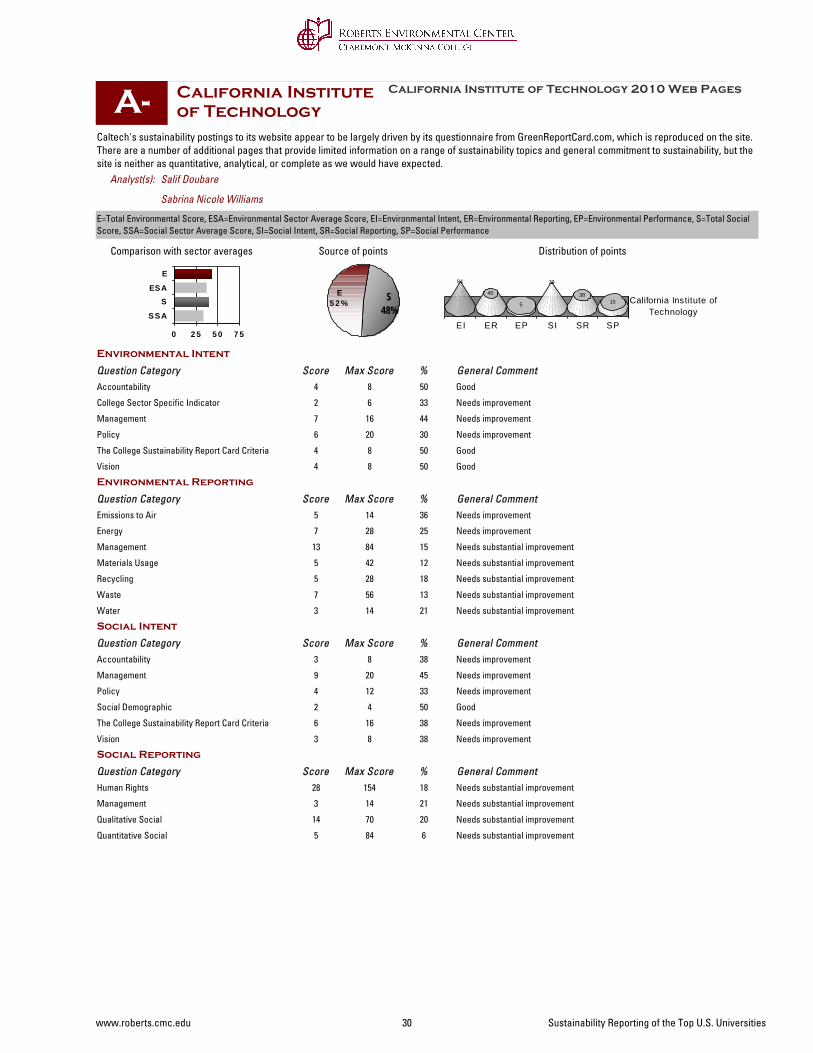
Caltech's sustainability postings to its website appear to be largely driven by its questionnaire from GreenReportCard.com, which is reproduced on the site. There are a number of additional pages that provide limited information on a range of sustainability topics and general commitment to sustainability, but the site is neither as quantitative, analytical, or complete as we would have expected.
S48%
E5 2 %
California Institute of Technology 2010 Web Pages
Comparison with sector averages Source of points
A-
Sabrina Nicole Williams
Salif Doubare
Distribution of points
E=Total Environmental Score, ESA=Environmental Sector Average Score, EI=Environmental Intent, ER=Environmental Reporting, EP=Environmental Performance, S=Total Social Score, SSA=Social Sector Average Score, SI=Social Intent, SR=Social Reporting, SP=Social Performance
EI ER EP SI SR SP
California Institute ofTechnology
84
45
5
79
3815
Analyst(s):
Environmental Intent
Question Category Max Score General CommentScore %Accountability 8 Good4 50
College Sector Specific Indicator 6 Needs improvement2 33
Management 16 Needs improvement7 44
Policy 20 Needs improvement6 30
The College Sustainability Report Card Criteria 8 Good4 50
Vision 8 Good4 50
Environmental Reporting
Question Category Max Score General CommentScore %Emissions to Air 14 Needs improvement5 36
Energy 28 Needs improvement7 25
Management 84 Needs substantial improvement13 15
Materials Usage 42 Needs substantial improvement5 12
Recycling 28 Needs substantial improvement5 18
Waste 56 Needs substantial improvement7 13
Water 14 Needs substantial improvement3 21
Social Intent
Question Category Max Score General CommentScore %Accountability 8 Needs improvement3 38
Management 20 Needs improvement9 45
Policy 12 Needs improvement4 33
Social Demographic 4 Good2 50
The College Sustainability Report Card Criteria 16 Needs improvement6 38
Vision 8 Needs improvement3 38
Social Reporting
Question Category Max Score General CommentScore %Human Rights 154 Needs substantial improvement28 18
Management 14 Needs substantial improvement3 21
Qualitative Social 70 Needs substantial improvement14 20
Quantitative Social 84 Needs substantial improvement5 6
www.roberts.cmc.edu 30 Sustainability Reporting of the Top U.S. Universities
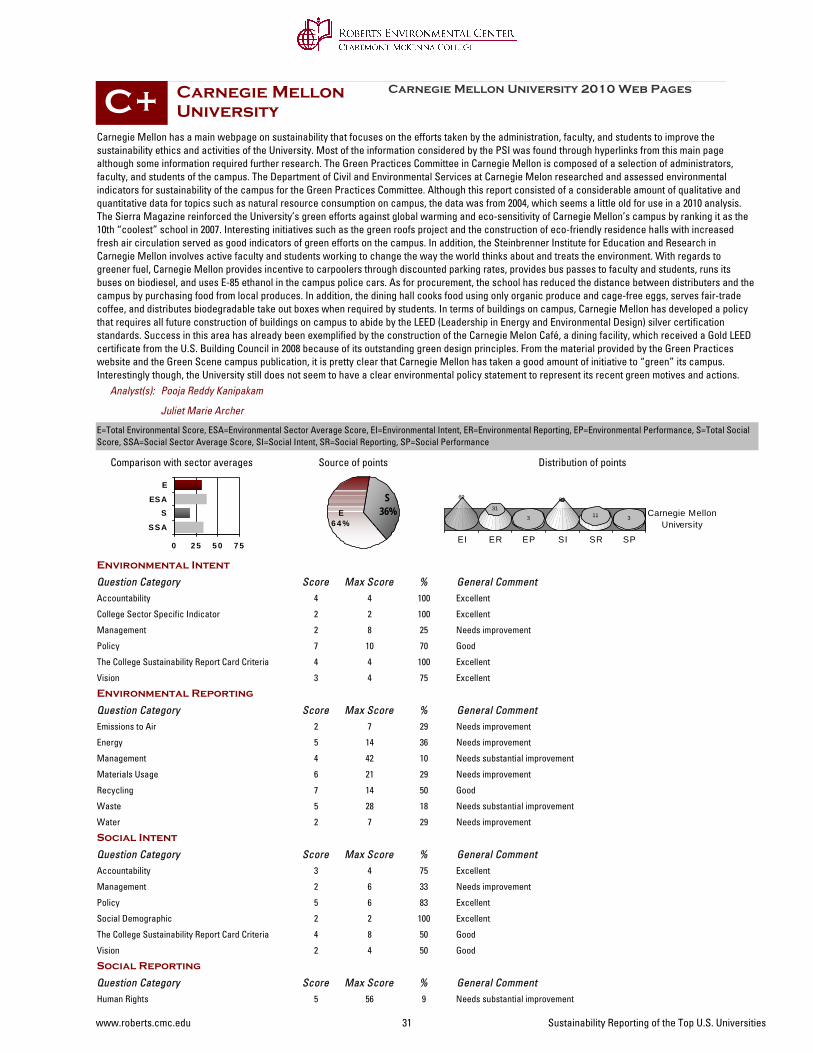
Carnegie Mellon University
0 2 5 5 0 7 5
SSA
SESA
E
Carnegie Mellon has a main webpage on sustainability that focuses on the efforts taken by the administration, faculty, and students to improve the sustainability ethics and activities of the University. Most of the information considered by the PSI was found through hyperlinks from this main page although some information required further research. The Green Practices Committee in Carnegie Mellon is composed of a selection of administrators, faculty, and students of the campus. The Department of Civil and Environmental Services at Carnegie Melon researched and assessed environmental indicators for sustainability of the campus for the Green Practices Committee. Although this report consisted of a considerable amount of qualitative and quantitative data for topics such as natural resource consumption on campus, the data was from 2004, which seems a little old for use in a 2010 analysis. The Sierra Magazine reinforced the University’s green efforts against global warming and eco-sensitivity of Carnegie Mellon’s campus by ranking it as the 10th “coolest” school in 2007. Interesting initiatives such as the green roofs project and the construction of eco-friendly residence halls with increased fresh air circulation served as good indicators of green efforts on the campus. In addition, the Steinbrenner Institute for Education and Research in Carnegie Mellon involves active faculty and students working to change the way the world thinks about and treats the environment. With regards to greener fuel, Carnegie Mellon provides incentive to carpoolers through discounted parking rates, provides bus passes to faculty and students, runs its buses on biodiesel, and uses E-85 ethanol in the campus police cars. As for procurement, the school has reduced the distance between distributers and the campus by purchasing food from local produces. In addition, the dining hall cooks food using only organic produce and cage-free eggs, serves fair-trade coffee, and distributes biodegradable take out boxes when required by students. In terms of buildings on campus, Carnegie Mellon has developed a policy that requires all future construction of buildings on campus to abide by the LEED (Leadership in Energy and Environmental Design) silver certification standards. Success in this area has already been exemplified by the construction of the Carnegie Melon Café, a dining facility, which received a Gold LEED certificate from the U.S. Building Council in 2008 because of its outstanding green design principles. From the material provided by the Green Practices website and the Green Scene campus publication, it is pretty clear that Carnegie Mellon has taken a good amount of initiative to “green” its campus. Interestingly though, the University still does not seem to have a clear environmental policy statement to represent its recent green motives and actions.
S36%E
6 4 %
Carnegie Mellon University 2010 Web Pages
Comparison with sector averages Source of points
C+
Juliet Marie Archer
Pooja Reddy Kanipakam
Distribution of points
E=Total Environmental Score, ESA=Environmental Sector Average Score, EI=Environmental Intent, ER=Environmental Reporting, EP=Environmental Performance, S=Total Social Score, SSA=Social Sector Average Score, SI=Social Intent, SR=Social Reporting, SP=Social Performance
EI ER EP SI SR SP
Carnegie MellonUniversity
69
31
3
60
11 3
Analyst(s):
Environmental Intent
Question Category Max Score General CommentScore %Accountability 4 Excellent4 100
College Sector Specific Indicator 2 Excellent2 100
Management 8 Needs improvement2 25
Policy 10 Good7 70
The College Sustainability Report Card Criteria 4 Excellent4 100
Vision 4 Excellent3 75
Environmental Reporting
Question Category Max Score General CommentScore %Emissions to Air 7 Needs improvement2 29
Energy 14 Needs improvement5 36
Management 42 Needs substantial improvement4 10
Materials Usage 21 Needs improvement6 29
Recycling 14 Good7 50
Waste 28 Needs substantial improvement5 18
Water 7 Needs improvement2 29
Social Intent
Question Category Max Score General CommentScore %Accountability 4 Excellent3 75
Management 6 Needs improvement2 33
Policy 6 Excellent5 83
Social Demographic 2 Excellent2 100
The College Sustainability Report Card Criteria 8 Good4 50
Vision 4 Good2 50
Social Reporting
Question Category Max Score General CommentScore %Human Rights 56 Needs substantial improvement5 9
www.roberts.cmc.edu 31 Sustainability Reporting of the Top U.S. Universities
Qualitative Social 42 Needs substantial improvement5 12
Quantitative Social 35 Needs substantial improvement0 0
www.roberts.cmc.edu 32 Sustainability Reporting of the Top U.S. Universities
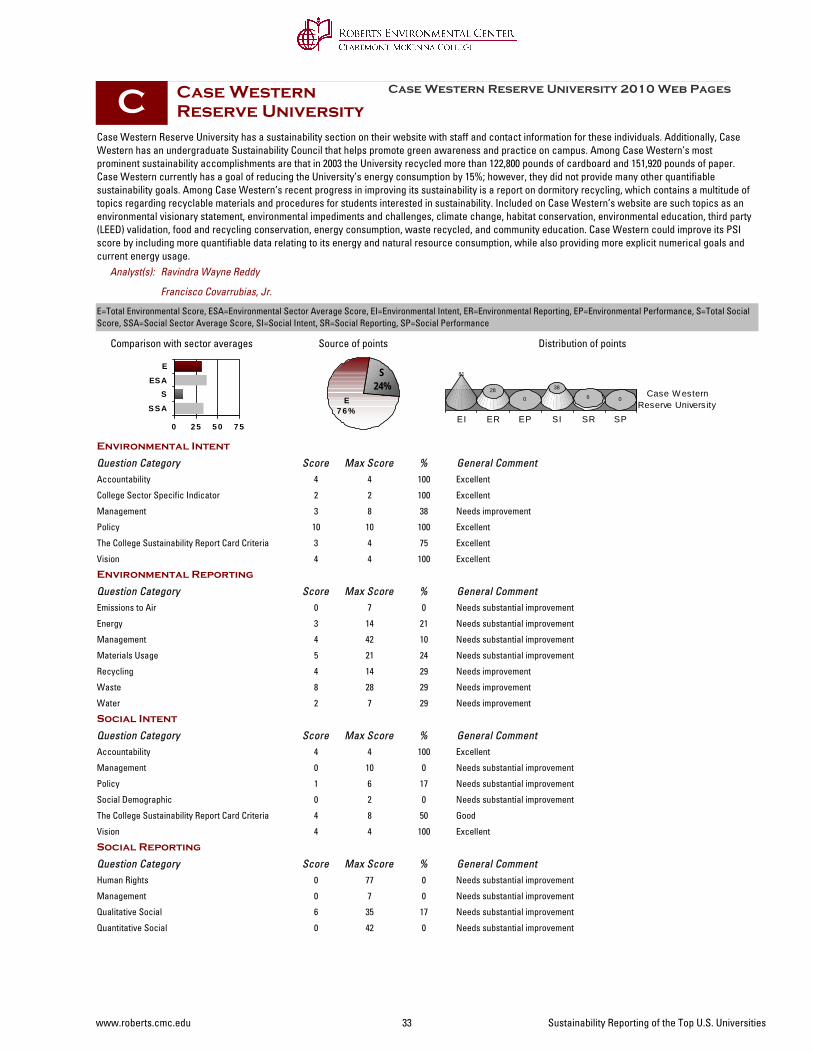
Case Western Reserve University
0 2 5 5 0 7 5
SSA
SESA
E
Case Western Reserve University has a sustainability section on their website with staff and contact information for these individuals. Additionally, Case Western has an undergraduate Sustainability Council that helps promote green awareness and practice on campus. Among Case Western’s most prominent sustainability accomplishments are that in 2003 the University recycled more than 122,800 pounds of cardboard and 151,920 pounds of paper. Case Western currently has a goal of reducing the University’s energy consumption by 15%; however, they did not provide many other quantifiable sustainability goals. Among Case Western’s recent progress in improving its sustainability is a report on dormitory recycling, which contains a multitude of topics regarding recyclable materials and procedures for students interested in sustainability. Included on Case Western’s website are such topics as an environmental visionary statement, environmental impediments and challenges, climate change, habitat conservation, environmental education, third party (LEED) validation, food and recycling conservation, energy consumption, waste recycled, and community education. Case Western could improve its PSI score by including more quantifiable data relating to its energy and natural resource consumption, while also providing more explicit numerical goals and current energy usage.
S24%
E7 6 %
Case Western Reserve University 2010 Web Pages
Comparison with sector averages Source of points
C
Francisco Covarrubias, Jr.
Ravindra Wayne Reddy
Distribution of points
E=Total Environmental Score, ESA=Environmental Sector Average Score, EI=Environmental Intent, ER=Environmental Reporting, EP=Environmental Performance, S=Total Social Score, SSA=Social Sector Average Score, SI=Social Intent, SR=Social Reporting, SP=Social Performance
EI ER EP SI SR SP
Case W esternReserve University
81
280
38
6 0
Analyst(s):
Environmental Intent
Question Category Max Score General CommentScore %Accountability 4 Excellent4 100
College Sector Specific Indicator 2 Excellent2 100
Management 8 Needs improvement3 38
Policy 10 Excellent10 100
The College Sustainability Report Card Criteria 4 Excellent3 75
Vision 4 Excellent4 100
Environmental Reporting
Question Category Max Score General CommentScore %Emissions to Air 7 Needs substantial improvement0 0
Energy 14 Needs substantial improvement3 21
Management 42 Needs substantial improvement4 10
Materials Usage 21 Needs substantial improvement5 24
Recycling 14 Needs improvement4 29
Waste 28 Needs improvement8 29
Water 7 Needs improvement2 29
Social Intent
Question Category Max Score General CommentScore %Accountability 4 Excellent4 100
Management 10 Needs substantial improvement0 0
Policy 6 Needs substantial improvement1 17
Social Demographic 2 Needs substantial improvement0 0
The College Sustainability Report Card Criteria 8 Good4 50
Vision 4 Excellent4 100
Social Reporting
Question Category Max Score General CommentScore %Human Rights 77 Needs substantial improvement0 0
Management 7 Needs substantial improvement0 0
Qualitative Social 35 Needs substantial improvement6 17
Quantitative Social 42 Needs substantial improvement0 0
www.roberts.cmc.edu 33 Sustainability Reporting of the Top U.S. Universities
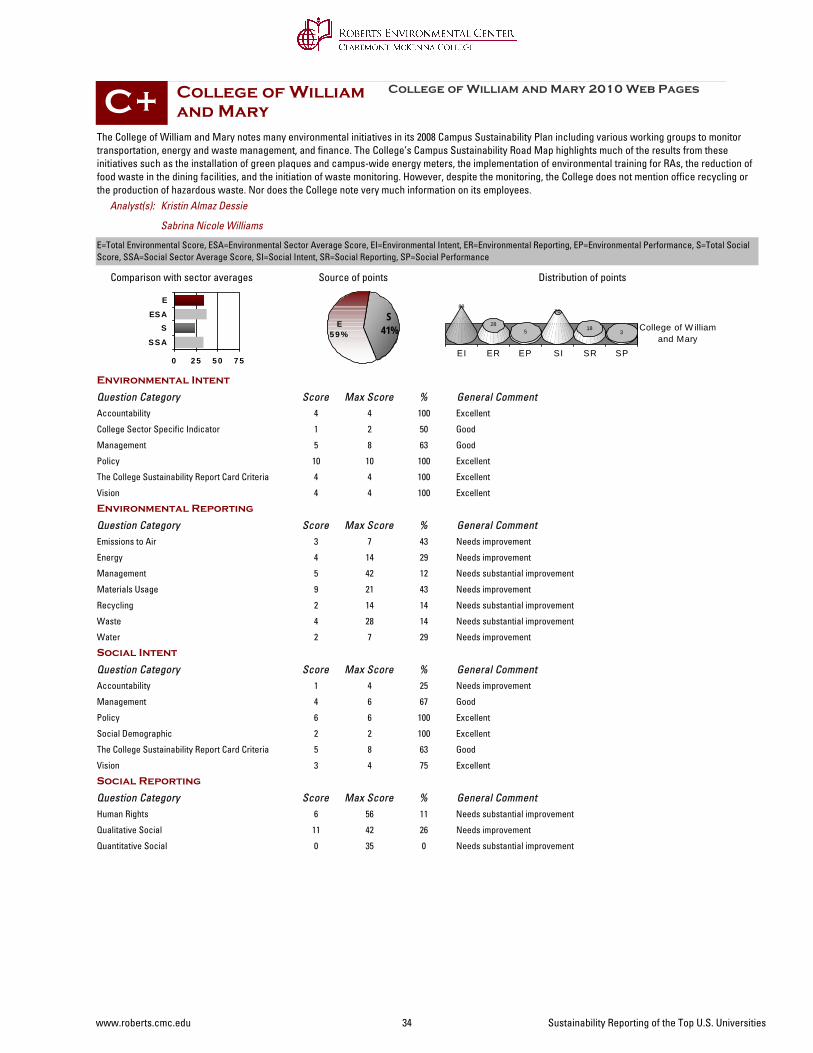
College of William and Mary
0 2 5 5 0 7 5
SSA
SESA
E
The College of William and Mary notes many environmental initiatives in its 2008 Campus Sustainability Plan including various working groups to monitor transportation, energy and waste management, and finance. The College’s Campus Sustainability Road Map highlights much of the results from these initiatives such as the installation of green plaques and campus-wide energy meters, the implementation of environmental training for RAs, the reduction of food waste in the dining facilities, and the initiation of waste monitoring. However, despite the monitoring, the College does not mention office recycling or the production of hazardous waste. Nor does the College note very much information on its employees.
S41%E
5 9 %
College of William and Mary 2010 Web Pages
Comparison with sector averages Source of points
C+
Sabrina Nicole Williams
Kristin Almaz Dessie
Distribution of points
E=Total Environmental Score, ESA=Environmental Sector Average Score, EI=Environmental Intent, ER=Environmental Reporting, EP=Environmental Performance, S=Total Social Score, SSA=Social Sector Average Score, SI=Social Intent, SR=Social Reporting, SP=Social Performance
EI ER EP SI SR SP
College of W illiamand Mary
88
285
70
183
Analyst(s):
Environmental Intent
Question Category Max Score General CommentScore %Accountability 4 Excellent4 100
College Sector Specific Indicator 2 Good1 50
Management 8 Good5 63
Policy 10 Excellent10 100
The College Sustainability Report Card Criteria 4 Excellent4 100
Vision 4 Excellent4 100
Environmental Reporting
Question Category Max Score General CommentScore %Emissions to Air 7 Needs improvement3 43
Energy 14 Needs improvement4 29
Management 42 Needs substantial improvement5 12
Materials Usage 21 Needs improvement9 43
Recycling 14 Needs substantial improvement2 14
Waste 28 Needs substantial improvement4 14
Water 7 Needs improvement2 29
Social Intent
Question Category Max Score General CommentScore %Accountability 4 Needs improvement1 25
Management 6 Good4 67
Policy 6 Excellent6 100
Social Demographic 2 Excellent2 100
The College Sustainability Report Card Criteria 8 Good5 63
Vision 4 Excellent3 75
Social Reporting
Question Category Max Score General CommentScore %Human Rights 56 Needs substantial improvement6 11
Qualitative Social 42 Needs improvement11 26
Quantitative Social 35 Needs substantial improvement0 0
www.roberts.cmc.edu 34 Sustainability Reporting of the Top U.S. Universities

Columbia University
0 2 5 5 0 7 5
SSA
SESA
E
Columbia University’s strongest and most unique sustainability initiative is its community outreach. Its website outlines strategies for bettering the local neighborhoods of Morningside Heights and Manhattanville through creation of green space, sustainable architecture, and education and employment opportunities. Columbia also provides significant benefits to its staff, including free online education programs and an ombudsperson to neutrally resolve conflicts. While Columbia discusses numerous environmental issues, both student and institution led, there are no energy audits or other specific data available online.
S53%
E4 7 %
Columbia University 2010 Web Pages
Comparison with sector averages Source of points
B-
Ravindra Wayne Reddy
Rebecca Enid Lofchie
Distribution of points
E=Total Environmental Score, ESA=Environmental Sector Average Score, EI=Environmental Intent, ER=Environmental Reporting, EP=Environmental Performance, S=Total Social Score, SSA=Social Sector Average Score, SI=Social Intent, SR=Social Reporting, SP=Social Performance
EI ER EP SI SR SP
Columbia University
69
260
68
3013
Analyst(s):
Environmental Intent
Question Category Max Score General CommentScore %Accountability 4 Excellent4 100
College Sector Specific Indicator 2 Excellent2 100
Management 8 Needs substantial improvement1 13
Policy 10 Excellent8 80
The College Sustainability Report Card Criteria 4 Excellent4 100
Vision 4 Excellent3 75
Environmental Reporting
Question Category Max Score General CommentScore %Emissions to Air 7 Needs improvement2 29
Energy 14 Needs substantial improvement3 21
Management 42 Needs substantial improvement6 14
Materials Usage 21 Needs substantial improvement5 24
Recycling 14 Needs substantial improvement3 21
Waste 28 Needs substantial improvement3 11
Water 7 Needs improvement2 29
Social Intent
Question Category Max Score General CommentScore %Accountability 4 Good2 50
Management 10 Excellent10 100
Policy 6 Good4 67
Social Demographic 2 Good1 50
The College Sustainability Report Card Criteria 8 Needs improvement3 38
Vision 4 Excellent3 75
Social Reporting
Question Category Max Score General CommentScore %Human Rights 77 Needs improvement27 35
Management 7 Needs improvement3 43
Qualitative Social 35 Needs improvement9 26
Quantitative Social 42 Needs substantial improvement1 2
www.roberts.cmc.edu 35 Sustainability Reporting of the Top U.S. Universities

Cornell University
0 2 5 5 0 7 5
SSA
SESA
E
Cornell University has a very comprehensive and forward-minded sustainability website. Aside from having a Center for a Sustainable Future whose mission is to “advance multidisciplinary research and cultivate innovative collaborations within and beyond Cornell,” the most promising aspect of the website is the Advancing Sustainability Action Plan (ASAP) where detailed goals and agendas are outlined, and people are held responsible and in charge of meeting those goals. Not only does the administration take sustainability seriously, but the students do as well. The student-run organization entitled the Sustainability Hub has its own website that lists current and past projects that students have engineered themselves. Overall sustainability appears to be an important issue for Cornell University.
S49%
E5 1%
Cornell University 2010 Web Pages
Comparison with sector averages Source of points
A-
Timothy Kareem Smedley
Andre Garland Shepley
Distribution of points
E=Total Environmental Score, ESA=Environmental Sector Average Score, EI=Environmental Intent, ER=Environmental Reporting, EP=Environmental Performance, S=Total Social Score, SSA=Social Sector Average Score, SI=Social Intent, SR=Social Reporting, SP=Social Performance
EI ER EP SI SR SP
Cornell University
94
46
8
82
4315
Analyst(s):
Environmental Intent
Question Category Max Score General CommentScore %Accountability 4 Excellent4 100
College Sector Specific Indicator 2 Excellent2 100
Management 8 Excellent6 75
Policy 10 Excellent10 100
The College Sustainability Report Card Criteria 4 Excellent4 100
Vision 4 Excellent4 100
Environmental Reporting
Question Category Max Score General CommentScore %Emissions to Air 7 Good4 57
Energy 14 Needs improvement6 43
Management 42 Needs improvement19 45
Materials Usage 21 Needs improvement9 43
Recycling 14 Needs substantial improvement3 21
Waste 28 Needs substantial improvement4 14
Water 7 Needs substantial improvement1 14
Social Intent
Question Category Max Score General CommentScore %Accountability 4 Excellent4 100
Management 10 Excellent8 80
Policy 6 Good4 67
Social Demographic 2 Excellent2 100
The College Sustainability Report Card Criteria 8 Excellent6 75
Vision 4 Excellent4 100
Social Reporting
Question Category Max Score General CommentScore %Human Rights 77 Needs improvement32 42
Management 7 Needs substantial improvement0 0
Qualitative Social 35 Needs improvement15 43
Quantitative Social 42 Needs substantial improvement10 24
www.roberts.cmc.edu 36 Sustainability Reporting of the Top U.S. Universities
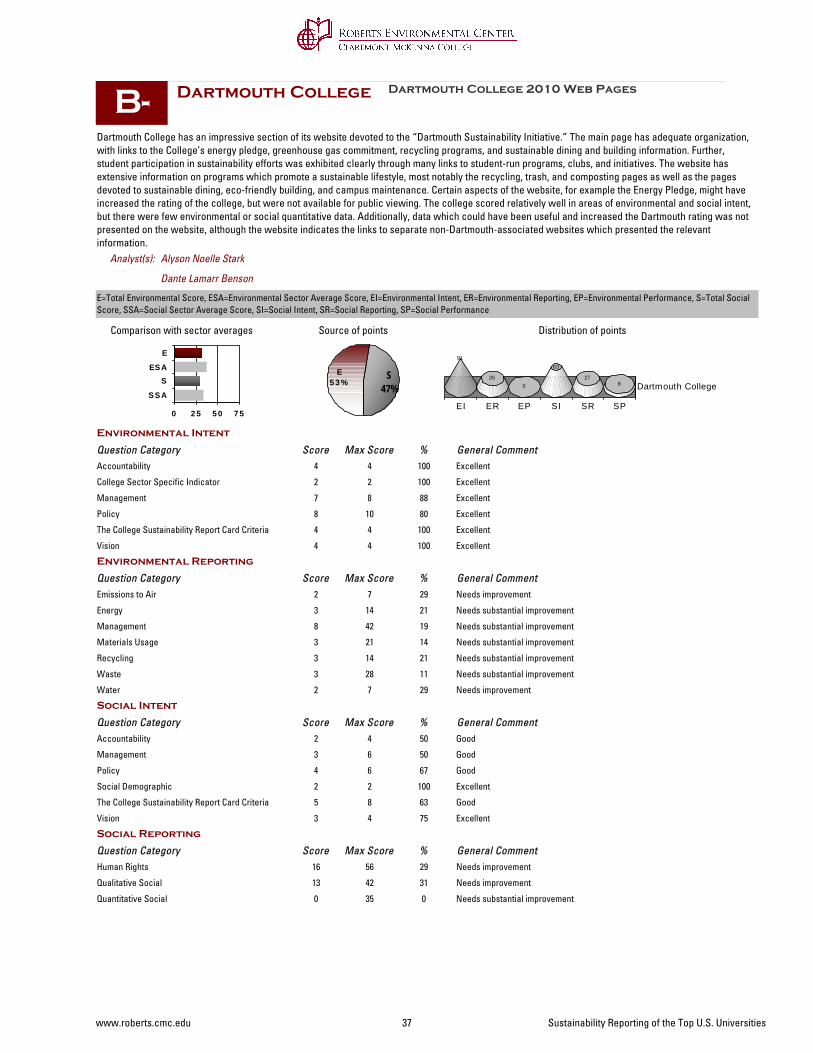
Dartmouth College
0 2 5 5 0 7 5
SSA
SESA
E
Dartmouth College has an impressive section of its website devoted to the “Dartmouth Sustainability Initiative.” The main page has adequate organization, with links to the College’s energy pledge, greenhouse gas commitment, recycling programs, and sustainable dining and building information. Further, student participation in sustainability efforts was exhibited clearly through many links to student-run programs, clubs, and initiatives. The website has extensive information on programs which promote a sustainable lifestyle, most notably the recycling, trash, and composting pages as well as the pages devoted to sustainable dining, eco-friendly building, and campus maintenance. Certain aspects of the website, for example the Energy Pledge, might have increased the rating of the college, but were not available for public viewing. The college scored relatively well in areas of environmental and social intent, but there were few environmental or social quantitative data. Additionally, data which could have been useful and increased the Dartmouth rating was not presented on the website, although the website indicates the links to separate non-Dartmouth-associated websites which presented the relevant information.
S47%
E5 3 %
Dartmouth College 2010 Web Pages
Comparison with sector averages Source of points
B-
Dante Lamarr Benson
Alyson Noelle Stark
Distribution of points
E=Total Environmental Score, ESA=Environmental Sector Average Score, EI=Environmental Intent, ER=Environmental Reporting, EP=Environmental Performance, S=Total Social Score, SSA=Social Sector Average Score, SI=Social Intent, SR=Social Reporting, SP=Social Performance
EI ER EP SI SR SP
Dartmouth College
91
260
63
278
Analyst(s):
Environmental Intent
Question Category Max Score General CommentScore %Accountability 4 Excellent4 100
College Sector Specific Indicator 2 Excellent2 100
Management 8 Excellent7 88
Policy 10 Excellent8 80
The College Sustainability Report Card Criteria 4 Excellent4 100
Vision 4 Excellent4 100
Environmental Reporting
Question Category Max Score General CommentScore %Emissions to Air 7 Needs improvement2 29
Energy 14 Needs substantial improvement3 21
Management 42 Needs substantial improvement8 19
Materials Usage 21 Needs substantial improvement3 14
Recycling 14 Needs substantial improvement3 21
Waste 28 Needs substantial improvement3 11
Water 7 Needs improvement2 29
Social Intent
Question Category Max Score General CommentScore %Accountability 4 Good2 50
Management 6 Good3 50
Policy 6 Good4 67
Social Demographic 2 Excellent2 100
The College Sustainability Report Card Criteria 8 Good5 63
Vision 4 Excellent3 75
Social Reporting
Question Category Max Score General CommentScore %Human Rights 56 Needs improvement16 29
Qualitative Social 42 Needs improvement13 31
Quantitative Social 35 Needs substantial improvement0 0
www.roberts.cmc.edu 37 Sustainability Reporting of the Top U.S. Universities
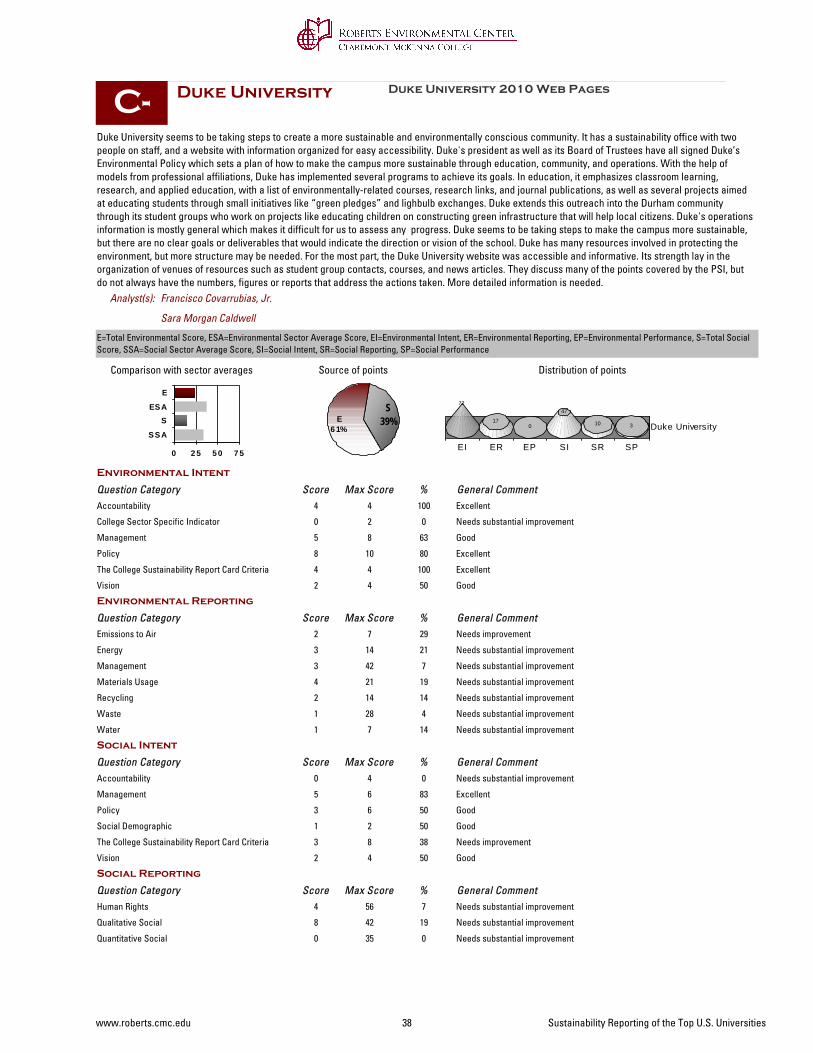
Duke University
0 2 5 5 0 7 5
SSA
SESA
E
Duke University seems to be taking steps to create a more sustainable and environmentally conscious community. It has a sustainability office with two people on staff, and a website with information organized for easy accessibility. Duke's president as well as its Board of Trustees have all signed Duke’s Environmental Policy which sets a plan of how to make the campus more sustainable through education, community, and operations. With the help of models from professional affiliations, Duke has implemented several programs to achieve its goals. In education, it emphasizes classroom learning, research, and applied education, with a list of environmentally-related courses, research links, and journal publications, as well as several projects aimed at educating students through small initiatives like “green pledges” and lighbulb exchanges. Duke extends this outreach into the Durham community through its student groups who work on projects like educating children on constructing green infrastructure that will help local citizens. Duke's operations information is mostly general which makes it difficult for us to assess any progress. Duke seems to be taking steps to make the campus more sustainable, but there are no clear goals or deliverables that would indicate the direction or vision of the school. Duke has many resources involved in protecting the environment, but more structure may be needed. For the most part, the Duke University website was accessible and informative. Its strength lay in the organization of venues of resources such as student group contacts, courses, and news articles. They discuss many of the points covered by the PSI, but do not always have the numbers, figures or reports that address the actions taken. More detailed information is needed.
S39%E
6 1%
Duke University 2010 Web Pages
Comparison with sector averages Source of points
C-
Sara Morgan Caldwell
Francisco Covarrubias, Jr.
Distribution of points
E=Total Environmental Score, ESA=Environmental Sector Average Score, EI=Environmental Intent, ER=Environmental Reporting, EP=Environmental Performance, S=Total Social Score, SSA=Social Sector Average Score, SI=Social Intent, SR=Social Reporting, SP=Social Performance
EI ER EP SI SR SP
Duke University
72
170
47
10 3
Analyst(s):
Environmental Intent
Question Category Max Score General CommentScore %Accountability 4 Excellent4 100
College Sector Specific Indicator 2 Needs substantial improvement0 0
Management 8 Good5 63
Policy 10 Excellent8 80
The College Sustainability Report Card Criteria 4 Excellent4 100
Vision 4 Good2 50
Environmental Reporting
Question Category Max Score General CommentScore %Emissions to Air 7 Needs improvement2 29
Energy 14 Needs substantial improvement3 21
Management 42 Needs substantial improvement3 7
Materials Usage 21 Needs substantial improvement4 19
Recycling 14 Needs substantial improvement2 14
Waste 28 Needs substantial improvement1 4
Water 7 Needs substantial improvement1 14
Social Intent
Question Category Max Score General CommentScore %Accountability 4 Needs substantial improvement0 0
Management 6 Excellent5 83
Policy 6 Good3 50
Social Demographic 2 Good1 50
The College Sustainability Report Card Criteria 8 Needs improvement3 38
Vision 4 Good2 50
Social Reporting
Question Category Max Score General CommentScore %Human Rights 56 Needs substantial improvement4 7
Qualitative Social 42 Needs substantial improvement8 19
Quantitative Social 35 Needs substantial improvement0 0
www.roberts.cmc.edu 38 Sustainability Reporting of the Top U.S. Universities
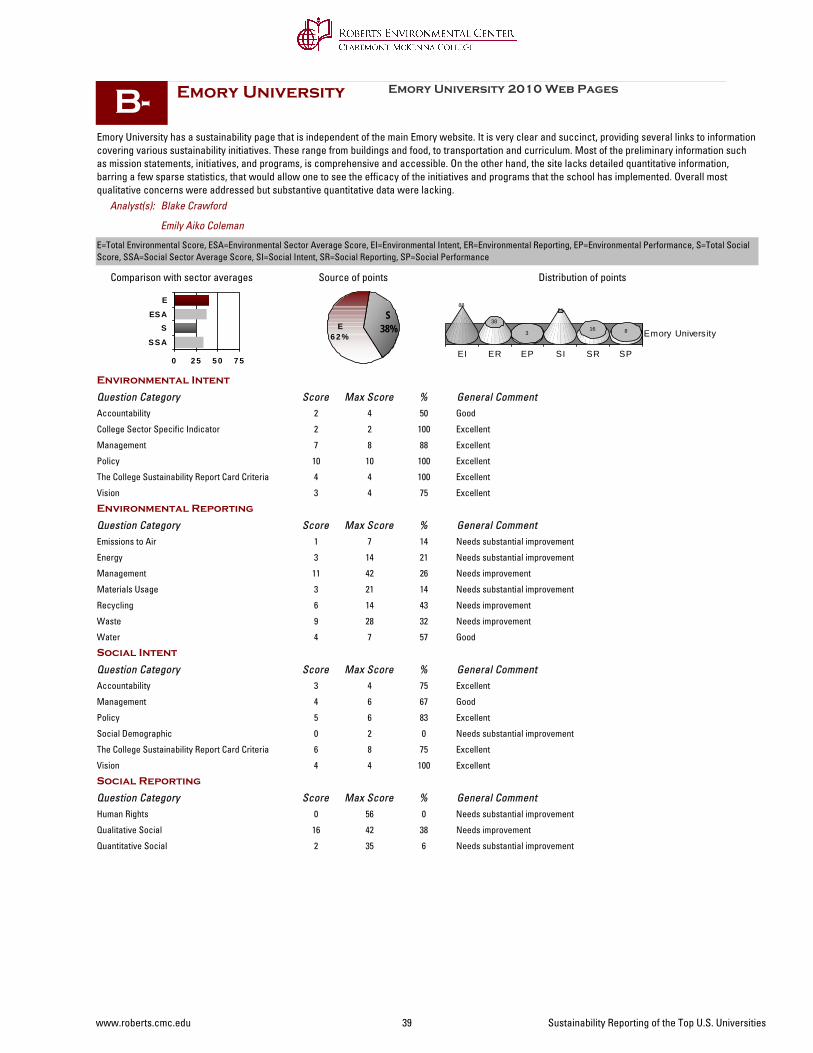
Emory University
0 2 5 5 0 7 5
SSA
SESA
E
Emory University has a sustainability page that is independent of the main Emory website. It is very clear and succinct, providing several links to information covering various sustainability initiatives. These range from buildings and food, to transportation and curriculum. Most of the preliminary information such as mission statements, initiatives, and programs, is comprehensive and accessible. On the other hand, the site lacks detailed quantitative information, barring a few sparse statistics, that would allow one to see the efficacy of the initiatives and programs that the school has implemented. Overall most qualitative concerns were addressed but substantive quantitative data were lacking.
S38%E
6 2 %
Emory University 2010 Web Pages
Comparison with sector averages Source of points
B-
Emily Aiko Coleman
Blake Crawford
Distribution of points
E=Total Environmental Score, ESA=Environmental Sector Average Score, EI=Environmental Intent, ER=Environmental Reporting, EP=Environmental Performance, S=Total Social Score, SSA=Social Sector Average Score, SI=Social Intent, SR=Social Reporting, SP=Social Performance
EI ER EP SI SR SP
Emory University
88
38
3
73
16 8
Analyst(s):
Environmental Intent
Question Category Max Score General CommentScore %Accountability 4 Good2 50
College Sector Specific Indicator 2 Excellent2 100
Management 8 Excellent7 88
Policy 10 Excellent10 100
The College Sustainability Report Card Criteria 4 Excellent4 100
Vision 4 Excellent3 75
Environmental Reporting
Question Category Max Score General CommentScore %Emissions to Air 7 Needs substantial improvement1 14
Energy 14 Needs substantial improvement3 21
Management 42 Needs improvement11 26
Materials Usage 21 Needs substantial improvement3 14
Recycling 14 Needs improvement6 43
Waste 28 Needs improvement9 32
Water 7 Good4 57
Social Intent
Question Category Max Score General CommentScore %Accountability 4 Excellent3 75
Management 6 Good4 67
Policy 6 Excellent5 83
Social Demographic 2 Needs substantial improvement0 0
The College Sustainability Report Card Criteria 8 Excellent6 75
Vision 4 Excellent4 100
Social Reporting
Question Category Max Score General CommentScore %Human Rights 56 Needs substantial improvement0 0
Qualitative Social 42 Needs improvement16 38
Quantitative Social 35 Needs substantial improvement2 6
www.roberts.cmc.edu 39 Sustainability Reporting of the Top U.S. Universities

Georgetown University
0 2 5 5 0 7 5
SSA
SESA
E
Georgetown University has an environmental action team named “Eco-Action.” This student-run organization has a management team and action plans. The school dining halls are actively participating in the school’s green revolution by going tray-less, purchasing local sustainable food, and composting food waste. Recycling appears to be Georgetown University’s primary sustainability strategy. The school has in-depth analysis of its solid, food, and construction wastes, as well as data on its composted food waste; it carefully disposes of hazardous waste. Carbon foot printing and an annual greenhouse gas inventory are other ways Georgetown University is monitoring its environmental impacts. The Sustainability Advisory Group performs on-going sustainability initiatives to educate the local community. Georgetown University also provides human resources information about employee hiring policies, benefits, and human rights.
S58%
E4 2 %
Georgetown University 2010 Web Pages
Comparison with sector averages Source of points
A
Andre Garland Shepley
Emily Aiko Coleman
Distribution of points
E=Total Environmental Score, ESA=Environmental Sector Average Score, EI=Environmental Intent, ER=Environmental Reporting, EP=Environmental Performance, S=Total Social Score, SSA=Social Sector Average Score, SI=Social Intent, SR=Social Reporting, SP=Social Performance
EI ER EP SI SR SP
GeorgetownUniversity
6943
13
68 57 48
Analyst(s):
Environmental Intent
Question Category Max Score General CommentScore %Accountability 4 Excellent4 100
College Sector Specific Indicator 2 Excellent2 100
Management 8 Needs improvement3 38
Policy 10 Good6 60
The College Sustainability Report Card Criteria 4 Excellent4 100
Vision 4 Excellent3 75
Environmental Reporting
Question Category Max Score General CommentScore %Emissions to Air 7 Good5 71
Energy 14 Needs improvement5 36
Management 42 Needs improvement19 45
Materials Usage 21 Needs improvement7 33
Recycling 14 Needs improvement6 43
Waste 28 Needs substantial improvement2 7
Water 7 Needs improvement2 29
Social Intent
Question Category Max Score General CommentScore %Accountability 4 Excellent3 75
Management 10 Excellent8 80
Policy 6 Needs improvement2 33
Social Demographic 2 Excellent2 100
The College Sustainability Report Card Criteria 8 Excellent6 75
Vision 4 Good2 50
Social Reporting
Question Category Max Score General CommentScore %Human Rights 77 Good49 64
Management 7 Needs substantial improvement0 0
Qualitative Social 35 Excellent31 89
Quantitative Social 42 Needs substantial improvement7 17
www.roberts.cmc.edu 40 Sustainability Reporting of the Top U.S. Universities

Georgia Institute of Technology
0 2 5 5 0 7 5
SSA
SESA
E
Environmental sustainability was written into Georgia Tech's Mission Statement in 1994, and seems to be working actively towards reaching higher sustainability goals “sooner rather than later," as stated in its main sustainability page. In 2008, Georgia Tech was awarded LEED (Leadership in Energy and Environmental Design) Gold Certification for its Christiphor Klaus Advanced Computing Building. Implementation of LEED standards has shown dollar savings over the past few years. Additionally, Georgia tech was solicited by an alumni named Ray Anderson to become a founding partner of Mission Zero (“an online platform for companies and individuals to learn from and assist others in the effort," as stated on the Georgia Tech Website). This was a great step to further both community and University involvement in creating a carbon neutral environment.
S41%E
5 9 %
Georgia Institute of Technology 2010 Web Pages
Comparison with sector averages Source of points
B
Alyson Noelle Stark
Pooja Reddy Kanipakam
Distribution of points
E=Total Environmental Score, ESA=Environmental Sector Average Score, EI=Environmental Intent, ER=Environmental Reporting, EP=Environmental Performance, S=Total Social Score, SSA=Social Sector Average Score, SI=Social Intent, SR=Social Reporting, SP=Social Performance
EI ER EP SI SR SP
Georgia Institute ofTechnology
6648
5
62
2611
Analyst(s):
Environmental Intent
Question Category Max Score General CommentScore %Accountability 4 Excellent3 75
College Sector Specific Indicator 2 Excellent2 100
Management 8 Needs improvement3 38
Policy 10 Excellent8 80
The College Sustainability Report Card Criteria 4 Excellent4 100
Vision 4 Needs improvement1 25
Environmental Reporting
Question Category Max Score General CommentScore %Emissions to Air 7 Good4 57
Energy 14 Good10 71
Management 42 Needs improvement11 26
Materials Usage 21 Needs improvement8 38
Recycling 14 Needs improvement6 43
Waste 28 Needs substantial improvement6 21
Water 7 Needs improvement2 29
Social Intent
Question Category Max Score General CommentScore %Accountability 4 Excellent4 100
Management 10 Good6 60
Policy 6 Good4 67
Social Demographic 2 Excellent2 100
The College Sustainability Report Card Criteria 8 Needs improvement3 38
Vision 4 Good2 50
Social Reporting
Question Category Max Score General CommentScore %Human Rights 77 Needs improvement23 30
Management 7 Needs substantial improvement1 14
Qualitative Social 35 Needs substantial improvement7 20
Quantitative Social 42 Needs substantial improvement3 7
www.roberts.cmc.edu 41 Sustainability Reporting of the Top U.S. Universities

Harvard University
0 2 5 5 0 7 5
SSA
SESA
E
Harvard University has some admirable programs for advancing environmental and staff sustainability. Its Green Leaf program offers clear educational tools for anyone hoping to ‘green’ their campus life. The hiring of an omnibuds person to serve as a neutral third party is an effective strategy of addressing staff concerns. Some areas of concern include the University's objectives, reporting, and the ‘green.harvard.edu’ website, the central source of material on Harvard’s sustainability efforts. Concrete objectives and environmental data are largely absent from the school’s materials. The website promises an improved reporting protocol as part of the school’s greenhouse gas implementation policy. Hopefully this new protocol will include some information on the school’s progress and goals for the future. Finally, the blog format of the sustainability website makes it difficult to discern the school’s official stance on environmental policies. The addition of some formal statements of intent and cumulative data would solve this problem.
S46%
E5 4 %
Harvard University 2010 Web Pages
Comparison with sector averages Source of points
C
Ravindra Wayne Reddy
Rebecca Enid Lofchie
Distribution of points
E=Total Environmental Score, ESA=Environmental Sector Average Score, EI=Environmental Intent, ER=Environmental Reporting, EP=Environmental Performance, S=Total Social Score, SSA=Social Sector Average Score, SI=Social Intent, SR=Social Reporting, SP=Social Performance
EI ER EP SI SR SP
Harvard University
81
160
56
18 4
Analyst(s):
Environmental Intent
Question Category Max Score General CommentScore %Accountability 4 Excellent4 100
College Sector Specific Indicator 2 Excellent2 100
Management 8 Good4 50
Policy 10 Excellent8 80
The College Sustainability Report Card Criteria 4 Excellent4 100
Vision 4 Excellent4 100
Environmental Reporting
Question Category Max Score General CommentScore %Emissions to Air 7 Needs improvement3 43
Energy 14 Needs substantial improvement1 7
Management 42 Needs substantial improvement3 7
Materials Usage 21 Needs substantial improvement3 14
Recycling 14 Needs substantial improvement3 21
Waste 28 Needs substantial improvement0 0
Water 7 Needs improvement2 29
Social Intent
Question Category Max Score General CommentScore %Accountability 4 Excellent4 100
Management 10 Excellent10 100
Policy 6 Needs substantial improvement1 17
Social Demographic 2 Excellent2 100
The College Sustainability Report Card Criteria 8 Needs improvement2 25
Vision 4 Needs substantial improvement0 0
Social Reporting
Question Category Max Score General CommentScore %Human Rights 77 Needs substantial improvement14 18
Management 7 Needs substantial improvement0 0
Qualitative Social 35 Needs substantial improvement6 17
Quantitative Social 42 Needs substantial improvement1 2
www.roberts.cmc.edu 42 Sustainability Reporting of the Top U.S. Universities
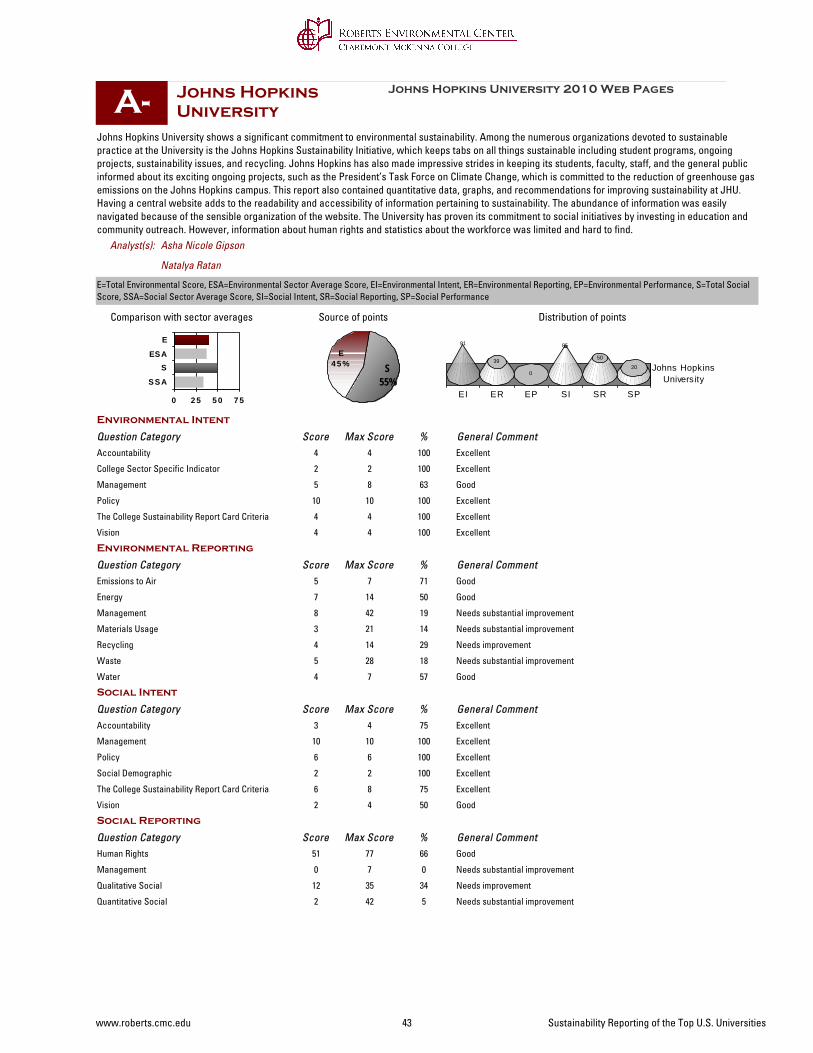
Johns Hopkins University
0 2 5 5 0 7 5
SSA
SESA
E
Johns Hopkins University shows a significant commitment to environmental sustainability. Among the numerous organizations devoted to sustainable practice at the University is the Johns Hopkins Sustainability Initiative, which keeps tabs on all things sustainable including student programs, ongoing projects, sustainability issues, and recycling. Johns Hopkins has also made impressive strides in keeping its students, faculty, staff, and the general public informed about its exciting ongoing projects, such as the President’s Task Force on Climate Change, which is committed to the reduction of greenhouse gas emissions on the Johns Hopkins campus. This report also contained quantitative data, graphs, and recommendations for improving sustainability at JHU. Having a central website adds to the readability and accessibility of information pertaining to sustainability. The abundance of information was easily navigated because of the sensible organization of the website. The University has proven its commitment to social initiatives by investing in education and community outreach. However, information about human rights and statistics about the workforce was limited and hard to find.
S55%
E4 5 %
Johns Hopkins University 2010 Web Pages
Comparison with sector averages Source of points
A-
Natalya Ratan
Asha Nicole Gipson
Distribution of points
E=Total Environmental Score, ESA=Environmental Sector Average Score, EI=Environmental Intent, ER=Environmental Reporting, EP=Environmental Performance, S=Total Social Score, SSA=Social Sector Average Score, SI=Social Intent, SR=Social Reporting, SP=Social Performance
EI ER EP SI SR SP
Johns HopkinsUniversity
91
39
0
85
50
20
Analyst(s):
Environmental Intent
Question Category Max Score General CommentScore %Accountability 4 Excellent4 100
College Sector Specific Indicator 2 Excellent2 100
Management 8 Good5 63
Policy 10 Excellent10 100
The College Sustainability Report Card Criteria 4 Excellent4 100
Vision 4 Excellent4 100
Environmental Reporting
Question Category Max Score General CommentScore %Emissions to Air 7 Good5 71
Energy 14 Good7 50
Management 42 Needs substantial improvement8 19
Materials Usage 21 Needs substantial improvement3 14
Recycling 14 Needs improvement4 29
Waste 28 Needs substantial improvement5 18
Water 7 Good4 57
Social Intent
Question Category Max Score General CommentScore %Accountability 4 Excellent3 75
Management 10 Excellent10 100
Policy 6 Excellent6 100
Social Demographic 2 Excellent2 100
The College Sustainability Report Card Criteria 8 Excellent6 75
Vision 4 Good2 50
Social Reporting
Question Category Max Score General CommentScore %Human Rights 77 Good51 66
Management 7 Needs substantial improvement0 0
Qualitative Social 35 Needs improvement12 34
Quantitative Social 42 Needs substantial improvement2 5
www.roberts.cmc.edu 43 Sustainability Reporting of the Top U.S. Universities
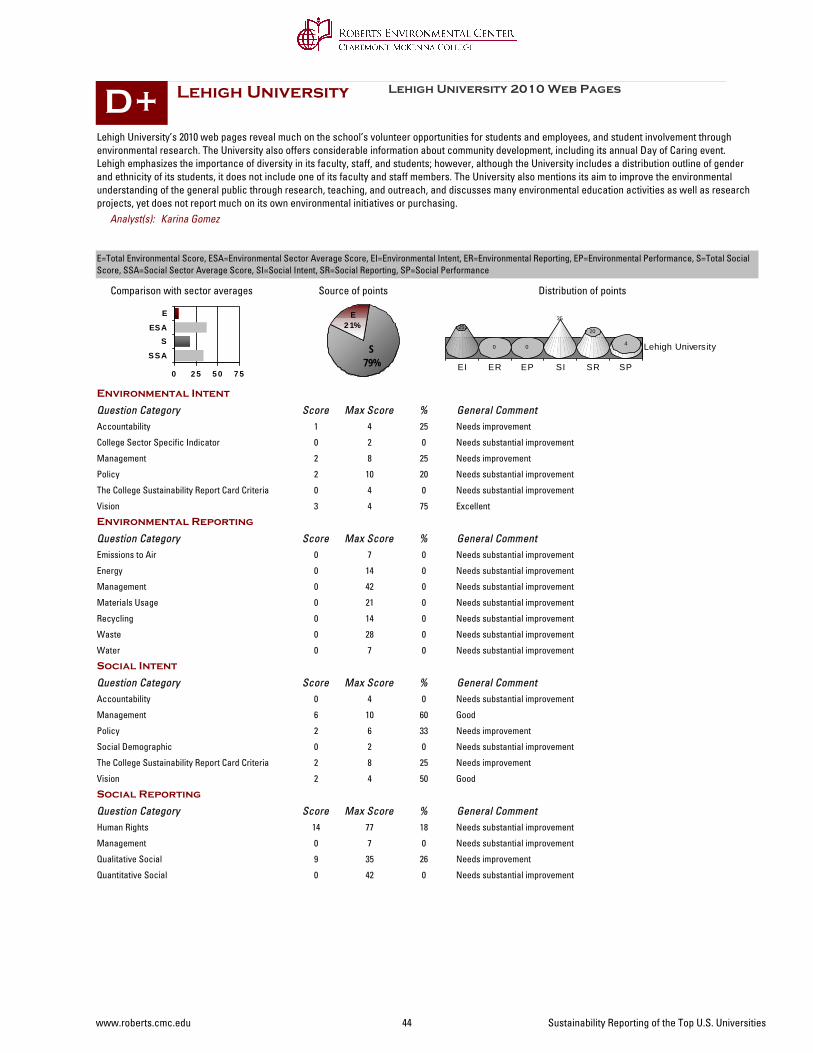
Lehigh University
0 2 5 5 0 7 5
SSA
SESA
E
Lehigh University’s 2010 web pages reveal much on the school’s volunteer opportunities for students and employees, and student involvement through environmental research. The University also offers considerable information about community development, including its annual Day of Caring event. Lehigh emphasizes the importance of diversity in its faculty, staff, and students; however, although the University includes a distribution outline of gender and ethnicity of its students, it does not include one of its faculty and staff members. The University also mentions its aim to improve the environmental understanding of the general public through research, teaching, and outreach, and discusses many environmental education activities as well as research projects, yet does not report much on its own environmental initiatives or purchasing.
S79%
E2 1%
Lehigh University 2010 Web Pages
Comparison with sector averages Source of points
D+
Karina Gomez
Distribution of points
E=Total Environmental Score, ESA=Environmental Sector Average Score, EI=Environmental Intent, ER=Environmental Reporting, EP=Environmental Performance, S=Total Social Score, SSA=Social Sector Average Score, SI=Social Intent, SR=Social Reporting, SP=Social Performance
EI ER EP SI SR SP
Lehigh University
25
0 0
35
20
4
Analyst(s):
Environmental Intent
Question Category Max Score General CommentScore %Accountability 4 Needs improvement1 25
College Sector Specific Indicator 2 Needs substantial improvement0 0
Management 8 Needs improvement2 25
Policy 10 Needs substantial improvement2 20
The College Sustainability Report Card Criteria 4 Needs substantial improvement0 0
Vision 4 Excellent3 75
Environmental Reporting
Question Category Max Score General CommentScore %Emissions to Air 7 Needs substantial improvement0 0
Energy 14 Needs substantial improvement0 0
Management 42 Needs substantial improvement0 0
Materials Usage 21 Needs substantial improvement0 0
Recycling 14 Needs substantial improvement0 0
Waste 28 Needs substantial improvement0 0
Water 7 Needs substantial improvement0 0
Social Intent
Question Category Max Score General CommentScore %Accountability 4 Needs substantial improvement0 0
Management 10 Good6 60
Policy 6 Needs improvement2 33
Social Demographic 2 Needs substantial improvement0 0
The College Sustainability Report Card Criteria 8 Needs improvement2 25
Vision 4 Good2 50
Social Reporting
Question Category Max Score General CommentScore %Human Rights 77 Needs substantial improvement14 18
Management 7 Needs substantial improvement0 0
Qualitative Social 35 Needs improvement9 26
Quantitative Social 42 Needs substantial improvement0 0
www.roberts.cmc.edu 44 Sustainability Reporting of the Top U.S. Universities
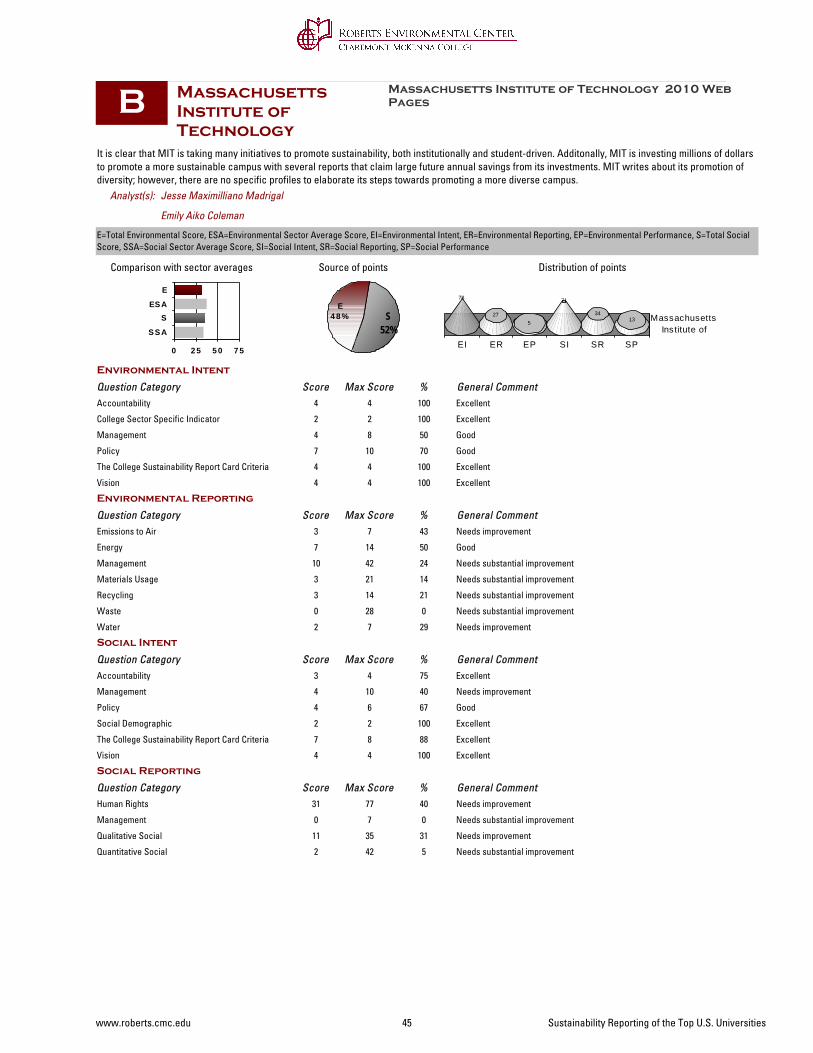
Massachusetts Institute of Technology
0 2 5 5 0 7 5
SSA
SESA
E
It is clear that MIT is taking many initiatives to promote sustainability, both institutionally and student-driven. Additonally, MIT is investing millions of dollars to promote a more sustainable campus with several reports that claim large future annual savings from its investments. MIT writes about its promotion of diversity; however, there are no specific profiles to elaborate its steps towards promoting a more diverse campus.
S52%
E4 8 %
Massachusetts Institute of Technology 2010 Web Pages
Comparison with sector averages Source of points
B
Emily Aiko Coleman
Jesse Maximilliano Madrigal
Distribution of points
E=Total Environmental Score, ESA=Environmental Sector Average Score, EI=Environmental Intent, ER=Environmental Reporting, EP=Environmental Performance, S=Total Social Score, SSA=Social Sector Average Score, SI=Social Intent, SR=Social Reporting, SP=Social Performance
EI ER EP SI SR SP
MassachusettsInstitute of
78
275
71
3413
Analyst(s):
Environmental Intent
Question Category Max Score General CommentScore %Accountability 4 Excellent4 100
College Sector Specific Indicator 2 Excellent2 100
Management 8 Good4 50
Policy 10 Good7 70
The College Sustainability Report Card Criteria 4 Excellent4 100
Vision 4 Excellent4 100
Environmental Reporting
Question Category Max Score General CommentScore %Emissions to Air 7 Needs improvement3 43
Energy 14 Good7 50
Management 42 Needs substantial improvement10 24
Materials Usage 21 Needs substantial improvement3 14
Recycling 14 Needs substantial improvement3 21
Waste 28 Needs substantial improvement0 0
Water 7 Needs improvement2 29
Social Intent
Question Category Max Score General CommentScore %Accountability 4 Excellent3 75
Management 10 Needs improvement4 40
Policy 6 Good4 67
Social Demographic 2 Excellent2 100
The College Sustainability Report Card Criteria 8 Excellent7 88
Vision 4 Excellent4 100
Social Reporting
Question Category Max Score General CommentScore %Human Rights 77 Needs improvement31 40
Management 7 Needs substantial improvement0 0
Qualitative Social 35 Needs improvement11 31
Quantitative Social 42 Needs substantial improvement2 5
www.roberts.cmc.edu 45 Sustainability Reporting of the Top U.S. Universities
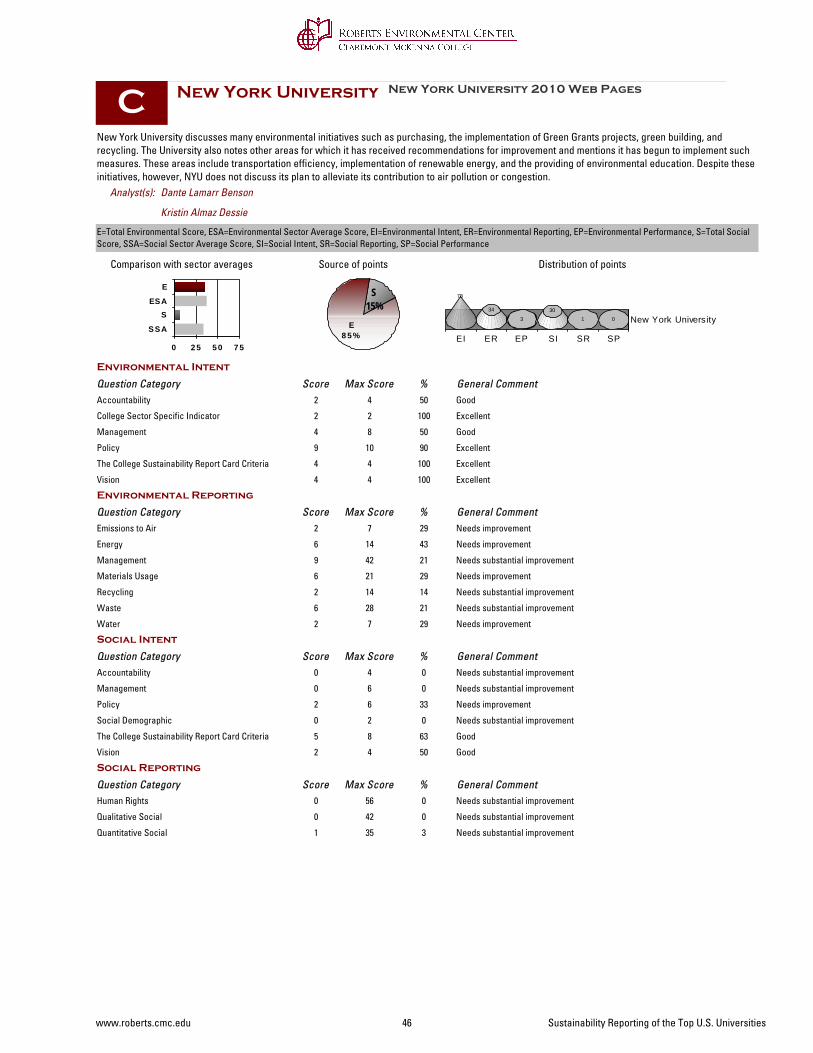
New York University
0 2 5 5 0 7 5
SSA
SESA
E
New York University discusses many environmental initiatives such as purchasing, the implementation of Green Grants projects, green building, and recycling. The University also notes other areas for which it has received recommendations for improvement and mentions it has begun to implement such measures. These areas include transportation efficiency, implementation of renewable energy, and the providing of environmental education. Despite these initiatives, however, NYU does not discuss its plan to alleviate its contribution to air pollution or congestion.
S15%
E8 5 %
New York University 2010 Web Pages
Comparison with sector averages Source of points
C
Kristin Almaz Dessie
Dante Lamarr Benson
Distribution of points
E=Total Environmental Score, ESA=Environmental Sector Average Score, EI=Environmental Intent, ER=Environmental Reporting, EP=Environmental Performance, S=Total Social Score, SSA=Social Sector Average Score, SI=Social Intent, SR=Social Reporting, SP=Social Performance
EI ER EP SI SR SP
New York University
78
34
330
1 0
Analyst(s):
Environmental Intent
Question Category Max Score General CommentScore %Accountability 4 Good2 50
College Sector Specific Indicator 2 Excellent2 100
Management 8 Good4 50
Policy 10 Excellent9 90
The College Sustainability Report Card Criteria 4 Excellent4 100
Vision 4 Excellent4 100
Environmental Reporting
Question Category Max Score General CommentScore %Emissions to Air 7 Needs improvement2 29
Energy 14 Needs improvement6 43
Management 42 Needs substantial improvement9 21
Materials Usage 21 Needs improvement6 29
Recycling 14 Needs substantial improvement2 14
Waste 28 Needs substantial improvement6 21
Water 7 Needs improvement2 29
Social Intent
Question Category Max Score General CommentScore %Accountability 4 Needs substantial improvement0 0
Management 6 Needs substantial improvement0 0
Policy 6 Needs improvement2 33
Social Demographic 2 Needs substantial improvement0 0
The College Sustainability Report Card Criteria 8 Good5 63
Vision 4 Good2 50
Social Reporting
Question Category Max Score General CommentScore %Human Rights 56 Needs substantial improvement0 0
Qualitative Social 42 Needs substantial improvement0 0
Quantitative Social 35 Needs substantial improvement1 3
www.roberts.cmc.edu 46 Sustainability Reporting of the Top U.S. Universities
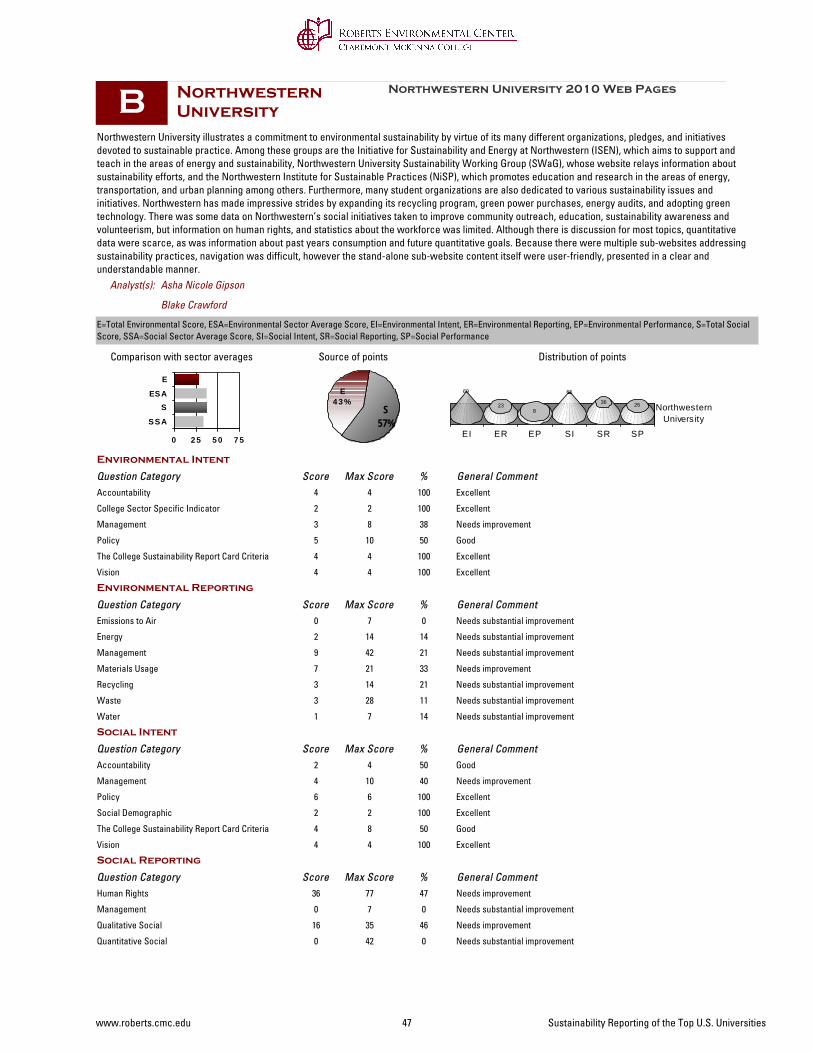
Northwestern University
0 2 5 5 0 7 5
SSA
SESA
E
Northwestern University illustrates a commitment to environmental sustainability by virtue of its many different organizations, pledges, and initiatives devoted to sustainable practice. Among these groups are the Initiative for Sustainability and Energy at Northwestern (ISEN), which aims to support and teach in the areas of energy and sustainability, Northwestern University Sustainability Working Group (SWaG), whose website relays information about sustainability efforts, and the Northwestern Institute for Sustainable Practices (NiSP), which promotes education and research in the areas of energy, transportation, and urban planning among others. Furthermore, many student organizations are also dedicated to various sustainability issues and initiatives. Northwestern has made impressive strides by expanding its recycling program, green power purchases, energy audits, and adopting green technology. There was some data on Northwestern’s social initiatives taken to improve community outreach, education, sustainability awareness and volunteerism, but information on human rights, and statistics about the workforce was limited. Although there is discussion for most topics, quantitative data were scarce, as was information about past years consumption and future quantitative goals. Because there were multiple sub-websites addressing sustainability practices, navigation was difficult, however the stand-alone sub-website content itself were user-friendly, presented in a clear and understandable manner.
S57%
E4 3 %
Northwestern University 2010 Web Pages
Comparison with sector averages Source of points
B
Blake Crawford
Asha Nicole Gipson
Distribution of points
E=Total Environmental Score, ESA=Environmental Sector Average Score, EI=Environmental Intent, ER=Environmental Reporting, EP=Environmental Performance, S=Total Social Score, SSA=Social Sector Average Score, SI=Social Intent, SR=Social Reporting, SP=Social Performance
EI ER EP SI SR SP
NorthwesternUniversity
69
238
65
36 26
Analyst(s):
Environmental Intent
Question Category Max Score General CommentScore %Accountability 4 Excellent4 100
College Sector Specific Indicator 2 Excellent2 100
Management 8 Needs improvement3 38
Policy 10 Good5 50
The College Sustainability Report Card Criteria 4 Excellent4 100
Vision 4 Excellent4 100
Environmental Reporting
Question Category Max Score General CommentScore %Emissions to Air 7 Needs substantial improvement0 0
Energy 14 Needs substantial improvement2 14
Management 42 Needs substantial improvement9 21
Materials Usage 21 Needs improvement7 33
Recycling 14 Needs substantial improvement3 21
Waste 28 Needs substantial improvement3 11
Water 7 Needs substantial improvement1 14
Social Intent
Question Category Max Score General CommentScore %Accountability 4 Good2 50
Management 10 Needs improvement4 40
Policy 6 Excellent6 100
Social Demographic 2 Excellent2 100
The College Sustainability Report Card Criteria 8 Good4 50
Vision 4 Excellent4 100
Social Reporting
Question Category Max Score General CommentScore %Human Rights 77 Needs improvement36 47
Management 7 Needs substantial improvement0 0
Qualitative Social 35 Needs improvement16 46
Quantitative Social 42 Needs substantial improvement0 0
www.roberts.cmc.edu 47 Sustainability Reporting of the Top U.S. Universities
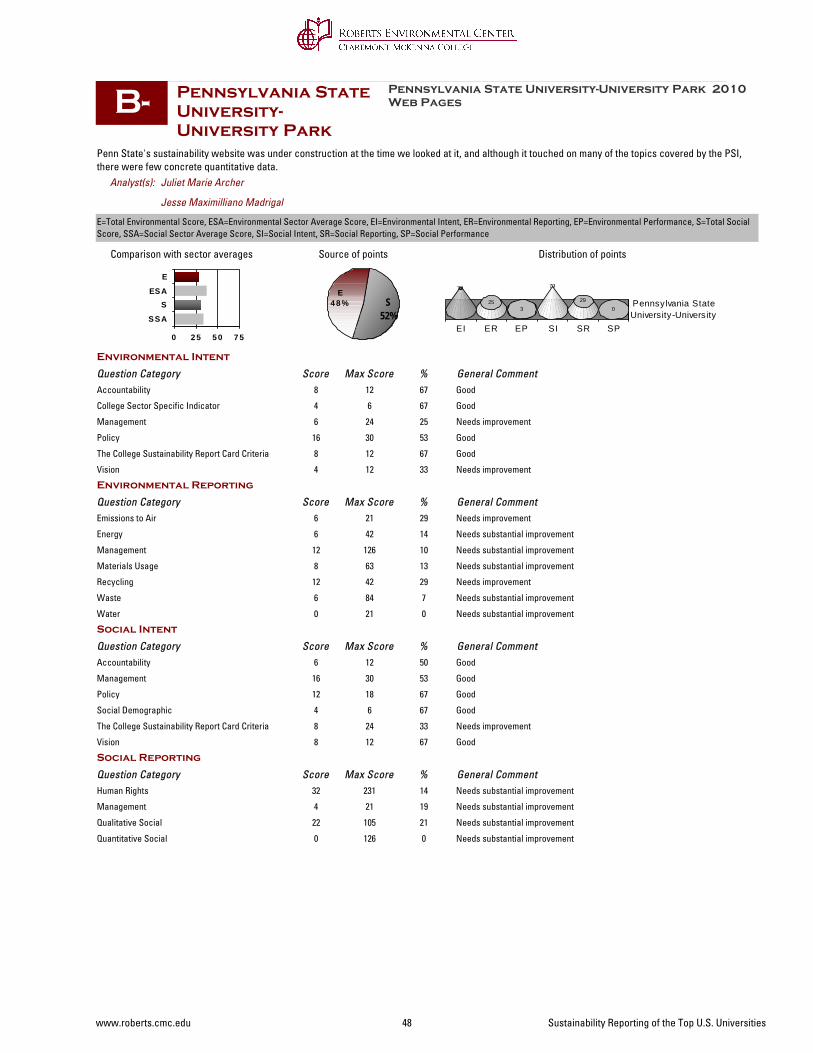
Pennsylvania State University-University Park
0 2 5 5 0 7 5
SSA
SESA
E
Penn State's sustainability website was under construction at the time we looked at it, and although it touched on many of the topics covered by the PSI, there were few concrete quantitative data.
S52%
E4 8 %
Pennsylvania State University-University Park 2010 Web Pages
Comparison with sector averages Source of points
B-
Jesse Maximilliano Madrigal
Juliet Marie Archer
Distribution of points
E=Total Environmental Score, ESA=Environmental Sector Average Score, EI=Environmental Intent, ER=Environmental Reporting, EP=Environmental Performance, S=Total Social Score, SSA=Social Sector Average Score, SI=Social Intent, SR=Social Reporting, SP=Social Performance
EI ER EP SI SR SP
Pennsylvania StateUniversity-University
72
253
79
290
Analyst(s):
Environmental Intent
Question Category Max Score General CommentScore %Accountability 12 Good8 67
College Sector Specific Indicator 6 Good4 67
Management 24 Needs improvement6 25
Policy 30 Good16 53
The College Sustainability Report Card Criteria 12 Good8 67
Vision 12 Needs improvement4 33
Environmental Reporting
Question Category Max Score General CommentScore %Emissions to Air 21 Needs improvement6 29
Energy 42 Needs substantial improvement6 14
Management 126 Needs substantial improvement12 10
Materials Usage 63 Needs substantial improvement8 13
Recycling 42 Needs improvement12 29
Waste 84 Needs substantial improvement6 7
Water 21 Needs substantial improvement0 0
Social Intent
Question Category Max Score General CommentScore %Accountability 12 Good6 50
Management 30 Good16 53
Policy 18 Good12 67
Social Demographic 6 Good4 67
The College Sustainability Report Card Criteria 24 Needs improvement8 33
Vision 12 Good8 67
Social Reporting
Question Category Max Score General CommentScore %Human Rights 231 Needs substantial improvement32 14
Management 21 Needs substantial improvement4 19
Qualitative Social 105 Needs substantial improvement22 21
Quantitative Social 126 Needs substantial improvement0 0
www.roberts.cmc.edu 48 Sustainability Reporting of the Top U.S. Universities
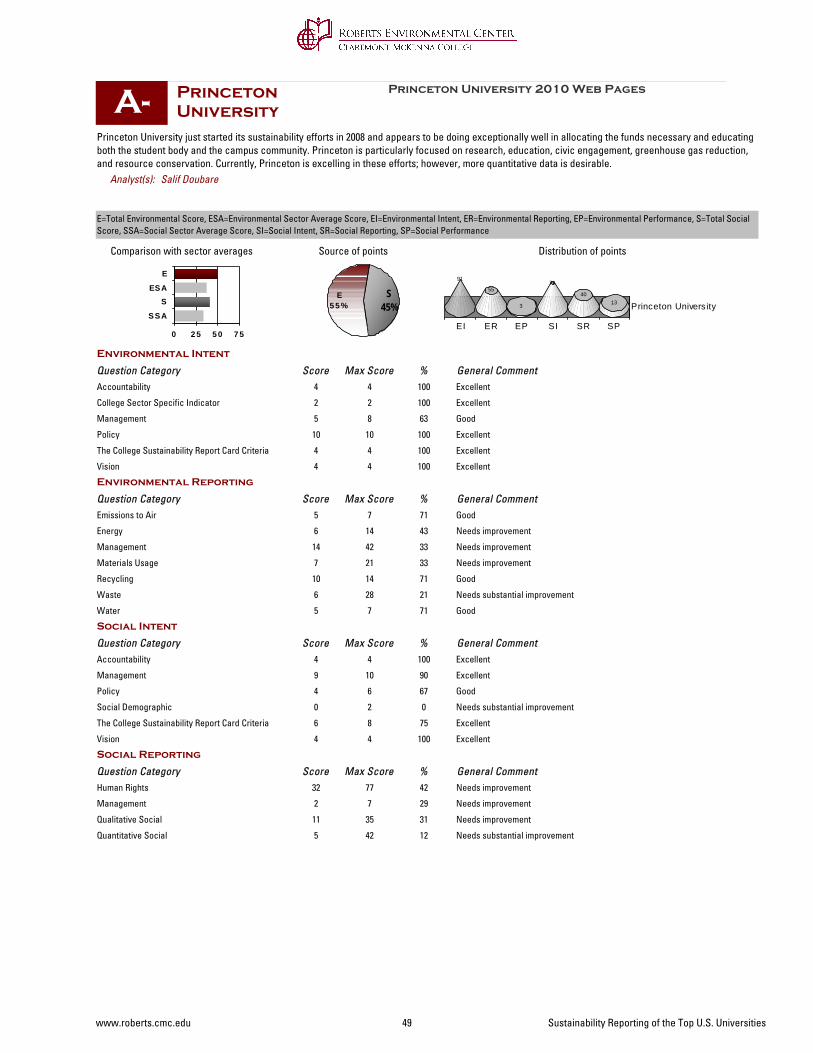
Princeton University
0 2 5 5 0 7 5
SSA
SESA
E
Princeton University just started its sustainability efforts in 2008 and appears to be doing exceptionally well in allocating the funds necessary and educating both the student body and the campus community. Princeton is particularly focused on research, education, civic engagement, greenhouse gas reduction, and resource conservation. Currently, Princeton is excelling in these efforts; however, more quantitative data is desirable.
S45%
E5 5 %
Princeton University 2010 Web Pages
Comparison with sector averages Source of points
A-
Salif Doubare
Distribution of points
E=Total Environmental Score, ESA=Environmental Sector Average Score, EI=Environmental Intent, ER=Environmental Reporting, EP=Environmental Performance, S=Total Social Score, SSA=Social Sector Average Score, SI=Social Intent, SR=Social Reporting, SP=Social Performance
EI ER EP SI SR SP
Princeton University
91
55
3
79
4013
Analyst(s):
Environmental Intent
Question Category Max Score General CommentScore %Accountability 4 Excellent4 100
College Sector Specific Indicator 2 Excellent2 100
Management 8 Good5 63
Policy 10 Excellent10 100
The College Sustainability Report Card Criteria 4 Excellent4 100
Vision 4 Excellent4 100
Environmental Reporting
Question Category Max Score General CommentScore %Emissions to Air 7 Good5 71
Energy 14 Needs improvement6 43
Management 42 Needs improvement14 33
Materials Usage 21 Needs improvement7 33
Recycling 14 Good10 71
Waste 28 Needs substantial improvement6 21
Water 7 Good5 71
Social Intent
Question Category Max Score General CommentScore %Accountability 4 Excellent4 100
Management 10 Excellent9 90
Policy 6 Good4 67
Social Demographic 2 Needs substantial improvement0 0
The College Sustainability Report Card Criteria 8 Excellent6 75
Vision 4 Excellent4 100
Social Reporting
Question Category Max Score General CommentScore %Human Rights 77 Needs improvement32 42
Management 7 Needs improvement2 29
Qualitative Social 35 Needs improvement11 31
Quantitative Social 42 Needs substantial improvement5 12
www.roberts.cmc.edu 49 Sustainability Reporting of the Top U.S. Universities
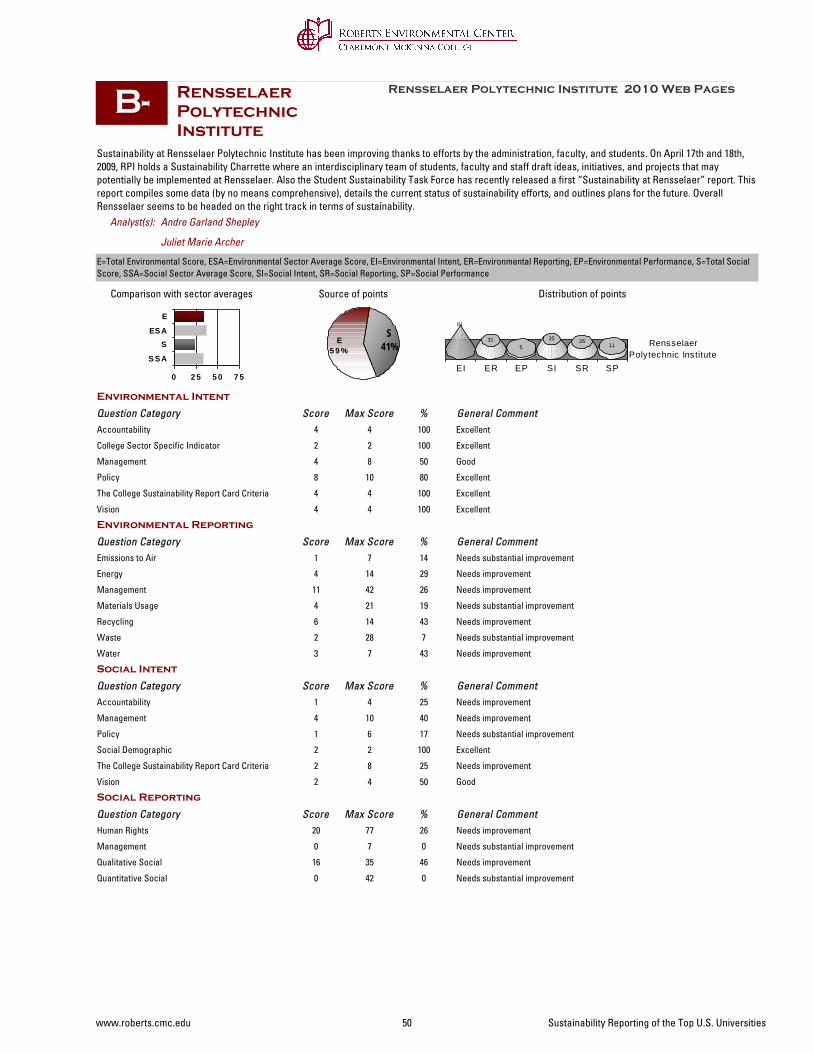
Rensselaer Polytechnic Institute
0 2 5 5 0 7 5
SSA
SESA
E
Sustainability at Rensselaer Polytechnic Institute has been improving thanks to efforts by the administration, faculty, and students. On April 17th and 18th, 2009, RPI holds a Sustainability Charrette where an interdisciplinary team of students, faculty and staff draft ideas, initiatives, and projects that may potentially be implemented at Rensselaer. Also the Student Sustainability Task Force has recently released a first “Sustainability at Rensselaer” report. This report compiles some data (by no means comprehensive), details the current status of sustainability efforts, and outlines plans for the future. Overall Rensselaer seems to be headed on the right track in terms of sustainability.
S41%E
5 9 %
Rensselaer Polytechnic Institute 2010 Web Pages
Comparison with sector averages Source of points
B-
Juliet Marie Archer
Andre Garland Shepley
Distribution of points
E=Total Environmental Score, ESA=Environmental Sector Average Score, EI=Environmental Intent, ER=Environmental Reporting, EP=Environmental Performance, S=Total Social Score, SSA=Social Sector Average Score, SI=Social Intent, SR=Social Reporting, SP=Social Performance
EI ER EP SI SR SP
RensselaerPolytechnic Institute
81
315
35 2611
Analyst(s):
Environmental Intent
Question Category Max Score General CommentScore %Accountability 4 Excellent4 100
College Sector Specific Indicator 2 Excellent2 100
Management 8 Good4 50
Policy 10 Excellent8 80
The College Sustainability Report Card Criteria 4 Excellent4 100
Vision 4 Excellent4 100
Environmental Reporting
Question Category Max Score General CommentScore %Emissions to Air 7 Needs substantial improvement1 14
Energy 14 Needs improvement4 29
Management 42 Needs improvement11 26
Materials Usage 21 Needs substantial improvement4 19
Recycling 14 Needs improvement6 43
Waste 28 Needs substantial improvement2 7
Water 7 Needs improvement3 43
Social Intent
Question Category Max Score General CommentScore %Accountability 4 Needs improvement1 25
Management 10 Needs improvement4 40
Policy 6 Needs substantial improvement1 17
Social Demographic 2 Excellent2 100
The College Sustainability Report Card Criteria 8 Needs improvement2 25
Vision 4 Good2 50
Social Reporting
Question Category Max Score General CommentScore %Human Rights 77 Needs improvement20 26
Management 7 Needs substantial improvement0 0
Qualitative Social 35 Needs improvement16 46
Quantitative Social 42 Needs substantial improvement0 0
www.roberts.cmc.edu 50 Sustainability Reporting of the Top U.S. Universities

Rice University
0 2 5 5 0 7 5
SSA
SESA
E
Rice University has highlighted its dedication to the environment in a number of initiatives including competing in Recycle Mania, launching a free bicycle program, implementing LEED green building designs, and beginning its new energy waste reporting in order to reduce solid waste, emissions, and energy use. However, despite these reporting initiatives, the University does not provide much quantitative data on its efforts. Rice also encourages community involvement in its green actions (i.e. creating a community garden which is also free for the community to use.) The University mentions a few donations made to student health organizations and support groups, yet does not discuss in detail further social involvement. Rice also does not publish much in the way of human rights policies.
S51%
E4 9 %
Rice University 2010 Web Pages
Comparison with sector averages Source of points
B
Asha Nicole Gipson
Alyson Noelle Stark
Distribution of points
E=Total Environmental Score, ESA=Environmental Sector Average Score, EI=Environmental Intent, ER=Environmental Reporting, EP=Environmental Performance, S=Total Social Score, SSA=Social Sector Average Score, SI=Social Intent, SR=Social Reporting, SP=Social Performance
EI ER EP SI SR SP
Rice University
94
273
82
3111
Analyst(s):
Environmental Intent
Question Category Max Score General CommentScore %Accountability 4 Excellent4 100
College Sector Specific Indicator 2 Excellent2 100
Management 8 Excellent6 75
Policy 10 Excellent10 100
The College Sustainability Report Card Criteria 4 Excellent4 100
Vision 4 Excellent4 100
Environmental Reporting
Question Category Max Score General CommentScore %Emissions to Air 7 Needs substantial improvement1 14
Energy 14 Needs substantial improvement3 21
Management 42 Needs improvement11 26
Materials Usage 21 Needs substantial improvement3 14
Recycling 14 Needs improvement4 29
Waste 28 Needs substantial improvement3 11
Water 7 Needs substantial improvement1 14
Social Intent
Question Category Max Score General CommentScore %Accountability 4 Excellent4 100
Management 10 Excellent8 80
Policy 6 Excellent6 100
Social Demographic 2 Excellent2 100
The College Sustainability Report Card Criteria 8 Good5 63
Vision 4 Excellent3 75
Social Reporting
Question Category Max Score General CommentScore %Human Rights 77 Needs improvement27 35
Management 7 Needs substantial improvement0 0
Qualitative Social 35 Needs improvement12 34
Quantitative Social 42 Needs substantial improvement2 5
www.roberts.cmc.edu 51 Sustainability Reporting of the Top U.S. Universities
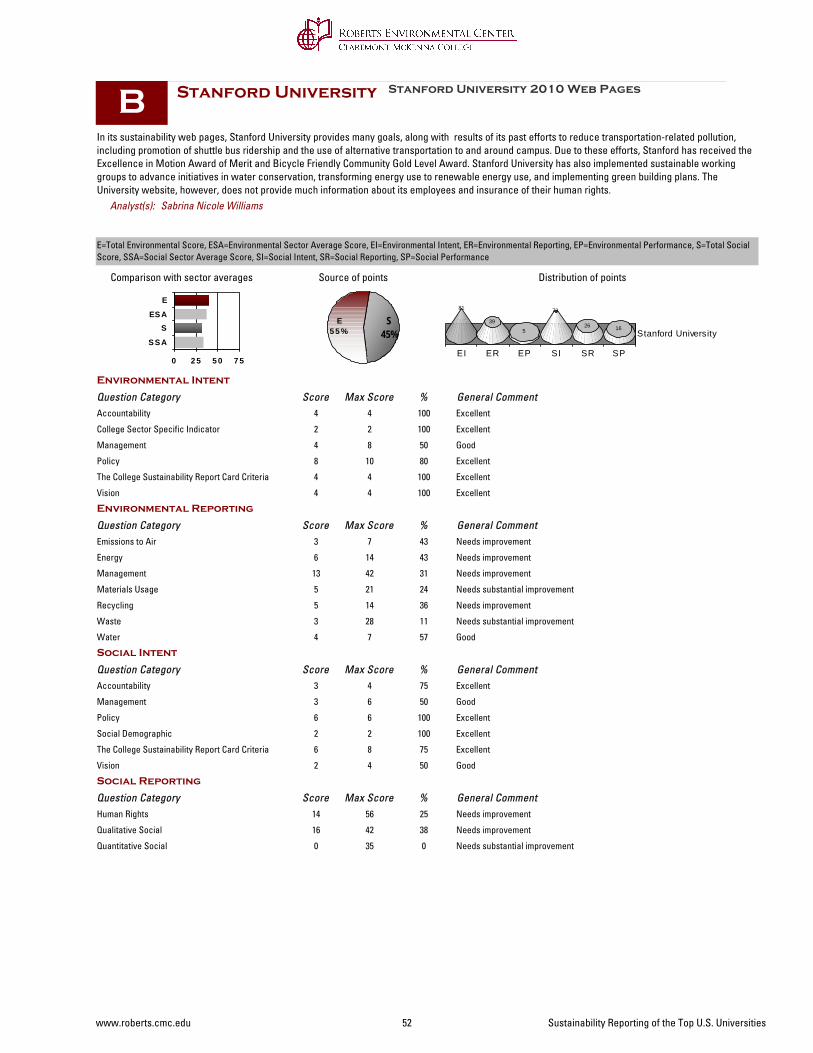
Stanford University
0 2 5 5 0 7 5
SSA
SESA
E
In its sustainability web pages, Stanford University provides many goals, along with results of its past efforts to reduce transportation-related pollution, including promotion of shuttle bus ridership and the use of alternative transportation to and around campus. Due to these efforts, Stanford has received the Excellence in Motion Award of Merit and Bicycle Friendly Community Gold Level Award. Stanford University has also implemented sustainable working groups to advance initiatives in water conservation, transforming energy use to renewable energy use, and implementing green building plans. The University website, however, does not provide much information about its employees and insurance of their human rights.
S45%
E5 5 %
Stanford University 2010 Web Pages
Comparison with sector averages Source of points
B
Sabrina Nicole Williams
Distribution of points
E=Total Environmental Score, ESA=Environmental Sector Average Score, EI=Environmental Intent, ER=Environmental Reporting, EP=Environmental Performance, S=Total Social Score, SSA=Social Sector Average Score, SI=Social Intent, SR=Social Reporting, SP=Social Performance
EI ER EP SI SR SP
Stanford University
81
39
5
73
26 16
Analyst(s):
Environmental Intent
Question Category Max Score General CommentScore %Accountability 4 Excellent4 100
College Sector Specific Indicator 2 Excellent2 100
Management 8 Good4 50
Policy 10 Excellent8 80
The College Sustainability Report Card Criteria 4 Excellent4 100
Vision 4 Excellent4 100
Environmental Reporting
Question Category Max Score General CommentScore %Emissions to Air 7 Needs improvement3 43
Energy 14 Needs improvement6 43
Management 42 Needs improvement13 31
Materials Usage 21 Needs substantial improvement5 24
Recycling 14 Needs improvement5 36
Waste 28 Needs substantial improvement3 11
Water 7 Good4 57
Social Intent
Question Category Max Score General CommentScore %Accountability 4 Excellent3 75
Management 6 Good3 50
Policy 6 Excellent6 100
Social Demographic 2 Excellent2 100
The College Sustainability Report Card Criteria 8 Excellent6 75
Vision 4 Good2 50
Social Reporting
Question Category Max Score General CommentScore %Human Rights 56 Needs improvement14 25
Qualitative Social 42 Needs improvement16 38
Quantitative Social 35 Needs substantial improvement0 0
www.roberts.cmc.edu 52 Sustainability Reporting of the Top U.S. Universities
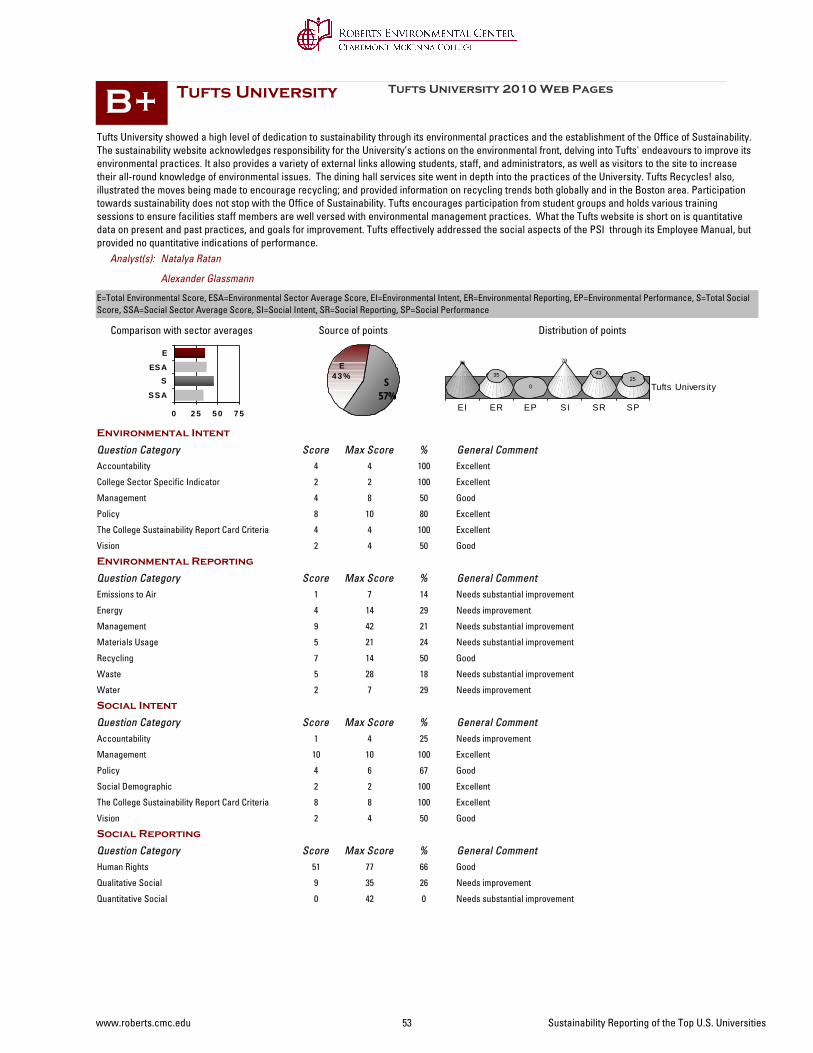
Tufts University
0 2 5 5 0 7 5
SSA
SESA
E
Tufts University showed a high level of dedication to sustainability through its environmental practices and the establishment of the Office of Sustainability. The sustainability website acknowledges responsibility for the University’s actions on the environmental front, delving into Tufts' endeavours to improve its environmental practices. It also provides a variety of external links allowing students, staff, and administrators, as well as visitors to the site to increase their all-round knowledge of environmental issues. The dining hall services site went in depth into the practices of the University. Tufts Recycles! also, illustrated the moves being made to encourage recycling; and provided information on recycling trends both globally and in the Boston area. Participation towards sustainability does not stop with the Office of Sustainability. Tufts encourages participation from student groups and holds various training sessions to ensure facilities staff members are well versed with environmental management practices. What the Tufts website is short on is quantitative data on present and past practices, and goals for improvement. Tufts effectively addressed the social aspects of the PSI through its Employee Manual, but provided no quantitative indications of performance.
S57%
E4 3 %
Tufts University 2010 Web Pages
Comparison with sector averages Source of points
B+
Alexander Glassmann
Natalya Ratan
Distribution of points
E=Total Environmental Score, ESA=Environmental Sector Average Score, EI=Environmental Intent, ER=Environmental Reporting, EP=Environmental Performance, S=Total Social Score, SSA=Social Sector Average Score, SI=Social Intent, SR=Social Reporting, SP=Social Performance
EI ER EP SI SR SP
Tufts University
75
35
0
79
4325
Analyst(s):
Environmental Intent
Question Category Max Score General CommentScore %Accountability 4 Excellent4 100
College Sector Specific Indicator 2 Excellent2 100
Management 8 Good4 50
Policy 10 Excellent8 80
The College Sustainability Report Card Criteria 4 Excellent4 100
Vision 4 Good2 50
Environmental Reporting
Question Category Max Score General CommentScore %Emissions to Air 7 Needs substantial improvement1 14
Energy 14 Needs improvement4 29
Management 42 Needs substantial improvement9 21
Materials Usage 21 Needs substantial improvement5 24
Recycling 14 Good7 50
Waste 28 Needs substantial improvement5 18
Water 7 Needs improvement2 29
Social Intent
Question Category Max Score General CommentScore %Accountability 4 Needs improvement1 25
Management 10 Excellent10 100
Policy 6 Good4 67
Social Demographic 2 Excellent2 100
The College Sustainability Report Card Criteria 8 Excellent8 100
Vision 4 Good2 50
Social Reporting
Question Category Max Score General CommentScore %Human Rights 77 Good51 66
Qualitative Social 35 Needs improvement9 26
Quantitative Social 42 Needs substantial improvement0 0
www.roberts.cmc.edu 53 Sustainability Reporting of the Top U.S. Universities

Tulane University
0 2 5 5 0 7 5
SSA
SESA
E
Tulane University has an easily accessible website dedicated solely to its efforts towards sustainability. While the site includes clear descriptions of many campus-wide “green” initiatives as well as useful links to student-run initiatives, it evades important specifics such as numerical data and clear objectives. On the front page of the site is a link to the University’s Greenhouse Gas Emissions Inventory. The extensive report demonstrates the impressive effort Tulane undertook to examine it’s own energy consumption. However, like the rest of Tulane’s web pages, it lacks clear data and real goals. In fact, the sheer quantity of data available in the report mystifies more than it reveals. A few plain summations would do a better job of clarifying the University’s progress towards sustainability. This, along with an outline of the institution's specific objectives, would effectively make Tulane more accountable for its environmental efforts.
S43%
E5 7 %
Tulane University 2010 Web Pages
Comparison with sector averages Source of points
C
Starrisha Marche Godfrey-Canada
Rebecca Enid Lofchie
Distribution of points
E=Total Environmental Score, ESA=Environmental Sector Average Score, EI=Environmental Intent, ER=Environmental Reporting, EP=Environmental Performance, S=Total Social Score, SSA=Social Sector Average Score, SI=Social Intent, SR=Social Reporting, SP=Social Performance
EI ER EP SI SR SP
Tulane University
81
180
4121
0
Analyst(s):
Environmental Intent
Question Category Max Score General CommentScore %Accountability 4 Excellent4 100
College Sector Specific Indicator 2 Excellent2 100
Management 8 Needs improvement2 25
Policy 10 Excellent10 100
The College Sustainability Report Card Criteria 4 Excellent4 100
Vision 4 Excellent4 100
Environmental Reporting
Question Category Max Score General CommentScore %Emissions to Air 7 Needs substantial improvement1 14
Energy 14 Needs substantial improvement3 21
Management 42 Needs substantial improvement5 12
Materials Usage 21 Needs substantial improvement4 19
Recycling 14 Needs substantial improvement1 7
Waste 28 Needs substantial improvement2 7
Water 7 Needs substantial improvement1 14
Social Intent
Question Category Max Score General CommentScore %Accountability 4 Excellent3 75
Management 10 Needs improvement4 40
Policy 6 Needs improvement2 33
Social Demographic 2 Excellent2 100
The College Sustainability Report Card Criteria 8 Needs improvement3 38
Vision 4 Needs substantial improvement0 0
Social Reporting
Question Category Max Score General CommentScore %Human Rights 77 Needs substantial improvement10 13
Management 7 Needs substantial improvement0 0
Qualitative Social 35 Needs improvement11 31
Quantitative Social 42 Needs substantial improvement0 0
www.roberts.cmc.edu 54 Sustainability Reporting of the Top U.S. Universities
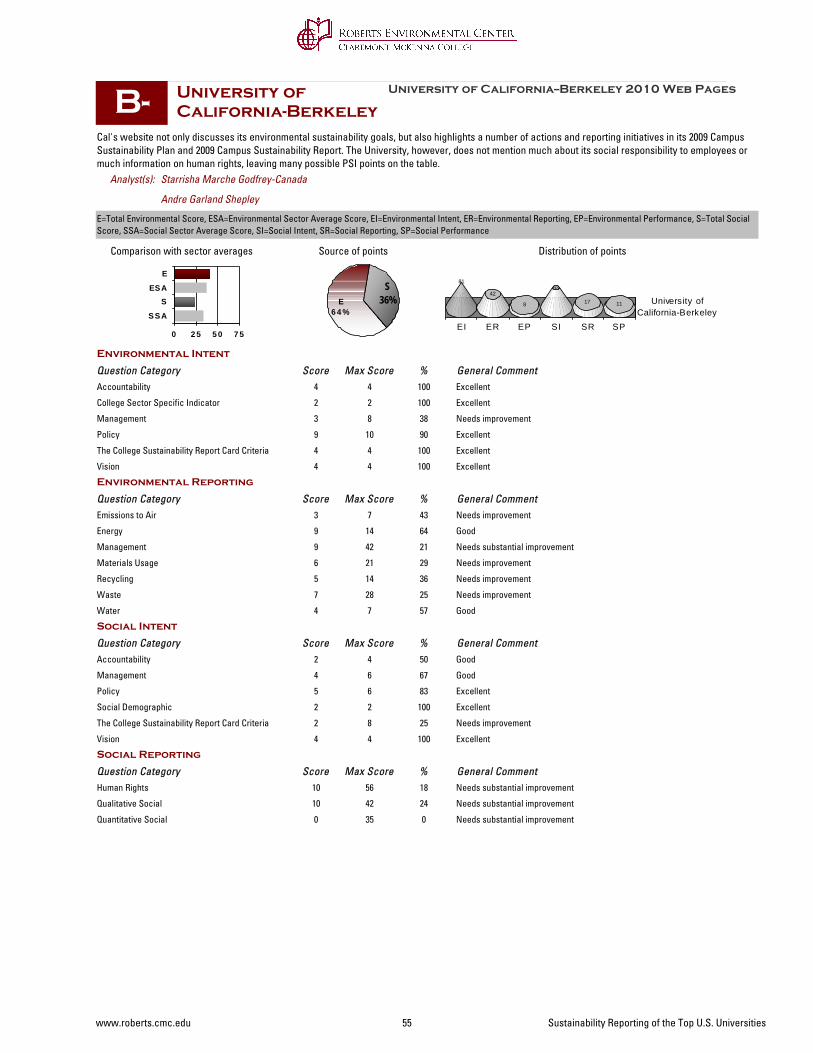
University of California-Berkeley
0 2 5 5 0 7 5
SSA
SESA
E
Cal's website not only discusses its environmental sustainability goals, but also highlights a number of actions and reporting initiatives in its 2009 Campus Sustainability Plan and 2009 Campus Sustainability Report. The University, however, does not mention much about its social responsibility to employees or much information on human rights, leaving many possible PSI points on the table.
S36%E
6 4 %
University of California--Berkeley 2010 Web Pages
Comparison with sector averages Source of points
B-
Andre Garland Shepley
Starrisha Marche Godfrey-Canada
Distribution of points
E=Total Environmental Score, ESA=Environmental Sector Average Score, EI=Environmental Intent, ER=Environmental Reporting, EP=Environmental Performance, S=Total Social Score, SSA=Social Sector Average Score, SI=Social Intent, SR=Social Reporting, SP=Social Performance
EI ER EP SI SR SP
University ofCalifornia-Berkeley
81
42
8
63
17 11
Analyst(s):
Environmental Intent
Question Category Max Score General CommentScore %Accountability 4 Excellent4 100
College Sector Specific Indicator 2 Excellent2 100
Management 8 Needs improvement3 38
Policy 10 Excellent9 90
The College Sustainability Report Card Criteria 4 Excellent4 100
Vision 4 Excellent4 100
Environmental Reporting
Question Category Max Score General CommentScore %Emissions to Air 7 Needs improvement3 43
Energy 14 Good9 64
Management 42 Needs substantial improvement9 21
Materials Usage 21 Needs improvement6 29
Recycling 14 Needs improvement5 36
Waste 28 Needs improvement7 25
Water 7 Good4 57
Social Intent
Question Category Max Score General CommentScore %Accountability 4 Good2 50
Management 6 Good4 67
Policy 6 Excellent5 83
Social Demographic 2 Excellent2 100
The College Sustainability Report Card Criteria 8 Needs improvement2 25
Vision 4 Excellent4 100
Social Reporting
Question Category Max Score General CommentScore %Human Rights 56 Needs substantial improvement10 18
Qualitative Social 42 Needs substantial improvement10 24
Quantitative Social 35 Needs substantial improvement0 0
www.roberts.cmc.edu 55 Sustainability Reporting of the Top U.S. Universities

University of California-Davis
0 2 5 5 0 7 5
SSA
SESA
E
While UC Davis is an environmentally sensitive campus, the institution is significantly lacking in current and relevant information reporting on its website. The bulk of the campus’s sustainability website is devoted to a “Long Range Development” document, published in 2003, which traces the plans and environmental impact of new campus buildings and expansion. While the document is exhaustively thorough, it contains no recent information and little to no information about actual campus activities in terms of waste or energy. Of note is the “Mitigation Monitoring Program," which outlines a number of goals with their appropriate monitoring and reporting procedure. Data from this reporting procedure is not available, but it appears that the University is at the least conscious of the types of data and information to keep on record. Habitat conservation is particularly detailed in this document, covering a number of endangered and native species with specific tasks and considerations for each. The campus also has an award-winning recycling program. Other more recent goals are outlined in the “Policy on Sustainable Practices” from September 2009, but numerical information on sustainability practices is at best difficult to find and appears, at this stage, to be incomplete.
S49%
E5 1%
University of California--Davis 2010 Web Pages
Comparison with sector averages Source of points
C+
Sara Morgan Caldwell
Distribution of points
E=Total Environmental Score, ESA=Environmental Sector Average Score, EI=Environmental Intent, ER=Environmental Reporting, EP=Environmental Performance, S=Total Social Score, SSA=Social Sector Average Score, SI=Social Intent, SR=Social Reporting, SP=Social Performance
EI ER EP SI SR SP
University ofCalifornia-Davis
56
26
3
47
27
3
Analyst(s):
Environmental Intent
Question Category Max Score General CommentScore %Accountability 4 Good2 50
College Sector Specific Indicator 2 Excellent2 100
Management 8 Needs improvement2 25
Policy 10 Good7 70
The College Sustainability Report Card Criteria 4 Excellent4 100
Vision 4 Needs improvement1 25
Environmental Reporting
Question Category Max Score General CommentScore %Emissions to Air 7 Needs improvement2 29
Energy 14 Needs substantial improvement3 21
Management 42 Needs substantial improvement5 12
Materials Usage 21 Needs improvement6 29
Recycling 14 Needs improvement5 36
Waste 28 Needs substantial improvement3 11
Water 7 Needs substantial improvement1 14
Social Intent
Question Category Max Score General CommentScore %Accountability 4 Good2 50
Management 6 Good4 67
Policy 6 Needs improvement2 33
Social Demographic 2 Excellent2 100
The College Sustainability Report Card Criteria 8 Needs improvement2 25
Vision 4 Good2 50
Social Reporting
Question Category Max Score General CommentScore %Human Rights 56 Needs substantial improvement12 21
Qualitative Social 42 Needs improvement12 29
Quantitative Social 35 Needs substantial improvement0 0
www.roberts.cmc.edu 56 Sustainability Reporting of the Top U.S. Universities
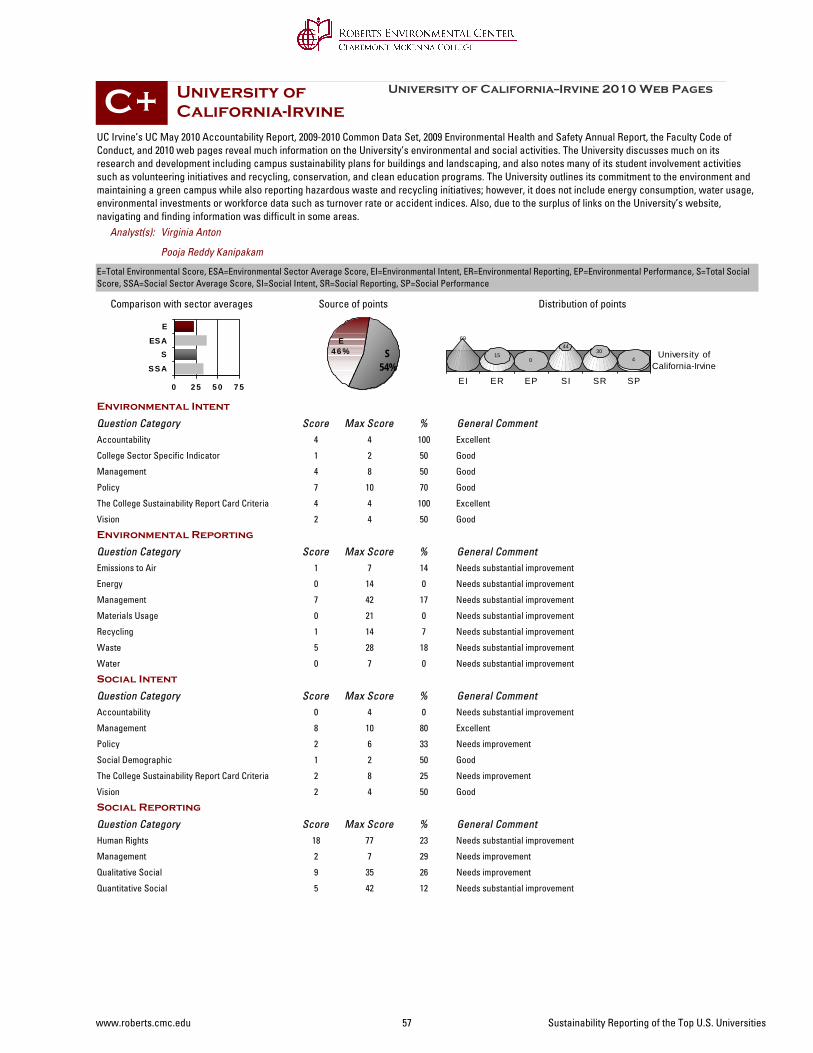
University of California-Irvine
0 2 5 5 0 7 5
SSA
SESA
E
UC Irvine’s UC May 2010 Accountability Report, 2009-2010 Common Data Set, 2009 Environmental Health and Safety Annual Report, the Faculty Code of Conduct, and 2010 web pages reveal much information on the University’s environmental and social activities. The University discusses much on its research and development including campus sustainability plans for buildings and landscaping, and also notes many of its student involvement activities such as volunteering initiatives and recycling, conservation, and clean education programs. The University outlines its commitment to the environment and maintaining a green campus while also reporting hazardous waste and recycling initiatives; however, it does not include energy consumption, water usage, environmental investments or workforce data such as turnover rate or accident indices. Also, due to the surplus of links on the University’s website, navigating and finding information was difficult in some areas.
S54%
E4 6 %
University of California--Irvine 2010 Web Pages
Comparison with sector averages Source of points
C+
Pooja Reddy Kanipakam
Virginia Anton
Distribution of points
E=Total Environmental Score, ESA=Environmental Sector Average Score, EI=Environmental Intent, ER=Environmental Reporting, EP=Environmental Performance, S=Total Social Score, SSA=Social Sector Average Score, SI=Social Intent, SR=Social Reporting, SP=Social Performance
EI ER EP SI SR SP
University ofCalifornia-Irvine
69
150
4430
4
Analyst(s):
Environmental Intent
Question Category Max Score General CommentScore %Accountability 4 Excellent4 100
College Sector Specific Indicator 2 Good1 50
Management 8 Good4 50
Policy 10 Good7 70
The College Sustainability Report Card Criteria 4 Excellent4 100
Vision 4 Good2 50
Environmental Reporting
Question Category Max Score General CommentScore %Emissions to Air 7 Needs substantial improvement1 14
Energy 14 Needs substantial improvement0 0
Management 42 Needs substantial improvement7 17
Materials Usage 21 Needs substantial improvement0 0
Recycling 14 Needs substantial improvement1 7
Waste 28 Needs substantial improvement5 18
Water 7 Needs substantial improvement0 0
Social Intent
Question Category Max Score General CommentScore %Accountability 4 Needs substantial improvement0 0
Management 10 Excellent8 80
Policy 6 Needs improvement2 33
Social Demographic 2 Good1 50
The College Sustainability Report Card Criteria 8 Needs improvement2 25
Vision 4 Good2 50
Social Reporting
Question Category Max Score General CommentScore %Human Rights 77 Needs substantial improvement18 23
Management 7 Needs improvement2 29
Qualitative Social 35 Needs improvement9 26
Quantitative Social 42 Needs substantial improvement5 12
www.roberts.cmc.edu 57 Sustainability Reporting of the Top U.S. Universities
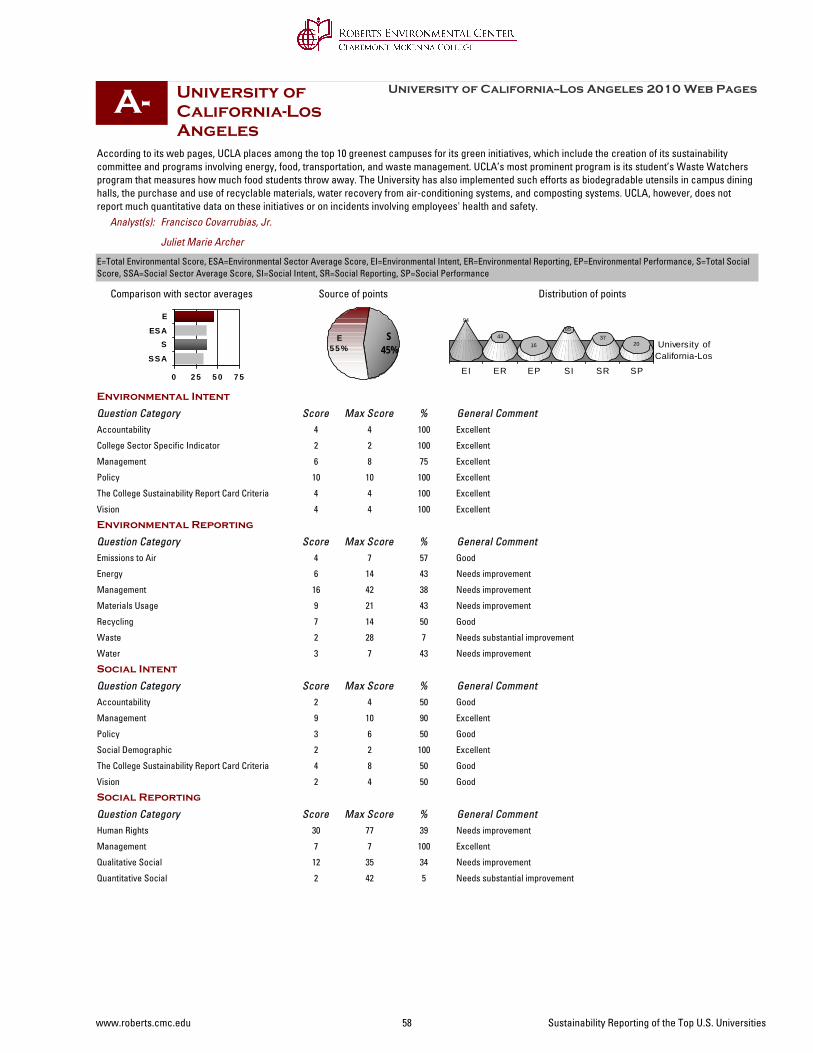
University of California-Los Angeles
0 2 5 5 0 7 5
SSA
SESA
E
According to its web pages, UCLA places among the top 10 greenest campuses for its green initiatives, which include the creation of its sustainability committee and programs involving energy, food, transportation, and waste management. UCLA’s most prominent program is its student’s Waste Watchers program that measures how much food students throw away. The University has also implemented such efforts as biodegradable utensils in campus dining halls, the purchase and use of recyclable materials, water recovery from air-conditioning systems, and composting systems. UCLA, however, does not report much quantitative data on these initiatives or on incidents involving employees' health and safety.
S45%
E5 5 %
University of California--Los Angeles 2010 Web Pages
Comparison with sector averages Source of points
A-
Juliet Marie Archer
Francisco Covarrubias, Jr.
Distribution of points
E=Total Environmental Score, ESA=Environmental Sector Average Score, EI=Environmental Intent, ER=Environmental Reporting, EP=Environmental Performance, S=Total Social Score, SSA=Social Sector Average Score, SI=Social Intent, SR=Social Reporting, SP=Social Performance
EI ER EP SI SR SP
University ofCalifornia-Los
94
4316
6537
20
Analyst(s):
Environmental Intent
Question Category Max Score General CommentScore %Accountability 4 Excellent4 100
College Sector Specific Indicator 2 Excellent2 100
Management 8 Excellent6 75
Policy 10 Excellent10 100
The College Sustainability Report Card Criteria 4 Excellent4 100
Vision 4 Excellent4 100
Environmental Reporting
Question Category Max Score General CommentScore %Emissions to Air 7 Good4 57
Energy 14 Needs improvement6 43
Management 42 Needs improvement16 38
Materials Usage 21 Needs improvement9 43
Recycling 14 Good7 50
Waste 28 Needs substantial improvement2 7
Water 7 Needs improvement3 43
Social Intent
Question Category Max Score General CommentScore %Accountability 4 Good2 50
Management 10 Excellent9 90
Policy 6 Good3 50
Social Demographic 2 Excellent2 100
The College Sustainability Report Card Criteria 8 Good4 50
Vision 4 Good2 50
Social Reporting
Question Category Max Score General CommentScore %Human Rights 77 Needs improvement30 39
Management 7 Excellent7 100
Qualitative Social 35 Needs improvement12 34
Quantitative Social 42 Needs substantial improvement2 5
www.roberts.cmc.edu 58 Sustainability Reporting of the Top U.S. Universities

University of California-San Diego
0 2 5 5 0 7 5
SSA
SESA
E
UCSD's website was very easy to navigate, with drop down menus for many of the environmental components that we score for. I was surprised at how much information I was able to gather concerning non-environmental sustainability factors. However, the climate action plan was not the easiest to follow. There are many goals and plans to implement in the future, but no up-to-date statistics on current and past performance.
S47%
E5 3 %
University of California--San Diego 2010 Web Pages
Comparison with sector averages Source of points
C-
Starrisha Marche Godfrey-Canada
Distribution of points
E=Total Environmental Score, ESA=Environmental Sector Average Score, EI=Environmental Intent, ER=Environmental Reporting, EP=Environmental Performance, S=Total Social Score, SSA=Social Sector Average Score, SI=Social Intent, SR=Social Reporting, SP=Social Performance
EI ER EP SI SR SP
University ofCalifornia-San Diego
47
153
41
134
Analyst(s):
Environmental Intent
Question Category Max Score General CommentScore %Accountability 4 Good2 50
College Sector Specific Indicator 2 Needs substantial improvement0 0
Management 8 Needs improvement2 25
Policy 10 Needs improvement4 40
The College Sustainability Report Card Criteria 4 Excellent3 75
Vision 4 Excellent4 100
Environmental Reporting
Question Category Max Score General CommentScore %Emissions to Air 7 Needs substantial improvement0 0
Energy 14 Needs substantial improvement3 21
Management 42 Needs substantial improvement6 14
Materials Usage 21 Needs substantial improvement0 0
Recycling 14 Needs substantial improvement2 14
Waste 28 Needs substantial improvement0 0
Water 7 Good4 57
Social Intent
Question Category Max Score General CommentScore %Accountability 4 Good2 50
Management 10 Good6 60
Policy 6 Needs improvement2 33
Social Demographic 2 Excellent2 100
The College Sustainability Report Card Criteria 8 Needs improvement2 25
Vision 4 Needs substantial improvement0 0
Social Reporting
Question Category Max Score General CommentScore %Human Rights 77 Needs substantial improvement12 16
Management 7 Needs substantial improvement0 0
Qualitative Social 35 Needs substantial improvement5 14
Quantitative Social 42 Needs substantial improvement0 0
www.roberts.cmc.edu 59 Sustainability Reporting of the Top U.S. Universities
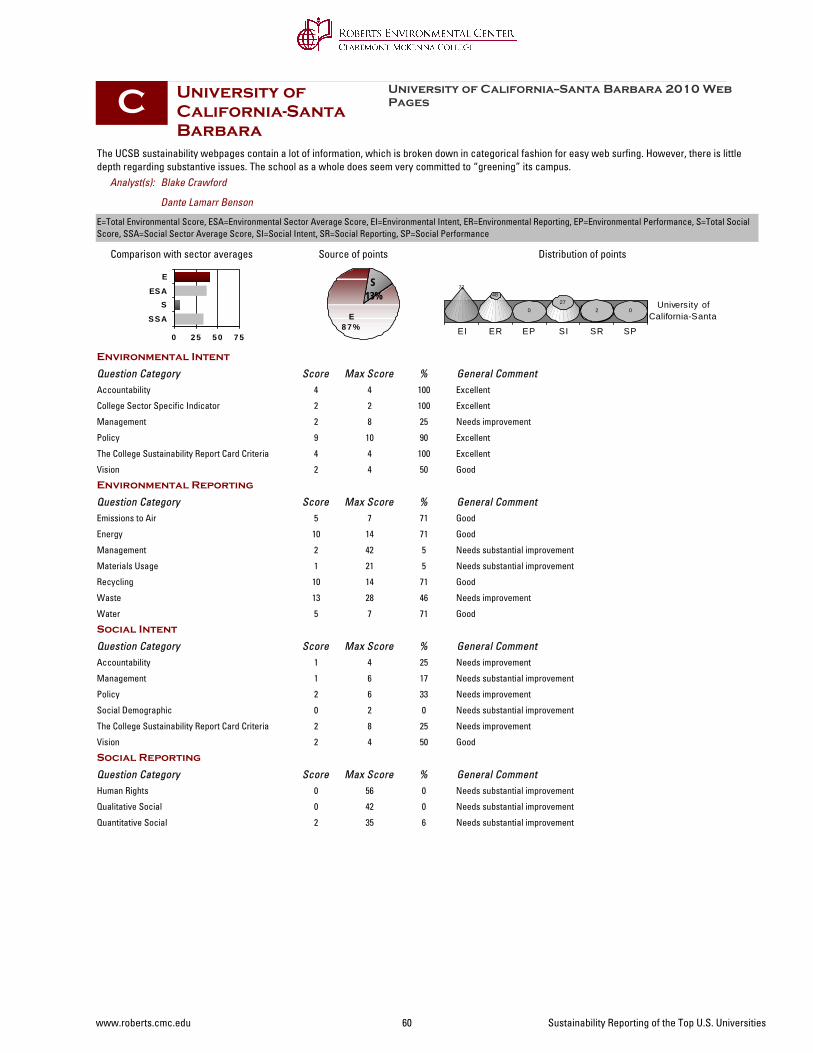
University of California-Santa Barbara
0 2 5 5 0 7 5
SSA
SESA
E
The UCSB sustainability webpages contain a lot of information, which is broken down in categorical fashion for easy web surfing. However, there is little depth regarding substantive issues. The school as a whole does seem very committed to “greening” its campus.
S13%
E8 7 %
University of California--Santa Barbara 2010 Web Pages
Comparison with sector averages Source of points
C
Dante Lamarr Benson
Blake Crawford
Distribution of points
E=Total Environmental Score, ESA=Environmental Sector Average Score, EI=Environmental Intent, ER=Environmental Reporting, EP=Environmental Performance, S=Total Social Score, SSA=Social Sector Average Score, SI=Social Intent, SR=Social Reporting, SP=Social Performance
EI ER EP SI SR SP
University ofCalifornia-Santa
7248
027
2 0
Analyst(s):
Environmental Intent
Question Category Max Score General CommentScore %Accountability 4 Excellent4 100
College Sector Specific Indicator 2 Excellent2 100
Management 8 Needs improvement2 25
Policy 10 Excellent9 90
The College Sustainability Report Card Criteria 4 Excellent4 100
Vision 4 Good2 50
Environmental Reporting
Question Category Max Score General CommentScore %Emissions to Air 7 Good5 71
Energy 14 Good10 71
Management 42 Needs substantial improvement2 5
Materials Usage 21 Needs substantial improvement1 5
Recycling 14 Good10 71
Waste 28 Needs improvement13 46
Water 7 Good5 71
Social Intent
Question Category Max Score General CommentScore %Accountability 4 Needs improvement1 25
Management 6 Needs substantial improvement1 17
Policy 6 Needs improvement2 33
Social Demographic 2 Needs substantial improvement0 0
The College Sustainability Report Card Criteria 8 Needs improvement2 25
Vision 4 Good2 50
Social Reporting
Question Category Max Score General CommentScore %Human Rights 56 Needs substantial improvement0 0
Qualitative Social 42 Needs substantial improvement0 0
Quantitative Social 35 Needs substantial improvement2 6
www.roberts.cmc.edu 60 Sustainability Reporting of the Top U.S. Universities
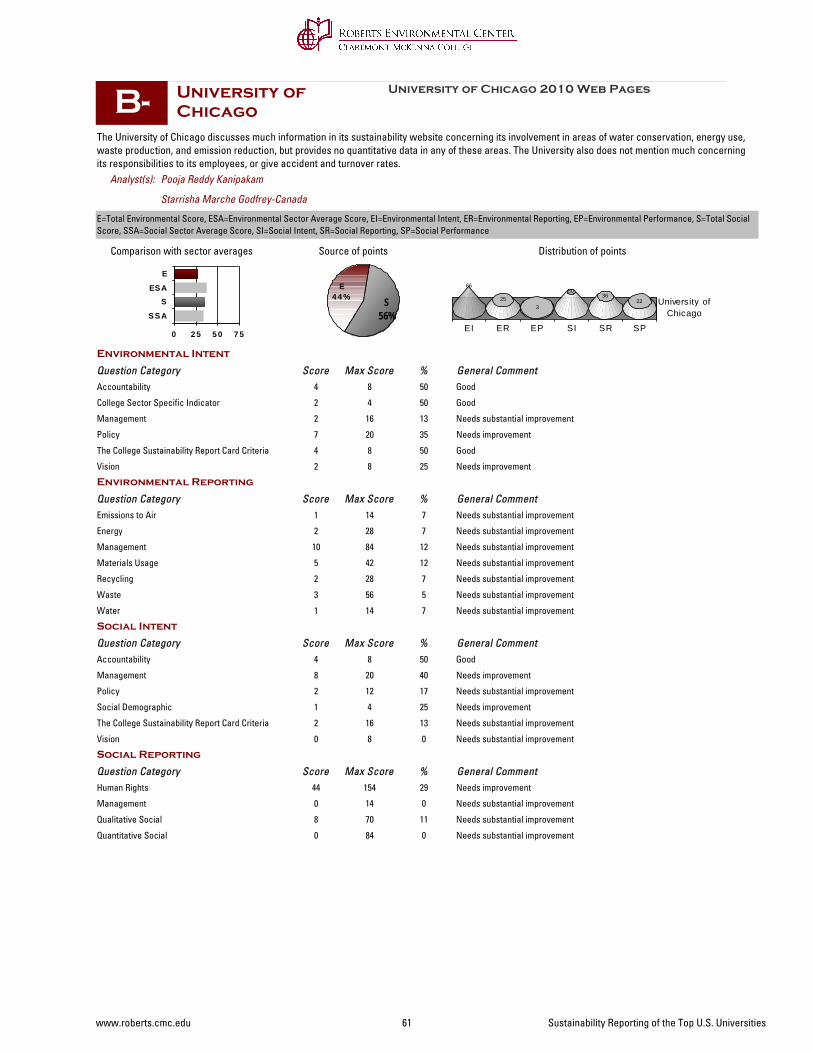
University of Chicago
0 2 5 5 0 7 5
SSA
SESA
E
The University of Chicago discusses much information in its sustainability website concerning its involvement in areas of water conservation, energy use, waste production, and emission reduction, but provides no quantitative data in any of these areas. The University also does not mention much concerning its responsibilities to its employees, or give accident and turnover rates.
S56%
E4 4 %
University of Chicago 2010 Web Pages
Comparison with sector averages Source of points
B-
Starrisha Marche Godfrey-Canada
Pooja Reddy Kanipakam
Distribution of points
E=Total Environmental Score, ESA=Environmental Sector Average Score, EI=Environmental Intent, ER=Environmental Reporting, EP=Environmental Performance, S=Total Social Score, SSA=Social Sector Average Score, SI=Social Intent, SR=Social Reporting, SP=Social Performance
EI ER EP SI SR SP
University ofChicago
66
253
5036
22
Analyst(s):
Environmental Intent
Question Category Max Score General CommentScore %Accountability 8 Good4 50
College Sector Specific Indicator 4 Good2 50
Management 16 Needs substantial improvement2 13
Policy 20 Needs improvement7 35
The College Sustainability Report Card Criteria 8 Good4 50
Vision 8 Needs improvement2 25
Environmental Reporting
Question Category Max Score General CommentScore %Emissions to Air 14 Needs substantial improvement1 7
Energy 28 Needs substantial improvement2 7
Management 84 Needs substantial improvement10 12
Materials Usage 42 Needs substantial improvement5 12
Recycling 28 Needs substantial improvement2 7
Waste 56 Needs substantial improvement3 5
Water 14 Needs substantial improvement1 7
Social Intent
Question Category Max Score General CommentScore %Accountability 8 Good4 50
Management 20 Needs improvement8 40
Policy 12 Needs substantial improvement2 17
Social Demographic 4 Needs improvement1 25
The College Sustainability Report Card Criteria 16 Needs substantial improvement2 13
Vision 8 Needs substantial improvement0 0
Social Reporting
Question Category Max Score General CommentScore %Human Rights 154 Needs improvement44 29
Management 14 Needs substantial improvement0 0
Qualitative Social 70 Needs substantial improvement8 11
Quantitative Social 84 Needs substantial improvement0 0
www.roberts.cmc.edu 61 Sustainability Reporting of the Top U.S. Universities
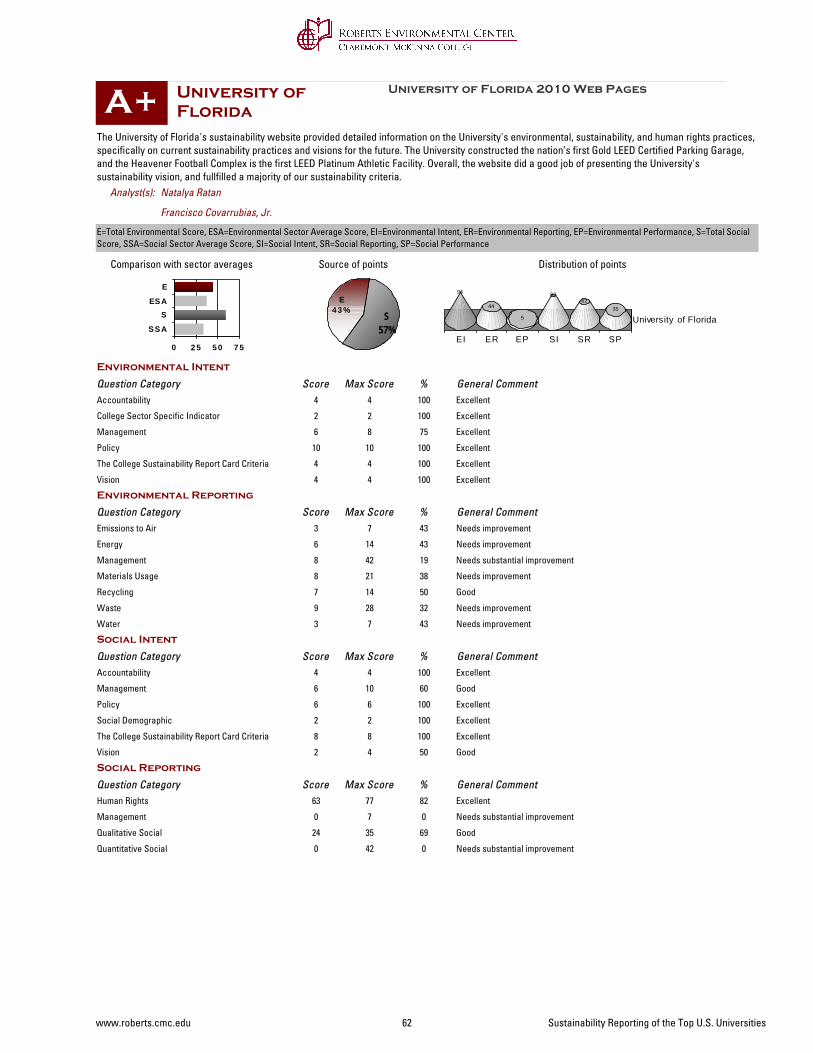
University of Florida
0 2 5 5 0 7 5
SSA
SESA
E
The University of Florida's sustainability website provided detailed information on the University's environmental, sustainability, and human rights practices, specifically on current sustainability practices and visions for the future. The University constructed the nation’s first Gold LEED Certified Parking Garage, and the Heavener Football Complex is the first LEED Platinum Athletic Facility. Overall, the website did a good job of presenting the University's sustainability vision, and fullfilled a majority of our sustainability criteria.
S57%
E4 3 %
University of Florida 2010 Web Pages
Comparison with sector averages Source of points
A+
Francisco Covarrubias, Jr.
Natalya Ratan
Distribution of points
E=Total Environmental Score, ESA=Environmental Sector Average Score, EI=Environmental Intent, ER=Environmental Reporting, EP=Environmental Performance, S=Total Social Score, SSA=Social Sector Average Score, SI=Social Intent, SR=Social Reporting, SP=Social Performance
EI ER EP SI SR SP
University of Florida
94
44
5
8262
35
Analyst(s):
Environmental Intent
Question Category Max Score General CommentScore %Accountability 4 Excellent4 100
College Sector Specific Indicator 2 Excellent2 100
Management 8 Excellent6 75
Policy 10 Excellent10 100
The College Sustainability Report Card Criteria 4 Excellent4 100
Vision 4 Excellent4 100
Environmental Reporting
Question Category Max Score General CommentScore %Emissions to Air 7 Needs improvement3 43
Energy 14 Needs improvement6 43
Management 42 Needs substantial improvement8 19
Materials Usage 21 Needs improvement8 38
Recycling 14 Good7 50
Waste 28 Needs improvement9 32
Water 7 Needs improvement3 43
Social Intent
Question Category Max Score General CommentScore %Accountability 4 Excellent4 100
Management 10 Good6 60
Policy 6 Excellent6 100
Social Demographic 2 Excellent2 100
The College Sustainability Report Card Criteria 8 Excellent8 100
Vision 4 Good2 50
Social Reporting
Question Category Max Score General CommentScore %Human Rights 77 Excellent63 82
Management 7 Needs substantial improvement0 0
Qualitative Social 35 Good24 69
Quantitative Social 42 Needs substantial improvement0 0
www.roberts.cmc.edu 62 Sustainability Reporting of the Top U.S. Universities
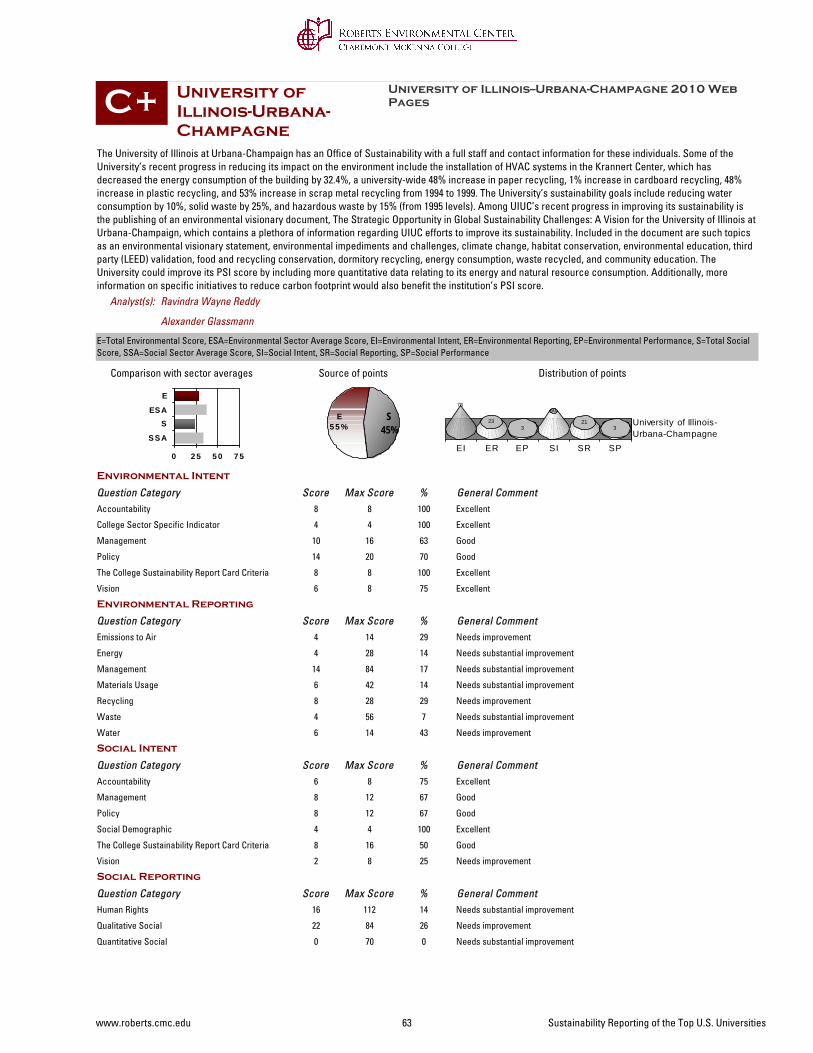
University of Illinois-Urbana-Champagne
0 2 5 5 0 7 5
SSA
SESA
E
The University of Illinois at Urbana-Champaign has an Office of Sustainability with a full staff and contact information for these individuals. Some of the University’s recent progress in reducing its impact on the environment include the installation of HVAC systems in the Krannert Center, which has decreased the energy consumption of the building by 32.4%, a university-wide 48% increase in paper recycling, 1% increase in cardboard recycling, 48% increase in plastic recycling, and 53% increase in scrap metal recycling from 1994 to 1999. The University’s sustainability goals include reducing water consumption by 10%, solid waste by 25%, and hazardous waste by 15% (from 1995 levels). Among UIUC’s recent progress in improving its sustainability is the publishing of an environmental visionary document, The Strategic Opportunity in Global Sustainability Challenges: A Vision for the University of Illinois at Urbana-Champaign, which contains a plethora of information regarding UIUC efforts to improve its sustainability. Included in the document are such topics as an environmental visionary statement, environmental impediments and challenges, climate change, habitat conservation, environmental education, third party (LEED) validation, food and recycling conservation, dormitory recycling, energy consumption, waste recycled, and community education. The University could improve its PSI score by including more quantitative data relating to its energy and natural resource consumption. Additionally, more information on specific initiatives to reduce carbon footprint would also benefit the institution’s PSI score.
S45%
E5 5 %
University of Illinois--Urbana-Champagne 2010 Web Pages
Comparison with sector averages Source of points
C+
Alexander Glassmann
Ravindra Wayne Reddy
Distribution of points
E=Total Environmental Score, ESA=Environmental Sector Average Score, EI=Environmental Intent, ER=Environmental Reporting, EP=Environmental Performance, S=Total Social Score, SSA=Social Sector Average Score, SI=Social Intent, SR=Social Reporting, SP=Social Performance
EI ER EP SI SR SP
University of Illinois-Urbana-Champagne
78
233
60
213
Analyst(s):
Environmental Intent
Question Category Max Score General CommentScore %Accountability 8 Excellent8 100
College Sector Specific Indicator 4 Excellent4 100
Management 16 Good10 63
Policy 20 Good14 70
The College Sustainability Report Card Criteria 8 Excellent8 100
Vision 8 Excellent6 75
Environmental Reporting
Question Category Max Score General CommentScore %Emissions to Air 14 Needs improvement4 29
Energy 28 Needs substantial improvement4 14
Management 84 Needs substantial improvement14 17
Materials Usage 42 Needs substantial improvement6 14
Recycling 28 Needs improvement8 29
Waste 56 Needs substantial improvement4 7
Water 14 Needs improvement6 43
Social Intent
Question Category Max Score General CommentScore %Accountability 8 Excellent6 75
Management 12 Good8 67
Policy 12 Good8 67
Social Demographic 4 Excellent4 100
The College Sustainability Report Card Criteria 16 Good8 50
Vision 8 Needs improvement2 25
Social Reporting
Question Category Max Score General CommentScore %Human Rights 112 Needs substantial improvement16 14
Qualitative Social 84 Needs improvement22 26
Quantitative Social 70 Needs substantial improvement0 0
www.roberts.cmc.edu 63 Sustainability Reporting of the Top U.S. Universities
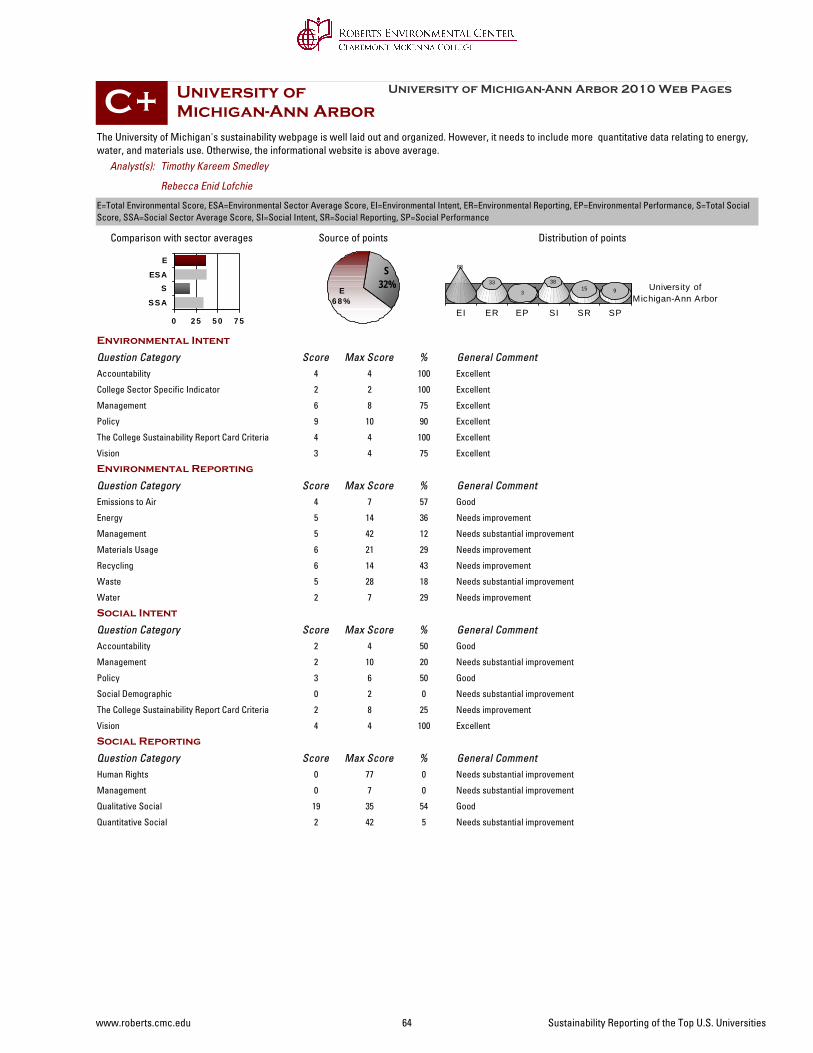
University of Michigan-Ann Arbor
0 2 5 5 0 7 5
SSA
SESA
E
The University of Michigan's sustainability webpage is well laid out and organized. However, it needs to include more quantitative data relating to energy, water, and materials use. Otherwise, the informational website is above average.
S32%
E6 8 %
University of Michigan-Ann Arbor 2010 Web Pages
Comparison with sector averages Source of points
C+
Rebecca Enid Lofchie
Timothy Kareem Smedley
Distribution of points
E=Total Environmental Score, ESA=Environmental Sector Average Score, EI=Environmental Intent, ER=Environmental Reporting, EP=Environmental Performance, S=Total Social Score, SSA=Social Sector Average Score, SI=Social Intent, SR=Social Reporting, SP=Social Performance
EI ER EP SI SR SP
University ofMichigan-Ann Arbor
88
33
3
3815 9
Analyst(s):
Environmental Intent
Question Category Max Score General CommentScore %Accountability 4 Excellent4 100
College Sector Specific Indicator 2 Excellent2 100
Management 8 Excellent6 75
Policy 10 Excellent9 90
The College Sustainability Report Card Criteria 4 Excellent4 100
Vision 4 Excellent3 75
Environmental Reporting
Question Category Max Score General CommentScore %Emissions to Air 7 Good4 57
Energy 14 Needs improvement5 36
Management 42 Needs substantial improvement5 12
Materials Usage 21 Needs improvement6 29
Recycling 14 Needs improvement6 43
Waste 28 Needs substantial improvement5 18
Water 7 Needs improvement2 29
Social Intent
Question Category Max Score General CommentScore %Accountability 4 Good2 50
Management 10 Needs substantial improvement2 20
Policy 6 Good3 50
Social Demographic 2 Needs substantial improvement0 0
The College Sustainability Report Card Criteria 8 Needs improvement2 25
Vision 4 Excellent4 100
Social Reporting
Question Category Max Score General CommentScore %Human Rights 77 Needs substantial improvement0 0
Management 7 Needs substantial improvement0 0
Qualitative Social 35 Good19 54
Quantitative Social 42 Needs substantial improvement2 5
www.roberts.cmc.edu 64 Sustainability Reporting of the Top U.S. Universities
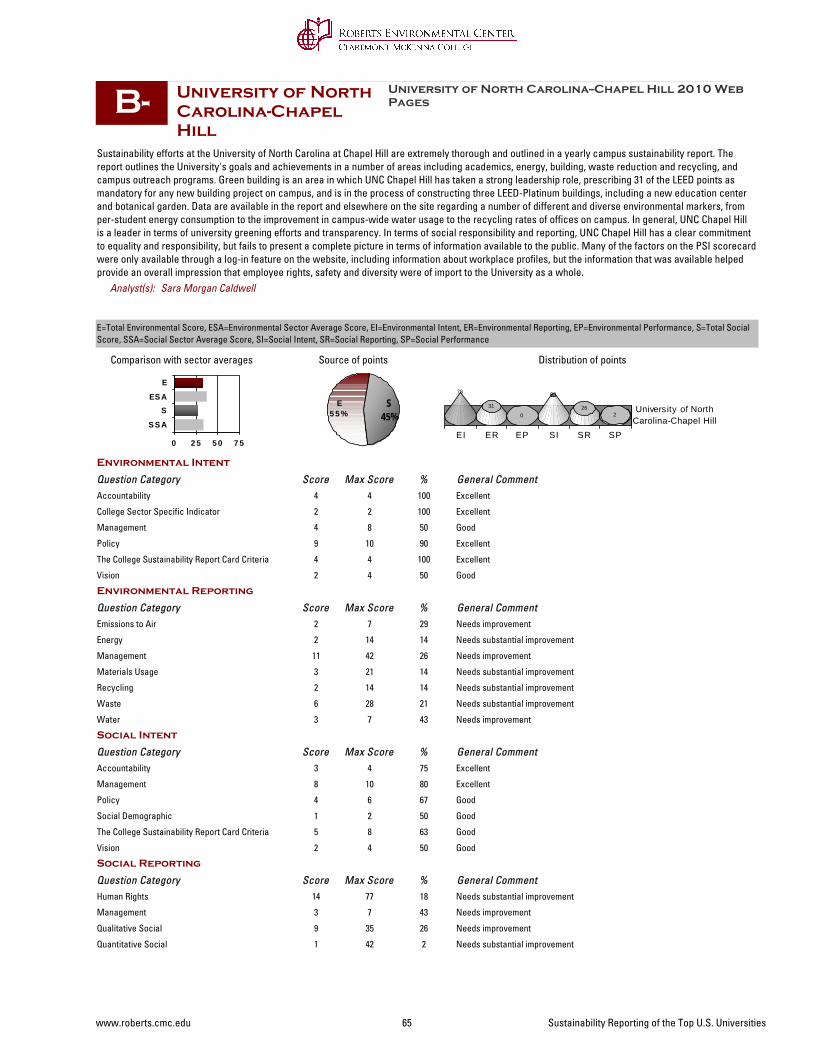
University of North Carolina-Chapel Hill
0 2 5 5 0 7 5
SSA
SESA
E
Sustainability efforts at the University of North Carolina at Chapel Hill are extremely thorough and outlined in a yearly campus sustainability report. The report outlines the University's goals and achievements in a number of areas including academics, energy, building, waste reduction and recycling, and campus outreach programs. Green building is an area in which UNC Chapel Hill has taken a strong leadership role, prescribing 31 of the LEED points as mandatory for any new building project on campus, and is in the process of constructing three LEED-Platinum buildings, including a new education center and botanical garden. Data are available in the report and elsewhere on the site regarding a number of different and diverse environmental markers, from per-student energy consumption to the improvement in campus-wide water usage to the recycling rates of offices on campus. In general, UNC Chapel Hill is a leader in terms of university greening efforts and transparency. In terms of social responsibility and reporting, UNC Chapel Hill has a clear commitment to equality and responsibility, but fails to present a complete picture in terms of information available to the public. Many of the factors on the PSI scorecard were only available through a log-in feature on the website, including information about workplace profiles, but the information that was available helped provide an overall impression that employee rights, safety and diversity were of import to the University as a whole.
S45%
E5 5 %
University of North Carolina--Chapel Hill 2010 Web Pages
Comparison with sector averages Source of points
B-
Sara Morgan Caldwell
Distribution of points
E=Total Environmental Score, ESA=Environmental Sector Average Score, EI=Environmental Intent, ER=Environmental Reporting, EP=Environmental Performance, S=Total Social Score, SSA=Social Sector Average Score, SI=Social Intent, SR=Social Reporting, SP=Social Performance
EI ER EP SI SR SP
University of NorthCarolina-Chapel Hill
78
31
0
68
262
Analyst(s):
Environmental Intent
Question Category Max Score General CommentScore %Accountability 4 Excellent4 100
College Sector Specific Indicator 2 Excellent2 100
Management 8 Good4 50
Policy 10 Excellent9 90
The College Sustainability Report Card Criteria 4 Excellent4 100
Vision 4 Good2 50
Environmental Reporting
Question Category Max Score General CommentScore %Emissions to Air 7 Needs improvement2 29
Energy 14 Needs substantial improvement2 14
Management 42 Needs improvement11 26
Materials Usage 21 Needs substantial improvement3 14
Recycling 14 Needs substantial improvement2 14
Waste 28 Needs substantial improvement6 21
Water 7 Needs improvement3 43
Social Intent
Question Category Max Score General CommentScore %Accountability 4 Excellent3 75
Management 10 Excellent8 80
Policy 6 Good4 67
Social Demographic 2 Good1 50
The College Sustainability Report Card Criteria 8 Good5 63
Vision 4 Good2 50
Social Reporting
Question Category Max Score General CommentScore %Human Rights 77 Needs substantial improvement14 18
Management 7 Needs improvement3 43
Qualitative Social 35 Needs improvement9 26
Quantitative Social 42 Needs substantial improvement1 2
www.roberts.cmc.edu 65 Sustainability Reporting of the Top U.S. Universities
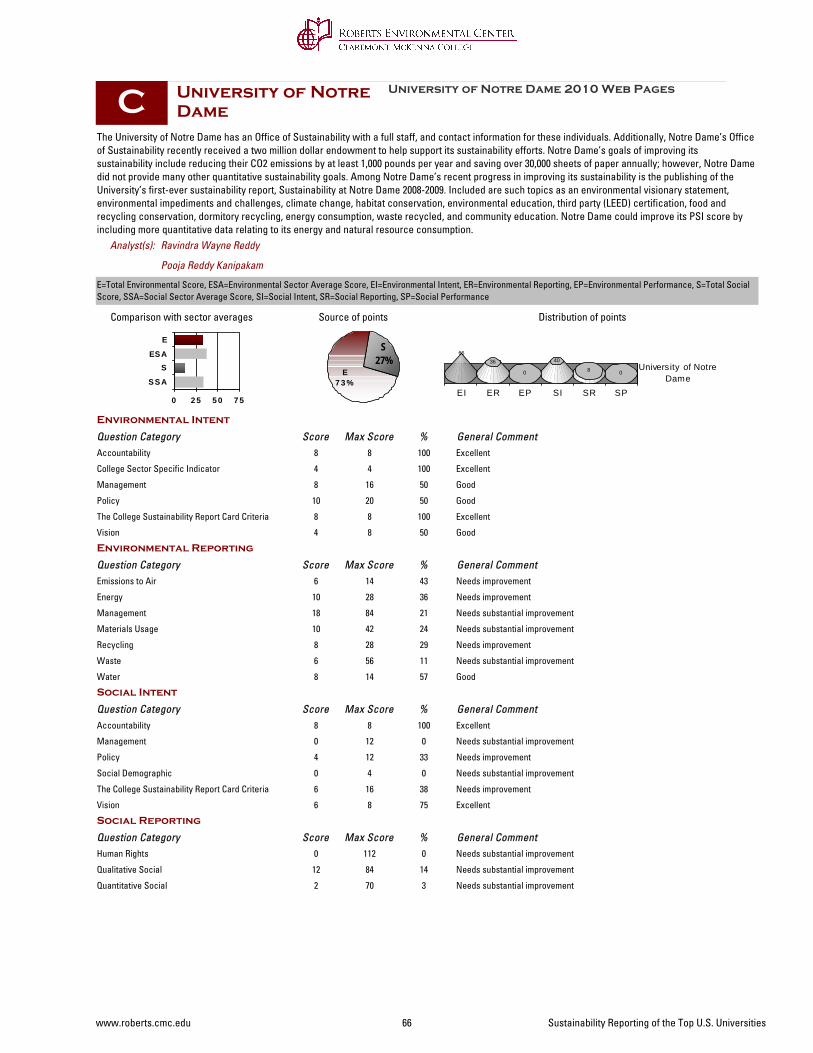
University of Notre Dame
0 2 5 5 0 7 5
SSA
SESA
E
The University of Notre Dame has an Office of Sustainability with a full staff, and contact information for these individuals. Additionally, Notre Dame’s Office of Sustainability recently received a two million dollar endowment to help support its sustainability efforts. Notre Dame’s goals of improving its sustainability include reducing their CO2 emissions by at least 1,000 pounds per year and saving over 30,000 sheets of paper annually; however, Notre Dame did not provide many other quantitative sustainability goals. Among Notre Dame’s recent progress in improving its sustainability is the publishing of the University’s first-ever sustainability report, Sustainability at Notre Dame 2008-2009. Included are such topics as an environmental visionary statement, environmental impediments and challenges, climate change, habitat conservation, environmental education, third party (LEED) certification, food and recycling conservation, dormitory recycling, energy consumption, waste recycled, and community education. Notre Dame could improve its PSI score by including more quantitative data relating to its energy and natural resource consumption.
S27%
E7 3 %
University of Notre Dame 2010 Web Pages
Comparison with sector averages Source of points
C
Pooja Reddy Kanipakam
Ravindra Wayne Reddy
Distribution of points
E=Total Environmental Score, ESA=Environmental Sector Average Score, EI=Environmental Intent, ER=Environmental Reporting, EP=Environmental Performance, S=Total Social Score, SSA=Social Sector Average Score, SI=Social Intent, SR=Social Reporting, SP=Social Performance
EI ER EP SI SR SP
University of NotreDame
6636
0
40
8 0
Analyst(s):
Environmental Intent
Question Category Max Score General CommentScore %Accountability 8 Excellent8 100
College Sector Specific Indicator 4 Excellent4 100
Management 16 Good8 50
Policy 20 Good10 50
The College Sustainability Report Card Criteria 8 Excellent8 100
Vision 8 Good4 50
Environmental Reporting
Question Category Max Score General CommentScore %Emissions to Air 14 Needs improvement6 43
Energy 28 Needs improvement10 36
Management 84 Needs substantial improvement18 21
Materials Usage 42 Needs substantial improvement10 24
Recycling 28 Needs improvement8 29
Waste 56 Needs substantial improvement6 11
Water 14 Good8 57
Social Intent
Question Category Max Score General CommentScore %Accountability 8 Excellent8 100
Management 12 Needs substantial improvement0 0
Policy 12 Needs improvement4 33
Social Demographic 4 Needs substantial improvement0 0
The College Sustainability Report Card Criteria 16 Needs improvement6 38
Vision 8 Excellent6 75
Social Reporting
Question Category Max Score General CommentScore %Human Rights 112 Needs substantial improvement0 0
Qualitative Social 84 Needs substantial improvement12 14
Quantitative Social 70 Needs substantial improvement2 3
www.roberts.cmc.edu 66 Sustainability Reporting of the Top U.S. Universities
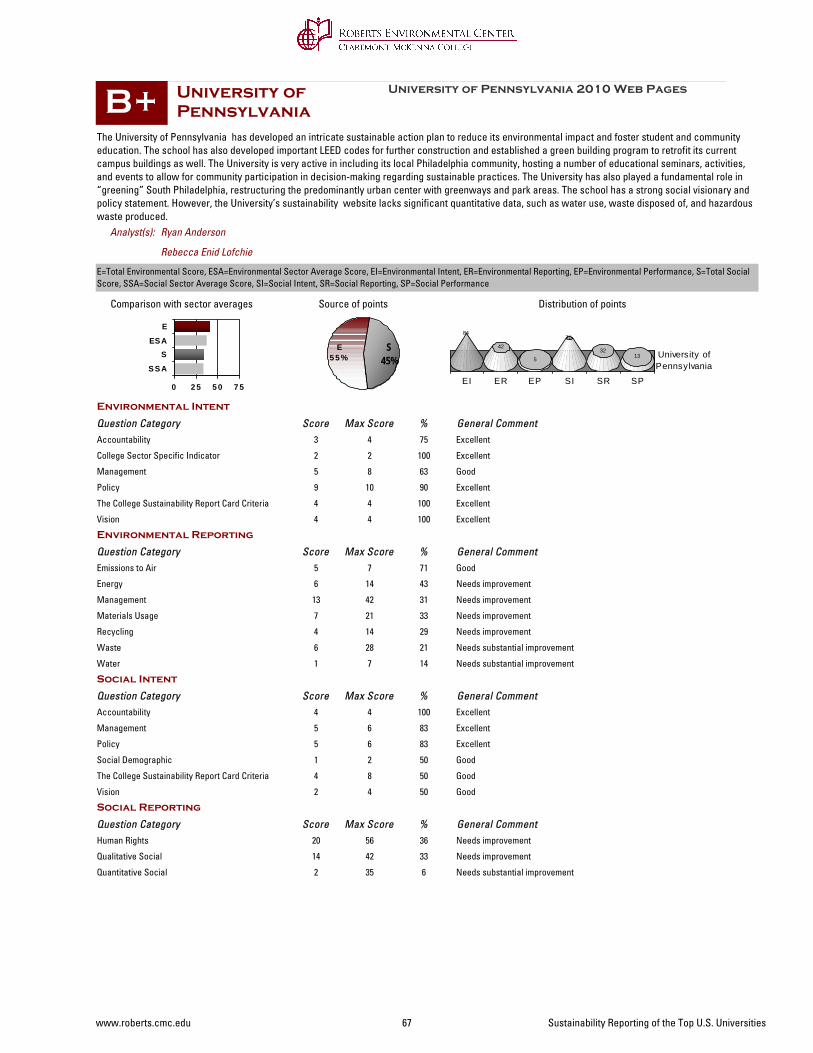
University of Pennsylvania
0 2 5 5 0 7 5
SSA
SESA
E
The University of Pennsylvania has developed an intricate sustainable action plan to reduce its environmental impact and foster student and community education. The school has also developed important LEED codes for further construction and established a green building program to retrofit its current campus buildings as well. The University is very active in including its local Philadelphia community, hosting a number of educational seminars, activities, and events to allow for community participation in decision-making regarding sustainable practices. The University has also played a fundamental role in “greening” South Philadelphia, restructuring the predominantly urban center with greenways and park areas. The school has a strong social visionary and policy statement. However, the University’s sustainability website lacks significant quantitative data, such as water use, waste disposed of, and hazardous waste produced.
S45%
E5 5 %
University of Pennsylvania 2010 Web Pages
Comparison with sector averages Source of points
B+
Rebecca Enid Lofchie
Ryan Anderson
Distribution of points
E=Total Environmental Score, ESA=Environmental Sector Average Score, EI=Environmental Intent, ER=Environmental Reporting, EP=Environmental Performance, S=Total Social Score, SSA=Social Sector Average Score, SI=Social Intent, SR=Social Reporting, SP=Social Performance
EI ER EP SI SR SP
University ofPennsylvania
84
42
5
70
3213
Analyst(s):
Environmental Intent
Question Category Max Score General CommentScore %Accountability 4 Excellent3 75
College Sector Specific Indicator 2 Excellent2 100
Management 8 Good5 63
Policy 10 Excellent9 90
The College Sustainability Report Card Criteria 4 Excellent4 100
Vision 4 Excellent4 100
Environmental Reporting
Question Category Max Score General CommentScore %Emissions to Air 7 Good5 71
Energy 14 Needs improvement6 43
Management 42 Needs improvement13 31
Materials Usage 21 Needs improvement7 33
Recycling 14 Needs improvement4 29
Waste 28 Needs substantial improvement6 21
Water 7 Needs substantial improvement1 14
Social Intent
Question Category Max Score General CommentScore %Accountability 4 Excellent4 100
Management 6 Excellent5 83
Policy 6 Excellent5 83
Social Demographic 2 Good1 50
The College Sustainability Report Card Criteria 8 Good4 50
Vision 4 Good2 50
Social Reporting
Question Category Max Score General CommentScore %Human Rights 56 Needs improvement20 36
Qualitative Social 42 Needs improvement14 33
Quantitative Social 35 Needs substantial improvement2 6
www.roberts.cmc.edu 67 Sustainability Reporting of the Top U.S. Universities
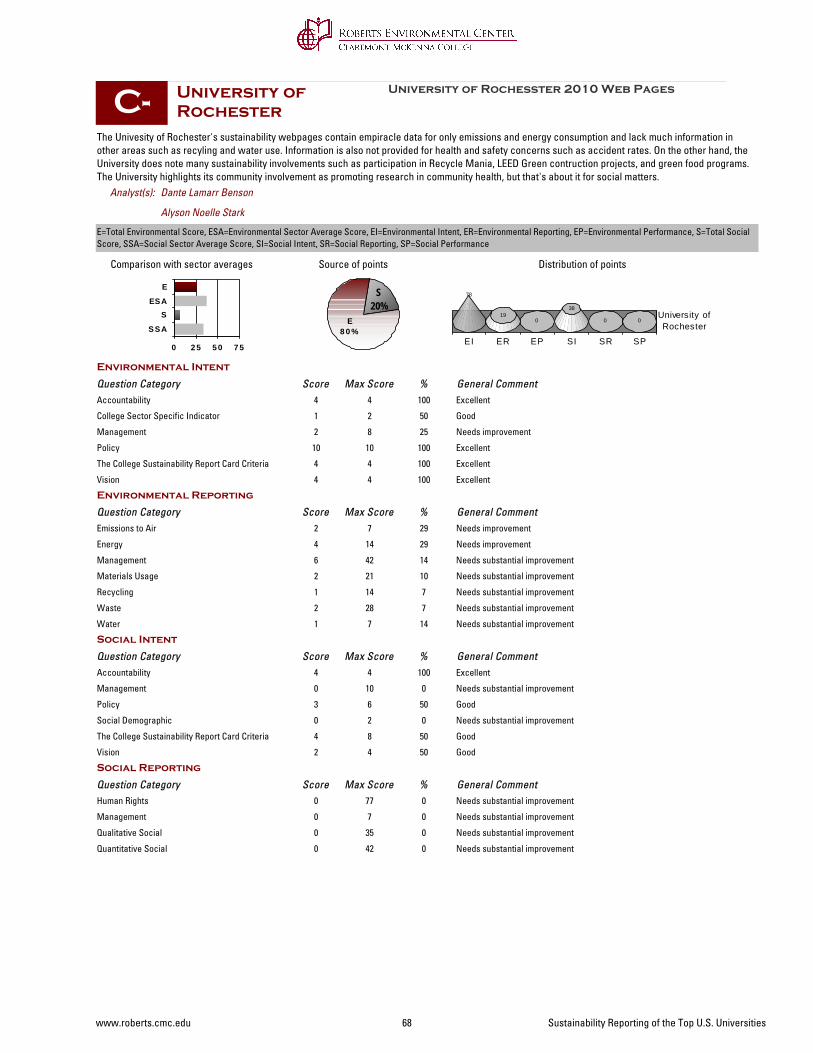
University of Rochester
0 2 5 5 0 7 5
SSA
SESA
E
The Univesity of Rochester's sustainability webpages contain empiracle data for only emissions and energy consumption and lack much information in other areas such as recyling and water use. Information is also not provided for health and safety concerns such as accident rates. On the other hand, the University does note many sustainability involvements such as participation in Recycle Mania, LEED Green contruction projects, and green food programs. The University highlights its community involvement as promoting research in community health, but that's about it for social matters.
S20%
E8 0 %
University of Rochesster 2010 Web Pages
Comparison with sector averages Source of points
C-
Alyson Noelle Stark
Dante Lamarr Benson
Distribution of points
E=Total Environmental Score, ESA=Environmental Sector Average Score, EI=Environmental Intent, ER=Environmental Reporting, EP=Environmental Performance, S=Total Social Score, SSA=Social Sector Average Score, SI=Social Intent, SR=Social Reporting, SP=Social Performance
EI ER EP SI SR SP
University ofRochester
78
190
38
0 0
Analyst(s):
Environmental Intent
Question Category Max Score General CommentScore %Accountability 4 Excellent4 100
College Sector Specific Indicator 2 Good1 50
Management 8 Needs improvement2 25
Policy 10 Excellent10 100
The College Sustainability Report Card Criteria 4 Excellent4 100
Vision 4 Excellent4 100
Environmental Reporting
Question Category Max Score General CommentScore %Emissions to Air 7 Needs improvement2 29
Energy 14 Needs improvement4 29
Management 42 Needs substantial improvement6 14
Materials Usage 21 Needs substantial improvement2 10
Recycling 14 Needs substantial improvement1 7
Waste 28 Needs substantial improvement2 7
Water 7 Needs substantial improvement1 14
Social Intent
Question Category Max Score General CommentScore %Accountability 4 Excellent4 100
Management 10 Needs substantial improvement0 0
Policy 6 Good3 50
Social Demographic 2 Needs substantial improvement0 0
The College Sustainability Report Card Criteria 8 Good4 50
Vision 4 Good2 50
Social Reporting
Question Category Max Score General CommentScore %Human Rights 77 Needs substantial improvement0 0
Management 7 Needs substantial improvement0 0
Qualitative Social 35 Needs substantial improvement0 0
Quantitative Social 42 Needs substantial improvement0 0
www.roberts.cmc.edu 68 Sustainability Reporting of the Top U.S. Universities
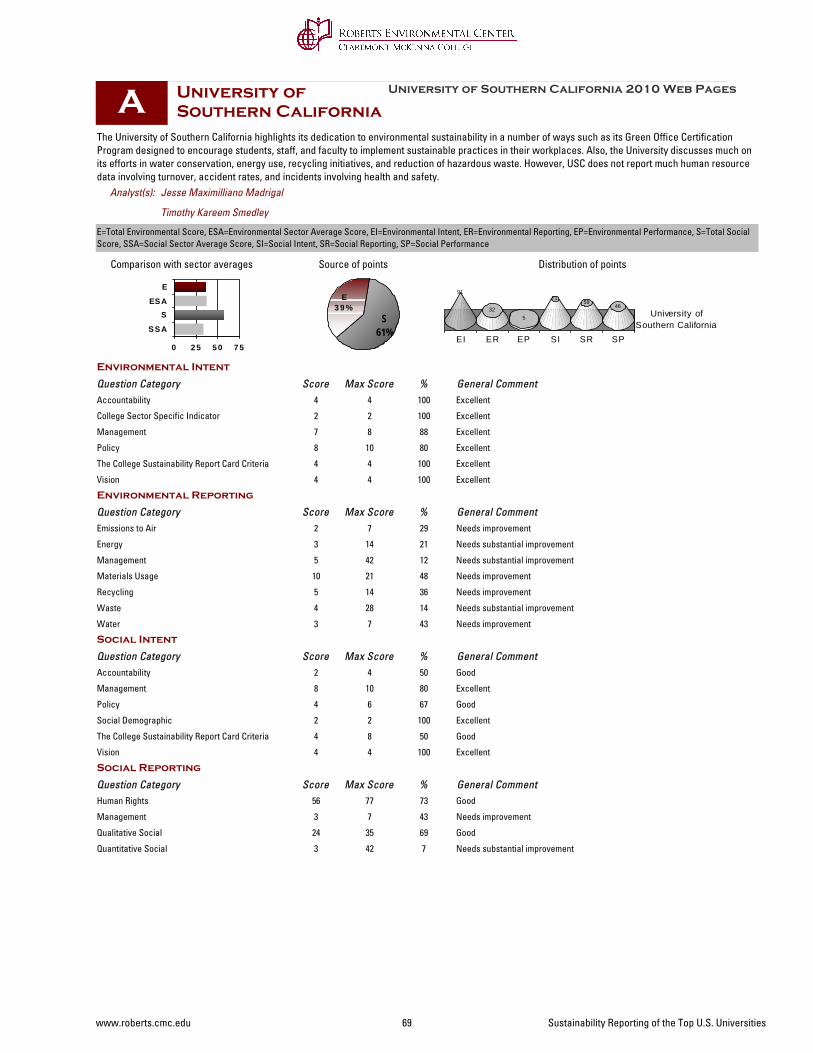
University of Southern California
0 2 5 5 0 7 5
SSA
SESA
E
The University of Southern California highlights its dedication to environmental sustainability in a number of ways such as its Green Office Certification Program designed to encourage students, staff, and faculty to implement sustainable practices in their workplaces. Also, the University discusses much on its efforts in water conservation, energy use, recycling initiatives, and reduction of hazardous waste. However, USC does not report much human resource data involving turnover, accident rates, and incidents involving health and safety.
S61%
E3 9 %
University of Southern California 2010 Web Pages
Comparison with sector averages Source of points
A
Timothy Kareem Smedley
Jesse Maximilliano Madrigal
Distribution of points
E=Total Environmental Score, ESA=Environmental Sector Average Score, EI=Environmental Intent, ER=Environmental Reporting, EP=Environmental Performance, S=Total Social Score, SSA=Social Sector Average Score, SI=Social Intent, SR=Social Reporting, SP=Social Performance
EI ER EP SI SR SP
University ofSouthern California
91
325
7158
46
Analyst(s):
Environmental Intent
Question Category Max Score General CommentScore %Accountability 4 Excellent4 100
College Sector Specific Indicator 2 Excellent2 100
Management 8 Excellent7 88
Policy 10 Excellent8 80
The College Sustainability Report Card Criteria 4 Excellent4 100
Vision 4 Excellent4 100
Environmental Reporting
Question Category Max Score General CommentScore %Emissions to Air 7 Needs improvement2 29
Energy 14 Needs substantial improvement3 21
Management 42 Needs substantial improvement5 12
Materials Usage 21 Needs improvement10 48
Recycling 14 Needs improvement5 36
Waste 28 Needs substantial improvement4 14
Water 7 Needs improvement3 43
Social Intent
Question Category Max Score General CommentScore %Accountability 4 Good2 50
Management 10 Excellent8 80
Policy 6 Good4 67
Social Demographic 2 Excellent2 100
The College Sustainability Report Card Criteria 8 Good4 50
Vision 4 Excellent4 100
Social Reporting
Question Category Max Score General CommentScore %Human Rights 77 Good56 73
Management 7 Needs improvement3 43
Qualitative Social 35 Good24 69
Quantitative Social 42 Needs substantial improvement3 7
www.roberts.cmc.edu 69 Sustainability Reporting of the Top U.S. Universities

University of Texas-Austin
0 2 5 5 0 7 5
SSA
SESA
E
The sustainability information on the University of Texas in Austin’s website was mediocre, mainly because of the seemingly random placement of information. The links did not correspond well with the information that one would associate with the current page, and there should be one link on the home page to a sustainability home page. The website should include a student’s perspective on sustainability because it mentions so often that the student is its main focus in sustainability initiatives.
S53%
E4 7 %
University of Texas--Austin 2010 Web Pages
Comparison with sector averages Source of points
B-
Jesse Maximilliano Madrigal
Timothy Kareem Smedley
Distribution of points
E=Total Environmental Score, ESA=Environmental Sector Average Score, EI=Environmental Intent, ER=Environmental Reporting, EP=Environmental Performance, S=Total Social Score, SSA=Social Sector Average Score, SI=Social Intent, SR=Social Reporting, SP=Social Performance
EI ER EP SI SR SP
University of Texas-Austin
75
260
63
3311
Analyst(s):
Environmental Intent
Question Category Max Score General CommentScore %Accountability 4 Excellent4 100
College Sector Specific Indicator 2 Excellent2 100
Management 8 Needs improvement3 38
Policy 10 Good7 70
The College Sustainability Report Card Criteria 4 Excellent4 100
Vision 4 Excellent4 100
Environmental Reporting
Question Category Max Score General CommentScore %Emissions to Air 7 Good4 57
Energy 14 Good8 57
Management 42 Needs substantial improvement2 5
Materials Usage 21 Needs substantial improvement1 5
Recycling 14 Good7 50
Waste 28 Needs substantial improvement3 11
Water 7 Needs substantial improvement0 0
Social Intent
Question Category Max Score General CommentScore %Accountability 4 Good2 50
Management 6 Good4 67
Policy 6 Excellent5 83
Social Demographic 2 Excellent2 100
The College Sustainability Report Card Criteria 8 Needs improvement2 25
Vision 4 Excellent4 100
Social Reporting
Question Category Max Score General CommentScore %Human Rights 56 Needs substantial improvement10 18
Qualitative Social 42 Needs improvement20 48
Quantitative Social 35 Needs substantial improvement3 9
www.roberts.cmc.edu 70 Sustainability Reporting of the Top U.S. Universities

University of Virginia
0 2 5 5 0 7 5
SSA
SESA
E
The University of Virginia has positioned itself as one of the university leaders in environmental and social leadership and has undertaken numerous initiatives to leave a lasting impression on its students, employees, staff, and community members. The University has officially addressed land use, natural habitat and biodiversity, transportation, green building, healthy dining, energy usage, water usage, and recycling. Also, the University has an official LEED green building plan to retrofit and construct new buildings according to LEED requirements. However, despite its comprehensive environmental plan, the University of Virginia does not provide numerical performance data and goals on its web pages, which would greatly improve them. From the standpoint of the PSI score, the University would benefit from inclusion of workforce profiles such as gender, age, and race.
S43%
E5 7 %
University of Virginia 2010 Web Pages
Comparison with sector averages Source of points
B-
Kristin Almaz Dessie
Ryan Anderson
Distribution of points
E=Total Environmental Score, ESA=Environmental Sector Average Score, EI=Environmental Intent, ER=Environmental Reporting, EP=Environmental Performance, S=Total Social Score, SSA=Social Sector Average Score, SI=Social Intent, SR=Social Reporting, SP=Social Performance
EI ER EP SI SR SP
University of Virginia
78
35
5
4430
11
Analyst(s):
Environmental Intent
Question Category Max Score General CommentScore %Accountability 4 Excellent3 75
College Sector Specific Indicator 2 Excellent2 100
Management 8 Excellent6 75
Policy 10 Good7 70
The College Sustainability Report Card Criteria 4 Excellent4 100
Vision 4 Excellent3 75
Environmental Reporting
Question Category Max Score General CommentScore %Emissions to Air 7 Needs improvement2 29
Energy 14 Needs improvement5 36
Management 42 Needs improvement11 26
Materials Usage 21 Needs improvement8 38
Recycling 14 Needs substantial improvement3 21
Waste 28 Needs substantial improvement2 7
Water 7 Good4 57
Social Intent
Question Category Max Score General CommentScore %Accountability 4 Good2 50
Management 10 Needs improvement4 40
Policy 6 Good3 50
Social Demographic 2 Excellent2 100
The College Sustainability Report Card Criteria 8 Good4 50
Vision 4 Needs substantial improvement0 0
Social Reporting
Question Category Max Score General CommentScore %Human Rights 77 Needs improvement24 31
Management 7 Needs substantial improvement0 0
Qualitative Social 35 Needs improvement15 43
Quantitative Social 42 Needs substantial improvement1 2
www.roberts.cmc.edu 71 Sustainability Reporting of the Top U.S. Universities
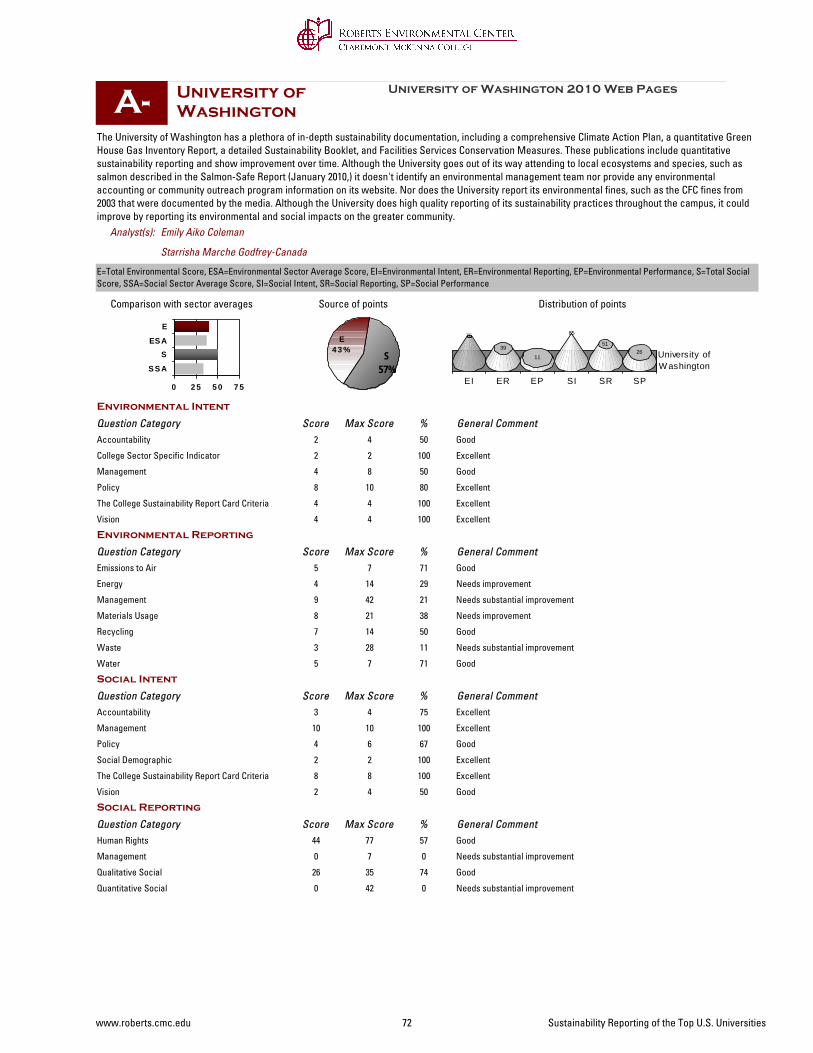
University of Washington
0 2 5 5 0 7 5
SSA
SESA
E
The University of Washington has a plethora of in-depth sustainability documentation, including a comprehensive Climate Action Plan, a quantitative Green House Gas Inventory Report, a detailed Sustainability Booklet, and Facilities Services Conservation Measures. These publications include quantitative sustainability reporting and show improvement over time. Although the University goes out of its way attending to local ecosystems and species, such as salmon described in the Salmon-Safe Report (January 2010,) it doesn't identify an environmental management team nor provide any environmental accounting or community outreach program information on its website. Nor does the University report its environmental fines, such as the CFC fines from 2003 that were documented by the media. Although the University does high quality reporting of its sustainability practices throughout the campus, it could improve by reporting its environmental and social impacts on the greater community.
S57%
E4 3 %
University of Washington 2010 Web Pages
Comparison with sector averages Source of points
A-
Starrisha Marche Godfrey-Canada
Emily Aiko Coleman
Distribution of points
E=Total Environmental Score, ESA=Environmental Sector Average Score, EI=Environmental Intent, ER=Environmental Reporting, EP=Environmental Performance, S=Total Social Score, SSA=Social Sector Average Score, SI=Social Intent, SR=Social Reporting, SP=Social Performance
EI ER EP SI SR SP
University ofW ashington
75
39
11
85
5126
Analyst(s):
Environmental Intent
Question Category Max Score General CommentScore %Accountability 4 Good2 50
College Sector Specific Indicator 2 Excellent2 100
Management 8 Good4 50
Policy 10 Excellent8 80
The College Sustainability Report Card Criteria 4 Excellent4 100
Vision 4 Excellent4 100
Environmental Reporting
Question Category Max Score General CommentScore %Emissions to Air 7 Good5 71
Energy 14 Needs improvement4 29
Management 42 Needs substantial improvement9 21
Materials Usage 21 Needs improvement8 38
Recycling 14 Good7 50
Waste 28 Needs substantial improvement3 11
Water 7 Good5 71
Social Intent
Question Category Max Score General CommentScore %Accountability 4 Excellent3 75
Management 10 Excellent10 100
Policy 6 Good4 67
Social Demographic 2 Excellent2 100
The College Sustainability Report Card Criteria 8 Excellent8 100
Vision 4 Good2 50
Social Reporting
Question Category Max Score General CommentScore %Human Rights 77 Good44 57
Management 7 Needs substantial improvement0 0
Qualitative Social 35 Good26 74
Quantitative Social 42 Needs substantial improvement0 0
www.roberts.cmc.edu 72 Sustainability Reporting of the Top U.S. Universities
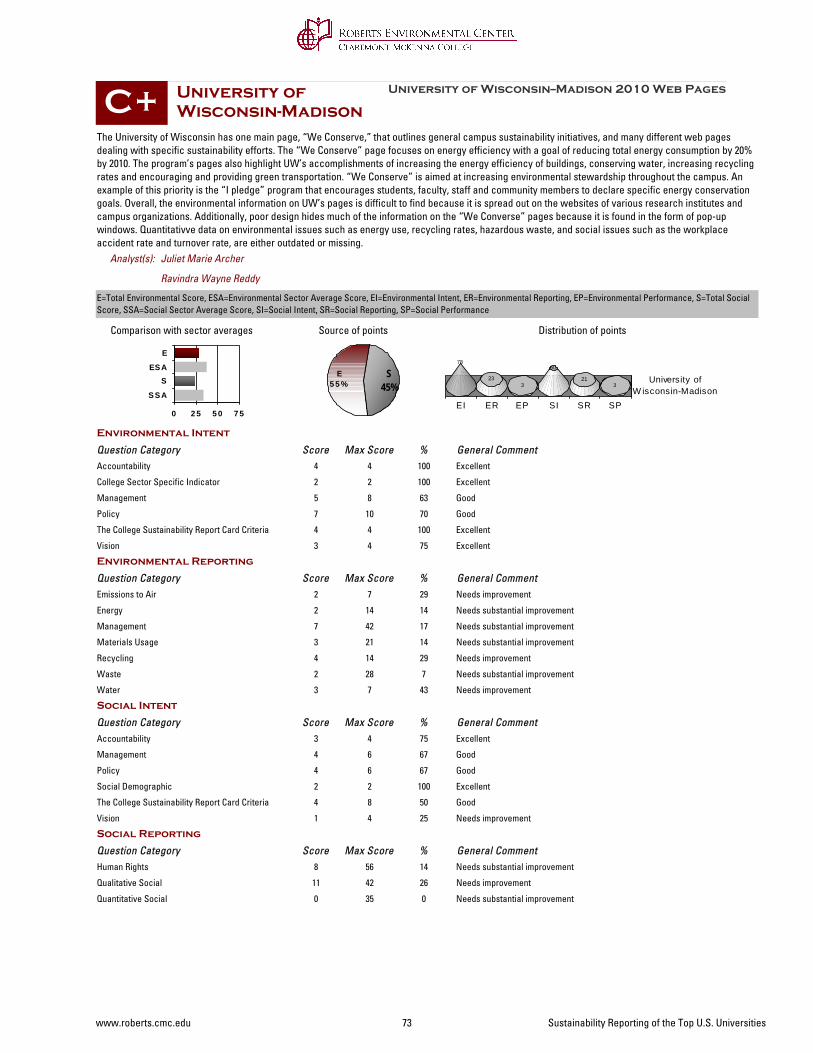
University of Wisconsin-Madison
0 2 5 5 0 7 5
SSA
SESA
E
The University of Wisconsin has one main page, “We Conserve,” that outlines general campus sustainability initiatives, and many different web pages dealing with specific sustainability efforts. The “We Conserve” page focuses on energy efficiency with a goal of reducing total energy consumption by 20% by 2010. The program’s pages also highlight UW’s accomplishments of increasing the energy efficiency of buildings, conserving water, increasing recycling rates and encouraging and providing green transportation. “We Conserve” is aimed at increasing environmental stewardship throughout the campus. An example of this priority is the “I pledge” program that encourages students, faculty, staff and community members to declare specific energy conservation goals. Overall, the environmental information on UW’s pages is difficult to find because it is spread out on the websites of various research institutes and campus organizations. Additionally, poor design hides much of the information on the “We Converse” pages because it is found in the form of pop-up windows. Quantitativve data on environmental issues such as energy use, recycling rates, hazardous waste, and social issues such as the workplace accident rate and turnover rate, are either outdated or missing.
S45%
E5 5 %
University of Wisconsin--Madison 2010 Web Pages
Comparison with sector averages Source of points
C+
Ravindra Wayne Reddy
Juliet Marie Archer
Distribution of points
E=Total Environmental Score, ESA=Environmental Sector Average Score, EI=Environmental Intent, ER=Environmental Reporting, EP=Environmental Performance, S=Total Social Score, SSA=Social Sector Average Score, SI=Social Intent, SR=Social Reporting, SP=Social Performance
EI ER EP SI SR SP
University ofW isconsin-Madison
78
233
60
213
Analyst(s):
Environmental Intent
Question Category Max Score General CommentScore %Accountability 4 Excellent4 100
College Sector Specific Indicator 2 Excellent2 100
Management 8 Good5 63
Policy 10 Good7 70
The College Sustainability Report Card Criteria 4 Excellent4 100
Vision 4 Excellent3 75
Environmental Reporting
Question Category Max Score General CommentScore %Emissions to Air 7 Needs improvement2 29
Energy 14 Needs substantial improvement2 14
Management 42 Needs substantial improvement7 17
Materials Usage 21 Needs substantial improvement3 14
Recycling 14 Needs improvement4 29
Waste 28 Needs substantial improvement2 7
Water 7 Needs improvement3 43
Social Intent
Question Category Max Score General CommentScore %Accountability 4 Excellent3 75
Management 6 Good4 67
Policy 6 Good4 67
Social Demographic 2 Excellent2 100
The College Sustainability Report Card Criteria 8 Good4 50
Vision 4 Needs improvement1 25
Social Reporting
Question Category Max Score General CommentScore %Human Rights 56 Needs substantial improvement8 14
Qualitative Social 42 Needs improvement11 26
Quantitative Social 35 Needs substantial improvement0 0
www.roberts.cmc.edu 73 Sustainability Reporting of the Top U.S. Universities
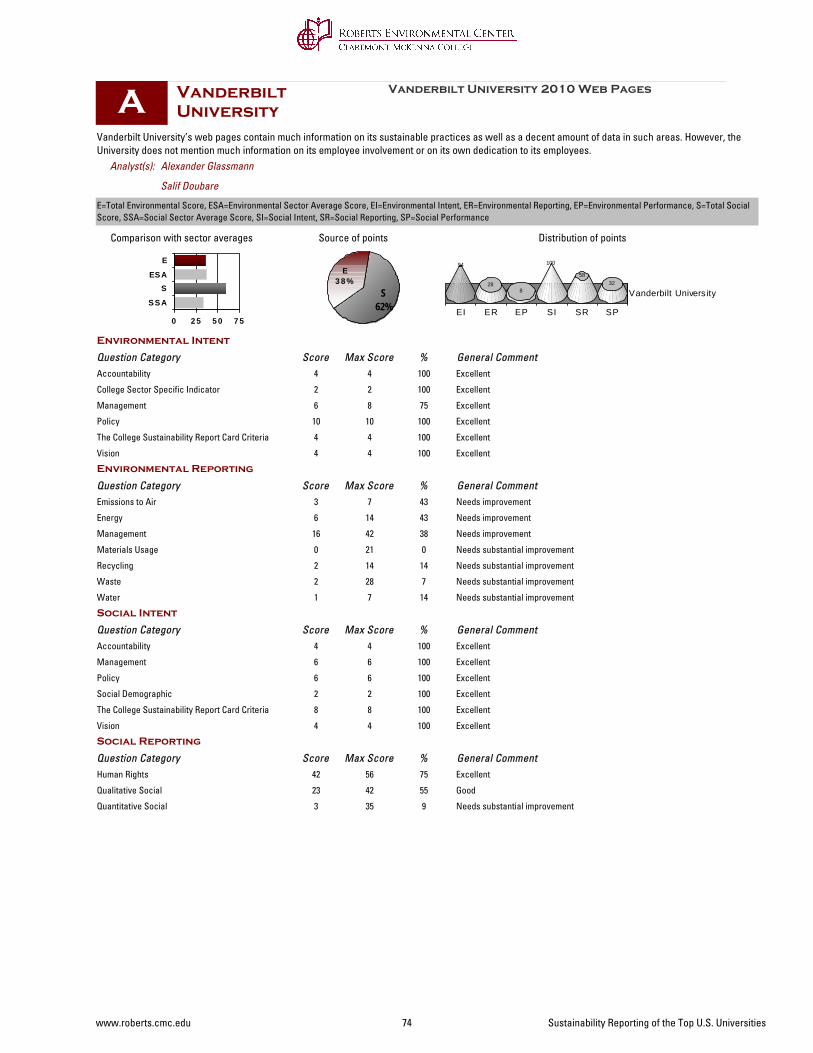
Vanderbilt University
0 2 5 5 0 7 5
SSA
SESA
E
Vanderbilt University’s web pages contain much information on its sustainable practices as well as a decent amount of data in such areas. However, the University does not mention much information on its employee involvement or on its own dedication to its employees.
S62%
E3 8 %
Vanderbilt University 2010 Web Pages
Comparison with sector averages Source of points
A
Salif Doubare
Alexander Glassmann
Distribution of points
E=Total Environmental Score, ESA=Environmental Sector Average Score, EI=Environmental Intent, ER=Environmental Reporting, EP=Environmental Performance, S=Total Social Score, SSA=Social Sector Average Score, SI=Social Intent, SR=Social Reporting, SP=Social Performance
EI ER EP SI SR SP
Vanderbilt University
94
288
100
5832
Analyst(s):
Environmental Intent
Question Category Max Score General CommentScore %Accountability 4 Excellent4 100
College Sector Specific Indicator 2 Excellent2 100
Management 8 Excellent6 75
Policy 10 Excellent10 100
The College Sustainability Report Card Criteria 4 Excellent4 100
Vision 4 Excellent4 100
Environmental Reporting
Question Category Max Score General CommentScore %Emissions to Air 7 Needs improvement3 43
Energy 14 Needs improvement6 43
Management 42 Needs improvement16 38
Materials Usage 21 Needs substantial improvement0 0
Recycling 14 Needs substantial improvement2 14
Waste 28 Needs substantial improvement2 7
Water 7 Needs substantial improvement1 14
Social Intent
Question Category Max Score General CommentScore %Accountability 4 Excellent4 100
Management 6 Excellent6 100
Policy 6 Excellent6 100
Social Demographic 2 Excellent2 100
The College Sustainability Report Card Criteria 8 Excellent8 100
Vision 4 Excellent4 100
Social Reporting
Question Category Max Score General CommentScore %Human Rights 56 Excellent42 75
Qualitative Social 42 Good23 55
Quantitative Social 35 Needs substantial improvement3 9
www.roberts.cmc.edu 74 Sustainability Reporting of the Top U.S. Universities
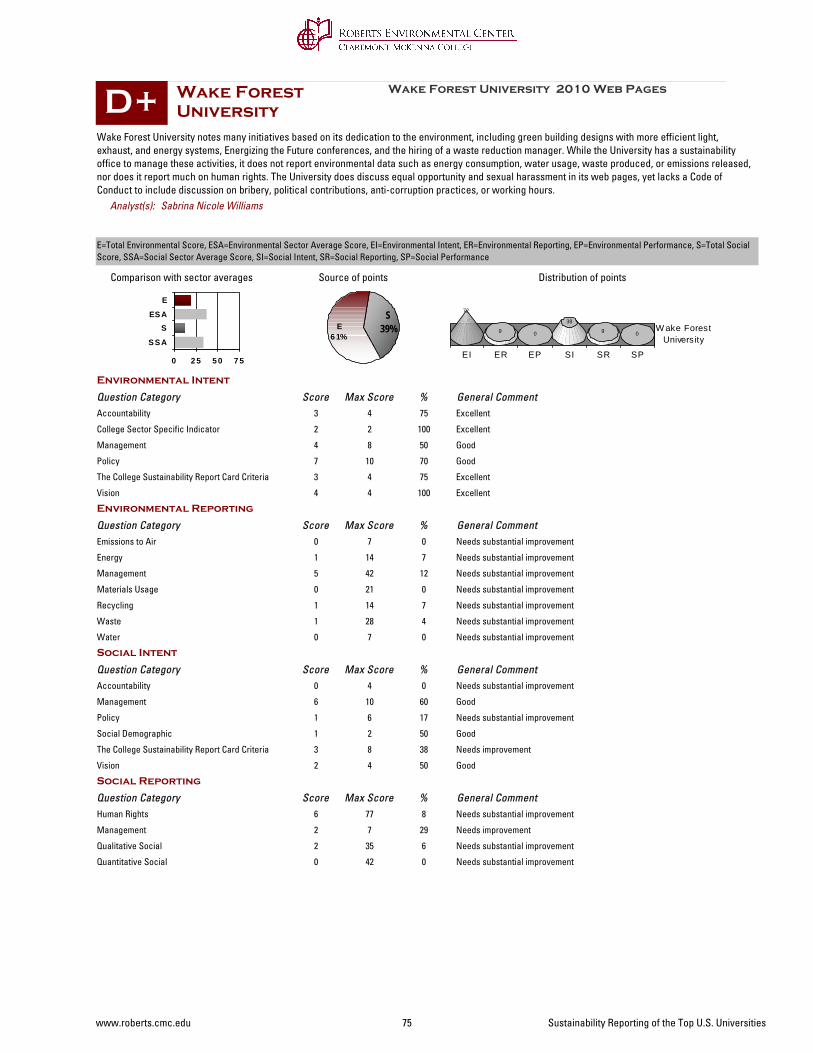
Wake Forest University
0 2 5 5 0 7 5
SSA
SESA
E
Wake Forest University notes many initiatives based on its dedication to the environment, including green building designs with more efficient light, exhaust, and energy systems, Energizing the Future conferences, and the hiring of a waste reduction manager. While the University has a sustainability office to manage these activities, it does not report environmental data such as energy consumption, water usage, waste produced, or emissions released, nor does it report much on human rights. The University does discuss equal opportunity and sexual harassment in its web pages, yet lacks a Code of Conduct to include discussion on bribery, political contributions, anti-corruption practices, or working hours.
S39%E
6 1%
Wake Forest University 2010 Web Pages
Comparison with sector averages Source of points
D+
Sabrina Nicole Williams
Distribution of points
E=Total Environmental Score, ESA=Environmental Sector Average Score, EI=Environmental Intent, ER=Environmental Reporting, EP=Environmental Performance, S=Total Social Score, SSA=Social Sector Average Score, SI=Social Intent, SR=Social Reporting, SP=Social Performance
EI ER EP SI SR SP
W ake ForestUniversity
72
9 0
38
9 0
Analyst(s):
Environmental Intent
Question Category Max Score General CommentScore %Accountability 4 Excellent3 75
College Sector Specific Indicator 2 Excellent2 100
Management 8 Good4 50
Policy 10 Good7 70
The College Sustainability Report Card Criteria 4 Excellent3 75
Vision 4 Excellent4 100
Environmental Reporting
Question Category Max Score General CommentScore %Emissions to Air 7 Needs substantial improvement0 0
Energy 14 Needs substantial improvement1 7
Management 42 Needs substantial improvement5 12
Materials Usage 21 Needs substantial improvement0 0
Recycling 14 Needs substantial improvement1 7
Waste 28 Needs substantial improvement1 4
Water 7 Needs substantial improvement0 0
Social Intent
Question Category Max Score General CommentScore %Accountability 4 Needs substantial improvement0 0
Management 10 Good6 60
Policy 6 Needs substantial improvement1 17
Social Demographic 2 Good1 50
The College Sustainability Report Card Criteria 8 Needs improvement3 38
Vision 4 Good2 50
Social Reporting
Question Category Max Score General CommentScore %Human Rights 77 Needs substantial improvement6 8
Management 7 Needs improvement2 29
Qualitative Social 35 Needs substantial improvement2 6
Quantitative Social 42 Needs substantial improvement0 0
www.roberts.cmc.edu 75 Sustainability Reporting of the Top U.S. Universities
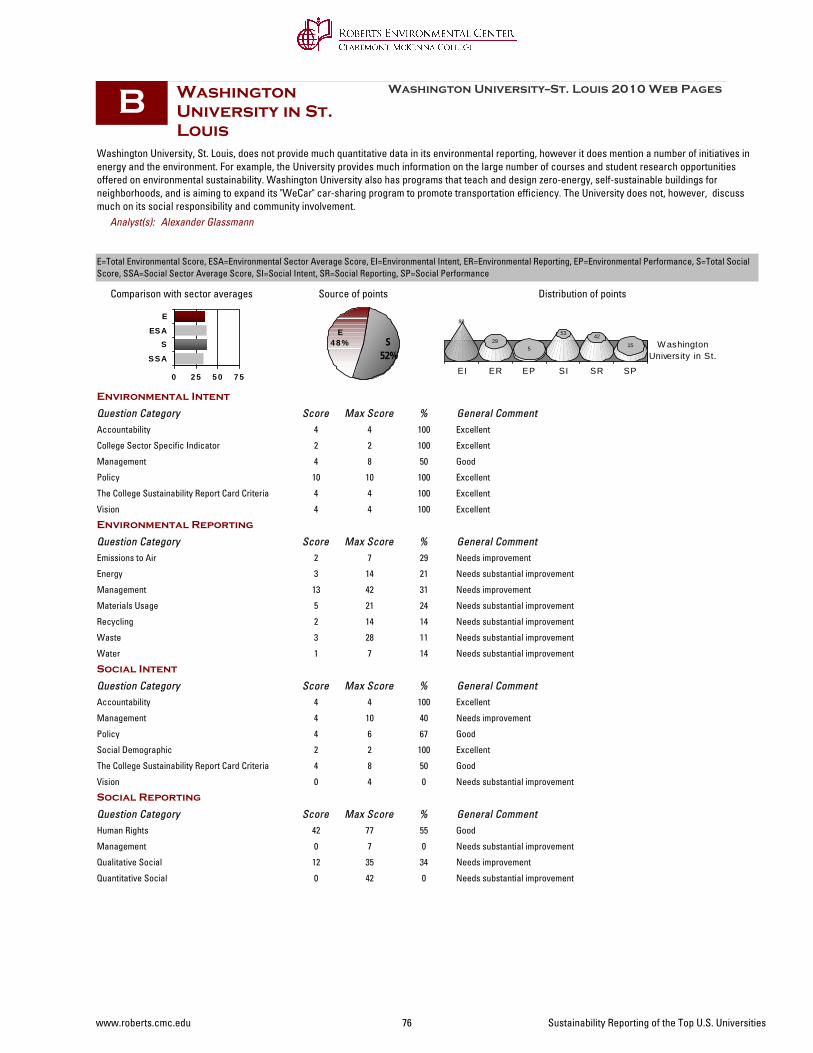
Washington University in St. Louis
0 2 5 5 0 7 5
SSA
SESA
E
Washington University, St. Louis, does not provide much quantitative data in its environmental reporting, however it does mention a number of initiatives in energy and the environment. For example, the University provides much information on the large number of courses and student research opportunities offered on environmental sustainability. Washington University also has programs that teach and design zero-energy, self-sustainable buildings for neighborhoods, and is aiming to expand its "WeCar" car-sharing program to promote transportation efficiency. The University does not, however, discuss much on its social responsibility and community involvement.
S52%
E4 8 %
Washington University--St. Louis 2010 Web Pages
Comparison with sector averages Source of points
B
Alexander Glassmann
Distribution of points
E=Total Environmental Score, ESA=Environmental Sector Average Score, EI=Environmental Intent, ER=Environmental Reporting, EP=Environmental Performance, S=Total Social Score, SSA=Social Sector Average Score, SI=Social Intent, SR=Social Reporting, SP=Social Performance
EI ER EP SI SR SP
W ashingtonUniversity in St.
88
295
53 4215
Analyst(s):
Environmental Intent
Question Category Max Score General CommentScore %Accountability 4 Excellent4 100
College Sector Specific Indicator 2 Excellent2 100
Management 8 Good4 50
Policy 10 Excellent10 100
The College Sustainability Report Card Criteria 4 Excellent4 100
Vision 4 Excellent4 100
Environmental Reporting
Question Category Max Score General CommentScore %Emissions to Air 7 Needs improvement2 29
Energy 14 Needs substantial improvement3 21
Management 42 Needs improvement13 31
Materials Usage 21 Needs substantial improvement5 24
Recycling 14 Needs substantial improvement2 14
Waste 28 Needs substantial improvement3 11
Water 7 Needs substantial improvement1 14
Social Intent
Question Category Max Score General CommentScore %Accountability 4 Excellent4 100
Management 10 Needs improvement4 40
Policy 6 Good4 67
Social Demographic 2 Excellent2 100
The College Sustainability Report Card Criteria 8 Good4 50
Vision 4 Needs substantial improvement0 0
Social Reporting
Question Category Max Score General CommentScore %Human Rights 77 Good42 55
Management 7 Needs substantial improvement0 0
Qualitative Social 35 Needs improvement12 34
Quantitative Social 42 Needs substantial improvement0 0
www.roberts.cmc.edu 76 Sustainability Reporting of the Top U.S. Universities
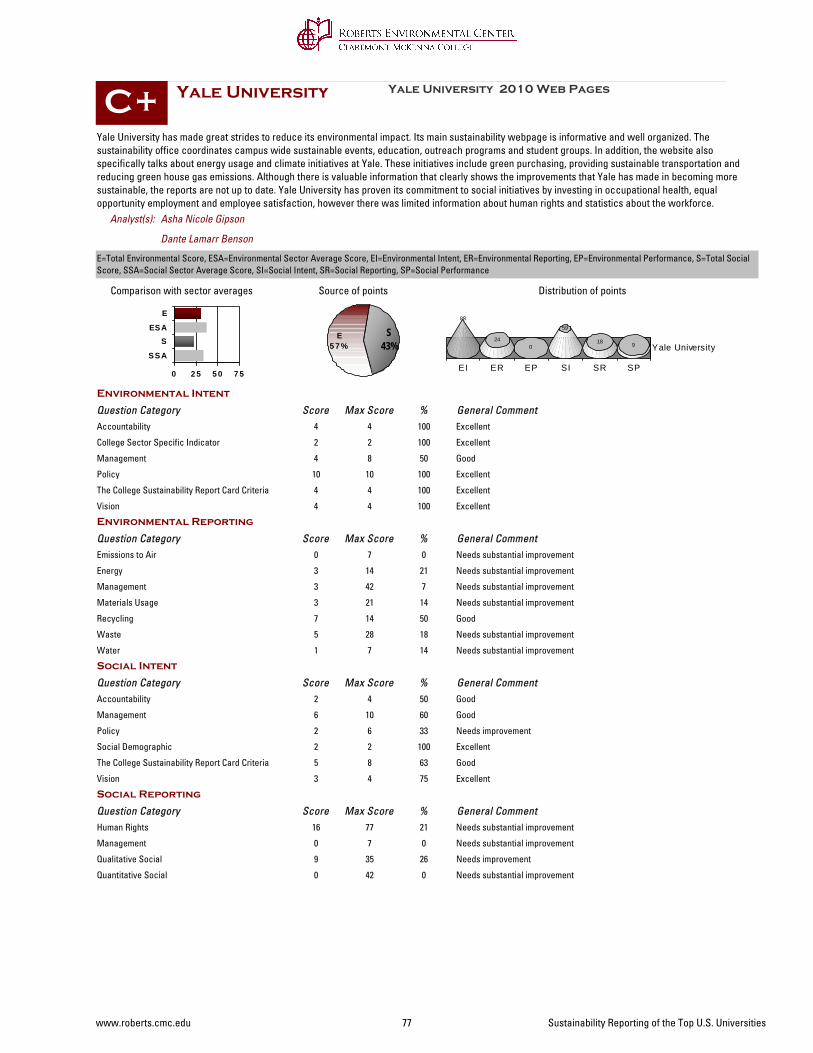
Yale University
0 2 5 5 0 7 5
SSA
SESA
E
Yale University has made great strides to reduce its environmental impact. Its main sustainability webpage is informative and well organized. The sustainability office coordinates campus wide sustainable events, education, outreach programs and student groups. In addition, the website also specifically talks about energy usage and climate initiatives at Yale. These initiatives include green purchasing, providing sustainable transportation and reducing green house gas emissions. Although there is valuable information that clearly shows the improvements that Yale has made in becoming more sustainable, the reports are not up to date. Yale University has proven its commitment to social initiatives by investing in occupational health, equal opportunity employment and employee satisfaction, however there was limited information about human rights and statistics about the workforce.
S43%
E5 7 %
Yale University 2010 Web Pages
Comparison with sector averages Source of points
C+
Dante Lamarr Benson
Asha Nicole Gipson
Distribution of points
E=Total Environmental Score, ESA=Environmental Sector Average Score, EI=Environmental Intent, ER=Environmental Reporting, EP=Environmental Performance, S=Total Social Score, SSA=Social Sector Average Score, SI=Social Intent, SR=Social Reporting, SP=Social Performance
EI ER EP SI SR SP
Yale University
88
240
59
18 9
Analyst(s):
Environmental Intent
Question Category Max Score General CommentScore %Accountability 4 Excellent4 100
College Sector Specific Indicator 2 Excellent2 100
Management 8 Good4 50
Policy 10 Excellent10 100
The College Sustainability Report Card Criteria 4 Excellent4 100
Vision 4 Excellent4 100
Environmental Reporting
Question Category Max Score General CommentScore %Emissions to Air 7 Needs substantial improvement0 0
Energy 14 Needs substantial improvement3 21
Management 42 Needs substantial improvement3 7
Materials Usage 21 Needs substantial improvement3 14
Recycling 14 Good7 50
Waste 28 Needs substantial improvement5 18
Water 7 Needs substantial improvement1 14
Social Intent
Question Category Max Score General CommentScore %Accountability 4 Good2 50
Management 10 Good6 60
Policy 6 Needs improvement2 33
Social Demographic 2 Excellent2 100
The College Sustainability Report Card Criteria 8 Good5 63
Vision 4 Excellent3 75
Social Reporting
Question Category Max Score General CommentScore %Human Rights 77 Needs substantial improvement16 21
Management 7 Needs substantial improvement0 0
Qualitative Social 35 Needs improvement9 26
Quantitative Social 42 Needs substantial improvement0 0
www.roberts.cmc.edu 77 Sustainability Reporting of the Top U.S. Universities
Top 50 National UniversitiesEnvironmental visionary statement-Discussion: includes a clear visionary statement expressing an organizational commitment to good environmental performance. -Initiatives/actions: include measures to fulfill that commitment.
5
DiscussionInitiatives/actions
Discussion Pg#
Initiatives Pg#
Environmental impediments and challenges-Discussion: of impediments and challenges faced by the organization in attempting to realize its environmental vision and commitments.-Initiatives/actions: include measures to overcome them.
6
DiscussionInitiatives/actions
Discussion Pg#
Initiatives Pg#
Social visionary statement -Discussion: includes a clear visionary statement expressing an organizational commitment to good social performance.-Initiatives/actions: include measures taken to fulfill that commitment.
42
DiscussionInitiatives/actions
Discussion Pg#
Initiatives Pg#
Social impediments and challengesDiscussion: of impediments and challenges faced by the organization in attempting to realize its social vision and commitments.Initiatives/actions: include measures taken to overcome them.
43
DiscussionInitiatives/actions
Discussion Pg#
Initiatives Pg#
Environmental policy statement-Discussion: includes a formal statement of the organization's environmental policy or plan.-Initiatives/actions: include a description of how the policy is being implemented.
9
DiscussionInitiatives/actions
Discussion Pg#
Initiatives Pg#
Social policy statement -Discussion: includes a formal statement of the company's social policy or plan.-Initiatives/actions: include a description of how the policy is being implemented.
45
DiscussionInitiatives/actions
Discussion Pg#
Initiatives Pg#
Report contact person-Discussion: identifies the person specifically designated to answer questions about the report or sustainability issues. Investor relations or public relations contact representatives are not valid contacts for this question. -Initiatives/actions: to facilitate such contact, i.e. providing email address, phone number, or a link for feedback and questions.
4
DiscussionInitiatives/actions
Discussion Pg#
Initiatives Pg#
Environmental management structure-Discussion: of the organization's environmental management structure or staffing.-Initiatives/actions: include identification of individuals currently holding the staff positions.
19
DiscussionInitiatives/actions
Discussion Pg#
Initiatives Pg#
Environmental management system-Discussion: includes a statement of adoption of ISO 14001 or other formal environmental management system. -Initiatives/actions: include information on the extent to which the system has been implemented.
20
DiscussionInitiatives/actions
Discussion Pg#
Initiatives Pg#
Health and safety, or social organizational structure-Discussion: of organizational structure or staffing for ensuring health and safety or social responsibility.-Initiatives/actions: include identification of the individuals currently holding the staff positions.
51
DiscussionInitiatives/actions
Discussion Pg#
Initiatives Pg#
Stakeholder consultation-Discussion: of consultation and dialogue with stakeholders about the organization's environmental aspects or impacts.-Initiatives/actions: include identification of specific consultation activities.
23
DiscussionInitiatives/actions
Discussion Pg#
Initiatives Pg#
Student involvement-Discussion: of student participation in sustainability initiatives.-Initiatives/Actions: taken by administrators or student groups, to encourage such activities.
292
DiscussionInitiatives/actions
Discussion Pg#
Initiatives Pg#
Shareholder engagement-Discussion: of whether investments include the opportunity for shareholder proxy voting (as would direct investment in specific corporate stock,) and whether students, faculty, or alumni can participate in such decisions.-Initiatives/Actions: taken to allow some level of such participation.
296
DiscussionInitiatives/actions
Discussion Pg#
Initiatives Pg#
Environmental education-Discussion: of efforts to promote environmental education and awareness of employees, the general public, or children.-Initiatives/actions: taken to provide such education.
16
DiscussionInitiatives/actions
Discussion Pg#
Initiatives Pg#
Environmental accounting-Discussion: of environmental expenditures.-Initiatives/actions: include detailed accounting of such expenditures.
21
DiscussionInitiatives/actions
Discussion Pg#
Initiatives Pg#
Third-party validation-Discussion: of the value (or lack thereof) of third-party auditing or validation. -Initiatives/actions: include formal auditing or validation by a qualified external third-party source.
54
DiscussionInitiatives/actions
Discussion Pg#
Initiatives Pg#
www.roberts.cmc.edu 78 Sustainability Reporting of the Top U.S. Universities
Top 50 National UniversitiesEndowment transparencyDiscussion: of accessibility to endowment investment information and shareholder proxy voting records by students, faculty, alumni, or the public at large.-Initiatives/Actions: taken to provide accessibility to such information.
294
DiscussionInitiatives/actions
Discussion Pg#
Initiatives Pg#
Investment priorities-Discussion: of consideration of socially responsible investing, such as in renewable energy funds or community development loan funds.-Initiatives/Actions: taken to make such investments.
295
DiscussionInitiatives/actions
Discussion Pg#
Initiatives Pg#
Climate change/global warming-Discussion: of the organization's position on climate change and/or global warming.-Initiatives/actions: include measures taken by the organization to decrease its contribution to climate change.
10
DiscussionInitiatives/actions
Discussion Pg#
Initiatives Pg#
Habitat/ecosystem conservation-Discussion: of the organization's position on conserving natural ecosystems and habitat.-Initiatives/actions: taken to increase conservation of natural ecosystems either associated with or separate from the organization's business activities.
11
DiscussionInitiatives/actions
Discussion Pg#
Initiatives Pg#
Biodiversity-Discussion: of the organization's position on biodiversity.-Initiatives/actions: taken by to the organization to foster biodiversity.
12
DiscussionInitiatives/actions
Discussion Pg#
Initiatives Pg#
Green purchasing-Discussion: about preferential purchasing of eco-friendly (non-polluting, recycled, recyclable, etc.) products.-Initiatives/actions: taken to implement such purchasing.
13
DiscussionInitiatives/actions
Discussion Pg#
Initiatives Pg#
Supplier screening based on social or environmental performance/ supplier management-Discussion: or description of procedures to evaluate and select suppliers on their ability to meet the requirements of the company's social or environmental policy and principles.-Initiatives/actions: include measures to implement or assure such screening or selection.
49
DiscussionInitiatives/actions
Discussion Pg#
Initiatives Pg#
Green building-Discussion: of campus-wide green building guidelines and green building design for new and existing buildings.-Initiatives/Actions: taken to implement such design principles, such as adopting LEED standards.
291
DiscussionInitiatives/actions
Discussion Pg#
Initiatives Pg#
Food & recycling-Discussion: of dining services policies about any aspect of recycling paper and utensils, redistributing excess food, or composting waste food.-Initiatives/Actions: taken to implement these policies.
290
DiscussionInitiatives/actions
Discussion Pg#
Initiatives Pg#
Dormitory/classroom waste recycling-Discussion: of recyling of paper, cardboard, glass, or plastic in the dormitories or classrooms.-Initiatives/Actions: taken to implement such recycling.
297
DiscussionInitiatives/actions
Discussion Pg#
Initiatives Pg#
Workforce profile: ethnicities/race-Discussion: of racial or ethnic distribution of workforce.-Initiatives/actions: taken to avoid racial or ethnic discrimination.
17
DiscussionInitiatives/actions
Discussion Pg#
Initiatives Pg#
Workforce profile: gender-Discussion: of gender distribution of workforce.-Initiatives/actions: taken to avoid gender discrimination and achieve appropriate balance
18
DiscussionInitiatives/actions
Discussion Pg#
Initiatives Pg#
Workforce profile: age-Discussion: of age distribution of workforce.-Initiatives/actions: include measures taken to avoid age discrimination or to encourage a balanced age structure.
52
DiscussionInitiatives/actions
Discussion Pg#
Initiatives Pg#
Employment for individuals with disabilities-Discussion: of appropriate actions to accommodate employees with disabilities.-Initiatives/actions: taken to implement such accommodations.
80
DiscussionInitiatives/actions
Discussion Pg#
Initiatives Pg#
Emergency preparedness program-Discussion: of emergency preparedness programs to prepare employees or the public to cope with potential emergencies at the organization's facilities.-Initiatives/actions: include measures taken to implement such programs.
53
DiscussionInitiatives/actions
Discussion Pg#
Initiatives Pg#
www.roberts.cmc.edu 79 Sustainability Reporting of the Top U.S. Universities
Top 50 National UniversitiesEmployee training for career development-Discussion: of training, skills and learning programs appropriate to support employees' upward mobility.-Initiatives/actions: taken to implement such training.
82
DiscussionInitiatives/actions
Discussion Pg#
Initiatives Pg#
Code of conduct or business ethics-Discussion: includes a formal organizational code of conduct or of ethical behavior.-Initiatives/actions: include measures to assure that the code of conduct is followed.
47
DiscussionInitiatives/actions
Discussion Pg#
Initiatives Pg#
Green spaceAmount of land that is kept as "green space" in contrast to paved or developed areas.
165
Discussion Discussion Pg#:Context Pg#:
Goal Pg#:Quant Pg#:
Prev Quan Pg#:Improve Pg#
Year Data Values Units
ContextGoalCurrent Period Quantitative DataPrevious Quantitative DataImprovement Over Previous
Pesticides usedAmount of pesticides used for landscaping or crop production.
161
Discussion Discussion Pg#:Context Pg#:
Goal Pg#:Quant Pg#:
Prev Quan Pg#:Improve Pg#
Year Data Values Units
ContextGoalCurrent Period Quantitative DataPrevious Quantitative DataImprovement Over Previous
Fertilizer usedAmount of fertilizer used for landscaping or agricultural purposes
162
Discussion Discussion Pg#:Context Pg#:
Goal Pg#:Quant Pg#:
Prev Quan Pg#:Improve Pg#
Year Data Values Units
ContextGoalCurrent Period Quantitative DataPrevious Quantitative DataImprovement Over Previous
Energy used (total)Sum of the energy used by the organization in all different forms, including electricity, fuel, natural gas and others.
26
Discussion Discussion Pg#:Context Pg#:
Goal Pg#:Quant Pg#:
Prev Quan Pg#:Improve Pg#
Year Data Values Units
ContextGoalCurrent Period Quantitative DataPrevious Quantitative DataImprovement Over Previous
Energy used (renewable)Energy used from renewable sources such as wind, solar, hydroelectric, or other renewable sources.
27
Discussion Discussion Pg#:Context Pg#:
Goal Pg#:Quant Pg#:
Prev Quan Pg#:Improve Pg#
Year Data Values Units
ContextGoalCurrent Period Quantitative DataPrevious Quantitative DataImprovement Over Previous
www.roberts.cmc.edu 80 Sustainability Reporting of the Top U.S. Universities
Top 50 National UniversitiesWaste recycled: solid wasteSum of all solid waste recycled, including hazardous waste.
30
Discussion Discussion Pg#:Context Pg#:
Goal Pg#:Quant Pg#:
Prev Quan Pg#:Improve Pg#
Year Data Values Units
ContextGoalCurrent Period Quantitative DataPrevious Quantitative DataImprovement Over Previous
Waste (office) recycledOffice recycling of paper, cardboard, metal, or plastic.
32
Discussion Discussion Pg#:Context Pg#:
Goal Pg#:Quant Pg#:
Prev Quan Pg#:Improve Pg#
Year Data Values Units
ContextGoalCurrent Period Quantitative DataPrevious Quantitative DataImprovement Over Previous
Waste (solid) disposed ofIncludes solid hazardous and non-hazardous waste landfilled, incinerated, or transferred.
34
Discussion Discussion Pg#:Context Pg#:
Goal Pg#:Quant Pg#:
Prev Quan Pg#:Improve Pg#
Year Data Values Units
ContextGoalCurrent Period Quantitative DataPrevious Quantitative DataImprovement Over Previous
Waste (hazardous) producedSum of all hazardous materials remaining after production, irrespective of final disposition. Hazardous wastes include items identified as TRI, PRTR, HAP (Hazardous Air Pollutants), and similar indices, and may include mercury or lead. Depending on the nationality of the organization, this could be labeled "TRI" (Toxic Release Inventory,) "substance releases" , or something else.
35
Discussion Discussion Pg#:Context Pg#:
Goal Pg#:Quant Pg#:
Prev Quan Pg#:Improve Pg#
Year Data Values Units
ContextGoalCurrent Period Quantitative DataPrevious Quantitative DataImprovement Over Previous
Waste (hazardous) released to the environmentAmounts of hazardous materials released into the environment, total (TRI, PRTR, HAP (Hazardous Air Pollutants), and similar indices), may include mercury or lead. Depending on the nationality of the organization, this could be labeled "TRI" (Toxic Release Inventory), "substance releases," or something else.
37
Discussion Discussion Pg#:Context Pg#:
Goal Pg#:Quant Pg#:
Prev Quan Pg#:Improve Pg#
Year Data Values Units
ContextGoalCurrent Period Quantitative DataPrevious Quantitative DataImprovement Over Previous
Water usedSum of all water used during operations.
29
Discussion Discussion Pg#:Context Pg#:
Goal Pg#:Quant Pg#:
Prev Quan Pg#:Improve Pg#
Year Data Values Units
ContextGoalCurrent Period Quantitative DataPrevious Quantitative DataImprovement Over Previous
www.roberts.cmc.edu 81 Sustainability Reporting of the Top U.S. Universities
Top 50 National UniversitiesWaste water released to natural water bodiesAmount of waste water released into natural waters.
110
Discussion Discussion Pg#:Context Pg#:
Goal Pg#:Quant Pg#:
Prev Quan Pg#:Improve Pg#
Year Data Values Units
ContextGoalCurrent Period Quantitative DataPrevious Quantitative DataImprovement Over Previous
Greenhouse gases (or CO2 equivalents), totalThe sum of all greenhouse gases released, which could include CO2, CH4 (methane), N2O (nitrous oxide), SF6 (Sulphur hexafluoride), PFCs (Perfluorocarbons) and HFCs (hydrofluorocarbons). The report should label this indicator as "greenhouse gases released", "CO2 Equivalents", or similar.
83
Discussion Discussion Pg#:Context Pg#:
Goal Pg#:Quant Pg#:
Prev Quan Pg#:Improve Pg#
Year Data Values Units
ContextGoalCurrent Period Quantitative DataPrevious Quantitative DataImprovement Over Previous
Employee turnover rateAnnual employee turnover rate.
3
Discussion Discussion Pg#:Context Pg#:
Goal Pg#:Quant Pg#:
Prev Quan Pg#:Improve Pg#
Year Data Values Units
ContextGoalCurrent Period Quantitative DataPrevious Quantitative DataImprovement Over Previous
Recordable incident/accident rateNumber of employee incidents or accidents, such as: “total case incident rate,” “incident rate,” or "accident rate."
74
Discussion Discussion Pg#:Context Pg#:
Goal Pg#:Quant Pg#:
Prev Quan Pg#:Improve Pg#
Year Data Values Units
ContextGoalCurrent Period Quantitative DataPrevious Quantitative DataImprovement Over Previous
Lost workday case rateNumber of employee injuries or illnesses that resulted in one or more lost workdays.
75
Discussion Discussion Pg#:Context Pg#:
Goal Pg#:Quant Pg#:
Prev Quan Pg#:Improve Pg#
Year Data Values Units
ContextGoalCurrent Period Quantitative DataPrevious Quantitative DataImprovement Over Previous
Social community investmentAmount of money spent on community outreach, including education grants, donations, and relief effort funds.
81
Discussion Discussion Pg#:Context Pg#:
Goal Pg#:Quant Pg#:
Prev Quan Pg#:Improve Pg#
Year Data Values Units
ContextGoalCurrent Period Quantitative DataPrevious Quantitative DataImprovement Over Previous
www.roberts.cmc.edu 82 Sustainability Reporting of the Top U.S. Universities
Top 50 National UniversitiesNotices of violation (environmental)Notices of violation (NOVs) for environmental infractions.
38
Discussion Discussion Pg#:Context Pg#:
Goal Pg#:Quant Pg#:
Prev Quan Pg#:Improve Pg#
Year Data Values Units
ContextGoalCurrent Period Quantitative DataPrevious Quantitative DataImprovement Over Previous
Environmental expenses and investmentsAn accounting of money spent or invested specifically to decrease environmental damage or to benefit the environment.
39
Discussion Discussion Pg#:Context Pg#:
Goal Pg#:Quant Pg#:
Prev Quan Pg#:Improve Pg#
Year Data Values Units
ContextGoalCurrent Period Quantitative DataPrevious Quantitative DataImprovement Over Previous
Fines (environmental)Government imposed fines for environmental infractions.
40
Discussion Discussion Pg#:Context Pg#:
Goal Pg#:Quant Pg#:
Prev Quan Pg#:Improve Pg#
Year Data Values Units
ContextGoalCurrent Period Quantitative DataPrevious Quantitative DataImprovement Over Previous
Health and safety citationsNumber of health and safety citations or notices of violation. If it is stated that there were none, check lines 1,2,3, 4, and 6.
76
Discussion Discussion Pg#:Context Pg#:
Goal Pg#:Quant Pg#:
Prev Quan Pg#:Improve Pg#
Year Data Values Units
ContextGoalCurrent Period Quantitative DataPrevious Quantitative DataImprovement Over Previous
Health and safety finesFines levied against a company for health and safety violations.
77
Discussion Discussion Pg#:Context Pg#:
Goal Pg#:Quant Pg#:
Prev Quan Pg#:Improve Pg#
Year Data Values Units
ContextGoalCurrent Period Quantitative DataPrevious Quantitative DataImprovement Over Previous
Emulating best practicesOrganization looks for industry "best practices" or performance of peer organizations as a guide to its reporting.
164
Discussion Discussion Pg#:
Context Pg#:Improve Pg#:
Initiative Pg#:Initiatives/ActionContextImprovement Over Previous
Green food purchasingAmount of food purchases come from local or organic sources, sustainable farms, or sustainable fisheries.
166
Discussion Discussion Pg#:
Context Pg#:Improve Pg#:
Initiative Pg#:Initiatives/ActionContextImprovement Over Previous
Women in managementRelative numbers of women in management.
2
Discussion Discussion Pg#:
Context Pg#:Improve Pg#:
Initiative Pg#:Initiatives/ActionContextImprovement Over Previous
www.roberts.cmc.edu 83 Sustainability Reporting of the Top U.S. Universities
Top 50 National UniversitiesEmployee satisfaction surveysSurveys to monitor employee satisfaction.
67
Discussion Discussion Pg#:
Context Pg#:Improve Pg#:
Initiative Pg#:Initiatives/ActionContextImprovement Over Previous
Occupational health and safety protectionEfforts to provide a safe and healthy working environment at all sites.
70
Discussion Discussion Pg#:
Context Pg#:Improve Pg#:
Initiative Pg#:Initiatives/ActionContextImprovement Over Previous
Employee volunteerismEfforts to promote employee volunteerism in social or environmental projects.
72
Discussion Discussion Pg#:
Context Pg#:Improve Pg#:
Initiative Pg#:Initiatives/ActionContextImprovement Over Previous
Green transportation initiativesPrograms to encourage carpooling, mass transit or other reductions in total commuting.
163
Discussion Discussion Pg#:
Context Pg#:Improve Pg#:
Initiative Pg#:Initiatives/ActionContextImprovement Over Previous
Community developmentEfforts to participate in social activities that improve the quality of life of communities including that of indigenous people, where the organization operates.
66
Discussion Discussion Pg#:
Context Pg#:Improve Pg#:
Initiative Pg#:Initiatives/ActionContextImprovement Over Previous
Community educationEfforts to support education in the communities where the company is located.
68
Discussion Discussion Pg#:
Context Pg#:Improve Pg#:
Initiative Pg#:Initiatives/ActionContextImprovement Over Previous
Sexual harassmentRejection of any form of sexual harassment.
1
Initiative Pg#:Policy Adopt Pg#:
Monitoring Pg#:Qty Perf Pg#:
Adoption of PolicyAction to Reinforce PolicyMonitoringQuant. Indication of Compliance
Political contributionsPolicy about political contributions.
7
Initiative Pg#:Policy Adopt Pg#:
Monitoring Pg#:Qty Perf Pg#:
Adoption of PolicyAction to Reinforce PolicyMonitoringQuant. Indication of Compliance
BriberyRejection of bribery
8
Initiative Pg#:Policy Adopt Pg#:
Monitoring Pg#:Qty Perf Pg#:
Adoption of PolicyAction to Reinforce PolicyMonitoringQuant. Indication of Compliance
Anti-corruption practicesEfforts to uphold the highest standards of business ethics and integrity. May be foundunder a Code of Conduct.
58
Initiative Pg#:Policy Adopt Pg#:
Monitoring Pg#:Qty Perf Pg#:
Adoption of PolicyAction to Reinforce PolicyMonitoringQuant. Indication of Compliance
Fair compensation of employeesAssurance that wages paid meet or exceed legal or industry minimum standard.
62
Initiative Pg#:Policy Adopt Pg#:
Monitoring Pg#:Qty Perf Pg#:
Adoption of PolicyAction to Reinforce PolicyMonitoringQuant. Indication of Compliance
Reasonable working hoursCompliance with applicable laws and industry standards on working hours, including overtime.
64
Initiative Pg#:Policy Adopt Pg#:
Monitoring Pg#:Qty Perf Pg#:
Adoption of PolicyAction to Reinforce PolicyMonitoringQuant. Indication of Compliance
Degrading treatment or punishment of employeesCommitment to oppose any corporal/hard labor punishment, mental/physical coercion, or verbal abuse.
59
Initiative Pg#:Policy Adopt Pg#:
Monitoring Pg#:Qty Perf Pg#:
Adoption of PolicyAction to Reinforce PolicyMonitoringQuant. Indication of Compliance
Elimination of discrimination in respect to employment and occupationCommitment not to engage in any kind of discrimination based on ethnicity, caste, religion, disability, sex, age, sexual orientation, union membership, or political affiliation in hiring practices or employee treatment.
60
Initiative Pg#:Policy Adopt Pg#:
Monitoring Pg#:Qty Perf Pg#:
Adoption of PolicyAction to Reinforce PolicyMonitoringQuant. Indication of Compliance
Free association and collective bargaining of employeesEfforts to respect the right of employees to form and join trade unions of their choice and to bargain collectively.
61
Initiative Pg#:Policy Adopt Pg#:
Monitoring Pg#:Qty Perf Pg#:
Adoption of PolicyAction to Reinforce PolicyMonitoringQuant. Indication of Compliance
www.roberts.cmc.edu 84 Sustainability Reporting of the Top U.S. Universities
Top 50 National UniversitiesElimination of all forms of forced and compulsory laborAssurance that all employees enter employment with the company of their own free will, not by compulsion.
63
Initiative Pg#:Policy Adopt Pg#:
Monitoring Pg#:Qty Perf Pg#:
Adoption of PolicyAction to Reinforce PolicyMonitoringQuant. Indication of Compliance
Effective abolition of child laborRejection of illegal child labor by the company or its affiliates.
65
Initiative Pg#:Policy Adopt Pg#:
Monitoring Pg#:Qty Perf Pg#:
Adoption of PolicyAction to Reinforce PolicyMonitoringQuant. Indication of Compliance
www.roberts.cmc.edu 85 Sustainability Reporting of the Top U.S. Universities
Boston College, Brandeis University, Brown University, California Institute of Technology, Carnegie Mellon University, Case Western Reserve University, College of Will iam and Mary, Columbia University, Cornell University, Dartmouth College, Duke University, Emory University, Georgetown University, Georgia Institute of Technology, Harvard University, Johns Hopkins University, Lehigh University, Massachusetts Institute of Technology, New York Univers i ty , Northwestern Univers i ty , Pennsylvania State University--University Park, Princeton University, Rensselaer Polytechnic Institute, Rice University, Stanford University, Tufts University, Tulane University, University of California - Berkeley, University of California - Los Angeles, University of California--Davis, U n i v e r s i t y o f C a l i f o r n i a - - I r v i n e , U n i v e r s i t y o f California--San Diego, University of California--Santa Barbara, University of Chicago, University of Florida, University of Illinois--Urbana-Champagne, University of Michigan - Ann Arbor, University of North Carolina - Chapel Hill, University of Notre Dame, University of Pennsylvania, University of Rochester, University of Southern California, University of Texas--Austin, University of Virginia, University of Washington, University of Wisconsin--Madison, Vanderbilt University, Wake Forest University, Washington University in St. L o u i s , Y a l e U n i v e r s i t y
Contact Information
Roberts Environmental Center
The Roberts Environmental Center is a research institute at Claremont McKenna College, endowed by George R. Roberts, Founding Partner, Kohlberg Kravis Roberts & Co. The Center is managed by faculty and sta�, and its research, including the material in this report, is done by students at the Claremont Colleges.
Dr. J. Emil Morhardt, Director, Phone: 909-621-8190, email: [email protected] Adidjaja, Research Fellow, Phone: 909-621-8698, email: [email protected] Environmental Center, Claremont McKenna College, 925 N. Mills Avenue, Claremont, CA 91711-5916, USA.
Claremont McKenna College, a member of the Claremont Colleges, is a highly selective, independent, coeducational, residential, undergraduate liberal arts college with a curricular emphasis on economics, government, and public a�airs.
Claremont McKenna College
The Claremont CollegesThe Claremont Colleges form a consortium of �ve undergraduate liberal arts colleges and two graduate institutions based on the Oxford/Cambridge model. The consortium o�ers students diverse opportunities and resources typically found only at much larger universities. The consortium members include Claremont McKenna College, Harvey Mudd College, Pitzer College, Pomona College, Scripps College, Keck Graduate Institute of Applied Life Sciences, and the Clremont Graduate University which—includes the Peter F. Drucker and Masatoshi Ito Graduate School of Management.