Embed Size (px)
Citation preview
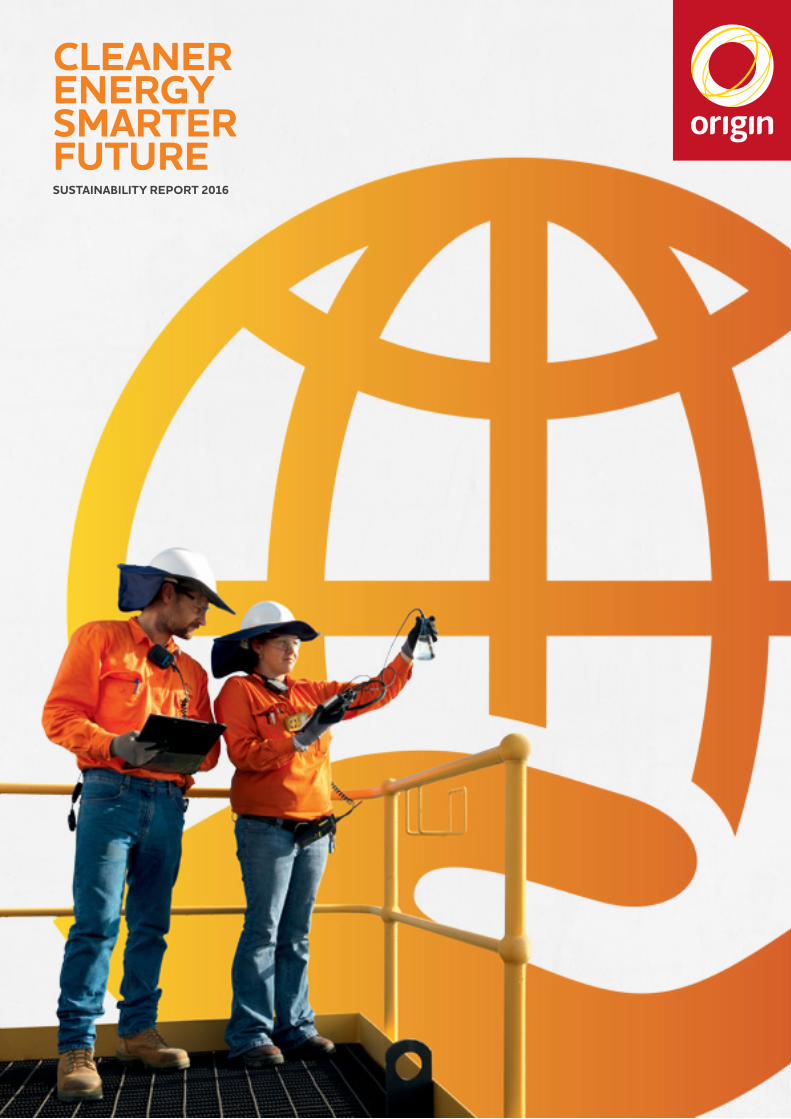
SUSTAINABILITY REPORT 2016
CLEANER ENERGYSMARTER FUTURE
CONTENTS
IMPORTANT INFORMATIONUnless otherwise stated, Origin’s Sustainability Report provides a summary of social, environmental and economic sustainability aspects, and our performance on these, for the period 1 July 2015 to 30 June 2016. Its scope is limited to the assets we operate, with the exception of emissions performance which is reported on an operated and equity basis. Significant events occurring after 30 June 2016 may also be referenced.Where this report contains forward looking statements, including statements of current intention, statements of opinion and predictions as to possible future events and future financial prospects, these statements are not statements of fact and there can be no certainty of outcome in relation to the matters to which the statements relate. Forward looking statements involve known and unknown risks, uncertainties, assumptions and other important factors that could cause the actual outcomes to be materially different from the events or results expressed or implied by such statements, and the outcomes are not all within the control of Origin. Statements about past performance are not necessarily indicative of future performance.All monetary amounts are in Australian dollars unless otherwise stated. Due to rounding, numbers presented in the Report may not add up precisely to the totals provided and percentages may not precisely reflect the absolute figures.Disclosures of Origin and Australia Pacific LNG’s reserves and resources are as at 30 June 2016. These reserves and resources were announced
on 29 July 2016 in Origin’s Annual Reserves Report for the year ended 30 June 2016 (Annual Reserves Report). Origin confirms that it is not aware of any new information or data that materially affects the information included in the Annual Reserves Report and that all the material assumptions and technical parameters underpinning the estimates in the Annual Reserves Report continue to apply and have not materially changed. Petroleum reserves and contingent resources are typically prepared by deterministic methods with support from probabilistic methods. Petroleum reserves and contingent resources are aggregated by arithmetic summation by category and as a result, proved reserves (1P reserves) may be a conservative estimate due to the portfolio effects of the arithmetic summation. Proved plus probable plus possible (3P reserves) may be an optimistic estimate due to the same aforementioned reasons. Some of Australia Pacific LNG CSG reserves and resources are subject to reversionary rights to transfer back to Tri-Star a 45 per cent interest in Australia Pacific LNG’s share of those CSG interests that were acquired from Tri-Star in 2002 if certain conditions are met. Please refer to section 6 of the Operating and Financial Review for further information.On 10 August 2015, Origin divested its entire 53.09 per cent interest in Contact Energy. Information in this report referencing total operations includes Contact Energy and references to continuing operations exclude Contact Energy.
OVERVIEW 1Read an overview of our performance and priorities from our Managing Director, find out more about who we are, where we operate and the year at a glance.
Overview 1Managing Director’s letter 2Where we operate 3Who we are 4Year at a glance 6
OUR APPROACH 8In this section, you will find information on how we operate, how we measure our overall sustainability performance, and how the rest of the report is structured.
Our Compass 9How we report 9
OUR STRATEGY 10Discover information on the sustainability aspects that shape our business and our broader strategies.
Business strategy 11 Global energy trends 13Origin’s contribution to a sustainable energy future 14
OUR DUTY OF CARE 17This section reports how we managed our social, environmental and economic sustainability aspects during the year. Detailed performance data for this year and previous years is set out in our Performance Data tables starting on page 53.
Social aspects 18Safety of our people 18Process safety 20Land and air transport 21People 22Land access and coexistence 24Impact on communities 26Customer care 27
Environmental aspects 29Climate change and emissions 29Water management 35Waste management 39Biodiversity 40Economic aspects 41Policy 41Energy affordability 42Sustainability in our supply chain 43
ADDING AND DISTRIBUTING VALUE 44In this section, we connect to our Annual Report to disclose the value added during the year.
Economic value generated and distributed 45Financial performance FY2016 46Creating value in our communities 47CSR highlights 48
DIVERSITY AND TRANSPARENCY 49In this section, we report on how we listen to the diverse opinions of stakeholders to identify the sustainability aspects they are most interested in, and how we disclose information on these areas; both in this report and in other disclosures.
Stakeholder engagement 50Reporting guidelines 52Participation in external disclosures 52Performance data 53Glossary 64
DISCOVER MORE ONLINE
OV
ERVIEW
02 MANAGING DIRECTOR’S MESSAGE
MANAGING DIRECTOR’S MESSAGE
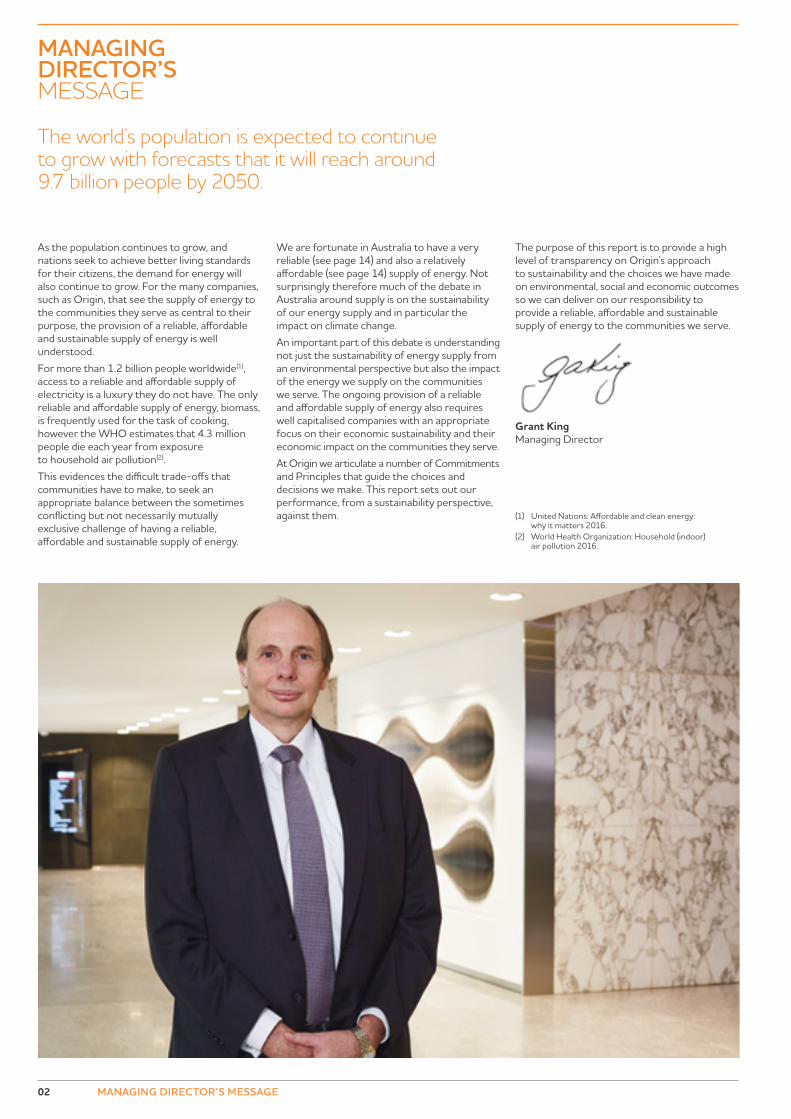
As the population continues to grow, and nations seek to achieve better living standards for their citizens, the demand for energy will also continue to grow. For the many companies, such as Origin, that see the supply of energy to the communities they serve as central to their purpose, the provision of a reliable, affordable and sustainable supply of energy is well understood.For more than 1.2 billion people worldwide(1), access to a reliable and affordable supply of electricity is a luxury they do not have. The only reliable and affordable supply of energy, biomass, is frequently used for the task of cooking, however the WHO estimates that 4.3 million people die each year from exposure to household air pollution(2).This evidences the difficult trade-offs that communities have to make, to seek an appropriate balance between the sometimes conflicting but not necessarily mutually exclusive challenge of having a reliable, affordable and sustainable supply of energy.
We are fortunate in Australia to have a very reliable (see page 14) and also a relatively affordable (see page 14) supply of energy. Not surprisingly therefore much of the debate in Australia around supply is on the sustainability of our energy supply and in particular the impact on climate change.An important part of this debate is understanding not just the sustainability of energy supply from an environmental perspective but also the impact of the energy we supply on the communities we serve. The ongoing provision of a reliable and affordable supply of energy also requires well capitalised companies with an appropriate focus on their economic sustainability and their economic impact on the communities they serve.At Origin we articulate a number of Commitments and Principles that guide the choices and decisions we make. This report sets out our performance, from a sustainability perspective, against them.
The purpose of this report is to provide a high level of transparency on Origin’s approach to sustainability and the choices we have made on environmental, social and economic outcomes so we can deliver on our responsibility to provide a reliable, affordable and sustainable supply of energy to the communities we serve.
Grant King Managing Director
The world’s population is expected to continue to grow with forecasts that it will reach around 9.7 billion people by 2050.
(1) United Nations: Affordable and clean energy: why it matters 2016.
(2) World Health Organization: Household (indoor) air pollution 2016.
03ORIGIN ENERGY SUSTAINABILITY REPORT 2016 OVERVIEW
SANTIAGO
CHILEHO CHI MINH CITY
VIETNAM
ADELAIDE
PERTH
MELBOURNE
SYDNEY
BRISBANE
PORT MORESBY
SUVA
ROMA
NEWPLYMOUTH
RAROTONGA
PORT VILA
TAFUNA
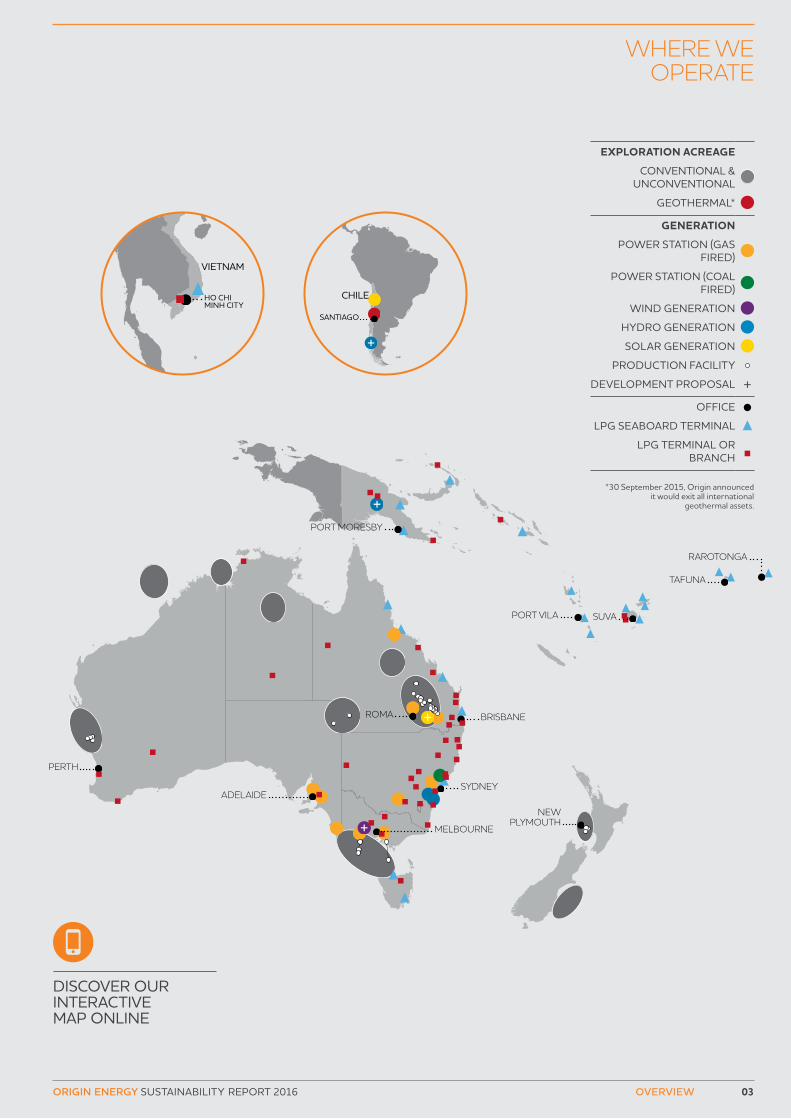
WHERE WE OPERATE
EXPLORATION ACREAGE
CONVENTIONAL & UNCONVENTIONAL
GEOTHERMAL*
GENERATION
POWER STATION (GAS FIRED)
POWER STATION (COAL FIRED)
WIND GENERATION
HYDRO GENERATION
SOLAR GENERATION
PRODUCTION FACILITY
DEVELOPMENT PROPOSAL
OFFICE
LPG SEABOARD TERMINAL
LPG TERMINAL OR BRANCH
*30 September 2015, Origin announced it would exit all international
geothermal assets.
DISCOVER OUR INTERACTIVE MAP ONLINE
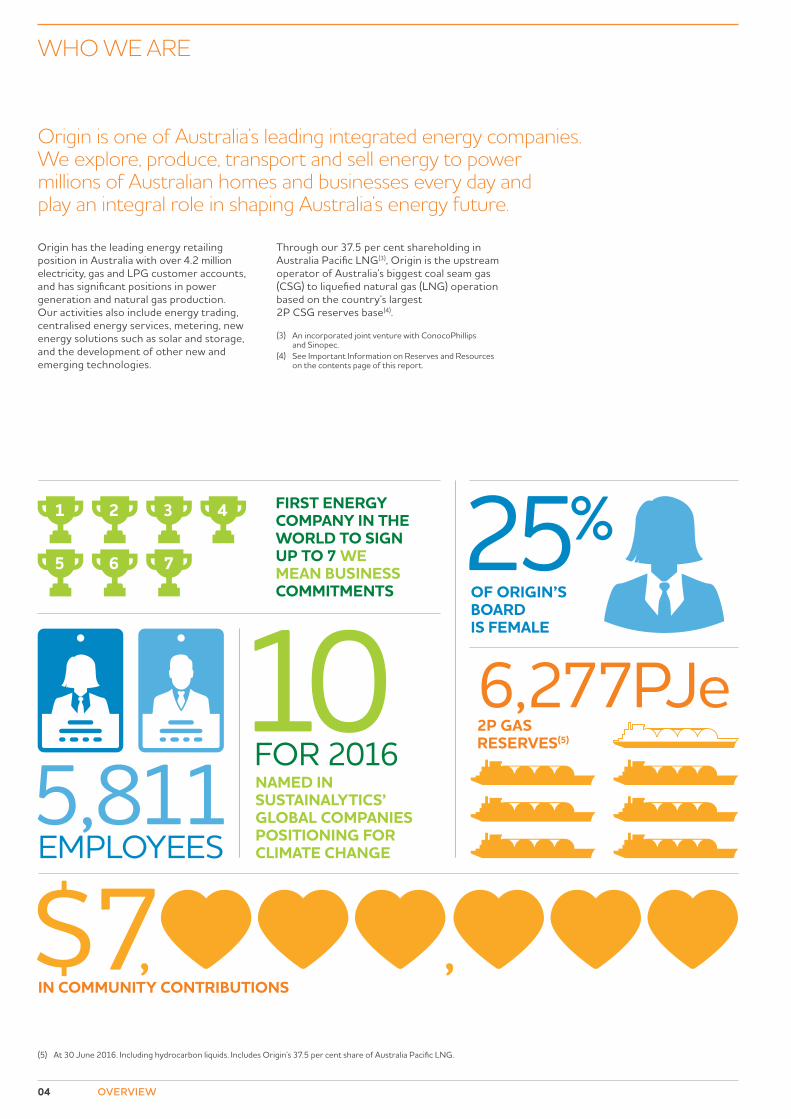
FIRST ENERGY COMPANY IN THE WORLD TO SIGN UP TO 7 WE MEAN BUSINESS COMMITMENTS
5,811
1 2 3 4
5 6 7
EMPLOYEES
IN COMMUNITY CONTRIBUTIONS$7, ,
OF ORIGIN’S BOARD IS FEMALE
25%
6,277PJe2P GAS RESERVES(5)
10FOR 2016NAMED IN SUSTAINALYTICS’ GLOBAL COMPANIES POSITIONING FOR CLIMATE CHANGE
04 OVERVIEW
WHO WE ARE
Origin is one of Australia’s leading integrated energy companies. We explore, produce, transport and sell energy to power millions of Australian homes and businesses every day and play an integral role in shaping Australia’s energy future.
Origin has the leading energy retailing position in Australia with over 4.2 million electricity, gas and LPG customer accounts, and has significant positions in power generation and natural gas production. Our activities also include energy trading, centralised energy services, metering, new energy solutions such as solar and storage, and the development of other new and emerging technologies.
Through our 37.5 per cent shareholding in Australia Pacific LNG(3), Origin is the upstream operator of Australia’s biggest coal seam gas (CSG) to liquefied natural gas (LNG) operation based on the country’s largest 2P CSG reserves base(4).
(3) An incorporated joint venture with ConocoPhillips and Sinopec.
(4) See Important Information on Reserves and Resources on the contents page of this report.
(5) At 30 June 2016. Including hydrocarbon liquids. Includes Origin’s 37.5 per cent share of Australia Pacific LNG.

SHAREHOLDING AS UPSTREAM OPERATOR OF AUSTRALIA PACIFIC LNG CUSTOMER ACCOUNTS
AUSTRALIAN PROVIDER OF GREENPOWER AND GREEN GAS PRODUCTS
MILLION
37.5%
>411,000ELECTRICITY CUSTOMERS WITH ROOFTOP SOLAR INSTALLATIONS
TREATED CSG WATER SUPPLIED FOR USE IN IRRIGATION
THE LARGEST98D
CONTRACTED RENEWABLE ENERGY VIA POWER PURCHASE AGREEMENTS(8)
745MW
12,379ML
CDP CLIMATE CHANGE SCORE IN FY2014(7)
INSTALLED LARGE SCALE INTERNAL GENERATION PORTFOLIO CAPACITY
6,011MW
OCGT AND CCGT(6) POWER STATIONS
WOMEN RECRUITED IN SENIOR ROLES28.6%
05ORIGIN ENERGY SUSTAINABILITY REPORT 2016 OVERVIEW
(6) In internal generation portfolio. OCGT = Open Cycle Gas Turbine; CCGT = Closed Cycle Gas Turbine. (7) CDP score is out of a maximum score of 100. (8) As at the end of the reporting period.
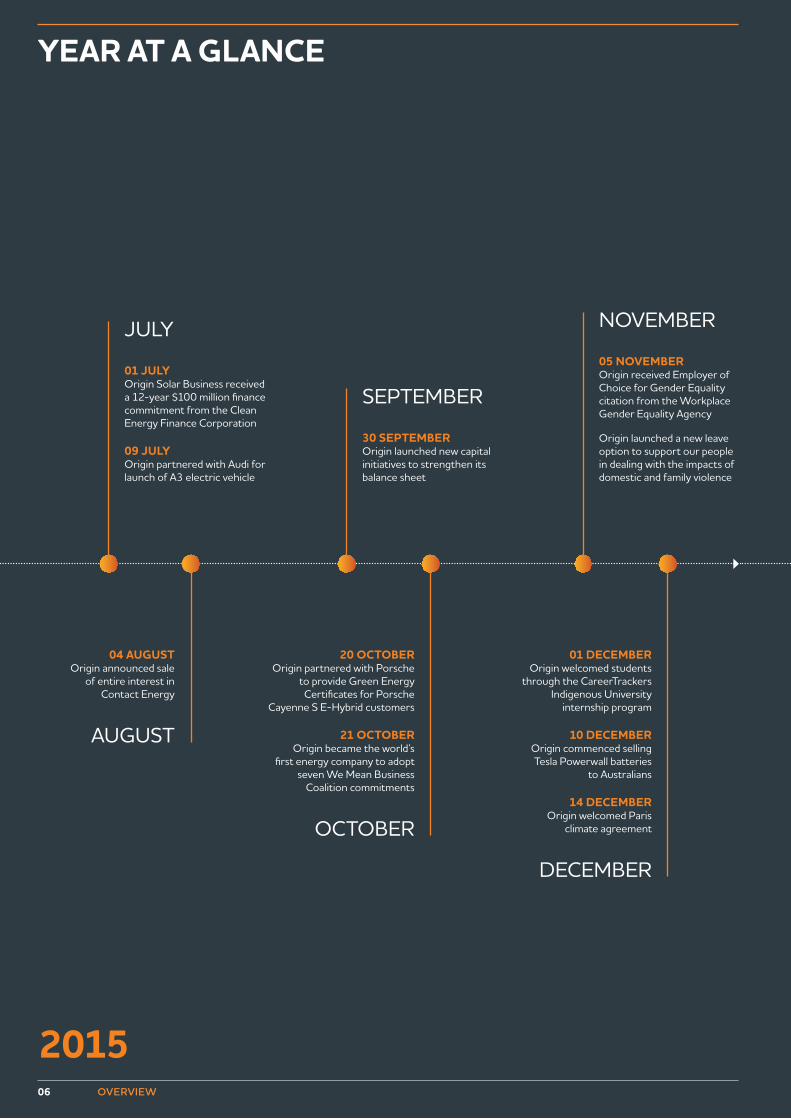
YEAR AT A GLANCE
06 OVERVIEW
2015
04 AUGUST Origin announced sale
of entire interest in Contact Energy
01 JULY Origin Solar Business received a 12-year $100 million finance commitment from the Clean Energy Finance Corporation
09 JULY Origin partnered with Audi for launch of A3 electric vehicle
30 SEPTEMBER Origin launched new capital initiatives to strengthen its balance sheet
05 NOVEMBER Origin received Employer of Choice for Gender Equality citation from the Workplace Gender Equality Agency
Origin launched a new leave option to support our people in dealing with the impacts of domestic and family violence
01 DECEMBEROrigin welcomed students
through the CareerTrackers Indigenous University
internship program
10 DECEMBEROrigin commenced selling Tesla Powerwall batteries
to Australians
14 DECEMBEROrigin welcomed Paris
climate agreement
20 OCTOBER Origin partnered with Porsche
to provide Green Energy Certificates for Porsche
Cayenne S E-Hybrid customers
21 OCTOBER Origin became the world’s
first energy company to adopt seven We Mean Business
Coalition commitments
DECEMBER
OCTOBER
AUGUST
JULY
SEPTEMBER
NOVEMBER
ORIGIN ENERGY SUSTAINABILITY REPORT 2016 07OVERVIEW
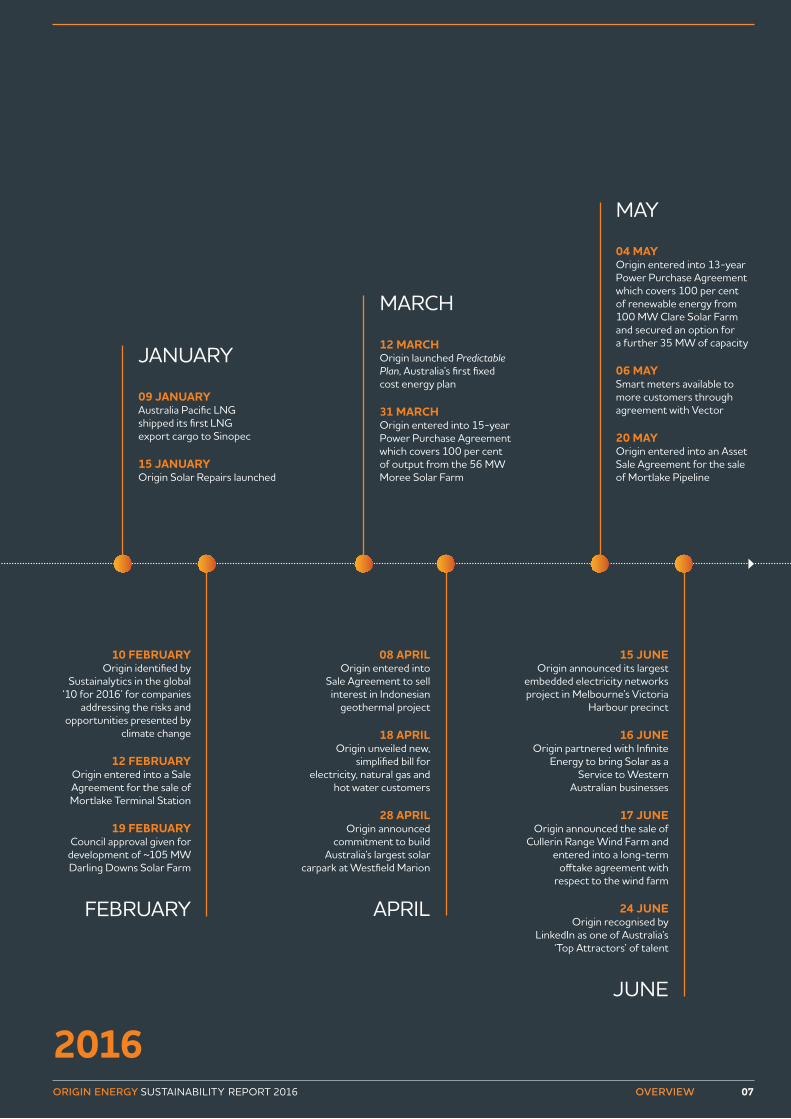
2016
09 JANUARYAustralia Pacific LNG shipped its first LNG export cargo to Sinopec
15 JANUARYOrigin Solar Repairs launched
10 FEBRUARYOrigin identified by
Sustainalytics in the global ‘10 for 2016’ for companies
addressing the risks and opportunities presented by
climate change
12 FEBRUARYOrigin entered into a Sale Agreement for the sale of Mortlake Terminal Station
19 FEBRUARYCouncil approval given for development of ~105 MW Darling Downs Solar Farm
12 MARCHOrigin launched Predictable Plan, Australia’s first fixed cost energy plan
31 MARCHOrigin entered into 15-year Power Purchase Agreement which covers 100 per cent of output from the 56 MW Moree Solar Farm
08 APRILOrigin entered into
Sale Agreement to sell interest in Indonesian
geothermal project
18 APRILOrigin unveiled new,
simplified bill for electricity, natural gas and
hot water customers
28 APRILOrigin announced
commitment to build Australia’s largest solar
carpark at Westfield Marion
15 JUNEOrigin announced its largest
embedded electricity networks project in Melbourne’s Victoria
Harbour precinct
16 JUNEOrigin partnered with Infinite
Energy to bring Solar as a Service to Western
Australian businesses
17 JUNEOrigin announced the sale of
Cullerin Range Wind Farm and entered into a long-term
offtake agreement with respect to the wind farm
24 JUNEOrigin recognised by
LinkedIn as one of Australia’s ‘Top Attractors’ of talent
FEBRUARY
JANUARY
MARCH
04 MAYOrigin entered into 13-year Power Purchase Agreement which covers 100 per cent of renewable energy from 100 MW Clare Solar Farm and secured an option for a further 35 MW of capacity
06 MAYSmart meters available to more customers through agreement with Vector
20 MAYOrigin entered into an Asset Sale Agreement for the sale of Mortlake Pipeline
MAY
APRIL
JUNE
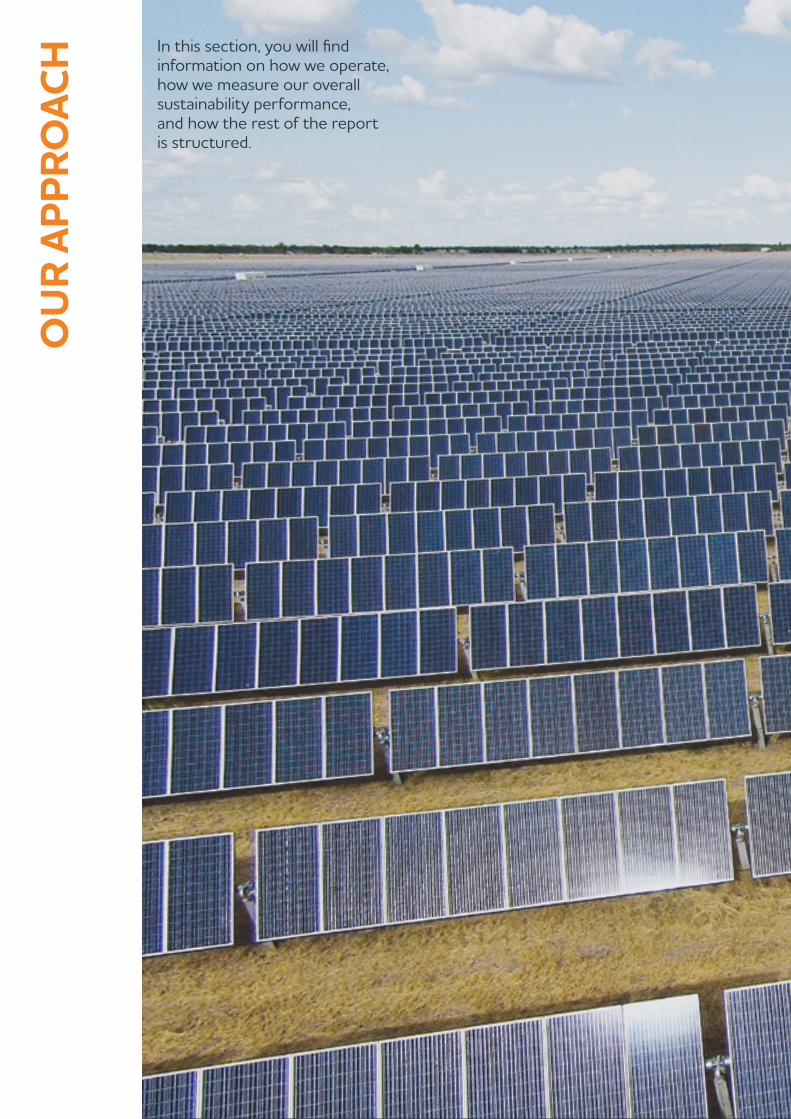
In this section, you will find information on how we operate, how we measure our overall sustainability performance, and how the rest of the report is structured.
OU
R AP
PRO
ACH
ORIGIN ENERGY SUSTAINABILITY REPORT 2016 09OUR APPROACH
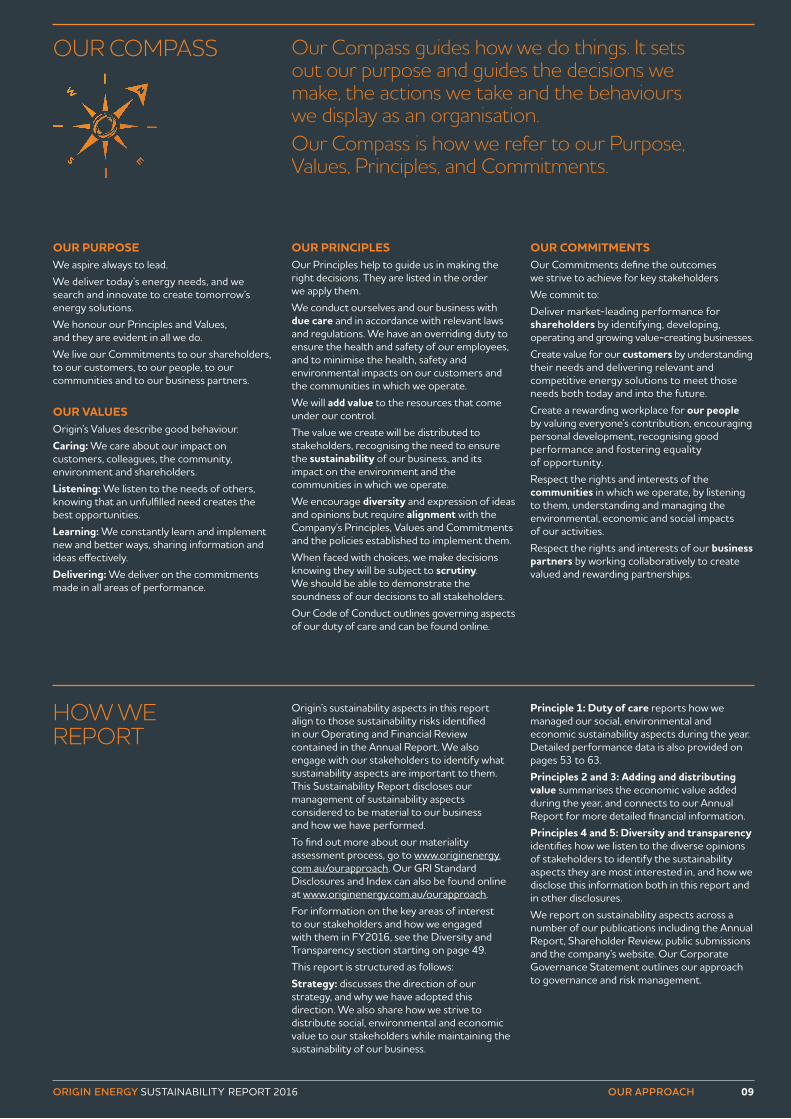
OUR COMPASS
OUR PURPOSEWe aspire always to lead.We deliver today’s energy needs, and we search and innovate to create tomorrow’s energy solutions.We honour our Principles and Values, and they are evident in all we do.We live our Commitments to our shareholders, to our customers, to our people, to our communities and to our business partners.
OUR VALUESOrigin’s Values describe good behaviour. Caring: We care about our impact on customers, colleagues, the community, environment and shareholders.Listening: We listen to the needs of others, knowing that an unfulfilled need creates the best opportunities. Learning: We constantly learn and implement new and better ways, sharing information and ideas effectively.Delivering: We deliver on the commitments made in all areas of performance.
OUR PRINCIPLESOur Principles help to guide us in making the right decisions. They are listed in the order we apply them.We conduct ourselves and our business with due care and in accordance with relevant laws and regulations. We have an overriding duty to ensure the health and safety of our employees, and to minimise the health, safety and environmental impacts on our customers and the communities in which we operate.We will add value to the resources that come under our control. The value we create will be distributed to stakeholders, recognising the need to ensure the sustainability of our business, and its impact on the environment and the communities in which we operate.We encourage diversity and expression of ideas and opinions but require alignment with the Company’s Principles, Values and Commitments and the policies established to implement them.When faced with choices, we make decisions knowing they will be subject to scrutiny. We should be able to demonstrate the soundness of our decisions to all stakeholders.Our Code of Conduct outlines governing aspects of our duty of care and can be found online.
OUR COMMITMENTSOur Commitments define the outcomes we strive to achieve for key stakeholdersWe commit to:Deliver market-leading performance for shareholders by identifying, developing, operating and growing value-creating businesses.Create value for our customers by understanding their needs and delivering relevant and competitive energy solutions to meet those needs both today and into the future.Create a rewarding workplace for our people by valuing everyone’s contribution, encouraging personal development, recognising good performance and fostering equality of opportunity.Respect the rights and interests of the communities in which we operate, by listening to them, understanding and managing the environmental, economic and social impacts of our activities.Respect the rights and interests of our business partners by working collaboratively to create valued and rewarding partnerships.
Our Compass guides how we do things. It sets out our purpose and guides the decisions we make, the actions we take and the behaviours we display as an organisation. Our Compass is how we refer to our Purpose, Values, Principles, and Commitments.
HOW WE REPORT
Origin’s sustainability aspects in this report align to those sustainability risks identified in our Operating and Financial Review contained in the Annual Report. We also engage with our stakeholders to identify what sustainability aspects are important to them. This Sustainability Report discloses our management of sustainability aspects considered to be material to our business and how we have performed.To find out more about our materiality assessment process, go to www.originenergy.com.au/ourapproach. Our GRI Standard Disclosures and Index can also be found online at www.originenergy.com.au/ourapproach.For information on the key areas of interest to our stakeholders and how we engaged with them in FY2016, see the Diversity and Transparency section starting on page 49.This report is structured as follows:Strategy: discusses the direction of our strategy, and why we have adopted this direction. We also share how we strive to distribute social, environmental and economic value to our stakeholders while maintaining the sustainability of our business.
Principle 1: Duty of care reports how we managed our social, environmental and economic sustainability aspects during the year. Detailed performance data is also provided on pages 53 to 63. Principles 2 and 3: Adding and distributing value summarises the economic value added during the year, and connects to our Annual Report for more detailed financial information.Principles 4 and 5: Diversity and transparency identifies how we listen to the diverse opinions of stakeholders to identify the sustainability aspects they are most interested in, and how we disclose this information both in this report and in other disclosures.We report on sustainability aspects across a number of our publications including the Annual Report, Shareholder Review, public submissions and the company’s website. Our Corporate Governance Statement outlines our approach to governance and risk management.

OU
R ST
RAT
EGY Discover information on the
sustainability aspects that shape our business and our broader strategies.
11ORIGIN ENERGY SUSTAINABILITY REPORT 2016 OUR STRATEGY
2BUSINESSES
TRIFR FOR OUR SAFETY
TOTAL SHAREHOLDER RETURNS FOR FINANCIAL PERFORMANCE
BUSINESS STRATEGY
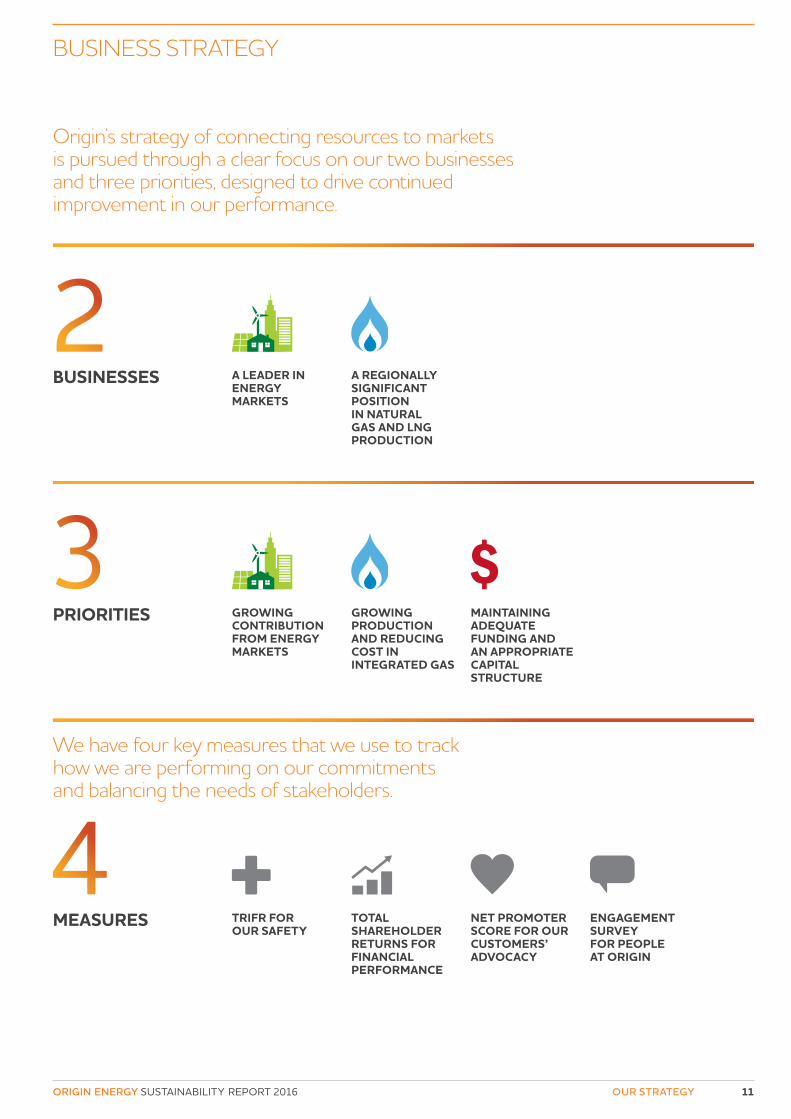
We have four key measures that we use to track how we are performing on our commitments and balancing the needs of stakeholders.
Origin’s strategy of connecting resources to markets is pursued through a clear focus on our two businesses and three priorities, designed to drive continued improvement in our performance.
NET PROMOTER SCORE FOR OUR CUSTOMERS’ ADVOCACY
ENGAGEMENT SURVEY FOR PEOPLE AT ORIGIN
GROWING CONTRIBUTION FROM ENERGY MARKETS
A LEADER IN ENERGY MARKETS
GROWING PRODUCTION AND REDUCING COST IN INTEGRATED GAS
A REGIONALLY SIGNIFICANT POSITION IN NATURAL GAS AND LNG PRODUCTION
MAINTAINING ADEQUATE FUNDING AND AN APPROPRIATE CAPITAL STRUCTURE
3PRIORITIES
4MEASURES
8.0
6.5
5.0
3.8 4.
2FY
16
FY15
FY14
FY13
FY12
19.9
7.0
20.6
-15.
0
-42.
0FY
16
FY15
FY14
FY13
FY12
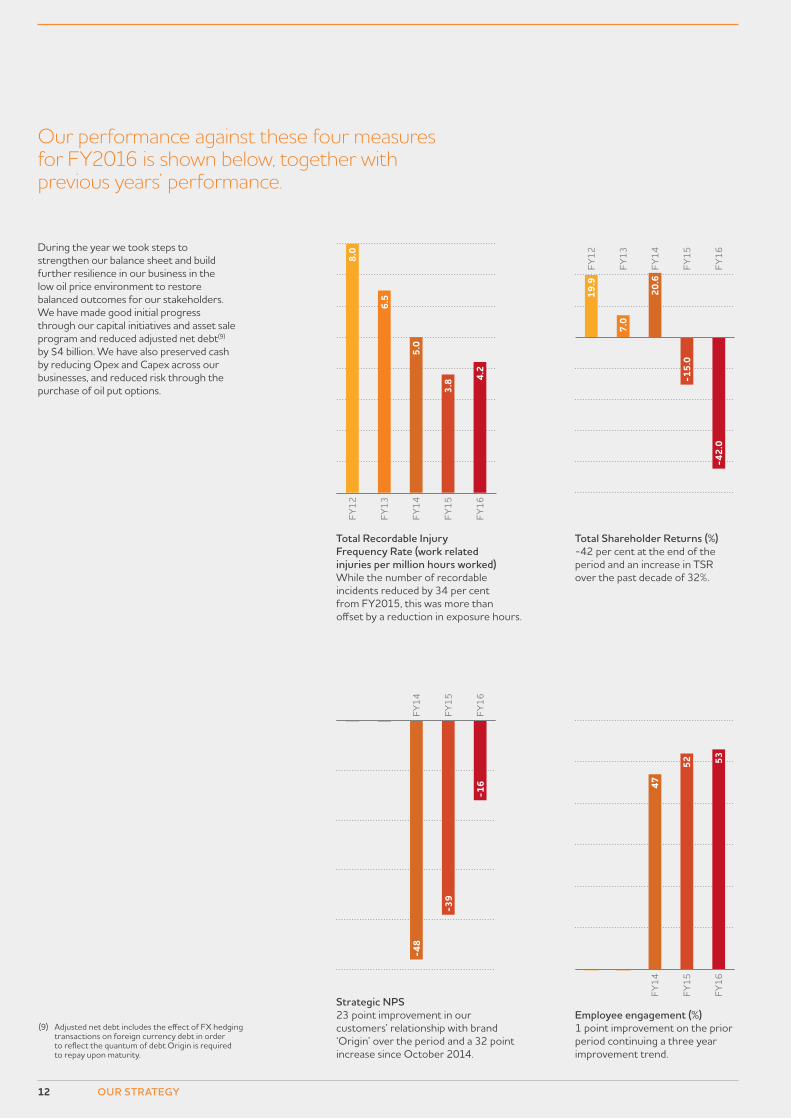
Total Recordable Injury Frequency Rate (work related injuries per million hours worked) While the number of recordable incidents reduced by 34 per cent from FY2015, this was more than offset by a reduction in exposure hours.
Total Shareholder Returns (%) -42 per cent at the end of the period and an increase in TSR over the past decade of 32%.
-48
-39
-16
FY14
FY16
FY15
47
52 53FY
16
FY14
FY15
Strategic NPS 23 point improvement in our customers’ relationship with brand ‘Origin’ over the period and a 32 point increase since October 2014.
Employee engagement (%) 1 point improvement on the prior period continuing a three year improvement trend.
12 OUR STRATEGY
(9) Adjusted net debt includes the effect of FX hedging transactions on foreign currency debt in order to reflect the quantum of debt Origin is required to repay upon maturity.
Our performance against these four measures for FY2016 is shown below, together with previous years’ performance.
During the year we took steps to strengthen our balance sheet and build further resilience in our business in the low oil price environment to restore balanced outcomes for our stakeholders. We have made good initial progress through our capital initiatives and asset sale program and reduced adjusted net debt(9) by $4 billion. We have also preserved cash by reducing Opex and Capex across our businesses, and reduced risk through the purchase of oil put options.
13ORIGIN ENERGY SUSTAINABILITY REPORT 2016 OUR STRATEGY
GLOBAL ENERGY TRENDS
A growing global population and continued urbanisation is transforming the global energy landscape at a rapid pace.
The challenge of meeting the energy needs of a growing global population needs to be balanced in light of overarching economic and environmental objectives. The world’s growing population, continued urbanisation and the desire to achieve improved standards of living will continue to drive energy demand. By 2050, our global population is expected to grow by around 2.4 billion to 9.7 billion(10) and 66 per cent of the population will live in urban areas(11). As a result of this trend, the International Energy Agency (IEA) expects electricity demand to increase by 70 per cent by 2040(12), requiring annual investment in the vicinity of $2 trillion across the energy value chain(13).A stable policy environment is required for investment in renewable energy as nations seek to decarbonise their economies and simultaneously maintain energy affordability and system reliability. Globally, governments are increasingly recognising the role they play in providing clear, non-conflicting policy signals to ensure investment, as evidenced by the agreement reached at the United Nations-led 21st Conference of Parties (CoP21) in Paris during the year.Three enablers emerge as critical factors in transitioning to a cleaner energy future:1. The contribution from renewable energy
and other low carbon sources will continue to grow in the global mix;
2. Technology will impact the way customers use energy and the way energy companies deliver it; and
3. The role of gas as the least emissions-intensive fossil fuel.
CLIMATE CHANGE AND RENEWABLE ENERGYEnergy production accounts for approximately two thirds of the world’s greenhouse gas emissions, placing the energy industry at the forefront of climate change mitigation strategies. Global commitments to climate change action were confirmed at CoP21 at the end of 2015. In April 2016, 177 countries (including Australia) signed the Paris Agreement(14) signalling a commitment to decarbonise at a rate that ensures global warming of less than 2°C. Achieving these targets will require a significant transformation in the way energy is produced and used, as well as stable and commercially viable policy settings.Renewable sources of energy will play a key role as the world embarks on the path of decarbonisation. In 2015, more than half of new power generation capacity came from renewable sources and global renewable spend reached US$286 billion(15). According to the IEA, renewables are expected to overtake coal as the largest source of power generation by the 2030s(16). By 2040, the composition of renewables is forecast to be 50 per cent in Europe, approximately 30 per cent in both China and Japan, and more than 25 per cent in the United States and India(17).Australia’s 2030 emissions reduction target is a 26 to 28 per cent decrease on 2005 levels, which (due to population growth) is equivalent to a 50 to 52 per cent reduction in emissions per person. To meet this target we estimate that our industry will be required to reduce the carbon intensity of Australia’s National Electricity Market from 0.91(18) to around 0.7(19) tonnes of CO2 per MWh over this period. This is around 30 million tonnes of CO2 per annum or the equivalent of closing two large coal-fired power stations(20).The Australian energy industry, which is at the forefront of forging a path towards a lower carbon future, will require substantial investment in renewables over the next four years to meet Australia’s targets.
TECHNOLOGYRapid advances in technology are transforming everyday life and the business environment. Online communication and the volume of available data have become increasingly connected with energy systems, enabling real-time monitoring and management of energy use. Technology improvements have the potential to contribute to decreasing costs for decentralised energy solutions like solar-connected storage; providing customers with unprecedented choice in relation to how and when they produce and use energy.These choices include distributed forms of energy such as solar PV and home energy management options for residential and commercial customers, through smart metering, battery storage and electric vehicles. The cost of these new options continues to decline rapidly through economies of scale and new manufacturing processes. As these technologies progress and costs fall, more customers will choose from a larger range of energy options, changing the way energy companies interact with them.
THE ROLE OF GASNatural gas has long been recognised for its low carbon profile and abundant supply, and its increasing availability anywhere in the world through pipelines and a growing LNG supply chain. Gas is widely acknowledged as an ongoing complementary fuel to support the intermittency of renewables. It is also expected to play a role in displacing coal. These factors underpin its status as the only fossil fuel to increase in use under all of the IEA’s future energy scenarios. Based on policies announced in the lead-up to CoP21 in 2015 natural gas use is forecast to increase 47 per cent by 2040, led by China and the Middle East(21). Despite a significant fall in oil prices and the realignment of oil-linked gas pricing, Australia’s liquefied natural gas (LNG) prospects remain strong.Australia’s proximity to Asia, as well as its large LNG export market, means our nation is best placed to help meet Asia’s ongoing demand for gas.
(10) United Nations, World Population Prospects: The 2015 Revision, and United Nations website.
(11) United Nations, World Urbanisation Prospects: The 2014 Revision.
(12) IEA World Energy Outlook 2015 Factsheet.(13) International Energy Agency, Energy and Climate
Change: World Energy Outlook Special Report 2015.(14) While 177 UNFCCC members signed the treaty, it will
not come into force until 55 countries (representing 55 per cent of global greenhouse gas emissions) ratify the agreement. As at 29 April 2016, the agreement had been ratified by 15 countries.
(15) United Nations: Global Trends in Renewable Energy Investment 2016.
(16) International Energy Agency, World Energy Outlook, 2015.(17) International Energy Agency, World Energy Outlook, 2015.(18) AEMO, CDEI Calculated as the ratio of total emissions
in proportion to the total energy sent out in FY2016.(19) AEMO, NemSight, and Origin based on the assumption
that power generation sector shares the national INDC target aiming for 26 to 28 per cent reductions in total carbon emissions by 2030 below the 2005 levels.
(20) Equivalent to two 2000 MW power stations running at 90 per cent capacity factor.
(21) IEA World Energy Outlook 2015 Factsheet.
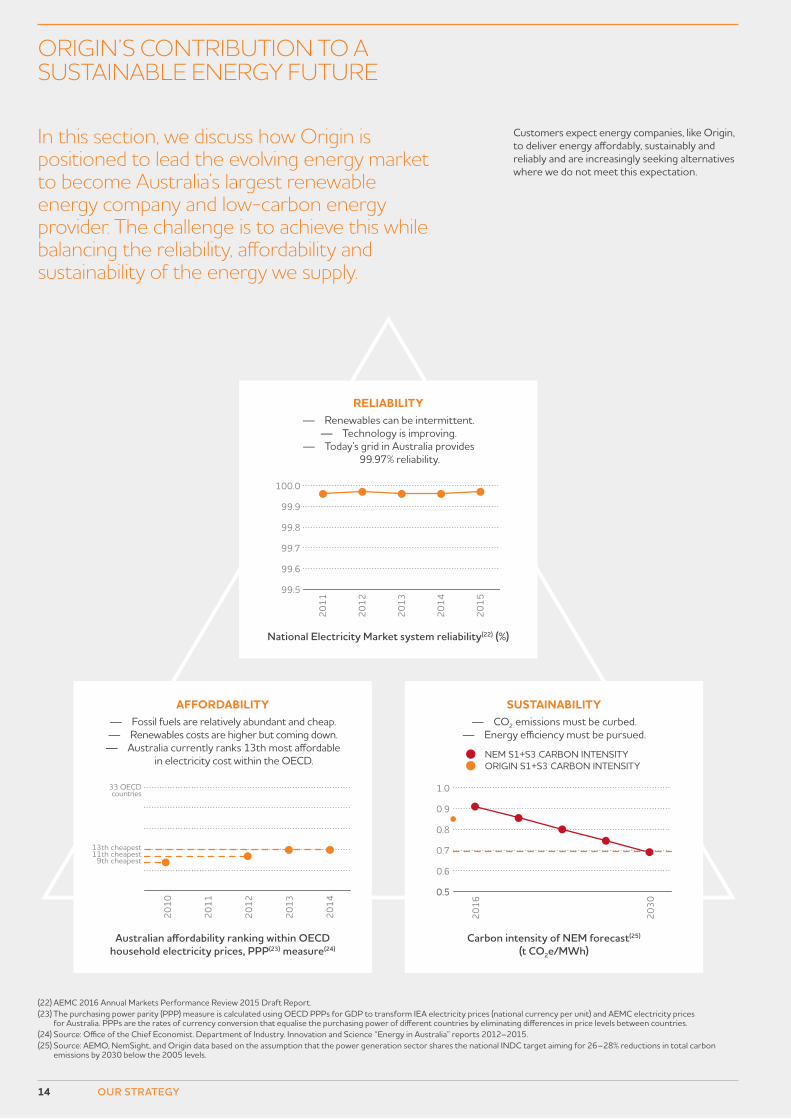
Australian affordability ranking within OECD household electricity prices, PPP(23) measure(24)
AFFORDABILITY — Fossil fuels are relatively abundant and cheap. — Renewables costs are higher but coming down. — Australia currently ranks 13th most affordable
in electricity cost within the OECD.
2010
13th cheapest11th cheapest
9th cheapest
2014
2013
2012
2011
33 OECDcountries
Carbon intensity of NEM forecast(25) (t CO2e/MWh)
SUSTAINABILITY — CO2 emissions must be curbed.
— Energy efficiency must be pursued.
2016
2030
0.5
0.6
0.7
0.8
0.9
1.0
0.5
NEM S1+S3 CARBON INTENSITYORIGIN S1+S3 CARBON INTENSITY
2016
2030
0.5
0.6
0.7
0.8
0.9
1.0
0.5
NEM S1+S3 CARBON INTENSITYORIGIN S1+S3 CARBON INTENSITY
RELIABILITY — Renewables can be intermittent.
— Technology is improving. — Today’s grid in Australia provides
99.97% reliability.
National Electricity Market system reliability(22) (%)
2012
2013
2014
99.5
99.6
99.7
99.8
99.9
100.0
2011
2015
14 OUR STRATEGY
ORIGIN’S CONTRIBUTION TO A SUSTAINABLE ENERGY FUTURE
(22) AEMC 2016 Annual Markets Performance Review 2015 Draft Report.(23) The purchasing power parity (PPP) measure is calculated using OECD PPPs for GDP to transform IEA electricity prices (national currency per unit) and AEMC electricity prices
for Australia. PPPs are the rates of currency conversion that equalise the purchasing power of different countries by eliminating differences in price levels between countries.(24) Source: Office of the Chief Economist. Department of Industry. Innovation and Science “Energy in Australia” reports 2012–2015.(25) Source: AEMO, NemSight, and Origin data based on the assumption that the power generation sector shares the national INDC target aiming for 26–28% reductions in total carbon
emissions by 2030 below the 2005 levels.
Customers expect energy companies, like Origin, to deliver energy affordably, sustainably and reliably and are increasingly seeking alternatives where we do not meet this expectation.
In this section, we discuss how Origin is positioned to lead the evolving energy market to become Australia’s largest renewable energy company and low-carbon energy provider. The challenge is to achieve this while balancing the reliability, affordability and sustainability of the energy we supply.
ORIGIN ENERGY SUSTAINABILITY REPORT 2016 15OUR STRATEGY
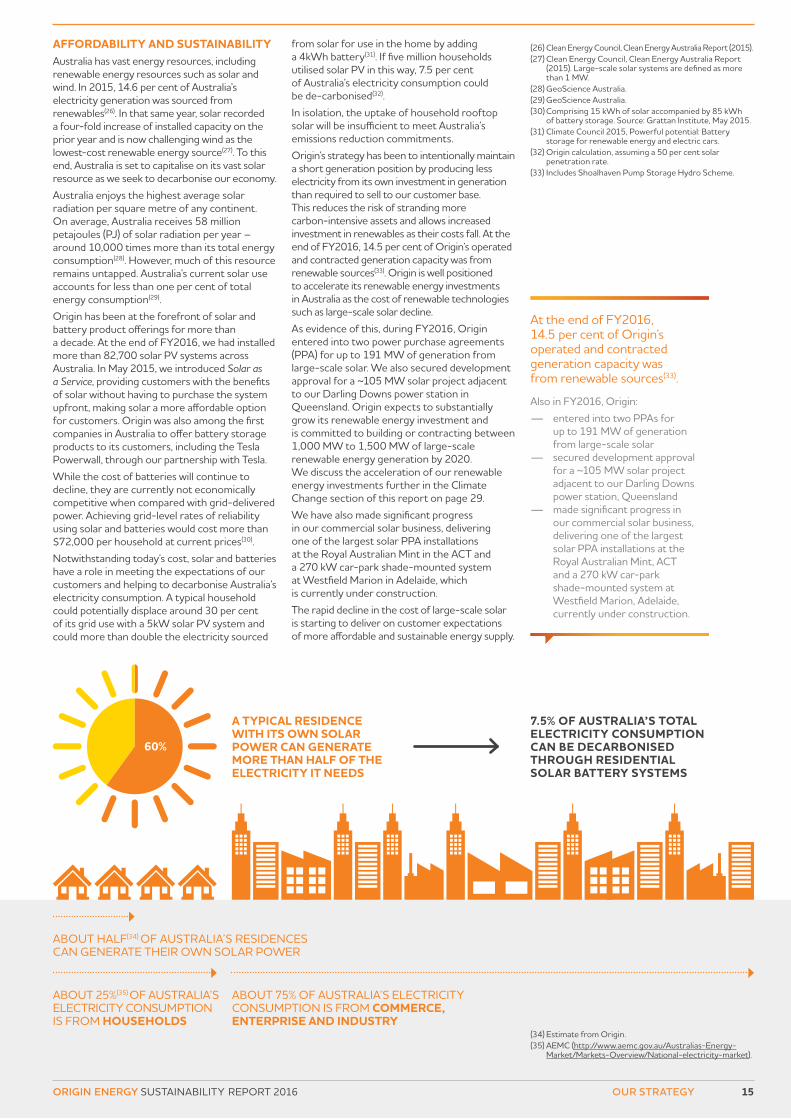
AFFORDABILITY AND SUSTAINABILITYAustralia has vast energy resources, including renewable energy resources such as solar and wind. In 2015, 14.6 per cent of Australia’s electricity generation was sourced from renewables(26). In that same year, solar recorded a four-fold increase of installed capacity on the prior year and is now challenging wind as the lowest-cost renewable energy source(27). To this end, Australia is set to capitalise on its vast solar resource as we seek to decarbonise our economy.Australia enjoys the highest average solar radiation per square metre of any continent. On average, Australia receives 58 million petajoules (PJ) of solar radiation per year – around 10,000 times more than its total energy consumption(28). However, much of this resource remains untapped. Australia’s current solar use accounts for less than one per cent of total energy consumption(29).Origin has been at the forefront of solar and battery product offerings for more than a decade. At the end of FY2016, we had installed more than 82,700 solar PV systems across Australia. In May 2015, we introduced Solar as a Service, providing customers with the benefits of solar without having to purchase the system upfront, making solar a more affordable option for customers. Origin was also among the first companies in Australia to offer battery storage products to its customers, including the Tesla Powerwall, through our partnership with Tesla.While the cost of batteries will continue to decline, they are currently not economically competitive when compared with grid-delivered power. Achieving grid-level rates of reliability using solar and batteries would cost more than $72,000 per household at current prices(30).Notwithstanding today’s cost, solar and batteries have a role in meeting the expectations of our customers and helping to decarbonise Australia’s electricity consumption. A typical household could potentially displace around 30 per cent of its grid use with a 5kW solar PV system and could more than double the electricity sourced
from solar for use in the home by adding a 4kWh battery(31). If five million households utilised solar PV in this way, 7.5 per cent of Australia’s electricity consumption could be de-carbonised(32).In isolation, the uptake of household rooftop solar will be insufficient to meet Australia’s emissions reduction commitments.Origin’s strategy has been to intentionally maintain a short generation position by producing less electricity from its own investment in generation than required to sell to our customer base. This reduces the risk of stranding more carbon-intensive assets and allows increased investment in renewables as their costs fall. At the end of FY2016, 14.5 per cent of Origin’s operated and contracted generation capacity was from renewable sources(33). Origin is well positioned to accelerate its renewable energy investments in Australia as the cost of renewable technologies such as large-scale solar decline.As evidence of this, during FY2016, Origin entered into two power purchase agreements (PPA) for up to 191 MW of generation from large-scale solar. We also secured development approval for a ~105 MW solar project adjacent to our Darling Downs power station in Queensland. Origin expects to substantially grow its renewable energy investment and is committed to building or contracting between 1,000 MW to 1,500 MW of large-scale renewable energy generation by 2020. We discuss the acceleration of our renewable energy investments further in the Climate Change section of this report on page 29.We have also made significant progress in our commercial solar business, delivering one of the largest solar PPA installations at the Royal Australian Mint in the ACT and a 270 kW car-park shade-mounted system at Westfield Marion in Adelaide, which is currently under construction.The rapid decline in the cost of large-scale solar is starting to deliver on customer expectations of more affordable and sustainable energy supply.
(26) Clean Energy Council, Clean Energy Australia Report (2015).(27) Clean Energy Council, Clean Energy Australia Report
(2015). Large-scale solar systems are defined as more than 1 MW.
(28) GeoScience Australia.(29) GeoScience Australia.(30) Comprising 15 kWh of solar accompanied by 85 kWh
of battery storage. Source: Grattan Institute, May 2015.(31) Climate Council 2015, Powerful potential: Battery
storage for renewable energy and electric cars.(32) Origin calculation, assuming a 50 per cent solar
penetration rate.(33) Includes Shoalhaven Pump Storage Hydro Scheme.
60%
A TYPICAL RESIDENCE WITH ITS OWN SOLAR POWER CAN GENERATE MORE THAN HALF OF THE ELECTRICITY IT NEEDS
7.5% OF AUSTRALIA’S TOTAL ELECTRICITY CONSUMPTION CAN BE DECARBONISED THROUGH RESIDENTIAL SOLAR BATTERY SYSTEMS
ABOUT HALF(34) OF AUSTRALIA’S RESIDENCES CAN GENERATE THEIR OWN SOLAR POWER
ABOUT 25%(35) OF AUSTRALIA’S ELECTRICITY CONSUMPTION IS FROM HOUSEHOLDS
ABOUT 75% OF AUSTRALIA’S ELECTRICITY CONSUMPTION IS FROM COMMERCE, ENTERPRISE AND INDUSTRY
(34) Estimate from Origin.(35) AEMC (http://www.aemc.gov.au/Australias-Energy-
Market/Markets-Overview/National-electricity-market).
At the end of FY2016, 14.5 per cent of Origin’s operated and contracted generation capacity was from renewable sources(33).
Also in FY2016, Origin: — entered into two PPAs for
up to 191 MW of generation from large-scale solar
— secured development approval for a ~105 MW solar project adjacent to our Darling Downs power station, Queensland
— made significant progress in our commercial solar business, delivering one of the largest solar PPA installations at the Royal Australian Mint, ACT and a 270 kW car-park shade-mounted system at Westfield Marion, Adelaide, currently under construction.
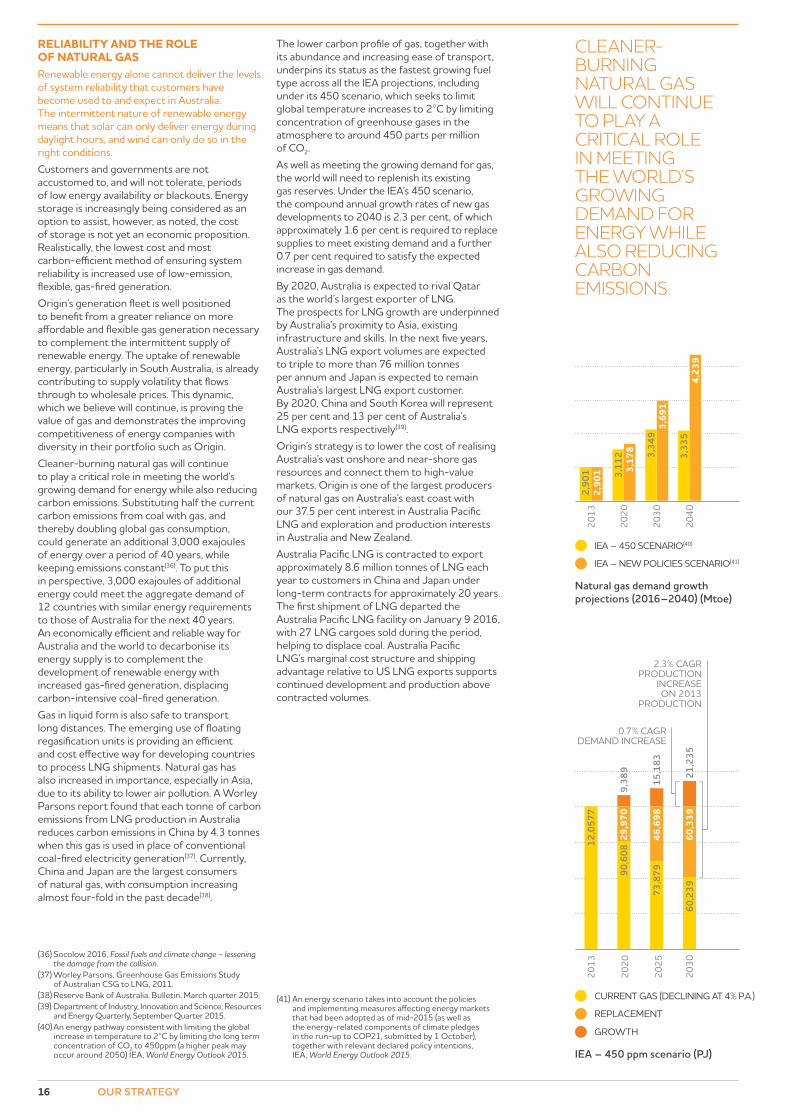
Natural gas demand growth projections (2016–2040) (Mtoe)
3,3
35
3,1
12 3,3
49
4,2
39
2,9
01 2
,901 3
,178
3,6
91
2040
2030
2020
2013
IEA – 450 SCENARIO(40)
IEA – NEW POLICIES SCENARIO(41)
IEA – 450 ppm scenario (PJ)
73,8
79
60,2
39
12,0
577
90,6
08
46,6
98
60,3
39
29,9
70
15,1
83
21,2
35
9,38
9
2030
2025
2020
2013
CURRENT GAS (DECLINING AT 4% P.A.)
REPLACEMENT
GROWTH
0.7% CAGRDEMAND INCREASE
2.3% CAGRPRODUCTION
INCREASEON 2013
PRODUCTION
16 OUR STRATEGY
(36) Socolow 2016, Fossil fuels and climate change – lessening the damage from the collision.
(37) Worley Parsons, Greenhouse Gas Emissions Study of Australian CSG to LNG, 2011.
(38) Reserve Bank of Australia. Bulletin. March quarter 2015.(39) Department of Industry, Innovation and Science, Resources
and Energy Quarterly, September Quarter 2015. (40) An energy pathway consistent with limiting the global
increase in temperature to 2°C by limiting the long term concentration of CO2 to 450ppm (a higher peak may occur around 2050) IEA, World Energy Outlook 2015.
(41) An energy scenario takes into account the policies and implementing measures affecting energy markets that had been adopted as of mid-2015 (as well as the energy-related components of climate pledges in the run-up to COP21, submitted by 1 October), together with relevant declared policy intentions, IEA, World Energy Outlook 2015.
CLEANER-BURNING NATURAL GAS WILL CONTINUE TO PLAY A CRITICAL ROLE IN MEETING THE WORLD’S GROWING DEMAND FOR ENERGY WHILE ALSO REDUCING CARBON EMISSIONS.
RELIABILITY AND THE ROLE OF NATURAL GASRenewable energy alone cannot deliver the levels of system reliability that customers have become used to and expect in Australia. The intermittent nature of renewable energy means that solar can only deliver energy during daylight hours, and wind can only do so in the right conditions.Customers and governments are not accustomed to, and will not tolerate, periods of low energy availability or blackouts. Energy storage is increasingly being considered as an option to assist, however, as noted, the cost of storage is not yet an economic proposition. Realistically, the lowest cost and most carbon-efficient method of ensuring system reliability is increased use of low-emission, flexible, gas-fired generation.Origin’s generation fleet is well positioned to benefit from a greater reliance on more affordable and flexible gas generation necessary to complement the intermittent supply of renewable energy. The uptake of renewable energy, particularly in South Australia, is already contributing to supply volatility that flows through to wholesale prices. This dynamic, which we believe will continue, is proving the value of gas and demonstrates the improving competitiveness of energy companies with diversity in their portfolio such as Origin.Cleaner-burning natural gas will continue to play a critical role in meeting the world’s growing demand for energy while also reducing carbon emissions. Substituting half the current carbon emissions from coal with gas, and thereby doubling global gas consumption, could generate an additional 3,000 exajoules of energy over a period of 40 years, while keeping emissions constant(36). To put this in perspective, 3,000 exajoules of additional energy could meet the aggregate demand of 12 countries with similar energy requirements to those of Australia for the next 40 years. An economically efficient and reliable way for Australia and the world to decarbonise its energy supply is to complement the development of renewable energy with increased gas-fired generation, displacing carbon-intensive coal-fired generation.Gas in liquid form is also safe to transport long distances. The emerging use of floating regasification units is providing an efficient and cost effective way for developing countries to process LNG shipments. Natural gas has also increased in importance, especially in Asia, due to its ability to lower air pollution. A Worley Parsons report found that each tonne of carbon emissions from LNG production in Australia reduces carbon emissions in China by 4.3 tonnes when this gas is used in place of conventional coal-fired electricity generation(37). Currently, China and Japan are the largest consumers of natural gas, with consumption increasing almost four-fold in the past decade(38).
The lower carbon profile of gas, together with its abundance and increasing ease of transport, underpins its status as the fastest growing fuel type across all the IEA projections, including under its 450 scenario, which seeks to limit global temperature increases to 2°C by limiting concentration of greenhouse gases in the atmosphere to around 450 parts per million of CO2.As well as meeting the growing demand for gas, the world will need to replenish its existing gas reserves. Under the IEA’s 450 scenario, the compound annual growth rates of new gas developments to 2040 is 2.3 per cent, of which approximately 1.6 per cent is required to replace supplies to meet existing demand and a further 0.7 per cent required to satisfy the expected increase in gas demand.By 2020, Australia is expected to rival Qatar as the world’s largest exporter of LNG. The prospects for LNG growth are underpinned by Australia’s proximity to Asia, existing infrastructure and skills. In the next five years, Australia’s LNG export volumes are expected to triple to more than 76 million tonnes per annum and Japan is expected to remain Australia’s largest LNG export customer. By 2020, China and South Korea will represent 25 per cent and 13 per cent of Australia’s LNG exports respectively(39).Origin’s strategy is to lower the cost of realising Australia’s vast onshore and near-shore gas resources and connect them to high-value markets. Origin is one of the largest producers of natural gas on Australia’s east coast with our 37.5 per cent interest in Australia Pacific LNG and exploration and production interests in Australia and New Zealand.Australia Pacific LNG is contracted to export approximately 8.6 million tonnes of LNG each year to customers in China and Japan under long-term contracts for approximately 20 years. The first shipment of LNG departed the Australia Pacific LNG facility on January 9 2016, with 27 LNG cargoes sold during the period, helping to displace coal. Australia Pacific LNG’s marginal cost structure and shipping advantage relative to US LNG exports supports continued development and production above contracted volumes.
OU
R DU
TY OF C
ARE
This section reports how we managed our social, environmental and economic sustainability aspects during the year. Detailed performance data for this year and previous years is set out in our Performance Data tables starting on page 53.
ALL EMPLOYEES AND CONTRACTORS ARE EMPOWERED TO STOP ANY ACTIVITY THEY FIND UNSAFE.
18 OUR DUTY OF CARE: SOCIAL ASPECTS
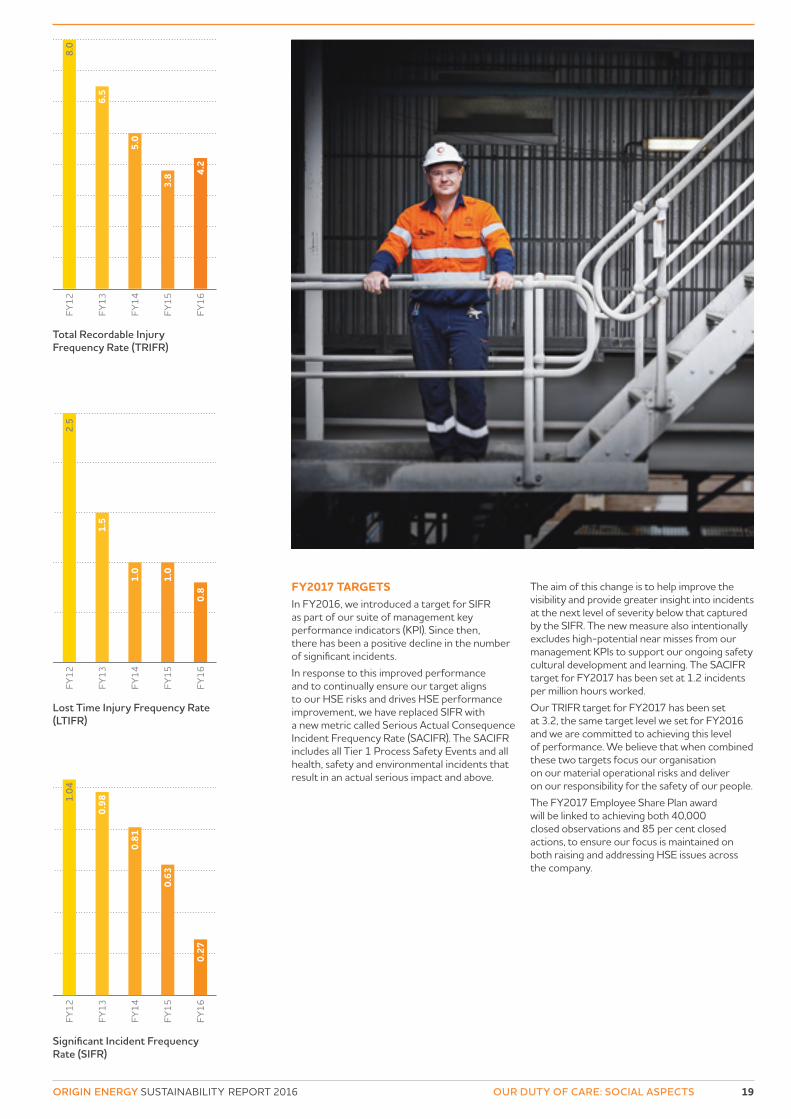
All employees and contractors are empowered to stop any activity they find unsafe. In FY2016, we met two of our three safety targets. The rate of significant incidents fell and our action closure rate improved. However, the frequency rate of recordable injuries increased and we will focus our efforts in FY2017 to address this.Health and safety in all Origin workplaces is governed by legislation and regulations applicable to those operations. At a minimum, we seek to meet these requirements and, where appropriate, we apply higher standards.Origin’s approach to health and safety is governed by the Health, Safety and Environment (HSE) Policy. This policy explains how we think about, plan and manage health, safety and environmental risks and initiatives across our business.In recognition of the importance of health and safety, Short-Term Incentives (STI) for our people are determined in part by health and safety performance.We continually measure our ongoing health and safety performance using metrics outlined below, and we foster a culture of safety awareness.
FY2016 PERFORMANCEOrigin’s primary measure of safety performance is the Total Recordable Injury Frequency Rate (TRIFR), which measures our company-wide work-related injuries per million hours worked.In FY2016, we recorded a TRIFR of 4.2 against our target of 3.2 for the period. Notwithstanding the increase in TRIFR, we had 79 injuries this year which was one third less than the 120 injuries recorded in FY2015. This reduction in injuries was more than offset by a reduction in exposure hours as Australia Pacific LNG commenced its transition from construction to sustained production, while our other projects in Energy Markets and Exploration & Production were scaled back.
Despite fewer injuries during the period, our TRIFR target for this year was not met. As such, the STI amounts allocated to safety were not paid.Our Lost Time Injury Frequency Rate (LTIFR) measures the frequency of injuries that result in an employee missing at least one full shift or work day per million hours worked. In FY2016, our LTIFR was 0.8, which is a reduction from 1.0 in FY2015. Since FY2012, our LTIFR has fallen by 68 per cent.Our Significant Incident Frequency Rate (SIFR) measures the HSE incidents that have resulted in a major consequence or had the potential to result in a critical or catastrophic consequence(42). They may result from the work environment, work process or behaviour. Analysing the SIFR allows us to focus our resources on the factors that will help prevent our most serious incidents. In FY2016, we achieved a result of 0.27 well below our 0.50 target. This result is due to a reduction in the number of significant incidents from the FY2015 period where our SIFR was 0.63.There were no fatalities associated with our work activities recorded during the reporting period.Observations are a key tool we use day-to-day in the workplace to recognise safe and unsafe behaviours and to identify, address and prevent hazards. The program was introduced in 2011, encouraging employees to record observations in an online database, and to take closure action to make the work environment safer or to improve behaviours.In FY2016, the Employee Share Plan was linked to the achievement of a closure rate of 85 per cent of actions by the original due date. This target was met. Our HSE action closure rate increased from 85.3 per cent in FY2015 to 87.3 per cent during the reporting period. In recognition of the achievement of our safety target the Board awarded $1,000 of Origin shares to all eligible employees.
At Origin, safety is our first priority. We believe that every one of our people should expect to return home safe at the end of every single day.
SOCIAL ASPECTS SAFETY OF OUR PEOPLE
(42) Per million hours worked. Calculated as ratio based on the number of significant incidents, divided by the number of hours worked over a 12-month period.
8.0
6.5
5.0
3.8 4.
2FY
16
FY15
FY14
FY13
FY12
Total Recordable Injury Frequency Rate (TRIFR)
2.5
1.5
1.0
1.0
0.8
FY16
FY15
FY14
FY13
FY12
Lost Time Injury Frequency Rate (LTIFR)
1.04
0.98
0.81
0.63
0.27
FY16
FY15
FY14
FY13
FY12
Significant Incident Frequency Rate (SIFR)
19ORIGIN ENERGY SUSTAINABILITY REPORT 2016 OUR DUTY OF CARE: SOCIAL ASPECTS
FY2017 TARGETSIn FY2016, we introduced a target for SIFR as part of our suite of management key performance indicators (KPI). Since then, there has been a positive decline in the number of significant incidents.In response to this improved performance and to continually ensure our target aligns to our HSE risks and drives HSE performance improvement, we have replaced SIFR with a new metric called Serious Actual Consequence Incident Frequency Rate (SACIFR). The SACIFR includes all Tier 1 Process Safety Events and all health, safety and environmental incidents that result in an actual serious impact and above.
The aim of this change is to help improve the visibility and provide greater insight into incidents at the next level of severity below that captured by the SIFR. The new measure also intentionally excludes high-potential near misses from our management KPIs to support our ongoing safety cultural development and learning. The SACIFR target for FY2017 has been set at 1.2 incidents per million hours worked.Our TRIFR target for FY2017 has been set at 3.2, the same target level we set for FY2016 and we are committed to achieving this level of performance. We believe that when combined these two targets focus our organisation on our material operational risks and deliver on our responsibility for the safety of our people.The FY2017 Employee Share Plan award will be linked to achieving both 40,000 closed observations and 85 per cent closed actions, to ensure our focus is maintained on both raising and addressing HSE issues across the company.
35
24
FY16
FY15
TIER 1 TIER 2
Process safety events
IN FY2016, WE ACHIEVED A
REDUCTION IN PROCESS SAFETY EVENTS.
25%
20 OUR DUTY OF CARE: SOCIAL ASPECTS
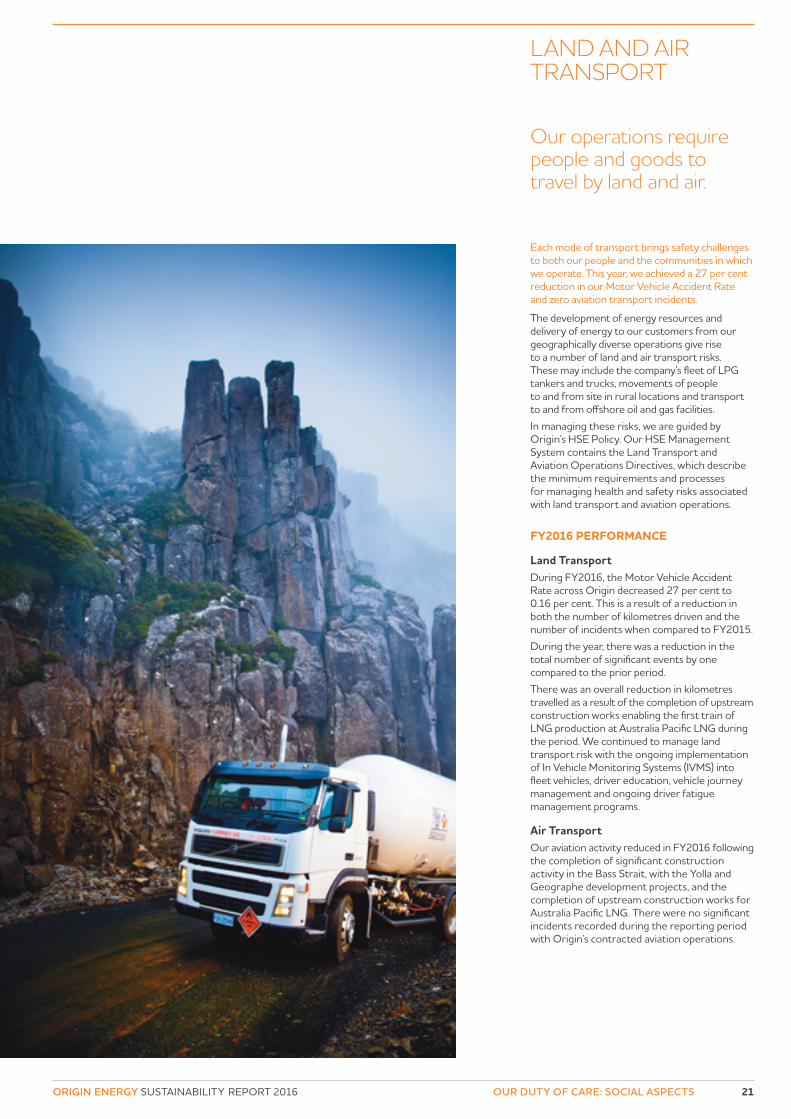
Our approach to process safety is designed to prevent major accidents that could impact the environment and the health and safety of members of the public and our people. We reduce our major accident risk by implementing and monitoring process safety controls at all of our assets. In FY2016 we achieved a 25 per cent reduction in process safety events. Process safety requires us to make sure our facilities are well designed, safely operated and properly maintained. We are committed to managing our assets and facilities safely, and we use recognised international standards backed by assurance programs and audits that test how well these standards are working. This year we reduced process safety events by 25 per cent and introduced process safety metrics to Management KPIs.Our process safety requirements are set out in our HSE Management System. We draw them from industry guidance from the UK Energy Institute, the International Association of Oil & Gas Producers (IOGP) and the American Institute of Chemical Engineers (AIChE) Center for Chemical Process Safety. We also undertake assurance activities to ensure that we maintain operational discipline in process safety.Our process safety performance is tracked using leading and lagging indicators, and reported to the management-level Operational Risk Committee as well as the Board Risk Committee.
FY2016 PERFORMANCEIn FY2016, we continued to implement elements of our Process Safety Management (PSM) Improvement Plan. During the reporting period, we incorporated performance-based, industry-benchmarked PSM requirements into our HSE Management System and continued to consolidate PSM practice.Additional leading metrics were included in the existing enterprise-wide process safety management KPIs. These include metrics for overdue process safety-related actions, process safety-related competencies, and operational discipline in implementing PSM requirements.We record process safety events as defined by the IOGP with four tiers of process safety events(43), and Tier 1 the most severe.During the period, there was a decrease in both Tier 1 and Tier 2 process safety events(44). In FY2016, there were two Tier 1 events, and four Tier 2 events.Tier 1 and Tier 2 events are investigated thoroughly, and independently where appropriate, with urgent measures put in place to reduce any immediate operating risk and longer-term measures put in place to mitigate reoccurrence. We also continue to record, investigate and examine trend data for lower-consequence process safety incidents, to ensure the integrity of our system.Assurance activities and audits occur at our assets and during FY2016, these processes did not identify any material findings that would prevent us from continuing to operate our assets safely.FY2017 will see the implementation of the final stage of Origin’s PSM Improvement Plan, focusing on improvements in the way we share and learn from process safety events. This stage will also seek to improve the enterprise-wide management of the competency of those in process-safety-related roles and those with safety critical roles.From FY2017, Tier 1 process safety events will be linked to management KPIs associated with the company’s Short Term Incentive program through the new Serious Actual Consequence Incident Frequency Rate. This will maintain management focus on this important element of the company’s overall safety performance.
PROCESS SAFETY
We operate and maintain a wide variety of equipment and facilities as part of operating our business.
(43) IOGP 2011. Process Safety – Recommended practice on key performance indicators.
(44) With the potential for a serious consequence or above, as defined by the Origin Risk Rating Toolkit.
25%
21ORIGIN ENERGY SUSTAINABILITY REPORT 2016 OUR DUTY OF CARE: SOCIAL ASPECTS
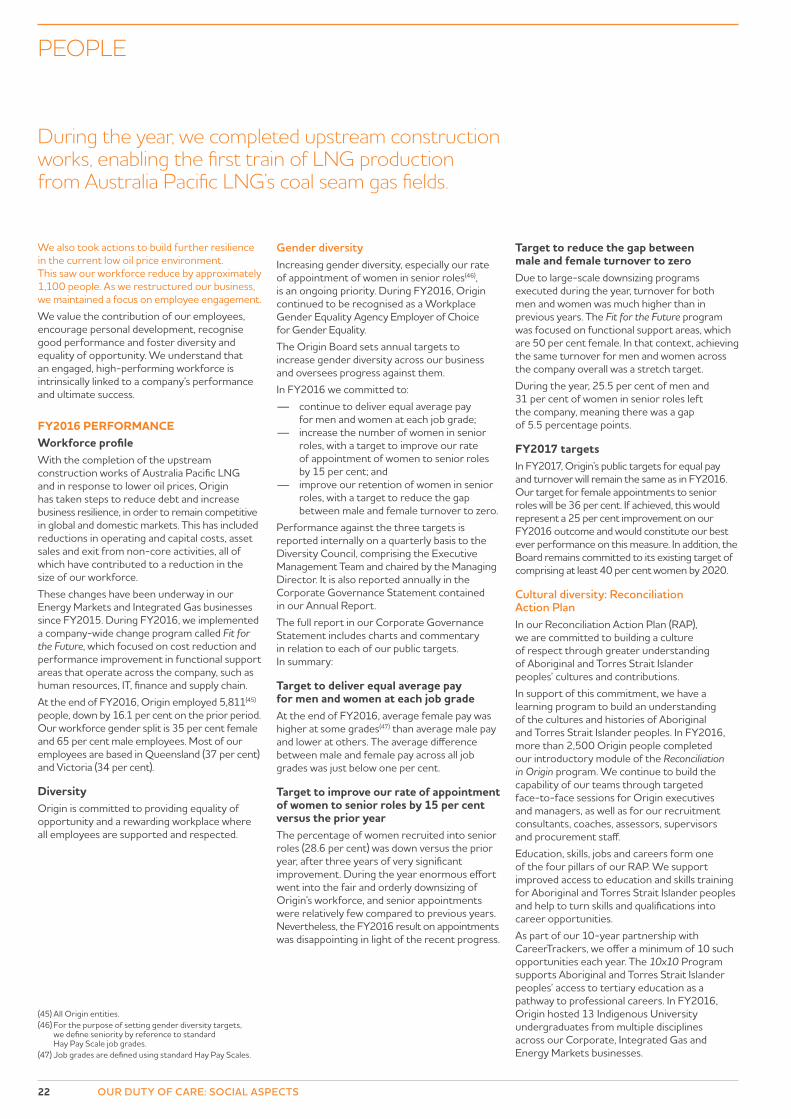
Each mode of transport brings safety challenges to both our people and the communities in which we operate. This year, we achieved a 27 per cent reduction in our Motor Vehicle Accident Rate and zero aviation transport incidents.
The development of energy resources and delivery of energy to our customers from our geographically diverse operations give rise to a number of land and air transport risks. These may include the company’s fleet of LPG tankers and trucks, movements of people to and from site in rural locations and transport to and from offshore oil and gas facilities.In managing these risks, we are guided by Origin’s HSE Policy. Our HSE Management System contains the Land Transport and Aviation Operations Directives, which describe the minimum requirements and processes for managing health and safety risks associated with land transport and aviation operations.
FY2016 PERFORMANCE
Land TransportDuring FY2016, the Motor Vehicle Accident Rate across Origin decreased 27 per cent to 0.16 per cent. This is a result of a reduction in both the number of kilometres driven and the number of incidents when compared to FY2015.During the year, there was a reduction in the total number of significant events by one compared to the prior period.There was an overall reduction in kilometres travelled as a result of the completion of upstream construction works enabling the first train of LNG production at Australia Pacific LNG during the period. We continued to manage land transport risk with the ongoing implementation of In Vehicle Monitoring Systems (IVMS) into fleet vehicles, driver education, vehicle journey management and ongoing driver fatigue management programs.
Air TransportOur aviation activity reduced in FY2016 following the completion of significant construction activity in the Bass Strait, with the Yolla and Geographe development projects, and the completion of upstream construction works for Australia Pacific LNG. There were no significant incidents recorded during the reporting period with Origin’s contracted aviation operations.
LAND AND AIR TRANSPORT
Our operations require people and goods to travel by land and air.
22 OUR DUTY OF CARE: SOCIAL ASPECTS
We also took actions to build further resilience in the current low oil price environment. This saw our workforce reduce by approximately 1,100 people. As we restructured our business, we maintained a focus on employee engagement.We value the contribution of our employees, encourage personal development, recognise good performance and foster diversity and equality of opportunity. We understand that an engaged, high-performing workforce is intrinsically linked to a company’s performance and ultimate success.
FY2016 PERFORMANCEWorkforce profileWith the completion of the upstream construction works of Australia Pacific LNG and in response to lower oil prices, Origin has taken steps to reduce debt and increase business resilience, in order to remain competitive in global and domestic markets. This has included reductions in operating and capital costs, asset sales and exit from non-core activities, all of which have contributed to a reduction in the size of our workforce.These changes have been underway in our Energy Markets and Integrated Gas businesses since FY2015. During FY2016, we implemented a company-wide change program called Fit for the Future, which focused on cost reduction and performance improvement in functional support areas that operate across the company, such as human resources, IT, finance and supply chain.At the end of FY2016, Origin employed 5,811(45) people, down by 16.1 per cent on the prior period. Our workforce gender split is 35 per cent female and 65 per cent male employees. Most of our employees are based in Queensland (37 per cent) and Victoria (34 per cent).
DiversityOrigin is committed to providing equality of opportunity and a rewarding workplace where all employees are supported and respected.
Gender diversityIncreasing gender diversity, especially our rate of appointment of women in senior roles(46), is an ongoing priority. During FY2016, Origin continued to be recognised as a Workplace Gender Equality Agency Employer of Choice for Gender Equality.The Origin Board sets annual targets to increase gender diversity across our business and oversees progress against them.In FY2016 we committed to:
— continue to deliver equal average pay for men and women at each job grade;
— increase the number of women in senior roles, with a target to improve our rate of appointment of women to senior roles by 15 per cent; and
— improve our retention of women in senior roles, with a target to reduce the gap between male and female turnover to zero.
Performance against the three targets is reported internally on a quarterly basis to the Diversity Council, comprising the Executive Management Team and chaired by the Managing Director. It is also reported annually in the Corporate Governance Statement contained in our Annual Report.The full report in our Corporate Governance Statement includes charts and commentary in relation to each of our public targets. In summary:
Target to deliver equal average pay for men and women at each job gradeAt the end of FY2016, average female pay was higher at some grades(47) than average male pay and lower at others. The average difference between male and female pay across all job grades was just below one per cent.
Target to improve our rate of appointment of women to senior roles by 15 per cent versus the prior yearThe percentage of women recruited into senior roles (28.6 per cent) was down versus the prior year, after three years of very significant improvement. During the year enormous effort went into the fair and orderly downsizing of Origin’s workforce, and senior appointments were relatively few compared to previous years. Nevertheless, the FY2016 result on appointments was disappointing in light of the recent progress.
Target to reduce the gap between male and female turnover to zeroDue to large-scale downsizing programs executed during the year, turnover for both men and women was much higher than in previous years. The Fit for the Future program was focused on functional support areas, which are 50 per cent female. In that context, achieving the same turnover for men and women across the company overall was a stretch target.During the year, 25.5 per cent of men and 31 per cent of women in senior roles left the company, meaning there was a gap of 5.5 percentage points.
FY2017 targetsIn FY2017, Origin’s public targets for equal pay and turnover will remain the same as in FY2016. Our target for female appointments to senior roles will be 36 per cent. If achieved, this would represent a 25 per cent improvement on our FY2016 outcome and would constitute our best ever performance on this measure. In addition, the Board remains committed to its existing target of comprising at least 40 per cent women by 2020.
Cultural diversity: Reconciliation Action PlanIn our Reconciliation Action Plan (RAP), we are committed to building a culture of respect through greater understanding of Aboriginal and Torres Strait Islander peoples’ cultures and contributions.In support of this commitment, we have a learning program to build an understanding of the cultures and histories of Aboriginal and Torres Strait Islander peoples. In FY2016, more than 2,500 Origin people completed our introductory module of the Reconciliation in Origin program. We continue to build the capability of our teams through targeted face-to-face sessions for Origin executives and managers, as well as for our recruitment consultants, coaches, assessors, supervisors and procurement staff.Education, skills, jobs and careers form one of the four pillars of our RAP. We support improved access to education and skills training for Aboriginal and Torres Strait Islander peoples and help to turn skills and qualifications into career opportunities.As part of our 10-year partnership with CareerTrackers, we offer a minimum of 10 such opportunities each year. The 10x10 Program supports Aboriginal and Torres Strait Islander peoples’ access to tertiary education as a pathway to professional careers. In FY2016, Origin hosted 13 Indigenous University undergraduates from multiple disciplines across our Corporate, Integrated Gas and Energy Markets businesses.
PEOPLE
During the year, we completed upstream construction works, enabling the first train of LNG production from Australia Pacific LNG’s coal seam gas fields.
(45) All Origin entities.(46) For the purpose of setting gender diversity targets,
we define seniority by reference to standard Hay Pay Scale job grades.
(47) Job grades are defined using standard Hay Pay Scales.
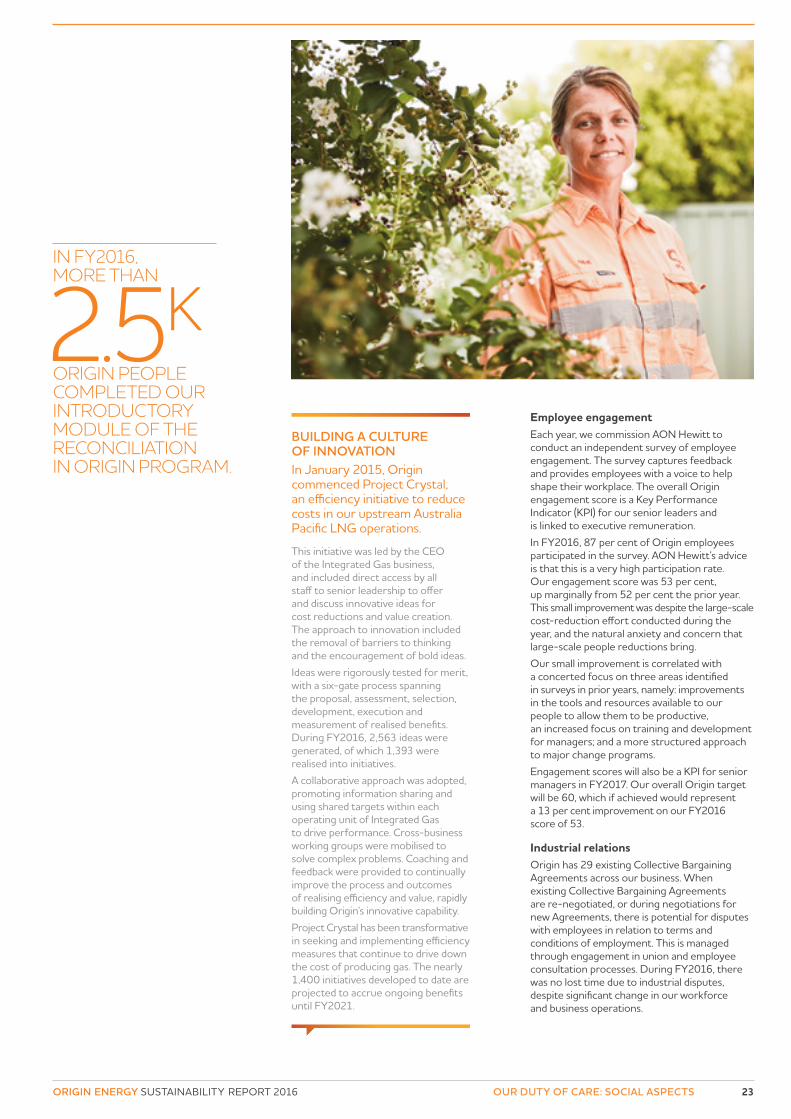
IN FY2016, MORE THAN
ORIGIN PEOPLE COMPLETED OUR INTRODUCTORY MODULE OF THE RECONCILIATION IN ORIGIN PROGRAM.
2.5K
23ORIGIN ENERGY SUSTAINABILITY REPORT 2016 OUR DUTY OF CARE: SOCIAL ASPECTS
Employee engagementEach year, we commission AON Hewitt to conduct an independent survey of employee engagement. The survey captures feedback and provides employees with a voice to help shape their workplace. The overall Origin engagement score is a Key Performance Indicator (KPI) for our senior leaders and is linked to executive remuneration.In FY2016, 87 per cent of Origin employees participated in the survey. AON Hewitt’s advice is that this is a very high participation rate. Our engagement score was 53 per cent, up marginally from 52 per cent the prior year. This small improvement was despite the large-scale cost-reduction effort conducted during the year, and the natural anxiety and concern that large-scale people reductions bring.Our small improvement is correlated with a concerted focus on three areas identified in surveys in prior years, namely: improvements in the tools and resources available to our people to allow them to be productive, an increased focus on training and development for managers; and a more structured approach to major change programs.Engagement scores will also be a KPI for senior managers in FY2017. Our overall Origin target will be 60, which if achieved would represent a 13 per cent improvement on our FY2016 score of 53.
Industrial relationsOrigin has 29 existing Collective Bargaining Agreements across our business. When existing Collective Bargaining Agreements are re-negotiated, or during negotiations for new Agreements, there is potential for disputes with employees in relation to terms and conditions of employment. This is managed through engagement in union and employee consultation processes. During FY2016, there was no lost time due to industrial disputes, despite significant change in our workforce and business operations.
BUILDING A CULTURE OF INNOVATIONIn January 2015, Origin commenced Project Crystal, an efficiency initiative to reduce costs in our upstream Australia Pacific LNG operations.
This initiative was led by the CEO of the Integrated Gas business, and included direct access by all staff to senior leadership to offer and discuss innovative ideas for cost reductions and value creation. The approach to innovation included the removal of barriers to thinking and the encouragement of bold ideas.Ideas were rigorously tested for merit, with a six-gate process spanning the proposal, assessment, selection, development, execution and measurement of realised benefits. During FY2016, 2,563 ideas were generated, of which 1,393 were realised into initiatives.A collaborative approach was adopted, promoting information sharing and using shared targets within each operating unit of Integrated Gas to drive performance. Cross-business working groups were mobilised to solve complex problems. Coaching and feedback were provided to continually improve the process and outcomes of realising efficiency and value, rapidly building Origin’s innovative capability.Project Crystal has been transformative in seeking and implementing efficiency measures that continue to drive down the cost of producing gas. The nearly 1,400 initiatives developed to date are projected to accrue ongoing benefits until FY2021.
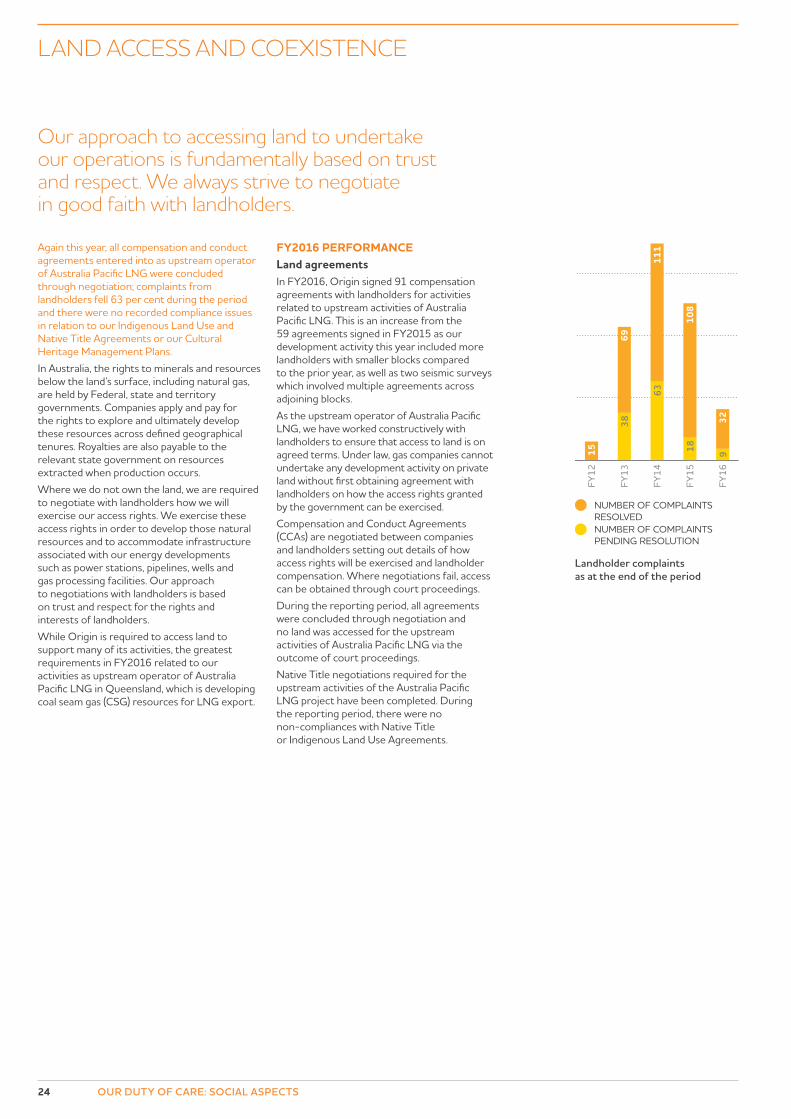
15
38
63
69
111
108
32
18 9FY
16
FY15
FY14
FY13
FY12
NUMBER OF COMPLAINTS RESOLVEDNUMBER OF COMPLAINTS PENDING RESOLUTION
Landholder complaints as at the end of the period
24 OUR DUTY OF CARE: SOCIAL ASPECTS
Again this year, all compensation and conduct agreements entered into as upstream operator of Australia Pacific LNG were concluded through negotiation; complaints from landholders fell 63 per cent during the period and there were no recorded compliance issues in relation to our Indigenous Land Use and Native Title Agreements or our Cultural Heritage Management Plans.In Australia, the rights to minerals and resources below the land’s surface, including natural gas, are held by Federal, state and territory governments. Companies apply and pay for the rights to explore and ultimately develop these resources across defined geographical tenures. Royalties are also payable to the relevant state government on resources extracted when production occurs.Where we do not own the land, we are required to negotiate with landholders how we will exercise our access rights. We exercise these access rights in order to develop those natural resources and to accommodate infrastructure associated with our energy developments such as power stations, pipelines, wells and gas processing facilities. Our approach to negotiations with landholders is based on trust and respect for the rights and interests of landholders.While Origin is required to access land to support many of its activities, the greatest requirements in FY2016 related to our activities as upstream operator of Australia Pacific LNG in Queensland, which is developing coal seam gas (CSG) resources for LNG export.
FY2016 PERFORMANCELand agreementsIn FY2016, Origin signed 91 compensation agreements with landholders for activities related to upstream activities of Australia Pacific LNG. This is an increase from the 59 agreements signed in FY2015 as our development activity this year included more landholders with smaller blocks compared to the prior year, as well as two seismic surveys which involved multiple agreements across adjoining blocks.As the upstream operator of Australia Pacific LNG, we have worked constructively with landholders to ensure that access to land is on agreed terms. Under law, gas companies cannot undertake any development activity on private land without first obtaining agreement with landholders on how the access rights granted by the government can be exercised.Compensation and Conduct Agreements (CCAs) are negotiated between companies and landholders setting out details of how access rights will be exercised and landholder compensation. Where negotiations fail, access can be obtained through court proceedings.During the reporting period, all agreements were concluded through negotiation and no land was accessed for the upstream activities of Australia Pacific LNG via the outcome of court proceedings.Native Title negotiations required for the upstream activities of the Australia Pacific LNG project have been completed. During the reporting period, there were no non-compliances with Native Title or Indigenous Land Use Agreements.
LAND ACCESS AND COEXISTENCE
Our approach to accessing land to undertake our operations is fundamentally based on trust and respect. We always strive to negotiate in good faith with landholders.
25ORIGIN ENERGY SUSTAINABILITY REPORT 2016 OUR DUTY OF CARE: SOCIAL ASPECTS
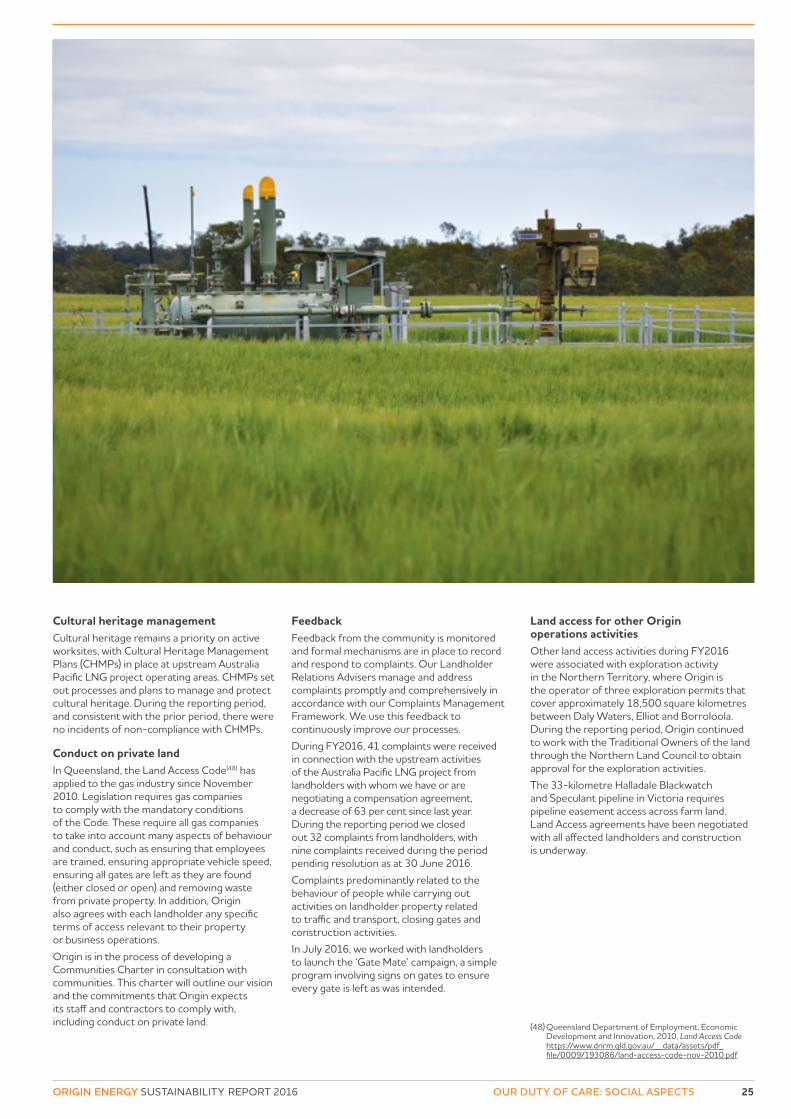
Cultural heritage managementCultural heritage remains a priority on active worksites, with Cultural Heritage Management Plans (CHMPs) in place at upstream Australia Pacific LNG project operating areas. CHMPs set out processes and plans to manage and protect cultural heritage. During the reporting period, and consistent with the prior period, there were no incidents of non-compliance with CHMPs.
Conduct on private landIn Queensland, the Land Access Code(48) has applied to the gas industry since November 2010. Legislation requires gas companies to comply with the mandatory conditions of the Code. These require all gas companies to take into account many aspects of behaviour and conduct, such as ensuring that employees are trained, ensuring appropriate vehicle speed, ensuring all gates are left as they are found (either closed or open) and removing waste from private property. In addition, Origin also agrees with each landholder any specific terms of access relevant to their property or business operations.Origin is in the process of developing a Communities Charter in consultation with communities. This charter will outline our vision and the commitments that Origin expects its staff and contractors to comply with, including conduct on private land.
FeedbackFeedback from the community is monitored and formal mechanisms are in place to record and respond to complaints. Our Landholder Relations Advisers manage and address complaints promptly and comprehensively in accordance with our Complaints Management Framework. We use this feedback to continuously improve our processes.During FY2016, 41 complaints were received in connection with the upstream activities of the Australia Pacific LNG project from landholders with whom we have or are negotiating a compensation agreement, a decrease of 63 per cent since last year. During the reporting period we closed out 32 complaints from landholders, with nine complaints received during the period pending resolution as at 30 June 2016.Complaints predominantly related to the behaviour of people while carrying out activities on landholder property related to traffic and transport, closing gates and construction activities.In July 2016, we worked with landholders to launch the ‘Gate Mate’ campaign, a simple program involving signs on gates to ensure every gate is left as was intended.
Land access for other Origin operations activitiesOther land access activities during FY2016 were associated with exploration activity in the Northern Territory, where Origin is the operator of three exploration permits that cover approximately 18,500 square kilometres between Daly Waters, Elliot and Borroloola. During the reporting period, Origin continued to work with the Traditional Owners of the land through the Northern Land Council to obtain approval for the exploration activities.The 33-kilometre Halladale Blackwatch and Speculant pipeline in Victoria requires pipeline easement access across farm land. Land Access agreements have been negotiated with all affected landholders and construction is underway.
(48) Queensland Department of Employment, Economic Development and Innovation, 2010, Land Access Code https://www.dnrm.qld.gov.au/__data/assets/pdf_file/0009/193086/land-access-code-nov-2010.pdf
26 OUR DUTY OF CARE: SOCIAL ASPECTS
IMPACT ON COMMUNITIES
Typically this infrastructure is located in rural and regional areas and we remain in these locations for long periods of time. Community complaints fell by 44 per cent during the period as we completed upstream construction works at Australia Pacific LNG. Our largest asset with the most significant and widespread potential impact on its neighbouring communities is our interest in Australia Pacific LNG, where Origin is also the upstream operator. As we completed upstream construction works enabling the first train of LNG production from our coal seam gas fields, the nature of impacts has changed.
FY2016 PERFORMANCEManaging impacts on communities at Australia Pacific LNGAustralia Pacific LNG’s approvals were subject to extensive environmental and Social Impact Assessments (SIA), and regulated management of potential impacts.In FY2015, Origin, on behalf of Australia Pacific LNG, conducted a voluntary SIA to better understand the impacts associated with the transition of the Australia Pacific LNG project from construction to operations and to find new ways to address them.The most significant impacts and concerns for local communities identified by the SIA and informal consultations held during the year were:
— property access and construction; — economic impacts of the reduction
in large scale construction activity; — environmental concerns; and — uncertainty about Origin’s future
development plans and commitment to the region.
In response, Origin is building a community planning and performance cycle for the duration of the operational phase of Australia Pacific LNG which will address impacts and concerns identified each year. Key aspects of this plan in FY2016 were:
— the development of a Communities Charter that sets our expectations for how we will operate in communities;
— actions to improve regional economic participation (see Economic value generated and distributed page 45);
— increasing community participation in addressing health and environmental concerns; and
— broadening and deepening stakeholder engagement.
During the period, Origin, on behalf of Australia Pacific LNG, also entered into a partnership with Western Downs Regional Council to support the development of tourism initiatives within the region. This was developed in response to community aspirations for economic diversification following the transition of CSG to LNG projects from construction to operations. The $1.4 million initiative, with $750,000 contributed from Australia Pacific LNG, includes the development of community-led tourism action plans and initiatives.
Social Impact Assessment for Eraring Power StationDuring FY2016, Origin conducted a voluntary SIA for Eraring Power Station.The findings indicated the most significant concerns for the local community were employment opportunities, environmental management and the impact of traffic. The SIA also highlighted the ongoing importance of regular communication with members of the local community. Origin will continue to meet with the Eraring community through a quarterly community forum, providing an update on site activities and community initiatives along with an opportunity to raise questions.
Responding to community complaintsComplaints from community members are an indicator of our performance in communities as well as a reflection of community experience of our activities.During the period, we recorded 91 complaints from community members across our Integrated Gas and Energy Markets activities(49). Around half of these complaints related to activities of the upstream activities of the Australia Pacific LNG project, and predominately related to behaviour of people while carrying out activities on landholders’ property.In addition to our activities at Australia Pacific LNG, complaints and concerns were raised during the period in relation to our Otway gas plant in Victoria, particularly relating to noise and air emissions. Origin has worked closely with the State Government and neighbouring residents to seek to address these concerns through additional testing and monitoring, and optimising equipment where applicable.At the end of the reporting period, 83 complaints had been resolved(50).
Our activities involve the construction and operation of large-scale infrastructure such as power stations, gas processing facilities, pipelines as well as smaller-scale infrastructure such as gas wells.
(49) This includes complaints received from landholders in relation to the Australia Pacific LNG project, reported under the Land access and coexistence section of this report.
(50) This includes complaints from prior periods resolved during this period.

157
621
917
1,57
9FY
16
FY15
FY14
FY13
Customers accounts registered for e-billing (000’s)
Ombudsman complaints per 1,000 customers
7.2
9.2
6.6
5.0
3.4
FY16
FY15
FY14
FY13
FY12
Calls per customer
1.6
1.3
1.2 1.
3FY
16
FY15
FY14
FY13
27ORIGIN ENERGY SUSTAINABILITY REPORT 2016 OUR DUTY OF CARE: SOCIAL ASPECTS
CUSTOMER CARE
This year, we lifted service experience, launched innovative, market-first products and invested in supporting the most vulnerable customers through our leading hardship program, Power On. The number of people who would recommend Origin to a family or friend rose, as did customer feedback following an interaction with Origin, whilst complaints to the Ombudsman(51) fell 30 per cent. We continue to accelerate our customer-first agenda, progressively launching innovations in product and digital services. We recognise the importance of energy affordability and remain steadfastly resolved to supporting vulnerable customers and working closely with community partners. Origin is a leading provider of energy to homes and businesses across Australia, with over 4.2 million customer accounts. At the end of the 2016 financial year, this included 2.7 million electricity customer accounts, 1.1 million natural gas customer accounts and 387,000 LPG customer accounts.Our customer accounts remained relatively steady from the previous reporting period. In FY2016, there was an increase in natural gas and LPG customer accounts, offset by a reduced number of electricity accounts.
FY2016 PERFORMANCEImproving customer experienceWhile our Strategic Net Promoter Score (NPS) measures the relationship stakeholders have with brand ‘Origin’, our Interaction NPS is similar to a customer satisfaction score, and we use it as a key measure of customer experience. We ask our customers how likely they would be to recommend Origin to family or friends after a recent interaction with us. We use this information to identify key issues with a customer’s experience with Origin and work to solve them.Since we started tracking Interaction NPS in September 2015 we have seen an improvement from +6.3 to +12.3 at the end of FY2016.The methodology polls customer feedback across all customer facing teams in our retail, solar and LPG businesses, covering activity from phone calls, to LPG truck deliveries, and solar PV system installations. This measure cascaded to agents in the form of shared KPIs, ensuring visibility and business engagement.
During the reporting period, we made improvements in our digitally enabled service design, to support enhanced customer experiences and services. We continued our focus on helping customers interact with us when they want, and how they like. Our extended call centre hours continued to offer customers more freedom to get in touch when it suited them. The new and improved ‘My Account’ allows customers to see when and where their energy is being used, review their bills and pay them online or predict the cost of their next bill.Following an extensive customer research program this year, we redesigned our energy bills, making them easier to read and understand. Customer feedback was used to focus on the key information and charges customers wanted to know, and reduced the amount of unwanted information. During the year we also increased our paperless billing, with about 1.6 million customer accounts having taken up e-billing to the end of the period.Our social and digital media activity increased in FY2016 allowing us to engage key audiences, provide broader communication, respond to issues, and more actively manage our reputation.Despite increased competition, the number of calls per customer has remained relatively steady this year. Since FY2013, the number of calls per customer has fallen from 1.6 to 1.3 calls per customer in FY2016.If a customer feels that an issue they have experienced with Origin has not been addressed by the company, they can have the matter reviewed by the relevant Ombudsman in their state or territory.In FY2016, we had 3.4 Ombudsman complaints per 1,000 customers – which is an improvement on the 5.0 from the prior period. This result reflects a number of recent improvements, including ongoing investment to stabilise our core business platforms and a reduction in our late bills. We have also addressed backlogs in our back-of-house processing methods, which has improved the turnaround of key functions and reduced complaints. This result continues the downward trend in Ombudsman complaints since FY2013.
Our commitment is to create value for our customers through a culture that puts our customers firmly at the centre of all our decisions and actions.
(51) Per 1,000 customers.
28 OUR DUTY OF CARE: SOCIAL ASPECTS
Innovative productsEnergy retailing in Australia is highly competitive. We aspire to be first to market with innovative new products that meet customer needs, based on strong consumer insights that we collect and analyse.
Predictable energy billsDuring FY2016, we launched Predictable Plan. The first such plan in Australia, Predictable Plan allows customers to pay a fixed fortnightly or monthly amount for 12 months, regardless of how much energy they use. Initially available to our existing customers, it aims to reduce ‘bill shock’ and ease budgeting for customers with regular fortnightly or monthly payments.
Low-carbon product solutionsWe are committed to becoming Australia’s leading renewable and low carbon energy provider, and in FY2016 continued to help our customers support renewable sources of electricity.We continued to offer our Residential and Business customers flexible GreenPower options, giving them the chance to nominate the percentage of power they would like us to match with GreenPower-accredited renewable sources (from 25 per cent to 100 per cent). For Green Gas, we purchase greenhouse gas offsets that are equal to the customer’s estimated emissions. In FY2016, we were the only retailer in Australia to offer this product. At the end of the reporting period, we had around 195,000 green energy customer accounts, making us one of Australia’s largest providers of GreenPower and Green Gas products(52).At the end of the reporting period, 411,266 Origin customers had solar installations at their properties. During the reporting period, we sold solar PV systems with a total capacity of 21 MW. At the end of FY2016, Origin had installed more than 82,700 solar PV systems.
Extending beyond grid-based energy supplyIn FY2015, we introduced Solar as a Service, an innovative way for customers to benefit from solar panels, without having to purchase, or pay to maintain, the system. Through Solar as a Service Origin owns, installs and maintains the system throughout the life of the contract and the customer receives the energy produced by the solar system at a price generally lower than their conventional tariff. In January this year we launched Origin Solar Repairs, offering end-to-end solar solutions through the service and repair of solar PV systems.As more customers begin to search for low-carbon energy solutions, we are also investing in battery storage analysis and product review. In FY2016, we released our Origin Solar + Powerwall energy solution. The collaboration combines our extensive experience with energy and solar PV with Tesla Energy’s leading knowledge in energy storage systems, so our customers can optimise the use of their solar energy in their home.In June this year we announced our largest embedded electricity project in partnership with Lendlease in Melbourne’s Victoria Harbour precinct. An Embedded Energy Network (EEN) is created when a building containing a number of tenants is fed through a single supply point and energy is then on-sold to residents, helping to deliver reduced electricity rates.Origin’s Acumen Metering business provides metering, data management and energy intelligence services. Servicing billable meters across electricity, water and solar sites, Acumen meters deliver customers with insights into energy usage via an online portal. These insights also provide a foundation for our product innovation and differentiation, enhancing our ability to deliver a strong customer experience. This year, we continued to accelerate our deployment of advanced meters for customers, starting with customers whose meter box had typically been difficult to access. This allows us to improve the customer experience by reducing the frequency of estimated bills.
Financial support optionsEnergy plays an essential part in all of our lives, but energy can lead to pressures for some Australians who are experiencing short-term or long-term financial hardship.Origin’s formal hardship program Power On offers referrals to financial counselling services, flexible payment options, free home energy audits and energy efficiency information to help customers manage their energy bills. A customer entering this program works with Origin to reduce energy usage to sustainable levels and repay their debt over a longer period. In 2014 Power On was recognised in a survey undertaken by the Financial and Consumer Rights Council as the industry leader in handling customers’ financial hardship issues.At the end of FY2016, 23,526 customers were being supported through Power On, remaining steady from 23,453 last year. During the reporting period, 4,798 customers paid off their debts and successfully completed the program.
Regulatory requirementsOrigin is required to submit quarterly performance indicator reports to both the Australian Energy Regulator (AER) and Essential Services Commission of Victoria (ESCV), as well as report compliance breaches according to a prescribed schedule.In FY2016, Origin reported issues relating to, in general terms, late bills, wrongful disconnections, bill content, late customer notification of a price change, explicit informed consent and overcharging on customer bills. No financial penalties were received in relation to these non-compliances.
(52) National GreenPower Accreditation Program Status Report, Q4 2015.
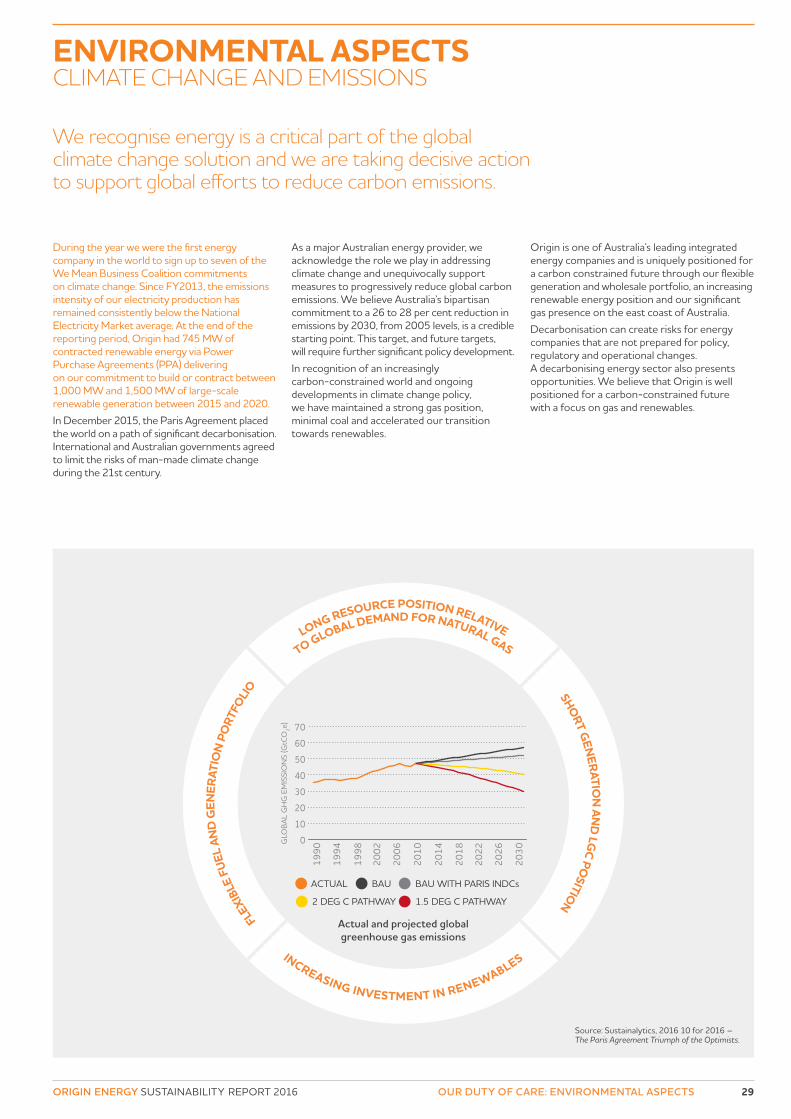
Source: Sustainalytics, 2016 10 for 2016 – The Paris Agreement Triumph of the Optimists.
1990
1994
1998
2010
2002
2006
2014
2018
2022
2026
2030
0
10
20
30
40
50
60
70
GLO
BA
L G
HG
EM
ISSI
ON
S (G
tCO
2e)
FLEX
IBLE
FUE
L AN
D G
ENER
ATIO
N P
ORT
FOLIO
INCREASING INVESTMENT IN RENEWABLES
SHORT G
ENERATIO
N AN
D LG
C POSITIO
N
LONG RESOURCE POSITION RELATIVE
TO GLOBAL DEMAND FOR NATURAL GAS
Actual and projected global greenhouse gas emissions
ACTUAL BAU BAU WITH PARIS INDCs
1.5 DEG C PATHWAY2 DEG C PATHWAY
29ORIGIN ENERGY SUSTAINABILITY REPORT 2016 OUR DUTY OF CARE: ENVIRONMENTAL ASPECTS
We recognise energy is a critical part of the global climate change solution and we are taking decisive action to support global efforts to reduce carbon emissions.
ENVIRONMENTAL ASPECTS CLIMATE CHANGE AND EMISSIONS
During the year we were the first energy company in the world to sign up to seven of the We Mean Business Coalition commitments on climate change. Since FY2013, the emissions intensity of our electricity production has remained consistently below the National Electricity Market average. At the end of the reporting period, Origin had 745 MW of contracted renewable energy via Power Purchase Agreements (PPA) delivering on our commitment to build or contract between 1,000 MW and 1,500 MW of large-scale renewable generation between 2015 and 2020.In December 2015, the Paris Agreement placed the world on a path of significant decarbonisation. International and Australian governments agreed to limit the risks of man-made climate change during the 21st century.
As a major Australian energy provider, we acknowledge the role we play in addressing climate change and unequivocally support measures to progressively reduce global carbon emissions. We believe Australia’s bipartisan commitment to a 26 to 28 per cent reduction in emissions by 2030, from 2005 levels, is a credible starting point. This target, and future targets, will require further significant policy development.In recognition of an increasingly carbon-constrained world and ongoing developments in climate change policy, we have maintained a strong gas position, minimal coal and accelerated our transition towards renewables.
Origin is one of Australia’s leading integrated energy companies and is uniquely positioned for a carbon constrained future through our flexible generation and wholesale portfolio, an increasing renewable energy position and our significant gas presence on the east coast of Australia. Decarbonisation can create risks for energy companies that are not prepared for policy, regulatory and operational changes. A decarbonising energy sector also presents opportunities. We believe that Origin is well positioned for a carbon-constrained future with a focus on gas and renewables.
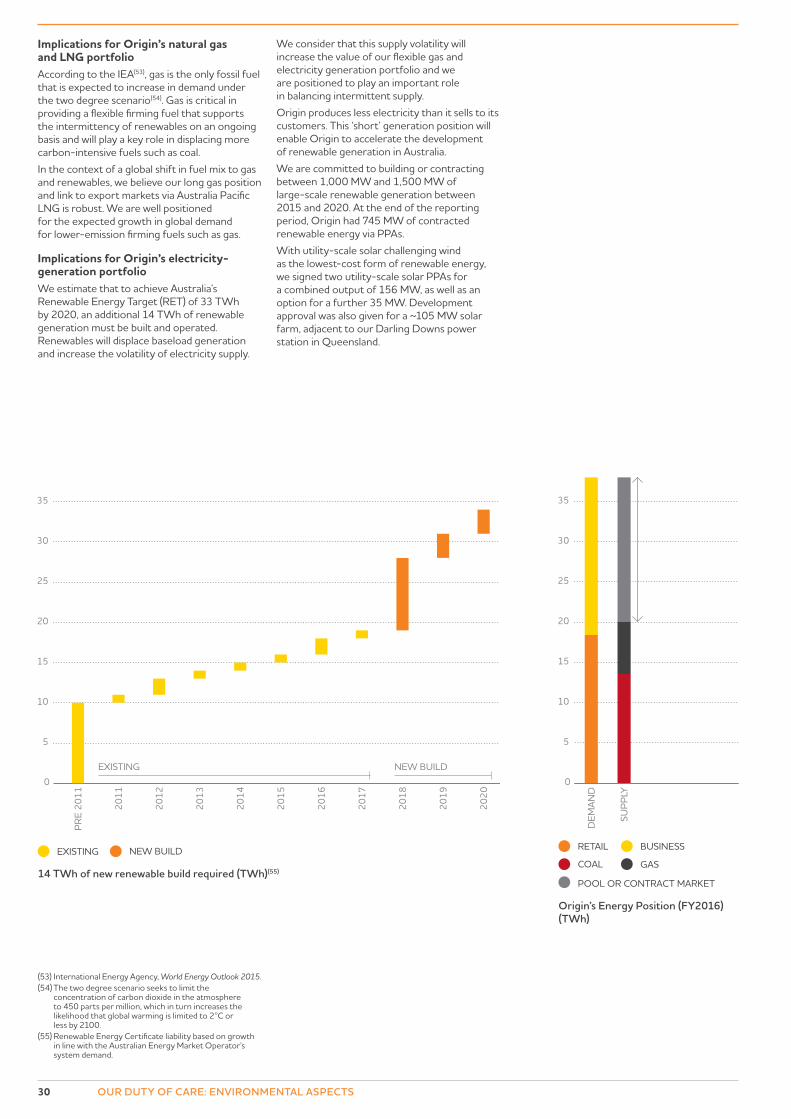
30 OUR DUTY OF CARE: ENVIRONMENTAL ASPECTS
Implications for Origin’s natural gas and LNG portfolioAccording to the IEA(53), gas is the only fossil fuel that is expected to increase in demand under the two degree scenario(54). Gas is critical in providing a flexible firming fuel that supports the intermittency of renewables on an ongoing basis and will play a key role in displacing more carbon-intensive fuels such as coal.In the context of a global shift in fuel mix to gas and renewables, we believe our long gas position and link to export markets via Australia Pacific LNG is robust. We are well positioned for the expected growth in global demand for lower-emission firming fuels such as gas.
Implications for Origin’s electricity-generation portfolioWe estimate that to achieve Australia’s Renewable Energy Target (RET) of 33 TWh by 2020, an additional 14 TWh of renewable generation must be built and operated. Renewables will displace baseload generation and increase the volatility of electricity supply.
We consider that this supply volatility will increase the value of our flexible gas and electricity generation portfolio and we are positioned to play an important role in balancing intermittent supply.Origin produces less electricity than it sells to its customers. This ‘short’ generation position will enable Origin to accelerate the development of renewable generation in Australia.We are committed to building or contracting between 1,000 MW and 1,500 MW of large-scale renewable generation between 2015 and 2020. At the end of the reporting period, Origin had 745 MW of contracted renewable energy via PPAs.With utility-scale solar challenging wind as the lowest-cost form of renewable energy, we signed two utility-scale solar PPAs for a combined output of 156 MW, as well as an option for a further 35 MW. Development approval was also given for a ~105 MW solar farm, adjacent to our Darling Downs power station in Queensland.
14 TWh of new renewable build required (TWh)(55)
0
5
10
15
20
25
30
35
PR
E 20
11
2011
2012
2013
2014
2015
2016
2017
2018
2019
2020
EXISTING
EXISTING
NEW BUILD
NEW BUILD
SUP
PLY
DEM
AN
D
RETAIL
COAL
POOL OR CONTRACT MARKET
BUSINESS
GAS
0
5
10
15
20
25
30
35
Origin’s Energy Position (FY2016) (TWh)
(53) International Energy Agency, World Energy Outlook 2015.(54) The two degree scenario seeks to limit the
concentration of carbon dioxide in the atmosphere to 450 parts per million, which in turn increases the likelihood that global warming is limited to 2°C or less by 2100.
(55) Renewable Energy Certificate liability based on growth in line with the Australian Energy Market Operator’s system demand.
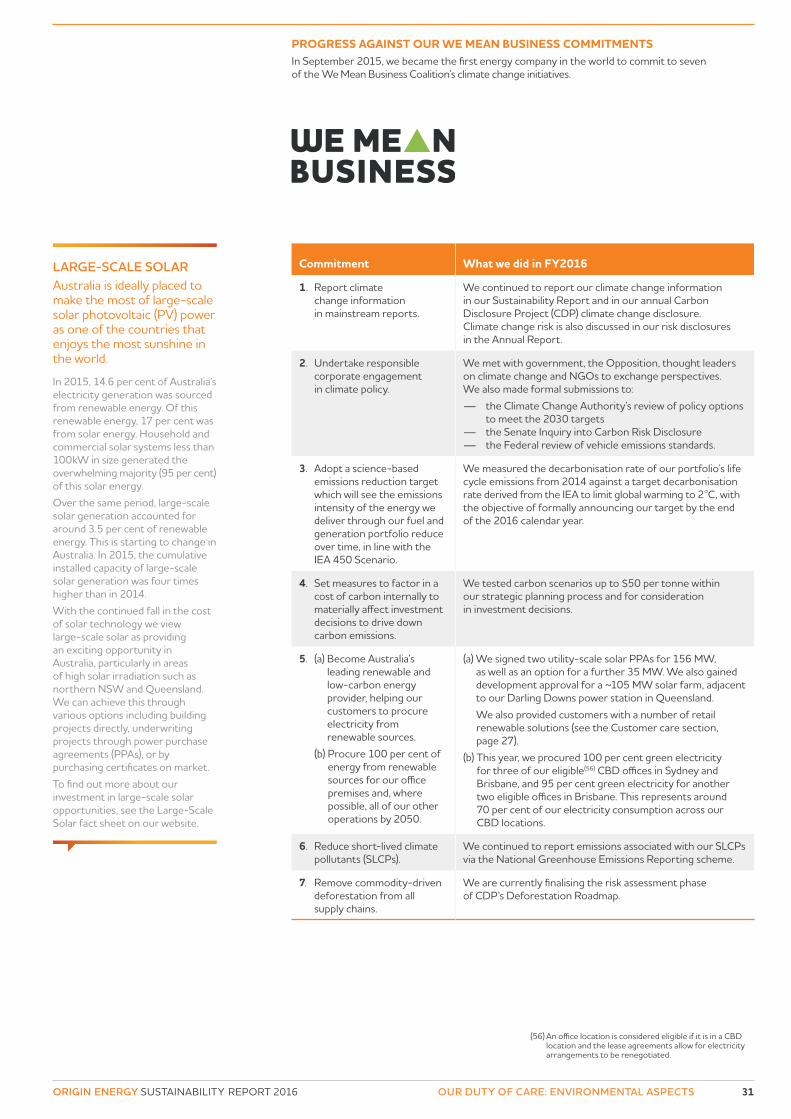
31ORIGIN ENERGY SUSTAINABILITY REPORT 2016 OUR DUTY OF CARE: ENVIRONMENTAL ASPECTS
(56) An office location is considered eligible if it is in a CBD location and the lease agreements allow for electricity arrangements to be renegotiated.
Commitment What we did in FY2016
1. Report climate change information in mainstream reports.
We continued to report our climate change information in our Sustainability Report and in our annual Carbon Disclosure Project (CDP) climate change disclosure. Climate change risk is also discussed in our risk disclosures in the Annual Report.
2. Undertake responsible corporate engagement in climate policy.
We met with government, the Opposition, thought leaders on climate change and NGOs to exchange perspectives. We also made formal submissions to:
— the Climate Change Authority’s review of policy options to meet the 2030 targets
— the Senate Inquiry into Carbon Risk Disclosure — the Federal review of vehicle emissions standards.
3. Adopt a science-based emissions reduction target which will see the emissions intensity of the energy we deliver through our fuel and generation portfolio reduce over time, in line with the IEA 450 Scenario.
We measured the decarbonisation rate of our portfolio’s life cycle emissions from 2014 against a target decarbonisation rate derived from the IEA to limit global warming to 2°C, with the objective of formally announcing our target by the end of the 2016 calendar year.
4. Set measures to factor in a cost of carbon internally to materially affect investment decisions to drive down carbon emissions.
We tested carbon scenarios up to $50 per tonne within our strategic planning process and for consideration in investment decisions.
5. (a) Become Australia’s leading renewable and low-carbon energy provider, helping our customers to procure electricity from renewable sources.
(b) Procure 100 per cent of energy from renewable sources for our office premises and, where possible, all of our other operations by 2050.
(a) We signed two utility-scale solar PPAs for 156 MW, as well as an option for a further 35 MW. We also gained development approval for a ~105 MW solar farm, adjacent to our Darling Downs power station in Queensland.
We also provided customers with a number of retail renewable solutions (see the Customer care section, page 27).
(b) This year, we procured 100 per cent green electricity for three of our eligible(56) CBD offices in Sydney and Brisbane, and 95 per cent green electricity for another two eligible offices in Brisbane. This represents around 70 per cent of our electricity consumption across our CBD locations.
6. Reduce short-lived climate pollutants (SLCPs).
We continued to report emissions associated with our SLCPs via the National Greenhouse Emissions Reporting scheme.
7. Remove commodity-driven deforestation from all supply chains.
We are currently finalising the risk assessment phase of CDP’s Deforestation Roadmap.
LARGE-SCALE SOLARAustralia is ideally placed to make the most of large-scale solar photovoltaic (PV) power as one of the countries that enjoys the most sunshine in the world.
In 2015, 14.6 per cent of Australia’s electricity generation was sourced from renewable energy. Of this renewable energy, 17 per cent was from solar energy. Household and commercial solar systems less than 100kW in size generated the overwhelming majority (95 per cent) of this solar energy.Over the same period, large-scale solar generation accounted for around 3.5 per cent of renewable energy. This is starting to change in Australia. In 2015, the cumulative installed capacity of large-scale solar generation was four times higher than in 2014.With the continued fall in the cost of solar technology we view large-scale solar as providing an exciting opportunity in Australia, particularly in areas of high solar irradiation such as northern NSW and Queensland. We can achieve this through various options including building projects directly, underwriting projects through power purchase agreements (PPAs), or by purchasing certificates on market.To find out more about our investment in large-scale solar opportunities, see the Large-Scale Solar fact sheet on our website.
PROGRESS AGAINST OUR WE MEAN BUSINESS COMMITMENTSIn September 2015, we became the first energy company in the world to commit to seven of the We Mean Business Coalition’s climate change initiatives.
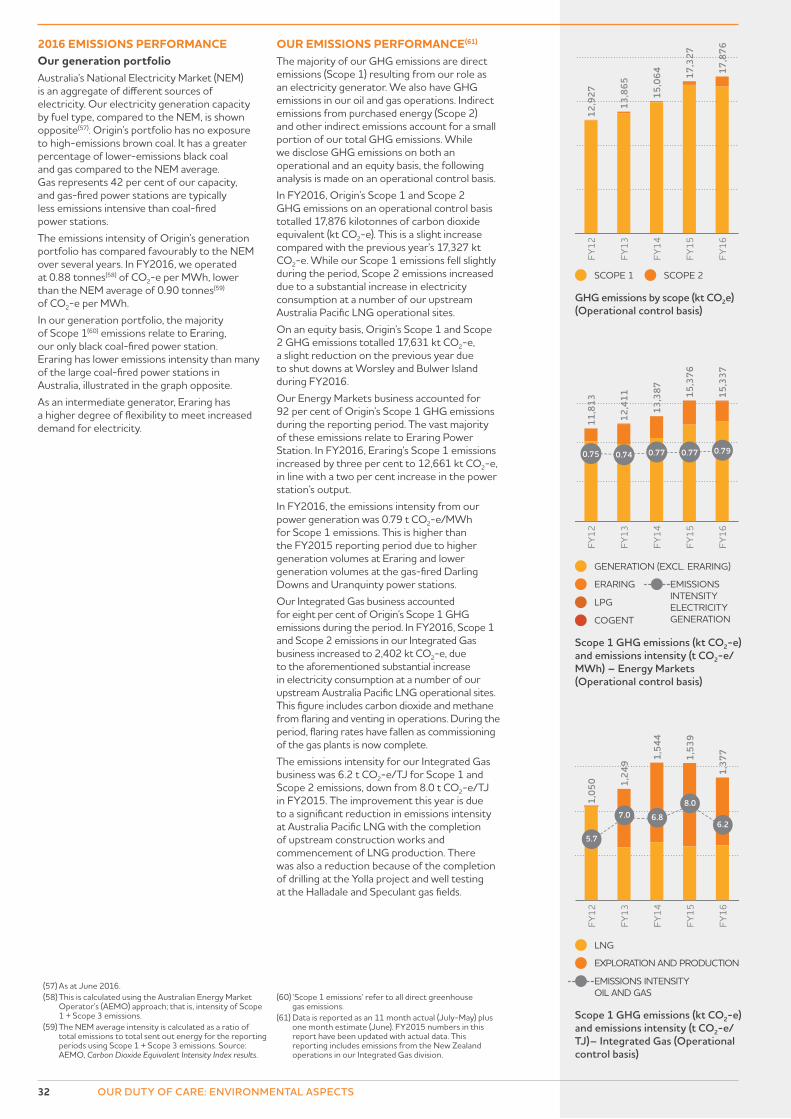
1,05
0
1,54
4
1,37
7
1,24
9 1,53
9
FY16
FY15
FY14
FY13
FY12
LNG
EXPLORATION AND PRODUCTION
EMISSIONS INTENSITY OIL AND GAS
7.0 6.8
8.0
6.2
5.7
Scope 1 GHG emissions (kt CO2-e) and emissions intensity (t CO2-e/TJ)– Integrated Gas (Operational control basis)
13,3
87 15,3
37
11,8
13
12,4
11 15,3
76
FY16
FY15
FY14
FY13
FY12
GENERATION (EXCL. ERARING)
ERARING
LPG
COGENT
EMISSIONS INTENSITY ELECTRICITY GENERATION
0.74 0.77 0.77 0.790.75
Scope 1 GHG emissions (kt CO2-e) and emissions intensity (t CO2-e/MWh) – Energy Markets (Operational control basis)
15,0
64 17,8
76
12,9
27
13,8
65
17,3
27
FY16
FY15
FY14
FY13
FY12
SCOPE 1 SCOPE 2
GHG emissions by scope (kt CO2e) (Operational control basis)
32 OUR DUTY OF CARE: ENVIRONMENTAL ASPECTS
2016 EMISSIONS PERFORMANCEOur generation portfolioAustralia’s National Electricity Market (NEM) is an aggregate of different sources of electricity. Our electricity generation capacity by fuel type, compared to the NEM, is shown opposite(57). Origin’s portfolio has no exposure to high-emissions brown coal. It has a greater percentage of lower-emissions black coal and gas compared to the NEM average. Gas represents 42 per cent of our capacity, and gas-fired power stations are typically less emissions intensive than coal-fired power stations.The emissions intensity of Origin’s generation portfolio has compared favourably to the NEM over several years. In FY2016, we operated at 0.88 tonnes(58) of CO2-e per MWh, lower than the NEM average of 0.90 tonnes(59) of CO2-e per MWh.In our generation portfolio, the majority of Scope 1(60) emissions relate to Eraring, our only black coal-fired power station. Eraring has lower emissions intensity than many of the large coal-fired power stations in Australia, illustrated in the graph opposite.As an intermediate generator, Eraring has a higher degree of flexibility to meet increased demand for electricity.
OUR EMISSIONS PERFORMANCE(61)
The majority of our GHG emissions are direct emissions (Scope 1) resulting from our role as an electricity generator. We also have GHG emissions in our oil and gas operations. Indirect emissions from purchased energy (Scope 2) and other indirect emissions account for a small portion of our total GHG emissions. While we disclose GHG emissions on both an operational and an equity basis, the following analysis is made on an operational control basis.In FY2016, Origin’s Scope 1 and Scope 2 GHG emissions on an operational control basis totalled 17,876 kilotonnes of carbon dioxide equivalent (kt CO2-e). This is a slight increase compared with the previous year’s 17,327 kt CO2-e. While our Scope 1 emissions fell slightly during the period, Scope 2 emissions increased due to a substantial increase in electricity consumption at a number of our upstream Australia Pacific LNG operational sites.On an equity basis, Origin’s Scope 1 and Scope 2 GHG emissions totalled 17,631 kt CO2-e, a slight reduction on the previous year due to shut downs at Worsley and Bulwer Island during FY2016.Our Energy Markets business accounted for 92 per cent of Origin’s Scope 1 GHG emissions during the reporting period. The vast majority of these emissions relate to Eraring Power Station. In FY2016, Eraring’s Scope 1 emissions increased by three per cent to 12,661 kt CO2-e, in line with a two per cent increase in the power station’s output.In FY2016, the emissions intensity from our power generation was 0.79 t CO2-e/MWh for Scope 1 emissions. This is higher than the FY2015 reporting period due to higher generation volumes at Eraring and lower generation volumes at the gas-fired Darling Downs and Uranquinty power stations.Our Integrated Gas business accounted for eight per cent of Origin’s Scope 1 GHG emissions during the period. In FY2016, Scope 1 and Scope 2 emissions in our Integrated Gas business increased to 2,402 kt CO2-e, due to the aforementioned substantial increase in electricity consumption at a number of our upstream Australia Pacific LNG operational sites. This figure includes carbon dioxide and methane from flaring and venting in operations. During the period, flaring rates have fallen as commissioning of the gas plants is now complete.The emissions intensity for our Integrated Gas business was 6.2 t CO2-e/TJ for Scope 1 and Scope 2 emissions, down from 8.0 t CO2-e/TJ in FY2015. The improvement this year is due to a significant reduction in emissions intensity at Australia Pacific LNG with the completion of upstream construction works and commencement of LNG production. There was also a reduction because of the completion of drilling at the Yolla project and well testing at the Halladale and Speculant gas fields.
(57) As at June 2016.(58) This is calculated using the Australian Energy Market
Operator’s (AEMO) approach; that is, intensity of Scope 1 + Scope 3 emissions.
(59) The NEM average intensity is calculated as a ratio of total emissions to total sent out energy for the reporting periods using Scope 1 + Scope 3 emissions. Source: AEMO, Carbon Dioxide Equivalent Intensity Index results.
(60) ‘Scope 1 emissions’ refer to all direct greenhouse gas emissions.
(61) Data is reported as an 11 month actual (July-May) plus one month estimate (June). FY2015 numbers in this report have been updated with actual data. This reporting includes emissions from the New Zealand operations in our Integrated Gas division.
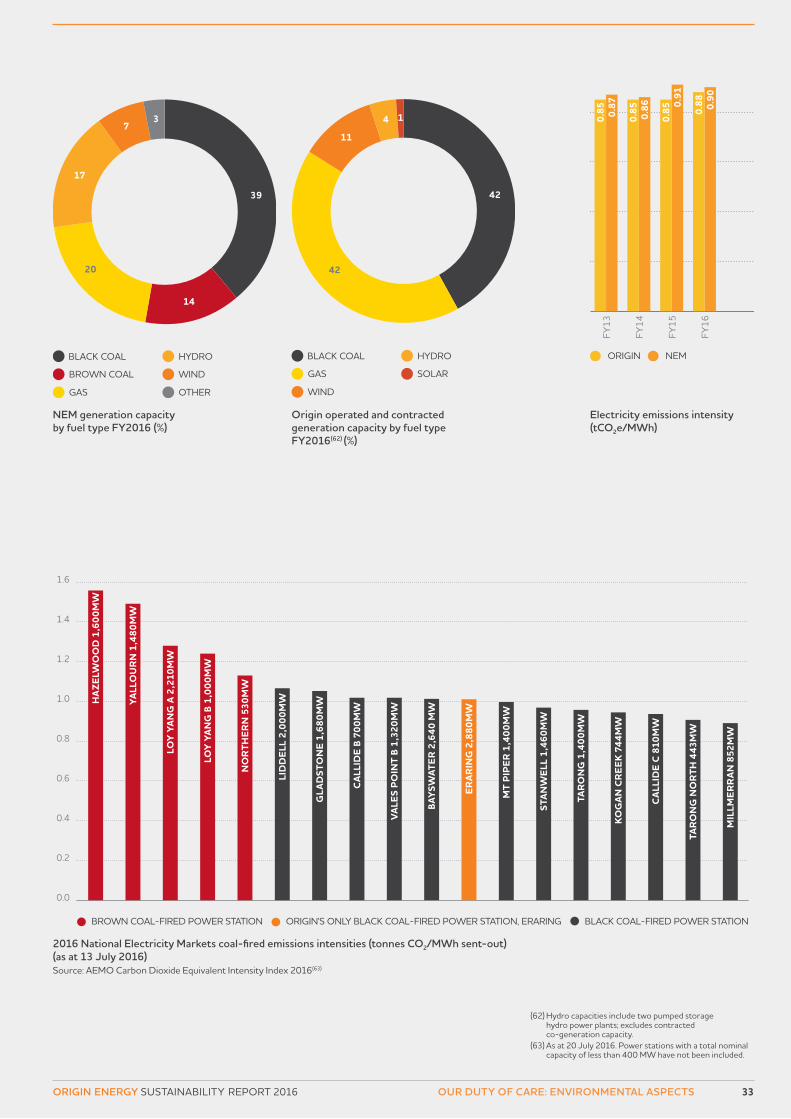
NEM generation capacity by fuel type FY2016 (%)
2016 National Electricity Markets coal-fired emissions intensities (tonnes CO2/MWh sent-out) (as at 13 July 2016)Source: AEMO Carbon Dioxide Equivalent Intensity Index 2016(63)
Origin operated and contracted generation capacity by fuel type FY2016(62) (%)
Electricity emissions intensity (tCO2e/MWh)
(62) Hydro capacities include two pumped storage hydro power plants; excludes contracted co-generation capacity.
(63) As at 20 July 2016. Power stations with a total nominal capacity of less than 400 MW have not been included.
BLACK COAL HYDRO
BROWN COAL WIND
GAS OTHER
3
14
20
17
7
39
BLACK COAL HYDRO
GAS SOLAR
WIND
42
1
42
11
4
BROWN COAL-FIRED POWER STATION ORIGIN'S ONLY BLACK COAL-FIRED POWER STATION, ERARING BLACK COAL-FIRED POWER STATION
0.0
0.2
0.4
0.6
0.8
1.0
1.2
1.4
1.6
1.8
MIL
LMER
RAN
852
MW
TAR
ON
G N
OR
TH 4
43M
W
CAL
LID
E C
810M
W
KOG
AN C
REE
K 74
4MW
TAR
ON
G 1
,400
MW
STAN
WEL
L 1,
460M
W
MT
PIPE
R 1,
400M
W
ERAR
ING
2,8
80M
W
BAYS
WAT
ER 2
,640
MW
VALE
S PO
INT
B 1,
320M
W
CAL
LID
E B
700M
W
GLA
DST
ON
E 1,
680M
W
LID
DEL
L 2,
000M
W
NO
RTH
ERN
530
MW
LOY
YAN
G B
1,0
00M
W
LOY
YAN
G A
2,2
10M
W
YALL
OU
RN
1,4
80M
W
HA
ZELW
OO
D 1
,600
MW
0.85
0.85
0.85 0.
88
0.87
0.86 0.
91
0.90
FY16
FY15
FY14
FY13
ORIGIN NEM
33ORIGIN ENERGY SUSTAINABILITY REPORT 2016 OUR DUTY OF CARE: ENVIRONMENTAL ASPECTS
34 OUR DUTY OF CARE: ENVIRONMENTAL ASPECTS
FUGITIVE EMISSIONS FROM GAS OPERATIONSIn recent years, questions have been raised about the emission of short-lived climate pollutants, notably methane, in the gas industry. The emission of methane is more potent and has a higher potential to exacerbate the effects of climate change than carbon dioxide.Intermittently, operations experience disruptions to production that are triggered by inbuilt safety systems that protect people and equipment. In these events, there are established operational practices in place to manage gas, however, in some circumstances there is a need to relieve pressure in the system by flaring. This flaring process converts methane to carbon dioxide, which is a less potent greenhouse gas. Emissions from these practices are reported annually in Origin’s National Greenhouse and Energy Report.Leakage from infrastructure (fugitive emissions) is also a source of methane. In line with the Queensland Government’s regulatory requirements, we survey Australia Pacific LNG’s gas field infrastructure for methane leaks. Emissions factors are used to estimate fugitive emissions. In 2014, a CSIRO study(64) confirmed in field tests that the government-prescribed emission factors for general leaks were scientifically adequate. The study also confirmed that fugitive emissions formed only a very small percentage of Scope 1 greenhouse gas emissions.During the reporting period, Origin’s fugitive emissions from flaring, venting and leakage at our oil and gas operations were 756 kt CO2-e(65). This is a slight decrease on the previous year despite a considerable increase in production volumes.Another source of methane is the natural liberation of the gas from the landscape. Queensland gas fields have a history of natural methane emissions that predates the CSG industry. Evidence of methane emissions is present in water bore drilling records, mining and petroleum journals over many decades, and anecdotal evidence from landholders.Origin continues to take steps to quantify and manage landscape methane emissions. We have been working with the Queensland Government and the CSIRO to further research and quantify landscape emissions within the region. In particular, we are focusing on an area of the Condamine River, south-west of Chinchilla, where gas emissions known as ‘seeps’ have been more active since the beginning of 2012.
These studies have created a better understanding of the presence of these emissions across the region, as well as the potential emissions associated with abandoned coal exploration bores and landholder bores.During FY2016, Origin continued to develop a management program that aims to reduce the emissions, including investigating the potential for intercepting and capturing the methane below the surface.We also expanded our engagement with stakeholders and community members with an interest in these emissions, to better understand their concerns and inform them about our planned management program.
OTHER AIR EMISSIONSData for the emissions of oxides of nitrogen (NOx), sulfur oxides (SOx), volatile organic compounds (VOCs) and particulate matter (PM10) can be found in the Performance Data section of this report, starting on page 53.During FY2016, there were a number of air quality limit non compliances under our Environmental Protection Authority (EPA) licence in relation to the Otway facility. Origin can confirm that no unacceptable human health or environmental risks were identified by these non compliances. Origin continues to work closely and productively with the Victorian EPA on a range of requirements set by the Victorian EPA to manage emissions from the facility. Specifically, Origin has altered the plant operating philosophy and implemented various operational improvements to further control air emissions.In 2014, Origin, on behalf of Australia Pacific LNG, voluntarily implemented a comprehensive Surat Basin ambient air quality monitoring program, to monitor a range of air quality parameters at selected sites across the Surat Basin. This program includes real-time monitoring of methane and selected gases at five locations across the Surat Basin. The CSIRO independently designed, implemented and managed the program, which included collating and reporting data. In 2016, responsibility for this program was transitioned to the Gas Industry Social and Environmental Research Alliance (GISERA). This year, data will be available live on the Department of Environment and Heritage Protection’s website. The results of the ambient air monitoring program to date confirm that CSG activities are not materially impacting the ambient air quality of the region.
(64) CSIRO, 2014, Field Measurements of Fugitive Emissions from Equipment and Well Casings in Australian Coal Seam Gas Production Facilities.
(65) Includes emissions from flaring, venting and leakage calculated using regulatory methods outlined for the National Greenhouse Emissions Reporting Scheme and New Zealand Emissions Trading Scheme.
CONDAMINE RIVER STUDIESOrigin, on behalf of Australia Pacific LNG, continues to invest in a robust and comprehensive research program as part of an ongoing commitment by industry and government to better understand the Condamine River seeps.
Independent research has been conducted on the Condamine River since 2012, where in addition to Queensland Government studies, Origin commissioned investigations by independent environmental specialists and international experts, including the CSIRO.A number of mitigation activities are underway. These include drilling of wells to target the specific shallow geological areas where gas may be trapped, to intercept some of this gas and reduce the amount flowing towards the river. Origin has also engaged the CSIRO to develop a regular gas flux (flow rate) measurement regime involving use of floating hoods on the surface of the river that are moved in accordance with a pre-defined grid. In addition, four underwater capture hoods have been installed over the most vigorous seep locations to capture and transfer the gas via polyethylene pipes to a nearby data measuring station, where the gas flux rate is measured in real time.More information on this program of work is available in the Condamine River Studies Fact Sheet available on Origin’s website.
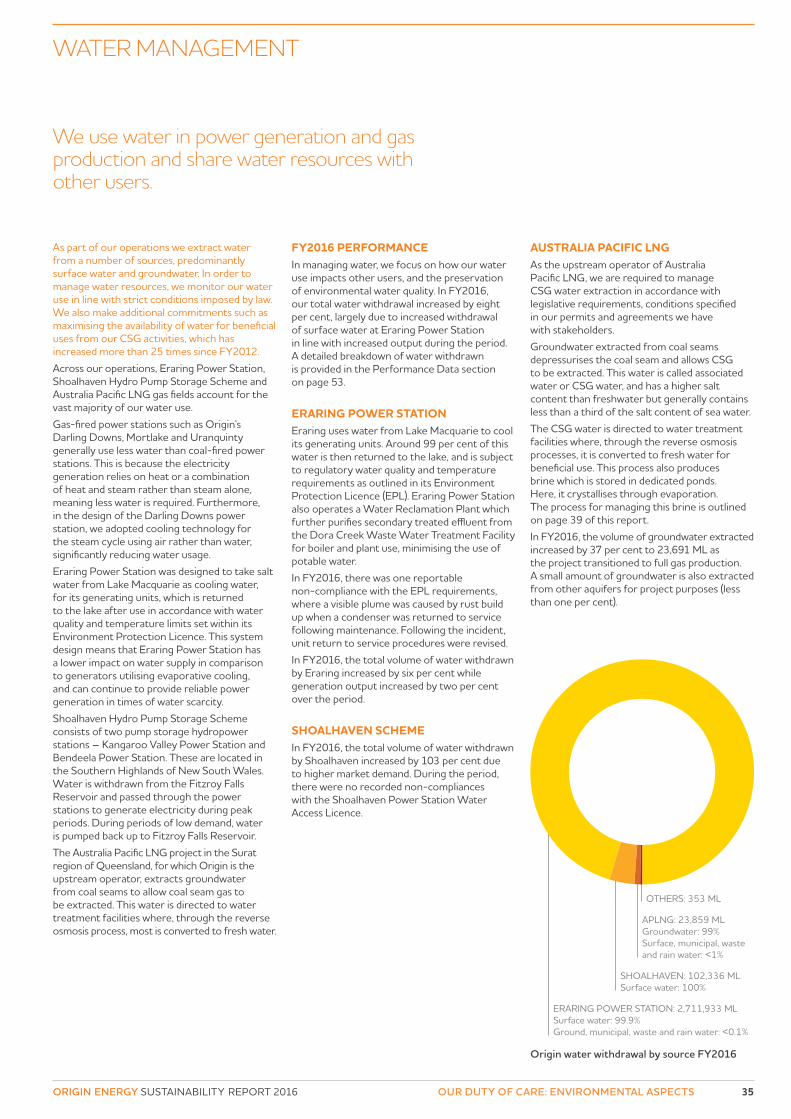
As part of our operations we extract water from a number of sources, predominantly surface water and groundwater. In order to manage water resources, we monitor our water use in line with strict conditions imposed by law. We also make additional commitments such as maximising the availability of water for beneficial uses from our CSG activities, which has increased more than 25 times since FY2012.Across our operations, Eraring Power Station, Shoalhaven Hydro Pump Storage Scheme and Australia Pacific LNG gas fields account for the vast majority of our water use.Gas-fired power stations such as Origin’s Darling Downs, Mortlake and Uranquinty generally use less water than coal-fired power stations. This is because the electricity generation relies on heat or a combination of heat and steam rather than steam alone, meaning less water is required. Furthermore, in the design of the Darling Downs power station, we adopted cooling technology for the steam cycle using air rather than water, significantly reducing water usage.Eraring Power Station was designed to take salt water from Lake Macquarie as cooling water, for its generating units, which is returned to the lake after use in accordance with water quality and temperature limits set within its Environment Protection Licence. This system design means that Eraring Power Station has a lower impact on water supply in comparison to generators utilising evaporative cooling, and can continue to provide reliable power generation in times of water scarcity.Shoalhaven Hydro Pump Storage Scheme consists of two pump storage hydropower stations – Kangaroo Valley Power Station and Bendeela Power Station. These are located in the Southern Highlands of New South Wales. Water is withdrawn from the Fitzroy Falls Reservoir and passed through the power stations to generate electricity during peak periods. During periods of low demand, water is pumped back up to Fitzroy Falls Reservoir.The Australia Pacific LNG project in the Surat region of Queensland, for which Origin is the upstream operator, extracts groundwater from coal seams to allow coal seam gas to be extracted. This water is directed to water treatment facilities where, through the reverse osmosis process, most is converted to fresh water.
FY2016 PERFORMANCEIn managing water, we focus on how our water use impacts other users, and the preservation of environmental water quality. In FY2016, our total water withdrawal increased by eight per cent, largely due to increased withdrawal of surface water at Eraring Power Station in line with increased output during the period. A detailed breakdown of water withdrawn is provided in the Performance Data section on page 53.
ERARING POWER STATIONEraring uses water from Lake Macquarie to cool its generating units. Around 99 per cent of this water is then returned to the lake, and is subject to regulatory water quality and temperature requirements as outlined in its Environment Protection Licence (EPL). Eraring Power Station also operates a Water Reclamation Plant which further purifies secondary treated effluent from the Dora Creek Waste Water Treatment Facility for boiler and plant use, minimising the use of potable water.In FY2016, there was one reportable non-compliance with the EPL requirements, where a visible plume was caused by rust build up when a condenser was returned to service following maintenance. Following the incident, unit return to service procedures were revised.In FY2016, the total volume of water withdrawn by Eraring increased by six per cent while generation output increased by two per cent over the period.
SHOALHAVEN SCHEMEIn FY2016, the total volume of water withdrawn by Shoalhaven increased by 103 per cent due to higher market demand. During the period, there were no recorded non-compliances with the Shoalhaven Power Station Water Access Licence.
AUSTRALIA PACIFIC LNGAs the upstream operator of Australia Pacific LNG, we are required to manage CSG water extraction in accordance with legislative requirements, conditions specified in our permits and agreements we have with stakeholders.Groundwater extracted from coal seams depressurises the coal seam and allows CSG to be extracted. This water is called associated water or CSG water, and has a higher salt content than freshwater but generally contains less than a third of the salt content of sea water.The CSG water is directed to water treatment facilities where, through the reverse osmosis processes, it is converted to fresh water for beneficial use. This process also produces brine which is stored in dedicated ponds. Here, it crystallises through evaporation. The process for managing this brine is outlined on page 39 of this report.In FY2016, the volume of groundwater extracted increased by 37 per cent to 23,691 ML as the project transitioned to full gas production. A small amount of groundwater is also extracted from other aquifers for project purposes (less than one per cent).
APLNG: 23,859 MLGroundwater: 99%Surface, municipal, waste and rain water: <1%
OTHERS: 353 ML
ERARING POWER STATION: 2,711,933 MLSurface water: 99.9% Ground, municipal, waste and rain water: <0.1%
SHOALHAVEN: 102,336 MLSurface water: 100%
35ORIGIN ENERGY SUSTAINABILITY REPORT 2016 OUR DUTY OF CARE: ENVIRONMENTAL ASPECTS
We use water in power generation and gas production and share water resources with other users.
WATER MANAGEMENT
Origin water withdrawal by source FY2016
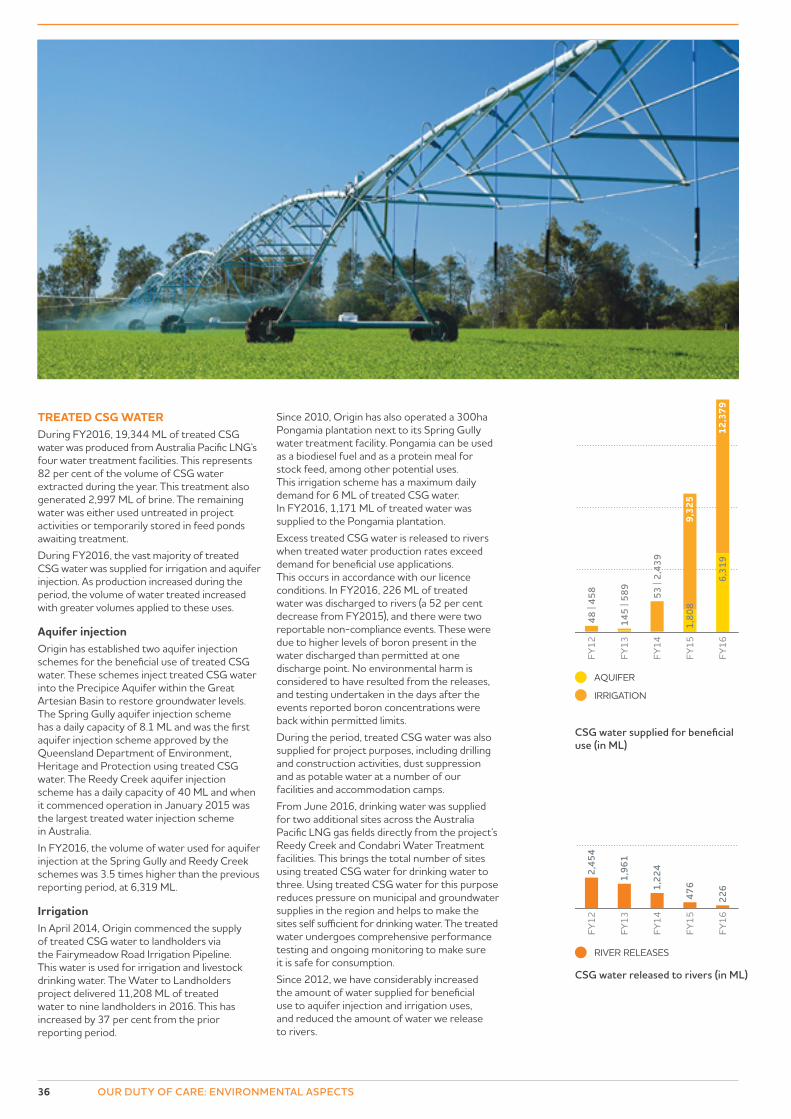
FY16
FY15
FY14
FY13
FY12
48 |
458
145
| 589 53
| 2,
439
9,32
51,
808
12,3
796,
319
AQUIFER
IRRIGATION
CSG water supplied for beneficial use (in ML)
CSG water released to rivers (in ML)
2,45
4
1,96
1
1,22
4
476
226
RIVER RELEASES
FY16
FY15
FY14
FY13
FY12
36 OUR DUTY OF CARE: ENVIRONMENTAL ASPECTS
TREATED CSG WATERDuring FY2016, 19,344 ML of treated CSG water was produced from Australia Pacific LNG’s four water treatment facilities. This represents 82 per cent of the volume of CSG water extracted during the year. This treatment also generated 2,997 ML of brine. The remaining water was either used untreated in project activities or temporarily stored in feed ponds awaiting treatment.During FY2016, the vast majority of treated CSG water was supplied for irrigation and aquifer injection. As production increased during the period, the volume of water treated increased with greater volumes applied to these uses.
Aquifer injectionOrigin has established two aquifer injection schemes for the beneficial use of treated CSG water. These schemes inject treated CSG water into the Precipice Aquifer within the Great Artesian Basin to restore groundwater levels. The Spring Gully aquifer injection scheme has a daily capacity of 8.1 ML and was the first aquifer injection scheme approved by the Queensland Department of Environment, Heritage and Protection using treated CSG water. The Reedy Creek aquifer injection scheme has a daily capacity of 40 ML and when it commenced operation in January 2015 was the largest treated water injection scheme in Australia.In FY2016, the volume of water used for aquifer injection at the Spring Gully and Reedy Creek schemes was 3.5 times higher than the previous reporting period, at 6,319 ML.
IrrigationIn April 2014, Origin commenced the supply of treated CSG water to landholders via the Fairymeadow Road Irrigation Pipeline. This water is used for irrigation and livestock drinking water. The Water to Landholders project delivered 11,208 ML of treated water to nine landholders in 2016. This has increased by 37 per cent from the prior reporting period.
Since 2010, Origin has also operated a 300ha Pongamia plantation next to its Spring Gully water treatment facility. Pongamia can be used as a biodiesel fuel and as a protein meal for stock feed, among other potential uses. This irrigation scheme has a maximum daily demand for 6 ML of treated CSG water. In FY2016, 1,171 ML of treated water was supplied to the Pongamia plantation.Excess treated CSG water is released to rivers when treated water production rates exceed demand for beneficial use applications. This occurs in accordance with our licence conditions. In FY2016, 226 ML of treated water was discharged to rivers (a 52 per cent decrease from FY2015), and there were two reportable non-compliance events. These were due to higher levels of boron present in the water discharged than permitted at one discharge point. No environmental harm is considered to have resulted from the releases, and testing undertaken in the days after the events reported boron concentrations were back within permitted limits.During the period, treated CSG water was also supplied for project purposes, including drilling and construction activities, dust suppression and as potable water at a number of our facilities and accommodation camps.From June 2016, drinking water was supplied for two additional sites across the Australia Pacific LNG gas fields directly from the project’s Reedy Creek and Condabri Water Treatment facilities. This brings the total number of sites using treated CSG water for drinking water to three. Using treated CSG water for this purpose reduces pressure on municipal and groundwater supplies in the region and helps to make the sites self sufficient for drinking water. The treated water undergoes comprehensive performance testing and ongoing monitoring to make sure it is safe for consumption.Since 2012, we have considerably increased the amount of water supplied for beneficial use to aquifer injection and irrigation uses, and reduced the amount of water we release to rivers.
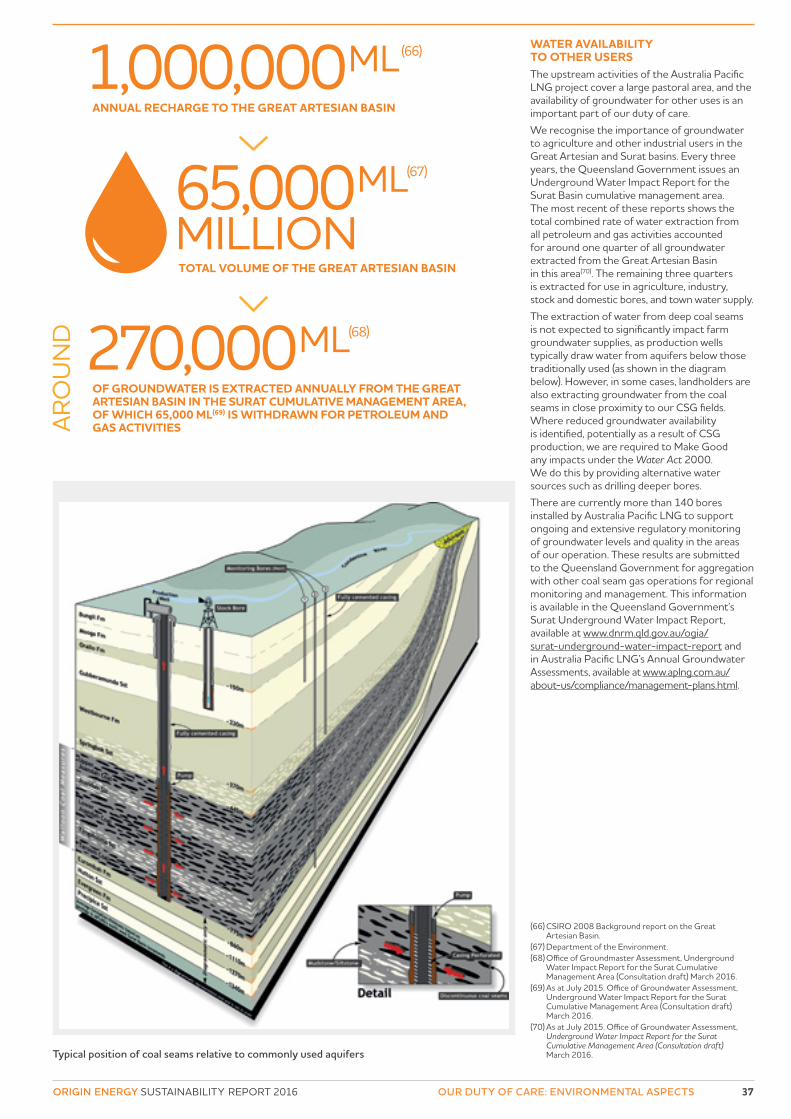
Typical position of coal seams relative to commonly used aquifers
37ORIGIN ENERGY SUSTAINABILITY REPORT 2016 OUR DUTY OF CARE: ENVIRONMENTAL ASPECTS
WATER AVAILABILITY TO OTHER USERSThe upstream activities of the Australia Pacific LNG project cover a large pastoral area, and the availability of groundwater for other uses is an important part of our duty of care.We recognise the importance of groundwater to agriculture and other industrial users in the Great Artesian and Surat basins. Every three years, the Queensland Government issues an Underground Water Impact Report for the Surat Basin cumulative management area. The most recent of these reports shows the total combined rate of water extraction from all petroleum and gas activities accounted for around one quarter of all groundwater extracted from the Great Artesian Basin in this area(70). The remaining three quarters is extracted for use in agriculture, industry, stock and domestic bores, and town water supply.The extraction of water from deep coal seams is not expected to significantly impact farm groundwater supplies, as production wells typically draw water from aquifers below those traditionally used (as shown in the diagram below). However, in some cases, landholders are also extracting groundwater from the coal seams in close proximity to our CSG fields. Where reduced groundwater availability is identified, potentially as a result of CSG production, we are required to Make Good any impacts under the Water Act 2000. We do this by providing alternative water sources such as drilling deeper bores.There are currently more than 140 bores installed by Australia Pacific LNG to support ongoing and extensive regulatory monitoring of groundwater levels and quality in the areas of our operation. These results are submitted to the Queensland Government for aggregation with other coal seam gas operations for regional monitoring and management. This information is available in the Queensland Government’s Surat Underground Water Impact Report, available at www.dnrm.qld.gov.au/ogia/surat-underground-water-impact-report and in Australia Pacific LNG’s Annual Groundwater Assessments, available at www.aplng.com.au/about-us/compliance/management-plans.html.
(66) CSIRO 2008 Background report on the Great Artesian Basin.
(67) Department of the Environment.(68) Office of Groundmaster Assessment, Underground
Water Impact Report for the Surat Cumulative Management Area (Consultation draft) March 2016.
(69) As at July 2015. Office of Groundwater Assessment, Underground Water Impact Report for the Surat Cumulative Management Area (Consultation draft) March 2016.
(70) As at July 2015. Office of Groundwater Assessment, Underground Water Impact Report for the Surat Cumulative Management Area (Consultation draft) March 2016.
1,000,000ML(66)
ANNUAL RECHARGE TO THE GREAT ARTESIAN BASIN
270,000ML(68)
OF GROUNDWATER IS EXTRACTED ANNUALLY FROM THE GREAT ARTESIAN BASIN IN THE SURAT CUMULATIVE MANAGEMENT AREA, OF WHICH 65,000 ML(69) IS WITHDRAWN FOR PETROLEUM AND GAS ACTIVITIESA
RO
UN
D
TOTAL VOLUME OF THE GREAT ARTESIAN BASIN
65,000ML(67)
MILLION
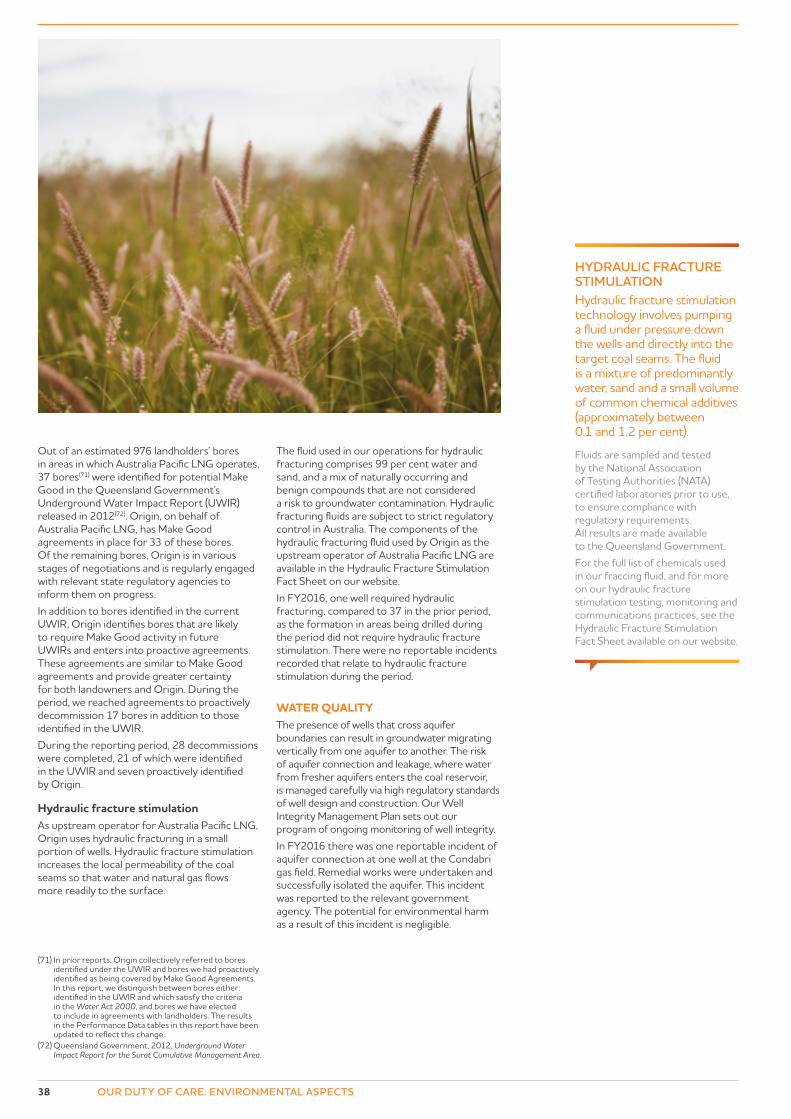
HYDRAULIC FRACTURE STIMULATIONHydraulic fracture stimulation technology involves pumping a fluid under pressure down the wells and directly into the target coal seams. The fluid is a mixture of predominantly water, sand and a small volume of common chemical additives (approximately between 0.1 and 1.2 per cent).
Fluids are sampled and tested by the National Association of Testing Authorities (NATA) certified laboratories prior to use, to ensure compliance with regulatory requirements. All results are made available to the Queensland Government.For the full list of chemicals used in our fraccing fluid, and for more on our hydraulic fracture stimulation testing, monitoring and communications practices, see the Hydraulic Fracture Stimulation Fact Sheet available on our website.
38 OUR DUTY OF CARE: ENVIRONMENTAL ASPECTS
Out of an estimated 976 landholders’ bores in areas in which Australia Pacific LNG operates, 37 bores(71) were identified for potential Make Good in the Queensland Government’s Underground Water Impact Report (UWIR) released in 2012(72). Origin, on behalf of Australia Pacific LNG, has Make Good agreements in place for 33 of these bores. Of the remaining bores, Origin is in various stages of negotiations and is regularly engaged with relevant state regulatory agencies to inform them on progress.In addition to bores identified in the current UWIR, Origin identifies bores that are likely to require Make Good activity in future UWIRs and enters into proactive agreements. These agreements are similar to Make Good agreements and provide greater certainty for both landowners and Origin. During the period, we reached agreements to proactively decommission 17 bores in addition to those identified in the UWIR.During the reporting period, 28 decommissions were completed, 21 of which were identified in the UWIR and seven proactively identified by Origin.
Hydraulic fracture stimulationAs upstream operator for Australia Pacific LNG, Origin uses hydraulic fracturing in a small portion of wells. Hydraulic fracture stimulation increases the local permeability of the coal seams so that water and natural gas flows more readily to the surface.
The fluid used in our operations for hydraulic fracturing comprises 99 per cent water and sand, and a mix of naturally occurring and benign compounds that are not considered a risk to groundwater contamination. Hydraulic fracturing fluids are subject to strict regulatory control in Australia. The components of the hydraulic fracturing fluid used by Origin as the upstream operator of Australia Pacific LNG are available in the Hydraulic Fracture Stimulation Fact Sheet on our website.In FY2016, one well required hydraulic fracturing, compared to 37 in the prior period, as the formation in areas being drilled during the period did not require hydraulic fracture stimulation. There were no reportable incidents recorded that relate to hydraulic fracture stimulation during the period.
WATER QUALITYThe presence of wells that cross aquifer boundaries can result in groundwater migrating vertically from one aquifer to another. The risk of aquifer connection and leakage, where water from fresher aquifers enters the coal reservoir, is managed carefully via high regulatory standards of well design and construction. Our Well Integrity Management Plan sets out our program of ongoing monitoring of well integrity.In FY2016 there was one reportable incident of aquifer connection at one well at the Condabri gas field. Remedial works were undertaken and successfully isolated the aquifer. This incident was reported to the relevant government agency. The potential for environmental harm as a result of this incident is negligible.
(71) In prior reports, Origin collectively referred to bores identified under the UWIR and bores we had proactively identified as being covered by Make Good Agreements. In this report, we distinguish between bores either: identified in the UWIR and which satisfy the criteria in the Water Act 2000, and bores we have elected to include in agreements with landholders. The results in the Performance Data tables in this report have been updated to reflect this change.
(72) Queensland Government, 2012, Underground Water Impact Report for the Surat Cumulative Management Area.
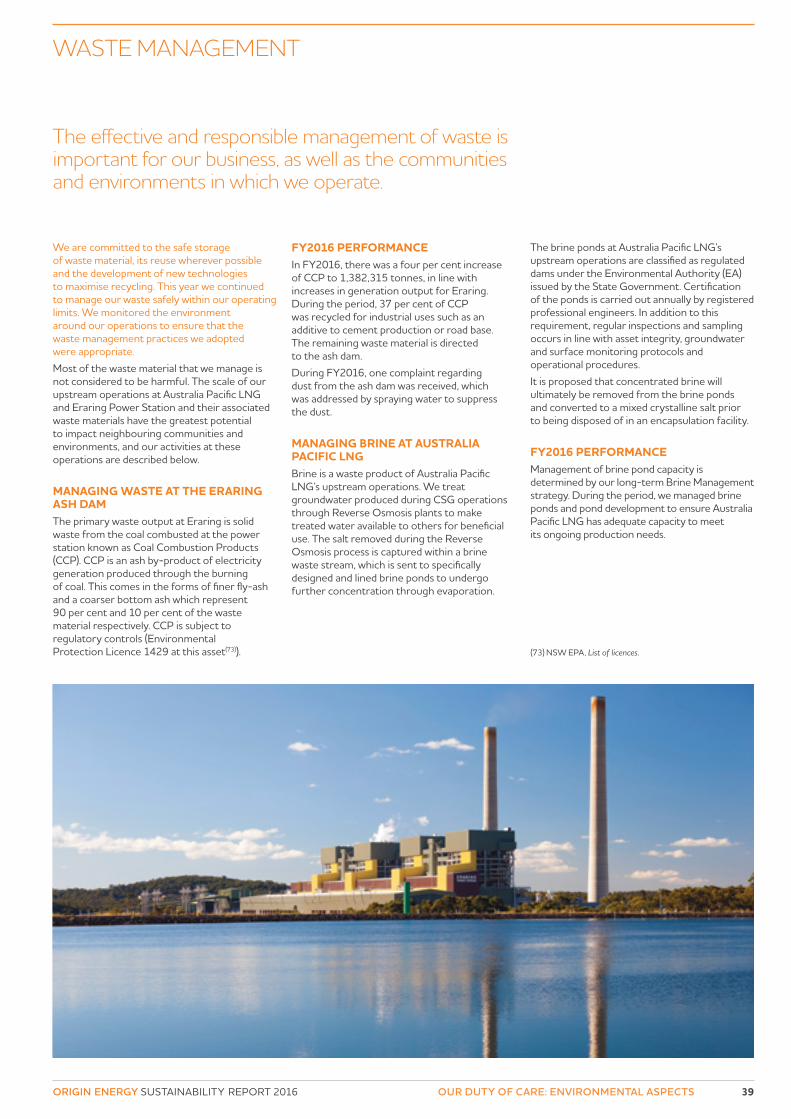
39ORIGIN ENERGY SUSTAINABILITY REPORT 2016 OUR DUTY OF CARE: ENVIRONMENTAL ASPECTS
WASTE MANAGEMENT
The effective and responsible management of waste is important for our business, as well as the communities and environments in which we operate.
We are committed to the safe storage of waste material, its reuse wherever possible and the development of new technologies to maximise recycling. This year we continued to manage our waste safely within our operating limits. We monitored the environment around our operations to ensure that the waste management practices we adopted were appropriate. Most of the waste material that we manage is not considered to be harmful. The scale of our upstream operations at Australia Pacific LNG and Eraring Power Station and their associated waste materials have the greatest potential to impact neighbouring communities and environments, and our activities at these operations are described below.
MANAGING WASTE AT THE ERARING ASH DAMThe primary waste output at Eraring is solid waste from the coal combusted at the power station known as Coal Combustion Products (CCP). CCP is an ash by-product of electricity generation produced through the burning of coal. This comes in the forms of finer fly-ash and a coarser bottom ash which represent 90 per cent and 10 per cent of the waste material respectively. CCP is subject to regulatory controls (Environmental Protection Licence 1429 at this asset(73)).
FY2016 PERFORMANCEIn FY2016, there was a four per cent increase of CCP to 1,382,315 tonnes, in line with increases in generation output for Eraring. During the period, 37 per cent of CCP was recycled for industrial uses such as an additive to cement production or road base. The remaining waste material is directed to the ash dam.During FY2016, one complaint regarding dust from the ash dam was received, which was addressed by spraying water to suppress the dust.
MANAGING BRINE AT AUSTRALIA PACIFIC LNGBrine is a waste product of Australia Pacific LNG’s upstream operations. We treat groundwater produced during CSG operations through Reverse Osmosis plants to make treated water available to others for beneficial use. The salt removed during the Reverse Osmosis process is captured within a brine waste stream, which is sent to specifically designed and lined brine ponds to undergo further concentration through evaporation.
The brine ponds at Australia Pacific LNG’s upstream operations are classified as regulated dams under the Environmental Authority (EA) issued by the State Government. Certification of the ponds is carried out annually by registered professional engineers. In addition to this requirement, regular inspections and sampling occurs in line with asset integrity, groundwater and surface monitoring protocols and operational procedures.It is proposed that concentrated brine will ultimately be removed from the brine ponds and converted to a mixed crystalline salt prior to being disposed of in an encapsulation facility.
FY2016 PERFORMANCEManagement of brine pond capacity is determined by our long-term Brine Management strategy. During the period, we managed brine ponds and pond development to ensure Australia Pacific LNG has adequate capacity to meet its ongoing production needs.
(73) NSW EPA, List of licences.
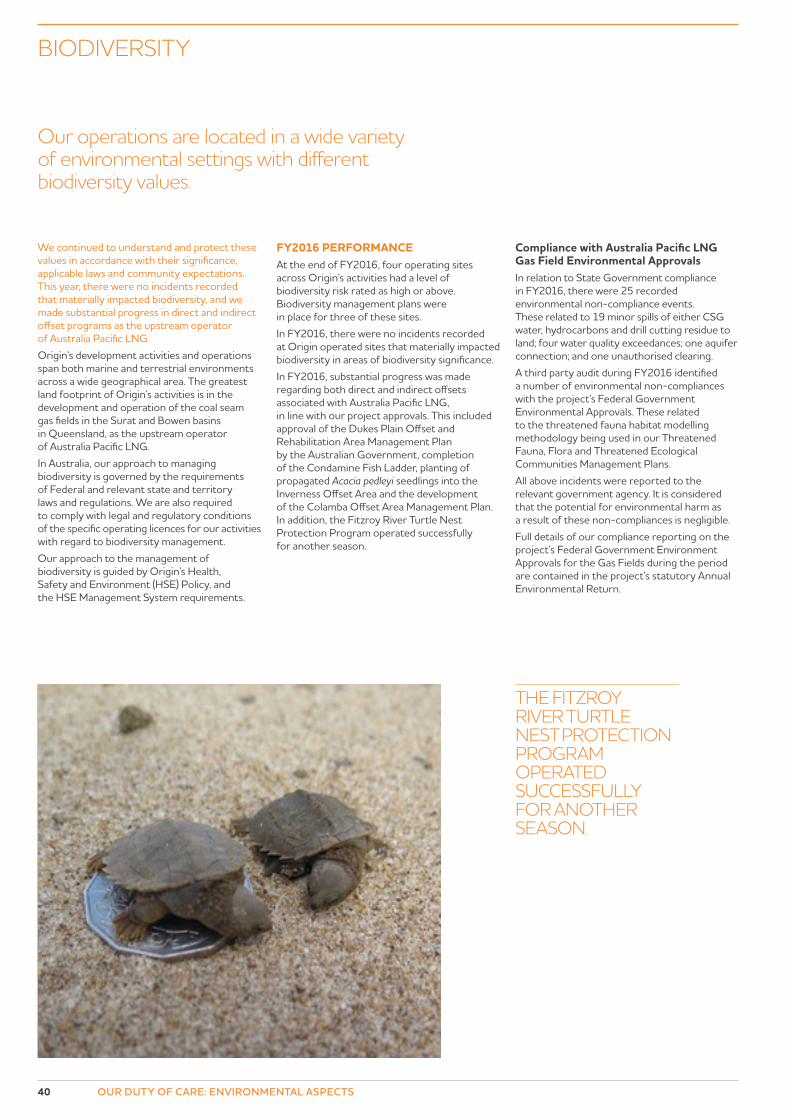
THE FITZROY RIVER TURTLE NEST PROTECTION PROGRAM OPERATED SUCCESSFULLY FOR ANOTHER SEASON.
40 OUR DUTY OF CARE: ENVIRONMENTAL ASPECTS
We continued to understand and protect these values in accordance with their significance, applicable laws and community expectations. This year, there were no incidents recorded that materially impacted biodiversity, and we made substantial progress in direct and indirect offset programs as the upstream operator of Australia Pacific LNG. Origin’s development activities and operations span both marine and terrestrial environments across a wide geographical area. The greatest land footprint of Origin’s activities is in the development and operation of the coal seam gas fields in the Surat and Bowen basins in Queensland, as the upstream operator of Australia Pacific LNG.In Australia, our approach to managing biodiversity is governed by the requirements of Federal and relevant state and territory laws and regulations. We are also required to comply with legal and regulatory conditions of the specific operating licences for our activities with regard to biodiversity management.Our approach to the management of biodiversity is guided by Origin’s Health, Safety and Environment (HSE) Policy, and the HSE Management System requirements.
FY2016 PERFORMANCEAt the end of FY2016, four operating sites across Origin’s activities had a level of biodiversity risk rated as high or above. Biodiversity management plans were in place for three of these sites.In FY2016, there were no incidents recorded at Origin operated sites that materially impacted biodiversity in areas of biodiversity significance.In FY2016, substantial progress was made regarding both direct and indirect offsets associated with Australia Pacific LNG, in line with our project approvals. This included approval of the Dukes Plain Offset and Rehabilitation Area Management Plan by the Australian Government, completion of the Condamine Fish Ladder, planting of propagated Acacia pedleyi seedlings into the Inverness Offset Area and the development of the Colamba Offset Area Management Plan. In addition, the Fitzroy River Turtle Nest Protection Program operated successfully for another season.
Compliance with Australia Pacific LNG Gas Field Environmental ApprovalsIn relation to State Government compliance in FY2016, there were 25 recorded environmental non-compliance events. These related to 19 minor spills of either CSG water, hydrocarbons and drill cutting residue to land; four water quality exceedances; one aquifer connection; and one unauthorised clearing.A third party audit during FY2016 identified a number of environmental non-compliances with the project’s Federal Government Environmental Approvals. These related to the threatened fauna habitat modelling methodology being used in our Threatened Fauna, Flora and Threatened Ecological Communities Management Plans.All above incidents were reported to the relevant government agency. It is considered that the potential for environmental harm as a result of these non-compliances is negligible.Full details of our compliance reporting on the project’s Federal Government Environment Approvals for the Gas Fields during the period are contained in the project’s statutory Annual Environmental Return.
BIODIVERSITY
Our operations are located in a wide variety of environmental settings with different biodiversity values.
41ORIGIN ENERGY SUSTAINABILITY REPORT 2016 OUR DUTY OF CARE: ECONOMIC ASPECTS
As Australia seeks to deliver on its carbon reduction commitments, we must seek to meet environmental objectives without unduly compromising the reliability and affordability of energy. Effective and stable policy is essential to achieving this transition and providing energy businesses and their customers with greater certainty in making choices. This year, our advocacy focused on policies related to climate change, access to resources and fiscal arrangements. We regularly engage with policymakers across all levels of government to advocate for well-informed and commercially viable policies. We support broader policy debate through participating in public forums, think tanks and research. We also provide advice and support to industry associations.
CLIMATE CHANGEWe support the progressive decarbonisation of the energy sector and encourage long-term emission reduction targets. Australia has a 2020 target of a 5 per cent reduction on 2000 levels, which the Australian Government plans to meet via its Direct Action Plan and Renewable Energy Target scheme. With current policy settings, Australia is estimated to be on track to achieve this 2020 target(74).The United Nations Framework Convention on Climate Change (UNFCCC) conference in December 2015 resulted in a historic worldwide agreement to limit the impacts of climate change.In FY2016, 177 countries pledged targets for the 2020–2030 period as part of the Paris Agreement. The agreement contains provision for countries to review and increase their targets every five years, commencing in 2020. As part of the agreement, Australia has committed to a 2030 target of a 26 to 28 per cent reduction on 2005 levels.We support the global target of no more than a 2°C global temperature change by 2100, and the aspiration to limit temperature change to 1.5°C. We also support Australia’s announced 2030 target and believe that greater reductions over time will require a suite of comprehensive policies.
We therefore advocate examining the most appropriate key policies required for each sector. This is especially important for the electricity sector, which needs to make large, long-term capital investments with a certain level of confidence. For the electricity sector, we believe these policies should include:
— an explicit carbon abatement cost, possibly through a baseline and credit approach for the sector
— support for the deployment of renewable energy at a significant scale, including consideration of how such support evolves in the period after 2020
— the orderly closure of highly emissions-intensive coal-fired power stations.
We have been preparing for a carbon-constrained world and our strategy has a target of 2°C in mind. This will involve:
— significantly increasing our support for renewable energy such as solar
— continuing the role of gas as an important complementary fuel for Australia that both supports the move to renewables and enhances reliability and affordability of the energy mix, and as a substitute for coal in international markets
— retiring our only coal-fired generator in the 2030s.
ACCESS TO RESOURCESAustralia can create significant additional economic, environmental and social benefits by developing low-carbon fuels such as natural gas. We face strong global competition in natural gas markets. A supportive market-based policy environment is necessary for the benefits to be realised.The east coast of Australia now has strongly interconnected gas markets with a diverse range of existing reserves and potential future supplies. Recent reports commissioned by Federal, state and territory governments, the Grattan Institute and the Australian Energy Market Operator have found that there are sufficient gas reserves on the east coast of Australia to supply growing domestic and international markets. The reports note that these reserves can be developed in a socially and environmentally responsible way.
Origin believes that allowing Australia’s resources to flow to their highest-value use creates the greatest benefits for the country. We believe that science-based policies and regulations that protect environmental and social values while supporting this outcome are more constructive than moratoriums
FISCAL ARRANGEMENTSAustralia’s tax system includes a complex set of national and state taxes. There are inefficiencies in our system. We continue to advocate that business tax policy, structure and levels should be internationally competitive to attract investment in Australia.We believe that sound tax policy can encourage research and development in less carbon-intensive fuels such as gas, renewables, and low-carbon electricity generation technologies. Programs such as accelerated depreciation can promote investment. Consistent and fair Federal and state royalty regimes can encourage resource development and the equitable allocation of economic benefits to stakeholders.Fiscal penalties that make Australian gas projects uncompetitive in the global market are detrimental to employment, economic and environmental outcomes. We advocate that the role of LNG in making a contribution to lower global emissions should be recognised. Until competitor countries in the global LNG industry set comparable prices on carbon, Australian LNG projects should be included in relevant assistance mechanisms.
(74) Department of Environment and Heritage, Tracking to 2020 – April 2016 update.
Governments play an instrumental role in shaping market settings and transitioning our economy to a low-carbon energy mix.
ECONOMIC ASPECTS POLICY
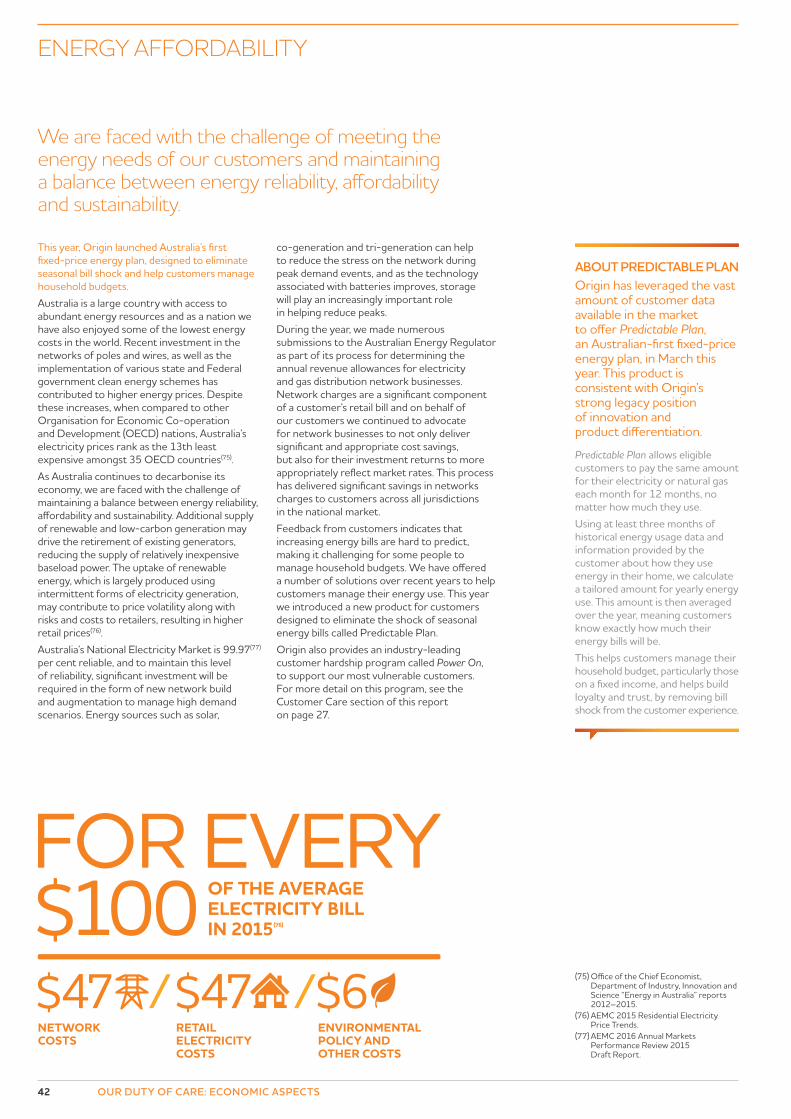
FOR EVERY $100 OF THE AVERAGE
ELECTRICITY BILL IN 2015(76)
$47NETWORK COSTS
RETAIL ELECTRICITY COSTS
$47ENVIRONMENTAL POLICY AND OTHER COSTS
$6
42 OUR DUTY OF CARE: ECONOMIC ASPECTS
This year, Origin launched Australia’s first fixed-price energy plan, designed to eliminate seasonal bill shock and help customers manage household budgets.Australia is a large country with access to abundant energy resources and as a nation we have also enjoyed some of the lowest energy costs in the world. Recent investment in the networks of poles and wires, as well as the implementation of various state and Federal government clean energy schemes has contributed to higher energy prices. Despite these increases, when compared to other Organisation for Economic Co-operation and Development (OECD) nations, Australia’s electricity prices rank as the 13th least expensive amongst 35 OECD countries(75).As Australia continues to decarbonise its economy, we are faced with the challenge of maintaining a balance between energy reliability, affordability and sustainability. Additional supply of renewable and low-carbon generation may drive the retirement of existing generators, reducing the supply of relatively inexpensive baseload power. The uptake of renewable energy, which is largely produced using intermittent forms of electricity generation, may contribute to price volatility along with risks and costs to retailers, resulting in higher retail prices(76).Australia’s National Electricity Market is 99.97(77) per cent reliable, and to maintain this level of reliability, significant investment will be required in the form of new network build and augmentation to manage high demand scenarios. Energy sources such as solar,
co-generation and tri-generation can help to reduce the stress on the network during peak demand events, and as the technology associated with batteries improves, storage will play an increasingly important role in helping reduce peaks.During the year, we made numerous submissions to the Australian Energy Regulator as part of its process for determining the annual revenue allowances for electricity and gas distribution network businesses. Network charges are a significant component of a customer’s retail bill and on behalf of our customers we continued to advocate for network businesses to not only deliver significant and appropriate cost savings, but also for their investment returns to more appropriately reflect market rates. This process has delivered significant savings in networks charges to customers across all jurisdictions in the national market.Feedback from customers indicates that increasing energy bills are hard to predict, making it challenging for some people to manage household budgets. We have offered a number of solutions over recent years to help customers manage their energy use. This year we introduced a new product for customers designed to eliminate the shock of seasonal energy bills called Predictable Plan.Origin also provides an industry-leading customer hardship program called Power On, to support our most vulnerable customers. For more detail on this program, see the Customer Care section of this report on page 27.
ENERGY AFFORDABILITY
We are faced with the challenge of meeting the energy needs of our customers and maintaining a balance between energy reliability, affordability and sustainability.
(75) Office of the Chief Economist, Department of Industry, Innovation and Science “Energy in Australia” reports 2012–2015.
(76) AEMC 2015 Residential Electricity Price Trends.
(77) AEMC 2016 Annual Markets Performance Review 2015 Draft Report.
ABOUT PREDICTABLE PLANOrigin has leveraged the vast amount of customer data available in the market to offer Predictable Plan, an Australian-first fixed-price energy plan, in March this year. This product is consistent with Origin’s strong legacy position of innovation and product differentiation.
Predictable Plan allows eligible customers to pay the same amount for their electricity or natural gas each month for 12 months, no matter how much they use.Using at least three months of historical energy usage data and information provided by the customer about how they use energy in their home, we calculate a tailored amount for yearly energy use. This amount is then averaged over the year, meaning customers know exactly how much their energy bills will be.This helps customers manage their household budget, particularly those on a fixed income, and helps build loyalty and trust, by removing bill shock from the customer experience.
43ORIGIN ENERGY SUSTAINABILITY REPORT 2016 OUR DUTY OF CARE: ECONOMIC ASPECTS
During the period, our Regional Buy program in the gas field communities of Australia Pacific LNG involved working with our major contractors to focus on local business participation. In delivering on our Reconciliation Action Plan commitments, we also focused on increasing participation by Indigenous businesses in our supply chain. We acknowledge the risk that parties in our supply chain may conduct their business in ways that are not aligned with our policies and expectations of business conduct. These include anti-bribery and anti-corruption expectations, and health, safety and environment requirements. Origin’s centralised supply chain structure and control framework was introduced in 2016 to manage this risk.Within our control framework, there is a mandated supplier risk-profiling process governed by Origin’s Risk Management Framework. Before we engage a supplier, we undertake a profiling exercise to determine if a supplier poses a risk to our expectations of business conduct.As part of our Risk Management Framework there are mechanisms in place to mitigate the risk that an Origin employee or supplier may solicit, offer, promise, give or accept an advantage that is illegal, unethical or in breach of trust in relation to supply contracts. This includes segregation of duties for procurement activities, conflict-of-interest declarations in the sourcing process, and training and support materials regarding relevant obligations.During the tender evaluation stage, our supply chain processes seek to identify if materials and services have been procured from high-risk countries. We also conduct a health, safety and environment pre-qualification process prior to a supplier being registered for use by Origin. Further reviews are also completed prior to each engagement.Our contract management process uses the results of these reviews to mitigate identified risks for all suppliers that are subsequently engaged. These include Quality Assurance and Quality Control Activities, HSE Contracts schedules, HSE monthly reporting and supporting processes to correct any identified issues.
FY2016 PERFORMANCEIn our role as upstream operator of Australia Pacific LNG, we aim to consult with local communities to ensure they are informed and have opportunities to provide input to our economic participation approach. During the period, stakeholders expressed that they wanted Origin to increase both local employment and procurement of local goods and services. In response, Origin has commenced a number of initiatives aimed at improving regional economic participation outcomes. We will continue to keep communities informed and seek their feedback on our emerging strategies and outcomes.
BUY LOCAL – EMPLOY LOCALProcuring from local suppliers and hiring local employees is the most significant way we can share economic value in local communities. The transition of Australia Pacific LNG to its operational phase, involves a significantly reduced spend profile, and a smaller number of contracting opportunities. We have remodelled our approach to regional economic participation to integrate requirements into business as usual practices i.e. sourcing strategies, evaluations and recommendations to award to ensure we deliver on our operational requirements.Our Regional Buy program aims to identify additional opportunities for local suppliers to participate in our supply chain. The Regional Buy program focuses on small to medium-size enterprises within our APLNG operating footprint, largely consisting of the Western Downs Regional Council, Maranoa Regional Council and Banana Shire local government areas.The program is integrated with our procurement process and provides regional business with direct access to dedicated procurement specialists, giving them visibility of upcoming opportunities. Where applicable, we also require our major contractors to have a plan for maximising local business participation and employment, and we manage their performance against these plans.
LOCAL EMPLOYMENTAs the upstream operator for Australia Pacific LNG, we are also a major regional employer in the Surat Basin. At the end of the period, we directly employed 168 people from the local community, representing 28 per cent of our regionally based workforce. This is a reduction from the prior reporting period, reflecting the organisation changes to the Integrated Gas division during the period.
INCREASING INDIGENOUS PARTICIPATIONOrigin released its first Reconciliation Action Plan (RAP) in April 2015. In it, we committed to exploring where Aboriginal and Torres Strait Islander businesses and businesses with high representation of Aboriginal and Torres Strait Islander peoples can add value to our business.In the period, we continued our Indigenous Participation Plans in key contracts, to maximise business and employment opportunities for Aboriginal and Torres Strait Islander people in our supply chain. In FY2016, we also expanded our regional buy database to include Indigenous businesses. During the period, 11 Indigenous businesses provided goods and services to the Australia Pacific LNG project. As at the end of the reporting period, Indigenous businesses had provided services worth $7.8 million to the Australia Pacific LNG project.We have partnered with Many Rivers, a not-for-profit micro enterprise development organisation that, during the period, provided support and advice primarily to small Indigenous businesses.
SUSTAINABILITY IN OUR SUPPLY CHAIN
Our supply chain encompasses suppliers and contractors, and those commercial parties who directly or indirectly support them in meeting our needs.

In this section, we connect to our Annual Report to disclose the value added during the year.
ADD
ING
AN
D D
ISTR
IBU
TIN
G V
ALU
E
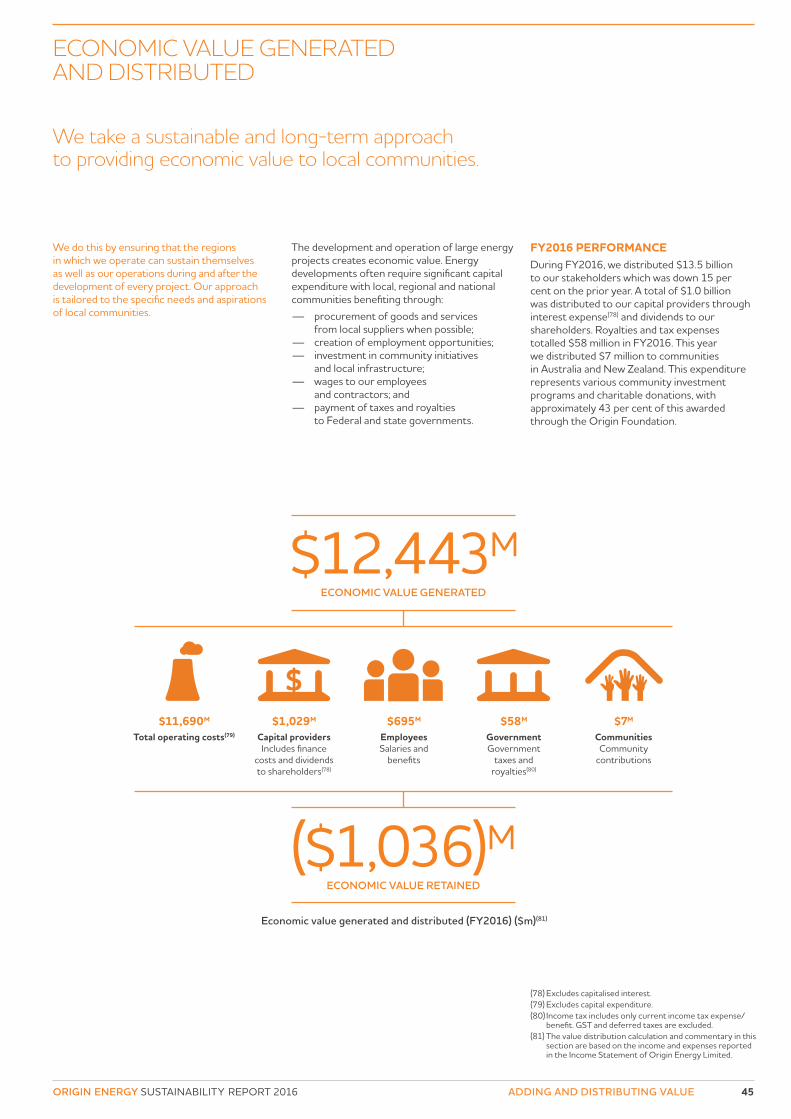
$11,690M
Total operating costs(79)
$1,029M
Capital providersIncludes finance
costs and dividends to shareholders(78)
$695M
EmployeesSalaries and
benefits
$58M
GovernmentGovernment
taxes and royalties(80)
$7M
CommunitiesCommunity
contributions
$12,443MECONOMIC VALUE GENERATED
($1,036)MECONOMIC VALUE RETAINED
45ORIGIN ENERGY SUSTAINABILITY REPORT 2016 ADDING AND DISTRIBUTING VALUE
We do this by ensuring that the regions in which we operate can sustain themselves as well as our operations during and after the development of every project. Our approach is tailored to the specific needs and aspirations of local communities.
The development and operation of large energy projects creates economic value. Energy developments often require significant capital expenditure with local, regional and national communities benefiting through:
— procurement of goods and services from local suppliers when possible;
— creation of employment opportunities; — investment in community initiatives
and local infrastructure; — wages to our employees
and contractors; and — payment of taxes and royalties
to Federal and state governments.
FY2016 PERFORMANCEDuring FY2016, we distributed $13.5 billion to our stakeholders which was down 15 per cent on the prior year. A total of $1.0 billion was distributed to our capital providers through interest expense(78) and dividends to our shareholders. Royalties and tax expenses totalled $58 million in FY2016. This year we distributed $7 million to communities in Australia and New Zealand. This expenditure represents various community investment programs and charitable donations, with approximately 43 per cent of this awarded through the Origin Foundation.
ECONOMIC VALUE GENERATED AND DISTRIBUTED
Economic value generated and distributed (FY2016) ($m)(81)
We take a sustainable and long-term approach to providing economic value to local communities.
(78) Excludes capitalised interest.(79) Excludes capital expenditure.(80) Income tax includes only current income tax expense/
benefit. GST and deferred taxes are excluded.(81) The value distribution calculation and commentary in this
section are based on the income and expenses reported in the Income Statement of Origin Energy Limited.
46 ADDING AND DISTRIBUTING VALUE
FINANCIAL PERFORMANCE FY2016
Within this environment, Origin delivered strong operational performance, however the result was offset by the impact of lower oil prices. The company made good progress on asset sales and cost reductions during the financial year, resulting in a $4 billion reduction in adjusted net debt(82).
FY2016 PERFORMANCE Origin announced an underlying profit from continuing operations of $354 million, down 41 per cent on the previous year. The result included a strong operational performance from Origin’s Energy Markets business and maiden LNG production by Australia Pacific LNG, offset by increased interest, depreciation and amortisation expense relating to the LNG business. Statutory loss from total operations was $589 million, an improvement of 10 per cent on the prior year. The main drivers of this result include the lower underlying profit from continuing operations, down $249 million from the prior period; the sale of Origin’s entire interest in Contact Energy, resulting in a reduction of $55 million; offset by a reduction in items excluded from underlying profit of $386 million.While acknowledging both a statutory loss and a reduction in underlying profit, Origin has made significant progress in the past year through asset sales, cost reduction, improving cash flow and the equity raising. These actions resulted in a significant reduction in debt and the company is well placed to exceed its target to reduce adjusted net debt(82) to below $9 billion by the end of FY2017.Items excluded from underlying profit include non-cash, after tax impairments of $515 million in the full year, $271 million of which was taken in the second half, driven mainly by downward revisions to reserves previously disclosed in the Company’s Annual Reserves Report in July 2016.Net cash from operating and investing activities improved $3.3 billion to $1.2 billion driven by asset sales and improving cash flow as capital expenditure and operating costs reduced. As a consequence of improved cash flows, asset sales and the Entitlement Offer in October 2015, Origin’s adjusted net debt(82) decreased $4 billion to $9.1 billion.Given the important task of continued debt reduction, and the fact that in the current lower oil price environment Origin is not generating franking credits sufficient to frank any dividends, the Board determined to not pay a dividend in respect of earnings for the second half of the financial year.
ENERGY MARKETS The Energy Markets segment has significantly increased cash from operating and investing activities and improved operational outcomes across many key indicators of performance. A strong operational performance from Energy Markets resulted in an increased EBITDA contribution of $70 million to $1.3 billion. Gross profit contributions from the Natural Gas and Electricity businesses were preserved in a market that has changed significantly in the past year while costs were reduced. Importantly, net cash flow from operating and investing activities increased by $522 million to $1.3 billion.
INTEGRATED GASDuring the year, the Integrated Gas segment achieved an important milestone with the commencement of LNG sales from Australia Pacific LNG’s first Train. Train 2 is expected to commence production in Q2 FY2017. This transition from development through to production in FY2016 and FY2017 will see Origin benefit significantly from its investment in Australia Pacific LNG through earnings and returns from FY2018 and beyond.Train 1 production has ramped up quickly to above design nameplate capacity and as at 17 August 2016, Australia Pacific LNG had shipped 36 cargoes, primarily to its two major customers, Sinopec and Kansai.EBITDA from the Integrated Gas segment decreased $112 million to $386 million as the maiden contribution from the commencement of LNG sales by Australia Pacific LNG was offset by the impact of lower oil prices, lower production and increased exploration expense. Net cash flows used in operating and investing activities improved by $1.4 billion to $1.6 billion due to reduced capital spend in the E&P business and lower contributions to Australia Pacific LNG as the project nears completion.
BUILDING RESILIENCE During the past year, asset sales totaling $484 million have been announced, in addition to the sale of Origin’s interest in Contact Energy, totaling $1.6 billion. The sale of additional assets is on track to meet our target of $800 million by the end of FY2017.In the 18 months to the end of FY2016, our workforce was reduced by 28 per cent, or 2,500 people, as acquisition and development activities diminished. This will support a continued reduction in cash costs into FY2017. The company also took action to reduce exposure to low oil prices through the purchase of put options over 15 million barrels of oil for FY2017 at prices of US$40 per barrel and A$55 per barrel.
LOOKING AHEADFY2016 and FY2017 are transitional years for Origin as LNG production commences and ramps up to full production over this period. In FY2017 Origin expects(83) a 45 – 60 per cent increase in Underlying EBITDA when compared to FY2016 Underlying EBITDA from continuing operations:
— Energy Markets Underlying EBITDA to increase to $1.44 billion – $1.54 billion, driven by Electricity margin expansion, maintaining the increased Natural Gas contribution, continued improvement in cost to serve and an increased contribution from LPG and Solar & Energy Services. This includes additional annual costs of approximately $32 million from new agreements entered into as part of asset sales to date.
— Integrated Gas Underlying EBITDA to increase to $1 billion – $1.15 billion, comprising:
— E&P Underlying EBITDA to increase to $350 – $400 million, driven by increased production from Halladale/Speculant coming online, partly offset by lower production across other basins.
— LNG Underlying EBITDA to increase to $650 – $750 million as LNG production continues to ramp up and revenue recognition for Train 2 begins in Q3 FY2017.
— Corporate costs to reduce as benefits from the functional cost reduction program are realised.
Origin continues to target further debt reduction and expects adjusted net debt to be well below its target of $9 billion at the end of the 2017 financial year.In FY2018 and beyond, as Australia Pacific LNG transitions from development to production, Origin expects to see significant growth in earnings and returns, strong cash flow and continuing reduction in debt. In a world increasingly committed to reducing carbon emissions, Origin’s strategy is to continue connecting resources to markets on an increasingly sustainable basis. To this end, Origin is well positioned for a carbon constrained future through a focus on gas and renewables.
During the 2016 financial year there were major changes in the global energy industry with lower oil prices, new LNG projects coming into production and increasing global commitments to reducing carbon.
(82) Adjusted net debt includes the effect of FX hedging transactions on foreign currency debt in order to reflect the quantum of debt Origin is required to repay upon maturity.
(83) This guidance is based on an average oil price US$52.90/bbl and a AUD/USD exchange rate of $0.74 and is dependent on the timing of production from Train 2. For APLNG, the effective oil price for oil-linked LNG sales will incorporate the lag in oil prices associated with LNG Sale and Purchase Agreements.

47ORIGIN ENERGY SUSTAINABILITY REPORT 2016 ADDING AND DISTRIBUTING VALUE
We also focus on the power of education to help create better lives for young Australians, through the Origin Foundation. This year the Foundation continued to deliver focused support for education programs, providing more funding to non-profit organisations than ever before.
ORIGIN FOUNDATIONThe Origin Foundation is our philanthropic body, funded and established by Origin in 2010. Our focus, chosen by the people of Origin, is to support programs that use education to help break the cycle of disadvantage and empower young Australians to reach their potential.The Foundation provides funding to Australian non-profit organisations that use education, training and development to help young people become the best that they can be. Since inception, the Origin Foundation has distributed $15.9 million to the community.Our grants program focuses on three areas: addressing the gender imbalance in Science, Technology, Engineering and Maths education; equality of educational opportunity for Indigenous students and young people living in regional and rural Australia; and helping to build a stronger community sector, by supporting the training and professional development of employees in the non-profit sector. During FY2016, we provided $1.4 million through this program.
Origin’s employees play a critical role in the Origin Foundation through the Give Time program. With fully paid volunteer leave, Origin employees donate their time and professional skills to help our Foundation partners. In FY2016, employees gave more than 6,000 hours of their time to a wide variety of projects, including helping young Indigenous children with their reading, inspiring the next generation of scientists and engineers, cooking breakfast for The Big Issue vendors and lending their hands to a range of conservation projects.The Foundation also matches the donations Origin employees make to charitable organisations through the workplace giving program. In the 2016 financial year, Origin employees donated more than $337,000 through the Give2 program which, when matched by the Origin Foundation, delivered over $674,000 to over 210 organisations in the not-for-profit sector.The performance of the Origin Foundation is published annually and can be read at www.originfoundation.com.au.
COMMUNITY INVESTMENT AT AUSTRALIA PACIFIC LNGDuring FY2016, Origin, as upstream operator of Australia Pacific LNG, contributed a further $3.36 million in community investment, including community infrastructure and partnerships in the Surat Basin. See the CSR Highlights section of this report for more detail on some of the activities we’ve invested in during the year. Since project inception, Origin has spent more than $21.6 million on community investment, primarily through the implementation of the Social Impact Management Plan.
INVESTING IN SOCIAL AND ENVIRONMENTAL RESEARCHOrigin and Australia Pacific LNG helped CSIRO form the Gas Industry Social & Environmental Research Alliance (GISERA) in 2011, to invest in research to understand the impacts of the broader CSG industry. GISERA researches issues around the gas industry, to address community concerns. CSIRO maintains independence from industry and government through its strong governance framework, which is designed to ensure the highest standards of research independence, transparency and integrity. In FY2016, we continued to participate in the research of this important initiative. Visit the GISERA website for more information: gisera.org.auIn 2011, Origin and Australia Pacific LNG also joined the University of Queensland’s Centre for Coal Seam Gas (CCSG), an alliance that provides gas industry, technology, environment, and social research. We continued to participate in collaborative research throughout FY2016. Visit the CCSG website for more information: ccsg.uq.edu.au.
CREATING VALUE IN OUR COMMUNITIES
As part of our day-to-day activities in the communities in which we operate, we concentrate our efforts on the projects and activities where our contributions will generate real value for local people.
48 ADDING AND DISTRIBUTING VALUE
CSR HIGHLIGHTS
CAREERTRACKERSSince 2014, Origin has partnered with the non-profit organisation CareerTrackers to provide internship opportunities for Indigenous university students looking to gain valuable work experience with an ASX-listed company.
As part of Origin’s Reconciliation Action Plan, we’ve committed to providing internships through this program for the next 10 years, with the aim of transitioning students into full-time employees upon completion of their degree.For more information about our partnership with CareerTrackers, visit our website.
FAIRYMEADOW ROAD IRRIGATION PIPELINE SCHEME – WATER TO LANDHOLDERSAs the upstream operator of Australia Pacific LNG, Origin works with landholders to find beneficial uses for water produced as a result of CSG development.
The Fairymeadow Road Irrigation Pipeline Scheme is a long-term collaboration with participating landholders to open up new or expanded irrigation opportunities. The scheme helps to achieve maximum beneficial use of water purified at the Talinga and Condabri Water Treatment Facilities.To find out more about the Fairymeadow Road Irrigation Pipeline Scheme, visit our website.
ORIGIN FOUNDATIONEstablished in 2010, the Origin Foundation is using education to break the cycle of disadvantage and empower young Australians to reach their potential. We pursue an Engaged Philanthropy model, offering added value to our Grants Program partners primarily through access to skilled volunteering.
Our Grants Program includes three focus areas: — Creating greater gender diversity in
‘STEM’ education – science, technology, engineering and maths;
— Equality of educational opportunity for Indigenous students and children in rural remote Australia; and
— Building a stronger community sector by increasing the professionalism and productivity of the not-for-profit sector through training and development.
For more information on the work of the Origin Foundation, visit our website.
GISERAAustralia Pacific LNG is one of the foundation partners of the Gas Industry Social and Environment Research Alliance (GISERA), along with the CSIRO and QGC.
GISERA’s core objectives are to carry out research and provide information for the benefit of Australian communities in CSG and shale gas regions and industry, and to inform governments and policymakers of key research outcomes.GISERA’s research addresses the potential social, economic and environmental challenges and opportunities of the gas industry.For more information, visit our website.
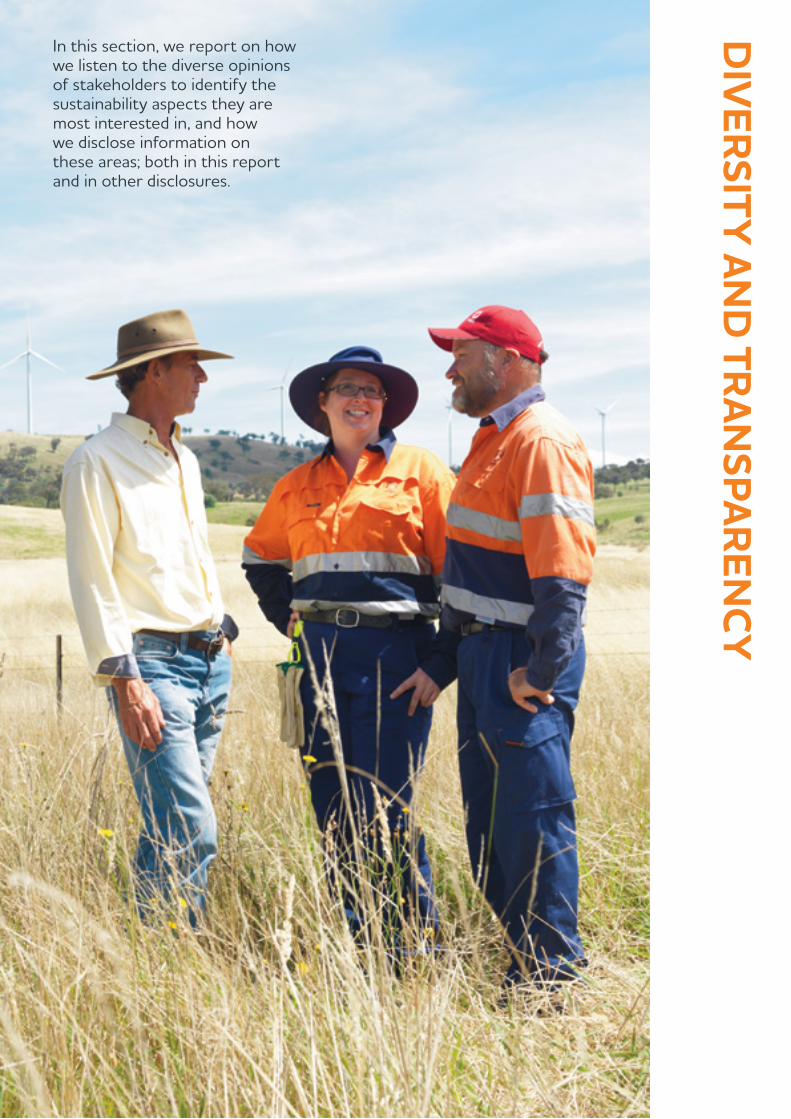
In this section, we report on how we listen to the diverse opinions of stakeholders to identify the sustainability aspects they are most interested in, and how we disclose information on these areas; both in this report and in other disclosures.
DIV
ERSITY AN
D TR
ANSPAR
ENCY
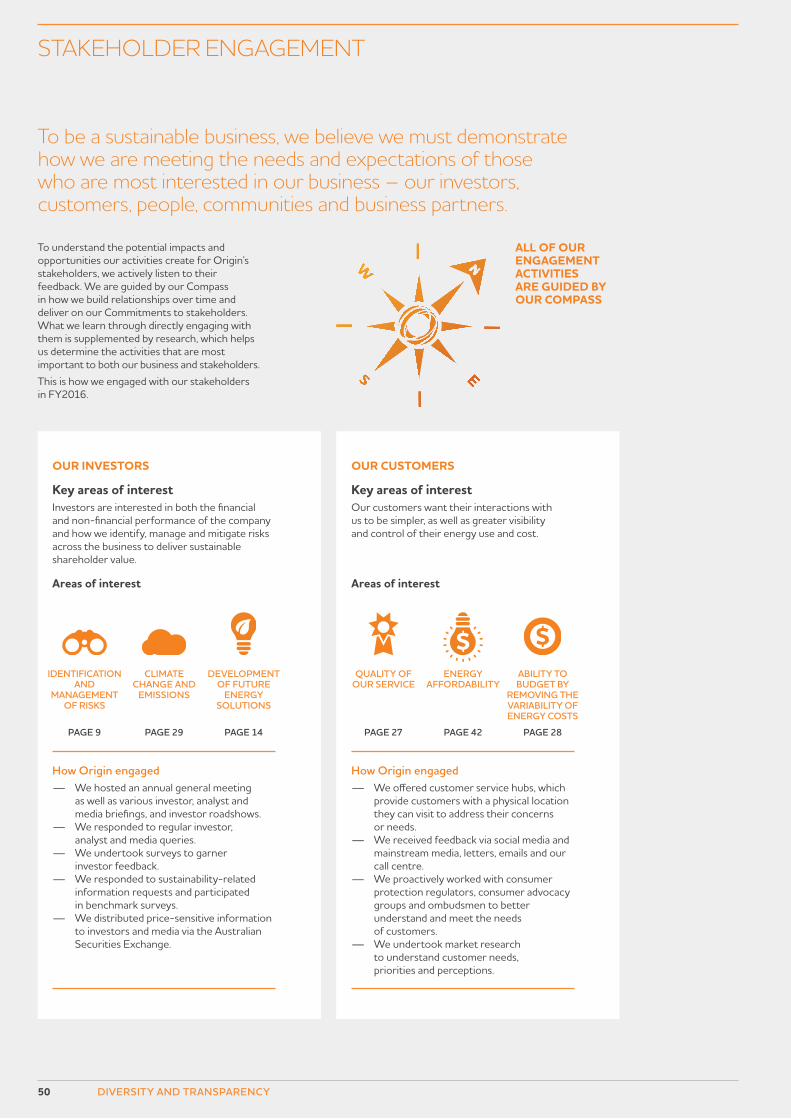
STAKEHOLDER ENGAGEMENT
To be a sustainable business, we believe we must demonstrate how we are meeting the needs and expectations of those who are most interested in our business – our investors, customers, people, communities and business partners.
To understand the potential impacts and opportunities our activities create for Origin’s stakeholders, we actively listen to their feedback. We are guided by our Compass in how we build relationships over time and deliver on our Commitments to stakeholders. What we learn through directly engaging with them is supplemented by research, which helps us determine the activities that are most important to both our business and stakeholders.This is how we engaged with our stakeholders in FY2016.
OUR CUSTOMERS
Key areas of interestOur customers want their interactions with us to be simpler, as well as greater visibility and control of their energy use and cost.
Areas of interest
How Origin engaged — We offered customer service hubs, which
provide customers with a physical location they can visit to address their concerns or needs.
— We received feedback via social media and mainstream media, letters, emails and our call centre.
— We proactively worked with consumer protection regulators, consumer advocacy groups and ombudsmen to better understand and meet the needs of customers.
— We undertook market research to understand customer needs, priorities and perceptions.
QUALITY OF OUR SERVICE
PAGE 27
ENERGY AFFORDABILITY
PAGE 42
ABILITY TO BUDGET BY
REMOVING THE VARIABILITY OF ENERGY COSTS
PAGE 28
OUR INVESTORS
Key areas of interestInvestors are interested in both the financial and non-financial performance of the company and how we identify, manage and mitigate risks across the business to deliver sustainable shareholder value.
Areas of interest
How Origin engaged — We hosted an annual general meeting
as well as various investor, analyst and media briefings, and investor roadshows.
— We responded to regular investor, analyst and media queries.
— We undertook surveys to garner investor feedback.
— We responded to sustainability-related information requests and participated in benchmark surveys.
— We distributed price-sensitive information to investors and media via the Australian Securities Exchange.
IDENTIFICATION AND
MANAGEMENT OF RISKS
PAGE 9
CLIMATE CHANGE AND
EMISSIONS
PAGE 29
DEVELOPMENT OF FUTURE
ENERGY SOLUTIONS
PAGE 14
ALL OF OUR ENGAGEMENT ACTIVITIES ARE GUIDED BY OUR COMPASS
50 DIVERSITY AND TRANSPARENCY
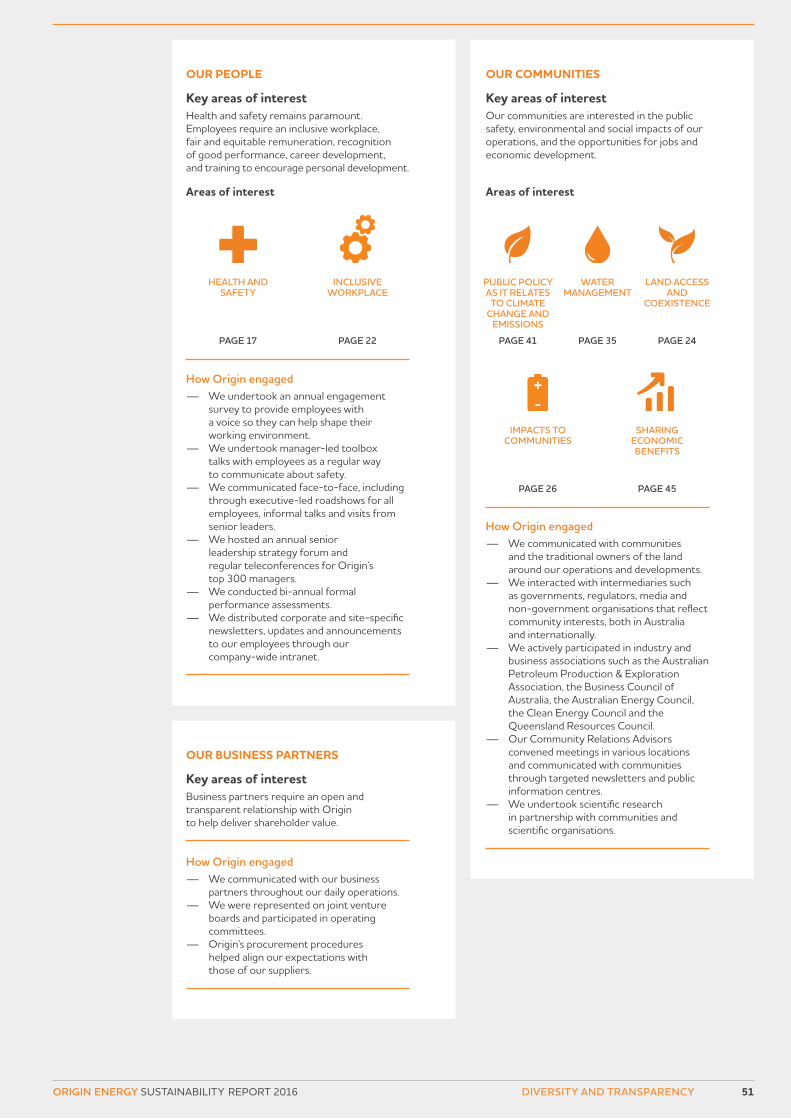
OUR PEOPLE
Key areas of interestHealth and safety remains paramount. Employees require an inclusive workplace, fair and equitable remuneration, recognition of good performance, career development, and training to encourage personal development.
Areas of interest
How Origin engaged — We undertook an annual engagement
survey to provide employees with a voice so they can help shape their working environment.
— We undertook manager-led toolbox talks with employees as a regular way to communicate about safety.
— We communicated face-to-face, including through executive-led roadshows for all employees, informal talks and visits from senior leaders.
— We hosted an annual senior leadership strategy forum and regular teleconferences for Origin’s top 300 managers.
— We conducted bi-annual formal performance assessments.
— We distributed corporate and site-specific newsletters, updates and announcements to our employees through our company-wide intranet.
HEALTH AND SAFETY
PAGE 17
INCLUSIVE WORKPLACE
PAGE 22
IMPACTS TO COMMUNITIES
PAGE 26
SHARING ECONOMIC BENEFITS
PAGE 45
OUR COMMUNITIES
Key areas of interestOur communities are interested in the public safety, environmental and social impacts of our operations, and the opportunities for jobs and economic development.
Areas of interest
How Origin engaged — We communicated with communities
and the traditional owners of the land around our operations and developments.
— We interacted with intermediaries such as governments, regulators, media and non-government organisations that reflect community interests, both in Australia and internationally.
— We actively participated in industry and business associations such as the Australian Petroleum Production & Exploration Association, the Business Council of Australia, the Australian Energy Council, the Clean Energy Council and the Queensland Resources Council.
— Our Community Relations Advisors convened meetings in various locations and communicated with communities through targeted newsletters and public information centres.
— We undertook scientific research in partnership with communities and scientific organisations.
PUBLIC POLICY AS IT RELATES TO CLIMATE
CHANGE AND EMISSIONS
PAGE 41
WATER MANAGEMENT
PAGE 35
LAND ACCESS AND
COEXISTENCE
PAGE 24
OUR BUSINESS PARTNERS
Key areas of interestBusiness partners require an open and transparent relationship with Origin to help deliver shareholder value.
How Origin engaged — We communicated with our business
partners throughout our daily operations. — We were represented on joint venture
boards and participated in operating committees.
— Origin’s procurement procedures helped align our expectations with those of our suppliers.
51ORIGIN ENERGY SUSTAINABILITY REPORT 2016 DIVERSITY AND TRANSPARENCY
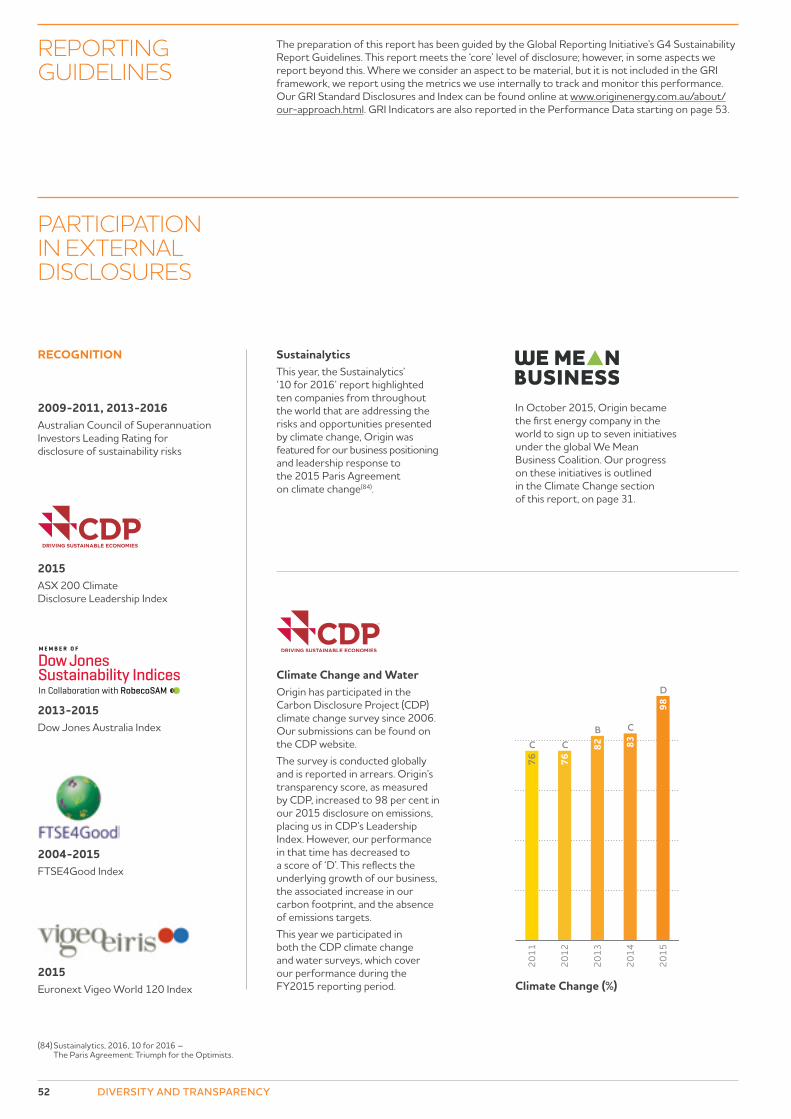
52 DIVERSITY AND TRANSPARENCY
(84) Sustainalytics, 2016, 10 for 2016 – The Paris Agreement: Triumph for the Optimists.
76
C
D
CBC
76
82 83
9820
15
2014
2013
2012
2011
Climate Change (%)
REPORTING GUIDELINES
The preparation of this report has been guided by the Global Reporting Initiative’s G4 Sustainability Report Guidelines. This report meets the ‘core’ level of disclosure; however, in some aspects we report beyond this. Where we consider an aspect to be material, but it is not included in the GRI framework, we report using the metrics we use internally to track and monitor this performance. Our GRI Standard Disclosures and Index can be found online at www.originenergy.com.au/about/our-approach.html. GRI Indicators are also reported in the Performance Data starting on page 53.
PARTICIPATION IN EXTERNAL DISCLOSURES
Climate Change and WaterOrigin has participated in the Carbon Disclosure Project (CDP) climate change survey since 2006. Our submissions can be found on the CDP website.The survey is conducted globally and is reported in arrears. Origin’s transparency score, as measured by CDP, increased to 98 per cent in our 2015 disclosure on emissions, placing us in CDP’s Leadership Index. However, our performance in that time has decreased to a score of ‘D’. This reflects the underlying growth of our business, the associated increase in our carbon footprint, and the absence of emissions targets. This year we participated in both the CDP climate change and water surveys, which cover our performance during the FY2015 reporting period.
In October 2015, Origin became the first energy company in the world to sign up to seven initiatives under the global We Mean Business Coalition. Our progress on these initiatives is outlined in the Climate Change section of this report, on page 31.
Sustainalytics This year, the Sustainalytics’ ‘10 for 2016’ report highlighted ten companies from throughout the world that are addressing the risks and opportunities presented by climate change, Origin was featured for our business positioning and leadership response to the 2015 Paris Agreement on climate change(84).
RECOGNITION
2015ASX 200 Climate Disclosure Leadership Index
2013-2015Dow Jones Australia Index
2004-2015FTSE4Good Index
2015Euronext Vigeo World 120 Index
2009-2011, 2013-2016Australian Council of Superannuation Investors Leading Rating for disclosure of sustainability risks
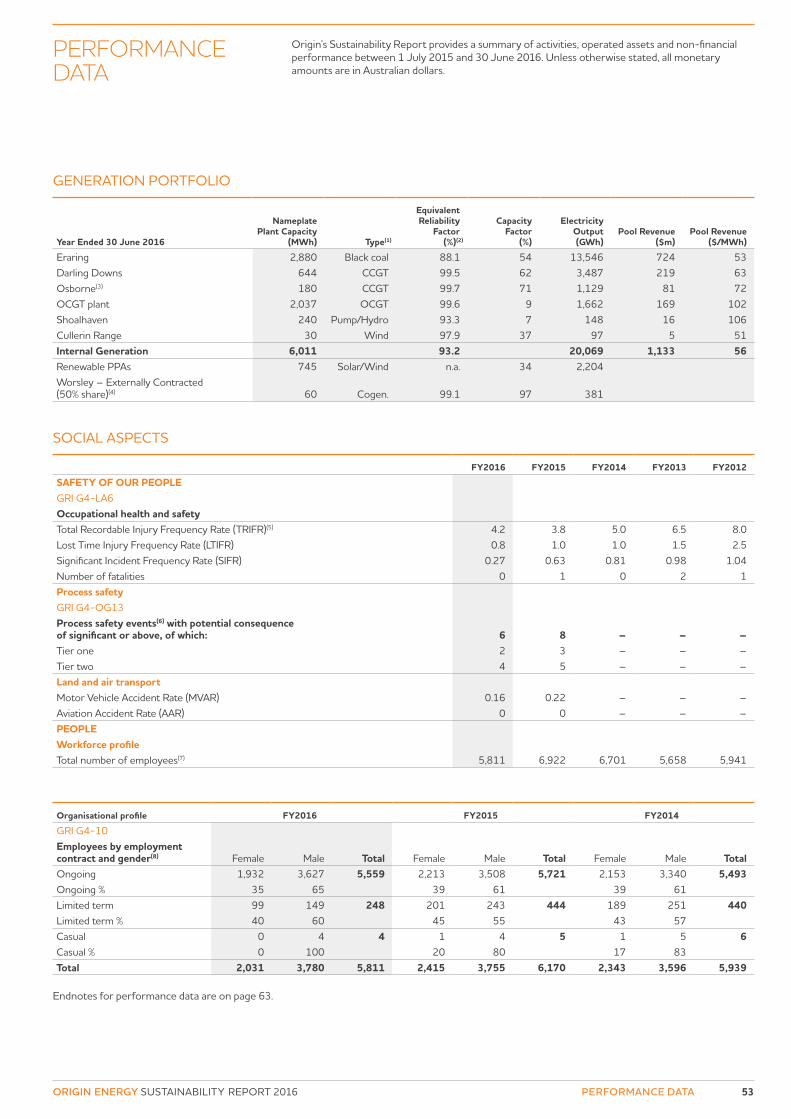
53ORIGIN ENERGY SUSTAINABILITY REPORT 2016 PERFORMANCE DATA
GENERATION PORTFOLIO
Year Ended 30 June 2016
Nameplate Plant Capacity
(MWh) Type(1)
Equivalent2 Reliability2
Factor2 (%)(2)
Capacity Factor
(%)
Electricity Output (GWh)
Pool Revenue ($m)
Pool Revenue ($/MWh)
Eraring 2,880 Black coal 88.1 54 13,546 724 53Darling Downs 644 CCGT 99.5 62 3,487 219 63Osborne(3) 180 CCGT 99.7 71 1,129 81 72OCGT plant 2,037 OCGT 99.6 9 1,662 169 102Shoalhaven 240 Pump/Hydro 93.3 7 148 16 106Cullerin Range 30 Wind 97.9 37 97 5 51Internal Generation 6,011 93.2 20,069 1,133 56Renewable PPAs 745 Solar/Wind n.a. 34 2,204Worsley – Externally Contracted (50% share)(4) 60 Cogen. 99.1 97 381
SOCIAL ASPECTS
FY2016 FY2015 FY2014 FY2013 FY2012
SAFETY OF OUR PEOPLEGRI G4-LA6 Occupational health and safetyTotal Recordable Injury Frequency Rate (TRIFR)(5) 4.2 3.8 5.0 6.5 8.0Lost Time Injury Frequency Rate (LTIFR) 0.8 1.0 1.0 1.5 2.5 Significant Incident Frequency Rate (SIFR) 0.27 0.63 0.81 0.98 1.04Number of fatalities 0 1 0 2 1Process safetyGRI G4-OG13 Process safety events(6) with potential consequence of significant or above, of which: 6 8 – – –Tier one 2 3 – – –Tier two 4 5 – – –Land and air transportMotor Vehicle Accident Rate (MVAR) 0.16 0.22 – – –Aviation Accident Rate (AAR) 0 0 – – –PEOPLEWorkforce profileTotal number of employees(7) 5,811 6,922 6,701 5,658 5,941
Organisational profile FY2016 FY2015 FY2014
GRI G4-10Employees by employment contract and gender(8) Female Male Total Female Male Total Female Male TotalOngoing 1,932 3,627 5,559 2,213 3,508 5,721 2,153 3,340 5,493Ongoing % 35 65 39 61 39 61Limited term 99 149 248 201 243 444 189 251 440Limited term % 40 60 45 55 43 57Casual 0 4 4 1 4 5 1 5 6Casual % 0 100 20 80 17 83Total 2,031 3,780 5,811 2,415 3,755 6,170 2,343 3,596 5,939
Endnotes for performance data are on page 63.
PERFORMANCE DATA
Origin’s Sustainability Report provides a summary of activities, operated assets and non-financial performance between 1 July 2015 and 30 June 2016. Unless otherwise stated, all monetary amounts are in Australian dollars.
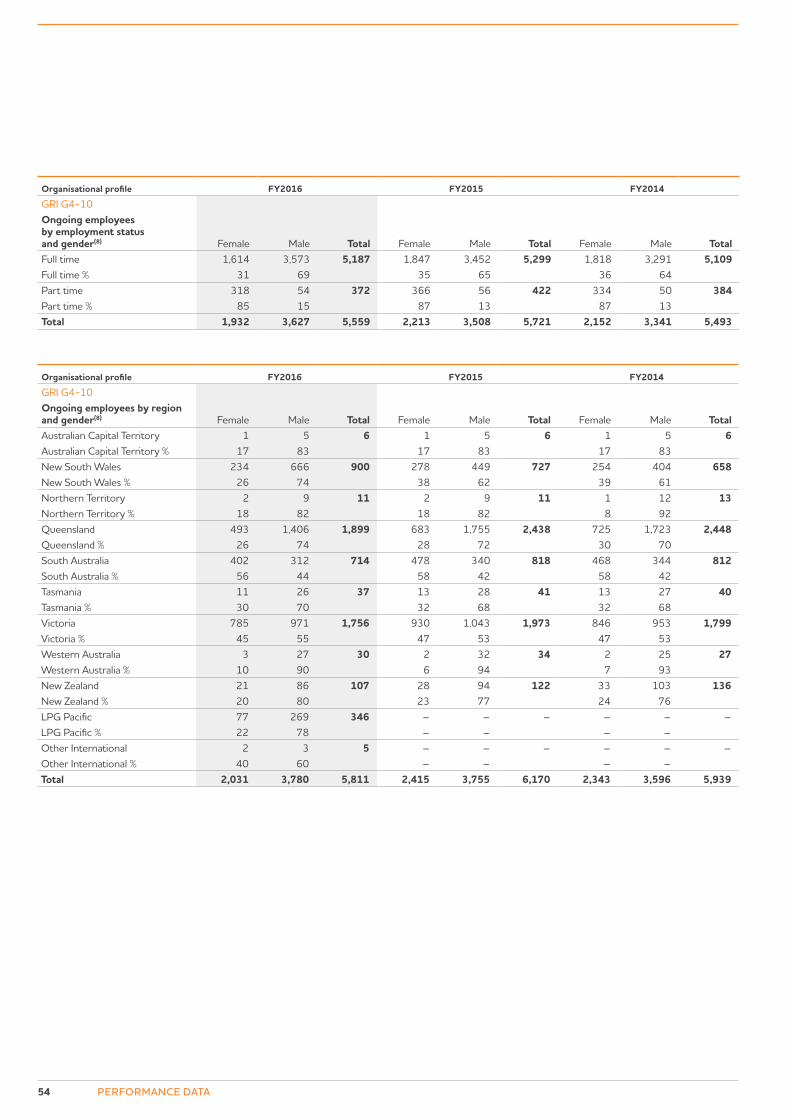
54 PERFORMANCE DATA
Organisational profile FY2016 FY2015 FY2014
GRI G4-10Ongoing employees by employment status and gender(8) Female Male Total Female Male Total Female Male TotalFull time 1,614 3,573 5,187 1,847 3,452 5,299 1,818 3,291 5,109Full time % 31 69 35 65 36 64 Part time 318 54 372 366 56 422 334 50 384Part time % 85 15 87 13 87 13Total 1,932 3,627 5,559 2,213 3,508 5,721 2,152 3,341 5,493
Organisational profile FY2016 FY2015 FY2014
GRI G4-10Ongoing employees by region and gender(8) Female Male Total Female Male Total Female Male TotalAustralian Capital Territory 1 5 6 1 5 6 1 5 6Australian Capital Territory % 17 83 17 83 17 83 New South Wales 234 666 900 278 449 727 254 404 658New South Wales % 26 74 38 62 39 61 Northern Territory 2 9 11 2 9 11 1 12 13Northern Territory % 18 82 18 82 8 92 Queensland 493 1,406 1,899 683 1,755 2,438 725 1,723 2,448Queensland % 26 74 28 72 30 70 South Australia 402 312 714 478 340 818 468 344 812South Australia % 56 44 58 42 58 42 Tasmania 11 26 37 13 28 41 13 27 40Tasmania % 30 70 32 68 32 68 Victoria 785 971 1,756 930 1,043 1,973 846 953 1,799Victoria % 45 55 47 53 47 53 Western Australia 3 27 30 2 32 34 2 25 27Western Australia % 10 90 6 94 7 93 New Zealand 21 86 107 28 94 122 33 103 136New Zealand % 20 80 23 77 24 76 LPG Pacific 77 269 346 – – – – – –LPG Pacific % 22 78 – – – – Other International 2 3 5 – – – – – –Other International % 40 60 – – – – Total 2,031 3,780 5,811 2,415 3,755 6,170 2,343 3,596 5,939
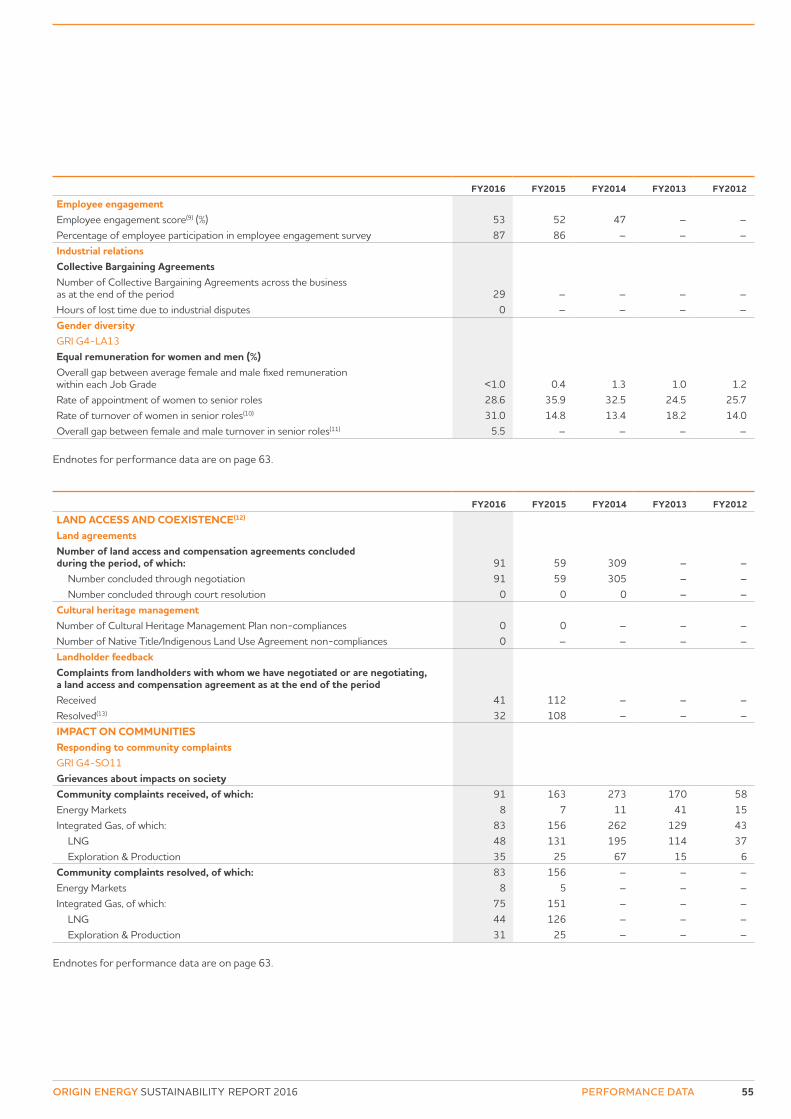
55ORIGIN ENERGY SUSTAINABILITY REPORT 2016 PERFORMANCE DATA
FY2016 FY2015 FY2014 FY2013 FY2012
Employee engagementEmployee engagement score(9) (%) 53 52 47 – –Percentage of employee participation in employee engagement survey 87 86 – – –Industrial relationsCollective Bargaining AgreementsNumber of Collective Bargaining Agreements across the business as at the end of the period 29 – – – –Hours of lost time due to industrial disputes 0 – – – –Gender diversity GRI G4-LA13Equal remuneration for women and men (%)Overall gap between average female and male fixed remuneration within each Job Grade <1.0 0.4 1.3 1.0 1.2Rate of appointment of women to senior roles 28.6 35.9 32.5 24.5 25.7Rate of turnover of women in senior roles(10) 31.0 14.8 13.4 18.2 14.0Overall gap between female and male turnover in senior roles(11) 5.5 – – – –
Endnotes for performance data are on page 63.
FY2016 FY2015 FY2014 FY2013 FY2012
LAND ACCESS AND COEXISTENCE(12)
Land agreementsNumber of land access and compensation agreements concluded during the period, of which: 91 59 309 – –
Number concluded through negotiation 91 59 305 – –Number concluded through court resolution 0 0 0 – –
Cultural heritage management Number of Cultural Heritage Management Plan non-compliances 0 0 – – –Number of Native Title/Indigenous Land Use Agreement non-compliances 0 – – – –Landholder feedbackComplaints from landholders with whom we have negotiated or are negotiating, a land access and compensation agreement as at the end of the periodReceived 41 112 – – –Resolved(13) 32 108 – – –IMPACT ON COMMUNITIESResponding to community complaintsGRI G4-SO11Grievances about impacts on societyCommunity complaints received, of which: 91 163 273 170 58Energy Markets 8 7 11 41 15Integrated Gas, of which: 83 156 262 129 43
LNG 48 131 195 114 37Exploration & Production 35 25 67 15 6
Community complaints resolved, of which: 83 156 – – –Energy Markets 8 5 – – –Integrated Gas, of which: 75 151 – – –
LNG 44 126 – – –Exploration & Production 31 25 – – –
Endnotes for performance data are on page 63.
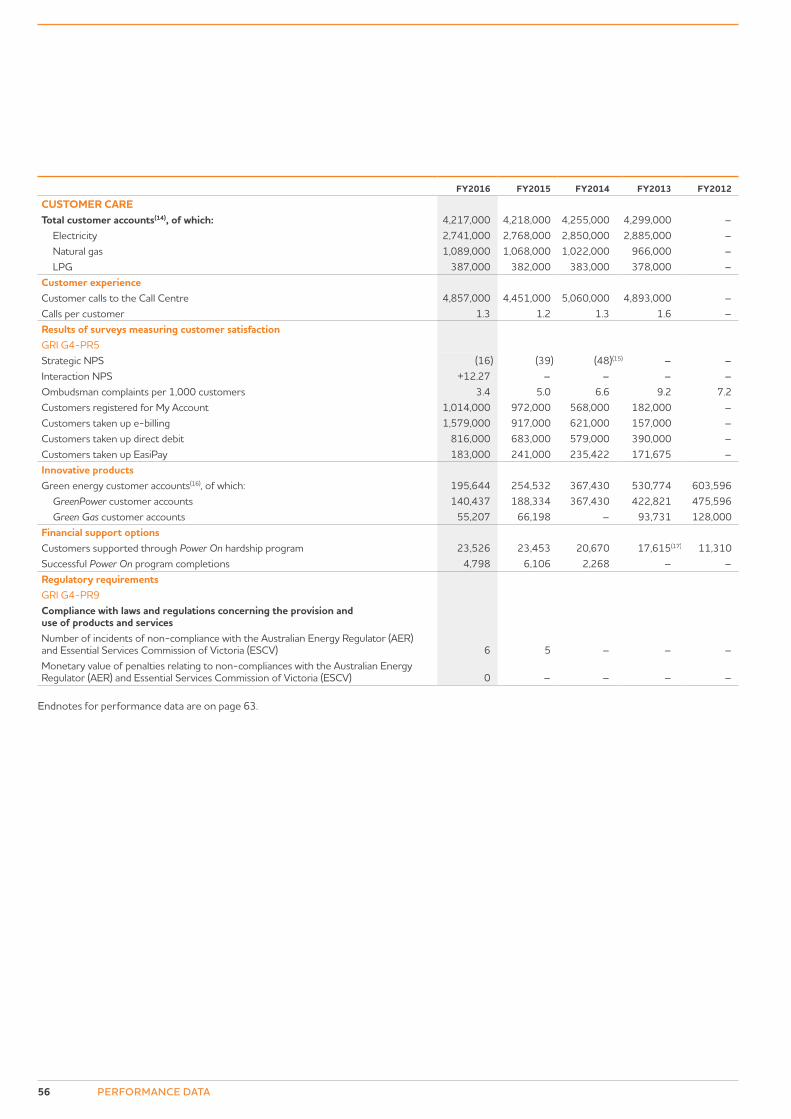
56 PERFORMANCE DATA
FY2016 FY2015 FY2014 FY2013 FY2012
CUSTOMER CARE Total customer accounts(14), of which: 4,217,000 4,218,000 4,255,000 4,299,000 –
Electricity 2,741,000 2,768,000 2,850,000 2,885,000 –Natural gas 1,089,000 1,068,000 1,022,000 966,000 –LPG 387,000 382,000 383,000 378,000 –
Customer experienceCustomer calls to the Call Centre 4,857,000 4,451,000 5,060,000 4,893,000 –Calls per customer 1.3 1.2 1.3 1.6 –Results of surveys measuring customer satisfactionGRI G4-PR5Strategic NPS (16) (39) (48)(15) – – Interaction NPS +12.27 – – – – Ombudsman complaints per 1,000 customers 3.4 5.0 6.6 9.2 7.2Customers registered for My Account 1,014,000 972,000 568,000 182,000 –Customers taken up e-billing 1,579,000 917,000 621,000 157,000 –Customers taken up direct debit 816,000 683,000 579,000 390,000 –Customers taken up EasiPay 183,000 241,000 235,422 171,675 –Innovative productsGreen energy customer accounts(16), of which: 195,644 254,532 367,430 530,774 603,596
GreenPower customer accounts 140,437 188,334 367,430 422,821 475,596Green Gas customer accounts 55,207 66,198 – 93,731 128,000
Financial support optionsCustomers supported through Power On hardship program 23,526 23,453 20,670 17,615(17) 11,310Successful Power On program completions 4,798 6,106 2,268 – –Regulatory requirementsGRI G4-PR9Compliance with laws and regulations concerning the provision and use of products and servicesNumber of incidents of non-compliance with the Australian Energy Regulator (AER) and Essential Services Commission of Victoria (ESCV) 6 5 – – –Monetary value of penalties relating to non-compliances with the Australian Energy Regulator (AER) and Essential Services Commission of Victoria (ESCV) 0 – – – –
Endnotes for performance data are on page 63.
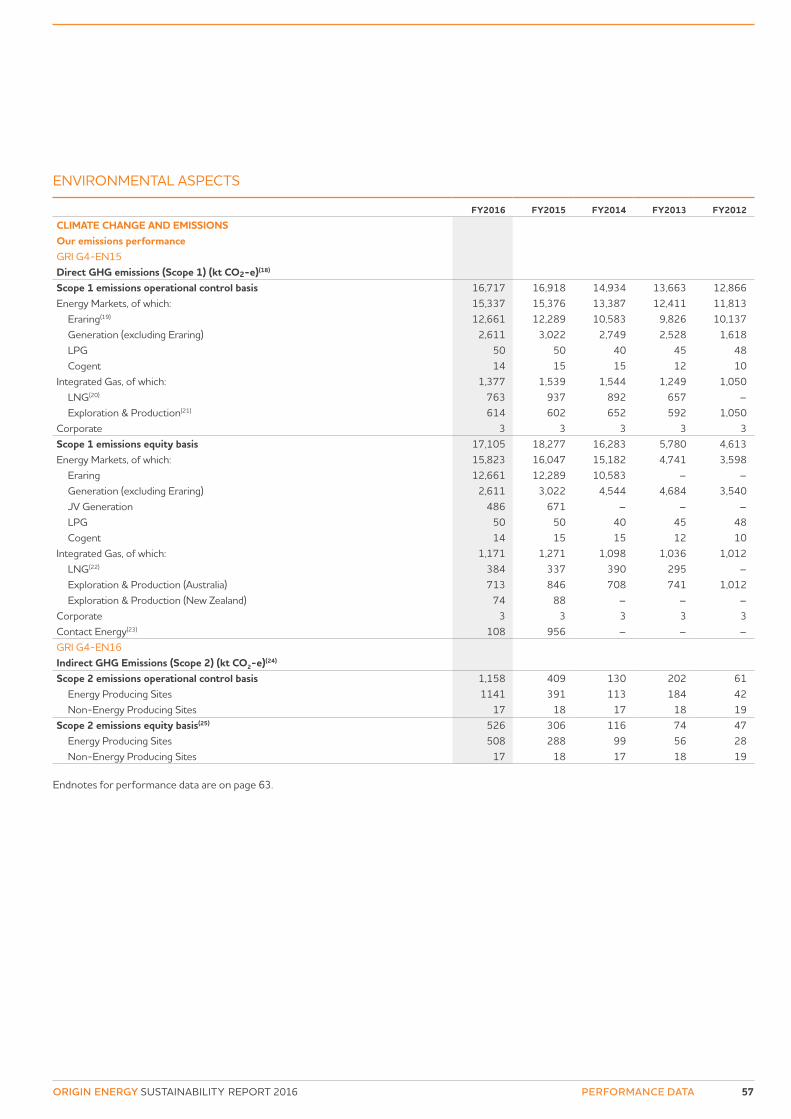
57ORIGIN ENERGY SUSTAINABILITY REPORT 2016 PERFORMANCE DATA
ENVIRONMENTAL ASPECTS
FY2016 FY2015 FY2014 FY2013 FY2012
CLIMATE CHANGE AND EMISSIONSOur emissions performanceGRI G4-EN15 Direct GHG emissions (Scope 1) (kt CO2-e)(18) Scope 1 emissions operational control basis 16,717 16,918 14,934 13,663 12,866Energy Markets, of which: 15,337 15,376 13,387 12,411 11,813
Eraring(19) 12,661 12,289 10,583 9,826 10,137Generation (excluding Eraring) 2,611 3,022 2,749 2,528 1,618LPG 50 50 40 45 48Cogent 14 15 15 12 10
Integrated Gas, of which: 1,377 1,539 1,544 1,249 1,050LNG(20) 763 937 892 657 –Exploration & Production(21) 614 602 652 592 1,050
Corporate 3 3 3 3 3Scope 1 emissions equity basis 17,105 18,277 16,283 5,780 4,613Energy Markets, of which: 15,823 16,047 15,182 4,741 3,598
Eraring 12,661 12,289 10,583 – –Generation (excluding Eraring) 2,611 3,022 4,544 4,684 3,540JV Generation 486 671 – – –LPG 50 50 40 45 48Cogent 14 15 15 12 10
Integrated Gas, of which: 1,171 1,271 1,098 1,036 1,012LNG(22) 384 337 390 295 –Exploration & Production (Australia) 713 846 708 741 1,012Exploration & Production (New Zealand) 74 88 – – –
Corporate 3 3 3 3 3Contact Energy(23) 108 956 – – –GRI G4-EN16 Indirect GHG Emissions (Scope 2) (kt CO2-e)(24) Scope 2 emissions operational control basis 1,158 409 130 202 61
Energy Producing Sites 1141 391 113 184 42Non-Energy Producing Sites 17 18 17 18 19
Scope 2 emissions equity basis(25) 526 306 116 74 47Energy Producing Sites 508 288 99 56 28Non-Energy Producing Sites 17 18 17 18 19
Endnotes for performance data are on page 63.
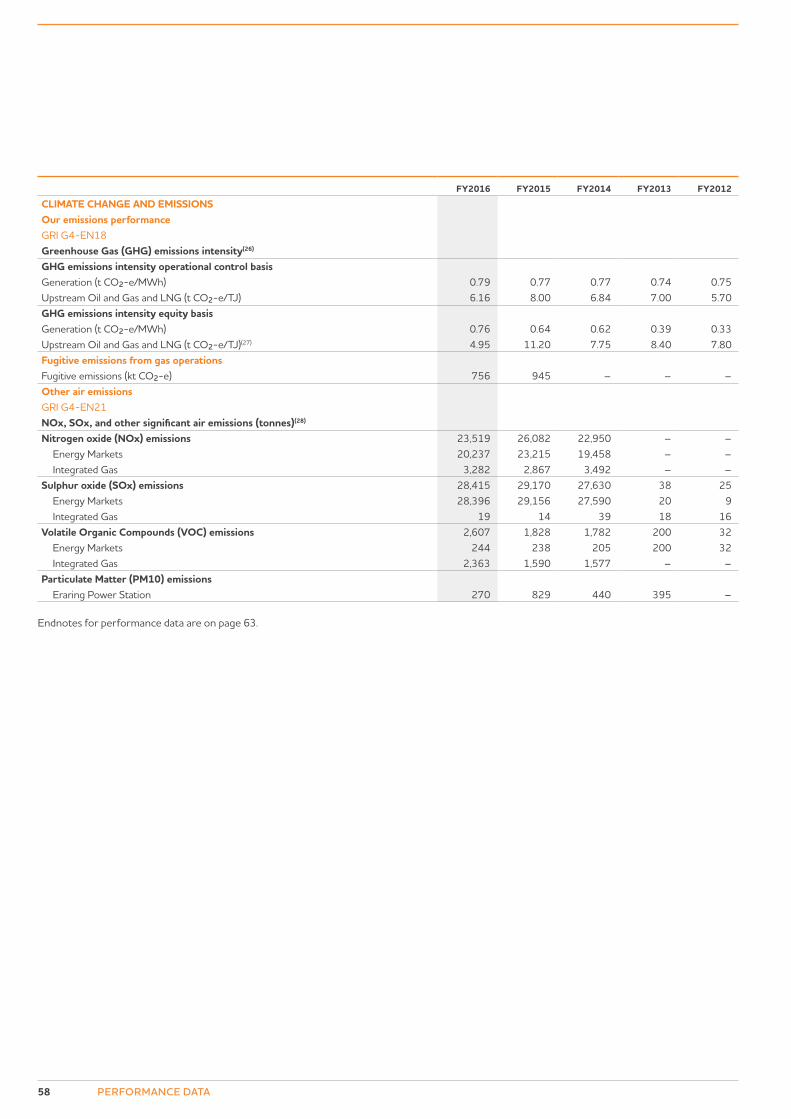
58 PERFORMANCE DATA
FY2016 FY2015 FY2014 FY2013 FY2012
CLIMATE CHANGE AND EMISSIONSOur emissions performanceGRI G4-EN18 Greenhouse Gas (GHG) emissions intensity(26) GHG emissions intensity operational control basisGeneration (t CO2-e/MWh) 0.79 0.77 0.77 0.74 0.75Upstream Oil and Gas and LNG (t CO2-e/TJ) 6.16 8.00 6.84 7.00 5.70GHG emissions intensity equity basisGeneration (t CO2-e/MWh) 0.76 0.64 0.62 0.39 0.33Upstream Oil and Gas and LNG (t CO2-e/TJ)(27) 4.95 11.20 7.75 8.40 7.80Fugitive emissions from gas operationsFugitive emissions (kt CO2-e) 756 945 – – –Other air emissionsGRI G4-EN21 NOx, SOx, and other significant air emissions (tonnes)(28) Nitrogen oxide (NOx) emissions 23,519 26,082 22,950 – –
Energy Markets 20,237 23,215 19,458 – –Integrated Gas 3,282 2,867 3,492 – –
Sulphur oxide (SOx) emissions 28,415 29,170 27,630 38 25Energy Markets 28,396 29,156 27,590 20 9Integrated Gas 19 14 39 18 16
Volatile Organic Compounds (VOC) emissions 2,607 1,828 1,782 200 32Energy Markets 244 238 205 200 32Integrated Gas 2,363 1,590 1,577 – –
Particulate Matter (PM10) emissions Eraring Power Station 270 829 440 395 –
Endnotes for performance data are on page 63.
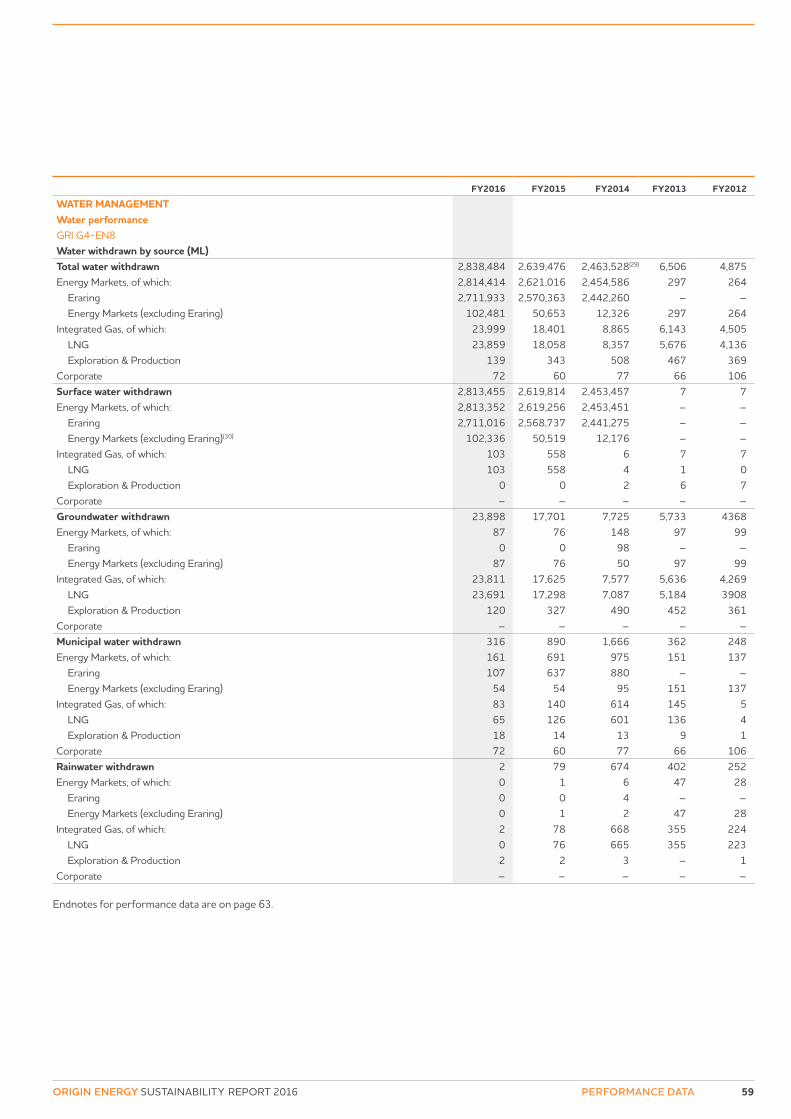
59ORIGIN ENERGY SUSTAINABILITY REPORT 2016 PERFORMANCE DATA
FY2016 FY2015 FY2014 FY2013 FY2012
WATER MANAGEMENTWater performanceGRI G4-EN8 Water withdrawn by source (ML) Total water withdrawn 2,838,484 2,639,476 2,463,528(29) 6,506 4,875Energy Markets, of which: 2,814,414 2,621,016 2,454,586 297 264
Eraring 2,711,933 2,570,363 2,442,260 – –Energy Markets (excluding Eraring) 102,481 50,653 12,326 297 264
Integrated Gas, of which: 23,999 18,401 8,865 6,143 4,505LNG 23,859 18,058 8,357 5,676 4,136Exploration & Production 139 343 508 467 369
Corporate 72 60 77 66 106Surface water withdrawn 2,813,455 2,619,814 2,453,457 7 7Energy Markets, of which: 2,813,352 2,619,256 2,453,451 – –
Eraring 2,711,016 2,568,737 2,441,275 – –Energy Markets (excluding Eraring)(30) 102,336 50,519 12,176 – –
Integrated Gas, of which: 103 558 6 7 7LNG 103 558 4 1 0Exploration & Production 0 0 2 6 7
Corporate – – – – –Groundwater withdrawn 23,898 17,701 7,725 5,733 4368Energy Markets, of which: 87 76 148 97 99
Eraring 0 0 98 – –Energy Markets (excluding Eraring) 87 76 50 97 99
Integrated Gas, of which: 23,811 17,625 7,577 5,636 4,269LNG 23,691 17,298 7,087 5,184 3908Exploration & Production 120 327 490 452 361
Corporate – – – – –Municipal water withdrawn 316 890 1,666 362 248Energy Markets, of which: 161 691 975 151 137
Eraring 107 637 880 – –Energy Markets (excluding Eraring) 54 54 95 151 137
Integrated Gas, of which: 83 140 614 145 5LNG 65 126 601 136 4Exploration & Production 18 14 13 9 1
Corporate 72 60 77 66 106Rainwater withdrawn 2 79 674 402 252Energy Markets, of which: 0 1 6 47 28
Eraring 0 0 4 – –Energy Markets (excluding Eraring) 0 1 2 47 28
Integrated Gas, of which: 2 78 668 355 224LNG 0 76 665 355 223Exploration & Production 2 2 3 – 1
Corporate – – – – –
Endnotes for performance data are on page 63.
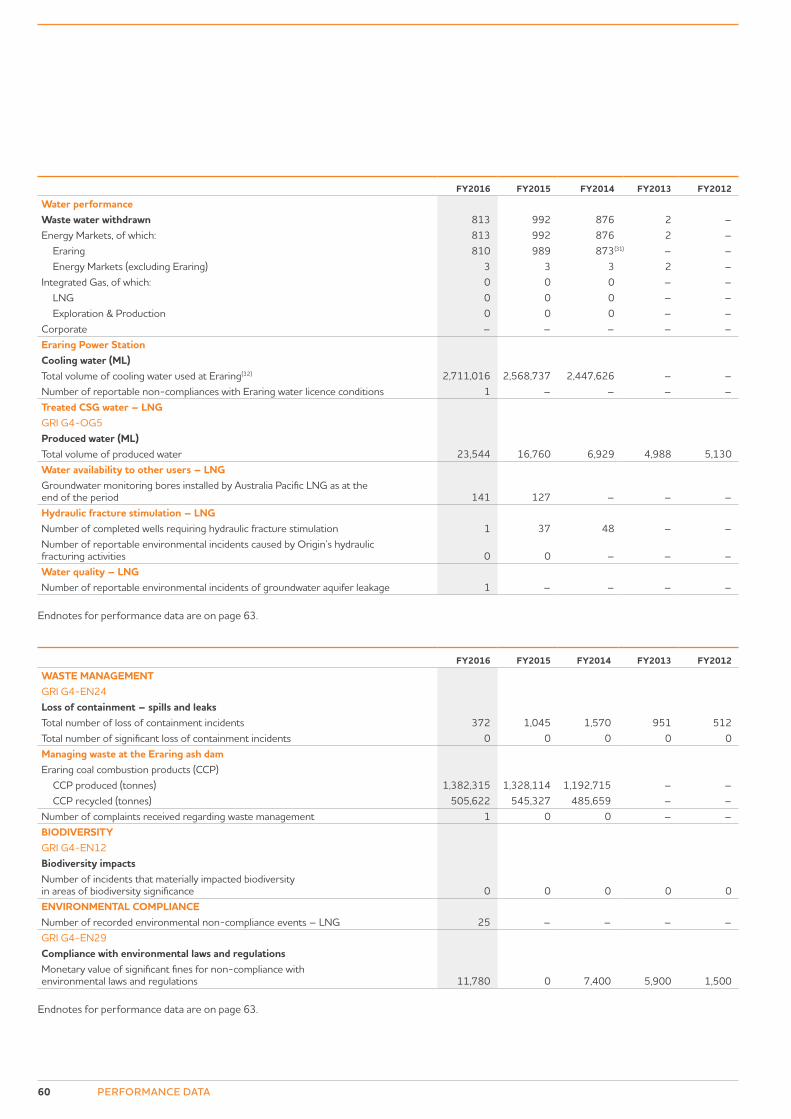
60 PERFORMANCE DATA
FY2016 FY2015 FY2014 FY2013 FY2012
Water performanceWaste water withdrawn 813 992 876 2 –Energy Markets, of which: 813 992 876 2 –
Eraring 810 989 873(31) – –Energy Markets (excluding Eraring) 3 3 3 2 –
Integrated Gas, of which: 0 0 0 – –LNG 0 0 0 – –Exploration & Production 0 0 0 – –
Corporate – – – – –Eraring Power Station Cooling water (ML)Total volume of cooling water used at Eraring(32) 2,711,016 2,568,737 2,447,626 – –Number of reportable non-compliances with Eraring water licence conditions 1 – – – –Treated CSG water – LNGGRI G4-OG5 Produced water (ML) Total volume of produced water 23,544 16,760 6,929 4,988 5,130Water availability to other users – LNGGroundwater monitoring bores installed by Australia Pacific LNG as at the end of the period 141 127 – – –Hydraulic fracture stimulation – LNGNumber of completed wells requiring hydraulic fracture stimulation 1 37 48 – –Number of reportable environmental incidents caused by Origin’s hydraulic fracturing activities 0 0 – – –Water quality – LNGNumber of reportable environmental incidents of groundwater aquifer leakage 1 – – – –
Endnotes for performance data are on page 63.
FY2016 FY2015 FY2014 FY2013 FY2012
WASTE MANAGEMENTGRI G4-EN24Loss of containment – spills and leaksTotal number of loss of containment incidents 372 1,045 1,570 951 512Total number of significant loss of containment incidents 0 0 0 0 0Managing waste at the Eraring ash damEraring coal combustion products (CCP)
CCP produced (tonnes) 1,382,315 1,328,114 1,192,715 – –CCP recycled (tonnes) 505,622 545,327 485,659 – –
Number of complaints received regarding waste management 1 0 0 – –BIODIVERSITYGRI G4-EN12Biodiversity impactsNumber of incidents that materially impacted biodiversity in areas of biodiversity significance 0 0 0 0 0ENVIRONMENTAL COMPLIANCENumber of recorded environmental non-compliance events – LNG 25 – – – –GRI G4-EN29Compliance with environmental laws and regulations Monetary value of significant fines for non-compliance with environmental laws and regulations 11,780 0 7,400 5,900 1,500
Endnotes for performance data are on page 63.
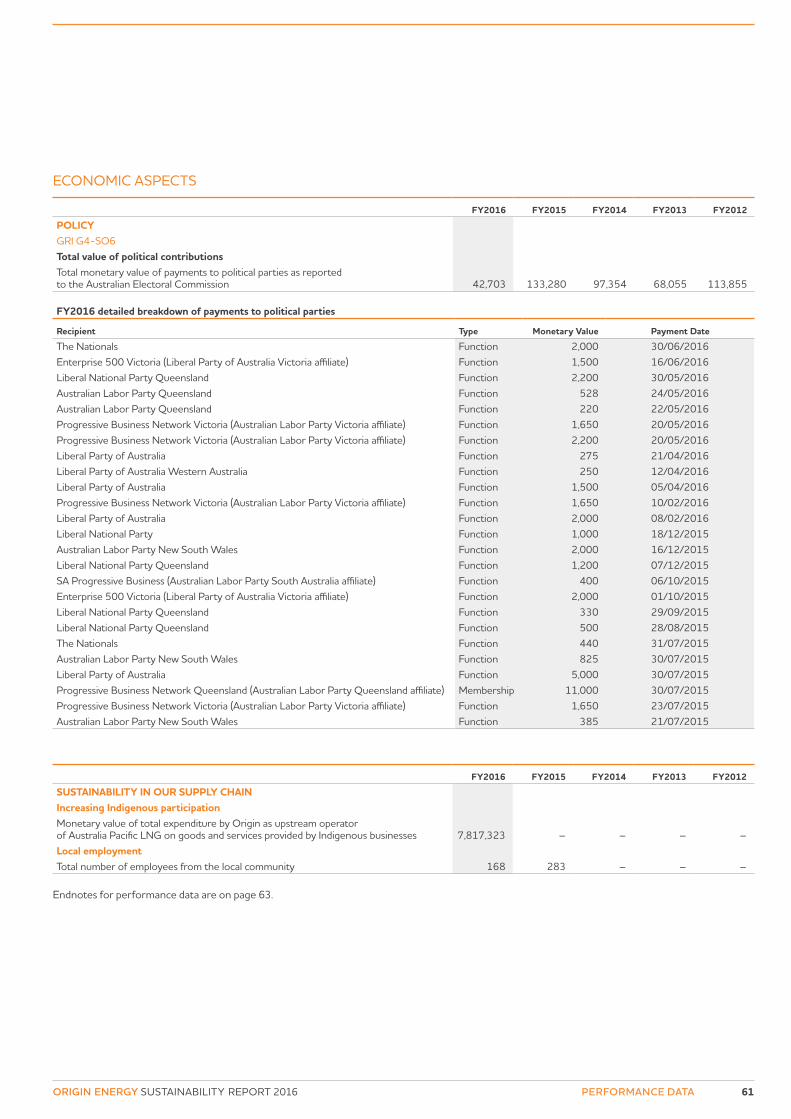
61ORIGIN ENERGY SUSTAINABILITY REPORT 2016 PERFORMANCE DATA
ECONOMIC ASPECTS
FY2016 FY2015 FY2014 FY2013 FY2012
POLICYGRI G4-SO6Total value of political contributions Total monetary value of payments to political parties as reported to the Australian Electoral Commission 42,703 133,280 97,354 68,055 113,855
FY2016 detailed breakdown of payments to political parties
Recipient Type Monetary Value Payment Date
The Nationals Function 2,000 30/06/2016Enterprise 500 Victoria (Liberal Party of Australia Victoria affiliate) Function 1,500 16/06/2016Liberal National Party Queensland Function 2,200 30/05/2016Australian Labor Party Queensland Function 528 24/05/2016Australian Labor Party Queensland Function 220 22/05/2016Progressive Business Network Victoria (Australian Labor Party Victoria affiliate) Function 1,650 20/05/2016Progressive Business Network Victoria (Australian Labor Party Victoria affiliate) Function 2,200 20/05/2016Liberal Party of Australia Function 275 21/04/2016Liberal Party of Australia Western Australia Function 250 12/04/2016Liberal Party of Australia Function 1,500 05/04/2016Progressive Business Network Victoria (Australian Labor Party Victoria affiliate) Function 1,650 10/02/2016Liberal Party of Australia Function 2,000 08/02/2016Liberal National Party Function 1,000 18/12/2015Australian Labor Party New South Wales Function 2,000 16/12/2015Liberal National Party Queensland Function 1,200 07/12/2015SA Progressive Business (Australian Labor Party South Australia affiliate) Function 400 06/10/2015Enterprise 500 Victoria (Liberal Party of Australia Victoria affiliate) Function 2,000 01/10/2015Liberal National Party Queensland Function 330 29/09/2015Liberal National Party Queensland Function 500 28/08/2015The Nationals Function 440 31/07/2015Australian Labor Party New South Wales Function 825 30/07/2015Liberal Party of Australia Function 5,000 30/07/2015Progressive Business Network Queensland (Australian Labor Party Queensland affiliate) Membership 11,000 30/07/2015Progressive Business Network Victoria (Australian Labor Party Victoria affiliate) Function 1,650 23/07/2015Australian Labor Party New South Wales Function 385 21/07/2015
FY2016 FY2015 FY2014 FY2013 FY2012
SUSTAINABILITY IN OUR SUPPLY CHAINIncreasing Indigenous participationMonetary value of total expenditure by Origin as upstream operator of Australia Pacific LNG on goods and services provided by Indigenous businesses 7,817,323 – – – –Local employmentTotal number of employees from the local community 168 283 – – –
Endnotes for performance data are on page 63.
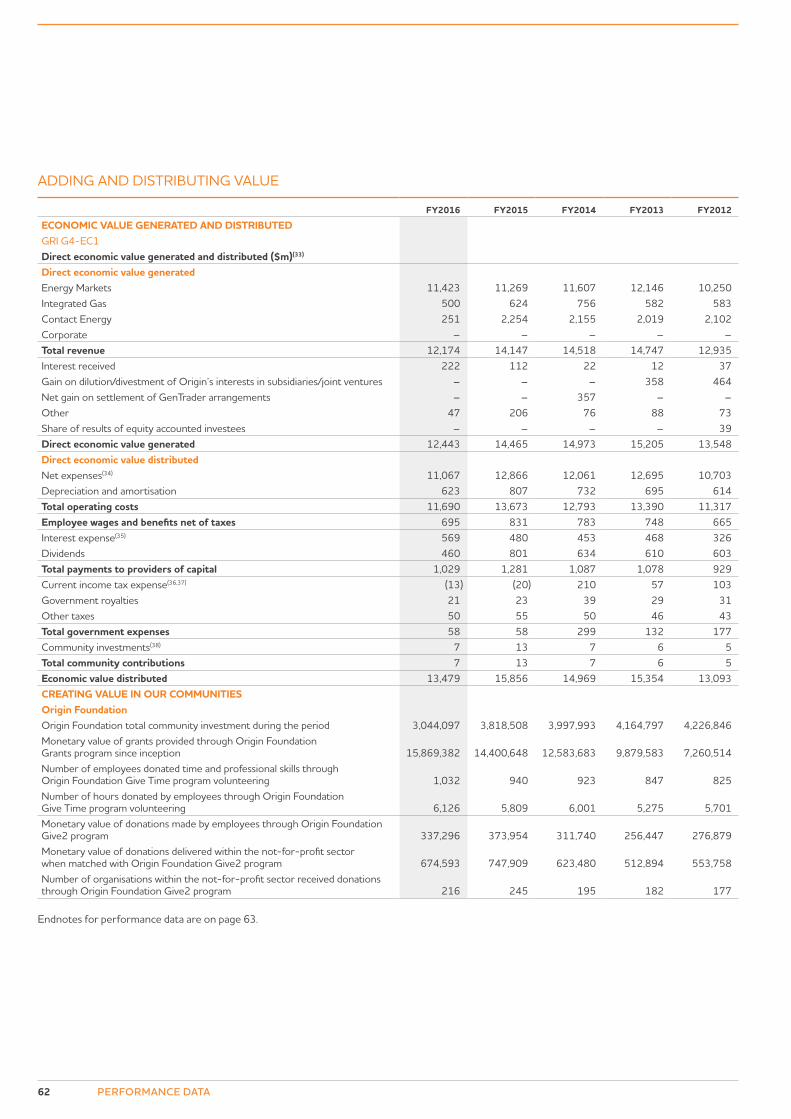
62 PERFORMANCE DATA
ADDING AND DISTRIBUTING VALUE
FY2016 FY2015 FY2014 FY2013 FY2012
ECONOMIC VALUE GENERATED AND DISTRIBUTEDGRI G4-EC1Direct economic value generated and distributed ($m)(33) Direct economic value generatedEnergy Markets 11,423 11,269 11,607 12,146 10,250Integrated Gas 500 624 756 582 583Contact Energy 251 2,254 2,155 2,019 2,102Corporate – – – – –Total revenue 12,174 14,147 14,518 14,747 12,935Interest received 222 112 22 12 37Gain on dilution/divestment of Origin’s interests in subsidiaries/joint ventures – – – 358 464Net gain on settlement of GenTrader arrangements – – 357 – –Other 47 206 76 88 73Share of results of equity accounted investees – – – – 39Direct economic value generated 12,443 14,465 14,973 15,205 13,548Direct economic value distributedNet expenses(34) 11,067 12,866 12,061 12,695 10,703Depreciation and amortisation 623 807 732 695 614Total operating costs 11,690 13,673 12,793 13,390 11,317Employee wages and benefits net of taxes 695 831 783 748 665Interest expense(35) 569 480 453 468 326Dividends 460 801 634 610 603Total payments to providers of capital 1,029 1,281 1,087 1,078 929Current income tax expense(36,37) (13) (20) 210 57 103Government royalties 21 23 39 29 31Other taxes 50 55 50 46 43Total government expenses 58 58 299 132 177Community investments(38) 7 13 7 6 5Total community contributions 7 13 7 6 5Economic value distributed 13,479 15,856 14,969 15,354 13,093CREATING VALUE IN OUR COMMUNITIESOrigin FoundationOrigin Foundation total community investment during the period 3,044,097 3,818,508 3,997,993 4,164,797 4,226,846Monetary value of grants provided through Origin Foundation Grants program since inception 15,869,382 14,400,648 12,583,683 9,879,583 7,260,514Number of employees donated time and professional skills through Origin Foundation Give Time program volunteering 1,032 940 923 847 825Number of hours donated by employees through Origin Foundation Give Time program volunteering 6,126 5,809 6,001 5,275 5,701Monetary value of donations made by employees through Origin Foundation Give2 program 337,296 373,954 311,740 256,447 276,879Monetary value of donations delivered within the not-for-profit sector when matched with Origin Foundation Give2 program 674,593 747,909 623,480 512,894 553,758Number of organisations within the not-for-profit sector received donations through Origin Foundation Give2 program 216 245 195 182 177
Endnotes for performance data are on page 63.
63ORIGIN ENERGY SUSTAINABILITY REPORT 2016 PERFORMANCE DATA
ENDNOTES FOR PERFORMANCE DATA(1) OCGT = Open cycle gas turbine; CCGT = Combined cycle gas turbine.(2) Availability for Eraring = Equivalent Availability Factor (which takes into account de-ratings).(3) Origin has 50 per cent interest in the 180 MW plant and contracts 100 per cent of the output.(4) Worsley JV ended in March 2016.(5) Rolling 12-month average.(6) With the potential for a serious consequence or above, as defined by the Origin risk matrix. IOGP Report No. 456 defines tier one process safety events as losses of primary containment
with the greatest consequences and provides a set of consequence-based criteria for this, as well as a set of threshold quantities for various materials. A tier two process safety event is a loss of primary containment with lesser consequences (IOGP 2011:12, www.ogp.org.uk/pubs/456.pdf).
(7) All Origin entities excluding Contact Energy.(8) The definition used for the 2014 and 2015 cohort analysis was Origin Energy Limited Australia and Origin Energy Resources New Zealand employees only (excludes Eraring NSW,
Contact Energy, LPG Asia Pacific and other international locations).(9) AON Hewitt’s methodology.(10) 12-month rolling average as at 30 June 2016.(11) New measure in FY2016, using point difference of 12-month rolling average as at 30 June 2016.(12) All figures reported under the Land access and coexistence section relate to Australia Pacific LNG operations.(13) Number of complaints closed during the period includes complaints received during the prior period.(14) In FY2016, a new customer accounts methodology was introduced which excludes customers in the process of transferring to or away from Origin in order to reflect active customers.
Customer accounts from FY13 to FY15 have been rebated using this methodology.(15) NPS Strategic measure was introduced in October 2014.(16) Green energy customer account figures for FY2012 have been restated to include the figures from 1 July 2011 to 30 June 2012. The figures previously only covered the period from
1 July 2011 to March 2012.(17) This figure includes customer accounts supported through Origin’s hardship program Power On (12,008), Country Energy’s hardship program (4,623) and Integral Energy’s hardship
program (984).(18) Emissions figures are estimations as at the time of publication, and any restatements in prior years are made to report actual results calculated after the date of publication.(19) Origin assumed operational control of Eraring Power Station on 1 August 2013. Prior to this, Origin owned the output of Eraring Power Station from March 2011 under the previous
GenTrader Arrangement with the New South Wales Government. Scope 1 and Scope 2 GHG emissions for FY2011 and FY2012 are included in these emissions calculations. In FY2013, the emissions for these assets were transferred under a Financial Control Liability Transfer Certificate to an Origin owned entity and are included to align with our obligations under the Clean Energy Act 2011.
(20) Australia Pacific LNG facilities where Origin is the operator.(21) Includes Exploration & Production (New Zealand) emissions.(22) Australia Pacific LNG includes equity emissions from upstream facilities. Emissions from the LNG facility are not included.(23) Included for FY2016 however in August 2015, Origin divested its entire interest in Contact Energy.(24) Emissions figures are estimations as at the time of publication, and any restatements in prior years are made to report actual results calculated after the date of publication.(25) Includes equity emissions from Australia Pacific LNG upstream facilities. Emissions from the LNG facility are not included.(26) Emissions figures are estimations as at the time of publication, and any restatements in prior years are made to report actual results calculated after the date of publication.(27) Includes equity emissions from Australia Pacific LNG upstream facilities. Emissions from the LNG facility are not included.(28) Emissions figures are estimations as at the time of publication, and any restatements in prior years are made to report actual results calculated after the date of publication.(29) Total water withdrawn figure has been restated to include Other EM result.(30) FY2015 and FY2014 figures restated to include surface water withdrawals relating to the Shoalhaven Scheme. Origin assumed operational control of the Shoalhaven Scheme
on 1 August 2013.(31) Waste water withdrawn figure for FY2013 has been restated to include Eraring total excluded from FY2015 sustainability performance data.(32) Origin assumed operational control of Eraring Power Station on 1 August 2013.(33) The value distribution calculation and commentary in this section is based on the income and expenses reported in the Income Statement of Origin Energy Limited. Any restatements
made to prior year results have been made in line with Origin financial statements.(34) Excludes capital expenditure.(35) Excludes capitalised interest.(36) Income tax includes only current income tax expense/benefit. GST and deferred taxes are excluded.(37) Includes all subsidiaries in Australia and overseas.(38) Rounded to the nearest million.
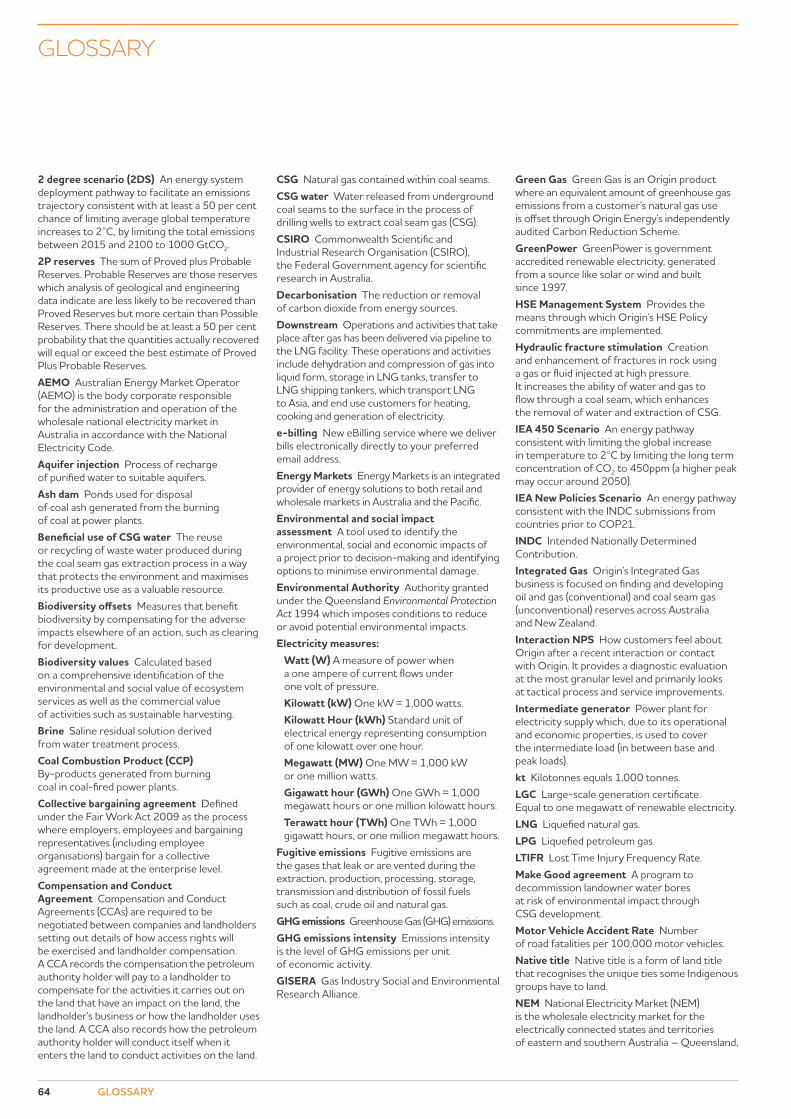
64 GLOSSARY
2 degree scenario (2DS) An energy system deployment pathway to facilitate an emissions trajectory consistent with at least a 50 per cent chance of limiting average global temperature increases to 2°C, by limiting the total emissions between 2015 and 2100 to 1000 GtCO2.2P reserves The sum of Proved plus Probable Reserves. Probable Reserves are those reserves which analysis of geological and engineering data indicate are less likely to be recovered than Proved Reserves but more certain than Possible Reserves. There should be at least a 50 per cent probability that the quantities actually recovered will equal or exceed the best estimate of Proved Plus Probable Reserves.AEMO Australian Energy Market Operator (AEMO) is the body corporate responsible for the administration and operation of the wholesale national electricity market in Australia in accordance with the National Electricity Code.Aquifer injection Process of recharge of purified water to suitable aquifers.Ash dam Ponds used for disposal of coal ash generated from the burning of coal at power plants.Beneficial use of CSG water The reuse or recycling of waste water produced during the coal seam gas extraction process in a way that protects the environment and maximises its productive use as a valuable resource.Biodiversity offsets Measures that benefit biodiversity by compensating for the adverse impacts elsewhere of an action, such as clearing for development.Biodiversity values Calculated based on a comprehensive identification of the environmental and social value of ecosystem services as well as the commercial value of activities such as sustainable harvesting.Brine Saline residual solution derived from water treatment process.Coal Combustion Product (CCP) By-products generated from burning coal in coal-fired power plants.Collective bargaining agreement Defined under the Fair Work Act 2009 as the process where employers, employees and bargaining representatives (including employee organisations) bargain for a collective agreement made at the enterprise level.Compensation and Conduct Agreement Compensation and Conduct Agreements (CCAs) are required to be negotiated between companies and landholders setting out details of how access rights will be exercised and landholder compensation. A CCA records the compensation the petroleum authority holder will pay to a landholder to compensate for the activities it carries out on the land that have an impact on the land, the landholder’s business or how the landholder uses the land. A CCA also records how the petroleum authority holder will conduct itself when it enters the land to conduct activities on the land.
CSG Natural gas contained within coal seams.CSG water Water released from underground coal seams to the surface in the process of drilling wells to extract coal seam gas (CSG).CSIRO Commonwealth Scientific and Industrial Research Organisation (CSIRO), the Federal Government agency for scientific research in Australia.Decarbonisation The reduction or removal of carbon dioxide from energy sources.Downstream Operations and activities that take place after gas has been delivered via pipeline to the LNG facility. These operations and activities include dehydration and compression of gas into liquid form, storage in LNG tanks, transfer to LNG shipping tankers, which transport LNG to Asia, and end use customers for heating, cooking and generation of electricity.e-billing New eBilling service where we deliver bills electronically directly to your preferred email address.Energy Markets Energy Markets is an integrated provider of energy solutions to both retail and wholesale markets in Australia and the Pacific.Environmental and social impact assessment A tool used to identify the environmental, social and economic impacts of a project prior to decision-making and identifying options to minimise environmental damage.Environmental Authority Authority granted under the Queensland Environmental Protection Act 1994 which imposes conditions to reduce or avoid potential environmental impacts.Electricity measures:
Watt (W) A measure of power when a one ampere of current flows under one volt of pressure. Kilowatt (kW) One kW = 1,000 watts. Kilowatt Hour (kWh) Standard unit of electrical energy representing consumption of one kilowatt over one hour. Megawatt (MW) One MW = 1,000 kW or one million watts. Gigawatt hour (GWh) One GWh = 1,000 megawatt hours or one million kilowatt hours. Terawatt hour (TWh) One TWh = 1,000 gigawatt hours, or one million megawatt hours.
Fugitive emissions Fugitive emissions are the gases that leak or are vented during the extraction, production, processing, storage, transmission and distribution of fossil fuels such as coal, crude oil and natural gas.GHG emissions Greenhouse Gas (GHG) emissions.GHG emissions intensity Emissions intensity is the level of GHG emissions per unit of economic activity.GISERA Gas Industry Social and Environmental Research Alliance.
Green Gas Green Gas is an Origin product where an equivalent amount of greenhouse gas emissions from a customer’s natural gas use is offset through Origin Energy’s independently audited Carbon Reduction Scheme.GreenPower GreenPower is government accredited renewable electricity, generated from a source like solar or wind and built since 1997.HSE Management System Provides the means through which Origin’s HSE Policy commitments are implemented.Hydraulic fracture stimulation Creation and enhancement of fractures in rock using a gas or fluid injected at high pressure. It increases the ability of water and gas to flow through a coal seam, which enhances the removal of water and extraction of CSG.IEA 450 Scenario An energy pathway consistent with limiting the global increase in temperature to 2°C by limiting the long term concentration of CO2 to 450ppm (a higher peak may occur around 2050).IEA New Policies Scenario An energy pathway consistent with the INDC submissions from countries prior to COP21.INDC Intended Nationally Determined Contribution.Integrated Gas Origin’s Integrated Gas business is focused on finding and developing oil and gas (conventional) and coal seam gas (unconventional) reserves across Australia and New Zealand.Interaction NPS How customers feel about Origin after a recent interaction or contact with Origin. It provides a diagnostic evaluation at the most granular level and primarily looks at tactical process and service improvements.Intermediate generator Power plant for electricity supply which, due to its operational and economic properties, is used to cover the intermediate load (in between base and peak loads).kt Kilotonnes equals 1,000 tonnes.LGC Large-scale generation certificate. Equal to one megawatt of renewable electricity.LNG Liquefied natural gas.LPG Liquefied petroleum gas.LTIFR Lost Time Injury Frequency Rate.Make Good agreement A program to decommission landowner water bores at risk of environmental impact through CSG development.Motor Vehicle Accident Rate Number of road fatalities per 100,000 motor vehicles.Native title Native title is a form of land title that recognises the unique ties some Indigenous groups have to land.NEM National Electricity Market (NEM) is the wholesale electricity market for the electrically connected states and territories of eastern and southern Australia – Queensland,
GLOSSARY
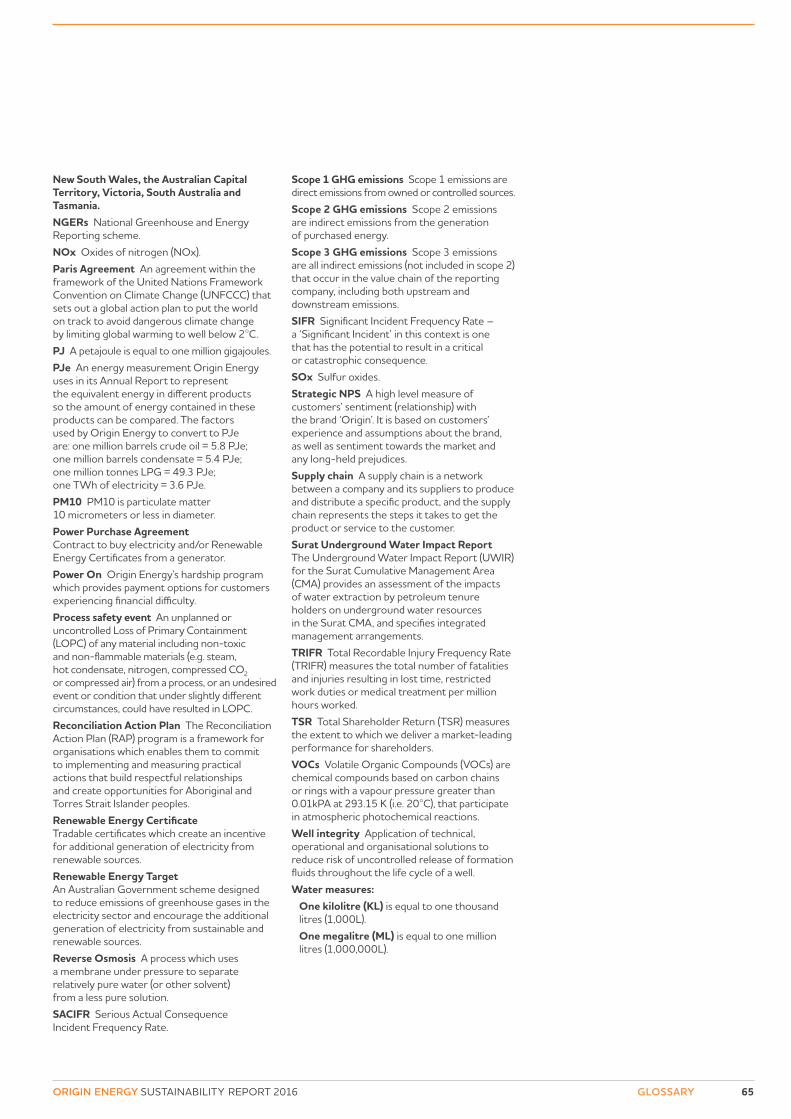
65ORIGIN ENERGY SUSTAINABILITY REPORT 2016
New South Wales, the Australian Capital Territory, Victoria, South Australia and Tasmania.NGERs National Greenhouse and Energy Reporting scheme.NOx Oxides of nitrogen (NOx).Paris Agreement An agreement within the framework of the United Nations Framework Convention on Climate Change (UNFCCC) that sets out a global action plan to put the world on track to avoid dangerous climate change by limiting global warming to well below 2°C.PJ A petajoule is equal to one million gigajoules.PJe An energy measurement Origin Energy uses in its Annual Report to represent the equivalent energy in different products so the amount of energy contained in these products can be compared. The factors used by Origin Energy to convert to PJe are: one million barrels crude oil = 5.8 PJe; one million barrels condensate = 5.4 PJe; one million tonnes LPG = 49.3 PJe; one TWh of electricity = 3.6 PJe.PM10 PM10 is particulate matter 10 micrometers or less in diameter.Power Purchase Agreement Contract to buy electricity and/or Renewable Energy Certificates from a generator.Power On Origin Energy’s hardship program which provides payment options for customers experiencing financial difficulty.Process safety event An unplanned or uncontrolled Loss of Primary Containment (LOPC) of any material including non-toxic and non-flammable materials (e.g. steam, hot condensate, nitrogen, compressed CO2 or compressed air) from a process, or an undesired event or condition that under slightly different circumstances, could have resulted in LOPC.Reconciliation Action Plan The Reconciliation Action Plan (RAP) program is a framework for organisations which enables them to commit to implementing and measuring practical actions that build respectful relationships and create opportunities for Aboriginal and Torres Strait Islander peoples.Renewable Energy Certificate Tradable certificates which create an incentive for additional generation of electricity from renewable sources.Renewable Energy Target An Australian Government scheme designed to reduce emissions of greenhouse gases in the electricity sector and encourage the additional generation of electricity from sustainable and renewable sources.Reverse Osmosis A process which uses a membrane under pressure to separate relatively pure water (or other solvent) from a less pure solution.SACIFR Serious Actual Consequence Incident Frequency Rate.
Scope 1 GHG emissions Scope 1 emissions are direct emissions from owned or controlled sources.Scope 2 GHG emissions Scope 2 emissions are indirect emissions from the generation of purchased energy.Scope 3 GHG emissions Scope 3 emissions are all indirect emissions (not included in scope 2) that occur in the value chain of the reporting company, including both upstream and downstream emissions.SIFR Significant Incident Frequency Rate – a ‘Significant Incident’ in this context is one that has the potential to result in a critical or catastrophic consequence.SOx Sulfur oxides.Strategic NPS A high level measure of customers’ sentiment (relationship) with the brand ‘Origin’. It is based on customers’ experience and assumptions about the brand, as well as sentiment towards the market and any long-held prejudices.Supply chain A supply chain is a network between a company and its suppliers to produce and distribute a specific product, and the supply chain represents the steps it takes to get the product or service to the customer.Surat Underground Water Impact Report The Underground Water Impact Report (UWIR) for the Surat Cumulative Management Area (CMA) provides an assessment of the impacts of water extraction by petroleum tenure holders on underground water resources in the Surat CMA, and specifies integrated management arrangements.TRIFR Total Recordable Injury Frequency Rate (TRIFR) measures the total number of fatalities and injuries resulting in lost time, restricted work duties or medical treatment per million hours worked.TSR Total Shareholder Return (TSR) measures the extent to which we deliver a market-leading performance for shareholders.VOCs Volatile Organic Compounds (VOCs) are chemical compounds based on carbon chains or rings with a vapour pressure greater than 0.01kPA at 293.15 K (i.e. 20°C), that participate in atmospheric photochemical reactions.Well integrity Application of technical, operational and organisational solutions to reduce risk of uncontrolled release of formation fluids throughout the life cycle of a well.Water measures:
One kilolitre (KL) is equal to one thousand litres (1,000L). One megalitre (ML) is equal to one million litres (1,000,000L).
GLOSSARY

DIRECTORY ORIGIN ENERGY LIMITED
Registered officeLevel 45, Australia Square 264-278 George Street Sydney NSW 2000
GPO Box 5376 Sydney NSW 2001
T (02) 8345 5000 F (02) 9252 9244
www.originenergy.com.au [email protected]
SecretariesAndrew Clarke Helen Hardy
Share registerBoardroom Pty Limited Level 12, 225 George Street Sydney NSW 2000
GPO Box 3993 Sydney NSW 2001
T Australia 1300 664 446 T International (+61 2) 8016 2896 F (02) 9279 0664
www.boardroomlimited.com.au [email protected]
Further information about Origin’s performance can be found on the website: www.originenergy.com.au