Embed Size (px)
Citation preview

SUSTAINABILITY PROGRAM 2011 ANNUAL REPORT
October, 2012 Prepared by the Interdepartmental and
FasTracks Sustainability Committees
RTD 2011 SUSTAINABILITY REPORT Page 1
TABLE OF CONTENTS
LIST OF FIGURES Page 2
1. Executive Summary Page 3.
2. RTD Sustainability Program Page 7.
3. RTD Sustainability Culture Page 8.
3.1. Quality of Life Page 8.
3.1.1. Greater Travel Choices/Accessibility Page 9.
3.1.2. Livable Communities Page 10.
3.2. Environmental Sustainability Page 12.
4. Next Steps Page 16.
5. Glossary of Terms Page 16.
Appendix A. RTD Sustainability Metrics Page 19.

RTD 2011 SUSTAINABILITY REPORT Page 2
LIST OF FIGURES
Figure 1. RTD Improving Public Environmental Health. Page 2.
Figure 2. RTD sustainability Program. Page 7.
Figure 3. RTD Sustainability Culture. Page 8.
Figure 4. Passenger Miles by Year. Page 9.
Figure 5. Total RTD Energy Usage in 2011. Page 12.
Figure 6. Energy Consumption Pattern in 2011. Page 13.
Figure 7. GHG Emissions (tons). Page 13.
Figure 8. Sources of GHG Emissions. Page 14.
Figure 9. Annual Water Use in Million Gallons. Page 14.
Figure 10. Operating energy & Water Costs. Page 15.
Figure 1 RTD Hybrid Bus improves air quality by reducing emissions.
RTD 2011 SUSTAINABILITY REPORT Page 3
1. EXECUTIVE SUMMARY
The RTD Sustainability Program reflects the agency’s mission by focusing on Responsible,
Thoughtful, and Dependable solutions.
The Regional Transportation District (RTD) Sustainability Program is an economic, social and
environmental triple-bottom line (TBL) framework that fulfills the RTD mission of providing
safe, clean, reliable, courteous, accessible and cost-effective service. The TBL focuses on
economically responsible, environmentally thoughtful and socially dependable solutions for
present needs without sacrificing the future. RTD has a service area of 2,326 square miles and
serves a population of 2.7 million, carrying over 325,000 passengers daily. This is RTD’s update
for the year 2011 on its Sustainability Program.
RTD and Sustainability
In 2006, at the outset of the FasTracks program, the RTD Board of Directors adopted a
Sustainability Policy with accompanying Sustainability Guidelines. The policy’s goal is to
incorporate sustainability in all of RTD’s activities.
In 2011, RTD moved more passengers and reduced consumption. Despite the rising cost of
energy and water, operating costs remained the same as the previous year.
This 2011 Sustainability Report update documents the macro level changes to the state of the
system – namely the services delivered to the community, and the corresponding resources
used to deliver those services. The most significant level of change in the future is expected as
new rail lines become operational and as bus service modifies.
In 2011, the RTD system provided a community service increase while reducing its
environmental footprint. Unlinked Passenger Trips increased 1.6 percent and passenger miles
increased 6.5 percent over the previous year as reported to National Transit Database (NTD) by
RTD. Greenhouse Gas Emissions were calculated 2.69 percent lower than 2010.
The 2011 RTD sustainability highlights include the following:
Denver Union Station (DUS)
DUS is on track to be LEED-Silver Certified.
DUS completed the LEED design phase submittal review with all credits accepted.
Energy efficiency measures include a performance improvement of 25.7 percent over
the baseline defined by ASHRAE; this includes improved thermal envelope, high-

RTD 2011 SUSTAINABILITY REPORT Page 4
efficiency glazing, reduced interior lighting power density and high-efficiency HVAC
equipment.
Earned LEED credits include Brownfield Redevelopment and Bicycle Storage/ Changing
Rooms.
West Rail Line
Utilized 32 biodiesel capable vehicles and 21 highly efficient (SUVs) construction vehicles
on the project. All construction equipment met or exceeded State of Colorado Air
Quality Emission Standards.
Recycled 39,000 tons of asphalt and concrete, of which we have reused 54 percent,
21,000 tons, onsite for stabilization under new roadways.
Re-vegetated close to 200 acres of off-guideway corridor with drought tolerant, non-
irrigated native seed.
EAGLE (East and Gold Rail Lines)
Sustainability Plan in initial draft stages.
Denver Transit Partners (DTP) assigned a senior level manager as the Sustainability
Coordinator for the project.
Contributed $145,000 to the Workforce Initiative Now (WIN) Program and hired
qualified WIN candidates for the project.
The design and construction phases of the project have surpassed its DBE/SBE goal
The design and construction for the Commuter Rail Maintenance Facility (CRMF) is on
track for LEED-Silver Certification.
The CRMF power density estimate is 38 percent below the base line.
Remediated 21,586 square yards of contaminated soils.
Adopted a Dust Mitigation and Particulate Mitigation Plan; as required by law.
The CRMF is on track to divert 75 percent of all construction and demolition waste
including concrete, asphalt and rail scrap.
Saved 264 tons of surplus rails from the West Line for reuse in the Eagle P3 project
Concrete ties and rails are manufactured locally.
Rail cars will be equipped with regenerative braking.
Northwest Rail Line/US36 BRT
Design of bus slip ramps will reduce commuting times and minimize conflicts with traffic.
Bus Rapid Transit (BRT) stops with bicycle traffic will be equipped with bicycle racks and
lockers.

RTD 2011 SUSTAINABILITY REPORT Page 5
North Metro Rail Line/I-225 Line
As both projects get started, a sustainability plan is being developed and coordinated by
the consultant.
Southeast Rail Extension
The project is considering design alternatives for a photovoltaic array to satisfy site
illumination needs.
Lighting criteria will optimize illumination levels and reduce energy consumption.
Each of the stations allows for potential TOD parcels.
Rail Operations
Averting the need to expand cooling systems, SCADA (Supervisory Control and Data
Acquisition) upgraded computer systems reducing energy costs by a third after retiring
inefficient computer servers.
LRV Maintenance shortened the time the HVAC stays on after the operator turns the
vehicle off.
Interior lights are turned off during the day on all parked LRVs.
To improve performance, maximum draw on LRVs have been reduced from 1200amps
to 900amps.
Base System Operations
Platte Drivers End Remodel - Added a stairway to the roof for convenience and safety.
FM personnel had previously been walking up and down a 45° slope and climbing over a
roof parapet to reach the roof for maintenance.
Platte Engine Wash Hoist Replacement: Removed a non-functioning floor mounted
platform hoist in the engine wash bay. The hoist is being replaced with new more
efficient mobile column hoists which will make this service bay functional again.
Platte North Lot Asphalt Repairs: Repaired cracks up to 3” wide and resurfaced the
driver’s parking lot to eliminate tripping hazards.
Facilities Concrete Pavement Repairs: Removed and replaced broken concrete
pavement at District Shops, Platte and East Metro to eliminate tripping hazards for
personnel and damage to vehicles.
Boulder Mechanical Upgrade: this project replaced and upgraded 30 year old HVAC
equipment and control systems to make the Bus Operations Building more comfortable
and energy efficient.
District Shops Fire Protection Upgrade: the project brought the building up to current
Denver Fire Department requirements as well as adding additional fire protection to our

RTD 2011 SUSTAINABILITY REPORT Page 6
records storage building. The entire District Shops and associated out buildings fire
alarm system was reviewed and updated.
RTD Engineering
In preparation for the future Pine Junction p-n-R construction, RTD transplanted fifteen
(15) large native ponderosa pines outside the future construction zone. The trees will
be incorporated into the future p-n-R landscape and provide a vegetative buffer for the
property.
Twenty four (24) pines were transplanted from the future Pine Junction p-n-R to Twin
Forks p-n-R, reducing pavement reflectivity and heat island effect while elevating the
Twin Forks p-n-R aesthetics.
Next Steps:
Section 4 of this report includes descriptions of next steps to move the RTD Sustainability
Program forward
The RTD Sustainability Policy and Guidelines, established in 2006, shall be reviewed and
recommended to the board for an update.
Coordinate the sustainability program with the RTD Long Range Fiscal Sustainability Task
Force as they investigate long term fiscal opportunities.
RTD staff is considering creation of an RTD Sustainability Coordinator/Manager position.
Renew efforts to establish a Green Procurement Policy.
Continue the ongoing RTD Sustainability Program efforts.
Monitor rising trends connected to sustainability.
Continue to review sustainability metrics to evaluate this sustainability program.
Measure changes in walkability for rail stations to be open April 26, 2013.

RTD 2011 SUSTAINABILITY REPORT Page 7
2. RTD SUSTAINABILITY PROGRAM
Sustainability is the capacity to give support. For humans, sustainability is the long-term
maintenance of well-being, which has environmental, economic and social components. As
illustrated in Figure 2 below, the RTD Sustainability Program seeks to balance the delivery of
effective public services (external activities) with the implementation of efficient business
activities (internal management practices). This results in an increased quality of life, a smaller
environmental footprint and cost-effective management of resources and materials. With the
endorsement of the United Nations this became the dominant approach to public sector full
cost accounting. In the private sector, this is known as “corporate social responsibility.”
Figure 2 RTD Sustainability Program Concept Chart

RTD 2011 SUSTAINABILITY REPORT Page 8
3. RTD SUSTAINABILITY CULTURE
RTD’s sustainability program is part of the daily tasks of the agency. The chart below highlights
the fundamental factors which comprise RTD sustainability culture, objectives, and indicators.
RTD uses indicators as a sign or group of statistical values to measure whether the agency’s
activities are within its sustainability culture and whether it meets its sustainability objectives.
RTD’s sustainability indicators provide useful metrics to identify problems before they become
critical, and to spotlight the areas where the links between the environment, economy and
society are weak. The indicators below fall into the three objectives of sustainability outlined by
RTD policy.
Figure 3 RTD Sustainability Culture chart
3.1. QUALITY OF LIFE
Quality of Life is used to evaluate the general well-being of individuals and societies. Quality of
life should not be confused with the concept of standard of living, which is based primarily on
income. Instead, standard indicators of the quality of life include not only wealth and
employment, but also the built environment, physical and mental health, education, recreation,
social belonging and leisure time.

RTD 2011 SUSTAINABILITY REPORT Page 9
3.1.1. GREATER TRAVEL CHOICES/ACCESSIBILITY
Optimized Transit Service refers to growth and improvements to the transit network, including
new rail and bus routes, increased frequency, directivity, speed, and the facilities that support
those services. Transit service is most efficient when a least number of passenger miles traveled
(PMT) are given by the highest number of boardings. In 2011, Annual Passenger Miles saw a
4.23% increase to 558 Million. There were slight decreases in the Annual Passenger Miles
traveled on the bus and direct response system. The increase came from the LRT system
(Figure 4).
RTD Annual Passenger Miles
Passenger Miles Bus and LRT
Figure 4 Passenger Miles by Year
524 535 558
-
200
400
600
2009 2010 2011
Mill
ion
s
383,948,305 385,410,133 383,245,030
129,248,691 139,416,653 164,540,706
-
100,000,000
200,000,000
300,000,000
400,000,000
2009 2010 2011
Bus LRT Bus LRT Bus LRT

RTD 2011 SUSTAINABILITY REPORT Page 10
The FasTracks Program consists of nine rail corridors, one bus rapid transit corridor,
redevelopment of Denver Union Station, a new Commuter Rail Maintenance Facility and an
expanded light rail maintenance facility. At completion, the program will add approximately 93
miles of commuter rail, 28 miles of light rail, 18 miles of BRT, park-n-Ride improvements and/or
relocations at existing park-n-Ride lots along US 36.
Balanced Transit Access is the ability for people to approach transit in a convenient way, such
as being within walking distance to origin and destination, or efficient transfers from one mode
of transportation to another. This refers also to the capacity for people with special needs to
get access to special transportation.
Public Involvement engages the community in planning and project development in order to
increase the pool of common knowledge and build trust. Public involvement is based on giving
people the opportunities to debate issues, frame alternative solutions, and affect final decisions
in ways that respect the roles of decision-makers.
Multimodal Opportunities refers to linking the interaction of various modes of transportation
(walking, cycling, automobile, public transit, etc.) with planning and development, and the
connections among such modes so each can fill its optimal role in the overall transport system.
3.1.2. LIVABLE COMMUNITIES
Air Quality: Although air quality, based on EPA’s readings, has improved significantly since the
passage of the Clean Air Act in 1970, there are still many areas of the country where the public
is exposed to unhealthy levels of air pollutants and sensitive ecosystems are damaged by air
pollution. RTD’s role in improving air quality includes curbing greenhouse gas emissions,
particulate matter and ozone producing pollutants.
Water Quality: Water quality is measured by standards set by the EPA relative to health of
ecosystems, safety of human contact and drinking water. RTD complies with all water quality
law and in addition implements measures that reuse water for irrigation purposes and help
prevent the waste of water.
RTD has installed several rain sensors at its facilities and three weather stations to be
used as tools in the optimal allocation of water for irrigation purposes throughout the
District.
The RTD park-n-Ride at US 36 and McCaslin Blvd. is irrigated with reclaimed gray water
supplied by the Town of Superior.

RTD 2011 SUSTAINABILITY REPORT Page 11
Reduce Congestion: Rail and bus service will slow the increase of congestion and daily VMT
growth. If congestion in the region increases, transit modes, particularly those with dedicated
right-of-way, will likely also see an increase.
Transit-Oriented Development is a mixed use area that is compatible with other uses and is
characterized by convenient access to transit. TOD often incorporates features to encourage
transit ridership. A TOD neighborhood typically has a center with a transit station or stop,
surrounded by relatively high-density development with progressively lower-density
development spreading outward from the center. TODs generally are located within a radius of
one-quarter to one-half mile from a transit stop, as this is considered to be an appropriate
walking distance for pedestrians. RTD’s TOD program has been and will continue to coordinate
with other programs to promote the benefits of sustainability.
Walking is a method of accessibility; more people access transit by walking than by any other
means. Because walking is ecologically stable, promotes health and social connections,
walkability is used as an indicator of sustainability. Transit supports walkable communities at
both ends of the trip, at the origin by promoting residential densities that support pedestrian-
scale neighborhoods and at the destination by promoting easy access to employment, services
and recreation.
WIN: The regional Workforce Initiative Now (WIN) is a collaborative partnership between RTD,
Community College of Denver, Denver Transit Partners (DTP) and the Urban League of
Metropolitan Denver. WIN helps job seekers, companies, and local communities through the
creation of career opportunities in the transportation and construction industries.
DBE/SBE/MBE Participation on Projects: FTA recipients receiving planning, capital and/or
operating assistance who will award prime contracts exceeding $250,000 in FTA funds in a
Federal fiscal year are required to have a Disadvantaged Business Enterprise (DBE) Program
that complies with the requirements of federal regulations codified at 49 CFR Part 26. As an
applicable recipient, RTD is continuing to implement a DBE Program consistent with federal
requirements. Recently, RTD not only reorganized its Small Business Department (re-naming it
the Civil Rights Department) but revised its DBE Plan and implementing Program to continue to
comply with the federal DBE Program requirements. RTD has consistently established DBE
participation goals; in the process, members are notified of the program requirements, given
comprehensive compliance monitoring, provided with technical assistance and supportive
services, and provided with training on the program requirements.

RTD 2011 SUSTAINABILITY REPORT Page 12
Transit Watch refers to passengers being alert and aware; passengers are encouraged to report
suspicious activity. The CERT program is a safety and security partnership between RTD and its
passengers in which RTD asks its users to receive orientation to and make a commitment to be
an alert, informed, prepared and involved passenger.
3.2. ENVIRONMENTAL SUSTAINABILITY
Environmental Footprint: The environmental footprint is a measure of human demand on the
Earth's ecosystems. It is a standardized measure of demand for natural capital that may be
contrasted with the planet's ecological capacity to regenerate.
The following is a tabulation of significant environmental impacts of the RTD system.
Reduce Energy Use: The total energy used by the RTD system showed a decrease of 3.56%
in the year 2011. For this calculation all energy units were converted to kilowatt-hour
assuming that one kilowatt-hour is equal to 3,413 BTU. Average Mean temperatures were
slightly cooler in 2011 than in 2010. Of all the forms of energy used, the percentage of
electricity used increased, while the percentage of diesel use decreased.
Figure 5 Total RTD Energy Usage in 2011
609 588
0
250
500
750
2010 2011
Mill
ion
s
RTD 2011 SUSTAINABILITY REPORT Page 13
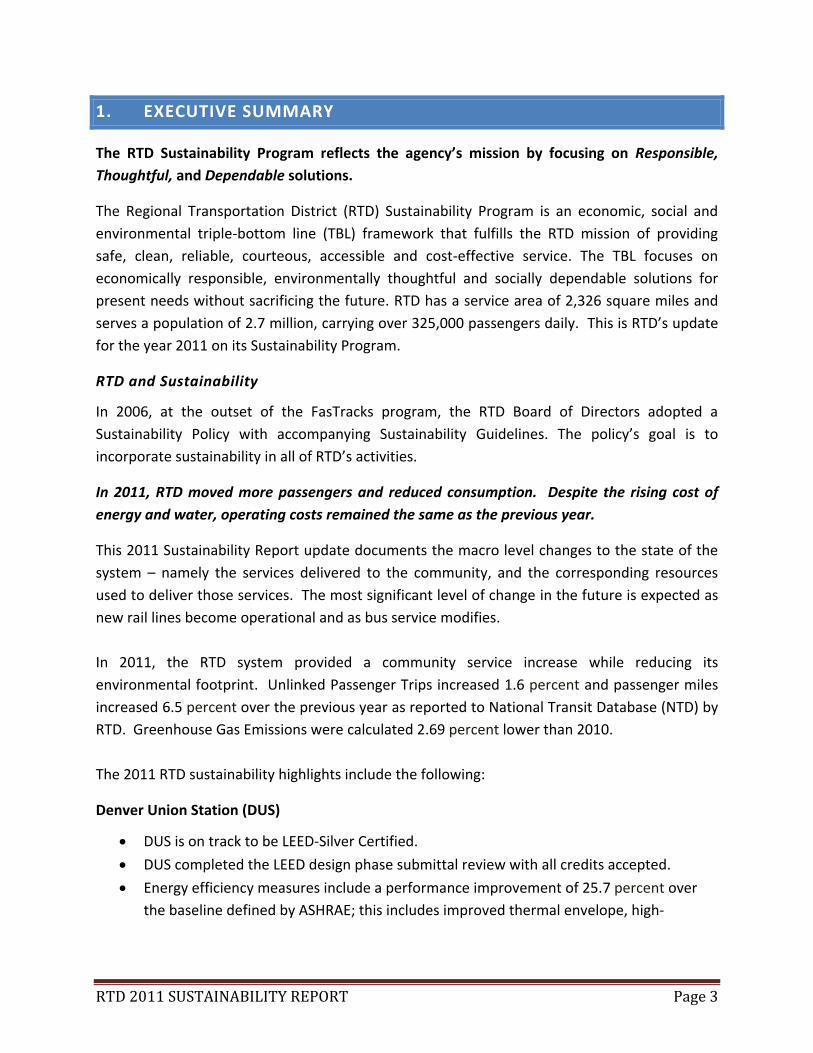
Figure 6 Energy Consumption Pattern in 2011
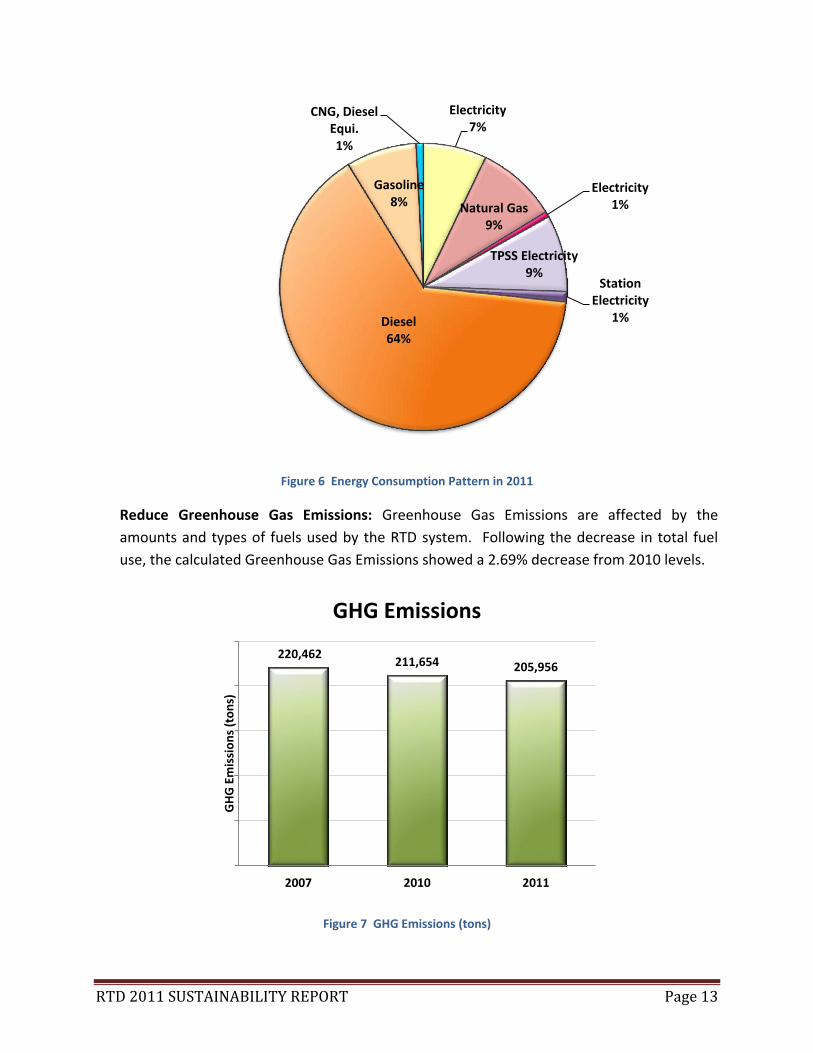
Reduce Greenhouse Gas Emissions: Greenhouse Gas Emissions are affected by the
amounts and types of fuels used by the RTD system. Following the decrease in total fuel
use, the calculated Greenhouse Gas Emissions showed a 2.69% decrease from 2010 levels.
Figure 7 GHG Emissions (tons)
Electricity 7%
Natural Gas 9%
Electricity 1%
TPSS Electricity 9%
Station Electricity
1% Diesel 64%
Gasoline 8%
CNG, Diesel Equi. 1%
220,462 211,654 205,956
2007 2010 2011
GH
G E
mis
sio
ns
(to
ns)
GHG Emissions

RTD 2011 SUSTAINABILITY REPORT Page 14
Figure 8 Sources of GHG Emissions
Reduce Water Use: The water use by park-n-Rides and LRT Stations saw a 12.4% decrease
in 2011. This was aided by good precipitation in 2011. It is also a testimony of the impact
of installing rain gauge sensors on irrigation systems.
Figure 9 Annual Water Use in Million Gallons 2011
Electricity 34%
Natural Gas 5%
Diesel 54%
Gasoline 6%
CNG 1%
Sources of GHG Emissions
28
10
25
9
-
10
20
30
park-n-Rides LRT Irrigation
Mill
ion
s
2010 2011

RTD 2011 SUSTAINABILITY REPORT Page 15
Figure 10 Operating energy & Water Costs
$5,446,221
$6,258,789
$0
$2,500,000
$5,000,000
2010 2011

RTD 2011 SUSTAINABILITY REPORT Page 16
4. NEXT STEPS
There are a number of items that need to be considered to continue moving forward with the
Sustainability Program as follows.
RTD Sustainability Policy and Guidelines Update: the current policy was drafted in 2006 and
needs an update to reflect some of the conditions that characterize the District today and state-
of-the-art sustainability measures.
Fiscal Sustainability (RTD Task Force): the Sustainability Program shall coordinate with the Long
Range Fiscal Sustainability Task Force who is looking at the opportunities for operating
efficiencies and revenue enhancements to promote RTD fiscal sustainability in the long term.
RTD Sustainability Coordinator/Manager position: the purpose of this position would be to
manage an agency-wide environmental management system and to foster the sustainability
program. This position would implement management processes and procedures to allow RTD
to analyze, control and reduce the environmental impact of its activities, products and services
and operate with greater efficiency and control. Benefits of implementing an environmental
and sustainability management system may include better accountability and cost reductions in
operations and maintenance. One of the tools commonly used for this purpose is the ISO 14001
standard.
Advancing RTD sustainable policy: Update current standards and create new RTD Standards
improving the state-of-the art to include
Landscape (Xeriscaping)
Solar Photovoltaic Systems
Lighting
Mechanical
Recycling
Fuel Efficiency/Transit Effectiveness
Advancement of Green Procurement Policy: RTD staff should take into account long term
maintenance considerations while specifying products. To start with, RTD may want to study
various approaches to Life Cycle costing methodologies for the bigger purchase categories to
start with. RTD does need to maintain all its infrastructure and vehicles in good working
condition, while operating within a framework of many regulations that govern procurement.
Questions to address include:
1. What constitutes a green product or service?
2. How do we verify we will get the green attributes of products and services we desire?
3. How much of a premium are we willing to pay for desirable environmental attributes?
4. How much of a premium are we willing to pay for lower maintenance costs?
RTD 2011 SUSTAINABILITY REPORT Page 15
5. How do we incorporate the above considerations into our designs, specifications, and
procurement documents?
Collaboration with other agencies: Increase the collaboration with other agencies and
programs including the Colorado Environmental Leadership Program.

RTD 2011 SUSTAINABILITY REPORT Page 16
5. GLOSSARY OF TERMS
Biomass: as a renewable energy source, biomass is biological material from living, or recently
living organisms. As an energy source, biomass can either be used directly, or converted
into other energy products such as biofuel.
Carbon dioxide (CO2): is a colorless, odorless, non-toxic greenhouse gas also associated with
ocean acidification, emitted from sources such as combustion, cement production, and
respiration. It is otherwise recycled in the atmosphere in the carbon cycle.
Carbon monoxide: is a colorless, odorless, non-irritating but very poisonous gas. It is a
byproduct of incomplete fuel combustion such as natural gas, coal or wood. Vehicular
exhaust is a major source of carbon monoxide.
CERT: Community Emergency Response Team
Corporate Social Responsibility: is a form of corporate self-regulation integrated into a
business model and it is commonly seen as a synonym to the Triple-Bottom Line of
sustainability.
CRMF: Commuter Rail Maintenance Facility
DBE: Disadvantage Business Enterprise
DTP: Denver Transit Partners
DUS: Denver Union Station
Ecological Footprint: is a measure of human demand on the Earth's ecosystems, at RTD it is
measured in term of water usage, energy usage and greenhouse gas emissions.
ECO Pass: Employee Commuter Options program is an RTD membership based transit pass for
businesses and communities.
Emissions: are pollutants in the air that can cause harm to humans and the environment.
Emissions can be in the form of solid, liquid, or gases.
Energy Efficiency: is the goal of efforts to reduce the amount of energy required to provide
products and services.
Energy Equivalence: is the method of quantifying the amounts of energy from diverse sources
into one common measure, this report uses kilowatt-hour as a measure of equivalence.
EPA: Environment Protection Agency

RTD 2011 SUSTAINABILITY REPORT Page 17
Green Procurement: is a spending and investment process that enables the acquisition of
goods, services, utilities and works not solely based on a cost-benefit analysis, but in
combination with a return on investment in the long term and external benefits.
Greenhouse Gases: are gases in the earth’s atmosphere that absorb and emit radiation within
the thermal infrared range. The primary greenhouse gases in the Earth's atmosphere are
water vapor, carbon dioxide, methane, nitrous oxide, and ozone.
LEED: Leadership in Energy and Environmental Design
LRT: Light Rail Transit or light rail is a form of urban rail public transportation that generally has
a lower capacity and lower speed than heavy rail and metro systems, but higher capacity
and higher speed than traditional street-running streetcar systems.
LRV: Light Rail Vehicle
Nitrogen oxides (NOx): especially nitrogen dioxide, these gases are emitted from high
temperature combustion and can be seen as the brown haze dome above or plume
downwind of cities. Nitrogen dioxide is the chemical compound with the formula NO2. It is
one of the several nitrogen oxides. This reddish-brown toxic gas has a characteristic sharp,
biting odor. NO2 is one of the most prominent air pollutants.
NTD: National Transit Database
Renewable Energy: is energy which comes from natural resources such as sunlight, wind, rain,
tides, and geothermal heat, which are naturally replenished.
PMT: Passenger Miles Traveled
SBE: Small Business Enterprise
SCADA: Supervisory Control and Data Acquisition
TOD: Transit-Oriented Development is a mixed-use residential or commercial area designed to
maximize access to public transport, and often incorporates features to encourage transit
ridership.
TBL: Triple Bottom line
WIN: Workforce Initiative Now

RTD 2011 SUSTAINABILITY REPORT Page 18
APPENDIX A. RTD SUSTAINABILITY METRICS
This appendix contains supporting data referenced in the body of the report.
1. SERVICE FOOTPRINT
1.1 Vehicle Fleet Fuel, Mileage and Greenhouse Gas Emissions
1.2 RTD Water Use Data.
NTD Annual Passenger Miles 2009 2010 2011
Bus - Directly Operated 243,595,629 258,792,817 258,943,797
Bus - Purchased Transportation 140,352,676 126,617,316 124,301,233
Bus - Total 383,948,305 385,410,133 383,245,030
LRT - Directly Operated 129,248,691 139,416,653 164,540,706
Demand Response - Directly Operated 685,366 668,398 596,424
Demand Response - Purchased Transportation 9,849,409 9,926,265 9,707,660
Demand Response - Total 10,534,775 10,594,663 10,304,084
Grand Total 523,731,771 535,421,449 558,089,820
kWH % of Total kWH COST COSTper 1000 KWH kWH % of Total kWH COST COSTper 1000 KWH
Facilites Steam 4,372,906 1% $224,221 $51.275 2,874,582 0% $167,895 $58.407
Facilites Electricity 33,599,026 6% $2,508,280 $74.653 31,204,866 5% $3,457,563 $110.802
Facilites Gas Interruptible 67,162,632 11% $832,425 $12.394 42,069,233 7% $829,154 $19.709
Facilites Gas Firm 8,139,188 1% $222,907 $27.387 11,190,801 2% $259,989 $23.232
PnR Electricity 3,212,535 1% $312,803 $97.370 3,492,765 1% $335,181 $95.965
LRT System TPSS Electricity 46,339,256 8% $4,330,553 $93.453 50,417,181 9% $4,945,078 $98.083
LRT System
Communication
signal house
Electricity
1,512,882
0%
$181,965
$120.277
1,553,191
0%
$188,816
$121.566
LRT System Station Electricity 7,040,916 1% $662,332 $94.069 6,942,705 1% $606,888 $87.414
Bus System Diesel 383,570,381 63% 376,264,373 65%
Bus System Gasoline 48,046,364 8% 46,372,183 8%
Bus System CNG, Diesel Equi. 6,208,649 1% 4,726,931 1%
TOTAL 609,204,736 100% 577,108,809 100%
2010 2011
RTD System Fuel and Energy Sources
Gallons Cost Cost per thousand gallons Gallons Cost Cost per thousand gallons
park-n-Rides 27,607,294 $169,073 $6.12 24,619,583 $161,054 $6.54
Facilities 29,820,783 $128,219 $4.30 29,866,486 $127,615 $4.27
LRT Water 5,916,009 $39,314 $6.65 6,319,313 $45,706 $7.23
LRT Irrigation 10,258,005 $40,199 $3.92 8,549,000 $34,355 $4.02
TOTAL 73,602,091 $376,805 $5.12 69,354,382 $368,730 $5.32
2011
RTD Water Use
2010

RTD 2011 SUSTAINABILITY REPORT Page 19
1.3 Greenhouse Gas Impacts
2. SYSTEM ECONOMIC FOOTPRINT
2.1 System Fuel and Energy Costs
2.2 System Data- Minus Buildings
Fuel Unit Conversion Factor/Source Quantity tons % Quantity tons %
Electricity kWH EPA calculator 91,704,615 69,705 33% 93,610,707 71,144 35%
Natural Gas Therms EPA calculator 2,570,028 14,165 7% 1,817,749 10,016 5%
CO2 lb/gallon 0%
Diesel Gallon 22.2 10,148,170 112,645 53% 9,954,874 110,499 54%
Gasoline Gallon 19.4 1,401,545 13,595 6% 1,352,708 13,121 6%
CNG Diesel Equivalent Gallon 18.8 164,263 1,544 1% 125,061 1,176 1%
TOTAL 211,654 100% 205,956 100%
Steam is ignored because of small percentage component
GHG Impact - Debit Side
2010 2011
kWH % of Total kWH COST COSTper 1000 KWH kWH % of Total kWH COST COSTper 1000 KWH
Steam 4,372,906 1% $224,221 $51.275 2,874,582 0% 167,895$ $58.41
Electricity 91,704,615 15% $2,508,280 $27.352 93,610,707 15% 3,457,563$ $36.94
Natural Gas 75,301,820 12% $832,425 $11.055 53,260,034 9% 829,154$ $15.57
Diesel 383,570,381 63% 376,264,373 62%
Gasoline 48,046,364 8% 46,372,183 8%
CNG, Diesel Equi. 6,208,649 1% 4,726,931 1%
TOTAL 609,204,736 100% 577,108,809 95%
2010 2011
RTD System Fuel and Energy Sources
Year
Annual Passenger Miles 129,248,691 139,416,653 164,540,706
Unlinked Passenger Trips 19,759,388 20,087,726 20,694,632
Annual Ridership 8,182,448 8,304,712 0
kWh Cost kWh Cost kWh Cost
TPPS power usage 43,766,810 $3,554,373 46,339,256 $4,330,553 50,417,181 $4,945,078
Communication signal
house power usage
1,450,420 $158,108 1,512,882 $181,965 1,553,191 $188,816
Light Rail Station Power 8,861,604 $614,264 7,040,916 $662,332 6,942,705 $606,888
TOTAL 54,078,834 4,326,745 54,893,054 5,174,850 58,913,077 5,740,782
kWh/Passenger Mile 0.42 0.39 0.36
2009 2010 2011
LRT Sytem Data-Minus buildings

RTD 2011 SUSTAINABILITY REPORT Page 20
2.3 Facilities and park-n-Ride Energy
2.4 Bus System Data
2.5 Cost of Operations
2010 2011 2010 2011 2010 2011
Facilites Steam 4,372,906 2,874,582 $224,221 167,895.00$ 0.05 0.06
Facilites Electricity 33,599,026 31,204,865.71 $2,508,280 3,457,563$ 0.07 0.11
Facilites Gas Interruptible 67,162,632 42,069,233 $832,425 829,154$ 0.01 0.02
Facilites Gas Firm 8,139,188 11,190,801 $222,907 259,988.68$ 0.03 0.02
PnR Electricity 3,212,535 3,492,765 $312,803 335,181$ 0.10 0.10
TOTAL 116,486,288 90,832,246 $4,100,636 $5,049,782 0.04 0.06
kWH COST COST/KWH
Facilities & PnR's Energy Use
Year
Annual Passenger Miles 396,004,796 393,549,114
Unlinked Passenger Trips 77,340,510 76,378,836
Annual Ridership (2009)= 98,577,123 97,676,208 98,383,870
Miles Traveled 59,839,933 68,622,441
Energy/Unit (BTU/Gallon) Gallon kWh Gallon kWh
Diesel 129,000 10,148,170 383,570,381 9,954,874 376,264,373
Gasoline 117,000 1,401,545 48,046,364 1,352,708 46,372,183
CNG, Diesel Equi. 129,000 164,263 6,208,649 125,061 4,726,931
TOTAL 437,825,394 427,363,486
kWh/Passenger Mile 1.11 1.09
2010
Bus Sytem Data (Direct + Purchased + Demand Response)2011
ITEM pnR Facilities LR SYSTEM TOTAL % pnR Facilities LR SYSTEM TOTAL %
Electricity $312,803 $2,517,453 $662,867 $3,493,124 64% $335,181 $3,464,494 $606,888 $4,406,564 70%
Nat. Gas $1,055,332 $1,055,332 19% $1,089,143 $1,089,143 17%
Steam $217,994 $217,994 4% $167,895 $167,895 3%
Water $169,073 $132,188 $79,513 $380,774 7% $161,054 $127,615 $80,061 $368,730 6%
Sewer/Storm $56,541 $105,545 $50,054 $212,141 4% $53,277 $90,288 $53,544 $197,109 3%
Other $4,657 $21,700 $60,500 $86,856 2% $2,076 $9,352 $17,921 $29,349 0%
TOTAL $543,075 $4,050,212 $852,934 $5,446,221 100% $551,588 $4,948,787 $758,414 $6,258,789 100%
2010 2011
COST