Embed Size (px)
Citation preview
1
Genpact Sustainability Report 2011
Sustainability@GenpactSustainability Report 2012 Performance Highlights
GENERATING INTELLIGENT IMPACT
2
For internal use only
“The focus now is not on ‘IF’ a company
should be sustainable, but on ‘How’ a
company goes about being sustainable. If
done right, Sustainability can be a competitive
advantage”
NV “Tiger” Tyagarajan
President & CEO Genpact
3
For internal use only
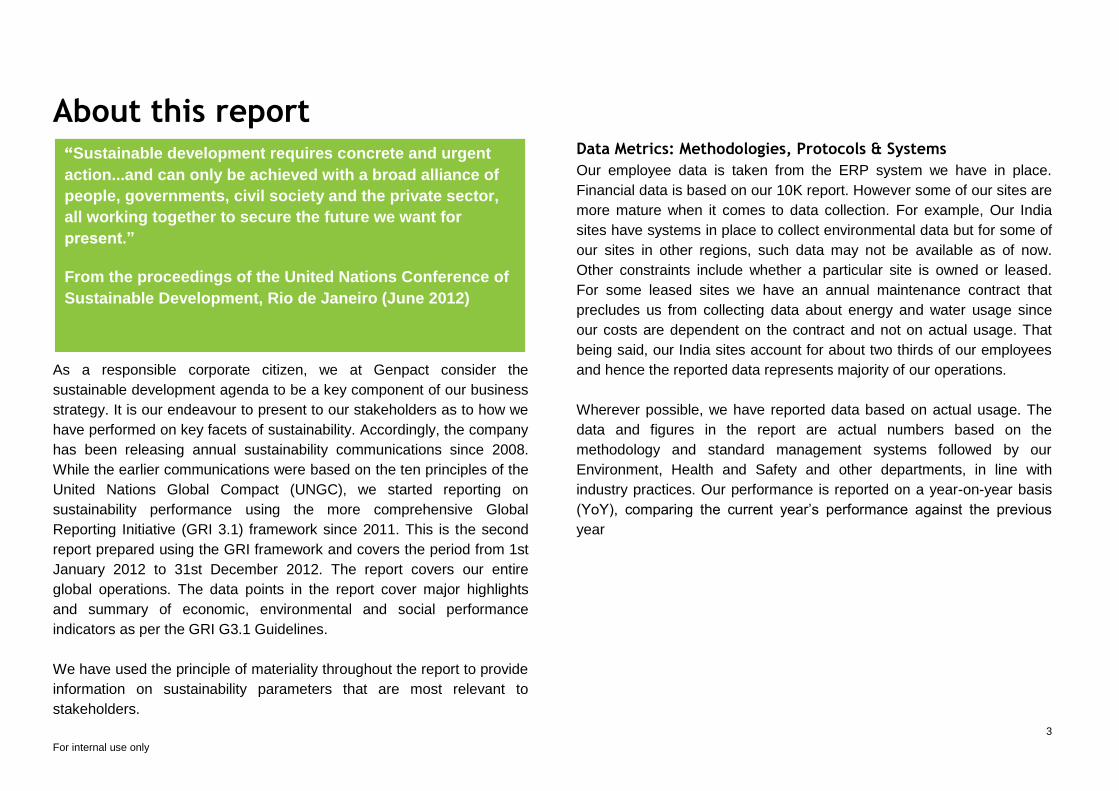
About this report
As a responsible corporate citizen, we at Genpact consider the
sustainable development agenda to be a key component of our business
strategy. It is our endeavour to present to our stakeholders as to how we
have performed on key facets of sustainability. Accordingly, the company
has been releasing annual sustainability communications since 2008.
While the earlier communications were based on the ten principles of the
United Nations Global Compact (UNGC), we started reporting on
sustainability performance using the more comprehensive Global
Reporting Initiative (GRI 3.1) framework since 2011. This is the second
report prepared using the GRI framework and covers the period from 1st
January 2012 to 31st December 2012. The report covers our entire
global operations. The data points in the report cover major highlights
and summary of economic, environmental and social performance
indicators as per the GRI G3.1 Guidelines.
We have used the principle of materiality throughout the report to provide
information on sustainability parameters that are most relevant to
stakeholders.
Data Metrics: Methodologies, Protocols & Systems
Our employee data is taken from the ERP system we have in place.
Financial data is based on our 10K report. However some of our sites are
more mature when it comes to data collection. For example, Our India
sites have systems in place to collect environmental data but for some of
our sites in other regions, such data may not be available as of now.
Other constraints include whether a particular site is owned or leased.
For some leased sites we have an annual maintenance contract that
precludes us from collecting data about energy and water usage since
our costs are dependent on the contract and not on actual usage. That
being said, our India sites account for about two thirds of our employees
and hence the reported data represents majority of our operations.
Wherever possible, we have reported data based on actual usage. The
data and figures in the report are actual numbers based on the
methodology and standard management systems followed by our
Environment, Health and Safety and other departments, in line with
industry practices. Our performance is reported on a year-on-year basis
(YoY), comparing the current year’s performance against the previous
year
“Sustainable development requires concrete and urgent
action...and can only be achieved with a broad alliance of
people, governments, civil society and the private sector,
all working together to secure the future we want for
present.”
From the proceedings of the United Nations Conference of
Sustainable Development, Rio de Janeiro (June 2012)
4
For internal use only
Table of Contents About this report 3
Summary of our performance 5
Awards and Recognition for 2012 6
Sustainability@Genpact 7
Economic performance 9
People performance 12
Environmental performance 20
Ethics and Governance 28
Corporate Citizenship 31
GRI Index (sample) 34
Annexure 1: Economic Value Added 50
Annexure 2: Human resource data 55
Draft for discussion 5
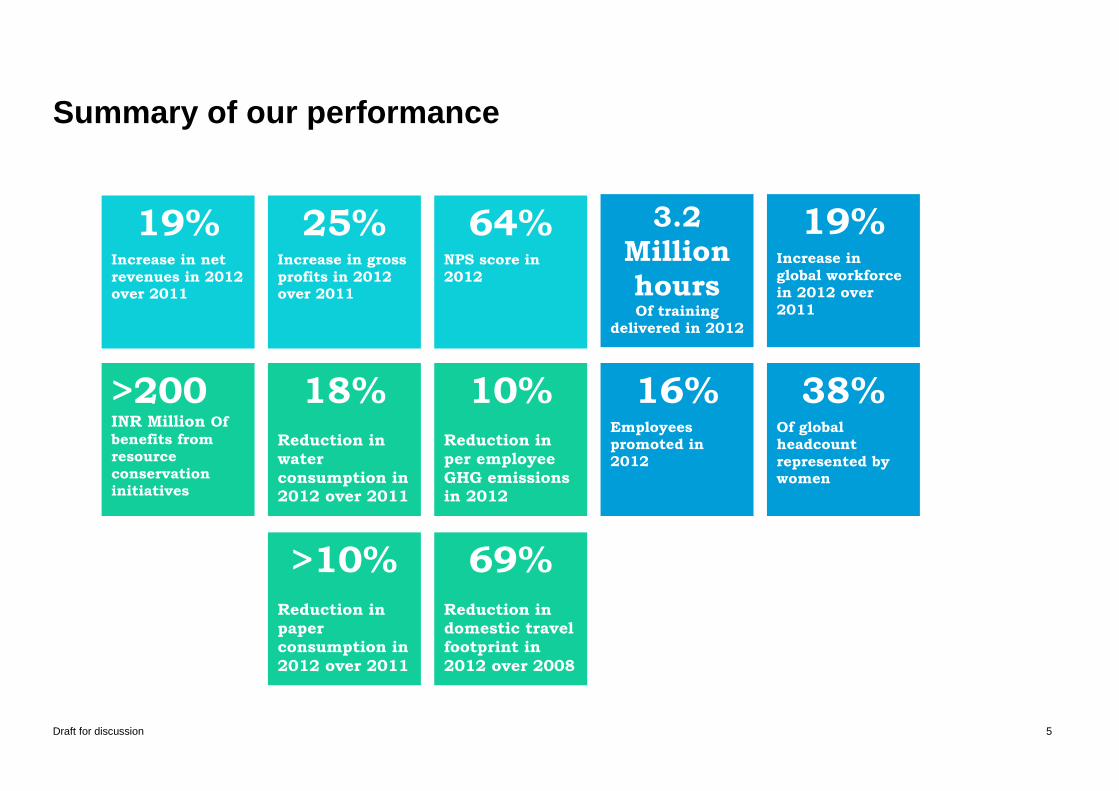
Summary of our performance
19% Increase in net revenues in 2012 over 2011
25% Increase in gross profits in 2012 over 2011
64% NPS score in 2012
3.2
Million
hours Of training
delivered in 2012
19% Increase in global workforce in 2012 over 2011
16% Employees promoted in 2012
38% Of global headcount represented by women
>200 INR Million Of
benefits from resource conservation initiatives
18%
Reduction in water
consumption in 2012 over 2011
>10%
Reduction in paper consumption in
2012 over 2011
10%
Reduction in per employee
GHG emissions in 2012
69%
Reduction in domestic travel footprint in
2012 over 2008
Draft for discussion 6
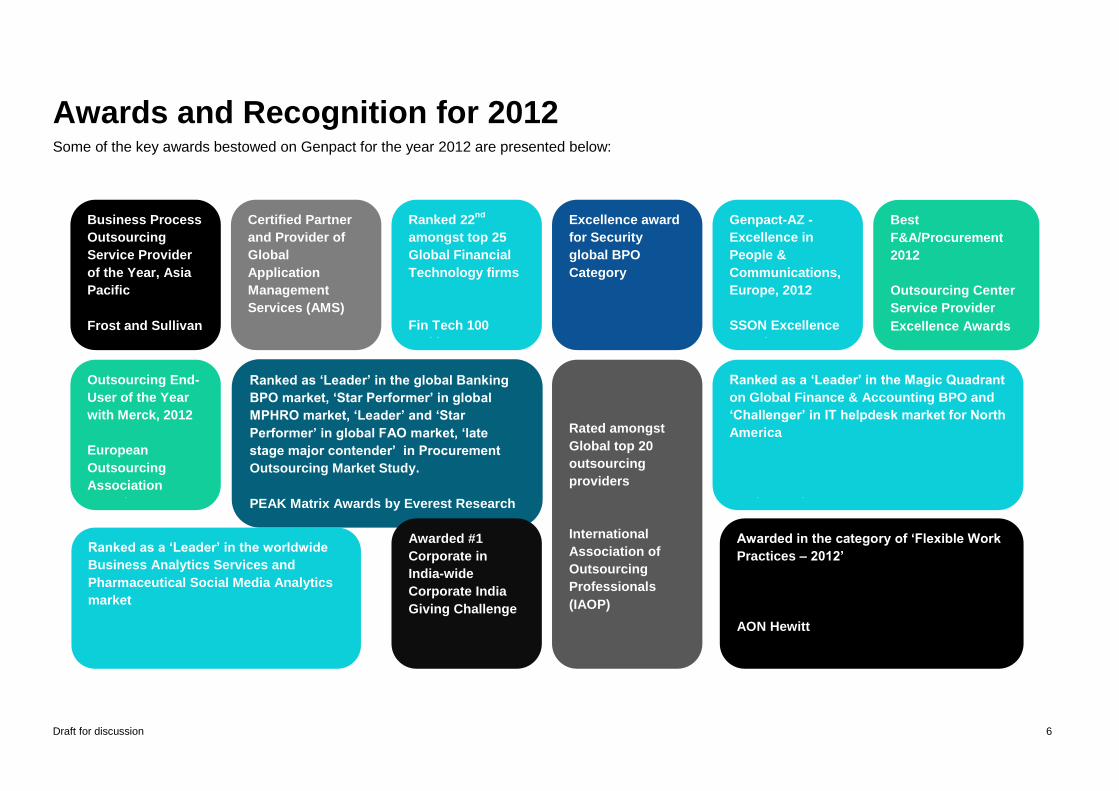
Awards and Recognition for 2012 Some of the key awards bestowed on Genpact for the year 2012 are presented below:
Business Process
Outsourcing
Service Provider
of the Year, Asia
Pacific
Frost and Sullivan
Certified Partner
and Provider of
Global
Application
Management
Services (AMS)
SAP
Ranked 22nd
amongst top 25
Global Financial
Technology firms
Fin Tech 100
rankings
Excellence award
for Security
global BPO
Category
DSCI
Genpact-AZ -
Excellence in
People &
Communications,
Europe, 2012
SSON Excellence
awards
Best
F&A/Procurement
2012
Outsourcing Center
Service Provider
Excellence Awards
Outsourcing End-
User of the Year
with Merck, 2012
European
Outsourcing
Association
Awards
Ranked as ‘Leader’ in the global Banking
BPO market, ‘Star Performer’ in global
MPHRO market, ‘Leader’ and ‘Star
Performer’ in global FAO market, ‘late
stage major contender’ in Procurement
Outsourcing Market Study.
PEAK Matrix Awards by Everest Research
Rated amongst
Global top 20
outsourcing
providers
International
Association of
Outsourcing
Professionals
(IAOP)
Ranked as a ‘Leader’ in the Magic Quadrant
on Global Finance & Accounting BPO and
‘Challenger’ in IT helpdesk market for North
America
Magic Quadrant
Ranked as a ‘Leader’ in the worldwide
Business Analytics Services and
Pharmaceutical Social Media Analytics
market
IDC’s 2012 Market Scape Report
Awarded #1
Corporate in
India-wide
Corporate India
Giving Challenge
Give India
Awarded in the category of ‘Flexible Work
Practices – 2012’
AON Hewitt
Draft for discussion 7
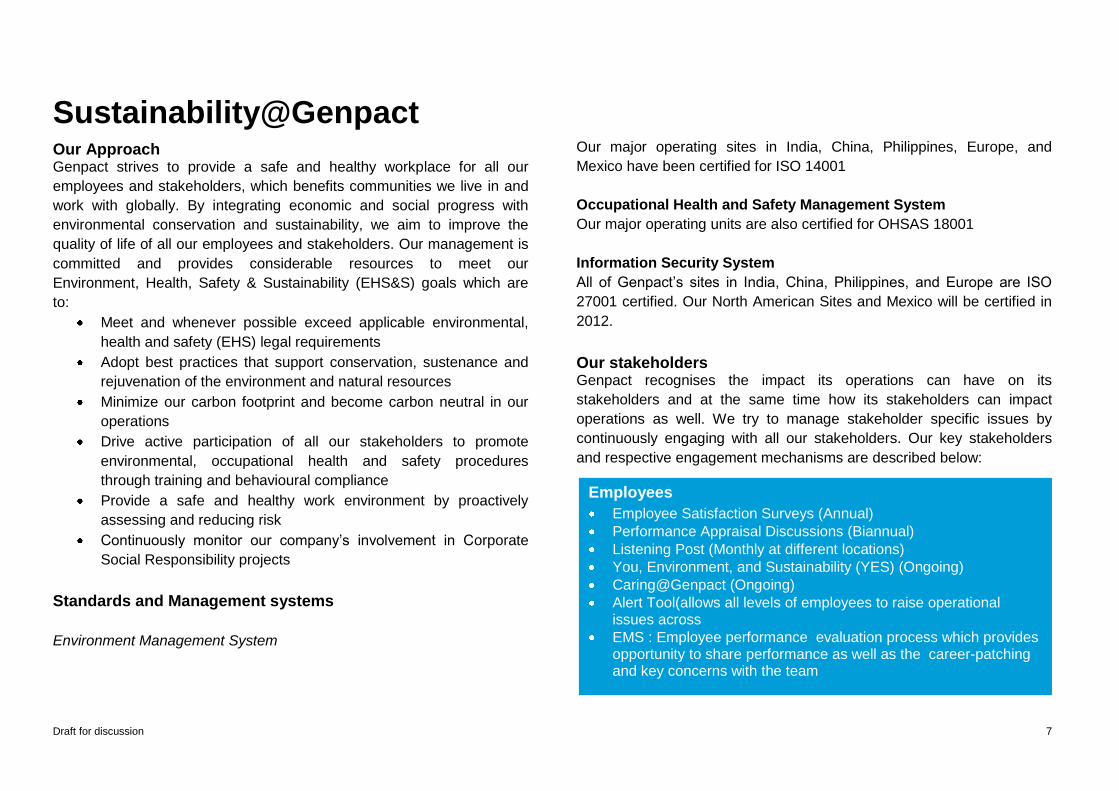
Sustainability@Genpact Our Approach Genpact strives to provide a safe and healthy workplace for all our
employees and stakeholders, which benefits communities we live in and
work with globally. By integrating economic and social progress with
environmental conservation and sustainability, we aim to improve the
quality of life of all our employees and stakeholders. Our management is
committed and provides considerable resources to meet our
Environment, Health, Safety & Sustainability (EHS&S) goals which are
to:
Meet and whenever possible exceed applicable environmental,
health and safety (EHS) legal requirements
Adopt best practices that support conservation, sustenance and
rejuvenation of the environment and natural resources
Minimize our carbon footprint and become carbon neutral in our
operations
Drive active participation of all our stakeholders to promote
environmental, occupational health and safety procedures
through training and behavioural compliance
Provide a safe and healthy work environment by proactively
assessing and reducing risk
Continuously monitor our company’s involvement in Corporate
Social Responsibility projects
Standards and Management systems
Environment Management System
Our major operating sites in India, China, Philippines, Europe, and
Mexico have been certified for ISO 14001
Occupational Health and Safety Management System
Our major operating units are also certified for OHSAS 18001
Information Security System
All of Genpact’s sites in India, China, Philippines, and Europe are ISO
27001 certified. Our North American Sites and Mexico will be certified in
2012.
Our stakeholders Genpact recognises the impact its operations can have on its
stakeholders and at the same time how its stakeholders can impact
operations as well. We try to manage stakeholder specific issues by
continuously engaging with all our stakeholders. Our key stakeholders
and respective engagement mechanisms are described below:
Employees
Employee Satisfaction Surveys (Annual)
Performance Appraisal Discussions (Biannual)
Listening Post (Monthly at different locations)
You, Environment, and Sustainability (YES) (Ongoing)
Caring@Genpact (Ongoing)
Alert Tool(allows all levels of employees to raise operational issues across
EMS : Employee performance evaluation process which provides opportunity to share performance as well as the career-patching and key concerns with the team
Draft for discussion 8
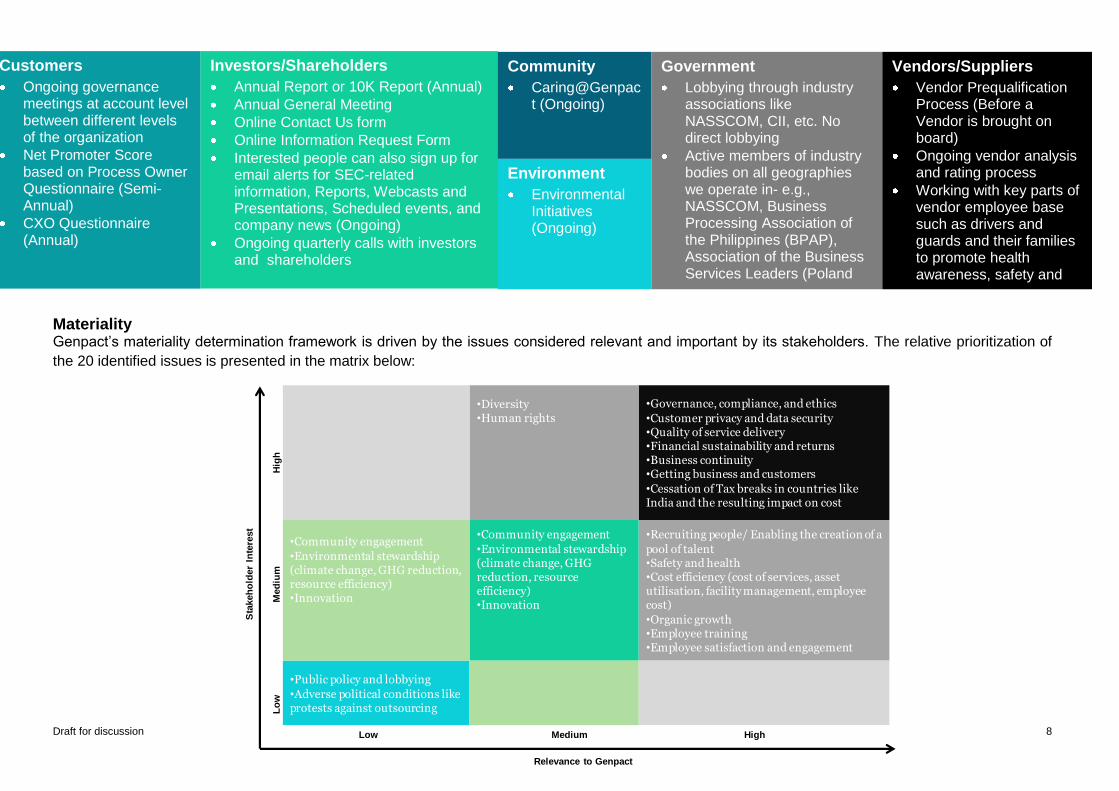
•Governance, compliance, and ethics
•Customer privacy and data security•Quality of service delivery•Financial sustainability and returns•Business continuity•Getting business and customers
•Cessation of Tax breaks in countries like India and the resulting impact on cost
•Recruiting people/ Enabling the creation of a
pool of talent•Safety and health•Cost efficiency (cost of services, asset utilisation, facility management, employee cost)
•Organic growth•Employee training•Employee satisfaction and engagement
•Diversity•Human rights
•Community engagement
•Environmental stewardship (climate change, GHG reduction, resource efficiency)•Innovation
•Public policy and lobbying
•Adverse political conditions like protests against outsourcing
•Community engagement
•Environmental stewardship (climate change, GHG reduction, resource efficiency)•Innovation
Low Medium High
Lo
wM
ed
ium
Hig
h
Relevance to Genpact
Sta
keh
old
er
Inte
rest
Materiality Genpact’s materiality determination framework is driven by the issues considered relevant and important by its stakeholders. The relative prioritization of
the 20 identified issues is presented in the matrix below:
Customers
Ongoing governance meetings at account level between different levels of the organization
Net Promoter Score based on Process Owner Questionnaire (Semi-Annual)
CXO Questionnaire (Annual)
Investors/Shareholders
Annual Report or 10K Report (Annual)
Annual General Meeting
Online Contact Us form
Online Information Request Form
Interested people can also sign up for email alerts for SEC-related information, Reports, Webcasts and Presentations, Scheduled events, and company news (Ongoing)
Ongoing quarterly calls with investors and shareholders
Community
Caring@Genpact (Ongoing)
Environment
Environmental Initiatives (Ongoing)
Government
Lobbying through industry associations like NASSCOM, CII, etc. No direct lobbying
Active members of industry bodies on all geographies we operate in- e.g., NASSCOM, Business Processing Association of the Philippines (BPAP), Association of the Business Services Leaders (Poland and Romania), etc
Vendors/Suppliers
Vendor Prequalification Process (Before a Vendor is brought on board)
Ongoing vendor analysis and rating process
Working with key parts of vendor employee base such as drivers and guards and their families to promote health awareness, safety and grooming
Draft for discussion 9
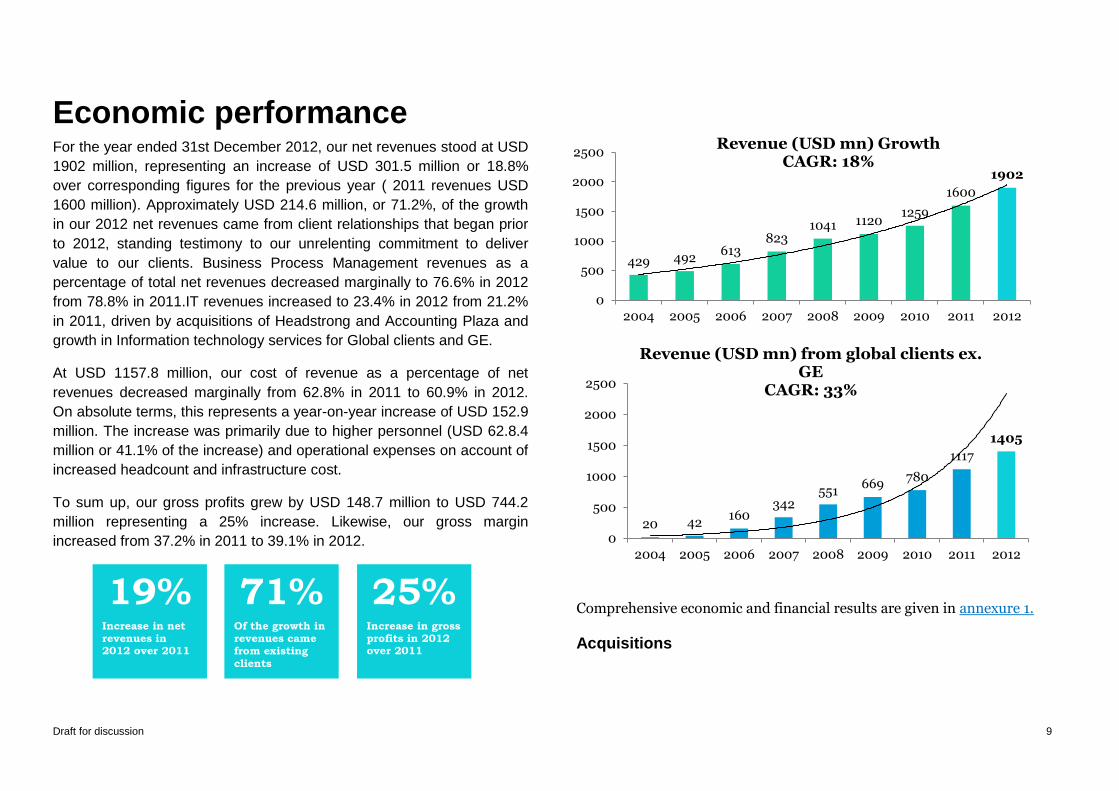
Economic performance For the year ended 31st December 2012, our net revenues stood at USD
1902 million, representing an increase of USD 301.5 million or 18.8%
over corresponding figures for the previous year ( 2011 revenues USD
1600 million). Approximately USD 214.6 million, or 71.2%, of the growth
in our 2012 net revenues came from client relationships that began prior
to 2012, standing testimony to our unrelenting commitment to deliver
value to our clients. Business Process Management revenues as a
percentage of total net revenues decreased marginally to 76.6% in 2012
from 78.8% in 2011.IT revenues increased to 23.4% in 2012 from 21.2%
in 2011, driven by acquisitions of Headstrong and Accounting Plaza and
growth in Information technology services for Global clients and GE.
At USD 1157.8 million, our cost of revenue as a percentage of net
revenues decreased marginally from 62.8% in 2011 to 60.9% in 2012.
On absolute terms, this represents a year-on-year increase of USD 152.9
million. The increase was primarily due to higher personnel (USD 62.8.4
million or 41.1% of the increase) and operational expenses on account of
increased headcount and infrastructure cost.
To sum up, our gross profits grew by USD 148.7 million to USD 744.2
million representing a 25% increase. Likewise, our gross margin
increased from 37.2% in 2011 to 39.1% in 2012.
Comprehensive economic and financial results are given in annexure 1.
Acquisitions
20 42 160
342 551
669 780
1117
1405
0
500
1000
1500
2000
2500
2004 2005 2006 2007 2008 2009 2010 2011 2012
Revenue (USD mn) from global clients ex. GE
CAGR: 33%
19% Increase in net revenues in 2012 over 2011
25% Increase in gross profits in 2012 over 2011
71% Of the growth in revenues came from existing
clients
429 492 613
823 1041 1120
1259
1600
1902
0
500
1000
1500
2000
2500
2004 2005 2006 2007 2008 2009 2010 2011 2012
Revenue (USD mn) Growth CAGR: 18%
Draft for discussion 10
From time to time we may make acquisitions or engage in other strategic
transactions to fill capability gaps and drive growth. We continue to look
for focused, well-run businesses that add to our capabilities.
In April 2012, we acquired Accounting Plaza BV(Accounting
Plaza),a provider of finance and accounting, human resources
and People Soft ERP services
In August 2012, we acquired Triumph Engineering, Corp and
Triumph On-Demand, US based providers of engineering
services to the aviation, energy and oil and gas industries
In September 2012, we acquired Atyati Technologies Private
Limited (‘’Atyati”),a cloud –hosted technology platform provider for
the rural banking sector
Client Focus Our clients include some of the world’s best known companies, many of
them leaders in their respective sectors. GE, our largest client, accounted
for approximately 26.1% of our revenues in fiscal 2012. Some of our
leading Global clients include - AstraZeneca, Aon, BUPA, Cadbury
Schweppes, Genworth Financial, Dollar General, GlaxoSmithKline,
Hertz, Hyatt, Information Resources Inc., Kimberly-Clark, MassMutual
Financial Group, National Australia Bank, Nissan, Symantec, SABMiller,
United Biscuits, Walgreens and Wells Fargo.
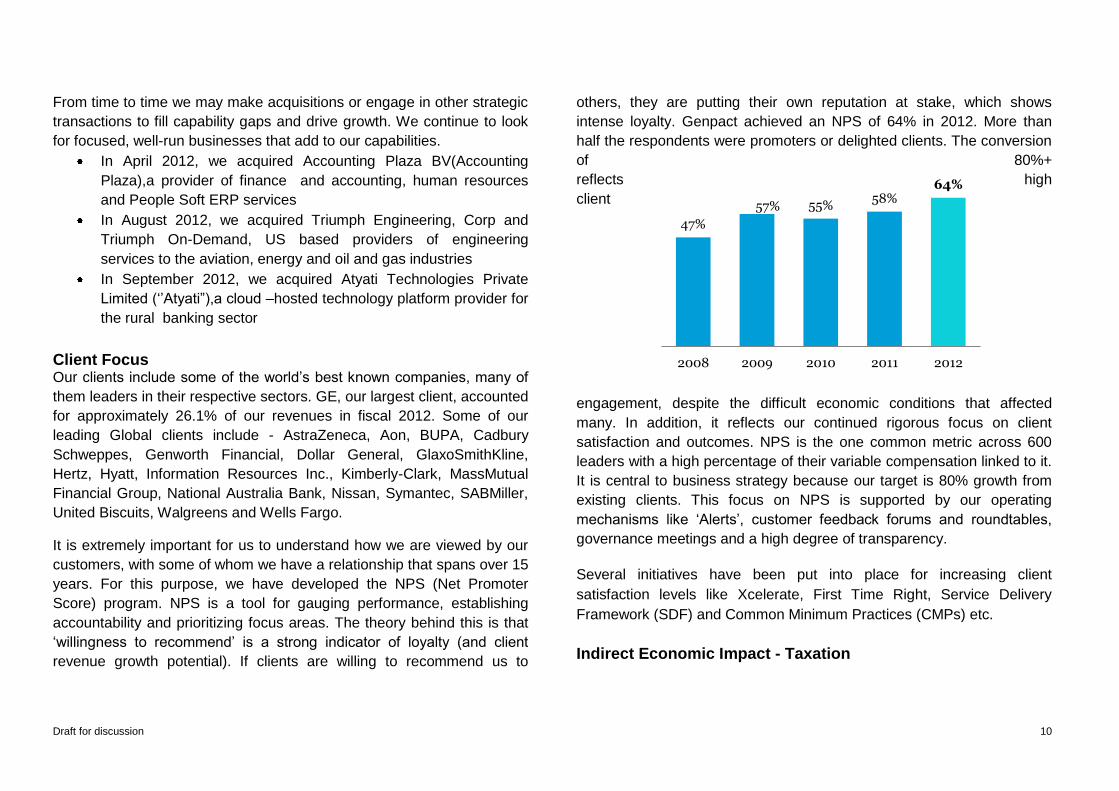
It is extremely important for us to understand how we are viewed by our
customers, with some of whom we have a relationship that spans over 15
years. For this purpose, we have developed the NPS (Net Promoter
Score) program. NPS is a tool for gauging performance, establishing
accountability and prioritizing focus areas. The theory behind this is that
‘willingness to recommend’ is a strong indicator of loyalty (and client
revenue growth potential). If clients are willing to recommend us to
others, they are putting their own reputation at stake, which shows
intense loyalty. Genpact achieved an NPS of 64% in 2012. More than
half the respondents were promoters or delighted clients. The conversion
of 80%+
reflects high
client
engagement, despite the difficult economic conditions that affected
many. In addition, it reflects our continued rigorous focus on client
satisfaction and outcomes. NPS is the one common metric across 600
leaders with a high percentage of their variable compensation linked to it.
It is central to business strategy because our target is 80% growth from
existing clients. This focus on NPS is supported by our operating
mechanisms like ‘Alerts’, customer feedback forums and roundtables,
governance meetings and a high degree of transparency.
Several initiatives have been put into place for increasing client
satisfaction levels like Xcelerate, First Time Right, Service Delivery
Framework (SDF) and Common Minimum Practices (CMPs) etc.
Indirect Economic Impact - Taxation
47%
57% 55% 58%
64%
2008 2009 2010 2011 2012
Draft for discussion 11
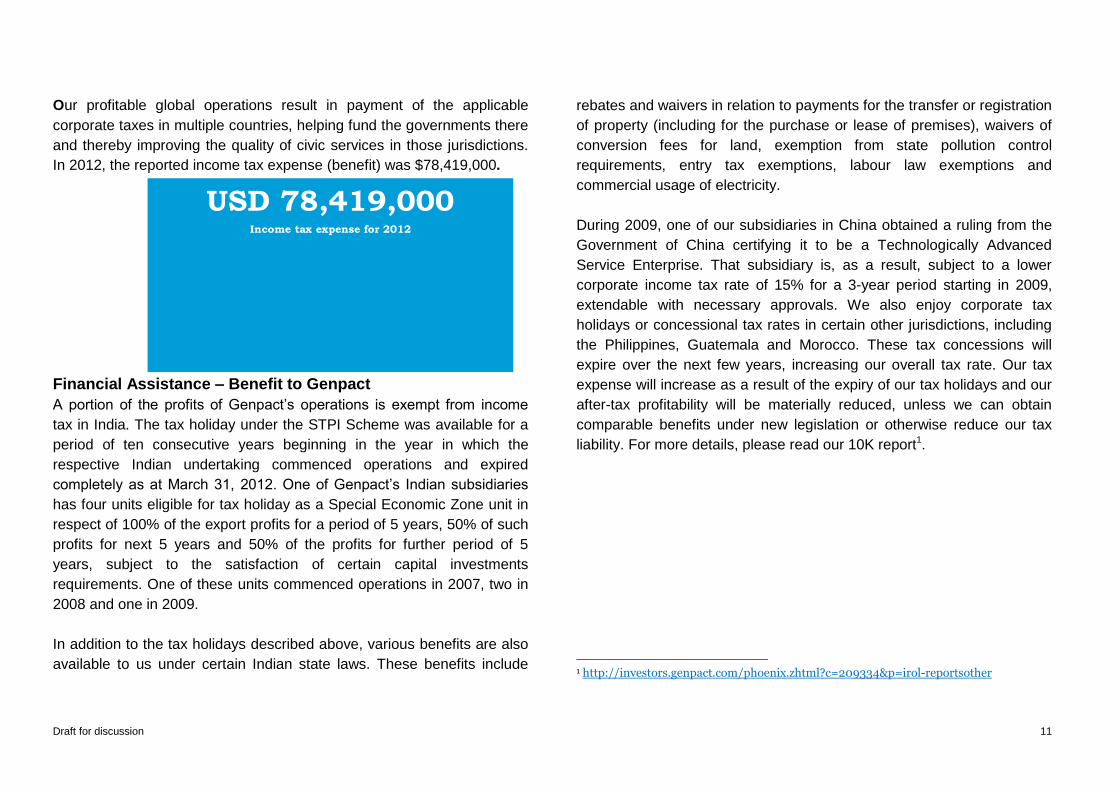
USD 78,419,000 Income tax expense for 2012
Our profitable global operations result in payment of the applicable
corporate taxes in multiple countries, helping fund the governments there
and thereby improving the quality of civic services in those jurisdictions.
In 2012, the reported income tax expense (benefit) was $78,419,000.
Financial Assistance – Benefit to Genpact
A portion of the profits of Genpact’s operations is exempt from income
tax in India. The tax holiday under the STPI Scheme was available for a
period of ten consecutive years beginning in the year in which the
respective Indian undertaking commenced operations and expired
completely as at March 31, 2012. One of Genpact’s Indian subsidiaries
has four units eligible for tax holiday as a Special Economic Zone unit in
respect of 100% of the export profits for a period of 5 years, 50% of such
profits for next 5 years and 50% of the profits for further period of 5
years, subject to the satisfaction of certain capital investments
requirements. One of these units commenced operations in 2007, two in
2008 and one in 2009.
In addition to the tax holidays described above, various benefits are also
available to us under certain Indian state laws. These benefits include
rebates and waivers in relation to payments for the transfer or registration
of property (including for the purchase or lease of premises), waivers of
conversion fees for land, exemption from state pollution control
requirements, entry tax exemptions, labour law exemptions and
commercial usage of electricity.
During 2009, one of our subsidiaries in China obtained a ruling from the
Government of China certifying it to be a Technologically Advanced
Service Enterprise. That subsidiary is, as a result, subject to a lower
corporate income tax rate of 15% for a 3-year period starting in 2009,
extendable with necessary approvals. We also enjoy corporate tax
holidays or concessional tax rates in certain other jurisdictions, including
the Philippines, Guatemala and Morocco. These tax concessions will
expire over the next few years, increasing our overall tax rate. Our tax
expense will increase as a result of the expiry of our tax holidays and our
after-tax profitability will be materially reduced, unless we can obtain
comparable benefits under new legislation or otherwise reduce our tax
liability. For more details, please read our 10K report1.
1 http://investors.genpact.com/phoenix.zhtml?c=209334&p=irol-reportsother
Draft for discussion 12
People performance
There are two prime focus areas of our people practices:
Genpact is an equal opportunity employer promoting diversity across
geographies. Genpact is focused on HR best practices which are an
industry benchmark. Standardization of HR policies has been the focus
area and the policies are uniform across locations to the extent possible.
Through our collaborative programs we ensure the availability of a steady
stream of people for recruiting. Our focus on diversity and fair
employment helps us recruit and retain a diverse bunch of people
spanning many nationalities, physical capabilities, and gender balance.
Performance Management, growth in terms of learning, role
enhancement, up-skilling through elaborate trainings modules and
platforms such as Education@Work are the cornerstones on which the
people practice edifice is built. YES and Caring@Genpact, both act as
employee engagement initiatives, helping our employees work for a
higher purpose. Our GOLD programme serves as a platform for
developing crucial leadership skills.
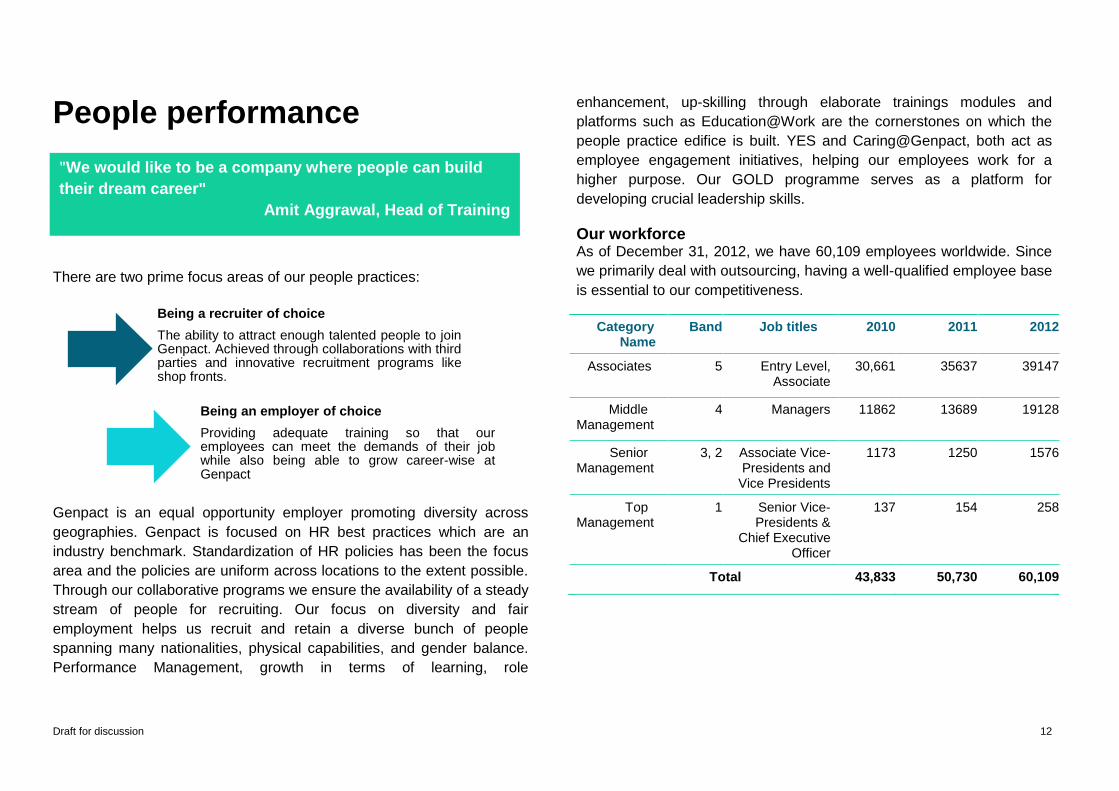
Our workforce As of December 31, 2012, we have 60,109 employees worldwide. Since
we primarily deal with outsourcing, having a well-qualified employee base
is essential to our competitiveness.
Category Name
Band Job titles 2010 2011 2012
Associates 5 Entry Level, Associate
30,661 35637
39147
Middle Management
4 Managers 11862
13689
19128
Senior Management
3, 2 Associate Vice-Presidents and
Vice Presidents
1173
1250
1576
Top Management
1 Senior Vice-Presidents &
Chief Executive Officer
137 154 258
Total 43,833 50,730 60,109
Being a recruiter of choice
The ability to attract enough talented people to join Genpact. Achieved through collaborations with third parties and innovative recruitment programs like shop fronts.
Being an employer of choice
Providing adequate training so that our employees can meet the demands of their job while also being able to grow career-wise at Genpact
"We would like to be a company where people can build
their dream career"
Amit Aggrawal, Head of Training
Draft for discussion 13
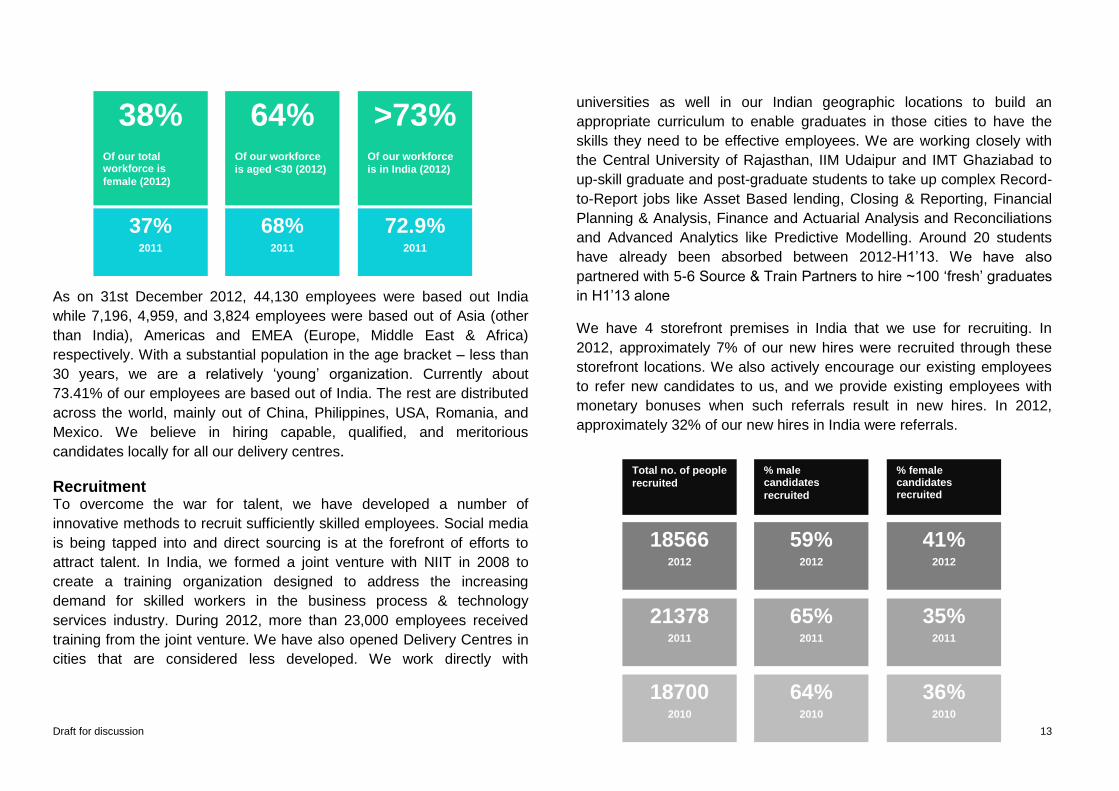
As on 31st December 2012, 44,130 employees were based out India
while 7,196, 4,959, and 3,824 employees were based out of Asia (other
than India), Americas and EMEA (Europe, Middle East & Africa)
respectively. With a substantial population in the age bracket – less than
30 years, we are a relatively ‘young’ organization. Currently about
73.41% of our employees are based out of India. The rest are distributed
across the world, mainly out of China, Philippines, USA, Romania, and
Mexico. We believe in hiring capable, qualified, and meritorious
candidates locally for all our delivery centres.
Recruitment To overcome the war for talent, we have developed a number of
innovative methods to recruit sufficiently skilled employees. Social media
is being tapped into and direct sourcing is at the forefront of efforts to
attract talent. In India, we formed a joint venture with NIIT in 2008 to
create a training organization designed to address the increasing
demand for skilled workers in the business process & technology
services industry. During 2012, more than 23,000 employees received
training from the joint venture. We have also opened Delivery Centres in
cities that are considered less developed. We work directly with
universities as well in our Indian geographic locations to build an
appropriate curriculum to enable graduates in those cities to have the
skills they need to be effective employees. We are working closely with
the Central University of Rajasthan, IIM Udaipur and IMT Ghaziabad to
up-skill graduate and post-graduate students to take up complex Record-
to-Report jobs like Asset Based lending, Closing & Reporting, Financial
Planning & Analysis, Finance and Actuarial Analysis and Reconciliations
and Advanced Analytics like Predictive Modelling. Around 20 students
have already been absorbed between 2012-H1’13. We have also
partnered with 5-6 Source & Train Partners to hire ~100 ‘fresh’ graduates
in H1’13 alone
We have 4 storefront premises in India that we use for recruiting. In
2012, approximately 7% of our new hires were recruited through these
storefront locations. We also actively encourage our existing employees
to refer new candidates to us, and we provide existing employees with
monetary bonuses when such referrals result in new hires. In 2012,
approximately 32% of our new hires in India were referrals.
38% Of our total workforce is
female (2012)
>73% Of our workforce
is in India (2012)
64% Of our workforce
is aged <30 (2012)
37% 2011
72.9% 2011
68% 2011
Total no. of people
recruited
% female candidates recruited
% male candidates
recruited
18566 2012
41% 2012
59% 2012
21378 2011
35% 2011
65% 2011
18700 2010
36% 2010
64% 2010
Draft for discussion 14
Building a sustainable talent eco-system - a case study
Our geographical footprint while providing access to global talent, also
requires us to constantly innovate and solve different kinds of
challenges locally to meet manpower requirements
This led to the launch of a global transformation project “Program
Gateway & Build” in 2011. The project is positioned to help Genpact
remain ahead in the “War for Talent” by building a self-sustaining
Talent ecosystem so that it bridges the gap between employability and
the increasing talent deficit.
As a part of the project, we have launched skill-building programs
across domains to feed into the talent pipeline in strong collaboration
with the Government, Universities and Private Training Institutions. We
leveraged this to train candidates for skills where the business foresees
growth and shortage of ready-made talent, thus creating a symbiotic
eco-system for a sustainable talent supply.
The Project created value in the following ways:
For the Community: To create employability through skill-
building where there is an opportunity .
For the Organization & Customer: To build a ready supply
chain and widen talent pool for growth.
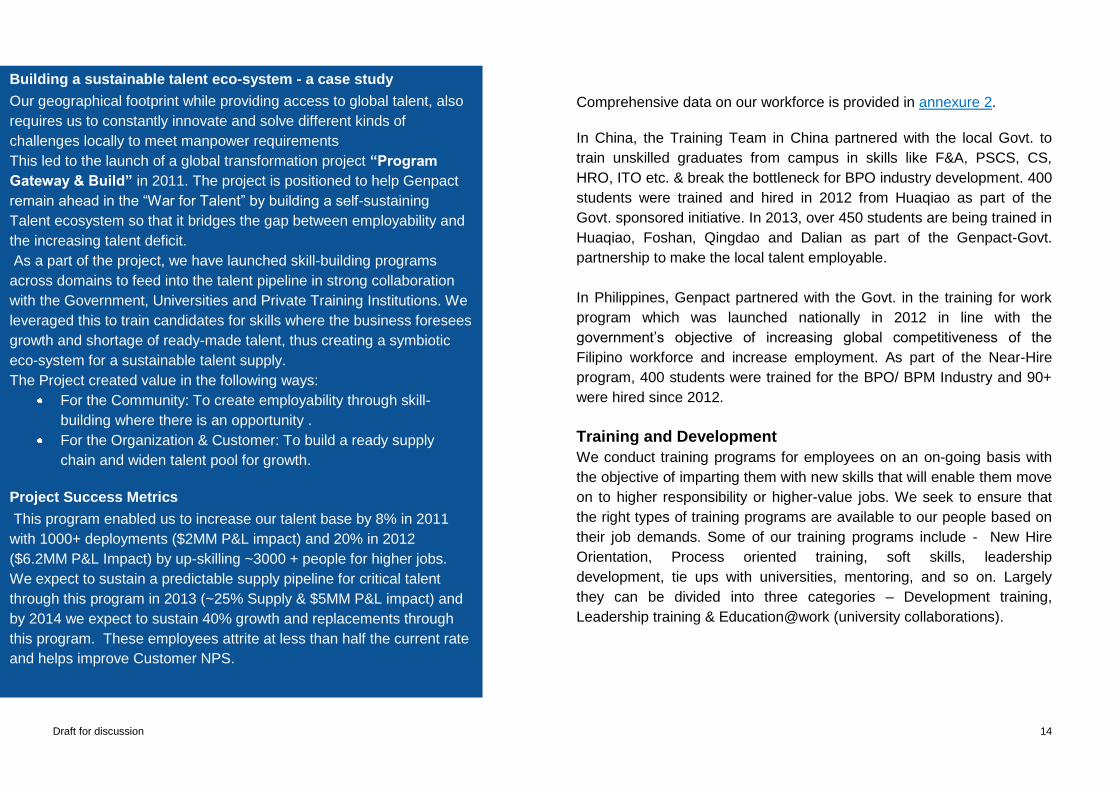
Project Success Metrics
This program enabled us to increase our talent base by 8% in 2011
with 1000+ deployments ($2MM P&L impact) and 20% in 2012
($6.2MM P&L Impact) by up-skilling ~3000 + people for higher jobs.
We expect to sustain a predictable supply pipeline for critical talent
through this program in 2013 (~25% Supply & $5MM P&L impact) and
by 2014 we expect to sustain 40% growth and replacements through
this program. These employees attrite at less than half the current rate
and helps improve Customer NPS.
Comprehensive data on our workforce is provided in annexure 2.
In China, the Training Team in China partnered with the local Govt. to
train unskilled graduates from campus in skills like F&A, PSCS, CS,
HRO, ITO etc. & break the bottleneck for BPO industry development. 400
students were trained and hired in 2012 from Huaqiao as part of the
Govt. sponsored initiative. In 2013, over 450 students are being trained in
Huaqiao, Foshan, Qingdao and Dalian as part of the Genpact-Govt.
partnership to make the local talent employable.
In Philippines, Genpact partnered with the Govt. in the training for work
program which was launched nationally in 2012 in line with the
government’s objective of increasing global competitiveness of the
Filipino workforce and increase employment. As part of the Near-Hire
program, 400 students were trained for the BPO/ BPM Industry and 90+
were hired since 2012.
Training and Development
We conduct training programs for employees on an on-going basis with
the objective of imparting them with new skills that will enable them move
on to higher responsibility or higher-value jobs. We seek to ensure that
the right types of training programs are available to our people based on
their job demands. Some of our training programs include - New Hire
Orientation, Process oriented training, soft skills, leadership
development, tie ups with universities, mentoring, and so on. Largely
they can be divided into three categories – Development training,
Leadership training & Education@work (university collaborations).
Draft for discussion 15
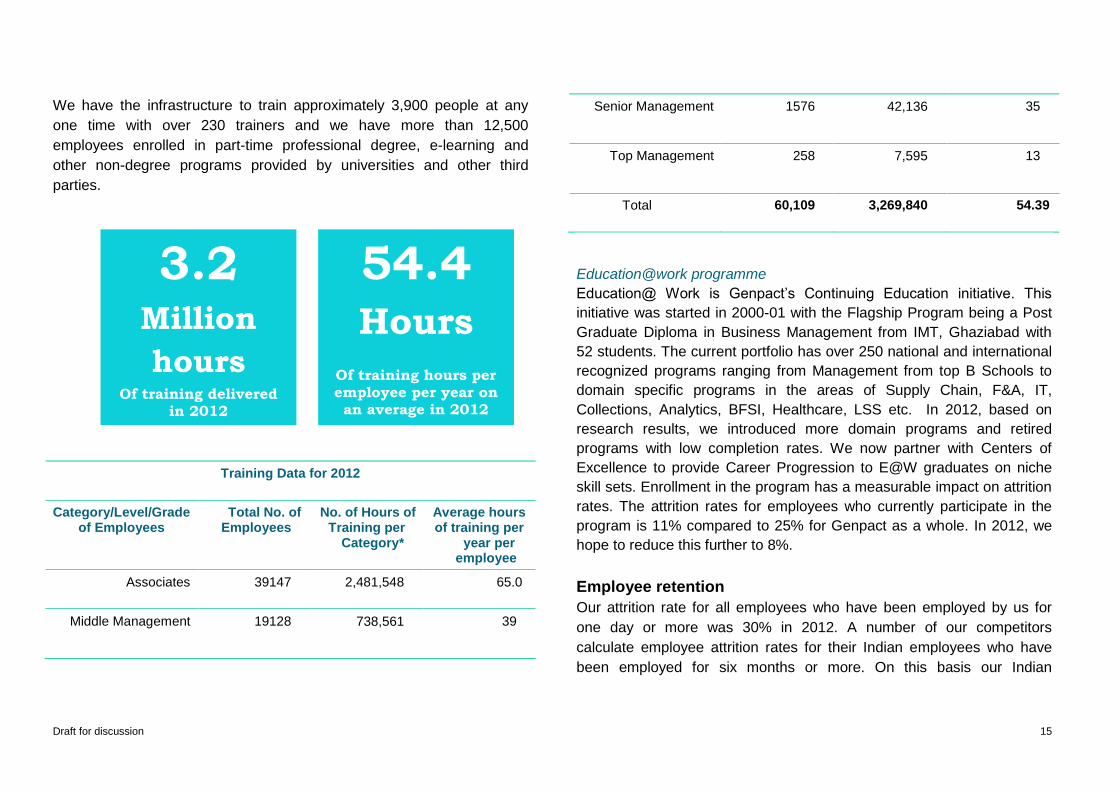
We have the infrastructure to train approximately 3,900 people at any
one time with over 230 trainers and we have more than 12,500
employees enrolled in part-time professional degree, e-learning and
other non-degree programs provided by universities and other third
parties.
Training Data for 2012
Category/Level/Grade of Employees
Total No. of Employees
No. of Hours of Training per
Category*
Average hours of training per
year per employee
Associates 39147 2,481,548 65.0
Middle Management 19128 738,561
39
Senior Management 1576 42,136
35
Top Management 258 7,595
13
Total 60,109 3,269,840 54.39
Education@work programme
Education@ Work is Genpact’s Continuing Education initiative. This
initiative was started in 2000-01 with the Flagship Program being a Post
Graduate Diploma in Business Management from IMT, Ghaziabad with
52 students. The current portfolio has over 250 national and international
recognized programs ranging from Management from top B Schools to
domain specific programs in the areas of Supply Chain, F&A, IT,
Collections, Analytics, BFSI, Healthcare, LSS etc. In 2012, based on
research results, we introduced more domain programs and retired
programs with low completion rates. We now partner with Centers of
Excellence to provide Career Progression to E@W graduates on niche
skill sets. Enrollment in the program has a measurable impact on attrition
rates. The attrition rates for employees who currently participate in the
program is 11% compared to 25% for Genpact as a whole. In 2012, we
hope to reduce this further to 8%.
Employee retention
Our attrition rate for all employees who have been employed by us for
one day or more was 30% in 2012. A number of our competitors
calculate employee attrition rates for their Indian employees who have
been employed for six months or more. On this basis our Indian
3.2 Million
hours Of training delivered
in 2012
54.4 Hours
Of training hours per employee per year on an average in 2012
Draft for discussion 16
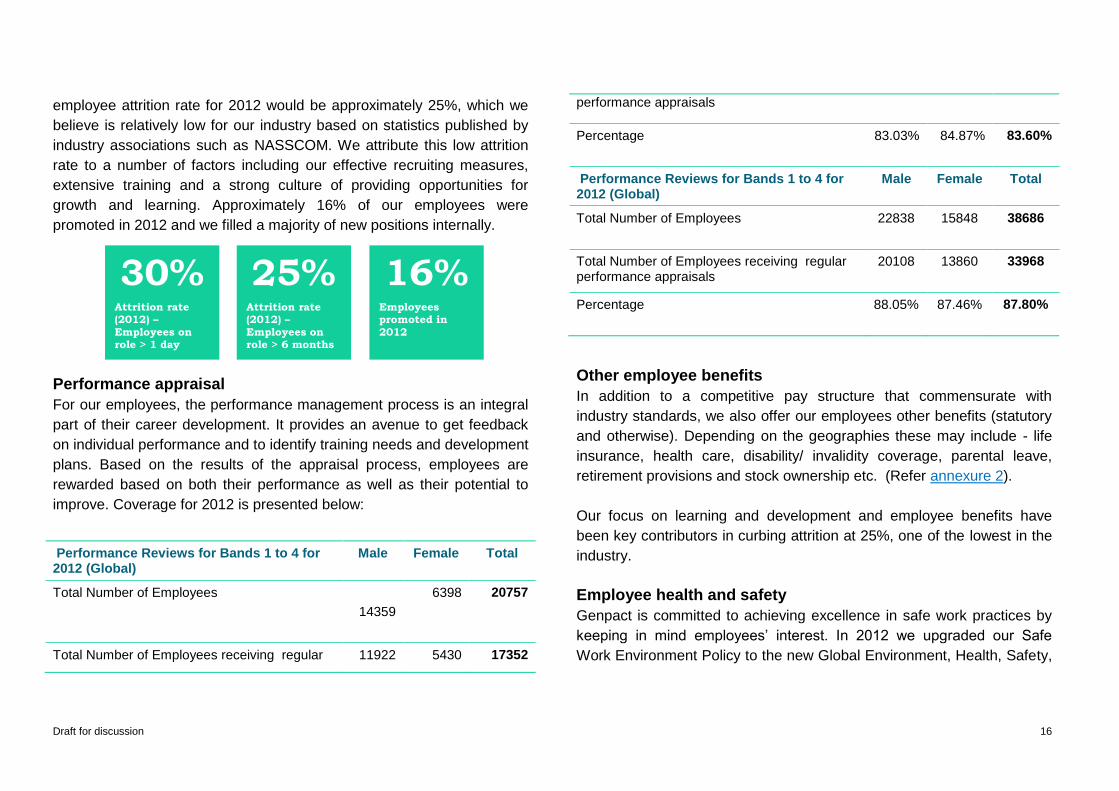
employee attrition rate for 2012 would be approximately 25%, which we
believe is relatively low for our industry based on statistics published by
industry associations such as NASSCOM. We attribute this low attrition
rate to a number of factors including our effective recruiting measures,
extensive training and a strong culture of providing opportunities for
growth and learning. Approximately 16% of our employees were
promoted in 2012 and we filled a majority of new positions internally.
Performance appraisal
For our employees, the performance management process is an integral
part of their career development. It provides an avenue to get feedback
on individual performance and to identify training needs and development
plans. Based on the results of the appraisal process, employees are
rewarded based on both their performance as well as their potential to
improve. Coverage for 2012 is presented below:
Performance Reviews for Bands 1 to 4 for 2012 (Global)
Male Female Total
Total Number of Employees
14359
6398
20757
Total Number of Employees receiving regular 11922 5430 17352
performance appraisals
Percentage 83.03%
84.87%
83.60%
Performance Reviews for Bands 1 to 4 for 2012 (Global)
Male Female Total
Total Number of Employees 22838
15848
38686
Total Number of Employees receiving regular performance appraisals
20108
13860
33968
Percentage 88.05%
87.46%
87.80%
Other employee benefits
In addition to a competitive pay structure that commensurate with
industry standards, we also offer our employees other benefits (statutory
and otherwise). Depending on the geographies these may include - life
insurance, health care, disability/ invalidity coverage, parental leave,
retirement provisions and stock ownership etc. (Refer annexure 2).
Our focus on learning and development and employee benefits have
been key contributors in curbing attrition at 25%, one of the lowest in the
industry.
Employee health and safety
Genpact is committed to achieving excellence in safe work practices by
keeping in mind employees’ interest. In 2012 we upgraded our Safe
Work Environment Policy to the new Global Environment, Health, Safety,
30% Attrition rate (2012) –
Employees on role > 1 day
16% Employees promoted in
2012
25% Attrition rate (2012) –
Employees on role > 6 months
Draft for discussion 17
and Sustainability Policy. The policy was launched in January 2012 and
is displayed and communicated across all our locations. All our major
Global operating sites (primarily India, China, Mexico, EMEA, and
Philippines) are OHSAS 18001-2007 certified which will enable us to
identify hazards in our operations and minimize any health and safety
risks.
As an IT and ITES company our focus largely rests on occupational
health and ergonomic related conditions (e.g. Repetitive Strain
Syndrome, lower back pain, and wrist sprains etc). All our employees
undergo two mandatory online courses – one on office ergonomics and
another on EHS awareness. Apart from these, there are other optional
courses available both online and in-practice. Courses on Defensive
Driving, First Aid and Life Saving Skills, Ergo Champion, Fire Fighting are
a few examples. All our operating sites have medical facilities fully
equipped for medical emergency, first aid, and basic illnesses like
fainting, abdominal pains, shortness of breath, seizures, etc. Our medical
centres are staffed 24X7 by nurses and doctors are available for about 8-
10 hours a day based on employee timings. Any safety concern can be
emailed to @GenpactEHSGlobal or the Site Logistics Leader or the Site
EHS leader can be informed about the unsafe condition. All such
concerns are investigated and due action taken.
Diversity and inclusion
We are a globally diverse organization across multiple dimensions. Our
focus is to create the right environment, level playing field and support
structure to enable a gender diverse work to equally participate, succeed
and rise to positions of leadership in the organization based on their
merit.
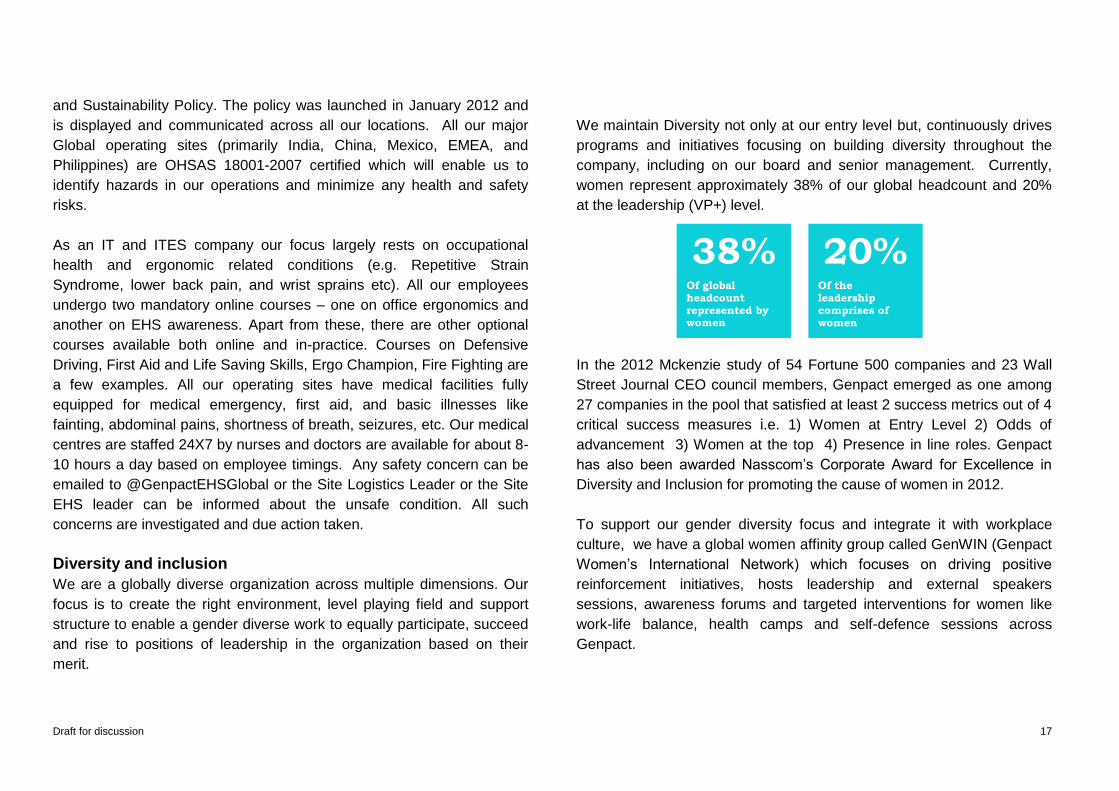
We maintain Diversity not only at our entry level but, continuously drives
programs and initiatives focusing on building diversity throughout the
company, including on our board and senior management. Currently,
women represent approximately 38% of our global headcount and 20%
at the leadership (VP+) level.
In the 2012 Mckenzie study of 54 Fortune 500 companies and 23 Wall
Street Journal CEO council members, Genpact emerged as one among
27 companies in the pool that satisfied at least 2 success metrics out of 4
critical success measures i.e. 1) Women at Entry Level 2) Odds of
advancement 3) Women at the top 4) Presence in line roles. Genpact
has also been awarded Nasscom’s Corporate Award for Excellence in
Diversity and Inclusion for promoting the cause of women in 2012.
To support our gender diversity focus and integrate it with workplace
culture, we have a global women affinity group called GenWIN (Genpact
Women’s International Network) which focuses on driving positive
reinforcement initiatives, hosts leadership and external speakers
sessions, awareness forums and targeted interventions for women like
work-life balance, health camps and self-defence sessions across
Genpact.
38% Of global headcount represented by women
20% Of the leadership comprises of women
Draft for discussion 18
Genpact is proud to engage people with disabilities including the
orthopedically challenged, hearing, and visually impaired. These
employees are all engaged with different operations and functions,
ranging from accounting, insurance, and customer care to hiring and HR
shared services. Some of our visually-impaired employees have been
with us for more than 3 years and have grown from an associate level to
middle management positions, handling different roles and
responsibilities and even leading teams. The company employs 38
differentially-abled personnel at our delivery centres (2012).
Human rights One of our core beliefs is that we grow when our people grow, and that
such growth is ensured through strong Fair Employment Practices. We
works hard to provide its employees with a workplace free of
harassment, and requires that all decisions relating to employment be
made on the basis of merit, which protects the rights of minorities and all
protected classes of people.
Fair Employment Policy
We are committed to observing all applicable labour and employment
laws wherever we operate. That includes observing those laws that
pertain to privacy, the prohibition of forced, compulsory and child labour,
and those laws that pertain to the elimination of any improper
employment discrimination. Irrespective of the country, we observe the
following globally:
• We do not tolerate nepotism or adverse bias
• Merit, qualifications (for example, education, experience, or skill
sets) and other job-related criteria are the sole basis for all employment
related decisions affecting employees and applicants
• No allowances are given to any discriminatory practices
regardless of what cultural practices may persist in the wider society
• Our goal is to maintain a congenial and productive working
environment conducive for all
Prevention of discrimination and harassment
Genpact prohibits basing any employment decisions on race, colour,
religion, sex, caste, sexual orientation, national or regional origin, or any
other characteristic protected by law. Genpact's Policy is to use merit,
qualifications, job-related and other criteria sanctioned by our Human
Resources function as the basis for all employment-related decisions.
Where harassment occurs as a result of an act or omission by any third
party or outsider, we are committed to take all steps that are reasonable
and appropriate to prevent the harassment from continuing.
Avoidance of child and forced labour
As a part of our Fair Employment Policy, employment of any or all forms
of forced, compulsory and child labour either directly or through
contractors are strictly prohibited. We endeavour to ensure that age
criteria as per laws are met by the company and the contractors we hire.
Accordingly, we have put in place procedures for background checks and
age verification.
Freedom of association
We do not prevent any employee from exercising the right to freedom of
association or collective bargaining. In many countries, local law
guarantees collective bargaining. In most of the countries however
Genpact is not a union based environment. We adhere to all necessary
regulations in the regions in which we operate. In Brazil and the Czech
Republic, 100% of our employees are trade union association members.
Draft for discussion 19
In Romania we have employee representatives instead of a trade union
and 100% of our employees are covered under it.
Investment screening
Before we take a decision to acquire a company or a stake in it, we
conduct a thorough due diligence process. This includes checking for
statutory compliances, employee welfare benefits, human resource
compensation and benefits, leave policy, bonus policy, policy related to
salary increases, etc. There are largely no issues relating to child/forced
labour in our acquisitions.
Protection of personal information of employees
We respect employee privacy and the sanctity of personal information or
communication stored in official systems. Such information is accessed
only for business reasons such as - in the course of performing
maintenance, when investigating a problem or concern or in response to
a legal request for such information etc. Due notice is given to employees
in such cases.
Human rights in supply chain
All new vendors undergo an extensive Environment Health & Safety
(EHS) audit which also checks compliance with labour laws prohibiting
child and forced Labour. Our legal teams check compliance with statutory
requirements. Screening processes like police verification, background
checks, etc. are also conducted. This forms the basic level of pre-
qualification. We expect 100% compliance to all applicable EHS
guidelines and regulatory requirements. If a serious violation of our
integrity rules including EHS rules and regulations occurs, the vendor (or
an employee of the vendor) will be suspended or dismissed.
Draft for discussion 20
Environmental performance Our BPO/ITES specific Environmental Policy was developed in 2006; this
was subsequently followed-up with an ‘Eco-transformation Roadmap’ in
2007. The roadmap consisted of three phases: achieving ISO 14001
(Environment Management System) certification, capturing and analysing
the carbon footprint of our India locations and implementing energy and
environment conservation programmes to reduce this carbon footprint.
The program achieved intended results – our Carbon footprint and
energy costs were reduced significantly. In January 2012, we took the
next step by drafting of a Global “Environment Health Safety &
Sustainability policy” (EHS&S) policy.
Environmental Compliance We ensure compliance to all established regulatory standards for air
pollution (E.g., ozone depleting substances, NOx, SOx emissions, etc. –
primary source air pollution from our operations – DG sets)., noise
pollution, effluent quality, etc. We have been compliant with all
surveillance audits. We have recorded no instances of exceeding limits
so far in all our facilities. We monitor our indoor air quality performance
thrice a year, in-line with necessary standards, and maintain good indoor
air quality standards.
Resource Conservation
We have set our own internal objectives and targets on specific
environmental standards. We have adopted a strategy to adopt Green
Building designs for all our newly constructed (owned) and leased sites
where feasible. We have also invested in latest technologies to improve
our energy efficiency and minimize environmental releases. We carry out
ongoing campaigns to recycle, reduce waste, and conserve energy. By
focusing on green sourcing our equipment, and the green IT and
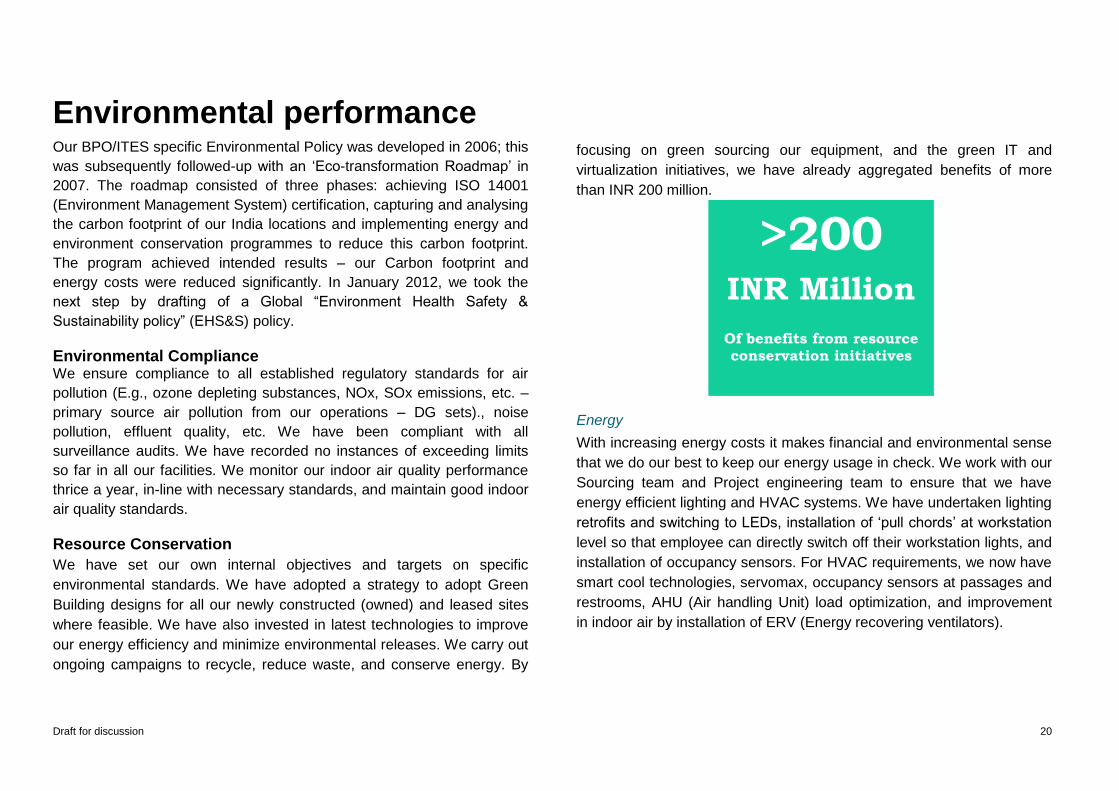
virtualization initiatives, we have already aggregated benefits of more
than INR 200 million.
Energy
With increasing energy costs it makes financial and environmental sense
that we do our best to keep our energy usage in check. We work with our
Sourcing team and Project engineering team to ensure that we have
energy efficient lighting and HVAC systems. We have undertaken lighting
retrofits and switching to LEDs, installation of ‘pull chords’ at workstation
level so that employee can directly switch off their workstation lights, and
installation of occupancy sensors. For HVAC requirements, we now have
smart cool technologies, servomax, occupancy sensors at passages and
restrooms, AHU (Air handling Unit) load optimization, and improvement
in indoor air by installation of ERV (Energy recovering ventilators).
>200 INR Million
Of benefits from resource conservation initiatives
Draft for discussion 21
60 59
69 72
0
10
20
30
40
50
60
70
80
2009 2010 2011 2012
Indirect Energy Consumption for Operations in India (GWh)
Apart from this we also endeavour to make our buildings more energy
efficient both through retrofits and by consolidating small and old sites to
bigger and more efficient sites. We have also used renewable energy
source like solar power for heating water at a residential building in one
of our campuses.
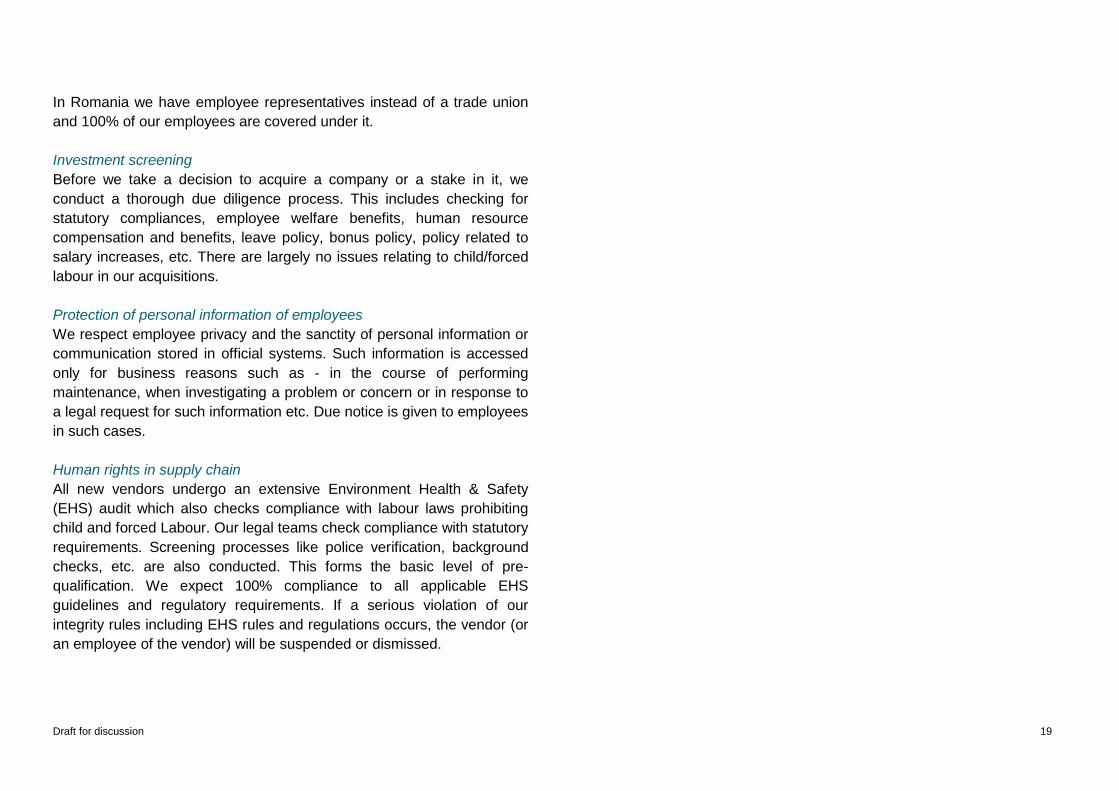
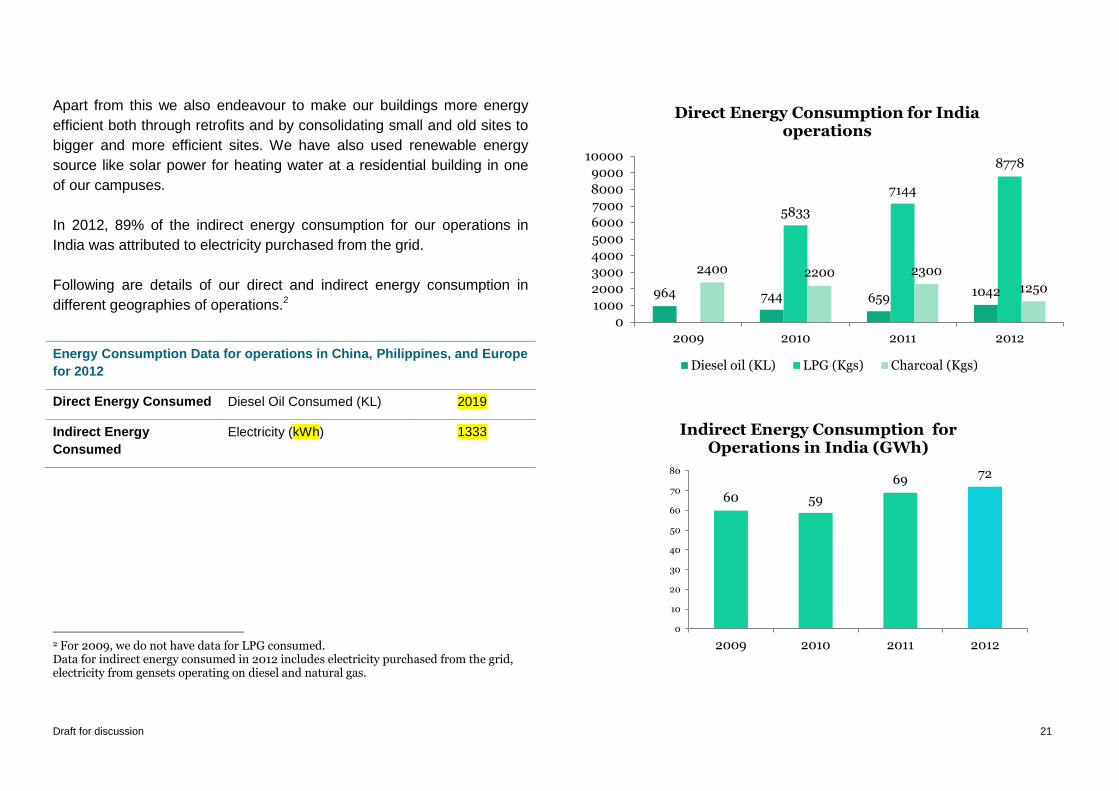
In 2012, 89% of the indirect energy consumption for our operations in
India was attributed to electricity purchased from the grid.
Following are details of our direct and indirect energy consumption in
different geographies of operations.2
Energy Consumption Data for operations in China, Philippines, and Europe
for 2012
Direct Energy Consumed Diesel Oil Consumed (KL) 2019
Indirect Energy
Consumed
Electricity (kWh) 1333
2 For 2009, we do not have data for LPG consumed. Data for indirect energy consumed in 2012 includes electricity purchased from the grid, electricity from gensets operating on diesel and natural gas.
964 744 659 1042
5833
7144
8778
2400 2200 2300
1250
0
1000
2000
3000
4000
5000
6000
7000
8000
9000
10000
2009 2010 2011 2012
Direct Energy Consumption for India operations
Diesel oil (KL) LPG (Kgs) Charcoal (Kgs)
Draft for discussion 22
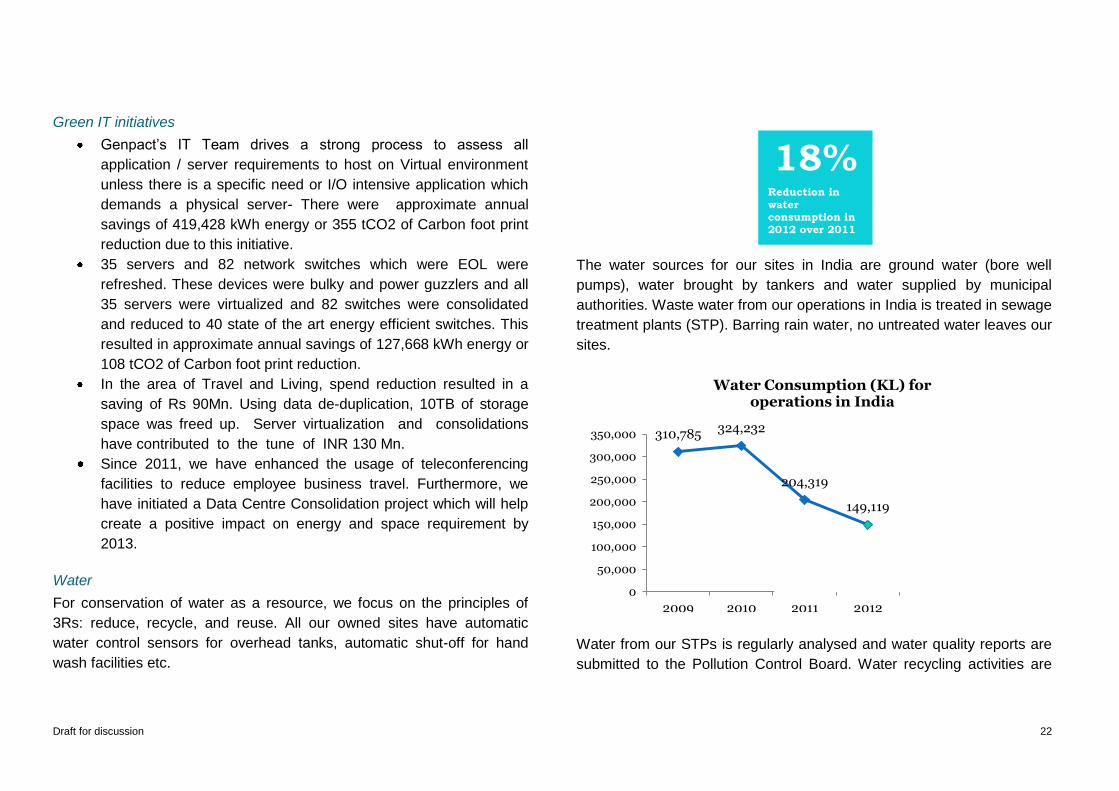
310,785 324,232
204,319
149,119
0
50,000
100,000
150,000
200,000
250,000
300,000
350,000
2009 2010 2011 2012
Water Consumption (KL) for operations in India
Green IT initiatives
Genpact’s IT Team drives a strong process to assess all
application / server requirements to host on Virtual environment
unless there is a specific need or I/O intensive application which
demands a physical server- There were approximate annual
savings of 419,428 kWh energy or 355 tCO2 of Carbon foot print
reduction due to this initiative.
35 servers and 82 network switches which were EOL were
refreshed. These devices were bulky and power guzzlers and all
35 servers were virtualized and 82 switches were consolidated
and reduced to 40 state of the art energy efficient switches. This
resulted in approximate annual savings of 127,668 kWh energy or
108 tCO2 of Carbon foot print reduction.
In the area of Travel and Living, spend reduction resulted in a
saving of Rs 90Mn. Using data de-duplication, 10TB of storage
space was freed up. Server virtualization and consolidations
have contributed to the tune of INR 130 Mn.
Since 2011, we have enhanced the usage of teleconferencing
facilities to reduce employee business travel. Furthermore, we
have initiated a Data Centre Consolidation project which will help
create a positive impact on energy and space requirement by
2013.
Water
For conservation of water as a resource, we focus on the principles of
3Rs: reduce, recycle, and reuse. All our owned sites have automatic
water control sensors for overhead tanks, automatic shut-off for hand
wash facilities etc.
The water sources for our sites in India are ground water (bore well
pumps), water brought by tankers and water supplied by municipal
authorities. Waste water from our operations in India is treated in sewage
treatment plants (STP). Barring rain water, no untreated water leaves our
sites.
Water from our STPs is regularly analysed and water quality reports are
submitted to the Pollution Control Board. Water recycling activities are
18% Reduction in
water consumption in 2012 over 2011
Draft for discussion 23
being carried out at our owned sites and are used for landscaping,
flushing, etc in our global sites, the waste water leaving our operations
flow into communal or local sewage treatment facilities. In such cases we
do not measure water recycling figures. Our focus for the next few years
is to map our water consumption pan India. We will also focus on
monitoring consumption against regional benchmarks. We also plan to
establish sewage treatment plants and adopt rain water harvesting
strategies in all our own buildings and leased buildings where possible.
Since 2011, we have started measuring water consumption in some of
our Global sites. The water consumption for our sites in China,
Philippines, and Europe in 2012 is 44849 KL. The total water
consumption figure in 2012 has been taken for owned sites and leased
sites-single tenant facilities since metered water monitoring mechanisms
are in place in these sites.
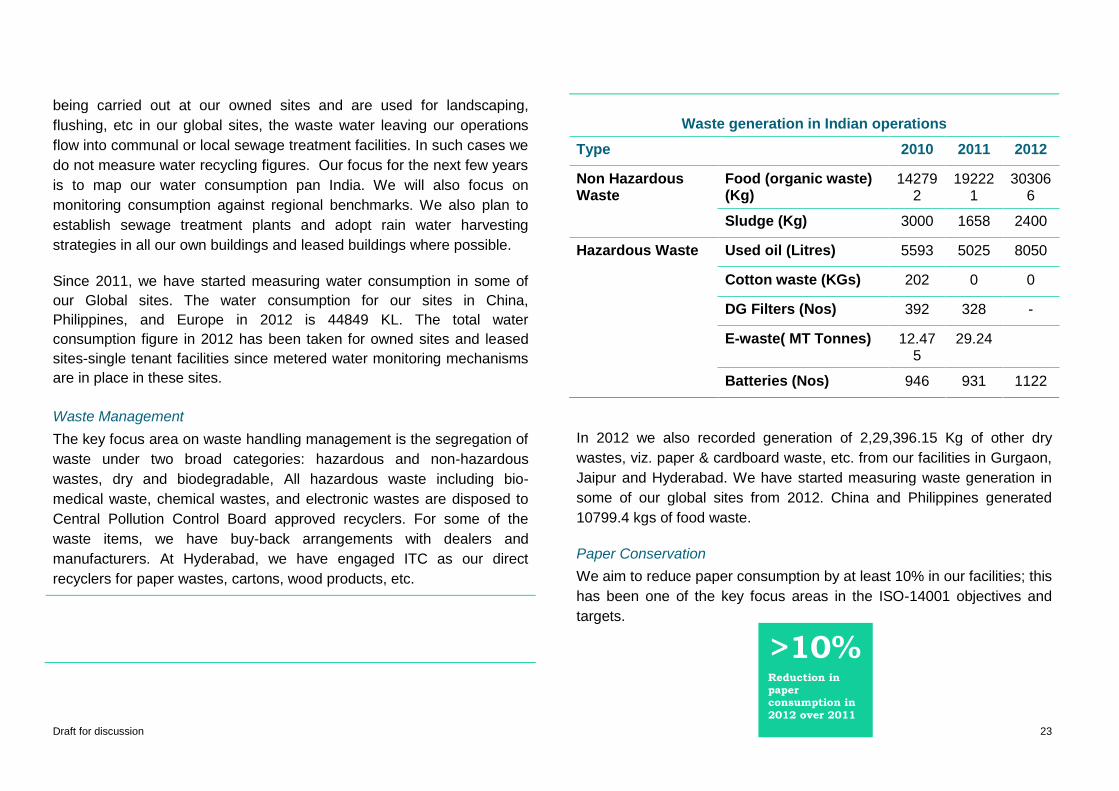
Waste Management
The key focus area on waste handling management is the segregation of
waste under two broad categories: hazardous and non-hazardous
wastes, dry and biodegradable, All hazardous waste including bio-
medical waste, chemical wastes, and electronic wastes are disposed to
Central Pollution Control Board approved recyclers. For some of the
waste items, we have buy-back arrangements with dealers and
manufacturers. At Hyderabad, we have engaged ITC as our direct
recyclers for paper wastes, cartons, wood products, etc.
Waste generation in Indian operations
Type 2010 2011 2012
Non Hazardous Waste
Food (organic waste) (Kg)
142792
192221
303066
Sludge (Kg) 3000 1658 2400
Hazardous Waste Used oil (Litres) 5593 5025 8050
Cotton waste (KGs) 202 0 0
DG Filters (Nos) 392 328 -
E-waste( MT Tonnes) 12.475
29.24
Batteries (Nos) 946 931 1122
In 2012 we also recorded generation of 2,29,396.15 Kg of other dry
wastes, viz. paper & cardboard waste, etc. from our facilities in Gurgaon,
Jaipur and Hyderabad. We have started measuring waste generation in
some of our global sites from 2012. China and Philippines generated
10799.4 kgs of food waste.
Paper Conservation
We aim to reduce paper consumption by at least 10% in our facilities; this
has been one of the key focus areas in the ISO-14001 objectives and
targets.
>10% Reduction in paper consumption in
2012 over 2011
Draft for discussion 24
0.31 0.05 0.07
1.81
1.61 1.73
1.63
1.47 1.61
0.00
0.50
1.00
1.50
2.00
2.50
3.00
3.50
4.00
2008 2011 2012
GHG emissions (tCO2) per employee per year
Scope 3
Scope 2
Scope 1
Programs like – Minus One (Reducing the font size to 1 unit for paper
efficiency, online bills, back to back printing, promoting ceramic/reusable
cups to disposable, etc. are our key drivers for paper reduction. Other
initiatives include sending communication splashes to all employees to
minimise paper usage, maximising the use of soft copies for office
transactions, printing on both sides of the paper, restricted distribution of
stationery, and reducing the usage of paper towels in all facilities.
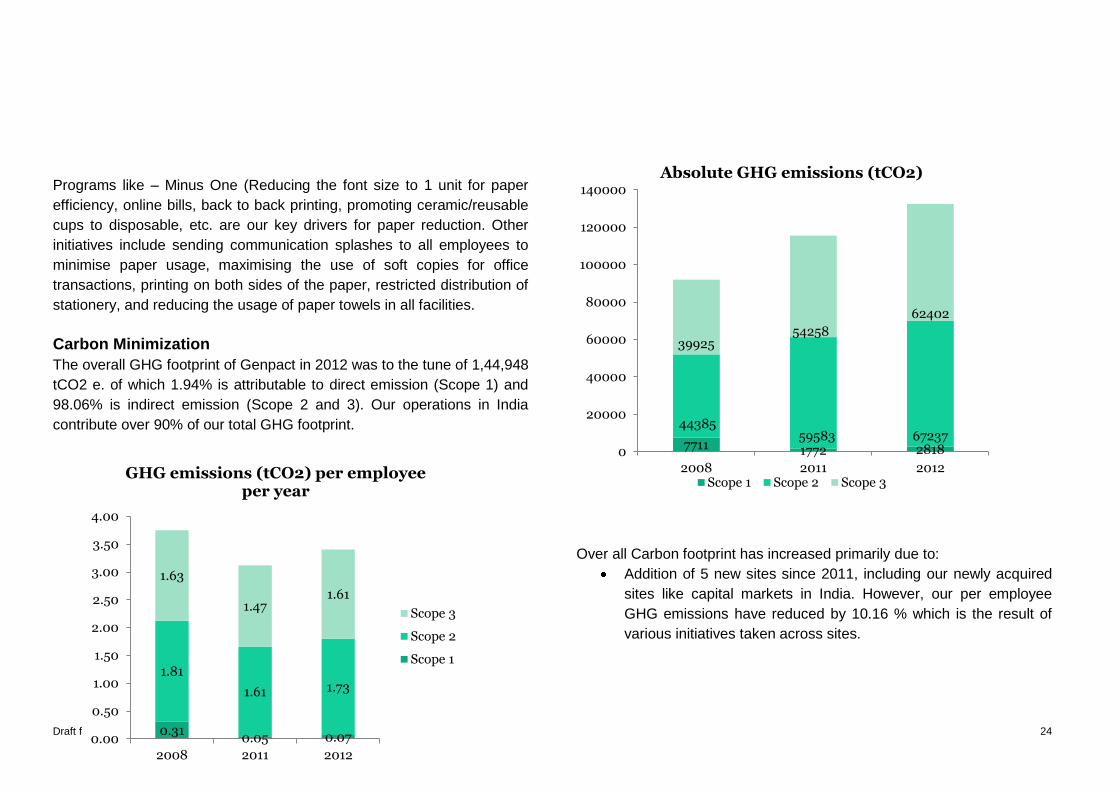
Carbon Minimization
The overall GHG footprint of Genpact in 2012 was to the tune of 1,44,948
tCO2 e. of which 1.94% is attributable to direct emission (Scope 1) and
98.06% is indirect emission (Scope 2 and 3). Our operations in India
contribute over 90% of our total GHG footprint.
Over all Carbon footprint has increased primarily due to:
Addition of 5 new sites since 2011, including our newly acquired
sites like capital markets in India. However, our per employee
GHG emissions have reduced by 10.16 % which is the result of
various initiatives taken across sites.
7711 1772 2818
44385 59583 67237
39925 54258
62402
0
20000
40000
60000
80000
100000
120000
140000
2008 2011 2012
Absolute GHG emissions (tCO2)
Scope 1 Scope 2 Scope 3
Draft for discussion 25
0.00
0.20
0.40
0.60
0.80
1.00
1.20
2008 2011 2012
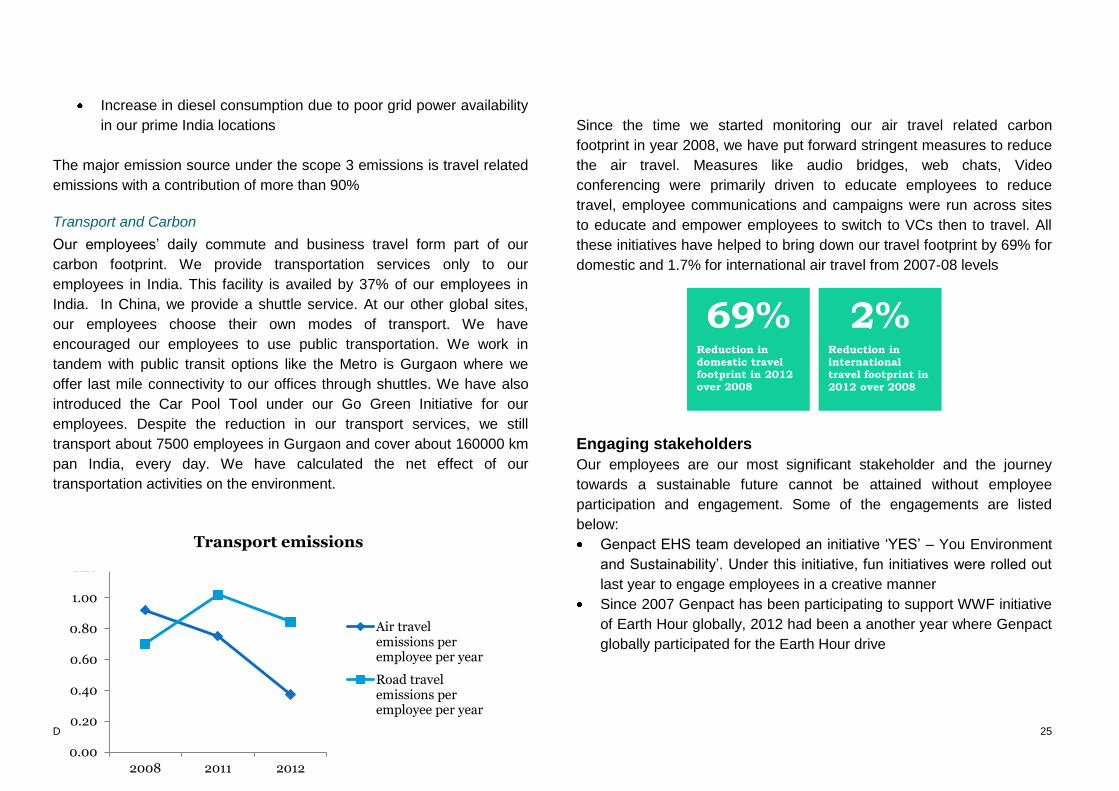
Transport emissions
Air travelemissions peremployee per year
Road travelemissions peremployee per year
Increase in diesel consumption due to poor grid power availability
in our prime India locations
The major emission source under the scope 3 emissions is travel related
emissions with a contribution of more than 90%
Transport and Carbon
Our employees’ daily commute and business travel form part of our
carbon footprint. We provide transportation services only to our
employees in India. This facility is availed by 37% of our employees in
India. In China, we provide a shuttle service. At our other global sites,
our employees choose their own modes of transport. We have
encouraged our employees to use public transportation. We work in
tandem with public transit options like the Metro is Gurgaon where we
offer last mile connectivity to our offices through shuttles. We have also
introduced the Car Pool Tool under our Go Green Initiative for our
employees. Despite the reduction in our transport services, we still
transport about 7500 employees in Gurgaon and cover about 160000 km
pan India, every day. We have calculated the net effect of our
transportation activities on the environment.
Since the time we started monitoring our air travel related carbon
footprint in year 2008, we have put forward stringent measures to reduce
the air travel. Measures like audio bridges, web chats, Video
conferencing were primarily driven to educate employees to reduce
travel, employee communications and campaigns were run across sites
to educate and empower employees to switch to VCs then to travel. All
these initiatives have helped to bring down our travel footprint by 69% for
domestic and 1.7% for international air travel from 2007-08 levels
Engaging stakeholders
Our employees are our most significant stakeholder and the journey
towards a sustainable future cannot be attained without employee
participation and engagement. Some of the engagements are listed
below:
Genpact EHS team developed an initiative ‘YES’ – You Environment
and Sustainability’. Under this initiative, fun initiatives were rolled out
last year to engage employees in a creative manner
Since 2007 Genpact has been participating to support WWF initiative
of Earth Hour globally, 2012 had been a another year where Genpact
globally participated for the Earth Hour drive
69% Reduction in domestic travel footprint in 2012 over 2008
2% Reduction in international travel footprint in 2012 over 2008
Draft for discussion 26
Globally, our sites in China, Europe and Mexico also organized
events to raise employee consciousness. China had a ‘Greening
Tomorrow’ activity and Mexico had a plantation drive
Under the ‘Go Green’ drive and to celebrate the last week of ‘Earth
Day’ 2012 ,Genpact Hyderabad Logistics organized a ‘Flash Mob’ in
the Uppal premises. The objective was to bring employees together
and spread awareness on ‘Saving Our Planet’.
Offices in Hyderabad and Bangalore had ‘Safai-Abhyan’ clean up
drives
The Puttenhalli Lake Cleaning Drive on April 14, 2012, spearheaded
by the Bangalore I & L, EHS and CSR teams, was a tremendous
success, thanks to the spirited participation of some volunteers from
Genpact who truly care for the environment.
Genpact joined hands with the members of the ‘Spark the Rise
Project’ for the lake restoration and cleaning activity. The intention of
the drive was to enable the lake to breathe and foster a healthy
coexistence of bio- diverse forms, make it a clean water body and
restore it as a natural the habitats of avian, aquatic and other life
forms
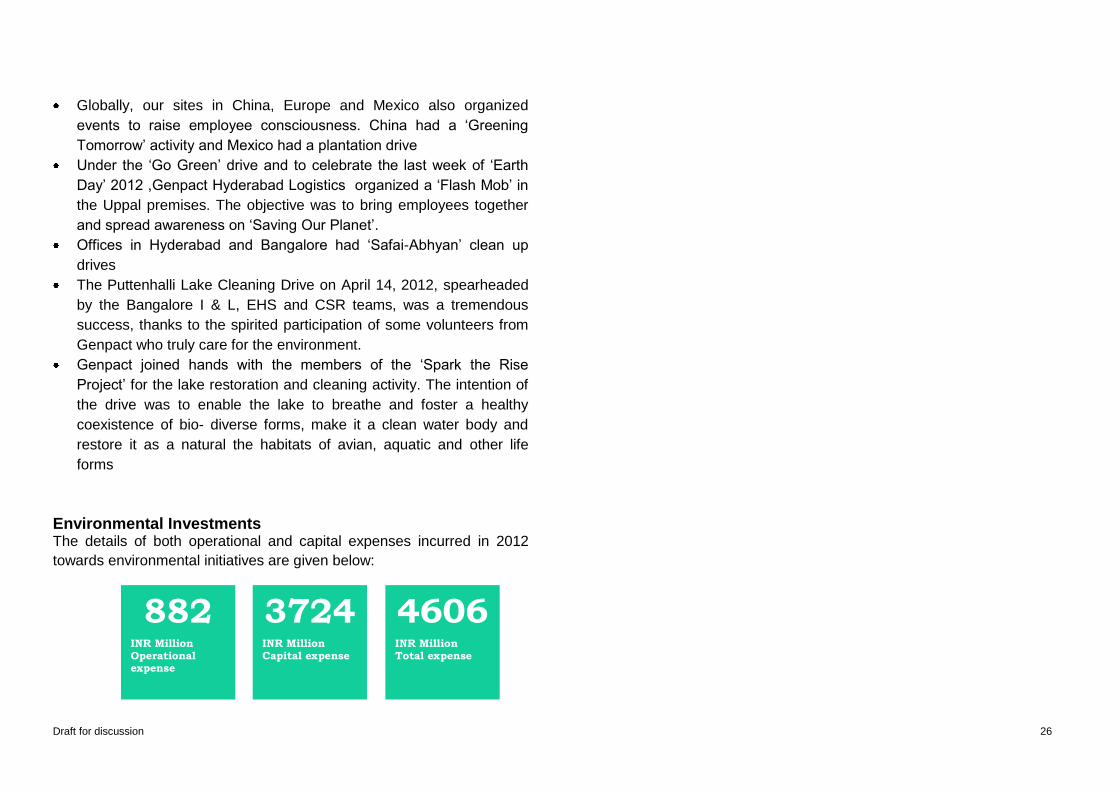
Environmental Investments The details of both operational and capital expenses incurred in 2012
towards environmental initiatives are given below:
882 INR Million Operational expense
4606 INR Million Total expense
3724 INR Million Capital expense

Draft for discussion 27
Draft for discussion 28
Ethics and Governance
Our governance framework is designed to ensure that we have a process
to identify, measure, and manage risks responsibly. We conduct risk
assessments annually at the level of the entity, business segment and
business process, leading to effective statutory, policy and process
compliances. Genpact is among the first few to become a member of
Partnering against Corruption Initiative. Genpact conducts focused
training on our policies relating to corruption to key risk groups, such as
our business development teams and those handling government
contracts.
Our governance structure involves a Board composed of 11 directors out
of which 10 are independent and respective Board level committees -
Audit Committee, a Compensation Committee and a Nominating and
Governance Committee. The structure is backed by strong policies and
frameworks that ensure ethical conduct across levels throughout the
organization.
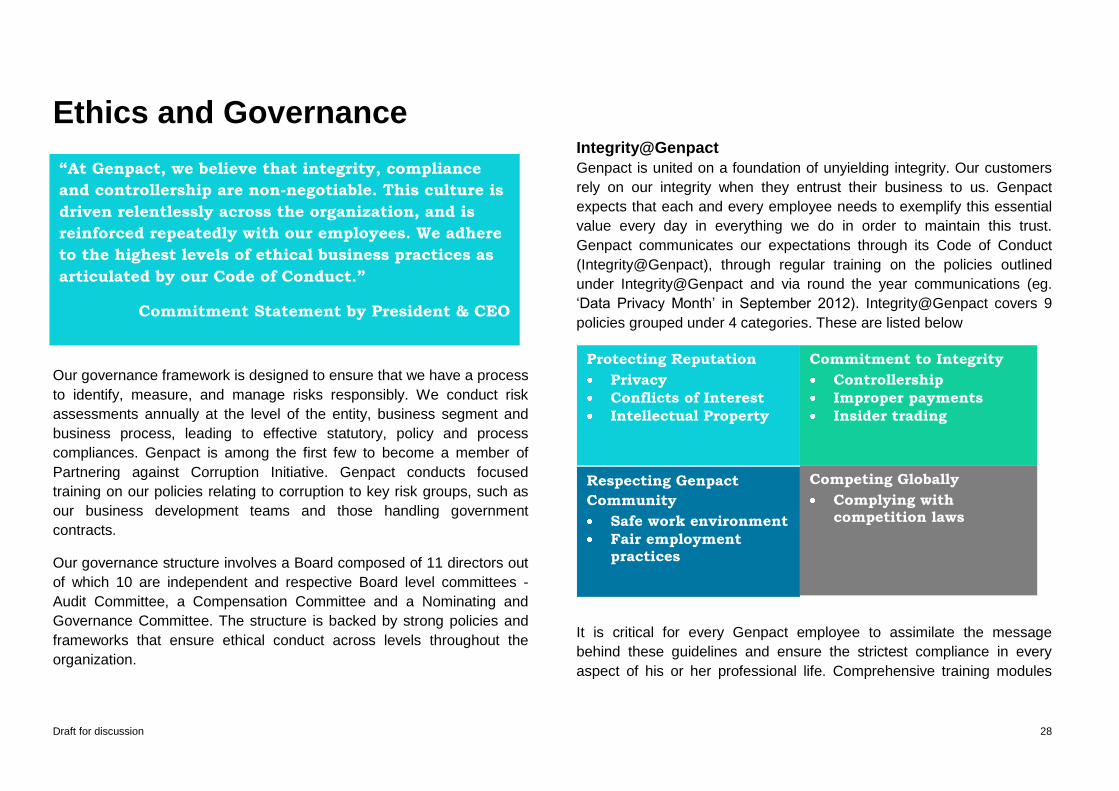
Integrity@Genpact
Genpact is united on a foundation of unyielding integrity. Our customers
rely on our integrity when they entrust their business to us. Genpact
expects that each and every employee needs to exemplify this essential
value every day in everything we do in order to maintain this trust.
Genpact communicates our expectations through its Code of Conduct
(Integrity@Genpact), through regular training on the policies outlined
under Integrity@Genpact and via round the year communications (eg.
‘Data Privacy Month’ in September 2012). Integrity@Genpact covers 9
policies grouped under 4 categories. These are listed below
It is critical for every Genpact employee to assimilate the message
behind these guidelines and ensure the strictest compliance in every
aspect of his or her professional life. Comprehensive training modules
“At Genpact, we believe that integrity, compliance
and controllership are non-negotiable. This culture is
driven relentlessly across the organization, and is
reinforced repeatedly with our employees. We adhere
to the highest levels of ethical business practices as
articulated by our Code of Conduct.”
Commitment Statement by President & CEO
Protecting Reputation
Privacy
Conflicts of Interest
Intellectual Property
Commitment to Integrity
Controllership
Improper payments
Insider trading
Respecting Genpact
Community
Safe work environment
Fair employment practices
Competing Globally
Complying with competition laws
Draft for discussion 29
are available for employees. The number and percentage of employees
receiving training on Integrity@Genpact are given below:
Employee Category No of employees who have received integrity trainings
% of total employees receiving training
Associates 6287 16.06%
Middle Management 1944 10.16%
Senior Management 54 3.43%
Top Management 21 8.14%
Total 8287 13.82%
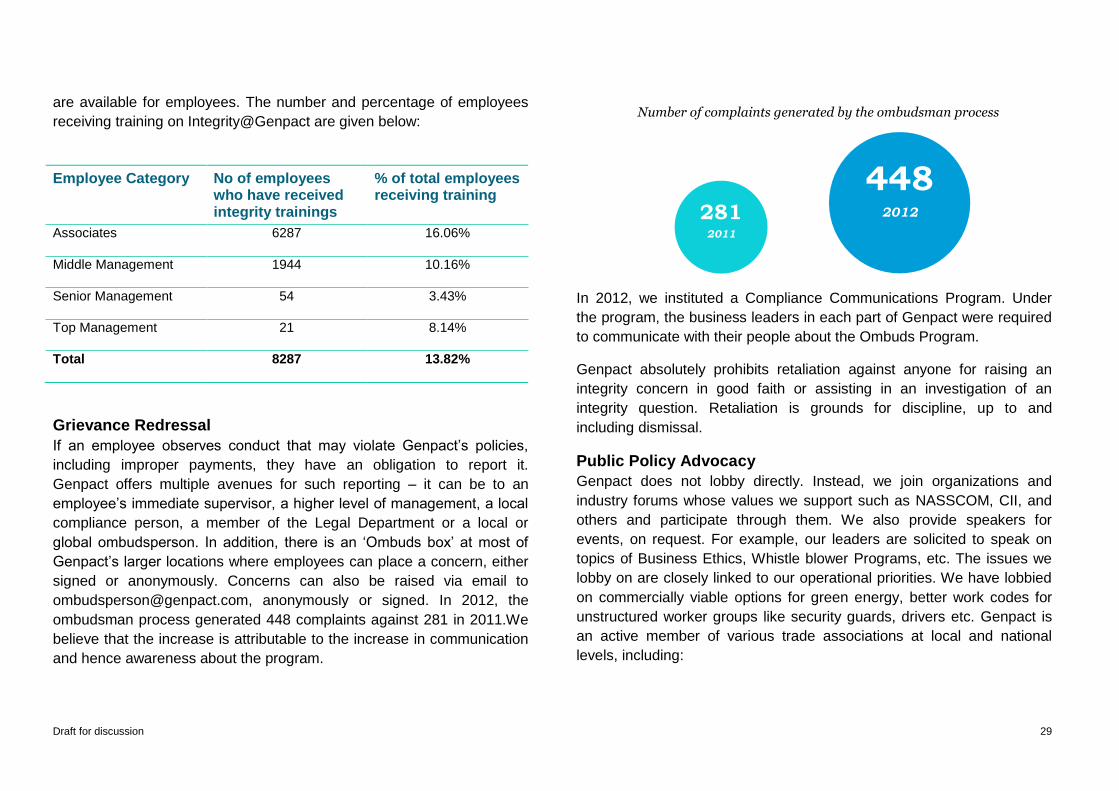
Grievance Redressal
If an employee observes conduct that may violate Genpact’s policies,
including improper payments, they have an obligation to report it.
Genpact offers multiple avenues for such reporting – it can be to an
employee’s immediate supervisor, a higher level of management, a local
compliance person, a member of the Legal Department or a local or
global ombudsperson. In addition, there is an ‘Ombuds box’ at most of
Genpact’s larger locations where employees can place a concern, either
signed or anonymously. Concerns can also be raised via email to
[email protected], anonymously or signed. In 2012, the
ombudsman process generated 448 complaints against 281 in 2011.We
believe that the increase is attributable to the increase in communication
and hence awareness about the program.
In 2012, we instituted a Compliance Communications Program. Under
the program, the business leaders in each part of Genpact were required
to communicate with their people about the Ombuds Program.
Genpact absolutely prohibits retaliation against anyone for raising an
integrity concern in good faith or assisting in an investigation of an
integrity question. Retaliation is grounds for discipline, up to and
including dismissal.
Public Policy Advocacy
Genpact does not lobby directly. Instead, we join organizations and
industry forums whose values we support such as NASSCOM, CII, and
others and participate through them. We also provide speakers for
events, on request. For example, our leaders are solicited to speak on
topics of Business Ethics, Whistle blower Programs, etc. The issues we
lobby on are closely linked to our operational priorities. We have lobbied
on commercially viable options for green energy, better work codes for
unstructured worker groups like security guards, drivers etc. Genpact is
an active member of various trade associations at local and national
levels, including:
281 2011
448 2012
Number of complaints generated by the ombudsman process
Draft for discussion 30
IAOP (International Association of Outsourcing Professionals)
NASSCOM
CII
ASUG (Americas SAP Users Group)
IMA Asia
U.S.-India Business Council
Contributions to Political Parties
Genpact advises employees to obey the laws and regulations of all
applicable jurisdictions with respect to political contributions and to never
give or offer, directly or indirectly, a payment or anything of value (such
as money, goods or services) to any political party, party official, or any
candidate for political office of any country to influence or reward any
governmental act or decision, or to obtain any improper advantage. No
donations have been made to political parties during the reporting period
Amount donated to political parties (INR):
0
Draft for discussion 31
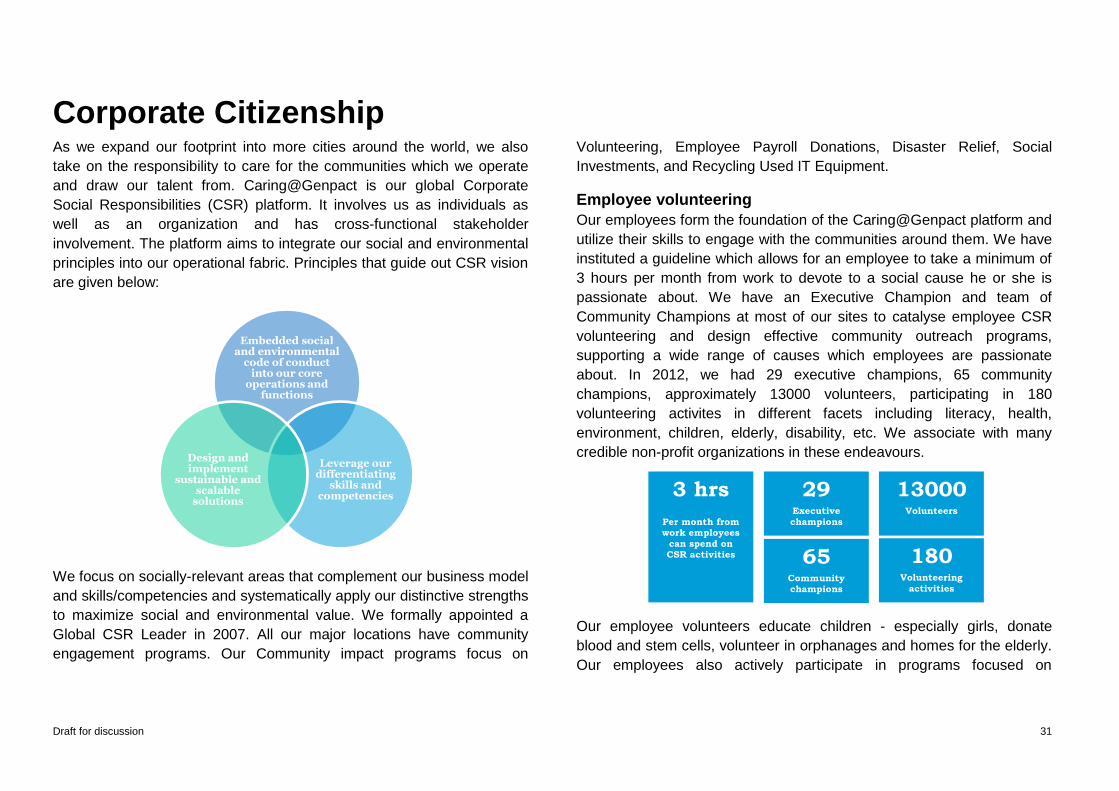
Corporate Citizenship As we expand our footprint into more cities around the world, we also
take on the responsibility to care for the communities which we operate
and draw our talent from. Caring@Genpact is our global Corporate
Social Responsibilities (CSR) platform. It involves us as individuals as
well as an organization and has cross-functional stakeholder
involvement. The platform aims to integrate our social and environmental
principles into our operational fabric. Principles that guide out CSR vision
are given below:
We focus on socially-relevant areas that complement our business model
and skills/competencies and systematically apply our distinctive strengths
to maximize social and environmental value. We formally appointed a
Global CSR Leader in 2007. All our major locations have community
engagement programs. Our Community impact programs focus on
Volunteering, Employee Payroll Donations, Disaster Relief, Social
Investments, and Recycling Used IT Equipment.
Employee volunteering
Our employees form the foundation of the Caring@Genpact platform and
utilize their skills to engage with the communities around them. We have
instituted a guideline which allows for an employee to take a minimum of
3 hours per month from work to devote to a social cause he or she is
passionate about. We have an Executive Champion and team of
Community Champions at most of our sites to catalyse employee CSR
volunteering and design effective community outreach programs,
supporting a wide range of causes which employees are passionate
about. In 2012, we had 29 executive champions, 65 community
champions, approximately 13000 volunteers, participating in 180
volunteering activites in different facets including literacy, health,
environment, children, elderly, disability, etc. We associate with many
credible non-profit organizations in these endeavours.
Our employee volunteers educate children - especially girls, donate
blood and stem cells, volunteer in orphanages and homes for the elderly.
Our employees also actively participate in programs focused on
Embedded social and environmental
code of conduct into our core
operations and functions
Leverage our differentiating
skills and competencies
Design and implement
sustainable and scalable
solutions 3 hrs
Per month from work employees
can spend on CSR activities
29 Executive
champions
65 Community champions
13000 Volunteers
180 Volunteering
activities
Draft for discussion 32
environmental wellbeing. Some such initiatives in which our employees
volunteered are listed below:
Employee volunteering in the US is mostly focused on health care
(e.g., Leukaemia and premature death of children) while most of
our volunteers in the eastern hemisphere work on education
related causes.
Genpact South Africa collaborated with Khulisani (a majority black
female-owned business focused exclusively on the employment
and mainstreaming of persons with disabilities) to support 3
vendor carts for food items – 1 in Durban and 2 in Johannesburg.
One of the vendor cart is placed in the Genpact Woodmead
building
Tree plantation drive – 1000 employees from our Gurgaon office
participated in the ‘Million Tree Initiative’ being driven by a non-
profit organization – ‘I am Gurgaon’; 3000 trees were planted by
our employee volunteers in one day
Our teams in Europe have also been involved in clean-up and
tree plantation drives.
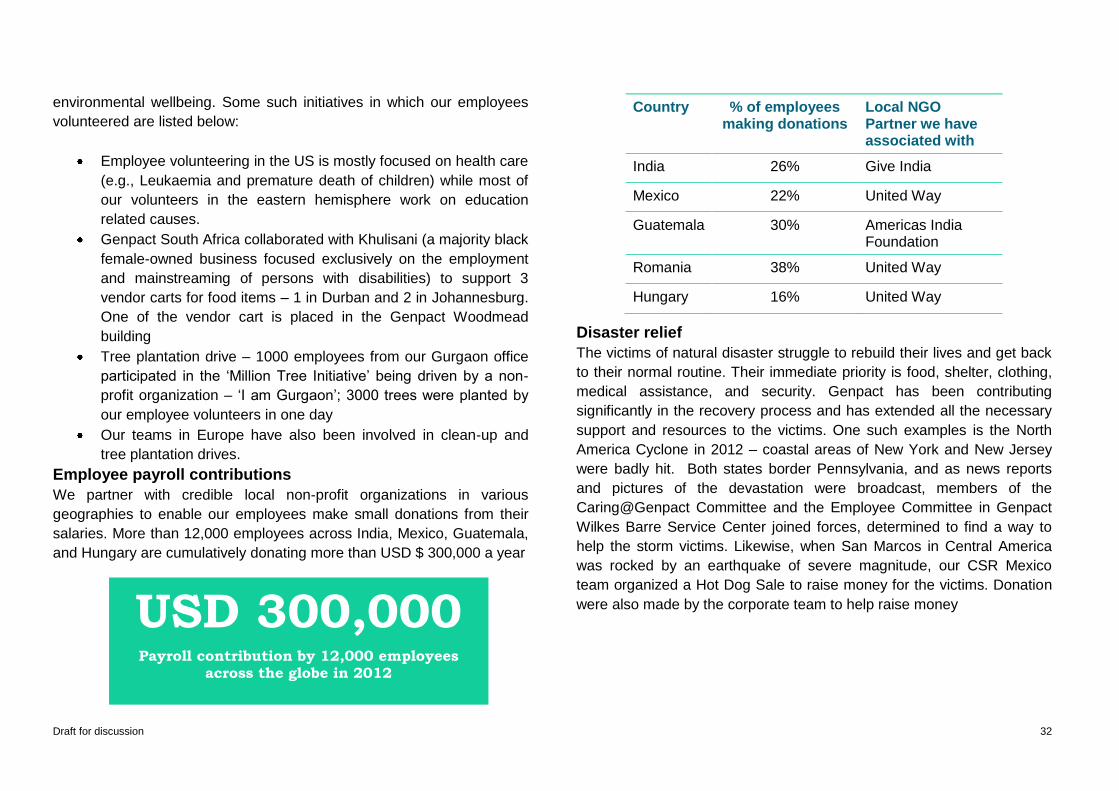
Employee payroll contributions
We partner with credible local non-profit organizations in various
geographies to enable our employees make small donations from their
salaries. More than 12,000 employees across India, Mexico, Guatemala,
and Hungary are cumulatively donating more than USD $ 300,000 a year
Disaster relief
The victims of natural disaster struggle to rebuild their lives and get back
to their normal routine. Their immediate priority is food, shelter, clothing,
medical assistance, and security. Genpact has been contributing
significantly in the recovery process and has extended all the necessary
support and resources to the victims. One such examples is the North
America Cyclone in 2012 – coastal areas of New York and New Jersey
were badly hit. Both states border Pennsylvania, and as news reports
and pictures of the devastation were broadcast, members of the
Caring@Genpact Committee and the Employee Committee in Genpact
Wilkes Barre Service Center joined forces, determined to find a way to
help the storm victims. Likewise, when San Marcos in Central America
was rocked by an earthquake of severe magnitude, our CSR Mexico
team organized a Hot Dog Sale to raise money for the victims. Donation
were also made by the corporate team to help raise money
Country % of employees making donations
Local NGO Partner we have associated with
India 26% Give India
Mexico 22% United Way
Guatemala 30% Americas India Foundation
Romania 38% United Way
Hungary 16% United Way
USD 300,000 Payroll contribution by 12,000 employees
across the globe in 2012
Draft for discussion 33
Social Investments
We are currently involved in various other ongoing social investments
programs. Two such important programs are described below
Public Health
We adopted and restored a non-functional government-run primary
health centre in Gurgaon, Haryana (India). As part of this effort, we
provided the healthcare centre with a team of doctors and nurses to help
the many underprivileged citizens who otherwise do not have access to
primary healthcare. Services at the health centre focus on providing
preventive care, basic health check-ups, pathological tests,
immunizations, eye examinations and diagnostic tests. Free medicine is
also provided at the facility.
Industry academia partnership
In India, we have partnered with IMT Ghaziabad in a program
titled ‘IMPACT’; upon signing a MoU with the institution in July
2012, we have launched five pilot courses in Analytics to improve
the employability of the students. The campus recruitment teams
in India assess candidature of students in remote locations of the
country for entrant level openings.
The Training Team in China partnered with the local government
to train unskilled graduates from campuses. 400 students were
trained and hired in 2012 from Huaqiao as part of the
government. sponsored initiative
In Philippines, we partner with the government in the ‘Training for
work’ program – a national program launched in 2012 to enhance
competitiveness of Filipino workforce. Since 2012, as a part of the
‘Near-hire’ program, we trained over 400 students in skills
relevant to BPO/BPM industry and recruited over 90 of them
Recycling used IT equipment
Till date, we have donated over 5,256 computers to educational
institutions and non-profit organizations in India. We have also been
streamlining our IT asset donation program – this includes an end-to –
end process of testing the equipments and assessing longevity, reloading
the Operating Systems, suggesting reasonable Annual Maintenance
Costs and prescribing vendors for e-waste disposal.
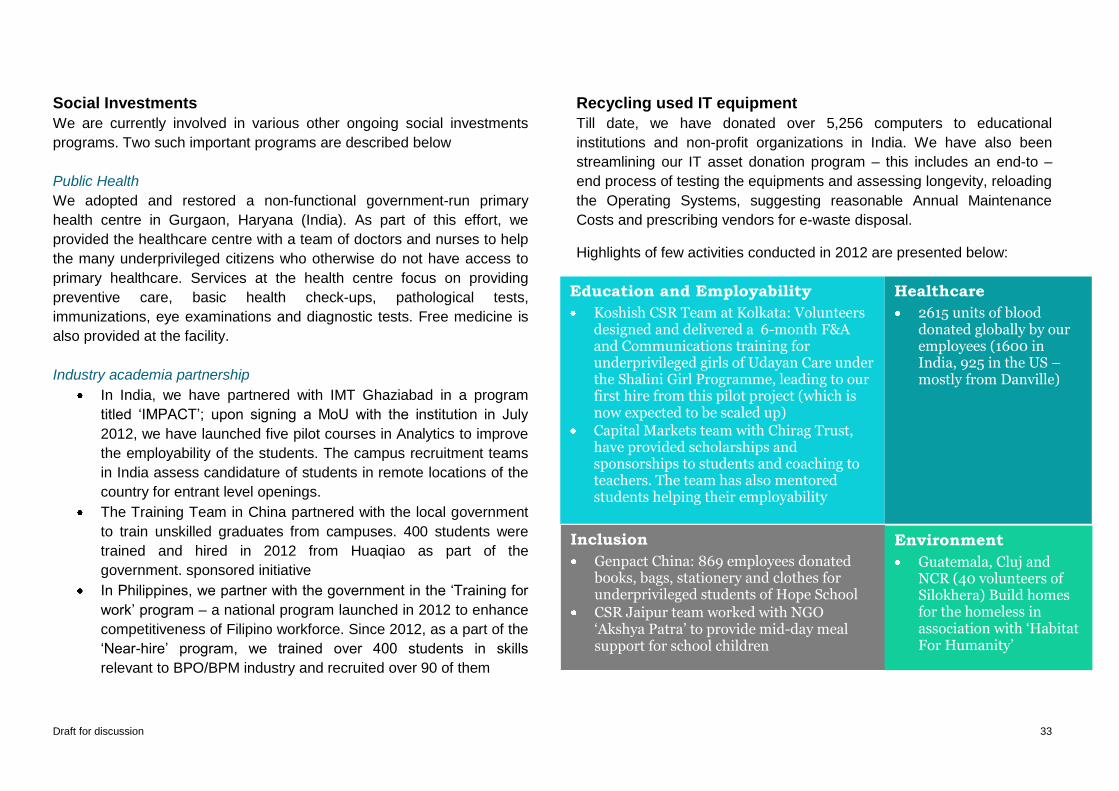
Highlights of few activities conducted in 2012 are presented below:
Education and Employability
Koshish CSR Team at Kolkata: Volunteers designed and delivered a 6-month F&A and Communications training for underprivileged girls of Udayan Care under the Shalini Girl Programme, leading to our first hire from this pilot project (which is now expected to be scaled up)
Capital Markets team with Chirag Trust, have provided scholarships and sponsorships to students and coaching to teachers. The team has also mentored students helping their employability
Healthcare
2615 units of blood donated globally by our employees (1600 in India, 925 in the US – mostly from Danville)
Inclusion
Genpact China: 869 employees donated books, bags, stationery and clothes for underprivileged students of Hope School
CSR Jaipur team worked with NGO ‘Akshya Patra’ to provide mid-day meal support for school children
Environment
Guatemala, Cluj and NCR (40 volunteers of Silokhera) Build homes for the homeless in association with ‘Habitat For Humanity’
Draft for discussion 34
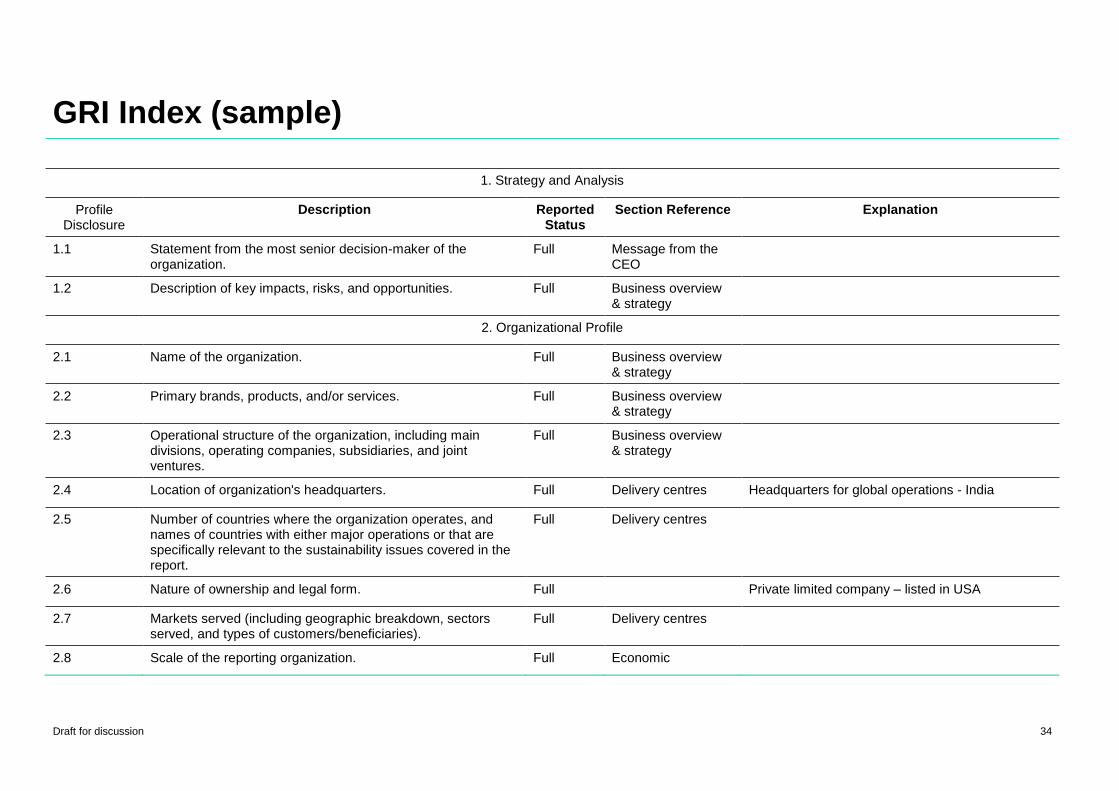
GRI Index (sample) STANDARD DISCLOSURES PART I: Profile Disclosures
1. Strategy and Analysis
Profile Disclosure
Description Reported Status
Section Reference Explanation
1.1 Statement from the most senior decision-maker of the organization.
Full Message from the CEO
1.2 Description of key impacts, risks, and opportunities. Full Business overview & strategy
2. Organizational Profile
2.1 Name of the organization. Full Business overview & strategy
2.2 Primary brands, products, and/or services. Full Business overview & strategy
2.3 Operational structure of the organization, including main divisions, operating companies, subsidiaries, and joint ventures.
Full Business overview & strategy
2.4 Location of organization's headquarters. Full Delivery centres Headquarters for global operations - India
2.5 Number of countries where the organization operates, and names of countries with either major operations or that are specifically relevant to the sustainability issues covered in the report.
Full Delivery centres
2.6 Nature of ownership and legal form. Full Private limited company – listed in USA
2.7 Markets served (including geographic breakdown, sectors served, and types of customers/beneficiaries).
Full Delivery centres
2.8 Scale of the reporting organization. Full Economic
Draft for discussion 35
performance
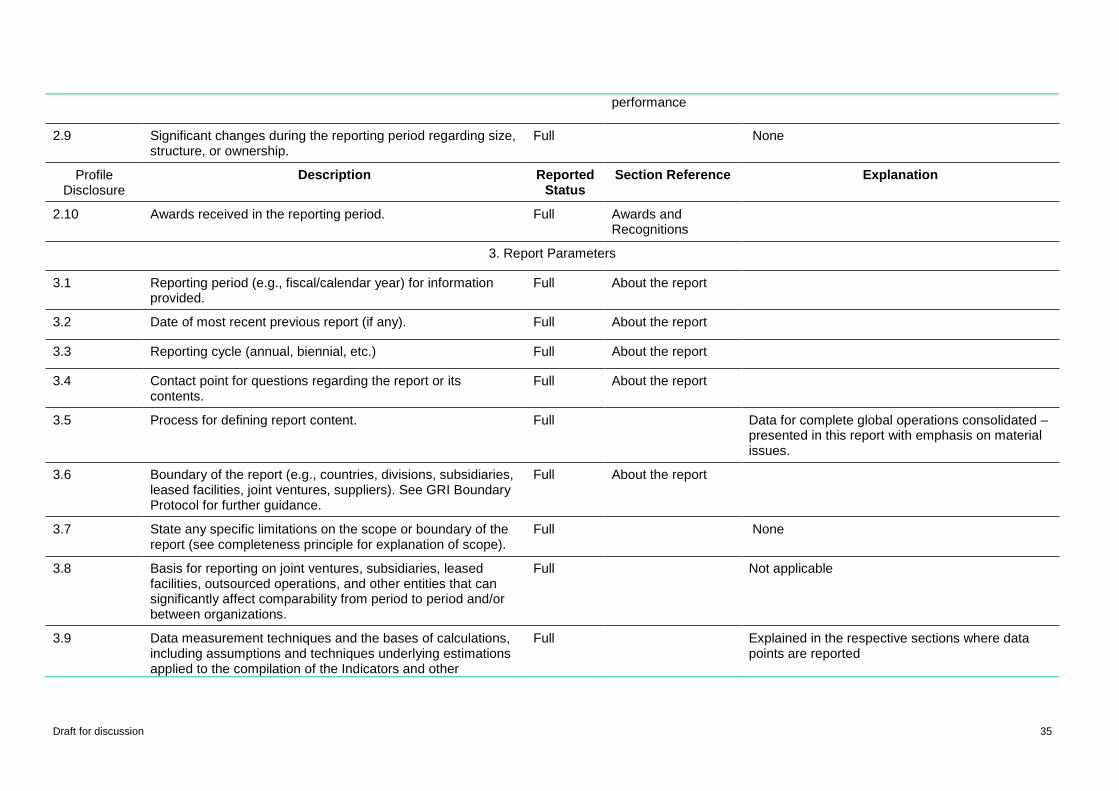
2.9 Significant changes during the reporting period regarding size, structure, or ownership.
Full None
Profile Disclosure
Description Reported Status
Section Reference Explanation
2.10 Awards received in the reporting period. Full Awards and Recognitions
3. Report Parameters
3.1 Reporting period (e.g., fiscal/calendar year) for information provided.
Full About the report
3.2 Date of most recent previous report (if any). Full About the report
3.3 Reporting cycle (annual, biennial, etc.) Full About the report
3.4 Contact point for questions regarding the report or its contents.
Full About the report
3.5 Process for defining report content. Full Data for complete global operations consolidated – presented in this report with emphasis on material issues.
3.6 Boundary of the report (e.g., countries, divisions, subsidiaries, leased facilities, joint ventures, suppliers). See GRI Boundary Protocol for further guidance.
Full About the report
3.7 State any specific limitations on the scope or boundary of the report (see completeness principle for explanation of scope).
Full None
3.8 Basis for reporting on joint ventures, subsidiaries, leased facilities, outsourced operations, and other entities that can significantly affect comparability from period to period and/or between organizations.
Full Not applicable
3.9 Data measurement techniques and the bases of calculations, including assumptions and techniques underlying estimations applied to the compilation of the Indicators and other
Full Explained in the respective sections where data points are reported
Draft for discussion 36
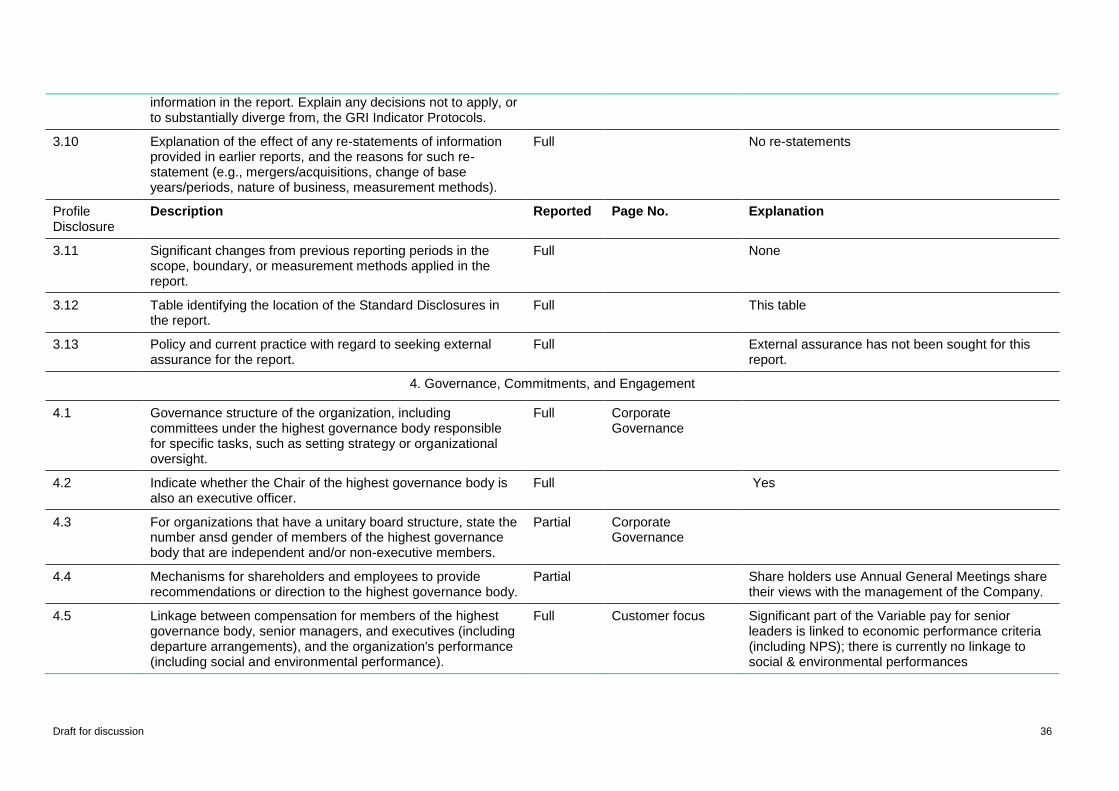
information in the report. Explain any decisions not to apply, or to substantially diverge from, the GRI Indicator Protocols.
3.10 Explanation of the effect of any re-statements of information provided in earlier reports, and the reasons for such re-statement (e.g., mergers/acquisitions, change of base years/periods, nature of business, measurement methods).
Full No re-statements
Profile Disclosure
Description Reported Page No. Explanation
3.11 Significant changes from previous reporting periods in the scope, boundary, or measurement methods applied in the report.
Full None
3.12 Table identifying the location of the Standard Disclosures in the report.
Full This table
3.13 Policy and current practice with regard to seeking external assurance for the report.
Full External assurance has not been sought for this report.
4. Governance, Commitments, and Engagement
4.1 Governance structure of the organization, including committees under the highest governance body responsible for specific tasks, such as setting strategy or organizational oversight.
Full Corporate Governance
4.2 Indicate whether the Chair of the highest governance body is also an executive officer.
Full Yes
4.3 For organizations that have a unitary board structure, state the number ansd gender of members of the highest governance body that are independent and/or non-executive members.
Partial Corporate Governance
4.4 Mechanisms for shareholders and employees to provide recommendations or direction to the highest governance body.
Partial Share holders use Annual General Meetings share their views with the management of the Company.
4.5 Linkage between compensation for members of the highest governance body, senior managers, and executives (including departure arrangements), and the organization's performance (including social and environmental performance).
Full Customer focus Significant part of the Variable pay for senior leaders is linked to economic performance criteria (including NPS); there is currently no linkage to social & environmental performances
Draft for discussion 37
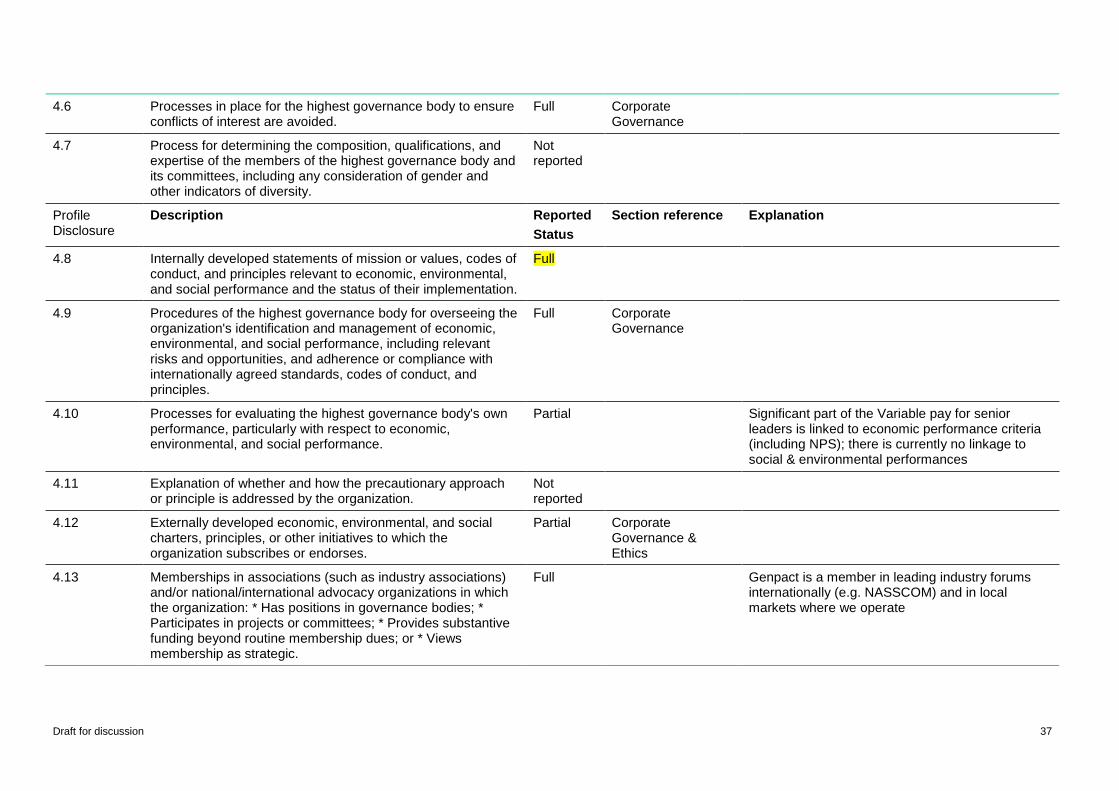
4.6 Processes in place for the highest governance body to ensure conflicts of interest are avoided.
Full Corporate Governance
4.7 Process for determining the composition, qualifications, and expertise of the members of the highest governance body and its committees, including any consideration of gender and other indicators of diversity.
Not reported
Profile Disclosure
Description Reported
Status
Section reference Explanation
4.8 Internally developed statements of mission or values, codes of conduct, and principles relevant to economic, environmental, and social performance and the status of their implementation.
Full
4.9 Procedures of the highest governance body for overseeing the organization's identification and management of economic, environmental, and social performance, including relevant risks and opportunities, and adherence or compliance with internationally agreed standards, codes of conduct, and principles.
Full Corporate Governance
4.10 Processes for evaluating the highest governance body's own performance, particularly with respect to economic, environmental, and social performance.
Partial Significant part of the Variable pay for senior leaders is linked to economic performance criteria (including NPS); there is currently no linkage to social & environmental performances
4.11 Explanation of whether and how the precautionary approach or principle is addressed by the organization.
Not reported
4.12 Externally developed economic, environmental, and social charters, principles, or other initiatives to which the organization subscribes or endorses.
Partial Corporate Governance & Ethics
4.13 Memberships in associations (such as industry associations) and/or national/international advocacy organizations in which the organization: * Has positions in governance bodies; * Participates in projects or committees; * Provides substantive funding beyond routine membership dues; or * Views membership as strategic.
Full Genpact is a member in leading industry forums internationally (e.g. NASSCOM) and in local markets where we operate
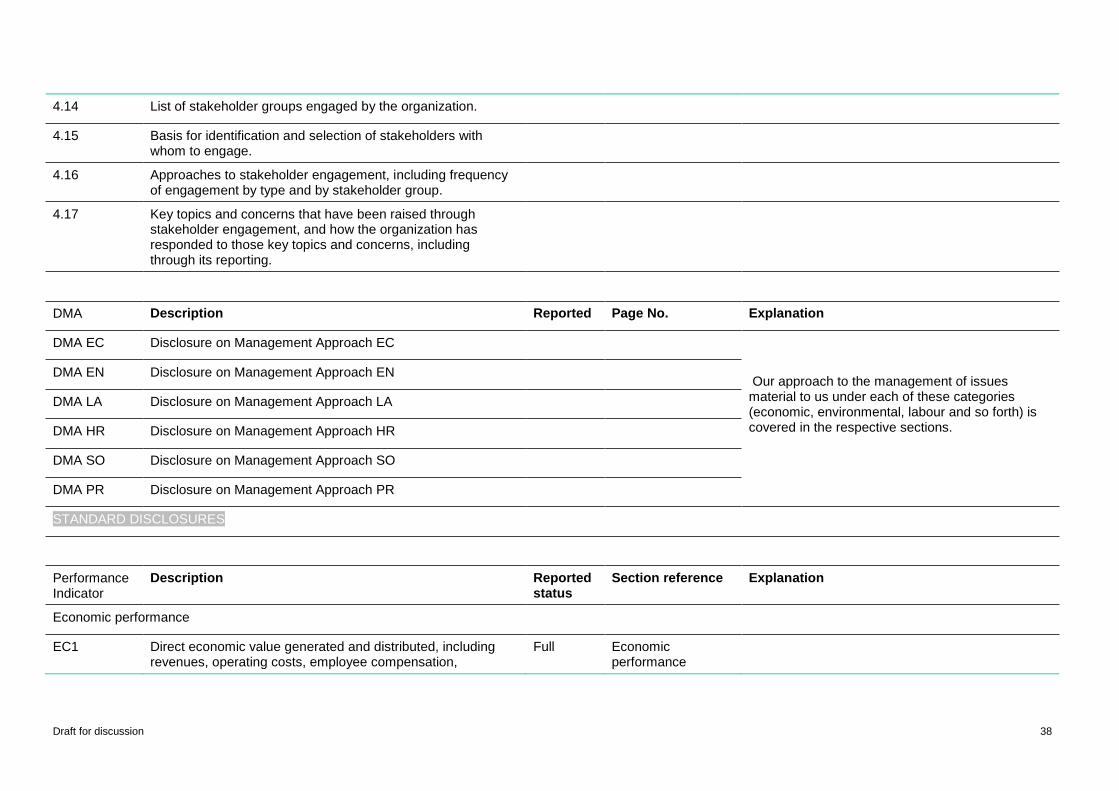
Draft for discussion 38
4.14 List of stakeholder groups engaged by the organization.
4.15 Basis for identification and selection of stakeholders with whom to engage.
4.16 Approaches to stakeholder engagement, including frequency of engagement by type and by stakeholder group.
4.17 Key topics and concerns that have been raised through stakeholder engagement, and how the organization has responded to those key topics and concerns, including through its reporting.
STANDARD DISCLOSURES PART II: Disclosures on Management Approach (DMAs)
DMA Description Reported Page No. Explanation
DMA EC Disclosure on Management Approach EC
Our approach to the management of issues material to us under each of these categories (economic, environmental, labour and so forth) is covered in the respective sections.
DMA EN Disclosure on Management Approach EN
DMA LA Disclosure on Management Approach LA
DMA HR Disclosure on Management Approach HR
DMA SO Disclosure on Management Approach SO
DMA PR Disclosure on Management Approach PR
STANDARD DISCLOSURES PART III: Performance Indicators
Economic
Performance Indicator
Description Reported status
Section reference Explanation
Economic performance
EC1 Direct economic value generated and distributed, including revenues, operating costs, employee compensation,
Full Economic performance
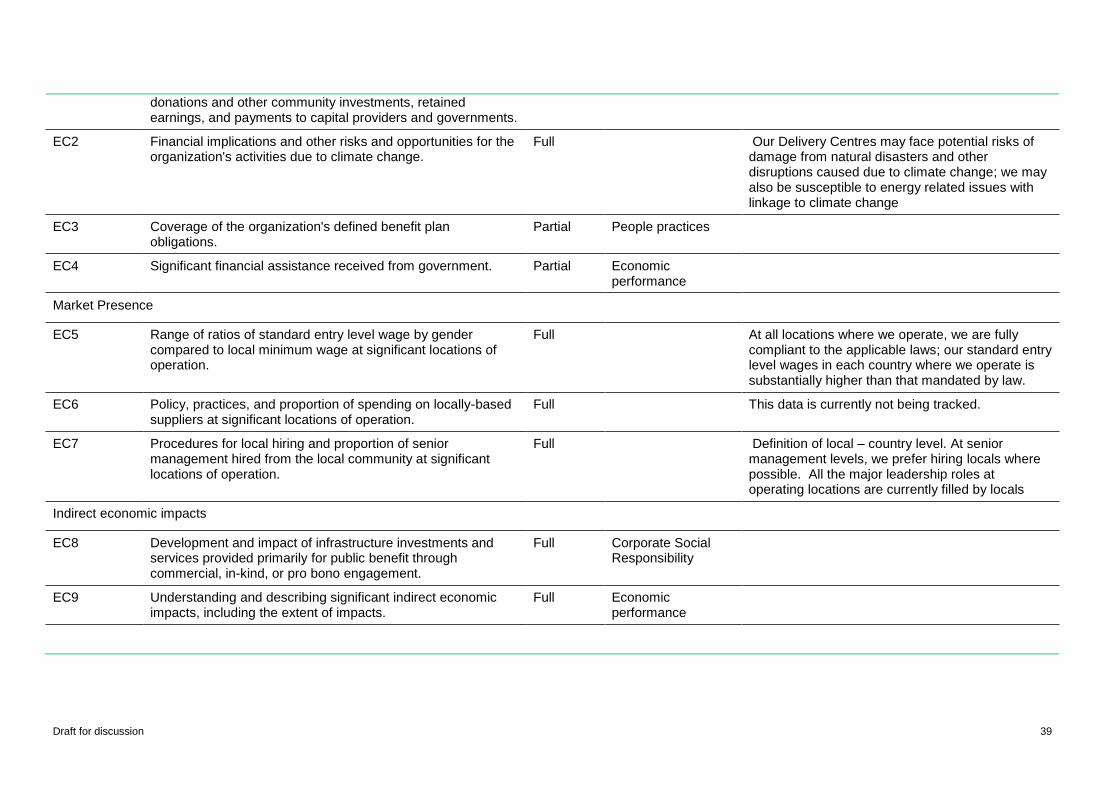
Draft for discussion 39
donations and other community investments, retained earnings, and payments to capital providers and governments.
EC2 Financial implications and other risks and opportunities for the organization's activities due to climate change.
Full Our Delivery Centres may face potential risks of damage from natural disasters and other disruptions caused due to climate change; we may also be susceptible to energy related issues with linkage to climate change
EC3 Coverage of the organization's defined benefit plan obligations.
Partial People practices
EC4 Significant financial assistance received from government. Partial Economic performance
Market Presence
EC5 Range of ratios of standard entry level wage by gender compared to local minimum wage at significant locations of operation.
Full At all locations where we operate, we are fully compliant to the applicable laws; our standard entry level wages in each country where we operate is substantially higher than that mandated by law.
EC6 Policy, practices, and proportion of spending on locally-based suppliers at significant locations of operation.
Full This data is currently not being tracked.
EC7 Procedures for local hiring and proportion of senior management hired from the local community at significant locations of operation.
Full Definition of local – country level. At senior management levels, we prefer hiring locals where possible. All the major leadership roles at operating locations are currently filled by locals
Indirect economic impacts
EC8 Development and impact of infrastructure investments and services provided primarily for public benefit through commercial, in-kind, or pro bono engagement.
Full Corporate Social Responsibility
EC9 Understanding and describing significant indirect economic impacts, including the extent of impacts.
Full Economic performance
Environmental
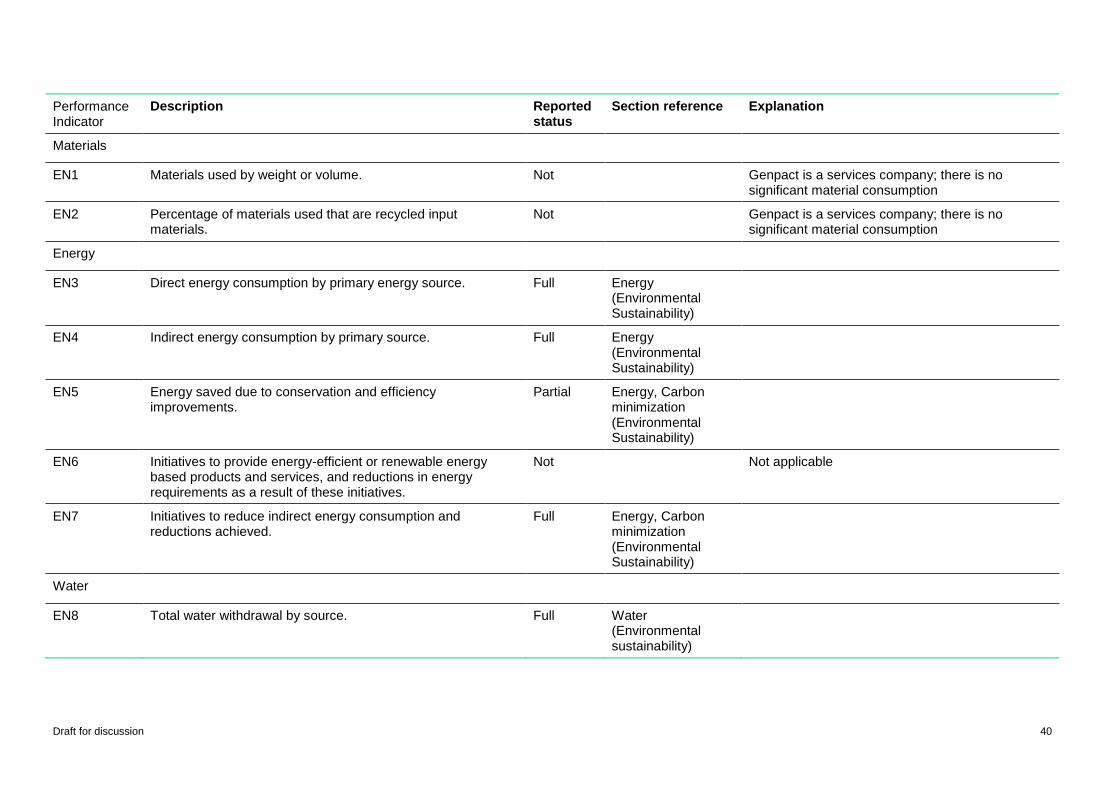
Draft for discussion 40
Performance Indicator
Description Reported status
Section reference Explanation
Materials
EN1 Materials used by weight or volume. Not Genpact is a services company; there is no significant material consumption
EN2 Percentage of materials used that are recycled input materials.
Not Genpact is a services company; there is no significant material consumption
Energy
EN3 Direct energy consumption by primary energy source. Full Energy (Environmental Sustainability)
EN4 Indirect energy consumption by primary source. Full Energy (Environmental Sustainability)
EN5 Energy saved due to conservation and efficiency improvements.
Partial Energy, Carbon minimization (Environmental Sustainability)
EN6 Initiatives to provide energy-efficient or renewable energy based products and services, and reductions in energy requirements as a result of these initiatives.
Not Not applicable
EN7 Initiatives to reduce indirect energy consumption and reductions achieved.
Full Energy, Carbon minimization (Environmental Sustainability)
Water
EN8 Total water withdrawal by source. Full Water (Environmental sustainability)
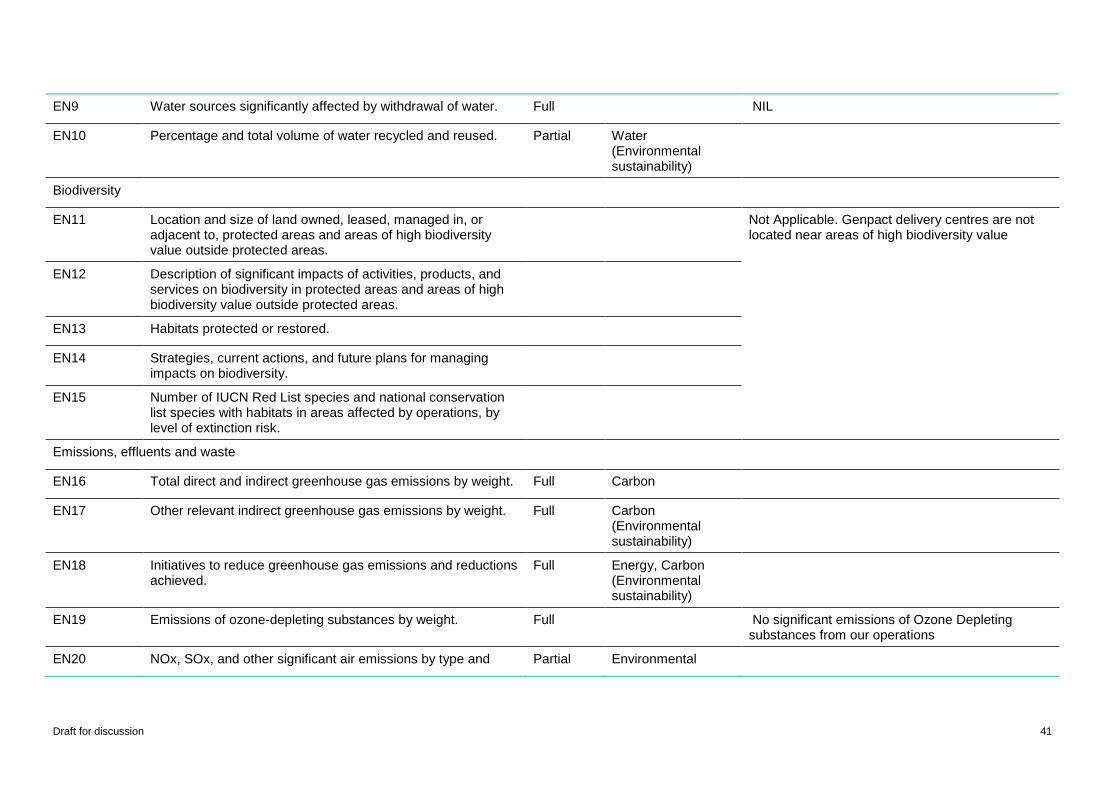
Draft for discussion 41
EN9 Water sources significantly affected by withdrawal of water. Full NIL
EN10 Percentage and total volume of water recycled and reused. Partial Water (Environmental sustainability)
Biodiversity
EN11 Location and size of land owned, leased, managed in, or adjacent to, protected areas and areas of high biodiversity value outside protected areas.
Not Applicable. Genpact delivery centres are not located near areas of high biodiversity value
EN12 Description of significant impacts of activities, products, and services on biodiversity in protected areas and areas of high biodiversity value outside protected areas.
EN13 Habitats protected or restored.
EN14 Strategies, current actions, and future plans for managing impacts on biodiversity.
EN15 Number of IUCN Red List species and national conservation list species with habitats in areas affected by operations, by level of extinction risk.
Emissions, effluents and waste
EN16 Total direct and indirect greenhouse gas emissions by weight. Full Carbon
EN17 Other relevant indirect greenhouse gas emissions by weight. Full Carbon (Environmental sustainability)
EN18 Initiatives to reduce greenhouse gas emissions and reductions achieved.
Full Energy, Carbon (Environmental sustainability)
EN19 Emissions of ozone-depleting substances by weight. Full No significant emissions of Ozone Depleting substances from our operations
EN20 NOx, SOx, and other significant air emissions by type and Partial Environmental
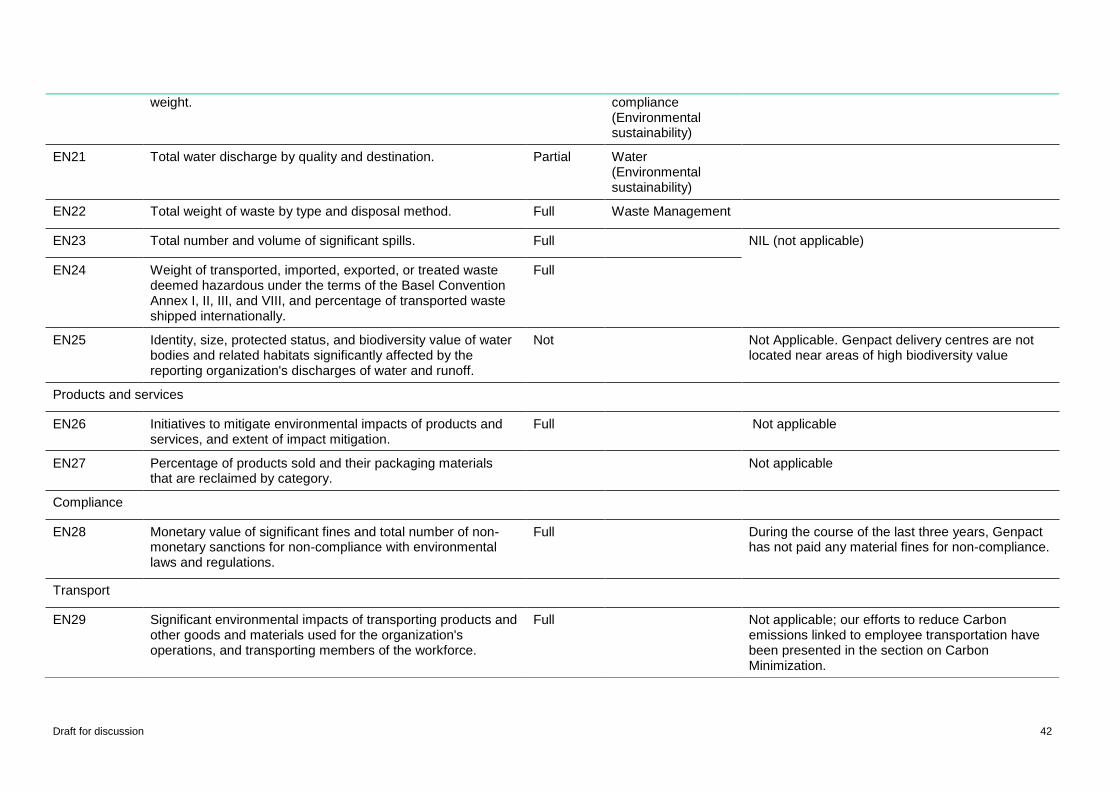
Draft for discussion 42
weight. compliance (Environmental sustainability)
EN21 Total water discharge by quality and destination. Partial Water (Environmental sustainability)
EN22 Total weight of waste by type and disposal method. Full Waste Management
EN23 Total number and volume of significant spills. Full NIL (not applicable)
EN24 Weight of transported, imported, exported, or treated waste deemed hazardous under the terms of the Basel Convention Annex I, II, III, and VIII, and percentage of transported waste shipped internationally.
Full
EN25 Identity, size, protected status, and biodiversity value of water bodies and related habitats significantly affected by the reporting organization's discharges of water and runoff.
Not Not Applicable. Genpact delivery centres are not located near areas of high biodiversity value
Products and services
EN26 Initiatives to mitigate environmental impacts of products and services, and extent of impact mitigation.
Full Not applicable
EN27 Percentage of products sold and their packaging materials that are reclaimed by category.
Not applicable
Compliance
EN28 Monetary value of significant fines and total number of non-monetary sanctions for non-compliance with environmental laws and regulations.
Full During the course of the last three years, Genpact has not paid any material fines for non-compliance.
Transport
EN29 Significant environmental impacts of transporting products and other goods and materials used for the organization's operations, and transporting members of the workforce.
Full Not applicable; our efforts to reduce Carbon emissions linked to employee transportation have been presented in the section on Carbon Minimization.
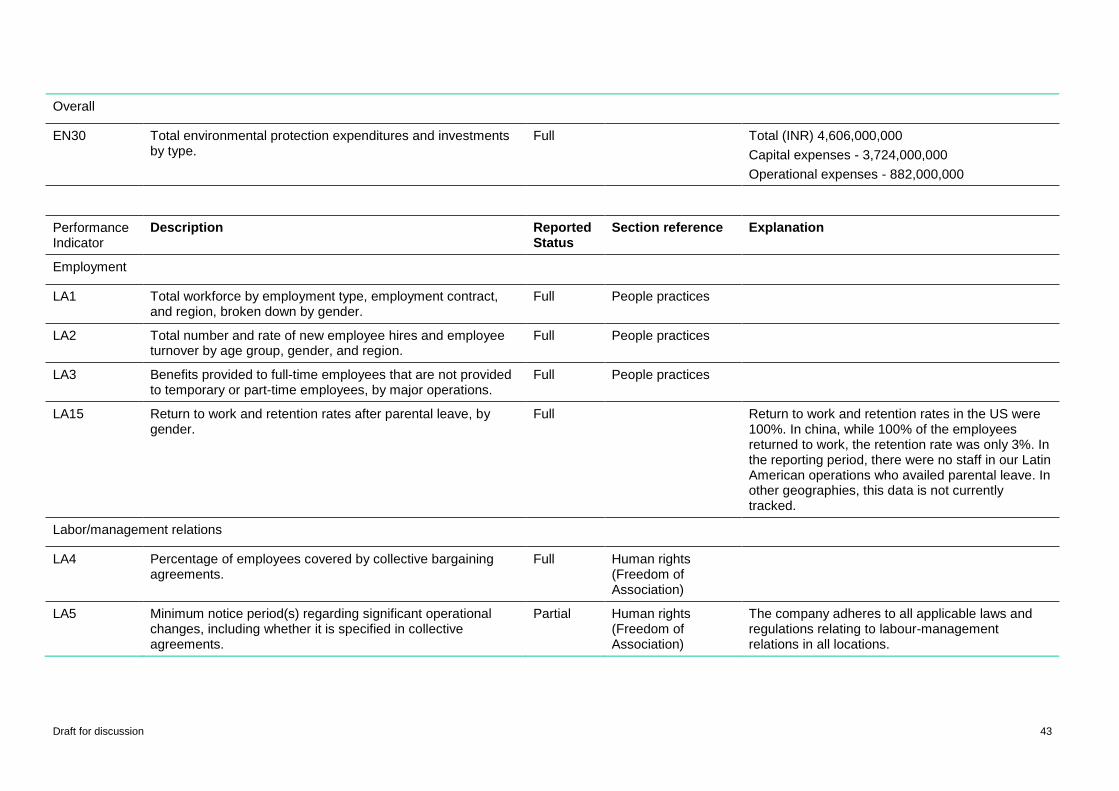
Draft for discussion 43
Overall
EN30 Total environmental protection expenditures and investments by type.
Full Total (INR) 4,606,000,000
Capital expenses - 3,724,000,000
Operational expenses - 882,000,000
Social: Labor Practices and Decent Work
Performance Indicator
Description Reported Status
Section reference Explanation
Employment
LA1 Total workforce by employment type, employment contract, and region, broken down by gender.
Full People practices
LA2 Total number and rate of new employee hires and employee turnover by age group, gender, and region.
Full People practices
LA3 Benefits provided to full-time employees that are not provided to temporary or part-time employees, by major operations.
Full People practices
LA15 Return to work and retention rates after parental leave, by gender.
Full Return to work and retention rates in the US were 100%. In china, while 100% of the employees returned to work, the retention rate was only 3%. In the reporting period, there were no staff in our Latin American operations who availed parental leave. In other geographies, this data is not currently tracked.
Labor/management relations
LA4 Percentage of employees covered by collective bargaining agreements.
Full Human rights (Freedom of Association)
LA5 Minimum notice period(s) regarding significant operational changes, including whether it is specified in collective agreements.
Partial Human rights (Freedom of Association)
The company adheres to all applicable laws and regulations relating to labour-management relations in all locations.
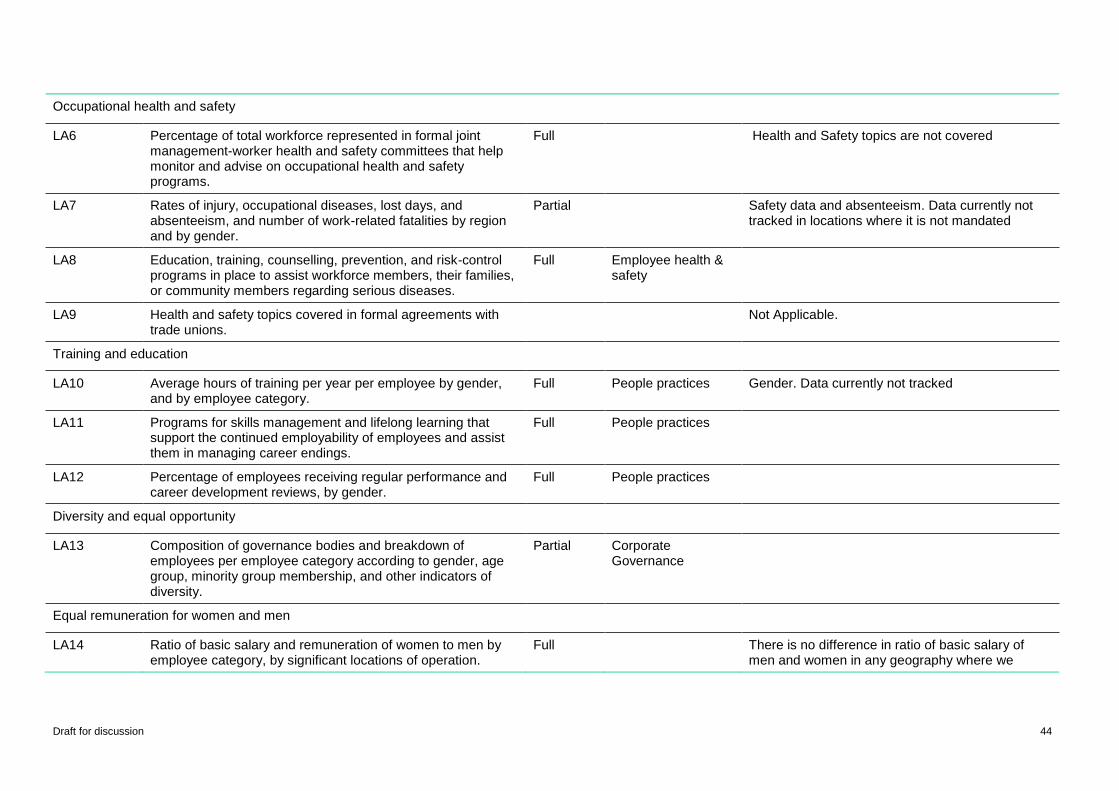
Draft for discussion 44
Occupational health and safety
LA6 Percentage of total workforce represented in formal joint management-worker health and safety committees that help monitor and advise on occupational health and safety programs.
Full Health and Safety topics are not covered
LA7 Rates of injury, occupational diseases, lost days, and absenteeism, and number of work-related fatalities by region and by gender.
Partial Safety data and absenteeism. Data currently not tracked in locations where it is not mandated
LA8 Education, training, counselling, prevention, and risk-control programs in place to assist workforce members, their families, or community members regarding serious diseases.
Full Employee health & safety
LA9 Health and safety topics covered in formal agreements with trade unions.
Not Applicable.
Training and education
LA10 Average hours of training per year per employee by gender, and by employee category.
Full People practices Gender. Data currently not tracked
LA11 Programs for skills management and lifelong learning that support the continued employability of employees and assist them in managing career endings.
Full People practices
LA12 Percentage of employees receiving regular performance and career development reviews, by gender.
Full People practices
Diversity and equal opportunity
LA13 Composition of governance bodies and breakdown of employees per employee category according to gender, age group, minority group membership, and other indicators of diversity.
Partial Corporate Governance
Equal remuneration for women and men
LA14 Ratio of basic salary and remuneration of women to men by employee category, by significant locations of operation.
Full There is no difference in ratio of basic salary of men and women in any geography where we
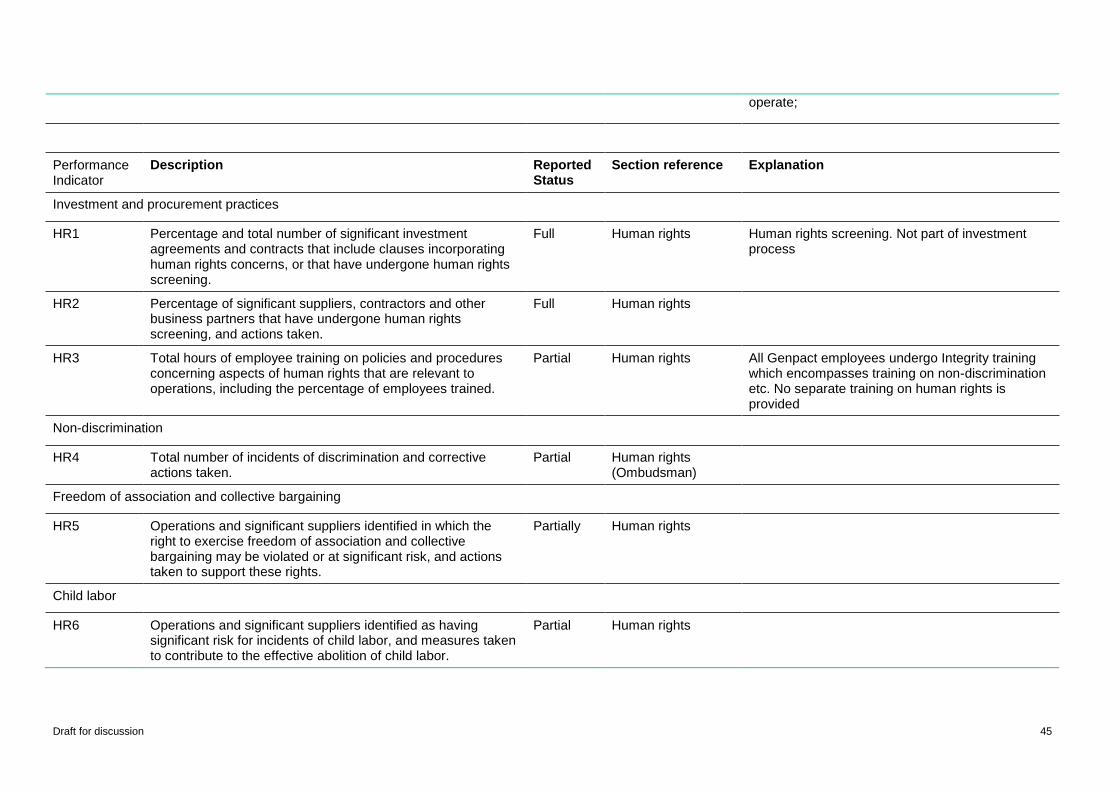
Draft for discussion 45
operate;
Social: Human Rights
Performance Indicator
Description Reported Status
Section reference Explanation
Investment and procurement practices
HR1 Percentage and total number of significant investment agreements and contracts that include clauses incorporating human rights concerns, or that have undergone human rights screening.
Full Human rights Human rights screening. Not part of investment process
HR2 Percentage of significant suppliers, contractors and other business partners that have undergone human rights screening, and actions taken.
Full Human rights
HR3 Total hours of employee training on policies and procedures concerning aspects of human rights that are relevant to operations, including the percentage of employees trained.
Partial Human rights All Genpact employees undergo Integrity training which encompasses training on non-discrimination etc. No separate training on human rights is provided
Non-discrimination
HR4 Total number of incidents of discrimination and corrective actions taken.
Partial Human rights (Ombudsman)
Freedom of association and collective bargaining
HR5 Operations and significant suppliers identified in which the right to exercise freedom of association and collective bargaining may be violated or at significant risk, and actions taken to support these rights.
Partially Human rights
Child labor
HR6 Operations and significant suppliers identified as having significant risk for incidents of child labor, and measures taken to contribute to the effective abolition of child labor.
Partial Human rights
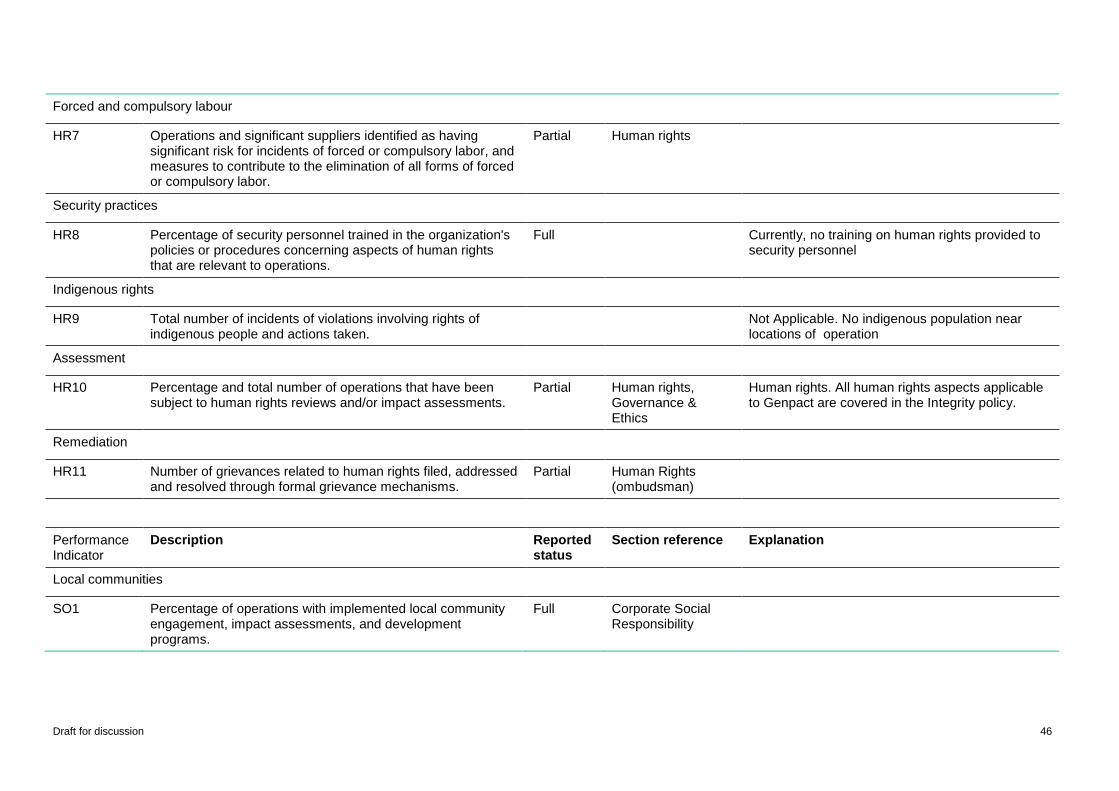
Draft for discussion 46
Forced and compulsory labour
HR7 Operations and significant suppliers identified as having significant risk for incidents of forced or compulsory labor, and measures to contribute to the elimination of all forms of forced or compulsory labor.
Partial Human rights
Security practices
HR8 Percentage of security personnel trained in the organization's policies or procedures concerning aspects of human rights that are relevant to operations.
Full Currently, no training on human rights provided to security personnel
Indigenous rights
HR9 Total number of incidents of violations involving rights of indigenous people and actions taken.
Not Applicable. No indigenous population near locations of operation
Assessment
HR10 Percentage and total number of operations that have been subject to human rights reviews and/or impact assessments.
Partial Human rights, Governance & Ethics
Human rights. All human rights aspects applicable to Genpact are covered in the Integrity policy.
Remediation
HR11 Number of grievances related to human rights filed, addressed and resolved through formal grievance mechanisms.
Partial Human Rights (ombudsman)
Social: Society
Performance Indicator
Description Reported status
Section reference Explanation
Local communities
SO1 Percentage of operations with implemented local community engagement, impact assessments, and development programs.
Full Corporate Social Responsibility
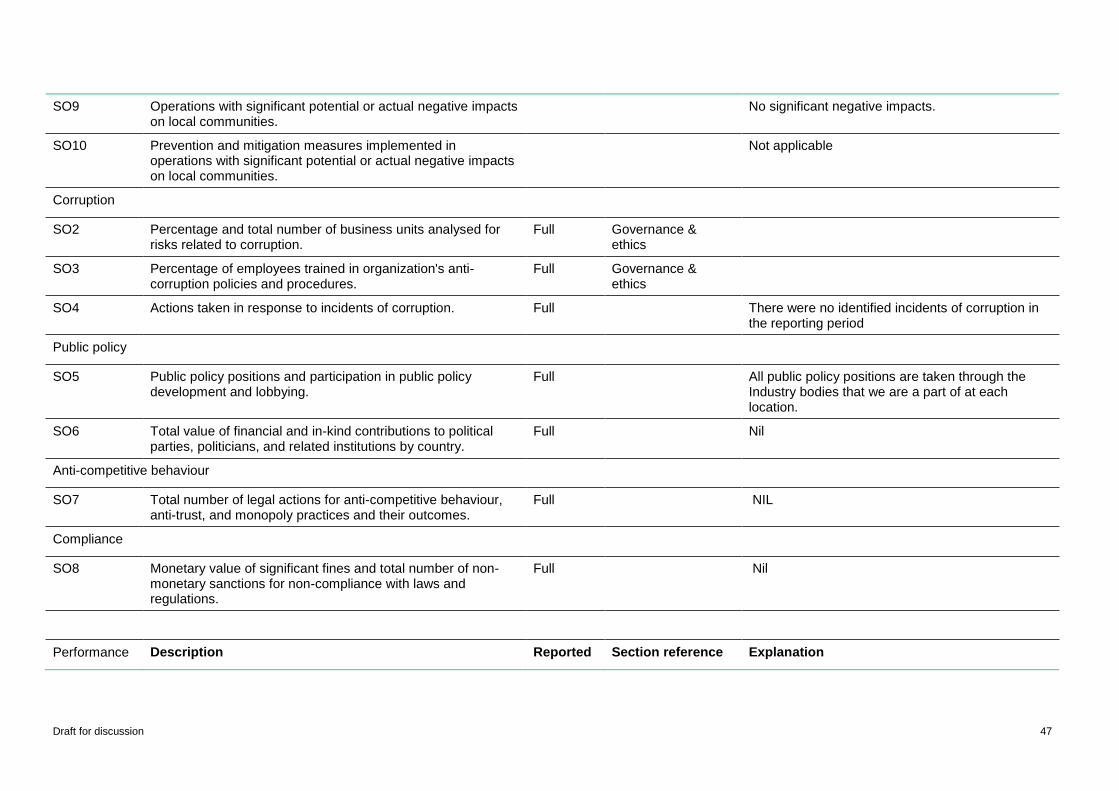
Draft for discussion 47
SO9 Operations with significant potential or actual negative impacts on local communities.
No significant negative impacts.
SO10 Prevention and mitigation measures implemented in operations with significant potential or actual negative impacts on local communities.
Not applicable
Corruption
SO2 Percentage and total number of business units analysed for risks related to corruption.
Full Governance & ethics
SO3 Percentage of employees trained in organization's anti-corruption policies and procedures.
Full Governance & ethics
SO4 Actions taken in response to incidents of corruption. Full There were no identified incidents of corruption in the reporting period
Public policy
SO5 Public policy positions and participation in public policy development and lobbying.
Full All public policy positions are taken through the Industry bodies that we are a part of at each location.
SO6 Total value of financial and in-kind contributions to political parties, politicians, and related institutions by country.
Full Nil
Anti-competitive behaviour
SO7 Total number of legal actions for anti-competitive behaviour, anti-trust, and monopoly practices and their outcomes.
Full NIL
Compliance
SO8 Monetary value of significant fines and total number of non-monetary sanctions for non-compliance with laws and regulations.
Full Nil
Social: Product Responsibility
Performance Description Reported Section reference Explanation
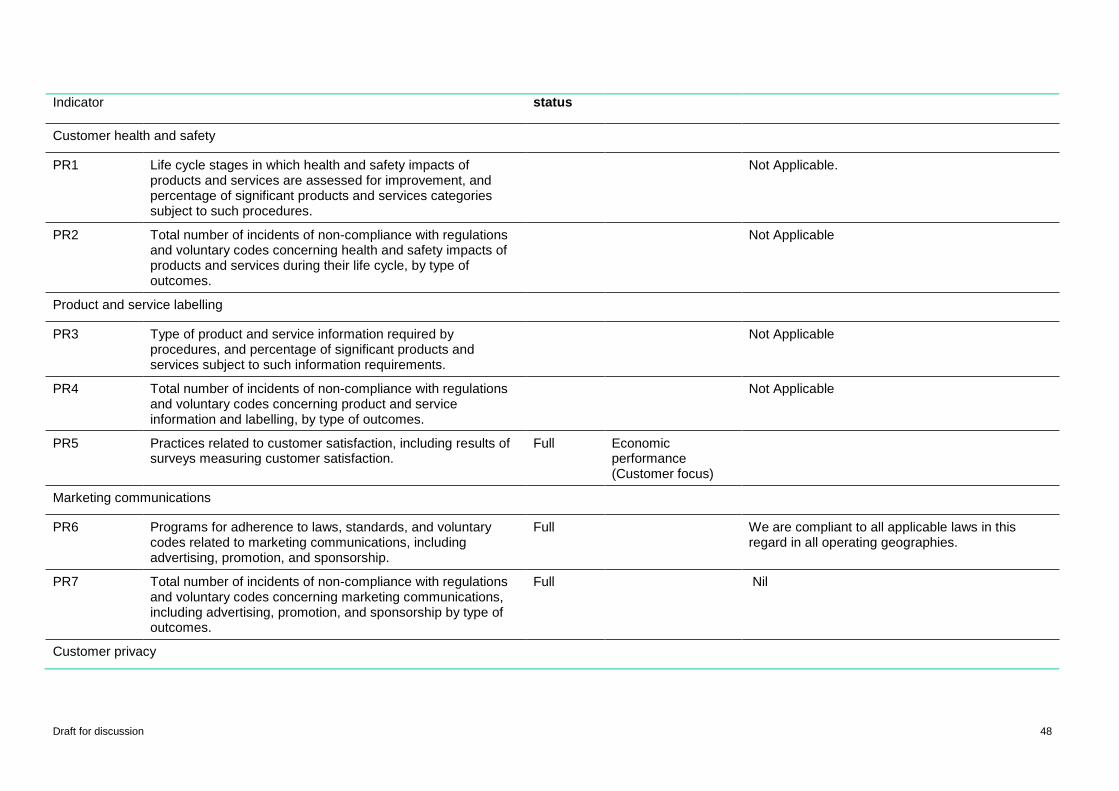
Draft for discussion 48
Indicator status
Customer health and safety
PR1 Life cycle stages in which health and safety impacts of products and services are assessed for improvement, and percentage of significant products and services categories subject to such procedures.
Not Applicable.
PR2 Total number of incidents of non-compliance with regulations and voluntary codes concerning health and safety impacts of products and services during their life cycle, by type of outcomes.
Not Applicable
Product and service labelling
PR3 Type of product and service information required by procedures, and percentage of significant products and services subject to such information requirements.
Not Applicable
PR4 Total number of incidents of non-compliance with regulations and voluntary codes concerning product and service information and labelling, by type of outcomes.
Not Applicable
PR5 Practices related to customer satisfaction, including results of surveys measuring customer satisfaction.
Full Economic performance (Customer focus)
Marketing communications
PR6 Programs for adherence to laws, standards, and voluntary codes related to marketing communications, including advertising, promotion, and sponsorship.
Full We are compliant to all applicable laws in this regard in all operating geographies.
PR7 Total number of incidents of non-compliance with regulations and voluntary codes concerning marketing communications, including advertising, promotion, and sponsorship by type of outcomes.
Full Nil
Customer privacy
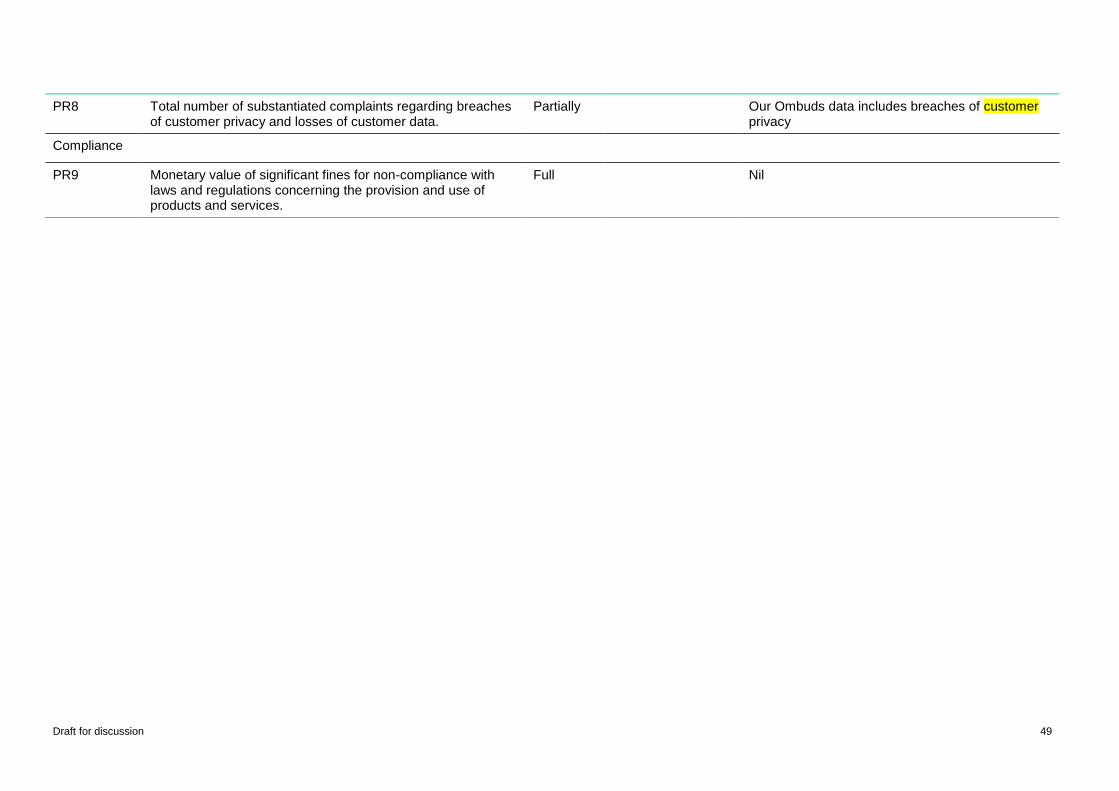
Draft for discussion 49
PR8 Total number of substantiated complaints regarding breaches of customer privacy and losses of customer data.
Partially Our Ombuds data includes breaches of customer privacy
Compliance
PR9 Monetary value of significant fines for non-compliance with laws and regulations concerning the provision and use of products and services.
Full Nil
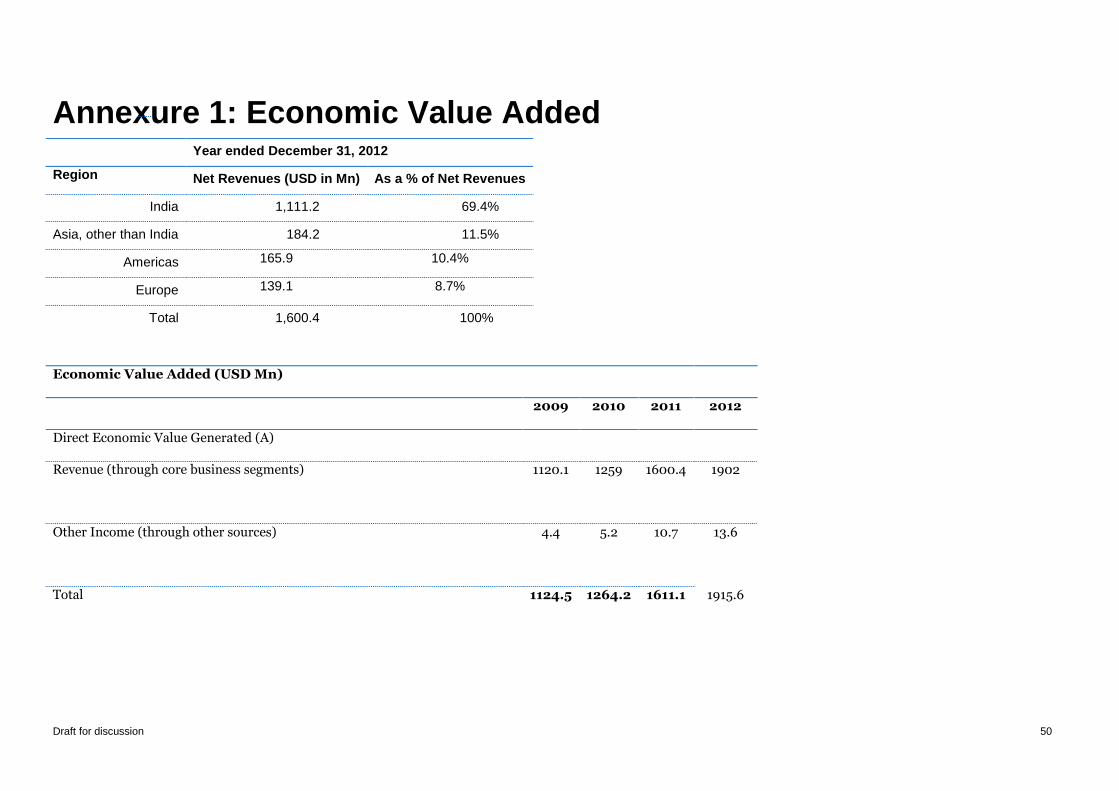
Draft for discussion 50
Annexure 1: Economic Value Added Year ended December 31, 2012
Region Net Revenues (USD in Mn) As a % of Net Revenues
India 1,111.2 69.4%
Asia, other than India 184.2 11.5%
Americas 165.9 10.4%
Europe 139.1 8.7%
Total 1,600.4 100%
Economic Value Added (USD Mn)
2009 2010 2011 2012
Direct Economic Value Generated (A)
Revenue (through core business segments) 1120.1 1259 1600.4 1902
Other Income (through other sources) 4.4 5.2 10.7 13.6
Total 1124.5 1264.2 1611.1 1915.6
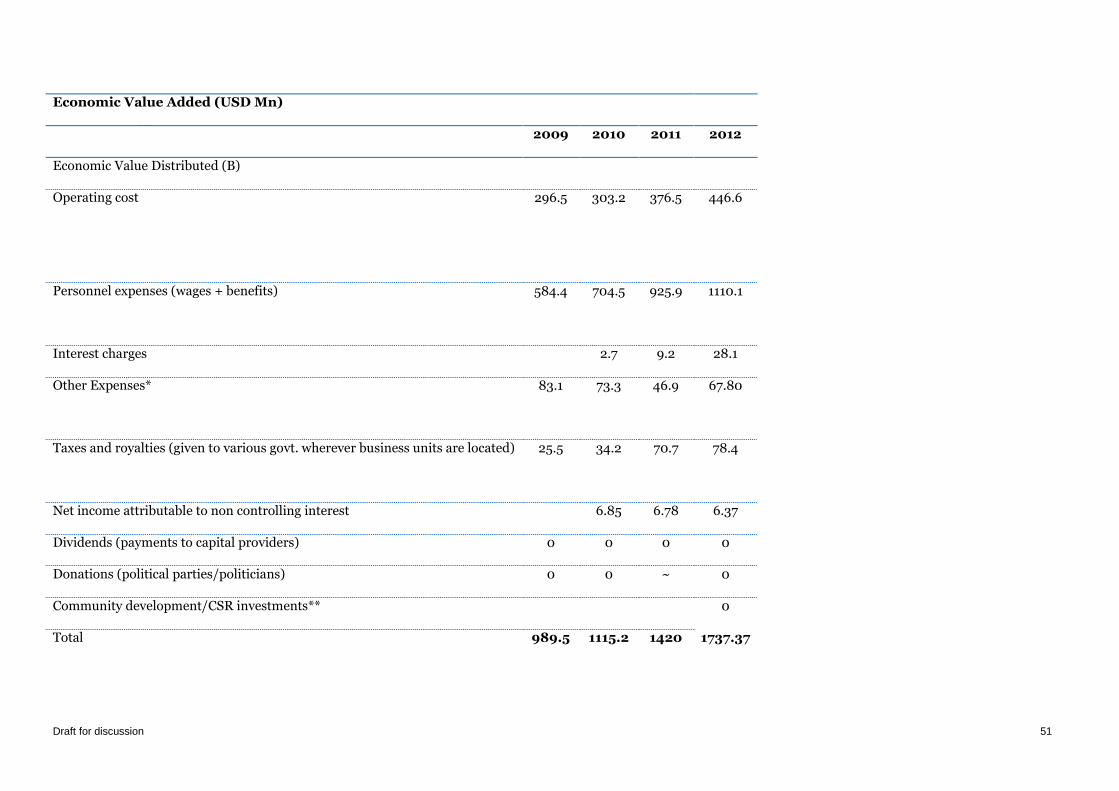
Draft for discussion 51
Economic Value Added (USD Mn)
2009 2010 2011 2012
Economic Value Distributed (B)
Operating cost 296.5 303.2 376.5 446.6
Personnel expenses (wages + benefits) 584.4 704.5 925.9 1110.1
Interest charges 2.7 9.2 28.1
Other Expenses* 83.1 73.3 46.9 67.80
Taxes and royalties (given to various govt. wherever business units are located) 25.5 34.2 70.7 78.4
Net income attributable to non controlling interest 6.85 6.78 6.37
Dividends (payments to capital providers) 0 0 0 0
Donations (political parties/politicians) 0 0 ~ 0
Community development/CSR investments** 0
Total 989.5 1115.2 1420 1737.37
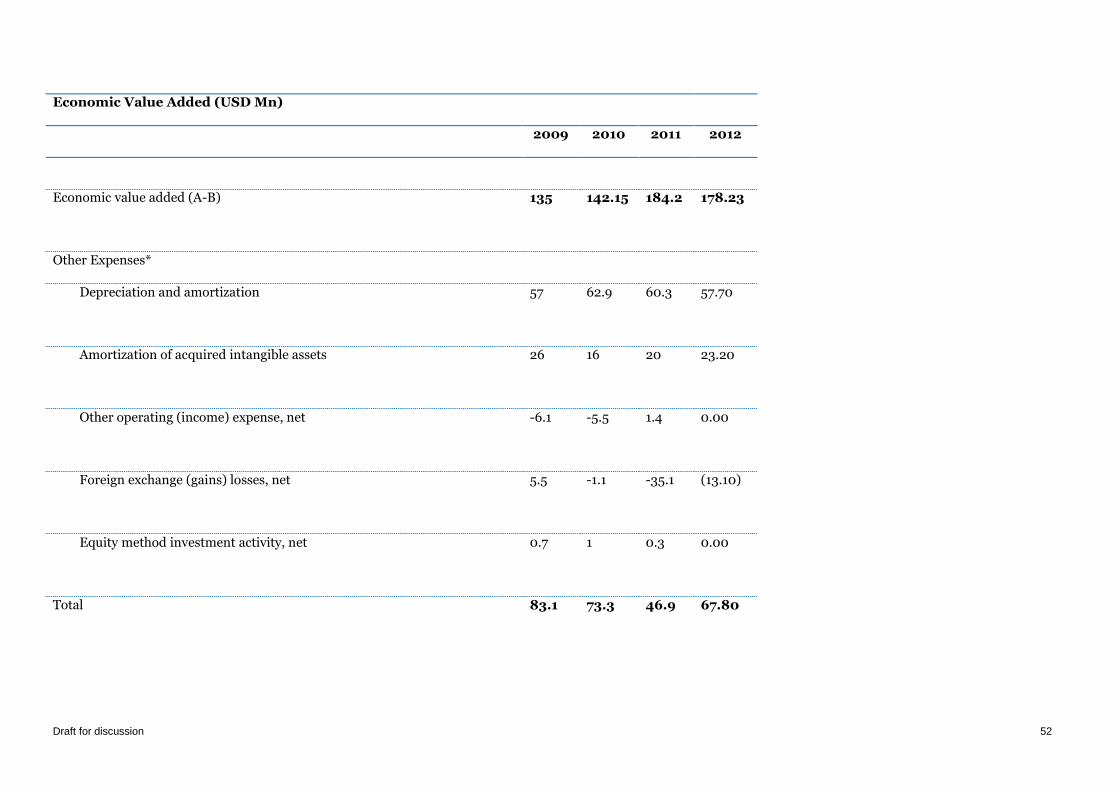
Draft for discussion 52
Economic Value Added (USD Mn)
2009 2010 2011 2012
Economic value added (A-B) 135 142.15 184.2 178.23
Other Expenses*
Depreciation and amortization 57 62.9 60.3 57.70
Amortization of acquired intangible assets 26 16 20 23.20
Other operating (income) expense, net -6.1 -5.5 1.4 0.00
Foreign exchange (gains) losses, net 5.5 -1.1 -35.1 (13.10)
Equity method investment activity, net 0.7 1 0.3 0.00
Total 83.1 73.3 46.9 67.80
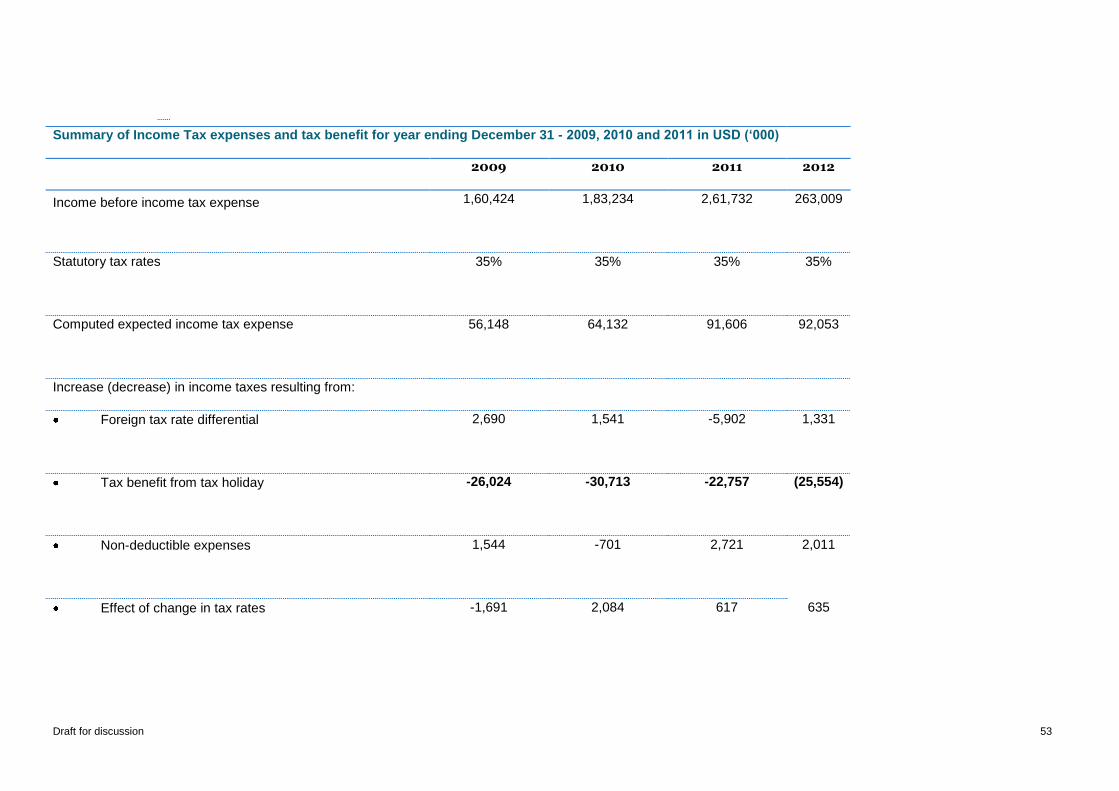
Draft for discussion 53
Summary of Income Tax expenses and tax benefit for year ending December 31 - 2009, 2010 and 2011 in USD (‘000)
2009 2010 2011 2012
Income before income tax expense 1,60,424 1,83,234 2,61,732 263,009
Statutory tax rates 35% 35% 35% 35%
Computed expected income tax expense 56,148 64,132 91,606 92,053
Increase (decrease) in income taxes resulting from:
Foreign tax rate differential 2,690 1,541 -5,902 1,331
Tax benefit from tax holiday -26,024 -30,713 -22,757 (25,554)
Non-deductible expenses 1,544 -701 2,721 2,011
Effect of change in tax rates -1,691 2,084 617 635
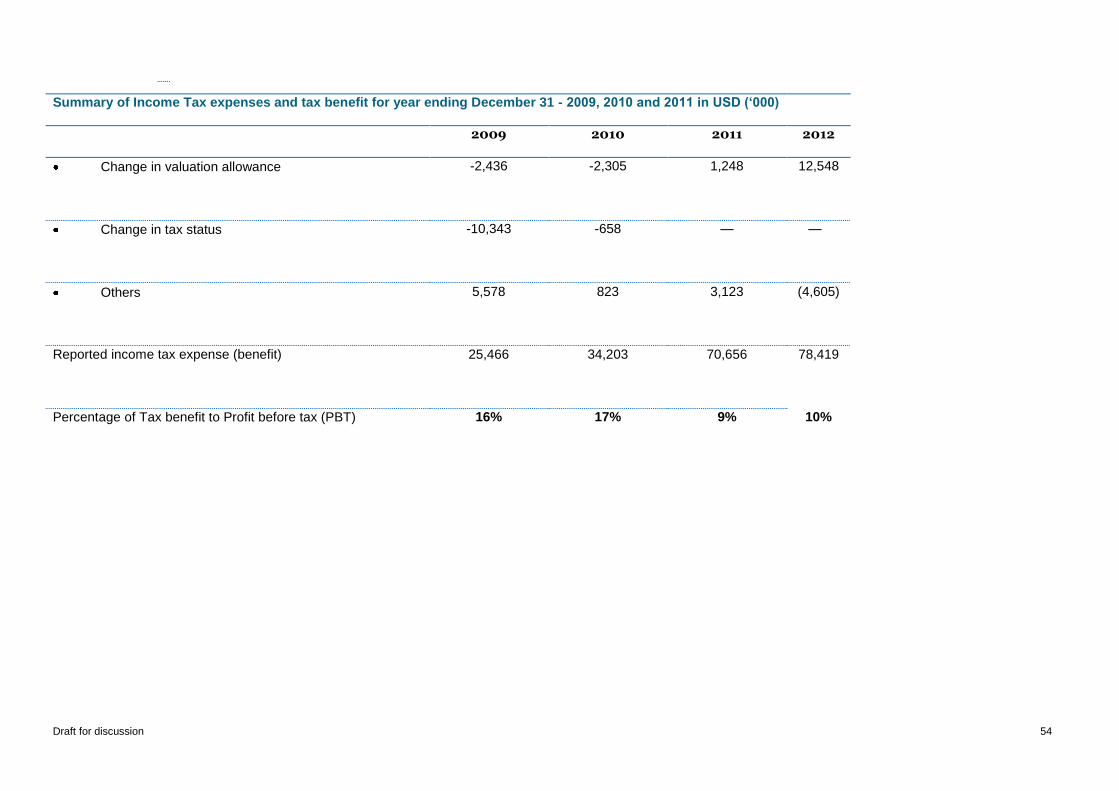
Draft for discussion 54
Summary of Income Tax expenses and tax benefit for year ending December 31 - 2009, 2010 and 2011 in USD (‘000)
2009 2010 2011 2012
Change in valuation allowance -2,436 -2,305 1,248 12,548
Change in tax status -10,343 -658 — —
Others 5,578 823 3,123 (4,605)
Reported income tax expense (benefit) 25,466 34,203 70,656 78,419
Percentage of Tax benefit to Profit before tax (PBT) 16% 17% 9% 10%
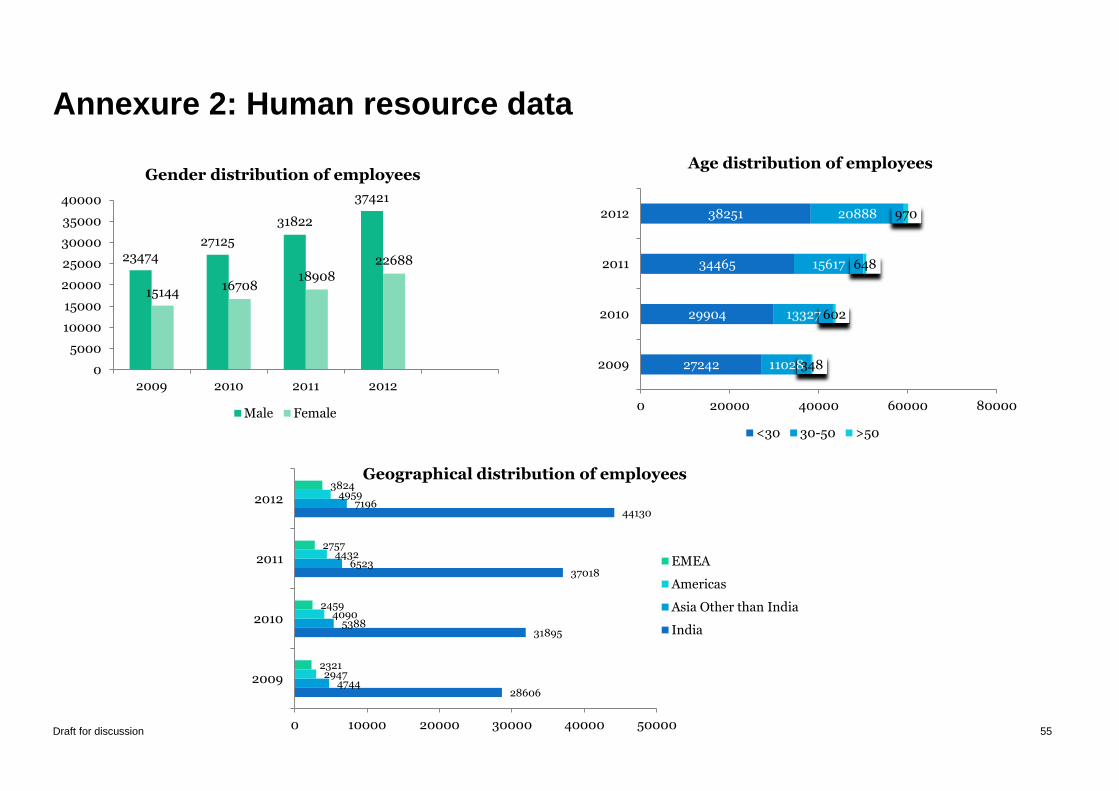
Draft for discussion 55
23474 27125
31822
37421
15144 16708
18908 22688
0
5000
10000
15000
20000
25000
30000
35000
40000
2009 2010 2011 2012
Gender distribution of employees
Male Female
27242
29904
34465
38251
11028
13327
15617
20888
348
602
648
970
0 20000 40000 60000 80000
2009
2010
2011
2012
Age distribution of employees
<30 30-50 >50
28606
31895
37018
44130
4744
5388
6523
7196
2947
4090
4432
4959
2321
2459
2757
3824
0 10000 20000 30000 40000 50000
2009
2010
2011
2012
Geographical distribution of employees
EMEA
Americas
Asia Other than India
India
Annexure 2: Human resource data
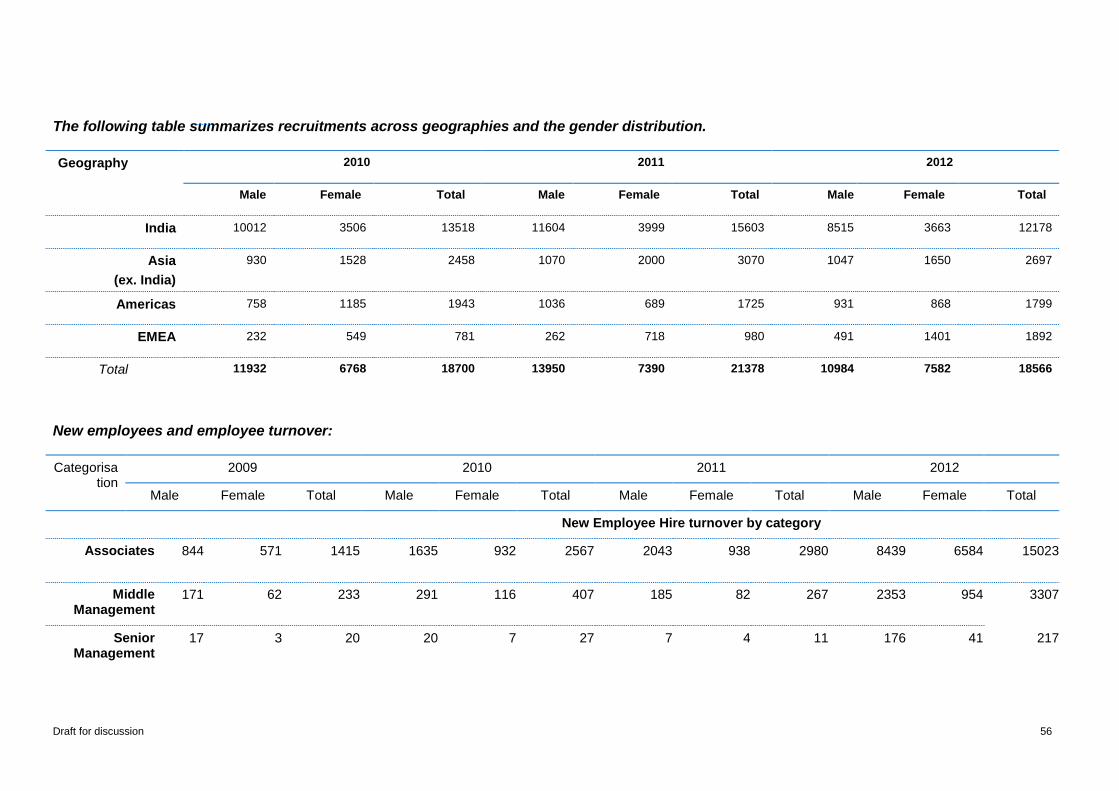
Draft for discussion 56
The following table summarizes recruitments across geographies and the gender distribution.
Geography 2010 2011 2012
Male Female Total Male Female Total Male Female Total
India 10012 3506 13518 11604 3999 15603 8515 3663 12178
Asia
(ex. India)
930 1528 2458 1070 2000 3070 1047 1650 2697
Americas 758 1185 1943 1036 689 1725 931 868 1799
EMEA 232 549 781 262 718 980 491 1401 1892
Total 11932 6768 18700 13950 7390 21378 10984 7582 18566
New employees and employee turnover:
Categorisation
2009 2010 2011 2012
Male Female Total Male Female Total Male Female Total Male Female Total
New Employee Hire turnover by category
Associates 844 571 1415 1635 932 2567 2043 938 2980 8439
6584
15023
Middle Management
171 62 233 291 116 407 185 82 267 2353
954
3307
Senior Management
17 3 20 20 7 27 7 4 11 176
41
217
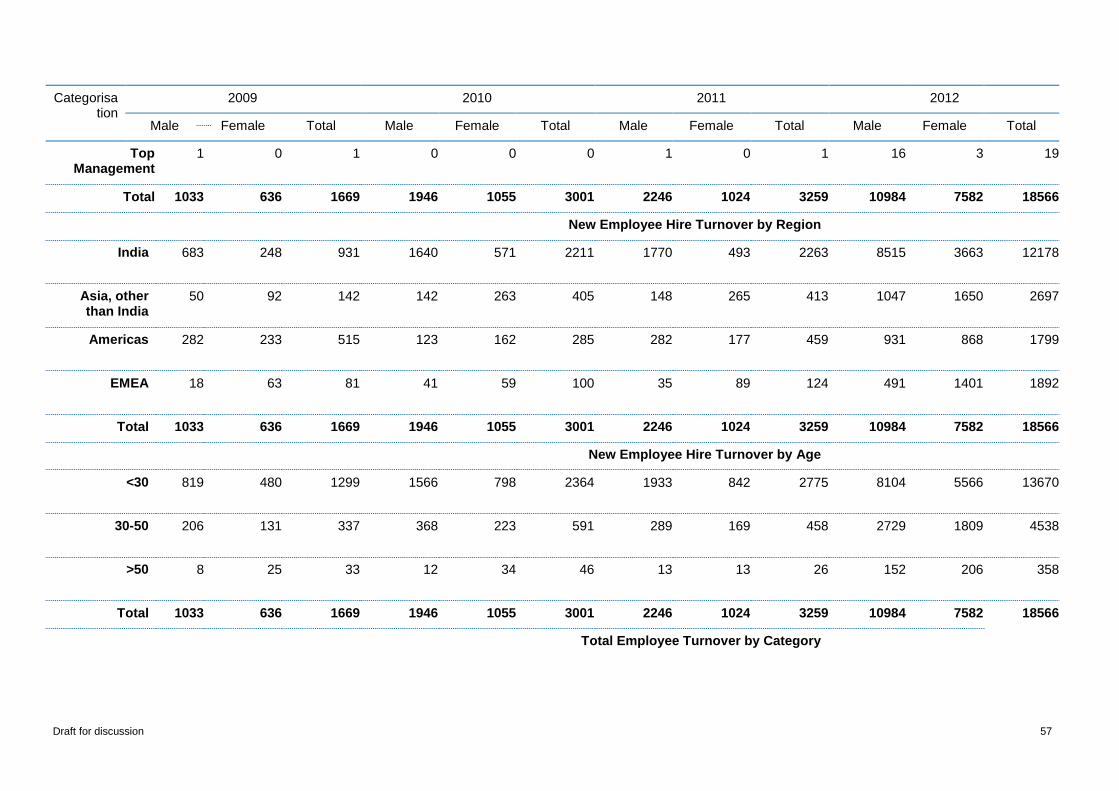
Draft for discussion 57
Categorisation
2009 2010 2011 2012
Male Female Total Male Female Total Male Female Total Male Female Total
Top Management
1 0 1 0 0 0 1 0 1 16
3
19
Total 1033 636 1669 1946 1055 3001 2246 1024 3259 10984 7582 18566
New Employee Hire Turnover by Region
India 683 248 931 1640 571 2211 1770 493 2263 8515
3663
12178
Asia, other than India
50 92 142 142 263 405 148 265 413 1047
1650
2697
Americas 282 233 515 123 162 285 282 177 459 931
868
1799
EMEA 18 63 81 41 59 100 35 89 124 491
1401
1892
Total 1033 636 1669 1946 1055 3001 2246 1024 3259 10984 7582 18566
New Employee Hire Turnover by Age
<30 819 480 1299 1566 798 2364 1933 842 2775 8104
5566
13670
30-50 206 131 337 368 223 591 289 169 458 2729
1809
4538
>50 8 25 33 12 34 46 13 13 26 152
206
358
Total 1033 636 1669 1946 1055 3001 2246 1024 3259 10984 7582 18566
Total Employee Turnover by Category
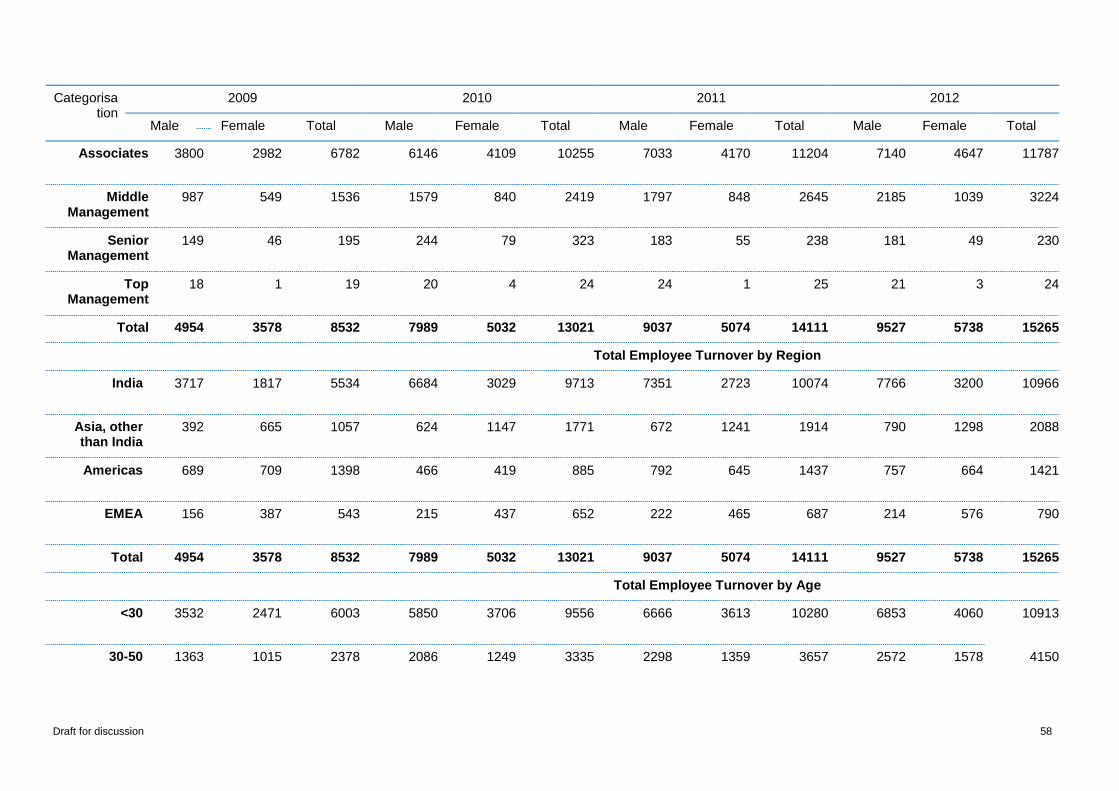
Draft for discussion 58
Categorisation
2009 2010 2011 2012
Male Female Total Male Female Total Male Female Total Male Female Total
Associates 3800 2982 6782 6146 4109 10255 7033 4170 11204 7140
4647
11787
Middle Management
987 549 1536 1579 840 2419 1797 848 2645 2185
1039
3224
Senior Management
149 46 195 244 79 323 183 55 238 181
49
230
Top Management
18 1 19 20 4 24 24 1 25 21
3
24
Total 4954 3578 8532 7989 5032 13021 9037 5074 14111 9527 5738 15265
Total Employee Turnover by Region
India 3717 1817 5534 6684 3029 9713 7351 2723 10074 7766
3200
10966
Asia, other than India
392 665 1057 624 1147 1771 672 1241 1914 790
1298
2088
Americas 689 709 1398 466 419 885 792 645 1437 757
664
1421
EMEA 156 387 543 215 437 652 222 465 687 214
576
790
Total 4954 3578 8532 7989 5032 13021 9037 5074 14111 9527 5738 15265
Total Employee Turnover by Age
<30 3532 2471 6003 5850 3706 9556 6666 3613 10280 6853
4060
10913
30-50 1363 1015 2378 2086 1249 3335 2298 1359 3657 2572 1578 4150
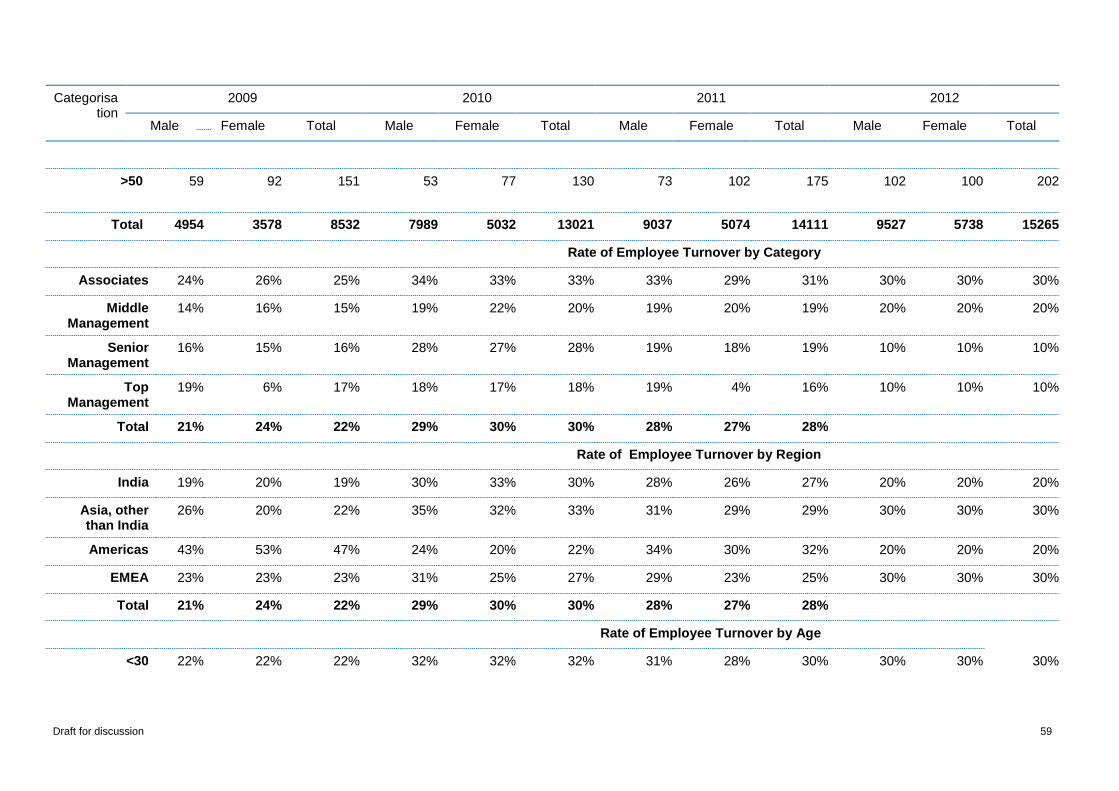
Draft for discussion 59
Categorisation
2009 2010 2011 2012
Male Female Total Male Female Total Male Female Total Male Female Total
>50 59 92 151 53 77 130 73 102 175 102
100
202
Total 4954 3578 8532 7989 5032 13021 9037 5074 14111 9527 5738 15265
Rate of Employee Turnover by Category
Associates 24% 26% 25% 34% 33% 33% 33% 29% 31% 30% 30% 30%
Middle Management
14% 16% 15% 19% 22% 20% 19% 20% 19% 20% 20% 20%
Senior Management
16% 15% 16% 28% 27% 28% 19% 18% 19% 10% 10% 10%
Top Management
19% 6% 17% 18% 17% 18% 19% 4% 16% 10% 10% 10%
Total 21% 24% 22% 29% 30% 30% 28% 27% 28%
Rate of Employee Turnover by Region
India 19% 20% 19% 30% 33% 30% 28% 26% 27% 20% 20% 20%
Asia, other than India
26% 20% 22% 35% 32% 33% 31% 29% 29% 30% 30% 30%
Americas 43% 53% 47% 24% 20% 22% 34% 30% 32% 20% 20% 20%
EMEA 23% 23% 23% 31% 25% 27% 29% 23% 25% 30% 30% 30%
Total 21% 24% 22% 29% 30% 30% 28% 27% 28%
Rate of Employee Turnover by Age
<30 22% 22% 22% 32% 32% 32% 31% 28% 30% 30% 30% 30%
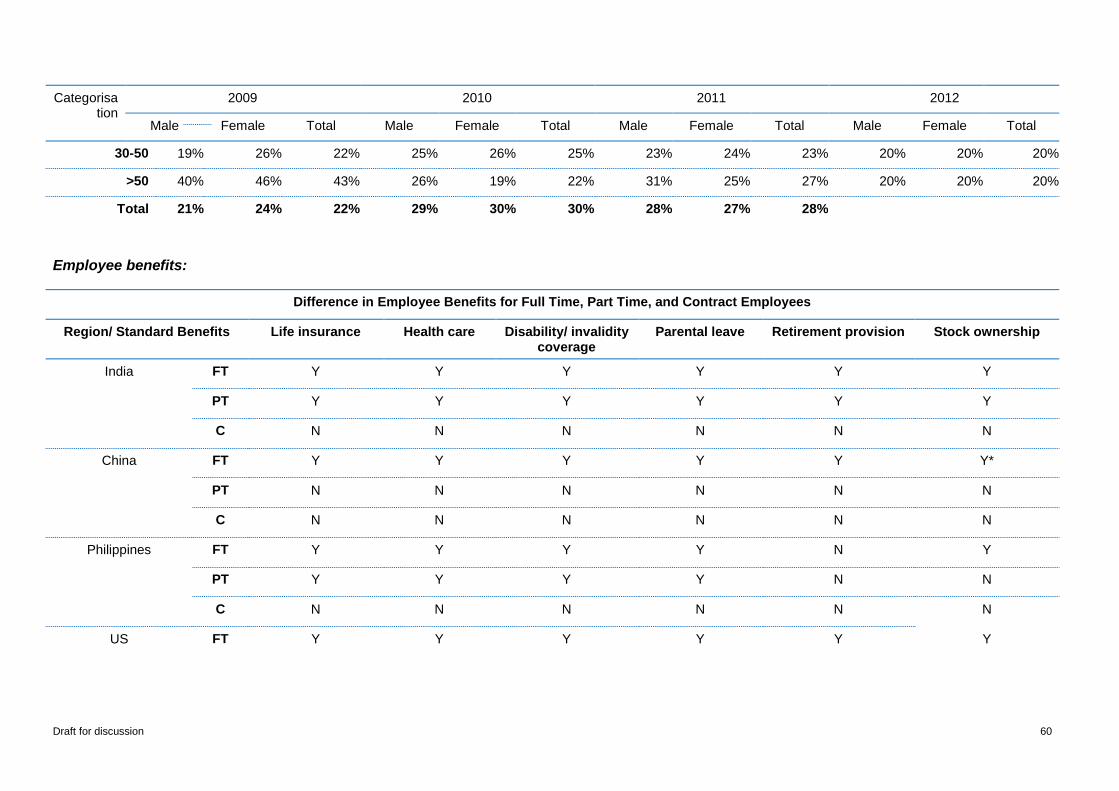
Draft for discussion 60
Categorisation
2009 2010 2011 2012
Male Female Total Male Female Total Male Female Total Male Female Total
30-50 19% 26% 22% 25% 26% 25% 23% 24% 23% 20% 20% 20%
>50 40% 46% 43% 26% 19% 22% 31% 25% 27% 20% 20% 20%
Total 21% 24% 22% 29% 30% 30% 28% 27% 28%
Employee benefits:
Difference in Employee Benefits for Full Time, Part Time, and Contract Employees
Region/ Standard Benefits Life insurance Health care Disability/ invalidity coverage
Parental leave Retirement provision Stock ownership
India FT Y Y Y Y Y Y
PT Y Y Y Y Y Y
C N N N N N N
China FT Y Y Y Y Y Y*
PT N N N N N N
C N N N N N N
Philippines FT Y Y Y Y N Y
PT Y Y Y Y N N
C N N N N N N
US FT Y Y Y Y Y Y
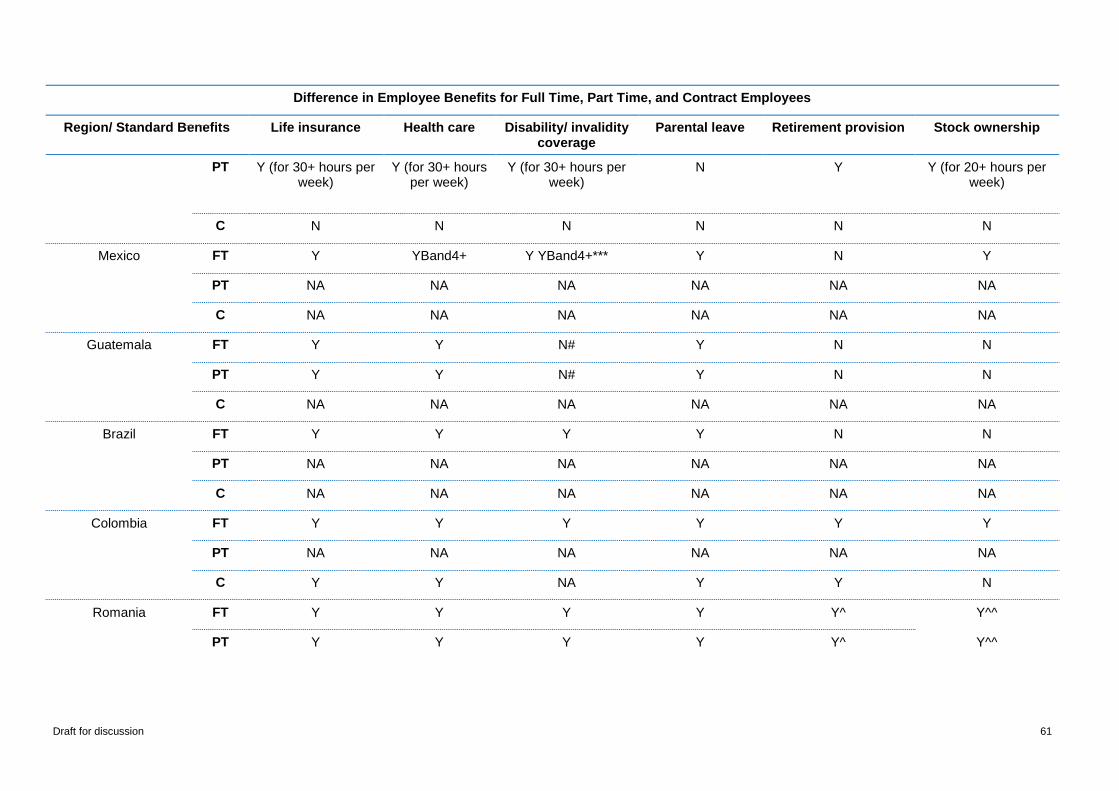
Draft for discussion 61
Difference in Employee Benefits for Full Time, Part Time, and Contract Employees
Region/ Standard Benefits Life insurance Health care Disability/ invalidity coverage
Parental leave Retirement provision Stock ownership
PT Y (for 30+ hours per week)
Y (for 30+ hours per week)
Y (for 30+ hours per week)
N Y Y (for 20+ hours per week)
C N N N N N N
Mexico FT Y YBand4+ Y YBand4+*** Y N Y
PT NA NA NA NA NA NA
C NA NA NA NA NA NA
Guatemala FT Y Y N# Y N N
PT Y Y N# Y N N
C NA NA NA NA NA NA
Brazil FT Y Y Y Y N N
PT NA NA NA NA NA NA
C NA NA NA NA NA NA
Colombia FT Y Y Y Y Y Y
PT NA NA NA NA NA NA
C Y Y NA Y Y N
Romania FT Y Y Y Y Y^ Y^^
PT Y Y Y Y Y^ Y^^
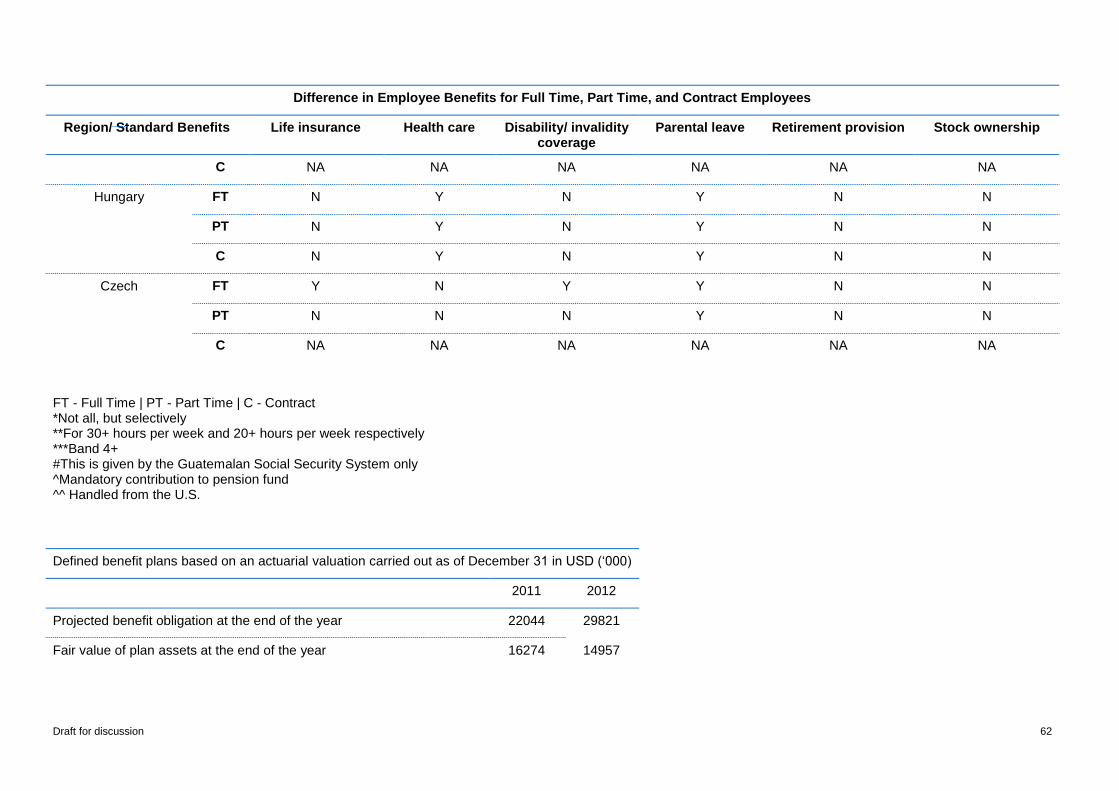
Draft for discussion 62
Difference in Employee Benefits for Full Time, Part Time, and Contract Employees
Region/ Standard Benefits Life insurance Health care Disability/ invalidity coverage
Parental leave Retirement provision Stock ownership
C NA NA NA NA NA NA
Hungary FT N Y N Y N N
PT N Y N Y N N
C N Y N Y N N
Czech FT Y N Y Y N N
PT N N N Y N N
C NA NA NA NA NA NA
FT - Full Time | PT - Part Time | C - Contract *Not all, but selectively **For 30+ hours per week and 20+ hours per week respectively ***Band 4+ #This is given by the Guatemalan Social Security System only ^Mandatory contribution to pension fund ^^ Handled from the U.S.
Defined benefit plans based on an actuarial valuation carried out as of December 31 in USD (‘000)
2011 2012
Projected benefit obligation at the end of the year 22044 29821
Fair value of plan assets at the end of the year 16274 14957
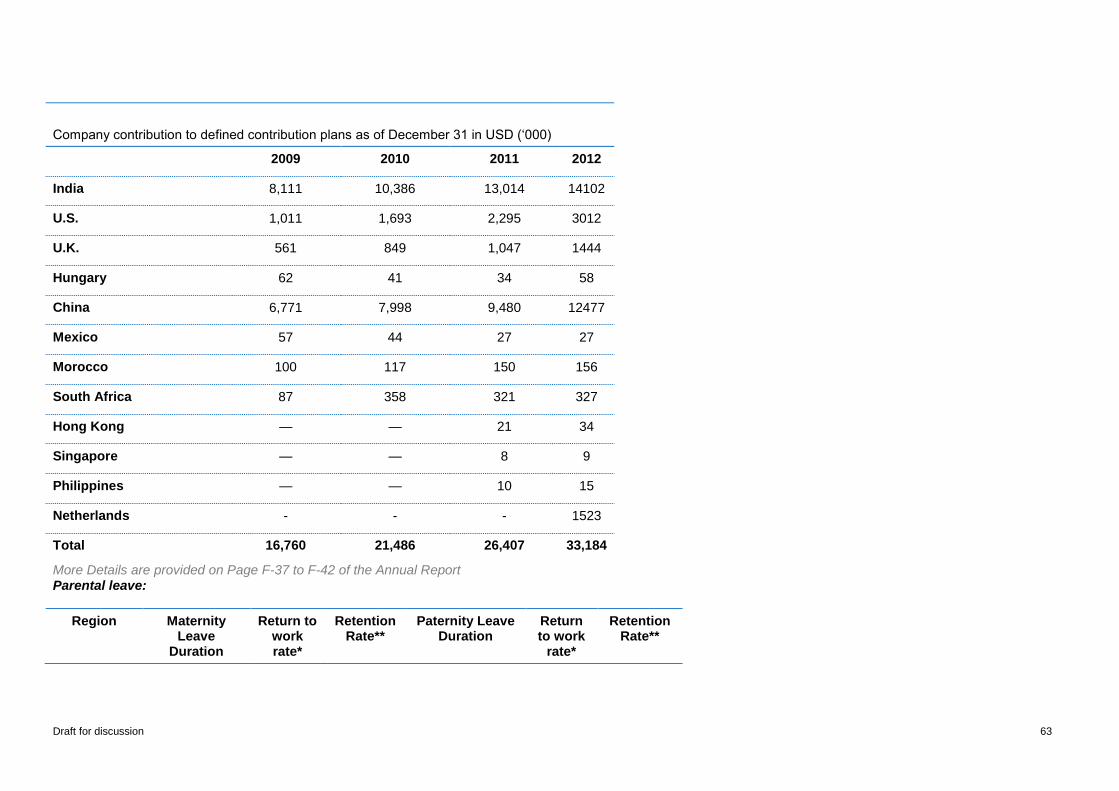
Draft for discussion 63
Company contribution to defined contribution plans as of December 31 in USD (‘000)
2009 2010 2011 2012
India 8,111 10,386 13,014 14102
U.S. 1,011 1,693 2,295 3012
U.K. 561 849 1,047 1444
Hungary 62 41 34 58
China 6,771 7,998 9,480 12477
Mexico 57 44 27 27
Morocco 100 117 150 156
South Africa 87 358 321 327
Hong Kong — — 21 34
Singapore — — 8 9
Philippines — — 10 15
Netherlands - - - 1523
Total 16,760 21,486 26,407 33,184
More Details are provided on Page F-37 to F-42 of the Annual Report Parental leave:
Region Maternity Leave
Duration
Return to work rate*
Retention Rate**
Paternity Leave Duration
Return to work
rate*
Retention Rate**
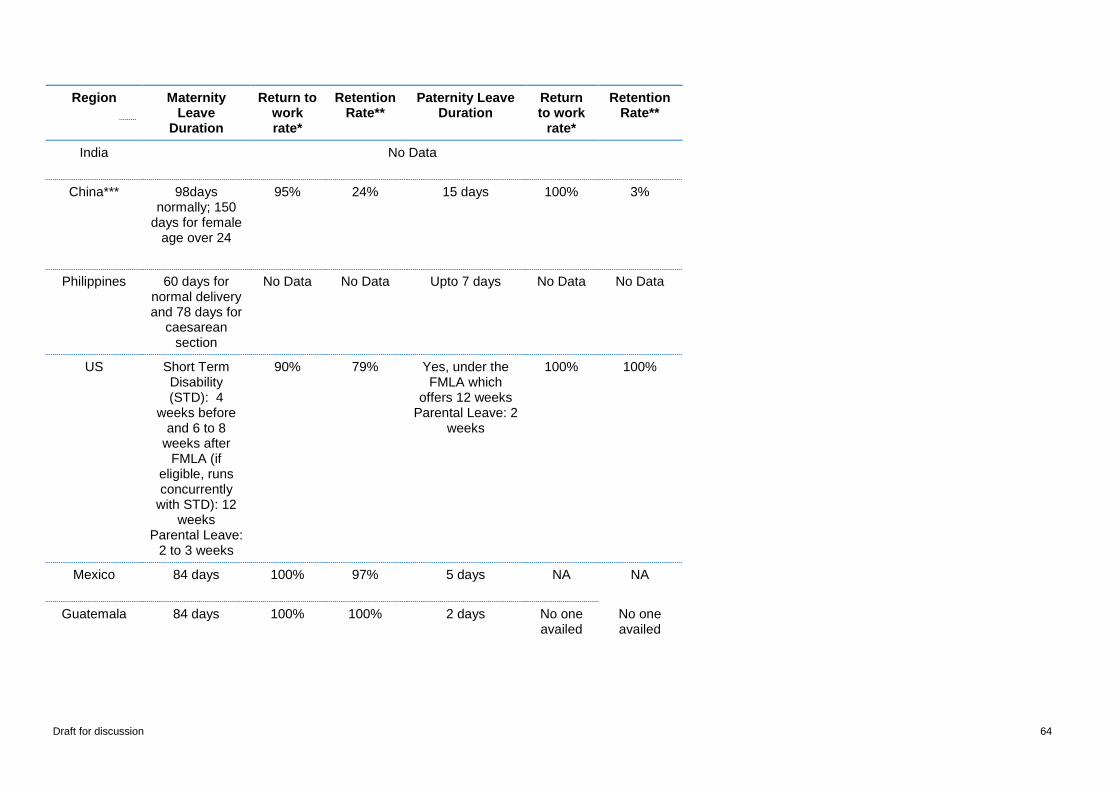
Draft for discussion 64
Region Maternity Leave
Duration
Return to work rate*
Retention Rate**
Paternity Leave Duration
Return to work
rate*
Retention Rate**
India No Data
China*** 98days normally; 150
days for female age over 24
95%
24%
15 days 100% 3%
Philippines 60 days for normal delivery and 78 days for
caesarean section
No Data No Data Upto 7 days No Data No Data
US Short Term Disability (STD): 4
weeks before and 6 to 8
weeks after FMLA (if
eligible, runs concurrently
with STD): 12 weeks
Parental Leave: 2 to 3 weeks
90% 79% Yes, under the FMLA which
offers 12 weeks Parental Leave: 2
weeks
100% 100%
Mexico 84 days 100% 97% 5 days NA NA
Guatemala 84 days 100% 100% 2 days No one availed
No one availed
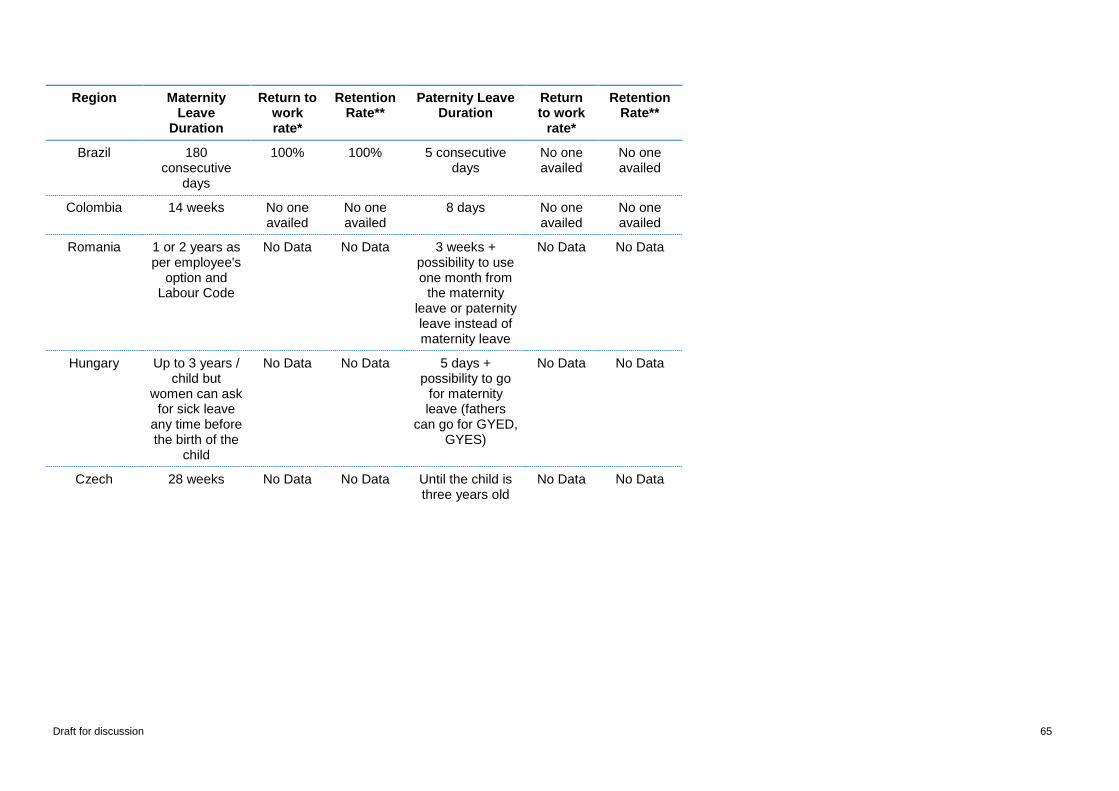
Draft for discussion 65
Region Maternity Leave
Duration
Return to work rate*
Retention Rate**
Paternity Leave Duration
Return to work
rate*
Retention Rate**
Brazil 180 consecutive
days
100% 100% 5 consecutive days
No one availed
No one availed
Colombia 14 weeks No one availed
No one availed
8 days No one availed
No one availed
Romania 1 or 2 years as per employee's
option and Labour Code
No Data No Data 3 weeks + possibility to use one month from
the maternity leave or paternity leave instead of maternity leave
No Data No Data
Hungary Up to 3 years / child but
women can ask for sick leave
any time before the birth of the
child
No Data No Data 5 days + possibility to go
for maternity leave (fathers
can go for GYED, GYES)
No Data No Data
Czech 28 weeks No Data No Data Until the child is three years old
No Data No Data

98
Canon’s Court, 22 Victoria Street, Hamilton HM 12, Bermuda (441) 295-2244www.genpact.com