Embed Size (px)
Citation preview
Sustainability
Planning and
Monitoringin Community Water Supply and Sanitation
Edited by:
Nilanjana Mukherjee
Christine van Wijk
A Guide on the Methodology for Participatory Assessment (MPA)
for Community-Driven Development Programs
International Water and Sanitation Centre
This document is an update, supplemented with learning gained from MPA
applications worldwide during 1999-2002, of the original MPA Metguide published
in March 2000.
The Metguide (Methodology for Participatory Assessment with Communities,
Institutions and Policy Makers) was developed by WSP and IRC in 1998 primarily
for the purpose of conducting a global study in 15 countries, which investigated
the links between the sustainability of community-marged water supply services
and gender- and poverty-sensitivity of demand-responsive approaches used to
establish the services.
Since the completion of the global study in 1999, MPA has developed further as a
tool for mainstreaming gender and social equity in large scale projects. Its
applications have expanded from evaluation and monitoring to designing and
planning new project interventions, and from dedicated water supply and
sanitation projects into the realm of multi-sector project designs.
This document presents the MPA as it is currently being used in Asia, Africa and
Latin America. It consolidates the lessons learned in the process of its continuing
development.
Section 1 of this book represents an extensively re-written and supplemented version
of the original Metguide, by the editors Nilanjana Mukherjee and Christine van
Wijk. Section 2 contains case studies contributed by Bruce Gross, Suzanne Reiff,
Soutsakhone Chanthaphone, Santanu Lahiri, Christine van Wijk, Nilanjana
Mukherjee, Nina Shatifan and Richard Hopkins. Photographs on the cover and
inside were contributed by MPA practitioners in different parts of the world.
i
Sustainability
Planning and
Monitoringin Community Water Supply and Sanitation
Edited by:
Nilanjana Mukherjee
Christine van Wijk
A Guide on the Methodology for Participatory Assessment (MPA)
for Community-Driven Development Programs

ii
iii
Foreword
Jamal SaghirJamal SaghirJamal SaghirJamal SaghirJamal Saghir WWWWWalter Stottmannalter Stottmannalter Stottmannalter Stottmannalter StottmannDirector Program ManagerEnergy and Water Water and Sanitation ProgramChairWater Supply and SanitationSector BoardThe World Bank
AAAAAccess to safe water and sanitation lies atthe very core of poverty reduction.Improved access gives the poor, especially
women, control over basic aspects of their life anda sense of empowerment.
Within the context of the Millennium DevelopmentGoals for water and sanitation, interventions mustbe designed to strike more effectively at the rootsof global poverty and involve more than the mereconstruction of facilities. The keys to success willbe establishing pro-poor policies and institutionalpractices; promoting sustainable financingmechanisms; and sharing knowledge with andbuilding capacities in institutions for scaling upsustainable and equitable water and sanitationservices. Meeting these targets at the ground levelwill require infrastructure improvement projects thatuse appropriate targeting strategies, involvecommunities in decision making, and measureachievements in social equity and justice.
The Methodology for Participatory Assessment(MPA) offers the mechanism needed to track genderand social equity in large-scale infrastructureprojects and measure progress of the goal toprovide sustainable services for all. Increasedinvestment flows can reach the poor. Community-driven projects– those that represent the needs andchoices of each member of the community–provide the channel.
The Water and Sanitation Program (WSP) andthe IRC International Water and Sanitation Centre
developed the MPA through a global pilotingand validation exercise in 18 large-scale projectsin 15 countries. The study, Linking Sustainabilitywith Demand, Gender and Poverty, foundempirical evidence that community-managedwater supply services, which employed demand-responsive approaches sensitive to gender andpoverty issues, were more sustainable and moreeffectively used.
Since its inception in 1998, the MPA has gainedwide appreciation and popularity with sectorstakeholders in Asia, Africa, and Latin America.Country governments, donor agencies, andNGOs active in water supply and sanitation haveinvested in building institutional capacities for itsuse and in tailoring MPA applications to their workat the policy, institution, and community levels. Inthe process new applications have been developedand fielded, strengths and weaknesses of the MPArecognized and addressed, quality controlmeasures identified, and knowledge generatedfrom the field widely shared. In this book, WSPand IRC bring together the fruits of learning gainedby and with partners worldwide during the period1999 - 2002.
The MPA can empower poor communities to plan,manage, and sustain their water and sanitationservices, and gain control over their life, health,and environment. This volume and its companionmaterials can ensure that the poor exercise theirrightful voice and choice in community-drivendevelopment processes.
iv
Preface
TTTTThe mission of the Water and Sanitation Program
(WSP) is to alleviate poverty by helping poor
people gain sustained access to improved water
and sanitation services. WSP works with partners in the
field to seek innovative solutions to the obstacles faced
by the poor communities, and strives to be a valued
source of knowledge with which to assist widespread
adoption of these solutions. Over its 25 year existence
the WSP has evolved into a major field-based learning
and policy facilitation network, supported through a
partnership of the world’s leading development
agencies. The WSP has a track record in advancing the
understanding of gender, participation, institutional and
policy aspects of poverty reduction.
In 1997 the WSP and IRC jointly launched the
Participatory Learning and Action (PLA) Initiative, a
global partnership of agencies to improve the
understanding of the links between gender,
participation, demand and sustainability of community-
managed water supply and sanitation services. During
1998 and 1999 these links were investigated through
action research in 15 countries using a common
methodology developed for the purpose, the
Methodology for Participatory Assessment (MPA). The
results provided empirical evidence that better sustained
and used services were significantly and positively
associated with the use of gender- and poverty-sensitive
demand-responsive approaches, in project
implementation, institutional practices and policies
(Linking Sustainability with Demand, Gender and
Poverty, WSP-IRC, 2001*).
Then began a capacity building phase to use the learning
gained and the tools developed, to influence the way
water - sanitation programs are designed, implemented
and monitored, by stakeholders at all levels. Work has
been underway since 2000, in a set of mutually
reinforcing streams:
Developing and institutionalizing national and
local capacities in the use of MPA so that funding
agencies, project and task managers may access
such expertise without having to invest extensively
in training every time such skills are needed. The
MPA’s analytical framework is focused on
sustainability and integrates gender and poverty
concerns at every stage of project planning,
implementation and monitoring. This makes MPA
easy to assimilate in project design and
management processes. Institutionalization
however needs to proceed with the understanding
that the full potential of MPA can only be realized
with proper training, even of those with long
experience in participatory methods, and with
quality control measures in scaling up.
* Also available on www.wsp.org
v
Application of MPA to large-scale programs, with a
tailoring of applications to project settings and
needs, and building in safeguards for MPA’s
interactive learning and empowering characteristics.
The very first applications fielded were for project
evaluations. Now applications have also developed
and are being used for project preparation, planning
and monitoring. Additionally, applications have
been developed for the facilitation of policy
formulation/improvement and institutional change
processes.
Expanding the application of the MPA analytical
framework to other sectors that work with
community-managed services, by developing sector-
specific indicators for sustainability and effective
use. Potential areas that have been identified or
partially explored to date include rural energy,
watershed development and management, multi-
sector CDD type projects.
Establishing quality assurance mechanisms for a
global community of practice that is evolving. MPA
practitioners need periodic opportunities to meet,
take stock of their learning, subject new
developments to independent audits for validity,
reliability and quality, and agree on some “core
uncompromisable quality and ethical principles”
to guide their work. This is a vital requirement for
an open-ended methodology that has high
potential for growth and institutionalization such
as the MPA. Unfortunately, funding for such
activities is more difficult to access than for project
applications.
This resource guide consolidates the current knowledge
about MPA in the form that it has now evolved,
incorporating learning from all the above areas, since
year 1999.
Section 1(Methodology for Participatory Assessments)
consists of 6 chapters. The first chapter (The Challenge
of Sustained Water Supply and Sanitation for All)
establishes the rationale for new ways of measuring
development effectiveness, since the global goals are
now defined with respect to sustainability, poverty
alleviation, gender equity and empowerment.
Chapter 2 (A New Tool for Planners and Managers of
Large Community-Driven Development Programs)
identifies who can use the MPA to accomplish what, and
explains what new advantages it adds for project
planners and managers.
Chapter 3 (The MPA Framework and Process) explains
the analytical framework of the MPA, the variables and
indicators to measure at each stakeholder’s level, and
the relationships among them.
Chapter 4 (The MPA in Action) is a process guide for
implementing assessments with stakeholders at various
levels.
Chapter 5 (Organizing and Interpreting the Data)
describes, with practical examples, a range of ways in
which results of MPA assessments can be organized,
presented and analyzed by participating communities,
implementing agencies and policymakers.
Chapter 6 (Participatory Tools Used in the MPA) contains
brief, illustrated descriptions of the participatory tools
used in MPA assessments at each level. This chapter
however, is intended as explanatory and reference
material, rather than a step-by-step guide. The latter
can be found in the MPA fieldbook, provided during
training.
Section 2 (MPA Application Case Studies) is a
compilation of seven case studies of MPA applications
for the purposes of: project planning, evaluation,
monitoring and design; action research exploring links
between policies, project rules and community level
project outcomes; and an illustration of the MPA’s
potential as a catalyser of social change within
communities.
The Appendices include a sample of a policy assessment
exercise using MPA tools and contact information about
institutions where MPA-trained facilitators and trainers
can be found in Asia, Africa, Europe and Latin America.

vi
Acknowledgements
TTTTThe Participatory Learning and Action
Initiative (PLAI: 1998-2000) brought
together a global core group* of
individuals and agencies into a partnership, which
continues to work together for mainstreaming
gender, and poverty concerns in water supply and
sanitation.
This resource guide on the Methodology for
Participatory Assessment (MPA) is a product of that
partnership between the Water and Sanitation
Program and the IRC International Water and
Sanitation Centre. The Initiative, funded by the
governments of Canada, The Netherlands,
Norway, Sweden and the Africa region of the
UNDP, concluded in early 2000 with the
development of the gender-poverty-mainstreaming
methodology, its validation through a global study
in 15 countries, and the production of training
materials and country reports.
Thereafter MPA has steadily gained popularity with
sector stakeholders as country governments,
external support agencies, national NGOs and
training institutions in Asia, Africa and Latin
America have discovered its potential and invested
in building capacities for its use. They have funded
the development of MPA applications tailored to
their country contexts, languages and learning
needs, allowing the global WSP-IRC core team to
further refine the methodology and integrate it
with institutional and policy reform efforts in a
growing number of countries. This resource guide
draws upon the learning gained in the post-PLAI
period, by and with government and NGO partner
agencies in Indonesia, Lao PDR, Cambodia,
Vietnam, The Philippines, Peru, Bolivia, India,
Nepal, Benin, Tanzania and Uganda. External
funding for these MPA applications came from
the governments of Australia, Canada, Denmark,
Germany, Luxembourg, Sweden, The Netherlands
and the United Kingdom.
This book draws substantially upon its predecessor,
the MPA Metguide published in 2000 and co-
authored by the present editors with Rekha Dayal.
However, it is not merely a new edition of the
Metguide. It is a synthesis of learning gained
through field applications by MPA practitioners
across the world, all of whom have contributed to
its evolution to the current state as described in
Section 1 of this book. Several of them have also
* Global steering group of PLAI: Bruce Gross, Christine van Wijk, Rekha Dayal, Nilanjana Mukherjee, RoseLidonde, Noma Musabayane, Suzanne Reiff, Jennifer Francis, Shalini Sinha. A.J. James joined the group in 1999.

vii
penned case studies of MPA applications for
Section 2, namely, Bruce Gross, Suzanne Reiff,
Nina Shatifan, Soutsakhone Chanthaphone,
Santanu Lahiri and Richard Hopkins.
We deeply appreciate the support of the
managements of the Water and Sanitation
Program (WSP) and IRC. Specifically, we would
like to express our thanks to Jamal Saghir, Director,
Energy and Water Department, the World Bank;
Walter Stottmann, Manager, WSP and
Parameswaran Iyer, Senior WSS Specialist, WSP,
for having faith that this product will be of value
to sector professionals and therefore providing
funds for its preparation. Our grateful thanks are
due to Caroline van den Berg and Richard Pollard,
the past and present Regional Team Leaders of
WSP-East Asia (where most of the drafting and
editing was done), for their keen interest, valuable
advice and demand for rigor. Funds received from
the World Bank for printing the book are gratefully
acknowledged.
Within IRC, Jennifer Francis and Maria Lucia Borba
were co-developers from the first hour onwards,
later joined by Leonie Postma, Francois Brikke,
Corine Otte and Michelle Moffat in NEWAH. Jan
Teun Visscher, Director IRC and Eveline Bolt, Head
of Research, ensured that the work was included
in IRC’s long-term program. Special thanks also
go to Mariela Garcia Vargas in CINARA, whose
critical review was the basis for continued operation
and documentation.
The MPA flag-bearers who have led country-
specific operationalization from within WSP are
Rose Lidonde and Suzanne Reiff in WSP - Africa
and Indrawati Josodipoero, Sisavanh
Phanouvong and Hoa Hoang Thi in WSP - East
Asia and the Pacific. Bruce Gross, former PLA
Initiative team leader, has contributed greatly
through deepening his hands-on involvement
with MPA in East Asia following his retirement
from the World Bank. Peter Feldman (Partners
for Development) and Bouy Kim Sreang have
opened up MPA chapters with sector partners in
Cambodia.
We owe much to our peer reviewers Michael
Bamberger (retired Senior Sociologist, Gender
and Development Group, World Bank), Josette
Murphy Malley (ex- Senior Evaluation Specialist,
ARD, World Bank) and Wendy Wakeman
(Senior Community Development Specialist,
PRMGE, World Bank). Their incisive comments,
valuable cri t ic ism, detai led scrut iny and
thought-provoking quest ions helped us
immensely in bringing greater clarity and
balance to our work.
All the photographs used in the book except
two were contributed by MPA practitioners and
enthusiasts including Bruce Gross, Leonie
Postma, Ratna Indrawati Josodipoero, Devi
Ariandy Setiawan, Kumala Sari, Thomas
Meadley, Nina Shatifan, Suzanne Reiff, Andrew
Whillas, SAWAC (NGO in Cambodia), CINARA
(Columbia), NEWAH (Nepal) and the editors of
this book.
Finally, and most importantly, we acknowledge
with the deepest gratitude the time, energy,
enthusiasm and resources contributed by
thousands of women and men in poor rural and
urban communities participating in MPA
assessments worldwide, who are sharing their life’s
experiences and views with MPA practitioners, thus
providing a wealth of learning for implementing
agencies, policy and decision makers and funding
agencies. We sincerely hope that they themselves
are deriving adequately worthwhile returns from
the process, both in the short and the long run.
Nilanjana MukherjeeNilanjana MukherjeeNilanjana MukherjeeNilanjana MukherjeeNilanjana Mukherjee Christine van WijkChristine van WijkChristine van WijkChristine van WijkChristine van Wijk
viii
Foreword ................................................................................................................................... iiiPreface ........................................................................................................................................ ivAcknowledgements ...................................................................................................................... vi
Section 1: METHODOLOGY FOR PARTICIPATORY ASSESSMENT
1. The Challenge of Sustained Water Supply and Sanitation for All .. 11.1 Defining sustainability and equity .................................................................................. 2
Five dimensions of sustainability .................................................................................... 21.2 Route to sustainability and equity ................................................................................... 4
How do we know we are getting there? .......................................................................... 4What methods work best? ............................................................................................. 4Why participatory methods and tools are useful for working with the community’swomen and men ........................................................................................................... 6Why managers of large programs are wary of using participatory methods ..................... 6
1.3 There is a middle path: MPA offers the best of both worlds ............................................. 7
2. A New Tool for Planners and Managers of LargeCommunity-Driven Development (CDD) Programs ........................... 92.1 Who can use the MPA, for what? ................................................................................... 92.2 Uses of the MPA to date ................................................................................................ 92.3 What is new about the MPA? ....................................................................................... 11
2.3.1 Quantification of qualitative data ...................................................................... 112.3.2 Combining sustainability assessment with gender and social equity analysis ...... 132.3.3 Addressing gender and social equity in a sector-specific way .............................. 152.3.4 Empowerment through self-assessment and action ............................................. 16
2.4 What do MPA assessments cost? .................................................................................. 17
3. The MPA Framework and Process .................................................. 183.1 MPA framework for analysis: linking outcomes with processes ....................................... 183.2 Types of systems to assess ............................................................................................ 203.3 Sustainability indicators ............................................................................................... 213.4 Other factors to explain differences .............................................................................. 233.5 Demand, demand-responsive approach and participation ........................................... 233.6 Three-step participatory assessments ............................................................................ 26
4. The MPA in Action ........................................................................... 284.1 Establishment of purpose and partnerships .................................................................. 284.2 Selecting the assessment teams .................................................................................... 304.3 Training preparation ................................................................................................... 324.4 Training implementation .............................................................................................. 324.5 Selecting the communities ............................................................................................ 344.6 Sampling procedures................................................................................................... 354.7 Preparation for fieldwork ............................................................................................. 364.8 Implementation: procedures, fieldbook and data templates .......................................... 37
Community level assessments ...................................................................................... 37Getting representative focus groups ............................................................................. 40Institutional assessments: stakeholders and policy meetings .......................................... 41
Contents
4.9 Visualization and self-scoring ...................................................................................... 41Scoring principles in the MPA ...................................................................................... 43The MPA fieldbook and data template ......................................................................... 44
4.10 Quality control ............................................................................................................ 45Experiences with the use of the MPA in general give rise to a number of cautionsand insights: ............................................................................................................... 47How managers can prevent problems and protect quality ............................................. 47
5. Organizing and Interpreting the Data .......................................... 495.1 Analysis of outcomes per tool ...................................................................................... 495.2 Analysis of relative performance ................................................................................... 50
By factor ..................................................................................................................... 50Benchmarking for sustainability ................................................................................... 50By aggregation ........................................................................................................... 50
5.3 Strengths and weaknesses analysis .............................................................................. 535.4 Comparison with other communities ............................................................................ 545.5 Analyzing community level results with agencies ........................................................... 555.6 Analyzing agency factors influencing results on the ground: stakeholders’ meetings ...... 575.7 Policy analysis ............................................................................................................. 585.8 Statistical analysis ........................................................................................................ 59
6. Participatory Tools Used in the MPA .............................................. 626.1 Ensuring quality and validity ........................................................................................ 626.2 Welfare classification ................................................................................................... 646.3 Community map ......................................................................................................... 666.4 Transect walk with rating scales.................................................................................... 706.5 Pocket voting ............................................................................................................... 726.6 Ladders (1) .................................................................................................................. 756.7 Card sorting ............................................................................................................... 776.8 Ladders (2) .................................................................................................................. 796.9 Matrix voting ............................................................................................................... 816.10 Hundred seeds ............................................................................................................ 846.11 Stakeholders’ meeting ................................................................................................. 866.12 Policy level assessment ................................................................................................. 90
Section 2: MPA APPLICATION CASE STUDIES
Do Project Rules Promote Bruce Gross 95Sustainability and Equity?
An ex post facto assessment in 40 communitiesserved by five past projects in Indonesia.
From Theory to Practice Suzanne Reiff 104A study of rural water supply and sanitationstrategy implementation: PADEAR in Benin.Evaluating the effectiveness of gender- andpoverty-targeting in project strategies to improvefinal impact of ongoing and forthcoming projects.
Adding Accountability for Nilanjana Mukherjee 111Gender and Social Inclusion and Nina Shatifan
Learning from the process of institutionalizinggender- and poverty-sensitivity in large scaleCommunity-Driven Development (CDD) projectsin Indonesia.
Looking Back to See Forward Soutsakhone Chanthaphone 127Learning from communities about the use and and Santanu Lahirisustainability of RWSS services in Lao PDR.Sector experience assessment for scaling upthe application of national RWSS sector strategy.
Effects of the MPA on Gender Christine van Wijk 138Relations in the Community
Case study from Java, Indonesia, of an MPAexperience changing community views on genderroles and gender relations towards greater equity.
Achieving Sustained Sanitation WSP-EAP 141for the Poor
Participatory policy research applications fromIndonesia, Cambodia, Vietnam - lessons from aset of three country reports and a regional synthesis.
How Well Did Those Development Richard Hopkins 143Projects in Flores Work?
Evaluating development effectivenes of past aidprojects and drawing policy lessons, Flores,Indonesia.
Appendix AInstitutions that currently have MPA-trained facilitators .............................................................. 149
Appendix BProcess designed for PLA policy assessment workshop (Indonesia, September 1999) .................. 151
References ...................................................................................................................... 155
List of Figures
Figure 1 Key aspects of sustainability of WSS Services .............................................................. 3Figure 2 The process of an increasingly specific focus ............................................................ 16Figure 3 Analytical framework of the MPA ............................................................................. 19Figure 4 Experiential learning cycle ....................................................................................... 26Figure 5 Flow diagram of MPA assessment at community level ............................................... 38Figure 6 Example of maximum and actual aggregated community score for
effective financing in one community ........................................................................ 53Figure 7 Strengths and weaknesses in sustaining domestic water supply in community “X” ...... 54Figure 8 Comparison of scores for four sustainability components across 40 communities ...... 55Figure 9 Results of policy assessment: example from country “X” ............................................ 59Figure 10 How effectively are water supply services sustained by the communities? ................... 97Figure 11 How effectively are water services managed? ............................................................ 97Figure 12 How effectively are water services financed? .............................................................. 98Figure 13 Who was involved in making decisions about the project? ....................................... 99Figure 14 Who has access to improved sanitation? ............................................................... 100Figure 15 Importance of benefits to poor and rich women and men ...................................... 103Figure 16 Who had voice and choice in WSS project implementation, as perceived by
women and men in the community ........................................................................ 106Figure 17 Gender equity in cost-sharing for water services ..................................................... 108
Figure 18 KDP 2 activity cycle with proposed inserts for gender-poverty mainstreaming ........... 116Figure 19 Location Map of LAO PDR ..................................................................................... 127Figure 20 Annual RWSS cycle ................................................................................................ 128Figure 21 How effectively are water services sustained? .......................................................... 131Figure 22 Overall sustainability of water supply in thirty-eight villages .................................... 131Figure 23 Benefits of household latrines - as perceived by users’ groups in 37 communities ... 132Figure 24 System quality ....................................................................................................... 133Figure 25 Effective financing .................................................................................................. 133Figure 26 Effective management ............................................................................................ 133Figure 27 Correlations between project approaches and sustainability and use of services
on the ground ...................................................................................................... 147
List of Boxes
Box 1 Cost comparisons for methods .................................................................................. 7Box 2 What comprises the MPA? ......................................................................................... 8Box 3 Uses of the MPA...................................................................................................... 10Box 4 Participatory, rapid... what’s the difference? ............................................................. 10Box 5 The MPA built on two existing methodologies ........................................................... 12Box 6 Main findings from the use of the MPA in a global evaluation in 1998/99 ............... 12Box 7 Social equity analysis in the MPA ............................................................................. 13Box 8 Gender analysis in the MPA .................................................................................... 14Box 9 Some key questions answered by the MPA ............................................................... 21Box 10 MPA indicators for community water supplies ........................................................... 22Box 11 MPA Indicators for community-managed sanitation .................................................. 24Box 12 The assessment team .............................................................................................. 31Box 13 Not everyone has the personal attitudes to work with participatory methods
and practice equity .................................................................................................. 30Box 14 The MPA is a process-oriented methodology ............................................................ 32Box 15 Key elements of MPA training .................................................................................. 33Box 16 Possible factors for consideration in decisions on type of sampling ........................... 35Box 17 Indicative sequence of work with a community ......................................................... 39Box 18 The advantages of self-scoring ................................................................................ 42Box 19 Scoring scale or “ladder” for community level assessment of gender
equity in service management ................................................................................. 42Box 20 Quality enhances validity ......................................................................................... 46Box 21 Analysis leading to correction .................................................................................. 50Box 22 Gender and poverty analysis of activities profile ....................................................... 51Box 23 Two examples of MPA scales benchmarked for sustainability ..................................... 52Box 24 Policy analysis builds consensus for needed change ................................................. 92Box 25 What is associated with low or high sustainability? ................................................ 136Box 26 Project “rule” discouraging hygiene? ...................................................................... 145
List of Tables
Table 1 Social inclusion and empowerment tools introduced in KDP 2 ................................ 115Table 2 WSLIC 2: Poverty and gender mainstreaming in the community planning
process through MPA and PHAST .......................................................................... 121Table 3 Performance monitoring and evaluation indicators for project development
objectives .............................................................................................................. 124
Section 1
The Methodology forParticipatory Assessment


THE CHALLENGE OF SUSTAINED WATER SUPPLY AND SANITATION FOR ALL
1
1The Challenge of Sustained WaterSupply and Sanitationfor All
●●●●● Do they work?Do they work?Do they work?Do they work?Do they work?
●●●●● Are they sustained?Are they sustained?Are they sustained?Are they sustained?Are they sustained?
●●●●● Do they benefit everyone, including the poorDo they benefit everyone, including the poorDo they benefit everyone, including the poorDo they benefit everyone, including the poorDo they benefit everyone, including the poor
in the community?in the community?in the community?in the community?in the community?
T hese are the questions by which the
effectiveness of infrastructure services
funded by development assistance is now
being judged. As we enter the new millennium,
persistently high levels of poverty exacerbated by
conflict, environmental and economic crises are
ushering in a climate that demands greater
accountability for results from development
investments. It is no longer sufficient to define
results in terms of creation of a targeted number
of infrastructure facilities. Outcomes now must also
prove to be sustainable as well as equitable, i.e.,
serving all sections of society fairly, including the
poor and the less powerful.
Global sector experience and research has now
established that services are better sustained when
service delivery is done using approaches that seek
to understand and respond to the demands of
potential users of the service.1 While this statement
is broadly true, it represents an oversimplified view
of reality. To understand what really decides
ultimate sustainability begs a deeper examination
of the question “whose demand?”
1 Katz, Travis and Sara, Jennifer. Making Rural Water Supply Sustainable: Recommendations from a globalstudy. UNDP-World Bank Water and Sanitation Program, 1997.

THE CHALLENGE OF SUSTAINED WATER SUPPLY AND SANITATION FOR ALL
2
In many community water and sanitation
programs, it is common to find a substantial
number of facilities out of order or functioning
below expectations at any given time. It also
happens frequently that a considerable number
of people do not use the facilities either always or
during part of the year. Often, they are reluctant
to support the new provisions that do not
sufficiently meet their demands.
There are also communities in which the
households that benefit from the better facilities
use and sustain them well. However, these facilities
serve only a portion of all households. Often, the
households that are excluded from basic services
belong to the poorest groups with the worst living
conditions. Public health benefits will not be
realized in such cases, since achieving them would
require a critical mass of use by all or almost all
households (Esrey, 1994).
Well-sustained and used water supplies and
sanitation facilities mean that, for a period that
covers the design life of the technologies used to
provide services, each member of all households
in the project area has a regular and dependable
delivery of water - acceptable in terms of quality
and quantity, and practices safe disposal of waste
365 days per year. Better sustained services (in
terms of those standards) were found to be
significantly positively associated with gender and
social equity in expressing demand for and
managing services, in a recent study of 88
community-managed water supply systems in 15
countries.2
As a development goal and issue, therefore,
sustainability is closely linked to social equity.
1.1 Defining sustainabilityand equity
To be meaningful, sustainability and equity need
to be operationally defined for each development
sector. Water and sanitation sector professionals
have reached some consensus by the late 1990s
that the following definitions offer a meaningful
starting point for progress towards achieving the
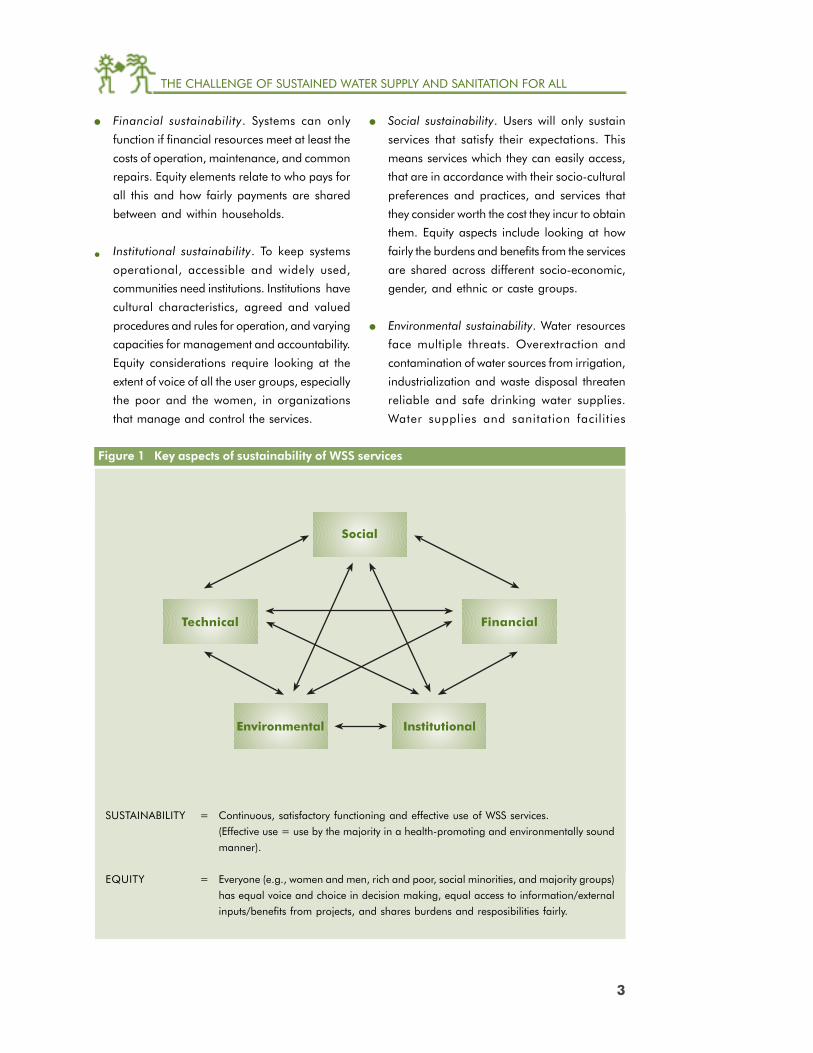
twin goals3 (see Figure 1).
Five dimensions of sustainability
Sustainability of water supplies and sanitation
has many dimensions. The following discussion
looks at five different but interrelated dimensions
of sustainabil i ty, all with specific equity
perspectives.
● Technical sustainability. This refers to the reliable
and correct functioning of the technology and,
for water supplies, the delivery of enough water
of an acceptable quality. Equity aspects relate
to the technology meeting the demands of all
user groups. Requirements for technical
sustainability include: a technically good design,
which is adhered to in construction and
operation, and first-rate workmanship and
materials.
2 Greater equity between women and men and between households that are economically better and poor, insharing planning decisions, management and upkeep of community water systems, was positively andsignificantly correlated with better sustained services. (Gross, B., van Wijk, C. and Mukherjee, N., 2001).
3 Improving Sustainability in RWSS Projects. Report of the South and East Asia regional water sanitationconference, Chiang Mai. 1998. Water and Sanitation Program – South Asia.Towards Sustainability with Equity. Report of the East Asia regional water and sanitation conference. ChiangMai, March 2001. Water and Sanitation Program – East Asia and the Pacific.
THE CHALLENGE OF SUSTAINED WATER SUPPLY AND SANITATION FOR ALL
3
● Financial sustainability. Systems can only
function if financial resources meet at least the
costs of operation, maintenance, and common
repairs. Equity elements relate to who pays for
all this and how fairly payments are shared
between and within households.
Institutional sustainability. To keep systems
operational, accessible and widely used,
communities need institutions. Institutions have
cultural characteristics, agreed and valued
procedures and rules for operation, and varying
capacities for management and accountability.
Equity considerations require looking at the
extent of voice of all the user groups, especially
the poor and the women, in organizations
that manage and control the services.
● Social sustainability. Users will only sustain
services that satisfy their expectations. This
means services which they can easily access,
that are in accordance with their socio-cultural
preferences and practices, and services that
they consider worth the cost they incur to obtain
them. Equity aspects include looking at how
fairly the burdens and benefits from the services
are shared across different socio-economic,
gender, and ethnic or caste groups.
● Environmental sustainability. Water resources
face multiple threats. Overextraction and
contamination of water sources from irrigation,
industrialization and waste disposal threaten
reliable and safe drinking water supplies.
Water supplies and sanitation facilities
SUSTAINABILITY = Continuous, satisfactory functioning and effective use of WSS services.
(Effective use = use by the majority in a health-promoting and environmentally sound
manner).
EQUITY = Everyone (e.g., women and men, rich and poor, social minorities, and majority groups)
has equal voice and choice in decision making, equal access to information/external
inputs/benefits from projects, and shares burdens and resposibilities fairly.
Figure 1 Key aspects of sustainability of WSS services
Social
Technical Financial
InstitutionalEnvironmental
THE CHALLENGE OF SUSTAINED WATER SUPPLY AND SANITATION FOR ALL
4
themselves threaten the environment through
the unsafe disposal of wastewater and human
and solid waste. In dry areas, lack of drainage
of wastewater has created new risks of insect
breeding that have brought outbreaks of
malaria, dengue, and filariasis.
Equity aspects include fair sharing of
responsibility among users for the protection
of their environment and water resources.
1.2 Route to sustainabilityand equity
How do we know we are gettingthere?
There is not much point in finding out only at the
end of a project whether or not it achieved
sustainable and equitable outcomes. Effective
water and sanitation interventions must have a
plan for sustainability and equity built into their
designs, and begin using some means of verifying
the progress being achieved once implementation
gets under way.
Measuring sustainability before it has actually
resulted can only be hypothetical. However, given
the evidence from global research about the
positive links between sustainability, demand and
equity, process indicators for equity within demand-
responsive approaches can serve as the indicators
of progress towards sustainability.
Planning for sustainability in projects can then
take the following forms:
a. designing gender- and poverty-sensitive
demand-responsive processes for working
towards the five dimensions of sustainability
(Figure 1); and
b. putting in place indicators and tools to track
the quality of those processes.
The institutionalization and scaling up of demand-
responsive approaches for sustainability would
likewise call for:
a. explicitly recognizing sustainability and equity
as the twin goals of sector policies.
b. recognizing gender- and poverty-sensitive
demand-responsive operations as essential
best practices in institutions providing
community water supply and sanitation
services.
c. establishing institutional accountability for
gender- and poverty-sensitive demand-
responsive operations.
What methods work best?
In the 1980s, it became clear that central project
agencies are not equipped to manage large
numbers of decentralized water supply and
sanitation systems. Many experiences showed that
with appropriate service delivery approaches,4
local community organizations can more effectively
and efficiently manage local water supply and
sanitation.
This insight has had far-reaching implications for
the planning and establishment of improved water
and sanitation technologies. It has also greatly
affected the development and use of local
operation, maintenance, management and
4 The above refers to a departure from the top-down, externally funded and planned, target-driven, supply-oriented approaches of the past, toward approaches that begin by offering service options to communities anddeliver services based on what the users want and are willing to pay for, i.e., demand-responsive or communitydemand-driven approaches.
THE CHALLENGE OF SUSTAINED WATER SUPPLY AND SANITATION FOR ALL
5
financing systems. If local women and men and
their organizations are themselves sustaining and
managing improved water supply and sanitation
projects, they can no longer be treated as mere
recipients of government designed and built
technologies based on the decisions of outsiders.
Instead, the community’s women and men become
the local planners and managers and the external
project agencies become their facilitators. In this
new set-up, the future users have the freedom and
the responsibility to make their own well-reasoned
decisions and management arrangements. They
also have the right to receive the information and
support that they need from the project
implementing agencies to plan, implement and
run their services in an effective and efficient
manner.
This does not mean that the implementing agencies
have a less important role. On the contrary, their
role is now even more crucial. Agency managers
and staff must develop processes of consultation
and support. They must also help local women
and men develop the additional capacities needed
to plan, implement, and manage their community
water supplies and their sanitation projects.
In their turn, the agency staff learn from the
community members what may be the best fitting
solutions in the given socio-cultural, economic,
institutional, environmental, and technical
circumstances. They also get useful insights from
local users and managers as to whether and why
certain approaches and choices have, or have not,
worked.
In decentralized systems, because local women
and men would operate, manage, and sustain
the improved services, planning requires the use
of participatory methods and tools. Only then is it
possible for all parties involved to share their
knowledge and experiences, learn from each other
and make the best use of the pooled knowledge
in planning new water supply and sanitation
systems or improve existing ones.
The principles of participatory learning and action
apply to all stages of a project cycle:
● When planning new services, they facilitate
better decision making, based on experiences
with existing water supply and sanitation
conditions.
● During operations, they help monitor, and
where necessary improve, the installed water
and sanitation systems and project
management approaches.
● While evaluating completed projects or
programs, they make it possible to assess
impacts of investments and make more
effective decisions about new investments and
strategies.
A range of methods and tools is available for
participatory learning and action. PROWWESS, the
project for the Promotion of the Role of Women in
Water and Environmental Sanitation Services
supported by the United Nations Development
Programme (UNDP) and the World Bank, has
developed tools for participatory planning,
monitoring and evaluation of community water
and sanitation facilities (Srinivasan, 1990).
More recently, they were supplemented by
Participatory Hygiene and Sanitation
Transformation (PHAST), a toolkit specially geared
to community planning and monitoring of
Planning and monitoring for sustainability calls for indicators and tools to track gender and
social equity in the way projects assess and elicit users’ demands and respond to them.
THE CHALLENGE OF SUSTAINED WATER SUPPLY AND SANITATION FOR ALL
6
improved hygiene and sanitation behavior (WHO,
1998). There is also a large family of more general
PLA (Participatory Learning and Action) tools (Pretty
et al, 1995).
Many of these general tools may be used in the
assessment of community water supply, sanitation,
and hygiene projects. The MPA builds further on
these foundations.
Why participatory methods andtools are useful for working with thecommunity’s women and men
● They enable quick visual representation of
local conditions and practices, minimizing
biases in expressed information resulting from
spoken language .
● Any person can participate, irrespective of their
levels of literacy and education.
● Participants are free to present their own
knowledge, views and interests on each subject.
Larger sections of the population are able to
express their views. Rich, insightful information
is obtained.
● For the subordinated, self-expression with tools
is easier than speaking in public.5
● The process is not limited or influenced by
questions from outsiders, minimizing
interviewer biases encountered in conventional
surveys.
● The public process makes it hard to present
and retain faulty information.
● Systematic overviews act as eye-openers for all
regarding previously unnoticed problems.
● Outcomes are immediately shared, open to
analysis and conclusions by all.
● People remain owners of the knowledge and
can immediately act upon it.
Why managers of large programsare wary of using participatorymethods
Despite the above advantages of participatory
methods, managers of large scale projects often
prefer social and technical surveys to meet their
information needs because:
● Information collected with participatory tools
is predominantly qualitative; the type of data
produced is not suitable for aggregation,
statistical analysis and for building up a
program database over time.
● Comparabili ty between and across
communities on results and common factors
is limited as indicators and/or ways of
investigation often differ.
● Participatory methods typically use small
samples. Data from a small number of
communities does not satisfy all project
monitoring needs.
● Participatory methods have a reputation of
being slower and more costly than social
surveys,6 although this has never been
5 Proper facilitation is nevertheless essential to avoid domination by the more powerful participants.The importance of the quality of the facilitation process is discussed in Chapter 4.
6 There is a very wide spectrum of participatory methods ranging from a one-day community visit to ananthropologist living for years in a village - which may have given rise to such perceptions. MPA exercises formonitoring or evaluation generally take 2 – 4 days to complete in a community depending on the scope ofinvestigation (a full sustainability study may not always be required). The actual length of time needed isrelated to the principles of participatory appraisal whereby assessment sessions are only scheduled at theconvenience of community members who are usually available for only 2 – 3 hours a day, mostly in theafternoons or evenings after work.
Improving community-managed services requires participatory methods because such methods build
local capacities of both user communities and project agencies, and facilitate partnerships between
them for enhancing the sustainability of services.
THE CHALLENGE OF SUSTAINED WATER SUPPLY AND SANITATION FOR ALL
7
properly researched. There are some
indications that the opposite may be true (see
Box 1).
● Prevail ing perceptions among some
managers that there may not be anything
worth learning from the views of poor people.
1.3 There is a middle path:MPA offers the best ofboth worlds
Participatory and survey methods both have
advantages and disadvantages from the points
of views of managers and community members.
In Thailand, Collinson (1981) conducted a week-long exploratory
investigation on small scale farming, but then felt obliged to follow it up
with a formal verification survey just to produce numbers. This survey
invariably produced the same information, but took longer, was costlier,
and delayed action.
A comparative study of participatory and survey methods recently conducted in a UNICEF-supported
sanitation project found that both approaches can yield comparable results but the survey costs 25
percent more in terms of money and 500 percent more in terms of person-weeks to carry out.
(Walujan, Hopkins and Istandar, 2002).
Box 1 Cost comparisons for methods
Social scientists have for many years been
searching for ways to combine the advantages
and limit the disadvantages of the two approaches.
The MPA, described in Box 2, has made some
advances in this direction and broken new
ground. Its main characteristic is that it quantifies
qualitative data through participatory processes
with communities and implementing agencies.
The result is that managers and researchers
acquire a quantitative database which they can
analyze statistically at the project/program level,
while community members and agency staff
remain in possession of their own data and act
on the basis of their learning, at community and
agency levels.
THE CHALLENGE OF SUSTAINED WATER SUPPLY AND SANITATION FOR ALL
8
● It is It is It is It is It is a frameworka frameworka frameworka frameworka framework for combining social equity analysis with the for combining social equity analysis with the for combining social equity analysis with the for combining social equity analysis with the for combining social equity analysis with the
analysis of sustainability of locally managed water supply andanalysis of sustainability of locally managed water supply andanalysis of sustainability of locally managed water supply andanalysis of sustainability of locally managed water supply andanalysis of sustainability of locally managed water supply and
sanitation interventions.sanitation interventions.sanitation interventions.sanitation interventions.sanitation interventions.
● It is a set of It is a set of It is a set of It is a set of It is a set of sector-specific indicatorssector-specific indicatorssector-specific indicatorssector-specific indicatorssector-specific indicators for measuring and for measuring and for measuring and for measuring and for measuring and
monitoring sustainability and equity in community watermonitoring sustainability and equity in community watermonitoring sustainability and equity in community watermonitoring sustainability and equity in community watermonitoring sustainability and equity in community water
supply and sanitation services and user practices.supply and sanitation services and user practices.supply and sanitation services and user practices.supply and sanitation services and user practices.supply and sanitation services and user practices.
● It is a It is a It is a It is a It is a sequence of participatory toolssequence of participatory toolssequence of participatory toolssequence of participatory toolssequence of participatory tools to assess the indicators with user communities, project to assess the indicators with user communities, project to assess the indicators with user communities, project to assess the indicators with user communities, project to assess the indicators with user communities, project
agencies/institutions and policymakers.agencies/institutions and policymakers.agencies/institutions and policymakers.agencies/institutions and policymakers.agencies/institutions and policymakers.
● It is a It is a It is a It is a It is a scoring systemscoring systemscoring systemscoring systemscoring system to quantify data from participatory assessments into tested and validated to quantify data from participatory assessments into tested and validated to quantify data from participatory assessments into tested and validated to quantify data from participatory assessments into tested and validated to quantify data from participatory assessments into tested and validated
ordinal and ratio scales, for building a database, doing statistical analysis, making graphicordinal and ratio scales, for building a database, doing statistical analysis, making graphicordinal and ratio scales, for building a database, doing statistical analysis, making graphicordinal and ratio scales, for building a database, doing statistical analysis, making graphicordinal and ratio scales, for building a database, doing statistical analysis, making graphic
presentations and benchmarking for sustainabilitypresentations and benchmarking for sustainabilitypresentations and benchmarking for sustainabilitypresentations and benchmarking for sustainabilitypresentations and benchmarking for sustainability.....
Communities use the scores and qualitative findings to identify, analyze, and interrelate problems,
plan improvements, and initiate new projects.
Project staff use the scores to compare between communities and across communities on common
factors in order to evaluate and improve inputs, methods, and approaches.
At the program and international level, the MPA makes it possible to quantify and interrelate
qualitative information generated through participatory methods across projects and programs
both within and between countries.
Box 2 What comprises the MPA?

THE CHALLENGE OF SUSTAINED WATER SUPPLY AND SANITATION FOR ALL
9
2
impact of one or more projects and their
approaches in the same country for national
policy improvement (Indonesia, Lao PDR,
Nepal, Benin, Cambodia).
● As part of monitoring and impact assessment
in two rural water supply projects and a
project to develop sustainable watershed
management practices (India).
● To link water and sanitation services with
hygiene promotion (Lao PDR).
● Participatory assessment of sanitation
A New Tool for Planners andManagers of Large Community-Driven Development (CDD)Programs
2.1 Who can use the MPA, forwhat?
T he MPA is an innovative methodology forplanning, monitoring and evaluationdesigned to enhance, and account for, the
sustainability and effectiveness of water supply andsanitation project interventions by integratingparticipatory field studies with quantitative programanalysis.
The methodology allows all stakeholders - fromilliterate women and men in communities toprogram managers and investors to:● use one instrument to assess strengths and
weaknesses in water supply and sanitationprojects,
● assess the social equity situation along withfactors for sustainability and effective use,
● plan and monitor for more sustainable and
equitable outcomes in development projects.
2.2 Uses of the MPA to date
The MPA, or selected parts of it, have so far been
used for the following purposes.
● As a tool to plan new projects based on the
participatory and comparative evaluation of
existing facilities and approaches (Indonesia,
Cambodia).
● Comparative evaluation of community level
MPA allows participatory assessment datato be quantified by stakeholders at all levels
A NEW TOOL FOR PLANNERS AND MANAGERS OF LARGE CDD PROGRAMS
10
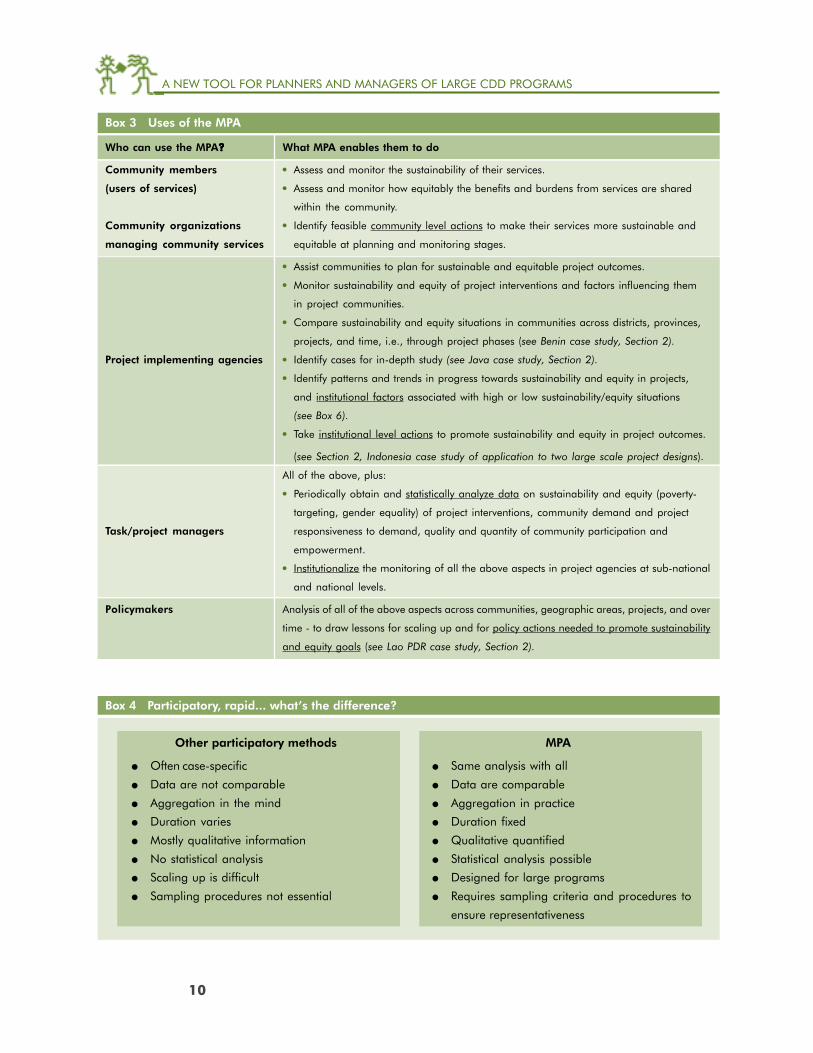
Box 4 Participatory, rapid... what’s the difference?
Other participatory methods MPA
● Often case-specific
● Data are not comparable
● Aggregation in the mind
● Duration varies
● Mostly qualitative information
● No statistical analysis
● Scaling up is difficult
● Sampling procedures not essential
● Same analysis with all
● Data are comparable
● Aggregation in practice
● Duration fixed
● Qualitative quantified
● Statistical analysis possible
● Designed for large programs
● Requires sampling criteria and procedures to
ensure representativeness
Who can use the MPA????? What MPA enables them to do
Community members ● Assess and monitor the sustainability of their services.
(users of services) ● Assess and monitor how equitably the benefits and burdens from services are shared
within the community.
Community organizations ● Identify feasible community level actions to make their services more sustainable and
managing community services equitable at planning and monitoring stages.
● Assist communities to plan for sustainable and equitable project outcomes.
● Monitor sustainability and equity of project interventions and factors influencing them
in project communities.
● Compare sustainability and equity situations in communities across districts, provinces,
projects, and time, i.e., through project phases (see Benin case study, Section 2).
Project implementing agencies ● Identify cases for in-depth study (see Java case study, Section 2).
● Identify patterns and trends in progress towards sustainability and equity in projects,
and institutional factors associated with high or low sustainability/equity situations
(see Box 6).
● Take institutional level actions to promote sustainability and equity in project outcomes.
(see Section 2, Indonesia case study of application to two large scale project designs).
All of the above, plus:
● Periodically obtain and statistically analyze data on sustainability and equity (poverty-
targeting, gender equality) of project interventions, community demand and project
Task/project managers responsiveness to demand, quality and quantity of community participation and
empowerment.
● Institutionalize the monitoring of all the above aspects in project agencies at sub-national
and national levels.
Policymakers Analysis of all of the above aspects across communities, geographic areas, projects, and over
time - to draw lessons for scaling up and for policy actions needed to promote sustainability
and equity goals (see Lao PDR case study, Section 2).
Box 3 Uses of the MPA
A NEW TOOL FOR PLANNERS AND MANAGERS OF LARGE CDD PROGRAMS
A NEW TOOL FOR PLANNERS AND MANAGERS OF LARGE CDD PROGRAMS
11
promotion policies and strategies (Indonesia,
Cambodia, Vietnam).
● Stakeholder assessment of poverty-sensitivity
and gender dimensions of national sector
policy and strategies (Peru, Bolivia, Indonesia,
Cambodia).
● Participatory stakeholder assessments of
benefits reaching the urban poor through past
water supply and sanitation interventions and
services currently being provided by urban
utilities (ongoing in Vietnam).
● Sustainability assessment of urban sanitation
services and water supply models for small
towns, to draw lessons for sector policy
improvement (The Philippines).
● To improve policymaking and program
planning by adding to the knowledge on
linkages between demand-responsive and
gender- and-poverty-sensitive approaches and
sustainability (15 country study).
The use of the MPA has led to the improvement of
training on budgeting and financial management
(DANIDA-supported project in Ghana), greater
gender balance in community management in
Kerala, India, Cameroon and Indonesia, and
more equitable water distribution in an integrated
water management project (also in Kerala, India).
2.3 What is new about theMPA ?
The MPA is not just a new acronym for yet another
set of participatory tools. It is a methodology
consisting of systematically sequenced investigation
focusing on specific community groups and is
designed to obtain and analyze quantitative and
qualitative information on community-managed
services. Box 4 gives the differences between the
MPA and other participatory learning methods
such as Participatory Rural Appraisal (PRA) and
Participatory Learning and Action (PLA).
2.3.1 Quantification of qualitativedata
Because no methodology existed that used
participatory tools and also provided large
programs with easily comparable data, the Water
and Sanitation Program (WSP) and the IRC
International Water and Sanitation Centre
developed the MPA. In this endeavor, the team
built on two existing methodologies: the Minimum
Evaluation Procedures (MEP) developed by the
London School of Hygiene and Tropical Medicine
(WHO, 1983) and the participatory evaluation tools
and indicators which Deepa Narayan developed
for the Water and Sanitation Program in 1993
building further on Lyra Srinivasan’s work on the
SARAR7 methodology (PROWWESS/UNDP, 1990).
Their characteristics are compared in Box 5.
The MPA combines the advantages of these two
previous methodologies and adds quantification.
It was developed in 1997-98 by a team from the
WSP and the IRC.
The MPA quantifies participatory assessment data
and allows statistical analysis at the program level.
The MPA was validated in a global study in 1998
and 1999 that covered 88 community-managed
water supplies from 18 projects in 15 countries.
The study was implemented by local teams from
universities, the private sector, national and local
NGOs, and the project agencies. WSP’s regional
offices in South-Asia, East Asia and Pacific, and
East and Southern Africa, and IRC with its partners
PAID and CINARA in West Africa and Latin
America, provided training and support.
7 SARAR stands for Self-esteem, Associative strengths, Resourcefulness, Action planning, Responsibility.Tools for Community Participation. Srinivasan, Lyra. (1990) PROWWESS/UNDP.
A NEW TOOL FOR PLANNERS AND MANAGERS OF LARGE CDD PROGRAMS
12
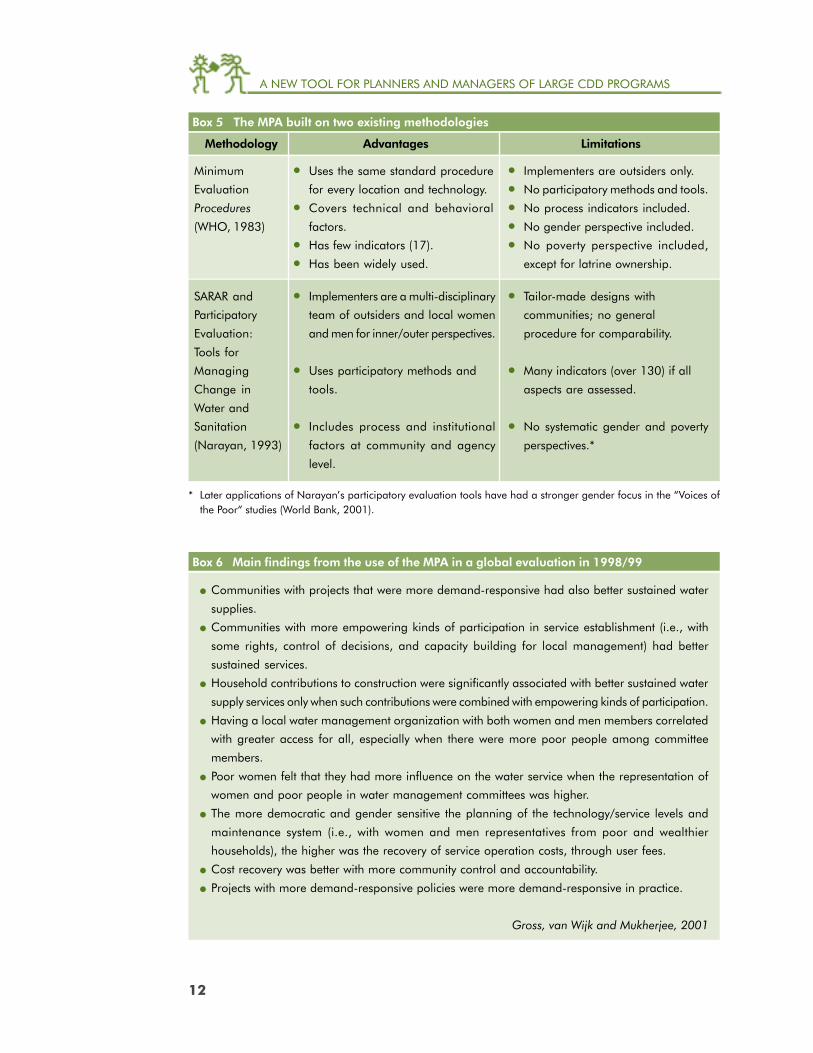
● Communities with projects that were more demand-responsive had also better sustained water
supplies.
● Communities with more empowering kinds of participation in service establishment (i.e., with
some rights, control of decisions, and capacity building for local management) had better
sustained services.
● Household contributions to construction were significantly associated with better sustained water
supply services only when such contributions were combined with empowering kinds of participation.
● Having a local water management organization with both women and men members correlated
with greater access for all, especially when there were more poor people among committee
members.
● Poor women felt that they had more influence on the water service when the representation of
women and poor people in water management committees was higher.
● The more democratic and gender sensitive the planning of the technology/service levels and
maintenance system (i.e., with women and men representatives from poor and wealthier
households), the higher was the recovery of service operation costs, through user fees.
● Cost recovery was better with more community control and accountability.
● Projects with more demand-responsive policies were more demand-responsive in practice.
Gross, van Wijk and Mukherjee, 2001
Box 6 Main findings from the use of the MPA in a global evaluation in 1998/99
● Implementers are outsiders only.● No participatory methods and tools.● No process indicators included.● No gender perspective included.● No poverty perspective included,
except for latrine ownership.
Methodology Advantages Limitations
● Uses the same standard procedure
for every location and technology.● Covers technical and behavioral
factors.● Has few indicators (17).● Has been widely used.
SARAR and
Participatory
Evaluation:
Tools for
Managing
Change in
Water and
Sanitation
(Narayan, 1993)
● Implementers are a multi-disciplinary
team of outsiders and local women
and men for inner/outer perspectives.
● Uses participatory methods and
tools.
● Includes process and institutional
factors at community and agency
level.
● Tailor-made designs with
communities; no general
procedure for comparability.
● Many indicators (over 130) if all
aspects are assessed.
● No systematic gender and poverty
perspectives.*
* Later applications of Narayan’s participatory evaluation tools have had a stronger gender focus in the “Voices ofthe Poor“ studies (World Bank, 2001).
Minimum
Evaluation
Procedures
(WHO, 1983)
Box 5 The MPA built on two existing methodologies
A NEW TOOL FOR PLANNERS AND MANAGERS OF LARGE CDD PROGRAMS
13
2.3.2 Combining sustainabilityassessment with gender andsocial equity analysis
Studies have shown that gender and social equity
approaches optimize results and impacts of water
supply and sanitation improvements. Such
approaches may also improve the relative
positions of women and poor people (Fong et
al., 1996, van Wijk, 1998, Woroniuk, 1994). The
outcomes of the global study summarized above
support these conclusions with quantitative
evidence. A gender and social equity analysis is
thus of great relevance for projects, communities,
families and individual women and men, girls
and boys.
However, gender and social equity are two of the
many issues that managers of water and sanitation
programs have to address. Particularly in large
infrastructure projects, managers must realize a
wide span and variety of objectives within limited
time frames, with fixed resources and regular
funding flows. The objectives may range from
achieving efficiency, effectiveness, sustainability,
people’s participation, decentralization and
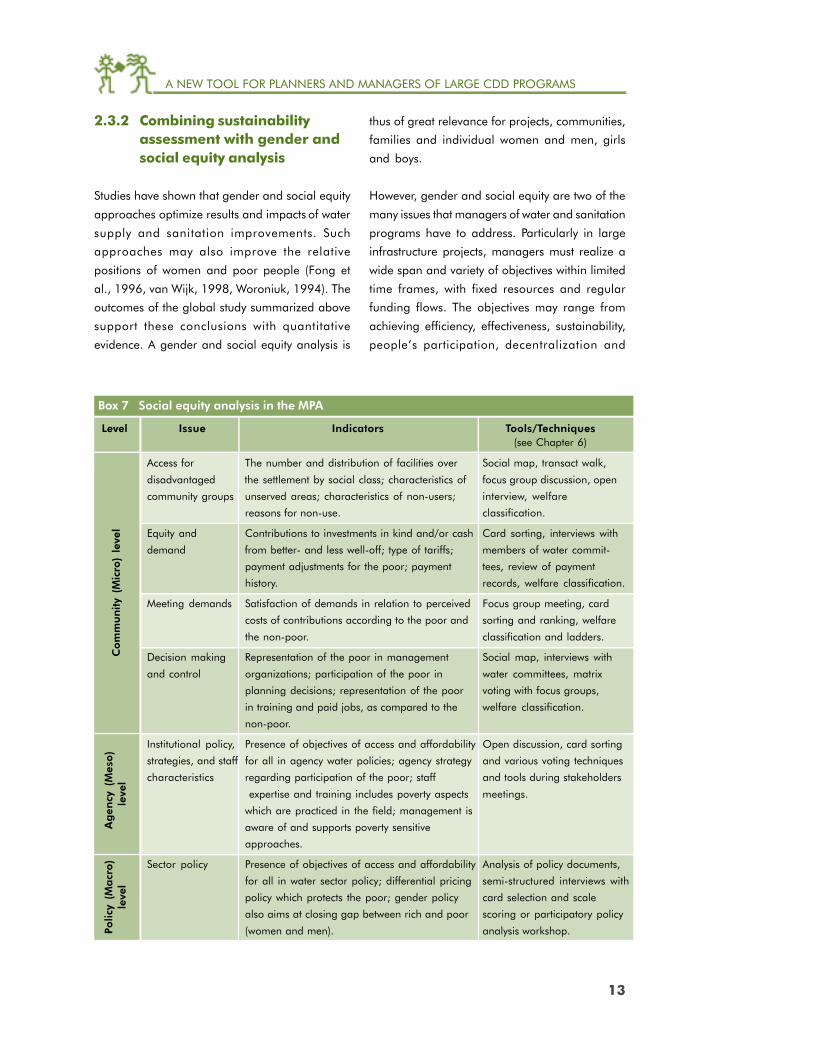
Box 7 Social equity analysis in the MPA
Com
mu
nity
(M
icro
) le
vel
Ag
ency
(M
eso
)le
vel
Polic
y (M
acr
o)
leve
l
Level Issue Indicators Tools/Techniques(see Chapter 6)
Access for The number and distribution of facilities over Social map, transact walk,
disadvantaged the settlement by social class; characteristics of focus group discussion, open
community groups unserved areas; characteristics of non-users; interview, welfare
reasons for non-use. classification.
Equity and Contributions to investments in kind and/or cash Card sorting, interviews with
demand from better- and less well-off; type of tariffs; members of water commit-
payment adjustments for the poor; payment tees, review of payment
history. records, welfare classification.
Meeting demands Satisfaction of demands in relation to perceived Focus group meeting, card
costs of contributions according to the poor and sorting and ranking, welfare
the non-poor. classification and ladders.
Decision making Representation of the poor in management Social map, interviews with
and control organizations; participation of the poor in water committees, matrix
planning decisions; representation of the poor voting with focus groups,
in training and paid jobs, as compared to the welfare classification.
non-poor.
Institutional policy, Presence of objectives of access and affordability Open discussion, card sorting
strategies, and staff for all in agency water policies; agency strategy and various voting techniques
characteristics regarding participation of the poor; staff and tools during stakeholders
expertise and training includes poverty aspects meetings.
which are practiced in the field; management is
aware of and supports poverty sensitive
approaches.
Sector policy Presence of objectives of access and affordability Analysis of policy documents,
for all in water sector policy; differential pricing semi-structured interviews with
policy which protects the poor; gender policy card selection and scale
also aims at closing gap between rich and poor scoring or participatory policy
(women and men). analysis workshop.
A NEW TOOL FOR PLANNERS AND MANAGERS OF LARGE CDD PROGRAMS
14
Com
mu
nity
(M
icro
) le
vel
Ag
ency
(M
eso
)le
vel
Polic
y (M
acr
o)
leve
l
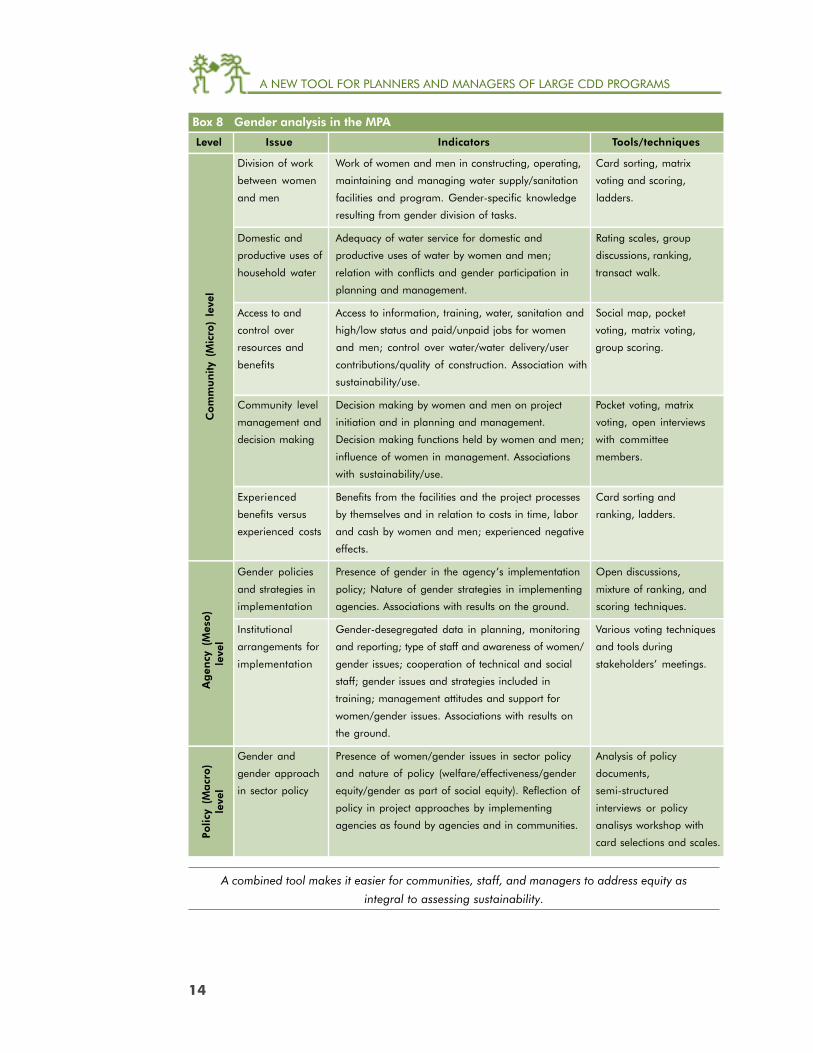
Box 8 Gender analysis in the MPA
A combined tool makes it easier for communities, staff, and managers to address equity as
integral to assessing sustainability.
Level Issue Indicators Tools/techniques
Division of work Work of women and men in constructing, operating, Card sorting, matrix
between women maintaining and managing water supply/sanitation voting and scoring,
and men facilities and program. Gender-specific knowledge ladders.
resulting from gender division of tasks.
Domestic and Adequacy of water service for domestic and Rating scales, group
productive uses of productive uses of water by women and men; discussions, ranking,
household water relation with conflicts and gender participation in transact walk.
planning and management.
Access to and Access to information, training, water, sanitation and Social map, pocket
control over high/low status and paid/unpaid jobs for women voting, matrix voting,
resources and and men; control over water/water delivery/user group scoring.
benefits contributions/quality of construction. Association with
sustainability/use.
Community level Decision making by women and men on project Pocket voting, matrix
management and initiation and in planning and management. voting, open interviews
decision making Decision making functions held by women and men; with committee
influence of women in management. Associations members.
with sustainability/use.
Experienced Benefits from the facilities and the project processes Card sorting and
benefits versus by themselves and in relation to costs in time, labor ranking, ladders.
experienced costs and cash by women and men; experienced negative
effects.
Gender policies Presence of gender in the agency’s implementation Open discussions,
and strategies in policy; Nature of gender strategies in implementing mixture of ranking, and
implementation agencies. Associations with results on the ground. scoring techniques.
Institutional Gender-desegregated data in planning, monitoring Various voting techniques
arrangements for and reporting; type of staff and awareness of women/ and tools during
implementation gender issues; cooperation of technical and social stakeholders’ meetings.
staff; gender issues and strategies included in
training; management attitudes and support for
women/gender issues. Associations with results on
the ground.
Gender and Presence of women/gender issues in sector policy Analysis of policy
gender approach and nature of policy (welfare/effectiveness/gender documents,
in sector policy equity/gender as part of social equity). Reflection of semi-structured
policy in project approaches by implementing interviews or policy
agencies as found by agencies and in communities. analisys workshop with
card selections and scales.
A NEW TOOL FOR PLANNERS AND MANAGERS OF LARGE CDD PROGRAMS
15
devolution of central government authority, to the
reduction of gender and poverty inequalities, the
protection of the environment, and the integrated
management of water used for different and often
competing purposes. In consequence, separate
gender and social equity investigations are rarely
carried out.
The two previous methodologies for analyzing and
improving community water supplies and
sanitation (the Minimum Evaluation Procedures
and the Participatory Evaluation Tools) did not
systematically include the analysis of gender and
social equity aspects. Projects that wished to
analyze such aspects had to therefore use a
separate study by a social researcher with
specialization in gender studies. In practice, this
came to mean that equity assessments often did
not happen.
Equity assessment is more likely to happen when
it can be investigated along with other issues of
major interest to the program. Having a combined
set of tools to analyze sustainability and gender
and social equity aspects makes it easier for
community women and men, project staff and
managers to analyze and improve these aspects
concurrently.
MPA training sessions on gender and social equity
(see Chapter 4) help future facilitators to identify
and practice measures that make implementation
more equitable for women and the poor. Bringing
out gender and poverty aspects in contents and
analysis and bringing together negatively affected
groups, are first steps in a process of change.
Assessing these aspects further serves as a baseline
for action planning and monitoring and provides
benchmarks for measuring progress in programs,
as illustrated in the case studies in the second
section of this book.
2.3.3 Addressinggender andsocial equityin a sector-specific way
The gender analysis in the MPA builds upon
frameworks that were developed by Overholt and
others in 1984 and Moser in 1993. These
frameworks were a breakthrough in the analysis
of gender in development, but they also have
some limitations:
● They are not sector specific;
● Analysis is usually through case studies by
external specialists; and
● The focus is on gender inequalities without
addressing social equity issues.
The gender and social analysis frameworks
included in the MPA are specific for the drinking
water and sanitation sector, as shown in Boxes 7
and 8. They use participatory methods and
address differences in gender and social welfare
divisions and benefits.
The main equity issues that community groups
and program staff and managers may jointly
discover and use to act upon relate to:
● whether women and poor people have the
same access to water and participation as men
and the wealthier households;

A NEW TOOL FOR PLANNERS AND MANAGERS OF LARGE CDD PROGRAMS
16
Figure 2 The process of an increasingly specific focus
In an open
meeting, women
and men identify,
with the help of
drawings of poor
and wealthier
households, the
characteristics of
low, medium and
upper class
households in their
community.
In an open
meeting, the
group draws a
social map of the
community. They
use their readings
of the three classes
to mark the socio-
economic level of
the households. In
the map, they
delineate the
households with
and without
access, or with
poor access to the
service.
The facilitators use
the map to plan a
transect walk to a
sample of water
points and meet
with groups of
women and men
at various points in
the system to
assess the quality
of the service.
They also meet
with women and
men in the
unserved area.
The facilitators use
the map to
organize separate
meetings with
women and men
from poor and
wealthier/middle
class households.
In these meetings,
the groups assess
their participation,
sharing of benefits
and contributions,
use of services,
and impacts on
their lives.
> > >
● to what extent the demands of each group
are met;
● how access to water and the benefits and
burdens from, and control over, local
participation and management are divided
between the socio-economic groups and
between women and men;
● the relationship of these divisions with the
sustainability and use of the water supply and
improved sanitation.
Other differences on which hierarchies and
discrimination are based, such as caste, ethnicity,
religion, and nationality, may be taken into
account locally. Being situation-specific, they have
not been highlighted here.
2.3.4 Empowerment through self-assessment and action
The MPA differs from many other gender and
social analysis frameworks in that local women
and men participate in the analysis of equity
and sustainability in a gender- and poverty-
sensitive, empowering mode. A systematic
procedure enhances the participation of all
stakeholder groups in the process, as illustrated
in Figure 2.
Practicing gender and poverty sensitiveness is part of training and field procedures.
All of these potential benefits can be realized only if the MPA application is tailored to the project
and the purpose for which it is used, with attention and resources being devoted to quality
assurance mechanisms, as explained in Chapter 4.
A NEW TOOL FOR PLANNERS AND MANAGERS OF LARGE CDD PROGRAMS
17
2.4 What do MPAassessments cost?
Typically, using the MPA for sustainability
assessment requires two facilitators that spend a
minimum of four to five days in a village, and at
least one day in a stakeholder meeting at district
or province level. This does not include time for
planning, data analysis, and reporting, which
would vary with the size of the project, objectives
of assessment and therefore, the required sample.
Generally, MPA assessments for project design may
require a sample of only a few communities which
together represent the major design-influencing
variables for a new project, e.g., geo-hydrological
conditions or relative poverty and diarrheal
morbility rates. Using the MPA for micro-planning
community interventions implies assessments in
every project community, and their costs should
be built into routine project implementation
procedures. Monitoring and evaluation
applications are likely to use stratified or purposive
sampling of 5-10 percent of all project
communities at similar points in the project cycle.
Following the global assessments, the MPA is now
being applied on a larger scale. Budgets prepared
for its application for planning and monitoring in
a large scale project in Indonesia suggest that
costs of the MPA can be comparable to those of
other community-based approaches, when the
MPA is integrated in project implementation. The
MPA seems to best fit projects aiming at
community-driven development, which typically
allocate 20-30 percent of total project costs to
software investments.
More cost-related information can be found in
Section 2, in the case studies from Lao PDR and
Indonesia - the Flores project evaluation.
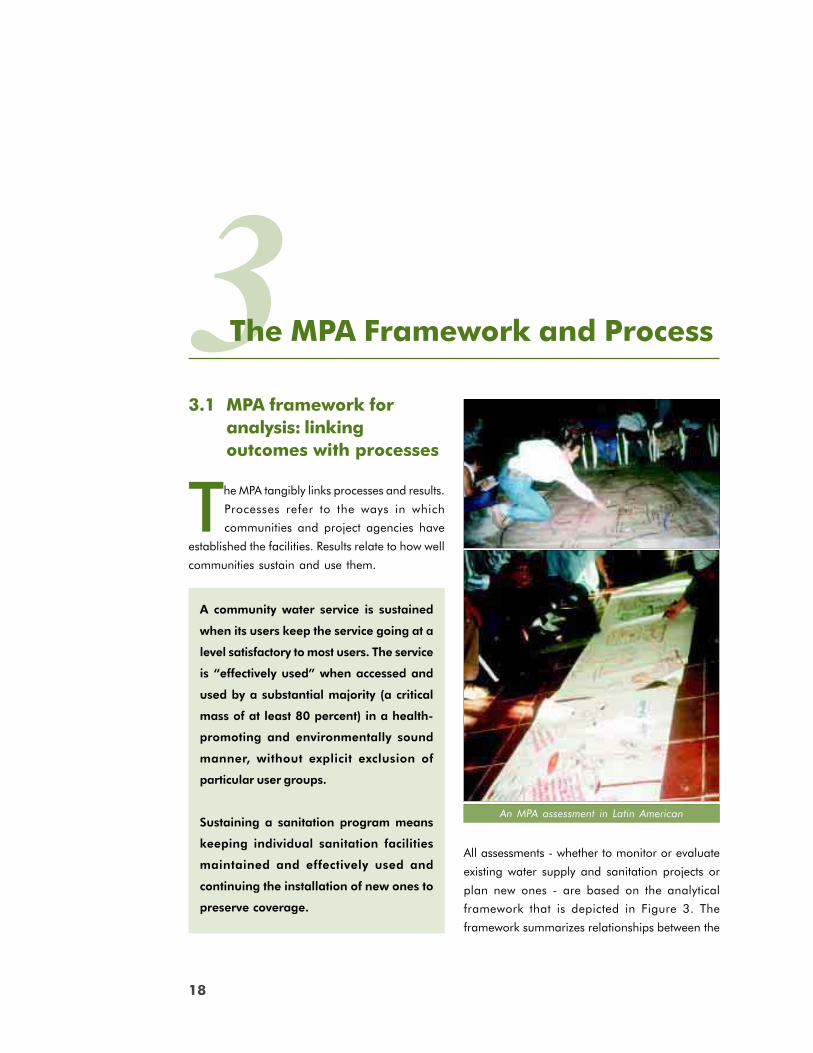
THE MPA FRAMEWORK AND PROCESS
18
33.1 MPA framework for
analysis: linkingoutcomes with processes
The MPA tangibly links processes and results.
Processes refer to the ways in which
communities and project agencies have
established the facilities. Results relate to how well
communities sustain and use them.
A community water service is sustained
when its users keep the service going at a
level satisfactory to most users. The service
is “effectively used” when accessed and
used by a substantial majority (a critical
mass of at least 80 percent) in a health-
promoting and environmentally sound
manner, without explicit exclusion of
particular user groups.
Sustaining a sanitation program means
keeping individual sanitation facilities
maintained and effectively used and
continuing the installation of new ones to
preserve coverage.
The MPA Framework and Process
All assessments - whether to monitor or evaluate
existing water supply and sanitation projects or
plan new ones - are based on the analytical
framework that is depicted in Figure 3. The
framework summarizes relationships between the
An MPA assessment in Latin American
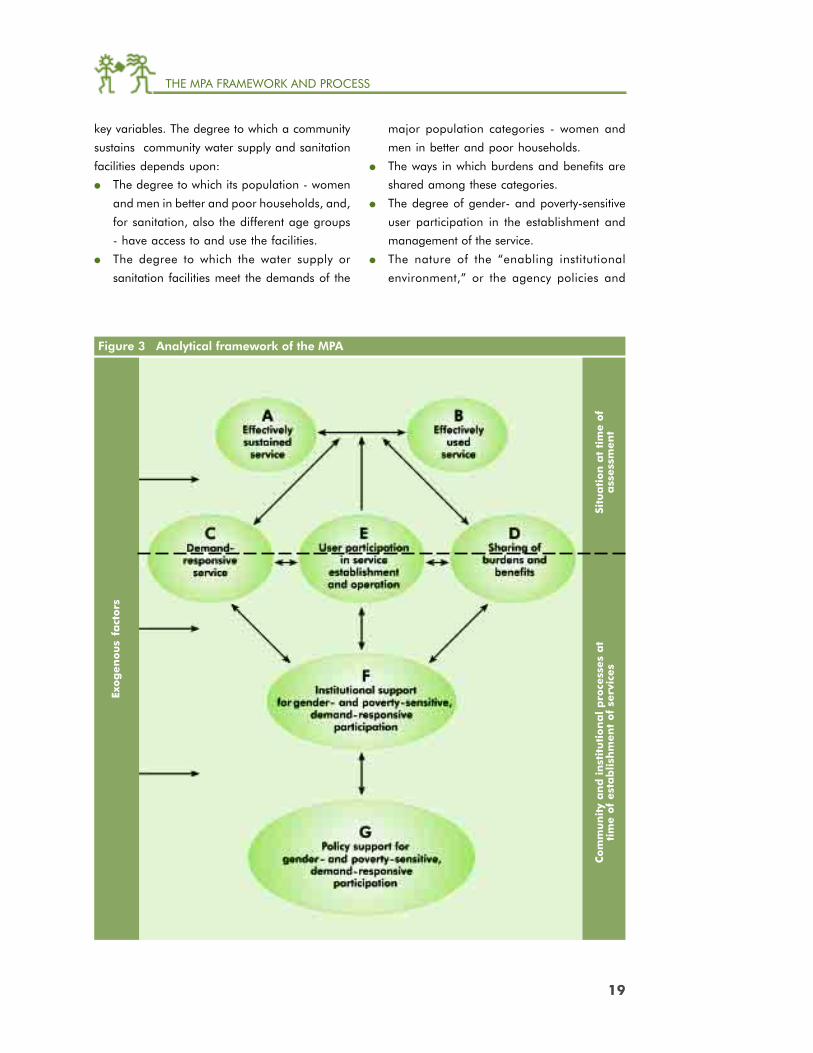
THE MPA FRAMEWORK AND PROCESS
19
key variables. The degree to which a community
sustains community water supply and sanitation
facilities depends upon:
● The degree to which its population - women
and men in better and poor households, and,
for sanitation, also the different age groups
- have access to and use the facilities.
● The degree to which the water supply or
sanitation facilities meet the demands of the
major population categories - women and
men in better and poor households.
● The ways in which burdens and benefits are
shared among these categories.
● The degree of gender- and poverty-sensitive
user participation in the establishment and
management of the service.
● The nature of the “enabling institutional
environment,” or the agency policies and
Figure 3 Analytical framework of the MPA
Situ
ati
on
at
tim
e o
fa
ssess
men
tC
om
mu
nit
y a
nd
in
stit
uti
on
al
pro
cess
es
at
tim
e o
f est
ab
lish
men
t of
serv
ices
Exo
gen
ou
s fa
cto
rs

THE MPA FRAMEWORK AND PROCESS
20
institutional arrangements and culture within
which the water supply and improved
sanitation services have been established.
● The “enabling policies,” or the nature of the
sector policies under which the project or
projects have been carried out.
The analytical framework provides an overview of
the situation and processes at the time of
establishment of the systems and at the time of
their assessment.
Clusters A and B are assessed with the
community’s women and men and their water
and sanitation management organization. They
represent the analysis of the current situation.
Clusters C, D, and E are also assessed with these
groups, but their variables, and their indicators
and sub-indicators span both current and past
situations. This is indicated by the dotted line in
the figure.
Apart from the analyzed factors, there may also
be “exogenous factors” that influence the
relationships between the clusters. They include
the type and complexity of the technology, age of
the system, ecological differences (e.g., drought
conditions and availability of alternative sources),
local mobility and access to spare parts and other
resources, communications, leadership situations
and gender and poverty conditions specific to the
area. They are captured in the initial Community
Data Sheet and through qualitative data recorded
by the assessment team as part of the participatory
analysis of the different factors. They may be
controlled through sampling if their presence is
known in advance. If not, data may need to be
grouped by the factors to analyze their influence
on the results.
3.2 Types of systems to assess
The MPA looks at generic qualities. Projects can
therefore use the methodology to assess and
compare between various types of water supply
or sanitation systems irrespective of the
technologies used or service levels.
Subjects of investigation are systems that have
been in existence for some time. To state with some
confidence that they are sustained and used, they
must have functioned for at least 1-2 years,
preferably longer. It is not necessary to have a
participatory assessment and analysis with all
communities which have installed new systems. It
is sufficient to carry out the study in a sufficiently
large randomly selected sample. This is discussed
in greater detail in Chapter 4.
For representativeness, the sample will preferably
also include non-functioning systems. The
analysis of non-functioning systems is an
important source of information about why
systems fail and how to avoid those mistakes.
However, conducting MPA assessments in
communities with non-functioning systems
assumes that some means for assistance are
available for correcting the situation. It would be
unethical to ask the community’s women and
men to spend several days of their time in
assessing the situation when the underlying
problems turn out to be beyond their influence
or control and no support can be given.
Sometimes such communities may not be
interested in participating in assessments. In such
cases full MPA assessments cannot be conducted,
but data should be gathered to avoid gaps in
the database through several other methods less
dependent on group participation involving
The MPA can help analyze any type of community-managed water and sanitation system
at community, institution, and policy levels.
THE MPA FRAMEWORK AND PROCESS
21
several days of time, e.g., key informant
interviews with project functionaries and willing
individual villagers and technical observation
checklists for water systems. The problem of non-
functioning systems cannot be overcome by
excluding them from the sample because doing
so would yield assessment results that are positively
biased and do not represent reality.
3.3 Sustainability indicators
The variables in clusters A-G, and the indicators
through which they are measured, are presented
in Box 10. In total, a full MPA assesses 15 main
variables, each with several sub-variables and
indicators. Sanitation can be included when
projects are integrated, or assessed separately.
Cluster A:Sustainability is measured by indicators for effective
design and construction, system functioning -
environmentally, technically and to the satisfaction
of users - effective financing and management.
Cluster B:Effective use is assessed in terms of access to
services and hygienic and environmentally safe
use by all.
Cluster C:Demand-responsiveness relates to three aspects:
user demand, responding to demand, and
satisfaction of demand.
● User demand is measured by the contributions
of the different user groups in cash and/or
kind to initiate and sustain operation.
● Responsiveness to demand is measured by the
degree to which the different communities and
user groups had opportunities to make
informed choices about the technologies and
service levels that they desire and can sustain,
and about financing and management
arrangements for them.
● Satisfaction of demands relates to the extent
to which demands of women and men in
wealthier and poor households are met by
the system, and the satisfaction of these groups
with the system and system management in
relation to their contributions.
Cluster D:Sharing of burdens and benefits is measured for
two points of time: during the construction of the
facilities, and during operation and maintenance.
It refers to the sharing at household and
community levels:
● How effectively are the facilities sustained and used?
● How equitable is the access gained by all groups?
● How equitable are the voice, choice and control exercised by all groups in the establishment
and operation of services?
● How equitably are the burdens and benefits divided among the groups?
● To what extent do agencies practice gender- and poverty-sensitive approaches?
● To what extent do sector/project policies support gender- and poverty-sensitive participation and
demand-responsive approaches?
● Do policies make a difference on the ground?
Box 9 Some key questions answered by the MPA
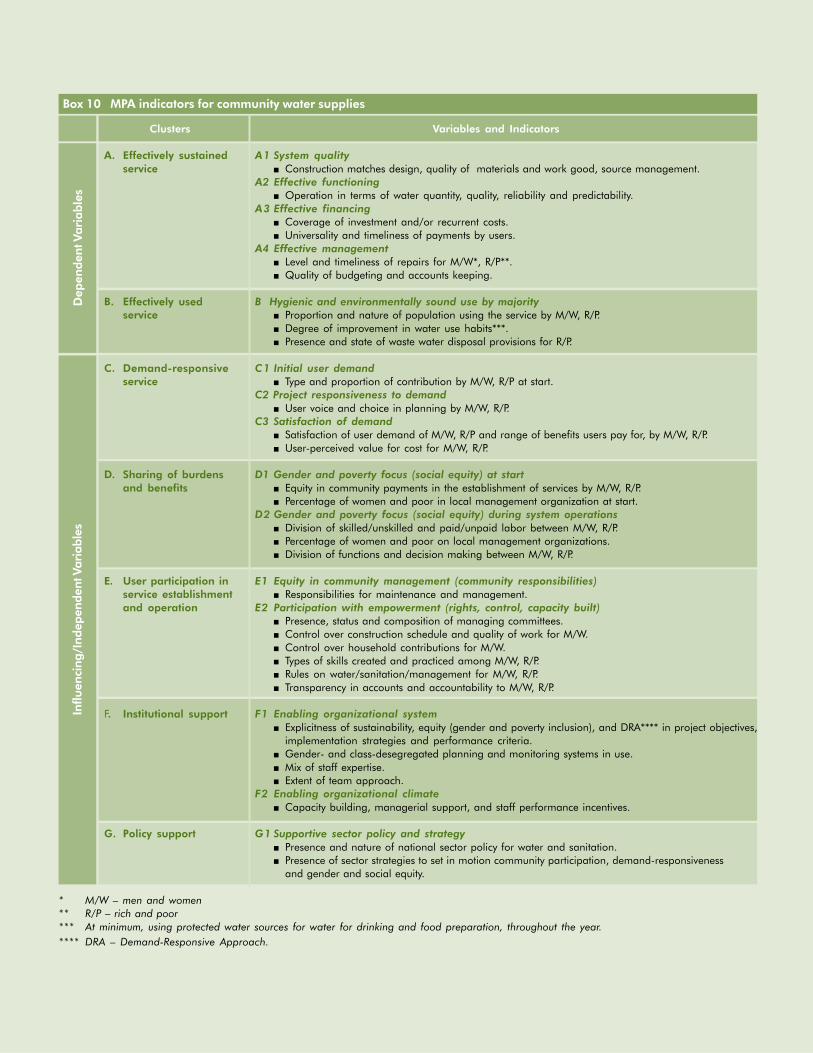
THE MPA FRAMEWORK AND PROCESS
22
Clusters Variables and Indicators
A. Effectively sustained A1 System qualityservice ■ Construction matches design, quality of materials and work good, source management.
A2 Effective functioning■ Operation in terms of water quantity, quality, reliability and predictability.
A3 Effective financing■ Coverage of investment and/or recurrent costs.■ Universality and timeliness of payments by users.
A4 Effective management■ Level and timeliness of repairs for M/W*, R/P**.■ Quality of budgeting and accounts keeping.
B. Effectively used B Hygienic and environmentally sound use by majorityservice ■ Proportion and nature of population using the service by M/W, R/P.
■ Degree of improvement in water use habits***.■ Presence and state of waste water disposal provisions for R/P.
C. Demand-responsive C1 Initial user demandservice ■ Type and proportion of contribution by M/W, R/P at start.
C2 Project responsiveness to demand■ User voice and choice in planning by M/W, R/P.
C3 Satisfaction of demand■ Satisfaction of user demand of M/W, R/P and range of benefits users pay for, by M/W, R/P.■ User-perceived value for cost for M/W, R/P.
D. Sharing of burdens D1 Gender and poverty focus (social equity) at startand benefits ■ Equity in community payments in the establishment of services by M/W, R/P.
■ Percentage of women and poor in local management organization at start.D2 Gender and poverty focus (social equity) during system operations
■ Division of skilled/unskilled and paid/unpaid labor between M/W, R/P.■ Percentage of women and poor on local management organizations.■ Division of functions and decision making between M/W, R/P.
E. User participation in E1 Equity in community management (community responsibilities)service establishment ■ Responsibilities for maintenance and management.and operation E2 Participation with empowerment (rights, control, capacity built)
■ Presence, status and composition of managing committees.■ Control over construction schedule and quality of work for M/W.■ Control over household contributions for M/W.■ Types of skills created and practiced among M/W, R/P.■ Rules on water/sanitation/management for M/W, R/P.■ Transparency in accounts and accountability to M/W, R/P.
F. Institutional support F1 Enabling organizational system■ Explicitness of sustainability, equity (gender and poverty inclusion), and DRA**** in project objectives,
implementation strategies and performance criteria.■ Gender- and class-desegregated planning and monitoring systems in use.■ Mix of staff expertise.■ Extent of team approach.
F2 Enabling organizational climate■ Capacity building, managerial support, and staff performance incentives.
G. Policy support G1 Supportive sector policy and strategy■ Presence and nature of national sector policy for water and sanitation.■ Presence of sector strategies to set in motion community participation, demand-responsiveness
and gender and social equity.
* M/W – men and women** R/P – rich and poor*** At minimum, using protected water sources for water for drinking and food preparation, throughout the year.**** DRA – Demand-Responsive Approach.
Dep
enden
t Var
iable
sIn
fluen
cing/
Inde
pende
nt V
aria
bles
Box 10 MPA indicators for community water supplies
THE MPA FRAMEWORK AND PROCESS
23
● of work, and, where applicable, of cash
contributions between the genders within
households;
● of decision making, paid and unpaid work
for local construction, maintenance and
management, between genders and social
classes.
Cluster E:The cluster on participation looks at two types of
participation:
● the responsibilities, or the work done by
community members done by in maintenance
and management;
● the rights, capabili t ies, and controls
(empowerment) for these tasks.
Here again, the assessment distinguishes between
responsibilities and power of the genders and
different socio-economic classes.
Cluster F:Institutional analysis has two entry points:
● the enabling organizational system for
approaches that are participatory, demand-
responsive and gender- and poverty-sensitive,
and,
● the enabling organizational climate in which
implementing agency staff operate.
Cluster G:Policy analysis looks at two areas:
● How explicitly sector policies define
sustainability and equity as their goals.
● To what extent strategies are defined and
available, in support of those goals.
The community level indicators for sanitation, in
Box 11, are somewhat different than those for
water supply. Only clusters E, F, and G are the
same as for water services. The indicators apply
only to community-managed sanitation
programs.8
3.4 Other factors to explaindifferences
Apart from the above, users of the MPA look at
other local and common factors that may explain
the differences found.
● In the communities: percent poor, ethnic/
religious homogeneity, availability of alternative
water sources, strength and unity of male and
female leadership, and level of development/
communications.
● In the project: complexity of technology;
availability spares and technical support, type
of funders, type of project (water or water and
sanitation), unit cost, age, number of times
upgraded.
● In the state or country: the GNP and human
development indicators.
3.5 Demand, demand-responsive approach andparticipation
Past research has revealed the pitfalls of using
purely economic definitions of demand9 and
demand-responsiveness.10
8 For programs that work directly with individual households, somewhat different indicators and scales will berequired. It should be noted that a sanitation component was included in only a small number of waterprojects/programs in the first assessments. As such, no statistical relationships were tested for the sanitationcomponent determined in the global study. Only frequencies were recorded and analyzed. Application in alarger sample for sanitation may show that some of these indicators and clusters are not statistically significant.
9 Katz and Sara (1997) define demand as “the quantity and quality of water community members will choose toconsume at a given price”.
10 Responding to demand means giving users choices as to how much water they want to consume at a givenprice. This implies that a project “allows communities to make informed choices about the level of service theywant, with an understanding of the implications of their decisions” (Katz and Sara, 1997).
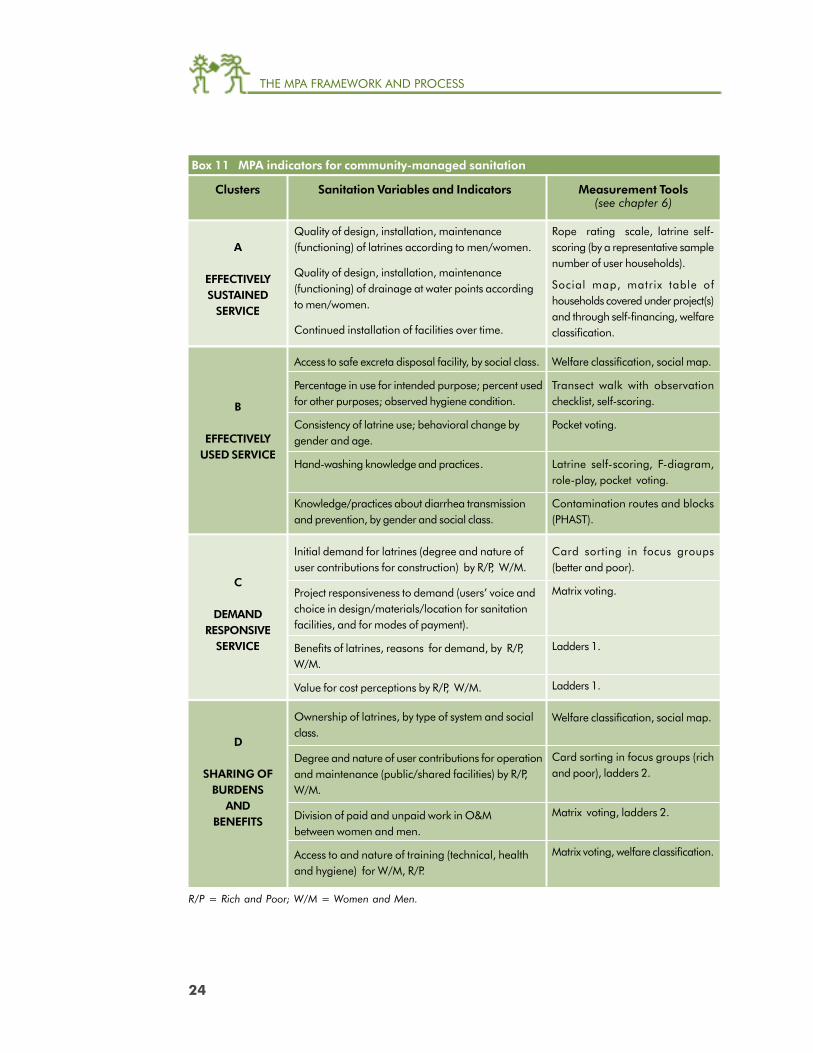
THE MPA FRAMEWORK AND PROCESS
24
Rope rating scale, latrine self-scoring (by a representative samplenumber of user households).
Social map, matrix table ofhouseholds covered under project(s)and through self-financing, welfareclassification.
Welfare classification, social map.
Transect walk with observationchecklist, self-scoring.
Pocket voting.
Latrine self-scoring, F-diagram,role-play, pocket voting.
Contamination routes and blocks(PHAST).
Card sorting in focus groups(better and poor).
Matrix voting.
Ladders 1.
Ladders 1.
Welfare classification, social map.
Card sorting in focus groups (richand poor), ladders 2.
Matrix voting, ladders 2.
Matrix voting, welfare classification.
Quality of design, installation, maintenance(functioning) of latrines according to men/women.
Quality of design, installation, maintenance(functioning) of drainage at water points accordingto men/women.
Continued installation of facilities over time.
Access to safe excreta disposal facility, by social class.
Percentage in use for intended purpose; percent usedfor other purposes; observed hygiene condition.
Consistency of latrine use; behavioral change bygender and age.
Hand-washing knowledge and practices.
Knowledge/practices about diarrhea transmissionand prevention, by gender and social class.
Initial demand for latrines (degree and nature ofuser contributions for construction) by R/P, W/M.
Project responsiveness to demand (users’ voice andchoice in design/materials/location for sanitationfacilities, and for modes of payment).
Benefits of latrines, reasons for demand, by R/P,W/M.
Value for cost perceptions by R/P, W/M.
Ownership of latrines, by type of system and socialclass.
Degree and nature of user contributions for operationand maintenance (public/shared facilities) by R/P,W/M.
Division of paid and unpaid work in O&Mbetween women and men.
Access to and nature of training (technical, healthand hygiene) for W/M, R/P.
A
EFFECTIVELYSUSTAINED
SERVICE
B
EFFECTIVELYUSED SERVICE
C
DEMANDRESPONSIVE
SERVICE
D
SHARING OFBURDENS
ANDBENEFITS
Box 11 MPA indicators for community-managed sanitation
Clusters Sanitation Variables and Indicators Measurement Tools(see chapter 6)
R/P = Rich and Poor; W/M = Women and Men.
THE MPA FRAMEWORK AND PROCESS
25
The MPThe MPThe MPThe MPThe MPA uses a basic definition of “A uses a basic definition of “A uses a basic definition of “A uses a basic definition of “A uses a basic definition of “demand” asdemand” asdemand” asdemand” asdemand” as
the “willingness to paythe “willingness to paythe “willingness to paythe “willingness to paythe “willingness to pay,,,,, based on informedbased on informedbased on informedbased on informedbased on informed
choice.”choice.”choice.”choice.”choice.”
Inherent in this definition are equity concerns
related to the questions “whose demand?” and
“whose willingness to pay?” In the MPA, demand
is understood as the aggregate demand of all
sections of communities, i.e., both women and
men, both the poor and the wealthier, both
minority and majority groups. “Payment” includes
all forms in which the users may contribute, i.e.,
in cash, in kind, and with time and energy for
obtaining, operating, maintaining, and managing
services.
Also inherent in this definition is the understanding
that “choice” means a lot more than technology
or cost options. The MPA uses the term to mean
who participates in which choices, i.e., which
groups within the communities and households
make which of the several key decisions, such as:
● initiation of the projects;
● the type of technologies and service levels;
● the location of the facilities;
● the local management, maintenance, and
financing systems; and
● the candidates for training.
The “capacity to pay“ gets verified through the
process of facilitating informed choice - an
essential requirement of the demand-responsive
approach. It is not possible to assess “willingness
to pay” with any accuracy in the absence of
choices and full information about choices being
offered and discussed with potential consumers.
Both willingness and capacity to pay can be
surprisingly elastic, depending on what options
are being offered, at what immediate and longer-
term costs, and how clearly this information is
communicated to and discussed with women and
men from wealthier, intermediate, and poor
groups, who are all potential consumers of
services. Gender-sensitive methods play an
important role in assessing the overall demand
for services (see example in Java case study,
Section 2 of this report).
While assessing demand, it is also important to
investigate and control for incentives in the
potential users’ environment which may distort their
willingness or capacity to pay. For example, if
people believe that services might be provided free
of charge, they may have an incentive to say that
they are too poor to pay. In such cases it may not
be possible to get an accurate assessment of
demand until the initial stages of project
implementation are under way. At this time
potential consumers can begin to see the real terms
under which the services are finally being provided.
Demands and meeting demands are not static
issues. Continued maintenance and use of
services and user payments depend on how well
the improved facilities continue to match the
expectations and resources of the different groups.
Users also continually compare how benefits relate
to the costs of obtaining them.
To understand “demand” in relation to sustained
services, the MPA measures the satisfaction of
women and men (in wealthier and poorer
households) with the improved facilities, the
operation and management of the facilities, and
the effects of the same on their lives (extent of
demand met). It relates these levels of satisfaction
to what each group has contributed to
construction and now contributes in the post-
construction phase, not only in cash but also in
time, labor, and any other form (perceived value
for cost). The analysis of these processes is done
across time and at community as well as agency
levels. This reveals how processes at different levels
and phases in the project cycle determine the final
results of water supply and sanitation projects.
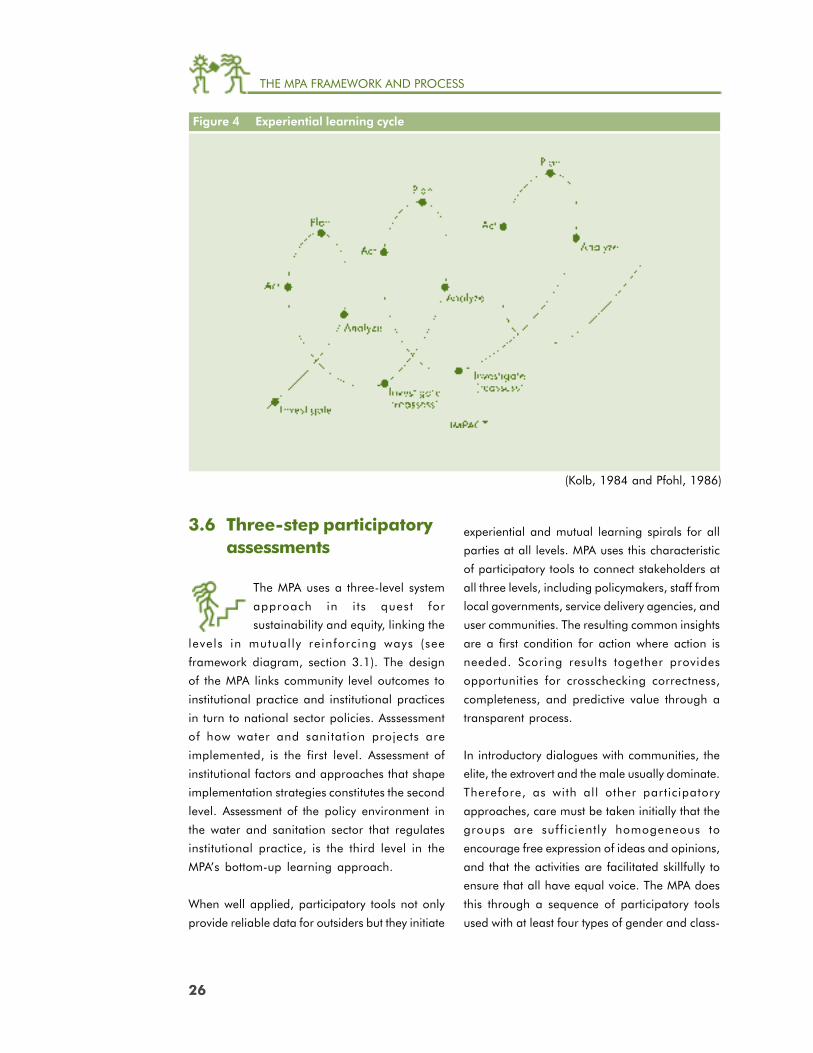
THE MPA FRAMEWORK AND PROCESS
26
Figure 4 Experiential learning cycle
3.6 Three-step participatoryassessments
The MPA uses a three-level system
approach in i ts quest for
sustainability and equity, linking the
levels in mutual ly reinforcing ways (see
framework diagram, section 3.1). The design
of the MPA links community level outcomes to
institutional practice and institutional practices
in turn to national sector policies. Asssessment
of how water and sanitation projects are
implemented, is the first level. Assessment of
institutional factors and approaches that shape
implementation strategies constitutes the second
level. Assessment of the policy environment in
the water and sanitation sector that regulates
institutional practice, is the third level in the
MPA’s bottom-up learning approach.
When well applied, participatory tools not only
provide reliable data for outsiders but they initiate
experiential and mutual learning spirals for all
parties at all levels. MPA uses this characteristic
of participatory tools to connect stakeholders at
all three levels, including policymakers, staff from
local governments, service delivery agencies, and
user communities. The resulting common insights
are a first condition for action where action is
needed. Scoring results together provides
opportunities for crosschecking correctness,
completeness, and predictive value through a
transparent process.
In introductory dialogues with communities, the
elite, the extrovert and the male usually dominate.
Therefore, as with all other participatory
approaches, care must be taken initially that the
groups are sufficiently homogeneous to
encourage free expression of ideas and opinions,
and that the activities are facilitated skillfully to
ensure that all have equal voice. The MPA does
this through a sequence of participatory tools
used with at least four types of gender and class-
(Kolb, 1984 and Pfohl, 1986)

THE MPA FRAMEWORK AND PROCESS
27
11 Voices Of The Poor Crying Out for Change. Narayan, Chambers, Shah and Petesch. World Bank. 2000.
segregated groups, namely, poor women, poor
men, wealthier women and wealthier men.
Results are then shared and discussed in mixed
gender and class groups in large community
gatherings, where the differences among the
groups can be understood and appreciated by
all. The MPA makes transparent the voices and
choices of all groups so that they can all be
accommodated in the community ’s plan for
improving services.
For community groups, the use of the MPA
community analysis tools is a first step to analyze
situations, identify areas for change, and take
collective action. For implementation, the groups
use further participatory processes and the MPA
monitoring tools. They may then repeat the
analysis to evaluate their progress, generate new
knowledge to plan further, improve
implementation or take up new activities as a
follow-up, as illustrated in Figure 4. Community
analysis is also a learning opportunity for program
staff. Dialogue and negotiations help pinpoint
the changes that local groups will make, and those
required from agency staff.
Agency staff members then use participatory
institutional analysis tools from the MPA to rate
the enabling environment in their agencies.
Representatives from user communities participate
in the institutional assessments to assess the styles
of working the staff has with women and men in
communities. (See Stakeholders’ meeting in
Chapter 6.)
An inventory and analysis of the overall policy
aspects takes place with the sector policymakers
or program managers, using the MPA tools for
participatory policy assessment. Doing this at the
end of the sequence, after the results of the other
levels are known, makes it possible to see if and
how results on the ground and in the institutions
are influenced by the prevailing policies, and
where action must start to bring about changes
in institutions and at ground level.
Participatory methods and tools have been in use
at micro level since the 1980s. In the last few years,
they have also been used to gain insight into
organizations and the qualitative aspects behind
economic figures at the macro level. The World
Bank has, for example, recently used them in a
22-country study to learn more about poverty from
poor women and men worldwide.11
The MPA now provides a way to apply participatory
tools in programs and projects at the meso
(intermediate, between macro and micro levels)
level. How to implement these assessments in
programs is described in the next chapter.
MPA fills a gap at the meso level.
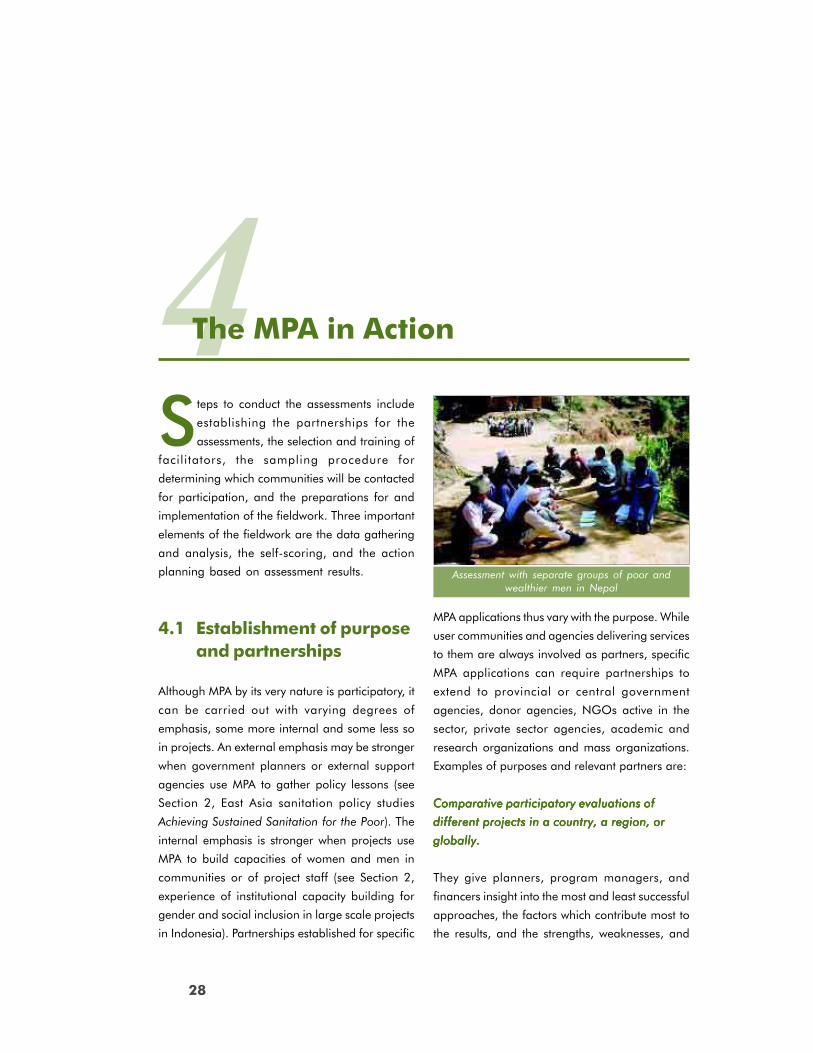
THE MPA IN ACTION
28
4Steps to conduct the assessments include
establishing the partnerships for the
assessments, the selection and training of
facilitators, the sampling procedure for
determining which communities will be contacted
for participation, and the preparations for and
implementation of the fieldwork. Three important
elements of the fieldwork are the data gathering
and analysis, the self-scoring, and the action
planning based on assessment results.
4.1 Establishment of purposeand partnerships
Although MPA by its very nature is participatory, it
can be carried out with varying degrees of
emphasis, some more internal and some less so
in projects. An external emphasis may be stronger
when government planners or external support
agencies use MPA to gather policy lessons (see
Section 2, East Asia sanitation policy studies
Achieving Sustained Sanitation for the Poor). The
internal emphasis is stronger when projects use
MPA to build capacities of women and men in
communities or of project staff (see Section 2,
experience of institutional capacity building for
gender and social inclusion in large scale projects
in Indonesia). Partnerships established for specific
The MPA in Action
MPA applications thus vary with the purpose. While
user communities and agencies delivering services
to them are always involved as partners, specific
MPA applications can require partnerships to
extend to provincial or central government
agencies, donor agencies, NGOs active in the
sector, private sector agencies, academic and
research organizations and mass organizations.
Examples of purposes and relevant partners are:
Comparative participatory evaluations ofComparative participatory evaluations ofComparative participatory evaluations ofComparative participatory evaluations ofComparative participatory evaluations of
different projects in a country, a region, ordifferent projects in a country, a region, ordifferent projects in a country, a region, ordifferent projects in a country, a region, ordifferent projects in a country, a region, or
globally.globally.globally.globally.globally.
They give planners, program managers, and
financers insight into the most and least successful
approaches, the factors which contribute most to
the results, and the strengths, weaknesses, and
Assessment with separate groups of poor andwealthier men in Nepal
THE MPA IN ACTION
29
action points in individual communities and
projects.
PPPPParticipatory baseline studies of approachesarticipatory baseline studies of approachesarticipatory baseline studies of approachesarticipatory baseline studies of approachesarticipatory baseline studies of approaches
and results in areas where new interventionsand results in areas where new interventionsand results in areas where new interventionsand results in areas where new interventionsand results in areas where new interventions
are planned.are planned.are planned.are planned.are planned.
Baseline studies give insights to project designers
and implementers into what the new program can
build on or has to improve. They also make it
possible for project managers to classify
communities into those which already have good
capabilities to manage improved water supply and
sanitation, those with great situational and
institutional problems, and those which are in-
between. The first group may mainly need funds
to improve or expand their infrastructure and
Terms of Reference to account for outputs and
financial management. The second group
obviously needs the longest and most
comprehensive technical support and a more
flexible time frame than the other groups.
Participatory baseline studies make it possible for
users and implementing and funding agencies to
evaluate the results and impacts of new
interventions.
PPPPParticipatory monitoringarticipatory monitoringarticipatory monitoringarticipatory monitoringarticipatory monitoring, mid-term, and, mid-term, and, mid-term, and, mid-term, and, mid-term, and
end-evaluations.end-evaluations.end-evaluations.end-evaluations.end-evaluations.
Mid-term evaluations are undertaken halfway
through a program or project. They show what
has been achieved with the given inputs and
resources and where improvements are required.
Doing them in a participatory manner gives staff
and community groups the opportunity to share
their experiences of program realities in a
structured manner. One or two external evaluators
may be added for combining internal and external
perspectives.
In periodic monitoring the methodology provides
managers and staff with quantitative data for every
community that has carried out an MPA
assessment. These data are entered into a simple
database using standard software of Excel, Access,
and/or SPSS. These packages make it possible
for any manager or agency staff with a basic
knowledge of statistics to combine and analyze
information according to his/her needs. They can
also present this information in graphic forms that
a wide range of stakeholders can understand -
from community groups to program financers,
local government personnel, and policymakers
(see examples in Chapter 5).
End-evaluations take place at the end of a
program or project. Using the MPA for end-
evaluations is the least satisfactory because it
leaves communities to address improvements on
their own. It is still useful though, since it helps
communities identify changes in their own
management of their services, which are
necessary to ensure sustainability. Funding
agencies and borrowing governments (in case
of loan-funded projects) may be learning
partners in such evaluations in view of
forthcoming projects.
One-time participatory studies byOne-time participatory studies byOne-time participatory studies byOne-time participatory studies byOne-time participatory studies by
external facilitatorsexternal facilitatorsexternal facilitatorsexternal facilitatorsexternal facilitators
While MPA can be used for this purpose, such
studies have several limitations:
● They do not build or strengthen capacities of
community groups and staff.
● Most staff and community groups do not
continue applying participatory analysis and
action planning after a study has been
completed.
● Horizontal spread to other communities and
groups in the program does not take place.
● There are no opportunities to link participatory
analysis with participatory planning and
implementation.
● After having identified the areas for action,
other participatory methods and tools are
THE MPA IN ACTION
30
needed to continue the work. Undertaking
studies as single and separate interventions
reduces the possibilities for continuing the
process.
● No program database is built up.
4.2 Selecting the assessmentteams
The assessment team usually comprises female
and male members from the community, field staff
from the agencies involved in the program, a
sociologist, anthropologist, or participatory
development specialist with skills on gender
analysis and training, and a water or sanitary
engineer. The latter two need to be skilled trainers
in the use of the MPA and have experience with,
and commitment to participatory approaches with
gender and social equity perspectives .
In cases where a statistical analysis is intended,
a development economist, sociologist or statistician
familiar with non-parametric statistics and
participatory methods is needed on the team.
For the preparation or adaptation of the
participatory tools, a local illustrator is helpful.
However, groups can also use their own materials
and inventiveness, and rely on real life symbols,
own sketches and drawings, and locally drawn
or written cards. Using their own or local materials
encourages ownership and creativity. It also makes
it easier for community groups to continue using
the participatory tools and techniques introduced.
Personal values and attitudes areas important as skills
Training teams of MPA facilitators constitutes a
considerable investment for the organizations that
undertake or finance MPA assessments. Such
organizations may be local NGOs, consultancy
firms, program support centers, and training
institutes. They may also be water supply and
sanitation implementation agencies that have
decided to train their own staff members.
Within these organizations, not everyone has the
right values, attitudes, and skills for facilitating the
use of participatory tools. Many facilitators with
skills in the use of participatory tools are not
automatically conscious of gender and social
inequalities. It takes the accompanying values,
attitudes, and skills to deal with these inequities.
The composition and hiring of facilitation teams
therefore requires a great deal of care.
Organizations have improved the selection and
capacity development of facilitators in several
ways:
Box 12 The assessment team
An MPA assessment team consists of:
● Male and female members of the
community and the local WSS management
organization, which, ideally, should
represent different socio-economic groups
in the community.
● Field staff who have been with the program
long enough to have experience with
approaches at the time of planning and
establishing the community systems.
● A sociologist/ participatory development
specialist with skills in gender analysis and
training.
● A sanitary or water supply engineer with
experience in and commitment to
participatory approaches with gender and
social equity perspectives.
● At the program level, a data analyst with
experience in using non-parametric
statistics.
THE MPA IN ACTION
31
● Program agencies, and agencies that finance
assessments, work with teams that continue
practicing over time. They do not accept teams
that have been formed “just for the occasion”
by inexperienced employees;
● Selection is by a committee which includes
persons with considerable field experience with
participatory tools and gender and social
equity;
● During interviews, candidates are asked to
provide examples of their experience of
participatory work, including work with women
and poor people;
● Selection committees ask the candidates to
provide some kind of skills demonstration,
e.g., in a role play or a problem solving
exercise;
● Candidates are asked to give examples of their
creative use of participatory methods, e.g.,
variations in materials and methods or
development of own tools, as evidence that
they are not applying participatory tools and
techniques mechanically as a “ritual”;
● Community groups - especially women, poor
people and other marginal groups -
recommend particular staff members for
training;
● The training doubles as a selection process;
only the best candidates will qualify, or
qualification is graded;
● Peer review and community reviews on
attitudes and skills are part of the training
and fieldwork;
● Structured observations on facilitation and
communication attitudes and skills are part of
the training and fieldwork.
The women and men from the community
participating in assessments should represent the
various socio-economic groups and not just the
elite. The trainers/facilitators help the other
members of the assessment team focus on
contextual issues, ensure objectivity and monitor
the quality of the work. A mix of respected female
and male community members and project or
government representatives at the start helps pave
the way for the assessment in the communities.
In case of a series of assessments at country or
inter-country level, the establishment of a Gender
Assessment Committee (GAC) comprising
representatives from sector line ministries and
partner agencies, and including persons with
field experience in participatory water and
sanitation programs may be useful. The role of
such a committee will include defining the scope
of the assessment, quality assurance, peer
reviewing and selecting of the assessment team.
The GAC does not conduct the assessment but
maintains a supervisory role.
Experience during the global PLA study showed that technical people sometimes feel uncomfortable
using participatory tools. “Let me come for training when you finish the visual exercise.”
Training program needed to focus first on attitude development for community-driven approaches
before embarking on MPA tools.
East and Southern Africa regional synthesis report on the PLA Initiative.
WSP - East and Southern Africa, 2000.
Box 13 Not everyone has the personal attitudes to work with participatory methods and
practice equity
THE MPA IN ACTION
32
4.3 Training preparation
In the preparation phase, a team of regional
trainers, well-vesed in the methodology, helps the
participating project(s) to plan the assessments and
prepare for the training of the staff members on
assessment teams. During this phase, the team
of trainers and project managers defines what the
training will entail. It has to be jointly determined,
for example, how much training may be needed
on participatory methods and gender and gender
analysis and whether the assessments will include
a statistical analysis.
In some Water and Sanitation Program field offices
and in IRC, trainers are available who have hands-
on experience with the methodology and have
taken part in the development of a Training Of
Trainers course.
4.4 Training implementation
The duration of the training depends on the level
of skills and experience of the staff, but generally,
it lasts some two weeks. Training events are
structured to cover the three levels of the
assessment: community, program agency, and
policy level. The development of attitudes and skills
for dealing with gender and social equity issues
at every level is an important element.
During the first few days of training the participants
become familiar with the concepts and tools of
the methodology and gain experience in its
application, using problem identification and
analysis from role plays. Structured peer and
trainers’ observations are used for generation of
awareness and improving skills. An important part
of training is the experiencing of each tool through
hands-on applications and role-playing. This
allows the participants to internalize the tools and
identify and address bottlenecks and limitations.
They are also encouraged to be creative and vary
application, tools, and techniques to adjust to
differences in the field.
The second week is spent on completing one
sequence in the field to gain hands-on experience,
and to allow observation and evaluation of content
and process, attitudes and skills. Fieldwork
includes practicing how to analyze outcomes of
individual sessions, and how to summarize and
analyze the outcomes of a community assessment
as a whole. It also covers the use of the fieldbook,
data entry, and scoring.
The final two days of training focus on ways of
compiling data across communities, critically
reviewing aggregated findings, practicing how to
present the information to management, and
discussing follow-up recommendations.
When working with the community, facilitators
must recognize that the community has its own
knowledge and creativity, and that gender
relations affect participation, control and
benefits. Hence those selected need to have
extensive experience
in the use of the
participatory tools
and activities and
know how to do a
gender analysis.
If the team has had no prior experience in
participatory approaches and gender issues,
it is important that the training is extended,
to develop skills and attitudes for dealing with
these aspects of the methodology.
Box 14 The MPA is a process-oriented
methodology
THE MPA IN ACTION
33
The training helps the team assimilate the application of the methodology. The
data collection and analysis is a learner-centered participatory process. The
aim is not to extract information, but to generate discussions to facilitate
community analysis and action planning. Elements in the training
are:
● Sharing experiences on sustainability, use, and participation. Understanding and appreciating
different perspectives and opportunities of community groups.
● Relating the understanding to the roles of the MPA to assess and enhance these aspects.
● Conceptual understanding of the methodology and its core features.
● Objectives, implementation, and uses of the assessments.
● Expectations of the participants from the methodology, the training, and other issues.
● Definition of terms and concepts to ensure consensus on issues of interpretation and perceptions.
● Facilitation process and skills, including awareness of gender and social equity issues. Practice
to deal with these issues in processes and contents of assessments.
● Emphasis that the team will be expected to help bring out insights and disaggregated information
on gender and social equity in processes (participation, demand responsive approach) and results
(sustaining and use of services), and analyze with community groups and program staff how
these issues are related and may be enhanced.
● Development and adaptation of tools to local contexts.
● Hands-on experience with participatory tools and scoring matrices. Clear understanding of the
purpose and application of each tool, the means for application and adjustment (e.g., in
mapping and pocket voting), the types of information expected from the tools, subject areas for
group analysis, and planning of follow-up action.
● Documentation of fieldwork and reporting of results.
● Locating communities for hands-on practice, preparation and planning logistic arrangements.
● Open-ended and structured observations. Feedback sessions at various points.
● Defining scope of study and sampling criteria. Reviewing preparations.
● Team building for working in a mutually complementary learning mode with team members
having diverse skill-profiles and experiences.
Key outputs of the training:
● Conceptual understanding of the assessment framework and issues.
● Consensus on objectives of the assessment, implementation, monitoring, and evaluation aspects,
and gender and poverty aspects.
● Skills to apply the methodology, including participatory analysis at the three levels and qualitative
and quantitative analysis afterwards.
● Sampling criteria defined.
● A skilled assessment team, sensitized to the need to work in an interdisciplinary team mode for
best results.
● Assessment tools and fieldbook adjusted for local context.
● Defined roles and responsibilities, including data entry and report writing responsibilities.
● Action plan for fieldwork, including logistics.
Box 15 Key elements of MPA training
33
THE MPA IN ACTION
34
4.5 Selecting the communities
When used for monitoring or self-evaluation, the
MPA helps its practitioners assess services already
operating. When used for planning of new
projects, the assessments will establish how existing
systems have been established and are managed.
MPA is most appropriate to use in the following
situations:
● The water and sanitation systems that will be
assessed should have been functioning for
some time, at least 2-3 years or longer.
● If they are still functioning, various aspects of
their functioning will be assessed. If not
functioning, reasons leading to the system’s
failure will be investigated and documented.
● The service should have some form of
decentralized management, i.e., it should not
be exclusively managed by an external agency.
If the services are entirely externally managed,
tools in addition to MPA will need to be used.
● The project organization and community
should further be willing to participate in the
assessments.12
In large programs, the assessments will usually
be carried out with a random sample of
communities. A random sample gives every
community in a project or program the same
chance to be included in the assessment. In a
random sample, each community has the same
probability of being approached to participate
in an assessment. Each potential community is
also selected independently from others. Those
eligible would be all communities in a particular
program area when the program makes no
distinction for size and type of communities that
may participate. Usually, however, programs have
specific selection criteria for communities. The
“sampling pool” (known in statistics as the
universe) will then consist of all communities that
meet the selection criteria and have water supply
and/or improved sanitation facilities installed
under the ongoing or completed program.
Alternatively, when MPA is used as a project
planning or baseline building method, the
selected communities may have older service
provisions, either made by themselves or under
earlier programs or both. The incoming program
will be aimed at enabling these communities to
update, expand, improve, or replace the systems.
In a non-random sample, the findings and
conclusions from selected communities only hold
for the specifically selected cases, and are not
applicable for all communities in the program(s)
from which they were selected.
Special caution is required if organizations or
communities take part in comparative studies
based on an open invitation from the organizers.
Chances are that in such cases of self-selection,
the sample will have a bias towards more
participatory, socially inclusive, and gender-aware
communities. In such situations, the variation in
approaches and results between individual
communities may still be large enough to bring
out differences that are significant, that is, to be
due to more than pure chance. However, in a
skewed sample, e.g., when selection procedures
have led to an overrepresentation of more
12 In keeping with participatory research principles, evaluation exercises may not be imposed on unwilling ordisinterested communities. However, working only with eager and willing communities can seriously bias thesample and results of assessments. It is therefore important to develop a rigorous sampling plan including analternative reserve list with additional communities, numbering at 20 percent of the required sample. Samplecommunities from the primary list are first contacted as planned. In case resistance or lack of interest inparticipating is encountered in a community, a genuine attempt should first be made to ascertain reasons bycontacting secondary sources of information and key individuals. If by doing so trust can be established, MPAassessments can be carried out as planned. If not, the case should be documented and another comparablecommunity selected from the reserve list. Such documentation usually provides valuable learning about pastproject approaches and their consequences.
THE MPA IN ACTION
35
successful or unsuccessful projects, regression
equations can not be applied to help predict which
inputs lead to better sustainability and use of
services.
4.6 Sampling procedures
The sample size and rigor of sampling procedures
will vary with the purpose for which the MPA is
being used, e.g., as a part of training for
managing water-sanitation projects, for case
studies, program planning, monitoring or
evaluation, or research purposes, and depending
on whether a statistical analysis is required.
For most evaluation research and monitoring
purposes, the number of communities in the
sample would vary with the size of the project and
the types of interventions it makes. The aim is to
involve enough communities to provide a good
cross-section of the typical technical, social,
economic, cultural, political, administrative, and
environmental conditions in the project area,
without confounding biases in selection.
If overall conditions are homogenous, a simple
random sample can be drawn. To do so, each
community in the program(s) being sampled gets
its own number, beginning with number one. Each
number is written on a separate slip of paper
which is tightly folded. The slips are placed in a
box or bag. They are stirred well until all have
mixed. The required number of communities for
the sample (see below under sample size) is then
drawn from the container.
The alternative is to use a table with random
numbers. Assuming that a sample of 40
communities needs to be drawn for a program
with 600 communities, a numbered list of
names is prepared from 1 to 600. To draw
the sample, one can start reading numbers
in the table that consist of any three figures.
The starting point may be anywhere in the
table. The first 40 numbers thus generated
between 1 and 600 are the numbers of the
communi t ies tha t w i l l be contac ted.
Continuing until one has 50 communities thus
identified will provide a reserve in case of later
refusals to participate.
When conditions are heterogeneous, communities
are grouped (stratified) according to their main
characteristics. They are then selected at random
in numbers proportional to their presence in the
program. Box 16 lists some factors that may be of
Box 16 Possible factors for consideration in decisions on type of sampling
● Environmental and technical conditions: type of water sources (ground and surface water),
availability and quality of fresh water, water resources, developments in water and land use,
technologies used for water supply and sanitation.
● Demographic conditions and developments: population size, density, growth, and migration.
● Economic conditions: economic base (e.g. subsistence, cash crop, or industrial or services economy),
communications (near major cities, well-connected or isolated), character of the settlement (rural
village, small market town, or low-income urban), economic growth.
● Socio-cultural conditions: religious, caste and ethnic composition, male and female literacy levels,
heterogeneous or homogeneous society, seclusion of women, etc.
● Political and administrative conditions: decentralization and devolution, types and legal status of
water and sanitation management organizations.
(See example of sample selection criteria in the Lao PDR case study, Section 2 of this report.)
THE MPA IN ACTION
36
relevance in the classification of the different
groups.
The way in which the sampling has been done
must always be reported. Data that illustrate the
representativeness of the participating communities
must also be collected and reported as part of the
assessments. Only then can it be assumed that
the information is representative of the sampling
universe.
To ensure representativeness of samples drawn,
it is necessary to define the sampling universe
carefully. For instance, if the sample is to
represent all communities covered in past water
supply projects, all communities that have ever
received interventions from any water supply
project must be included in the sampling
universe. If instead the sample is intended to
represent only those communities that received
interventions from project X, the sampling universe
will have to exclude communities that received
interventions from any other project. Such
considerations need to be combined with ethical
and practical ones. For example, this implies that
the final sample may include communities where
services were finally never built, partly built, or
have broken down. Reasons have to be
documented in each case. Secondly, while
working with communities whose systems are
incomplete or seriously out of order and where
the communities want to revive them, the MPA
practitioners should be prepared help resolve
the situation in some way, or at least link such
communities with resources that can help them
revive their services. The MPThe MPThe MPThe MPThe MPA was not designedA was not designedA was not designedA was not designedA was not designed
to be a tool for purely academic research. Itsto be a tool for purely academic research. Itsto be a tool for purely academic research. Itsto be a tool for purely academic research. Itsto be a tool for purely academic research. Its
sole use for such purposes would defeat itssole use for such purposes would defeat itssole use for such purposes would defeat itssole use for such purposes would defeat itssole use for such purposes would defeat its
fundamental objectivefundamental objectivefundamental objectivefundamental objectivefundamental objective,,,,, which iswhich iswhich iswhich iswhich is equitable equitable equitable equitable equitable
empowerment of all levels of stakeholders toempowerment of all levels of stakeholders toempowerment of all levels of stakeholders toempowerment of all levels of stakeholders toempowerment of all levels of stakeholders to
enhance the sustainability of their services.enhance the sustainability of their services.enhance the sustainability of their services.enhance the sustainability of their services.enhance the sustainability of their services.
Larger samples improve the chance of detecting
significant differences (that is, the likelihood that
they are due to real, rather than accidental,
differences), because there is more consistency in
the possible outcomes. It is thus always advisable
to take as large a sample as possible. For larger
programs, going below a sample size of 35 to 40
communities is not recommended, particularly if
statistical analysis is desired.13
4.7 Preparation for fieldwork
After having drawn the community sample, the
assessment facilitation team approaches the
selected communities to gauge their interest and
willingness to participate in the assessments. During
these preliminary visits, the team explains the
purpose and general nature of the assessment
and its costs and possible benefits for the
community. Before the visits, as part of overall
preparation of the fieldwork, the team will already
have determined if, and in what ways, the time
and effort of the community members who
participate in the assessments will be compensated.
It is important to realize that, just like the time of
13 As common in social research, MPA scores consist predominantly of ordinal data. Statistical analyses mostappropriate for such data are graphical presentations and non-parametric statistical tests. Non-parametricstatistics include a range of tools with varying powers of accepting or rejecting research hypotheses. Verysmall sample size limits the usefulness of some non-parametric tools. Greater applicability and choice of testsis possible when sample sizes are above 35, e.g., at a sample size greater than N=35 the normalapproximation of the binomial distribution can be used; the Spearman’s r test of association needs samplesizes of at least 35-40 to accept or reject rank-order correlations of at least 0.3 at 95 percent level ofconfidence; the Chi-square test of association requires expected frequencies to be 5 or more per cell for testresults to be interpretable, which means that any cross-tabulation of the sample beyond the basic 2X2 tableneeds sample sizes of at least 30.
THE MPA IN ACTION
37
external facilitators, time of the community’s
women and men has value. Visiting teams should
therefore adjust visits to when people are available.
In cases of longer visits and/or lenghty
cooperation, some form of compensation for the
work, such as snacks, a meal, or a small fee, will
need to be considered. The visits are continued
until the required number of interested and willing
communities has been found, with a date and
time for the first visit set that are convenient for the
community as well as the external assessment
team.
Depending on what is feasible, the team may make
an advance inventory of the general community
situation from secondary sources, then verify it with
the local authorities during this first visit. These data
make it possible to assess, during analysis of the
overall data, whether a particular external or system-
related factor, rather than community factors,
explains the linkages found. Examples of such
factors are age of systems (“do newer systems
perform better than older ones, irrespective of
responsiveness to demand, gender and class?’’),
availability of support (“does distance from the
nearest town where spare parts, tools and technical
support skills are available matter?”) and poverty
(“are services better sustained in richer communities
than in poorer ones, irrespective of other factors?”).
4.8 Implementation:procedures, fieldbookand data templates
Community level assessments
The actual participatory activities start with the
second visit, arranged with the community
leaders. With the progress of MPA activities, the
participation of formal community leaders should
begin to decline. Activities are increasingly
carried out in informal gatherings with specific
groups such as poor women and men. The
schedule presented in Figure 5 and Box 17 is
only indicat ive. Actual schedules and
arrangements are made with the women and
men in the communities. Tools and materials
will also vary according to local conditions and
creativity.
Participatory assessment with the community
consists of several types of activities:
● Observations of physical conditions,,,,, together
with a representative group from the
community during the transect walk, linked
with key questions to households living near
the facilities that may have direct knowledge
of the service, e.g., maintenance, repair, and
use. Both female and male community
representatives should take part in the review
visit and discussions on the technical service
aspects.
● Participatory activities with focus groups in the
community (male and female, rich and poor,
users and non-users), using a specially
designed sequence of participatory exercises
diagramming local conditions, practices and
preferences.
● Open-ended interviews with key respondents
(male and female members of relevant
committees and the operator and/or other
persons involved in operation and
maintenance).
● Review of written records (e.g., logbooks,
minutes of water committee meetings and
general assemblies).
Sampling of communities and groups is used to make the participatory analysis more representative.

THE MPA IN ACTION
38
The following diagram illustrates the typical flow of activities during an assessment in a community over a period of four to five days.
Figure 5 Flow diagram of MPA assessment at community level
38
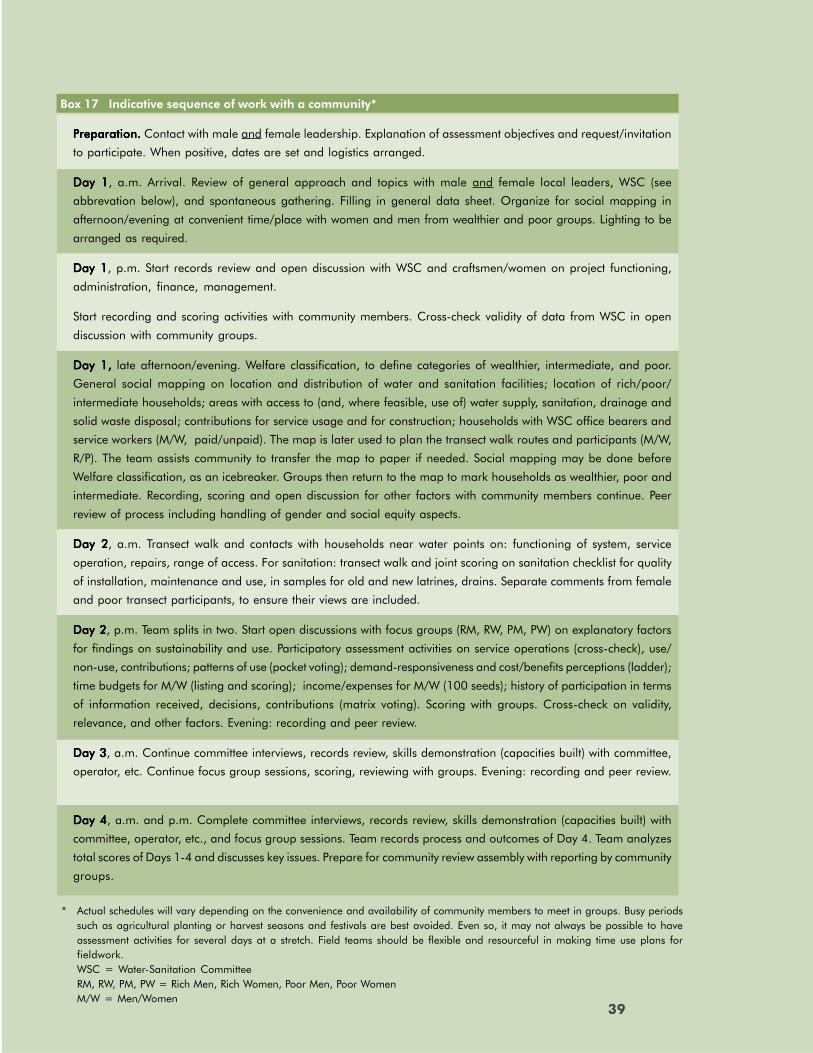
THE MPA IN ACTION
39
Box 17 Indicative sequence of work with a community*
Preparation.Preparation.Preparation.Preparation.Preparation. Contact with male and female leadership. Explanation of assessment objectives and request/invitation
to participate. When positive, dates are set and logistics arranged.
Day 1Day 1Day 1Day 1Day 1, a.m. Arrival. Review of general approach and topics with male and female local leaders, WSC (see
abbrevation below), and spontaneous gathering. Filling in general data sheet. Organize for social mapping in
afternoon/evening at convenient time/place with women and men from wealthier and poor groups. Lighting to be
arranged as required.
Day 1Day 1Day 1Day 1Day 1, p.m. Start records review and open discussion with WSC and craftsmen/women on project functioning,
administration, finance, management.
Start recording and scoring activities with community members. Cross-check validity of data from WSC in open
discussion with community groups.
Day 1,Day 1,Day 1,Day 1,Day 1, late afternoon/evening. Welfare classification, to define categories of wealthier, intermediate, and poor.
General social mapping on location and distribution of water and sanitation facilities; location of rich/poor/
intermediate households; areas with access to (and, where feasible, use of) water supply, sanitation, drainage and
solid waste disposal; contributions for service usage and for construction; households with WSC office bearers and
service workers (M/W, paid/unpaid). The map is later used to plan the transect walk routes and participants (M/W,
R/P). The team assists community to transfer the map to paper if needed. Social mapping may be done before
Welfare classification, as an icebreaker. Groups then return to the map to mark households as wealthier, poor and
intermediate. Recording, scoring and open discussion for other factors with community members continue. Peer
review of process including handling of gender and social equity aspects.
Day 2Day 2Day 2Day 2Day 2, a.m. Transect walk and contacts with households near water points on: functioning of system, service
operation, repairs, range of access. For sanitation: transect walk and joint scoring on sanitation checklist for quality
of installation, maintenance and use, in samples for old and new latrines, drains. Separate comments from female
and poor transect participants, to ensure their views are included.
Day 2Day 2Day 2Day 2Day 2, p.m. Team splits in two. Start open discussions with focus groups (RM, RW, PM, PW) on explanatory factors
for findings on sustainability and use. Participatory assessment activities on service operations (cross-check), use/
non-use, contributions; patterns of use (pocket voting); demand-responsiveness and cost/benefits perceptions (ladder);
time budgets for M/W (listing and scoring); income/expenses for M/W (100 seeds); history of participation in terms
of information received, decisions, contributions (matrix voting). Scoring with groups. Cross-check on validity,
relevance, and other factors. Evening: recording and peer review.
Day 3Day 3Day 3Day 3Day 3, a.m. Continue committee interviews, records review, skills demonstration (capacities built) with committee,
operator, etc. Continue focus group sessions, scoring, reviewing with groups. Evening: recording and peer review.
Day 4Day 4Day 4Day 4Day 4, a.m. and p.m. Complete committee interviews, records review, skills demonstration (capacities built) with
committee, operator, etc., and focus group sessions. Team records process and outcomes of Day 4. Team analyzes
total scores of Days 1-4 and discusses key issues. Prepare for community review assembly with reporting by community
groups.
* Actual schedules will vary depending on the convenience and availability of community members to meet in groups. Busy periodssuch as agricultural planting or harvest seasons and festivals are best avoided. Even so, it may not always be possible to haveassessment activities for several days at a stretch. Field teams should be flexible and resourceful in making time use plans forfieldwork.WSC = Water-Sanitation CommitteeRM, RW, PM, PW = Rich Men, Rich Women, Poor Men, Poor WomenM/W = Men/Women
39

THE MPA IN ACTION
40
Getting representative focus groups
Because the MPA is based on participatory
inventories and analysis with focus groups,
adequate representation of the various sections
of the community is critical. Ensuring this during
fieldwork requires sensitivity to local culture (as
explained in section 4.10) and careful sampling.
To ensure a good representation, purposive
sampling through social mapping is used. The way
this is done varies in small and large communities
Small communities
In communities of up to a few hundred households,
during the first day, available members of the
community assisted by the facilitators’ team draw
a social map of their settlement. This map is not
to scale and consists of a bird’s eye view of the
local roads, paths, compounds or houses and
facilities.
Maps may be drawn in sand, on floors (using chalk)
or on paper (using felt-tipped pens or
fingerpainting or cut- and paste-techniques). In
the map, the participants mark the compounds
or houses of lower, upper and middle class
families, using colored powder, crayon, paint,
colored pins, or some other local material. The
definitions of the three categories are relative and
based on the people’s perceptions of rich and
poor status. (Details in Chapter 6, Welfare
Classification.)
If all three categories exist in approximately equal
proportions, one wealthier and one poor
neighborhood are subsequently chosen at
random for a visit.
If the intermediate and poor categories are
approximately the same size and there are only a
few wealthier families (<10 percent) sessions
involve randomly chosen intermediate and poor
neighborhoods.
The team also discusses with both groups in what
ways the few wealthier families differ and adds
this as qualitative information to the data. If the
elites differ only marginally in their characteristics
from the intermediate group, the two groups are
taken together.
If there are only a few (<10 percent) households
who are particularly poor, focus group discussions
involve randomly chosen intermediate and
wealthier groups, but qualitative data are added
where the contributions and benefits differ for the
worst off households. This is done by either
interviewing them separately or, where socio-
culturally possible, inviting them to take part in
the discussions in the randomly chosen
intermediate group and indicating where their
situation differs.
Large communities
In large communities with 1000 or more
households, social mapping of the whole
community is not practical or feasible. Here the
recommended procedure is to divide, with the
help of the local authorit ies, the overall
community into lower, upper and middle class
localities (as defined by the leaders, who either
use an existing map or draw a map not based
on individual households but on community
sections). Again, the definit ions of poor,
intermediate, and rich are their own. The team
assigns numbers to each type of locality, puts
the numbers of each type on folded pieces of
paper in a box and draws three times: one rich,
one poor and one middle-level locality where
the fieldwork is to be done. In these three
localities, social mapping then takes place as
above.
In both cases, special care is needed to ensure
that the selected areas include non-users. If this is
not the case, e.g., because non-users live in one
specific area not included in the sample, the team

THE MPA IN ACTION
41
visits and conducts a participatory review with this
area separately.
Single parent households
In defining and classifying who are poor,
intermediate, and rich, the position of single-
headed households needs special attention. A
high percentage of female-headed households in
the community has been known to have both
positive and negative effects on gender burdens
and benefits in water supply services.
The positive effects could be that, in female-headed
households, women’s access to decisions, and
new maintenance and management roles may
be easier. These women sometimes have a good
income and control of that income from their own
enterprises. Negative effects have been that often,
many female-headed households are poor and
may have less capacity than other poor families
to contribute labor in addition to or instead of
cash payments.
Institutional assessments:stakeholders’ and policy meetings
The first level institutional assessment is usually at
a project implementing unit level, which is
generally the district, but in small provinces may
even be at the province level. The stakeholders’
meeting examines the agency approaches that
were used to achieve the results in the field. Female
and male field staff from different project agencies,
and women and men from the community
representing the users, get together for this one-
day meeting. They assess what, in the experience
of all stakeholder groups, are the strengths and
weaknesses at the agency level and identify areas
for improvement.
It is necessary to conduct these meetings in the
language that is understood and spoken regularly
by women and men representatives from the
community, and to ensure an environment in
which they do not feel inhibited about expressing
their views. During the meeting, the participants
again use participatory tools and techniques and
score their group’s outcomes. Although literacy is
generally required for the use of the institutional
tools of the MPA, in cases where community
representatives are not sufficiently literate, the tools
can be made more participatory through the use
of visuals and symbols devised on the spot to
replace written words.
After the agency level meetings are over, a similar
meeting takes place with policymakers and project
managers to assess various policy aspects that
guide, or have guided, implementation (see
Chapter 6 for details).
4.9 Visualization andself-scoring
All assessments use open-ended and visual
methods to make local situations and practices
visible. Most of these methods do not require
literacy and so allow those with low or no
literacy - often women, and poorer and older
people to participate.
Since the outcomes are visible to all, they generate
transparency, discussion, and the emergence of
one or two consensus viewpoints. However, the
latter usually does require separate meetings with
different class and gender groups. If not, the
opinions of only the more powerful would likely
prevail.
Even within separate groups certain individuals,
with vested interests, may exert pressure overtly or
covertly for the group to choose a score even when
it does not reflect reality. MPA facilitators are
sensitized to this possibility during training. In such
situations, it is advisable to complete the visual
analysis but postpone scoring to a later session
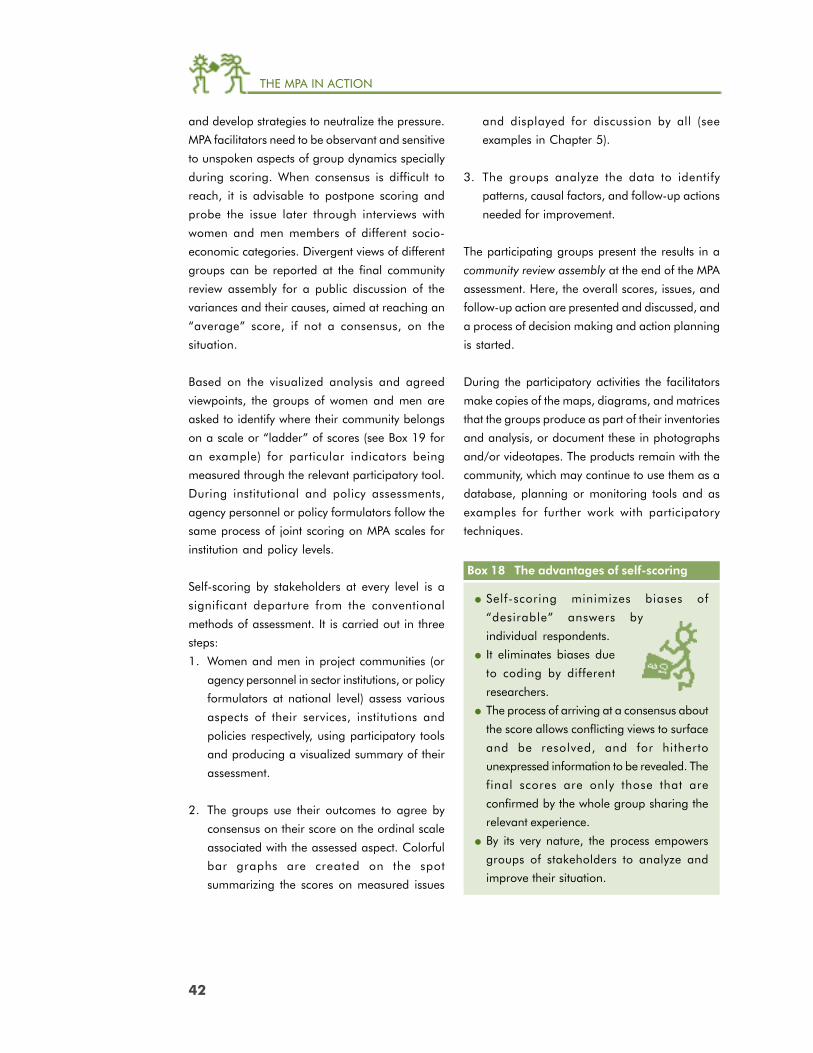
THE MPA IN ACTION
42
and develop strategies to neutralize the pressure.
MPA facilitators need to be observant and sensitive
to unspoken aspects of group dynamics specially
during scoring. When consensus is difficult to
reach, it is advisable to postpone scoring and
probe the issue later through interviews with
women and men members of different socio-
economic categories. Divergent views of different
groups can be reported at the final community
review assembly for a public discussion of the
variances and their causes, aimed at reaching an
“average” score, if not a consensus, on the
situation.
Based on the visualized analysis and agreed
viewpoints, the groups of women and men are
asked to identify where their community belongs
on a scale or “ladder” of scores (see Box 19 for
an example) for particular indicators being
measured through the relevant participatory tool.
During institutional and policy assessments,
agency personnel or policy formulators follow the
same process of joint scoring on MPA scales for
institution and policy levels.
Self-scoring by stakeholders at every level is a
significant departure from the conventional
methods of assessment. It is carried out in three
steps:
1. Women and men in project communities (or
agency personnel in sector institutions, or policy
formulators at national level) assess various
aspects of their services, institutions and
policies respectively, using participatory tools
and producing a visualized summary of their
assessment.
2. The groups use their outcomes to agree by
consensus on their score on the ordinal scale
associated with the assessed aspect. Colorful
bar graphs are created on the spot
summarizing the scores on measured issues
and displayed for discussion by all (see
examples in Chapter 5).
3. The groups analyze the data to identify
patterns, causal factors, and follow-up actions
needed for improvement.
The participating groups present the results in a
community review assembly at the end of the MPA
assessment. Here, the overall scores, issues, and
follow-up action are presented and discussed, and
a process of decision making and action planning
is started.
During the participatory activities the facilitators
make copies of the maps, diagrams, and matrices
that the groups produce as part of their inventories
and analysis, or document these in photographs
and/or videotapes. The products remain with the
community, which may continue to use them as a
database, planning or monitoring tools and as
examples for further work with participatory
techniques.
● Self-scoring minimizes biases of
“desirable” answers by
individual respondents.
● It eliminates biases due
to coding by different
researchers.
● The process of arriving at a consensus about
the score allows conflicting views to surface
and be resolved, and for hitherto
unexpressed information to be revealed. The
final scores are only those that are
confirmed by the whole group sharing the
relevant experience.
● By its very nature, the process empowers
groups of stakeholders to analyze and
improve their situation.
Box 18 The advantages of self-scoring

THE MPA IN ACTION
43
Scoring principles in the MPA14
Ordinal scales are routinely used to convert
qualitative data into numbers for comparisons of
performance within and across samples and sub-
samples in social research. The ordinal scoring
tables developed for the MPA have the following
added advantages.
1. Increasing accuracy through the use of 0 – 100
scales with “gaps.” The MPA uses 5 point
scales, which are convertible to 0-100 scales,
with the 5 points at 0, 25, 50, 75, and 100.
A description of the indicator being measured
accompanies each scale point. In case the
assessing group thinks its situation is not
correctly reflected by any of the five points, but
that it falls somewhere in between two
consecutive points, it can choose to score the
situation midway between the points concerned.
Their reasons for doing so are always
recorded. This provides valuable insights to
the project manager or monitoring unit about
field realities behind quantitative scores.
2. Capturing hard-to-measure issues more
meaningfully through descriptive ordinal
categories. It is difficult to compare scores from
people’s value judgments, as are common in
ordinal rating scales (e.g., Good = 100,
Average = 50, Poor = 0). To overcome this
difficulty, each MPA scale uses descriptive
categories arranged in a graduated order with
reference to one particular indicator/dimension
being measured. For instance, the example
in Box 19 measures the quality and extent of
14 This sub-section draws upon the paper “MPA: An improved methodology for participatory assessments” byA.J. James, presented at a workshop to produce a resource book Participatory Approaches to Project Design,Implementation and Evaluation, organized by the Institute of Rural Reconstruction (IIRR), the Philippines, andMysore Relief and Development Agency (MYRADA), Bangalore, July 2000. A.J. James was a member of theteam from WSP and IRC that developed the MPA and contributed substantially in the areas of quantificationof qualitative information and quantitative analysis.
Box 19 Scoring scale or “ladder” for community level assessment of gender equity in
service management
Score Score description Score
given converted
by to 100
community point scale
0 No woman in management functions at all, or only in name. 0
1 Women are members of lower-level management organization,
but do not attend meetings regularly.25
2 Women members take part in meetings of lower-level
management organizations, but not in decision making.50
3 Women members attend meetings of lower-level management
organizations and make decisions together with men.75
4 Males and females both participate in meetings of lower and
higher-level management organizations and make decisions jointly.100
THE MPA IN ACTION
44
15 Initially these represented a series of consensuses achieved among a global core group of sector professionalsand academicians, which were then validated through testing in 15 countries in a global study during 1998-99, documented in Gross et al (2001), Linking Sustainability with Demand, Gender and Poverty, and vanWijk-Sijbesma (2001), Best of Two Worlds?, WSP-IRC.
women’s participation in the community water
management organization more meaningfully
than a measure like “ the percentage of women
on management committees.” Using the same
scales for different points of time (such as
“before” and “after” project intervention) serves
also to measure the extent of change in the
situation as perceived by stakeholders
concerned.
3. Impact assessment without baseline
information: Since the MPA measures
community perceptions, it can be used to
assess project impact even when baseline
information is not readily available. For
instance, assuming 100 as the baseline (pre-
project) situation, user communities can define
the current (post-project) situation as a number
less than, more than, or equal to 100, and
explain reasons for their answers. A series of
figures and reasons thus obtained from a
sample of project communities provide a clear
picture of whether the intervention had an
impact, whether the impact was positive or
negative, and the extent of the impact.
Although not sophisticated in terms of
evaluation literature, such methods have
proved to be time- and cost-effective, and their
margin of error may compare with full-scale
evaluations using baseline data and case-
control designs.
4. Benchmarking of scales for sustainability
monitoring: Since the fundamental objective
of developing the MPA was to enhance the
sustainability of development interventions, the
MPA scales were designed with a central focus
on what constitutes the minimum condition
necessary for sustainability.15 The mid-points
of all MPA scales represent this minimum
condition, for the indicator being measured.
This feature enables all stakeholders to
evaluate where they stand with respect to the
minimum conditions to be satisfied for
achieving sustainability, in their communities,
projects, institutions, districts, or countries.
The MPA fieldbook and datatemplate
The MPA fieldbook is a repository of information
on the individual activities, processes, and tools,
along with the scoring scales and sheets to
document the discussions of the outcomes of
each activity. Copies are provided as part of the
MPA training course and are used during the
training. The MPA fieldbook has been translated
into local languages wherever local MPA
applications have been developed and country
teams trained.
The fieldbook contains introductions on the
methodology, its gender and social equity focus,
the scope and the need for ongoing development.
It then presents, in a systematic way, the purpose,
materials and process of the participatory activities.
Each activity comes with its own record forms to
note date, duration, number and types of
participants, scores, qualitative information, and
outcomes from group discussions on the findings
from that particular activity.
After the fieldwork, the outcomes from the
datasheets are entered into a database template
in MS ACCESS for analysis and presentations of
data across communities and projects.
THE MPA IN ACTION
45
4.10 Quality control
Participatory tools are visually interesting and
exciting to work with. For new users of these tools
it is easy to get carried away by the novelty of
outputs generated while losing sight of the process
and the environment that generate them. The latter,
however, are crucial to the authenticity of the
results. A few points that are critical for ensuring
the validity of results of participatory assessment
and analysis are mentioned here.
The MPThe MPThe MPThe MPThe MPA tools function only in the handsA tools function only in the handsA tools function only in the handsA tools function only in the handsA tools function only in the hands
of people that have experience in, andof people that have experience in, andof people that have experience in, andof people that have experience in, andof people that have experience in, and
values and attitudes forvalues and attitudes forvalues and attitudes forvalues and attitudes forvalues and attitudes for, using participatory, using participatory, using participatory, using participatory, using participatory
approaches with gender and social equity.approaches with gender and social equity.approaches with gender and social equity.approaches with gender and social equity.approaches with gender and social equity.
Participatory analysis requires more than
participatory tools. All members of teams
undertaking participatory learning assessments
with community groups need to have experience
in the application of participatory tools and
techniques, such as PRA, SARAR, or PHAST. It is
not enough if only one or two members of the
team are so trained, because team members must
be able to complement each other’s work during
field application of the tools.
Bias due to inappropriate facilitation styles is one
of the most important threats to quality and validity
of resulting data. Facilitators with knowledge of
participatory techniques and some application
experience may still distort field level results with
inappropriate facilitation styles and attitudes. Like
all participatory methods, MPA is vulnerable to
facilitators who are directive, judgmental,
insensitive to gender and social status imbalances
within groups, being mechanical and hurried or
rigid, and unable to adapt to local situations.
While MPA training can emphasize building the
required attitudes and openness to learning, it is
always a good investment to have specialized
facilitation and quality monitoring observers for
the first 1-2 assessments after training. The
observers can provide immediate feedback to
facilitator teams for course correction if necessary.
The MPThe MPThe MPThe MPThe MPA has a sequence of activities thatA has a sequence of activities thatA has a sequence of activities thatA has a sequence of activities thatA has a sequence of activities that
is carried out with different groups in ais carried out with different groups in ais carried out with different groups in ais carried out with different groups in ais carried out with different groups in a
community over a period of 4-5 days.community over a period of 4-5 days.community over a period of 4-5 days.community over a period of 4-5 days.community over a period of 4-5 days.
When and where each activity takes placeWhen and where each activity takes placeWhen and where each activity takes placeWhen and where each activity takes placeWhen and where each activity takes place
is determined in consultation with theis determined in consultation with theis determined in consultation with theis determined in consultation with theis determined in consultation with the
groups which will participate.groups which will participate.groups which will participate.groups which will participate.groups which will participate.
The first activities, in the first 1-2 days, are planned
with the local leaders and members of the
community water and sanitation management
organization. These activities give the facilitators
the time and information to plan further activities
with other groups, such as poor women and men
and non-users, at times and places of their
convenience. Fixed workshop schedules are not
appropriate. Sessions must be planned so as not
to disrupt livelihood-related activities and domestic
routines. Also, it is necessary to avoid periods
when communities experience seasonal stress or
heavy workloads, such as agricultural planting
and harvests, or festivals.
Factors that may inhibit participation haveFactors that may inhibit participation haveFactors that may inhibit participation haveFactors that may inhibit participation haveFactors that may inhibit participation have
to be anticipated and problem solvingto be anticipated and problem solvingto be anticipated and problem solvingto be anticipated and problem solvingto be anticipated and problem solving
strategies planned and practiced by thestrategies planned and practiced by thestrategies planned and practiced by thestrategies planned and practiced by thestrategies planned and practiced by the
facilitators’ team.facilitators’ team.facilitators’ team.facilitators’ team.facilitators’ team.
Very often, women hesitate to speak up in front of
men and figures of authority in male-dominated
cultures. Gender-segregated settings are then
essential. Helping each group to present its results
to other groups afterwards and then discuss
conclusions and action promotes two-way
understanding and collaboration.
The presence of government officials, the village
chief, or the Water Committee chairman may
prevent the poor, women and/or non-users of
services from freely expressing their views. In such
cases, sessions are planned without inhibiting
presences or a team member tactfully takes the
THE MPA IN ACTION
46
inhibitor(s) away, e.g., to inspect some water or
sanitation facility, review records, or start an
individual interview somewhere else. A dominant
participant who keeps speaking on behalf of
everybody else needs to be treated the same way
or given a different role, e.g., as a recorder, or a
photographer.
Establishing trust is essential.Establishing trust is essential.Establishing trust is essential.Establishing trust is essential.Establishing trust is essential.
The team has to approach the community in a
culturally appropriate manner, e.g., by
introducing themselves to the village elders and
seeking approval for the assessment. Participating
in community functions and group activities helps
break the ice. Intermediaries who are known and
trusted by the community can also introduce the
team. A particular challenge is to make
marginalized and subordinated groups, that may
have rightfully become distrustful, feel respected
and safe so that they will open up and participate
effectively.
Quality control in scaling-up.Quality control in scaling-up.Quality control in scaling-up.Quality control in scaling-up.Quality control in scaling-up.
With some experience in scaling up MPA
applications to date (mainly in East Asia), the
following lessons have emerged about
safeguarding consistency of procedures for
quality. Whenever multiple field teams are used,
prior agreements need to be reached with all
and documented for field use about: a) sample
selection procedures up to and within
communities, and preferred alternative strategies
to use when the sampling plan cannot be
adhered to; b) a “basic minimum” body of
quantitative and qualitative information to be
recorded per community, which enables checking
the adequacy and completeness of the MPA
process followed; c) the forms in which raw data
(including copies of visual analysis) are to be
made available for data entry and analysis at
levels higher than the community; and d) an
“essential set” of tables, graphics, and visual
outputs to be produced from the sample.
In addition, triangulation procedures need to
be used within each field team on a daily basis,
to cross-check the val id i ty of emerging
information and conclusions. Some form of
referral and feedback faci l i ty must be
established between field teams and their
coordinator to ensure consistency in the
functioning of all field teams. Spot checking
visits by the coordinator to each field team at
least once during fieldwork is another good
practice, resources permitting. When field
teams are expected to use MPA applications in
consecutive phases of a project (e.g., the WSLIC
2 project in Indonesia), review workshops of
facilitators at the end of each phase can provide
a wealth of learning for project agencies and
field facilitators about how to maximize the
benefits from MPA for enhancing project quality.
Adhering to representativeness and triangulation resulted in learning that:
● in one project, construction work was paid without completion;
● in another project, program staff had asked for bribes;
● in a third project, water committee members had installed illegal house connections; and
● a group of poor households had been left out. After the assessment revealed this, they were
finally included.
Box 20 Quality enhances validity
THE MPA IN ACTION
47
Experiences with the use of the MPAin general give rise to a number ofcautions and insights
● Agencies financing assessments have
sometimes tried to cut the duration of training
and/or fieldwork. They do not always accept
that by doing so, the quality of the work may
become so superficial that it is no longer
useful, and process and outcomes may
become mere tokenism.
● Some managers have selectively picked up
the MPA sustainability indicators, but replaced
the use of participatory methods by a
conventional survey, thus reducing the
methodological merits and the validity of the
derived scores. The users became passive
respondents in such cases and the power of
learning and control shifted to outside
researchers and the all-male water committees
with whom they discussed the results. Local
women disappeared as actors from the
learning process in those cases.
● Changes in the scales and parameters have
been made without testing whether these were
valid. Subsequently, the methodology was
used to make predictions for which no sound
methodological foundation existed.
● Especially when used for one-time studies,
there is a tendency to focus on quantitative
data collection and analysis, to the detriment
of the equally important qualitative aspects.
● Not all facilitators have the required aptitudes
and attitudes for participation or are sensitive
to gender and social equity issues.
● Application may become automatic and
“ritualistic” because facilitators do not consider
and adjust to local situations.
● Participatory tools and techniques for
investigations are not one-time “add-ons” to
otherwise unchanged programs. They need
to be linked to the use of participatory
approaches and processes in all other stages
and activities.
● Participatory approaches require changes in
existing structures, procedures, and climate
in agencies that give technical and financial
support, from engineering and social
development departments to contractors and
donor and lending agencies.
● Empowering women and men in
communities to take charge of their own
development means accepting different
ways of working for all parties concerned,
not just the communities. Empowering
women and men in communities to take
charge of their own development means
accepting different ways of working for all
parties concerned, not just the communities.
External assistance agencies must delegate
funds and power; adopt flexible time schedules
that accomodate communities; and let
sanctions for not meeting contract terms
apply to all parties concerned, including
themselves.
How managers can preventproblems and protect quality
It is important to involve managers at the earliest
possible stages of projects in discussions about
the use of the MPA to add value. They will be
more likely to appreciate its potential benefits,
accept its principles and support its proper
application when they have been a part of the
process of deciding how to use it.
The quality of MPA assessments is as good as the understanding and practice of, participatory
and qualitative approaches with gender and poverty perspectives by the people who use it.
THE MPA IN ACTION
48
Since misconceptions or incomplete understanding
of participatory methods are often at the root of
bad practice, managers can be encouraged to
better understand the strengths and limitations of
the use of participatory tools and techniques. They
can further enhance the quality of applications by
checking whether:
● field teams have spent the full time period with
the sampled communities;
● there is evidence, such as copies or
photographs of the outputs from tools, that
the scores are based on participatory
assessments;
● poor women and men, and groups normally
excluded for other reasons, have taken part
in the activities;
● the full range of data has been recorded;
● qualitative information has been recorded and
analyzed;
● facilitators have assisted community groups to
analyze the outcomes and identify actions; and
● facilitators have developed variations in
existing tools and processes and developed
new tools in response to field conditions
and as a sign of ongoing creativity and
commitment.
At a more general level, WSP and IRC seek to
protect the quality of the work in several ways:
● by working with a known group of
experienced organizations that trains
facilitators in the use of the MPA. The group
is large enough to meet requirements and
avoid monopolies;
● by seeking the introduction of internal and
external peer review for quality preservation
and further development; and
● by organizing periodic experience audits with
MPA practitioners from different parts of the
world.
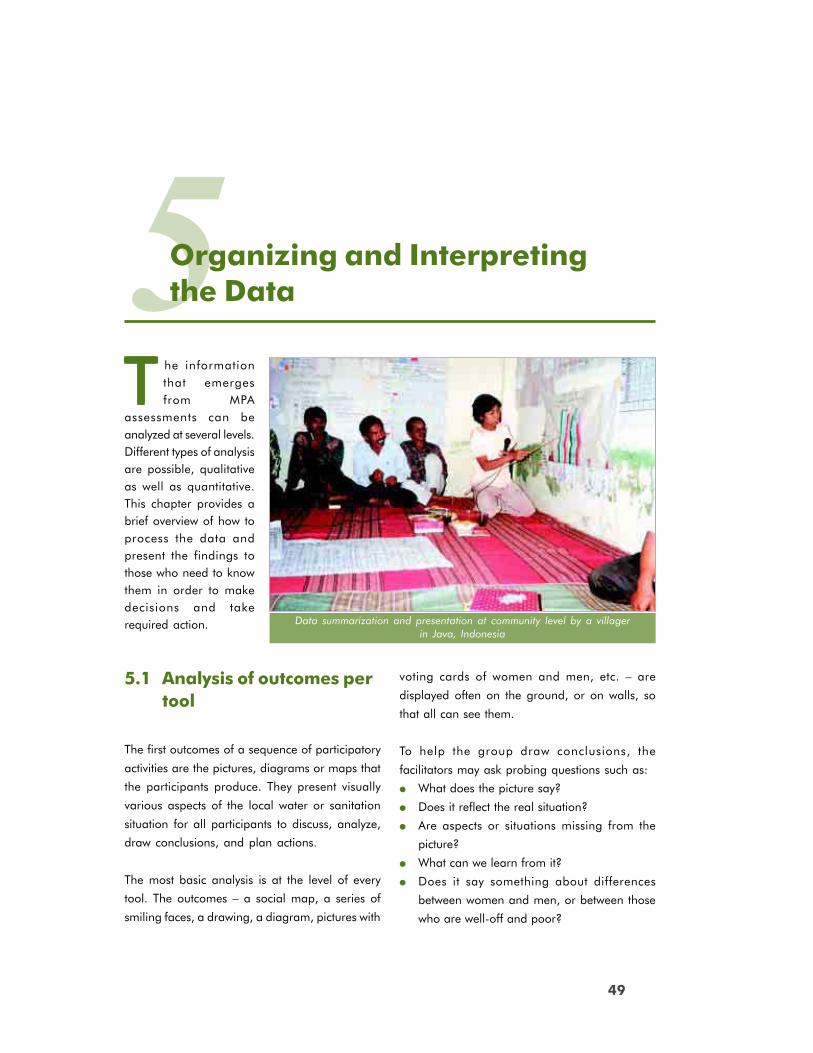
THE MPA IN ACTION
49
5Organizing and Interpretingthe Data
TTTTT he informationthat emergesfrom MPA
assessments can beanalyzed at several levels.Different types of analysisare possible, qualitativeas well as quantitative.This chapter provides abrief overview of how toprocess the data andpresent the findings tothose who need to knowthem in order to makedecisions and takerequired action.
5.1 Analysis of outcomes pertool
The first outcomes of a sequence of participatory
activities are the pictures, diagrams or maps that
the participants produce. They present visually
various aspects of the local water or sanitation
situation for all participants to discuss, analyze,
draw conclusions, and plan actions.
The most basic analysis is at the level of every
tool. The outcomes – a social map, a series of
smiling faces, a drawing, a diagram, pictures with
voting cards of women and men, etc. – are
displayed often on the ground, or on walls, so
that all can see them.
To help the group draw conclusions, the
facilitators may ask probing questions such as:
● What does the picture say?
● Does it reflect the real situation?
● Are aspects or situations missing from the
picture?
● What can we learn from it?
● Does it say something about differences
between women and men, or between those
who are well-off and poor?
Data summarization and presentation at community level by a villagerin Java, Indonesia
50
Box 21 Analysis leading to correction
In Sewukan, in central Java, Indonesia, women and men each assessed the technical quality ofthe existing water supply prior to constructing another system. The headman thought women’sparticipation was useless, because “women do not know about technology.”
Afterwards, however, the women had pinpointed most errors: inlets of reservoirs too low, pipelaying too shallow, wrong cement-sand ratio in concrete mixing, and so on. As a consequence,the women in each dusun (neighborhood) will, for the first time, form committees to monitor thecontractor’s work on a new project. The men will include a clause on quality norms in the contractand will take up any problems up with the private sector contractor.
Sometimes, the facilitators can help the group to
better focus on gender and class differences by
helping the group draw up and fill in simple two-
by-two tables. An example from Cheriyananad,
in Kerala, India is given in Box 22. This learning
process may lead to collective, corrective action,
as happened in Sewukan (Box 21).
5.2 Analysis of relativeperformance
By factor
Analysis of the scores on the scales helpscommunity groups compare their own situation
with other options. The facilitators use previouslyhand-written scoring options (score descriptions
or “scenario”) in the local language on separatecards. In the analysis of the situation, the assessing
group chooses the scenario that reflects its situationmost closely, or an intermediate situation between
consecutive scenarios. At this point the participantsmay decide to immediately discuss their score and
begin to consider changes for better sustainability,effective use and equity. They may also analyze
specific factors during the assembly at the end,when all scores for that community are reviewed
comprehensively.
For project managers simply comparing raw scoresfor individual factors across a number of
communities grouped by project, geographic areaor project rules can provide revealing trends and
insights, since all MPA scales are benchmarkedfor sustainability, as further explained below.
Benchmarking for sustainability
Score descriptions in MPA scales have been
benchmarked so that the middle point of eachscale represents the minimum score expected
when services/systems are likely to be sustainable.This is illustrated in the examples of selected
scales about the adequacy of financing andmanagement, in Box 23. If scores fall below this
mid-point, the services/systems are unlikely to besustained. This benchmarking allows a powerful
visual illustration of where a community systemstands on the sustainabili ty scale. When
community groups can see where their systemsare doing well and where they are at risk, they
are able to focus on correcting the situation in
order to enhance sustainability.
By aggregation
Most of the scores from MPA assessments areordinal, with the exception of a few that are ratio
scale measurements such as the performancerating by users. Ordinarily it is not valid to
aggregate ordinal scores, since it may not beassumed that intervals between scores are equal.
Two underlying design characteristics make itpossible to assign a degree of meaning to
rudimentary forms of aggregation using ordinal
MPA scores, as explained below.
a)a)a)a)a) Benchmarking for sustainabilityBenchmarking for sustainabilityBenchmarking for sustainabilityBenchmarking for sustainabilityBenchmarking for sustainability: as explainedearlier in this section, all scales have the same
range of scores and mid-points of all scalesare comparable, as the mid-points are
designed to indicate the minimum condition
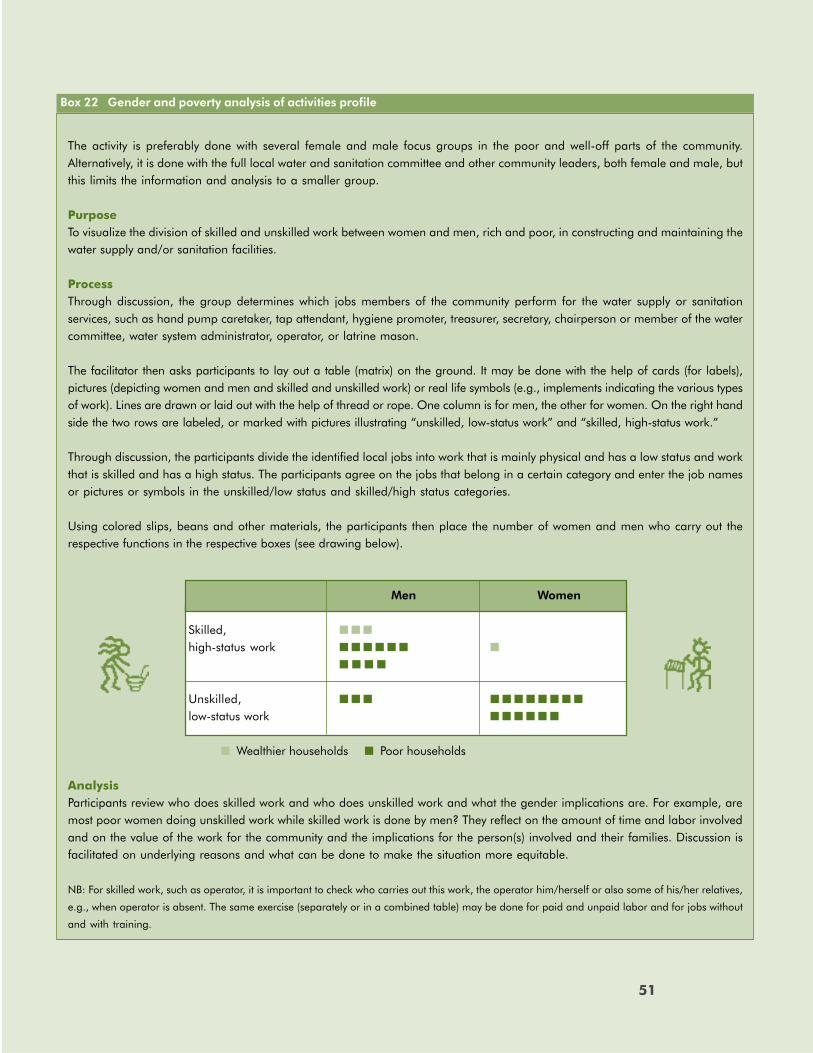
51
Box 22 Gender and poverty analysis of activities profile
The activity is preferably done with several female and male focus groups in the poor and well-off parts of the community.Alternatively, it is done with the full local water and sanitation committee and other community leaders, both female and male, butthis limits the information and analysis to a smaller group.
PurposeTo visualize the division of skilled and unskilled work between women and men, rich and poor, in constructing and maintaining thewater supply and/or sanitation facilities.
ProcessThrough discussion, the group determines which jobs members of the community perform for the water supply or sanitationservices, such as hand pump caretaker, tap attendant, hygiene promoter, treasurer, secretary, chairperson or member of the watercommittee, water system administrator, operator, or latrine mason.
The facilitator then asks participants to lay out a table (matrix) on the ground. It may be done with the help of cards (for labels),pictures (depicting women and men and skilled and unskilled work) or real life symbols (e.g., implements indicating the various typesof work). Lines are drawn or laid out with the help of thread or rope. One column is for men, the other for women. On the right handside the two rows are labeled, or marked with pictures illustrating “unskilled, low-status work” and “skilled, high-status work.”
Through discussion, the participants divide the identified local jobs into work that is mainly physical and has a low status and workthat is skilled and has a high status. The participants agree on the jobs that belong in a certain category and enter the job namesor pictures or symbols in the unskilled/low status and skilled/high status categories.
Using colored slips, beans and other materials, the participants then place the number of women and men who carry out therespective functions in the respective boxes (see drawing below).
Men Women
Skilled, ■ ■ ■
high-status work ■ ■ ■ ■ ■ ■ ■
■ ■ ■ ■
Unskilled, ■ ■ ■ ■ ■ ■ ■ ■ ■ ■ ■
low-status work ■ ■ ■ ■ ■ ■
■ Wealthier households ■ Poor households
AnalysisParticipants review who does skilled work and who does unskilled work and what the gender implications are. For example, aremost poor women doing unskilled work while skilled work is done by men? They reflect on the amount of time and labor involvedand on the value of the work for the community and the implications for the person(s) involved and their families. Discussion isfacilitated on underlying reasons and what can be done to make the situation more equitable.
NB: For skilled work, such as operator, it is important to check who carries out this work, the operator him/herself or also some of his/her relatives,
e.g., when operator is absent. The same exercise (separately or in a combined table) may be done for paid and unpaid labor and for jobs without
and with training.
51
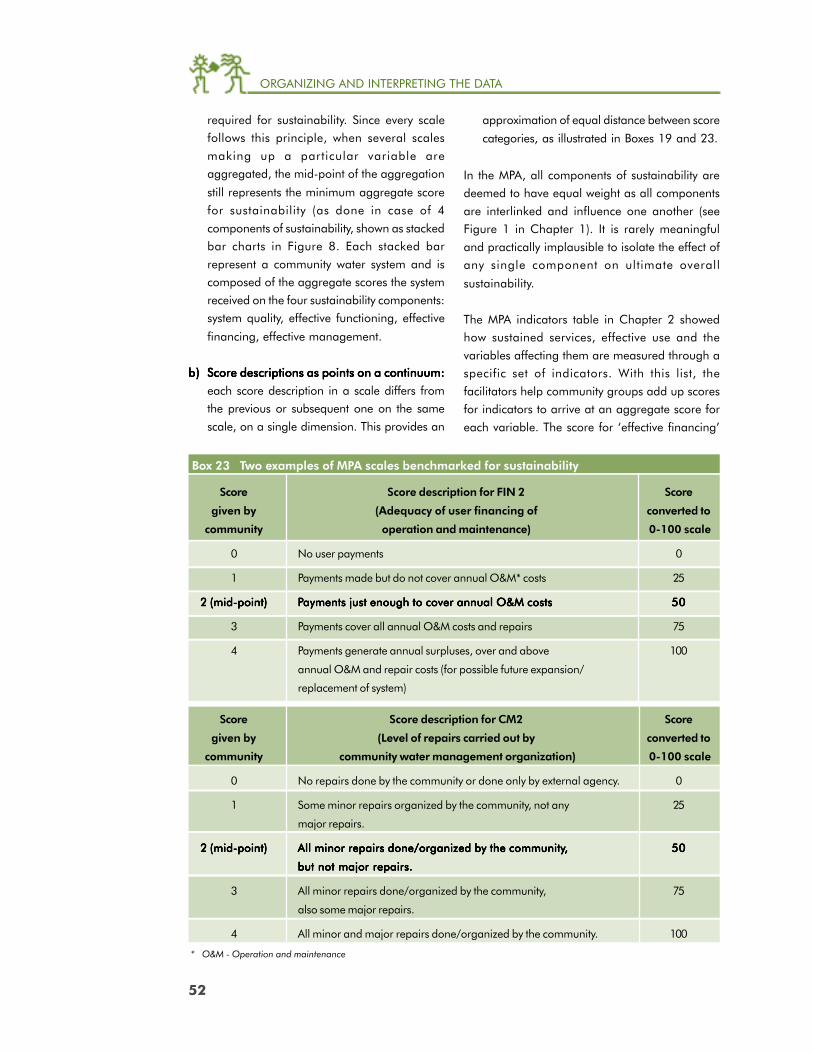
ORGANIZING AND INTERPRETING THE DATA
52
Box 23 Two examples of MPA scales benchmarked for sustainability
Score Score description for FIN 2 Score
given by (Adequacy of user financing of converted to
community operation and maintenance) 0-100 scale
0 No user payments 0
1 Payments made but do not cover annual O&M* costs 25
2 (mid-point)2 (mid-point)2 (mid-point)2 (mid-point)2 (mid-point) PPPPPayments just enough to cover annual O&M costsayments just enough to cover annual O&M costsayments just enough to cover annual O&M costsayments just enough to cover annual O&M costsayments just enough to cover annual O&M costs 5050505050
3 Payments cover all annual O&M costs and repairs 75
4 Payments generate annual surpluses, over and above 100
annual O&M and repair costs (for possible future expansion/
replacement of system)
Score Score description for CM2 Score
given by (Level of repairs carried out by converted to
community community water management organization) 0-100 scale
0 No repairs done by the community or done only by external agency. 0
1 Some minor repairs organized by the community, not any 25
major repairs.
2 (mid-point)2 (mid-point)2 (mid-point)2 (mid-point)2 (mid-point) All minor repairs done/organized by the communityAll minor repairs done/organized by the communityAll minor repairs done/organized by the communityAll minor repairs done/organized by the communityAll minor repairs done/organized by the community,,,,, 5050505050
but not major repairs.but not major repairs.but not major repairs.but not major repairs.but not major repairs.
3 All minor repairs done/organized by the community, 75
also some major repairs.
4 All minor and major repairs done/organized by the community. 100
required for sustainability. Since every scalefollows this principle, when several scales
making up a particular variable areaggregated, the mid-point of the aggregation
still represents the minimum aggregate score
for sustainability (as done in case of 4
components of sustainability, shown as stackedbar charts in Figure 8. Each stacked bar
represent a community water system and iscomposed of the aggregate scores the system
received on the four sustainability components:system quality, effective functioning, effective
financing, effective management.
b)b)b)b)b) Score descriptions as points on a continuum:Score descriptions as points on a continuum:Score descriptions as points on a continuum:Score descriptions as points on a continuum:Score descriptions as points on a continuum:
each score description in a scale differs fromthe previous or subsequent one on the same
scale, on a single dimension. This provides an
approximation of equal distance between score
categories, as illustrated in Boxes 19 and 23.
In the MPA, all components of sustainability aredeemed to have equal weight as all components
are interlinked and influence one another (seeFigure 1 in Chapter 1). It is rarely meaningful
and practically implausible to isolate the effect ofany single component on ultimate overall
sustainability.
The MPA indicators table in Chapter 2 showedhow sustained services, effective use and the
variables affecting them are measured through aspecific set of indicators. With this list, the
facilitators help community groups add up scoresfor indicators to arrive at an aggregate score for
each variable. The score for ‘effective financing’
* O&M - Operation and maintenance
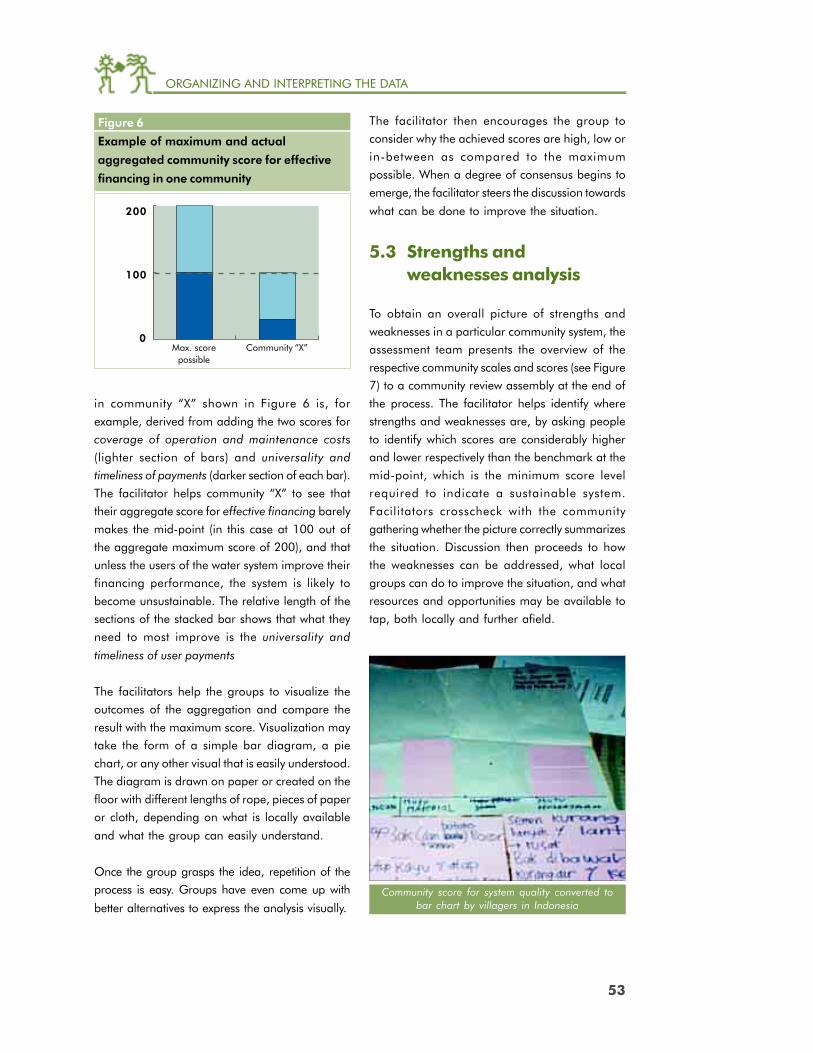
ORGANIZING AND INTERPRETING THE DATA
53
in community “X” shown in Figure 6 is, for
example, derived from adding the two scores forcoverage of operation and maintenance costs
(lighter section of bars) and universality andtimeliness of payments (darker section of each bar).
The facilitator helps community “X” to see thattheir aggregate score for effective financing barely
makes the mid-point (in this case at 100 out ofthe aggregate maximum score of 200), and that
unless the users of the water system improve theirfinancing performance, the system is likely to
become unsustainable. The relative length of thesections of the stacked bar shows that what they
need to most improve is the universality and
timeliness of user payments
The facilitators help the groups to visualize theoutcomes of the aggregation and compare the
result with the maximum score. Visualization maytake the form of a simple bar diagram, a pie
chart, or any other visual that is easily understood.The diagram is drawn on paper or created on the
floor with different lengths of rope, pieces of paperor cloth, depending on what is locally available
and what the group can easily understand.
Once the group grasps the idea, repetition of theprocess is easy. Groups have even come up with
better alternatives to express the analysis visually.
The facilitator then encourages the group toconsider why the achieved scores are high, low or
in-between as compared to the maximumpossible. When a degree of consensus begins to
emerge, the facilitator steers the discussion towards
what can be done to improve the situation.
5.3 Strengths andweaknesses analysis
To obtain an overall picture of strengths and
weaknesses in a particular community system, theassessment team presents the overview of the
respective community scales and scores (see Figure7) to a community review assembly at the end of
the process. The facilitator helps identify wherestrengths and weaknesses are, by asking people
to identify which scores are considerably higherand lower respectively than the benchmark at the
mid-point, which is the minimum score levelrequired to indicate a sustainable system.
Facilitators crosscheck with the communitygathering whether the picture correctly summarizes
the situation. Discussion then proceeds to howthe weaknesses can be addressed, what local
groups can do to improve the situation, and whatresources and opportunities may be available to
tap, both locally and further afield.
Figure 6
Example of maximum and actual
aggregated community score for effective
financing in one community
200
100
0Max. score
possibleCommunity “X”
Community score for system quality converted tobar chart by villagers in Indonesia
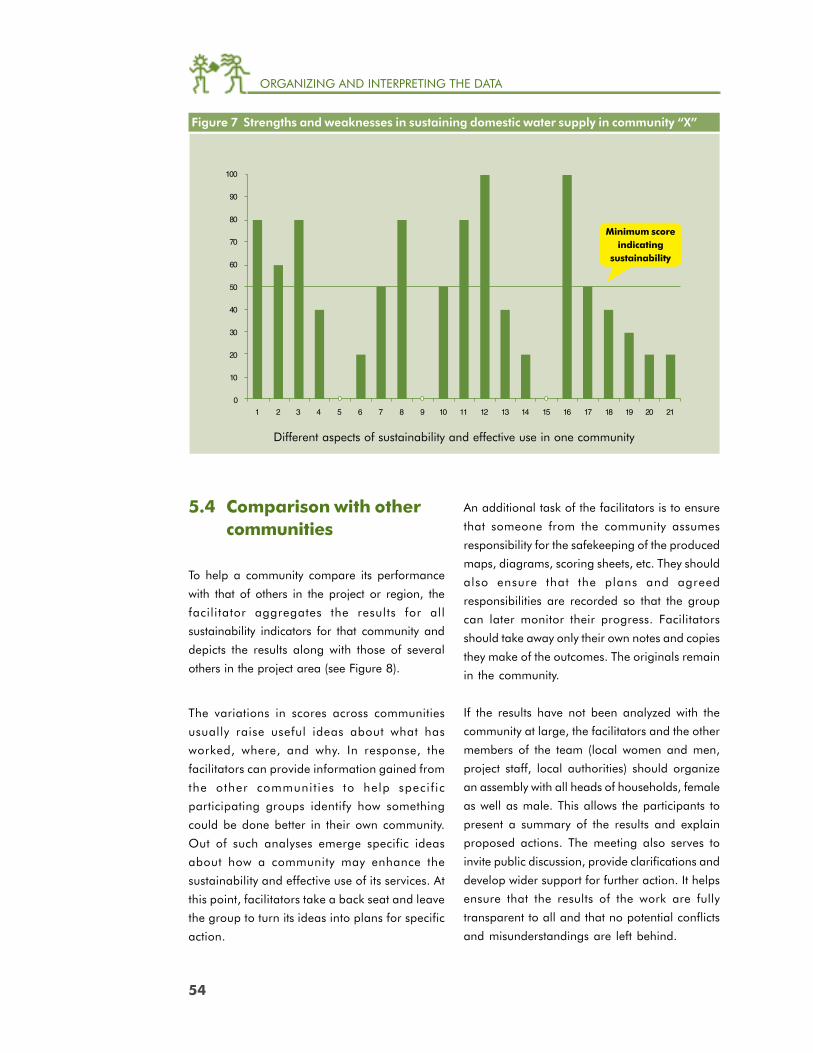
ORGANIZING AND INTERPRETING THE DATA
54
5.4 Comparison with othercommunities
To help a community compare its performance
with that of others in the project or region, the
facilitator aggregates the results for all
sustainability indicators for that community and
depicts the results along with those of several
others in the project area (see Figure 8).
The variations in scores across communities
usually raise useful ideas about what has
worked, where, and why. In response, the
facilitators can provide information gained from
the other communit ies to help specif ic
participating groups identify how something
could be done better in their own community.
Out of such analyses emerge specific ideas
about how a community may enhance the
sustainability and effective use of its services. At
this point, facilitators take a back seat and leave
the group to turn its ideas into plans for specific
action.
An additional task of the facilitators is to ensure
that someone from the community assumes
responsibility for the safekeeping of the produced
maps, diagrams, scoring sheets, etc. They should
also ensure that the plans and agreed
responsibilities are recorded so that the group
can later monitor their progress. Facilitators
should take away only their own notes and copies
they make of the outcomes. The originals remain
in the community.
If the results have not been analyzed with the
community at large, the facilitators and the other
members of the team (local women and men,
project staff, local authorities) should organize
an assembly with all heads of households, female
as well as male. This allows the participants to
present a summary of the results and explain
proposed actions. The meeting also serves to
invite public discussion, provide clarifications and
develop wider support for further action. It helps
ensure that the results of the work are fully
transparent to all and that no potential conflicts
and misunderstandings are left behind.
Figure 7 Strengths and weaknesses in sustaining domestic water supply in community “X”
Minimum scoreindicating
sustainability
100
90
80
70
60
50
40
30
20
10
0
1 2 3 4 5 6 7 8 9 10 11 12 13 14 15 16 17 18 19 20 21
Different aspects of sustainability and effective use in one community
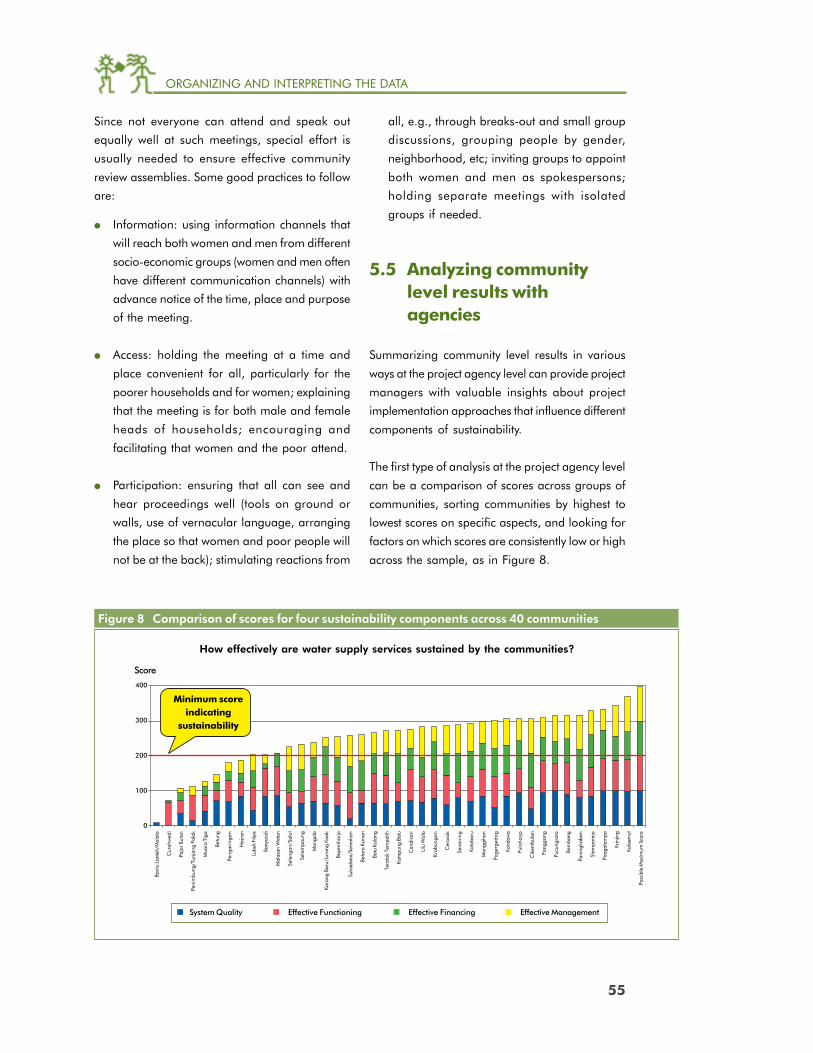
ORGANIZING AND INTERPRETING THE DATA
55
How effectively are water supply services sustained by the communities?
Figure 8 Comparison of scores for four sustainability components across 40 communities
Score
400
300
200
100
0
System Quality Effective Functioning Effective Financing Effective Management
Minimum scoreindicating
sustainability
Bant
u La
nteh
/Mal
alo
Cur
ahw
edi
Paja
r Bul
an
Peni
mbu
ng/T
unja
ng P
olak
Mua
ra T
iga
Betu
ng
Peng
arin
gan
Haj
ran
Lubu
k N
ipis
Bany
usid
i
Mal
asan
Wet
an
Sele
ngan
/Sal
ut
Sela
mpa
ung
Man
golo
Kara
ng B
aru/
Jura
ng K
oak
Baye
mha
rjo
Suka
dana
/Sem
okan
Beta
ra K
anan
Batu
Kal
ang
Tera
tak
Tem
patih
Kam
pung
Bat
u
Can
disa
ri
Ulu
Wol
o
Krob
unga
n
Cer
ocok
Sena
ning
Koto
baru
Man
ggih
an
Page
rged
og
Kond
owa
Pulo
harjo
Cik
embu
lan
Pang
gang
Pucu
ngro
to
Bam
bang
Pani
ngka
ban
Slam
pare
jo
Poog
alam
pa
Krin
jing
Kalis
emut
Poss
ible
Max
imum
Sco
re
Since not everyone can attend and speak out
equally well at such meetings, special effort is
usually needed to ensure effective community
review assemblies. Some good practices to follow
are:
● Information: using information channels that
will reach both women and men from different
socio-economic groups (women and men often
have different communication channels) with
advance notice of the time, place and purpose
of the meeting.
● Access: holding the meeting at a time and
place convenient for all, particularly for the
poorer households and for women; explaining
that the meeting is for both male and female
heads of households; encouraging and
facilitating that women and the poor attend.
● Participation: ensuring that all can see and
hear proceedings well (tools on ground or
walls, use of vernacular language, arranging
the place so that women and poor people will
not be at the back); stimulating reactions from
all, e.g., through breaks-out and small group
discussions, grouping people by gender,
neighborhood, etc; inviting groups to appoint
both women and men as spokespersons;
holding separate meetings with isolated
groups if needed.
5.5 Analyzing communitylevel results withagencies
Summarizing community level results in various
ways at the project agency level can provide project
managers with valuable insights about project
implementation approaches that influence different
components of sustainability.
The first type of analysis at the project agency level
can be a comparison of scores across groups of
communities, sorting communities by highest to
lowest scores on specific aspects, and looking for
factors on which scores are consistently low or high
across the sample, as in Figure 8.
ORGANIZING AND INTERPRETING THE DATA
56
16 This means that in practice the aggregate sustainability score of community-managed systems cannot anddoes not exceed the minimum benchmark whenever any one component performs extremely poorly. Recognizingthis interrelated web of influences among the components, the MPA treats all four components of sustainabilitywith equal weights. This relationship however may not hold true for systems not managed and financed by usercommunities.
Typical questions in this kind of analysis are:
● Which are the high, medium and low
performing communities on sustainability? On
effective use? On gender and social equity?
On demand-responsiveness of services?
● Do these results match our own monitoring
information? If not, why?
● What factors come out as strengths and
weaknesses in the communities assessed? Are
some common to all or most communities?
● What do they indicate about the agency’s
project implementation approaches?
An example of how the information presented in
Figure 8 can be analyzed and interpreted is
provided here.
Assuming that the 40 communities in Figure 8
constitute a representative sample of communities
served by project Z, the bar charts indicate the
following trends:
● About 20 percent of the water supply systems
provided are unlikely to be sustained (i.e.,
have aggregate scores below the sustainability
benchmark score) and another 7-8 percent are
borderline cases.
● It is difficult for community water supply
systems to be sustainable unless they achieve
a certain minimum (about half of the
maximum score) score on all four
components, i.e., system quality, effective
functioning, effective financing, and effective
management. Those that fall below the
benchmark usually score either zero or very
low on at least one out of the four
components. This trend, supported by field
level findings in MPA assessments to date,
reflects the assumption made in MPA scoring
(Section 5.2) that all four components of
sustainability are interrelated and one poorly
functioning component drags down scores
on the rest, endangering overall
sustainability.16
● The opposite also seems true. The best
performing systems are the ones where all
four components of sustainability get high
scores.
● While scores on system quality (blue section of
bars) and effective functioning (red section) are
comparable across all communities, great
variations are visible in terms of effective
financing (green) and effective management
(yellow). This suggests that the project has in
place the means to ensure certain quality
standards for technical aspects of water supply
systems (which affect effective functioning), but
probably has no standard approaches to
ensure the quality of community management
and adequate financing of operation and
maintenance by users.
Implications for changes in project approaches to
enhance sustainability or the need for deeper
investigations of specific issues can be deduced
from findings such as above.
Regrouping communities by the best and worst
performers (e.g., communities with the top and
bottom 10 percent of scores) on specific aspects
and looking for explanatory differences between
them is another possible analysis. This often
identifies questions for further explanatory
investigation.
Another type of possible analysis is looking for

ORGANIZING AND INTERPRETING THE DATA
57
trends or comparisons over time, by repeating
assessments in the same set of communities at
different points in the project cycle.
5.6 Analyzing agency factorsinfluencing results on theground: stakeholders’meeting
The second level of analysis takes place in the
stakeholders’ meeting. This meeting captures the
views of different categories of stakeholders on
the institutional mechanisms that influence
community level results such as sustainability,
effective use, participation, demand-
responsiveness, gender and social inclusion. The
stakeholders participating in this analysis are
agency personnel of different types, community
representatives, and social intermediaries.
The stakeholders’ meeting takes the form of a
day-long workshop where a series of participatory
analysis exercises are used to elicit assessments
and views from different stakeholder groups, on
agency objectives, strategies, practices,
mechanisms, organizational climate, incentives,
and management approaches. The assessment
is designed to explore how far each category of
stakeholders considers these agency factors to be
supportive of gender- and poverty-sensitive
demand-responsive approaches. A typical
stakeholders’ meeting program is described in
Chapter 6. At the end of each exercise as described
in Chapter 6, the facilitators gather all participants
to examine the visual outcome of the excercise.
Scores given by each category are averaged or
modal scores chosen as typical of each group.
Co-facilitators quickly plot the resulting scoring
patterns in simple visual and graphic forms.
The most revealing analysis and the most useful
findings usually emerge from the differences in
male and female responses, and between technical
and non-technical staff responses, and between
agency personnel and community members’
responses. Hence, it is essential to invite responses
and display results from each category separately,
without generating confrontations and threatening
situations. This means deciding on and
consistently using color-coded but anonymous
voting tokens and response cards of different
shapes and types throughout the workshop, for
all the stakeholders.
After visually displaying the results of assessment,
the facilitators help the meeting participants to
first identify similarities and differences in
outcomes. Facilitators ask questions to make
Stakeholders’ meeting in FLOWS project district, Flores island, Indonesia
ORGANIZING AND INTERPRETING THE DATA
58
participants think about the outcomes and discuss
their implications for the project/program. What
do the emerging consensus/divergence of views/
patterns mean? What do they say about the
strengths and weaknesses in the agencies? Is
anything surprising? To whom? Why? What are
the implications for further exploration? For further
action for improvement? Who should do what?
Facilitators use such questions to generate a group
discussion. When inter-category sensitivities are
anticipated, the discussion is held in several small,
homogenous groups where people feel more
comfortable in expressing their opinions. Co-
facilitators then bring the results from all the
groups to the plenary. Summarizing group
responses on cards helps focus this presentation
and makes it easier to record results later.
At the plenary, if a consensus seems to emerge
from the above discussion about the overall score
to be assigned, it is recorded on a large
scoreboard. This is done in a graphic way showing
each achieved score against the maximum possible
score, to enable visual monitoring of the
assessment activity as it progresses from one
exercise to the next. If consensus is not achieved,
the differing scores are recorded as such, marking
them with the names of categories whose
assessments they represent. The group then moves
to the next exercise.
At the end of all the assessments, the final
scoreboard is presented to the whole group. They
use it to identify and jointly rank areas of
institutional strengths and weaknessesinstitutional strengths and weaknessesinstitutional strengths and weaknessesinstitutional strengths and weaknessesinstitutional strengths and weaknesses, in terms
of support for sustainability and equity in the
outcomes of water supply and sanitation
interventions made by the institution.
Facilitators generate a plenary discussion on what
can be done to build on the strengths and improve
on the areas of weaknesses. The participants
discuss, agree on and record implications for
action needed at each of the three levels: the
community, sector agency/institution, and
policymaking. Scores and actions agreed upon
are recorded for future monitoring of progress by
the participating stakeholders and for presentation
at the next assessment level, the policy analysis
dialogue.
5.7 Policy analysis
The analysis of sector or agency policies can be
done through a half-day workshop with high level
policy formulators and national directors of
projects, using a process similar to stakeholders’
meetings. An alternative is to interview key officials
at times convenient to them and then gather them
for a presentation and discussion of a summary
of interview results. If the interview option is chosen
(see Chapter 6), the results are also discussed
with the interviewees as the interview progresses.
This serves as a joint analysis of findings on the
links between policies and results on the ground,
although it is limited to the participants in each
separate interview. If the more participatory
workshop option is chosen, the final score board
arrived at will depict the seven aspects assessed
(see example in Figure 9). The scores depicted in
the bars represent the participants’ assessment of
the extent to which different aspects of current sector
policies are supportive of gender- and poverty-
sensitive demand-responsive approaches.
Scores from more than one project may be used
together as all projects operating within the same
time frame in a country are implemented under
the same sector policies. Comparing several
projects make the participatory policy analysis a
more potent instrument of change. In the example
in Figure 9, both projects came across as weak
on their vision with respect to gender. This was
related to the lack of clarity in policies at the time
about why or how gender was important. In the
next step, the group of participating policymakers
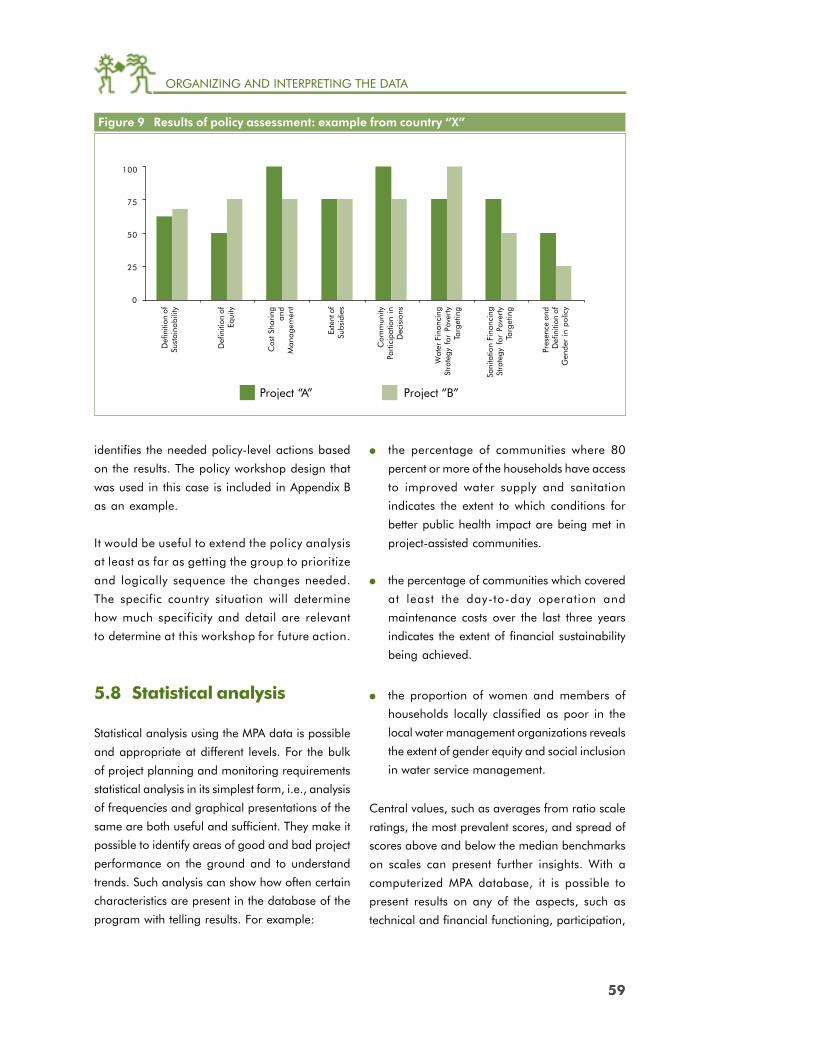
ORGANIZING AND INTERPRETING THE DATA
59
Figure 9 Results of policy assessment: example from country “X”
Project “A” Project “B”
100
75
50
25
0
Def
initi
on o
fSu
stai
nabi
lity
Def
initi
on o
fEq
uity
Cos
t Sha
ring
and
Man
agem
ent
Exte
nt o
fSu
bsid
ies
Com
mun
ityPa
rtic
ipat
ion
inD
ecis
ions
Wat
er F
inan
cing
Stra
tegy
for
Pov
erty
Targ
etin
g
Sani
tatio
n Fi
nanc
ing
Stra
tegy
for
Pov
erty
Targ
etin
g
Pres
ence
and
Def
initi
on o
fG
ende
r in
pol
icy
identifies the needed policy-level actions based
on the results. The policy workshop design that
was used in this case is included in Appendix B
as an example.
It would be useful to extend the policy analysis
at least as far as getting the group to prioritize
and logically sequence the changes needed.
The specific country situation will determine
how much specificity and detail are relevant
to determine at this workshop for future action.
5.8 Statistical analysis
Statistical analysis using the MPA data is possible
and appropriate at different levels. For the bulk
of project planning and monitoring requirements
statistical analysis in its simplest form, i.e., analysis
of frequencies and graphical presentations of the
same are both useful and sufficient. They make it
possible to identify areas of good and bad project
performance on the ground and to understand
trends. Such analysis can show how often certain
characteristics are present in the database of the
program with telling results. For example:
● the percentage of communities where 80
percent or more of the households have access
to improved water supply and sanitation
indicates the extent to which conditions for
better public health impact are being met in
project-assisted communities.
● the percentage of communities which covered
at least the day-to-day operation and
maintenance costs over the last three years
indicates the extent of financial sustainability
being achieved.
● the proportion of women and members of
households locally classified as poor in the
local water management organizations reveals
the extent of gender equity and social inclusion
in water service management.
Central values, such as averages from ratio scale
ratings, the most prevalent scores, and spread of
scores above and below the median benchmarks
on scales can present further insights. With a
computerized MPA database, it is possible to
present results on any of the aspects, such as
technical and financial functioning, participation,
ORGANIZING AND INTERPRETING THE DATA
60
17 For a fuller explanation readers can refer to standard textbooks for behavioral and social research such asResearch Methods and Anthropology: Qualitative and Quantitative Approaches by H. Russel Bernard. 1995.Altamira Press.
equity and use, in figures and graphical forms,
as and when needed. It is also possible to show
progress over time as the number of individual
community projects increases. Updating only
requires new information on current conditions,
not historical analysis.
Using aggregated scores from sub-indicators on
sustained or effectively used services (e.g. as
stacked bar charts, as shown in Figure 8),
managers can rank individual communities into
top and bottom performers. Ranking gives
managers and staff insight into the characteristics
of both groups. It helps them to bring communities
together for horizontal learning and to decide
where to focus limited resources.
Comparing community performance on individual
and aggregated scores also helps identify
interesting findings for case studies, especially
when combined with qualitative information.
In situations where MPA is used for more research-
focused purposes, such as investigating
relationships between factors or for comparing
clusters of communities on specific aspects,
statistical tests appropriate for ordinal
measurements can be applied, provided
conditions for statistual testing are satisfied. This
means ensuring that appropriate sample selection
procedures have been followed, the correct
statistical test is selected, and sufficiently small
margins of error are chosen to conclude that the
differences or associations found are significant
(that is, not due to chance).17 For hypotheses
testing, a 95 percent level of confidence is
considered sufficient for most social research and
monitoring purposes, although MPA data have
often produced results significant at a higher (99
percent) level of confidence, i.e., with only 1
percent probability that the tested relationship
found is not true.
Statistical testing for associations helps managers
to see whether certain clusters of factors, as well
as individual factors, tend to occur together. MPA
data have been used in this manner to answer
questions such as:
● Are better-sustained services also better used
by all? If not, are non-users a mix of different
types of households or are certain groups,
such as poor households, systematically
excluded?
● Are higher user payments for operation and
maintenance associated with greater choice
available to users (for service levels or for modes
of financing, or choice by more groups in the
community), more equitable tariff systems,
provision of training on financial
management, and/or better accountability to
users?
To test for significant correlations, non-parametric
tests are used because most scales used in the
MPA are ordinal in nature. The strength of the
association is measured through the correlation
coefficient. As the name indicates, a correlation
merely says that the two related aspects “co-relate,”
or “occur together.” It does not say whether
increase in scores for one aspect leads to a
simultaneous increase in scores for the related
aspect. Clear causal relationships are hard to
establish using ordinal data, since such
relationships may only be tested using parametric
tests such as multiple regression analysis or factor
analysis - which are applicable at higher levels of
measurement and require much larger sample
sizes than is usual with MPA applications.
ORGANIZING AND INTERPRETING THE DATA
61
Supplementing non-parametric tests of association
with qualitative explorations of community
perceptions of causality can provide project
managers with sufficient insights for action. To
cite an example from the global study, better
gender balance in the village water and sanitation
committees was found to be significantly associated
with higher overall sustainability scores. Qualitative
data from focus groups explained that when
community service management organizations are
gender-balanced, more management training can
go to women, enabling them to exert greater
influence on service management, thus making
the water service more responsive to their demands
and therefore more satisfying to the principal users
(who are usually women in the community).
Satisfied users value the service and therefore tend
to pay user fees regularly, thus improving the
adequacy of financing, which makes the service
more sustainable .
It can also be investigated if such relationships
continue to hold when controlling for other
possible influencing factors, e.g., the level of
development in the communities concerned or
the complexity and age of the installed systems.
Through building a model, it is possible to see
which factors are most crucial in obtaining the
desired results. However, such analyses can only
be done when the sample and data meet certain
requirements (see any methodological or
guidebook on statistical analysis in the social
sciences).
Insight through statistical analysis is attractive for
program managers, policymakers and
researchers. It requires the presence of a
sociologist, economist or statistician experienced
in the use of non-parametric statistics at the
program level. Her or his main functions are to
supervise data entry, analyze frequencies and
cross-tabulations, decide on the statistical test(s),
test the strengths of the associations among
individual influencing factors, and between those
factors and the achieved results in terms of how
services are sustained and used.
PARTICIPATORY TOOLS USED IN THE MPA
62
6TTTTThe MPA uses a sequence of nine pre-
defined participatory activities.18 It allows
opportunities, however, to choose different
tools for the same purpose or developing and
using variations of the tools. The sequence itself
is also not rigid, as it is adjusted to the convenience
of the participating groups.
6.1 Ensuring quality andvalidity
Pretty (1994) lists a set of criteria for deciding
whether information from participatory
assessments can be trusted. Use of the MPA will
meet most of them, provided applications are
carried out with quality control (see section 4.10),
as explained here.
● Working five days with each participating
community helps to meet the criterion of an
intensive engagement.
● The process allows for the expression and
analysis of variation by making certain that a
Participatory Tools Usedin the MPA
wide range of different actors is involved and
their perspectives and realities are accurately
represented.
● All relevant stakeholder groups - in all cases,
women and men, better- and poor, local
managers, and user and non-user groups -
must have participated.
● Cross-checks and parallel observations are built
in to test credibility, e.g., getting information
on the way the water supply or sanitation
program is managed from local managers and
users, women and men.
● The data have been subjected to triangulation,
that is, results are arrived at through up to three
different methods and are then compared for
internal consistency. In the MPA, this is done in
three ways:
- using the same type of source repeatedly,
e.g., interviewing several key informants.
- using more sources for the same
information, e.g., sessions with women
and men.
18 Specific tools which have been taken from existing participatory methodologies and adapted for use in theMPA are described accordingly in this section. The remaining tools were conceptualized and designed by theglobal core team from WSP and IRC that developed the MPA.
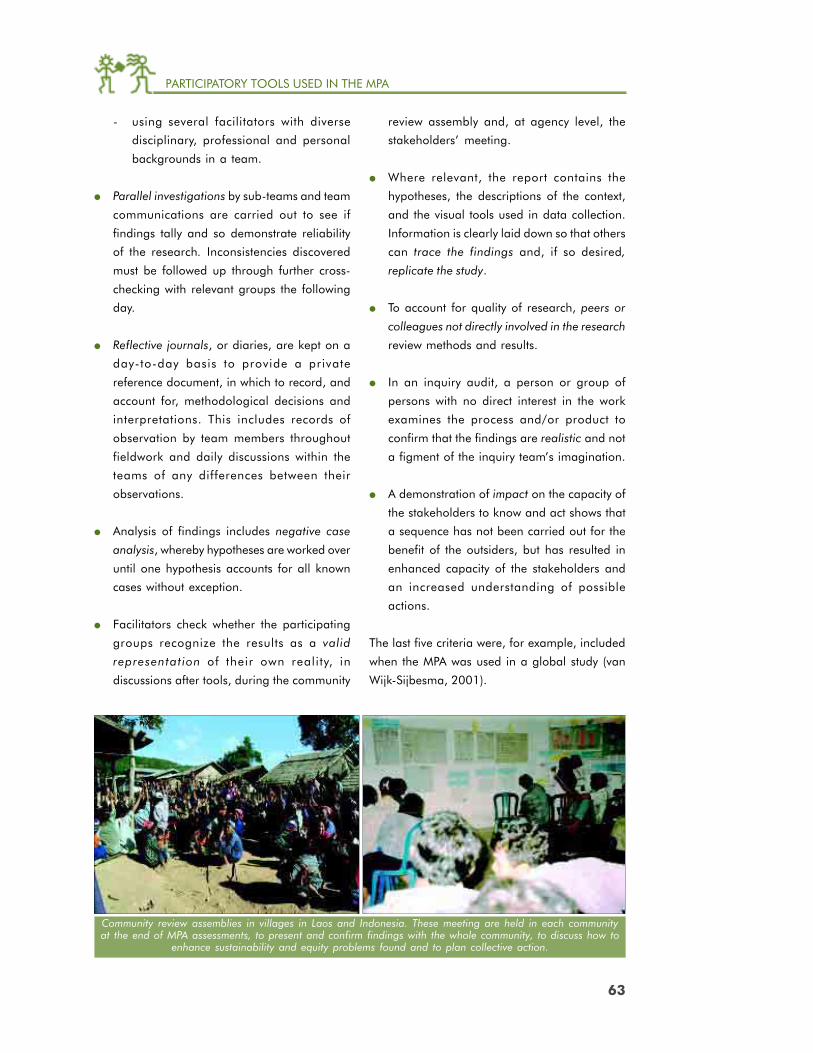
PARTICIPATORY TOOLS USED IN THE MPA
63
- using several facilitators with diverse
disciplinary, professional and personal
backgrounds in a team.
● Parallel investigations by sub-teams and team
communications are carried out to see if
findings tally and so demonstrate reliability
of the research. Inconsistencies discovered
must be followed up through further cross-
checking with relevant groups the following
day.
● Reflective journals, or diaries, are kept on a
day-to-day basis to provide a private
reference document, in which to record, and
account for, methodological decisions and
interpretations. This includes records of
observation by team members throughout
fieldwork and daily discussions within the
teams of any differences between their
observations.
● Analysis of findings includes negative case
analysis, whereby hypotheses are worked over
until one hypothesis accounts for all known
cases without exception.
● Facilitators check whether the participating
groups recognize the results as a valid
representation of their own reality, in
discussions after tools, during the community
review assembly and, at agency level, the
stakeholders’ meeting.
● Where relevant, the report contains the
hypotheses, the descriptions of the context,
and the visual tools used in data collection.
Information is clearly laid down so that others
can trace the findings and, if so desired,
replicate the study.
● To account for quality of research, peers or
colleagues not directly involved in the research
review methods and results.
● In an inquiry audit, a person or group of
persons with no direct interest in the work
examines the process and/or product to
confirm that the findings are realistic and not
a figment of the inquiry team’s imagination.
● A demonstration of impact on the capacity of
the stakeholders to know and act shows that
a sequence has not been carried out for the
benefit of the outsiders, but has resulted in
enhanced capacity of the stakeholders and
an increased understanding of possible
actions.
The last five criteria were, for example, included
when the MPA was used in a global study (van
Wijk-Sijbesma, 2001).
Community review assemblies in villages in Laos and Indonesia. These meeting are held in each communityat the end of MPA assessments, to present and confirm findings with the whole community, to discuss how to
enhance sustainability and equity problems found and to plan collective action.

PARTICIPATORY TOOLS USED IN THE MPA
64
and ask the group to draw pictures of a typical
well-off person in the community. When someone
takes the pen and starts drawing, the facilitator
asks others to draw a typical poor person and a
typical middle income person. The terminology to
be used for rich, poor etc. is taken from the
group’s own language, to be culturally acceptable.
This activity challenges the group’s creativity. The
drawings usually produce some laughs and serve
as good icebreakers.
Using the drawings as a starting point, the group
begins to describe the characteristics of each
category, one by one. As the answers emerge,
someone from the group lists them under the
picture in question. It is helpful to start with the
wealthier, then move to the poor, and end with
the middle category.
The activity continues until six to seven
characteristics have been identified for each
category. Probing by the facilitators helps bring
out different types of characteristics, not only assets
Purpose
The tool helps to classify the population in three
socio-economic strata (high/middle/low), based
on locally specific criteria and using culturally
appropriate terms. The facilitators use the
information to identify groups with which to hold
focus group discussions.
The community groups use the criteria for mapping
the access of the poor and the wealthier to
improved facilities, paid jobs and management
power and for identifying the differential rates of
payments and degrees of participation in community
decision making, service management, etc.
Process
A discussion is started with a group about how
they differentiate between households in their
community. When socio-economic criteria are
mentioned (which happens very soon), the
facilitators provide some blank sheets of paper
19 Modified from Wealth Ranking, a participatory rural appraisal (PRA) method.
6.2 Welfare classification19
Defining rich, poor, in-between categories in Cambodia
PARTICIPATORY TOOLS USED IN THE MPA
65
and access to services, but also household
composition (such as single parents, bachelors
and old couples), health (such as chronic illness)
and psychological characteristics (such as isolation,
lack of respect for self and from others).
Participants then distribute a number of seeds or
small stones equal to the total number of
households in the community over the three
pictures to visualize how the three groups are
present in their community. Alternatively,
facilitators provide a set of 100 pebbles/seeds and
ask the group to make a proportional distribution
of the seeds among the three categories, assuming
that the total amount of seeds provided represents
the total polulation. This allows a rough
percentage distribution to emerge, which can be
used to identify whether the middle group should
be included with the poor or the wealthier, for
focus groups. The group then records the resulting
characteristics and figures on a large sheet. These
are kept with the drawings for ready reference
during later assessments requiring rich/poor
differentiation.
Results
The activity results in agreed and locally valid
criteria for classifying households into upper,
intermediate and lower classes and the
approximate distribution of households in these
categories.
UseUseUseUseUses
The tool is used in combination with the community
map (see Section 6.3). Its information serves to:
● identify the route of the transect walk and the
focus groups of wealthier and poor women
and men with whom discussions and
assessment activities will later be held, as
described in Chapter 4 (Section 4.8, under
“Getting representative focus groups”).
● help the groups that make the community map
to decide which households to mark as
wealthier, poor and intermediate. They would
then count how many households fall outside
the areas of access to the improved water
supply, which they mark on the map using
twine or colored wool, and identify those
households by welfare category. The data are
then analyzed to see how equitably access is
shared and what may be done about
inequities found.
● put the numbers of households with and
without latrines in a matrix across the three
welfare categories, to analyze access to
sanitation, identify possible reasons for
access differentials, and better target
physical and financial support in case of
new projects.
● list the number of women and men in each
category who hold paid and unpaid jobs
related to the water and sanitation services,
who received various kinds of training and/or
have positions of influence on service
management committees. This make it
possible to assess gender and social equity in
access, type of work done and control of
services.
● visually depict whether tariffs, and contributions
in cash and kind reflect the socio-economic
differences in the community and how benefits
such as proximity to water sources and service
levels are shared. This facilities planning for
socio-economically fairer divisions of burdens
and benefits.

PARTICIPATORY TOOLS USED IN THE MPA
66
Purpose
Community social maps help to visually represent
and analyze the community situation regarding
all water and sanitation facilities - traditional as
well as those provided by specific projects - and
access of the poor, rich and middle-income
households to them.
They also help to visualize in which households
(rich/intermediate/poor) paid or unpaid males or
females work in water, sanitation and hygiene
promotion, who paid or currently pays how much
in relation to service access obtained, and who
received training.
Social maps represent a popular
planning, evaluation and monitoring
tool as they reveal a lot that is never
possible to know from written records.
Since they also take considerable time
to make, it is worthwhile to consider
how many different types of data to
include, keeping keeping in mind that
the more complex the map, the more
time the analysis will take and that
other tools, discussed later, can give
the same information more “at one
glance” than a social map.
Preparations
A day before this activity, the
facilitators will discuss it with village
representatives (both women and
men) and agree on the area to be
mapped.
For large villages, it is often too
cumbersome to map the whole village down to the
household level. In such cases, a general layout of
the community is drawn with the traditional and
new water supply systems created through the
project, as well as the rich, poor and intermediate
neighborhoods, according to the criteria agreed.
For project planning purposes, the entire
population to be covered by a project intervention
would have to be included. For monitoring and
evaluation purposes, however, areas for detailed
mapping can be delineated and average/typical
household clusters or neighborhoods selected
according to the purpose of the activity. For
instance, large villages can be sectioned off
20 Adapted from participatory rural appraisal (PRA) techniques
6.3 Community map20
Counting households with good or poor access to servicesfrom the social map in Cambodia
PARTICIPATORY TOOLS USED IN THE MPA
67
according to administrative (sub-village) or
geographic boundaries when point sources of
water such as dug wells or hand pumps were
provided. When network systems such as piped
water supply was provided, the command area of
each system from source to points of use would
constitute the types of areas/units for mapping.
A random selection is then made from the relevant
areas/clusters for household mapping, in
consultation with the community, so that the
mapped area provides sufficient information to
represent the majority’s water-sanitation situation.
The venue chosen for mapping is a central place
where a large group can gather for an extended
period of time, protected from the weather, well lit
and accessible to all classes and both genders.
Process
The facilitator explains the purpose of the exercise,
and helps start a discussion to develop a list of
features that need to be indicated on the map.
Women and men make the map, either together
or in separate groups, as gender relations allow.
Depending on literacy, local preferences and
availability of space and materials, they may
choose to draw it on a large sheet of paper (e.g.,
2-4 wrapping paper sheets taped together), using
drawing materials they are familiar with, or on
the floor, or on open ground.
With the help of local materials, such as pebbles,
seeds, flour, twigs in case of a map on the ground,
or symbols in case of a map on paper, all selected
features are marked. When maps are made on
the floor or open ground, the literate villagers and
team members transfer them to paper after
completion.
The team uses the map to generate group
discussions and gather information, for further
reference, particularly for planning the transect
walk and for sampling. It is usual for a map to be
progressively developed, detailed and refined over
the entire period an assessment team is in a
village.
Results
Maps bring out key local information.
● Number, type and location of all water sources,
whether or not created through the project
being assessed.
● Degree to which the sources meet all water
needs during the year, only partly meet water
needs in some months, or at times fall
completely dry.
● Degree to which distribution points meet all
water needs, of women and men separately,
the year round, or do not have water for certain
periods, for uses of women, men or both.
● Predictability of water delivery, consquences in
case of irregular service, especially for women.
● Cut-off zones for water source use, clarifying
access of households to sources, particularly
point sources.
● Location of rich, poor and middle-income
households according to criteria agreed on
earlier, and the relationship of the welfare
classification with accessibility and regularity
of service delivery.
● Households that do not have easy access to
any type of improved source.
● Number, type and location of sanitation
facilities, both public and household, according
to their installation before, during or after the
external intervention.
● Homes of community members with roles in
providing and maintaining water and
PARTICIPATORY TOOLS USED IN THE MPA
68
sanitation services, according to gender, period
(past and present), socio-economic level and
function or type of work, including whether it
is paid or unpaid.
● Homes of community members who have
received training for construction or
maintenance of services, according to gender,
class, period (past and present) and subject
area.
Uses
Community maps are used in the MPA to analyze
at least the following aspects of services.
Access to servicesAccess to servicesAccess to servicesAccess to servicesAccess to services: The group examines the
locations of the facilities vis-à-vis the clusters of
homes:
● Which clusters of households are well served,
through closeness to facilities or household
connections?
● Which clusters are not?
● Reasons?
Facilitation brings out the rationale for and stories
behind the siting of facilities – both for water supply
and sanitation.
During project evaluations, it is very useful to
compare the community map to the project
agency’s infrastructure map for the same village
and probe reasons in case discrepancies are found
between the two.
Coverage over timeCoverage over timeCoverage over timeCoverage over timeCoverage over time: The facilitator helps reflect
on what has happened over time:
● Since the project constructed facilities, has the
community expanded or replicated them? Has
it installed more taps? Built more latrines? With
or without external assistance? Why or why
not?
Proportion of people using the serviceProportion of people using the serviceProportion of people using the serviceProportion of people using the serviceProportion of people using the service. The group
selects the score that represents the community
situation best. The same procedure is followed
for sanitation.
Quality of serviceQuality of serviceQuality of serviceQuality of serviceQuality of service: The group also discusses the
quality and reliability of service:
● Are there variations in water quantity, quality
and reliability?
● Which sources/points are functioning well and
which ones not?
● What are the reasons?
● Who is affected?
The answers are used for scoring quantity, quality
and reliability of water delivered by the different
water points. The discussion often explains
aspects of management and financing.21
Equity in sharing cost vs. benefits:Equity in sharing cost vs. benefits:Equity in sharing cost vs. benefits:Equity in sharing cost vs. benefits:Equity in sharing cost vs. benefits: From the
classification of user households and analysis of
access and quality of services, the progression to
discussing contributions is quickly made.
● What did and do poor and rich households
near and far from water points contribute for
the service?
● Do some households also use the water from
the system for productive uses? What types of
households, and what types of uses?
● Do these uses involve a lot of water? Does it
affect water availability for all, or could it do
so in future? Are these uses reflected in the
tariffs?
The results help the group score equity of tariffs
and links information on water distribution and
21 The same information is also obtained from service management committees and triangulated with informationfrom users from the map and transect walks.

PARTICIPATORY TOOLS USED IN THE MPA
69
adequacy for gender- and class-specific water use
to system designs, source capacity and water
management.
Equ i t y i n commun i t y management andEqu i t y i n commun i t y management andEqu i t y i n commun i t y management andEqu i t y i n commun i t y management andEqu i t y i n commun i t y management and
capacity building:capacity building:capacity building:capacity building:capacity building: The group examines the map
to identify the homes of:
● women and men on the wa te r and
sanitation committee;
● women and men who received training
in f inancial , technical, management,
and hygiene education aspects;
● those who use this training in current
positions; and
● women and men who hold paid jobs in
water supply, sanitation and hygiene.
The information helps the group analyze
and score the equi ty in the communi ty
capacity created and used, by gender and
class.

PARTICIPATORY TOOLS USED IN THE MPA
70
Purpose
The transect walk is used to review the construction
quality and functionality of the water and
sanitation services in both the wealthier and
poorer sections of the community, both from the
users’ and external technical specialists’
perspectives. The walk also serves to cross-check
some of the information in the community map.
During the transect walk, a group of women and
men from the water and sanitation committee and
the different user groups, together with the
facilitators (one of whom is an engineer) visit a
cross-section of the water supply system(s) and the
sanitation facilities. It is conducted with male and
female community members so that it becomes
an opportunity to pool outside knowledge with
local knowledge of the technical aspects.
22 Adapted from participatory rural appraisal.
Process
When the community map has been prepared
and discussed, it is used to identify a route for a
water and sanitation-related transect walk. The
route has to include the source(s) of the community
water system(s), the main works and a sample of
delivery points in different parts of the community,
for systematic observations. It has to also include
a proportional sample of latrine-owning
households in the different welfare categories and
any public sanitation facilities existing in the village.
The team of facilitators and local women and men
moves along this route, observing and assessing
the quality of installations using the systems
observation form and semi-structured interview
guide (available in the MPA fieldbook provided
during training). They employ rating scales using
6.4 Transect walk22 with rating scales
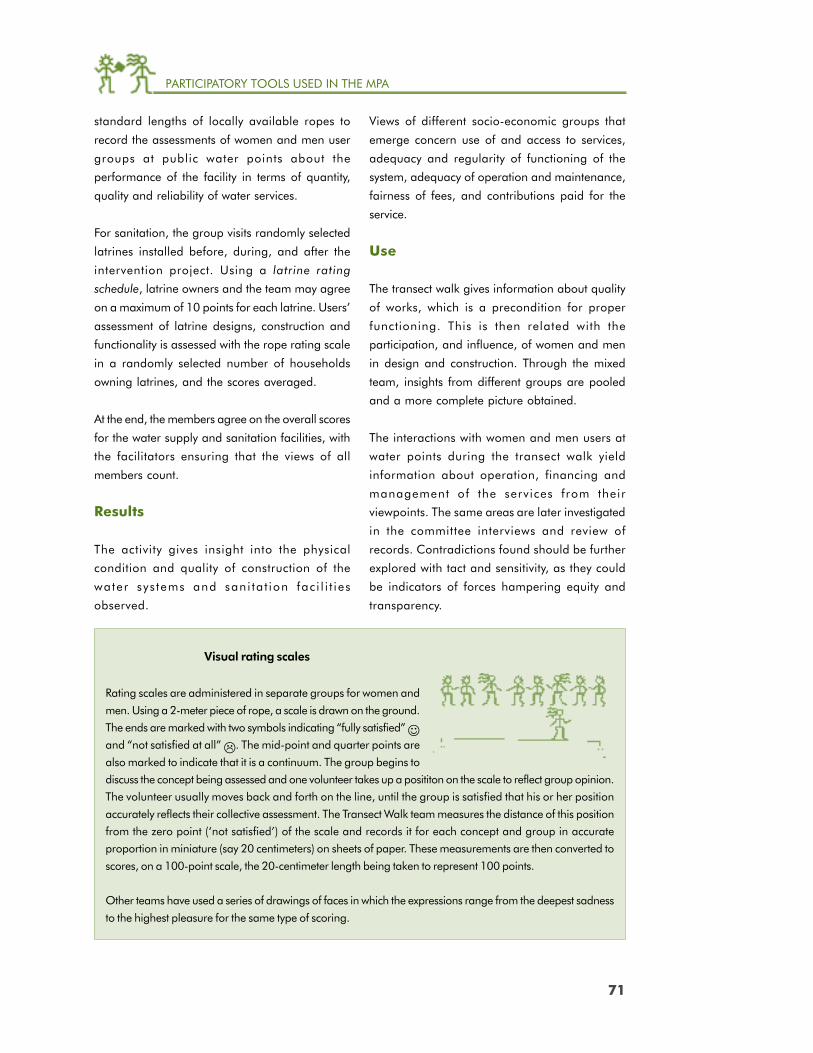
PARTICIPATORY TOOLS USED IN THE MPA
71
Visual rating scales
Rating scales are administered in separate groups for women and
men. Using a 2-meter piece of rope, a scale is drawn on the ground.
The ends are marked with two symbols indicating “fully satisfied”
and “not satisfied at all” . The mid-point and quarter points are
also marked to indicate that it is a continuum. The group begins to
discuss the concept being assessed and one volunteer takes up a posititon on the scale to reflect group opinion.
The volunteer usually moves back and forth on the line, until the group is satisfied that his or her position
accurately reflects their collective assessment. The Transect Walk team measures the distance of this position
from the zero point (‘not satisfied’) of the scale and records it for each concept and group in accurate
proportion in miniature (say 20 centimeters) on sheets of paper. These measurements are then converted to
scores, on a 100-point scale, the 20-centimeter length being taken to represent 100 points.
Other teams have used a series of drawings of faces in which the expressions range from the deepest sadness
to the highest pleasure for the same type of scoring.
standard lengths of locally available ropes to
record the assessments of women and men user
groups at public water points about the
performance of the facility in terms of quantity,
quality and reliability of water services.
For sanitation, the group visits randomly selected
latrines installed before, during, and after the
intervention project. Using a latrine rating
schedule, latrine owners and the team may agree
on a maximum of 10 points for each latrine. Users’
assessment of latrine designs, construction and
functionality is assessed with the rope rating scale
in a randomly selected number of households
owning latrines, and the scores averaged.
At the end, the members agree on the overall scores
for the water supply and sanitation facilities, with
the facilitators ensuring that the views of all
members count.
Results
The activity gives insight into the physical
condition and quality of construction of the
water sys tems and sani ta t ion fac i l i t ies
observed.
Views of different socio-economic groups that
emerge concern use of and access to services,
adequacy and regularity of functioning of the
system, adequacy of operation and maintenance,
fairness of fees, and contributions paid for the
service.
Use
The transect walk gives information about quality
of works, which is a precondition for proper
functioning. This is then related with the
participation, and influence, of women and men
in design and construction. Through the mixed
team, insights from different groups are pooled
and a more complete picture obtained.
The interactions with women and men users at
water points during the transect walk yield
information about operation, financing and
management of the services from their
viewpoints. The same areas are later investigated
in the committee interviews and review of
records. Contradictions found should be further
explored with tact and sensitivity, as they could
be indicators of forces hampering equity and
transparency.
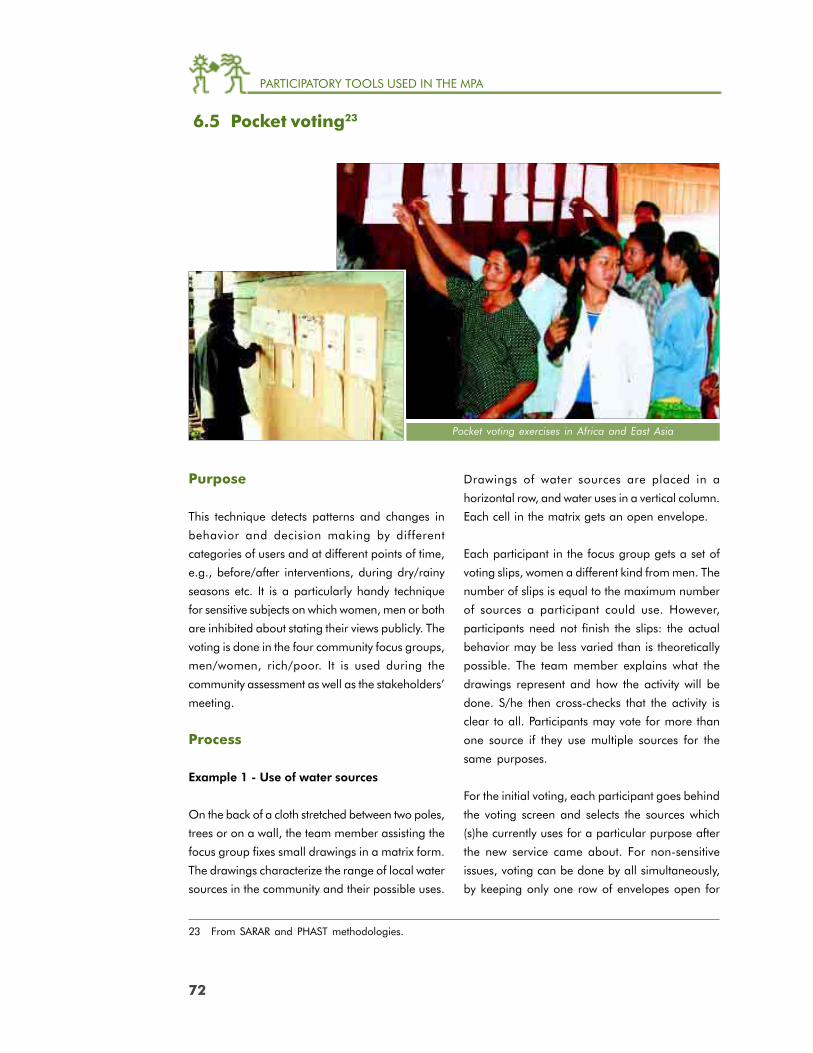
PARTICIPATORY TOOLS USED IN THE MPA
72
Purpose
This technique detects patterns and changes in
behavior and decision making by different
categories of users and at different points of time,
e.g., before/after interventions, during dry/rainy
seasons etc. It is a particularly handy technique
for sensitive subjects on which women, men or both
are inhibited about stating their views publicly. The
voting is done in the four community focus groups,
men/women, rich/poor. It is used during the
community assessment as well as the stakeholders’
meeting.
Process
Example 1 - Use of water sources
On the back of a cloth stretched between two poles,
trees or on a wall, the team member assisting the
focus group fixes small drawings in a matrix form.
The drawings characterize the range of local water
sources in the community and their possible uses.
23 From SARAR and PHAST methodologies.
Drawings of water sources are placed in a
horizontal row, and water uses in a vertical column.
Each cell in the matrix gets an open envelope.
Each participant in the focus group gets a set of
voting slips, women a different kind from men. The
number of slips is equal to the maximum number
of sources a participant could use. However,
participants need not finish the slips: the actual
behavior may be less varied than is theoretically
possible. The team member explains what the
drawings represent and how the activity will be
done. S/he then cross-checks that the activity is
clear to all. Participants may vote for more than
one source if they use multiple sources for the
same purposes.
For the initial voting, each participant goes behind
the voting screen and selects the sources which
(s)he currently uses for a particular purpose after
the new service came about. For non-sensitive
issues, voting can be done by all simultaneously,
by keeping only one row of envelopes open for
6.5 Pocket voting23
Pocket voting exercises in Africa and East Asia
PARTICIPATORY TOOLS USED IN THE MPA
73
voting at a time. When all have voted, a volunteer
takes out the slips from each envelope and the
facilitator registers the votes under the relevant
pictures on the matrix or on a paper version of
the matrix, using one symbol for the votes of men
and one for the votes of women, so that those
with no or low literacy can also analyze the results.
If there are great differences in service levels
between the wet and the dry seasons, the whole
activity has to be done twice. For before/after
analysis, a second round is done in the same
way, for the water use pattern before project
intervention. To do this, voting slips are given a
different shape or color than the first round and
the picture depicting a new project-provided source
is removed from the matrix for the second round
of voting (i.e., for the pre-project situation).
In the analysis the group compares the degree of
improvements in water use practices (change to
safer sources), and assesses whether some are
using a combination of safe and unsafe sources
for drinking.24 They discuss underlying reasons
and agree on the overall score in the scoring
system. In case the group raises issues, extra time
is required discuss them. The team later combines
the results of the various rounds of voting into a
total community result and score for presentation
and discussion of the overall community findings.
Example 2 - Sanitation and hygiene behavior
Voting procedures are as above. To find out where
people defecate, pictures of sites used for defecation
are placed in the horizontal row, and pictures of
different household members - women, men, girls,
boys, toddlers, babies - along the vertical column.
“Before” and “after” defecation practices are
assessed for a sanitation project by doing the
voting twice, first for the current situation and then
for the situation before the project intervention.
The incidence and/or effectiveness of hand
washing practices in the community is assessed by
placing different types of hand washing options
along the horizontal row and key hand washing
opportunities along the vertical row (before eating,
after defecation, after cleaning up infant’s feces,
before handling food).
Example 3 - History of participation
A similar matrix is used to analyze the extent of
local voice and choice (history of participation) in
decision making. Locally appropriate pictures of
persons/groups that are or were involved in making
decisions and choices are placed in the horizontal
row, such as:
● External agency worker
● Local male leader
● Local female leader
● Local men’s group - rich
● Local men’s group - rich and poor
● Local women’s group - rich
● Local women’s group - rich and poor
● Local mixed group (male, female) - rich
● Local mixed group - rich and poor, women
and men.
Types of important opportunities for choices and
decisions are placed in the vertical column, for
example:
● Initiation of project
● Types of technology and service levels
● Design, location of facility(ies)
● Agency or contractor for construction
● Payment amount and system
24 Reducing water-borne diseases requires a switch to year round use of only safe water sources for drinking andfood preparation, coupled with hygienic transport, storage and drawing. For the reduction of water-washeddiseases, any source of water is fine as long as plenty of water is used with soap or a soap substitute such as ash,or firm rubbing. Elimination of the guinea worm and schistosomiasis require the avoidance of bodily contact withinfested sources. Thus, a fairly detailed assessment is needed on the basis of local risks and practices.

PARTICIPATORY TOOLS USED IN THE MPA
74
● Local management
● Local maintenance system
● Persons to receive training
The participants in this activity vote twice, first on
who got access to information on which aspects,
and second on who made decisions on which
aspects. Women and men use voting slips in
different colors to make it possible to see if their
experiences and practices differ.
Results
The following kinds of information emerge from
this tool.
Water use:
● Which water source is generally used by the
community, for what purpose, before and after
introduction of the new project facility, and in
wet and dry seasons, if significant seasonal
variation exists.
● Whether women and men, rich and poor use
different sources of water and water for
different purposes.
● Internal consistency of the scores (e.g., do
women and men from the same neighborhood
report different sources for drinking water?).
● Whether the new facility has caused any
changes in the community ’s water use
pattern.
● Underlying reasons for change or lack of
change in water use practices.
Sanitation and hygiene behavior:
● Pattern of hygiene behavior being studied
before/after project interventions.
● Differences between women and men, rich and
poor.
● Underlying reasons for change or lack of
change in behavior before/after project
interventions.
Participation history:
● Who had access to what information in the
planning phase.
● Who participated in making the important
decisions leading to the creation of the water
supply and sanitation facilities. Who decided
on what local planning aspects.
● Who did not participate and why.
● What extent of information and choice was
available to those involved in making the
decisions.
Uses
After each voting, the group lays out votes and
the contents of the respective pockets on the
ground/cloth for the analysis of the findings. The
facilitator draws the group’s attention to voting
patterns to analyze similarities, differences and
changes. A team member notes the rationale and
stories behind the results, probing further wherever
something in the results seems unexpected or not
logical. The group then chooses the category on
the scale that best fits the results of their analysis
regarding improvement in water use practices;
effectiveness of handwashing, effective use of
sanitation facilities , access to information, and
voice and choice.
Community group discussing results of pocketvoting for water use in Cambodia
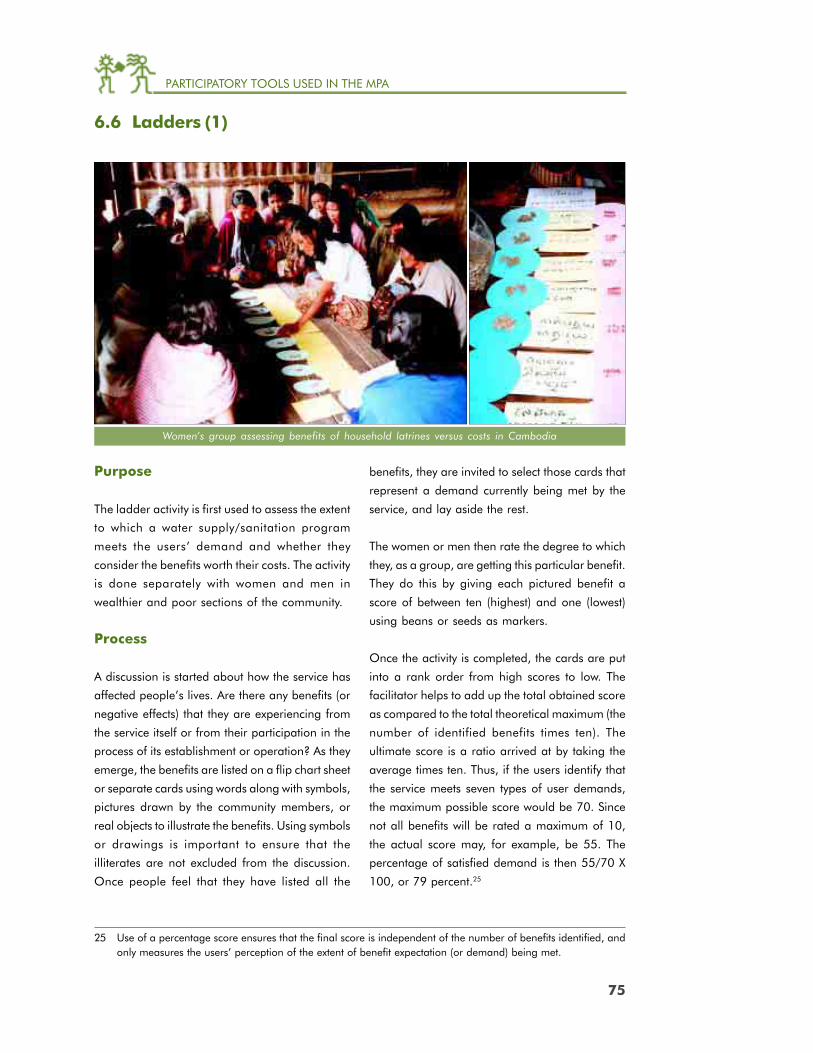
PARTICIPATORY TOOLS USED IN THE MPA
75
Purpose
The ladder activity is first used to assess the extent
to which a water supply/sanitation program
meets the users’ demand and whether they
consider the benefits worth their costs. The activity
is done separately with women and men in
wealthier and poor sections of the community.
Process
A discussion is started about how the service has
affected people’s lives. Are there any benefits (or
negative effects) that they are experiencing from
the service itself or from their participation in the
process of its establishment or operation? As they
emerge, the benefits are listed on a flip chart sheet
or separate cards using words along with symbols,
pictures drawn by the community members, or
real objects to illustrate the benefits. Using symbols
or drawings is important to ensure that the
illiterates are not excluded from the discussion.
Once people feel that they have listed all the
benefits, they are invited to select those cards that
represent a demand currently being met by the
service, and lay aside the rest.
The women or men then rate the degree to which
they, as a group, are getting this particular benefit.
They do this by giving each pictured benefit a
score of between ten (highest) and one (lowest)
using beans or seeds as markers.
Once the activity is completed, the cards are put
into a rank order from high scores to low. The
facilitator helps to add up the total obtained score
as compared to the total theoretical maximum (the
number of identified benefits times ten). The
ultimate score is a ratio arrived at by taking the
average times ten. Thus, if the users identify that
the service meets seven types of user demands,
the maximum possible score would be 70. Since
not all benefits will be rated a maximum of 10,
the actual score may, for example, be 55. The
percentage of satisfied demand is then 55/70 X
100, or 79 percent.25
6.6 Ladders (1)
Women’s group assessing benefits of household latrines versus costs in Cambodia
25 Use of a percentage score ensures that the final score is independent of the number of benefits identified, andonly measures the users’ perception of the extent of benefit expectation (or demand) being met.
PARTICIPATORY TOOLS USED IN THE MPA
76
To assess the value for costs, the participants look
at their scores again, but now discuss which of
these benefits are worth their past and current
contributions, in terms of payments, time, conflicts
and whatever else the service costs them..... If there
are items for which they feel their costs are greater
than the benefits they are getting, they can reduce
the number of beans given as scores. If there are
certain benefits for which they would even
contribute more than they do now, they can add
beans. The value-for-cost score is then calculated
using the same method as above.
Result
The scores indicate the groups’ perceptions of
different types of benefits from the new service.
They also reveal group perceptions of the extent
to which each type of benefit is experienced.
Ranking of benefits shows what they considered
worth paying for (in terms of money, time, effort,
assets or any other way), according to gender and
welfare class. Cross-checking helps identify to what
extent these experiences relate to their willingness
to sustain the water service or sanitation
improvements and whether other factors also play
a role. Women and men may also see different
benefits for themselves and for the other gender.
Use
The activity results in overviews of the types,
division and scope of benefits accruing to
women, men or both and as perceived by the
different socio-economic groups. The results
help examine whose demands are being met
and whose are not. Addit ionally, whose
demands are being met to a greater extent than
for others and why? If major inequities are
discovered in the benefits experienced from the
services and in the value for cost perceived by
different groups, facilitators use discussions to
draw out reasons underlying them. The whole
community needs to become aware of the
inequities and identify the reasons for them, to
spark collective decisions and actions.
For example, if a certain group is deriving
proportionately greater benefits from the services
than others but is paying the same user fees,
this could lead to a change in the rates of user
fees that better reflects the differentials in
consumption - thus improving financial
sustainability.
The activity also lends itself to a broader
discussion on benefits and gender: which
benefits are for women and girls, which for men
an boys, and which are the same for all. Trying
to distinguish between practical gender benefits
(that is, facilitating life without changing existing
roles of women and men) and strategic ones
(that is, leading to an improved position of
women as compared to men) turned out to be
difficult in field situations and was abandoned
as part of the assessments.

PARTICIPATORY TOOLS USED IN THE MPA
77
Purpose
Card sorting is used in MPA to assess who
contributed what to the establishment of the service,
in relation to capacity to contribute.
Process
For this activity, the starting points are the drawings
that emerged from welfare classification as
representing the rich/wealthier and the poor. With
each drawing, a picture of a man and a woman
is added (if not already present) to represent the
male and female head of the family. Alternatively,
the two persons are depicted with a symbol, e.g.,
typical male and female implements or pieces of
clothing. In addition, pictures or real life symbols
are needed to represent total and partial payments
in cash (e.g., large and small bag of money or
pile of coins); typical payments in kind (e.g.,
chicken, grain, coconuts, etc. as is locally
appropriate), typical unskilled labor (e.g., digging,
carrying construction materials, catering) and
typical local materials that the users may have
provided in the installation process (e.g., sand,
bricks, stones and the like).
The facilitator explains that this activity aims to
learn who in the households has contributed
what to establishing the service. The groups then
discuss what the cards represent or identify and
bring symbols for each kind of contribution by
women and men. They lay these out in three rows
under the pictures or symbols of a woman, a
man, and a woman and a man together, placed
as column headings.
Each person in the group then gets as many seeds,
pebbles or similar objects as there are types of
contributions. They place them next to types of
contribution(s) in any of the three rows: given by
the man or men in the household, the woman or
women in the household, or the genders/couple
together. The total number of beans is then copied
on a pictorial copy of the scoring sheet. To structure
the activity, it can be done row by row.
6.7 Card sorting
Assessing who contributed what for construction, by gender and class, in Nepal
PARTICIPATORY TOOLS USED IN THE MPA
78
Where relevant, the activity is done twice, once for
water supply and once for sanitation.
Results
The outcome provides insight into the division of
contributions within the community and on the
gender division of labor contribution in
households, and also for cash contributions in
those cultures where women and men have their
own sources and control of income. It shows the
nature of user contributions to meet demand,
other than time for meetings. Time also has
monetary value, but is hard to recall several years
after implementation.
Uses
This is another activity that helps to analyze
(in)equity and draw conclusions about whether
households contributed at the same rate or
different rates.
Questions may be asked to bring out what was
the basis of determining the type and amount
of contributions. Were the poor required to
contribute less or the same as others? How did
they decide who was to pay more or less? Did
the majority of users have a voice in deciding
the extent of the contribution? Did the poor
and the women have a say in deciding? Did
women and men within each household and
in both economic groups contribute different
amounts and in different ways? How do the
di f ferent categor ies feel about their
contributions? Do they feel it was fair? What
are the reasons for their answers?
Results are used to score the equity in division
of contributions during construction.
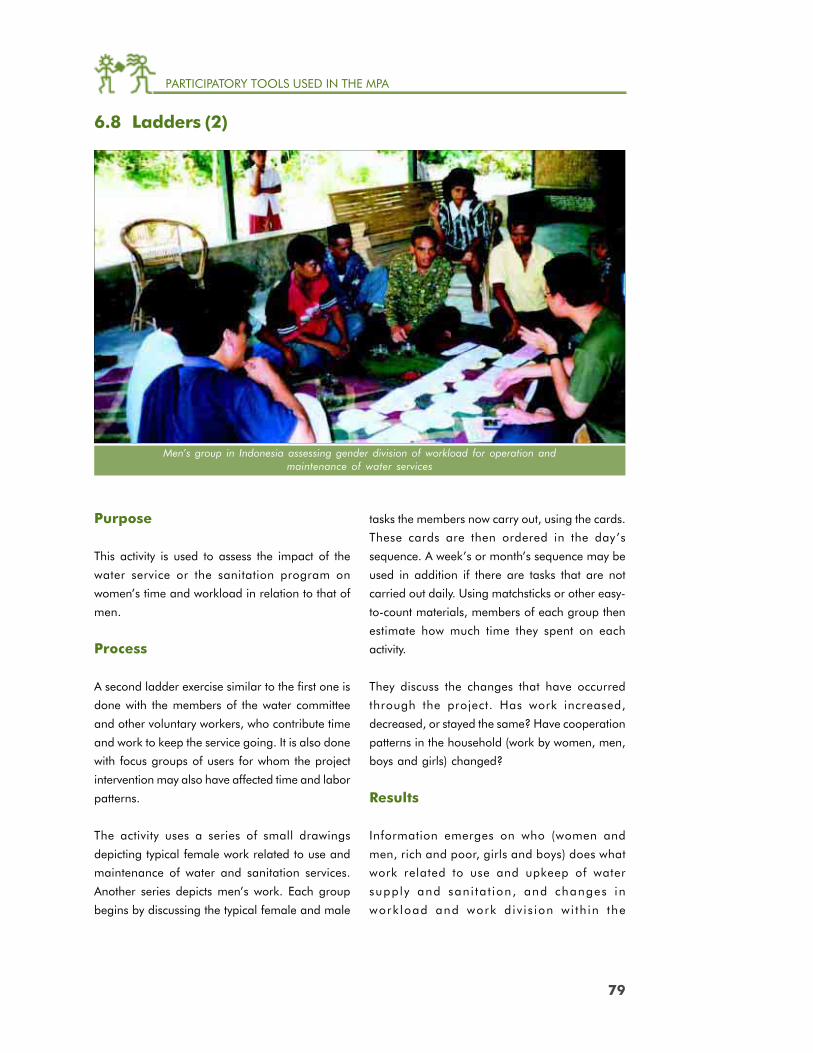
PARTICIPATORY TOOLS USED IN THE MPA
79
tasks the members now carry out, using the cards.
These cards are then ordered in the day’s
sequence. A week’s or month’s sequence may be
used in addition if there are tasks that are not
carried out daily. Using matchsticks or other easy-
to-count materials, members of each group then
estimate how much time they spent on each
activity.
They discuss the changes that have occurred
through the project. Has work increased,
decreased, or stayed the same? Have cooperation
patterns in the household (work by women, men,
boys and girls) changed?
Results
Information emerges on who (women and
men, rich and poor, girls and boys) does what
work related to use and upkeep of water
supply and sani ta t ion, and changes in
work load and work d iv i s ion wi th in the
Purpose
This activity is used to assess the impact of the
water service or the sanitation program on
women’s time and workload in relation to that of
men.
Process
A second ladder exercise similar to the first one is
done with the members of the water committee
and other voluntary workers, who contribute time
and work to keep the service going. It is also done
with focus groups of users for whom the project
intervention may also have affected time and labor
patterns.
The activity uses a series of small drawings
depicting typical female work related to use and
maintenance of water and sanitation services.
Another series depicts men’s work. Each group
begins by discussing the typical female and male
6.8 Ladders (2)
Men’s group in Indonesia assessing gender division of workload for operation andmaintenance of water services
PARTICIPATORY TOOLS USED IN THE MPA
80
households. This helps start discussions on
redistribution and other ways of facilitation
of equitable sharing of workloads.
Uses
Division of workload. When the visual output is
complete, the facilitator initiates a discussion
on sharing burdens. How are the workloads/
responsibilities for water supply and sanitation
shared between women and men? How is this
for boys and girls? Is the workload shared fairly?
If yes, how did it happen? If not, who has a
greater burden? Why? How does this affect their
lives?26 Should this change? What can be done
to share the burden more equitably? What
action can be taken, by whom? The groups use
the outcomes to choose the option (or in-
between score) that best represents their
situation.
26 Some significant effects can be changes in school attendance of girls and boys; changes in infant care andfeeding practices in the family; changes in women’s access to opportunities for developmental interventions orincome generating activities.
Effect on time and work division
After a ladder exercise, members of the water committee in a community in Ghana decided that,
for a fairer division of work and better results , all members would help the treasurer with fee
collection from user homes.
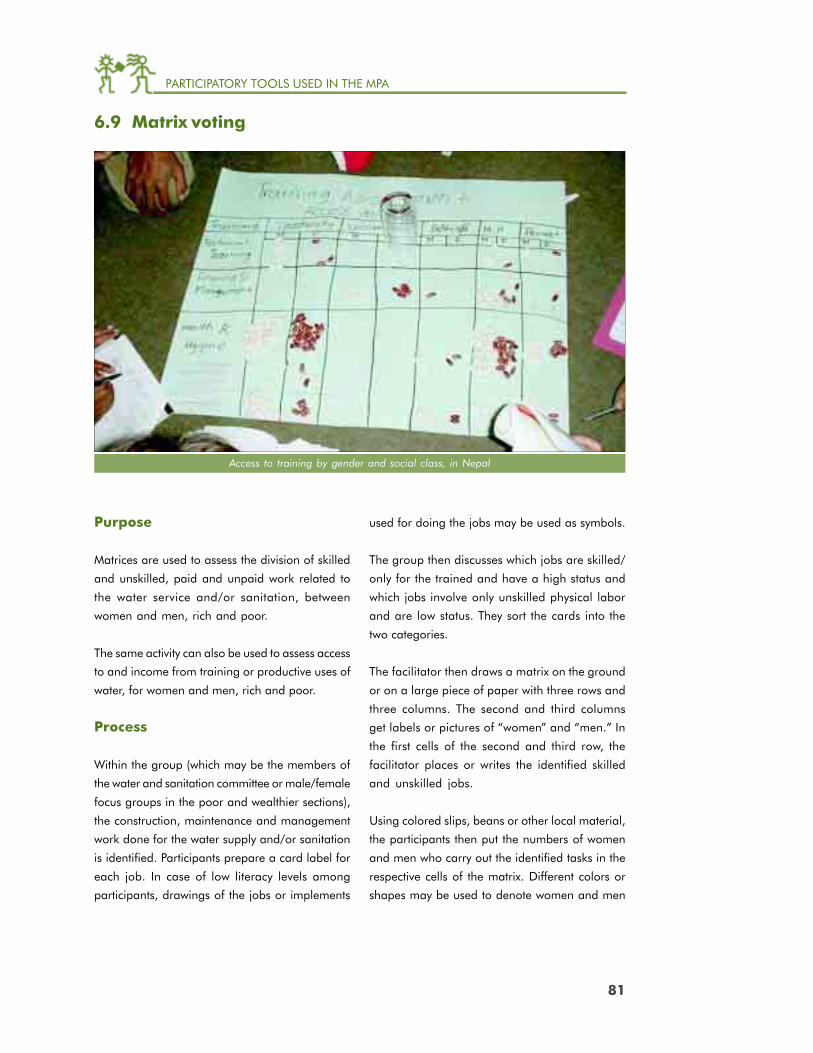
PARTICIPATORY TOOLS USED IN THE MPA
81
Purpose
Matrices are used to assess the division of skilled
and unskilled, paid and unpaid work related to
the water service and/or sanitation, between
women and men, rich and poor.
The same activity can also be used to assess access
to and income from training or productive uses of
water, for women and men, rich and poor.
Process
Within the group (which may be the members of
the water and sanitation committee or male/female
focus groups in the poor and wealthier sections),
the construction, maintenance and management
work done for the water supply and/or sanitation
is identified. Participants prepare a card label for
each job. In case of low literacy levels among
participants, drawings of the jobs or implements
used for doing the jobs may be used as symbols.
The group then discusses which jobs are skilled/
only for the trained and have a high status and
which jobs involve only unskilled physical labor
and are low status. They sort the cards into the
two categories.
The facilitator then draws a matrix on the ground
or on a large piece of paper with three rows and
three columns. The second and third columns
get labels or pictures of “women” and “men.” In
the first cells of the second and third row, the
facilitator places or writes the identified skilled
and unskilled jobs.
Using colored slips, beans or other local material,
the participants then put the numbers of women
and men who carry out the identified tasks in the
respective cells of the matrix. Different colors or
shapes may be used to denote women and men
6.9 Matrix voting
Access to training by gender and social class, in Nepal
PARTICIPATORY TOOLS USED IN THE MPA
82
from wealthier households and women and men
from poor families. The same exercise is done for
paid and unpaid jobs/tasks.
The types of training given or planned to be given
by projects are assessed in the same manner, e.g.,
training in leadership skills, technical construction
or maintenance skills, bookkeeping and
accounting skills, skills for monitoring system
functioning and use, and hygiene promotion.
Who and how many have had access to training
is identified by gender and class.
Results
Emerging data include new jobs and skills for
women and men, including non-stereotyped skills;
status and gender division of physical labor;
division of paid and unpaid jobs between women
and men, rich and poor; access to training for
women and men in wealthier and poor households;
impacts of the project on women and men.
Uses
To assess activities and impacts: The activity
provides insight into how unskilled and skilled jobs,
low and high status jobs are or will be divided
between women and men, and how this impacts
their positions. Typical questions that may be
answered are:
Sharing workloads and responsibility
● Do women/girls also do technical jobs? Why
or why not? Would there be benefits if more
women/girls are (also) trained for technical
tasks? What types of women/girls could/
should be trained?
● Do only women/poor people do the physical
work involving cleaning, collecting tariffs, etc.?
Is the work paid? What does the situation
mean for their workload?
● Do men have responsibilities for household
and environmental cleanliness?
Access to new resources - knowledge, skills
● Has the project brought new skills? To women,
men or both? To girls and boys?
● Has the project brought any training? In what
subjects? Who and how many benefited, in
the committee and in the community?
● Are only the wealthier getting trained for skilled
and paid jobs? Why?
● Was training given along conventional
gender lines, or did both women and men
learn new aspects, e.g., men on health and
hygiene, women on financing, maintenance
of facility?
Access to new resources - jobs, production, and
income
● Has the project brought new jobs? Paid or
unpaid? Who does the paid jobs, and who
the unpaid? If men did unpaid jobs that are
now done by women, would they be paid?
● Who has benefited from paid jobs? The elite,
or also common people?
● Any new/additional economic uses of water or
waste? What are the benefits? Payments? To
whom? Does the use affect current access to
the resource for others? May it do so in future?
The results are used for the scales on labor
division, training and gender impacts. Scores and
qualitative information are recorded in the
fieldbook. The original matrix, like all pervious
materials, is kept by the group for presentation
in the community review assembly, where
discussion is facilitated on any social and gender
inequities found and ways of correcting the
situation.27
27 And for further use in community monitoring of progress.
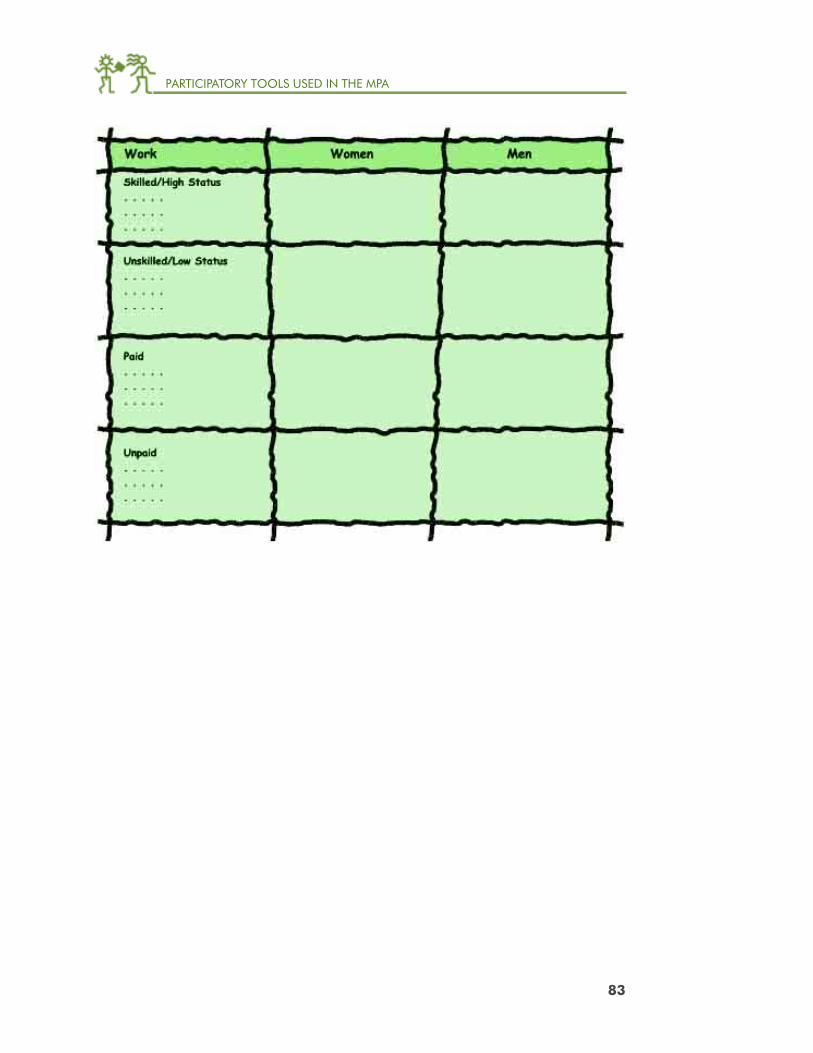
PARTICIPATORY TOOLS USED IN THE MPA
83

PARTICIPATORY TOOLS USED IN THE MPA
84
Purpose
“A hundred seeds” is a tool to obtain an
approximate percentage distribution of any
concept; in this case, sharing of earning and
financial responsibility within households.
Process
The hundred seeds activity gives insight into who
carries the burden of paying for (or otherwise
contributing to) improvements in water, sanitation
and hygiene, men or women or both, and from
what resources. For this purpose, each focus group
(male, female, rich, and poor) is given 100 seeds.
The seeds are assumed to constitute the total
income of women and men in the typical
household in the area.
Participants group the seeds or “money” into the
percentages each member of the household (father,
mother, older son, older daughter etc.) earns in
cash or the value of in-kind earnings.
The number of seeds in each pile constitutes the
percentage of the total household income
contributed.
The group then lists the type of financing
responsibilities each earner has in the household
and divides each pile into the proportion that each
person uses for these purposes and for personal
objectives. Payments for water, sanitation, and
hygiene are identified among those made for the
family.
Having divided the seeds per earner into piles and
transferred the numbers onto the slips representing
the extent of their financial responsibility, the group
then judges whether women in the family
contribute relatively more or less to water,
sanitation and hygiene than men, or whether the
payments and responsibilities are in proportion
to the levels of earning of the family members
concerned. Having come to a conclusion, the
group scores the results in terms of the extent of
6.10 Hundred seeds
Women in Sulawesi assessing distribution of financial responsibility for water supply and sanitationwithin households, Indonesia
PARTICIPATORY TOOLS USED IN THE MPA
85
equity. Further discussions probe possibilities of
addressing any gross inequities revealed.
In an adjusted version, the tool helps measure
time allocation, including for water collection and
sanitation.
Results
The tool provides information on:
● Intra-household patterns of earning and
contributions by different members, as
perceived by groups of rich men, poor men,
rich women, poor women.
● Intra-household pattern of paying or spending
time for household necessities, including water
supply and sanitation services and household
hygiene (who contributes what).
● Extent of division of work and financial
responsibility between women and men in the
household for household water supply,
sanitation and hygiene.
Uses
The outcomes facilitate a discussion on equity
implications, e.g., for family welfare and health,
and reasons for the emerged patterns of
financial and labor responsibility. Do the
payments made look proportional to differentials
in earning by different household members? Are
the financial responsibilities or work fairly shared?
If not, why? What may be the effects? What
might make it fair? The results are used for
scoring and planning and monitoring change
as with previous activi t ies, and divisions
presented as pie charts at the community review
meeting.
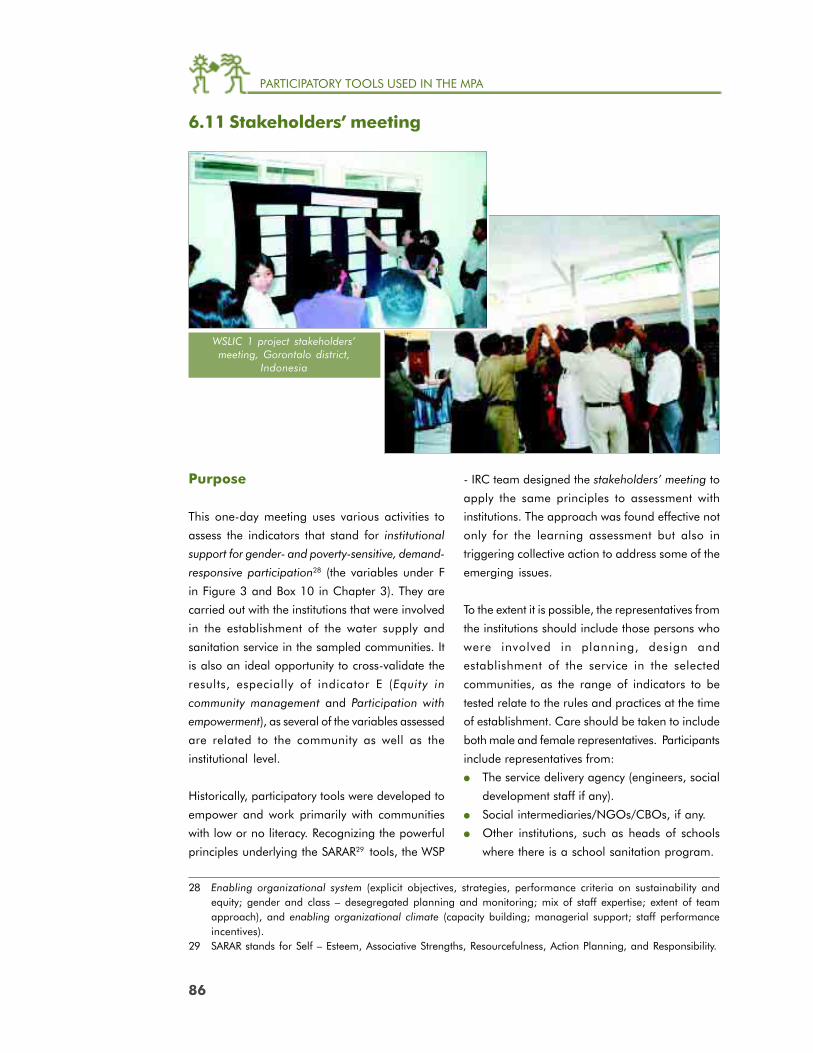
PARTICIPATORY TOOLS USED IN THE MPA
86
28 Enabling organizational system (explicit objectives, strategies, performance criteria on sustainability andequity; gender and class – desegregated planning and monitoring; mix of staff expertise; extent of teamapproach), and enabling organizational climate (capacity building; managerial support; staff performanceincentives).
29 SARAR stands for Self – Esteem, Associative Strengths, Resourcefulness, Action Planning, and Responsibility.
Purpose
This one-day meeting uses various activities to
assess the indicators that stand for institutional
support for gender- and poverty-sensitive, demand-
responsive participation28 (the variables under F
in Figure 3 and Box 10 in Chapter 3). They are
carried out with the institutions that were involved
in the establishment of the water supply and
sanitation service in the sampled communities. It
is also an ideal opportunity to cross-validate the
results, especially of indicator E (Equity in
community management and Participation with
empowerment), as several of the variables assessed
are related to the community as well as the
institutional level.
Historically, participatory tools were developed to
empower and work primarily with communities
with low or no literacy. Recognizing the powerful
principles underlying the SARAR29 tools, the WSP
- IRC team designed the stakeholders’ meeting to
apply the same principles to assessment with
institutions. The approach was found effective not
only for the learning assessment but also in
triggering collective action to address some of the
emerging issues.
To the extent it is possible, the representatives from
the institutions should include those persons who
were involved in planning, design and
establishment of the service in the selected
communities, as the range of indicators to be
tested relate to the rules and practices at the time
of establishment. Care should be taken to include
both male and female representatives. Participants
include representatives from:
● The service delivery agency (engineers, social
development staff if any).
● Social intermediaries/NGOs/CBOs, if any.
● Other institutions, such as heads of schools
where there is a school sanitation program.
6.11 Stakeholders’ meeting
WSLIC 1 project stakeholders’meeting, Gorontalo district,
Indonesia

PARTICIPATORY TOOLS USED IN THE MPA
87
● Community organizations that were involved
in the service establishment, e.g., members of
the then water and sanitation committees or
village development committees.
● Special categories/groups who made
significant contributions to service
establishment, such as female masons, health
workers involved in hygiene education, etc.
The stakeholders’ meeting is organized at the district
or project level. In situations where geographic
distances are vast, two or three such meetings
may have to be organized and the results collated
for reporting. The stakeholders’ meeting should
not be held at the office of the service agency. A
neutral place with adequate meeting space is
needed.
Process
The process and group dynamics are significant
and revealing. It is therefore critical that the
facilitator is assisted by recorder/s who take notes
very carefully and use them for reporting on the
qualitative aspects. The full meeting is conducted
in the local language.
Introduction
This is the formal opening at which all the
participants give a brief background of themselves
and their interests. Some introductory icebreaker
exercise compatible with the local culture is
necessary at this point, to neutralize hierarchical
barriers to interaction and create an informal,
relaxed climate conducive to sharing and learning
together.
Open discussions focusing attention on
sustained and effectively used services
The first step in the group process is an open
discussion on the influence of institutional factors
around the question “What agency factors were/
are important in establishing a sustainable and
effectively used service?”
Identified factors can be those that have either
positive or negative influence. Rather than letting
a dominant person speak up and answer for the
rest, it is advisable to have the different types of
participants record their views on color-coded
response cards, e.g., blue cards for technical
agency staff, pink for social development agency’s
staff, yellow for village level intermediaries, white
for community representatives and so forth. If
women and men write cards of different shapes,
e.g., men write rectangular cards while women
write oval ones, the results are visually very
“telling.” Writing is done with thick markers, and
only one idea may be written on one card. The
cards are displayed on the wall or floor.
The participants subsequently cluster the cards
based on the similarity of ideas expressed on them.
Each cluster is given a self-explanatory label. This
activity reveals the answers to the above question
as expressed by the whole group. The facilitator
then helps the group to draw conclusions on the
nature of factors and observed patterns, relating
expressed views to the participants’ backgrounds.
For example, do technical staff have views that
are different from those of the social development
staff or the village leaders? Do women think
differently from men?
The presence of hierarchical relationships among
the participants may inhibit honest responses about
agency factors. If that were the case, the first
exercise is done in three separate but parallel
groups with the help of three facilitators and the
results collated. This helps bring out major
disparities in views among different categories of
staff without threatening anyone.
Assessing agency objectives and strategies
This may be done using the card sorting technique

PARTICIPATORY TOOLS USED IN THE MPA
88
described earlier. Each participant sorts the cards
with scale options on agency policy on sustained
services, from the lowest to the highest order. Empty
cards of a different color are provided to add
another option if needed. Sorting is done in small
groups of different categories of participants, or
even individually if the number of participants is
less than 15.
Each person selects the card, which, in his/her
opinion, best matches the project approach their
agency used at the time of establishing the services
in the selected communities. Each person uses a
color-coded voting token or sticker to mark the
selected card. The colors represent participant
categories, i.e., whether the person is technical,
social or village level staff or community member
and whether male or female. The groups display
their cards and markings on the floor or a wall.
The facilitator helps the group to draw conclusions
about the similarity or divergence of views and
scores by different participant categories. Major
variations stimulate discussions on underlying
reasons, meanings of concepts, problems and
required actions.
The activity is repeated for the other indicators -
i.e., policies regarding demand-responsive
services, community ownership and management
and gender-sensitivity and gender balance.
The groups examine the degree of consensus and
agree on overall scores in the scoring tables with
the whole group. When consensus cannot be
reached, it is important to explore reasons for the
divergence of scores, which may be too sensitive
to do in the plenary discussion. Facilitators should
note if there are agreements within certain sub-
groups. Smaller, more homogenous groups can
be formed to discuss people’s rationales for given
scores and the results gathered from all. Persistent
lack of consensus should be recorded by
facilitators as such, identifying which groups
agreed with which scores and why.
Assessing enabling organizational systems
This variable (see footnote 28) requires assessors
to have experienced the relevant organizational
systems themselves, and thus can only be assessed
by agency personnel. Community representatives
may however be invited to comment on the results
of the assessment, as described below. The aspects
covered include planning and monitoring systems,
skill mixes of agencies, expertise in field teams,
and use of team approaches.
Several creative techniques have been used to
measure the degree to which the organization is
perceived to have gender- and poverty-sensitive
systems. One such technique was using ribbons
in different colors for each category. Participants
folded the ribbons conforming to their opinion of
level of support (fully open if the support is 100
percent to folded four times if the support is only
25 percent) and stuck the ribbons on to a board.
It is interesting as well as revealing to see how
colleagues in the same organization or in other
stakeholder groups view the organizational
culture.
Another alternative is to use pocket voting for each
scale. Empty envelopes are taped to individual
cards carrying descriptions for scores of 0, 1, 2, 3
or 4 for each scale. Each set of cards is placed on
a board turned towards the wall. Participants go
behind the board and vote using color-coded
tokens, one at a time. Since the topics covered in
this section may be sensitive, more honest
assessments are made possible through voting in
privacy. Results are then tallied in front of the whole
group, so everyone can see the voting pattern,
PARTICIPATORY TOOLS USED IN THE MPA
89
discuss the rationale for it, and agree on the
overall scores.
Community representatives are asked to report their
impressions on staff capacity, management support
and incentives. A plenary discussion is held on the
reporting and any emerging trends and issues.
Assessing enabling organizational climate
For this activity, each participant is given a sheet
with descriptions of scores for the aspect being
assessed (capaci ty bui ld ing provis ions ,
management support , staff incentives for
performance). If translations of scoring tables
are used with participants, it is advisable to
have bilingual versions that make both English
and translated sections available on the same
page.
Each participant selects the situation that best fits
the project being assessed and writes his/her
reasons for selecting that score, on the sheet.
Participants also record their gender and
participant category on the sheet. The process is
repeated for the scales about management support
and staff incentives.
After each round, the results are summarized
publicly for each participant category, by tallying
information from the sheets collected by the
facilitator, who also lists out the reasons given for
selection of each score. This reveals the
perceptions of different levels and types of staff
regarding organizational support for working in
a gender-sensitive and poverty-targeted manner.
An overall score is agreed on if a consensus can
be reached. If there are major score variations
among participant categories, the variations are
reported by categories instead of an overall score.
Role of the facilitator
The stakeholders’ meeting is, by virtue of the range
of participants, a significant challenge for the
facilitator. All efforts must be made to ensure that
the hierarchy of institutions is not reflected in the
proceedings, i.e., the poorer or female
participants are not relegated to the background
while the community elite and project staff take
center stage. Special care must be taken to ensure
equal participation by all. It is advisable to use
the services of professional facilitators adept in
the local language. A team of one facilitator and
one or two co-facilitators/recorders is preferable.
The facilitator and recorders are asked to be very
alert to capture special features of the group
dynamics between the different categories of
participants and make notes when views differ
consistently. The facilitator is further asked to record
his/her gut feelings on the credibility of the data:
did all participants take the activities seriously and
seem to answer truthfully? Were there any
inhibitions with certain individuals or groups?
Scales are scored on the spot, and refreshments
are made available during the activities.

PARTICIPATORY TOOLS USED IN THE MPA
90
Purpose
This activity helps identify the national or aid agency
policies that were operational during the planning
and implementation of water and sanitation
projects, and reveal how they relate to institutional
practices and thus finally influence results at
community level. The activity consists of assessing
the G variable in the MPA analytical framework
(Figure 3 and Box 10, Chapter 3).
Option I: Structured interviews with selected
policy officials
At the policy level, a structured interview guide is
used for discussion with officers involved at the
time of establishment of the service. During the
discussion, the facilitator provides a brief feedback
on the outcomes of assessment at the community
and institutional levels.
Option II: Policy dialogue workshop
A more participatory option is the organization of
a half-day workshop with the key officials at the
policy level, national directors of assessed projects
and representatives of external support agencies
and NGOs working in the sector. It is ideal if the
meeting is organized in collaboration with the
agency responsible for sector coordination. It is
important to ensure that all participants are
familiar with the assessed projects, the policies
governing their design and implementation, and
national sector policies/regulations at the time they
were implemented.
Process and Results
A workshop usually lasts about three to four hours
and has three main content blocks.
Introduction
This is the formal opening at which participants
introduce themselves and a facilitator explains the
purpose of the gathering. The participants are
usually familiar with each other as most are from
the central government and national level NGOs
and external aid agencies. A carefully designed,
culturally appropriate icebreaker exercise is
6.12 Policy level assessment
Assessing the definition of gender in water sector policies in the Philippines
PARTICIPATORY TOOLS USED IN THE MPA
91
necessary to create an informal, relaxed climate
conducive to sharing and learning together.
It is very important for the facilitating agency to
emphasize that the purpose of the meeting is not
to compare or evaluate the projects from which
MPA results are being discussed, but to identify
what policy elements and institutional factors
influenced by the policy elements could have led
to the community level outcomes observed.
Presentation of results of the assessment at
community and institutional levels
Summarized scores, qualitative findings and
graphic presentations from both community and
institutional assessments are presented by
facilitators, or invited project implementers.
Facilitators use the presentations, usually displayed
at the meeting venue, to raise questions and invite
discussions, using a creatively crafted process. They
help relate findings from communities and
institutions to existing policies and facilitate a
debate on what policies need to change and how,
to better support gender- and poverty-sensitive
demand-responsive approaches, for the ultimate
goals of sustainability and equity.
Scoring of relevant policies
Open discussion and participatory exercises such
as pocket voting, card sorting and visualized
scaling are then used, to get the participants to
assess the indicators under Policy support.30 It is
important to facilitate discussions on each visual
output before a score can be agreed upon.
It can be very productive and eye-opening for
al l i f the pol icy dialogue can include
stakeholders from implementing agencies and
user communities and if the country’s cultural
and political climate allows candid interactions
across all levels of stakeholders. In practice it
has been possible to include institutional and
policy levels but not the community
representatives in policy dialogues to date.
Community level assessments have however
been presented in policy dialogues as the basis
for policy discussions, with powerful impact.
Uses
The policy dialogue process is proving to be a
powerful tool for influencing mind-sets since it is
able to show how policies translate to action on
the ground. It is a process that is already being
used at various sub-national levels where
decentralization has devolved power and
responsibilities to province and regional levels.
Getting all levels of stakeholders to interact, learn
from each other and improve the end result is not
a new idea. The MPA only adds some concrete
and interesting ways to make the idea actionable.
To maximize the potential advantages of the policy
dialogue, it is necessary to use it as a part of the
process linking communities, institutions and
policies, and institutionalize it as a periodic
learning exercise for the national sector.
This policy assessment rounds off the activities of
data collection, sharing and analysis and begins
processes for planning and implementing
improvements.
The entry of the data into the database and the
analysis and reporting of the overall quantitative
and qualitative findings which comprise the second
level of action are described earlier in Chapter 4.
30 Presence and nature of national sector policy for water supply and sanitation; Presence of sector strategiesto set in motion community participation, demand-responsive approaches, gender and social equity.

PARTICIPATORY TOOLS USED IN THE MPA
92
In a policy dialogue workshop held in 1999 in Indonesia, based on results from one World Bank-
and one AusAID–supported project, the principal reason for lack of community participation in
planning certain types of water supply systems was traced back to a law which prohibits the
planning and construction of such technologies by anyone other that the government’s Public
Works Department.
The finding prompted a discussion and identification of other legal and regulatory mechanisms in
use in 1999, all designed when centrally decided supply-driven modes of providing water supply
were the only service delivery mechanisms. The need for change was suddenly very concretely
visible to all.
PLA Initiative Country report, Indonesia.
Water and Sanitation Program - East Asia and the Pacific
Box 24 Policy analysis builds consensus for needed change
Section 2
MPAApplication Case Studies
Section 2MPA APPLICATION CASE STUDIES
DO PROJECT RULES PROMOTE Bruce Gross 95
SUSTAINABILITY AND EQUITY?An ex post facto assessment in 40 communities
served by five past projects in Indonesia.
FROM THEORY TO PRACTICE Suzanne Reiff 104
A study of rural water supply and sanitation
strategy implementation: PADEAR in Benin.
Evaluating the effectiveness of gender- and
poverty-targeting in project strategies, to improve
final impact of ongoing and forthcoming projects.
ADDING ACCOUNTABILITY FOR Nilanjana Mukherjee 111
GENDER AND SOCIAL INCLUSION and Nina Shatifan
Learning from the process of institutionalizinggender- and poverty-sensitivity in large scaleCommunity-Driven Development (CDD) projectsin Indonesia.
LOOKING BACK TO SEE FORWARD Soutsakhone Chanthaphone 127
Learning from communities about the use and and Santanu Lahiri
sustainability of RWSS services in Lao PDR.
Sector experience assessment for scaling up
the application of national RWSS sector strategy.
EFFECTS OF THE MPA ON GENDER Christine van Wijk 138
RELATIONS IN THE COMMUNITYCase study from Java, Indonesia, of an MPA
experience changing community views on gender
roles and gender relations towards greater equity.
ACHIEVING SUSTAINED SANITATION WSP-EAP 141
FOR THE POORParticipatory policy research applications from
Indonesia, Cambodia, Vietnam - lessons from a
set of three country reports and a regional synthesis.
HOW WELL DID THOSE DEVELOPMENT Richard Hopkins 143
PROJECTS IN FLORES WORK?Evaluating development effectiveness of past aidprojects and drawing policy lessons, Flores,Indonesia.

95
DO PROJECT RULES PROMOTE SUSTAINABILITY AND EQUITY?
Do Project Rules PromoteSustainability and Equity?An ex post facto assessment in 40 communities served byfive past projects in Indonesia
Bruce Gross
Background
Indonesia has not yet adopted a national rural
water supply and sanitation policy, and funding
agencies have pretty much followed their own
development philosophies. The result has been
that projects vary substantially in their objectives,
financial rules, and approaches to demand and
community participation. Forty Indonesian
communities in seven different provinces, which
had received support to improve water supply
services in the past, were assisted to use the MPA
to find answers to the following questions:
● What kind of outcomes have the different
projects produced?
● How well do they do in giving women and the
poor voice and choice?
● Is there a link between project approaches and
access to services?
● How successful are multi-sector projects in
helping communities build the structures and
capacity to sustain their water systems?
● What can be learned for policy development
and for future projects?
96
DO PROJECT RULES PROMOTE SUSTAINABILITY AND EQUITY?
Projects, process, and watersystems
Three projects - the Village Infrastructure Project I
and II (VIP) and the first Kecamatan Development
Project (KDP 1) funded by the World Bank, and
the Village Infrastructure Project funded by the
Overseas Economic Cooperation Fund of Japan
(OECF) - were multi-sectoral poverty reduction
projects with water supplies as one of several public
infrastructure choices. The other two projects - the
Water Supply and Sanitation for Low Income
Communities (WSLIC) Project funded by the World
Bank, and the Asian Development Bank-assisted
Rural Water Supply and Sanitation (RWSS) Project-
offered only water supply and sanitation.
Six teams of four MPA facilitators each assisted
the communities between March and June 2001.
All team leaders had prior experience with the
MPA. Only the community level MPA indicators
were used. Project documents and reports were
reviewed to compare objectives, rules, and
approaches, and some project personnel were
interviewed to clarify how the projects worked in
practice.
The community sample was not completely
representative. It included user communities that
were willing to devote time for assessments of their
water systems, and since that is rarely the case for
non-functioning systems, the sample left out
completely broken down ones. It likely included
the better of the WSLIC, VIP and, in Jambi, the
RWSS water systems. The KDP and OECF-assisted
villages and the RWSS villages from south Sumatra
are the “available” villages in the geographical
area, because there were few water projects from
which to select. Hence, the lessons learned most
likely show the best picture. No tests of statistical
significance were performed for this analysis and
the results do not represent a comparative
evaluation of the projects. The focus of the
exploration was on the variations in project rules
and the outcomes associated with them.
Thirty water systems relied on gravity-flow piped
distribution, six had pumping systems, and four
used simpler technologies such as dug wells,
handpumps, and rainwater collection. The
average number of households per community
was 290 with a range from 83 to 639. WSLIC
systems had been in existence the longest, an
average of five years; KDP systems for the shortest
time, just over two years on average.
Three main positive findings
1. Despite the projects’ lack ofemphasis on sustainability,sustainability was average orbetter.
Only WSLIC had an explicit sustainability objective.
Sustainability was one of five project principles for
KDP. Sustainability in RWSS and VIP was expected
to result from community ownership. Despite this
lack of emphasis, sustainability of the water supply
systems was gratifying. 80 percent, or 32 of the
40 communities achieved a score of at least 200
out of 400, the point below which sustainability is
in doubt, although three of those 32 scored just
on the borderline of sustainability (Figure 10).
2. Active and trained communitywater managementorganizations do better onsustainability, local managementand financing, and expansion ofaccess and convenience.
The strong performance probably reflects growing
capacity and awareness within communities, of
what it takes to achieve sustainability, after many
successive development efforts. Although only the
water sector projects routinely set up management
arrangements, all of the communities in the upper
80 percent had some provision - mostly water
management organizations (WMOs) - to ensure
maintenance and repair over time. If the project
did not help the community establish a WMO,

97
DO PROJECT RULES PROMOTE SUSTAINABILITY AND EQUITY?
Figure 11 How effectively are water services managed?
Figure 10 How effectively are water supply services sustained by the communities?
Community responsibility for repairs
Quality of budgeting
Timeliness of repairs
Transparency in accounting to consumers
Minimum scoreindicating
sustainability
Score400
300
200
100
0Central
Java
VIP
NTB
OECF
South
Sumatra
Jambi Central
Java
Southeast
Sulawesi
East
Java
West
SumatraPossible
Maximum
Score
KDPWSLIC 1RWSS
70
30
60
80
50
38
40
55
1035
45
75
25
90
90
88
54
75
92
94
25
75
75
42
42
50
54
75
44
88
69
100
100
100
100
Minimum scoreindicating
sustainability
Score
400
300
200
100
0
Bant
u La
nteh
/ M
alal
o
Cur
ahw
edi
Paja
r Bu
lan
Pen
imb
ung
/Tun
jan
g P
ola
k
Mua
ra T
iga
Bet
un
g
Pen
ga
rin
ga
n
Haj
ran
Lubu
k N
ipis
Ba
nyu
sid
i
Mal
asan
Wet
an
Sele
ng
an
/Sa
lut
Sela
mp
au
ng
Ma
ng
olo
Kara
ng B
aru/
Jura
ng K
oak
Baye
mha
rjo
Suka
da
na/S
emo
kan
Beta
ra K
anan
Batu
Kal
ang
Tera
tak
Tem
patih
Kam
pung
Bat
u
Ca
ndis
ari
Ulu
Wol
o
Kro
bung
an
Cer
ocok
Sen
an
ing
Kot
obar
u
Ma
ng
gih
an
Pag
erg
edo
g
Ko
ndo
wa
Pulo
harj
o
Cik
emb
ula
n
Pan
gg
an
g
Pucu
ngro
to
Ba
mb
ang
Pani
ngka
ba
n
Sla
mp
are
jo
Poo
ga
lam
pa
Kri
njin
g
Ka
lisem
ut
Poss
ible
Max
imum
Sco
re
System Quality Effective Functioning Effective Financing Effective Management
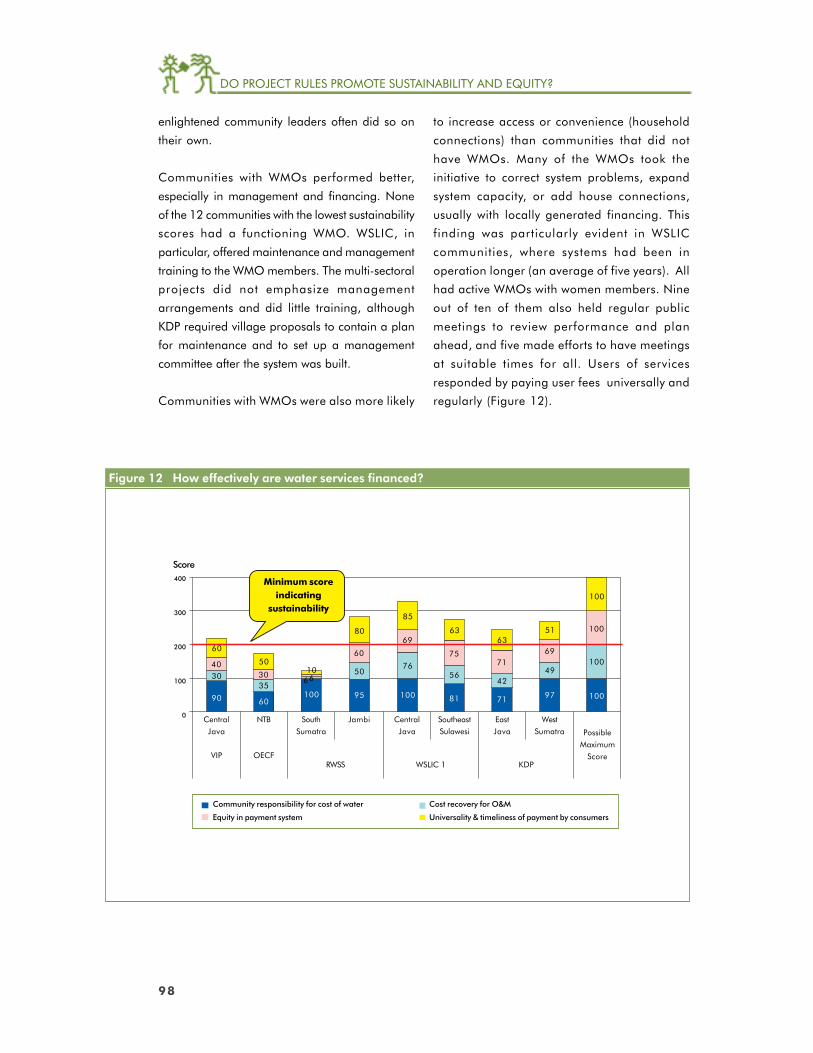
98
DO PROJECT RULES PROMOTE SUSTAINABILITY AND EQUITY?
enlightened community leaders often did so on
their own.
Communities with WMOs performed better,
especially in management and financing. None
of the 12 communities with the lowest sustainability
scores had a functioning WMO. WSLIC, in
particular, offered maintenance and management
training to the WMO members. The multi-sectoral
projects did not emphasize management
arrangements and did little training, although
KDP required village proposals to contain a plan
for maintenance and to set up a management
committee after the system was built.
Communities with WMOs were also more likely
to increase access or convenience (household
connections) than communities that did not
have WMOs. Many of the WMOs took the
initiative to correct system problems, expand
system capacity, or add house connections,
usually with locally generated financing. This
finding was particularly evident in WSLIC
communities, where systems had been in
operation longer (an average of five years). All
had active WMOs with women members. Nine
out of ten of them also held regular public
meetings to review performance and plan
ahead, and five made efforts to have meetings
at suitable times for all. Users of services
responded by paying user fees universally and
regularly (Figure 12).
Figure 12 How effectively are water services financed?
Community responsibility for cost of water
Equity in payment system
Cost recovery for O&M
Universality & timeliness of payment by consumers
Minimum scoreindicating
sustainability
Score400
300
200
100
0 Central
Java
VIP
NTB
OECF
South
Sumatra
Jambi Central
Java
Southeast
Sulawesi
East
Java
West
Sumatra Possible
Maximum
ScoreKDPWSLIC 1RWSS
60
4030
90
50
3035
60
10 6 6
100
80
60
50
95
85
69
76
100
63
75
56
81
63
71
42
71
51
69
49
97
100
100
100
100
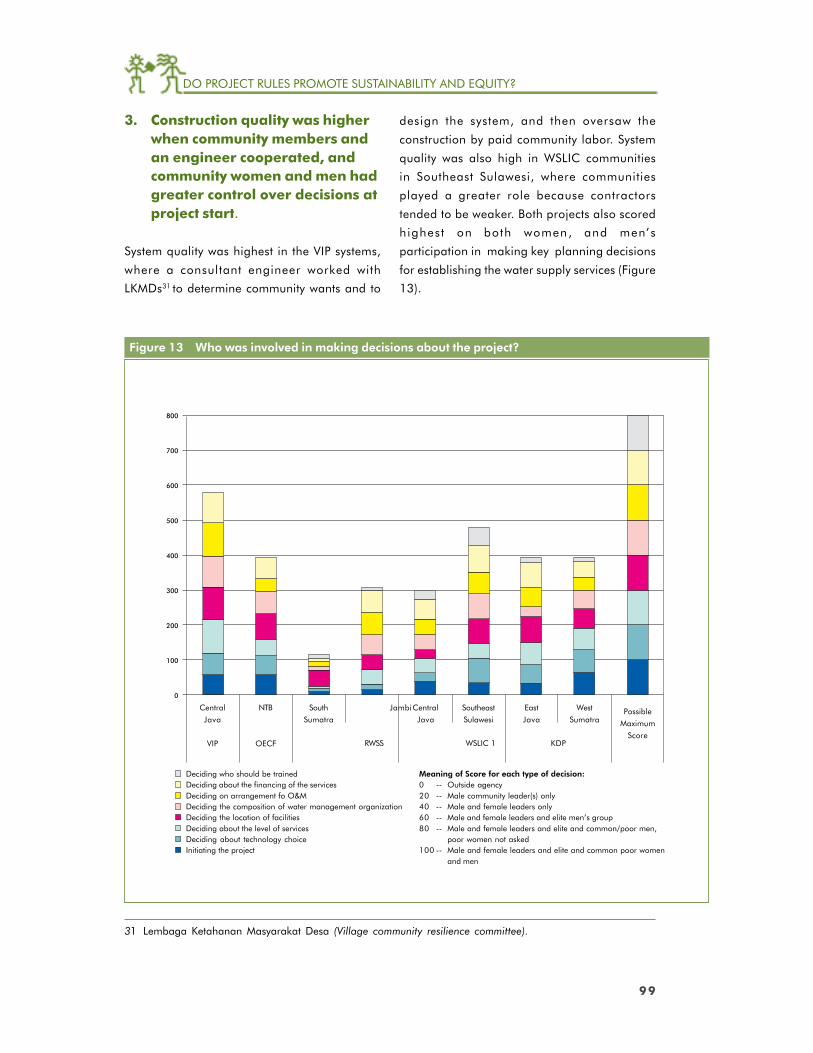
99
DO PROJECT RULES PROMOTE SUSTAINABILITY AND EQUITY?
3. Construction quality was higherwhen community members andan engineer cooperated, andcommunity women and men hadgreater control over decisions atproject start.
System quality was highest in the VIP systems,
where a consultant engineer worked with
LKMDs31 to determine community wants and to
design the system, and then oversaw the
construction by paid community labor. System
quality was also high in WSLIC communities
in Southeast Sulawesi, where communities
played a greater role because contractors
tended to be weaker. Both projects also scored
highest on both women, and men’s
participation in making key planning decisions
for establishing the water supply services (Figure
13).
31 Lembaga Ketahanan Masyarakat Desa (Village community resilience committee).
Figure 13 Who was involved in making decisions about the project?
Central
Java
VIP
NTB
OECF
South
Sumatra
JambiCentral
Java
Southeast
Sulawesi
East
Java
West
SumatraPossible
Maximum
ScoreKDPWSLIC 1RWSS
Deciding who should be trainedDeciding about the financing of the servicesDeciding on arrangement fo O&MDeciding the composition of water management organizationDeciding the location of facilitiesDeciding about the level of servicesDeciding about technology choiceInitiating the project
Meaning of Score for each type of decision:0 -- Outside agency20 -- Male community leader(s) only40 -- Male and female leaders only60 -- Male and female leaders and elite men’s group80 -- Male and female leaders and elite and common/poor men,
poor women not asked100 -- Male and female leaders and elite and common poor women
and men
800
700
600
500
400
300
200
100
0
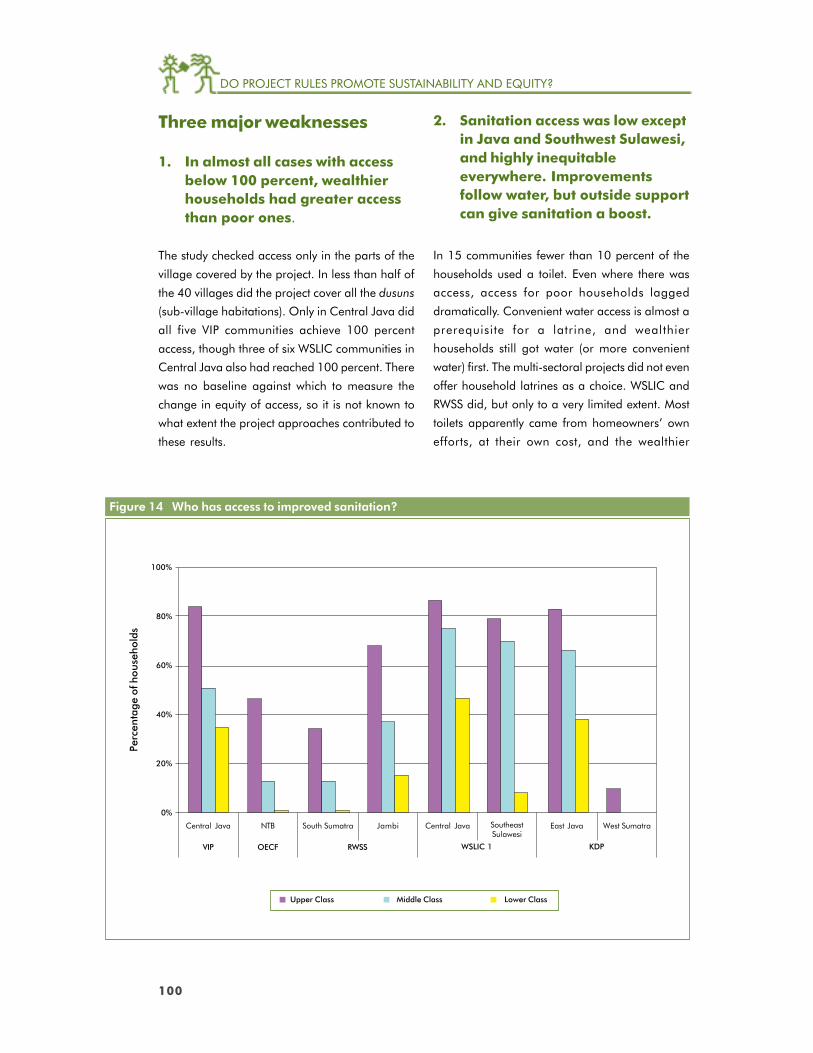
100
DO PROJECT RULES PROMOTE SUSTAINABILITY AND EQUITY?
Three major weaknesses
1. In almost all cases with accessbelow 100 percent, wealthierhouseholds had greater accessthan poor ones.
The study checked access only in the parts of the
village covered by the project. In less than half of
the 40 villages did the project cover all the dusuns
(sub-village habitations). Only in Central Java did
all five VIP communities achieve 100 percent
access, though three of six WSLIC communities in
Central Java also had reached 100 percent. There
was no baseline against which to measure the
change in equity of access, so it is not known to
what extent the project approaches contributed to
these results.
2. Sanitation access was low exceptin Java and Southwest Sulawesi,and highly inequitableeverywhere. Improvementsfollow water, but outside supportcan give sanitation a boost.
In 15 communities fewer than 10 percent of the
households used a toilet. Even where there was
access, access for poor households lagged
dramatically. Convenient water access is almost a
prerequisite for a latrine, and wealthier
households still got water (or more convenient
water) first. The multi-sectoral projects did not even
offer household latrines as a choice. WSLIC and
RWSS did, but only to a very limited extent. Most
toilets apparently came from homeowners’ own
efforts, at their own cost, and the wealthier
Figure 14 Who has access to improved sanitation?
Perc
enta
ge o
f hou
seho
lds
100%
80%
60%
40%
20%
0%
Central Java
VIP
NTB
OECF
South Sumatra Jambi Central Java SoutheastSulawesi
East Java West Sumatra
KDPWSLIC 1RWSS
Upper Class Middle Class Lower Class

101
DO PROJECT RULES PROMOTE SUSTAINABILITY AND EQUITY?
households got adequate sanitation first, or were
the only ones to have it (Figure 14).
Rural Indonesians prefer household pour-flush
latrines and use water for cleansing. Of the 12
communities that had sanitation access over 60
percent, the average water access was 84 percent,
and seven of the twelve had achieved 100 percent
water access. The assessment teams reported that
sanitation “took off” in a number of communities
after house connections came. They also found
that Ministry of Health (MOH) programs led to
vigorous sanitation programs in several villages.
In one, people were trained and groups were set
up with revolving funds to build latrines. In
another, sanitation received special attention when
the village was selected as a MOH model water
supply and sanitation community.
3. Women and poor householdshad little voice and choice indecisions and service control.
None of the projects had sufficiently effective
mechanisms to reach out to women and poor
households. Getting information is an essential
first step if people are to make informed choices
and decisions, but none of the projects did
very well in spreading information beyond the
village elite. VIP’s information dissemination
efforts worked best, followed by WSLIC’s in
South Sulawesi . These two groups of
communities, not surprisingly, also reported a
greater equity in control over decisions about
their water systems. As with information
provision, however, none of the vi l lages
reported that ordinary people were involved in
decision making to any extent (Figure 13).
Five lessons about theprojects for the future
1. Project inputs follow projectobjectives.
Only WSLIC had a clear sustainability objective.
Achieving sustainability in rural water supply and
sanitation requires attention to five aspects:
technical, environmental, financial, institutional
(managerial), and social. Community-managed
systems need a management organization to
ensure longer-term sustainability, particularly one
in which all categories of users, both women and
men, have a voice. Yet, only WSLIC and, to a
lesser extent, the RWSS project sought to establish
water management organizations and build their
capacity to sustain their water systems.
None of the projects had an equity objective.
Few project inputs - mainly in WSLIC and KDP -
were directed towards actions to increase the
chance that women, poor households, groups
in the project villages, and other marginalized
groups would have a voice and choice in their
services.
WSLIC was the only project to involve women
meaningfully in any project-supported activity.
It set out to include women in the WMOs it
established and in the training it offered.
Women and some poor people were brought
into management organizations and have stayed
involved over the years. Women were trained
and continue to use the skills they gained, and
both poor people and women have benefited
from the paid and unpaid jobs created in WSLIC
community-managed systems on Java.
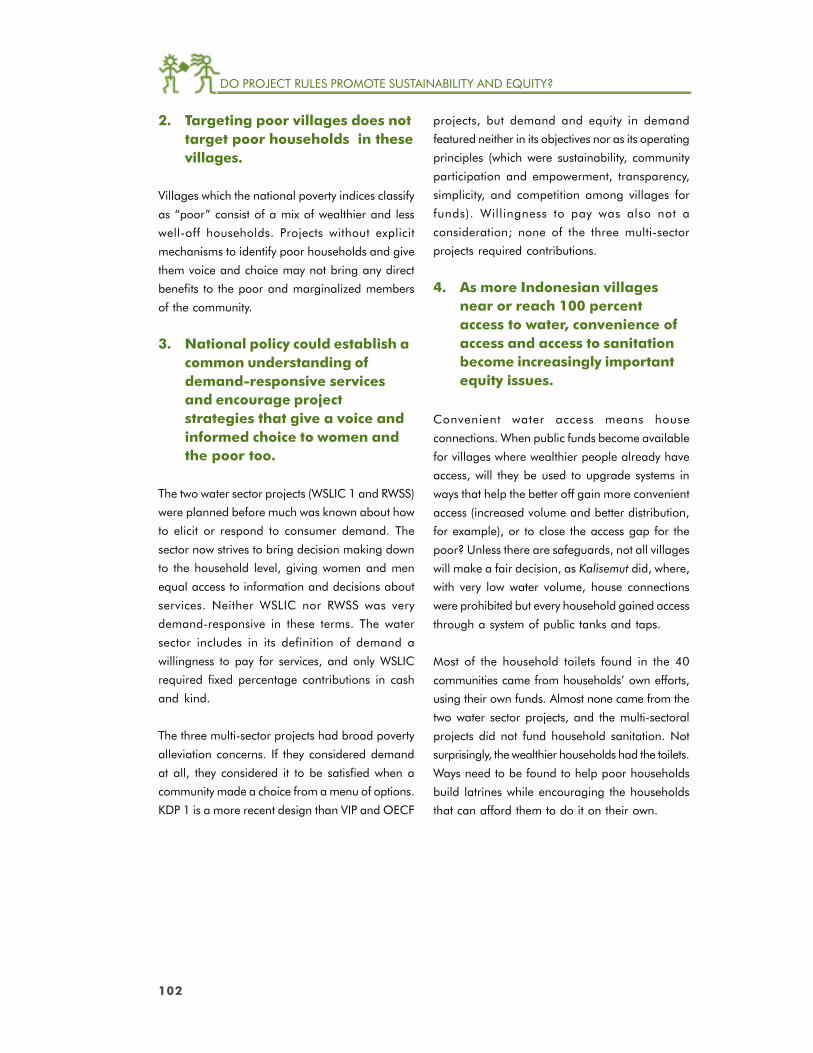
102
DO PROJECT RULES PROMOTE SUSTAINABILITY AND EQUITY?
projects, but demand and equity in demand
featured neither in its objectives nor as its operating
principles (which were sustainability, community
participation and empowerment, transparency,
simplicity, and competition among villages for
funds). Willingness to pay was also not a
consideration; none of the three multi-sector
projects required contributions.
4. As more Indonesian villagesnear or reach 100 percentaccess to water, convenience ofaccess and access to sanitationbecome increasingly importantequity issues.
Convenient water access means house
connections. When public funds become available
for villages where wealthier people already have
access, will they be used to upgrade systems in
ways that help the better off gain more convenient
access (increased volume and better distribution,
for example), or to close the access gap for the
poor? Unless there are safeguards, not all villages
will make a fair decision, as Kalisemut did, where,
with very low water volume, house connections
were prohibited but every household gained access
through a system of public tanks and taps.
Most of the household toilets found in the 40
communities came from households’ own efforts,
using their own funds. Almost none came from the
two water sector projects, and the multi-sectoral
projects did not fund household sanitation. Not
surprisingly, the wealthier households had the toilets.
Ways need to be found to help poor households
build latrines while encouraging the households
that can afford them to do it on their own.
2. Targeting poor villages does nottarget poor households in thesevillages.
Villages which the national poverty indices classify
as “poor” consist of a mix of wealthier and less
well-off households. Projects without explicit
mechanisms to identify poor households and give
them voice and choice may not bring any direct
benefits to the poor and marginalized members
of the community.
3. National policy could establish acommon understanding ofdemand-responsive servicesand encourage projectstrategies that give a voice andinformed choice to women andthe poor too.
The two water sector projects (WSLIC 1 and RWSS)
were planned before much was known about how
to elicit or respond to consumer demand. The
sector now strives to bring decision making down
to the household level, giving women and men
equal access to information and decisions about
services. Neither WSLIC nor RWSS was very
demand-responsive in these terms. The water
sector includes in its definition of demand a
willingness to pay for services, and only WSLIC
required fixed percentage contributions in cash
and kind.
The three multi-sector projects had broad poverty
alleviation concerns. If they considered demand
at all, they considered it to be satisfied when a
community made a choice from a menu of options.
KDP 1 is a more recent design than VIP and OECF
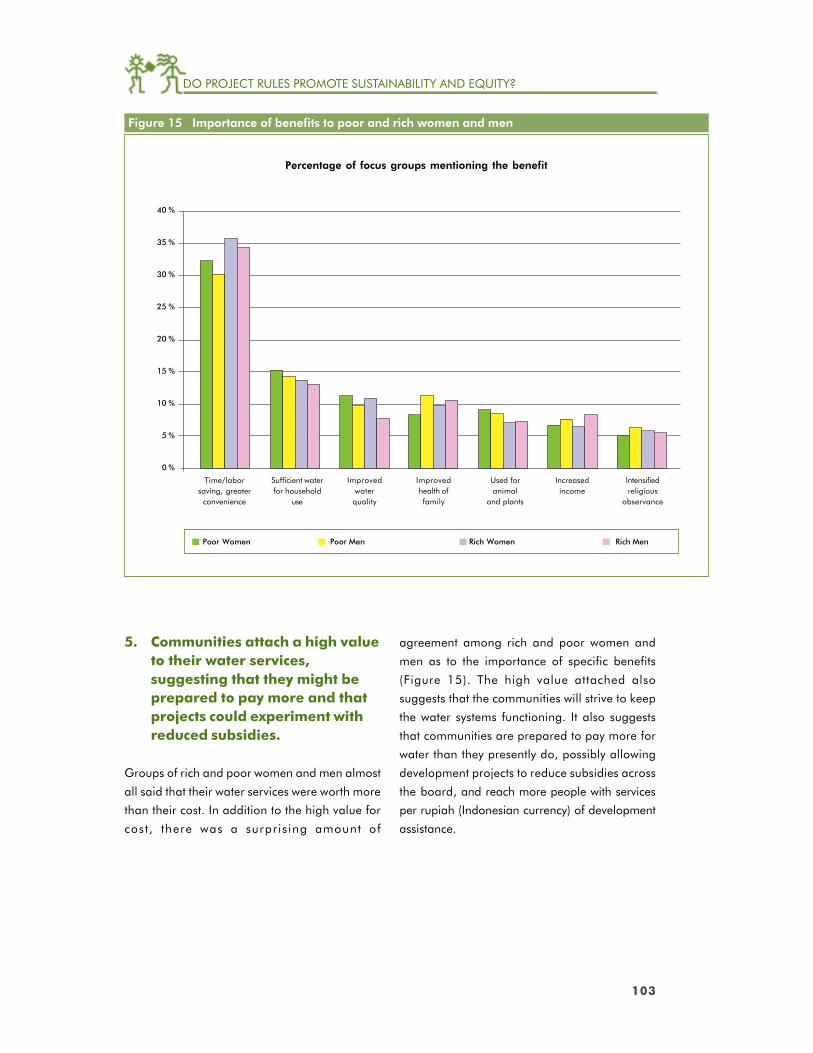
103
DO PROJECT RULES PROMOTE SUSTAINABILITY AND EQUITY?
Figure 15 Importance of benefits to poor and rich women and men
5. Communities attach a high valueto their water services,suggesting that they might beprepared to pay more and thatprojects could experiment withreduced subsidies.
Groups of rich and poor women and men almost
all said that their water services were worth more
than their cost. In addition to the high value for
cost, there was a surpris ing amount of
agreement among rich and poor women and
men as to the importance of specific benefits
(Figure 15). The high value attached also
suggests that the communities will strive to keep
the water systems functioning. It also suggests
that communities are prepared to pay more for
water than they presently do, possibly allowing
development projects to reduce subsidies across
the board, and reach more people with services
per rupiah (Indonesian currency) of development
assistance.
Percentage of focus groups mentioning the benefit
40 %
35 %
30 %
25 %
20 %
15 %
10 %
5 %
0 %
Time/laborsaving, greater
convenience
Poor Women
Sufficient waterfor household
use
Improvedwaterquality
Improvedhealth offamily
Used foranimal
and plants
Increasedincome
Intensifiedreligious
observance
Poor Men Rich Women Rich Men

104
FROM THEORY TO PRACTICE
From Theory to PracticeA study of rural water supply and sanitaion strategy implementation:PADEAR32 in Benin
Suzanne Reiff33
32 Projet d’Assistance au Développement du secteur d’alimentation en Eau potable et de l’Assainissement en
milieu Rural.
33 Suzanne Reiff, Gender and Environmental Health Specialist, WSP - Africa.
Background
In 1994, the Direction of Hydraulics in Benin,
with the support of the Water and Sanitation
Program (WSP), developed a rural water supply
and sanitation strategy which consisted of
implementing a demand-responsive approach
based on the principles of community
participation and decision making. The strategy
enabled communities to participate in the project
once the required community
contribution (approximately 5 percent of
investment costs) was collected and
deposited in a bank account. The
communities (including both men and
women) were enabled to choose their
technological option (improved well,
hand pump, and piped water systems)
with full knowledge of the recurrent costs
and maintenance for which they were
responsible. Community management
committees were set up by the
communities themselves and were
responsible for the management of the system
as well as small repairs, which were to be
financed from the sale of water. This strategy was
tested in two regions (Zou and Atlantique) during
a pilot project co-financed by IDA (International
Development Association) and DANIDA (Danish
International Development Agency). Soon after the
implementation of this project, GTZ (German
Agency for Technical Cooperation) and KFW
decided to follow suit and supported PADEAR
projects in two other regions of Benin. In 1999,
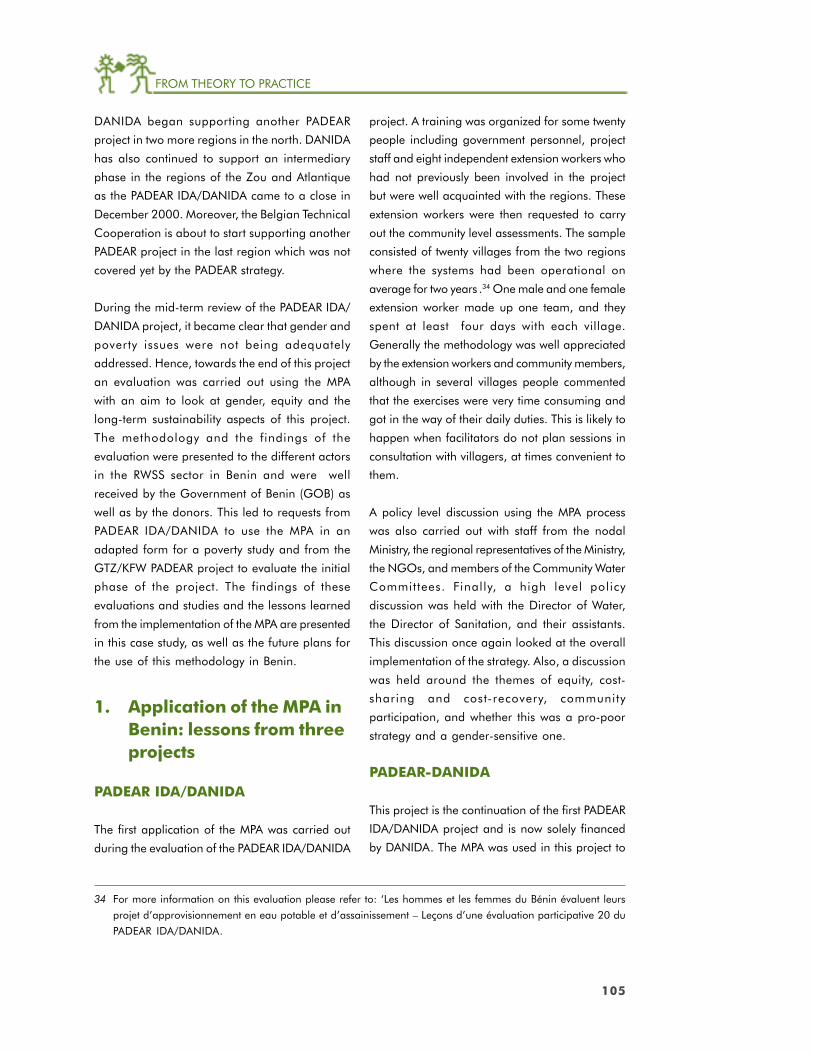
105
FROM THEORY TO PRACTICE
DANIDA began supporting another PADEAR
project in two more regions in the north. DANIDA
has also continued to support an intermediary
phase in the regions of the Zou and Atlantique
as the PADEAR IDA/DANIDA came to a close in
December 2000. Moreover, the Belgian Technical
Cooperation is about to start supporting another
PADEAR project in the last region which was not
covered yet by the PADEAR strategy.
During the mid-term review of the PADEAR IDA/
DANIDA project, it became clear that gender and
poverty issues were not being adequately
addressed. Hence, towards the end of this project
an evaluation was carried out using the MPA
with an aim to look at gender, equity and the
long-term sustainability aspects of this project.
The methodology and the findings of the
evaluation were presented to the different actors
in the RWSS sector in Benin and were well
received by the Government of Benin (GOB) as
well as by the donors. This led to requests from
PADEAR IDA/DANIDA to use the MPA in an
adapted form for a poverty study and from the
GTZ/KFW PADEAR project to evaluate the initial
phase of the project. The findings of these
evaluations and studies and the lessons learned
from the implementation of the MPA are presented
in this case study, as well as the future plans for
the use of this methodology in Benin.
1. Application of the MPA inBenin: lessons from threeprojects
PADEAR IDA/DANIDA
The first application of the MPA was carried out
during the evaluation of the PADEAR IDA/DANIDA
project. A training was organized for some twenty
people including government personnel, project
staff and eight independent extension workers who
had not previously been involved in the project
but were well acquainted with the regions. These
extension workers were then requested to carry
out the community level assessments. The sample
consisted of twenty villages from the two regions
where the systems had been operational on
average for two years .34 One male and one female
extension worker made up one team, and they
spent at least four days with each village.
Generally the methodology was well appreciated
by the extension workers and community members,
although in several villages people commented
that the exercises were very time consuming and
got in the way of their daily duties. This is likely to
happen when facilitators do not plan sessions in
consultation with villagers, at times convenient to
them.
A policy level discussion using the MPA process
was also carried out with staff from the nodal
Ministry, the regional representatives of the Ministry,
the NGOs, and members of the Community Water
Committees. Finally, a high level policy
discussion was held with the Director of Water,
the Director of Sanitation, and their assistants.
This discussion once again looked at the overall
implementation of the strategy. Also, a discussion
was held around the themes of equity, cost-
sharing and cost-recovery, community
participation, and whether this was a pro-poor
strategy and a gender-sensitive one.
PADEAR-DANIDA
This project is the continuation of the first PADEAR
IDA/DANIDA project and is now solely financed
by DANIDA. The MPA was used in this project to
34 For more information on this evaluation please refer to: ‘Les hommes et les femmes du Bénin évaluent leurs
projet d’approvisionnement en eau potable et d’assainissement – Leçons d’une évaluation participative 20 du
PADEAR IDA/DANIDA.
106
FROM THEORY TO PRACTICE
carry out a study on poverty zones in Benin. The
assumption underlying this study was that
applying the PADEAR strategy (which required a
financial contribution from the community within
a fixed time) may end up excluding some of the
poorer communities. It was indeed noticed in the
first PADEAR project that certain communities could
not get the total amount of their contributions
together on time. The question was: what other
mechanisms and principles could the PADEAR test
to assure that poor villages would not be excluded
from participating in RWSS projects?
The study (using selected MPA tools and MPA
trained extension workers for poverty profiling) was
carried out in 14 villages and a “poverty profile”
was developed for each village. The next step was
for several new approaches to be tested in the
three poorest villages to see what principles in the
PADEAR strategy needed to be made more flexible,
to insure that the poorest villages are not excluded
from the PADEAR. The approaches looked at
different mechanisms to mobilize community
contributions and also applied different
approaches to social intermediation.
PADEAR-GTZ/KFW
This is the second project that is testing the PADEAR
strategy. An evaluation of this project was carried
out by the same team of extension workers using
selected MPA tools at community level. The sample
for this evaluation was quite small (six villages),
and the systems had been working for one year
on average. Some interesting results and
differences were seen when compared with the
first PADEAR project.
Figure 16 Who had voice and choice in WSS project implementation, as perceived by women and men
in the community
Community women and men Chief and power elite Chief alone Project staff
100%
90%
80%
70%
60%
50%
40%
30%
20%
10%
0%
Who tookthe initiative
Access toInformation
Technologychoice
Decision onlevel
of service
Decision onlocation of the
waterpoint
Decision onmake-up ofcommittee
Decision onO & M
Decision onfinancing of
service
Decision onwho should be
trained
1
2
3
14
3
4
13
1
3
16
3
2
3
16
5
2
10
3
9
4
7
12
8
2
2
3
13
13
7
Perc
enta
ge o
f dec
isio
ns
107
FROM THEORY TO PRACTICE
● Progress in book keeping and budgeting was
clear from the assessments. Financial
management was particularly good in the
GTZ/KFW project, where financial tools were
used in the management of the systems.
Community management remainselite-dominated, and gender rolesin management remainstereotypical
● Gender and poverty issues presented some
interesting results for the IDA/DANIDA project.
In all the 20 villages the position of the
president was held by well-off men and the
persons responsible for hygiene were always
women (both poor and wealthier).
● Access to training showed the same gender
inequity. Men got almost all the training.
Women received very little training and never
on aspects of decision making or control of
finances. With regards to gender aspects, the
GTZ/KFW project attempted to be more
gender-sensitive by putting in place rules for
more women gaining access to different types
of training. Nevertheless the key positions in
the committees assessed were still held by men.
It was clear however that women in these
communities had more knowledge about the
management issues of the water system in
general and we may hope that when women
gain a more equal position with men on
management structures, this will lead to
greater sustainability in the long run.
Communities recognize and dealwith ”equity” problems in theirmidst, but within the householdwomen pay most of the cost of water
● In all projects, the proportions of wealthier
versus poorer was approximately the same in
all the villages with on average 15-20 percent
2. Key findings from thethree studies
Communities had voice and choicein only some areas of projectdecisions
● Community voice was strong in the first steps
of the development of the projects such as
project initiation, levels of service, and how
the system was to be financed. The projects
had also tended to give information about
these choices to both women and men. In these
respects the projects had been quite demand-
responsive (Figure 16).
● However, the community’s voice waned when
decisions were to be made concerning roles
and responsibilities in the water management
committee and training for operation and
maintenance. Project staff made most of the
decisions regarding who would get trained for
what. This was apparent especially in the pilot
project and to a certain extent, is still the case
in the GTZ/KFW project communities,
although generally they fared better in terms
of roles of men and women in water
management committees. The domination of
the power elite was clearly visible in deciding
the location for water facilities.
Capacity building for communitymanagement is bearing fruit
● Progress on this was seen from one PADEAR
project (IDA/DANIDA) to the next (GTZ/KFW).
Water management committees were present
in all the villages participating in the project
and were trained in technical aspects,
construction, small repairs, general
management and leadership and hygiene. The
second project put an additional emphasis on
training in financial management for money
made from the water sales.
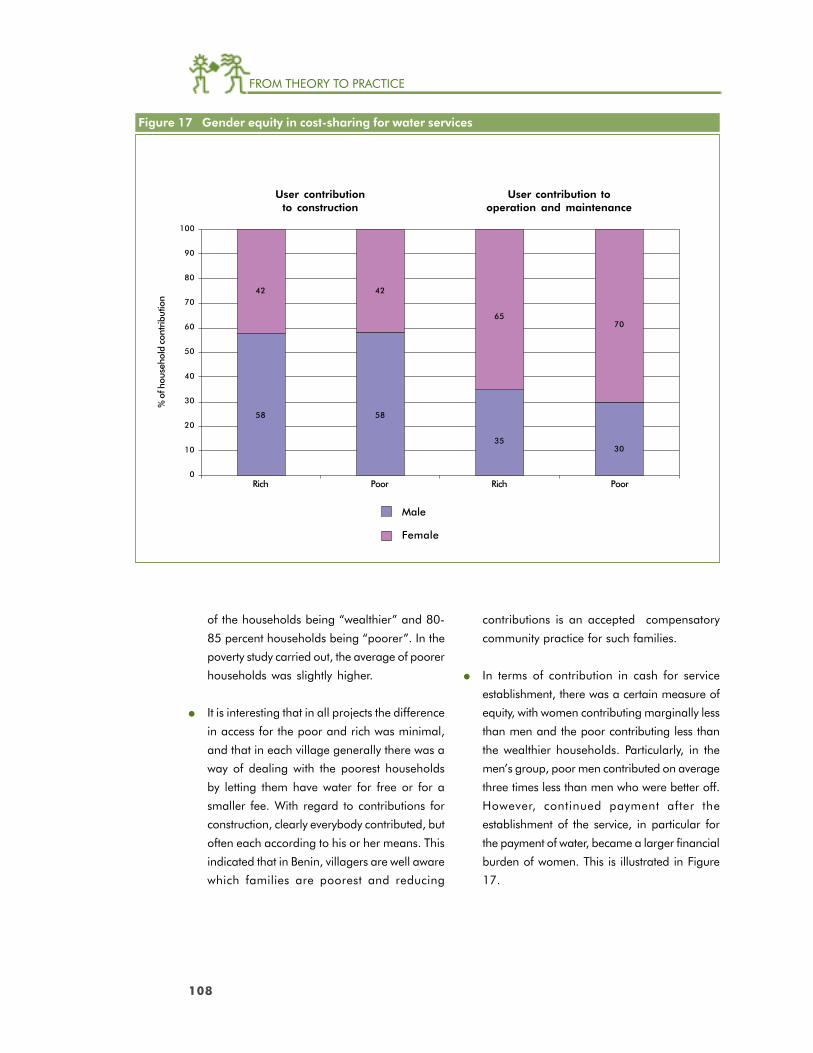
108
FROM THEORY TO PRACTICE
of the households being “wealthier” and 80-
85 percent households being “poorer”. In the
poverty study carried out, the average of poorer
households was slightly higher.
● It is interesting that in all projects the difference
in access for the poor and rich was minimal,
and that in each village generally there was a
way of dealing with the poorest households
by letting them have water for free or for a
smaller fee. With regard to contributions for
construction, clearly everybody contributed, but
often each according to his or her means. This
indicated that in Benin, villagers are well aware
which families are poorest and reducing
contributions is an accepted compensatory
community practice for such families.
● In terms of contribution in cash for service
establishment, there was a certain measure of
equity, with women contributing marginally less
than men and the poor contributing less than
the wealthier households. Particularly, in the
men’s group, poor men contributed on average
three times less than men who were better off.
However, continued payment after the
establishment of the service, in particular for
the payment of water, became a larger financial
burden of women. This is illustrated in Figure
17.
User contributions to constuctionFigure 17 Gender equity in cost-sharing for water services
100
90
80
70
60
50
40
30
20
10
0
% o
f hou
seho
ld c
ontr
ibut
ion
Male
Female
Rich Poor Rich Poor
42
58
42
58
65
35
70
30
User contributionto construction
User contribution tooperation and maintenance
109
FROM THEORY TO PRACTICE
35 Only 2 percent of this population gained access to a latrine. Of these 2 percent (48 households), 92 percent
(44 households) were from the better off class.
Reality of enmeshed gender andpoverty issues
● From the studies in Benin, it became clear
that most villages already deal effectively with
socio-economic variations between
households by adjusting contributions to
differential payment capacities. In contrast,
the gender gap remains large and is currently
the most important problem. One urgent point
for policy action that came out of the poverty
profile is that the poorest villages are also
those that have the highest proportion of
female-headed households. In some villages,
more that 75 percent of households are
female-headed.
Changing hygiene behavior takesmore than hygiene promotion
● The sanitation and hygiene component did
poorly in these projects. Construction rate of
latrines was very low and little behavior
change was observed. The strategy for the
sanitation component was to train local
masons in the building and promotion of
low-cost sanitation technology, and to put the
emphasis on hygiene and sanitation
promotion in order to foster demand rather
than offering subsidies for household latrines,
which has proved to be unsustainable. Even
though the PADEAR GTZ/KFW did put more
of an accent on hygiene by having a specific
group of people in each village being
responsible for carrying out door-to-door
hygiene promotion, little change was seen.
The hygiene promotion method was not well
developed and not targeted which led to
communities getting bored with the same
messages being repeated by the field project
staff.
● The sanitation component did poorly and the
latrine construction was clearly low in the 20
villages.35 This was mainly due to the low
priority the sanitation component was given
for the first year of the project. Also, more
efforts will have to be put into training
masons, in carrying out the marketing for
latrines, and allowing for households to pay
for their latrines in installments. It may be
possible to experiment with training women
latrine masons, which has been successful in
raising demand in other countries.
The PADEAR strategy succeeded tosome extent in promoting communityvoice and choice, communitymanagement capacity, and socialequity in project benefit-sharing
● In general, the strategy was successful in
providing the communities with a voice, and
to a lesser extent a choice, in the outcome of
their WSS projects. It is also clear from the
results that certain areas of the strategy were
less sensitive to the demand-responsive
approach than was expected. In many cases,
project staff made the choice as to who would
get trained in the water committee, and when
and how feedback to the community would
be given. Within communities, the village chief
and the male elite still dominate decisions on
the location of facilities.
110
FROM THEORY TO PRACTICE
● Regarding poverty issues, it appeared that
equity was quite good in all the projects in
terms of access and in financial matters. But
this may be more due to Benin’s cultural
traditions of helping neighbors than the
strategy’s principles.
● The PADEAR strategy enabled communities to
get water supply services that they wanted and
were willing to pay for and maintain. To a
certain extent, mechanisms were put in place
and tools developed for the water committees
to be able to manage their systems adequately.
The PADEAR strategy needs toimprove its gender-sensitivity andsanitation promotion approach
● It was clear that the gender-sensitivity of the
strategy was weak. It became stronger as the
project staff received training in gender issues
toward the end of the pilot project as well as
in the GTZ/KFW supported project.
● It is clear that the PADEAR strategy still needs
to improve its approach to sanitation and
hygiene. There is a strong belief that the
subsidy-free policy for sanitation is the way
forward for rural sanitation in Benin. Indeed
the problem is not so much the price of the
latrines, since they range from traditional type
latrines to VIP (Ventilated Improved Pit) latrines,
and thus there is a range of prices available.
In a study on the willingness to pay for
latrines,36 traditional latrines were considered
affordable to large segments of the
communities interviewed. The challenge that
PADEAR faces is generating demand for
latrines. Much progress can be made by
learning what motives women and men in the
different groups have for wanting to install and
use latrines, and tailor messages accordingly.
The problem is much the same with hygiene
promotion, where the methods used were not
adapted to the rural situation and the different
roles and responsibilities of women and men.
3. Plans for the future
The ongoing implementation of the PADEAR
projects as well as the results of the MPA evaluations
and others have yielded many lessons for the
continuation and adaptation of the strategy. The
Government of Benin and other stakeholders have
agreed that the PADEAR strategy is ready for
further refinement. The lessons learnt from the MPA
evaluations, especially concerning gender issues,
demand-responsiveness, sanitation and hygiene,
will be taken into account when reviewing and
updating the strategy.
Particular focus will be put on giving all project
staff (not only central level staff) training to look at
gender and poverty issues in a cross-cutting way
as well as providing improved hygiene promotion
methods and tools.
The strategy will also review how it can increasingly
put the community’s women and men at the
forefront on decisions regarding the establishment
and the management of their WSS services.
Regarding the continued use of the MPA in Benin
discussions are underway for the extension workers
in the PADEAR projects to be trained in using the
MPA tools for monitoring purposes. This
monitoring would be incorporated into their
regular social intermediation program in the
villages and would not require additional
resources.
36 Strassler, Dossou et Kinsiklounon, ‘La volonté de payer dans le domaine de l’eau et de l’assainissement-
Une expérience au Bénin’, Helvetas - Bénin, Avril 2000.
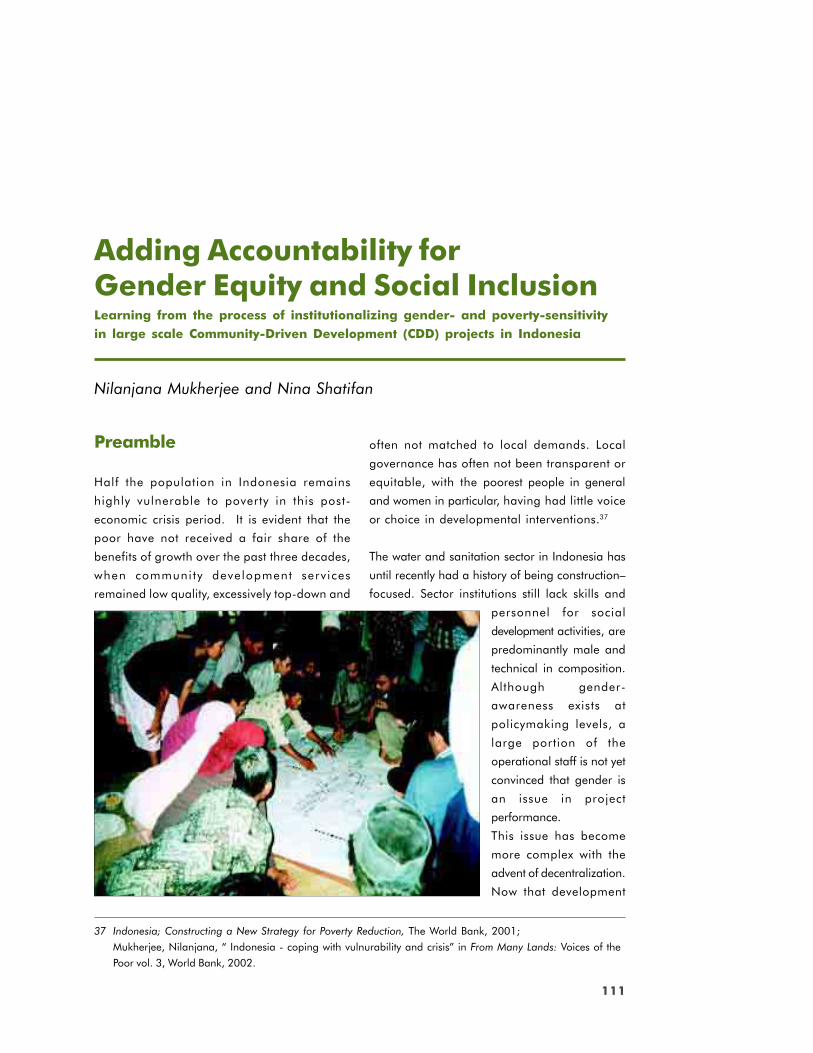
111
FROM THEORY TO PRACTICE
Preamble
Half the population in Indonesia remains
highly vulnerable to poverty in this post-
economic crisis period. It is evident that the
poor have not received a fair share of the
benefits of growth over the past three decades,
when communi ty development serv ices
remained low quality, excessively top-down and
Adding Accountability forGender Equity and Social InclusionLearning from the process of institutionalizing gender- and poverty-sensitivityin large scale Community-Driven Development (CDD) projects in Indonesia
Nilanjana Mukherjee and Nina Shatifan
often not matched to local demands. Local
governance has often not been transparent or
equitable, with the poorest people in general
and women in particular, having had little voice
or choice in developmental interventions.37
The water and sanitation sector in Indonesia has
until recently had a history of being construction–
focused. Sector institutions still lack skills and
personnel for social
development activities, are
predominantly male and
technical in composition.
Although gender-
awareness exists at
policymaking levels, a
large portion of the
operational staff is not yet
convinced that gender is
an issue in project
performance.
This issue has become
more complex with the
advent of decentralization.
Now that development
37 Indonesia; Constructing a New Strategy for Poverty Reduction, The World Bank, 2001;
Mukherjee, Nilanjana, “ Indonesia - coping with vulnurability and crisis” in From Many Lands: Voices of the
Poor vol. 3, World Bank, 2002.
112
ADDING ACCOUNTABILITY FOR GENDER EQUITY AND SOCIAL INCLUSION
projects have become the responsibility of multiple
stakeholders at national, provincial and district
levels, issues of capacity now extend from
policymaking to administration at sub-national
levels and communities.
Participatory evaluations have shown that past
water supply and sanitation interventions
supported by aid agencies in Indonesia have often
done poorly in terms of ensuring equity of access
for the poor or women in the community, to
empowering interventions. Moreover, community
water supply systems that have been evaluated
tended to have fairly adequate technical quality,
but community management and financing of their
operation and maintenance were often
inadequate, putting longer-term sustainability at
risk.38 At the same time, empirical evidence from
a worldwide study has shown the sustainability of
water-sanitation services to have positive
relationships with gender and social equity in
community empowerment.39
1.1. Gender and povertymainstreaming in two newprojects
Two projects starting in Indonesia in 2001 offered
ideal opportunities to build on the knowledge
gained to date, by addressing social and gender
equity and sustainability concerns in infrastructure
investments in concretely verifiable ways, and
building those mechanisms into local governance
structures and systems. To this end, a GENFUND
grant was used by WSP-EAP during 2001-02 to
support gender- and poverty-mainstreaming in two
World Bank supported infrastructure development
projects. This paper explains what interventions
were made and what was learned in the process
of institutionalizing them. Whether or not the MPA-
based interventions make a difference to project
outcomes will be monitored periodically during
2003-05 and evaluated near the end of projects
in 2006-07.
The second Kecamatan Development Program
(KDP 2, a multi-sector intervention) and the second
Water and Sanitation for Low Income Communities
Project (WSLIC 2, a health sector project) both aim
to improve basic infrastructure in poor villages
simultaneously with community empowerment and
improvement of local governance, using a
community demand-driven approach. WSLIC 2
plans to reach at least two million people in 2000
villages of seven provinces between 2001 -2008
while KDP 2 will use a similar approach to reach
an estimated 20-30 million people in twenty
provinces in four and a half years starting in 2002.
Together they constitute nearly $530 million in
credit and grant funds, although water and
sanitation will likely comprise only a part of the
KDP 2 project, the actual outlay being determined
by community demand.
The objectives of this gender and poverty
mainstreaming initiative were:
1. Developing and testing the use of verifiable
indicators and tools for gender equity and
social inclusion (poverty-targeting) within
communities in the community level planning
process for the multi sectoral Second
Kecamatan Development Program (KDP 2);
and
2. Developing and operationalizing a gender-
38 Reports available from www.wsp.org of WSP-EAP’s evaluation of community-based components of UNICEF
Indonesia’s WES programme (Local Voices Heard), West Nusa Tenggara ESWS Project and Flores WSS
projects supported by AusAID, RWSS project supported by ADB, (1997-99).
39 Linking Sustainability with Demand, Gender and Poverty: A Study in Community-Managed Water Supply
Projects in 15 Countries; Gross, B., van Wijk, C. and Mukherjee, N. Water and Sanitation Program and IRC
International Water and Sanitation Centre, (2001).
113
ADDING ACCOUNTABILITY FOR GENDER EQUITY AND SOCIAL INCLUSION
and poverty-sensitive community action plan
preparation process for water supply and/or
sanitation interventions, in the Second Water
and Sanitation for Low Income Communities
(WSLIC 2) Project, and also for these
interventions through social fund type projects.40
The Methodology for Participatory Assessments
(MPA) was the principal instrument for analysis
and intervention used in both projects. Selected
qualitative tools from two other participatory
methodologies, PRA and PHAST41 were used to
complement MPA in both cases.
2. Entry points andinterventions made inKDP 2
Government of Indonesia’s Kecamatan
Development Program supported by the World
Bank aims at reducing rural poverty and
improving local governance. KDP provides block
grants directly to sub-districts (Kecamatans), out
of which funds are made available to villages on
the basis of proposals presented and defended
by village teams at a sub-district level community
decision making forum. Program rules specify
ceilings for funds available to each village, the
kinds of activities that may be funded, and require
that if a village submits more than one proposal,
one must come from women’s groups. KDP
objectives emphasize community participation -
especially that of women and poor villagers-
transparent decision making, competition among
villages for funds, and sustainability of project
investments. In view of the multi-dimensional
gender mainstreaming actions already under way
in KDP 2, the WSP-EAP chose to focus strategically
on one piece of the whole picture, i.e., improving
the gender-poverty-sensitivity of village level
decision making processes for: a) village proposal
preparation, and subsequently, b) the final
selection of proposals to be funded by KDP 2, at
the sub-district level.
It was agreed with the project management team
that this would require a holistic approach, in
which:
a) capacity building for community facilitators
would be integrated with a gender- and
poverty-inclusive and empowering community
level planning process, and
b) the extent of empowerment and poverty/
gender-sensitivity of that process would be
verifiable and be monitored by the program
(KDP 2).
a. Providing a process and tools forinclusion and empowerment
A structure of activities was designed for the
community level process that will formulate activity
proposals for funding.
Table 1 summarizes the tools introduced and their
purposes (for details on MPA tools see Chapter 6
of this book), and Figure 18 illustrates how they
fit in the KDP 2 activity cycle.
b. Incorporating the process/ toolsfor inclusion and empowermentinto facilitator training
A training program to equip sub-district and
village-level facilitators to use these tools with
communities was piloted in one province. At the
40 In both cases, the objectives are pursued by working with KDP 2 and WSLIC 2 project implementing agencies
and drawing on project budgets for stakeholder involvement, training, and piloting of activities.
41 PRA - Participatory Rural Appraisal, and PHAST - Participatory Hygiene and Sanitation Transformation.
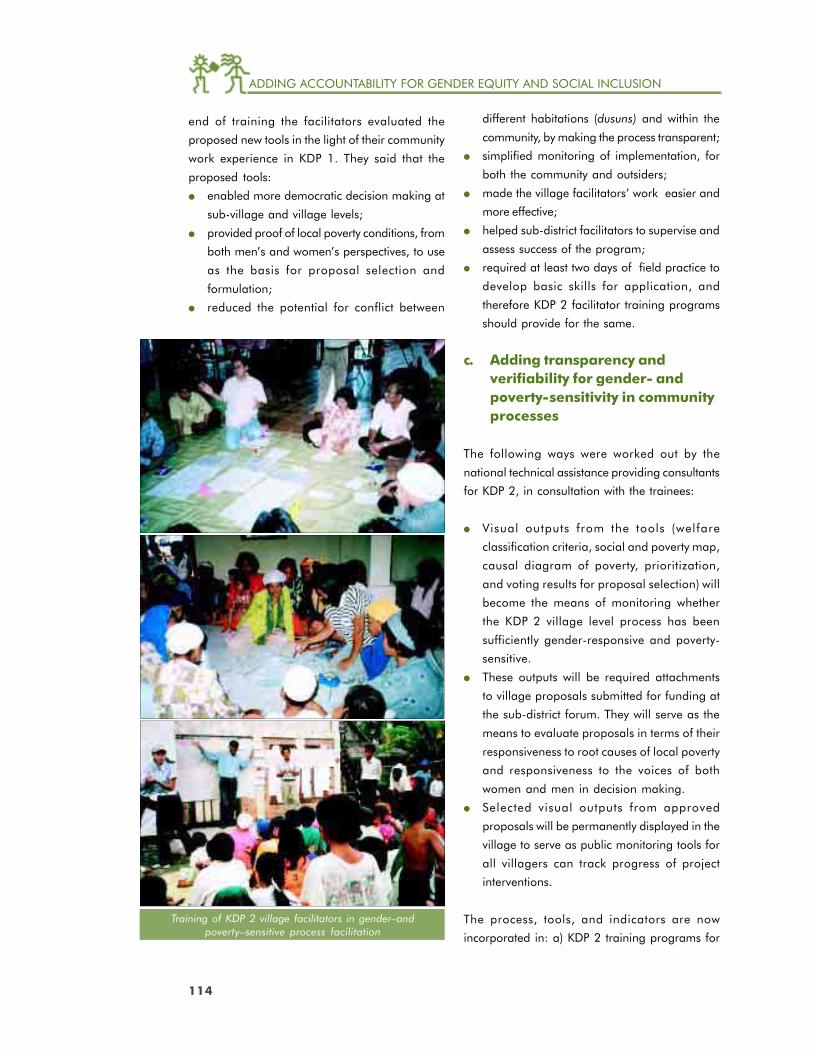
114
ADDING ACCOUNTABILITY FOR GENDER EQUITY AND SOCIAL INCLUSION
end of training the facilitators evaluated the
proposed new tools in the light of their community
work experience in KDP 1. They said that the
proposed tools:
● enabled more democratic decision making at
sub-village and village levels;
● provided proof of local poverty conditions, from
both men’s and women’s perspectives, to use
as the basis for proposal selection and
formulation;
● reduced the potential for conflict between
different habitations (dusuns) and within the
community, by making the process transparent;
● simplified monitoring of implementation, for
both the community and outsiders;
● made the village facilitators’ work easier and
more effective;
● helped sub-district facilitators to supervise and
assess success of the program;
● required at least two days of field practice to
develop basic skills for application, and
therefore KDP 2 facilitator training programs
should provide for the same.
c. Adding transparency andverifiability for gender- andpoverty-sensitivity in communityprocesses
The following ways were worked out by the
national technical assistance providing consultants
for KDP 2, in consultation with the trainees:
● Visual outputs from the tools (welfare
classification criteria, social and poverty map,
causal diagram of poverty, prioritization,
and voting results for proposal selection) will
become the means of monitoring whether
the KDP 2 village level process has been
sufficiently gender-responsive and poverty-
sensitive.
● These outputs will be required attachments
to village proposals submitted for funding at
the sub-district forum. They will serve as the
means to evaluate proposals in terms of their
responsiveness to root causes of local poverty
and responsiveness to the voices of both
women and men in decision making.
● Selected visual outputs from approved
proposals will be permanently displayed in the
village to serve as public monitoring tools for
all villagers can track progress of project
interventions.
The process, tools, and indicators are now
incorporated in: a) KDP 2 training programs for
Training of KDP 2 village facilitators in gender–andpoverty–sensitive process facilitation

115
ADDING ACCOUNTABILITY FOR GENDER EQUITY AND SOCIAL INCLUSION
TTTTTool andool andool andool andool andPurposePurposePurposePurposePurpose How does it help gender-poverty mainstreaming?How does it help gender-poverty mainstreaming?How does it help gender-poverty mainstreaming?How does it help gender-poverty mainstreaming?How does it help gender-poverty mainstreaming?
target grouptarget grouptarget grouptarget grouptarget group
1. W1. W1. W1. W1. Welfareelfareelfareelfareelfare To identify the local poor. Allows community members to discuss the basis Classification Classification Classification Classification Classification for socio-economic segmentation in their
To establish a baseline community and agree on criteria for differentiation.With poor poverty profile of the village.and wealthier Gives voice to a broader range of people.men and To ensure that the lowestwomen, during socio-economic sub-groups Allows for the economically weakest to besub-village are targeted for identified by local consensus.meetings participation.
2. Social2. Social2. Social2. Social2. Social To map out socio-economic Community has control of the process. Mapping Mapping Mapping Mapping Mapping distribution of the community
and current service provision. Increases community confidence in their capacity toWith poor and analyze their own situation and plan for improvements.wealthier men To assess equity in currentand women, access to and usage of Adds transparency to plans. Enables communityduring dusun available services. members to monitor the impact of the program on themeetings poor and non-poor sections of their population.
To check for improved accessof the poor while planningfuture infrastructureimprovements.
3. Selecting3. Selecting3. Selecting3. Selecting3. Selecting To elicit ideas for desired Individual members match their preferences against activity ideas activity ideas activity ideas activity ideas activity ideas improvements and identify community needs in an open and transparent manner for proposal for proposal for proposal for proposal for proposal potential benefits for different that promotes equity in decision making. formulation formulation formulation formulation formulation socio-economic groups,
drawing on information Enables collective evaluation of the effectiveness ofWith poor and provided through social suggested activities for poverty reduction, and theirwealthier men and mapping. potential sustainability.women, duringdusun and village To publicly evaluate ideas Prevents elite-domination of decision making by givingmeetings generated against a range of equal voice to poor and better off, women and men,
poverty targeting and gender through individual voting and public vote counting,inclusive criteria and rank them to select the activities that would be developed intousing a transparent voting system. village proposals.
4. Causal4. Causal4. Causal4. Causal4. Causal To identify root causes of local Provides space for women’s voices. Visually represent diagram diagram diagram diagram diagram ofofofofof poverty and links between women’s realities of poverty and links between causes.
local poverty local poverty local poverty local poverty local poverty causes, in order to identify the and proposal and proposal and proposal and proposal and proposal most appropriate strategies Provides evaluation of proposed activities from the formulation formulation formulation formulation formulation which will benefit the poor viewpoints of poor women and ranking of the most
and can be supported by effective poverty-reducing activity by consensusWith women from community resources. achieved through individual voting.poorest cluster ofhouseholds in the To evaluate strategies/action Prevents male-domination and elite-hijacking of decision-village, together ideas against a range of making in selecting ideas for women’s proposals.with women poverty- and gender inclusiveinvited from other criteria. Provides visual record of the process and rationaledusuns, during underlying women’s proposals – to be used as presentationwomen’s meeting To rank ideas using a aids by women representatives while defending their(Musbangdes democratic voting system. proposals at sub-district decision making forum forperempuan) funding.
(Note: 1 and 2 above are MPA tools, outputs from which are, then used to target poorest households and women’s groups for
further analysis and planning using 3 and 4, which are PRA tools).
Table 1 Social inclusion and empowerment tools introduced in KDP 2
115
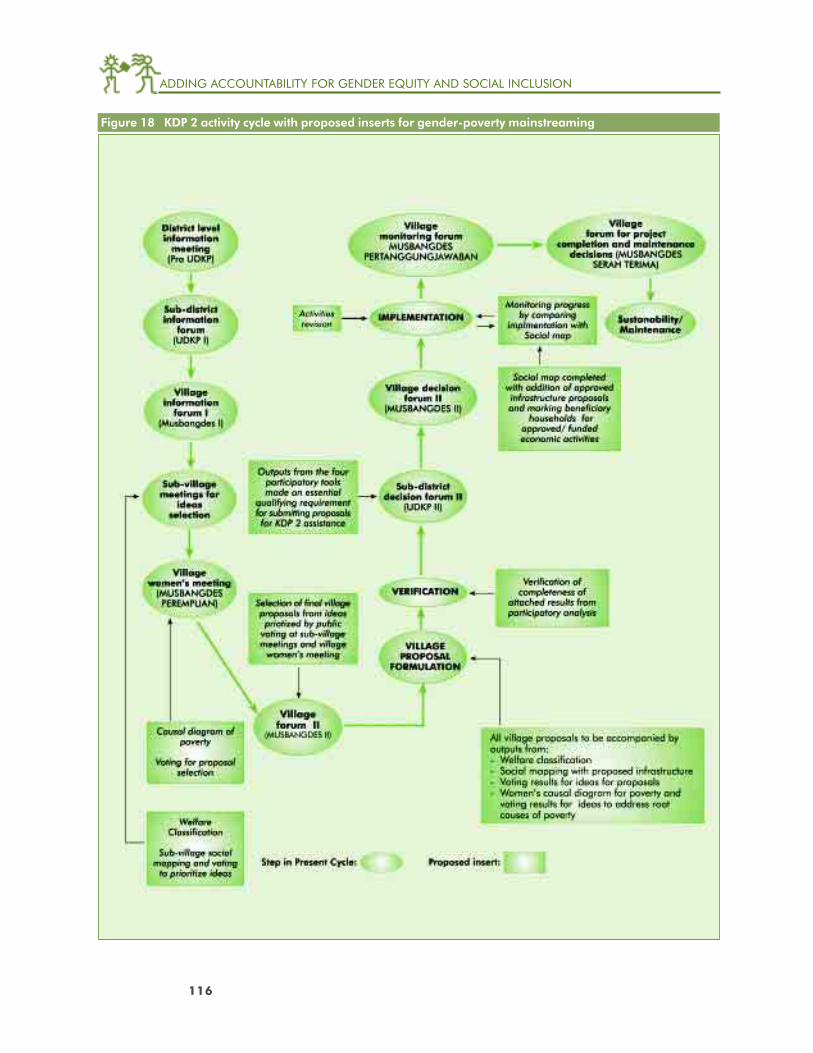
116
ADDING ACCOUNTABILITY FOR GENDER EQUITY AND SOCIAL INCLUSION
Figure 18 KDP 2 activity cycle with proposed inserts for gender-poverty mainstreaming
ADDING ACCOUNTABILITY FOR GENDER EQUITY AND SOCIAL INCLUSION
117
ADDING ACCOUNTABILITY FOR GENDER EQUITY AND SOCIAL INCLUSION
village and sub-district facilitators and their district
level supervisors, and b) KDP 2 project manuals
on proposal formulation, verification and final
selection criteria. In late 2002 project training
became operational.
2.1 Lessons learned in KDP 2
2.1.1 Capacity building for the MPA
and PRA Tools
There is capacity and readiness among the villageThere is capacity and readiness among the villageThere is capacity and readiness among the villageThere is capacity and readiness among the villageThere is capacity and readiness among the village
faci l i tators of KDPfaci l i tators of KDPfaci l i tators of KDPfaci l i tators of KDPfaci l i tators of KDP42 to use the selected to use the selected to use the selected to use the selected to use the selected
participatory toolsparticipatory toolsparticipatory toolsparticipatory toolsparticipatory tools. The trainees demonstrated
high levels of enthusiasm for using them at the
community level, but stressed the importance of
field practice for building skill and self-confidence.
Accordingly, at least two days of field practice are
now included in the seven-day training program
designed for KDP 2 village facilitators.
Village facilitators need additional sensitivity andVillage facilitators need additional sensitivity andVillage facilitators need additional sensitivity andVillage facilitators need additional sensitivity andVillage facilitators need additional sensitivity and
skills building in analysing gender issues in localskills building in analysing gender issues in localskills building in analysing gender issues in localskills building in analysing gender issues in localskills building in analysing gender issues in local
culturesculturesculturesculturescultures and dealing with them in culturallyand dealing with them in culturallyand dealing with them in culturallyand dealing with them in culturallyand dealing with them in culturally
acceptable waysacceptable waysacceptable waysacceptable waysacceptable ways. All participants demonstrated
a lack of gender analysis skills and ability to
address gender issues. Some gender training was
provided during KDP 1, which could be
strengthened by linking it in a practical manner
with the community level facilitation tasks and the
facilitators’ own community experiences. Gender
targeting would also benefit from an increase in
the number of female facilitators at village and
sub-district levels. Efforts are currently ongoing to
achieve this objective in KDP 2.
The field test experience suggested someThe field test experience suggested someThe field test experience suggested someThe field test experience suggested someThe field test experience suggested some
revisions in the criteria for the selection of villagerevisions in the criteria for the selection of villagerevisions in the criteria for the selection of villagerevisions in the criteria for the selection of villagerevisions in the criteria for the selection of village
facilitatorsfacilitatorsfacilitatorsfacilitatorsfacilitators. Empowering methodologies call for
facilitators with listening skills and openness to
learning. Criteria used during KDP 1 emphasized
“speaking skil ls” and “abil i ty to impart
information”, which can lead to the selection of
those who command respect. Such people are
used to providing direction and advice in
Indonesian communities, and are ill-at-ease in
listening and learning-facilitation roles. During
the training pilot, a few facilitators who happened
to be figures of authority in communities
demonstrated low capacity and interest to work
in a participatory learning mode.
The participatory nature of the training,
modeled after the approach to be used in
communities was appreciated, with many
participants commenting during evaluation that
they enjoyed the “relaxed” nature of the
learning. Facilitator training programs need to
exemplify the desired kind of facilitation for
better skill development.
2.1.2 Community use of the tools
during field test
The high level of enthusiasm shown by theThe high level of enthusiasm shown by theThe high level of enthusiasm shown by theThe high level of enthusiasm shown by theThe high level of enthusiasm shown by the
communitycommunitycommunitycommunitycommunity, both men and women demonstrated, both men and women demonstrated, both men and women demonstrated, both men and women demonstrated, both men and women demonstrated
their interest in working with the selected toolstheir interest in working with the selected toolstheir interest in working with the selected toolstheir interest in working with the selected toolstheir interest in working with the selected tools.
Their ability to grasp the concepts and purpose of
the tools was encouragingly high even though
understanding depends on the presentation style
and information provided by the facilitators. It
required approximately two hours per tool to make
sure that information emerging from a community
group is relevant and of good quality. This was
not seen as a constraint if group sessions were
scheduled at the convenience of community
members.
42 KDP’s village facilitators are residents of the village where they work and are to be chosen by the villagers.
They are expected to have at least middle-school level education and “good communication skills.” KDP 1 did
not formally provide them with facilitation training but KDP 2 does.
118
ADDING ACCOUNTABILITY FOR GENDER EQUITY AND SOCIAL INCLUSION
WWWWWomen in particular appreciated the opportunityomen in particular appreciated the opportunityomen in particular appreciated the opportunityomen in particular appreciated the opportunityomen in particular appreciated the opportunity
to vocalize their viewsto vocalize their viewsto vocalize their viewsto vocalize their viewsto vocalize their views, but were often interruptedbut were often interruptedbut were often interruptedbut were often interruptedbut were often interrupted.
One of the tools was used solely with women, as
is intended in the Musbangdes Perempuan or
village women’s meeting. Women responded
actively, as long as there were no men around.
However, it was often difficult to sustain gender-
segregated women’s group meetings for long
because some community men felt a need to
participate in the process, or at least be present
even in women’s meetings and answer on their
behalf. Unless specially sensitized to the need to
ensure the expression of women’s voices, village
facilitators tend to accept this situation rather than
deal with it, as it is culturally acceptable for men
to “take over” in this manner.
Information derived from the tools was gender-Information derived from the tools was gender-Information derived from the tools was gender-Information derived from the tools was gender-Information derived from the tools was gender-
and poverty-sensitiveand poverty-sensitiveand poverty-sensitiveand poverty-sensitiveand poverty-sensitive, in the sense that the different
priorities and viewpoints of men and women, the
poor and the non-poor, were made clear and
discussed by all. The trainees reported that the
tools allowed more community members to have
a voice, as compared to the methods they had
previously used.
One potential impact of the use of participatory
analysis methods is a reduced need for forms to
be completed, as the outputs from the tools provide
the supporting evidence and data for community
proposals (as indicated in Figure 18, the KDP 2
Activity cycle). A review of the current recording/
monitoring mechanisms is now being conducted
to see which ones can be simplified, eliminated
and replaced with actual outputs from
participatory analysis and planning tools. The
ongoing review is also aimed at institutionalizing
the monitoring of gender- and poverty-sensitivity
of KDP 2 processes and outcomes.
3 Interventions made inWSLIC 2
WSLIC 2 is a second-generation community-based
project for improving water and sanitation
infrastructure for poor communities in Indonesia.
It is a community-demand-driven project that offers
choices to communities about service
improvements and requires that they pay a
minimum 20 percent of the construction cost for
the chosen type and level of services, part in cash
(4 percent) and part in kind (16 percent).
Operation and maintenance are to be fully user-
financed, with some project inputs for capacity
building.
Gender and poverty mainstreaming were built into
the design of WSLIC 2 with a requirement for use
of MPA as the main approach for community
mobilization and planning process for improving
services and health, combined with PHAST.43 The
major challenges for this project thus far have
been the development of MPA as a methodology
for planning by combining it with PHAST, scaling
up a process that has hitherto been used for
relatively small scale monitoring and evaluation
exercise, and gaining “buy-in” at the provincial,
district, and community levels. Since the project
was launched in late 2001, the following
interventions have been made.
a) Project management
● Provision of a national level specialist adviser
for MPA and PHAST on the central project
management team.
● Project design requiring participatory
monitoring and evaluation at village level to
43 Participatory Hygiene and Sanitation Transformation: A participatory approach for the control of diarrhoeal
disease, developed through a collaboration between WHO and the UNDP/World Bank Water and Sanitation
Program in the mid 1990s.

119
ADDING ACCOUNTABILITY FOR GENDER EQUITY AND SOCIAL INCLUSION
be linked to the project’s Monitoring
Information System (MIS).
● Defining project monitoring and evaluation
indicators for sustainability; incorporating
process indicators for sustainability in terms
of gender-and-poverty-sensitive demand-
responsive approaches (in process, at the end
of 2002).
b) Capacity building
● Orientations on gender- and poverty-sensitive
empowering methodologies for project
consultants at all levels (central, provincial, and
district) and stakeholders (local government
agencies and contractors).
● Setting criteria for participatory skills and
experience as part of the selection process for
community facilitators.
● Intensive training in gender- and poverty-
inclusive empowering methodologies (the MPA-
PHAST-based process) for community
facilitators and district implementation teams,
incorporating substantial in-field practice.
c) Community engagement process
● Road shows (public information activities at
project launch) at district, sub-district and
village levels which emphasize the community-
demand-driven approach, choices available
to communities and the rules of engagement
with the project.
● Requirement for a formal expression of
community demand (a Letter of Intent) as the
starting point for project engagement with
interested communities.
● Developing a community planning process
that uses a demand-responsive, gender-
balanced and socially-inclusive approach,
combining MPA and PHAST methodologies
into one community planning process44 (See
Table 2 for process outline and tools used).
● Establishing the requirements for participatory,
gender and poverty-sensitive approaches to
be used in preparing community action plans
(setting criteria related to gender equity and
poverty-targeting for evaluating and
approving community action plans for project
funding).
● Providing trained facilitator teams to assist
communities to develop and implement their
action plans through the MPA-PHAST based
process.
● Providing training for village implementation
teams in participatory, gender- and poverty-
inclusive approaches.
3.1 Lessons learned in WSLIC 2
2002 is the first year of WSLIC 2 implementation.
Whether or not the processes, tools, and indicators
will have made a difference in outcomes will not
be known until at least another year. Some lessons
that have been learned to date, about
institutionalizing and scaling up gender- and
social-inclusion are presented here.
Institutionalization
● Incorporating gender- and socially-inclusiveIncorporating gender- and socially-inclusiveIncorporating gender- and socially-inclusiveIncorporating gender- and socially-inclusiveIncorporating gender- and socially-inclusive
methodologies into the project design hasmethodologies into the project design hasmethodologies into the project design hasmethodologies into the project design hasmethodologies into the project design has
proved essential in gaining acceptance atproved essential in gaining acceptance atproved essential in gaining acceptance atproved essential in gaining acceptance atproved essential in gaining acceptance at
national levelnational levelnational levelnational levelnational level. The requirement for the use of
the MPA has caused gender, poverty and
sustainability issues to be more easily
discussed and addressed in the normal course
44 Until this point, MPA had been used as an assessment tool for monitoring and evaluating project implementation.
WSLIC 2 provides the first opportunity for it to be tested as a planning methodology on a large scale. It has
necessitated some modification to the recording and use of information gathered through the participatory
tools. Further modifications are expected following the first round of field application in WSLIC 2 provinces in
2002.

120
ADDING ACCOUNTABILITY FOR GENDER EQUITY AND SOCIAL INCLUSION
of project implementation. Because they are
not seen as optional, the risks of these issues
being marginalised is lower, unlike what has
often been seen in past projects.
● A definite marketing strategy and extensiveA definite marketing strategy and extensiveA definite marketing strategy and extensiveA definite marketing strategy and extensiveA definite marketing strategy and extensive
promotion are necessary to “sell” thepromotion are necessary to “sell” thepromotion are necessary to “sell” thepromotion are necessary to “sell” thepromotion are necessary to “sell” the
approach for gender and socially inclusiveapproach for gender and socially inclusiveapproach for gender and socially inclusiveapproach for gender and socially inclusiveapproach for gender and socially inclusive
participatory development to stakeholders atparticipatory development to stakeholders atparticipatory development to stakeholders atparticipatory development to stakeholders atparticipatory development to stakeholders at
the national, provincial, and district levelsthe national, provincial, and district levelsthe national, provincial, and district levelsthe national, provincial, and district levelsthe national, provincial, and district levels.
The strategy adopted by WSLIC 2 was not to
sell these ideas separately, but integrate them
into a package that can attract all stakeholders’
interest. Since stakeholders at all levels are
concerned about sustainability, “sustainability
of services/project investments/health impact“
was strategically selected as the package for
marketing all the interlinked concepts, i.e.,
demand-responsive approaches, gender- and
poverty-inclusion, community empowerment
and participation. This is helping to develop
a degree of ownership of the project goals
(sustainability and equity) by various categories
of WSLIC 2 stakeholders, whereas, in other
cases, participation/gender/poverty issues tend
to be delegated only to social development
personnel in projects.
● The issue of institutional capacity building atThe issue of institutional capacity building atThe issue of institutional capacity building atThe issue of institutional capacity building atThe issue of institutional capacity building at
the local government level is emerging as athe local government level is emerging as athe local government level is emerging as athe local government level is emerging as athe local government level is emerging as a
major challengemajor challengemajor challengemajor challengemajor challenge. The consultants that are
implementing the project using the new
methodologies are supervised and managed
by district level government agencies. These
agencies are habituated to traditional, top-
down ways of executing programs. WSLIC 2
faces an enormous challenge of bringing
about a common understanding of project
concepts, facilitating more participatory,
downwardly accountable management styles
and new kinds of quality control criteria with
local government agencies, which are currently
also experiencing decentralization of central
power for the first time. Provincial and district
level structures are keen to test the limits of
their autonomy and are now less amenable
to central guidance than in the past.
● There needs to be an integrated strategy thatThere needs to be an integrated strategy thatThere needs to be an integrated strategy thatThere needs to be an integrated strategy thatThere needs to be an integrated strategy that
synchronizes the es tabl ishment ofsynchronizes the es tabl ishment ofsynchronizes the es tabl ishment ofsynchronizes the es tabl ishment ofsynchronizes the es tabl ishment of
participatoryparticipatoryparticipatoryparticipatoryparticipatory, community demand-, community demand-, community demand-, community demand-, community demand-drivendrivendrivendrivendriven
processesprocessesprocessesprocessesprocesses wi th ins t i tu t ional changei th ins t i tu t ional changei th ins t i tu t ional changei th ins t i tu t ional changei th ins t i tu t ional change
management at local government levels.management at local government levels.management at local government levels.management at local government levels.management at local government levels.
Projec t teams also need ins t i tu t ionProjec t teams also need ins t i tu t ionProjec t teams also need ins t i tu t ionProjec t teams also need ins t i tu t ionProjec t teams also need ins t i tu t ion
development skills. development skills. development skills. development skills. development skills. The use of empowering
methodologies, which mainstream gender-
and poverty-inclusion, necessitates major
changes in traditional institutional
mechanisms at local level. The nature and
scale of the institutional change management
challenge (to get local government agencies
Mapping households by welfare categories with villagers - communityfacilitators training in WSLIC 2 project, Indonesia.
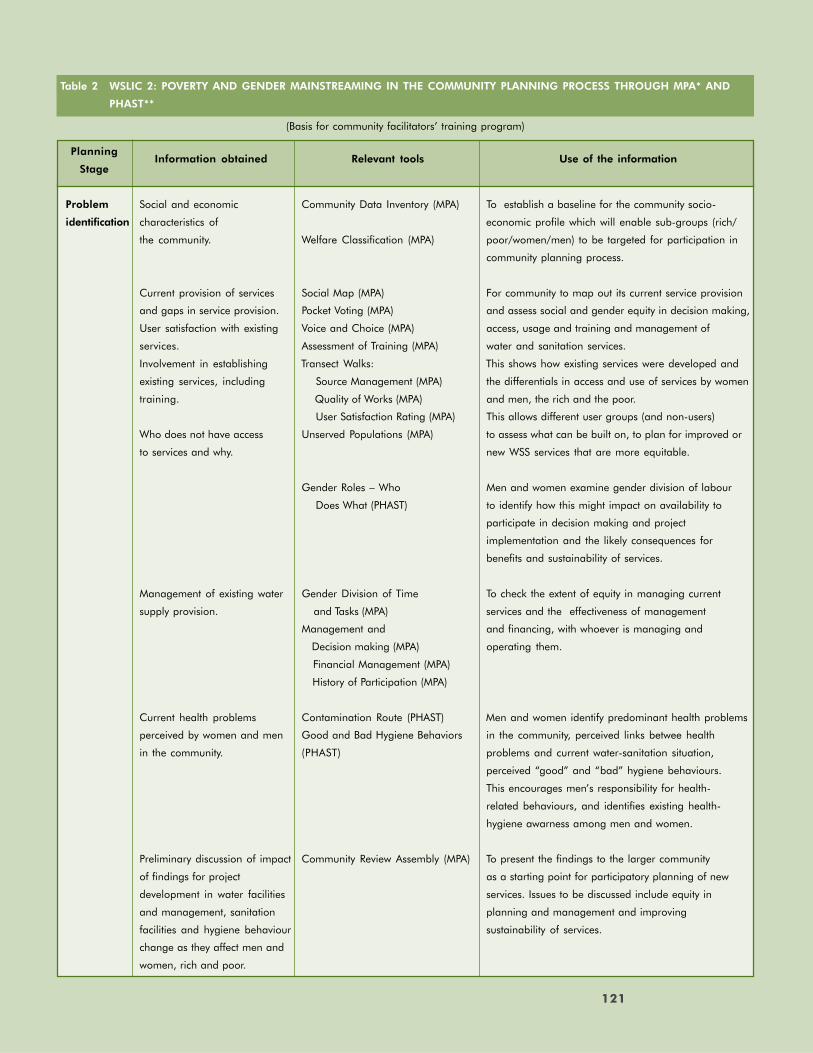
121
ADDING ACCOUNTABILITY FOR GENDER EQUITY AND SOCIAL INCLUSIONTable 2 WSLIC 2: POVERTY AND GENDER MAINSTREAMING IN THE COMMUNITY PLANNING PROCESS THROUGH MPA* AND
PHAST**
121
(Basis for community facilitators’ training program)
PlanningInformation obtained Relevant tools Use of the information
Stage
Problem Social and economic Community Data Inventory (MPA) To establish a baseline for the community socio-
identification characteristics of economic profile which will enable sub-groups (rich/
the community. Welfare Classification (MPA) poor/women/men) to be targeted for participation in
community planning process.
Current provision of services Social Map (MPA) For community to map out its current service provision
and gaps in service provision. Pocket Voting (MPA) and assess social and gender equity in decision making,
User satisfaction with existing Voice and Choice (MPA) access, usage and training and management of
services. Assessment of Training (MPA) water and sanitation services.
Involvement in establishing Transect Walks: This shows how existing services were developed and
existing services, including Source Management (MPA) the differentials in access and use of services by women
training. Quality of Works (MPA) and men, the rich and the poor.
User Satisfaction Rating (MPA) This allows different user groups (and non-users)
Who does not have access Unserved Populations (MPA) to assess what can be built on, to plan for improved or
to services and why. new WSS services that are more equitable.
Gender Roles – Who Men and women examine gender division of labour
Does What (PHAST) to identify how this might impact on availability to
participate in decision making and project
implementation and the likely consequences for
benefits and sustainability of services.
Management of existing water Gender Division of Time To check the extent of equity in managing current
supply provision. and Tasks (MPA) services and the effectiveness of management
Management and and financing, with whoever is managing and
Decision making (MPA) operating them.
Financial Management (MPA)
History of Participation (MPA)
Current health problems Contamination Route (PHAST) Men and women identify predominant health problems
perceived by women and men Good and Bad Hygiene Behaviors in the community, perceived links betwee health
in the community. (PHAST) problems and current water-sanitation situation,
perceived “good” and “bad” hygiene behaviours.
This encourages men’s responsibility for health-
related behaviours, and identifies existing health-
hygiene awarness among men and women.
Preliminary discussion of impact Community Review Assembly (MPA) To present the findings to the larger community
of findings for project as a starting point for participatory planning of new
development in water facilities services. Issues to be discussed include equity in
and management, sanitation planning and management and improving
facilities and hygiene behaviour sustainability of services.
change as they affect men and
women, rich and poor.
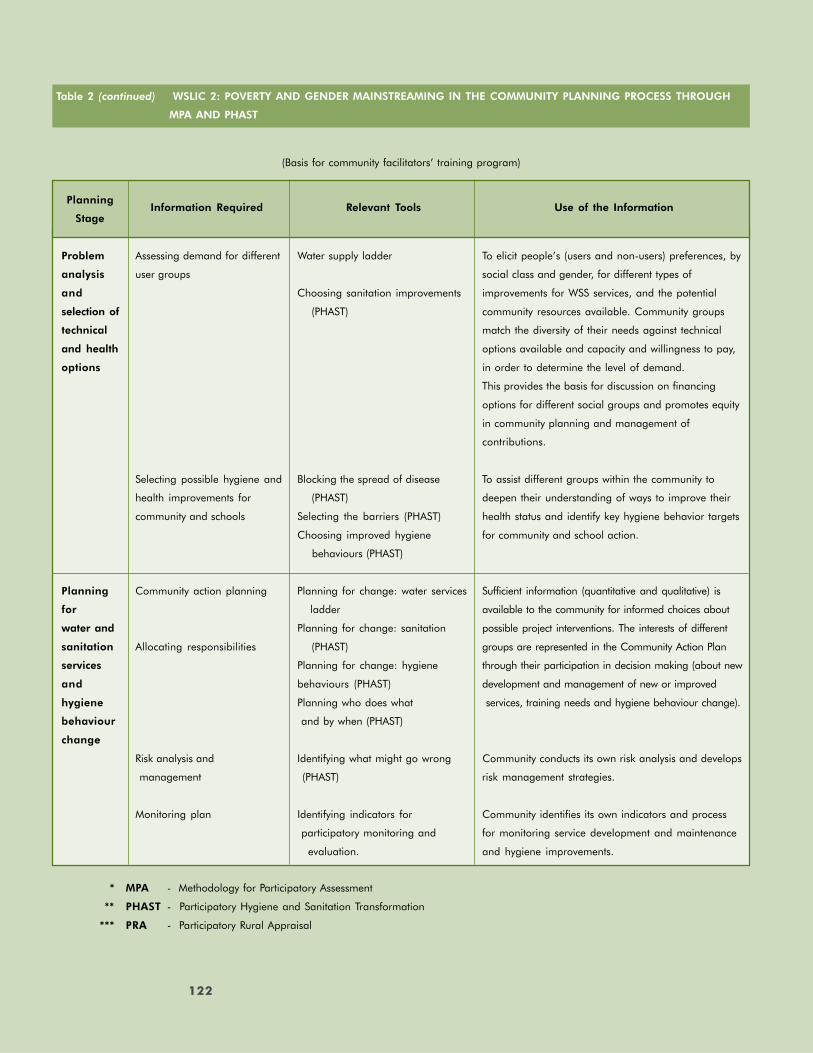
122
ADDING ACCOUNTABILITY FOR GENDER EQUITY AND SOCIAL INCLUSION
(Basis for community facilitators’ training program)
PlanningInformation Required Relevant Tools Use of the Information
Stage
Problem Assessing demand for different Water supply ladder To elicit people’s (users and non-users) preferences, by
analysis user groups social class and gender, for different types of
and Choosing sanitation improvements improvements for WSS services, and the potential
selection of (PHAST) community resources available. Community groups
technical match the diversity of their needs against technical
and health options available and capacity and willingness to pay,
options in order to determine the level of demand.
This provides the basis for discussion on financing
options for different social groups and promotes equity
in community planning and management of
contributions.
Selecting possible hygiene and Blocking the spread of disease To assist different groups within the community to
health improvements for (PHAST) deepen their understanding of ways to improve their
community and schools Selecting the barriers (PHAST) health status and identify key hygiene behavior targets
Choosing improved hygiene for community and school action.
behaviours (PHAST)
Planning Community action planning Planning for change: water services Sufficient information (quantitative and qualitative) is
for ladder available to the community for informed choices about
water and Planning for change: sanitation possible project interventions. The interests of different
sanitation Allocating responsibilities (PHAST) groups are represented in the Community Action Plan
services Planning for change: hygiene through their participation in decision making (about new
and behaviours (PHAST) development and management of new or improved
hygiene Planning who does what services, training needs and hygiene behaviour change).
behaviour and by when (PHAST)
change
Risk analysis and Identifying what might go wrong Community conducts its own risk analysis and develops
management (PHAST) risk management strategies.
Monitoring plan Identifying indicators for Community identifies its own indicators and process
participatory monitoring and for monitoring service development and maintenance
evaluation. and hygiene improvements.
* MPA - Methodology for Participatory Assessment
** PHAST - Participatory Hygiene and Sanitation Transformation
*** PRA - Participatory Rural Appraisal
Table 2 (continued) WSLIC 2: POVERTY AND GENDER MAINSTREAMING IN THE COMMUNITY PLANNING PROCESS THROUGH
MPA AND PHAST
122
123
ADDING ACCOUNTABILITY FOR GENDER EQUITY AND SOCIAL INCLUSION
to function in a demand-responsive mode
when they have had a history of being entirely
supply-oriented) were underestimated in the
project design. Moreover, bureaucratic
exigencies have caused batches of personnel
joining WSLIC 2 project in a manner that is
neither systematic nor properly sequenced.
Their readiness to function in the project has
had to be built in a reactive “fire-fighting” mode
instead of systematically and therefore cost-
effectively.
● MPMPMPMPMPA offers a process model for gender andA offers a process model for gender andA offers a process model for gender andA offers a process model for gender andA offers a process model for gender and
poverty-inclusive participatory planning thatpoverty-inclusive participatory planning thatpoverty-inclusive participatory planning thatpoverty-inclusive participatory planning thatpoverty-inclusive participatory planning that
fits with the new planning paradigm forfits with the new planning paradigm forfits with the new planning paradigm forfits with the new planning paradigm forfits with the new planning paradigm for
Indonesia, in theoryIndonesia, in theoryIndonesia, in theoryIndonesia, in theoryIndonesia, in theory..... At this initial phase of
the project the process is seen to be helping
technical specialists, health and community
development specialists function in a more
integrated manner than previously
experienced. However, ultimate success will
depend on MPA applications being maintained
consistently into the implementation phase to
ensure gender and social equity in future
outcomes, e.g., in community capacity building
for infrastructure operation and maintenance,
participation in water management
organizations, and more equitable distribution
of workloads, power and benefits resulting
from the project.
● Monitoring and evaluation specialists are anMonitoring and evaluation specialists are anMonitoring and evaluation specialists are anMonitoring and evaluation specialists are anMonitoring and evaluation specialists are an
important target to ensure that key genderimportant target to ensure that key genderimportant target to ensure that key genderimportant target to ensure that key genderimportant target to ensure that key gender
and poverty indicators are included inand poverty indicators are included inand poverty indicators are included inand poverty indicators are included inand poverty indicators are included in
Management Information Systems (MIS)Management Information Systems (MIS)Management Information Systems (MIS)Management Information Systems (MIS)Management Information Systems (MIS).
While process indicators are an important part
of assessing empowering approaches, project
level M&E is usually more concerned with
physical inputs and outputs. Successful
integration of MPA into the project MIS is a
key milestone, which has not yet been reached.
Table 3 provides a sample of gender- and
poverty-sensitive process indicators built into
WSLIC project design, which now need to be
made operational through participatory
monitoring mechanisms and the MIS.
Capacity building for communityprocesses
● Capacity building is an i terat ive andCapacity building is an i terat ive andCapacity building is an i terat ive andCapacity building is an i terat ive andCapacity building is an i terat ive and
continuous requirement.continuous requirement.continuous requirement.continuous requirement.continuous requirement. WSLIC 2 recognizes
that the community level interface is the most
critical one for the success of empowering
methodologies and for project sustainability,
and that quality training is required for those
who work at this level..... WSLIC 2 provided five
weeks of initial training for community
facilitators in three tranches, interspersed with
three phases of fieldwork. Despite this, further
technical guidance in the field during initial
stages has been identified as necessary and
ongoing refresher training is planned.
● Capacity building improves in quality throughCapacity building improves in quality throughCapacity building improves in quality throughCapacity building improves in quality throughCapacity building improves in quality through
learning from the field. learning from the field. learning from the field. learning from the field. learning from the field. The first year’s
community planning process has yielded
valuable feedback on how to streamline and
sharpen the MPA-PHAST process, and refine
community facilitators’ skills. A stakeholders’
review of the process has been planned with
the objective of reaching consensus before
making changes for the next round.
● Who makes the best participatory facilitator?Who makes the best participatory facilitator?Who makes the best participatory facilitator?Who makes the best participatory facilitator?Who makes the best participatory facilitator?
There are trade offs. WSLIC 2 experience
showed that fresh college graduates recruited
as community facilitators were more responsive
to the new empowering approaches. During
training they were more open to learning as
compared to those who have spent significant
time in bureaucracies, such as extension
workers within government systems (a
somewhat comparable finding is reported in
the section on KDP). However, while MPA tools
are relatively easily learned, the rationale for
their use is not easily understood without
some fieldwork and community experience.
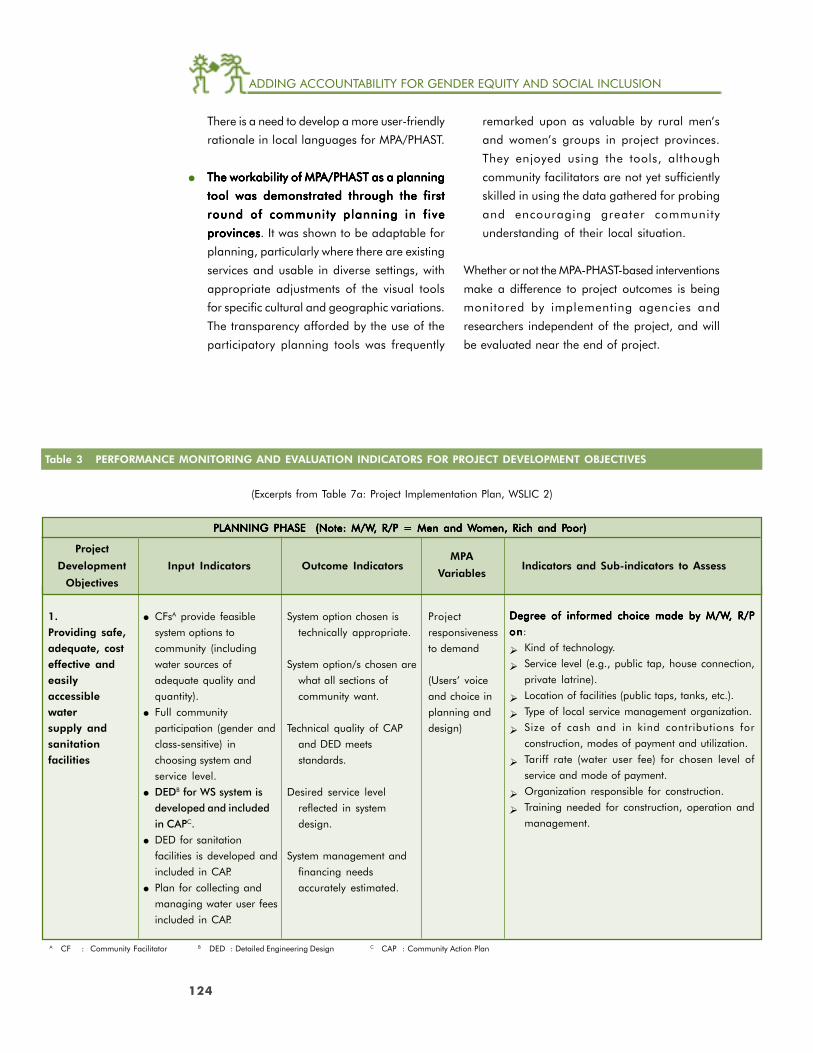
124
ADDING ACCOUNTABILITY FOR GENDER EQUITY AND SOCIAL INCLUSION
There is a need to develop a more user-friendly
rationale in local languages for MPA/PHAST.
● The workability of MPThe workability of MPThe workability of MPThe workability of MPThe workability of MPA/PHAST as a planningA/PHAST as a planningA/PHAST as a planningA/PHAST as a planningA/PHAST as a planning
tool was demonstrated through the firsttool was demonstrated through the firsttool was demonstrated through the firsttool was demonstrated through the firsttool was demonstrated through the first
round of community planning in f iveround of community planning in f iveround of community planning in f iveround of community planning in f iveround of community planning in f ive
provincesprovincesprovincesprovincesprovinces. It was shown to be adaptable for
planning, particularly where there are existing
services and usable in diverse settings, with
appropriate adjustments of the visual tools
for specific cultural and geographic variations.
The transparency afforded by the use of the
participatory planning tools was frequently
remarked upon as valuable by rural men’s
and women’s groups in project provinces.
They enjoyed using the tools, although
community facilitators are not yet sufficiently
skilled in using the data gathered for probing
and encouraging greater community
understanding of their local situation.
Whether or not the MPA-PHAST-based interventions
make a difference to project outcomes is being
monitored by implementing agencies and
researchers independent of the project, and will
be evaluated near the end of project.
(Excerpts from Table 7a: Project Implementation Plan, WSLIC 2)
PLANNING PHASE (Note: M/WPLANNING PHASE (Note: M/WPLANNING PHASE (Note: M/WPLANNING PHASE (Note: M/WPLANNING PHASE (Note: M/W, R/P = Men and W, R/P = Men and W, R/P = Men and W, R/P = Men and W, R/P = Men and Women, Rich and Pomen, Rich and Pomen, Rich and Pomen, Rich and Pomen, Rich and Poor)oor)oor)oor)oor)
ProjectMPA
Development Input Indicators Outcome IndicatorsVariables
Indicators and Sub-indicators to Assess
Objectives
1.Providing safe,adequate, costeffective andeasilyaccessiblewatersupply andsanitationfacilities
● CFsA provide feasible
system options to
community (including
water sources of
adequate quality and
quantity).
● Full community
participation (gender and
class-sensitive) in
choosing system and
service level.
● DEDB for WS system is
developed and included
in CAPC.
● DED for sanitation
facilities is developed and
included in CAP.
● Plan for collecting and
managing water user fees
included in CAP.
System option chosen is
technically appropriate.
System option/s chosen are
what all sections of
community want.
Technical quality of CAP
and DED meets
standards.
Desired service level
reflected in system
design.
System management and
financing needs
accurately estimated.
Project
responsiveness
to demand
(Users’ voice
and choice in
planning and
design)
Degree of informed choice made by M/WDegree of informed choice made by M/WDegree of informed choice made by M/WDegree of informed choice made by M/WDegree of informed choice made by M/W, R/P, R/P, R/P, R/P, R/P
ononononon:
Kind of technology.
Service level (e.g., public tap, house connection,
private latrine).
Location of facilities (public taps, tanks, etc.).
Type of local service management organization.
Size of cash and in kind contributions for
construction, modes of payment and utilization.
Tariff rate (water user fee) for chosen level of
service and mode of payment.
Organization responsible for construction.
Training needed for construction, operation and
management.
Table 3 PERFORMANCE MONITORING AND EVALUATION INDICATORS FOR PROJECT DEVELOPMENT OBJECTIVES
A CF : Community Facilitator B DED : Detailed Engineering Design C CAP : Community Action Plan
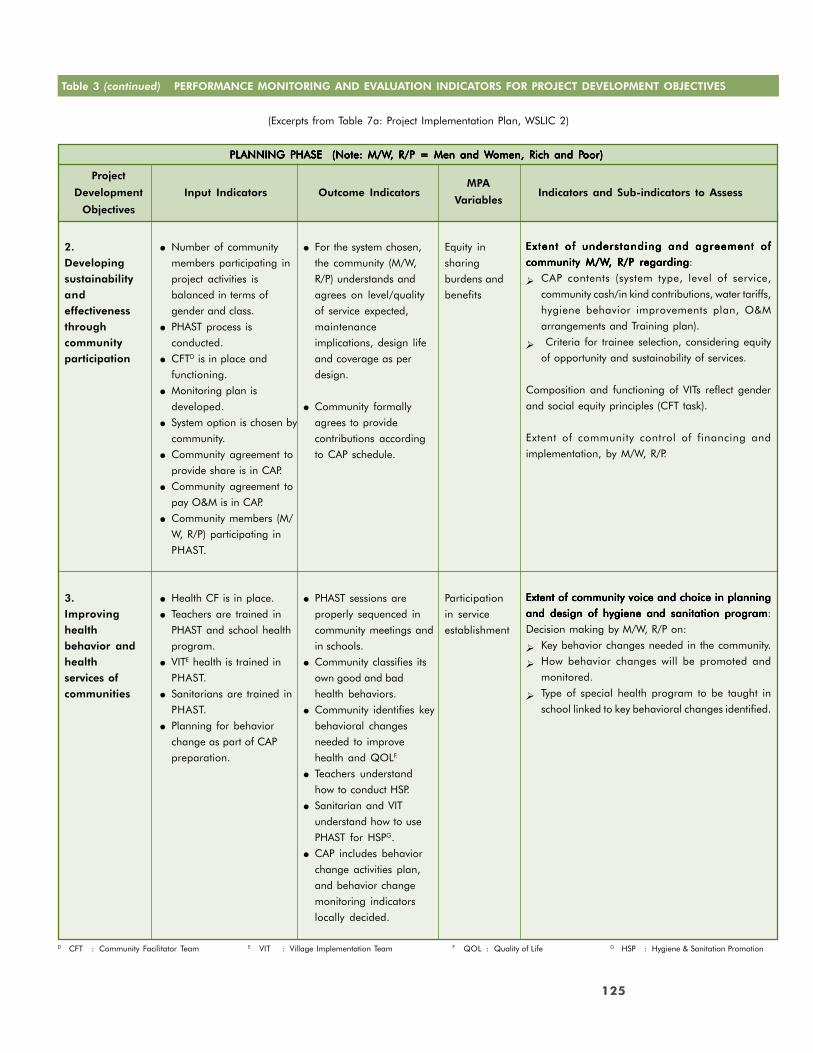
125
ADDING ACCOUNTABILITY FOR GENDER EQUITY AND SOCIAL INCLUSION
(Excerpts from Table 7a: Project Implementation Plan, WSLIC 2)
PLANNING PHASE (Note: M/WPLANNING PHASE (Note: M/WPLANNING PHASE (Note: M/WPLANNING PHASE (Note: M/WPLANNING PHASE (Note: M/W, R/P = Men and W, R/P = Men and W, R/P = Men and W, R/P = Men and W, R/P = Men and Women, Rich and Pomen, Rich and Pomen, Rich and Pomen, Rich and Pomen, Rich and Poor)oor)oor)oor)oor)
ProjectMPA
Development Input Indicators Outcome IndicatorsVariables
Indicators and Sub-indicators to Assess
Objectives
2.Developingsustainabilityandeffectivenessthroughcommunityparticipation
3.Improvinghealthbehavior andhealthservices ofcommunities
● Number of community
members participating in
project activities is
balanced in terms of
gender and class.
● PHAST process is
conducted.
● CFTD is in place and
functioning.
● Monitoring plan is
developed.
● System option is chosen by
community.
● Community agreement to
provide share is in CAP.
● Community agreement to
pay O&M is in CAP.
● Community members (M/
W, R/P) participating in
PHAST.
● Health CF is in place.
● Teachers are trained in
PHAST and school health
program.
● VITE health is trained in
PHAST.
● Sanitarians are trained in
PHAST.
● Planning for behavior
change as part of CAP
preparation.
● For the system chosen,
the community (M/W,
R/P) understands and
agrees on level/quality
of service expected,
maintenance
implications, design life
and coverage as per
design.
● Community formally
agrees to provide
contributions according
to CAP schedule.
● PHAST sessions are
properly sequenced in
community meetings and
in schools.
● Community classifies its
own good and bad
health behaviors.
● Community identifies key
behavioral changes
needed to improve
health and QOLF.
● Teachers understand
how to conduct HSP.
● Sanitarian and VIT
understand how to use
PHAST for HSPG.
● CAP includes behavior
change activities plan,
and behavior change
monitoring indicators
locally decided.
Equity in
sharing
burdens and
benefits
Participation
in service
establishment
Extent of understanding and agreement ofExtent of understanding and agreement ofExtent of understanding and agreement ofExtent of understanding and agreement ofExtent of understanding and agreement of
community M/Wcommunity M/Wcommunity M/Wcommunity M/Wcommunity M/W, R/P regarding, R/P regarding, R/P regarding, R/P regarding, R/P regarding:
CAP contents (system type, level of service,
community cash/in kind contributions, water tariffs,
hygiene behavior improvements plan, O&M
arrangements and Training plan).
Criteria for trainee selection, considering equity
of opportunity and sustainability of services.
Composition and functioning of VITs reflect gender
and social equity principles (CFT task).
Extent of community control of financing and
implementation, by M/W, R/P.
Extent of community voice and choice in planningExtent of community voice and choice in planningExtent of community voice and choice in planningExtent of community voice and choice in planningExtent of community voice and choice in planning
and design of hygiene and sanitation programand design of hygiene and sanitation programand design of hygiene and sanitation programand design of hygiene and sanitation programand design of hygiene and sanitation program:
Decision making by M/W, R/P on:
Key behavior changes needed in the community.
How behavior changes will be promoted and
monitored.
Type of special health program to be taught in
school linked to key behavioral changes identified.
Table 3 (continued) PERFORMANCE MONITORING AND EVALUATION INDICATORS FOR PROJECT DEVELOPMENT OBJECTIVES
D CFT : Community Facilitator Team E VIT : Village Implementation Team F QOL : Quality of Life G HSP : Hygiene & Sanitation Promotion
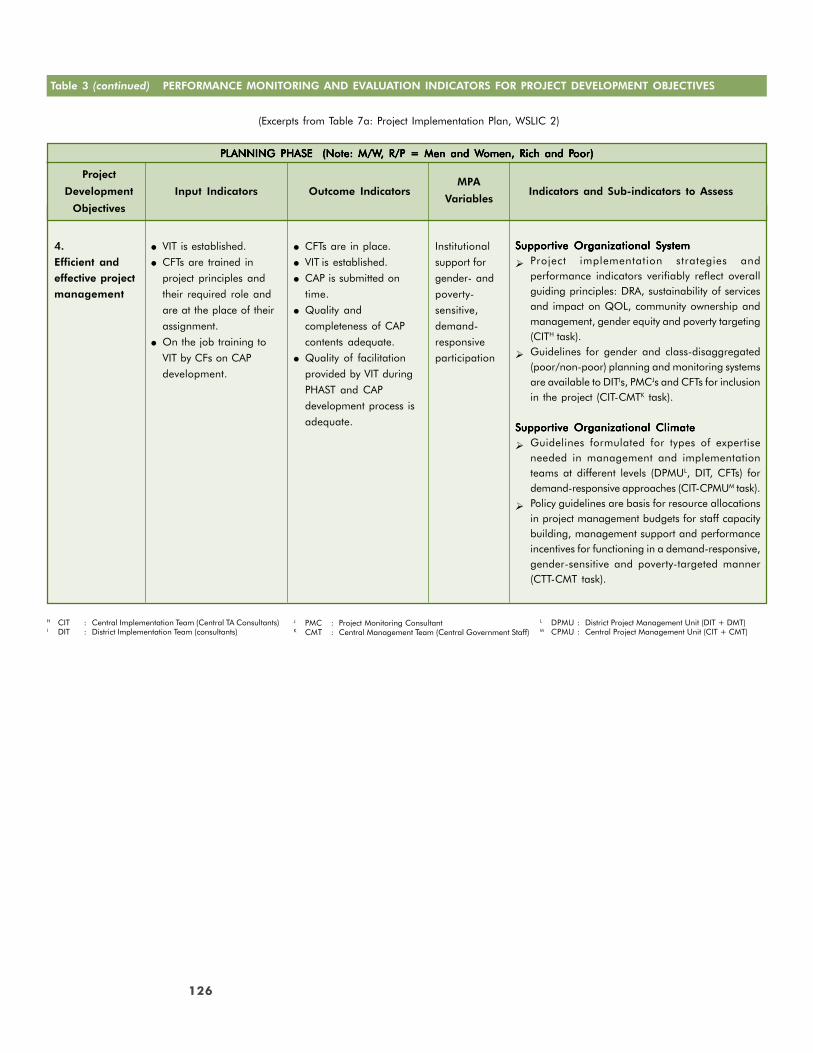
126
ADDING ACCOUNTABILITY FOR GENDER EQUITY AND SOCIAL INCLUSION
(Excerpts from Table 7a: Project Implementation Plan, WSLIC 2)
PLANNING PHASE (Note: M/WPLANNING PHASE (Note: M/WPLANNING PHASE (Note: M/WPLANNING PHASE (Note: M/WPLANNING PHASE (Note: M/W, R/P = Men and W, R/P = Men and W, R/P = Men and W, R/P = Men and W, R/P = Men and Women, Rich and Pomen, Rich and Pomen, Rich and Pomen, Rich and Pomen, Rich and Poor)oor)oor)oor)oor)
ProjectMPA
Development Input Indicators Outcome IndicatorsVariables
Indicators and Sub-indicators to Assess
Objectives
H CIT : Central Implementation Team (Central TA Consultants)I DIT : District Implementation Team (consultants)
J PMC : Project Monitoring ConsultantK CMT : Central Management Team (Central Government Staff)
L DPMU : District Project Management Unit (DIT + DMT)M CPMU : Central Project Management Unit (CIT + CMT)
● VIT is established.
● CFTs are trained in
project principles and
their required role and
are at the place of their
assignment.
● On the job training to
VIT by CFs on CAP
development.
● CFTs are in place.
● VIT is established.
● CAP is submitted on
time.
● Quality and
completeness of CAP
contents adequate.
● Quality of facilitation
provided by VIT during
PHAST and CAP
development process is
adequate.
Institutional
support for
gender- and
poverty-
sensitive,
demand-
responsive
participation
4.Efficient andeffective projectmanagement
Supportive Organizational SystemSupportive Organizational SystemSupportive Organizational SystemSupportive Organizational SystemSupportive Organizational SystemProject implementation strategies andperformance indicators verifiably reflect overallguiding principles: DRA, sustainability of servicesand impact on QOL, community ownership andmanagement, gender equity and poverty targeting(CITH task).Guidelines for gender and class-disaggregated(poor/non-poor) planning and monitoring systemsare available to DITIs, PMCJs and CFTs for inclusionin the project (CIT-CMTK task).
Supportive Organizational ClimateSupportive Organizational ClimateSupportive Organizational ClimateSupportive Organizational ClimateSupportive Organizational ClimateGuidelines formulated for types of expertiseneeded in management and implementationteams at different levels (DPMUL, DIT, CFTs) fordemand-responsive approaches (CIT-CPMUM task).Policy guidelines are basis for resource allocationsin project management budgets for staff capacitybuilding, management support and performanceincentives for functioning in a demand-responsive,gender-sensitive and poverty-targeted manner(CTT-CMT task).
Table 3 (continued) PERFORMANCE MONITORING AND EVALUATION INDICATORS FOR PROJECT DEVELOPMENT OBJECTIVES

127
ADDING ACCOUNTABILITY FOR GENDER EQUITY AND SOCIAL INCLUSION
Background
Lao People’s Democratic Republic (PDR), commonly
known as Lao PDR, is a land-locked area between
China, Vietnam, Thailand, Myanmar, and
Cambodia. It has a population of 5.2 million.
Around 85 percent of the population lives in rural
areas that are often remote and very difficult to
access. There is a broad range of linguistic and
ethnic diversity throughout the country. These
factors combine to make provision of rural water
supply and sanitation (RWSS) a challenging task.
Water and Sanitation SectorStrategy
The National Center for Environmental Health and
Water Supply, commonly known as Nam Saat,
within the Ministry of Health is responsible for co-
ordination, guidance and facilitation of the RWSS
sector. Prior to 1997, the approach to RWSS in
Lao PDR was top-down, focusing on coverage
rather than use and sustainability, and centered
on areas that were easily accessible. Following a
Looking Back to See ForwardLearning from communities about use and sustainability ofRWSS services in Lao PDR
Soutsakhone Chanthaphone and Santanu Lahiri
1
2
3
4
Vientiane Municipality
56
78
Study Areas
Northern Region
Central Region
Southern Region
Study areas: Provinces1. Luang Namtha2. Bokeo3. Sayaboury4. Vientiane5. Xiang Khouang6. Bolikhamxai7. Attapeu8. Champasak
Figure 19 Location map of Lao PDR
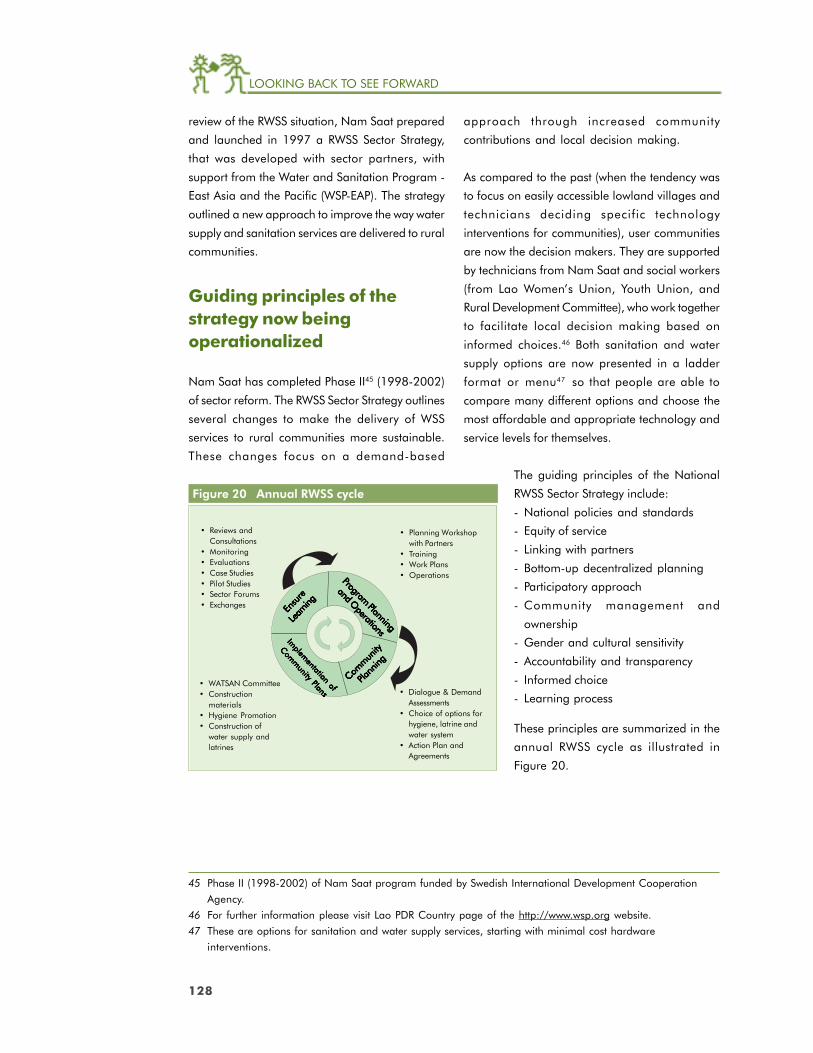
128
LOOKING BACK TO SEE FORWARD
review of the RWSS situation, Nam Saat prepared
and launched in 1997 a RWSS Sector Strategy,
that was developed with sector partners, with
support from the Water and Sanitation Program -
East Asia and the Pacific (WSP-EAP). The strategy
outlined a new approach to improve the way water
supply and sanitation services are delivered to rural
communities.
Guiding principles of thestrategy now beingoperationalized
Nam Saat has completed Phase II45 (1998-2002)
of sector reform. The RWSS Sector Strategy outlines
several changes to make the delivery of WSS
services to rural communities more sustainable.
These changes focus on a demand-based
approach through increased community
contributions and local decision making.
As compared to the past (when the tendency was
to focus on easily accessible lowland villages and
technicians deciding specific technology
interventions for communities), user communities
are now the decision makers. They are supported
by technicians from Nam Saat and social workers
(from Lao Women’s Union, Youth Union, and
Rural Development Committee), who work together
to facilitate local decision making based on
informed choices.46 Both sanitation and water
supply options are now presented in a ladder
format or menu47 so that people are able to
compare many different options and choose the
most affordable and appropriate technology and
service levels for themselves.
The guiding principles of the National
RWSS Sector Strategy include:
- National policies and standards
- Equity of service
- Linking with partners
- Bottom-up decentralized planning
- Participatory approach
- Community management and
ownership
- Gender and cultural sensitivity
- Accountability and transparency
- Informed choice
- Learning process
These principles are summarized in the
annual RWSS cycle as illustrated in
Figure 20.
45 Phase II (1998-2002) of Nam Saat program funded by Swedish International Development Cooperation
Agency.
46 For further information please visit Lao PDR Country page of the http://www.wsp.org website.
47 These are options for sanitation and water supply services, starting with minimal cost hardware
interventions.
• Reviews andConsultations
• Monitoring• Evaluations• Case Studies• Pilot Studies• Sector Forums• Exchanges
• WATSAN Committee• Construction
materials• Hygiene Promotion• Construction of
water supply andlatrines
• Planning Workshopwith Partners
• Training• Work Plans• Operations
• Dialogue & DemandAssessments
• Choice of options forhygiene, latrine andwater system
• Action Plan andAgreements
Figure 20 Annual RWSS cycle
Ensu
re
Ensu
re
Ensu
re
Ensu
re
Ensu
reLe
arnin
g
Lear
ning
Lear
ning
Lear
ning
Lear
ning
Program
Program
Program
Program
ProgramPlanning
Planning
Planning
Planning
Planning
and Operations
and Operations
and Operations
and Operations
and Operations
Implem
entation of
Implem
entation of
Implem
entation of
Implem
entation of
Implem
entation of
Comm
unity Plans
Comm
unity Plans
Comm
unity Plans
Comm
unity Plans
Comm
unity Plans
Commun
ity
Commun
ity
Commun
ity
Commun
ity
Commun
ity
Plan
ning
Plan
ning
Plan
ning
Plan
ning
Plan
ning
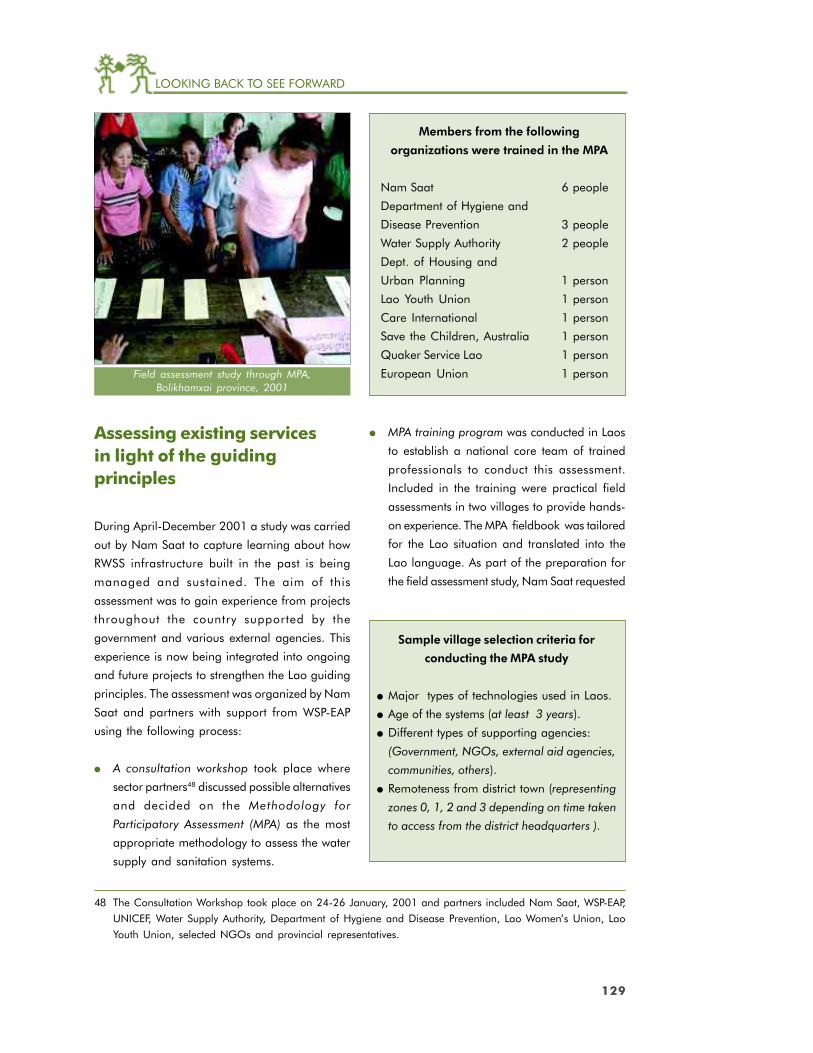
129
LOOKING BACK TO SEE FORWARD
Assessing existing servicesin light of the guidingprinciples
During April-December 2001 a study was carried
out by Nam Saat to capture learning about how
RWSS infrastructure built in the past is being
managed and sustained. The aim of this
assessment was to gain experience from projects
throughout the country supported by the
government and various external agencies. This
experience is now being integrated into ongoing
and future projects to strengthen the Lao guiding
principles. The assessment was organized by Nam
Saat and partners with support from WSP-EAP
using the following process:
● A consultation workshop took place where
sector partners48 discussed possible alternatives
and decided on the Methodology for
Participatory Assessment (MPA) as the most
appropriate methodology to assess the water
supply and sanitation systems.
● MPA training program was conducted in Laos
to establish a national core team of trained
professionals to conduct this assessment.
Included in the training were practical field
assessments in two villages to provide hands-
on experience. The MPA fieldbook was tailored
for the Lao situation and translated into the
Lao language. As part of the preparation for
the field assessment study, Nam Saat requested
48 The Consultation Workshop took place on 24-26 January, 2001 and partners included Nam Saat, WSP-EAP,
UNICEF, Water Supply Authority, Department of Hygiene and Disease Prevention, Lao Women’s Union, Lao
Youth Union, selected NGOs and provincial representatives.
Members from the following
organizations were trained in the MPA
Nam Saat 6 people
Department of Hygiene and
Disease Prevention 3 people
Water Supply Authority 2 people
Dept. of Housing and
Urban Planning 1 person
Lao Youth Union 1 person
Care International 1 person
Save the Children, Australia 1 person
Quaker Service Lao 1 person
European Union 1 person
Sample village selection criteria for
conducting the MPA study
● Major types of technologies used in Laos.
● Age of the systems (at least 3 years).
● Different types of supporting agencies:
(Government, NGOs, external aid agencies,
communities, others).
● Remoteness from district town (representing
zones 0, 1, 2 and 3 depending on time taken
to access from the district headquarters ).
Field assessment study through MPA,Bolikhamxai province, 2001
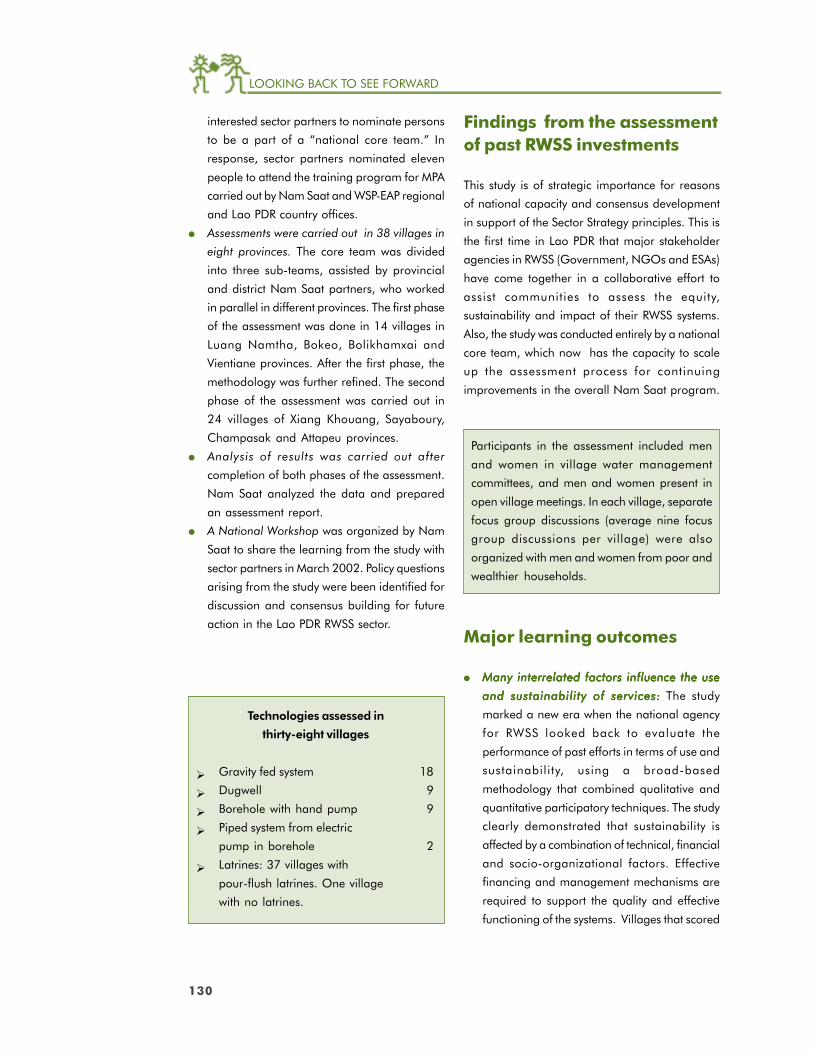
130
LOOKING BACK TO SEE FORWARD
interested sector partners to nominate persons
to be a part of a “national core team.” In
response, sector partners nominated eleven
people to attend the training program for MPA
carried out by Nam Saat and WSP-EAP regional
and Lao PDR country offices.
● Assessments were carried out in 38 villages in
eight provinces. The core team was divided
into three sub-teams, assisted by provincial
and district Nam Saat partners, who worked
in parallel in different provinces. The first phase
of the assessment was done in 14 villages in
Luang Namtha, Bokeo, Bolikhamxai and
Vientiane provinces. After the first phase, the
methodology was further refined. The second
phase of the assessment was carried out in
24 villages of Xiang Khouang, Sayaboury,
Champasak and Attapeu provinces.
● Analysis of results was carried out after
completion of both phases of the assessment.
Nam Saat analyzed the data and prepared
an assessment report.
● A National Workshop was organized by Nam
Saat to share the learning from the study with
sector partners in March 2002. Policy questions
arising from the study were been identified for
discussion and consensus building for future
action in the Lao PDR RWSS sector.
Findings from the assessmentof past RWSS investments
This study is of strategic importance for reasons
of national capacity and consensus development
in support of the Sector Strategy principles. This is
the first time in Lao PDR that major stakeholder
agencies in RWSS (Government, NGOs and ESAs)
have come together in a collaborative effort to
assist communities to assess the equity,
sustainability and impact of their RWSS systems.
Also, the study was conducted entirely by a national
core team, which now has the capacity to scale
up the assessment process for continuing
improvements in the overall Nam Saat program.
Participants in the assessment included men
and women in village water management
committees, and men and women present in
open village meetings. In each village, separate
focus group discussions (average nine focus
group discussions per village) were also
organized with men and women from poor and
wealthier households.
Major learning outcomes
● Many interrelated factors influence the useMany interrelated factors influence the useMany interrelated factors influence the useMany interrelated factors influence the useMany interrelated factors influence the use
and sustainability of services:and sustainability of services:and sustainability of services:and sustainability of services:and sustainability of services: The study
marked a new era when the national agency
for RWSS looked back to evaluate the
performance of past efforts in terms of use and
sustainability, using a broad-based
methodology that combined qualitative and
quantitative participatory techniques. The study
clearly demonstrated that sustainability is
affected by a combination of technical, financial
and socio-organizational factors. Effective
financing and management mechanisms are
required to support the quality and effective
functioning of the systems. Villages that scored
Technologies assessed in
thirty-eight villages
Gravity fed system 18
Dugwell 9
Borehole with hand pump 9
Piped system from electric
pump in borehole 2
Latrines: 37 villages with
pour-flush latrines. One village
with no latrines.

131
LOOKING BACK TO SEE FORWARD
highest on sustainability tended to do well on
all the factors, whereas villages where one or
more factor lagged, overall sustainability
scores tended to be dragged down (see Figure
21).
● Ownership of Services helps sustainability:Ownership of Services helps sustainability:Ownership of Services helps sustainability:Ownership of Services helps sustainability:Ownership of Services helps sustainability:
Overall, only 8 percent of the sampled villages
(three communities) showed high sustainability
scores of 300 or more on a 400-point scale).
In these cases, all the factors had been
optimized to encourage local ownership,
resulting in better sustainability. As Figure 22
illustrates, around 53 percent of the sample
villages (20 communities) judged their four
components for sustainability to be acceptable.
The remaining 39 percent (15 communities)
had low ratings, suggesting poor sustainability.
● PPPPPerceptions of benefits from improved facilitieserceptions of benefits from improved facilitieserceptions of benefits from improved facilitieserceptions of benefits from improved facilitieserceptions of benefits from improved facilities
vary between communities and outsiders:vary between communities and outsiders:vary between communities and outsiders:vary between communities and outsiders:vary between communities and outsiders: For
household latrines, men and women identified
“comfort and convenience” as being the main
benefit. External agencies have so far mainly
stressed “health” as the most important benefit
while promoting sanitation and hygiene
awareness, without taking into account the
perceptions of the users. The study
demonstrated that communities’ views often
differ from those of outside agencies. This will
help Nam Saat to develop new hygiene
Figure 21 How effectively are water services sustained?
300 - 400 (good)
200 - 299 (moderate)
< 200 (poor)
8%
39%
53%
(percentage of villages)
Figure 22 Overall sustainability of
water supply in 38 villages
Minimum scoreindicating
sustainability
Vo
ngvi
lay
Kokk
ong
Vo
ngsa
mp
hanh
Ban
Mai
Laya
okan
g
Laya
onua
kao
Pho
nsa
vad
Kua
ncha
nh
Pha
da
i
Pun
g
Sid
on
ng
eun
Na
mm
a
Na
mto
ung
Hui
a P
heun
g
Non
saa
t
Hei
r
Bun
gke
o
Ka
tiup
Ban
km 1
9
Mo
rphu
Tao
ho
me
Nam
bak
Phie
ng
ng
am
Borp
iet
Nam
on N
ua
Som
sin
sai
Pang
kha
m
Do
nem
an
e
Takd
ad
Bun
gm
a
Na
hint
ay
Na
mlin
Nay
ong
Hok
ang
Xien
gki
eo
Ban
Fai
Ba
an
Pha
tha
ng
XiengkhouangAttapeu BLK Bokeo Champasak Luang Namtha VTE Xayaboury
400
350
300
250
200
150
100
50
0
Score
(Grouped by province)
System Quality Effective Functioning Effective Financing Effective Management
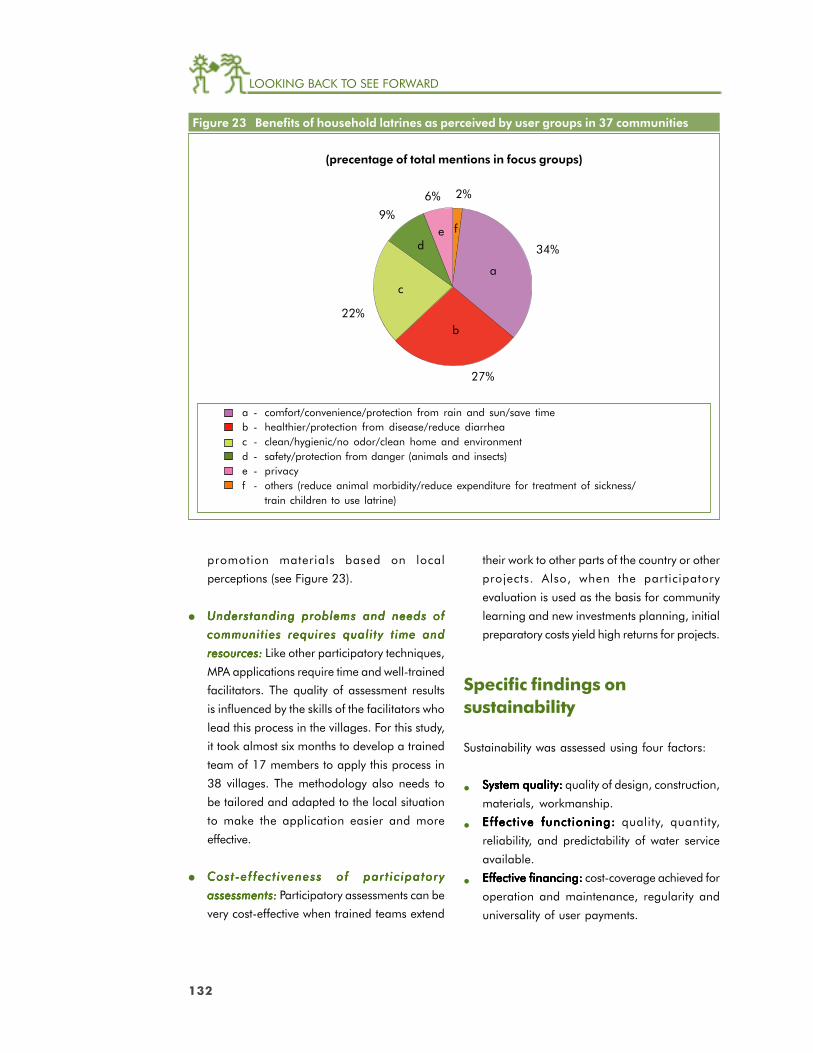
132
LOOKING BACK TO SEE FORWARD
(precentage of total mentions in focus groups)
a - comfort/convenience/protection from rain and sun/save timeb - healthier/protection from disease/reduce diarrheac - clean/hygienic/no odor/clean home and environmentd - safety/protection from danger (animals and insects)e - privacyf - others (reduce animal morbidity/reduce expenditure for treatment of sickness/
train children to use latrine)
2%
34%
27%
22%
9%
6%
Figure 23 Benefits of household latrines as perceived by user groups in 37 communities
promotion materials based on local
perceptions (see Figure 23).
● Understanding problems and needs ofUnderstanding problems and needs ofUnderstanding problems and needs ofUnderstanding problems and needs ofUnderstanding problems and needs of
communities requires quality time andcommunities requires quality time andcommunities requires quality time andcommunities requires quality time andcommunities requires quality time and
resources:resources:resources:resources:resources: Like other participatory techniques,
MPA applications require time and well-trained
facilitators. The quality of assessment results
is influenced by the skills of the facilitators who
lead this process in the villages. For this study,
it took almost six months to develop a trained
team of 17 members to apply this process in
38 villages. The methodology also needs to
be tailored and adapted to the local situation
to make the application easier and more
effective.
● Cost-ef fect iveness of par t ic ipatoryCost -ef fect iveness of par t ic ipatoryCost -ef fect iveness of par t ic ipatoryCost -ef fect iveness of par t ic ipatoryCost -ef fect iveness of par t ic ipatory
assessments:assessments:assessments:assessments:assessments: Participatory assessments can be
very cost-effective when trained teams extend
their work to other parts of the country or other
projects. Also, when the participatory
evaluation is used as the basis for community
learning and new investments planning, initial
preparatory costs yield high returns for projects.
Specific findings onsustainability
Sustainability was assessed using four factors:
System quality:System quality:System quality:System quality:System quality: quality of design, construction,
materials, workmanship.
Effect ive funct ioning:Effect ive funct ioning:Effect ive funct ioning:Effect ive funct ioning:Effect ive funct ioning: quality, quantity,
reliability, and predictability of water service
available.
Effective financing:Effective financing:Effective financing:Effective financing:Effective financing: cost-coverage achieved for
operation and maintenance, regularity and
universality of user payments.
a
b
c
de f
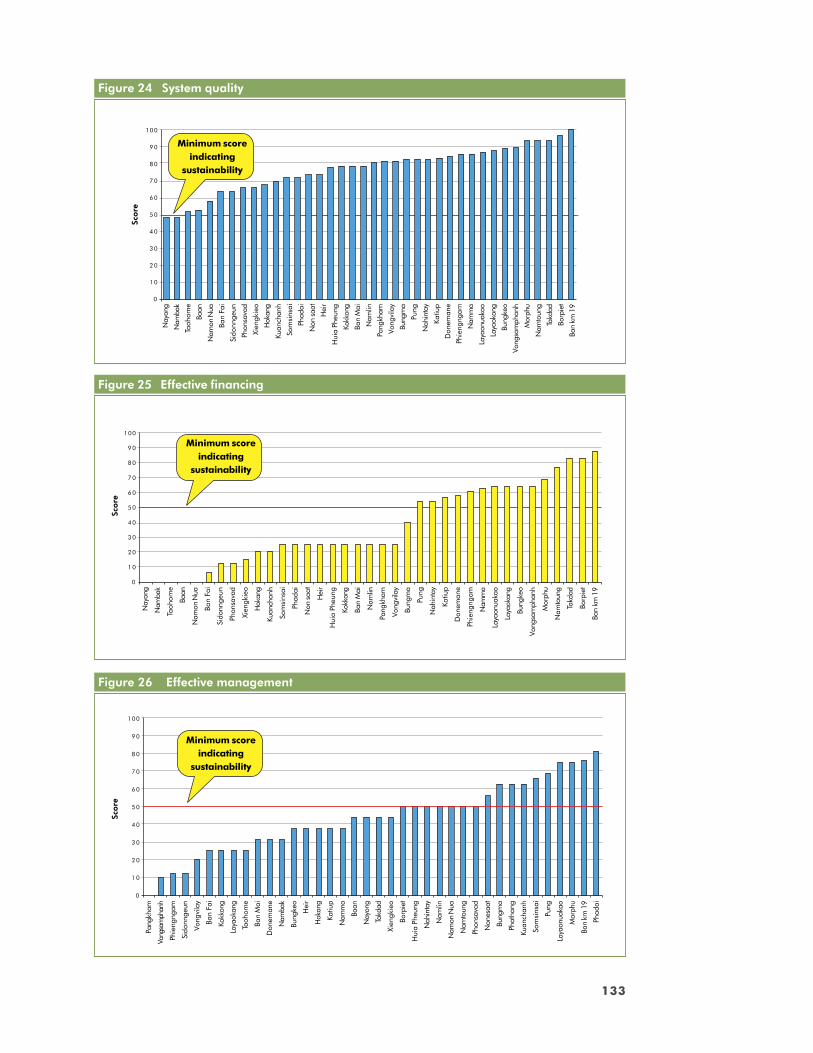
133
LOOKING BACK TO SEE FORWARDFigure 24 System quality
Figure 25 Effective financing
Figure 26 Effective management
Nay
ong
Nam
bak
Taoh
ome
Baan
Nam
on N
ua
Ban
Fai
Sido
nnge
un
Phon
sava
d
Xien
gkie
o
Hok
ang
Kuan
chan
h
Som
sins
ai
Phad
ai
Non
saat
Hei
r
Hui
a Ph
eung
Kokk
ong
Ban
Mai
Nam
lin
Pang
kham
Vong
vila
y
Bung
ma
Pung
Nah
inta
y
Katiu
p
Don
eman
e
Phie
ngng
am
Nam
ma
Laya
onua
kao
Laya
okan
g
Bung
keo
Vong
sam
phan
h
Mor
phu
Nam
toun
g
Takd
ad
Borp
iet
Ban
km 1
9
Pang
kham
Vong
sam
phan
h
Phie
ngng
am
Sido
nnge
un
Vong
vila
y
Ban
Fai
Kokk
ong
Laya
okan
g
Taoh
ome
Ban
Mai
Don
eman
e
Nam
bak
Bung
keo
Hei
r
Hok
ang
Katiu
p
Nam
ma
Baan
Nay
ong
Takd
ad
Xien
gkie
o
Borp
iet
Hui
a Ph
eung
Nah
inta
y
Nam
lin
Nam
on N
ua
Nam
toun
g
Phon
sava
d
Non
esaa
t
Bung
ma
Phat
hang
Kuan
chan
h
Som
sins
ai
Pung
Laya
onua
kao
Mor
phu
Ban
km 1
9
Phad
ai
100
9 0
8 0
7 0
6 0
5 0
4 0
3 0
2 0
1 0
0
Minimum scoreindicating
sustainability
Score
Minimum scoreindicating
sustainability
100
9 0
8 0
7 0
6 0
5 0
4 0
3 0
2 0
1 0
0
Nay
ong
Nam
bak
Taoh
ome
Baan
Nam
on N
ua
Ban
Fai
Sido
nnge
un
Phon
sava
d
Xien
gkie
o
Hok
ang
Kuan
chan
h
Som
sins
ai
Phad
ai
Non
saat
Hei
r
Hui
a Ph
eung
Kokk
ong
Ban
Mai
Nam
lin
Pang
kham
Vong
vila
y
Bung
ma
Pung
Nah
inta
y
Katiu
p
Don
eman
e
Phie
ngng
am
Nam
ma
Laya
onua
kao
Laya
okan
g
Bung
keo
Vong
sam
phan
h
Mor
phu
Nam
toun
g
Takd
ad
Borp
iet
Ban
km 1
9
Score
Minimum scoreindicating
sustainability
100
9 0
8 0
7 0
6 0
5 0
4 0
3 0
2 0
1 0
0
Score
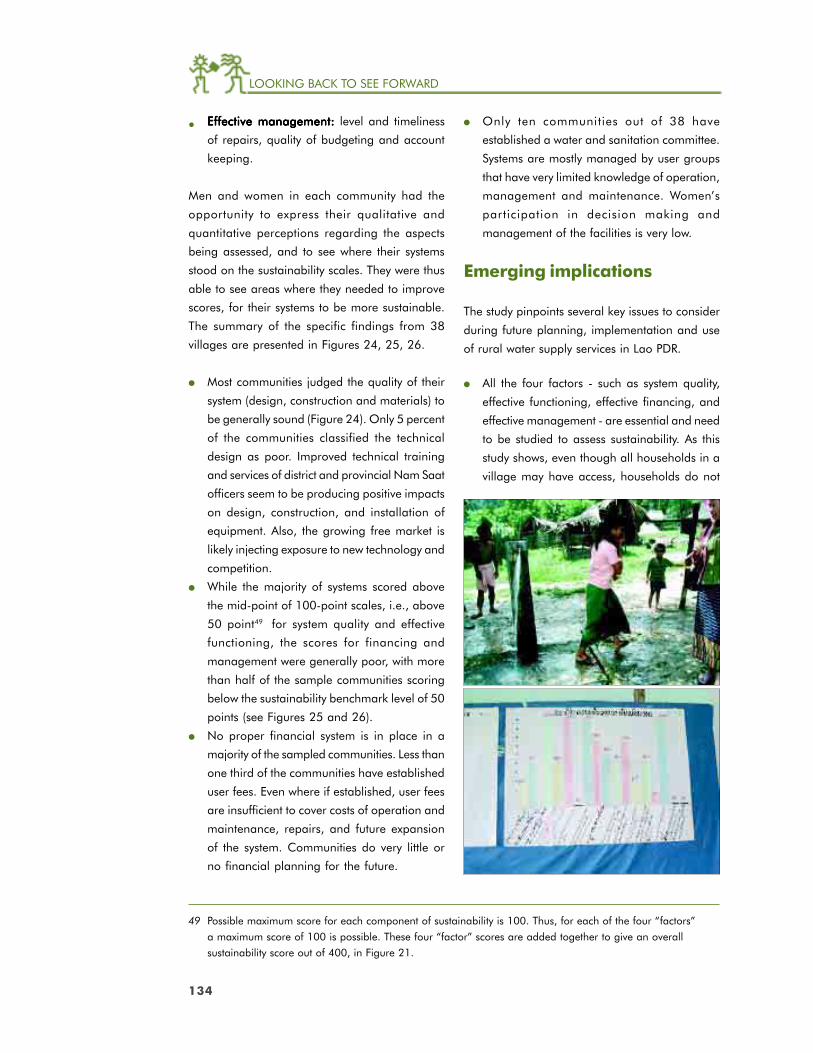
134
LOOKING BACK TO SEE FORWARD
Effective management:Effective management:Effective management:Effective management:Effective management: level and timeliness
of repairs, quality of budgeting and account
keeping.
Men and women in each community had the
opportunity to express their qualitative and
quantitative perceptions regarding the aspects
being assessed, and to see where their systems
stood on the sustainability scales. They were thus
able to see areas where they needed to improve
scores, for their systems to be more sustainable.
The summary of the specific findings from 38
villages are presented in Figures 24, 25, 26.
● Most communities judged the quality of their
system (design, construction and materials) to
be generally sound (Figure 24). Only 5 percent
of the communities classified the technical
design as poor. Improved technical training
and services of district and provincial Nam Saat
officers seem to be producing positive impacts
on design, construction, and installation of
equipment. Also, the growing free market is
likely injecting exposure to new technology and
competition.
● While the majority of systems scored above
the mid-point of 100-point scales, i.e., above
50 point49 for system quality and effective
functioning, the scores for financing and
management were generally poor, with more
than half of the sample communities scoring
below the sustainability benchmark level of 50
points (see Figures 25 and 26).
● No proper financial system is in place in a
majority of the sampled communities. Less than
one third of the communities have established
user fees. Even where if established, user fees
are insufficient to cover costs of operation and
maintenance, repairs, and future expansion
of the system. Communities do very little or
no financial planning for the future.
49 Possible maximum score for each component of sustainability is 100. Thus, for each of the four “factors”
a maximum score of 100 is possible. These four “factor” scores are added together to give an overall
sustainability score out of 400, in Figure 21.
● Only ten communities out of 38 have
established a water and sanitation committee.
Systems are mostly managed by user groups
that have very limited knowledge of operation,
management and maintenance. Women’s
participation in decision making and
management of the facilities is very low.
Emerging implications
The study pinpoints several key issues to consider
during future planning, implementation and use
of rural water supply services in Lao PDR.
● All the four factors - such as system quality,
effective functioning, effective financing, and
effective management - are essential and need
to be studied to assess sustainability. As this
study shows, even though all households in a
village may have access, households do not
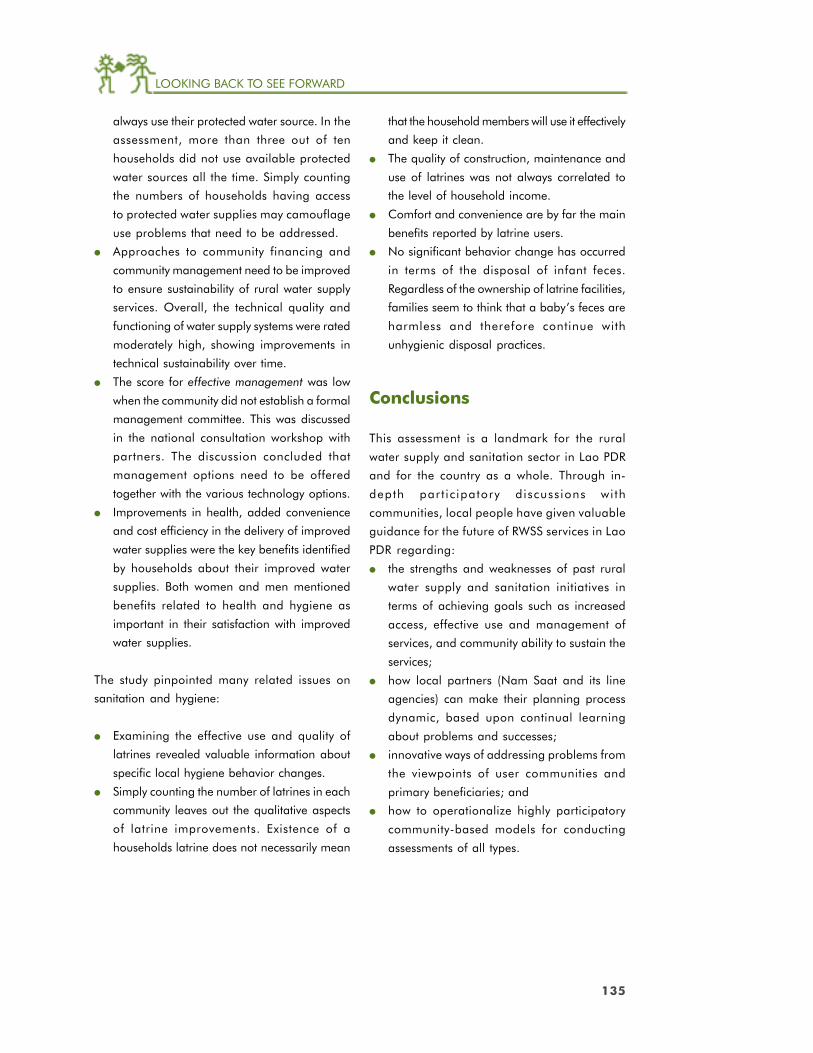
135
LOOKING BACK TO SEE FORWARD
always use their protected water source. In the
assessment, more than three out of ten
households did not use available protected
water sources all the time. Simply counting
the numbers of households having access
to protected water supplies may camouflage
use problems that need to be addressed.
● Approaches to community financing and
community management need to be improved
to ensure sustainability of rural water supply
services. Overall, the technical quality and
functioning of water supply systems were rated
moderately high, showing improvements in
technical sustainability over time.
● The score for effective management was low
when the community did not establish a formal
management committee. This was discussed
in the national consultation workshop with
partners. The discussion concluded that
management options need to be offered
together with the various technology options.
● Improvements in health, added convenience
and cost efficiency in the delivery of improved
water supplies were the key benefits identified
by households about their improved water
supplies. Both women and men mentioned
benefits related to health and hygiene as
important in their satisfaction with improved
water supplies.
The study pinpointed many related issues on
sanitation and hygiene:
● Examining the effective use and quality of
latrines revealed valuable information about
specific local hygiene behavior changes.
● Simply counting the number of latrines in each
community leaves out the qualitative aspects
of latrine improvements. Existence of a
households latrine does not necessarily mean
that the household members will use it effectively
and keep it clean.
● The quality of construction, maintenance and
use of latrines was not always correlated to
the level of household income.
● Comfort and convenience are by far the main
benefits reported by latrine users.
● No significant behavior change has occurred
in terms of the disposal of infant feces.
Regardless of the ownership of latrine facilities,
families seem to think that a baby’s feces are
harmless and therefore continue with
unhygienic disposal practices.
Conclusions
This assessment is a landmark for the rural
water supply and sanitation sector in Lao PDR
and for the country as a whole. Through in-
depth part ic ipatory discuss ions wi th
communities, local people have given valuable
guidance for the future of RWSS services in Lao
PDR regarding:
● the strengths and weaknesses of past rural
water supply and sanitation initiatives in
terms of achieving goals such as increased
access, effective use and management of
services, and community ability to sustain the
services;
● how local partners (Nam Saat and its line
agencies) can make their planning process
dynamic, based upon continual learning
about problems and successes;
● innovative ways of addressing problems from
the viewpoints of user communities and
primary beneficiaries; and
● how to operationalize highly participatory
community-based models for conducting
assessments of all types.
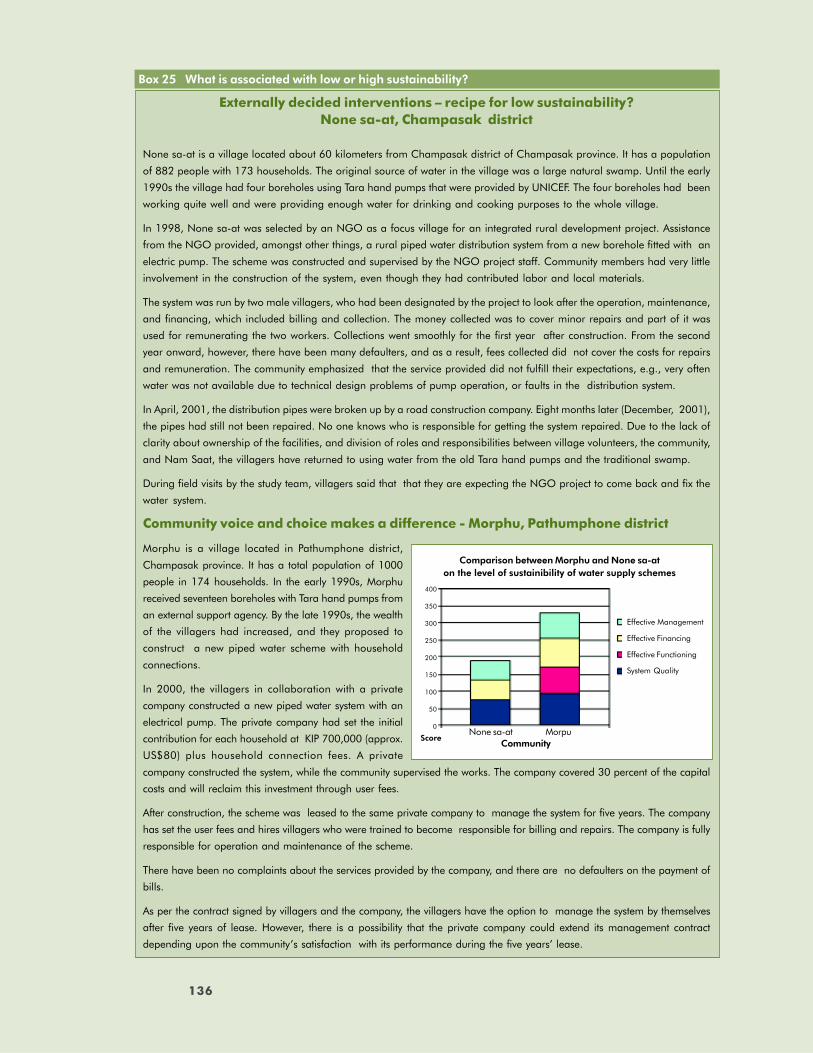
136
LOOKING BACK TO SEE FORWARD
136
Externally decided interventions – recipe for low sustainability?None sa-at, Champasak district
None sa-at is a village located about 60 kilometers from Champasak district of Champasak province. It has a population
of 882 people with 173 households. The original source of water in the village was a large natural swamp. Until the early
1990s the village had four boreholes using Tara hand pumps that were provided by UNICEF. The four boreholes had been
working quite well and were providing enough water for drinking and cooking purposes to the whole village.
In 1998, None sa-at was selected by an NGO as a focus village for an integrated rural development project. Assistance
from the NGO provided, amongst other things, a rural piped water distribution system from a new borehole fitted with an
electric pump. The scheme was constructed and supervised by the NGO project staff. Community members had very little
involvement in the construction of the system, even though they had contributed labor and local materials.
The system was run by two male villagers, who had been designated by the project to look after the operation, maintenance,
and financing, which included billing and collection. The money collected was to cover minor repairs and part of it was
used for remunerating the two workers. Collections went smoothly for the first year after construction. From the second
year onward, however, there have been many defaulters, and as a result, fees collected did not cover the costs for repairs
and remuneration. The community emphasized that the service provided did not fulfill their expectations, e.g., very often
water was not available due to technical design problems of pump operation, or faults in the distribution system.
In April, 2001, the distribution pipes were broken up by a road construction company. Eight months later (December, 2001),
the pipes had still not been repaired. No one knows who is responsible for getting the system repaired. Due to the lack of
clarity about ownership of the facilities, and division of roles and responsibilities between village volunteers, the community,
and Nam Saat, the villagers have returned to using water from the old Tara hand pumps and the traditional swamp.
During field visits by the study team, villagers said that that they are expecting the NGO project to come back and fix the
water system.
Community voice and choice makes a difference - Morphu, Pathumphone district
Morphu is a village located in Pathumphone district,
Champasak province. It has a total population of 1000
people in 174 households. In the early 1990s, Morphu
received seventeen boreholes with Tara hand pumps from
an external support agency. By the late 1990s, the wealth
of the villagers had increased, and they proposed to
construct a new piped water scheme with household
connections.
In 2000, the villagers in collaboration with a private
company constructed a new piped water system with an
electrical pump. The private company had set the initial
contribution for each household at KIP 700,000 (approx.
US$80) plus household connection fees. A private
company constructed the system, while the community supervised the works. The company covered 30 percent of the capital
costs and will reclaim this investment through user fees.
After construction, the scheme was leased to the same private company to manage the system for five years. The company
has set the user fees and hires villagers who were trained to become responsible for billing and repairs. The company is fully
responsible for operation and maintenance of the scheme.
There have been no complaints about the services provided by the company, and there are no defaulters on the payment of
bills.
As per the contract signed by villagers and the company, the villagers have the option to manage the system by themselves
after five years of lease. However, there is a possibility that the private company could extend its management contract
depending upon the community’s satisfaction with its performance during the five years’ lease.
Box 25 What is associated with low or high sustainability?
None sa-at MorpuCommunity
Effective Management
Effective Financing
Effective Functioning
System Quality
Score
400
350
300
250
200
150
100
50
0
Comparison between Morphu and None sa-aton the level of sustainibility of water supply schemes
137
LOOKING BACK TO SEE FORWARD
MPA core team members in Lao PDR
Sonephet Chanthaphone, WASA
Kheuvanh Souphindara, Nam Saat
Ving Sengsirichanh, Nam Saat
Khonekeo Phongvichit, Nam Saat
Phousavanh Sisavath, Nam Saat
Keo Oudom Namsena, Nam Saat
Bolilak Duangsavanh, Youth Union
Dengsong Seunou, Care International
Vanthong Sengvilay, Save the Children - Australia
Sengpaseuth Simmanivong, Quaker Service Laos
Sisavanh Phanouvong, focal Point for MPA, WSP-EAP
138
EFFECT OF THE MPA ON GENDER RELATIONS IN THE COMMUNITY
In September 2000, a group of MPA practitioners
carried out an MPA asssessment with the
community members of Sewukan community in
Magelang district, Java, Indonesia. The purpose
was to assess the community’s experiences with
their existing water supplies before embarking on
the design and construction of a new, additional
system. Before their participation in the
assessment, the women in Sewukan had met only
to discuss social or religious events. Their
participation in the evaluation of the existing water
supplies in the community affected gender relations
in several ways.
Value of women’s knowledgerecognized
Initially, the kepala dusun (sub-village head)
considered the consultation of women on
technical design and construction of the water
systems a waste of time. He said that women
knew nothing about such matters. However, his
views and those of the other men changed when
the group of women pointed out significant
Effects of the MPA on GenderRelations in the CommunityCase study from Java, Indonesia
Christine van Wijk
design errors such as too low a ratio of cement
to sand in concrete mixing50 and entry points
for the water pipes being set too low in the
reservoirs. The men’s group had given only very
general remarks such as lack of training. The
experience led the kepala dusun to make, in
that culture, an unusual remark in public that
the women had brought out more useful
technical observations than the men. When the
men presented the outcomes in the plenary
meeting (women and men alternated in
presentations and the men started), they
presented only the women’s findings. This
brought general hilarity, when a man in the
audience asked: “But what about our findings?”
Gender-specific needs anddemands brought out
The women’s evaluation of the existing water
systems also brought out two major women’s
needs for the new project: a better distribution of
domestic water and the addition of a sanitation
component to the project.
50 Reportedly observed by women during the construction of the facility by the contractor hired by the Public
Works Department.
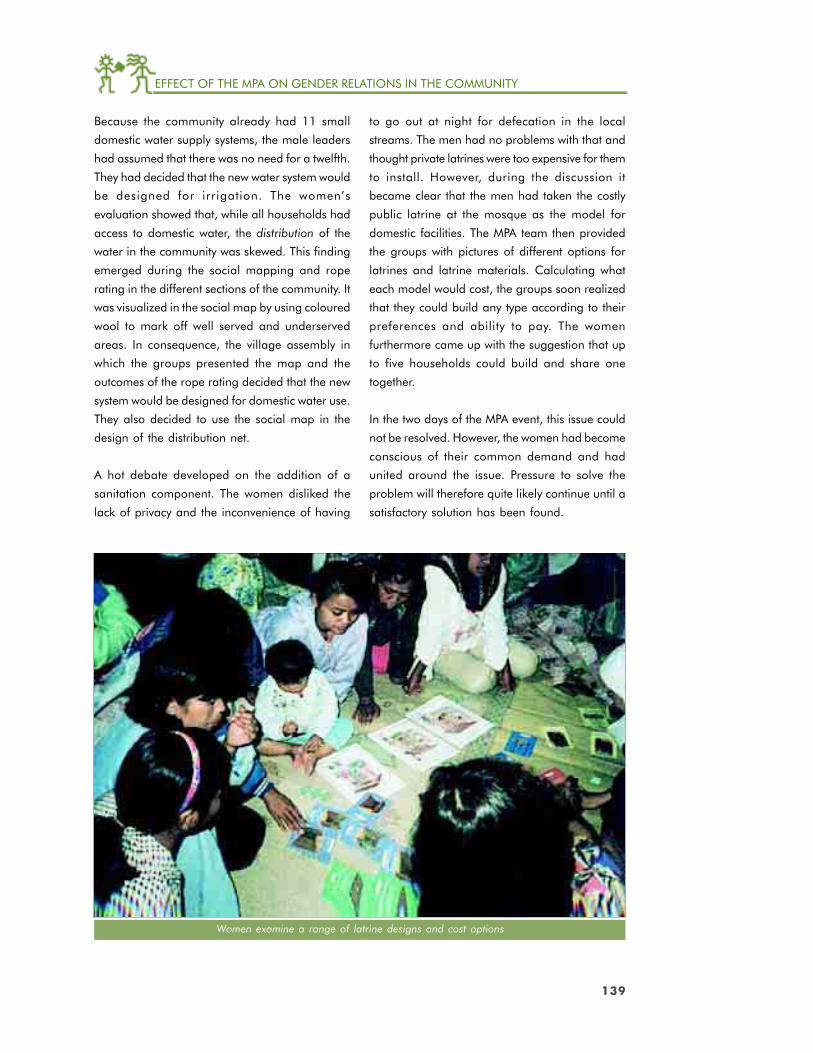
139
EFFECT OF THE MPA ON GENDER RELATIONS IN THE COMMUNITY
Because the community already had 11 small
domestic water supply systems, the male leaders
had assumed that there was no need for a twelfth.
They had decided that the new water system would
be designed for irrigation. The women’s
evaluation showed that, while all households had
access to domestic water, the distribution of the
water in the community was skewed. This finding
emerged during the social mapping and rope
rating in the different sections of the community. It
was visualized in the social map by using coloured
wool to mark off well served and underserved
areas. In consequence, the village assembly in
which the groups presented the map and the
outcomes of the rope rating decided that the new
system would be designed for domestic water use.
They also decided to use the social map in the
design of the distribution net.
A hot debate developed on the addition of a
sanitation component. The women disliked the
lack of privacy and the inconvenience of having
EFFECT OF THE MPA ON GENDER RELATIONS IN THE COMMUNITY
Women examine a range of latrine designs and cost options
to go out at night for defecation in the local
streams. The men had no problems with that and
thought private latrines were too expensive for them
to install. However, during the discussion it
became clear that the men had taken the costly
public latrine at the mosque as the model for
domestic facilities. The MPA team then provided
the groups with pictures of different options for
latrines and latrine materials. Calculating what
each model would cost, the groups soon realized
that they could build any type according to their
preferences and ability to pay. The women
furthermore came up with the suggestion that up
to five households could build and share one
together.
In the two days of the MPA event, this issue could
not be resolved. However, the women had become
conscious of their common demand and had
united around the issue. Pressure to solve the
problem will therefore quite likely continue until a
satisfactory solution has been found.
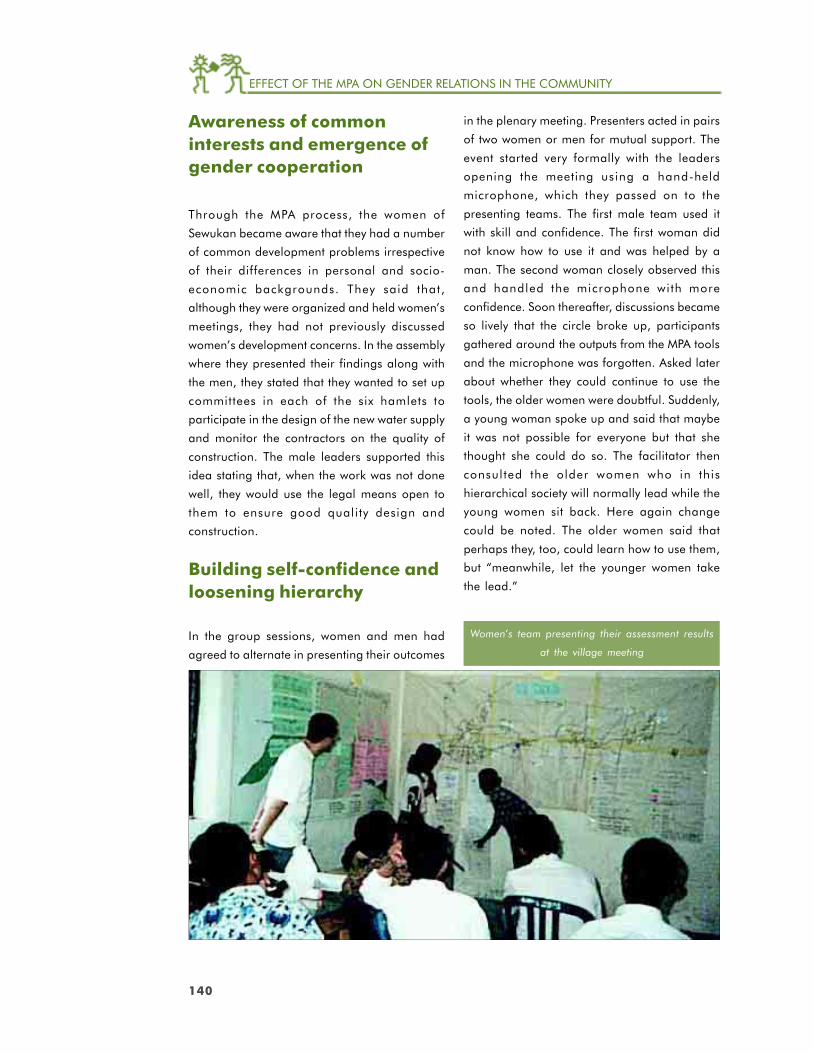
140
EFFECT OF THE MPA ON GENDER RELATIONS IN THE COMMUNITY
Awareness of commoninterests and emergence ofgender cooperation
Through the MPA process, the women of
Sewukan became aware that they had a number
of common development problems irrespective
of their differences in personal and socio-
economic backgrounds. They said that,
although they were organized and held women’s
meetings, they had not previously discussed
women’s development concerns. In the assembly
where they presented their findings along with
the men, they stated that they wanted to set up
committees in each of the six hamlets to
participate in the design of the new water supply
and monitor the contractors on the quality of
construction. The male leaders supported this
idea stating that, when the work was not done
well, they would use the legal means open to
them to ensure good quality design and
construction.
Building self-confidence andloosening hierarchy
In the group sessions, women and men had
agreed to alternate in presenting their outcomes
in the plenary meeting. Presenters acted in pairs
of two women or men for mutual support. The
event started very formally with the leaders
opening the meeting using a hand-held
microphone, which they passed on to the
presenting teams. The first male team used it
with skill and confidence. The first woman did
not know how to use it and was helped by a
man. The second woman closely observed this
and handled the microphone with more
confidence. Soon thereafter, discussions became
so lively that the circle broke up, participants
gathered around the outputs from the MPA tools
and the microphone was forgotten. Asked later
about whether they could continue to use the
tools, the older women were doubtful. Suddenly,
a young woman spoke up and said that maybe
it was not possible for everyone but that she
thought she could do so. The facilitator then
consulted the older women who in this
hierarchical society will normally lead while the
young women sit back. Here again change
could be noted. The older women said that
perhaps they, too, could learn how to use them,
but “meanwhile, let the younger women take
the lead.”
Women’s team presenting their assessment results
at the village meeting
141
EFFECT OF THE MPA ON GENDER RELATIONS IN THE COMMUNITY
MPA assessments were
carried out in selected
communities in three East
Asian countries, using a
common set of sampling
criteria, a common
sequence of tools and
methods of analysis. The
purpose of the
assessments was to
identify what helps or
hinders demands for
sanitation facilities in rural
communities, what
contributes to sustaining
sanitation services once
created, and how to reach the poor with sustained
sanitation services. All three studies were conducted
by country teams trained and assisted technically
by WSP-EAP, as a part of WSP-EAP’s policy reform
Achieving Sustained Sanitationfor the Poor51
MPA application for policy research studies in Indonesia, Cambodia, Vietnam
51 The following country reports and a regional synthesis from the 3 countries are available from WSP - East
Asia and the Pacific, or the WSP website www.wsp.org. Interested readers should look for the following
titles:
1. Achieving Sustained Sanitation for the Poor: Policy and Strategy Lessons from Participatory
Assessments in Cambodia, Indonesia and Vietnam. (WSP-EAP, 2001).
2. “Is it selling toilets?” “No, A lifestyle” (Indonesia country report). (WSP-EAP, 2000).
3. Selling Sanitation: What Works? (Vietnam country report). (WSP-EAP, 2002).
4. Learning What Works for Sanitation: Revisiting Sanitation Successes in Cambodia (Cambodia country
report). (WSP-EAP, 2002).
and sector strategy development work with country
partners. The learning gained in each country was
integrated with national sector strategies being
developed.

142
ACHIEVING SUSTAINED SANITATION FOR THE POOR
Major findings and learningemerging from the studies
1. Sanitation coverage figures generally masked
the fact that the poor households within
communities, which constituted between 20-
54 percent of all households in the sample
villages in the three countries, are not gaining
access to sanitation. Sanitation programs
everywhere have tended to promote only one
type of technology/design of facility at a fixed
cost, and have not developed options specially
suited to the poorer sections of communities.
2. Demand-responsive approaches are essential
to increasing sustained access to sanitation,
since sanitation facilities tend to have the
characteristics of consumer products.
Household latrines that people build at their
own cost are of higher quality, prove more
satisfying to their users and are maintained
much better than latrines that are subsidized
or provided free of charge.
3. Demand for and ownership of sanitation
facilities are not synonymous with improved
community sanitation behavior, i.e., consistent
use of safe excreta disposal practices by all
members of the household. A very high
proportion of latrine-owning households
continue to occasionally use unsafe, outdoor
defecation practices.
4. “Health improvements” are not the most
important motivating factor for people to
acquire household latrines. Sanitation
promotion methods currently in use are not
utilizing other, locally prevalent motivations for
acquiring sanitation improvements.
5. Women are markedly more interested in
acquiring household latrines, but programs
have not adequately targeted promotional
activities to women.
6. Even though some key hygiene behaviors are
universally important, their promotion methods
need to be varied because risky hygiene
practices take many different forms in different
cultures and vary from one community to
another. Communities usually know best what
triggers behavior change among their
members.
7. Time frames for sanitation projects need to be
longer than 4-5 years, because measurable
changes in community sanitation behavior only
happen after a viable, self-sustaining market
for sanitation services has developed, i.e.,
demand has been generated and supply
mechanisms have grown to service the demand.
Changes in community awareness of improved
sanitation as a more desirable way of life also
requires substantial population coverage to be
generated – which takes time.
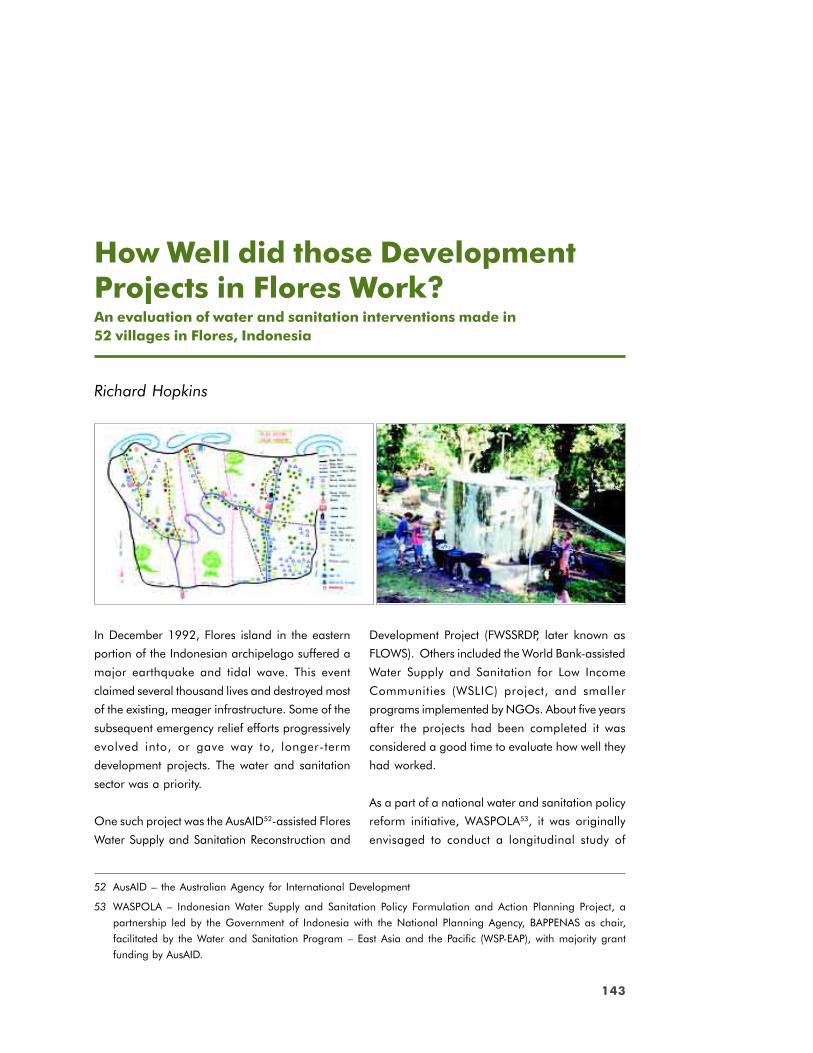
143
ACHIEVING SUSTAINED SANITATION FOR THE POOR
In December 1992, Flores island in the eastern
portion of the Indonesian archipelago suffered a
major earthquake and tidal wave. This event
claimed several thousand lives and destroyed most
of the existing, meager infrastructure. Some of the
subsequent emergency relief efforts progressively
evolved into, or gave way to, longer-term
development projects. The water and sanitation
sector was a priority.
One such project was the AusAID52-assisted Flores
Water Supply and Sanitation Reconstruction and
Richard Hopkins
How Well did those DevelopmentProjects in Flores Work?An evaluation of water and sanitation interventions made in52 villages in Flores, Indonesia
Development Project (FWSSRDP, later known as
FLOWS). Others included the World Bank-assisted
Water Supply and Sanitation for Low Income
Communities (WSLIC) project, and smaller
programs implemented by NGOs. About five years
after the projects had been completed it was
considered a good time to evaluate how well they
had worked.
As a part of a national water and sanitation policy
reform initiative, WASPOLA53, it was originally
envisaged to conduct a longitudinal study of
52 AusAID – the Australian Agency for International Development
53 WASPOLA – Indonesian Water Supply and Sanitation Policy Formulation and Action Planning Project, a
partnership led by the Government of Indonesia with the National Planning Agency, BAPPENAS as chair,
facilitated by the Water and Sanitation Program – East Asia and the Pacific (WSP-EAP), with majority grant
funding by AusAID.
144
HOW WELL DID THOSE DEVELOPMENT PROJECTS IN FLORES WORK?
sustainability and use of water supply and
environmental sanitation services in a small sample
of sites over a period of several years. The MPA
was the chosen basis for the evaluation
methodology. It expanded into a much larger-
scale assessment when AusAID expressed an
interest in gaining a better appreciation of the
current conditions of WSES54 facilities and services
across the island, particularly those constructed
under FLOWS.
To ensure representativeness of the findings and
conclusions, sampling of villages for assessment
was undertaken with adequate rigor. A stratified
random sample of 33 sites was drawn from an
estimated total of 260, properly representing the
projects, scheme size and type, districts,
topographical and climate variations across the
main island. For reasons of lack of access and
non-functioning of some facilities in the sample,
it was possible to complete the full MPA
sustainability assessments in some 52 of these 63
villages. For the rest, key informants provided the
information.
Within each village, sampling was also carefully
undertaken to ensure that all groups, especially
those traditionally marginalized – women and the
poor – were included in the assessments. Within
MPA there are specific techniques, which focus
activities on groups that may not otherwise
participate.
The approximate total direct costs for the study
were: for the international consultants US$45,000,
and for the national inputs US$105,000
equivalent.
The outcomes of the assessment provide rich
insights, mostly from the perspective of the end-
users, for stakeholders at many levels:
● the beneficiary communities themselves;
● local governments and support agencies close
to the communities;
● policymakers and decision makers in higher
levels of government; and
● external support agencies (donors funding
project/s).
Some key findings from the evaluation are
highlighted here.
1.1.1.1.1. Did aid work? Did aid work? Did aid work? Did aid work? Did aid work? (More precisely, were the
investments still providing benefits?) Of the
completed water supply schemes, almost all
were still functioning to some degree, three to
eight years after construction. It was the
communities themselves that kept the schemes
operating, with minor maintenance and
repairs. However, service levels had fallen
seriously at more than half the sites, and 22
percent of the systems were providing little or
no water for more than three months of the
year.
Similarly in the area of sanitation, those toilets
which had actually been constructed and were
working during the projects, were almost all
still functional. The distribution of toilets
between and within villages was very uneven.
The percentage of households with toilets
ranged from 6 to 100 percent in different
villages, reflecting wide inconsistencies in
project approaches or in their application.
2.2.2.2.2. Did aid work for the poor?Did aid work for the poor?Did aid work for the poor?Did aid work for the poor?Did aid work for the poor? (Was the
distribution of benefits equitable, and has it
remained so?) The access to improved water
supplies was still rated as “good”55 by the users
in 85 percent of villages, although in only 40
54 Water Supply and Environmental Sanitation (human waste, solid waste and drainage).
55 According to users “good” was a relative concept, only meaning that access was “better than before the
project”, when they used to have to walk to water sources much farther away.
145
HOW WELL DID THOSE DEVELOPMENT PROJECTS IN FLORES WORK?
percent was that access considered equally
good for all households. While there was no
evidence of systematic exclusion of the poor,
the adequacy of water was generally less good
for this group. Three to eight years after
construction, one-third of all the systems were
meeting the needs for drinking and cooking
only; for all other needs households had to
rely on other sources. Half the schemes were
able to supply water 24-hours per day all year
round. For the remainder, reliability and
predictability were seasonal, and seriously
problematic in 27 percent of all villages in the
dry season. Interestingly, these problems were
not correlated with source difficulties, or with
ecological conditions, but were related to
technical issues of design, quality of materials
and construction.
More than half the water supply schemes had
been modified from their original project
designs; most of the modifications were to the
distribution network, and almost all of those
involved house connections from the piped
network. As the systems were designed for
communal standpipes only, take-offs for house
connections affected flows in the rest of the
network. Elsewhere, plastic hoses were used
to make informal house connections and
extensions to the distribution network, though
mostly for the rich and middle-income
households. These adaptations are clear
indicators of:
● Poor consultation with end-users during the
design stage of the schemes; and
● Inequitable capturing of benefits by certain
sections of the community, usually the
wealthier and the powerful.
Where public standpipes were functioning,
some curious restrictions had been imposed
on their use, ostensibly for hygiene-related
purposes. These “rules” (see Box 26) forbade
the washing of babies and clothes in the vicinity
of the taps. Their origin and rationale were
unclear (possibly to limit consumption, or to
ameliorate drainage problems; if so neither
result was effectively achieved by such rules)
but the burden was felt mostly by those without
house connections, i.e., the poor.
Access to toilets was improved by the projects,
but was extremely variable, as noted above.
Self-financed toilets accounted for high
proportions of facilities in some regions.
Almost all toilets were used, but this did not
mean that behavioral changes had been
achieved. Three-quarters of all adults and
children (all age and gender groups) still
defecated in other places at times.
3.3.3.3.3. High rate of aborted projects, mainly due toHigh rate of aborted projects, mainly due toHigh rate of aborted projects, mainly due toHigh rate of aborted projects, mainly due toHigh rate of aborted projects, mainly due to
social conflicts.social conflicts.social conflicts.social conflicts.social conflicts. In 13 percent of the sample
villages water supply schemes were never
constructed, even though communities
contributed cash and labor. Social conflict was
Hygiene knowledge and perceptions regarding behavioral change were evaluated with representative
groups of women and men villagers using the three-pile sorting (PHAST) activity. An interesting
result was that washing children at public taps was classified by the community as a “bad practice.”
This is actually a good healthy practice, especially in dry areas, as prevention against skin and eye
infections, amongst others, and it also reduces the workload of women and girls. If this project-
imposed rule was aimed at eliminating drainage problems around public taps, it has failed to
achieve this outcome. In a high proportion of the public taps still functioning, drainage problems
continue to constitute a significant health risk.
Box 26 Project “rule” discouraging hygiene?
146
HOW WELL DID THOSE DEVELOPMENT PROJECTS IN FLORES WORK?
the major reason, especially concerning the
sharing of water resources. The projects had
no particular mechanisms to deal with this
important determinant of sustainability, neither
in brokering agreements nor in facilitating
alternative supply options in the absence of
reasonable agreements. The more ambitious
schemes were more likely to expose conflicts,
and conflicts tended to be more severe in drier
areas, where the competition for scarce
resources, especially during the dry season,
was more pronounced.
4.4.4.4.4. A few made the decisions for manyA few made the decisions for manyA few made the decisions for manyA few made the decisions for manyA few made the decisions for many..... All the
sampled projects were designed around
participatory, community-based approaches.
But in implementation, ordinary villagers (both
men and women) had little say in the key
project decisions. They had participated in 10
percent or fewer decisions about project
initiation, choice of technology or level of
service; in 19 percent of the decisions regarding
locations for facilities; in 26 percent of the
decisions about operation and maintenance
arrangements, and less than half the decisions
regarding the selection of committee members
and financing arrangements. These matters
were typically decided by project staff with the
village elite or with community leaders.
Where project planning had been more
inclusive of both women and men, and of the
poor households, water systems were
significantly better sustained and used (see
Figure 27 for correlations found).
5.5.5.5.5. Financial sustainability threatened.Financial sustainability threatened.Financial sustainability threatened.Financial sustainability threatened.Financial sustainability threatened. Regular
user payments do not cover full recurrent costs
(operation and maintenance, repairs, plus
depreciation) for water supplies in any of the
sampled villages. 59 percent of communities
have major shortfalls in covering just
operational costs. Similar to the trend seen in
determining contributions towards capital costs,
almost all villages had set fixed water user
charges for all consumers (flat rates per capita
or per household) irrespective of economic
means and lifestyles. Where these water user
fees are actually collected, the flat rate
disadvantages the poor, who tend to consume
less water, but for whom the water tariff
represents a greater proportion of their income.
This inequity likely reflects their lack of
participation in decision making as mentioned
earlier.
6.6.6.6.6. What makes for better management?What makes for better management?What makes for better management?What makes for better management?What makes for better management? Only
31 percent of the communities still have active
Water Management Organizations (WMOs)
three to eight years after project completion.
Those with higher proportions of women are
more active. More equitable (gender and
poverty inclusive) WMOs are associated with
better performing services, more effective
management and better cost recovery from user
payments. These relationships are statistically
significant (see Figure 27). The quality of local
management was the most important group
of factors correlated with sustainability
outcomes. The communities which had better
management arrangements (equitable control,
setting own rules, accounting to users for
services and financial issues) also tended to
have better functioning and more regularly
and universally paid-for services, although the
level of financing was not optimal.
Emerging lessons for agencypolicy and practice
The findings point clearly towards the following
conclusions and lessons for future projects:
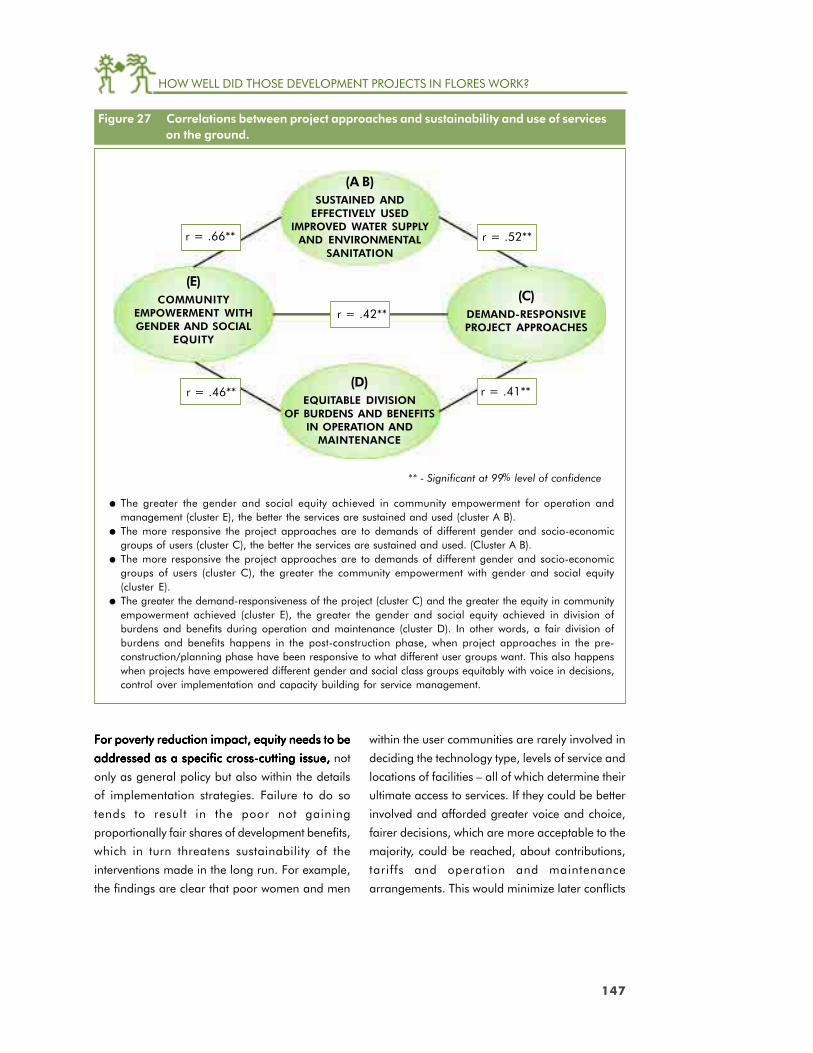
147
HOW WELL DID THOSE DEVELOPMENT PROJECTS IN FLORES WORK?
For poverty reduction impact, equity needs to beFor poverty reduction impact, equity needs to beFor poverty reduction impact, equity needs to beFor poverty reduction impact, equity needs to beFor poverty reduction impact, equity needs to be
addressed as a specific cross-cutting issue,addressed as a specific cross-cutting issue,addressed as a specific cross-cutting issue,addressed as a specific cross-cutting issue,addressed as a specific cross-cutting issue, not
only as general policy but also within the details
of implementation strategies. Failure to do so
tends to result in the poor not gaining
proportionally fair shares of development benefits,
which in turn threatens sustainability of the
interventions made in the long run. For example,
the findings are clear that poor women and men
within the user communities are rarely involved in
deciding the technology type, levels of service and
locations of facilities – all of which determine their
ultimate access to services. If they could be better
involved and afforded greater voice and choice,
fairer decisions, which are more acceptable to the
majority, could be reached, about contributions,
tariffs and operation and maintenance
arrangements. This would minimize later conflicts
Figure 27 Correlations between project approaches and sustainability and use of serviceson the ground.
● The greater the gender and social equity achieved in community empowerment for operation andmanagement (cluster E), the better the services are sustained and used (cluster A B).
● The more responsive the project approaches are to demands of different gender and socio-economicgroups of users (cluster C), the better the services are sustained and used. (Cluster A B).
● The more responsive the project approaches are to demands of different gender and socio-economicgroups of users (cluster C), the greater the community empowerment with gender and social equity(cluster E).
● The greater the demand-responsiveness of the project (cluster C) and the greater the equity in communityempowerment achieved (cluster E), the greater the gender and social equity achieved in division ofburdens and benefits during operation and maintenance (cluster D). In other words, a fair division ofburdens and benefits happens in the post-construction phase, when project approaches in the pre-construction/planning phase have been responsive to what different user groups want. This also happenswhen projects have empowered different gender and social class groups equitably with voice in decisions,control over implementation and capacity building for service management.
(A B)SUSTAINED AND
EFFECTIVELY USEDIMPROVED WATER SUPPLY
AND ENVIRONMENTALSANITATION
(D)EQUITABLE DIVISION
OF BURDENS AND BENEFITSIN OPERATION AND
MAINTENANCE
(C)DEMAND-RESPONSIVEPROJECT APPROACHES
(E)COMMUNITY
EMPOWERMENT WITHGENDER AND SOCIAL
EQUITY
r = .52**r = .66**
r = .46** r = .41**
r = .42**
** - Significant at 99% level of confidence

148
HOW WELL DID THOSE DEVELOPMENT PROJECTS IN FLORES WORK?
and refusals to pay. In designing project strategies,
it would therefore be cost-effective to allocate
resources, skills and time for engaging
communities equitably in early planning and
decision making, along with providing them
equitable access to relevant information for
making decisions. This will help communities plan
more realistically, especially in terms of:
- The scope and complexity of water supply
schemes attempted, and
- The arrangements for sharing water
resources with others.
● Equality is not equitable. Nor are communitiesEquality is not equitable. Nor are communitiesEquality is not equitable. Nor are communitiesEquality is not equitable. Nor are communitiesEquality is not equitable. Nor are communities
necessarily egalitarian.necessarily egalitarian.necessarily egalitarian.necessarily egalitarian.necessarily egalitarian. Project rules, or rules
set by community leaders which stipulate equal
contributions by all households to capital or
operating costs actually disadvantage the
poor, particularly when the poor have little
voice in community decisions.
● Equitable gender and socially inclusiveEquitable gender and socially inclusiveEquitable gender and socially inclusiveEquitable gender and socially inclusiveEquitable gender and socially inclusive
community level management organizationscommunity level management organizationscommunity level management organizationscommunity level management organizationscommunity level management organizations
are a key to sustained services.are a key to sustained services.are a key to sustained services.are a key to sustained services.are a key to sustained services. For long-term
functioning and financial sustainability of
services, it is necessary that projects help
establish such organizations, through gender-
and poverty-sensitive planning and capacity
building. This is important enough to be a
stated project objective, against which project
performance should be judged.
● WWWWWater supply scheme designs need toater supply scheme designs need toater supply scheme designs need toater supply scheme designs need toater supply scheme designs need to
reconcile technically and environmentallyreconcile technically and environmentallyreconcile technically and environmentallyreconcile technically and environmentallyreconcile technically and environmentally
feasible solutions with user communityfeasible solutions with user communityfeasible solutions with user communityfeasible solutions with user communityfeasible solutions with user community
demands.demands.demands.demands.demands. For instance, problems such as
inadequate source flows cannot be overcome
by project engineers setting arbitrary limits on
the technical options and levels of service,
when the majority of users want house
connections. The only sustainable solution in
such cases is for the user community to make
properly informed choices about technical
options and levels of service that the source
can sustain, and to set tariffs to reflect the real
costs of those choices.
● TTTTTechnicallyechnicallyechnicallyechnicallyechnically, water supply systems need to be, water supply systems need to be, water supply systems need to be, water supply systems need to be, water supply systems need to be
realistic in terms of distribution of small sourcerealistic in terms of distribution of small sourcerealistic in terms of distribution of small sourcerealistic in terms of distribution of small sourcerealistic in terms of distribution of small source
flowsflowsflowsflowsflows (which need to be measured at minimum
dry-season levels) and complexity of operations.
It is the project’s responsibility to advise
communities so that their expectations are
guided by the limits of technical feasibility.
Compromises in quality of materials and
construction due to over-ambitious schemes
can then be avoided. It is better to meet the
reasonable demands of fewer people within
single independent schemes, if necessary
having several independent schemes serving
an area, rather than complex schemes spread
over several villages.
At the policy level, the study confirms the general
thrust of the new Indonesian sector policy, with its
emphasis on sustainability and effective use, and
the application of demand-responsive approaches
through participatory methods.
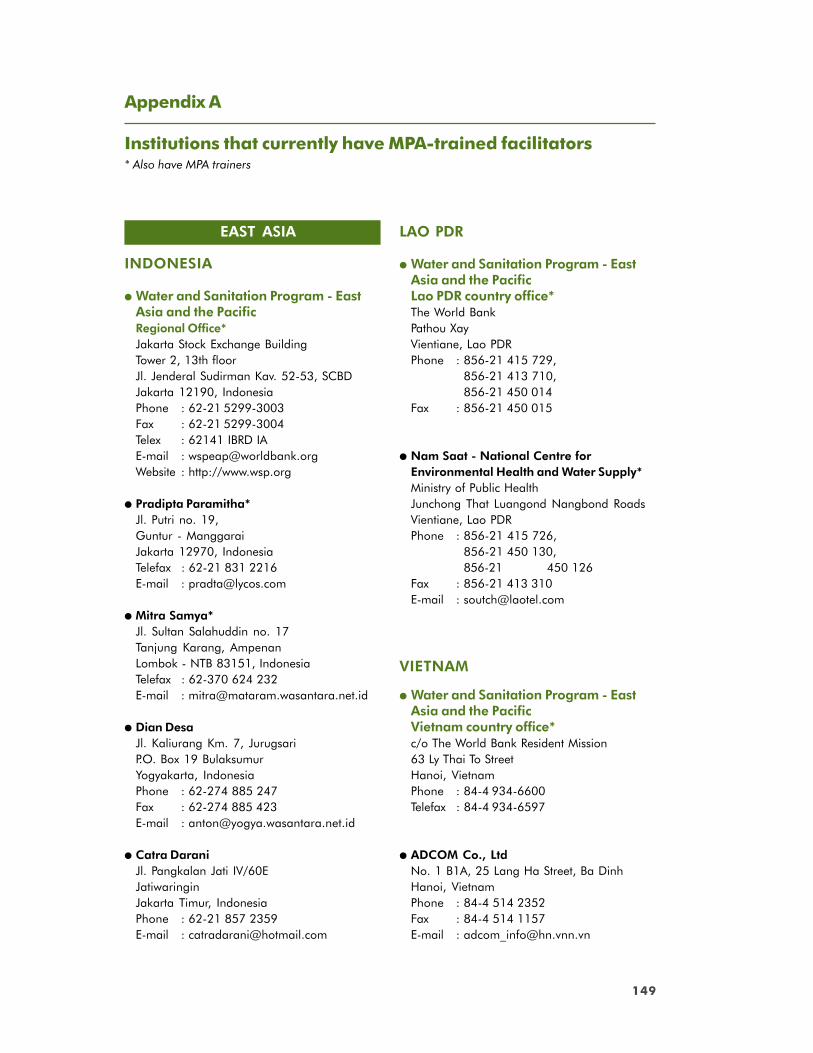
Appendix A 149
Appendix A
Institutions that currently have MPA-trained facilitators* Also have MPA trainers
EAST ASIA
INDONESIA
● Water and Sanitation Program - EastAsia and the PacificRegional Office*Jakarta Stock Exchange BuildingTower 2, 13th floorJl. Jenderal Sudirman Kav. 52-53, SCBDJakarta 12190, IndonesiaPhone : 62-21 5299-3003Fax : 62-21 5299-3004Telex : 62141 IBRD IAE-mail : [email protected] : http://www.wsp.org
● Pradipta Paramitha*Jl. Putri no. 19,Guntur - ManggaraiJakarta 12970, IndonesiaTelefax : 62-21 831 2216E-mail : [email protected]
● Mitra Samya*Jl. Sultan Salahuddin no. 17Tanjung Karang, AmpenanLombok - NTB 83151, IndonesiaTelefax : 62-370 624 232E-mail : [email protected]
● Dian DesaJl. Kaliurang Km. 7, JurugsariP.O. Box 19 BulaksumurYogyakarta, IndonesiaPhone : 62-274 885 247Fax : 62-274 885 423E-mail : [email protected]
● Catra DaraniJl. Pangkalan Jati IV/60EJatiwaringinJakarta Timur, IndonesiaPhone : 62-21 857 2359E-mail : [email protected]
LAO PDR
● Water and Sanitation Program - EastAsia and the PacificLao PDR country office*The World BankPathou XayVientiane, Lao PDRPhone : 856-21 415 729,
856-21 413 710,856-21 450 014
Fax : 856-21 450 015
● Nam Saat - National Centre forEnvironmental Health and Water Supply*Ministry of Public HealthJunchong That Luangond Nangbond RoadsVientiane, Lao PDRPhone : 856-21 415 726,
856-21 450 130,856-21 450 126
Fax : 856-21 413 310E-mail : [email protected]
VIETNAM
● Water and Sanitation Program - EastAsia and the PacificVietnam country office*c/o The World Bank Resident Mission63 Ly Thai To StreetHanoi, VietnamPhone : 84-4 934-6600Telefax : 84-4 934-6597
● ADCOM Co., LtdNo. 1 B1A, 25 Lang Ha Street, Ba DinhHanoi, VietnamPhone : 84-4 514 2352Fax : 84-4 514 1157E-mail : [email protected]

150 Appendix A
CAMBODIA*
● Partners for DevelopmentNo. 24, Street 294 (B.P.551)Phnom Penh - Kingdom of CambodiaPhone : 855 23 213 335Fax : 855 23 213 275
THE PHILIPPINES
● Philippine Center for Water and SanitationITN FoundationP-3 Minnesota Mansion 267,Ermin Garcia StreetCubao Quezon City, the PhilippinesPhone : +63 2 9120531Fax : +63 2 9115783E-mail : [email protected] : http://www.itnphil.org.ph
SOUTH ASIA
INDIA
● Socio Economic Unit Foundation*Easwara Vilasm Road,Post Box No. 507,Thycaud, Trivandrum - 14,Kerala - 695 014, IndiaPhone : +91-471 325 907Fax : +91-471 325 914E-mail : [email protected]
NEPAL
● NEWAH - Nepal Water for HealthP.O. Box 4231Baluwatar Kathmandhu, NepalPhone : +977 1 377 107Fax : +977 1 370078E-mail : [email protected]
EUROPE
● IRC International Water and SanitationCentre*P.O. Box 28692601 CW DelftThe NetherlandsTel : +31 15 21 92 957Fax : +31 15 21 90 955Website : http://www.irc.nl
AFRICA
● Water and Sanitation Program - Africa*West and Central Africa officeCorner of Booker Washington andJacques Aka StreetsCocody, Abidjan 01, Côte d’IvoirePhone : 225 22-40-04-00,
225 22-40-04-10Telefax : 225 22-40-04-61
● Institute of Water and SanitationDevelopment*Maasdoop Avenue, Alexandra Park, HarareBox MP 422 Mount PleasantHarare, ZimbabwePhone : +4 250-522Fax : +263 4 735 017, 735 026,
735 035, 250 522E-mail : [email protected] : http://www.iwsd.co.zw
● NETWAS - Network for Water andSanitationPlot no. 1, Norfolk Gardens, Lower KyambogoP.O. Box 40223Kampala, UgandaTel/fax : 256-041 286 352E-mail : [email protected]; or
LATIN AMERICA
COLUMBIA
● CINARA*AA 25157Ciudad Universitaria Melendez, edificio 344,Cali, ColumbiaPhone : 57-2 339 23 45
57-2 321 22 90Fax : 57-2 339 32 89E-mail : [email protected] : http://www.cinara.org.co
BRAZIL
● Contact Maria Lucia Cr. BorbaRua Jose GuardianoParque Primavera0632-190 Carapicuiba,Sao Paulo, BrazilPhone : +55 11 4186 0841E-mail : [email protected]
Appendix B 151
Process designed forPLA POLICY ASSESSMENT WORKSHOPIndonesia, September 1999
Appendix B
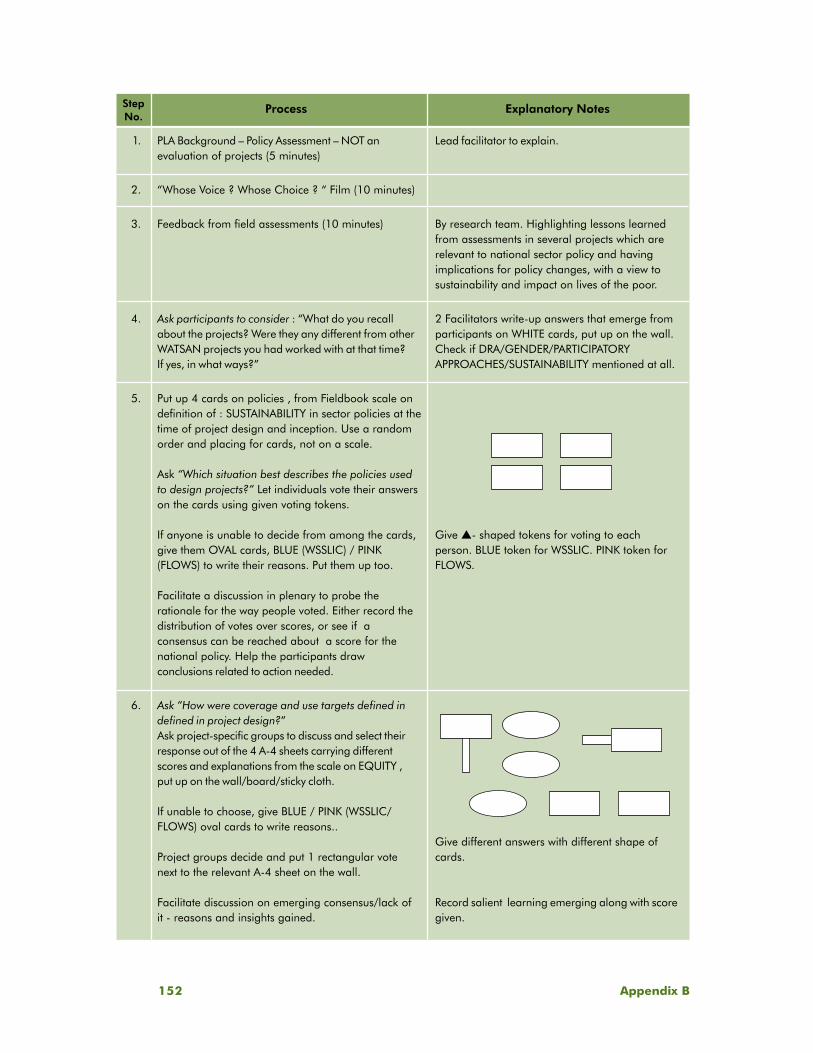
152 Appendix B
PLA Background – Policy Assessment – NOT anevaluation of projects (5 minutes)
“Whose Voice ? Whose Choice ? “ Film (10 minutes)
Feedback from field assessments (10 minutes)
Ask participants to consider : “What do you recallabout the projects? Were they any different from otherWATSAN projects you had worked with at that time?If yes, in what ways?”
Put up 4 cards on policies , from Fieldbook scale ondefinition of : SUSTAINABILITY in sector policies at thetime of project design and inception. Use a randomorder and placing for cards, not on a scale.
Ask “Which situation best describes the policies usedto design projects?” Let individuals vote their answerson the cards using given voting tokens.
If anyone is unable to decide from among the cards,give them OVAL cards, BLUE (WSSLIC) / PINK(FLOWS) to write their reasons. Put them up too.
Facilitate a discussion in plenary to probe therationale for the way people voted. Either record thedistribution of votes over scores, or see if aconsensus can be reached about a score for thenational policy. Help the participants drawconclusions related to action needed.
Ask “How were coverage and use targets defined indefined in project design?”Ask project-specific groups to discuss and select theirresponse out of the 4 A-4 sheets carrying differentscores and explanations from the scale on EQUITY ,put up on the wall/board/sticky cloth.
If unable to choose, give BLUE / PINK (WSSLIC/FLOWS) oval cards to write reasons..
Project groups decide and put 1 rectangular votenext to the relevant A-4 sheet on the wall.
Facilitate discussion on emerging consensus/lack ofit - reasons and insights gained.
StepNo.
Process Explanatory Notes
Lead facilitator to explain.
By research team. Highlighting lessons learnedfrom assessments in several projects which arerelevant to national sector policy and havingimplications for policy changes, with a view tosustainability and impact on lives of the poor.
2 Facilitators write-up answers that emerge fromparticipants on WHITE cards, put up on the wall.Check if DRA/GENDER/PARTICIPATORYAPPROACHES/SUSTAINABILITY mentioned at all.
Give ▲- shaped tokens for voting to eachperson. BLUE token for WSSLIC. PINK token forFLOWS.
Give different answers with different shape ofcards.
Record salient learning emerging along with scoregiven.
1.
2.
3.
4.
5.
6.
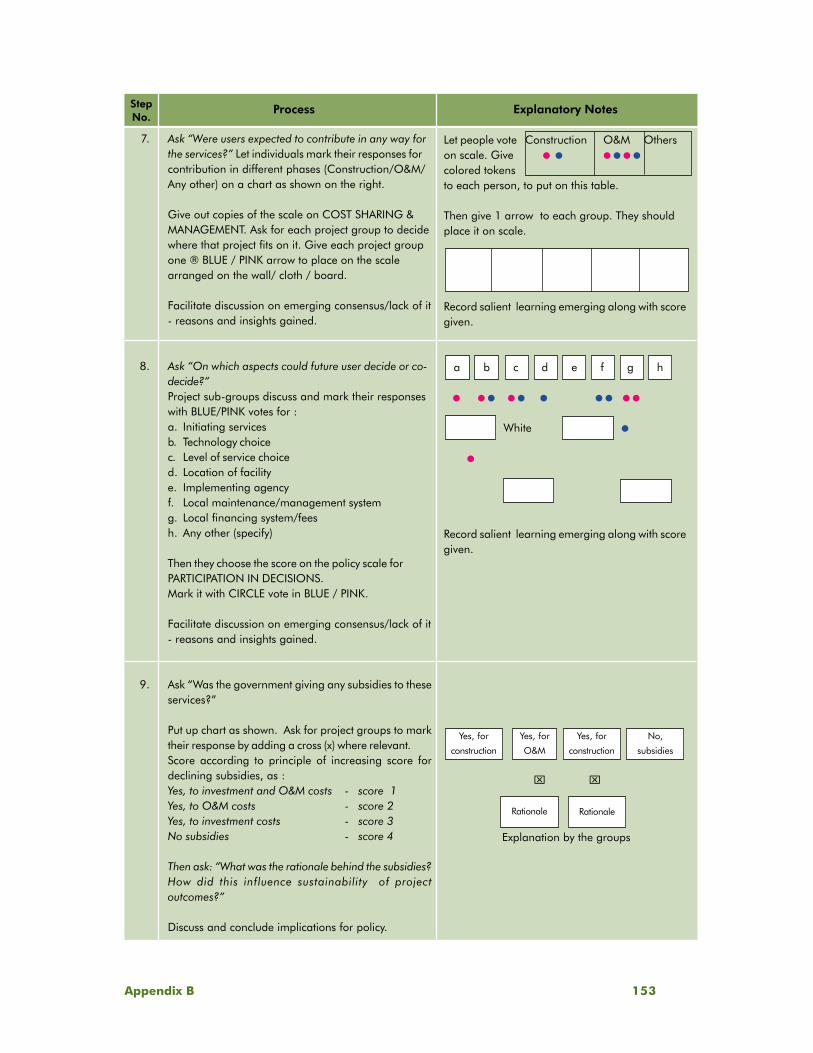
Appendix B 153
StepNo.
Process Explanatory Notes
Ask “Were users expected to contribute in any way forthe services?” Let individuals mark their responses forcontribution in different phases (Construction/O&M/Any other) on a chart as shown on the right.
Give out copies of the scale on COST SHARING &MANAGEMENT. Ask for each project group to decidewhere that project fits on it. Give each project groupone ® BLUE / PINK arrow to place on the scalearranged on the wall/ cloth / board.
Facilitate discussion on emerging consensus/lack of it- reasons and insights gained.
Ask “On which aspects could future user decide or co-decide?”Project sub-groups discuss and mark their responseswith BLUE/PINK votes for :a. Initiating servicesb. Technology choicec. Level of service choiced. Location of facilitye. Implementing agencyf. Local maintenance/management systemg. Local financing system/feesh. Any other (specify)
Then they choose the score on the policy scale forPARTICIPATION IN DECISIONS.Mark it with CIRCLE vote in BLUE / PINK.
Facilitate discussion on emerging consensus/lack of it- reasons and insights gained.
Ask “Was the government giving any subsidies to theseservices?”
Put up chart as shown. Ask for project groups to marktheir response by adding a cross (x) where relevant.Score according to principle of increasing score fordeclining subsidies, as :Yes, to investment and O&M costs - score 1Yes, to O&M costs - score 2Yes, to investment costs - score 3No subsidies - score 4
Then ask: “What was the rationale behind the subsidies?How did this influence sustainability of projectoutcomes?”
Discuss and conclude implications for policy.
7.
8.
9.
Yes, for
O&M
Yes, for
construction
No,
subsidies
Yes, for
construction
Rationale Rationale
Let people vote Construction O&M Otherson scale. Give ● ● ● ● ● ●
colored tokensto each person, to put on this table.
Then give 1 arrow to each group. They shouldplace it on scale.
Record salient learning emerging along with scoregiven.
a b c d e f g h
● ● ● ● ● ● ● ● ● ●
White ●
●
Record salient learning emerging along with scoregiven.
Explanation by the groups
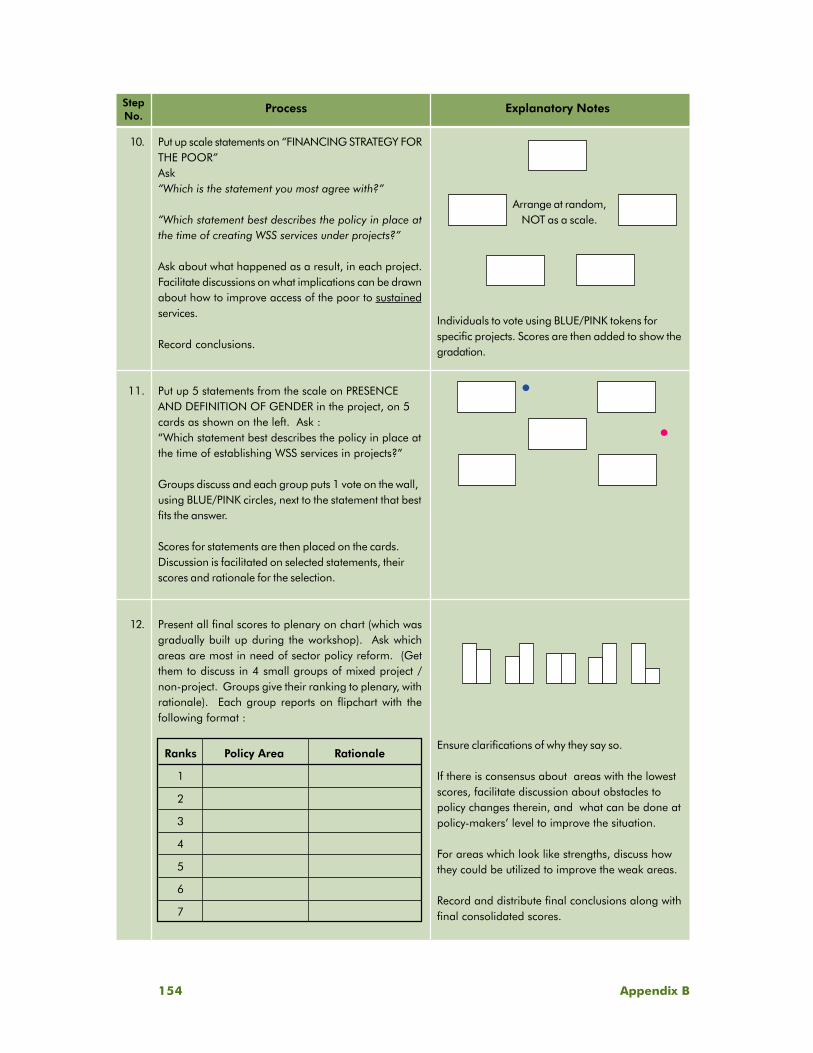
154 Appendix B
StepNo.
Process Explanatory Notes
Put up scale statements on “FINANCING STRATEGY FORTHE POOR”Ask“Which is the statement you most agree with?”
“Which statement best describes the policy in place atthe time of creating WSS services under projects?”
Ask about what happened as a result, in each project.Facilitate discussions on what implications can be drawnabout how to improve access of the poor to sustainedservices.
Record conclusions.
Put up 5 statements from the scale on PRESENCEAND DEFINITION OF GENDER in the project, on 5cards as shown on the left. Ask :“Which statement best describes the policy in place atthe time of establishing WSS services in projects?”
Groups discuss and each group puts 1 vote on the wall,using BLUE/PINK circles, next to the statement that bestfits the answer.
Scores for statements are then placed on the cards.Discussion is facilitated on selected statements, theirscores and rationale for the selection.
Present all final scores to plenary on chart (which wasgradually built up during the workshop). Ask whichareas are most in need of sector policy reform. (Getthem to discuss in 4 small groups of mixed project /non-project. Groups give their ranking to plenary, withrationale). Each group reports on flipchart with thefollowing format :
Ranks Policy Area Rationale
1
2
3
4
5
6
7
Arrange at random,NOT as a scale.
Individuals to vote using BLUE/PINK tokens forspecific projects. Scores are then added to show thegradation.
●
●
10.
11.
12.
Ensure clarifications of why they say so.
If there is consensus about areas with the lowestscores, facilitate discussion about obstacles topolicy changes therein, and what can be done atpolicy-makers’ level to improve the situation.
For areas which look like strengths, discuss howthey could be utilized to improve the weak areas.
Record and distribute final conclusions along withfinal consolidated scores.
References 155
Bernard, Russel H. (1995). Research Methods in Anthropology, Walnut Creek, London, New Delhi,
Altamira Press.
Collinson, Michael. (1981). A low-cost approach to understanding small farmers. Agricultural
Administration, 8, 433-450.
Esrey, Steven A. (1994). Complementary strategies for decreasing diarrhea morbidity and mortality:
water and sanitation. Paper presented at the Pan American Health Organization, March 2-3.
Fong, Monica S., Wakeman, Wendy and Bhushan, Anjana. (1996). Toolkit on gender in water and
sanitation. (Worldbank gender toolkit No. 2). Washington D.C. The World Bank. Also available:
http://www.worldbank.org/gender/know/agtlkit.pdf. (April 25, 2001).
Gross, Bruce. Wijk, Christine van and Mukherjee, Nilanjana. (2001). Linking Sustainability with
Demand, Gender and Poverty: A Study in community-managed water supply projects in 15 countries.
Water and Sanitation Program and IRC International Water and Sanitation Centre.
James, A.J. (2000). ‘An Improved methodology for participatory assessments’, Paper presented at
workshop on Participatory Approaches to Project Design, Implementation and Evaluation. IIRR Philippines
and MYRADA, Bangalore.
Katz, Travis and Sara, Jennifer. (1997). Making Rural Water Supply Sustainable: Recommendations
from a global study. UNDP/World Bank Water and Sanitation Program.
Kolb, D.A. (1984). Experiential learning: Experience as the source of learning and development.
Englewood Cliffs: Prentice-Hall.
Moser, Caroline O.N. (1993). Gender Planning and Development : Theory, Practice and Training.
London and New York: Routledge.
Mukherjee, Nilanjana and Josodipoero, Ratna I. (2000). Is it Selling Toilets? No, A Lifestyle. Water
and Sanitation Program – East Asia and the Pacific.
Mukherjee, Nilanjana. (2001). Achieving Sustained Sanitation for the Poor: Policy and strategy lessons
from participatory assessments in Cambodia, Indonesia and Vietnam. Water and Sanitation Program –
East Asia and the Pacific.
References
156 References
Mukherjee, Nilanjana. (2002). ‘Indonesia – Coping with Vulnerability and Crisis’, in Narayan and
Petesch (eds). From Many Lands. Washington D.C. The World Bank.
Narayan, Deepa. (1993). Participatory Evaluation: Tools for Managing Change in Water and Sanitation.
World Bank Technical Paper number 207. Washington D.C. The World Bank.
Narayan, D., Chambers, R., Shah, M.K. and Petesch, P. (2000). Crying Out for Change. The World
Bank.
Overholt, Catherine et al (eds.) (1984). Gender Roles in Development Projects: A Case Book. East
Hartford, CT: Kumarian Press.
Pfohl, Jacob. (1986). Participatory monitoring and evaluation: A user’s guide. New York: PACT
Pretty, J., Guijt, I., Thompson, I. and Scoones, I. (1995). Participatory Learning and Action: A
Trainer’s Guide. International Institute of Environment and Development, London.
Srinivasan, Lyra. (1990). Tools for Community Participation: A Manual for Training Trainers in
Participatory Techniques. PROWWESS/UNDP Technical Series, New York, N.Y.
Strassler, Dosou. (2000). La volonte de payer dans le domaine de l’eau et de l’assainissement – une
experience au Benin. Helvetas – Benin.
Walujan, R., Hopkins, R. and Istandar, A. (2002) Sanitation in Wonosobo: Two Evaluation Approaches
Compared. Water and Sanitation Program – East Asia and the Pacific.
Water and Sanitation Program – East Asia and the Pacific. (1998). Participatory Learning and
Action Initiative – Indonesia Country Report.
Water and Sanitation Program – East Asia and the Pacific. (2001). Towards Sustainability with
Equity: Report of East Asia Regional Water and Sanitation Conference.
Water and Sanitation Program – East Asia and the Pacific. (2002). Learning What Works for
Sanitation: Revisiting Sanitation Successes in Cambodia.
Water and Sanitation Program – East and Southern Africa. (2000). Demand-responsiveness,
Participation, Gender and Poverty: East and Southern Africa regional synthesis report of the Participatory
Learning and Action Initiative.
Water and Sanitation Program - South Asia. (1998). Improving Sustainability in RWSS Projects:
Report of South and East Asia Regional Water and Sanitation Conference.

References 157
Wijk, Christine van. (1998). ‘Gender in Water Resources Management’, in Water and Sanitation:
Roles and Realities Revisited. Technical paper No. 33-E. IRC International Water and Sanitation Centre.
The Hague.
Wijk-Sijbesma, Christine van. (2001). Best of two Worlds? Methodology for Participatory Assessment
of Community Water Services. IRC International Water and Sanitation Centre. Delft.
World Health Organization. (1983). Minimum Evaluation Procedures (MEP) for Water Supply and
Sanitation Projects, Geneva.
World Health Organization (1998). PHAST Step-by-Step Guide: A Participatory Approach for the
Control of Diarrhoea Disease, Geneva.
Woroniuk, Beth (Ed.). (1994). Gender and water resources management, II (Report of a workshop
held in Stockholm, 1-3 December 1993). Sida. Stockholm.

This document is published by the Water and Sanitation Program. It was edited and produced in East Asia. Copies can be ordered from theProgram: telephone 202 473 9785, fax 202 522 3313 or 522 3228, e-mai [email protected].
The World Bank does not accept responsibility for the views expressed herein, which are those of the authors and should not be attributed tothe World Bank or its affiliated organizations. The findings, interpretations and conclusions are the results of research supported by the Bank.The designations employed and the presentation of the material are solely for the convenience of the reader and do not imply the expressionof any legal opinion whatsoever on the part of the World Bank or its affiliates concerning the legal status of any country, territory, city, area, orits authorities, or concerning the delimitations of its boundaries or national affiliations.
One of the cover photographs and the photo on page 1 are by Guy Stubbs.
The original Metguide, 2000
Previous publications on the MPA
Information flyer, 2000 15 - Country study report, 2001
Design & lay out by Ariya Pramudiya
Water and Sanitation ProgramWater Supply and SanitationWorld Bank1818 H Street, N.W.Washington, D.C. 20433Phone: +1 (202) 473-9785Fax: +1 (202) 522-3313, 522-3228E-mail: [email protected] site: www.wsp.org
IRC International Water and Sanitation CentrePO Box 2869, 2601 CW DelftThe Netherlands
Telephone: +31 (0) 15 291 2939Fax: +31 (0) 15 219 0955E-mail: [email protected]: http://www.irc.nl
20032003200320032003
The Water and Sanitation Program
is an international partnership to help
the poor gain sustained access to
improved water supply and sanitation
services. The program’s main funding
partners are the Governments of
Australia, Belgium, Canada,
Denmark, Germany, Italy, Japan,
Luxembourg, the Netherlands,
Norway, Sweden, Switzerland, and
the United Kingdom; the United
Nations Development Programme
and the World Bank.