Embed Size (px)
Citation preview
South African Journal of Animal Science 2013, 43 (No. 3)
URL: http://www.sasas.co.za ISSN 0375-1589 (print), ISSN 2221-4062 (online) Publisher: South African Society for Animal Science http://dx.doi.org/10.4314/sajas.v43i3.5
Sustainability of the South African Livestock Sector towards 2050 Part 1: Worth and impact of the sector
H.H. Meissner1#, M.M. Scholtz2,3 & A.R. Palmer4
1189 van Riebeeck Avenue, Lyttelton Manor, Centurion 0157, South Africa; 2 ARC-Animal Production Institute, Private Bag X2, Irene 0062, South Africa; 3University of the Free State, PO Box 339, Bloemfontein 9300, South Africa;
4 ARC-Animal Production Institute, PO Box 101, Grahamstown 6140, South Africa
Copyright resides with the authors in terms of the Creative Commons Attribution 2.5 South African Licence. See: http://creativecommons.org/licenses/by/2.5/za
Condition of use: The user may copy, distribute, transmit and adapt the work, but must recognise the authors and the South African Journal of Animal Science
________________________________________________________________________________ Abstract
Livestock production in South Africa contributes substantially to food security. It is also a topic of public debate because of lack of knowledge and wrong information. This article aims to provide information on the worth and impact of the livestock sector; information and statistics providing a baseline to guiding sustainability towards 2050. Seventy percent of agricultural land in South Africa can be utilized only by livestock and game and species are found in all provinces with high concentrations in the eastern higher rainfall regions. Statistics in 2010 indicate 13.6 million beef cattle, 1.4 million dairy cattle, 24.6 million sheep, 7.0 million goats, 3 million game species (farmed), 1.1 million pigs, 113 million broilers, 31.8 million layers and 1.6 million ostriches. The gross value of livestock products increased by 185% from 1995/2000 to 2006/2010. In relation to field crops and horticulture, livestock products increased their position from 42% to 47% of gross agricultural value. The main reason was a rise in the value and demand for livestock foods, particularly meat. Livestock foods contribute 27% of the consumer food basket on a weight basis. Consumption of livestock foods resembles that of developing countries with meat consumption being 50 - 90 g/capita/day, milk and dairy products 120 - 130 g /capita/day and eggs 15 - 20 g/capita/day. Since this is the average for the country with consumption by the rich and poor often differing tenfold, consumption of livestock foods by the poor is of concern, given the many health attributes of livestock foods. The livestock sector in South Africa is a major role player in the conservation of biodiversity through a variety of well-adapted indigenous and non-indigenous breeds and rare game species. It has also shown commitment to rangeland/ecosystem conservation through conservative stocking rates, with several studies and observations reporting improvement in the condition of the natural resource. The sector has always been a major employer, but employment rate has declined steadily since 2000 because of increased minimum wages, fewer commercial farmers and increased property size. Some 245 000 employees with 1.45 million dependants, in addition to dependants on communal land and emerging farms, are employed on 38 500 commercial farms and intensive units with wages amounting to R 6 100 million (South African rand). Livestock farming is the backbone of the socio-economy and provides the sustenance of most non-metropolitan towns and rural communities. ________________________________________________________________________________ Keywords: Biodiversity, livestock foods, livestock numbers, production, socio-economic impact #Corresponding author: [email protected] Introduction
Livestock production in South Africa is a significant contributor to food security and clothing, and provides many social and economic attributes to the country. It is also the subject of regular public debate. Concerned citizens frequently raise questions about issues such as the role of modern technology in animal production, animal welfare, loss of natural systems and biodiversity, use of water in a water-scarce country, zoonosis, impact of livestock products on human health, and more recently the contribution of livestock to greenhouse gas emissions. Several of these issues are expected to have an effect on the livestock sector over
Meissner et al., 2013. S. Afr. J. Anim. Sci. vol. 43 283
the next 20 - 30 years. In common with international trends, the debated topics are often supported by powerful lobby groups and animal rights activists. This global phenomenon (Capper et al., 2009; O’Leary, 2013) has prompted international coordinating and administrative bodies such as the International Meat Secretariat (Harris, 2012; IMS, 2012) and the International Dairy Federation (IDF, 2012; Seifert, 2013) to strategize proactively.
The aim of this article (Part 1) is to provide a comprehensive overview of the integrated role of the livestock sector in the natural and socio-economic environment of the country and secondly, to assess what the sector offers to the population in a responsible and sustainable way. It is not the intention to provide counteracting or opposing arguments to the anti-livestock campaign, but correct information should go a long way towards refuting wrong, uninformed, emotional and irrational arguments. The livestock industries are well aware that they sometimes fall short in addressing inadequacies and the negatives referred to above, but have shown commitment through their Codes of Best Practice (e.g. NWGA, 2009; RPO, 2010) to rectifying inadequate and unjustifiable management practices and to embark on a more sustainable path. Therefore, in support and by way of introspection, the intention in Part 2 will be to discuss challenges that the livestock sector faces towards 2050 and where changes and alternative management options will be required.
Status of the Sector Numbers and distribution of livestock
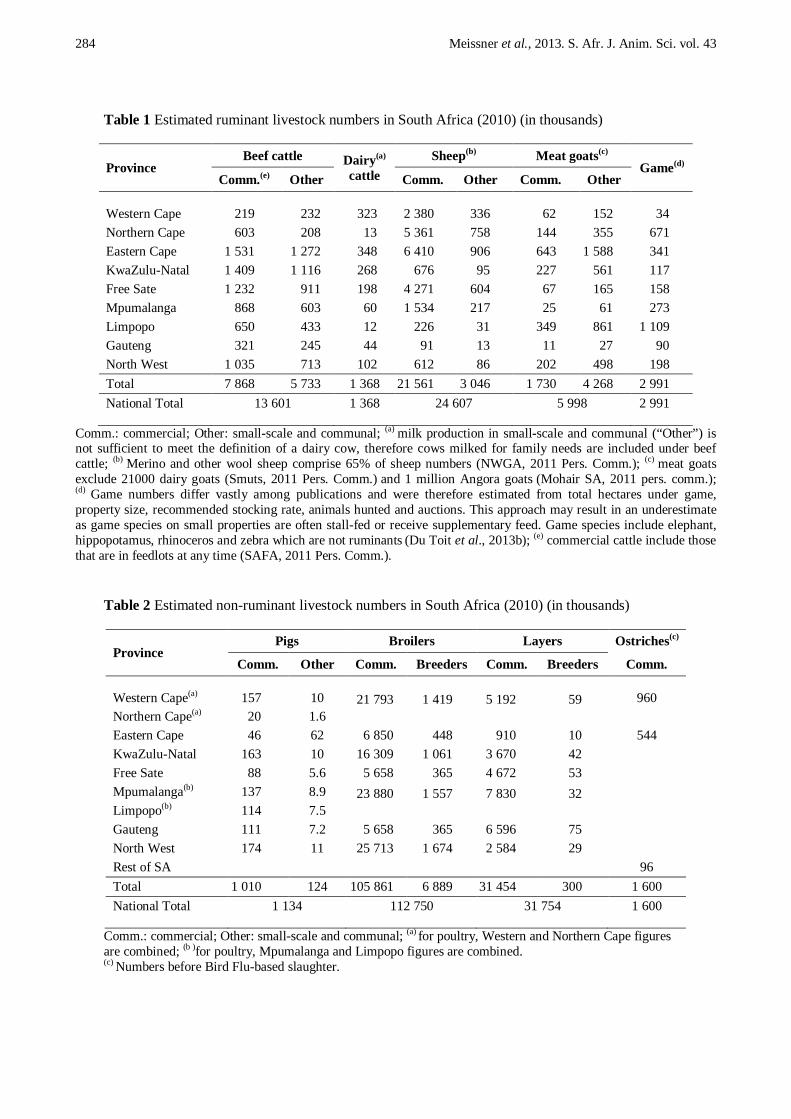
Livestock are produced throughout South Africa, with numbers, breeds and species varying according to grazing, environment and production systems (commercial, small-scale or communal). Intensive production systems (feedlots, poultry, pigs) are also wide-spread owing to choices associated with optimal land use and vertical integration, but tend to congregate near metropolitan markets and feed suppliers. About 38 500 commercial farms and intensive units and an estimated 2 million small-scale/communal farmers are involved with livestock. The numbers and distribution across provinces according to 2010 estimates are provided for ruminants in Table 1 and for non-ruminants in Table 2. Numbers of non-productive species such as horses and food-producing species with low numbers (e.g. crocodiles, geese and turkeys) are not included.
Statistics of official sources are often questionable. Therefore the figures in Tables 1 and 2 are the result of statistics provided by the 2010 Abstract of Agricultural Statistics (DAFF, 2010a), DAFF Directorate of Agricultural Statistics Newsletter (DAFF, 2010b) and farmer support bodies (Milk SA, 2011; Mohair SA, 2011; NWGA, 2011a; RPO provincial offices, 2011; SAFA, 2011; SAGRA, 2011; SAPA, 2011; SA Pork, 2011), which were cross-checked with other references, auction sales and slaughter data (Du Toit et al., 2013a; b; c; d). The game numbers are from privately owned properties (farms and reserves) and do not include those in government protected areas.
The Eastern Cape boasts the highest concentrations of cattle, sheep and goats (including Angoras) in the country (Table 1). KwaZulu-Natal is second in beef cattle and Northern Cape second in sheep. Proportionally the small-scale and communal sectors own 41% of the beef cattle, 12% of the sheep and 67% of the goats. Game species are farmed mostly in Limpopo and the Northern Cape. Pigs in the commercial sector are concentrated in North West, KwaZulu-Natal and the Western Cape whereas family ownership in the Eastern Cape accounts for about 50% of pig numbers in the small-scale and communal sectors (Table 2). North West, Western/Northern Cape and Limpopo/Mpumalanga produce the bulk of the 113 million broilers and a substantial portion of eggs. Ostriches are confined to the Western and Eastern Cape.
Compared with 2000, there have not been major shifts in cattle, sheep and goat numbers in the years until 2010 (DAFF, 2010a). Game numbers in private ownership, apart from localized case studies, have not been estimated in the past and estimates for pigs have always differed vastly between official statistical sources and the pork industry because of calculation methods. Poultry numbers, despite yearly fluctuations, remain on the increase because of rising demand. Production and demand statistics
The relative position of livestock compared to field crops and horticulture in the five years 2006/2010 has increased (Table 3) (DAFF, 2010a). In the preceding 10 years of 1995 to 2005 the gross value of these products relative to each other remained about the same, with livestock products comprising 42%, but in the
284 Meissner et al., 2013. S. Afr. J. Anim. Sci. vol. 43
Table 1 Estimated ruminant livestock numbers in South Africa (2010) (in thousands)
Province Beef cattle Dairy(a)
cattle Sheep(b) Meat goats(c)
Game(d) Comm.(e) Other Comm. Other Comm. Other
Western Cape 219 232 323 2 380 336 62 152 34 Northern Cape 603 208 13 5 361 758 144 355 671 Eastern Cape 1 531 1 272 348 6 410 906 643 1 588 341 KwaZulu-Natal 1 409 1 116 268 676 95 227 561 117 Free Sate 1 232 911 198 4 271 604 67 165 158 Mpumalanga 868 603 60 1 534 217 25 61 273 Limpopo 650 433 12 226 31 349 861 1 109 Gauteng 321 245 44 91 13 11 27 90 North West 1 035 713 102 612 86 202 498 198 Total 7 868 5 733 1 368 21 561 3 046 1 730 4 268 2 991 National Total 13 601 1 368 24 607 5 998 2 991
Comm.: commercial; Other: small-scale and communal; (a) milk production in small-scale and communal (“Other”) is not sufficient to meet the definition of a dairy cow, therefore cows milked for family needs are included under beef cattle; (b) Merino and other wool sheep comprise 65% of sheep numbers (NWGA, 2011 Pers. Comm.); (c) meat goats exclude 21000 dairy goats (Smuts, 2011 Pers. Comm.) and 1 million Angora goats (Mohair SA, 2011 pers. comm.); (d) Game numbers differ vastly among publications and were therefore estimated from total hectares under game, property size, recommended stocking rate, animals hunted and auctions. This approach may result in an underestimate as game species on small properties are often stall-fed or receive supplementary feed. Game species include elephant, hippopotamus, rhinoceros and zebra which are not ruminants (Du Toit et al., 2013b); (e) commercial cattle include those that are in feedlots at any time (SAFA, 2011 Pers. Comm.).
Table 2 Estimated non-ruminant livestock numbers in South Africa (2010) (in thousands)
Province Pigs Broilers Layers Ostriches(c)
Comm. Other Comm. Breeders Comm. Breeders Comm. Western Cape(a) 157 10 21 793
1 419
5 192
59
960
Northern Cape(a) 20 1.6 Eastern Cape 46 62 6 850 448 910 10 544 KwaZulu-Natal 163 10 16 309 1 061 3 670 42 Free Sate 88 5.6 5 658 365 4 672 53 Mpumalanga(b) 137 8.9 23 880
1 557
7 830
32
Limpopo(b) 114 7.5 Gauteng 111 7.2 5 658 365 6 596 75 North West 174 11 25 713 1 674 2 584 29 Rest of SA 96 Total 1 010 124 105 861 6 889 31 454 300 1 600 National Total 1 134 112 750 31 754 1 600
Comm.: commercial; Other: small-scale and communal; (a) for poultry, Western and Northern Cape figures are combined; (b )for poultry, Mpumalanga and Limpopo figures are combined. (c) Numbers before Bird Flu-based slaughter.
Meissner et al., 2013. S. Afr. J. Anim. Sci. vol. 43 285
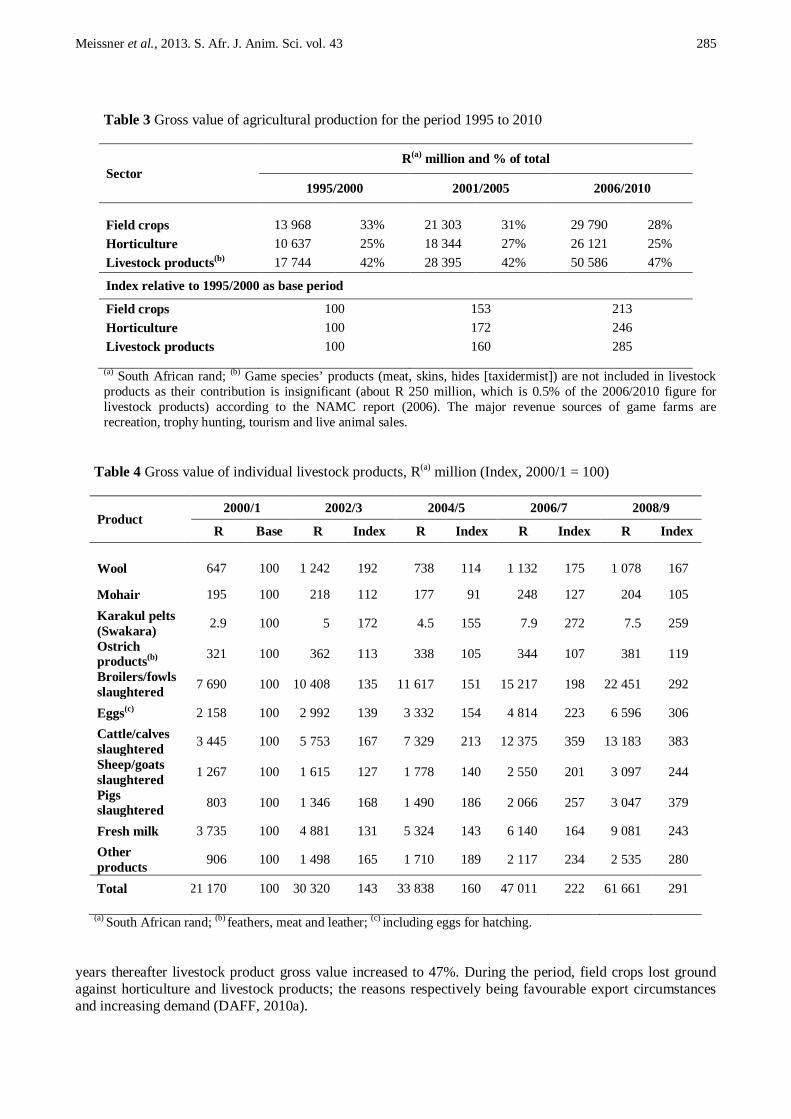
Table 3 Gross value of agricultural production for the period 1995 to 2010
Sector R(a) million and % of total
1995/2000 2001/2005 2006/2010 Field crops 13 968 33% 21 303 31% 29 790 28% Horticulture 10 637 25% 18 344 27% 26 121 25% Livestock products(b) 17 744 42% 28 395 42% 50 586 47%
Index relative to 1995/2000 as base period
Field crops 100 153 213 Horticulture 100 172 246 Livestock products 100 160 285
(a) South African rand; (b) Game species’ products (meat, skins, hides [taxidermist]) are not included in livestock products as their contribution is insignificant (about R 250 million, which is 0.5% of the 2006/2010 figure for livestock products) according to the NAMC report (2006). The major revenue sources of game farms are recreation, trophy hunting, tourism and live animal sales.
Table 4 Gross value of individual livestock products, R(a) million (Index, 2000/1 = 100)
Product 2000/1 2002/3 2004/5 2006/7 2008/9
R Base R Index R Index R Index R Index
Wool 647 100 1 242 192 738 114 1 132 175 1 078 167
Mohair 195 100 218 112 177 91 248 127 204 105 Karakul pelts (Swakara) 2.9 100 5 172 4.5 155 7.9 272 7.5 259
Ostrich products(b) 321 100 362 113 338 105 344 107 381 119
Broilers/fowls slaughtered 7 690 100 10 408 135 11 617 151 15 217 198 22 451 292
Eggs(c) 2 158 100 2 992 139 3 332 154 4 814 223 6 596 306 Cattle/calves slaughtered 3 445 100 5 753 167 7 329 213 12 375 359 13 183 383
Sheep/goats slaughtered 1 267 100 1 615 127 1 778 140 2 550 201 3 097 244
Pigs slaughtered 803 100 1 346 168 1 490 186 2 066 257 3 047 379
Fresh milk 3 735 100 4 881 131 5 324 143 6 140 164 9 081 243 Other products 906 100 1 498 165 1 710 189 2 117 234 2 535 280
Total 21 170 100 30 320 143 33 838 160 47 011 222 61 661 291
(a) South African rand; (b) feathers, meat and leather; (c) including eggs for hatching.
years thereafter livestock product gross value increased to 47%. During the period, field crops lost ground against horticulture and livestock products; the reasons respectively being favourable export circumstances and increasing demand (DAFF, 2010a).
286 Meissner et al., 2013. S. Afr. J. Anim. Sci. vol. 43
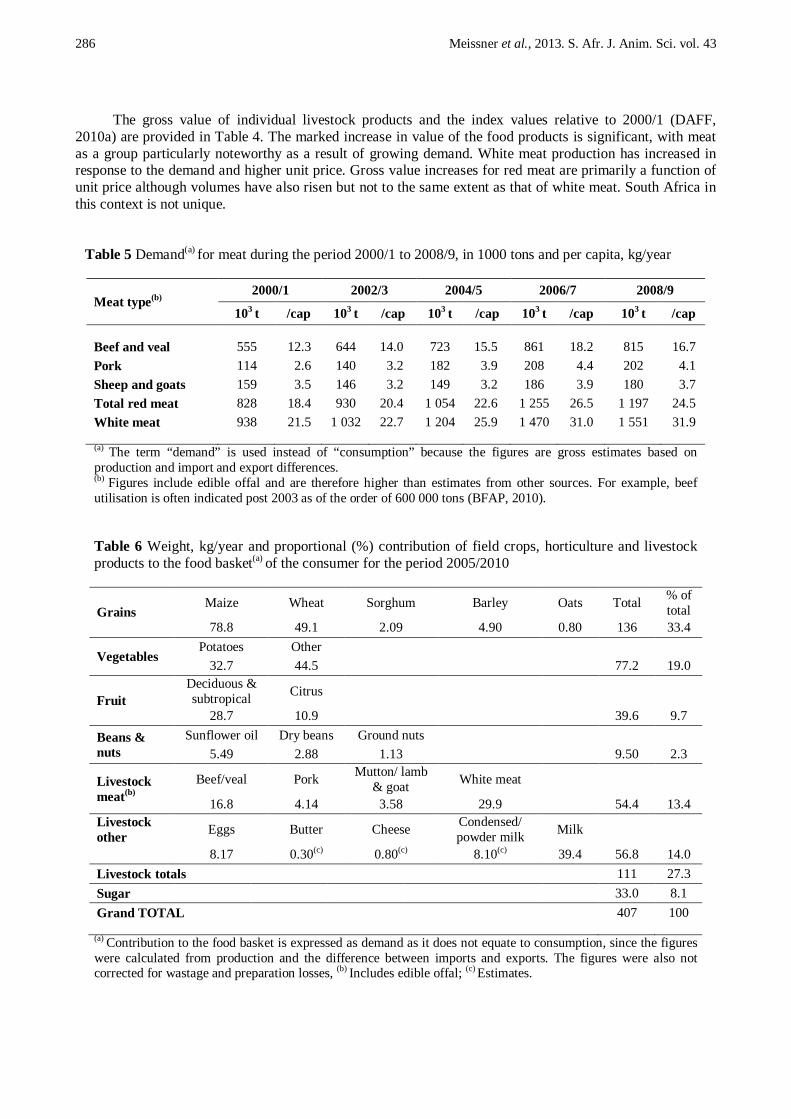
The gross value of individual livestock products and the index values relative to 2000/1 (DAFF, 2010a) are provided in Table 4. The marked increase in value of the food products is significant, with meat as a group particularly noteworthy as a result of growing demand. White meat production has increased in response to the demand and higher unit price. Gross value increases for red meat are primarily a function of unit price although volumes have also risen but not to the same extent as that of white meat. South Africa in this context is not unique.
Table 5 Demand(a) for meat during the period 2000/1 to 2008/9, in 1000 tons and per capita, kg/year
Meat type(b) 2000/1 2002/3 2004/5 2006/7 2008/9
103 t /cap 103 t /cap 103 t /cap 103 t /cap 103 t /cap Beef and veal 555 12.3 644 14.0 723 15.5 861 18.2 815 16.7 Pork 114 2.6 140 3.2 182 3.9 208 4.4 202 4.1 Sheep and goats 159 3.5 146 3.2 149 3.2 186 3.9 180 3.7 Total red meat 828 18.4 930 20.4 1 054 22.6 1 255 26.5 1 197 24.5 White meat 938 21.5 1 032 22.7 1 204 25.9 1 470 31.0 1 551 31.9 (a) The term “demand” is used instead of “consumption” because the figures are gross estimates based on production and import and export differences. (b) Figures include edible offal and are therefore higher than estimates from other sources. For example, beef utilisation is often indicated post 2003 as of the order of 600 000 tons (BFAP, 2010).
Table 6 Weight, kg/year and proportional (%) contribution of field crops, horticulture and livestock products to the food basket(a) of the consumer for the period 2005/2010
Grains Maize Wheat Sorghum Barley Oats Total % of
total 78.8 49.1 2.09 4.90 0.80 136 33.4
Vegetables Potatoes Other
32.7 44.5 77.2 19.0
Fruit Deciduous & subtropical Citrus
28.7 10.9 39.6 9.7 Beans & nuts
Sunflower oil Dry beans Ground nuts 5.49 2.88 1.13 9.50 2.3
Livestock meat(b)
Beef/veal Pork Mutton/ lamb & goat White meat
16.8 4.14 3.58 29.9 54.4 13.4 Livestock other Eggs Butter Cheese Condensed/
powder milk Milk
8.17 0.30(c) 0.80(c) 8.10(c) 39.4 56.8 14.0 Livestock totals 111 27.3 Sugar 33.0 8.1 Grand TOTAL 407 100
(a) Contribution to the food basket is expressed as demand as it does not equate to consumption, since the figures were calculated from production and the difference between imports and exports. The figures were also not corrected for wastage and preparation losses, (b) Includes edible offal; (c) Estimates.
Meissner et al., 2013. S. Afr. J. Anim. Sci. vol. 43 287
The global demand for livestock foods, mainly meat, is on the increase (Scollan et al., 2010; Meissner, 2012); driven by the upsurge in world human population combined with greater affluence in developing countries and an accompanying shift in consumption of livestock products. The South African middle-class population has increased dramatically in the last 10 years with concomitant growth in demand for livestock foods. The trends in demand for red and white meat (Table 5) (DAFF, 2010a) support these arguments, although price sensitivity might have reduced red meat demand recently.
Livestock foods on a weight basis, contribute 27% of the consumer food basket (expressed as demand), with red and white meat contributing 13% (Table 6). The main item is grains (33%), reflecting mainly maize meal and bread, whereas vegetables (19%) are also significant (DAFF, 2010). Contribution and impact South Africa in relation to the globe: An overview
Livestock products account for 33% (Thornton, 2010) to 40% (Scollan et al., 2010) of world agricultural GDP. In South Africa livestock products only recently increased from a similar level to 47% in 2006/2010 (Table 3). Future global trends predict an increase in demand for meat of almost double towards 2050 (FAO, 2009), mainly in transition and developing countries associated with increased affluence. In South Africa the increase in demand seen in Table 5 is also related to improved income.
The bulk of the increased global demand will have to come from intensive pig and poultry systems and greater efficiency of production on pasture, as the potential for raising the numbers of grazing systems is limited (Scollan et al., 2010). The demand for pork in South Africa is traditionally low. Therefore, the increase will have to come primarily from poultry (Table 5). Cattle, sheep and goat numbers have changed negligibly over the past 10 years (DAFF, 2010a) but there may be some potential for an increase as a result of improvement in rangeland conditions and expansion of the small-scale sector.
Livestock is critical for many of the poor in developing countries, often contributing to multiple livelihood objectives and offering ways out of poverty (Randolph et al., 2007; FAO, 2009). This is similar in the deep rural communal areas of South Africa where livestock in particular is a valuable asset as a store of wealth that can be utilized as collateral for credit in difficult times (DAFF, 2010c).
Livestock of the poor in developing countries contribute substantially to maintaining health and constitutes the main source of nutrition (Randolph et al., 2007; FAO, 2009). The livestock sector is a major employer, with 1.3 billion people employed directly and indirectly world-wide (Scollan et al., 2010). In South Africa the livestock sector is also a major employer, employing 245 000 workers (see Socio-economic impact).
In a sense livestock production in South Africa is a micro presentation of global trends.
Consumption of livestock foods The role and importance of livestock foods have to be considered in the context of the dichotomy of
abundance in the developed world and low consumption in the developing world, although vast changes are expected with increasing affluence as poor countries rise during the transition phase (FAO, 2009; Smith et al., 2013). For example, the per capita demand for meat in China increased dramatically from 3.6 kg in 1961 to 52.4 kg in 2002 (Scollan et al., 2010). Overall, demand for livestock foods is predicted to increase, even though demand for particular commodities, notably beef (Meissner, 2012) and milk (Scollan et al., 2010) in the short term appears to stagnate. In developed countries demand for meat and milk (including dairy products) is predicted to increase from 78 kg and 202 kg per capita per annum from 2002 to respectively 83 kg and 203 kg per capita per annum in 2015. The corresponding figures for developing countries are 28 kg meat and 44 kg milk per capita per annum from 2002 to 32 kg meat and 55 kg milk per capita per annum in 2015 (Scollan et al., 2010). The dichotomy of developed versus developing countries is best illustrated by the per capita demand for meat at the extremes of developed vs. developing countries, viz. 125 kg meat in the US, 146 kg in Denmark (Scollan et al., 2010), 60 kg (beef alone) in Argentina (Arelovich et al., 2011) and 13.3 kg/annum in sub-Saharan Africa (FAO, 2009). These figures equate to per capita consumption (demand corrected for losses as explained in Tables 5 and 7) of 165 g/day, 200 g/day, 80 g/day and 20 g/day respectively, reflecting a tenfold difference from highest to lowest. To put these numbers in perspective, recommendations for meat intake from an essential nutrient intake point of view range from 50 - 100 g per capita per day (McMichael & Ainslie, 2010) to 100 - 110 g per capita per day by the World Cancer
288 Meissner et al., 2013. S. Afr. J. Anim. Sci. vol. 43
Research Forum (IMS, 2011), whereas intakes of up to 150 g per day of lean beef have been shown to lower blood low-density lipoprotein (Feedstuffs Foodlink, undated).
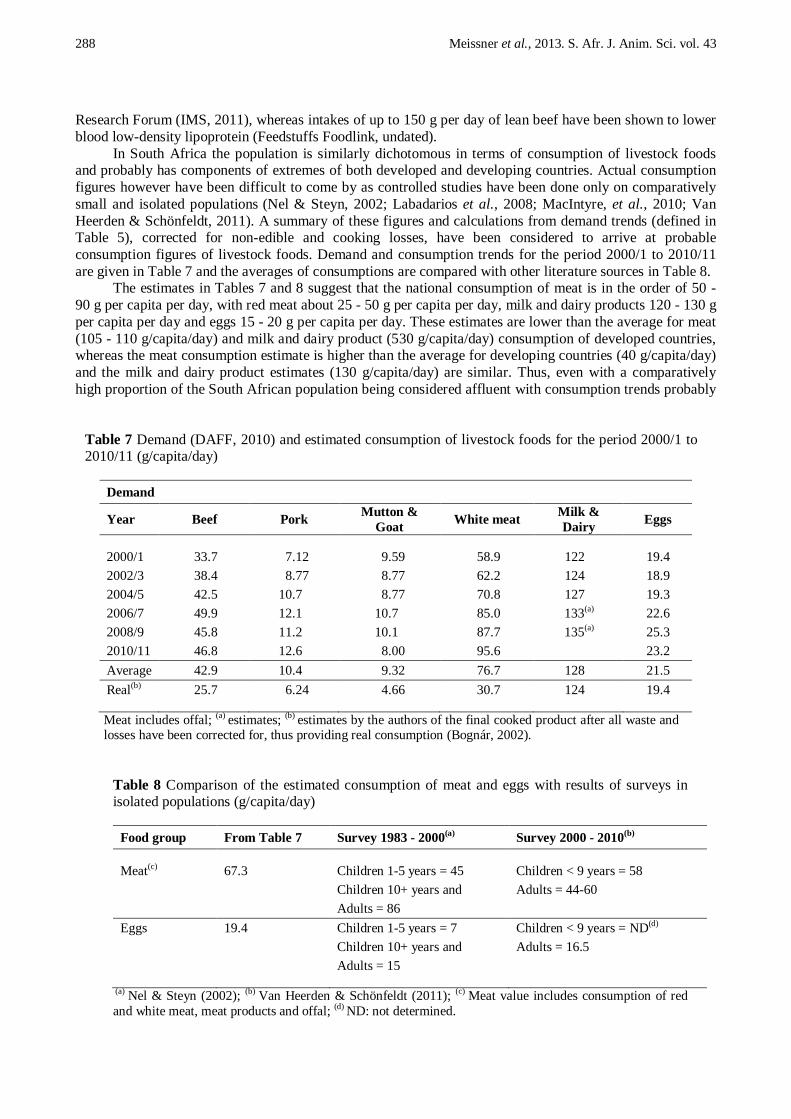
In South Africa the population is similarly dichotomous in terms of consumption of livestock foods and probably has components of extremes of both developed and developing countries. Actual consumption figures however have been difficult to come by as controlled studies have been done only on comparatively small and isolated populations (Nel & Steyn, 2002; Labadarios et al., 2008; MacIntyre, et al., 2010; Van Heerden & Schönfeldt, 2011). A summary of these figures and calculations from demand trends (defined in Table 5), corrected for non-edible and cooking losses, have been considered to arrive at probable consumption figures of livestock foods. Demand and consumption trends for the period 2000/1 to 2010/11 are given in Table 7 and the averages of consumptions are compared with other literature sources in Table 8.
The estimates in Tables 7 and 8 suggest that the national consumption of meat is in the order of 50 - 90 g per capita per day, with red meat about 25 - 50 g per capita per day, milk and dairy products 120 - 130 g per capita per day and eggs 15 - 20 g per capita per day. These estimates are lower than the average for meat (105 - 110 g/capita/day) and milk and dairy product (530 g/capita/day) consumption of developed countries, whereas the meat consumption estimate is higher than the average for developing countries (40 g/capita/day) and the milk and dairy product estimates (130 g/capita/day) are similar. Thus, even with a comparatively high proportion of the South African population being considered affluent with consumption trends probably
Table 7 Demand (DAFF, 2010) and estimated consumption of livestock foods for the period 2000/1 to 2010/11 (g/capita/day)
Demand
Year Beef Pork Mutton & Goat White meat Milk &
Dairy Eggs 2000/1 33.7 7.12 9.59 58.9 122 19.4 2002/3 38.4 8.77 8.77 62.2 124 18.9 2004/5 42.5 10.7 8.77 70.8 127 19.3 2006/7 49.9 12.1 10.7 85.0 133(a) 22.6 2008/9 45.8 11.2 10.1 87.7 135(a) 25.3 2010/11 46.8 12.6 8.00 95.6 23.2 Average 42.9 10.4 9.32 76.7 128 21.5 Real(b) 25.7 6.24 4.66 30.7 124 19.4 Meat includes offal; (a) estimates; (b) estimates by the authors of the final cooked product after all waste and losses have been corrected for, thus providing real consumption (Bognár, 2002).
Table 8 Comparison of the estimated consumption of meat and eggs with results of surveys in isolated populations (g/capita/day)
Food group From Table 7 Survey 1983 - 2000(a) Survey 2000 - 2010(b)
Meat(c) 67.3 Children 1-5 years = 45 Children < 9 years = 58
Children 10+ years and Adults = 44-60
Adults = 86 Eggs 19.4 Children 1-5 years = 7 Children < 9 years = ND(d)
Children 10+ years and Adults = 16.5
Adults = 15
(a) Nel & Steyn (2002); (b) Van Heerden & Schönfeldt (2011); (c) Meat value includes consumption of red and white meat, meat products and offal; (d) ND: not determined.
Meissner et al., 2013. S. Afr. J. Anim. Sci. vol. 43 289
resembling those of developed countries (unfortunately figures are not available), the national consumption of meat resembles that of transition countries and the consumption of milk and dairy products that of developing countries.
The marginal consumption of meat (in comparison with recommendations) and the unacceptably low average consumption of milk and dairy products, imply that the consumption by the low-income component of the population is of concern and probably a major cause of observed under- and malnutrition. Under- and malnutrition may result in low physical growth, frequent infection, poor cognitive development and school performance, and low birth weight infants (FAO, 2009). The importance of livestock-based foods in supplying sufficient protein, essential amino acids and micro-nutrients in this context is discussed by Schönfeldt et al. (2013). Ecosystem, biodiversity and rangeland
The successful functioning, resilience and sustainable utilization of natural resources will depend on sufficient genetic diversity and healthy ecosystems. Therefore, maintaining biodiversity of flora and fauna species and the associated ecosystems has become a global concern. Livestock production is the world’s largest user of land resources and engages closely with landscape management, biodiversity, soil conservation and the holistic functioning of ecosystems (Scollan et al., 2010). South Africa is not different; livestock is farmed with on about 70% of agricultural land (DAFF, 2006; WWF, 2010), which accounts for about 80% of land resources. The major environmental impact of livestock is on land degradation, water depletion and pollution, and biodiversity if production systems are mismanaged. This section provides an overview of the current status of impact of the sector in South Africa.
The global concern for the loss in diversity of livestock genetic resources because of injudicious crossbreeding and replacement has resulted in the adoption of certain resolutions in the first report on the state of the World’s Genetic Resources by the FAO (DAFF, 2007). First, animal genetic resources are a global concern because they are essential to achieve food security and sustainable livelihoods. Second, domestic animal diversity is vital for future generations to develop breeds adapted to largely unforeseeable ecological and economic scenarios. Third, the conservation of animal genetic resources must be promoted and much greater awareness raised.
The concern to maintain livestock genetic resources, together with growing awareness of the value of adapted minimum care breeds, has boosted the maintenance of genetic diversity and created a lucrative market for South African farmers who keep such breeds and composites (RPO, 2010). The demand is expected to increase with research progress into sequenced genomes and transgenic or cloned animals in order to exploit favourable genes for increased productivity and quality livestock products. Although genetic material can be stored through semen and ova, storage is expensive. Therefore, sustainable maintenance and utilization of the animals themselves remain the primary options, which place a strong biodiversity perspective on the responsibility of seedstock (stud) suppliers (Scholtz, 2012). The growth in adapted and minimum care cattle breeds in South Africa (DAFF, 2007) suggests that farmers support the initiative, even though their intention is primarily profitability.
South African livestock farmers also contribute to maintaining biodiversity and conservation of rare and endangered wildlife species. Farming with game has increased dramatically. The National Agricultural Marketing Council (NAMC, 2006) estimated that game farming is practised on 20.5 million hectares, with the number of hectares increasing by 5% per year. The numbers of game species are about 3-times to 4-times greater than the numbers conserved in government protected areas, which, together with neighbouring states, is unique in the world. Table 1 provides the most recent estimate of provincial and national numbers. The benefit to the country, in addition to protection of biodiversity, is related to ecosystem and rangeland management, and conservation of rare and endangered species. If game species are introduced at the correct stocking rates and include browsers, selective feeders and bulk (grass) feeders, they may improve or complement effective rangeland and ecosystem management strategies. In terms of rare and endangered species, Du Toit et al. (2013b) estimated the numbers in grazing systems on private property as 19 800 disease-free buffalo, 5 450 black and white rhinoceros and 7 300 sable and roan antelope.
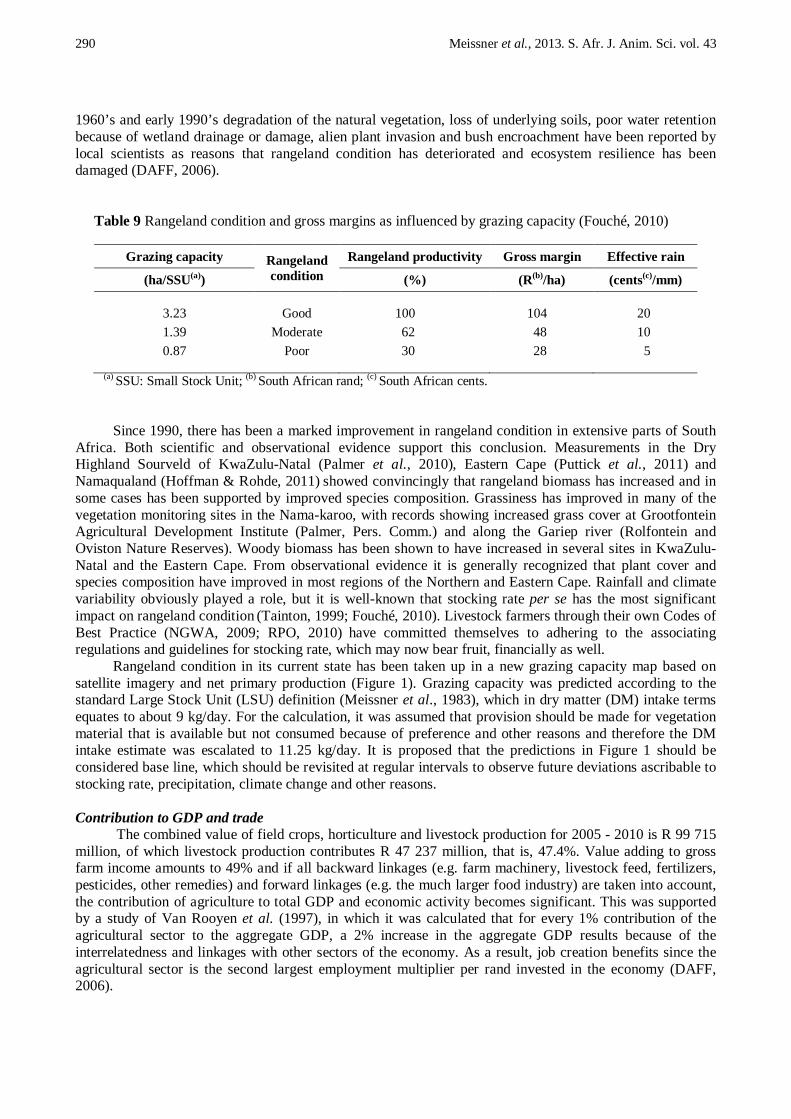
Rangeland condition and grazing capacity may deteriorate as a result of environmental conditions and further invasion by alien vegetation, but mostly because of overutilization of the resource. The consequences are shown in Table 9. Overutilization results mainly because the grazing capacity is over-estimated or simply because of lack of knowledge by the farmer, which is sometimes aggravated by poor advice. Between the
290 Meissner et al., 2013. S. Afr. J. Anim. Sci. vol. 43
1960’s and early 1990’s degradation of the natural vegetation, loss of underlying soils, poor water retention because of wetland drainage or damage, alien plant invasion and bush encroachment have been reported by local scientists as reasons that rangeland condition has deteriorated and ecosystem resilience has been damaged (DAFF, 2006).
Table 9 Rangeland condition and gross margins as influenced by grazing capacity (Fouché, 2010)
Grazing capacity Rangeland condition
Rangeland productivity Gross margin Effective rain
(ha/SSU(a)) (%) (R(b)/ha) (cents(c)/mm)
3.23 Good 100 104 20 1.39 Moderate 62 48 10 0.87 Poor 30 28 5
(a) SSU: Small Stock Unit; (b) South African rand; (c) South African cents.
Since 1990, there has been a marked improvement in rangeland condition in extensive parts of South Africa. Both scientific and observational evidence support this conclusion. Measurements in the Dry Highland Sourveld of KwaZulu-Natal (Palmer et al., 2010), Eastern Cape (Puttick et al., 2011) and Namaqualand (Hoffman & Rohde, 2011) showed convincingly that rangeland biomass has increased and in some cases has been supported by improved species composition. Grassiness has improved in many of the vegetation monitoring sites in the Nama-karoo, with records showing increased grass cover at Grootfontein Agricultural Development Institute (Palmer, Pers. Comm.) and along the Gariep river (Rolfontein and Oviston Nature Reserves). Woody biomass has been shown to have increased in several sites in KwaZulu-Natal and the Eastern Cape. From observational evidence it is generally recognized that plant cover and species composition have improved in most regions of the Northern and Eastern Cape. Rainfall and climate variability obviously played a role, but it is well-known that stocking rate per se has the most significant impact on rangeland condition (Tainton, 1999; Fouché, 2010). Livestock farmers through their own Codes of Best Practice (NGWA, 2009; RPO, 2010) have committed themselves to adhering to the associating regulations and guidelines for stocking rate, which may now bear fruit, financially as well.
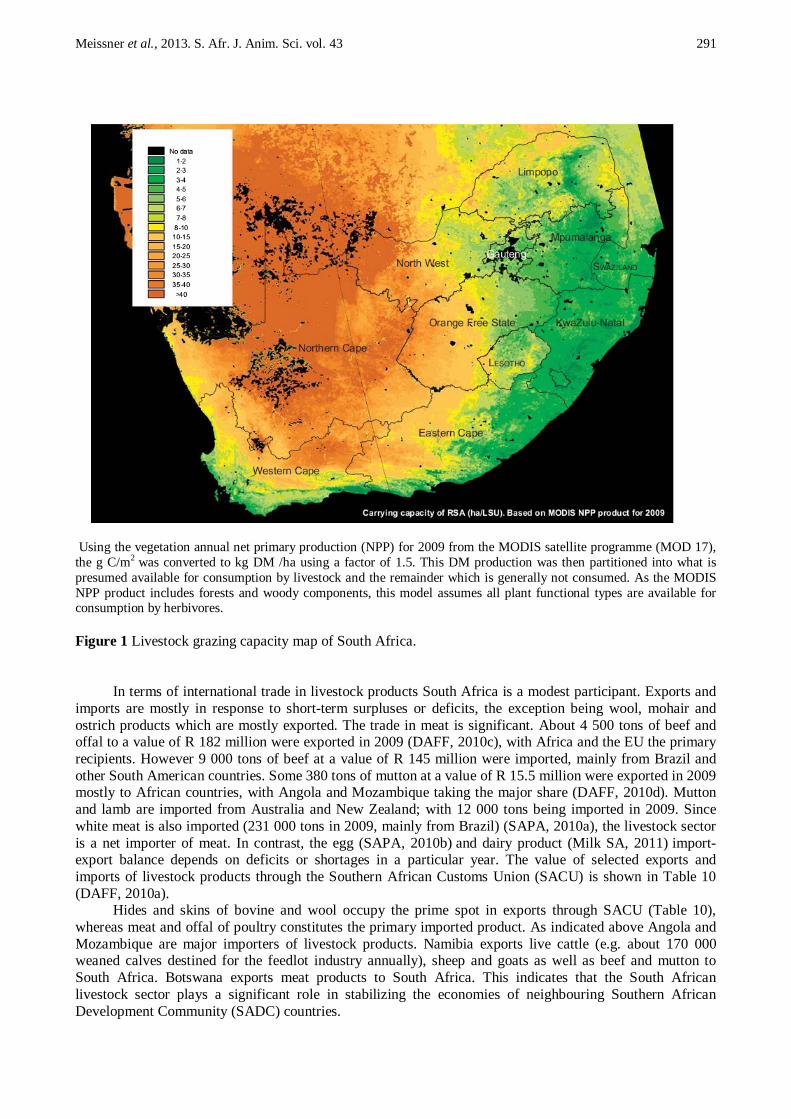
Rangeland condition in its current state has been taken up in a new grazing capacity map based on satellite imagery and net primary production (Figure 1). Grazing capacity was predicted according to the standard Large Stock Unit (LSU) definition (Meissner et al., 1983), which in dry matter (DM) intake terms equates to about 9 kg/day. For the calculation, it was assumed that provision should be made for vegetation material that is available but not consumed because of preference and other reasons and therefore the DM intake estimate was escalated to 11.25 kg/day. It is proposed that the predictions in Figure 1 should be considered base line, which should be revisited at regular intervals to observe future deviations ascribable to stocking rate, precipitation, climate change and other reasons. Contribution to GDP and trade
The combined value of field crops, horticulture and livestock production for 2005 - 2010 is R 99 715 million, of which livestock production contributes R 47 237 million, that is, 47.4%. Value adding to gross farm income amounts to 49% and if all backward linkages (e.g. farm machinery, livestock feed, fertilizers, pesticides, other remedies) and forward linkages (e.g. the much larger food industry) are taken into account, the contribution of agriculture to total GDP and economic activity becomes significant. This was supported by a study of Van Rooyen et al. (1997), in which it was calculated that for every 1% contribution of the agricultural sector to the aggregate GDP, a 2% increase in the aggregate GDP results because of the interrelatedness and linkages with other sectors of the economy. As a result, job creation benefits since the agricultural sector is the second largest employment multiplier per rand invested in the economy (DAFF, 2006).
Meissner et al., 2013. S. Afr. J. Anim. Sci. vol. 43 291
Using the vegetation annual net primary production (NPP) for 2009 from the MODIS satellite programme (MOD 17), the g C/m2 was converted to kg DM /ha using a factor of 1.5. This DM production was then partitioned into what is presumed available for consumption by livestock and the remainder which is generally not consumed. As the MODIS NPP product includes forests and woody components, this model assumes all plant functional types are available for consumption by herbivores. Figure 1 Livestock grazing capacity map of South Africa.
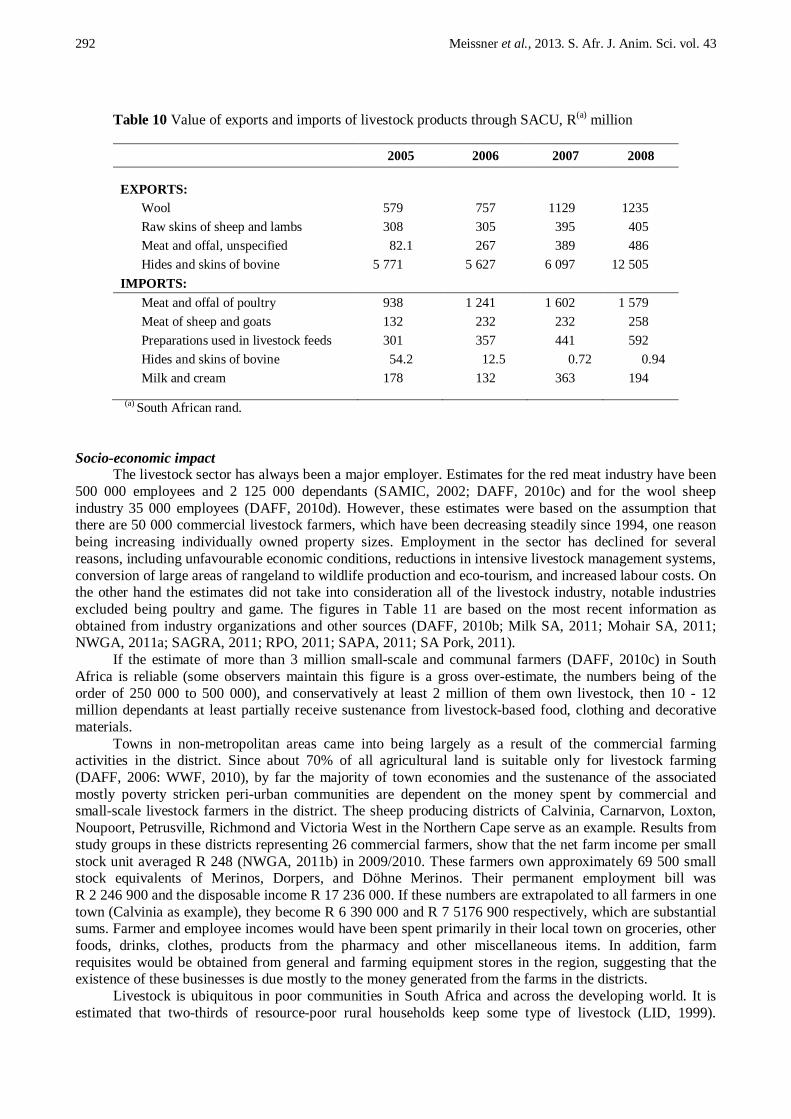
In terms of international trade in livestock products South Africa is a modest participant. Exports and imports are mostly in response to short-term surpluses or deficits, the exception being wool, mohair and ostrich products which are mostly exported. The trade in meat is significant. About 4 500 tons of beef and offal to a value of R 182 million were exported in 2009 (DAFF, 2010c), with Africa and the EU the primary recipients. However 9 000 tons of beef at a value of R 145 million were imported, mainly from Brazil and other South American countries. Some 380 tons of mutton at a value of R 15.5 million were exported in 2009 mostly to African countries, with Angola and Mozambique taking the major share (DAFF, 2010d). Mutton and lamb are imported from Australia and New Zealand; with 12 000 tons being imported in 2009. Since white meat is also imported (231 000 tons in 2009, mainly from Brazil) (SAPA, 2010a), the livestock sector is a net importer of meat. In contrast, the egg (SAPA, 2010b) and dairy product (Milk SA, 2011) import-export balance depends on deficits or shortages in a particular year. The value of selected exports and imports of livestock products through the Southern African Customs Union (SACU) is shown in Table 10 (DAFF, 2010a).
Hides and skins of bovine and wool occupy the prime spot in exports through SACU (Table 10), whereas meat and offal of poultry constitutes the primary imported product. As indicated above Angola and Mozambique are major importers of livestock products. Namibia exports live cattle (e.g. about 170 000 weaned calves destined for the feedlot industry annually), sheep and goats as well as beef and mutton to South Africa. Botswana exports meat products to South Africa. This indicates that the South African livestock sector plays a significant role in stabilizing the economies of neighbouring Southern African Development Community (SADC) countries.
292 Meissner et al., 2013. S. Afr. J. Anim. Sci. vol. 43
Table 10 Value of exports and imports of livestock products through SACU, R(a) million
2005 2006 2007 2008 EXPORTS:
Wool 579 757 1129 1235 Raw skins of sheep and lambs 308 305 395 405 Meat and offal, unspecified 82.1 267 389 486 Hides and skins of bovine 5 771 5 627 6 097 12 505
IMPORTS: Meat and offal of poultry 938 1 241 1 602 1 579 Meat of sheep and goats 132 232 232 258 Preparations used in livestock feeds 301 357 441 592 Hides and skins of bovine 54.2 12.5 0.72 0.94 Milk and cream 178 132 363 194
(a) South African rand.
Socio-economic impact The livestock sector has always been a major employer. Estimates for the red meat industry have been
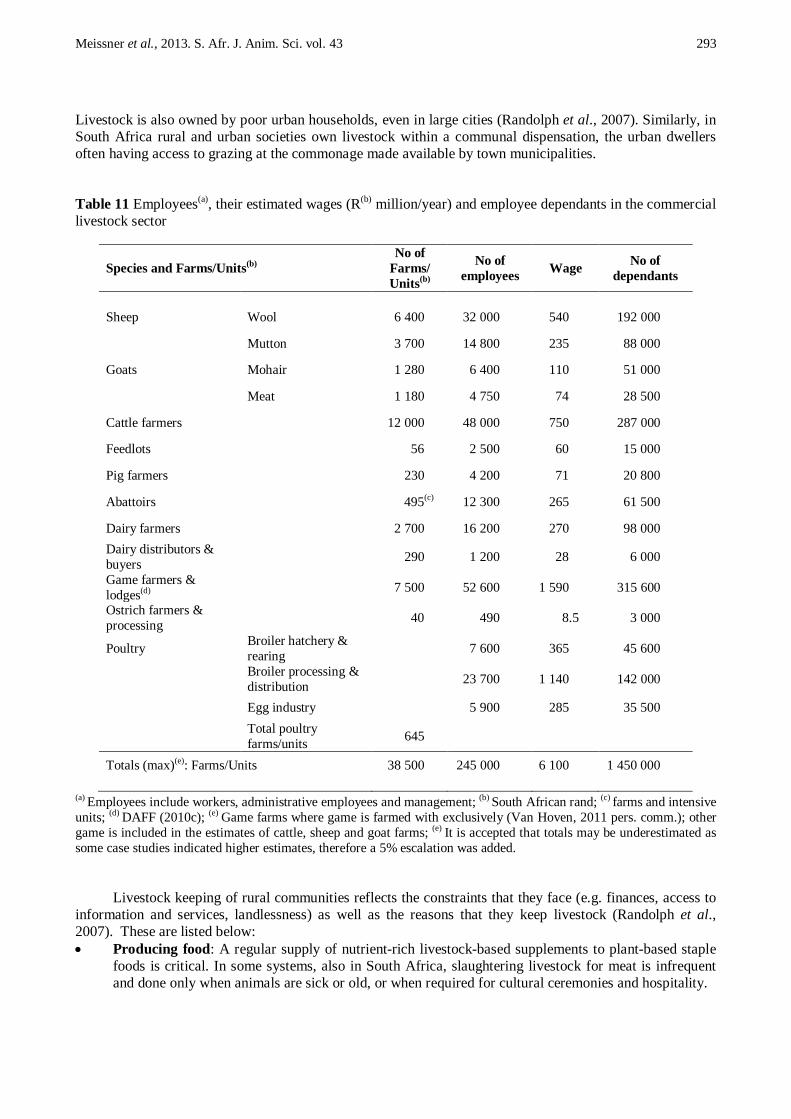
500 000 employees and 2 125 000 dependants (SAMIC, 2002; DAFF, 2010c) and for the wool sheep industry 35 000 employees (DAFF, 2010d). However, these estimates were based on the assumption that there are 50 000 commercial livestock farmers, which have been decreasing steadily since 1994, one reason being increasing individually owned property sizes. Employment in the sector has declined for several reasons, including unfavourable economic conditions, reductions in intensive livestock management systems, conversion of large areas of rangeland to wildlife production and eco-tourism, and increased labour costs. On the other hand the estimates did not take into consideration all of the livestock industry, notable industries excluded being poultry and game. The figures in Table 11 are based on the most recent information as obtained from industry organizations and other sources (DAFF, 2010b; Milk SA, 2011; Mohair SA, 2011; NWGA, 2011a; SAGRA, 2011; RPO, 2011; SAPA, 2011; SA Pork, 2011).
If the estimate of more than 3 million small-scale and communal farmers (DAFF, 2010c) in South Africa is reliable (some observers maintain this figure is a gross over-estimate, the numbers being of the order of 250 000 to 500 000), and conservatively at least 2 million of them own livestock, then 10 - 12 million dependants at least partially receive sustenance from livestock-based food, clothing and decorative materials.
Towns in non-metropolitan areas came into being largely as a result of the commercial farming activities in the district. Since about 70% of all agricultural land is suitable only for livestock farming (DAFF, 2006: WWF, 2010), by far the majority of town economies and the sustenance of the associated mostly poverty stricken peri-urban communities are dependent on the money spent by commercial and small-scale livestock farmers in the district. The sheep producing districts of Calvinia, Carnarvon, Loxton, Noupoort, Petrusville, Richmond and Victoria West in the Northern Cape serve as an example. Results from study groups in these districts representing 26 commercial farmers, show that the net farm income per small stock unit averaged R 248 (NWGA, 2011b) in 2009/2010. These farmers own approximately 69 500 small stock equivalents of Merinos, Dorpers, and Döhne Merinos. Their permanent employment bill was R 2 246 900 and the disposable income R 17 236 000. If these numbers are extrapolated to all farmers in one town (Calvinia as example), they become R 6 390 000 and R 7 5176 900 respectively, which are substantial sums. Farmer and employee incomes would have been spent primarily in their local town on groceries, other foods, drinks, clothes, products from the pharmacy and other miscellaneous items. In addition, farm requisites would be obtained from general and farming equipment stores in the region, suggesting that the existence of these businesses is due mostly to the money generated from the farms in the districts.
Livestock is ubiquitous in poor communities in South Africa and across the developing world. It is estimated that two-thirds of resource-poor rural households keep some type of livestock (LID, 1999).
Meissner et al., 2013. S. Afr. J. Anim. Sci. vol. 43 293
Livestock is also owned by poor urban households, even in large cities (Randolph et al., 2007). Similarly, in South Africa rural and urban societies own livestock within a communal dispensation, the urban dwellers often having access to grazing at the commonage made available by town municipalities.
Table 11 Employees(a), their estimated wages (R(b) million/year) and employee dependants in the commercial livestock sector
Species and Farms/Units(b) No of
Farms/ Units(b)
No of employees Wage No of
dependants
Sheep Wool 6 400 32 000 540 192 000
Mutton 3 700 14 800 235 88 000
Goats Mohair 1 280 6 400 110 51 000
Meat 1 180 4 750 74 28 500
Cattle farmers 12 000 48 000 750 287 000
Feedlots 56 2 500 60 15 000
Pig farmers 230 4 200 71 20 800
Abattoirs 495(c) 12 300 265 61 500
Dairy farmers 2 700 16 200 270 98 000 Dairy distributors & buyers 290 1 200 28 6 000
Game farmers & lodges(d) 7 500 52 600 1 590 315 600
Ostrich farmers & processing 40 490 8.5 3 000
Poultry Broiler hatchery & rearing 7 600 365 45 600
Broiler processing & distribution 23 700 1 140 142 000
Egg industry 5 900 285 35 500
Total poultry farms/units 645
Totals (max)(e): Farms/Units 38 500 245 000 6 100 1 450 000
(a) Employees include workers, administrative employees and management; (b) South African rand; (c) farms and intensive units; (d) DAFF (2010c); (e) Game farms where game is farmed with exclusively (Van Hoven, 2011 pers. comm.); other game is included in the estimates of cattle, sheep and goat farms; (e) It is accepted that totals may be underestimated as some case studies indicated higher estimates, therefore a 5% escalation was added.
Livestock keeping of rural communities reflects the constraints that they face (e.g. finances, access to
information and services, landlessness) as well as the reasons that they keep livestock (Randolph et al., 2007). These are listed below: • Producing food: A regular supply of nutrient-rich livestock-based supplements to plant-based staple
foods is critical. In some systems, also in South Africa, slaughtering livestock for meat is infrequent and done only when animals are sick or old, or when required for cultural ceremonies and hospitality.

294 Meissner et al., 2013. S. Afr. J. Anim. Sci. vol. 43
• Generating income: Owners may produce for the market but often sales are occasional to meet urgent needs for cash.
• Providing manure: Livestock waste is used mainly to maintain soil fertility and therefore contributes to better crop production.
• Traction and transport: Cattle and donkeys are often used to plough and transport commodities. • Serving as financial aids: The poor do not have access to credit and banking facilities in general.
Livestock offer an alternative to their savings or accumulated capital, and as a hedge against inflation. They can sell their livestock for urgent cash or use them as a form of insurance, which can be sold to provide for the family when the owner dies.
• Enhancing social status: Cultural norms in many poor rural societies place considerable value on livestock as an indicator of social importance in the community. Livestock is also exchanged as dowry and the price of the bride is linked to the social status of the family. The various reasons for keeping livestock confirm that livestock forms an integral and indispensable
part of social life and sustenance of poor communities in South Africa.
Concluding remarks Since agricultural land in South Africa is primarily livestock-based, the livestock grazing (extensive)
sector is well-represented in all provinces, with high large and small stock concentrations in the south-eastern higher rainfall areas. Intensive systems of pig and poultry on the other hand tend to congregate near metropolitan areas where concentrate feed and slaughter facilities are readily available. The rapid increase in game farming with a substantial contribution to agricultural GDP, conservation of rare species and maintenance of biodiversity is noteworthy. This, and lower stocking rates has probably contributed to the observed improvement in rangeland and ecosystem condition. Increased demand for livestock products, particularly meat, has resulted in a proportional increase in gross value relative to field crops and horticulture from 1995/2000 to 2006/2010 and a per capita increase in demand for meat from 33.9 kg/annum in 2000/1 to 56.4 kg/annum in 2008/9. Even though this increase is impressive, contrary to general belief, overall consumption of livestock foods is still much lower than in developed countries. This applies in particular to milk and dairy products which can go a long way in addressing malnutrition in poor communities. Trade in livestock products, particularly export, remains disappointing; the same applies to employment in commercial farming which has declined from 500 000 in the 1990s in the red meat industry alone to 245 000 in the total livestock sector at present. Livestock farming nevertheless plays an enormous role in providing sustenance to poor communities and stabilizing the economies of towns in non-metropolitan areas. References Arelovich, H.M., Bravo, R.D. & Martinez, M.F., 2011. Development, characteristics and trends for beef
cattle production in Argentina. Animal Frontiers 1, 37-45. BFAP, 2010. The South African Agricultural Baseline. Bureau for Food and Agricultural Policy, Pretoria.
www.bfap.co.za. Bognár, A., 2002. Tables on weight yield and the retention factors of food constituents for the calculation of
food composition of cooked food (dishes). Berichte der Bundesforchsungsanstalt für Ernährung, Karlsruhe. ISN 0933-5463.
Capper, J.L., Cady, R.A. & Bauman, D.D., 2009. Demystifying the environmental sustainability of food production. In: Proceedings of the Cornell Nutrition Conference, Syracuse, NY: Cornell University. pp. 187-203.
DAFF, 2003. Strategic Plan for the Department of Agriculture 2003 to 2006. Directorate: Agricultural Information Services, Department of Agriculture, Forestry and Fisheries, Pretoria.
DAFF, 2006. Livestock Development Strategy for South Africa 2006-2015. Investing in the potential of the livestock sector resource base for lasting animal agriculture. Plus, a companion document: Natural Resource Base Implementation Framework for the Livestock Development Strategy. Department of Agriculture, Forestry and Fisheries, Pretoria.
DAFF, 2007. National Beef Cattle Strategy and Implementation Framework. Department of Agriculture, Forestry and Fisheries, Pretoria. www.daff.gov.za.

Meissner et al., 2013. S. Afr. J. Anim. Sci. vol. 43 295
DAFF, 2010a. Abstract of Agricultural Statistics. Directorate: Agricultural Statistics, Department of Agriculture, Forestry and Fisheries, Pretoria.
DAFF, 2010b. News Letter: National livestock numbers. February 2010. Directorate: Agricultural Statistics, Department of Agriculture, Forestry and Fisheries, Pretoria.
DAFF, 2010c. A profile of the South African Beef Market value chain. Directorate: Marketing, Department of Agriculture, Forestry and Fisheries, Pretoria.
DAFF, 2010d. A profile of the South African Mutton Market value chain. Directorate: Marketing, Department of Agriculture, Forestry and Fisheries, Pretoria.
Du Toit, C.J.L., Meissner, H.H. & Van Niekerk, W.A., 2013a. Direct methane and nitrous oxide emissions of South African dairy and beef cattle. S. Afr. J. Anim. Sci. 43, 320-339.
Du Toit, C.J.L., Meissner, H.H. & Van Niekerk, W.A., 2013b. Direct greenhouse gas emissions of the game industry in South Africa. S. Afr. J. Anim. Sci. 43, 376-393.
Du Toit, C.J.L., Van Niekerk, W.A. & Meissner, H.H., 2013c. Direct greenhouse gas emissions of South African small stock sectors. S. Afr. J. Anim. Sci. 43, 340-361.
Du Toit, C.J.L., Van Niekerk, W A. & Meissner, H.H., 2013d. Direct methane and nitrous oxide emissions of monogastric livestock in South Africa. S. Afr. J. Anim. Sci. 43, 362-375.
FAO, 2009. The state of food and agriculture – Livestock in the balance. Food and Agricultural Organization of the United Nations, Rome. ISBN 978-92-5-1062 15-9.
Feedstuffs Foodlink, undated. Beef okay for heart health. www.FeedstuffsFoodlink.com. Fouché, H.J., 2010. Global warming and its influence on red meat production. Presentation at the RPO North
West Congress, Hartbeesfontein, South Africa, September 2010. Harris, C., 2012. WMC-IMS in partnership with FAO on livestock emissions. The Beef Site, 6 June 2012
http://www.thebeefsite.com/news/38733/wmc-ims. Hoffman, M.T. & Rohde, R.F., 2011. Rivers through time: Historical changes in the riparian vegetation of
the semi-arid rainfall region of South Africa in response to climate and land use. J. History Biol. 44, 59-80.
IDF, 2012. IDF partners with FAO to harmonize measurement of livestock’s environmental impacts, 5 July 2012. www.fil.idf.org.
IMS, 2012. Message from the IMS President, IMS Sustainable Meat Committee. www.meat-ims.org. Labadarios, D., Swart, R., Maunder, E. et al., 2008. The National Food Consumption Survey – Fortification
Baseline (NFCS-FS-11): South Africa, 2005. Directorate Nutrition, Department of Health, Pretoria. LID, 1999. Livestock in poverty-focused development. Livestock in Development, Somerset, UK. MacIntyre, U.E., Naicker, A., Venter, C.S. et al., 2010. Dietary patterns and risk markers for non-
communicable diseases in an Indian population in KwaZulu-Natal. S. Afr. J. Clin. Nutr. 23 (Suppl. 2), S26.
McMichael, A.J. & Ainslie, J.B., 2010. Environmentally sustainable and equitable meat consumption in a climate change world. In: The Meat Crisis: Developing More Sustainable Production and Consumption. Eds: D’Silva, J. & Webster, J., Earthscan LTD, London. pp. 173-189.
Meissner, H.H., 2012. Beef production and consumption: Sustainability towards 2030. NutriEconomics®: Balancing Global Nutrition & Productivity, World Nutrition Forum, October 10th – 13th, 2012, Singapore, pp179-188, Anytime Publishing, Leicestershire, England. ISBN: 978-0-9573721-2-2.
Meissner, H.H., Hofmeyr, H.S., Van Rensburg, W.J.J. & Pienaar, J.P., 1983. Classification of livestock for realistic prediction of substitution values in terms of a biologically defined Large Stock Unit. Technical Communication No. 175 of the Department of Agriculture, April 1983. Available from the Directorate Agricultural Information, Department of Agriculture, Forestry and Fisheries, Pretoria. ISBN 0 621 07954 5.
Milk SA, 2011. Statistics, LACTO DATA, Vol. 14(1), May 2011, a Milk SA publication compiled by the MPO, Pretoria.
Mohair SA, 2011. Report to authors on goat numbers and employment in the Mohair Industry. Mohair SA, Port Elizabeth, South Africa.
NAMC, 2006. Report on the investigation to identify problems for sustainable growth and development in South African wildlife ranching. Report no 2006-03, National Agricultural Marketing Council, Pretoria.

296 Meissner et al., 2013. S. Afr. J. Anim. Sci. vol. 43
Nel, J.H. & Steyn, N.P., 2002. Report on South African food consumption studies undertaken amongst different population groups (1983-2000). Average intakes of foods most commonly consumed (online). http://www.sahealthinfo.org/nutrition/scientific.htm.
NWGA, 2009. Best Practice Manual for Wool Sheep Farming in South Africa, 2009. www.ngwa.co.za. NWGA, 2011a. Report to authors on sheep numbers and employment in the Wool Industry. National Wool
Growers Association, Port Elizabeth. NWGA, 2011b. Ekonomiese Studiegroep Resultate. National Wool Growers Association, Port Elizabeth.
Supported by Cape Wools SA, SA Mohair Growers Association, RMRD SA, RPO and DAFF. O’Leary, P., 2013. The importance of technology in doubling food supply by 2050. In: Proceedings of the 4th
Global Feed and Food Congress, 10 – 12 April 2013. Sun City, South Africa. www.gffc2013.com. Palmer, A.R., Short, A. & Yunusa, I.A.M., 2010. Biomass production and water use efficiency of grassland
in KwaZulu-Natal, South Africa. Afr. J. Range Forage Sci. 27, 163-169. Puttick, J.R., Hoffman, M.T. & Gambiza, J., 2011. Historical and recent land-use impacts on the vegetation
of Bathurst, a municipal commonage in the Eastern Cape, South Africa. Afr. J. Range Forage Sci. 28, 9-20.
Randolph, T.H., Schelling, E., Grace, D., Nicholson, C.F., Leroy, J.L., Cole, D.C., Demment, M.W., Omore, A., Zinsstag, J. & Ruel, M., 2007. Invited Review: Role of livestock in human nutrition and health for poverty reduction in developing countries. J. Anim. Sci. 85, 2788-2800.
RPO, 2010. RPO and NERPO Code of Best Practice for Sustainable and Profitable Red Meat Production. Red Meat Producers Organization, Pretoria. www.rpo.co.za.
RPO, 2011. Report by RPO Provincial Offices to authors on beef cattle and goat numbers and employment in the Red Meat Industry. Red Meat Producers Organization, Pretoria.
SAFA, 2011. Report to authors on cattle and sheep numbers and employment in the Feedlot Industry. South African Feedlot Association, Centurion.
SAGRA, 2011. Report to authors on game numbers and employment in the Game Industry. South African Game Ranchers Association, Pretoria.
SAMFED, 1999. Dairy Development Initiative, Milk SA, Pretoria. SAMIC, 2002. Red Meat Industry Status Report, South African Meat Industry Company, Pretoria. SAPA, 2010a. Annual Report of the Broiler Organization. South African Poultry Association.
www.sapa.co.za. SAPA, 2010b. Annual Report of the Egg Organization. South African Poultry Association. www.sapa.co.za SAPA, 2011. Report to authors on poultry numbers and employment in the Poultry Industry. South African
Poultry Association, Johannesburg. SA Pork, 2011. Report to authors on pig numbers and employment in the Pork Industry. South African Pork
Producers Organization, Pretoria. Scholtz, M.M., 2012. The development of a seed stock industry using indigenous livestock from rural
keepers for sustainable production. J. Life Sci. 6, 1270-1276. Schönfeldt, H.C., Pretorius, B. & Hall, N., 2013. The impact of animal source food products on human
nutrition and health. S. Afr. J. Anim. Sci. 43, 394-412. Scollan, N., Moran, D., Joong Kim, E. & Thomas, C., 2010. The Environmental Impact of Meat Production
Systems. Report to the International Meat Secretariat, 2 July 2010. Seifert, J., 2013. IDF objectives, strategy and actions with regard to a sustainable dairy industry. In:
Proceedings of the 4th Global Feed and Food Congress, 10-13 April 2013. Sun City, South Africa. www.gffc2013.com.
Smith, J., Sones, K., Grace, D., MacMillan, S., Tarawali, S. & Herrero, M., 2013. Animal Frontiers 3, 6-13. Smuts, M., 2011. Report to authors on milk goat numbers. Scientific Roets, Kokstad, South Africa. Tainton, N.M., 1999. Veld Management in South Africa. University of Natal Press, Pietermaritzburg, South
Africa. Thornton, P.K., 2010. Livestock production: Recent trends, future prospects. Phil. Trans. R. Soc. B365,
2853-2867. Van Heerden, I.V. & Schönfeldt, H.C., 2011. The lack of food intake data and the consequences thereof.
S. Afr. J. Clin. Nutr. 24, 10-18. Van Hoven, W., 2011. Report to authors on number of game farms. UP, Pretoria.

Meissner et al., 2013. S. Afr. J. Anim. Sci. vol. 43 297
Van Rooyen, C.J., Carstens, J.P. & Nortjé, A., 1997. The role of agriculture in South Africa’s economy: A research and technology challenge. Agricultural Research Council, Pretoria.
WWF, 2010. Agriculture in South Africa: Facts and Trends. World Wildlife Fund, Stellenbosch. www.wwf.org.za.