Embed Size (px)
Citation preview
Sustainability of Changing Agricultural
Systems in the Coastal Zone of Bangladesh
By
BYOMKESH TALUKDER
A thesis submitted to the School of Environmental Studies
in conformity with the requirements for
the degree of Master of Environmental Studies
Queen’s University
Kingston, Ontario, Canada
(September, 2012)
Copyright ©Byomkesh Talukder, 2012

ii
Sustainability of Changing Agricultural Systems in the Coastal Zone of Bangladesh
Transformations of the various agricultural systems have been taking place in the coastal zone of
Bangladesh. While some farmers continue to follow traditional practices, in recent years, others
have become involved in massive shrimp cultivation, shrimp-rice cultivation, a rice-based improved
agricultural system or a shrimp-rice-vegetable integrated system. All these types of agriculture are
being practiced under highly vulnerable environmental conditions. The long-term livelihood, food
security and adaptation of the coastal people largely depend on the sustainability of these
agricultural practices. In this context, assessing the level of sustainability is extremely important
and will be essential for developing future policy options in Bangladesh.
This study attempts to examine the sustainability of agricultural practices in the coastal region of
Bangladesh. A field study was carried out in 2011 in five villages of five upazilas in the mature and
active delta areas of the country. The data were collected through in-depth questionnaire surveys,
focus groups discussions, field observation, key informants and secondary materials. A
comprehensive suite of indicators was developed considering productivity, efficiency, stability,
durability, compatibility and equity of the coastal agriculture. The categories and the indicators
were weighted using Multi-Criteria Decision Analysis (MCDA) to measure the sustainability level of
five study sites.
The integrated agricultural system (shrimp-rice-vegetable) of Dumuria appeared to be the most
sustainable system among agricultural practices, and other integrated systems (rice-based
improved agricultural system) of Kalaroa were also found to show a good level of sustainability.
The massive shrimp cultivation system of Shyamnagar and Kaliganj appears to be least
sustainable. A traditional agriculture system with some improved methods followed in Bhola Sadar
Abstract

iii
Sustainability of Changing Agricultural Systems in the Coastal Zone of Bangladesh
also performed in a satisfactory manner, but there were limitations in terms of its location in the
active delta. The level of the sustainability measured in this study allows for a comparison among
agricultural practices of the five study sites. The information generated from the study may be used
in formulating policies for this part of the country. Measuring agricultural sustainability in this way
produces a useful summary of sustainability issues and also provides some vital learning
experiences.
A holistic and interdisciplinary approach is attempted in this study for assessing and comparing the
sustainability level of coastal agricultural systems. It has the potential to become useful as one of
the frameworks for sustainability assessment.

iv
Sustainability of Changing Agricultural Systems in the Coastal Zone of Bangladesh
First and foremost, I would like to express my debt of gratitude to my supervisor, Professor Gary
vanLoon, MES, Queen’s University, Canada for generous guidance and providing me with the
opportunity for this rewarding research experience. His valued advice always kept my thoughts
towards an appropriate focus. I am also grateful to Professor Graham Whitelaw, Queen’s
University, Canada for his co-supervision of my thesis. I would also like to thank Professor Dara
Shamsuddin (Retired, Department of Geography and Environment, Jahangirnagar University,
Dhaka, Bangladesh) for share his vast experiences and guidance during field study. I am also
grateful to Md. Saifuzzaman (Lecturer, Department of Geography and Environment, Jahangirnagar
University, Dhaka, Bangladesh) for data collection activities and arranging logistic support during
field visit, I would like to thank Krishna, Sumon, Arif, Zaman and Sabbir (Students, Department of
Geography and Environment, Jahangirnagar University, Dhaka, Bangladesh) for their support in
data collection and field activity management. I would also like to thank all of my informants and
respondents in the study areas, for sparing valuable time and sincere effort to get required data. I
also thank all the officers (agriculture, fish, health, education) of upazilas and local leaders to
extend all possible supports. I would like to give special thanks to Harkiran Kaur for helping me in
editing my thesis.
I am grateful to the School of Environmental Studies, Queen’s University for funding which they
have provided, making the field research a success. I thank the MES class, particularly Jonathon
Chretien, Clay McMullen, Alan Clark, Tina Louise Basso and Anna Graham for their support and
friendship.
Acknowledgement
v
Sustainability of Changing Agricultural Systems in the Coastal Zone of Bangladesh
I owe a debt of gratitude to my wonderful parents for their unconditioned love, affection and
invaluable guidance throughout my life. I also owe a debt to my brothers and sisters for their
guidance. I would like to thank my great family for their unconditioned support and encouragement
throughout my studies. Most importantly, this research work is for very special person, my wife
Soma Karmaker and daughter Purnata Talukder Tuli who always inspired me with their ever-
encouraging emotional support, cooperation and empathy. Thank you.
Byomkesh Talukder
September, 2012
vi
Sustainability of Changing Agricultural Systems in the Coastal Zone of Bangladesh
Page Abstract ii
Acknowledgement iv
Table of Contents vi
List of Tables viii
List of Figures Ix
List of Pictures x
List of Appendices xi
Chapter – 1 : Introduction 1
1.0 Introduction 1
1.1 Agricultural Sustainability 3
1.2 Conceptual Framework of the Thesis 8
1.3 Research Objectives 11
1.4 Scope of the Study 12
1.5 Brief Profile of Bangladesh 13
1.6 Brief Profile of the Coastal Areas 16
1.7 Organization of the Thesis 19
Chapter – 2 : Methodology 21
2.0 Introduction 21
2.1 Literature Review 22
2.2 Establishing Linkage with a Local University 24
2.3 Questionnaire Development 24
2.4 Selection of Study Areas 24
2.5 Events in Field Study 26
2.6 Verification of the Study Areas 26
2.7 Field Observation 27
2.8 Selection of Sample Size 28
2.9 Household Questionnaire Survey 28
2.10 FGD (Focus Group Discussion) 30
2.11 Key Informant Interviews 32
2.12 Summarizing and Tabulating Collected Data 33
2.13 Quantitative Data Analysis 33
2.14 Qualitative Data Analysis 33
2.15 Selection of Indicators 33
2.16 Multi Criteria Decision Analysis 37
Table of Contents
vii
Sustainability of Changing Agricultural Systems in the Coastal Zone of Bangladesh
Chapter – 3 : Study Area 50
3.0 Introduction 50 3.1 Description of Munshiganj Village of Shyamnagar Upazila 51 3.2 Description of Nalta Village of Kaliganj Upazila 53 3.3 Description of Tarulia Village of Kalaroa Upazila 53 3.4 Description of Banda Village of Dumuria Upazila 55 3.5 Description of Kunja Patti Village of Bhola Sadar Upazila 56
Chapter – 4 : Data Analysis and Discussion 59
4.0 Introduction 59 4.1 Profile of the Respondent Households 59 4.2 Agricultural Profile of the Study Areas 60 4.3 Sustainability Assessment 70 4.3.1 Productivity 71 4.3.2 Stability 75 4.3.3 Efficiency 81 4.3.4 Durability 85 4.3.5 Compatibility 91 4.3.6 Equity 96 4.3.7 Discussion 108 4.3.8 Level of Agricultural Sustainability in the Study Areas 115
Chapter – 5 : Conclusion and Recommendations 119
References
123
viii
Sustainability of Changing Agricultural Systems in the Coastal Zone of Bangladesh
List of Tables Page
Table 1.1 : Classification of scholars’ emphasis and their tendency toward three components of agricultural sustainability according to a review of literatures
6
Table 2.1 : List of sources of the secondary information and data 23 Table 2.2 : Matrixes for selection of the study areas 25 Table 2.3 : Major events of field study over a period of four months 26 Table 2.4 : Number of surveyed household 28 Table 2.5 : Target groups and data collection methods 29
Table 2.6 : Selected indicators and justification of selection 34 Table 2.7 : Weighting judgment of selected attributes to measure value of
sustainability of agricultural systems by MCDA 41
Table 2.8 : List of methods/software for measuring different indicators 46 Table 4.1 : Profile of the respondent households 59 Table 4.2 : Characteristics of traditional and integrated shrimp farming in the study
areas 61
Table 4.3 : General seasonal calendar of the study areas 62 Table 4.4 : Agricultural activities of Shyamnagar based on general crop calendar 63 Table 4.5 : Agricultural activities of Kaliganj based on general crop calendar 64 Table 4.6 : Agricultural activities of Kalaroa based on general crop calendar 66 Table 4.7 : Agricultural activities of Dumuria based on general crop calendar 68 Table 4.8 : Agricultural activities of Bhola Sadar based on general crop calendar 70 Table P1 : Productivity indicators of the agricultural systems 73 Table 4.3.1 : Productivity values after combining weightings and normalized results of
indicators 75
Table S1 : Assigned values of stability indicators 77 Table 4.3.2 : Stability values after combining weightings and normalized results of
indicators 81
Table E1 : Efficiency indicators of the agricultural systems 84 Table 4.3.3 : Efficiency values after combining weightings and normalized results of
indicators 85
Table D1 : Durability indicators of the agricultural systems 89 Table 4.3.4 : Durability values after combining weightings and normalized results of
indicators 90
Table C1 : Compatibility indicators of the agricultural systems 94 Table 4.3.5 : Compatibility values after combining weightings and normalized results of
indicators 95
Table E1 : Indicators of equity of the agricultural systems 99 Table 4.3.6 : Equity values after combining weightings and normalized results of
indicators 106
Table 4.3.7 : Sustainability level after combining weightings and MCDA results of catagories
118

ix
Sustainability of Changing Agricultural Systems in the Coastal Zone of Bangladesh
List of Figures Page
Figure 1.1 : Sustainability tripod 3 Figure 1.2 : Agriculture and sustainable issues 4 Figure 1.3 : Conceptual framework to assess agricultural sustainability 8 Figure 1.4 : Bengal delta 18 Figure 2.1 : Flow chart of the research methodology 22 Figure 2.2 : Example of the attribute tree of agricultural sustainability in Web-HIPRE
window 39
Figure 3.1 : Location of the study areas in Bangladesh 50 Figure 4.1 : Large-scale transect of agricultural system of Shyamnagar 63 Figure 4.2 : Large-scale transect of agricultural system of Kaliganj 65 Figure 4.3 : Large-scale transect of agricultural system of Kalaroa 66 Figure 4.4 : Large-scale transect of agricultural system of Dumuria 68 Figure 4.5 : Diagram of integrated gher farming system and soil fertility process 69 Figure 4.6 : Large-scale transect of agricultural system of Bhola Sadar 70 Figure 4.3.1 : Value of productivity of the study areas by MCDA 74 Figure 4.3.2 : Value of stability of the study areas by MCDA 80 Figure 4.3.3 : Value of efficiency of the study areas by MCDA 84 Figure 4.3.4 : Value of durability of the study areas by MCDA 90 Figure 4.3.5 : Value of comptibility of the study areas by MCDA 95 Figure 4.3.6 : Value of equity of the study areas by MCDA 106 Figure 4.3.7 : Value of sustainability of the study areas by MCDA 117
Figure 4.3.8 : Comparison of the level of agricultural sustainability of the study areas in spider diagram
118
x
Sustainability of Changing Agricultural Systems in the Coastal Zone of Bangladesh
List of Pictures Page
Picture 2.1 : Activities for verification of the study areas 27 Picture 2.1(A) : Verification of agricultural system and surrounding environs of
Kaliganj with local people 27
Picture 2.1(B) : Verification of agricultural system and surrounding environs of Kalaroa with key informants
27
Picture 2.1(C) : Verification of agricultural system and surrounding environs of Shyamnagar with local people
27
Picture 2.1(D) : Returning field station after verifying the study area of Shyamnagar 27 Picture 2.2 : Activities of questionnaire survey during field study 30 Picture 2.2(A) : Questionnaire survey in Shyamnagar 30 Picture 2.2(B) : Questionnaire survey in Kaliganj 30 Picture 2.2(C) : Questionnaire survey in Kalaroa 30 Picture 2.2(D) : Questionnaire survey in Dumuria 30 Picture 2.3 : Activities of FGDs during field study 31 Picture 2.3(A) : FGD in Shyamnagar 31 Picture 2.3(B) : FGD in Kaliganj 31 Picture 2.3(C) : FGD in Dumuria and 31 Picture 2.3(D) : FGD in Bhola Sadar 31 Picture 2.4 : Key informant interview during field study 32 Picture 2.4(A) : Interview with key informant in Kalaroa 32 Picture 2.4(B) : Interview with key informant in Dumuria 32 Picture 4.4.5(A) : Supply of drinking water by truck in Shyamnagar, 96 Picture 4.4.5(B) : Collection of shrimp fry form natural habitat 96 Picture 4.4.5(C) : Homestead of Dumuria with rich biodiversity 96 Picture 4.4.5(D) : Rich biodiversity of agricultural fields and homesteads of Bhola
Sadar. 96
Picture 4.4.6(A) : Women are working in agricultural field of Kaliganj, 107 Picture 4.4.6(B) : Farmer and his wife are working together preparing food for galda
prawn in Dumuria, 107
Picture 4.4.6(C) : Male and female children of farmers in a classroom of a primary school of Kalaroa
107
Picture 4.4.6(D) : Solar panel in a homestead of Shyamnagar to run and charge electronic goods like TV, mobile etc.
107
xi
Sustainability of Changing Agricultural Systems in the Coastal Zone of Bangladesh
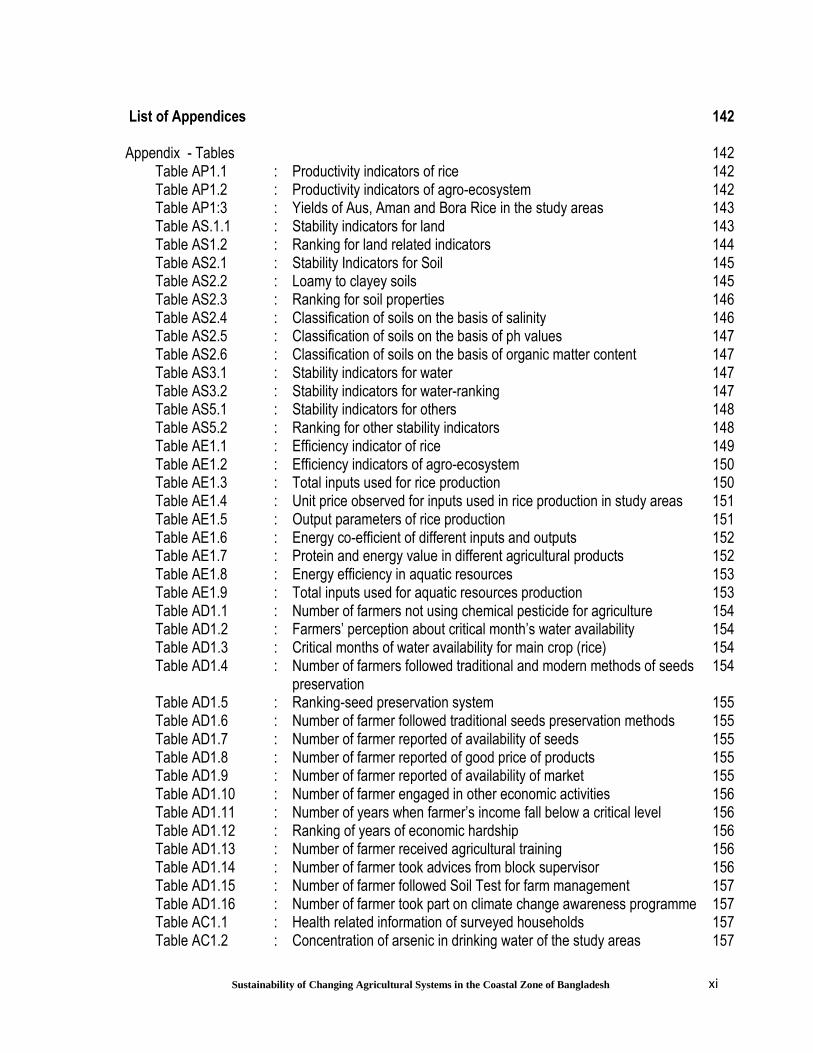
List of Appendices
142
Appendix - Tables 142 Table AP1.1 : Productivity indicators of rice 142 Table AP1.2 : Productivity indicators of agro-ecosystem 142 Table AP1:3 : Yields of Aus, Aman and Bora Rice in the study areas 143 Table AS.1.1 : Stability indicators for land 143 Table AS1.2 : Ranking for land related indicators 144 Table AS2.1 : Stability Indicators for Soil 145 Table AS2.2 : Loamy to clayey soils 145 Table AS2.3 : Ranking for soil properties 146 Table AS2.4 : Classification of soils on the basis of salinity 146 Table AS2.5 : Classification of soils on the basis of ph values 147 Table AS2.6 : Classification of soils on the basis of organic matter content 147 Table AS3.1 : Stability indicators for water 147 Table AS3.2 : Stability indicators for water-ranking 147 Table AS5.1 : Stability indicators for others 148 Table AS5.2 : Ranking for other stability indicators 148 Table AE1.1 : Efficiency indicator of rice 149 Table AE1.2 : Efficiency indicators of agro-ecosystem 150 Table AE1.3 : Total inputs used for rice production 150 Table AE1.4 : Unit price observed for inputs used in rice production in study areas 151 Table AE1.5 : Output parameters of rice production 151 Table AE1.6 : Energy co-efficient of different inputs and outputs 152 Table AE1.7 : Protein and energy value in different agricultural products 152 Table AE1.8 : Energy efficiency in aquatic resources 153 Table AE1.9 : Total inputs used for aquatic resources production 153 Table AD1.1 : Number of farmers not using chemical pesticide for agriculture 154 Table AD1.2 : Farmers’ perception about critical month’s water availability 154 Table AD1.3 : Critical months of water availability for main crop (rice) 154 Table AD1.4 : Number of farmers followed traditional and modern methods of seeds
preservation 154
Table AD1.5 : Ranking-seed preservation system 155 Table AD1.6 : Number of farmer followed traditional seeds preservation methods 155 Table AD1.7 : Number of farmer reported of availability of seeds 155 Table AD1.8 : Number of farmer reported of good price of products 155 Table AD1.9 : Number of farmer reported of availability of market 155 Table AD1.10 : Number of farmer engaged in other economic activities 156 Table AD1.11 : Number of years when farmer’s income fall below a critical level 156 Table AD1.12 : Ranking of years of economic hardship 156 Table AD1.13 : Number of farmer received agricultural training 156 Table AD1.14 : Number of farmer took advices from block supervisor 156 Table AD1.15 : Number of farmer followed Soil Test for farm management 157 Table AD1.16 : Number of farmer took part on climate change awareness programme 157 Table AC1.1 : Health related information of surveyed households 157 Table AC1.2 : Concentration of arsenic in drinking water of the study areas 157

xii
Sustainability of Changing Agricultural Systems in the Coastal Zone of Bangladesh
Table AC1.3 : Ranking of arsenic 157 Table AC1.4 : Land use in the study areas in 2010 158 Table AC1.5 : Ecosystem services provided by agricultural system 159 Table AC1.6 : Crop richness 159 Table AC1.7 : Farmer opinion on overall environmental condition 159 Table AEQ1.1 : Educational status of the respondent 160 Table AEQ1.2 : Educational status of respondent’s male children 160 Table AEQ1.3 : Educational status of respondent’s femael children 160 Table AEQ1.4 : Education status scoring system 160 Table AEQ1.5 : Average income of the agro ecosystem (in us$) 161 Table AEQ1.6 : Farm assets value 161 Table AEQ1.7 : Total wage of farm labours 161 Table AEQ1.8 : Percentage of people above extreme poor 161 Table AEQ1.9 : Availability of staple food from own production 161 Table AEQ1.10 : Nutrition intake status from staple food 162 Table AEQ1.11 : Settings of treatment 162 Table AEQ1.12 : Cooking facilities 162 Table AEQ1.13 : Toilet facilities 163 Table AEQ1.14 : Electricity connection 163 Table AEQ1.15 : Women participation in agricultural activities 163 Table AEQ1.16 : Percentage of women representative in local government 163 Table AEQ1.17 : Access to electronic media 163 Appendix - Questionnaire 164 Appendix - Figures 191 Figure 1.1 : Administrative map of Shyamnagar Upazila 191 Figure 1.2 Google imagery of the Munshiganj area 192 Figure 1.3 : Administrative map of Nalta village 192 Figure 1.4 : Google imagery of the Nalta area 193 Figure 1.5 : Administrative map of Jogikhali 193 Figure 1.6 : Google imagery of the Jogikhali area 194 Figure 1.7 : Administrative map of Dumuria 194 Figure 1.8 : Google imagery of the Dumuria area 195 Figure 1.9 : Administrative map of Bhola Sadar 196 Figure 1.10 : Google imagery of the Kunja Patti village 197 Appendix - MCDA Results 198

1
Sustainability of Changing Agricultural Systems in the Coastal Zone of Bangladesh
1.0 Introduction
Agriculture is the most important livelihood option for the coastal people of Bangladesh (GoB and
UNDP, 2009). It has a key role to play in tackling the challenges of the growing population, poverty
alleviation, maintaining food security and adapting to climate change (BCCAAP, 2010; BPRSP,
2005). It has been identified as being of prime importance for achieving development goals in
coastal areas (BPRSP, 2005). About 40 million people of the coastal areas of Bangladesh depend
on agriculture (BBS, 2011).
The area under study in this thesis is highly vulnerable due to causes that are both natural and
human (UNEP and GoB, 2001). Cyclones, tidal surges, high wave interactions, sea level rise,
global climate change impacts, floods, withdrawal of upstream river water, salt water intrusion,
erosion and saline water-logging are all affecting the agricultural systems in the coastal areas
(GoB, 2010). Along with disasters, the agriculture practices of this area are always under threat as
it is one of the depressed regions of Bangladesh and it has suffered from sluggish growth partly
due to longstanding administrative negligence (BPRSP, 2005).
At present, however, the coastal agricultural of Bangladesh is transforming, in spite of the many
problems and constraints (Islam, 2006a). Embankments in particular have played a crucial role in
transformation of traditional agriculture. After the introduction of surge-protecting
embankments/polders in the 1960s some parts of the coastal region started to enjoy high yields in
traditional crop cultivation (Ali, 2002; Nishat, 1988). However, later on due to the effects of frequent
cyclones and storm surges and poor management of the embankment, some parts of the coastal
areas have become water logged and saline (Rahman, 1995). This makes these areas unsuitable
for traditional cropping (Rahman, 1995) and in this situation, in the 1970s some farmers started
Chapter-1: Introduction
2
Sustainability of Changing Agricultural Systems in the Coastal Zone of Bangladesh
commercial shrimp cultivation to mitigate the loss in traditional agriculture to maintain their
livelihood (Karim, 1986).
From the 1980s to the present, shrimp cultivation has created a substantial economic and social
transformation in those coastal areas where it has been taken up (DoF, 2010; Hamid and Alauddin,
1998). Furthermore, in recent years, shrimp has become a significant foreign exchange earner for
Bangladesh (DoF, 2010; Mahmood, 2006). However, shrimp farming is a subject of criticism since
it can damage the local ecology by increasing the salinity of the water and soil, change the
composition of the soil and bring about rapid changes in land use and land cover (Deb, 1998;
Hagler, 1997; Haque, 2004; Islam et al. 1999; Kori, 1996; Karim and Stellwagen, 1998). There are
also claims that it has led to disintegration of economic and social conditions of coastal rural
communities (Ali, 2006; Ali, 2004; Islam and Koudstaal, 2003; Mohmood, 2006).
Because of environmental and social impacts associated with shrimp cultivation, farmers of some
parts of the coastal areas are incorporating vegetables and domestic animals into existing farming
practices, integrating shrimp or prawn and fish with rice and vegetables. As a whole the people of
the coastal areas are trying different agricultural practices to cope with the changing environment
(Mohmood, 2006). This transformation of agriculture has many positive effects and has reduced
some risks in farming. However, there is a growing concern on how this transforming agriculture is
coping with the existing physical and social economic environment, how it is supporting people of
the area and how beneficial it is in comparison with shrimp cultivation or traditional agricultural
practices. In fact, these changes in livelihood have raised several issues, all of which can be
summarized under the following research question.

3
Sustainability of Changing Agricultural Systems in the Coastal Zone of Bangladesh
What are the sustainability features of adaptive agricultural systems that are practised
for pursuing livelihoods, especially in comparison with different farming systems that
are followed in different parts of the coastal areas? This can be answered by
measuring the sustainability of agricultural practices.
1.1 Agricultural Sustainability
The word ‘sustainability’ is often used interchangeably with ‘sustainable development’ in spite of
perhaps having different meanings (Sarah et al., 1999). The words sustainable development have
been at the center of the environment and development debate since the Conference on Human
Environment in Stockholm in 1972 (Richard and
Emmerij, 2009). The best known definition of sustainable
development that of the Brundtland Commission of the
United Nations on March 20, 1987: “Sustainable
development is development that meets the needs of the
present without compromising the ability of future
generations to meet their own needs” (UN, 1987).
Sustainable Development or sustainability must involve many interconnected factors(vanLoon et
al., 2005). There is broad consensus that these factors should incorporate three elements:
environmental, economical and, social (Figure 1.1).
On the basis of the above basic concept, the sustainability of any human activity can be assessed.
Agriculture is one of the human activities that is a major concern in the present world due to the
global food crisis and environmental problems. Interest in the sustainability of agricultural and food
systems can be traced to environmental concerns that began to appear in the 1950s–1960s
Figure 1.1: Sustainability tripod

4
Sustainability of Changing Agricultural Systems in the Coastal Zone of Bangladesh
Figure 1.2: Agriculture and sustainable issues
(Pretty, 2008). The interest has evolved over the last 20 years, now appearing in the political
agenda at the international and national levels, with particular emphasis on ecological concerns
(Häni et al., 2006).
Agriculture profoundly affects many natural ecological systems and, in its relation with economics
and society, also affects the life of humans around the world (Figure 1.2). Agro-ecosystems can be
conceived as social-ecological systems that combine human actors with other biological and
physical elements in the process of food and fiber production (Waltner-Toews et al., 2004).
The social element of agricultural sustainability mainly derives from the fact that each of us is
involved directly or indirectly in all aspects of agriculture (vanLoon et al., 2005). In most definitions
of agricultural sustainability, the need to maintain resilience in environmental and social systems by
meeting a complex array of interacting environmental, social and economic conditions is central
(Swart et al., 2004). According to DFID (2004) "agriculture is sustainable when current and future
food demands can be met without unnecessarily compromising economic, ecological, social and
5
Sustainability of Changing Agricultural Systems in the Coastal Zone of Bangladesh
political needs". Feenstra and Campbell (2011) also emphasize that sustainable agriculture
integrates three main goals--environmental health, economic profitability, and social and economic
equity.
There are different views regarding how to assess the sustainability of agriculture. According to
Lynam and Herdt (1989), agricultural sustainability can be assessed by examining the changes in
yields and total factor productivity. Conway (1987, 1985) measured agricultural sustainability
through studying its yields, social acceptability and biophysical sustainability. Biological and
physical scientists have tended to focus on biophysical measures of sustainability, such as crop
yields on the output side, and indicators of soil and water quality on the input side (Barnett et al.,
1995; Pieri et al., 1995). According to Ceyhan (2010), to assess agricultural sustainability data
used to create indicators of sustainability should be collected within economic, social,
environmental and bio-physical groupings.
Due to its multidimensional nature, a variety of philosophies, policies and practices have
contributed to measure the goals of sustainable agriculture. Those who study and practice
sustainable agriculture come from diverse backgrounds, academic disciplines, and farming
practices (Gold, 2007) and their opinions vary on what features are suitable or not suitable in its
assessment (Table 1.1).
A detailed and multidimensional investigation is needed to assess sustainability of any agricultural
system. In assessing sustainability, setting objectives should be the first step followed by a careful
selection and application of indicators. An indicator is a number or other descriptor that is
representative of a set of conditions and indicates or points to aspects of an issue (vanLoon et al.,
2005). Another fairly simple definition of indicator is something that quantifies and simplifies
phenomena and helps us to understand complex realities; in other words it acts as a proxy or
6
Sustainability of Changing Agricultural Systems in the Coastal Zone of Bangladesh
simplification of more complex information (EC, 2007). Sustainability indicators for agriculture are
being developed all over the world to measure the effects of agriculture on economic,
environmental and social issues. Sustainability indicators need to be easy to measure, overlapping
in time and diverse so that the indicators can capture the main effects of agriculture on the
economy, environment and socio-economic make-up of a community.
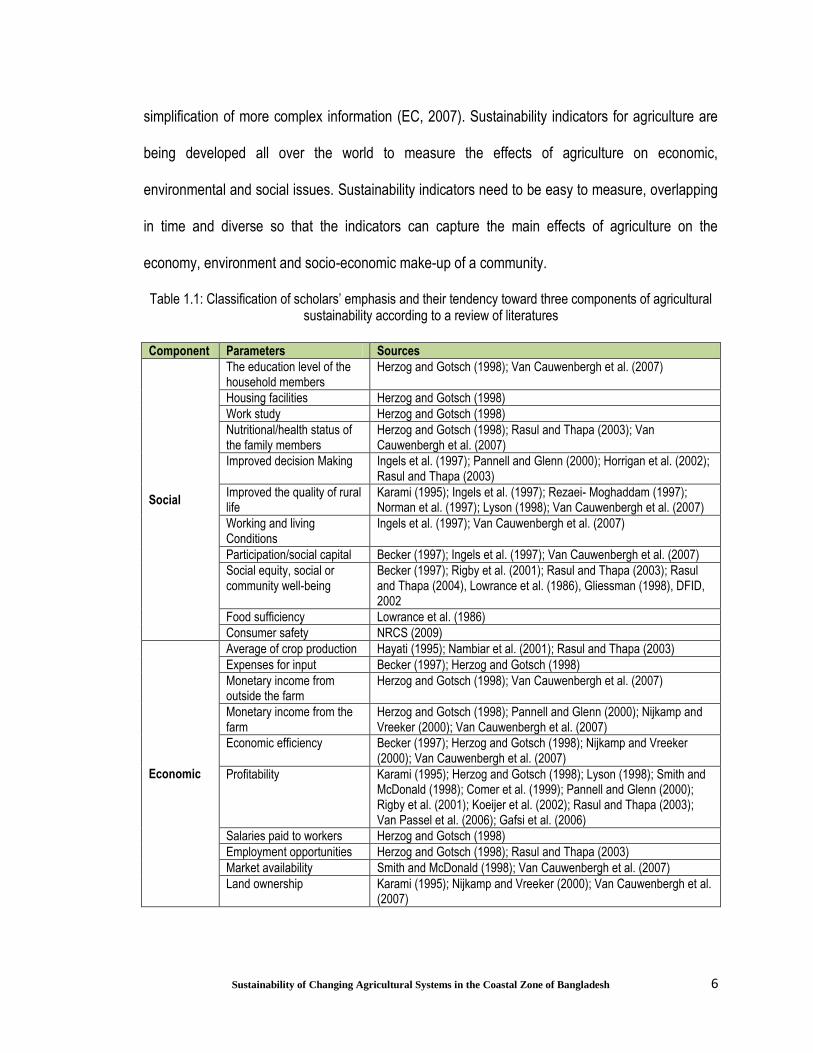
Table 1.1: Classification of scholars’ emphasis and their tendency toward three components of agricultural sustainability according to a review of literatures
Component Parameters Sources
Social
The education level of the household members
Herzog and Gotsch (1998); Van Cauwenbergh et al. (2007)
Housing facilities Herzog and Gotsch (1998)
Work study Herzog and Gotsch (1998)
Nutritional/health status of the family members
Herzog and Gotsch (1998); Rasul and Thapa (2003); Van Cauwenbergh et al. (2007)
Improved decision Making Ingels et al. (1997); Pannell and Glenn (2000); Horrigan et al. (2002); Rasul and Thapa (2003)
Improved the quality of rural life
Karami (1995); Ingels et al. (1997); Rezaei- Moghaddam (1997); Norman et al. (1997); Lyson (1998); Van Cauwenbergh et al. (2007)
Working and living Conditions
Ingels et al. (1997); Van Cauwenbergh et al. (2007)
Participation/social capital Becker (1997); Ingels et al. (1997); Van Cauwenbergh et al. (2007)
Social equity, social or community well-being
Becker (1997); Rigby et al. (2001); Rasul and Thapa (2003); Rasul and Thapa (2004), Lowrance et al. (1986), Gliessman (1998), DFID, 2002
Food sufficiency Lowrance et al. (1986)
Consumer safety NRCS (2009)
Economic
Average of crop production Hayati (1995); Nambiar et al. (2001); Rasul and Thapa (2003)
Expenses for input Becker (1997); Herzog and Gotsch (1998)
Monetary income from outside the farm
Herzog and Gotsch (1998); Van Cauwenbergh et al. (2007)
Monetary income from the farm
Herzog and Gotsch (1998); Pannell and Glenn (2000); Nijkamp and Vreeker (2000); Van Cauwenbergh et al. (2007)
Economic efficiency Becker (1997); Herzog and Gotsch (1998); Nijkamp and Vreeker (2000); Van Cauwenbergh et al. (2007)
Profitability Karami (1995); Herzog and Gotsch (1998); Lyson (1998); Smith and McDonald (1998); Comer et al. (1999); Pannell and Glenn (2000); Rigby et al. (2001); Koeijer et al. (2002); Rasul and Thapa (2003); Van Passel et al. (2006); Gafsi et al. (2006)
Salaries paid to workers Herzog and Gotsch (1998)
Employment opportunities Herzog and Gotsch (1998); Rasul and Thapa (2003)
Market availability Smith and McDonald (1998); Van Cauwenbergh et al. (2007)
Land ownership Karami (1995); Nijkamp and Vreeker (2000); Van Cauwenbergh et al. (2007)

7
Sustainability of Changing Agricultural Systems in the Coastal Zone of Bangladesh
Component Parameters Sources
Economic
Soil management Hayati (1995); Becker (1997); Ingels et al. (1997); Bouma and Droogers (1998); Pannell and Glenn (2000); Sands and Podmore (2000); Bosshard (2000); Nambiar et al. (2001); Horrigan et al. (2002); Rasul and Thapa (2003); Van Cauwenbergh et al. (2007)
Long-term stability of the agricultural enterprise
NRCS (2009)
Crop productivity Gliessman (1998), DFID, 2002
Ecological
Improve water resource management
Hayati (1995); Ingels et al. (1997); Gafsi et al. (2006); Van Cauwenbergh et al. (2007)
Usage of pesticides, herbicides and fungicides
Hayati (1995); Rezaei-Moghaddam (1997); Ingels et al. (1997); Norman et al. (1997); Pannell and Glenn (2000); Rasul and Thapa (2004)
Usage of animal/organic manure
Saltiel et al. (1994); Hayati (1995); Norman et al. (1997); Bosshard (2000)
Usage of green manure Senanayake (1991); Saltiel et al. (1994); Hayati (1995)
Physical yield Ingels et al. (1997); Herzog and Gotsch (1998) • Physical inputs and efficient use of input Herzog and Gotsch (1998); Rasul and Thapa (2003)
Crop diversification Senanayake (1991); Saltiel et al. (1994); Ingels et al. (1997);Comer et al. (1999); Praneetvatakul et al. (2001); Nambiar et al. (2001); Horrigan et al. (2002); Rasul and Thapa (2003)
Crop rotation Saltiel et al. (1994); Rasul and Thapa (2003) • Use of alternative crop Saltiel et al. (1994) Ecological • Usage of fallow system Saltiel et al. (1994); Hayati (1995); Comer et al. (1999); Horrigan et al. (2002); Rasul and Thapa (2003)
Cropping pattern Nijkamp and Vreeker (2000); Rasul and Thapa (2003); Rasul and Thapa (2004)
Trend of change in climatic conditions
Smith and McDonald (1998); Van Cauwenbergh et al. (2007)
Usage of chemical fertilizer Hayati (1995); Ingels et al. (1997); Rezaei-Moghaddam (1997)
Conservational tillage (no/minimum tillage)
Hayati (1995); Ingels et al. (1997); Comer et al. (1999); Horrigan et al. (2002);
Control erosion Hayati (1995); Ingels et al. (1997); Rasul and Thapa (2003); Gafsi et al. (2006); Van Cauwenbergh et al. (2007)
Energy Senanayake (1991); Pannell and Glenn (2000) • Microbial biomass with in the soil Senanayake (1991); ); Ingels et al. (1997); Norman et al. (1997); Nambiar et al. (2001); Van Cauwenbergh et al. (2007)
Cover crop/Mulch Ingels et al. (1997); Norman et al. (1997); Comer et al. (1999); Horrigan et al. (2002); Rasul and Thapa (2003)
Depth of groundwater Table Pannell and Glenn (2000); Sands and Podmore (2000); Van Cauwenbergh et al. (2007)
Integrated pest Management
Pannell and Glenn (2000); Protein level of crops Comer et al. (1999); Praneetvatakul et al. (2001); Orrigan et al. (2002); Rasul and Thapa (2003)
Decline in the quality of the natural environment
McIsaac and Edwards (1994)
Adverse environmental impact
Rasul and Thapa (2003)

8
Sustainability of Changing Agricultural Systems in the Coastal Zone of Bangladesh
Component Parameters Sources
Ecological
Stewardship of natural resources
Lowrance et al. (1986)
Environmental protection NRCS (2009)
Balances environmental soundness
Gliessman (1998)
Capacity of systems to buffer shocks and stresses (Resilience)
DFID, (2002)
Source: Hayati et al., 2010; Literature survey, 2012
1.2 Conceptual Framework of the Thesis
In any assessment, indicators should be chosen only after first developing and clearly expressing a
conceptual overview (Figure 1.3) of the situation and objectives of the measurement process. For
our study in Bangladesh sustainable agriculture is defined as “producing food in a productive and
economically efficient manner, using practices that maintain or enhance the quality of the local and
surrounding environment-soil, water, air and all living things. It is also sustainable in supporting the
health and quality of life of individual farmers, their families and the community as a whole” (based
on the definition in vanLoon et al., 2005).
Figure 1.3: Conceptual framework to assess agricultural sustainability, Concept adapted from vanLoon et al., 2005

9
Sustainability of Changing Agricultural Systems in the Coastal Zone of Bangladesh
After setting out a conceptual statement a second step is to further refine and expand the overview
to establish specific areas that require investigation. These areas are called categories. To draw a
description of the total situation of any agriculture system, it is then necessary as third step to
select appropriate indicators that allow assessment within these categories. Recognizing that
agriculture is a process of food production as well as a way of life, six categories are chosen so as
to reflect its various dimensions. These categories are based on issues of sustainable
development. The categories (modified from vanLoon et al., 2005) are:
Productivity: For the needs of the farm family as well as to satisfy national and global
requirements, sustainable agriculture must be capable of producing high yields. For this study,
standard measures of crop yield, shrimp/fish harvest, etc. will be used, and also comparisons will
be made on the basis of economic value of the harvested product.
Stability: For sustainable agriculture it is necessary that the high level of productivity be
maintained over an indefinite period of time. This requires that the quality of the resources on which
production is based also be maintained and even enhanced. For this study an examination of the
long-term prospects of traditional and altered agriculture systems will be carried out based on data
of land, soil, water, climate and other related issues.
Efficiency: To be sustainable, all resources required for agriculture - human, animal and material -
should be used in a way that is not wasteful, but maximizes output per unit input. This is especially
true of non-renewable resources. For this project the measures will be the ratio of product output
to input of various resources, primarily non-renewable resources, including measures of energy
output/input ratios.

10
Sustainability of Changing Agricultural Systems in the Coastal Zone of Bangladesh
Durability: Any crop production process is from time to time subject to stresses of various types,
such as those due to water, pests or finance. Sustainable systems should be intrinsically resilient in
the face of such stress. For this study, durability issues are the frequency of stress encounters in
the study area – financial and environmental, and ways of relieving stress and what are the
sustainability measures that can be taken to cope with regular stresses?
Compatibility: Sustainable agriculture should fit in with the human, social and natural
environments where it is located, maintaining and enhancing health of these environments. For this
study, it will be observed how the traditional and modified agricultural systems fit in with the unique
natural surroundings of the coastal area. Also, how compatible are the agricultural practices with
human health?
Equity: Agriculture should promote a good quality of life among the various individuals involved in
the farming activities and within families. This includes having consideration for the standard of
living, health and education of all people in the community. For this study the comparison of some
issues of education, economics, health and gender of the traditional and altered agricultural system
will be followed in terms of equity.
Having set out categories to be assessed, indicators are chosen, modified or often developed
afresh. The careful choice of indicators is critical in order to achieve the desired goals of the
investigation.
The overviews of the assessment suggested here are meant to provide a comprehensive picture of
agricultural sustainability in coastal areas of Bangladesh. Other workers in this field have
developed different, but usually similar, frameworks that can be used as scaffolding for the
construction of indicators. For example, Rasul and Thapa (2003) in their study for sustainability
11
Sustainability of Changing Agricultural Systems in the Coastal Zone of Bangladesh
assessment of agricultural systems in Bangladesh used ecological, economic and social dimension
categories for the evaluation of conventional and ecological agricultural systems.
While sustainability of agriculture has become an important issue in developed countries, there are
few studies in Bangladesh that have addressed the issue. Sustainable agriculture has only recently
been directly addressed through policy initiatives, although the term sustainability has often been
mentioned. Most of the policies have indicated the need of sustainable development in agriculture
by ensuring good environmental management, increasing economic activities and development the
society (GoB, 2006). The draft National Agriculture Policy of Bangladesh (2010) broadly aims at
"creating an enabling environment for sustainable growth of agriculture for reducing poverty and
ensuring food security through increased crop production and employment opportunity as
envisaged in National Strategy for Accelerated Poverty Reduction (NSAPR), Millennium
Development Goals (MDGs) and SAARC Development Goals (SDGs)" (MoA, 2010). In fact, to
achieve these aims agriculture will have to be managed on the basis of a broad view of
sustainability. Recently the national strategy of sustainable development of Bangladesh recognized
sustainable development in agriculture through formulating a sustainable agricultural strategy for
crops, fisheries and livestock sectors.
1.3 Research Objectives
Based on empirical data obtained from primary observation and other sources, the present study
attempts to examine the sustainability of agricultural practices in the coastal Bangladesh. Specific
objectives of the research are:
12
Sustainability of Changing Agricultural Systems in the Coastal Zone of Bangladesh
1. To understand and draw a profile of traditional and changing agriculture systems in coastal
areas of Bangladesh;
2. To develop a set of representative indicators, in order to analyze agricultural sustainability;
3. Using these indictaors, to measure the level of agricultural sustainability in various
categories and to aggregate them using a Multiple-Criteria Decision Analysis technique
4. To give some recommendations based on the findings that support best agriculture
practice for sustainable agriculture in coastal regions of Bangladesh.
1.4 Scope of the Study
An understanding of agricultural sustainability is indispensable for designing coastal agricultural
policies. Different studies have revealed that, due to transformation of practices in this area, the
natural resource base has potentially been damaged but at the same time there have been some
positive impacts on coastal society (Alam et al., 1990; DoE, 2005; Firoze, 2003; Haque, 2004).
While many aspects of the present agricultural systems appear to be attractive, there is no
conclusive evidence about the long term benefits to individuals and the wider community. In this
situation, it is expected that the study will assist farm families and policy makers in understanding
the features of coastal agricultural sustainability
In order to do this assessment, a supporting goal is to identify and develop communicable
indicators for productivity, stability, efficiency, durability, compatibility and equity. For this, there is a
need to apply a variety of multidisciplinary methods in gathering and analyzing information.
13
Sustainability of Changing Agricultural Systems in the Coastal Zone of Bangladesh
1.5 Brief Profile of Bangladesh
Bangladesh is a low-lying deltaic country in the tropical zone of South Asia (NPDM, 2007; Rashid,
1991). The physiography of the country consists of floodplains (79.1%), some terraces (8.3%) and
hilly areas (12.6%) (FAO, 2007). A network of 230 rivers with their tributaries and distributaries
crisscross the country, and among them 57 are trans-boundary rivers (Suvedi, 2005). Being the
downstream and deltaic portion of a vast watershed, it is naturally vulnerable to the water quality
and quantity that flows into it from upstream.
The United Nations Development Program (UNDP) in 2004 and Global Climate Risk Index (CRI)-
2010 (Harmeling, 2010) recognized Bangladesh as a highly vulnerable country in terms of natural
calamities. It is also widely recognized to be one of the most vulnerable countries to the potential
effects of climate change. The country could lose 17% of its land by 2050 because of rising sea
level by 1 m (IPCC, 2007). In the coming decades therefore, the rising sea level could create more
than 20 million climate refugees in Bangladesh (PBS, 2008; Walker, 2010). Along with many
natural calamities, Bangladesh is grappling with the largest mass poisoning of a population in
history because of groundwater used for drinking that has been contaminated with naturally
occurring inorganic arsenic (Smith et al., 2000); up to 77 million people are exposed to toxic
arsenic from drinking water (BBC, 2010).
Bangladesh has a typical monsoon climate. The average annual rainfall is about 2000 mm, of
which approximately 70% occurs during the monsoon season. The relative humidity is persistently
high, varying from 70% in March to 89% in July. The average annual temperature is 26oC (BMD,
2011).
14
Sustainability of Changing Agricultural Systems in the Coastal Zone of Bangladesh
The total land area of Bangladesh is about 14.4 million ha (BBS, 2011). Depending on the flooding
depth, land is categorized as highland (20%), medium highland (35%), medium lowland (20%),
lowland (8%) and very lowland (1%) (Kashem, 2006). Based on the features of the physical
environment that are relevant to land use, the land is divided into 30 agro-ecological zones and 88
sub-regions (FAO/UNDP, 1999).
The population of 142.32 million ranks Bangladesh 7th in the world and the population density is
more than 964 people per km2 (BBS, 2011). About 80% of the total population are living in rural
areas, and among them, 53% are classified as poor (WB, 2011). Rural population is made up of
mostly marginal and small farmers along with a sizeable fraction of rural landless labourers all of
whom are fully dependent on agriculture (BBS, 2006). The number of farmer families is 10 million;
among them 2 million are in the marginal and landless categories (BBS, 2008). At present the
average household size is 4.4 persons per family (BBS, 2011).
Bangladesh has 8.44 (56.87% of total land area) million ha of cultivable land among which about
2.85 (19%) million ha is devoted to single cropped area; 3.98 (26.82%) million ha is double
cropped area and 0.94 (6.54%) million ha is triple cropped area (BBS, 2006; MoA, 2006). The total
number of farm holdings is 15,089,000 with 0.56 ha being the average size of a holding and 0.06
ha per capita cultivated area (BBS, 2006). Agricultural land is fragmented into small pieces
because of the large number of farm holdings and division of land among family members over the
generations (Uddin and Haque, 2007). Over 30 to 40 years, the arable land of the country is
decreasing by 1% per year due to the absence of proper land use policies, and the building of new
houses, industrialization, and urbanization (NFPCSP, 2008).

15
Sustainability of Changing Agricultural Systems in the Coastal Zone of Bangladesh
Despite many constraints, Bangladesh has made substantial progress in enhancing food security
and recently achieved food autarky in rice at the national level (FPMU, 2008). Among different
crops, rice is overwhelmingly dominant in terms of area planted and importance; it is the staple
food and accounts for about 75% of the cropping area of the country (Gumma, 2012). Although
production of rice is largely sufficient, self-sufficiency in other food items is yet to be achieved
(Mainudden et al., 2011). In Bangladesh half of the population are below the absolute poverty line
defined in terms of a minimum calorie intake of 2122 kcal/day (WFP, 2005) and approximately one
fourth of the population are the hard-core poor consuming less than 1805 kcal/day (MoA and FAO,
2010).
The national economy of Bangladesh is significantly dependent on agricultural production (ICID,
2000). The rural population is directly or indirectly engaged in a wide range of agricultural activities
for employment, livelihoods and nutrition - including grain crops, fruit and vegetables, fisheries,
livestock and forestry (Rahman et al., 2002). In 2007-08, the agricultural sector accounted 20.16%
of the national GDP, of which crops made up 11.70%, fisheries 4.64%, livestock 2.79% and
forestry 1.75%. Agriculture provides more than 60% of the national employment (BBS, 2008).
In 2011, Bangladesh ranked 146 among 172 countries in the Human Development Index (HDI)
with an index value of 0.566 (UNDP, 2011). The per capita GDP of Bangladesh stood at USD 664
per annum (PC, 2010). Households spend 59% of their income on food. Bangladesh has, however,
achieved remarkable progress in some areas of MDGs such as primary schooling, girls’ education,
immunization, micro-credit, female economic participation, birth control, physical mobility and
safety nets (GoB and UNDP, 2005). In universal primary education, Bangladesh is on its way to
meet the MDG 2 by 2015 (GoB and UNDP, 2005). Although relevant indicators of other MDGs
16
Sustainability of Changing Agricultural Systems in the Coastal Zone of Bangladesh
have moved toward their 2015 targets, their performances have been uneven (GoB and UNDP,
2005). Bangladesh is in the process of completing its first Poverty Reduction Strategy Papers
(PRSP), which has taken into account the MDGs. The PRSP is addressing the issues of pro-poor
growth and human development, and when implemented, will accelerate the achievement of the
MDGs (GoB and UNDP, 2005).
1.6 Brief Profile of the Coastal Areas
The coastal zone of Bangladesh covers 47 201 (32%) km2 land area of the total geographical area
of the country (Shamsuddoha and Chowdhury, 2007; MoWR, 2005). The entire zone is low lying
with 62% of land have an elevation of less than 3 metres and 86% less than 5 metres (Islam et al.,
2006). Depending on elevation and other factors, the defined coastal area can reach from 37 to
195 km from the shore (MoWR, 2005). The whole coast runs along the northern border of the Bay
of Bengal, forming a 710 km long coastline (MoWR, 2005).
Physiographically most of the coastal zone consists of extensive flat coastal and deltaic land of the
Ganges-Brahmaputra Delta, which is crossed by large tidal rivers discharging into the Bay of
Bengal (Rashid and Kabir, 1998). In general, much of the western part of the coastal zone is a
moribund or mature delta; the middle part is an active delta; and the eastern part is a stable
landmass (Ahmed, 2003) (Figure 1.4). Continuous accretion and deposition are taking place in
active delta of the coastal regions due to strong river and tidal currents (Chowdhury and Hossain,
2006). In this project study areas were selected from the active delta (Bhola Sadar) and the mature
delta (the other four sites).

17
Sustainability of Changing Agricultural Systems in the Coastal Zone of Bangladesh
The coastal region covers 19 administrative districts encompassing 153 upazilas (sub-districts,
formerly called thanas) and the Exclusive Economic Zone (MoWR, 2005). Out of these 19 districts,
12 meet the sea or lower estuary directly (MoWR, 2005). Among the upazilas, 51 from 12 districts
face the coast or lower estuary and these areas are known as exposed coast (Islam et al., 2006;
PDO-ICZMP, 2003). The remaining 102 upazilas that are further inland from the exposed coast are
within what is termed the interior coast (MoWR, 2005). The upazilas in the exposed coast have
already met or crossed the threshold limit tidal movement, salinity, cyclone risk - and the upazilas
in interior coast have met or exceed any two or one of the three parameters (PDO-ICZMP, 2003).
In the coastal zone, 62% of land has an elevation of 3 m or less and 86% is less than 5 m above
sea level (Islam et al., 2006). Since the 1960s, the southeast coast of Bangladesh is protected by
implementing cross dams (Wheeler and Gravgaard, 2010). The coastal people pursue their
livelihoods in a unique environment with a combination of natural disasters and man-made
changes (WRPO, 2006).
The National Strategy for Accelerated Poverty Reduction (BPRSP, 2005) acknowledges the
Coastal Zone as a special focus area that is distinct in many respects and requiring of special
attention acknowledging the fact that “there is considerable interface between the persistence of
chronic poverty and unfavorable agricultural environments, (e.g. salinity-prone, flood-prone, river-
erosion prone, drought-prone areas)”. Later on, the Government of Bangladesh formulated Coastal
Zone Policy, 2005 and Coastal Development Strategy, 2006 and adopted an Estuary Development
Programme along with other initiatives to address coastal vulnerabilities.

18
Sustainability of Changing Agricultural Systems in the Coastal Zone of Bangladesh
According to 2011 Population Census, the coastal zone comprises 6.85 million households with a
population of 35.1 million (BBS, 2011). In the coastal zone the net cultivable area is 1.95 million ha
Figure 1.4: Bengal delta, Source: Banglapedia, 2010

19
Sustainability of Changing Agricultural Systems in the Coastal Zone of Bangladesh
indicating that the average landholding per household is half the already small national average.
The net-cropped area of coastal zone in Bangladesh has been decreasing over the years due to
various causes that are soil-related or associated with climate risk and socio-economic problems;
the most common one is land inundation and salinity intrusion by tidal water. A comparative study
of Bangladesh Soil Resource Development Institute (SRDI) shows that from 1973 to 2000 about
0.170 million ha (20.4%) land of coastal areas is affected by salinity (SRDI, 1997; SRDI, 2001).
One of the main economic activities in the coastal zone is aquaculture (Islam and Ahmad, 2004).
The significance of shrimp farming has grown rapidly over the last 30 years (Alam and Phillips,
2004). Shrimp areas have expanded from 51 812 ha in 1983 to 137 996 ha in 1994 and 218 649
ha in 2004 (DoF, 1995 and 2005). At present, Bangladesh supplies around 2.5% of the global
shrimp trade (DoF, 2004).
1.7 Organization of the thesis
This thesis is comprised of five chapters that contribute to fulfilling of the research objectives.
Chapter One sets out the context of the research and the research question, the framework of the
research, research objectives and scope. Chapter Two describes the methodologies with a focus
on description of different approaches used for data collection and analysis. It also reflects on the
research plan, the process adopted for the selection of study areas and a view of the techniques of
data analysis. Chapter Three describes the study areas. Chapter Four analyses the data, through
qualitative, quantitative and MCDA methods. It explores different indicators, their measurement
and, finally, the level of agricultural sustainability in the five study areas. This chapter also

20
Sustainability of Changing Agricultural Systems in the Coastal Zone of Bangladesh
synthesizes the key findings and contributions of the research. Chapter Five concludes the thesis
with some recommendations related to coastal agricultural sustainability of Bangladesh.

21
Sustainability of Changing Agricultural Systems in the Coastal Zone of Bangladesh
2.0 Introduction Assessment of agricultural sustainability is a complex task, involving many factors. Developing a
comprehensive suite of indicators is one useful way of assessing sustainability. Indicators can be
qualitative or quantitative; they are often relative in terms of time and space and are influenced by
the socioeconomic and agro-ecological conditions of the area (Hayati et al., 2011). In this study, an
indicator-based procedure is used to assess agricultural sustainability in the coastal zones of
Bangladesh; supported by descriptive data obtained by various types of primary and secondary
data.
Ethical approval was obtained from the General Research Ethics Board (GREB) to conduct this
research through the Office of Research Services, Queen’s University, Kingston, Ontario. After
ethical approval, the research methodology of the study advanced in three main phases (Figure
2.1). In the first phase, issues of sustainability relevant to the adapted agriculture of the study area
were identified through literature survey, brainstorming and discussion with experts. On the basis
of the identified issues, a questionnaire was established. In this phase, correspondence was
carried out with a local university of Bangladesh for selection of study areas, pre-test of the
questionnaire, and arranging for students to assist with data collection.
Phase two dealt with primary and secondary data collection. Farmers were the source of primary
data. General discussions were held with them to monitor the situation. Various documents of the
Government and NGOs were acted as major sources of secondary data. Ensuring full participation
of the sampled farmers at all stages was the main strategy of primary data collection.
Chapter-2: Methodology

22
Sustainability of Changing Agricultural Systems in the Coastal Zone of Bangladesh
In phase three, both primary and secondary data were summarized and tabulated. After tabulation,
both qualitative and quantitative techniques were applied to assess the sustainability of agricultural
systems.
2.1 Literature Review
A literature review was carried out to collect available data related to sustainability of coastal
agriculture in Bangladesh. At the same time literature was sought that would assist in
Finalization of the collected data
Figure 2.1: Flow chart of the research methodology
Ph
ase
On
e P
has
e T
wo
P
has
e T
hre
e
Questionnaire survey, key
informant interview, FGD, and detailed field observation
Literature Review Identify possible issues for six categories of sustainability
Development of
Questionnaire
Establish linkage with local university and
Selection of study areas
Pretest of the
questionnaire
Finalization of the questionnaire
Selection of the sample size for questionnaire survey, key
informants and FGD participants
Start Data Collection
Secondary data from government
and NGOs documents, books,
reports, internet etc.
Ground truthing of the
study areas, GPS
reading and field
observation
Preparation of Google imagery maps of the selected study areas
and its environs
Summarize and tabulation of the collected data
Qualitative and Quantitative analysis, MCDA
Second field study to verify the issue rose from first field study
Preparation of final report and presentation

23
Sustainability of Changing Agricultural Systems in the Coastal Zone of Bangladesh
understanding appropriate qualitative and quantitative techniques for data analysis. Documents,
policy reports, presented papers, articles, academic journals, books and related websites of
government and non-government bodies were reviewed. The literature also assisted in identifying
gaps in current knowledge and targeting the types of data needed for the assessment. The source
organizations of secondary data are listed in Table 2.1.
Table 2.1: List of sources of the secondary information and data
Sl. No. Name of the Source Organization Abbreviation
Government Organizations
1. Bangladesh Statistical Bureau BBS
2. Department of Agriculture Extension DoAE
3. Department of Fisheries DoF
4. Department of Livestock Services DoLS
5. Bangladesh Water Development Board BWDB
6. Bangladesh Agricultural Research Council BARC
7. Soil Resources Development Institute SRDI
8. Bangladesh Meteorological Department BMD
9. Department of Environment DoF
10. Comprehensive Disaster Management Programme CDMP
NGOs(Non-Government Organizations)
1. Bangladesh Resource Center on Indigenous Knowledge BARCIK
2. Coastal Environment Conservation Center CECC
3. Bangladesh Centre for Advanced Studies BCAS
4. Bangladesh Rural Advancement Centre BRAC
5. Sushilon
6. Centre for Policy Dialog
7. Bangladesh Institute for Development Studies BIDS
International Organizations
1. International Union for Conservation of Nature IUCN
2. United States Agency for International Development USAID - Bangladesh
3. Asian Development Bank ADB
4. World bank WB
5. United Nations UN
6. Food and Agriculture Organization FAO
7. Intergovernmental Panel on Climate Change IPCC
8. World Health Organization WHO
9. Canadian International Development Agency CIDA Source: Literature review, 2011

24
Sustainability of Changing Agricultural Systems in the Coastal Zone of Bangladesh
2.2 Establishing Linkage with a Local University
An informal linkage was established involving two academicians at the Department of Geography
and Environment, Jahangirnagar University, Savar, Dhaka, Bangladesh and the School of
Environmental Studies, Queen’s University, Kingston, Canada. Professor Dara Shamsuddin and
Lecturer Md. Saifuzzaman of Jahangirnagar contributed immensely to the work by sharing their
ideas, and assisting in data collection and analysis. In addition, a group consisting of six students
was selected through interviews and they were given training on the research topic and data
collection methods. After training, they worked under supervision for data collection.
2.3 Questionnaire Development
A 35-page questionnaire was developed to collect field level primary data (Appendix A). The
questionnaire was pre-tested through 5 interviews, and after pretest needed improvements were
made. The questionnaire was in English, but interviews were conducted in the local language,
Bangla. The issues of sustainability of agriculture were kept in mind during development of the
questionnaire, and it was designed to be comprehensive, but also simple enough to allow for
appropriate collection and interpretation of information (Rattray and Jones, 2007).
2.4 Selection of Study Areas
Five villages from five coastal upazilas were selected for study araes. Several criteria were
considered during their selection: farmers doing intensive shrimp farming with little rice; farmers
doing intensive shrimp and rice with the same weight; farmers growing traditional crops but using
modern methods; farmers doing integrated shrimp, rice and vegetable farming; and farmers doing
mostly traditional agriculture. The criteria and locations were selected through literature review and
consultation with local experts. Here, traditional agriculture means growing crops and following
25
Sustainability of Changing Agricultural Systems in the Coastal Zone of Bangladesh
practice that have been used over many years. Five maps from Google imagery were produced to
get an idea about the environs of the study areas before undertaking the field study.
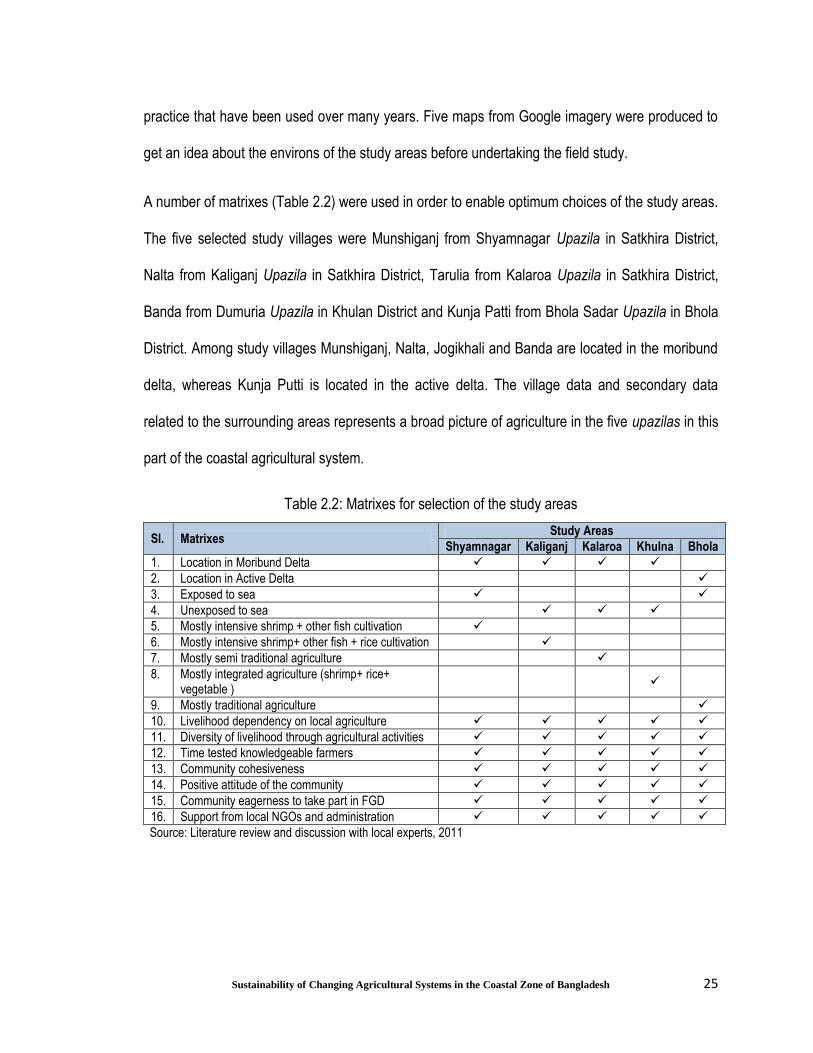
A number of matrixes (Table 2.2) were used in order to enable optimum choices of the study areas.
The five selected study villages were Munshiganj from Shyamnagar Upazila in Satkhira District,
Nalta from Kaliganj Upazila in Satkhira District, Tarulia from Kalaroa Upazila in Satkhira District,
Banda from Dumuria Upazila in Khulan District and Kunja Patti from Bhola Sadar Upazila in Bhola
District. Among study villages Munshiganj, Nalta, Jogikhali and Banda are located in the moribund
delta, whereas Kunja Putti is located in the active delta. The village data and secondary data
related to the surrounding areas represents a broad picture of agriculture in the five upazilas in this
part of the coastal agricultural system.
Table 2.2: Matrixes for selection of the study areas
Sl. Matrixes Study Areas
Shyamnagar Kaliganj Kalaroa Khulna Bhola
1. Location in Moribund Delta
2. Location in Active Delta
3. Exposed to sea
4. Unexposed to sea
5. Mostly intensive shrimp + other fish cultivation
6. Mostly intensive shrimp+ other fish + rice cultivation
7. Mostly semi traditional agriculture
8. Mostly integrated agriculture (shrimp+ rice+ vegetable )
9. Mostly traditional agriculture
10. Livelihood dependency on local agriculture
11. Diversity of livelihood through agricultural activities
12. Time tested knowledgeable farmers
13. Community cohesiveness
14. Positive attitude of the community
15. Community eagerness to take part in FGD
16. Support from local NGOs and administration
Source: Literature review and discussion with local experts, 2011

26
Sustainability of Changing Agricultural Systems in the Coastal Zone of Bangladesh
2.5 Events in Field Study
The field study was carried out from May to August, 2011. First step of the field study was to visit
and observe the selected study areas to understand the agricultural activities and environment
inform helpers about the objectives of the research and contact key informants. The second step
was to establish contact with different organizations as sources of secondary information and to
arrange logistic support for data collection activities. After this, approximately three months were
spent in carrying out the various components of the survey. The major events of field study over a
period of four months are presented in Table 2.3.
Table 2.3: Major events of field study over a period of four months
Tools/methods 2011
Outcome May June July August
Ground truthing of the selected study areas, informing local helper about the objectives of the research.
Visit selected study areas with Google images and understand the agricultural practices and associate environ.
Second pretesting of the questionnaire.
Pretesting of the questionnaire in the selected villages.
Field observation. Field visit on foot to interact with famers to understand the agricultural practices fully.
Household questionnaire survey. Sustainability issues of agricultural systems.
FGD with farmers. Identify the sustainability issue of agricultural practices.
Interview with key informants. Collect the key information related to coastal agriculture.
Collecting of secondary data. Various secondary data on six categories of sustainability of agriculture.
Source: Field study, 2011
2.6 Verification of the Study Areas
Philosophy of ground-truthing techniques was applied to verify the nature of the agricultural
systems and associate environments of the elected study areas. This was especially pertinent in
order to relate satellite image data (Google) to real features and material on the ground. Prior to

27
Sustainability of Changing Agricultural Systems in the Coastal Zone of Bangladesh
ground-truthing field visits, checklists were prepared for the issues which needed to be verified.
Examples of some activates of ground-truthing are presented in Picture 2.1.
Picture 2.1: Activities for verification of the study areas. (A) Verification of agricultural system and surrounding environs of Kaliganj with local people, (B) Verification of agricultural system and surrounding environs of Kalaroa with key informants, (C) Verification of agricultural system and surrounding environs of Shyamnagar with local people and (D) Returning field station after verifying the study area of Shyamnagar.
2.7 Field Observation
Field observation was used to collect information on the agricultural system and people involved
with emphasis on issues of sustainability. Advantages of the use of direct observation as a
research method have been emphasized by many researchers (Robson, 1993). Simpson and
Tuson (1995) noted that there is almost no research strategy to which data collection by
observation cannot contribute. In the present situation, a detailed examination of the agricultural
A B
C D
28
Sustainability of Changing Agricultural Systems in the Coastal Zone of Bangladesh
settings was important as background for carrying out the farmers’ survey as well as the interviews
of various stakeholders.
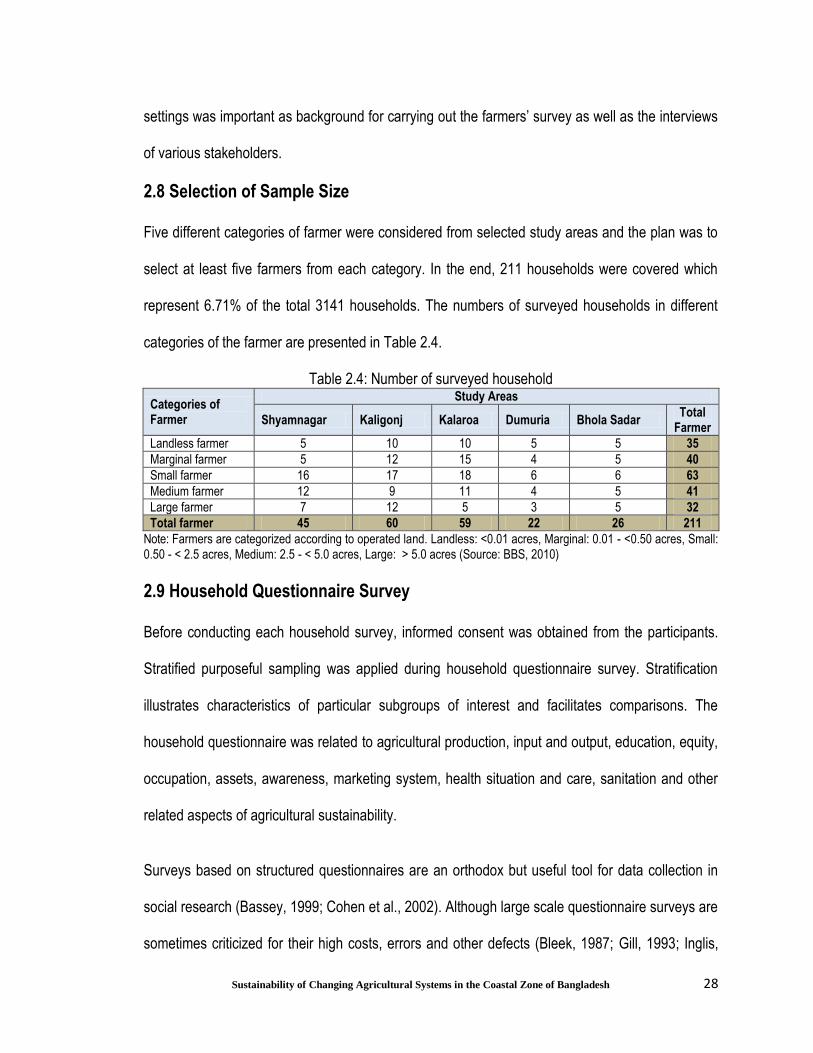
2.8 Selection of Sample Size
Five different categories of farmer were considered from selected study areas and the plan was to
select at least five farmers from each category. In the end, 211 households were covered which
represent 6.71% of the total 3141 households. The numbers of surveyed households in different
categories of the farmer are presented in Table 2.4.
Table 2.4: Number of surveyed household
Categories of Farmer
Study Areas
Shyamnagar Kaligonj Kalaroa Dumuria Bhola Sadar Total
Farmer
Landless farmer 5 10 10 5 5 35
Marginal farmer 5 12 15 4 5 40
Small farmer 16 17 18 6 6 63
Medium farmer 12 9 11 4 5 41
Large farmer 7 12 5 3 5 32
Total farmer 45 60 59 22 26 211
Note: Farmers are categorized according to operated land. Landless: <0.01 acres, Marginal: 0.01 - <0.50 acres, Small: 0.50 - < 2.5 acres, Medium: 2.5 - < 5.0 acres, Large: > 5.0 acres (Source: BBS, 2010)
2.9 Household Questionnaire Survey
Before conducting each household survey, informed consent was obtained from the participants.
Stratified purposeful sampling was applied during household questionnaire survey. Stratification
illustrates characteristics of particular subgroups of interest and facilitates comparisons. The
household questionnaire was related to agricultural production, input and output, education, equity,
occupation, assets, awareness, marketing system, health situation and care, sanitation and other
related aspects of agricultural sustainability.
Surveys based on structured questionnaires are an orthodox but useful tool for data collection in
social research (Bassey, 1999; Cohen et al., 2002). Although large scale questionnaire surveys are
sometimes criticized for their high costs, errors and other defects (Bleek, 1987; Gill, 1993; Inglis,
29
Sustainability of Changing Agricultural Systems in the Coastal Zone of Bangladesh
1991) for one-off investigations or longitudinal studies, but they remain one of the most widespread
and sustainable methods of rural research (Guijt, 1992). DFID (2000) and Ellis (1998) suggested
that using questionnaire surveys can provide reliable data on livelihoods strategies and outcomes.
Data gathered by questionnaires provide an opportunity to compare across cases and wealth
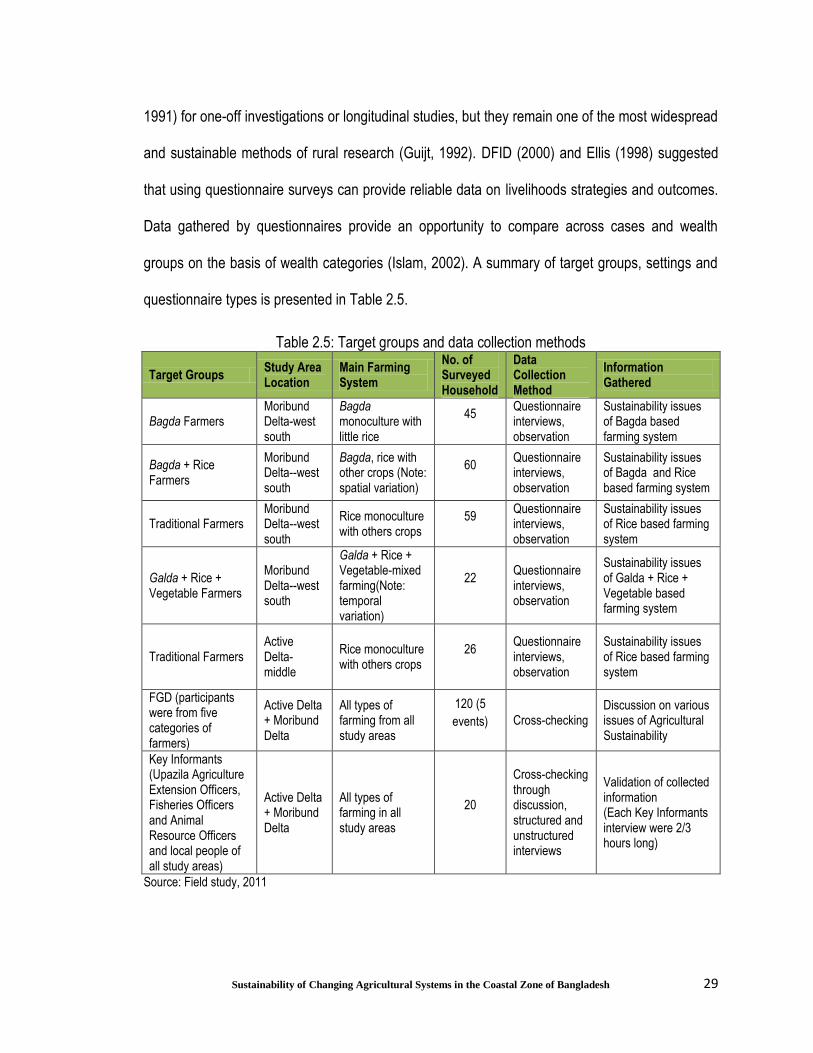
groups on the basis of wealth categories (Islam, 2002). A summary of target groups, settings and
questionnaire types is presented in Table 2.5.
Table 2.5: Target groups and data collection methods
Target Groups Study Area Location
Main Farming System
No. of Surveyed Household
Data Collection Method
Information Gathered
Bagda Farmers Moribund Delta-west south
Bagda monoculture with little rice
45 Questionnaire interviews, observation
Sustainability issues of Bagda based farming system
Bagda + Rice Farmers
Moribund Delta--west south
Bagda, rice with other crops (Note: spatial variation)
60 Questionnaire interviews, observation
Sustainability issues of Bagda and Rice based farming system
Traditional Farmers Moribund Delta--west south
Rice monoculture with others crops
59 Questionnaire interviews, observation
Sustainability issues of Rice based farming system
Galda + Rice + Vegetable Farmers
Moribund Delta--west south
Galda + Rice + Vegetable-mixed farming(Note: temporal variation)
22 Questionnaire interviews, observation
Sustainability issues of Galda + Rice + Vegetable based farming system
Traditional Farmers Active Delta-middle
Rice monoculture with others crops
26 Questionnaire interviews, observation
Sustainability issues of Rice based farming system
FGD (participants were from five categories of farmers)
Active Delta + Moribund Delta
All types of farming from all study areas
120 (5
events) Cross-checking Discussion on various issues of Agricultural Sustainability
Key Informants (Upazila Agriculture Extension Officers, Fisheries Officers and Animal Resource Officers and local people of all study areas)
Active Delta + Moribund Delta
All types of farming in all study areas
20
Cross-checking through discussion, structured and unstructured interviews
Validation of collected information (Each Key Informants interview were 2/3 hours long)
Source: Field study, 2011
30
Sustainability of Changing Agricultural Systems in the Coastal Zone of Bangladesh
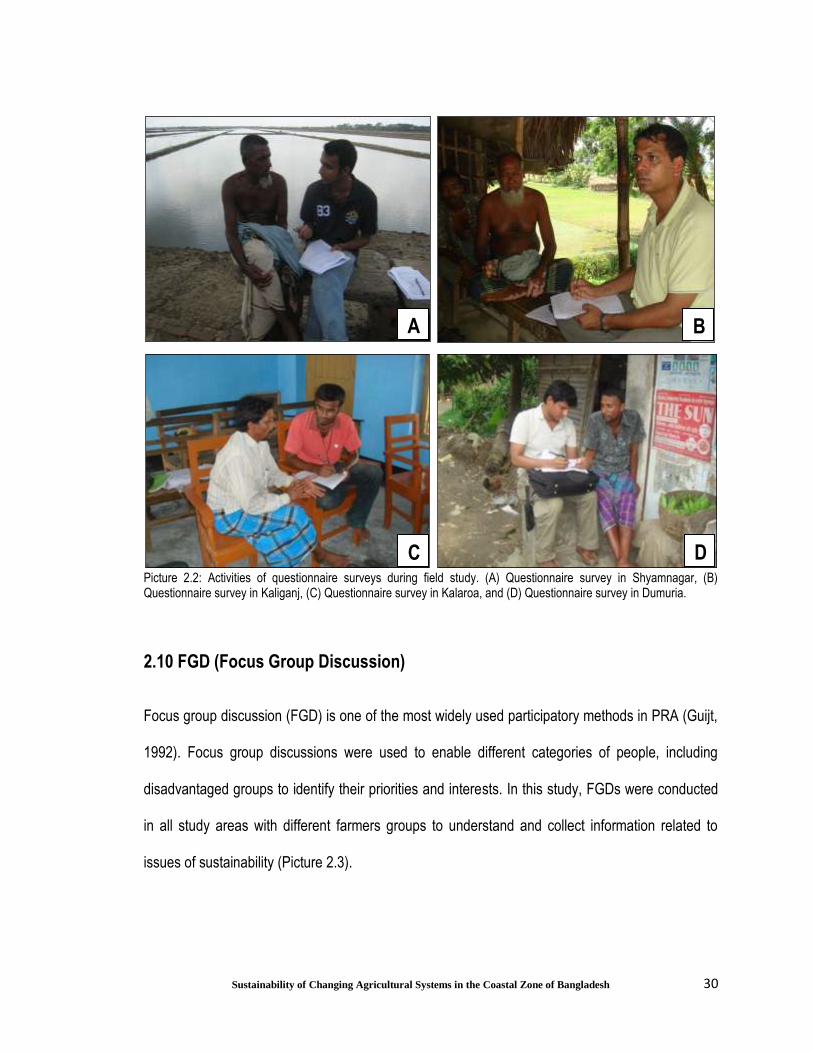
Picture 2.2: Activities of questionnaire surveys during field study. (A) Questionnaire survey in Shyamnagar, (B) Questionnaire survey in Kaliganj, (C) Questionnaire survey in Kalaroa, and (D) Questionnaire survey in Dumuria.
2.10 FGD (Focus Group Discussion)
Focus group discussion (FGD) is one of the most widely used participatory methods in PRA (Guijt,
1992). Focus group discussions were used to enable different categories of people, including
disadvantaged groups to identify their priorities and interests. In this study, FGDs were conducted
in all study areas with different farmers groups to understand and collect information related to
issues of sustainability (Picture 2.3).
A B
C D

31
Sustainability of Changing Agricultural Systems in the Coastal Zone of Bangladesh
Picture 2.3: Activities of FGDs during field study. (A) FGD in Shyamnagar, (B) FGD in Kaliganj, (C) FGD in Dumuria and (D) FGD in Bhola Sadar.
The household questionnaire was used as a checklist in conducting the FGDs but different issues
were also discussed. FGDs were carried out for 1.5-2 hours, at farm sites, at farmers’ homesteads
and in community settings. In totality, approximately 120 participants attended five FGDs. Audio
recordings of FGDs were made.
Under FGDs, the participants were permitted to discuss among themselves and even argue in
order to reach a consensus of an issue. The main limitation of FGDs was dominance by one
individual as a leader type person which often influenced other participants. However, in the
informal environment of the FGD, many of the respondents shared a wide variety of opinions while
answering the questions which proved to be an effective technique.
A B
C D

32
Sustainability of Changing Agricultural Systems in the Coastal Zone of Bangladesh
2.11 Key Informant Interviews
Key informant interviews were carried out to verify information from household questionnaire
surveys and focus groups. A key informant is anyone who has significant knowledge on a particular
topic (Faruk, 2009). The key informant survey is a method of obtaining information from persons
whose professional and/or organizational roles imply that they have knowledge about specific
characteristics of the population being studied as well as potential pathways and constraints for
community change (Eyler et al., 1999).
In order to efficiently develop agriculture, there is an agricultural extensions office, a fisheries office
and a livestock office in each upazila. Through unstructured and informal discussions, varieties of
information were collected from the key informants employed in these offices. The experts were
encouraged to speak in their minds. A total of 20 key informant interviews were conducted.
Picture 2.4: Key informant interview during field study. (A) Interview with key informant in Kalaroa and (B) Interview with key informant in Dumuria.
A B

33
Sustainability of Changing Agricultural Systems in the Coastal Zone of Bangladesh
2.12 Summarizing and Tabulating Collected Data
Collected data were compiled, edited, and summarized. For easy modification and refinement of
information, five databases for each of the study area were prepared in Excel format.
2.13 Quantitative Data Analysis
Preliminary quantitative methods such as percentage, weighted average, mean etc. were used to
prepare tables and graphs. Normality of quantitative data was checked by visual observation.
2.14 Qualitative Data Analysis
From qualitative data, simple percentages of various issues of sustainability of agriculture were
calculated. The collected qualitative data were coded before entering to the computer.
2.15 Selection of Indicators
For the present study, agricultural sustainability was defined in terms of the six categories –
productivity, stability, efficiency, durability, compatibility and equity - defined above (vanLoon et al.,
2005). In order to assess sustainability within these categories, a suite of indicators was selected
from standard sources or developed for the particular situation in coastal Bangladesh. Indicators
are an aggregation of information that indicates the change or determines the status of particular
issues (UN, 2007). Indicators are most often based on quantifiable data but may also be based on
qualitative data depending on the purpose of the indicator (Miller, 2001). The indicators were
developed on the basis of being policy-relevant, practical, available in standardized measurements
and related to a reference level (Hardi and Zdan, 1997; Meadows, 1998; vanLoon et al., 2005).
Although it was difficult for every indicator to conform to all of these requirements, it was important
that they be adhered to as far as possible. It was also important that indicators be selected
according to their ability to describe some aspect of sustainability of agriculture in its broadest
sense. A literature review (OECD, 2001; Vander Werf and Petit, 2002; vanLoon et al., 2005) and
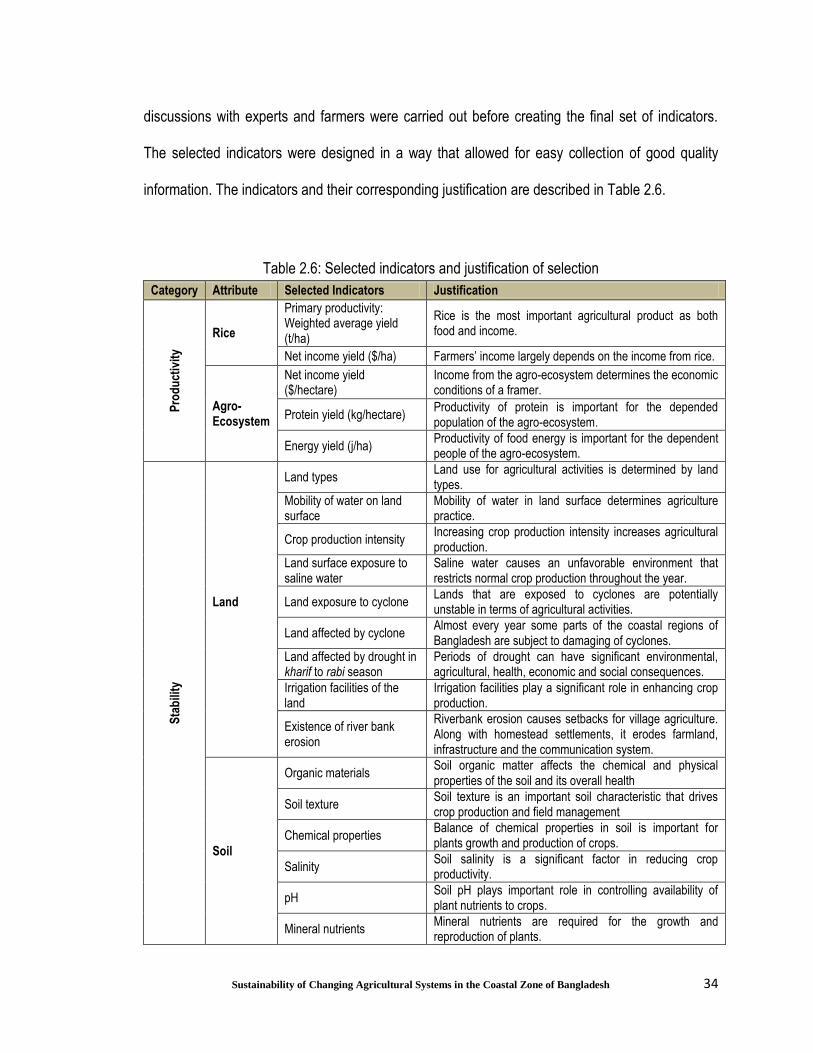
34
Sustainability of Changing Agricultural Systems in the Coastal Zone of Bangladesh
discussions with experts and farmers were carried out before creating the final set of indicators.
The selected indicators were designed in a way that allowed for easy collection of good quality
information. The indicators and their corresponding justification are described in Table 2.6.
Table 2.6: Selected indicators and justification of selection
Category Attribute Selected Indicators Justification
Pro
du
ctiv
ity
Rice
Primary productivity: Weighted average yield (t/ha)
Rice is the most important agricultural product as both food and income.
Net income yield ($/ha) Farmers’ income largely depends on the income from rice.
Agro-Ecosystem
Net income yield ($/hectare)
Income from the agro-ecosystem determines the economic conditions of a framer.
Protein yield (kg/hectare) Productivity of protein is important for the depended population of the agro-ecosystem.
Energy yield (j/ha) Productivity of food energy is important for the dependent people of the agro-ecosystem.
Sta
bili
ty
Land
Land types Land use for agricultural activities is determined by land types.
Mobility of water on land surface
Mobility of water in land surface determines agriculture practice.
Crop production intensity Increasing crop production intensity increases agricultural production.
Land surface exposure to saline water
Saline water causes an unfavorable environment that restricts normal crop production throughout the year.
Land exposure to cyclone Lands that are exposed to cyclones are potentially unstable in terms of agricultural activities.
Land affected by cyclone Almost every year some parts of the coastal regions of Bangladesh are subject to damaging of cyclones.
Land affected by drought in kharif to rabi season
Periods of drought can have significant environmental, agricultural, health, economic and social consequences.
Irrigation facilities of the land
Irrigation facilities play a significant role in enhancing crop production.
Existence of river bank erosion
Riverbank erosion causes setbacks for village agriculture. Along with homestead settlements, it erodes farmland, infrastructure and the communication system.
Soil
Organic materials Soil organic matter affects the chemical and physical properties of the soil and its overall health
Soil texture Soil texture is an important soil characteristic that drives crop production and field management
Chemical properties Balance of chemical properties in soil is important for plants growth and production of crops.
Salinity Soil salinity is a significant factor in reducing crop productivity.
pH Soil pH plays important role in controlling availability of plant nutrients to crops.
Mineral nutrients Mineral nutrients are required for the growth and reproduction of plants.

35
Sustainability of Changing Agricultural Systems in the Coastal Zone of Bangladesh
Category Attribute Selected Indicators Justification
Sta
bili
ty
Soil
Macronutrients (N, S, P, Ca, K, and Mg)
Soil macronutrients, nitrogen (N), phosphorus (P), and potassium (K), are essential elements for crop growth
Micronutrients (B, Cu, Fe, Mn, Mo, Zn and Cl)
Soil micronutrient controls crop yield, quality, plant morphological structure (such as fewer xylem vessels of small size), widespread infestation of various diseases and pests, low activation of phytosiderophores, and lower fertilizer use efficiency.
Water
Surface water salinity Too much salt can reduce or even prohibit crop production.
Groundwater salinity Too much salt can reduce or even prohibit crop production.
Arsenic concentration Reduced agricultural productivity due to arsenic toxicity which is harmful to humans and possibly to animals when high arsenic rice straw is used for feed
Climate
Current temperature (CT) Current temperature and trend of temperature affects
the yield of various crops. Trend of temperature (TT)
Current rainfall (CR) Agricultural production in coastal areas of Bangladesh is very much dependent upon adequate and timely rainfall.
Trend of rainfall(TR)
Others issues
Withdraw of upstream water
Withdrawal of upstream water creates a severe stress on soil moisture, soil salinity, and non-availability of fresh groundwater, thus affecting agricultural productivity in the long term.
Drying of river Drying river has a profound negative impact on hydrological cycle, ecosystem and agricultural activities.
Stability of embankment
Coastal embankments provide safeguard against the intrusion of saline water and devastation associated with repeated attacks of tidal surges and cyclonic storms.
Condition of transport system
Effective transport helps to develop agriculture.
Eff
icie
ncy
Rice
Hectare wise efficiency ($/ha)
Rice production dominates the farming system, so maximizing gain (income per unit of land) from rice is important for farmers.
Overall energy efficiency (Ratio of energy output and input)
Rice production dominates the farming system, so energy efficiency (energy out/energy in) is important for the efficiency of rice cultivation system.
Agro-Ecosystem
Ratio ($output/$ input) Profit gained per unit area is important from the farmers’ economic point of view.
Overall energy efficiency (Ratio of energy output and input)
Overall energy efficiency of an agro-ecosystem determines the efficiency of the agricultural practices.
Non-renewable energy efficiency
Efficiency in terms of non-renewable energy sources is especially important for the sustainability of an agro-ecosystem.

36
Sustainability of Changing Agricultural Systems in the Coastal Zone of Bangladesh
Category Attribute Selected Indicators Justification
Du
rab
ility
Pest stress Non-Chemical Response to Pest Stress
Pest control by non-chemical means ensures a healthy environment and ecosystem.
Water availability
Water availability at transplanting stage of rice
Availability of water at the transplanting stage is important for crops growth.
Water availability at flowering stage of rice
Availability of water at the flowering stage is important for crops growth.
Seed Seeds preservation
Proper preservation of seeds ensures the quality of seeds.
Availability of seeds Availability of seeds ensures smooth agricultural activities.
Economics
Product price Good price of the agricultural products motivates farmers to employ good agricultural practices.
Availability of market Availability of markets ensures the sale of the agricultural products.
Livelihood diversity Livelihood diversity ensures additional sources of income and provides an outlet for some secondary agricultural products.
Years of economic hardship
Economic hardship stops farmer of doing agricultural activities all the year round.
Agricultural Knowledge
Agricultural training
Block Supervisor provides efficient and effective need-based extension services to all categories of farmers, to enable them to optimize their use of resources, in order to promote sustainable agricultural and socioeconomic development.
Advices from suggestion from Block Supervisor
Awareness of climate change impacts on agriculture helps farmers to adopt their agricultural systems.
Soil test Improved farm management/soil test is necessary to enhance production of crops.
Climate change awareness
Training on agriculture helps farmers to employ better agricultural practices.
Co
mp
atib
ility
Human
Illness from drinking water Concentration of As in drinking water affects the health of farmers.
Protected water supply Drinking -water related illness indicates the quality of drinking water in the agro-ecosystem.
Arsenic concentration in drinking water supply
Protected water supply ensures safe drinking water.
Biophysical Surroundings
Overall biodiversity condition
Diversity of agro-ecosystem ensures better agricultural practices and maintains ecosystem health.
Percentage of Non-crop area.
Non-crop area helps in sustainable pest control.
Condition of ecosystem services
Sustainable agricultural depends on the conditions of ecosystem services.
Overall environmental conditions
Overall environmental conditions determines the sustainability of the agriculture

37
Sustainability of Changing Agricultural Systems in the Coastal Zone of Bangladesh
Category Attribute Selected Indicators Justification
Eq
uit
y Education
Education status of farmers
Education of farmers is beneficial for promoting sustainable agriculture.
Education status of farmers’ male children
Education of farmers’ male children also helps the sustainable practise of agriculture.
Education status of farmers’ female children
Female children’s education indicates the openness of a community.
Access to electronic media
Access to electronic media indicates farmers’ access to information in an agro-ecosystem.
Economic A. Farmer Income
Average income from agro ecosystem
Average income of an agro-ecosystem provides information about economic status and wellbeing of the area.
Average value of the assets of the farm
Farm assets value indicates the economic status of a farm.
People above extreme poor
Percentage of extremely poor people indicates is a measure of economic equity
Economic B. Labourer income
Average daily wage of farm labourer
Average wage of farm labour indicates the economic status of the farm labourer.
Gender based wage differentials
Gender based wage differences is an indication the status of women in the labour market.
Economic C. Electricity connection
Electricity connection in household
Electricity connection in the household indicates opportunities for better health, more education, and more time for other activities than basic household chores.
Health
Status of production of own staple food
Status of production of owns staple food indicates the availability of food within the agro-ecosystem.
Average calorie intake by each family member from staple food
Average calorie intake by each family member from staple food indicates the calorie intake status of the household.
Settings where treatment is taken
A setting where treatment is taken indicates the heath care facilities in the agro-ecosystem.
Toilet facilities Toilet facilities are a measure of a healthy environment for humans in the agro-ecosystem.
Cooking facilities Cooking facilities indicate indoor air quality and use of agricultural by products.
Decision Making
Women participation in agricultural activities
Women’s participation supports diversification and sustainable development of agriculture.
Gender based governance difference
Gender based governance difference indicates the women participation in decision-making in an agro-ecosystem.
Source: Literature review, Expert opinion, FGD, Key informants, Questionnaire survey, and observation, 2011
2.16 Multi Criteria Decision Analysis
The indicator data obtained in the five study areas was assessed by Multi-Criteria Decision
Analysis (MCDA). MCDA is a set of methods and procedures by which multiple criteria can be
formally incorporated into a management planning process (Dantsis et al., 2010; Mustajoki et al.,
38
Sustainability of Changing Agricultural Systems in the Coastal Zone of Bangladesh
2003; Peng and Shi, 2012). There is extensive literature describing application of multi-criteria
analysis or multi-criteria decision making in environmental studies (Dantsis et al., 2010; DFCALG,
2009; Miranda, 2001; Tiwari et al., 1999). Dantsis et al. in 2010; Hayashi in 2000 and Marttunen
and Hamalainen in 1995 have reviewed the application of the methodology in natural resource
management, agricultural resource management and agricultural sustainability assessment.
In this study, MCDA was carried out using web-based Web-HIPRE (Hierarchical PREference
Analysis) shareware. Web-HIPRE is a web-version of the HIPRE3+ implementation software for
analytic problem structuring, multi-criteria evaluation and prioritization (Ha¨ma¨la¨inen and Lauri,
1995). It is also capable of considering a large collection of criteria and is able to produce
comparisons for different situations. In the present case, it was used to rank sustainability in the six
chosen categories for the five study sites.
This software supports multi-attribute value theory (MAVT) based methods (Keeney and Raiffa,
1976). Multi-Attribute Value Theory (MAVT) is a rigorous framework for pursuing the logic of
computing an overall score for each alternative (Dias and Antunes, 2012). In this study, MAVT
approach was used as it has the ability to analyze situations and conduct an assessment (Scholz
and Tietje, 2002).
An attribute tree was developed in data analysis by MAVT. A set of attribute trees summarize the
indicators that were chosen to assess sustainability. In the comprehensive tree (Figure 2.6),
agricultural sustainability (overall goal) is divided hierarchically into six individual sustainability
categories. Similarly, lower level trees tabulate and correlate indicator data with that category.

39
Sustainability of Changing Agricultural Systems in the Coastal Zone of Bangladesh
Figure 2.2: Example of the attribute tree of agricultural sustainability in Web-HIPRE window
In MAVT, the alternatives are evaluated with respect to each attribute and the attributes are
weighted according to their relative importance (Mustajoki et al., 2003). An additive value function
can be used to aggregate the component values, assuming mutually preferentially independent
attributes (Mustajoki et al., 2003). The overall value of the alternative “x” is
n
v(x) = wivi(x)
i = 1
Where,
n = The number of attributes,
wi = The weight of attribute i, and
vi(x) = The rating of an alternative x with respect to an attribute i.

40
Sustainability of Changing Agricultural Systems in the Coastal Zone of Bangladesh
The sum of the weights is normalized to one, and the component value functions vi(·) has values
between 0 and 1. The weights wi indicates the relative importance of attribute i changing from its
worst level to its best level, compared to the changes in the other attributes (Mustajoki et al., 2003).
The words attribute and criterion are often used synonymously in the literature on MCDA. Attribute
is also sometimes used to refer to a measurable criterion. In this study, the identified category of
sustainability of agriculture is first attribute. Subdivisions of the categories are second attributes
and the indicators that are identified under each subcategory are third attributes.
Weight attributes can be elicited by different procedures. For weighting of attributes in this study,
“Direct” and “SMART” weighting procedures were used. In “Direct weight”, points are given directly
whereas in “SMART”, 10 points are first given to the least important attribute. Then, more points
are given to the other attributes depending on the relative importance of their ranges
(Ha¨ma¨la¨inen and Lauri, 1995). The relative spacing between the levels of the attribute reflects
the strength of preference of one level compared with another (Hostmanna et al., 2005).
To give weighting values that estimate the relative importance of the different attributes of
sustainability of agriculture multiple judgment methods were employed based on field observation,
literature survey and discussion with farmers and local experts (Table 2.7). The values for different
indicators were assessed as shown in Table 2.8. It was difficult to set the optimum value for some
of the indicators as indicators of sustainable agriculture are time and space relative. However, in
this study the actual range is determined by the alternatives with the largest and smallest values of
each indicator based on the results of the questionnaire, secondary information and accepted
standard values of some of the indicators.

41
Sustainability of Changing Agricultural Systems in the Coastal Zone of Bangladesh
Table 2.7: Weighting judgment of selected attributes to measure value of sustainability of agricultural systems by MCDA
Code Selected Attributes Weight Weighting Judgment P Productivity 30
P1 Rice 30 Rice dominates the cropping pattern in study areas’ agro-ecosystem and it is also the staple food of the study areas’ people.
P1.1 Primary productivity: Weighted average yield(t/ha)
40 Among many types of productivity of rice, yield is very important as it related self-sufficiency of rice.
P1.2 Net income yield($/ha) 60
Net income yield of rice is very important to the farmers as farmers’ economic condition is largely determined by it. It is also the most important strategic commodity in the economy of Bangladesh.
P2 Agro-Ecosystem 70 Food security and entire agro-economics of the farmers depend on the productivity of whole agro-ecosystem including crops and aquatics foods.
P2.1 Net income ($/ha) 50 Economic condition of farmers of the study areas’ agro-ecosystem is determined by hectare wise net income of the agro-ecosystem.
P2.2 Protein (kg/ha) 25 Hectare wise protein yield of agro-ecosystem determines supply of this essential nutrient for the people.
P2.3 Energy (kcal/ha) 25 Energy intake by the people is related with the hectare wise kilocalorie yield of the agro-ecosystem.
S Stability 20
S1 Land 20
Land in terms of appropriate location, availability of water and protected from disasters is a fundamental requirement for establishing an agricultural system.
S1.1 Land types 20 Farmers of the study areas determine cultivation of crops according to land types (elevation).
S1.2 Mobility of water 10 Mobility of water over the land surface determines the time of crop establishment.
S1.3 Crop production intensity 10 Crop production intensity ensures year round agricultural activities and land’s health.
S1.4 Exposure to saline water 10 Saline water diminishes the biological productivity of land.
S1.5 Exposure to cyclone 10 Cyclone damages the agriculture of cyclone exposed lands.
S1.6 Land affected by cyclone 10 The persistent of damage to land by cyclone varies at different study sides.
S1.7 Land affected by drought 10 Drought damages crops and reduce productivity in some coastal areas due to inadequate and poorly distributed rainfall.
S1.8 Irrigation facilities 10 Surface and ground water are important aspects for rice cultivation when salinity and/or drought problem occur.
S1.9 River bank erosion 10 River bank erosion hampers agricultural activities in coastal regions.
S2 Soil 40
Soil is the fundamental component of crop production. Healthy soil is the foundation of the food system. Its produce crops that in turn nourish people.

42
Sustainability of Changing Agricultural Systems in the Coastal Zone of Bangladesh
S2.1 Salinity 50 Higher concentrations of salt in soil slowdowns the movement of water from the soil to the root which effects crops growth.
S2.2 Organic materials 20 Organic materials perform many vital functions including converting dead and decaying matter as well as minerals to plant nutrients.
S2.3 Soil texture 10 Soil texture is an important soil characteristic that drives crop production and field management.
S2.4 Chemical properties 20 Soil chemical properties directly or indirectly influence nutrient dynamics of soil in agriculture production.
S2.4.1 pH 20 Plants grown in acid soils can experience a potential nutrient deficiency of calcium (Ca) and magnesium (Mg).
S2.4.2 Mineral nutrients 80 Balance mineral nutrients ensure higher productivity of crops.
S2.4.2.1 Macronutrients (N, S, P, Ca, K, and Mg)
70 Large quantity macronutrients are needed for crops growth.
S2.4.2.2 Micronutrients (B, Cu, Fe, Mn, Mo, Zn and Cl)
30 Micronutrients are essential for crops growth, but are required in much smaller amounts than macronutrients.
S3 Water 30 Water (surface and ground) is essential for the survival of all crops.
S3.1 Surface water salinity 60 Surface water salinity degraded land and it reduces agricultural productivity.
S3.2 Groundwater salinity 30 Groundwater salinity restrains land from irrigation facilities from ground water.
S3.3 Arsenic concentration 10
Arsenic concentration restrains farmers from ground water irrigation as there is generally a significant positive correlation between soil arsenic and crops arsenic concentrations. The farmers of Bangladesh start to realize the contamination of arsenic in crops.
S4 Climate 0
Climatic condition controls agricultural activities with soil and water. Therefore, as fundamental components of agriculture climate scores 10 in 10-100 weighting scale.
S4.1 Temperature 0 Temperature variation affects agriculture.
S4.2 Rainfall 0 Most of the crops in Bangladesh require at least some rain water to survive and to some extend agriculture in Bangladesh is largely rain dependent.
S5 Others issues 10 Without main stability issues there are some other issues those have some impacts on agricultural activities in coastal areas.
S5.1 Withdraw of upstream water 25 Withdraw of upstream water disrupts irrigation system in coastal areas as well as helps in saline intrusion.
S5.2 Drying of river 25 Drying rives have significant impacts on total agro-ecosystem.
5.3 Stability of embankment 40 Stability of embankment largely determines the agricultural practices in coastal areas.
5.4 Condition of transport system 10 Transport system allows farmers to sell their products outside the agro-ecosystem.
E Efficiency 15
E1 Rice 30 Rice is the main crop of the study areas’ agro-ecosystem. The efficiency issues of rice are very
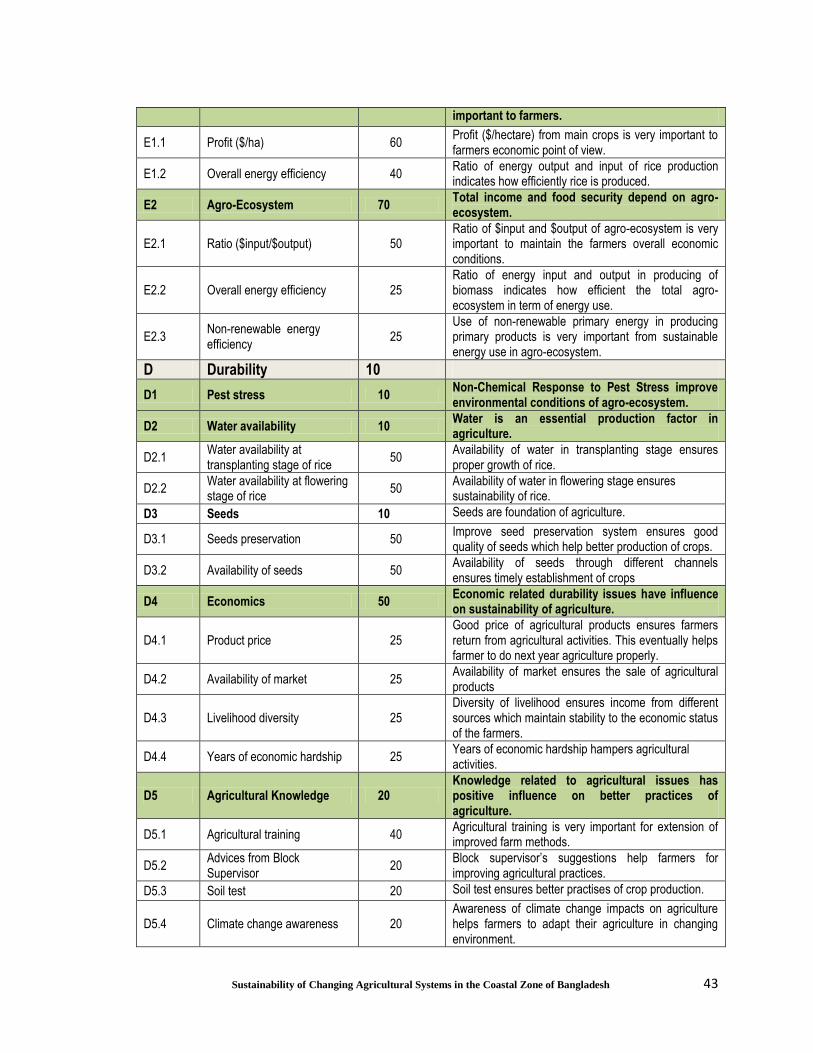
43
Sustainability of Changing Agricultural Systems in the Coastal Zone of Bangladesh
important to farmers.
E1.1 Profit ($/ha) 60 Profit ($/hectare) from main crops is very important to farmers economic point of view.
E1.2 Overall energy efficiency 40 Ratio of energy output and input of rice production indicates how efficiently rice is produced.
E2 Agro-Ecosystem 70 Total income and food security depend on agro-ecosystem.
E2.1 Ratio ($input/$output) 50 Ratio of $input and $output of agro-ecosystem is very important to maintain the farmers overall economic conditions.
E2.2 Overall energy efficiency 25 Ratio of energy input and output in producing of biomass indicates how efficient the total agro-ecosystem in term of energy use.
E2.3 Non-renewable energy efficiency
25 Use of non-renewable primary energy in producing primary products is very important from sustainable energy use in agro-ecosystem.
D Durability 10
D1 Pest stress 10 Non-Chemical Response to Pest Stress improve environmental conditions of agro-ecosystem.
D2 Water availability 10 Water is an essential production factor in agriculture.
D2.1 Water availability at transplanting stage of rice
50 Availability of water in transplanting stage ensures proper growth of rice.
D2.2 Water availability at flowering stage of rice
50 Availability of water in flowering stage ensures sustainability of rice.
D3 Seeds 10 Seeds are foundation of agriculture.
D3.1 Seeds preservation 50 Improve seed preservation system ensures good quality of seeds which help better production of crops.
D3.2 Availability of seeds 50 Availability of seeds through different channels ensures timely establishment of crops
D4 Economics 50 Economic related durability issues have influence on sustainability of agriculture.
D4.1 Product price 25 Good price of agricultural products ensures farmers return from agricultural activities. This eventually helps farmer to do next year agriculture properly.
D4.2 Availability of market 25 Availability of market ensures the sale of agricultural products
D4.3 Livelihood diversity 25 Diversity of livelihood ensures income from different sources which maintain stability to the economic status of the farmers.
D4.4 Years of economic hardship 25 Years of economic hardship hampers agricultural activities.
D5 Agricultural Knowledge 20 Knowledge related to agricultural issues has positive influence on better practices of agriculture.
D5.1 Agricultural training 40 Agricultural training is very important for extension of improved farm methods.
D5.2 Advices from Block Supervisor
20 Block supervisor’s suggestions help farmers for improving agricultural practices.
D5.3 Soil test 20 Soil test ensures better practises of crop production.
D5.4 Climate change awareness 20 Awareness of climate change impacts on agriculture helps farmers to adapt their agriculture in changing environment.

44
Sustainability of Changing Agricultural Systems in the Coastal Zone of Bangladesh
C Compatibility 10
C1 Human 50 Farmers’ health depends on the agricultural practices.
C1.1 Illness from drinking water 50 Drinking water is affected by agricultural practices which are responsible for water related illness.
C1.2 Protected water supply 30 Protected water supply in agro-ecosystem ensures safe drinking water.
C1.3 Arsenic concentration in drinking water supply
20 Arsenic is a slow poison which has long-term impact in long run.
C2 Biophysical Surroundings 50 Sustainable agriculture depends on biophysical surroundings.
C2.1 Overall biodiversity condition 30 Conditions of overall biodiversity ensures better agriculture practices
C2.2 Percentage of non-crop area. 20 Percentage of non-crops area indicates the land cover situation. It helps to improve the biophysical supports of the agro-ecosystem.
C2.3 Condition of ecosystem services
20 Ecosystem services that are provided by agro-ecosystem ensure sustainable agriculture.
C2.4 Crop richness 20 Crop rotation plays important role to maintain the health of crops
C2.5 Overall environmental condition
10 Conditions of environment influence agricultural activities and human health
E Equity 15
E1 Education 20
Status of education is very important as an equity issue of the agro-ecosystem. As equity issue education is given prominence in the Millennium Development goals.
E1.1 Education status of farmers 20 Farmers’ education status influence better agriculture practices as well as ensures some equity in society.
E1.2 Education status of male children
35 Education status of farmers’ mail children influences for preparing skilled farmers and better society in future.
E1.3 Education status of female children
35 Education status of farmers’ female children influences to bring gender equity in society.
E1.4 Access to electronic media 10 Access to electronic media ensures access to information, which helps farmer for making better decision.
E2 Economics 35 Overall economic conditions of the farmers determine different equity issues in agro-ecosystem
E2.1 Farmer income 45 Status of income is very important issues in equity as it can ensure education and better life.
E2.1.1 Income from agro ecosystem 50 Average income from agro-ecosystem ensures farmers’ economic conditions.
E2.1.2 Average value of the assets of farm
25 Average value of farm’s assets ensures some sorts of stability to the economic conditions of farmers.
E2.1.3 Percentage of people above extreme poor
25 Percentage of people above extreme poor indicates the economic condition of the society as a whole.
E2.2 Labourer income 45 Farm labour income in very important from equity point of view as it deals with low income people.
E2.2.1 Average wage of farm labourer
60 Average wage ensures farm labour economic condition.
E2.2.2 Gender based labourer wage 40 Gender based wage different indicates the status of
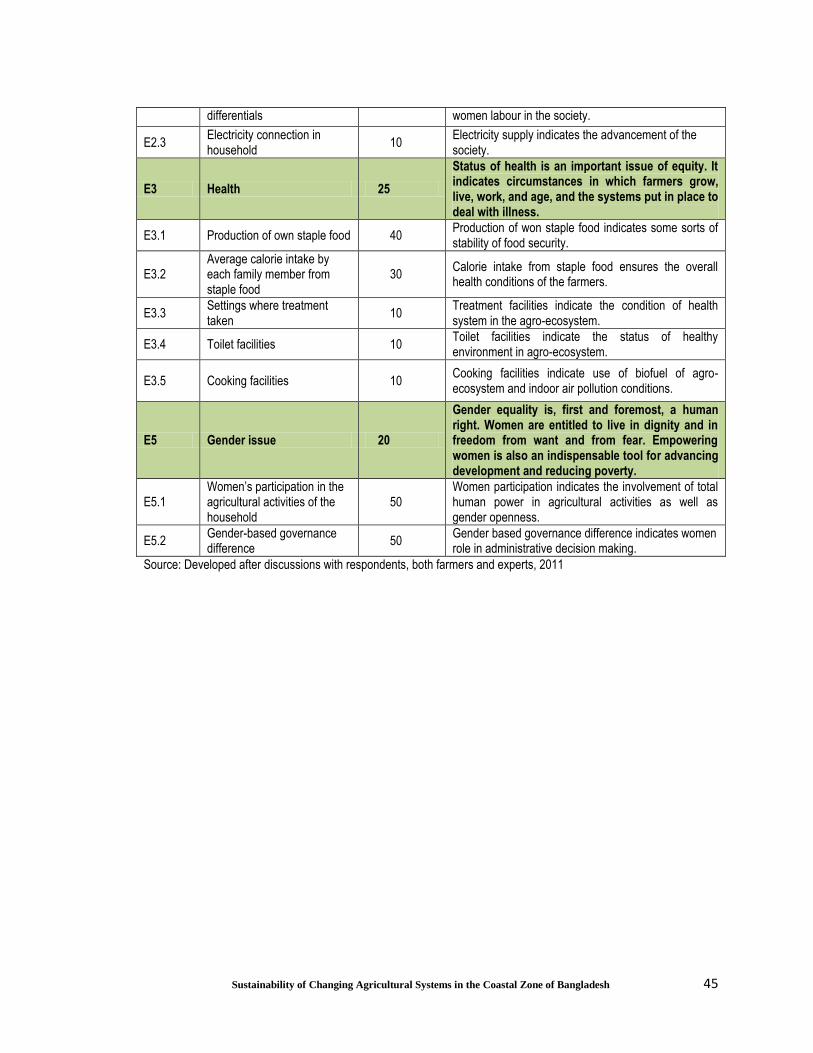
45
Sustainability of Changing Agricultural Systems in the Coastal Zone of Bangladesh
differentials women labour in the society.
E2.3 Electricity connection in household
10 Electricity supply indicates the advancement of the society.
E3 Health 25
Status of health is an important issue of equity. It indicates circumstances in which farmers grow, live, work, and age, and the systems put in place to deal with illness.
E3.1 Production of own staple food 40 Production of won staple food indicates some sorts of stability of food security.
E3.2 Average calorie intake by each family member from staple food
30 Calorie intake from staple food ensures the overall health conditions of the farmers.
E3.3 Settings where treatment taken
10 Treatment facilities indicate the condition of health system in the agro-ecosystem.
E3.4 Toilet facilities 10 Toilet facilities indicate the status of healthy environment in agro-ecosystem.
E3.5 Cooking facilities 10 Cooking facilities indicate use of biofuel of agro-ecosystem and indoor air pollution conditions.
E5 Gender issue 20
Gender equality is, first and foremost, a human right. Women are entitled to live in dignity and in freedom from want and from fear. Empowering women is also an indispensable tool for advancing development and reducing poverty.
E5.1 Women’s participation in the agricultural activities of the household
50 Women participation indicates the involvement of total human power in agricultural activities as well as gender openness.
E5.2 Gender-based governance difference
50 Gender based governance difference indicates women role in administrative decision making.
Source: Developed after discussions with respondents, both farmers and experts, 2011

46
Sustainability of Changing Agricultural Systems in the Coastal Zone of Bangladesh
Table 2.8: List of methods/software for measuring different indicators
Code Purpose Methods/Software Description
Google map ArcGIS Identification of study areas
Create a data base Microsoft Excel Software Data from questionnaire interviews were coded and entered into a database system
P Productivity Formula Description
P1.1 Primary productivity of rice: Weighted average yield (t/ha)
PP(Y)=Mp/A Where, PP(Y)= Primary productivity (Yield), Mp=Total mass of crop, A=Total area of crop
P1.2 Income yield from rice ($/ha)
IY=In/A Where, IY= Income yield, In = The net income, A=Total area of crop
P2.1 Income yield from agro-ecosystem ($/ha)
IYAE= (Ini X A)/At
Where, IYAE= Income yield from agro-ecosystem, Ini = The net income per hectare for each crop grown, A=Area of each crop, At = Total land area of agro-ecosystem
P2.2 Protein yield from agro-ecosystem (kg/ha)
PYAE = Pni/At Where, PYAE= Protein yield from agro-ecosystem, Pni = Total protein from different crops of agro-ecosystem At = Total land area of agro-ecosystem
P2.3 Energy yield from agro-ecosystem (kcal/ha)
EYAE = Eni/At Where, EYAE= Energy yield from agro-ecosystem, Eni = Total energy from different crops of agro-ecosystem At = Total land area of agro-ecosystem
Note: Stability data has been collected from secondary information
E Efficiency Formula Description
E1.1 Profit (gain from rice) ($/ha)
GR=TV/At Where, GR= Dollar gain from per ha of rice, TV
= Total value of the total production of rice, At = Total land area for rice
E1.2 Overall energy efficiency in rice
OEER= TECR/ TEI
Where, OEFR= Overall energy efficiency of rice, TECR=Total energy content of total production of rice, TEI=Total energy input for total rice production.
E2.1 Ratio ($input/$output) R=TVI/TVO Where, R= Ratio of $input to $output in agro-ecosystem, TVI = Total value of the total input in $, TVO= Total value of the total output in $
E2.2 Overall energy efficiency in agro-ecosystem
OEEAE=TECAE/TEO
Where, OEFAE= Overall energy efficiency of agro-ecosystem, TECR=Total energy content of total production of crops of agro-ecosystem, TEI=Total energy input for total all crops production.
E2.3
Non-renewable primary energy efficiency in agro-ecosystem
NREFAE= ECPR/NEEI
Where, NREFAE= Non-renewable primary energy efficiency of agro-ecosystem, ECPR=Energy content of primary product, NEEI=Non-Renewable energy input for total all crops production.
D Durability Formula Description
D1 Non-chemical response to pest stress
NCRPS=P*10
Where, NCRPS=Non-chemical response to pest stress, P= Percentage of farmers using non-chemical pest control, 10 indicates height value of non-chemical response to pest stress by converting percentage of farmers in 0 to 10 scale.
D2.1 Water availability at transplanting stage of main crops (t. Aman) )
WATS=P*10
Where, WATS= Water availability at transplanting stage of rice, P= Percentage of farmers reported availability of water, 10 indicates height value of water availability reported by farmers by converting percentage of farmers in 0 to 10 scale.
D2.2 Water availability at flowering stage of rice
WAFS=P*10 Where, WATS= Water availability at flowering stage of rice, P= Percentage of farmers reported

47
Sustainability of Changing Agricultural Systems in the Coastal Zone of Bangladesh
availability of water, 10 indicates height value of water availability in flowering stage reported by farmers by converting percentage of farmers in 0 to 10 scale.
D3.1 Seeds preservation SPS=P*10
Where, SPS= Seeds preservation, P= Percentage of farmers apply modern methods for seed preservation, 10 indicates height value of farmers who preserved seeds by converting percentage of farmers in 0 to 10 scale.
D3.2 Availability of seeds AS=P*10
Where, AS= Availability of seed, P= Percentage of farmers reported of availability of seed, 10 indicates height value of farmers who said seeds are available by converting percentage of farmers in 0 to 10 scale.
D4.1 Products price PP= P*10
Where, PP= Product price, P= Percentage of reported about good product price, 10 indicates height value of farmers who get good price of the agricultural products by converting percentage of farmers in 0 to 10 scale.
D4.2 Availability of market AMAP= P*10
Where, AMAP= Availability of market, P= Percentage of farmers reported availability of market, 10 indicates height value of farmers who said availability of market by converting percentage of farmers in 0 to 10 scale.
D4.3 Livelihood diversity LD=P*10
Where, LD= Livelihood diversity, P= Percentage of farmers reported secondary occupation other than agricultural activities, 10 indicates height value of farmers reported livelihood diversity by converting percentage of farmers in 0 to 10 scale.
D4.4 Years of economic hardship
YEH=10-N Where, YEH=Year of economic hardship, N=Number of year of economic hardship out of 10 years.
D5.1 Agricultural training AT=P*10
Where, AT= Agricultural training, P= Percentage of farmers reported about receiving agricultural training, 10 indicates height value of farmers received agricultural training by converting percentage of farmers in 0 to 10 scale.
D5.2 Advices from block supervisor
AFBS=P*10
Where, AFBS= Advices from block supervisor , P= Percentage of farmers reported about taking suggestion from block supervisor for agricultural activities, 10 indicates height value of farmers reported take suggestion from block supervisor by converting percentage of farmers in 0 to 10 scale.
D5.3 Soil test ST=P*10
Where, ST= Soil test, P= Percentage of farmers do soil test in farm management, 10 indicates height value of farmers who follow soil test in farm management by converting percentage of farmers in 0 to 10 scale.
D5.4 Climate change awareness
CCA=P*10
Where, CCA= Climate change awareness in agriculture, P= Percentage of farmers reported about awareness of climate change impacts on agriculture, 10 indicates height value of farmers reported have awareness about climate change impacts by converting percentage of farmers in 0 to 10 scale.

48
Sustainability of Changing Agricultural Systems in the Coastal Zone of Bangladesh
C Compatibility Formula Description
C1.1 Illness from drinking water
IFDW=(20-P)/2
Where, IFDW= Illness from drinking water, P=Percentage of people how have experienced illness and required treatment in past year, 20 per cent is the poorest goalpost and 0 is the best goalpost.
C1.2 Protected water supply
PWS=P/10 Where, PWS=Protected water supply, P=Percentage of people with access to protected water. “10” is the best score in 0 to 10 scales.
C1.3 Arsenic concentration in drinking water supply
AsCDWS = (10mg/L-CAs)/5
Where, AsCDWS= Arsenic concentration in drinking water supply, CAs=mg/L As concentration in drinking water, 10 mg/L is the WHO upper limit guideline.
C2.1 Overall biodiversity condition[Shannon Diversity Index]
OBC = - Ai * ln Ai,
SOBC=10XOBC/2
Where, OBC=Overall biodiversity condition, Ai = Fractional area occupied by an individual crop or
land use, ln Ai = natural logarithm (ln) of Ai.
SOBC= Scaling overall biodiversity condition, OBC=Overall biodiversity condition, “10” is the best score in 0 to 10 scale.
C2.2 Percentage of non-crop arae
PONCA = TNCA/TA*100 Where, PONCA = Percentage of non-crop area, TNCA= Total non-crop area, TA=Total area
C2.3 Condition of ecosystem services
COES=TSESAS/HS*10
Where, ES=Ecosystem services, TSESAS=Total score of ecosystem services of an agricultural system, HS=Possible highest score of the agricultural system, “10” is the best score in 0 to 10 scale.
C2.4 Crop richiness CR=N Where, CR= Crop richiness, N=Number of different crops grown
C2.5 Overall environmental condition
OEC=OQROEBF Where, OEC = Overall environmental condition, QRFFAE=Overall qualitative ranking of environment by farmers
E Equity Formula Description
E1.1 Education status of farmers
ES=( XiNi/Nt)*10 Where, ES=Education status, Ni = Individuals have
a score of Xi, Nt =Total number, “10” is the best score in 0 to 10 scale.
E1.2 Education status of male children
As above As above
E1.3 Education status of female children
As above As above
E1.4 Access to electronic media
AEM=P*10 Where, AEM=Access to electronic media, P=Percentage of farmer have access to electronic media, “10” is the best score in 0 to 10 scale.
E2.1.1 Income from agro ecosystem
IAE= TE/N Where, IAE= Income from agro-ecosystem in a year, TE=Total income from the whole agro-ecosystem, N=Number of farmer surveyed.
E2.1.2 Average value of the assets of farm
AVAF= CAi/N
Where, AVAF= Average value of the assets of farm, CAi = Value of capital assets of an individual farmer, N = Number of farmer surveyed.
E2.1.3 Percentage of people above extreme poor
PPAEP=P Where, PPAEP=Percentage of people above extreme poor, P=Number of percentage of people above extreme poor in the agro-ecosystem
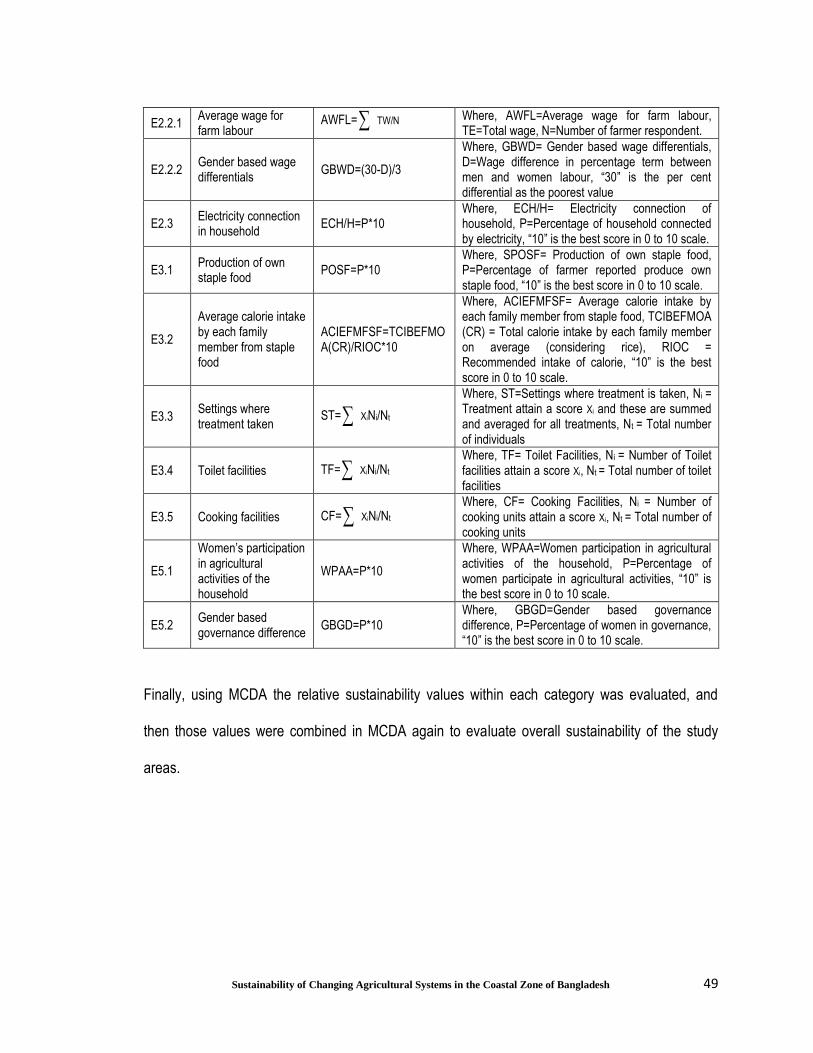
49
Sustainability of Changing Agricultural Systems in the Coastal Zone of Bangladesh
E2.2.1 Average wage for farm labour
AWFL= TW/N Where, AWFL=Average wage for farm labour, TE=Total wage, N=Number of farmer respondent.
E2.2.2 Gender based wage differentials
GBWD=(30-D)/3
Where, GBWD= Gender based wage differentials, D=Wage difference in percentage term between men and women labour, “30” is the per cent differential as the poorest value
E2.3 Electricity connection in household
ECH/H=P*10 Where, ECH/H= Electricity connection of household, P=Percentage of household connected by electricity, “10” is the best score in 0 to 10 scale.
E3.1 Production of own staple food
POSF=P*10 Where, SPOSF= Production of own staple food, P=Percentage of farmer reported produce own staple food, “10” is the best score in 0 to 10 scale.
E3.2
Average calorie intake by each family member from staple food
ACIEFMFSF=TCIBEFMOA(CR)/RIOC*10
Where, ACIEFMFSF= Average calorie intake by each family member from staple food, TCIBEFMOA (CR) = Total calorie intake by each family member on average (considering rice), RIOC = Recommended intake of calorie, “10” is the best score in 0 to 10 scale.
E3.3 Settings where treatment taken
ST= XiNi/Nt
Where, ST=Settings where treatment is taken, Ni = Treatment attain a score Xi and these are summed and averaged for all treatments, Nt = Total number of individuals
E3.4 Toilet facilities TF= XiNi/Nt Where, TF= Toilet Facilities, Ni = Number of Toilet facilities attain a score Xi, Nt = Total number of toilet facilities
E3.5 Cooking facilities CF= XiNi/Nt Where, CF= Cooking Facilities, Ni = Number of cooking units attain a score Xi, Nt = Total number of cooking units
E5.1
Women’s participation in agricultural activities of the household
WPAA=P*10
Where, WPAA=Women participation in agricultural activities of the household, P=Percentage of women participate in agricultural activities, “10” is the best score in 0 to 10 scale.
E5.2 Gender based governance difference
GBGD=P*10 Where, GBGD=Gender based governance difference, P=Percentage of women in governance, “10” is the best score in 0 to 10 scale.
Finally, using MCDA the relative sustainability values within each category was evaluated, and
then those values were combined in MCDA again to evaluate overall sustainability of the study
areas.

50
Sustainability of Changing Agricultural Systems in the Coastal Zone of Bangladesh
3.0 Introduction
A brief description of the study areas is given in this chapter. The selected study areas (upazilas,
counties) are located in the coastal zone of Bangladesh as shown in Figure 3.1. The study included
primary information obtained from a selected village within each upazila as well as secondary
information from the upazila and broader district.
Figure 3.1: Location of the study areas in Bangladesh (Source: CGIS, 2010)
Chapter-III: Study Area

51
Sustainability of Changing Agricultural Systems in the Coastal Zone of Bangladesh
3.1 Description of Munshiganj Village of Shyamnagar Upazila
Location and Area: Munshiganj Village lies between latitudes of 22°11’ and 22°24’N, and
longitudes 89°0’ and 89°19’E in Shyamnagar Upazila of Satkhira District. The total area of
Munshiganj is 2470 ha whereas total area of Shyamnagar is 1968 km2 including 32.20 km2
occupied by the river (BBSa, 2001; SRDIa, 2001).
Physiography: Shyamnagar is located in the tidal floodplain of the Ganges delta and is influenced
by diurnal tidal cycles. The area is characterized by flat land and smooth relief created by the
deposition of sediment from the Ganges distributaries. Within the area there is a tidal river and a
close network of interconnected creeks. In general, river banks of the area are elevated about a
metre or less above the water level. Most parts of the region are less than 500 m from a tidal river
or creek. The natural drainage, other than the main river channel, is impeded by extensive
embankments and polders (SRDIa, 2001).
Climate: Like other parts of Bangladesh, this area experiences tropical monsoon climate with a hot
and rainy summer and a pronounced dry season in the cooler months. Annual average rainfall of
the area is about 1682 mm and annual average temperature is 25.8°C (SRDIa, 2001). The rainy
season is characterized by hot and humid winds blowing from the Bay of Bengal during April to
September, resulting in heavy rainfall with about 80% of the total rainfall occurring in this period.
November to March is cool and dry (Mahmood et. al., 1994; SRDIa, 2001).
Land and Soil Type: About 78% land of the area is classified as medium high land. The soil is
mostly grey or dark grey, noncalcareous, heavy silty clay. There is a general pattern of grey,
slightly calcareous loamy soils in the river banks. Organic matter content is medium. Extremely
acidic soils (acid sulfate soils) occur in patches throughout the area (SRDIa, 2001).

52
Sustainability of Changing Agricultural Systems in the Coastal Zone of Bangladesh
Water Resources: The region abounds in water resources; however most of these are rich in salt
content. High salinity is also noticed in ground water under near-surface aquifers (SRDIa, 2001).
Present Land Use: Transplanted ‘Aman’ rice is the principal crop during and after the rainy
season (the kharif season), a time when water salinity is low. ‘Aus’ rice and rabi (dry, winter)
season crops may grow in non-saline upland areas. In homestead areas betelnut, coconut,
vegetables, local fruits can be grown. However, most of the land is devoted to Bagda (a type of
saltwater shrimp) cultivation (Field Study, 2011).
Salinity: Salinity in soil and water is a common feature of the area. The salinity is dominated by the
presence of a prolonged low saline regime during the monsoon and post-monsoon seasons. Tidal
waves play an important role in salinity intrusion and drainage congestion/inundations in this area.
Salinity dominates agriculture, ecosystems and human activities (SRDIa, 2001).
Population: The total population is 17 692 with 9079 males and 8613 females. According to the
population census of 2001 the population growth rate is 1.77 % per annum. The population density
is 1024/km². Average literacy rate is 44 % with male literacy rate at 54 % and female literacy rate at
33 %. The average household size is 5.2 persons (BBSa, 2001).
Livelihood: Most people of the area are involved in agriculture or related activities either on their
land or as workers for other people. Besides agriculture some people are also involved in fishing,
fish business, transport, shopkeeping and a variety of other occupations. The staple food is rice
and most people are accustomed to consuming fish and vegetables as part of their daily diet (Field
Study, 2011).
53
Sustainability of Changing Agricultural Systems in the Coastal Zone of Bangladesh
3.2 Description of Nalta Village of Kaliganj Upazila
Location and Area: Nalta Village lies between latitudes of 22°19’ and 22°34’N, and longitudes
89°58’ and 89°10’E in Kaliganj Upazila of Satkhira District. The total area of Nalta is 480 ha
whereas the total area of Kaliganj is 334 km2 inclusive of 8 km2 for the river (BBSa, 2001; SRDIb,
1997).
Nalta is also a part of tidal floodplain of the Ganges Delta, and has similar physiographic features -
climate, soil type, water resource, salinity, land use and livelihood pattern - as does Shyamnagar
(SRDIb, 1997). However, the land use pattern of more expansive homesteads is somewhat
different than that of Munshiganj. Usually, the homestead area is used for growing rice as well as
rabi crops and vegetables both for personal consumption and for commercial purposes.
Population: The total population is 7900 among which males make up 4084 and females 3816.
Population density is 768/km². Population growth rate is 1.19% per annum. Average literacy rate is
47% with 53% male literacy rate and 40% female literacy rate. Total number of household is 1605.
The average household size is 4.9 persons (BBSa, 2001).
3.3 Description of Tarulia Village of Kalaroa Upazila
Location and Area: Tarulia Village lies between latitudes of 23°48’ and 23°57’N, and longitudes of
88°54’ and 89°09’E in Kalaroa Upazila of Satkhira District. The total area of Tarulia is 546 ha
whereas the total area of Kalaroa is 231.5 km2 (BBSa, 2001; SRDIc, 1991).
Physiography: Like Munshiganj and Nalta, Kalaroa is also part of the tidal floodplain of the
Ganges Delta. Most parts have a complex relief of ridges and inter-ridge depressions. Upper parts
of high ridges remain above flood level, and lower parts are seasonally flooded to a shallow depth.

54
Sustainability of Changing Agricultural Systems in the Coastal Zone of Bangladesh
Like other parts of Satkhira District, the natural drainage system is impeded by embankments and
polders (SRDIc, 1991).
Climate: Kalaroa also has a tropical monsoonal climate. There is no difference in the average
annual rainfall and temperature for Munshiganj and Nalta areas (SRD1c, 1991).
Land and Soil Type: Most of the land is medium high land. Soils are silty loam and silty clay loam
in ridges, and dark grey clay soils in basins. Most ridge soils are calcareous while basin soils are
non-calcareous. Organic matter content in ridges is low (<1.5%), but higher (2-5%) in the dark grey
basin soils. Soil reaction ranges from neutral to strongly acidic (SRDIc, 1991).
Water Resources: In some parts of this area, water is pumped from the river channel in order to
irrigate kharif crops. In other parts, only limited amounts of surface water are available from small
rivers and oxbow lakes. However, groundwater is used extensively for irrigation (Filed study, 2011;
SRDIc, 1991).
Salinity: Water is substantially fresh, little influenced by the sea, therefore playing a dominating
role in agriculture, ecosystems and livelihood (SRDIc, 1991).
Present Land Use: Rice, jute, pulses, oilseeds, wheat, sugarcane, tobacco, potato, turmeric,
vegetables, banana and mango are important crops (Field study, 2011).
Population: Total population is 3166 with 1648 males and 1518 females. Population density is
953/km2. Population growth rate is 1.67 persons per annum. Total literacy rate is 43 % with males
at 48 % and female at 37 %. Total number of household is 708 with an average household size of
4.4 persons (BBSa, 2001).
Livelihood: Like Munshiganj and Nalta, a most of the people are involved in agricultural activities
on their own land or for other people. Some people are involved in other activities including
transportation, service, business and shopkeeping (Field study, 2011).
55
Sustainability of Changing Agricultural Systems in the Coastal Zone of Bangladesh
3.4 Description of Banda Village of Dumuria Upazila
Location and Area: Banda Village lies between latitudes 22°39’ and 22°56’N, and longitudes
89°15’ and 89°32’E (Figure 3.5 and 3.6) in Dumuria Upazila of Khulna District. The total area of
Banda is 229 ha whereas total area of Dumuria is 448 km2 of which the river occupies 19.5 km2
(BBSb, 2001; SRDId, 2008).
Physiography: Like Munshiganj, Nalta and Tarulia it is also a part of tidal floodplain of the Ganges
Delta and has been created by deposition of sediment. Most parts are located in a flat low-lying
basin. The area is characterized by low relief and is influenced by diurnal tidal cycles. Like other
study areas of Satkhira its natural drainage system is impeded by embankments and polders
(SRDId, 2008).
Climate: Dumuria also belongs to the tropical monsoonal climatic system. The average annual
rainfall is 1693 mm and annual average temperature is 26°C. Eighty percent of the total rainfall
occurs in the rainy season from May to September (Mahmood et. al., 1994; SRDId, 2008).
Land Type and Soil: Most of the land is classified as medium high land. On basin margins, grey
and dark grey acidic heavy clay overlies peat and muck to a depth of 25 to 100 cm. Soft peat and
muck occupy perennially wet basin centres. Organic matter content is medium from 1.7% to 3.4%
(SRDId, 2008).
Water Resources: Surface water is used for irrigation purpose. Rivers and creeks are tidal in the
dry season. Ground water is sweet in northern and eastern areas but saline in the south-west.
Along with surface water, rain plays an important role in agricultural activities (SRDId, 2008).
Salinity: The surface water is slightly saline but the concentration of salinity can be high in the
ground water. Farmers use rainwater for agricultural activities as well as in Galda farming. The

56
Sustainability of Changing Agricultural Systems in the Coastal Zone of Bangladesh
farmers of the area are careful not to allow saline water into their agricultural fields (SRDId, 2008;
Field study, 2011).
Present Land Use: Transplanted Aman rice or HYV Boro rice are grown in the kharif season. Rabi
crops are grown on high river bank soils. Many of the fields are characterized by an integrated
system of Galda (a type of fresh water prawn), rice and vegetables; the latter are often grown on
the dikes of the gher (Field study, 2011).
Population: Total population is 1828 with 922 males and 906 females. Population density is
616/km2. The population growth rate at 0.88 % per annum is lower than in the other areas. Total
literacy rate is 62% with 72% male literacy rate and 52% female literacy rate. Total number of
households is 426. The average household size is 4.9 persons (BBSb, 2001).
Livelihood: Like other study areas of Satkhira District the people of Banda are involved in
agricultural activities. Other livelihood activities include agricultural labour, services, shopkeeping,
business and trading (Field study, 2011).
3.5 Description of Kunja Patti Village of Bhola Sadar Upazila
Location and Area: Kunja Patti Village lies between latitude 22°32’ and 22°52’ N, and longitude
90°32’ and 90°44’ E in Bhola Sadar Upazila of Bhola District. The total area of Kunja Patti is 458
ha, whereas the total area of Bhola Sadar is 314 km2 within which the river occupies 10 km2
(BBSc, 2001; SRDIe, 1993).
Physiography: Bhola Sadar is located in the discharge area of the Ganges- Brahmaputra-Meghna
River (GBM) system. It is occupied by flat land with very low ridges and broad depressions. Here,
shifting channels constantly erode land and deposits sediment in other places to create new island
formations. The area is highly influenced by tidal interactions and the consequential backwater

57
Sustainability of Changing Agricultural Systems in the Coastal Zone of Bangladesh
effect. The heavy sediment inputs from the rivers make it a morphologically dynamic coastal zone
(SRDIe, 1993).
Climate: Like other study areas it is also within the tropical monsoon climate system. The annual
mean rainfall is about 2000 mm and annual average temperature is 25.6oC. In the early summer
(April and May) and late in the monsoon season (September to November) wind is variable and
unstable causing frequent cyclones and tidal surges (SRDIe, 1993).
Land type and Soil: Medium high land makes up about 45% of all land types. Soils of the area
are mainly grey to olive deep silt loams and silty clay loams, and organic matter content is medium
(SRDIe, 1993).
Water Resources: Surface water is fresh. Sweet water is also found at a shallow depth in
floodplain ridges and this is required for domestic use. Deeper water is more saline, especially in
the southern part. Salinity gradually progresses northward in the dry season (SRDIe, 1993).
Salinity: Surface fresh water plays a lead role in agriculture, ecosystem and human activities of
the area. On the other hand, salinity found in deep groundwater renders it unusable for most
purposes (SRDIe, 1993).
Present Land Use: The dominant crop is transplanted Aman rice followed by kheshari and lentils.
Aus or Aman rice is also grown in some parts. Rabi crops including many vegetables like chilli,
eggplant, water gourd, amaranths etc. and multi-season crops like coconut, betel nut and
sugarcane are also grown (Field study, 2011).
Population: Total population is 5235 with 2712 males and 2523 females. Population density is
988/km2 with population growth at 1.50 % per annum. Literacy is very low at 26% in totality with
30% male literacy rate and 23% female literacy rate. The total number of households is 1028 and
average household size is 5.1 persons (BBSc, 2001).
58
Sustainability of Changing Agricultural Systems in the Coastal Zone of Bangladesh
Livelihood: Like other study areas, most people are farmers and involved in agricultural activities.
Some other occupations for the local people include labour, transport, shopkeeping and fishing
(Field study, 2011).

59
Sustainability of Changing Agricultural Systems in the Coastal Zone of Bangladesh
4.0 Introduction
Data analysis was carried out in response to the objectives set out in Chapter One. The overall
goal was to compare the levels of agricultural sustainability in the five study areas.
4.1 Profile of the Respondent Households
A total of 211 households were surveyed, based on interviews with one of the senior household
members; among them only 6 were female respondents. A profile of the respondent households is
presented in Table 3.1. It was found that the average age of the respondents was between 40 and
50 years.
Table 4.1: Profile of the respondent households
Items Study areas
Shyamnagar Kaliganj Kalaroa Dumuria Bhola Sadar
Total number of respondents 45 60 59 22 26
Sex Male 44 100 54 100 100
Female 1 0 5 0 0
Family size (Average family member) 6 5 5 6 7
Average age 40 41.4 49.2 47.4 42
Literacy level (%)
Illiterate (No schooling) 18 28 63 9 50
Primary schooling 24 8 10 27 15
Secondary schooling 42 38 12 41 27
Tertiary schooling (SSC and HSC equivalent and above)
16 25 15 23 8
Occupational status (%)
Agricultural (Primary) 100% 100% 100% 100% 100%
Others (Secondary) 33% 48% 32% 36% 34%
Land holding (Ha/HH) 2.25 3.50 1.12 1.31 2.32
Source: Questionnaire survey, 2011
Educational status of the sample households was considered under the following categories:
illiterate, completed primary schooling, high schooling and tertiary schooling. Among respondents,
illiteracy rate is highest in Kalaroa and Bhola Sadar. Thirty to fifty years ago the number of primary
school going students was unusually low in rural areas of Bangladesh. As a result, the illiteracy
rate remains high among adults in many parts of the country. In Kalaroa, the average age of the
Chapter-4: Data Analysis and Discussion

60
Sustainability of Changing Agricultural Systems in the Coastal Zone of Bangladesh
respondents is about 50 years and illiteracy is high among them. Most of the aged respondents did
not have access to primary education. Because of this reason, in Bhola Sadar too illiteracy is also
high among respondents. In the case of Dumuria, although the age of the farmers is around 50
years, the illiteracy rate is lower as it was near a large urban area and primary education started
here during the British period. The average family size of the respondent households of about 6
persons is close to the national average of 4.4 persons (BBS, 2011). The family size has been
defined as the number of persons living together under the control of one head and taking meals
from the same kitchen. The term family includes wife, sons, unmarried daughters, father, mother,
and brothers etc. (BBS, 2001). The highest family size was found in Bhola Sadar. Average land
holdings ranged from 1.12 ha/HH in Kalaroa to 3.50 ha/HH in Kaliganj. Land use varied from
shrimp farming in the near-coast areas of Shyamnagar and Kaliganj, to field crops in Kalaroa and
Bhola Sadar while there is extensive use of land for both shrimp and agriculture in Dumuria.
All the respondents of the study areas are doing agriculture as primary activities. In all study areas,
apart from agriculture, about one third to one half of respondents held secondary occupations like
fishing, small business, shop keeping, transport and a variety of services. The highest numbers of
respondents involved in activities other than agriculture were found in Kaliganj while Kalaroa had
the lowest number of respondents in non-agricultural occupations.
4.2 Agricultural Profile of the Study Areas
Shyamnagar: The Black Tiger shrimp (Penaeus monodon), locally called bagda chingri (DoF,
2005) is intensively cultivated in the tidally inundated low-lying flat lands of Shyamnagar. Most of
the shrimp farmers include several types of fish in their gher to reduce their risks (Field study,
2011). The cultivation methods supporting production of bagda are mostly traditional with low
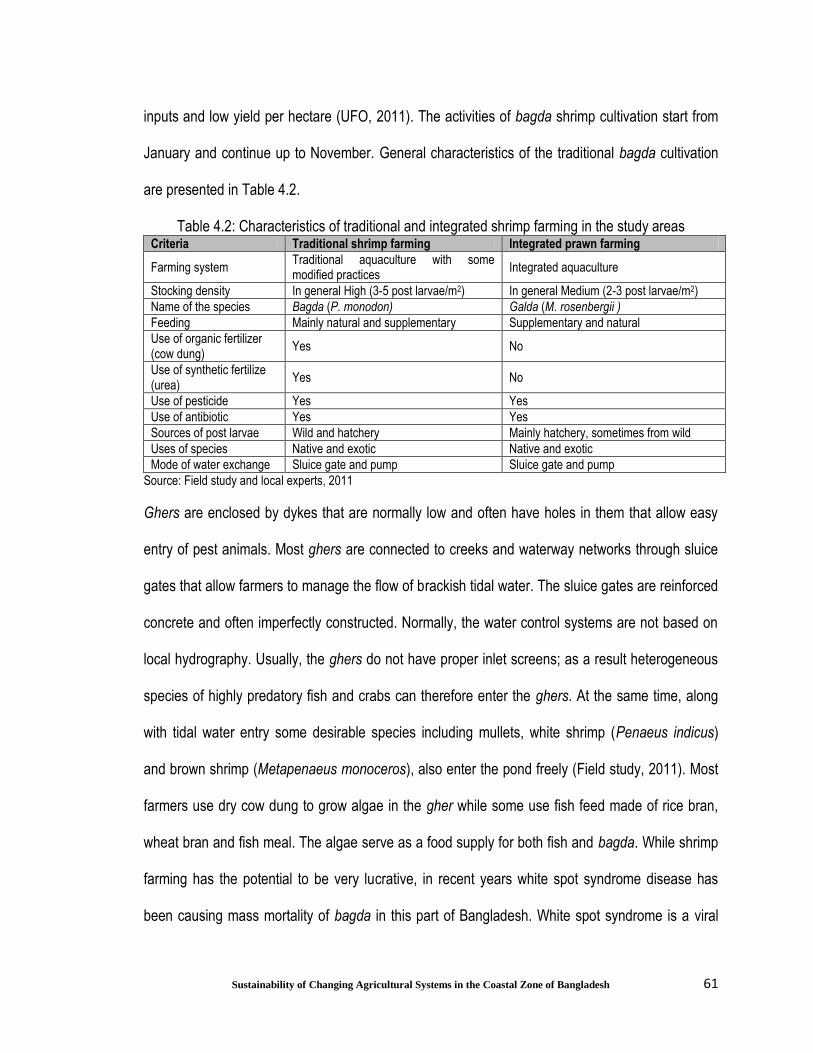
61
Sustainability of Changing Agricultural Systems in the Coastal Zone of Bangladesh
inputs and low yield per hectare (UFO, 2011). The activities of bagda shrimp cultivation start from
January and continue up to November. General characteristics of the traditional bagda cultivation
are presented in Table 4.2.
Table 4.2: Characteristics of traditional and integrated shrimp farming in the study areas Criteria Traditional shrimp farming Integrated prawn farming
Farming system Traditional aquaculture with some modified practices
Integrated aquaculture
Stocking density In general High (3-5 post larvae/m2) In general Medium (2-3 post larvae/m2)
Name of the species Bagda (P. monodon) Galda (M. rosenbergii )
Feeding Mainly natural and supplementary Supplementary and natural
Use of organic fertilizer (cow dung)
Yes No
Use of synthetic fertilize (urea)
Yes No
Use of pesticide Yes Yes
Use of antibiotic Yes Yes
Sources of post larvae Wild and hatchery Mainly hatchery, sometimes from wild
Uses of species Native and exotic Native and exotic
Mode of water exchange Sluice gate and pump Sluice gate and pump
Source: Field study and local experts, 2011
Ghers are enclosed by dykes that are normally low and often have holes in them that allow easy
entry of pest animals. Most ghers are connected to creeks and waterway networks through sluice
gates that allow farmers to manage the flow of brackish tidal water. The sluice gates are reinforced
concrete and often imperfectly constructed. Normally, the water control systems are not based on
local hydrography. Usually, the ghers do not have proper inlet screens; as a result heterogeneous
species of highly predatory fish and crabs can therefore enter the ghers. At the same time, along
with tidal water entry some desirable species including mullets, white shrimp (Penaeus indicus)
and brown shrimp (Metapenaeus monoceros), also enter the pond freely (Field study, 2011). Most
farmers use dry cow dung to grow algae in the gher while some use fish feed made of rice bran,
wheat bran and fish meal. The algae serve as a food supply for both fish and bagda. While shrimp
farming has the potential to be very lucrative, in recent years white spot syndrome disease has
been causing mass mortality of bagda in this part of Bangladesh. White spot syndrome is a viral
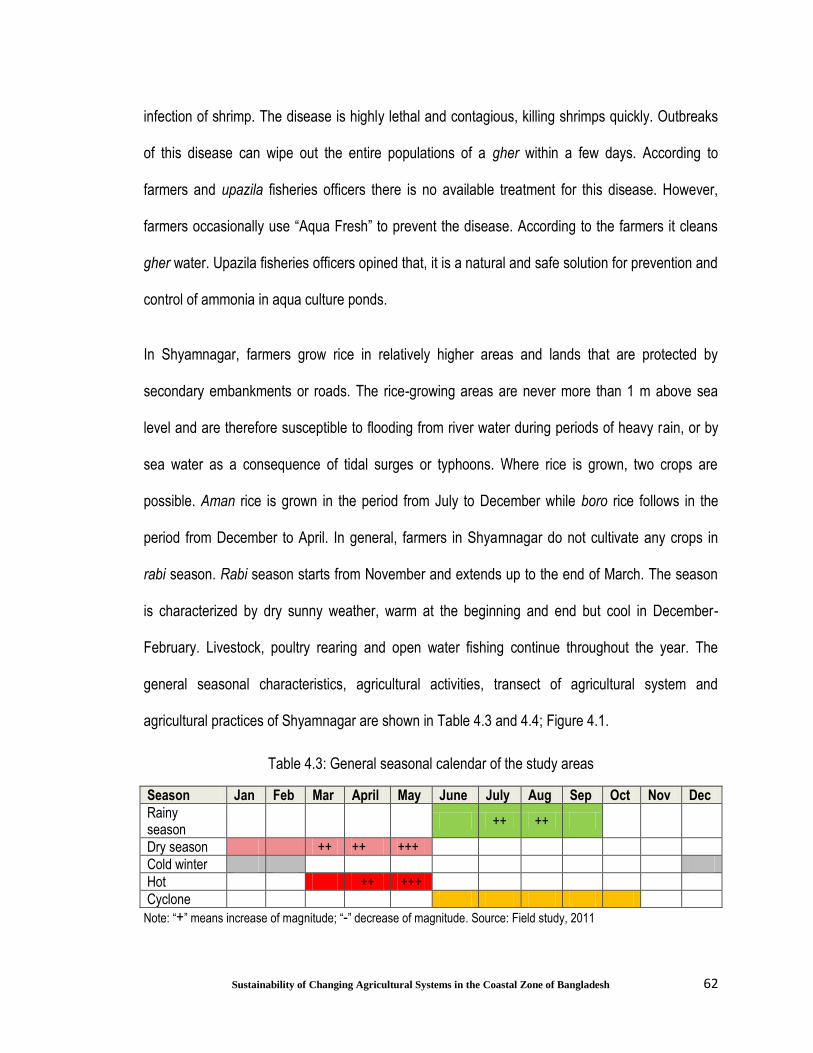
62
Sustainability of Changing Agricultural Systems in the Coastal Zone of Bangladesh
infection of shrimp. The disease is highly lethal and contagious, killing shrimps quickly. Outbreaks
of this disease can wipe out the entire populations of a gher within a few days. According to
farmers and upazila fisheries officers there is no available treatment for this disease. However,
farmers occasionally use “Aqua Fresh” to prevent the disease. According to the farmers it cleans
gher water. Upazila fisheries officers opined that, it is a natural and safe solution for prevention and
control of ammonia in aqua culture ponds.
In Shyamnagar, farmers grow rice in relatively higher areas and lands that are protected by
secondary embankments or roads. The rice-growing areas are never more than 1 m above sea
level and are therefore susceptible to flooding from river water during periods of heavy rain, or by
sea water as a consequence of tidal surges or typhoons. Where rice is grown, two crops are
possible. Aman rice is grown in the period from July to December while boro rice follows in the
period from December to April. In general, farmers in Shyamnagar do not cultivate any crops in
rabi season. Rabi season starts from November and extends up to the end of March. The season
is characterized by dry sunny weather, warm at the beginning and end but cool in December-
February. Livestock, poultry rearing and open water fishing continue throughout the year. The
general seasonal characteristics, agricultural activities, transect of agricultural system and
agricultural practices of Shyamnagar are shown in Table 4.3 and 4.4; Figure 4.1.
Table 4.3: General seasonal calendar of the study areas
Season Jan Feb Mar April May June July Aug Sep Oct Nov Dec
Rainy season
++ ++
Dry season ++ ++ +++
Cold winter
Hot ++ +++
Cyclone
Note: “+” means increase of magnitude; “-” decrease of magnitude. Source: Field study, 2011

63
Sustainability of Changing Agricultural Systems in the Coastal Zone of Bangladesh
Table 4.4: Agricultural activities of Shyamnagar based on general crop calendar
Season Jan Feb Mar April May June July Aug Sep Oct Nov Dec
Crops Aman rice Showing and Harvesting
Boro rice Showing and Harvesting
S……
Bag
da
Gh
er
Pond preparation
Pond drying
Dikes repairing
Water intake
Tilling
Liming
Fertilization
Stocking
Harvesting
Marketing
Livestock & poultry All the year round Source: FGD and Field study, 2011.
Figure 4.1: Large-scale transect of agricultural system of Shyamnagar. Source: Field study, 2011
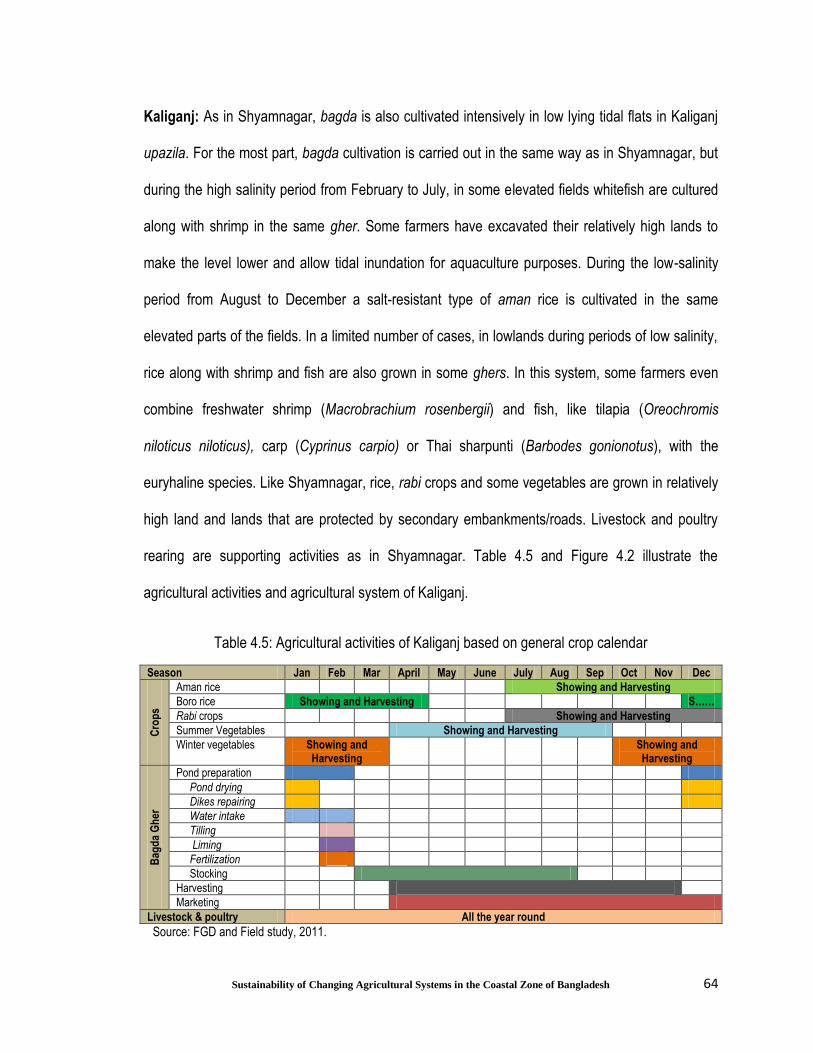
64
Sustainability of Changing Agricultural Systems in the Coastal Zone of Bangladesh
Kaliganj: As in Shyamnagar, bagda is also cultivated intensively in low lying tidal flats in Kaliganj
upazila. For the most part, bagda cultivation is carried out in the same way as in Shyamnagar, but
during the high salinity period from February to July, in some elevated fields whitefish are cultured
along with shrimp in the same gher. Some farmers have excavated their relatively high lands to
make the level lower and allow tidal inundation for aquaculture purposes. During the low-salinity
period from August to December a salt-resistant type of aman rice is cultivated in the same
elevated parts of the fields. In a limited number of cases, in lowlands during periods of low salinity,
rice along with shrimp and fish are also grown in some ghers. In this system, some farmers even
combine freshwater shrimp (Macrobrachium rosenbergii) and fish, like tilapia (Oreochromis
niloticus niloticus), carp (Cyprinus carpio) or Thai sharpunti (Barbodes gonionotus), with the
euryhaline species. Like Shyamnagar, rice, rabi crops and some vegetables are grown in relatively
high land and lands that are protected by secondary embankments/roads. Livestock and poultry
rearing are supporting activities as in Shyamnagar. Table 4.5 and Figure 4.2 illustrate the
agricultural activities and agricultural system of Kaliganj.
Table 4.5: Agricultural activities of Kaliganj based on general crop calendar
Season Jan Feb Mar April May June July Aug Sep Oct Nov Dec
Cro
ps
Aman rice Showing and Harvesting
Boro rice Showing and Harvesting S……
Rabi crops Showing and Harvesting
Summer Vegetables Showing and Harvesting
Winter vegetables Showing and Harvesting
Showing and Harvesting
Bag
da
Gh
er
Pond preparation
Pond drying
Dikes repairing
Water intake
Tilling
Liming
Fertilization
Stocking
Harvesting
Marketing
Livestock & poultry All the year round
Source: FGD and Field study, 2011.
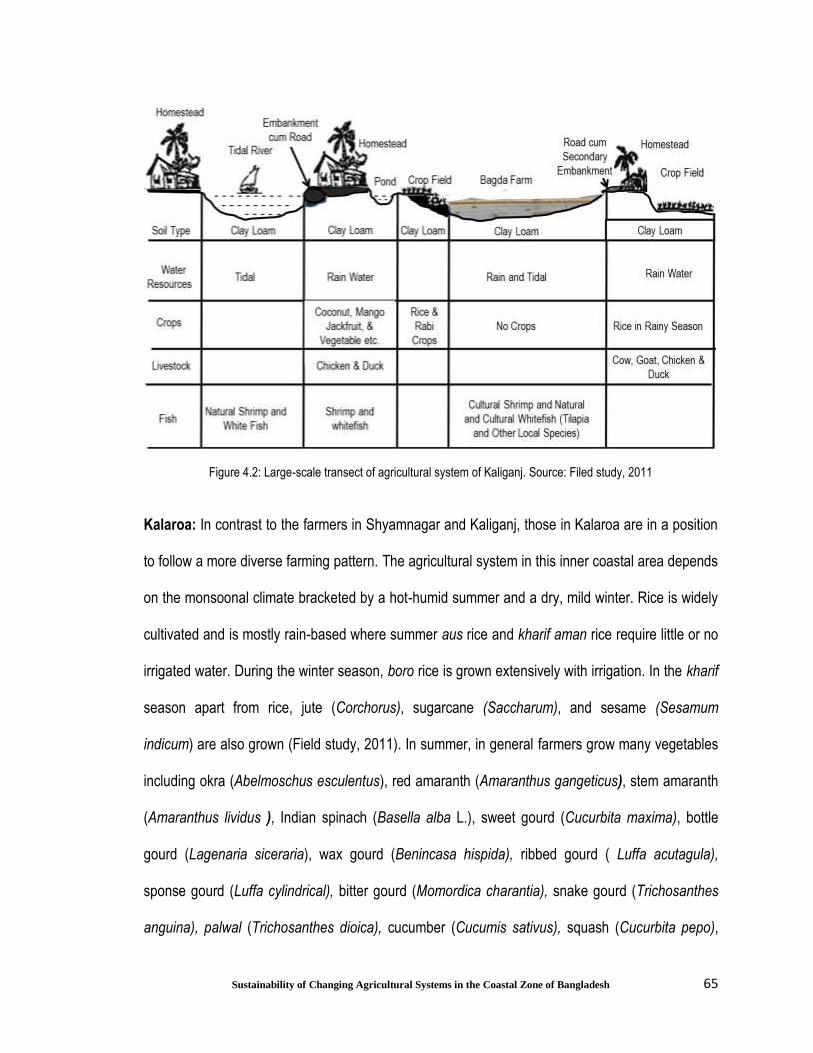
65
Sustainability of Changing Agricultural Systems in the Coastal Zone of Bangladesh
Figure 4.2: Large-scale transect of agricultural system of Kaliganj. Source: Filed study, 2011
Kalaroa: In contrast to the farmers in Shyamnagar and Kaliganj, those in Kalaroa are in a position
to follow a more diverse farming pattern. The agricultural system in this inner coastal area depends
on the monsoonal climate bracketed by a hot-humid summer and a dry, mild winter. Rice is widely
cultivated and is mostly rain-based where summer aus rice and kharif aman rice require little or no
irrigated water. During the winter season, boro rice is grown extensively with irrigation. In the kharif
season apart from rice, jute (Corchorus), sugarcane (Saccharum), and sesame (Sesamum
indicum) are also grown (Field study, 2011). In summer, in general farmers grow many vegetables
including okra (Abelmoschus esculentus), red amaranth (Amaranthus gangeticus), stem amaranth
(Amaranthus lividus ), Indian spinach (Basella alba L.), sweet gourd (Cucurbita maxima), bottle
gourd (Lagenaria siceraria), wax gourd (Benincasa hispida), ribbed gourd ( Luffa acutagula),
sponse gourd (Luffa cylindrical), bitter gourd (Momordica charantia), snake gourd (Trichosanthes
anguina), palwal (Trichosanthes dioica), cucumber (Cucumis sativus), squash (Cucurbita pepo),

66
Sustainability of Changing Agricultural Systems in the Coastal Zone of Bangladesh
brinjal (Solanum melongena) and summer tomato (Lycopersicon esculentum). In the rabi season
farmers grow boro rice, wheat, oilseeds and pulses. Some farmers also grow spices and other
supporting crops like green chillies (Capsicum annuum), ginger (zingiber officinale), onion (Allium
cepa) and turmeric (Curcuma longa) in different seasons. As in Kaliganj, livestock and poultry
rearing are continued throughout the year. Table 4.6 and Figure 4.3 illustrate the agricultural
activities and agricultural system of Kalaroa.
Table 4.6: Agricultural activities of Kalaroa based on general crop calendar
Season Jan Feb Mar April May June July Aug Sep Oct Nov Dec
Cro
ps
Aus rice Showing and Harvesting
Aman rice Showing and Harvesting
Boro rice Showing and Harvesting s…
Rabi crops Showing and Harvesting
Summer vegetables Showing and Harvesting
Winter vegetables Showing and Harvesting
Showing and Harvesting
Fruits (Mango, Jackfruit, Banana, Papaya and others)
Livestock & poultry All the year round
Source: FGD and Field study, 2011
Figure 4.3: Large-scale transect of agricultural system of Kalaroa. Source: Filed study, 2011

67
Sustainability of Changing Agricultural Systems in the Coastal Zone of Bangladesh
Dumuria: The farmers of Dumuria are mostly involved in an agricultural system where farmers
hope to get a substantial output but with minimum supply of inputs of seeds, urea, TSP, gypsum,
and pesticide. Through the questionnaire survey it was observed that, in comparison with other
study areas, farmers of Dumuria are using less input for agricultural activities. Most of the farmers
are involved in rice, fresh water prawn (Macrobrachium rosenbergii) and fish and vegetables
cultivation in the same gher. This approach has been uniquely developed by the local farmers. In
the gher, dikes are raised above normal flood level with an excavated canal 1 to 2 m deep and 3 to
6 m wide; alternatively, a small shallow pond is excavated in the middle or corner inside the gher
periphery as a shelter for prawns and fish during the dry season (Field study, 2011). In this gher
the rice is cultivated during the kharif season. Figure 4.4 illustrates the integrated gher system of
Dumuria.
This fresh water prawn is known as the giant river/freshwater prawn worldwide while in Bangladesh
it is commonly known as ‘galda chingri’ (Macrobrachium rosenbergii) (FAO, 1980). Farmers are
growing galda along with carp, tilapia and other fish culture after harvesting rice. In this technique,
galda and fish (usually carp and grass carp (Ctenopharyngodon idella)) are stocked in the paddy
field after harvesting rice from the land. Fish rearing for six to seven months is possible until rice
plantation begins in the next season. Vegetables are planted on dikes or by constructing frames
using available materials (bamboo sticks, branches of trees and shrubs). In this way, farmers are
able to produce both summer and winter vegetables commercially. Particularly in summer, the
cultivated vegetables include eggplant, amaranth, bitter gourd, cucumber, tomato, water gourd,
coneflower, radish and bean. In some relatively high lands, farmers are cultivating only rice and
rabi crops like, potato, pulses, onion. The livestock and poultry are reared throughout the year.
Table 4.7, Figure 4.4 and 4.5 illustrate the agricultural activities and agricultural system in Dumuria.

68
Sustainability of Changing Agricultural Systems in the Coastal Zone of Bangladesh
Table 4.7: Agricultural activities of Dumuria based on general crop calendar
Season Jan Feb Mar April May June July Aug Sep Oct Nov Dec C
rop
s Aus rice Showing and Harvesting
Aman rice Showing and Harvesting
Boro rice Showing and Harvesting S……
Summer vegetables Showing and Harvesting
Winter vegetables Showing and Harvesting Showing and Harvesting
Gal
da
Gh
er
Pond preparation
Pond drying
Dikes repairing
Water intake
Tilling
Liming
Fertilization
Stocking
Harvesting
Marketing
Livestock & poultry All the year round
Source: FGD and Field study, 2011.
Figure 4.4: Large-scale transect of agricultural system of Dumuria. Source: Field study, 2011
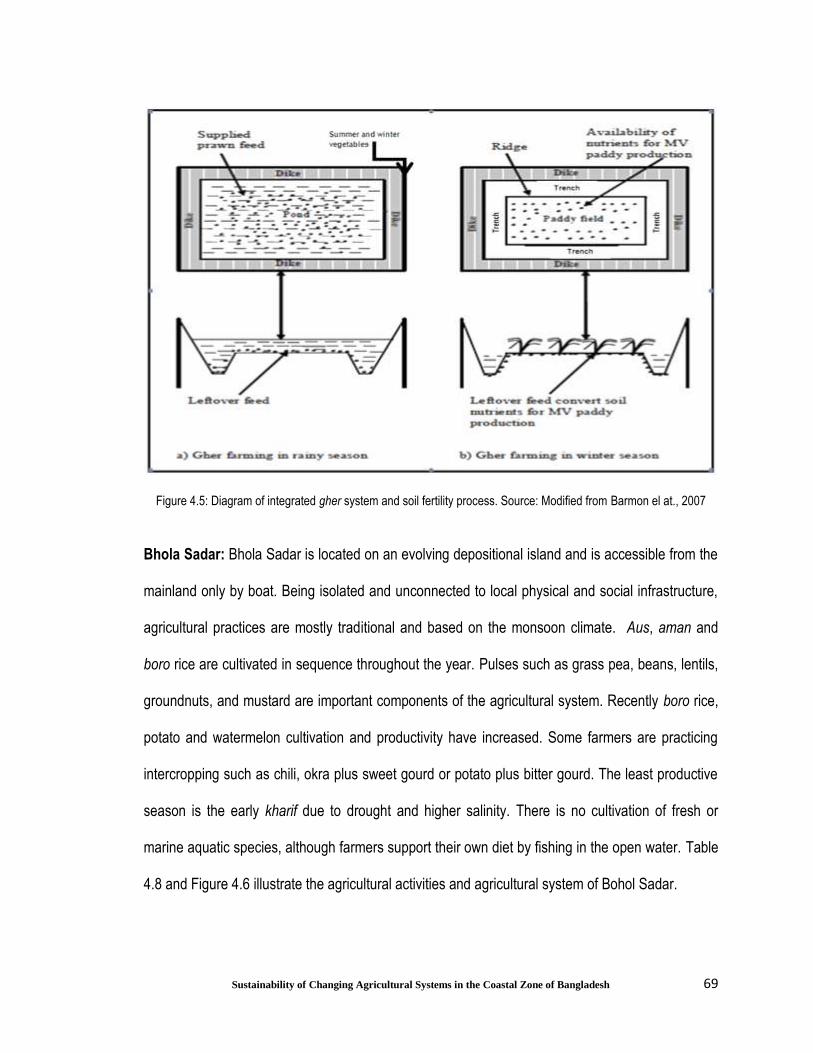
69
Sustainability of Changing Agricultural Systems in the Coastal Zone of Bangladesh
Figure 4.5: Diagram of integrated gher system and soil fertility process. Source: Modified from Barmon el at., 2007
Bhola Sadar: Bhola Sadar is located on an evolving depositional island and is accessible from the
mainland only by boat. Being isolated and unconnected to local physical and social infrastructure,
agricultural practices are mostly traditional and based on the monsoon climate. Aus, aman and
boro rice are cultivated in sequence throughout the year. Pulses such as grass pea, beans, lentils,
groundnuts, and mustard are important components of the agricultural system. Recently boro rice,
potato and watermelon cultivation and productivity have increased. Some farmers are practicing
intercropping such as chili, okra plus sweet gourd or potato plus bitter gourd. The least productive
season is the early kharif due to drought and higher salinity. There is no cultivation of fresh or
marine aquatic species, although farmers support their own diet by fishing in the open water. Table
4.8 and Figure 4.6 illustrate the agricultural activities and agricultural system of Bohol Sadar.

70
Sustainability of Changing Agricultural Systems in the Coastal Zone of Bangladesh
Table 4.8: Agricultural activities of Bhola Sadar based on general crop calendar
Season Jan Feb Mar April May June July Aug Sep Oct Nov Dec C
rop
s Aus rice Showing and Harvesting
Aman rice Showing and Harvesting
Boro rice Showing and Harvesting Showing
Rabi crops Showing and Harvesting
Summer vegetables Showing and Harvesting
Winter vegetables Showing and Harvesting
Showing and Harvesting
Livestock & poultry All the year round
Source: FGD and Field study, 2011.
Figure 4.6: Large-scale transect of agricultural system of Bhola Sadar. Source: Field study, 2011
4.3 Sustainability Assessment
To assess sustainability of agriculture in the five study areas, indicators within six categories were
calculated as outlined in Chapter 3. Employing MCDA methodology, the indicator data were then
scored within the different categories and finally in terms of overall agricultural sustainability. The
goal of this work was to compare various aspects of agricultural sustainability followed in the
coastal region of Bangladesh using the results obtained.

71
Sustainability of Changing Agricultural Systems in the Coastal Zone of Bangladesh
4.3.1 Productivity
Productivity of the agricultural system is extremely important in order to provide for individual
farmers’ livelihood and to feed the wider population. Without good productivity, it would be a
challenge in the future to feed people in the coastal area as well as the population of the whole
country from an increasingly vanishing and degraded natural resource base. Productivity is
therefore the first prerequisite necessary to meet food security for both the farmer’s family as well
as for the nation. It is an intrinsic component of agricultural sustainability.
In measuring productivity, the fundamental issues centre around how much crop or crops can be
produced on a given area of land and this can be measured by several different indicators.
Keeping in mind the importance of rice as the principal agricultural crop throughout the area, two
indicators that focus on rice were considered essential – the average yield (t/ha) and the net
income ($/ha) from a given area obtained by farmers. Clearly, these indicators overlap but in
addition to yield, the second one also takes into account the important economic issue of cost in
achieving a certain level of production. Three other indicators were also chosen to account for the
variety of other agricultural and marine products produced within the total area available to farmers
- net income ($/ha), protein yield (kg/ha) and energy yield (J/ha), all considering the entire agro-
ecosystem (Table: P1). These indicators were selected to take into account the main goals of
agriculture, as a source of income and to produce protein and food energy (kcal). Again, there is
overlap in what is measured in each of these three indicators since all of them depend on the yield
of various commodities, but no single indicator is able to account for issues like the varying
economic value, protein and energy content of different products. Assigning a weight to each
indicator was then done in a way to take into account this overlap. For example, because rice yield

72
Sustainability of Changing Agricultural Systems in the Coastal Zone of Bangladesh
influences all five productivity indicators, productivity of rice (P1.1) was assigned a lower weighting
than if it had been the single indicator used to describe productivity alone.
Of the five study areas, the weighted average yield of overall seasons (6.51 t/ha) of rice was found
to be highest in the integrated agricultural system of Dumuria. This high yield is considerably above
the Bangladesh average (2.8 t/ha) and can be attributed in part to the lower salinity of both water
and soil during the rice cultivation period and also to the supply of a significant amount of soil
organic matter and soil nutrients from waste associated with galda prawn cultivation prior to
planting rice were other contributing factors towards the higher yield (Barmon et al., 2007). Yield
(2.28 t/ha) is lowest in the bagda shrimp dominated agricultural system of Shyamnagar because
prolonged shrimp farming diminishes the soil quality of the rice fields adjacent to the ghers (Ali,
2004; 2006). Furthermore, the storm surge from the recent, 2009 cyclone ‘Aila’ over Shyamnagar
brought saline water into the rice fields. This has created profound negative impacts on the soil and
water for rice cultivation. While 2009 was the most recent such event, this highly exposed coastal
region has been subject to other such surges over the past decades. The yield (2.86 t/ha) of rice in
Bhola Sadar was also found to be low about the same as the national average of Bangladesh,
however the farming systems are basically subsistence in nature, and rice is cultivated under input-
starved conditions. Moreover, natural hazards like cyclones, heavy rainfall and drought have been
affecting the rice production systems of this area at different levels almost every year. Kalaroa
(5.25 t/ha) and Kaliganj (4.41 t/ha) experience good yield of rice every year because of improved
methods and irrigation facilities. The rice marketing chain is very fragmented in Bhola Sadar and
for this reason the farmers get a lower price, US$ 0.18 per kg, for their rice compared to the other
three areas. In other study areas the price of per kg rice varies from US$ 0.25 to US$ 0.30. The net
income from rice is very high in Dumuria because wholesalers purchase there and send the rice to
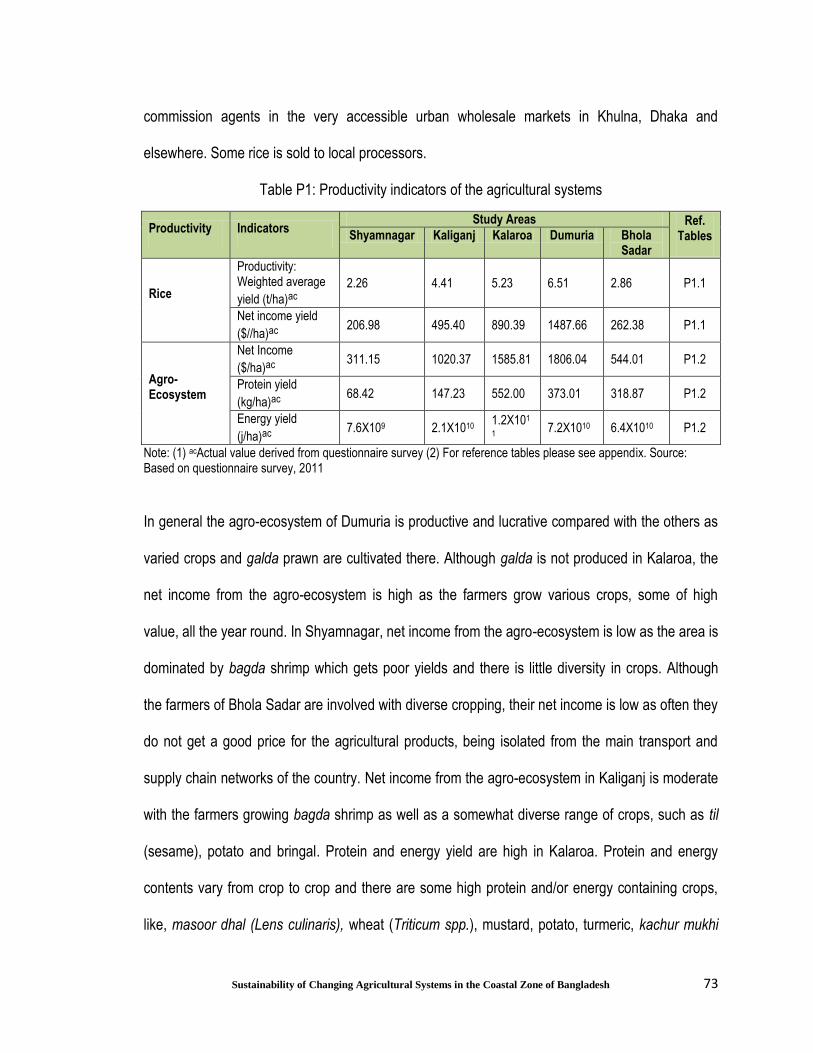
73
Sustainability of Changing Agricultural Systems in the Coastal Zone of Bangladesh
commission agents in the very accessible urban wholesale markets in Khulna, Dhaka and
elsewhere. Some rice is sold to local processors.
Table P1: Productivity indicators of the agricultural systems
Productivity Indicators Study Areas Ref.
Tables Shyamnagar Kaliganj Kalaroa Dumuria Bhola Sadar
Rice
Productivity: Weighted average
yield (t/ha)ac
2.26 4.41 5.23 6.51 2.86 P1.1
Net income yield
($//ha)ac 206.98 495.40 890.39 1487.66 262.38 P1.1
Agro-Ecosystem
Net Income
($/ha)ac 311.15 1020.37 1585.81 1806.04 544.01 P1.2
Protein yield
(kg/ha)ac 68.42 147.23 552.00 373.01 318.87 P1.2
Energy yield
(j/ha)ac 7.6X10⁹ 2.1X10¹⁰
1.2X101
1 7.2X10¹⁰ 6.4X10¹⁰ P1.2
Note: (1) acActual value derived from questionnaire survey (2) For reference tables please see appendix. Source: Based on questionnaire survey, 2011
In general the agro-ecosystem of Dumuria is productive and lucrative compared with the others as
varied crops and galda prawn are cultivated there. Although galda is not produced in Kalaroa, the
net income from the agro-ecosystem is high as the farmers grow various crops, some of high
value, all the year round. In Shyamnagar, net income from the agro-ecosystem is low as the area is
dominated by bagda shrimp which gets poor yields and there is little diversity in crops. Although
the farmers of Bhola Sadar are involved with diverse cropping, their net income is low as often they
do not get a good price for the agricultural products, being isolated from the main transport and
supply chain networks of the country. Net income from the agro-ecosystem in Kaliganj is moderate
with the farmers growing bagda shrimp as well as a somewhat diverse range of crops, such as til
(sesame), potato and bringal. Protein and energy yield are high in Kalaroa. Protein and energy
contents vary from crop to crop and there are some high protein and/or energy containing crops,
like, masoor dhal (Lens culinaris), wheat (Triticum spp.), mustard, potato, turmeric, kachur mukhi
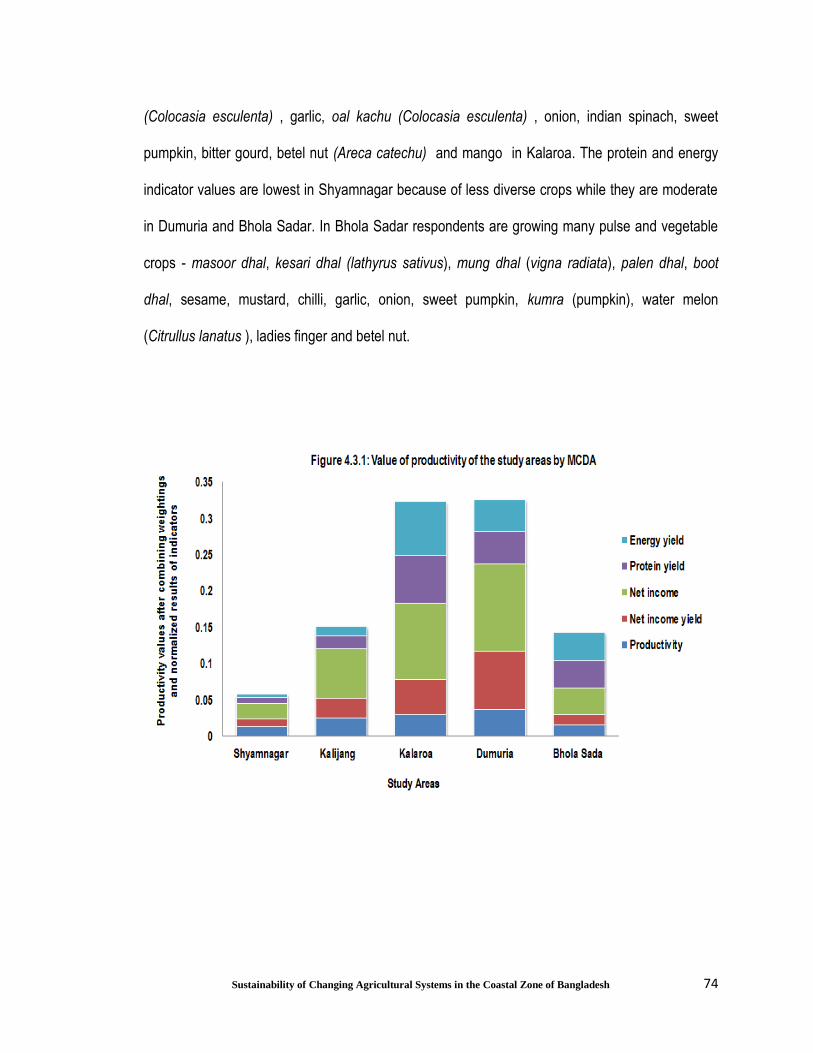
74
Sustainability of Changing Agricultural Systems in the Coastal Zone of Bangladesh
(Colocasia esculenta) , garlic, oal kachu (Colocasia esculenta) , onion, indian spinach, sweet
pumpkin, bitter gourd, betel nut (Areca catechu) and mango in Kalaroa. The protein and energy
indicator values are lowest in Shyamnagar because of less diverse crops while they are moderate
in Dumuria and Bhola Sadar. In Bhola Sadar respondents are growing many pulse and vegetable
crops - masoor dhal, kesari dhal (lathyrus sativus), mung dhal (vigna radiata), palen dhal, boot
dhal, sesame, mustard, chilli, garlic, onion, sweet pumpkin, kumra (pumpkin), water melon
(Citrullus lanatus ), ladies finger and betel nut.

75
Sustainability of Changing Agricultural Systems in the Coastal Zone of Bangladesh
Table 4.3.1: Productivity values after combining weightings and normalized results of indicators
Indicators Study Areas
Shyamnagar Kaliganj Kalaroa Dumuria Bhola Sadar
Rice
Productivity 0.013 0.025 0.030 0.037 0.016
Net income 0.011 0.027 0.048 0.080 0.014
Agro-Ecosystem
Net income 0.021 0.068 0.105 0.120 0.036
Protein yield 0.008 0.018 0.066 0.045 0.038
Energy yield 0.005 0.013 0.074 0.044 0.039
Overall 0.057 0.150 0.323 0.326 0.144 Source: Score calculated by Web-HIPRE, 2012.
Combining all the productivity indicators and weighting as described in the methodology chapter
(Table 2.8), MCDA analysis (Figure 4.3.1 and Table 4.3.1) shows that the productivity score is high
in Dumuria and Kalaroa, both areas showing good yields of rich agro-biodiversity. On the other
hand, the score for productivity is very low in Shyamnagar, an area where most food production is
limited to repetitive farming of bagda shrimp in lowlands and rice in slightly elevated areas.
4.3.2 Stability
Stability in crop production describes the ability to maintain a good level of productivity over an
extended period of time (vanLoon et al., 2005). It is generally not possible to measure stability
directly in a predictive sense but it can be assessed indirectly by examining the quality of the
resources on which productivity depends. These resources include land, soil, water and climate, as
well as other issues. For an example, for agricultural stability and overall sustainability, it is
essential that the basic soil and water resources be and remain available in ample quantity and of
good quality.
In the present study, many indicators under the five headings – land, soil, water, climate and other
- (Table S1) were determined from secondary data obtained from various sources, for example the
76
Sustainability of Changing Agricultural Systems in the Coastal Zone of Bangladesh
upazila soil profile of Bangladesh Soil Resource Development Institute, reports of Disaster
Management Bureau and reports of Department of Environment in order to assess the state of the
agricultural resource. ‘Land’ refers to general landscape factors of the food production area
distinguishing it from ‘soil’, which refers to the chemical and physical properties of the medium in
which plants grow. ‘Other factors’ are usually those that relate to the built environment, most of
which are outside the control of farmers in the communities being studied.
In giving a value to each indicator, we did not use actual values that had been measured. Many of
the data with headings like land types (elevation), soil salinity, soil micronutrient that were available
from various government departments or the upazila had already been placed in various semi-
quantitative categories, using different scales. We assigned a numerical value to each category.
For example for soil, a very low salinity was given a value of 5 while a very high salinity was valued
at 1. In all cases, a high value means good condition and a low value poor condition. Table S1 and
the reference tables in the appendix explain the methods of assigning values for different
indicators.
Among stability indicators, soil and water salinity are highest importance. The salinity level in soil
and water plays a very important role in determining the agricultural practices over a period of time.
Salinity is high in soil and water in Shyamnagar. Most of the respondents of this study area were
fully aware of the limitations for growing crops due to the high level of salinity in soil and water. This
is the reason why conventional agriculture is difficult and why much of the area is devoted to
culture of bagda shrimp. In Kaliganj, salinity of soil is lower than in Shyamnagar but water salinity
remains elevated. As a result, the area is somewhat more suitable for rice while the abundant
marine water supply enables bagda shrimp cultivation to be a continuing activity. However, a
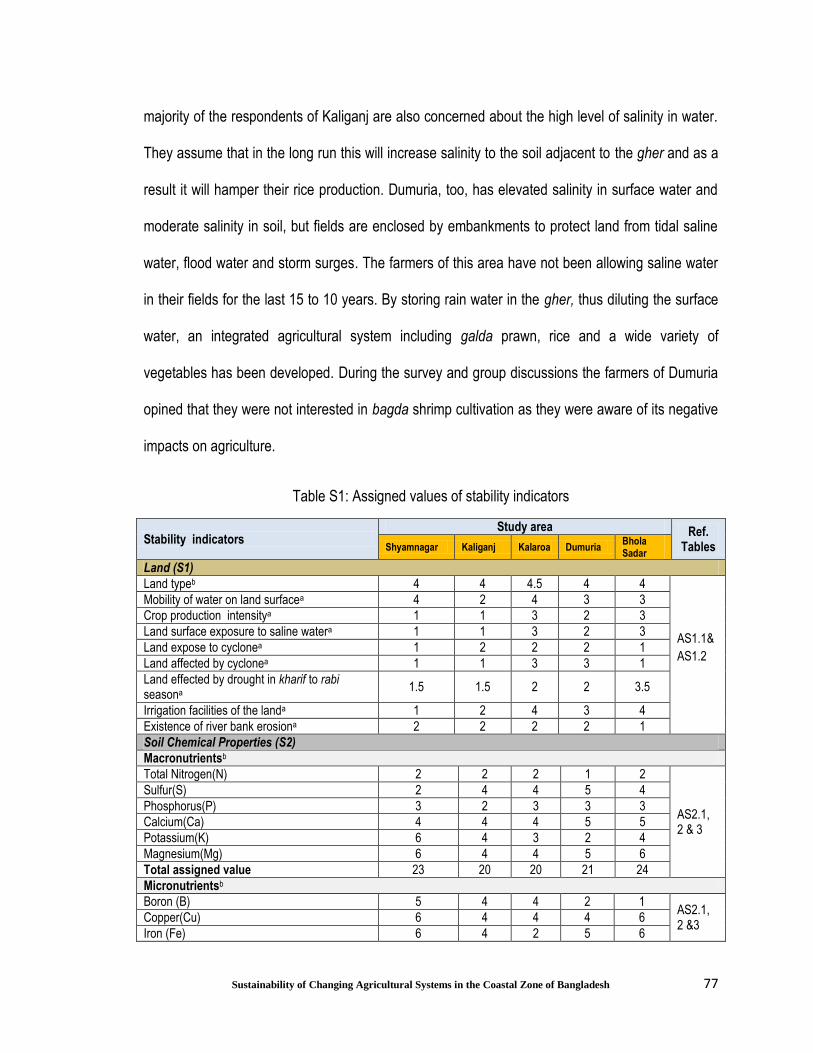
77
Sustainability of Changing Agricultural Systems in the Coastal Zone of Bangladesh
majority of the respondents of Kaliganj are also concerned about the high level of salinity in water.
They assume that in the long run this will increase salinity to the soil adjacent to the gher and as a
result it will hamper their rice production. Dumuria, too, has elevated salinity in surface water and
moderate salinity in soil, but fields are enclosed by embankments to protect land from tidal saline
water, flood water and storm surges. The farmers of this area have not been allowing saline water
in their fields for the last 15 to 10 years. By storing rain water in the gher, thus diluting the surface
water, an integrated agricultural system including galda prawn, rice and a wide variety of
vegetables has been developed. During the survey and group discussions the farmers of Dumuria
opined that they were not interested in bagda shrimp cultivation as they were aware of its negative
impacts on agriculture.
Table S1: Assigned values of stability indicators
Stability indicators Study area Ref.
Tables Shyamnagar Kaliganj Kalaroa Dumuria Bhola Sadar
Land (S1)
Land typeb 4 4 4.5 4 4
AS1.1&
AS1.2
Mobility of water on land surfacea 4 2 4 3 3
Crop production intensitya 1 1 3 2 3
Land surface exposure to saline watera 1 1 3 2 3
Land expose to cyclonea 1 2 2 2 1
Land affected by cyclonea 1 1 3 3 1
Land effected by drought in kharif to rabi seasona
1.5 1.5 2 2 3.5
Irrigation facilities of the landa 1 2 4 3 4
Existence of river bank erosiona 2 2 2 2 1
Soil Chemical Properties (S2)
Macronutrientsb
Total Nitrogen(N) 2 2 2 1 2
AS2.1, 2 & 3
Sulfur(S) 2 4 4 5 4
Phosphorus(P) 3 2 3 3 3
Calcium(Ca) 4 4 4 5 5
Potassium(K) 6 4 3 2 4
Magnesium(Mg) 6 4 4 5 6
Total assigned value 23 20 20 21 24
Micronutrientsb
Boron (B) 5 4 4 2 1 AS2.1, 2 &3
Copper(Cu) 6 4 4 4 6
Iron (Fe) 6 4 2 5 6
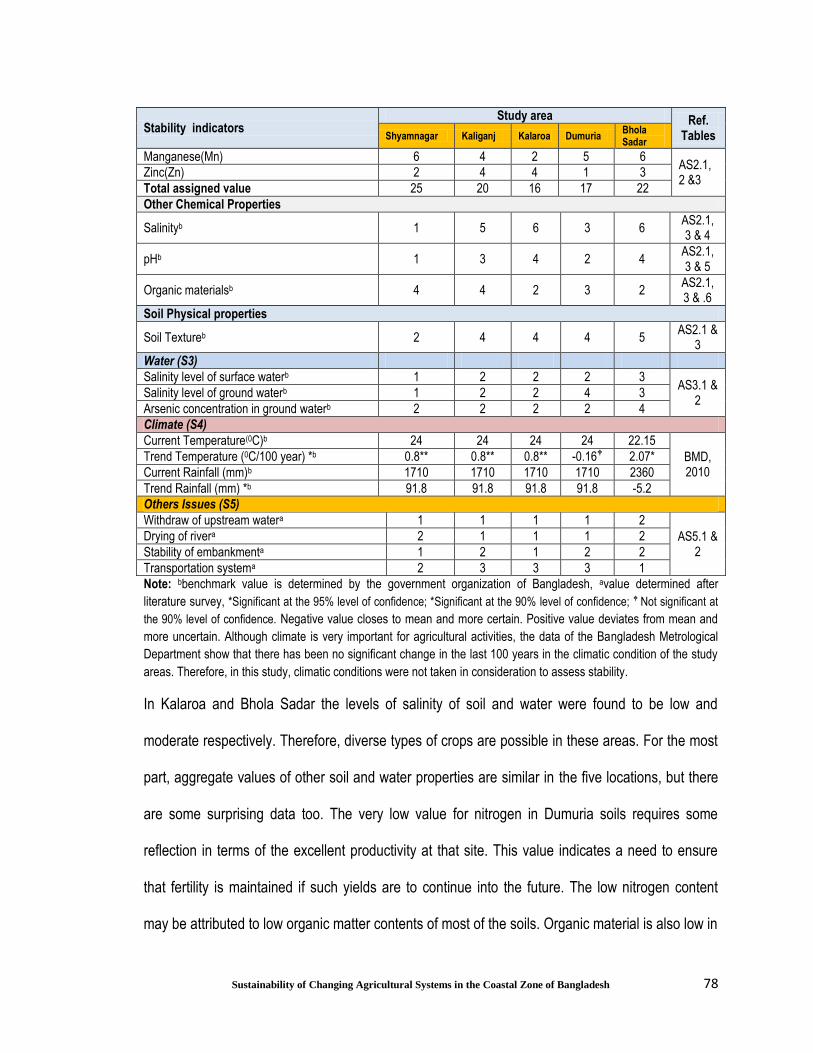
78
Sustainability of Changing Agricultural Systems in the Coastal Zone of Bangladesh
Stability indicators Study area Ref.
Tables Shyamnagar Kaliganj Kalaroa Dumuria Bhola Sadar
Manganese(Mn) 6 4 2 5 6 AS2.1, 2 &3
Zinc(Zn) 2 4 4 1 3
Total assigned value 25 20 16 17 22
Other Chemical Properties
Salinityb 1 5 6 3 6 AS2.1, 3 & 4
pHb 1 3 4 2 4 AS2.1, 3 & 5
Organic materialsb 4 4 2 3 2 AS2.1, 3 & .6
Soil Physical properties
Soil Textureb 2 4 4 4 5 AS2.1 &
3
Water (S3)
Salinity level of surface waterb 1 2 2 2 3 AS3.1 &
2 Salinity level of ground waterb 1 2 2 4 3
Arsenic concentration in ground waterb 2 2 2 2 4
Climate (S4)
Current Temperature(0C)b 24 24 24 24 22.15
BMD, 2010
Trend Temperature (0C/100 year) *b 0.8** 0.8** 0.8** -0.16 2.07*
Current Rainfall (mm)b 1710 1710 1710 1710 2360
Trend Rainfall (mm) *b 91.8 91.8 91.8 91.8 -5.2
Others Issues (S5)
Withdraw of upstream watera 1 1 1 1 2
AS5.1 & 2
Drying of rivera 2 1 1 1 2
Stability of embankmenta 1 2 1 2 2
Transportation systema 2 3 3 3 1
Note: bbenchmark value is determined by the government organization of Bangladesh, avalue determined after
literature survey, *Significant at the 95% level of confidence; *Significant at the 90% level of confidence; Not significant at
the 90% level of confidence. Negative value closes to mean and more certain. Positive value deviates from mean and
more uncertain. Although climate is very important for agricultural activities, the data of the Bangladesh Metrological
Department show that there has been no significant change in the last 100 years in the climatic condition of the study
areas. Therefore, in this study, climatic conditions were not taken in consideration to assess stability.
In Kalaroa and Bhola Sadar the levels of salinity of soil and water were found to be low and
moderate respectively. Therefore, diverse types of crops are possible in these areas. For the most
part, aggregate values of other soil and water properties are similar in the five locations, but there
are some surprising data too. The very low value for nitrogen in Dumuria soils requires some
reflection in terms of the excellent productivity at that site. This value indicates a need to ensure
that fertility is maintained if such yields are to continue into the future. The low nitrogen content
may be attributed to low organic matter contents of most of the soils. Organic material is also low in

79
Sustainability of Changing Agricultural Systems in the Coastal Zone of Bangladesh
Kalaroa and Dumuria. This may be a future concern for the stability of the agriculture of these
areas. Organic material is high in Kaliganj.
Soil in Shyamnagar is strongly alkaline and for this, micronutrient deficiencies expected in the
future as alkalinity is a common factor leading to micronutrient deficiencies. This may impact future
crop production in Shyamnagar. Soil pH is moderate to low in other study areas.
The texture of the soil of the study areas varies from clay to clay loam. In Shyamnagar clay soil is
found. In clay soil, land preparation becomes very difficult as, when the soil dries out, deep and
wide cracks develop and the surface soil becomes very hard. This makes tillage very difficult.
Availability of fresh water for irrigation in Kalaroa, Dumuria as well as in Bhola Sadar is important
for ensuring stability of crop production. Due to salinity, the available water of Kaliganj and
Shyamnagar is not favourable for irrigation purposes in dry season. Scarcity of quality irrigation
water during the dry season limits cultivation of crops in these two study areas. Farmers of all the
study areas depend on rain water for agricultural purposes. However farmers reported that
sometimes uncertain rainfall delays sowing/transplanting and sometimes flash floods wash away
the standing crops. During field visits, it was observed that due to heavy rainfall a waterlogged
situation was created in Kalaroa and several farmers reported damage of crops at that time.
Among the study areas, Shyamnagar, Kaliganj and Bhola Sadar are exposed to the sea and are
most susceptible to cyclone events. As a result, occasionally these three areas are affected by
extreme wind and rain, storm surges and tidal salt water. Kalaroa and Dumuria are less exposed to
the sea and are protected to some degree by adjacent lands but still, due to their location in the
coastal area, they too can be affected by such storm activity. Other climate data are obtained on a
regional basis and, for the most part are not very different from site to site.
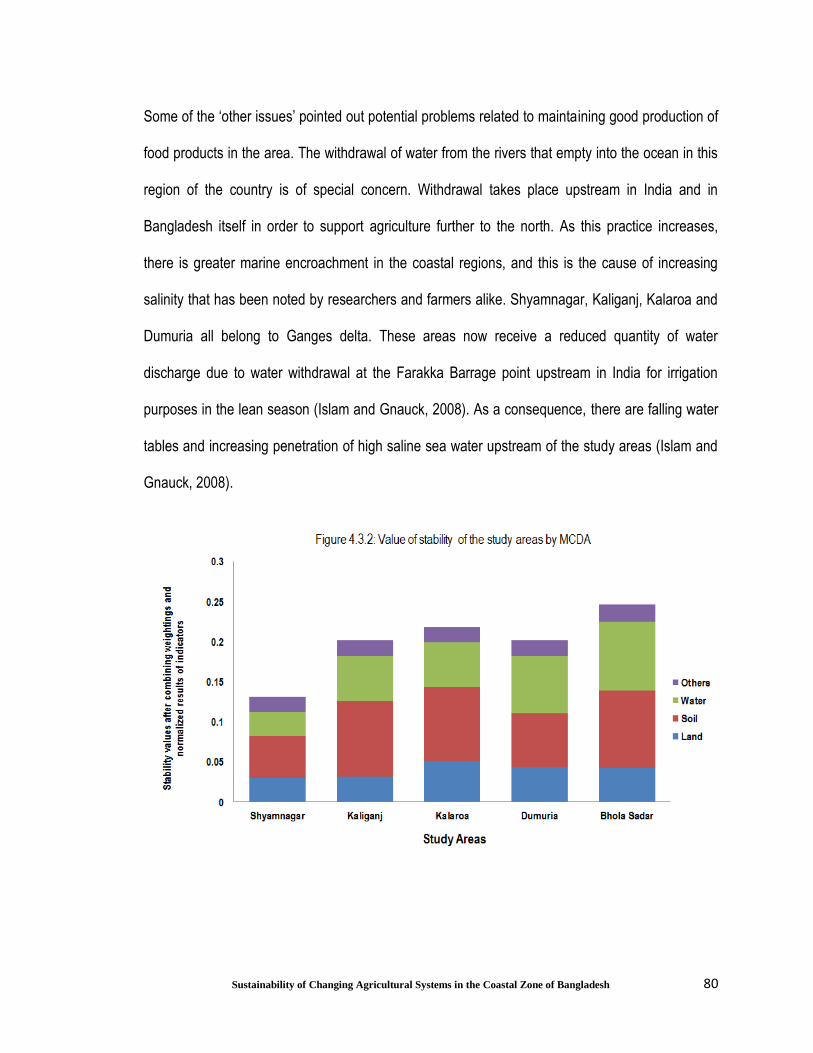
80
Sustainability of Changing Agricultural Systems in the Coastal Zone of Bangladesh
Some of the ‘other issues’ pointed out potential problems related to maintaining good production of
food products in the area. The withdrawal of water from the rivers that empty into the ocean in this
region of the country is of special concern. Withdrawal takes place upstream in India and in
Bangladesh itself in order to support agriculture further to the north. As this practice increases,
there is greater marine encroachment in the coastal regions, and this is the cause of increasing
salinity that has been noted by researchers and farmers alike. Shyamnagar, Kaliganj, Kalaroa and
Dumuria all belong to Ganges delta. These areas now receive a reduced quantity of water
discharge due to water withdrawal at the Farakka Barrage point upstream in India for irrigation
purposes in the lean season (Islam and Gnauck, 2008). As a consequence, there are falling water
tables and increasing penetration of high saline sea water upstream of the study areas (Islam and
Gnauck, 2008).

81
Sustainability of Changing Agricultural Systems in the Coastal Zone of Bangladesh
Table 4.3.2: Stability values after combining weightings and normalized results of indicators
Indicators Study Areas
Shyamnagar Kaliganj Kalaroa Dumuria Bhola Sadar
Land 0.030 0.032 0.051 0.044 0.043
Soil 0.052 0.094 0.092 0.067 0.096
Water 0.030 0.056 0.056 0.071 0.086
Others 0.019 0.020 0.019 0.020 0.021
Overall 0.132 0.201 0.218 0.202 0.247
Source: Score calculated by Web-HIPRE, 2012.
Combining all indicators and their weighting in MCDA analysis, the stability score is highest for
Bhola Sadar followed by Kalaroa (Figure 4.3.2 and Table 4.3.2). The greatest concerns and the
greatest variability centre around the water supplies. Although Bhola Sadar is exposed to the sea
and cyclones, its geographical location in the freshwater estuary and the fact that it is in a
deposition zone where fertile sediment makes up the soil base helps it to score high in many
stability indicators. On the other hand, the score for stability is very low in Shyamnagar, an area
which is affected by salinity and exposed to sea and cyclone. This affects many elements of the of
stability indicators. Stability scores are moderate in other three study areas.
4.3.3 Efficiency
The processes of crop production require a range of inputs, and efficiency is the measure of the
extent to which those inputs enhance farm productivity. The agricultural system can be deemed to
be highly efficient where a small supply of inputs results in excellent productivity. Inputs of many
kinds work together in crop production. Inputs can be in the form of natural, human, social, physical
and financial capital, and achieving efficiency as a component of agricultural sustainability involves
consideration of all these inputs.
Efficiency of agriculture can be measured by different indicators, but the indicators used here are
limited to those related to financial and physical capital. Multiple indicators were considered in
82
Sustainability of Changing Agricultural Systems in the Coastal Zone of Bangladesh
studying the five areas because of the need to examine the role of various inputs, especially non-
renewable ones, in both energy and monetary terms. Energy is a comprehensive term, especially
important in food production, in that the embodied energy of inputs (energy required to produce
these inputs) can be compared with the caloric value of the food produced. The importance of
monetary efficiency to farmers needs no further explanation.
As in the productivity category, both efficiency in growing rice (the principal crop), and efficiency for
total food production in the agro-ecosystem were measured. In the case of rice, hectare wise
monetary efficiency, signifying the income capability in growing a given area of the crop for one
year, and overall energy efficiency to measure the output vs. input energy were both considered to
be important from the perspectives of the farmers. Considering the agro-ecosystem as a whole,
measures of monetary and energy efficiency were used along with an indicator for non-renewable
energy efficiency. While there is considerable overlap in what is being measured through each of
the five efficiency indicators, there are also unique aspects to each one. Weighting factors were
again set taking into account the extent of the overlap. Values for efficiency indicators are
summarized in Table 2.8.
The relation between agriculture and energy is very close. Agriculture itself is both an energy
consumer and an energy supplier in the form of bio-energy. Natural energy inputs like sunlight and
rain are the most basic requirements for agriculture, while human-provided energy like labour,
seeds, agrochemicals, machinery are used for essential purposes of land preparation, irrigation,
harvest, post-harvest processing, transportation of agricultural inputs and outputs.
Among the performances of energy efficiency for rice cultivation in the study areas, Dumuria
stands out as being very good in comparison to other study areas. It was shown previously that
yields of rice were highest in this area. After Dumuria, the efficiency of rice production was found to
83
Sustainability of Changing Agricultural Systems in the Coastal Zone of Bangladesh
be almost the same in the crop-diverse agricultural systems of Kalaroa and Bhola Sadar. Energy
efficiency is low in bagda shrimp-dominated Shyamnagar and Kaliganj.
The energy efficiencies of the total agro-ecosystems of Kalaroa, Dumuria and Bhola Sadar are
very similar - one of the benefits of the diversity in these three areas. As expected, the energy
efficiency is very low in less diverse agro-ecosystem of Shyamnagar and Kaliganj. It would appear
that energy inputs into marine production do not achieve a good return in terms of food energy,
something also reflected in the poor yields of bagda at these two sites. For example, overall
aquatic energy efficiency of Shyamnagar and Kaliganj are 0.11 and 0.10 while for rice in the same
locations, energy efficiency was about 4.7. In Shyamnagar 9.71E+10 (j/kg) energy output is
produced after giving 9.1672E+11 (j/kg) energy input. The pattern is similar in the case of non-
renewable energy efficiency.
The three most favourable measures for monetary efficiency in rice production were found in
Dumuria followed by Kalaroa and Kaliganj. To a large extent, these values track the values of
productivity (Table P1) modified somewhat by the price of rice (Table E1.1 in Appendix). The price
of the inputs like fertilizer, pesticides, seeds and labour are more or less the same in all the study
areas. Per hectare wise monetary efficiency of rice is low in Shyamnagar and Bhola Sadar. In
Shyamnagar, the price of rice is good but productivity is very low. As noted earlier, the price of the
rice is very low in Bhola Sadar.
In considering the monetary efficiency of the agro-ecosystem as a whole, there was a large range
of values, with Dumuria again standing out as most efficient. The very low values, especially for
Shyamnagar are indicative of large money expenditures giving only limited gain to the farmers.
This was widely recognized by the farmers in that area. One frustrated bagda farmer Bashanta
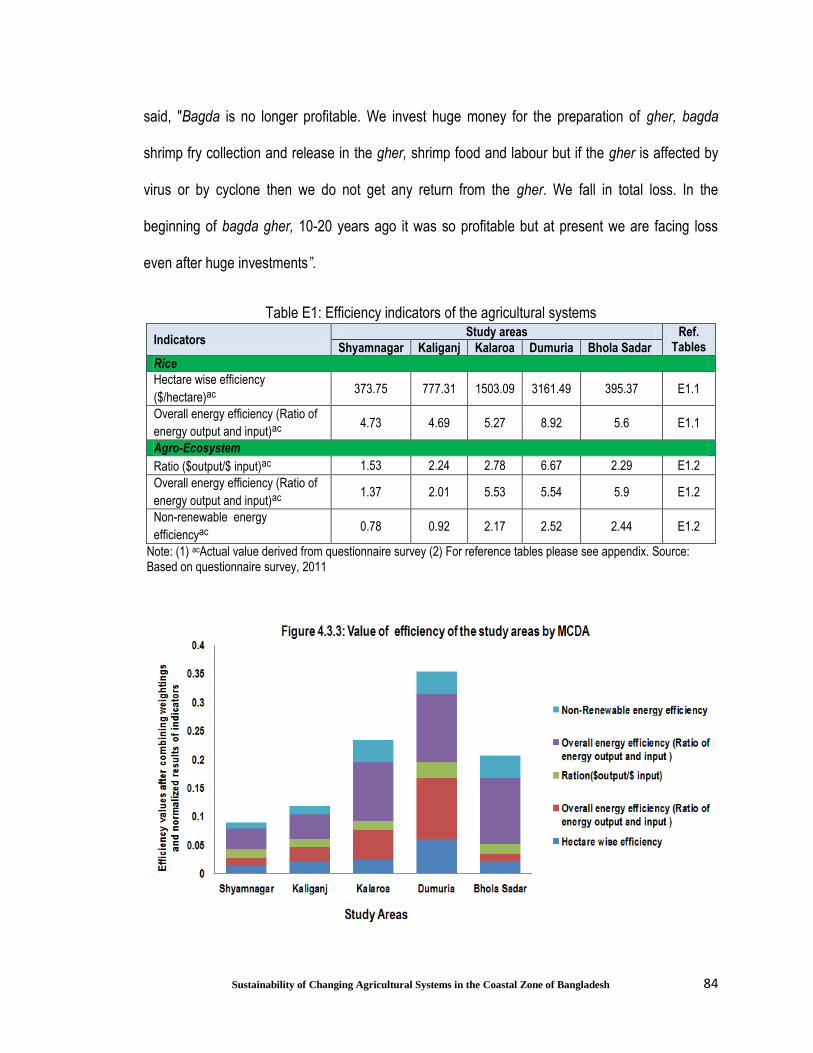
84
Sustainability of Changing Agricultural Systems in the Coastal Zone of Bangladesh
said, "Bagda is no longer profitable. We invest huge money for the preparation of gher, bagda
shrimp fry collection and release in the gher, shrimp food and labour but if the gher is affected by
virus or by cyclone then we do not get any return from the gher. We fall in total loss. In the
beginning of bagda gher, 10-20 years ago it was so profitable but at present we are facing loss
even after huge investments”.
Table E1: Efficiency indicators of the agricultural systems
Indicators Study areas Ref.
Tables Shyamnagar Kaliganj Kalaroa Dumuria Bhola Sadar
Rice
Hectare wise efficiency
($/hectare)ac 373.75 777.31 1503.09 3161.49 395.37 E1.1
Overall energy efficiency (Ratio of
energy output and input)ac 4.73 4.69 5.27 8.92 5.6 E1.1
Agro-Ecosystem
Ratio ($output/$ input)ac 1.53 2.24 2.78 6.67 2.29 E1.2
Overall energy efficiency (Ratio of
energy output and input)ac 1.37 2.01 5.53 5.54 5.9 E1.2
Non-renewable energy
efficiencyac 0.78 0.92 2.17 2.52 2.44 E1.2
Note: (1) acActual value derived from questionnaire survey (2) For reference tables please see appendix. Source: Based on questionnaire survey, 2011

85
Sustainability of Changing Agricultural Systems in the Coastal Zone of Bangladesh
Table 4.3.3: Efficiency values after combining weightings and normalized results of indicators
Indicators Study Areas
Shyamnagar Kaliganj Kalaroa Dumuria Bhola Sadar Rice Hectare wise efficiency 0.014 0.020 0.025 0.060 0.021 Overall energy efficiency (Ratio of energy output and input )
0.013 0.026 0.051 0.107 0.013
Agro-Ecosystem Ration($output/$ input) 0.015 0.014 0.016 0.027 0.017 Overall energy efficiency (Ratio of energy output and input )
0.037 0.044 0.103 0.120 0.116
Non-Renewable energy efficiency 0.010 0.014 0.039 0.039 0.039
Overall 0.087 0.119 0.234 0.353 0.206 Source: Score calculation by Web-HIPRE, 2012.
Combining all indicators and their weighting in MCDA analysis, as expected the efficiency score is
highest in Dumuria (Figure 4.3.3 and Table 4.3.3). Kalaroa and Bhola Sadar had intermediate
values and Shyamnagar and Kaliganj showed consistently poor levels of efficiency.
4.3.4 Durability
Durability is defined as the ability of the agricultural system to resist stress while maintaining a
good level of productivity (vanLoon et al., 2005). In some cases durability issues may overlap with
issues of stability. Stability refers to long term factors upon which agriculture depends. In contrast,
durability considers maintenance of productivity over a single season without the intervention of
synthetic and high energy inputs, in the face of one or more imposed stresses. Ability to withstand
economic stresses is also a durability issue. Irrigation is an example of a potential overlap of issues
describing stability and durability. When productive stability is maintained by having an assured
water supply, crop management systems are developed that rely on the continued availability of
the irrigation resource. However, if the water supply becomes degraded or unavailable, the
unmodified methods of crop production may become vulnerable to water stresses. Because of
these connections, it is important that indicators that fall within both stability and durability

86
Sustainability of Changing Agricultural Systems in the Coastal Zone of Bangladesh
categories be carefully considered. In this study, indicators that examine agricultural management
to cope with stresses like pests, water and economic issues, and agricultural knowledge support
were selected to measure durability (Table D1).
In the case of pest stress, a crop system is considered to be durable when it is grown successfully
with minimal assistance from chemical protection methods. On the other hand, a low indicator
value is indicative of extensive spraying. Shyamnagar had the lowest value as among farmers of
this study area 83% make use of chemicals in control of pests in rice. In contrast, in Bhola Sadar
65% farmers grow crops without any pesticide, relying instead on nature to control pests. In the
integrated agricultural system of Dumuria, 55% farmers relay on the natural system for pest
control. Many farmers in this upazila spoke of the value of using an integrated pest management
system in growing rice, vegetables and fish. In Kalaroa and Kaliganj, 42% of farmers depend on
the natural system to control pests. Where chemicals were employed to control particularly insects
when growing rice, extensive spraying may be required. During the FCDs, the farmers of the study
areas informed that on average, spraying three times is required during a single rice season. This
means that in places where three crops are grown in a year, pesticide use can be quite extensive.
The greater assurance of availability of water at two critical stages in rice growth - the transplanting
and flowering stages - in Shyamnagar and Kaliganj gave these two sites a higher indicator value
than in the other three areas. According to many farmers, Shyamnagar and Kaliganj nearly always
get rain water during transplanting and flowering stage of rice. On the other hand, farmers in the
other three areas complained about often not getting enough water during these times. In Bhola
Sadar, farmers reported that they sometimes got excess water during rice transplanting and
flowering stages which is also a problem for the crops. Throughout the study areas, rainfall occurs
87
Sustainability of Changing Agricultural Systems in the Coastal Zone of Bangladesh
almost at the same time but due to differences in the time of cultivation water availability at the
transplanting and flowering stage may vary. Furthermore, differences were found in the
accessibility to supplemental fresh water irrigation from rivers and ponds.
The scores related to availability of seed through proper storage or through the market are almost the same
in all study areas. Farmers follow both traditional and improved methods to preserve sun-dried seeds across
the study areas. In traditional methods, farmers keep seed in mud vessels covering the mouth loosely with a
clay disc or other means. In improved methods, farmers keep their seeds in polythene bags or plastic or
metal vessels, ensuring that the mouth is properly sealed. Availability of seeds during the cultivation period
is very important for the production of crops. Almost every farmer expressed that the availability of seeds
was adequate, either their own or through the market or government agencies.
To measure durability in the face of economic stress, we considered the value of product prices,
availability of markets, livelihood diversification and years of economic hardship. Stress was found
to be lowest (highest score) in Shyamnagar. Among respondents, 84% are satisfied with the
agricultural product prices, in large part because of the demand and good prices for shrimp and
fish in national and international markets. In addition to growing crops and shrimp in Shyamnagar,
farmers are involved in diverse ancillary activities, like shrimp selling, transportation, shop keeping
and labour, much associated with the shrimp industry. In the case of Kaliganj, Kalaroa and
Dumuria, mixed response values were observed regarding economic stress. As a whole, the
values of product prices are similar in these three upazilas. Some farmers in these areas opined
that they got a low price for rice, vegetables and other products due to traders control over market.
According to their opinion, the government does not have sufficiently strong mechanisms to control
the markets. However, shrimp and prawn of Kaliganj and Dumuria are in high demand in national
and international markets and fetch a good price. To some extent, farmers of Kaliganj, Kalaroa and
88
Sustainability of Changing Agricultural Systems in the Coastal Zone of Bangladesh
Dumuria are also involved in other economic activities apart from agriculture. The score for
economic stress is lowest in Bhola Sadar. The upazila agricultural officer of Bhola Sadar said,
“Being isolated from the main transport network the framers of Bhola Sadr cannot market their
products properly, and as a result, they always get less price from the traders”. Economic diversity
is good among the respondents of the Bhola Sadar as the farmers also generate extra income to
sustain their economic condition through shop keeping, labour, and transport. As expected,
however, farmers in this remote area still suffer from some measure of economic hardship. In focus
group discussions, farmers expressed that they suffered economic hardship for at least 4 years out
of the last ten years. The values of durability are relative and even in areas that have high values;
the majority of respondents encounter significant economic challenges.
The ability to cope with stress is strengthened when farmers have access to good sources of
information and advice through training or opportunities to speak to knowledgeable persons.
Among study areas, the score for agricultural knowledge was found to be quite variable and was
highest in Dumuria and lowest in Bhola Sadar. In Dumuria, the greatest percentages (23%) of
farmers have received agricultural training. This is because some farmers want to improve their
integrated agricultural system through training provided by the upazila agricultural office. In
Kalaroa, surprisingly, the lowest percentage (3%) of farmers received agricultural training. Some
farmers in Kaliganj and Shyamnagar take agricultural training on how to grow crops in salinity
effects fields. It appears that especially in Kalaroa and Bhola, farmers rely on trial and error
methods to deal with problems and to improve their agriculture. Across study areas, only 4% to
12% of farmers take advice from block supervisor - a government employee who promotes
agricultural extension in villages, for agricultural activities. Seeking advice from this official is not
very common; instead most farmers rely on improving their agriculture by trial and error methods or
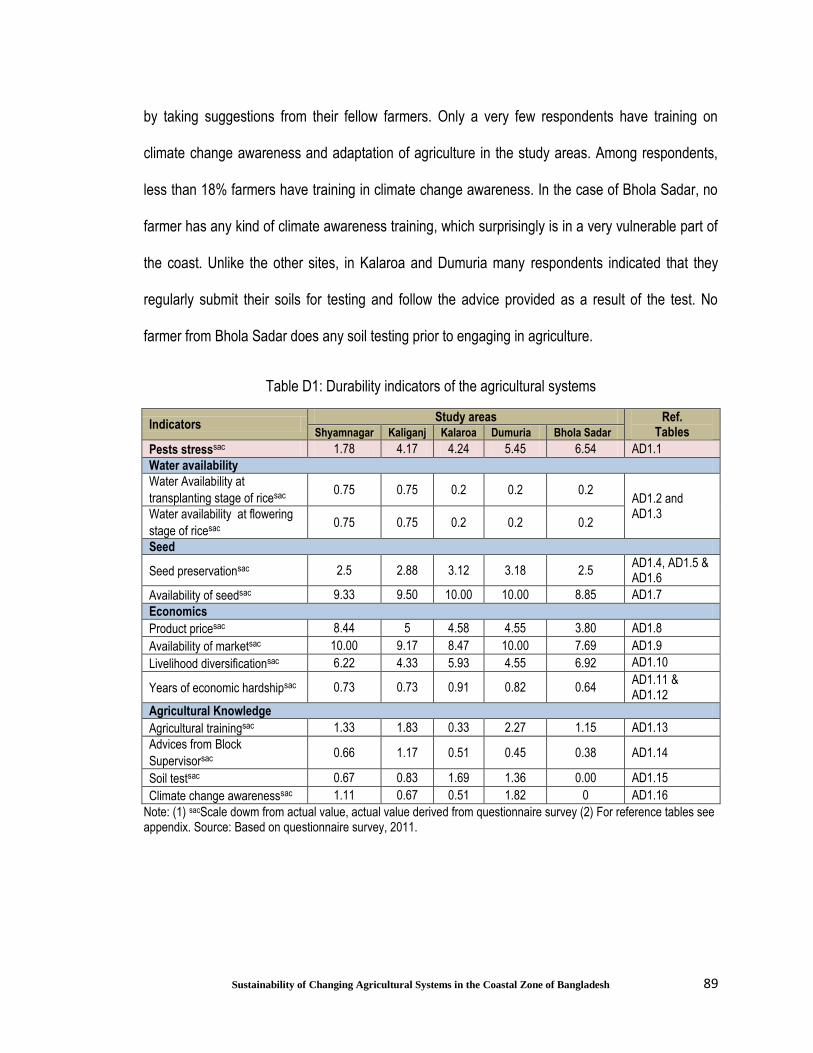
89
Sustainability of Changing Agricultural Systems in the Coastal Zone of Bangladesh
by taking suggestions from their fellow farmers. Only a very few respondents have training on
climate change awareness and adaptation of agriculture in the study areas. Among respondents,
less than 18% farmers have training in climate change awareness. In the case of Bhola Sadar, no
farmer has any kind of climate awareness training, which surprisingly is in a very vulnerable part of
the coast. Unlike the other sites, in Kalaroa and Dumuria many respondents indicated that they
regularly submit their soils for testing and follow the advice provided as a result of the test. No
farmer from Bhola Sadar does any soil testing prior to engaging in agriculture.
Table D1: Durability indicators of the agricultural systems
Indicators Study areas Ref.
Tables Shyamnagar Kaliganj Kalaroa Dumuria Bhola Sadar
Pests stresssac 1.78 4.17 4.24 5.45 6.54 AD1.1
Water availability
Water Availability at
transplanting stage of ricesac 0.75 0.75 0.2 0.2 0.2
AD1.2 and AD1.3 Water availability at flowering
stage of ricesac 0.75 0.75 0.2 0.2 0.2
Seed
Seed preservationsac 2.5 2.88 3.12 3.18 2.5 AD1.4, AD1.5 & AD1.6
Availability of seedsac 9.33 9.50 10.00 10.00 8.85 AD1.7
Economics
Product pricesac 8.44 5 4.58 4.55 3.80 AD1.8
Availability of marketsac 10.00 9.17 8.47 10.00 7.69 AD1.9
Livelihood diversificationsac 6.22 4.33 5.93 4.55 6.92 AD1.10
Years of economic hardshipsac 0.73 0.73 0.91 0.82 0.64 AD1.11 & AD1.12
Agricultural Knowledge
Agricultural trainingsac 1.33 1.83 0.33 2.27 1.15 AD1.13
Advices from Block
Supervisorsac 0.66 1.17 0.51 0.45 0.38 AD1.14
Soil testsac 0.67 0.83 1.69 1.36 0.00 AD1.15
Climate change awarenesssac 1.11 0.67 0.51 1.82 0 AD1.16
Note: (1) sacScale dowm from actual value, actual value derived from questionnaire survey (2) For reference tables see appendix. Source: Based on questionnaire survey, 2011.
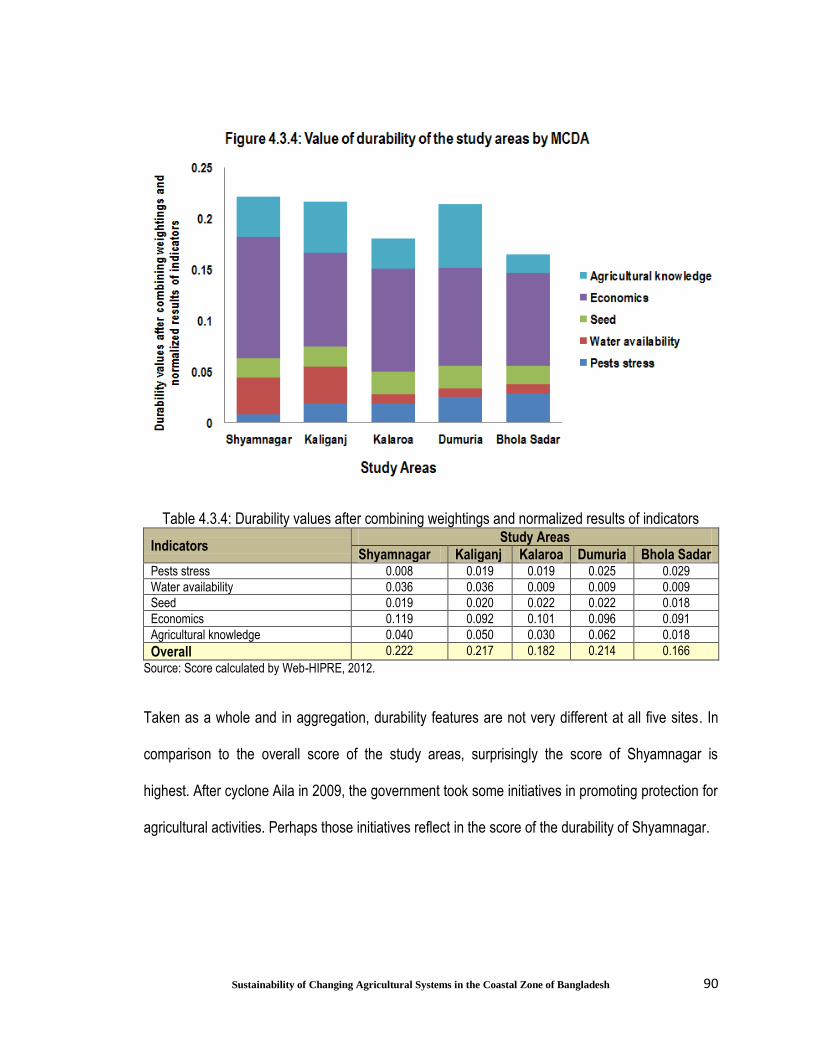
90
Sustainability of Changing Agricultural Systems in the Coastal Zone of Bangladesh
Table 4.3.4: Durability values after combining weightings and normalized results of indicators
Indicators Study Areas
Shyamnagar Kaliganj Kalaroa Dumuria Bhola Sadar Pests stress 0.008 0.019 0.019 0.025 0.029
Water availability 0.036 0.036 0.009 0.009 0.009
Seed 0.019 0.020 0.022 0.022 0.018
Economics 0.119 0.092 0.101 0.096 0.091
Agricultural knowledge 0.040 0.050 0.030 0.062 0.018
Overall 0.222 0.217 0.182 0.214 0.166
Source: Score calculated by Web-HIPRE, 2012.
Taken as a whole and in aggregation, durability features are not very different at all five sites. In
comparison to the overall score of the study areas, surprisingly the score of Shyamnagar is
highest. After cyclone Aila in 2009, the government took some initiatives in promoting protection for
agricultural activities. Perhaps those initiatives reflect in the score of the durability of Shyamnagar.

91
Sustainability of Changing Agricultural Systems in the Coastal Zone of Bangladesh
4.3.5 Compatibility
In a broad sense, compatibility refers to the ability of an agricultural system to fit in with the
biogeophysical, human and socio-cultural surroundings in which the system is placed (vanLoon et
al., 2005). Over time, depending on fundamental biogeochemistry and climatic features, there is
mutual adjustment between the agro-ecosystem and the surroundings including land, living plants,
animals and microorganisms. Human society depends on agriculture and human and agricultural
systems are always intertwined, with each influencing the other.
Agriculture carries out many activities in natural settings for the well-being of humans but, at the
same time, these activities can be a cause of environmental problems, such as water
contamination, loss of biodiversity, soil erosion or other types of destruction in a healthy
ecosystem. Therefore, in a sustainable agricultural system it is expected that agricultural activities
will cause minimal harm but rather, provide widespread benefits for the well-being of both the
human and the natural environment.
In this study, the compatibility indicators were categorized into human and biogeophysical types.
Among human indicators, the quality of water available for domestic use was considered to be very
important. There are many problems with water that is used for drinking or other domestic
purposes in Shyamnagar .This was evidenced by the many drinking water related illnesses like
diarrhoea and dysentery because families in this area depend on open ponds for drinking water.
This condition exists because the installed tube-wells do not lift fresh water due to high salinity
level in the ground water aquifer. Pond water is also contaminated. With increase of bagda
cultivation, the fresh water ponds have also become more saline due to leaching from adjacent salt
water ghers. Furthermore, in the recent 2009 storm surge over Shyamnagar additional saline water

92
Sustainability of Changing Agricultural Systems in the Coastal Zone of Bangladesh
was transported into the drinking water ponds; they were also contaminated due to human and
animal fecal matter. During the survey and focus group discussions, farmers pointed out that no
initiatives had subsequently been taken to make the pond water safe for drinking, resulting in a
persistent drinking water crisis. Having no other options, many farmers continue to use
contaminated water and face different kinds of water-related illnesses. Some respondents in
Shyamnagar buy drinking water from water suppliers who collect safe drinking water from other
upazilas. Some NGOs also help to supply safe drinking water in this study area. They bring safe
drinking water by trucks or vans and distribute it under community management (Picture 4.4.5).
Although some farmers obtain safe drinking water in this way, they continue to cook and wash their
dishes using pond water. As a result, they are always at risk of contracting water-related illnesses.
In Kaliganj also, massive shrimp cultivation is taking place but this upazila is more remote from the
ocean and there are some fresh water aquifers so that farmers can draw fresh drinking water from
the ground through tube wells. However, the situation of drinking water in Kaliganj remains
unsatisfactory in homesteads that are surrounded by ghers. In contrast to Shyamnagar and
Kaliganj, the situation of illness related to drinking water is better in Kalaroa and Bhola Sadar, and
in Dumuria, no respondent reported any illness related to drinking water.
Even in areas where the drinking water does not cause acute illnesses, there remains the problem
of arsenic contamination and consequent poisoning. According to the drinking water standard data
provided by UNICEF and BBS, 2011, the presence of arsenic is very high in the ground water of
Dumuria. Farmers of the area are aware of this development but poisoning is very slow and often
not visible, leading to little or no concern about it. During the field visits, it was observed that the
local administration had declared some tubewells to be arsenic free. In most cases, members of
respondent’s’ household collect drinking water from the safe tube wells but use potentially

93
Sustainability of Changing Agricultural Systems in the Coastal Zone of Bangladesh
contaminated tube well water for other purposes – bathing, washing clothes etc. In the long run,
however, there could be a serious problem for the Dumuria agricultural system if arsenic moves
into food-stuffs and affects other parts of the agro-ecosystem. The arsenic concentration in drinking
water is higher in Kalaroa and Bhola Sadar upazilas but is lower in Shyamnagar and Kaliganj study
areas.
The biophysical indicators focus on aspects of biodiversity. As expected, the overall biodiversity
conditions are good in Kalaroa, Bhola Sadar and Dumuria (Picture 4.4.5) and poor in Shyamnagar
and Kaliganj. The trend is accurately reflected in both the crop richness and in the percentage of
non-crop areas. The condition of ecosystem services like crop production, forest production,
preserving habitats and biodiversity, water quality regulation, carbon sequestration and regional
climate and air quality regulation are also lowest in the agro-ecosystem of Shyamnagar and
Kaliganj. According to respondents, the overall environmental condition is well known to be poor in
Shyamnagar and Kaliganj. For example, in these two areas, during shrimp fry collection from the
natural habitats (Picture 4.4.5) the transporting and sorting process results in a very large wastage
of fry of both penaeid shrimps and other commercially important species, including fish. During the
field visit it was observed that when the fry collectors use mosquito nets to catch shrimp fry, many
other kinds of fry of aquatic species are killed in the process. Later when the fry are separated from
other species, these species are simply discarded. This has become a serious biodiversity concern
for the water bodies in Shyamnagar and Kaliganj. In almost every case according to the local
fishermen these days you get hardly any fish in the river. Many farmers also said that due to bagda
shrimp cultivation crop diversification has been severely undermined. Because of bagda cultivation
they can no longer grow non-rice crops, vegetables and fodder for livestock. In some places even
rice, which has some tolerance to salinity, cannot be grown. According to the farmers and the

94
Sustainability of Changing Agricultural Systems in the Coastal Zone of Bangladesh
upazila officer, the overall environmental conditions of Shyamnagar became even worse after the
2009 cyclone.
During the questionnaire survey in a village in Shyamnagar, one farmer named Farid Gazi pointed
toward his gher said “in this land my family grew rice for years before bagda cultivation. Today,
there is nothing but salt water. After bagda cultivation for twenty years nothing else grows here,
even though we want to start rice again”. Another farmer named Rabi said "we are not interested in
bagda cultivation anymore. We used to produce 10 to 15 maunds of rice per bigha before the
bagda cultivation. Now it has come down to less than 5 maunds per bigha,”
Table C1: Compatibility indicators of the agricultural systems
Compatibility Indicators Study Areas Ref.
Tables Shyamnagar Kaliganj Kalaroa Dumuria Bhola Sadar
Human
Illness from watersac 0.00 8 9 10 9 C1.1
Protected water supplysac 5 10 10 10 10 C1.1
Arsenic concentration in drinking
water supplysac 3 3 10 0 10
C1.2 & C1.3
Biophysical
Overall biodiversity indicatorsac 1.75 2.76 6.13 4.4 4.65 C1.4
Percentage of non-crop areasac 7.54 6.48 23.01 15.73 18.68 C1.4
Condition of ecosystem
servicessac 1 1.5 2.5 3 3
C1.5
Crop richnesssac 2 6 16 10 17 C1.6
Overall environmental
conditionssac 1 1.5 2.5 3 3
C1.7
Note: (1) sacScale dowm from actual value derived from questionnaire survey (2) For reference tables see appendix. Source: Based on questionnaire survey, 2011.

95
Sustainability of Changing Agricultural Systems in the Coastal Zone of Bangladesh
Table 4.3.5: Compatibility values after combining weightings and normalized results of indicators
Indicators Study Areas
Shyamnagar Kaliganj Kalaroa Dumuria Bhola Sadar Human Illness from drinking water 0.000 0.056 0.063 0.069 0.063 Protected water supply 0.017 0.033 0.033 0.033 0.033 Arsenic concentration in drinking water supply
0.012 0.012 0.038 0.000 0.038
Biophysical Surroundings Overall biodiversity indicator 0.013 0.021 0.047 0.033 0.035 Percentage of non-crop area 0.011 0.009 0.032 0.022 0.026 Condition of ecosystem services 0.009 0.014 0.023 0.027 0.027 Crop Richness 0.004 0.012 0.031 0.020 0.033 Overall environmental conditions 0.005 0.007 0.011 0.014 0.014 Overall 0.070 0.163 0.279 0.219 0.270
Source: Score calculated by Web-HIPRE, 2012.

96
Sustainability of Changing Agricultural Systems in the Coastal Zone of Bangladesh
Combining all indicators and their weighting in MCDA analysis, the compatibility score is the
relatively high in Kalaroa, Bhola Sadar and Dumuria (Figure 4.3.5 and Table 4.3.5). Kaliganj
showed moderate score whereas Shyamnagar showed an extremely poor score in compatibility.
Picture 4.4:5: (A) Supply of drinking water by truck in Shyamnagar, (B) Collection of shrimp fry form natural habitat, (C) Homestead of Dumuria with rich biodiversity and (D) Rich biodiversity of agricultural fields and homesteads of Bhola Sadar.
4.3.6 Equity
All aspects of agricultural activities must come together to support farmers for an adequate and
comfortable standard of living. And conversely, social welfare of the community within an agro-
ecosystem is extremely important for the sustainability of agriculture itself. In this study, we
A B
C D
97
Sustainability of Changing Agricultural Systems in the Coastal Zone of Bangladesh
measured social welfare as “equity” where the term equity is used to signify a balanced distribution
of the benefits of agriculture to all the members of the community.
An equitable agro-ecosystem is one that would provide employment for all healthy adults and
would not create significant disparities among farmers. There should be fairness with respect to
males and females of all ages and efficient public services; with the essential ones being services
for education and health. There are many issues to assess in examining the equity in an agro-
ecosystem. In this study, four sets of equity indicators were considered under the general headings
of education, economic conditions, health and decision making (Table 4.3.6).
Among indicators, the value for education was found to be highest in Dumuria where the farmers’
educational status as well as that of their male and female children’s education was good in
comparison with other areas. The people of Dumuria have been exposed to formal education as far
back as the British period. Apart from this, Dumuria upazila is located near the Khulna Division
headquarters and as a result, the farmers’ family members have convenient access to the main
educational facilities of the division. The lowest indicator value for education was in Bhola Sadar
where 50% of respondents are illiterate, and education for children’s education is not well
developed. This area has been deprived of educational facilities in part due to its isolated
geographical location. In spite of government initiatives, the percentage of illiterate male (12.8%)
and female children (9.1%) remains highest in Bhola Sadar among study areas. Note the surprising
feature that the percentage of illiterate male children is slightly greater than that of female children.
The same feature was observed in Kalaroa. It was found that most of the children of landless and
marginal farmers in Bhola Sadar are illiterate because families engaged their male and female

98
Sustainability of Changing Agricultural Systems in the Coastal Zone of Bangladesh
children in economic activities - agricultural activities and also in selling of agricultural products in
the rural market.
Except in Bhola Sadar, in the other study areas the percentage of illiterate children was always
less than 7% .In Dumuria there are no illiterate male or female children. Through the study areas
as a whole, the percentages of illiterate, primary schooling, secondary schooling and tertiary
schooling male children are 5.8%, 42.0%, 26.3% and 25.9% respectively and for female children
4.0%, 32.1%, 22.3% and 19.6%. In all study areas, it was found that the respondents are strongly
supportive of children’s education because of the awareness created by the government, media
and NGOs. The Government of Bangladesh has a strong plan and policy to promote education
among children as part of achieving one of the Millennium Development Goals. Therefore in
general, the education participation rate is quite good among children of the study areas.
Electronic media (TV, satellite and radio) provide informal opportunities to educate the farmers in
various issues. To have access to electronic media, farmers need electricity and within the study
area, Dumuria has the best provision of electrical power. Access to electronic media is also good in
Kaliganj and Kalaroa. Although there is no public electricity supply in Shyamnagar, a large number
of farmers are getting personal use of electronic media through generating electricity by using solar
panels. The access to electronic media is poor in Bhola Sadar where only 38% of families have this
privilege.
Economics-related issues of the study areas were measured in both direct and indirect ways.
Among economic issues, the yearly average agricultural income of farmers is highest in Kaliganj.
Both rice and bagda shrimp are the main crops of this area and in particular, farmers get a good
income from bagda which is a profitable agricultural product in Bangladesh. Like Kaliganj, the
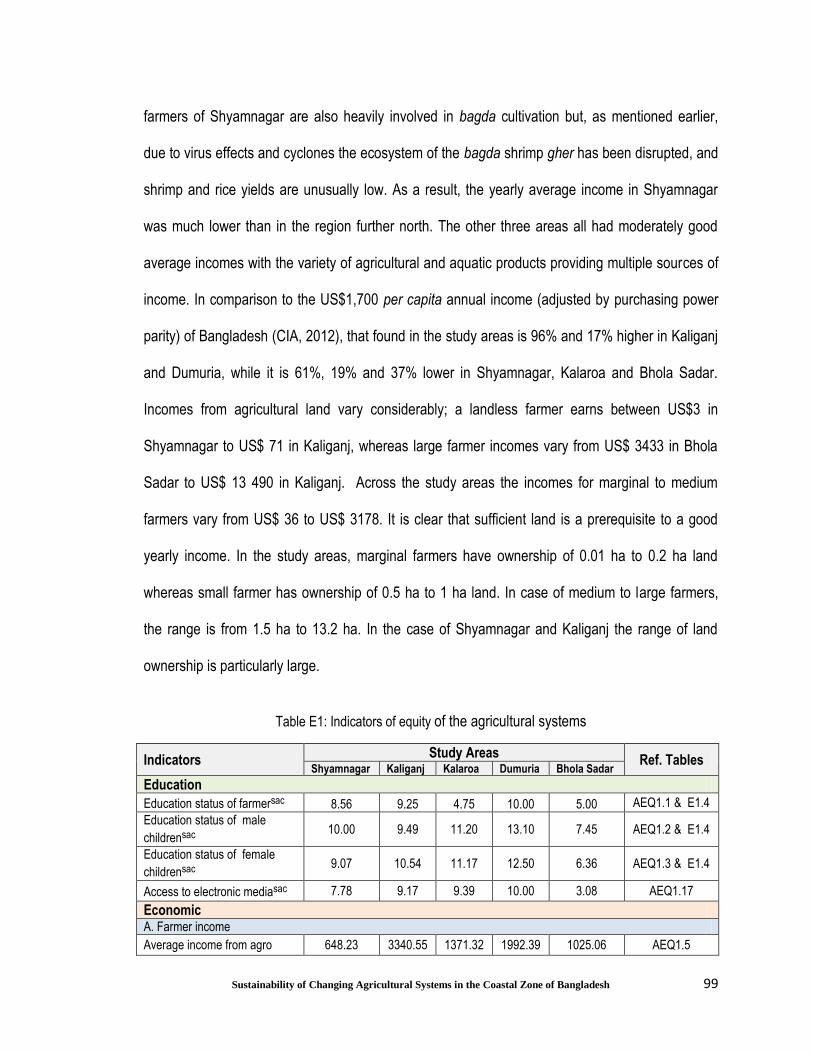
99
Sustainability of Changing Agricultural Systems in the Coastal Zone of Bangladesh
farmers of Shyamnagar are also heavily involved in bagda cultivation but, as mentioned earlier,
due to virus effects and cyclones the ecosystem of the bagda shrimp gher has been disrupted, and
shrimp and rice yields are unusually low. As a result, the yearly average income in Shyamnagar
was much lower than in the region further north. The other three areas all had moderately good
average incomes with the variety of agricultural and aquatic products providing multiple sources of
income. In comparison to the US$1,700 per capita annual income (adjusted by purchasing power
parity) of Bangladesh (CIA, 2012), that found in the study areas is 96% and 17% higher in Kaliganj
and Dumuria, while it is 61%, 19% and 37% lower in Shyamnagar, Kalaroa and Bhola Sadar.
Incomes from agricultural land vary considerably; a landless farmer earns between US$3 in
Shyamnagar to US$ 71 in Kaliganj, whereas large farmer incomes vary from US$ 3433 in Bhola
Sadar to US$ 13 490 in Kaliganj. Across the study areas the incomes for marginal to medium
farmers vary from US$ 36 to US$ 3178. It is clear that sufficient land is a prerequisite to a good
yearly income. In the study areas, marginal farmers have ownership of 0.01 ha to 0.2 ha land
whereas small farmer has ownership of 0.5 ha to 1 ha land. In case of medium to large farmers,
the range is from 1.5 ha to 13.2 ha. In the case of Shyamnagar and Kaliganj the range of land
ownership is particularly large.
Table E1: Indicators of equity of the agricultural systems
Indicators Study Areas
Ref. Tables Shyamnagar Kaliganj Kalaroa Dumuria Bhola Sadar
Education
Education status of farmersac 8.56 9.25 4.75 10.00 5.00 AEQ1.1 & E1.4
Education status of male
childrensac 10.00 9.49 11.20 13.10 7.45 AEQ1.2 & E1.4
Education status of female
childrensac 9.07 10.54 11.17 12.50 6.36 AEQ1.3 & E1.4
Access to electronic mediasac 7.78 9.17 9.39 10.00 3.08 AEQ1.17
Economic A. Farmer income
Average income from agro 648.23 3340.55 1371.32 1992.39 1025.06 AEQ1.5

100
Sustainability of Changing Agricultural Systems in the Coastal Zone of Bangladesh
ecosystem (in $)ac
Average value of the assets of
farm ($)ac 519.89 1253.23 703.99 1130.96 426.76 AEQ1.6
People above extreme poorsb 5.60 5.60 6.20 9.00 7.20 AEQ1.8
B.Labourer income
Average daily wage of farm
labourer (Tk.)ac 100 100 120 135 120 AEQ1.7
Gender-based wage
differentialsac 0.33 0.33 0.5 0.59 0 AEQ1.7
C. Electricity connection in
householdsac 0 7.5 8.5 10 0 AEQ1.14
Health Production of own staple
foodsac 2.00 6.67 6.44 6.36 5.00 AEQ1.9
Average calorie intake by each family member from staple
foodsac
5.49 5.60 6.88 7.36 5.85 AEQ1.10
Settings where medical
treatment takensac 3.51 4.76 4.07 8.14 4.29 AEQ1.11
Toilet facilitiessac 7.69 8.73 7.59 7.41 7.08 AEQ1.12
Cooking facilitiessac 4.01 4.27 3.95 4.00 4.30 AEQ1.13
Gender issue Women participation in the agricultural activities of the
householdsac
3 4 5 6.5 2.5 AEQ1.15
Gender -based governance
differencesac 1.67 1.67 1.67 1.67 1.67 AEQ1.16
Note: (1) acActual value, sbScale down from bench mark value, sacScale dowm from actual value derived from questionnaire survey (2) For reference tables see appendix,(3) US$1=Tk. 75. Source: Based on questionnaire survey, FGD and literature survey, 2011
Another economic issue is average value of farm assets which is highest in Kaliganj and Dumuria
reflecting the higher average yearly income in these areas. Most of the small , medium and large
farmers of these two study areas own a television set, a mobile phone and one or more bicycles
along with agricultural equipment like a water pump and power tiller. Some large and medium
landholding families have a refrigerator as well. In contrast, throughout the study areas, it was
found that most of the landless and marginal farmers had few of these assets. One surprising thing
however, was that almost every farmer family has a mobile phone. Farm assets are limited in both
Bhola Sadar and Shyamnagar although in Shyamnagar some medium and large farmers have TV
101
Sustainability of Changing Agricultural Systems in the Coastal Zone of Bangladesh
and other electronic goods. Some small and marginal farmers informed us that they had owned a
TV before 2009 cyclone, but they lost most of their assets in that event.
The average wage of a farm labourer is highest in Dumuria as there is a demand for labour all year
round due to the wide diversity of agricultural activities there. In Shyamnagar and Kaliganj, a large
number of labourers are required only at the time of preparation of the ghers, an activity that
typically requires about 8 weeks each year. In Kaliganj and Shyamnagar female labourers also
work along with male labourer in rice fields and ghers. In the case of Bhola due to the conservative
nature of society, female labourers are not allowed to work in the fields. Therefore, there is a
shortage of labourers and wages are relatively high. The gender-based wage differential is
significant throughout the five upazilas. In Dumuria and Kaliganj women typically make on average
US$ 1.06 and US$ 0.67 per day compared with men who made US$ 2.13 to US$ 2.0. The average
wage is the same for male (US$2) and female (US$0.67) labours in Shyamnagar and Kaliganj. In
both areas women made only 33% of the daily wage of men. We estimate that most labourers
would be employed for between 90 and 240 days per year and so the total yearly income from
agriculture could be quite low. Throughout Bangladesh people who depend on farm wages are the
most disadvantaged of the employed population.
Measuring the fraction of households with electricity connections was an indirect measure of
economic condition as the pattern of household energy consumption is often an indication of the
stage of welfare. Being located near a large urban area where the Bangladesh electrical system is
well developed, every household of Dumuria is connected by electricity. To provide light in houses
in Shyamnagar and Bhola, most respondents use kerosene hurricane lamps. As noted above, in
Shyamnagar, some medium and large farmers have solar panels to get electricity for their houses.

102
Sustainability of Changing Agricultural Systems in the Coastal Zone of Bangladesh
While electricity connections are good in Kaliganj and Kalaroa, farmers complained of not to getting
a continuous supply of electricity during the day. In those upazilas most of the landless and
marginal farmers do not have any electricity connection in their houses. According to many
farmers, having electricity helps to generate income (water pumps for irrigation), helps in
education, and helps to get better health facilities. The variable extent of household connections to
electricity is clear evidence of regional differences of economic development.
In the case of health, the overall score was relatively good in Dumuria, Kalaroa and Kaliganj and
significantly poorer in the other two places. Most of the small, middle and large farmers in Kaliganj,
Kalaroa, Dumuria and Bhola Sadar were able to produce sufficient staple food on their own farm.
Almost every landless farmer, of course, is required to access rice from the market unless their
wages are paid in part by rice itself. Many marginal and some small farmers also buy staple foods
from the market. Because only a single crop can be grown each year, and the yield is usually
relatively poor, most households in Shyamnagar must also supplement their own supply from the
market. The value of per person average calorie intake from staple food ranged from1540 kcal in
Shyamnagar to 2060 kcal in Dumuria. The Bangladesh Institute of Development Studies/ BIDS, in
2008, shows that the mean total food intake for all ages and sexes of the average Bangladeshi
population is 681 grams. The energy that an individual can derive from this amount of food is
approximately 1900 kcal. In this respect, the energy intake from staple food is above the national
average in Dumuria, Kalaroa and Bhola Sadar. Nevertheless, these energy values indicate that
there could be a substandard level of nutrition in many households, depending on the landholding
size and the composition of the family. Clearly also, there are other aspects of nutrition which are
required for good health.

103
Sustainability of Changing Agricultural Systems in the Coastal Zone of Bangladesh
The respondents of all study areas take medical treatment from a variety of health providers - an
upazila hospital or clinic, a union health centre, a pharmacy or a minimally trained village doctor or
kabiraz (traditional/herbal healers who have a longstanding involvement in rural community). Most
of the respondents from Dumuria expressed that they have convenient access to health care
facilities, being near to a large urban area. As expected, access to good facilities is lowest in
Shyamnagar and Bhola. A large number of respondents of Shyamnagar, Kaliganj, Kalaroa and
Bhola Sadar take treatment from the local pharmacy and village doctors. Like Dumuria, many
respondents of Kaliganj and Kalaroa also have convenient access to upazila health offices but in
Bhola Sadar, a very small number of respondents go to upazila health offices for treatment.
Throughout the study areas, large and medium farmers prefer to visit upazila health offices or
clinics whereas landless to small farmers more frequently choose the local pharmacy, village
doctors or a kabiraz for treatment.
Sanitation is an important public health concern. Most homes had their own toilets and these were
classified as either pucca or semi-pucca. Where the toilet room and slab are made of brick and
concrete it is called a pucca toilet, and where the toilet room walls and the roof are tin or wood, and
the slab is concrete, it is called semi-pucca. Compared to many other low-income countries, these
types of facility are quite good, again due to government initiatives as part of achieving one of the
Millennium Development Goals. In the study areas, 68% to 97% of toilets belong to pucca to semi
pucca categories. In Kaliganj, Kalaroa and Dumuria there are no open toilets. In Shyamnagar, only
one of the respondent’s households used an open toilet whereas two are open in Bhola Sadar. In
all cases, these open toilets belong to landless farmers. Importantly, almost every respondent told
that they use soap and water after returning from the toilet as part of hygienic practices.

104
Sustainability of Changing Agricultural Systems in the Coastal Zone of Bangladesh
As another measure of equity in health terms, cooking facilities were measured, with the highest
value given to LPG and lowest value to firewood and other biomass types. Where various forms of
biomass are used for cooking, women and children are exposed to smoke and this may have
serious health impacts in future. Firewood, leaves and agricultural waste including dried cow dung
were the main sources of household energy for cooking in every part of the study area. Because of
this, the indicator value of cooking facilities tends to be low throughout. Furthermore, because of
using a lot of agricultural waste, the fields are deprived of the natural manures for use as a soil
amendment. It was found that the maximum use of such secondary material occurred in Kalaroa.
Among respondents only in Kaliganj, a small number (6%) of respondents are using liquefied
petroleum gas (LPG) as cooking fuel.
In the case of gender issues, we measured the participation of women in the work force and in
political life within the community. The workforce score is highest in Dumuria. There, the women
participate in a wide range of household agricultural activities like sun-drying the crops, seed
preservation, vegetable gardening, feeding shrimp/fish and preparing fish feed, working in the field,
animal nursing, raising chickens and ducks as well as other general agricultural work. Women of
Kaliganj and Kalaroa also actively participate in household agricultural activities. Participation is
much less in Shyamnagar and Bhola Sadar due to emphasis on shrimp cultivation in Shyamnagar
and to the conservative society in Bhola Sadar and. In these two study areas, women have less
opportunity to be involved in household agricultural activities. However, some women grow
vegetables for family consumption in the homestead area. In shrimp cultivation, shrimp are often
sold from the gher directly to the trader or brought to a market in a nearby town, so women have
less chance to work on agricultural activities. In general, apart from agricultural activities women of
the study areas are also involved in other household work like cooking, clothes and dishes

105
Sustainability of Changing Agricultural Systems in the Coastal Zone of Bangladesh
washing, cleaning household and yard, fuel collection, drinking water collection, sewing and
mending clothes, nursing the sick, child care, .
Women’s participation at the local government level is crucial so that they have a voice in decision
making on issues that affect the community. The Government of Bangladesh ensures women
participation in the Union Parishad (local government or Union Council) by law. The Union
Parishad is the smallest rural administrative and local government unit in the country. A quota
system was introduced in the local government (Union Parishad) elections in 1997. Each Union
Parishad has nine constituencies and one chairperson position open for competition by both men
and women. In addition, each block of three constituencies has one reserved seat for directly
elected women. Thus the reserved ratio is three reserved seats for women for every nine non-
reserved seats – or 25 percent. Among the study areas, it was found that no more than the
minimum 25% representatives within the Union Parishad are from women. No additional elected
woman representative was found in the local government in any of the unions studied.
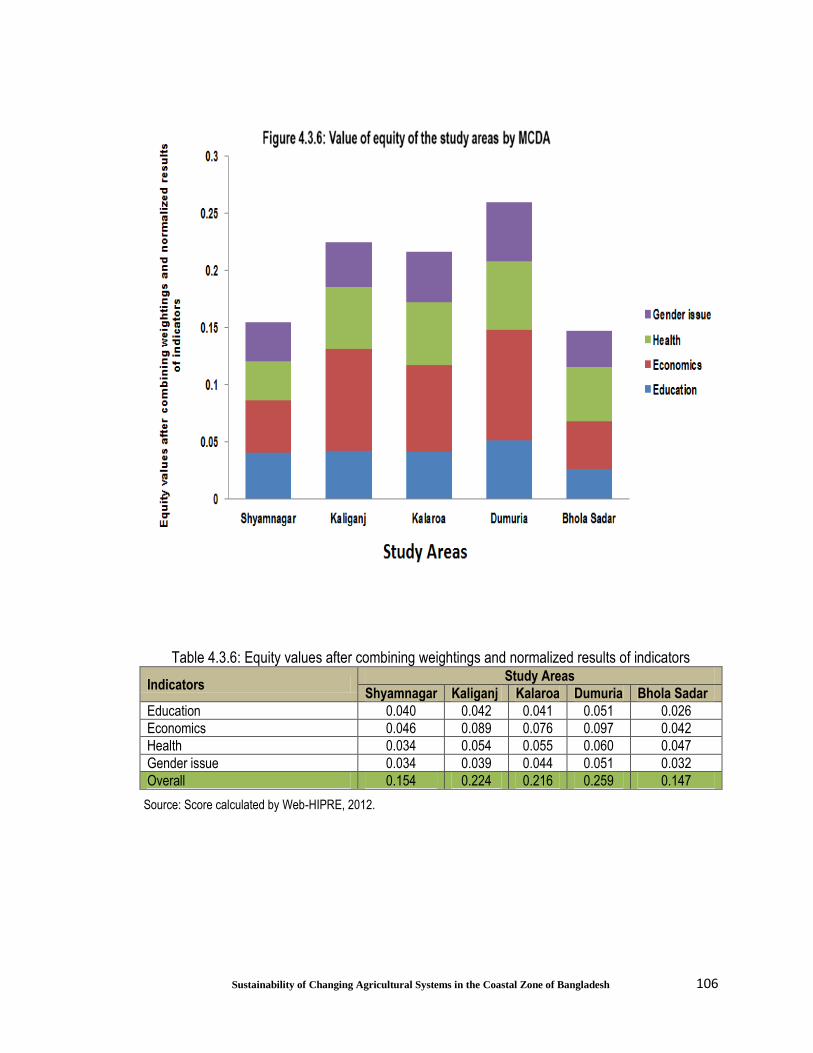
106
Sustainability of Changing Agricultural Systems in the Coastal Zone of Bangladesh
Table 4.3.6: Equity values after combining weightings and normalized results of indicators
Indicators Study Areas
Shyamnagar Kaliganj Kalaroa Dumuria Bhola Sadar
Education 0.040 0.042 0.041 0.051 0.026
Economics 0.046 0.089 0.076 0.097 0.042
Health 0.034 0.054 0.055 0.060 0.047
Gender issue 0.034 0.039 0.044 0.051 0.032
Overall 0.154 0.224 0.216 0.259 0.147
Source: Score calculated by Web-HIPRE, 2012.
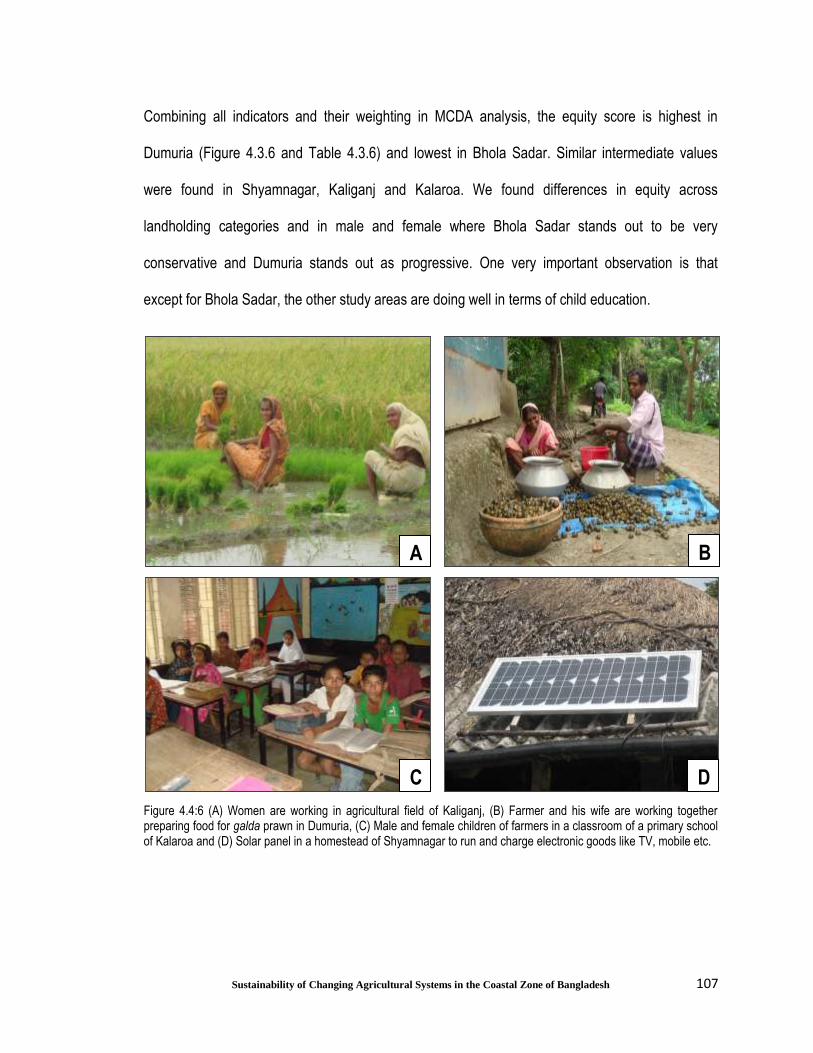
107
Sustainability of Changing Agricultural Systems in the Coastal Zone of Bangladesh
Combining all indicators and their weighting in MCDA analysis, the equity score is highest in
Dumuria (Figure 4.3.6 and Table 4.3.6) and lowest in Bhola Sadar. Similar intermediate values
were found in Shyamnagar, Kaliganj and Kalaroa. We found differences in equity across
landholding categories and in male and female where Bhola Sadar stands out to be very
conservative and Dumuria stands out as progressive. One very important observation is that
except for Bhola Sadar, the other study areas are doing well in terms of child education.
Figure 4.4:6 (A) Women are working in agricultural field of Kaliganj, (B) Farmer and his wife are working together preparing food for galda prawn in Dumuria, (C) Male and female children of farmers in a classroom of a primary school of Kalaroa and (D) Solar panel in a homestead of Shyamnagar to run and charge electronic goods like TV, mobile etc.
A B
C D
108
Sustainability of Changing Agricultural Systems in the Coastal Zone of Bangladesh
4.3.7 Discussion
A quiet agricultural transformation has been taking place in Coastal Bangladesh. In spite of several
visible constraints, agriculture in this part of the country is facing a challenge to reinvent itself. It
has to withstand the competition of national and international economic demands, take into
account global environmental problems and provide food and employment opportunities for the
coastal population. In the coastal areas, agriculture is beginning to change from a largely peasant-
based subsistence activity to a commercial activity which is driven by the farmers themselves and
the government initiatives.
Coastal agriculture has been especially influenced by the establishment of embankments/polders
during the 1960s to the 1980s. Over this time, the resulting new agricultural paradigm has brought
a significant change in the landscape ecology of these areas which include the five upazilas under
study here. Shyamnagar and Kaliganj have observed transformation from a saline water-based rice
cultivation system to mixed bagda shrimp and rice cultivation. Dumuria has experienced
transformation to a rice-, galda prawn- and vegetables-based integrated agricultural system.
Kalaroa and Bhola Sadar are also protected by embankments, but the agriculture of these two
areas has changed much less except for some improvements in traditional agricultural practices.
To assess and draw a broad picture of agricultural sustainability, an interdisciplinary perspective of
sustainable development is necessary. Therefore, the agriculture of these study areas has been
viewed through six categories: productivity, stability, efficiency, durability, compatibility and equity.
For this, initiatives were taken to collect comprehensive data for each category from representative
landholding categories within each of the five upazilas. After surveying the literature, brainstorming
with experts, field observations and data collection, a set of indicators were developed, and they

109
Sustainability of Changing Agricultural Systems in the Coastal Zone of Bangladesh
were estimated for each site. At this stage, the major challenges of the study were selecting
appropriate indicators for each category and identifying proper primary and secondary data for
those indicators. Most of the indicators are relative within the study areas since they are influenced
by site-specific conditions and numerous biological, physical, social and economic factors. A few
indicators like soil properties, salinity level, land types etc. have more broadly-based benchmark
values with which they can be compared. For example, if the soil salinity level is 12-15 dS/m, it is
considered to be a high salinity soil using information developed by the Bangladesh Soil Resource
Development Institute.
After selection of the indicators, a scheme of weightings was developed according to the deemed
importance of the categories and their respective indicators. In the present study, weighting was
assigned by us after discussions with respondents, both farmers and experts. Using the indicator
data and assigned weightings, MCDA (Multi-Criteria Decision Analysis) was used to calculate the
sustainability level within each of the categories. In MCDA, the benchmark value, actual value and
scale-down benchmark or actual values were used. The indicators values were normalized and
inserted in MCDA. For each parameter, the individual values for the five sites were normalized in
the following way: the values were summed and each individual site value was divided by the sum,
giving normalized results on a 0 to 1 scale. The normalized results were then weighted. After
MCDA analysis, scores of the categories were compared among study areas and finally a level of
sustainability for each study area was generated. As with many indicators, there was no
benchmark level of agricultural sustainability at the national level in order to make comparisons
beyond the study area.

110
Sustainability of Changing Agricultural Systems in the Coastal Zone of Bangladesh
When it comes to the possible methods of assessing agricultural sustainability there have been a
large number of approaches, most making use of indicators and often assigning the indicators to
different categories (Dantsis, 2010; Eilers et al. 2010; OECD, 1999; Walker, 2002). While there are
differences in each of the proposed assessments, there are also many commonalities with issues
like biodiversity, soil and water properties, use of chemicals and economic resilience being
measured in various ways (Eilers et al. 2010; OECD, 1999; Walker, 2002). Unlike some studies,
our work considers productivity to be of prime importance, efficiency in resource use is measured
and social issues are considered to be an important aspect of sustainability in the village setting
(vanLoon et al., 2005).
Another challenge in quantifying sustainability is how to aggregate the data values obtained for
different categories. This has been a problem identified in earlier studies, for example in an
evaluation of sustainability in the Tungabhadra region of South India (vanLoon et al., 2005). To
cope with this problem, the study here has shown how MCDA can be a useful tool for aggregating
individual values. The individual results and aggregated summaries provided using MCDA make it
possible to compare the level of sustainability of each study area and assign differences to various
components of sustainability.
Various studies have proposed and discussed methodological approaches regarding assessment
of agricultural sustainability (Binder et al., 2010; Dantsis et al., 2010; Van Cauwenbergh et al.,
2007). These studies showed several advantages, disadvantages and limitations of the agricultural
sustainability assessment. Dantsis et al. in 2010 proposed a MCDA-based methodological
framework for the assessment and comparison of the sustainability of agricultural on a regional
scale in Greece by using easily obtained indicators through an empirical study, utilizing
111
Sustainability of Changing Agricultural Systems in the Coastal Zone of Bangladesh
questionnaires completed during interviews with farm managers. The indicators were analyzed to
evaluate the contribution of different indicators to the final goal of sustainability. This study has
some similarities with our study in comparison of agricultural sustainability of different study areas
by applying MCDA. Van Cauwenbergh et al., in their study in 2007 argued about Sustainability
Assessment of Farming and the Environment (SAFE) framework describing the ability to assess
the sustainability of agriculture. However, according to the authors “this framework is not intended
to find a common solution for sustainability in agriculture as a whole, but to serve as an
assessment tool for the identification, the development and the evaluation of agricultural production
systems, techniques and policies”. Binder et al. in 2010 developed an indicator-based agricultural
sustainability assessment method which includes a bottom-up approach by integrated participatory
or trans-disciplinary methods. In our study a trans-disciplinary and participatory approach is also
used to develop indicators from the field and from secondary information. In Bangladesh in 2003,
Rasul and Thapa carried out a study on sustainability of ecological and conventional agricultural
systems in the middle part of Bangladesh. It is based on environmental, economic and social
perspectives of the two agricultural systems. In assessing agricultural sustainability of two
production systems they used empirical data collected through a household survey, soil sample
analysis, observations and discussions with key informants. In our study we also used similar
methods to collect information. The study of Rasul and Thapa suggests that ecological agriculture
has a tendency towards becoming ecologically, economically and socially more sound than
conventional agriculture. In our study we find that the integrated agricultural system is more
sustainable than any other system. Although an integrated agricultural system does not rigidly
follow ecological agriculture, it emphasizes that the natural environment is an important component
of agricultural practices.

112
Sustainability of Changing Agricultural Systems in the Coastal Zone of Bangladesh
In Bangladesh, studies address some issues of coastal agricultural sustainability in different ways.
Datta et al. in 2005 address some sustainability issues of shrimp culture (like movement of shrimp
cultivation and shrimp disease and impacts) of the south-western coastal regions. The study shows
that outbreak of disease is a major hindrance for shrimp culture. A study on “Adaptive Crop
Agriculture Including Innovative Farming Practices in the Coastal Zone of Bangladesh” in Satkhira
District finds suitable adaptation measures (e.g. introducing high varieties of rice-BRRIdhan29,
BRRIdhan45 and BRRIdhan47 etc., saline tolerant rice and vegetables according to soil
properties) that can be employed to adapt to changing conditions (CEGIS, 2008). In order to
assess and analyze the problems, this study appraised the existing findings from a literature review
and community consultation. Karim in 2008 by using questionnaires, observation and satellite
imagery identified that a decrease of crop production, many environmental problems (like shortage
of livestock fodder, fuel scarcity and decreases in traditional labour forces) and social problems are
associated with shrimp cultivation. Miah in 2010, by using a multi-disciplinary, participatory and
interactive method in “Assessing Long-term Impacts of Vulnerabilities on Crop Production Due to
Climate Change in the Coastal Areas of Bangladesh” investigated climate impacts on crop
production systems. He suggested appropriate coping strategies and adaptation options for
improving coastal agriculture to increase agricultural production. He also wanted to find better
livelihood options for the vulnerable members of the farming community. Roy and Chan in 2011,
based on reviews and synthesis, proposed a set of indicators (economical, social and ecological)
for assessing agricultural sustainability in Bangladesh. In our study we also developed indicators
which also cover the same issues, relevant specifically to the coastal region. Moudud et al. in 1988
pointed out aspects of unsustainable development in Bangladesh coastal areas and proposed
better application and management of coastal resources such as the Sunderban with its diverse
113
Sustainability of Changing Agricultural Systems in the Coastal Zone of Bangladesh
flora and fauna. Shang et al., in 1998 suggest reduction in production cost and negative
environmental impacts through bio-technical improvement and efficient management are of key
importance for sustainable development of the shrimp sector of Bangladesh.
Deb (1998) reveals the fact that if the societal values of the coastal environment that supports life-
and-livelihood of millions of coastal communities of Bangladesh are not recognized, the
aquaculture industry might give rise to severe ecological, economic and social problems and
conflicts.
Other studies also address different aspects of coastal agricultural sustainability. Some of the
literature focuses on the environmental impact of shrimp while focus on both environmental and
social issues. There is a general conception that shrimp farming in Bangladesh has many negative
environmental impacts including salinization of soil and water, loss of wild and domesticated flora
and fauna, mangrove destruction, change in cropping patterns and species composition (Ahmad,
2004; Ali, 2006; Bhattacharya et al., 1999a, Bhattacharya et al. 1999b, DoE, 2005; Manju, 2000;
MoWR 2006). Although all the studies address the issue of agricultural sustainability, they do not
attempt to provide a quantitative or semi-quantitative measure of sustainability. In this respect our
study is unique in that it is the first attempt to measure sustainability of present agricultural
practices in coastal regions.
Despite some limitations, the present study has been able to use a systematic indicator-based
approach supported by MCDA aggregation that contributes to assessing the sustainability of
agriculture in each study area. As a broad conclusion, our assessment provides substantial
evidence to prove the success of the integrated system followed by many farmers in Dumuria: it is
clearly more sustainable than in the other study areas combining all categories of agricultural
sustainability. The level of sustainability of diversified traditional agriculture in Kalaroa is also

114
Sustainability of Changing Agricultural Systems in the Coastal Zone of Bangladesh
relatively good. A common feature of practices followed in Dumuria and Kalaroa is an emphasis on
diversity which plays into all the categories of sustainability, even contributing to strengths in areas
of productivity and efficiency. The level of sustainability is low in Shyamnagar, an area where
farmers have been devoting considerable energy and resources to cultivating bagda shrimp. The
increase of salinity and rapid alteration of the landscape ecology have created problems in that
area. Bhola Sadar is following patterns of traditional agriculture including substantial diversification
which produce moderate productivity, but due to its isolated location and the effects of cyclones the
agricultural system has severe limitations in terms of sustainability.
The level of the sustainability measured here allows for a comparison among the five sites. No
comparison was done with an overall national benchmark value as no such value exists. However,
among sustainable categories, some aspects of productivity, stability and equity can be compared
with the national benchmark values; for the other three categories comparisons are difficult as, for
example, there is no standard measurement for efficiency. Productivity can readily compared with
other national and international values. The average yearly productivity of rice of the study areas
vary from 2.26 t/ha in Shyamnagar to 6.51t/ha in Dumuria which bracket the average yearly
productivity of rice of Bangladesh (2.8 t/ha) and the World (4.37 t/ha). It was significant that in the
integrated agricultural system, rice productivity is much higher than in the other areas, and is better
even than the global average. The stability of the study areas is largely determined by the soil and
water salinity and the natural calamities of the areas as well as efficient management of the
embankment and withdrawals of the upstream water. The integrated system of Dumuria and
diverse agricultural system of Kalaroa turned out to be the most efficient and durable agricultural
systems among study areas. In all study areas there are significant equity problems, but indicators

115
Sustainability of Changing Agricultural Systems in the Coastal Zone of Bangladesh
of education and toilet facilities came out favorably, which is on track with the target of the
Millennium Development Goals for Bangladesh and other developing countries. There are other
challenges in terms of equity. It is very clear that agricultural land is not equitably distributed among
farmers. For example, landless farmers hold less than 0.01 ha of land whereas large farmers held
13.2 ha on average.
Sustainable agriculture means successful management of resources for agriculture to satisfy the
changing human needs, while maintaining or enhancing the quality of environment and conserving
natural resources. The first priority of sustainable agriculture is to understand the sustainability
level of the present situation. This study, depending on various indicators and MCDA analysis
provides a way of measuring the level of coastal agricultural sustainability of Bangladesh .This
information can be used in formulating policies for the country.
4.3.8 Level of Agricultural Sustainability in the Study Areas
Combining all the overall scores of all categories and their respective weightings as described in
the methodology chapter (Table 2.8), MCDA analysis (Figure 4.3.7 and 4.3.8 and Table 4.3.7)
shows that the sustainability score is highest in Dumuria. Among six categories, the scores of
productivity, efficiency and equity are highest at that site and the scores of the rest three categories
are also good. This designates that the performance of agriculture in terms of agricultural
sustainability is better in Dumuria in comparison to other study areas. In this respect, it is
worthwhile to mention that, during the field visit, questionnaire survey and FGD, almost every
farmer in Dumuria expressed their satisfaction for the present agricultural practices. On the other
hand, as expected after field observation, the lowest score of agricultural sustainability is observed
in Shyamnagar. The farmers and the upazila officials are concerned about agricultural

116
Sustainability of Changing Agricultural Systems in the Coastal Zone of Bangladesh
sustainability of the area. The scores of the productivity, efficiency and compatibility category are
very low in Shyamnagar. The score for productivity is very poor as the repetitive bagda cultivation
is hampered by shrimp diseases and occasionally by cyclones; furthermore the production of rice is
limited due to the impacts of salinity. According to farmers of this study area, saline water intrusion
is a naturally occurring phenomenon for the fields of the area that affects land productivity even in
the absence of shrimp culture, but massive shrimp cultivation has clearly had an impact in
destroying the natural setting for crop production. In the overall score, Kalaroa scored second
highest after Dumuria. The farmers of this study area are practicing mostly traditional agriculture
with some improved methods. Farmers are satisfied about their agricultural practices as they
generally achieve a good economic return and at the same time they are aware of the negative
impacts of extensive shrimp cultivation. According to the farmers and upazila officials agro-
biodiversity in the Kalaroa area plays a major role in promoting good performance in terms of
agricultural sustainability. The sustainability score of Kaliganj is much better than of Shyamnagar.
During the field study and FGD in Kaliganj, the farmers expressed their concerns about the
sustainability of their agricultural system. Like Shyamnagar, they have observed the negative
effects of shrimp cultivation in their agro-ecology system too. They started producing shrimp for its
good economic return but now they are concerned about the cost and benefit of shrimp cultivation
and its effect on traditional agriculture in terms of sustainability. They stated that they were
conscious about the impacts of bagda shrimp cultivation, and that they know about the benefits of
the integrated agricultural practices of Dumuria. Some farmers opined that they were considering
adjusting their agriculture practices to be more like those of Dumuria. In Bhola Sadar, the
sustainability score is third highest. This area is subject to frequent cyclones and is isolated from
the main land. Because of these factors, it showed low performance in some categories of
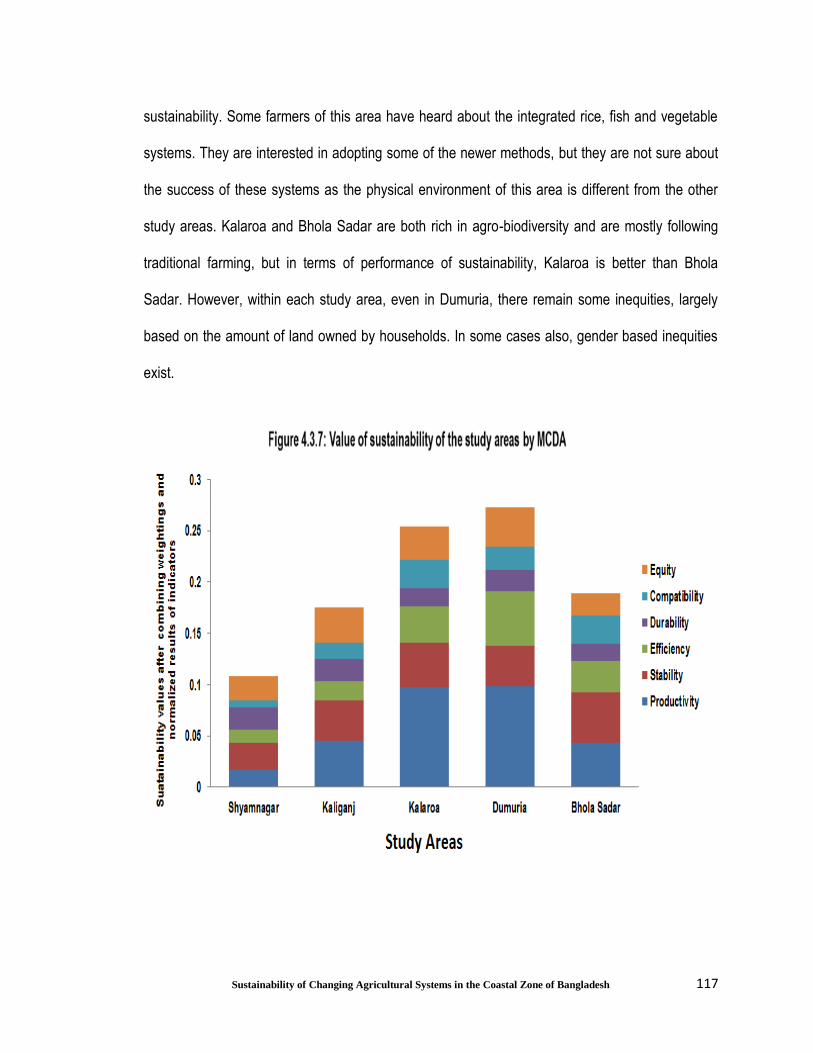
117
Sustainability of Changing Agricultural Systems in the Coastal Zone of Bangladesh
sustainability. Some farmers of this area have heard about the integrated rice, fish and vegetable
systems. They are interested in adopting some of the newer methods, but they are not sure about
the success of these systems as the physical environment of this area is different from the other
study areas. Kalaroa and Bhola Sadar are both rich in agro-biodiversity and are mostly following
traditional farming, but in terms of performance of sustainability, Kalaroa is better than Bhola
Sadar. However, within each study area, even in Dumuria, there remain some inequities, largely
based on the amount of land owned by households. In some cases also, gender based inequities
exist.
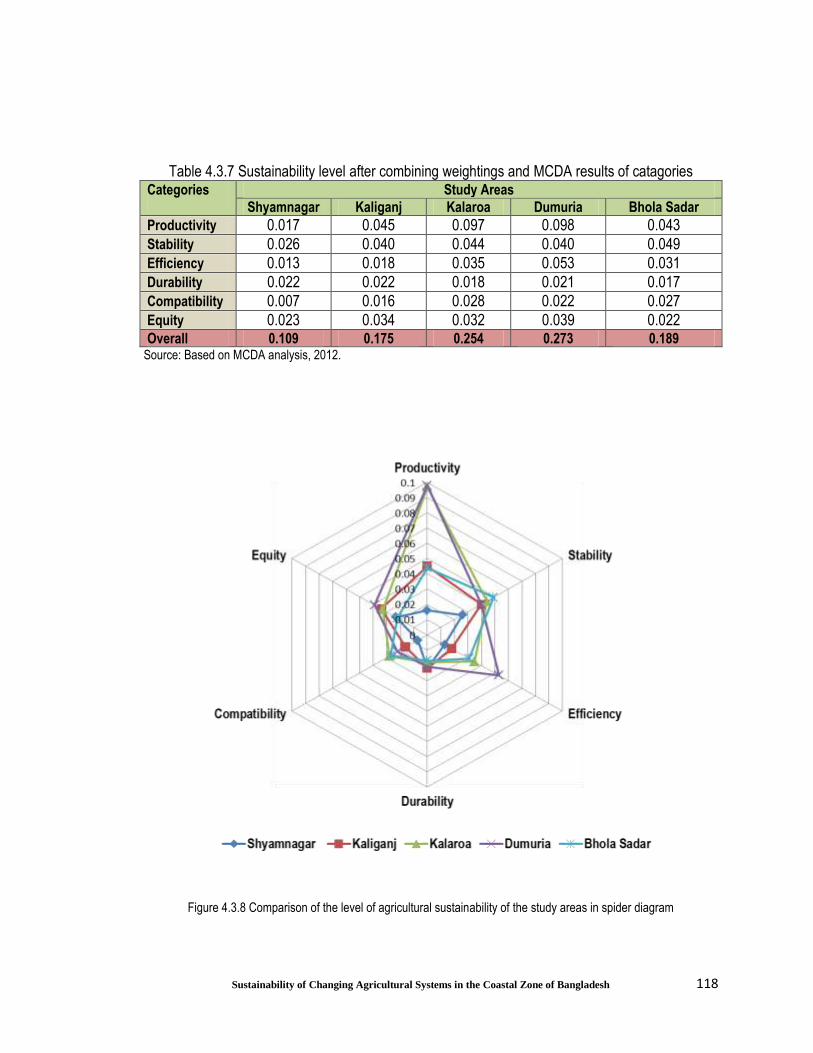
118
Sustainability of Changing Agricultural Systems in the Coastal Zone of Bangladesh
Table 4.3.7 Sustainability level after combining weightings and MCDA results of catagories Categories Study Areas
Shyamnagar Kaliganj Kalaroa Dumuria Bhola Sadar
Productivity 0.017 0.045 0.097 0.098 0.043
Stability 0.026 0.040 0.044 0.040 0.049
Efficiency 0.013 0.018 0.035 0.053 0.031
Durability 0.022 0.022 0.018 0.021 0.017
Compatibility 0.007 0.016 0.028 0.022 0.027
Equity 0.023 0.034 0.032 0.039 0.022 Overall 0.109 0.175 0.254 0.273 0.189
Source: Based on MCDA analysis, 2012.
Figure 4.3.8 Comparison of the level of agricultural sustainability of the study areas in spider diagram

119
Sustainability of Changing Agricultural Systems in the Coastal Zone of Bangladesh
“What are the sustainability features of adaptive agricultural systems that are
practised for pursuing livelihoods, especially in comparison with different farming
systems that are followed in different parts of the coastal areas? This can be
answered by measuring the sustainability of agricultural practices”.
This was the research question I set out to answer and the thesis has described what has been
learned in working to this end.
Agricultural sustainability was assessed and compared by measuring indicators of productivity,
stability, efficiency, durability, compatibility and equity and aggregating them using Multi
Component Decision Analysis (MCDA) methodology in five sites within the Bangladesh coastal
region. Measuring agricultural sustainability in this way produces a useful summary of sustainability
issues and also provides some vital learning experiences. Choosing indicators to satisfy
assessment within the six categories is an iterative process where it is necessary to make use of
past experience, expert opinion and advice from local farmers and their families, all things being
considered within the requirement of having indicators that can be readily measured in the field or
determined from secondary information. Combining multiple pieces of diverse types of data
expressed in the indicators was another challenge and it was found that MCDA could be a useful
tool for this purpose.
In the end, a holistic and interdisciplinary approach was developed for assessing and comparing
the sustainability level of agricultural systems and it has the potential to become useful as a
framework for future analyses of sustainability.
Chapter-5: Conclusion & Recommendations

120
Sustainability of Changing Agricultural Systems in the Coastal Zone of Bangladesh
There were challenges in doing this work and, in some cases; these challenges meant that there
are limitations in what could be done. To investigate sustainability, a large amount of primary and
secondary data was collected from the five different study areas. The coastal region of Bangladesh
covers a vast area and the agricultural practices of the region vary from site to site. Due to time
constraints and lack of appropriate transportation and logistics support we could not spend as
much time as we wished in order to observe all the agricultural systems within the five sites.
Furthermore, during the field survey, we found that some respondents appeared to be afraid and
reluctant to interact freely with the investigators. In focus group discussions, all participants were
not active in participation. This made it difficult to collect all the information we required. Also, due
to unfriendly weather, the law and order and political situations, a more detailed investigation could
not be done in study areas. Secondary data collection was very time consuming and it was
frequently difficult to obtain data from government agencies due to complex rules and regulations.
Finally, only a few studies have touched on issues of assessment of sustainability in the coastal
agriculture of Bangladesh. As a result, there is limited literature to enrich the analysis in this study
by reviewing other findings.
Within these limitations, the information obtained from the random samples chosen, from focus
groups, from discussions with experts and from government documents taken together provides a
realistic picture of many of the commonly used practices at each location.
Agricultural development in the saline coastal belt of Bangladesh is constrained by various
physical, chemical and social factors. Water and soil salinity are among the most dominant limiting
factors in the region, especially during the dry season. Soil salinity affects many crops including

121
Sustainability of Changing Agricultural Systems in the Coastal Zone of Bangladesh
rice, the most important, at different levels and at critical stages of growth. As a consequence,
yields can be reduced and in severe cases total yield is lost. The presence of salinity in surface
and ground water in different areas near the coast is another factor affecting crop production. In
spite of these difficulties, in some places this research has shown that an integrated agricultural
management system involving multiple crops as well as aquaculture is doing well in the coastal
areas. This study shows that the integrated systems are productive and efficient and, in general,
the level of sustainability in these areas is the highest of all systems that were studied.
The findings of this research will be transmitted to local authorities in Bangladesh with the hope
that they will enable agricultural policy making departments to plan management actions for
sustainable agricultural development in the coastal regions.
Some of the recommendations that arise from this study are:
1. Based on the present study, it is recommended that an indicator-based analysis be one
method by which the sustainability level of different agricultural systems be assessed. The
information thus gained can be used as one factor for determining coastal agricultural
policy of Bangladesh.
2. The coastal population of Bangladesh is dependent on agriculture for income and
employment. Therefore, government should emphasize introducing agricultural practices
that ensure productivity and employment.
3. Comprehensive investigation is needed to understand the present agricultural practices
and to bring diversification in the agricultural system for reducing yield gaps.

122
Sustainability of Changing Agricultural Systems in the Coastal Zone of Bangladesh
4. There is a need to design and enforce a policy and institutional framework for natural
resources management and conservation to support agricultural growth in the coastal
areas of Bangladesh.
5. Improving physical and social infrastructure - roads, electricity, communication, water and
sanitation, health and education – in rural areas is fundamental for sustainable
development in agriculture.
6. Proper operation of embankments should be ensured for protecting agriculture from saline
water and storm surges.
7. Rain water should be stored in the saline-affected water areas to minimize the salinity
effect of the surface water during the dry season.
8. Introduction of integrated agricultural system by storing rain water in saline affected areas
may be a news strategy to cope with emerging adverse situations.
9. Government should formulate a project to promote the feasibility of integrated agricultural
system in the salinity affected areas of Bangladesh to ensure the sustainability of coastal
agriculture.

123
Sustainability of Changing Agricultural Systems in the Coastal Zone of Bangladesh
Ahmad, M. (2003). Coastal livelihood: situation and context. Working paper WP015. Program
Development Office for Integrated Coastal Zone Management Plan Project, Water
Resources Planning Organization. Dhaka, Bangladesh, pp.1-30
Alam, M.S., Shamsuddin, S.D. and Sikder, S. (1990) Application of remote sensing for monitoring
shrimp culture development in a coastal mangrove ecosystem in Bangladesh. In:
Proceedings of the Twentythird International Symposium on Remote Sensing of
Environment, 18–25 April 1990, Bangkok, Thailand, pp. 109–119.
Alam, S.M.N. and Phillips M.J. (2004). Coastal shrimp aquaculture systems in southwestern
Bangladesh. Asian Fisheries Science, 17, pp.175–189.
Ali, A.M.S. (2004). Technological change in agriculture and land degradation in Bangladesh: a
case study. Land Degradation & Development, 15(3), pp. 283-298.
Ali, M.L. (2002). An integrated approach for the improvement of flood control and drainage
schemes in the coastal belt of Bangladesh. Delft, Wageningen University and International
Institute for Infrastructural, Hydraulic and Environmental Engineering. (Ph.D. thesis). pp.1-10
Available at: http://www.icimod.org/?opg=949&q=drr_document&document=480. [Accessed
26 February 1012]
Ali, S.M.A. (2006). Rice to shrimp: Land use/land cover changes and soil degradation in
southwestern Bangladesh. Land Use Policy. Elsevier, 23(4), pp. 421-435.
Barnett, V., Payne, R. and Steiner, R. (eds). (1995). Agricultural sustainability: economic,
environmental, and statistical considerations. London: John Wiley and Sons Ltd.
BBSa (Bangladesh Bureau of Statistics). (2001). Population census - 2001.Community series, Zila:
Satkhira. Planning Davison, Ministry of Planning. Dhaka, Bangladesh.
BBSb (Bangladesh Bureau of Statistics). (2001). Population census-2001.Community series, Zila:
Khulna. Planning Davison, Ministry of Planning. Dhaka, Bangladesh.
References
124
Sustainability of Changing Agricultural Systems in the Coastal Zone of Bangladesh
BBSc (Bangladesh Bureau of Statistics). (2001). Population census-2001.Community series, Zila:
Bhola. Planning Davison, Ministry of Planning. Dhaka, Bangladesh.
BBS (Bangladesh Bureau of Statistics). (2011). Population and housing census report 2011.
Bangladesh Bureau of Statistics. Ministry of Planning. Dhaka, Bangladesh.
BBS (Bangladesh Bureau of Statistics). (2008). Agriculture census. The Bangladesh census of
agriculture and livestock. Ministry of Planning. Dhaka, Bangladesh.
BBS (Bangladesh Bureau of Statistics). (2006). Agriculture sample of Bangladesh – 2005. Ministry
of Planning. Dhaka, Bangladesh.
BBS (Bangladesh Bureau of Statistics). (2006). Statistical yearbook of Bangladesh. Bureau of
Statistic, Ministry of Plan. Dhaka, Bangladesh,
BCCAAP (Bangladesh climate change strategy and action plan). (2010). Ministry of Environment
and Forest (MOEF), Government of People’s Republic of Bangladesh. Dhaka. Bangladesh
Binder, C.R., Feola, G., Steinberger, J.K. (2010). Considering the normative, systemic and procedural dimensions in indicator-based sustainability assessments in agriculture. Environmental Impact Assessment Review 30, pp.71–81
Bhattacharya, D., Rahman, M., Khatun, F.A. (1999a). Environmental impact of trade liberalization
and policies for the sustainable management of natural resources: a case study on Bangladesh’s shrimp farming industry. Centre for Policy Dialogue (CPD). Dhaka, Bangladesh, pp.i-xx
Bhattacharya, D., Rahman, M., Khatun, F.A. (1999b). Environmental impact of structural
adjustment policies: the case of export oriented shrimp culture in Bangladesh. Centre for Policy Dialogue (CPD). Dhaka, Bangladesh, pp.1-15
BPRSP (Bangladesh: Poverty Reduction Strategy Paper). (2005). General economics division,
Planning Commission. Government of People’s Republic of Bangladesh. Dhaka,
Bangladesh
125
Sustainability of Changing Agricultural Systems in the Coastal Zone of Bangladesh
BBC (British Broadcasting Corporation). (2010). Bangladesh: 77m poisoned by arsenic in drinking
water". BBC News. 2010-06-19. Avialbe at:
http://news.bbc.co.uk/2/hi/world/south_asia/10358063.stm [Acessed 2 February 2012]
BMD (Bangladesh Metrological Department). (2011). Climate of Bangladesh. Dhaka, Bangladesh
Bleek, W. (1987). Lying informants: A fieldwork experience from Ghana. Population and
Development Review. 13, pp.314-332. Available at:http://dare.uva.nl/document/14485
[Accessed 10 February 2012]
Bassey, M. (1999). Case study research in educational settings. Maidenhead: Open University
Press
Barmon, K.B., Kondo, T. and Osanami, F. (2007). Economic evaluation of rice-prawn gher farming
system on soil fertility for modern variety paddy production in Bangladesh. Asia-Pacific
Journal of Rural Development, XVII (1), pp.67-81
Ceyhan, V. (2010). Assessing the agricultural sustainability of conventional farming systems in
samsun province of Turkey. African Journal of Agricultural Research 5(13), pp. 1572-1583,
Available at: http://www.academicjournals.org/AJAR [Accessed 27 February 2011].
Conway, G.R. (1987). The properties of agro ecosystems. Agricultural Systems. 24, pp. 95-117.
Conway, G.R. (1985). Agroecosystems analysis, Agricultural Administration. 20, pp. 31-35.
Chowdhury, Q.S. and Hossain, Q. (2006). Bengal delta in Banglapedia. National Encyclopedia of
Bangladesh. Asiatic Society of Bangladesh. Dhaka, Bangladesh
Cohen, L., Manion, L. and Morrison, K. (2002). Research methods in education. Routlege, Falmer.
New Fetterlane, London.
CEGIS (Center for Environmental and Geographic Information Services). (2010). Coastal land use
zoning in the southwest. Dhaka, Bangladesh

126
Sustainability of Changing Agricultural Systems in the Coastal Zone of Bangladesh
CEGIS (Center for Environmental and Geographic Information Services). (2008). Adaptive crop agriculture including innovative farming pactices in the coastal zone of Bangladesh. Climate Change Cell, Department of Environment (DoE), Component 4B, Comprehensive Disaster Management Program (CDMP) and Ministry of Food and Disaster Management, Dhaka, Bangladesh
CIA (Central Intelligence Agency). (2012). World factbook: country comparison to the world:
Bangladesh. Avilable at: https://www.cia.gov/library/publications/the-world-
factbook/fields/2004.html [Accessed on 30 July 2012]
Dias, C.L and Antunes, H.C. (2012). Multiattribute value theory: additive models (a brief summary).
Available at:
http://www.vrtuosi.com/OAM/VR_COI002/VR_COI002_2_OA_AdditiveModels.pdf [Accessed
2 February 2012]
DFCALG (Department for Communities and Local Government). (2009). Multi-criteria analysis: a
manual. London. Available at: http://eprints.lse.ac.uk/12761/1/Multi-criteria_Analysis.pdf
[Accessed 12 April 2012]
DFID (Department for International Development). (2002). Better livelihoods for poor people: The
role of agriculture. Consultation Document. Department for International Development.
London. Available at:
http://www.iatp.org/files/Better_Livelihoods_for_Poor_People_The_Role_of.htm [Accessed
11 May 2012].
Dantsis, T., Douma, C., Giourga, C., Loumou, A., and Polychronaki, A. E. (2010). A methodological approach to assess and compare the sustainability level of agricultural plant production systems. Ecological Indicators, 10, pp. 256–263
Datta, D.K., Roy, K. and Hassan, N. (2005). Shrimp culture: trend, consequences and
sustainability in south-western coastal region of Bangladesh in management and sustainable development of coastal zone environments. In: A.L. Ramanathan, P. Bhattacharya, T. Dittmar, B. Prasad, and B. Neupane (ed.). Springer, p.227
Deb, A. K. (1998). Fake blue eevolution: environmental and socio-economic impact of shrimp
culture in the coastal areas of Bangladesh. Ocean & Coastal Management, 41(1), pp. 63–88
127
Sustainability of Changing Agricultural Systems in the Coastal Zone of Bangladesh
DFID (Department for International Development). (2004). Agricultural sustainability:
working/supporting paper. England. Available at:
http://dfid-agriculture-consultation.nri.org/summaries/wp12.pdf [Accessed 10 March 2011].
DoF (Department of Fisheries). (1995). Shrimp resources statistics. Central Shrimp Cell,
Department of Fisheries. Dhaka, Bangladesh
DoF(Department of Fisheries). (2004). Draft shrimp strategy, summary. Department of Fisheries.
Dhaka, Bangladesh
DoF(Department of Fisheries). (2005). Fishery statistical yearbook of Bangladesh 2003–2004.
Fisheries Resources Survey System, Department of Fisheries. Dhaka, Bangladesh
DoF(Department of Fisheries). (2010). Fishery statistical yearbook of Bangladesh 2009–2010.
Fisheries Resources Survey System, Department of Fisheries. Dhaka, Bangladesh
DoF (Department of Fisheries). (2005). Aquaculture and management technology innovation and
development. National Fish Fortnight Souvenir, 2052. Department of fisheries. Dhaka,
Bangladesh
DoE (Department of Environment). (2005). Bangladesh: National programme of action for
protection of the coastal and marine environment from land-based activities. Department of
Environment, Ministry of Environment and Forests, Government of the People’s Republic of
Bangladesh in Collaboration With IUCN – The World Conservation Union Bangladesh
Country Office and Bangladesh and Center for Advance Studies (BCAS). Dhaka,
Bangladesh.
EC (European Commission). (2007). The use of indicators in the European Commission. Reflection
paper. European Commission, DG Environment, Sustainable Development and Economic
Analysis Unit, p.3, Available at http://www.beyond-gdp.eu/download/bgdp-bp-white.pdf
[Accessed 5 March 2011]
128
Sustainability of Changing Agricultural Systems in the Coastal Zone of Bangladesh
Eyler, A. A., Mayer, J., Rafii, R., Housemann, R., Brownson, C. R and King, C.A. (1999). Key
informant surveys as a tool to implement and evaluate physical activity interventions in the
community. Health Education Research. Theory & Practice. 14(2), pp. 289–298
Eilers, W., R. MacKay, L. Graham and A. Lefebvre (edi.). (2010). Environmental sustainability of
canadian agriculture. Agri-Environmental Indicator Report Series. Report #3. Agriculture
and Agri-Food Canada. Available at:
http://www4.agr.gc.ca/resources/prod/doc/prog/pdf/asca-aedc_rep2010_eng.pdf
[Accessed 20 July 2012]
Ellis, F. (1998). Household livelihoods strategies and rural livelihoods diversification. Journal of
Development Studies. 35 (1), pp.1-38
Faruk, M.H. (2009). Hilsa (Tenualosa ilisha) marketing system in different wholesale and retail
markets in Dhaka city. Masters Thesis submitted to the Institute of Aquaculture, Stirling
University, UK in Aquatic Resource Development, p.62
Feenstra, G. and Campbell, D. (2011). What is sustainable agriculture? UC Sustainable Agriculture
Research and Education Program, University of California. Available at:
http://www.sarep.ucdavis.edu/concept.htm [Accessed 5 March 2011]
FAO (Food and Agriculture Organization). (2007). Water profile of Bangladesh". In: Encyclopedia
of Earth. Eds. Cutler J. Cleveland (Washington, D.C.: Environmental Information Coalition,
National Council for Science and the Environment). Available at:
http://www.eoearth.org/article/Water_profile_of_Bangladesh [Accessed 25 February 2012]
FAO (Food and Agriculture Organization). (2001). Integrated agriculture-aquaculture: a primer.
FAO Fisheries Technical Paper. Rome, Italy, 407, p.149
FAO/UNDP. (1999). Land resources appraisal of Bangladesh for agricultural development report 2:
agroecological regions of Bangladesh. 1998 Yearbook of Agricultural Statistics. Bangladesh
Bureau of Statistics, Dhaka, Bangladesh

129
Sustainability of Changing Agricultural Systems in the Coastal Zone of Bangladesh
FPMU (Food Planning and Monitoring Unit). (2008). National food policy plan of action :( 2008-
2015). Ministry of Food and Disaster Management. Dhaka, Bangladesh
Firoze, A. (2003). The southwest coastal region: problems and potentials. The Daily Star, XIV,
Issue 215, Dhaka, Bangladesh
GoB (Government of Bangladesh). (2010). National agriculture policy 2010 (Final draft). Ministry of
Agriculture. Dhaka. Bangladesh
GoB(Government of Bangladesh) and UNDP Bangladesh. (2009). Policy study on the probable
impacts of climate change on poverty and economic growth and the options of coping with
adverse effect of climate change in Bangladesh. General Economic Division, Planning
Commission, Dhaka, Bangladesh
GoB(Government of Bangladesh) and UNDP Bangladesh. (2005). Millennium Development Goals:
Bangladesh Progress Report. Dhaka, Bangladesh
GoB (Government of Bangladesh). (2008). Bangladesh climate change strategy and action plan.
Ministry of Emvironmnet and Forest. Dhaka, Bangladesh.
GoB (Government of Bangladesh). (2006). synthesis of agricultural policies in Bangladesh.
Agriculture sector review. Ministry of Agriculture, Dhaka, Bangladesh. 3, pp. 1-17
Gold, M. V. (2007). Sustainable agriculture: definitions and terms. (Special reference briefs; 99-02).
Sustainable agriculture—Terminology. Title NAL Call #: aS21.D27S64 no. 99-02.
ISSN 1052-5368. Avialble at: http://www.nal.usda.gov/afsic/pubs/terms/srb9902.shtml
[Acessed 25 March 2011]
Gumma K. M., Nelson A., Maunahan A., Thenkabail S. P., and Islam S. (2012). Rice cropping
patterns in Bangladesh. International Rice Research Institute. Manila. Phillipine. Available
at:http://irri.org/index.php?option=com_k2&view=item&id=11680:rice-cropping-patterns-in-
bangladesh&lang=en [Accessed 7 May 2012]

130
Sustainability of Changing Agricultural Systems in the Coastal Zone of Bangladesh
Häni J.F, Pintér, L. and Herren, H.R. (ed). (2006). Sustainable agriculture from common principles
to common practice. Proceedings and outputs of the first Symposium of the International
Forum on Assessing Sustainability in Agriculture (INFASA), March 16, 2006, Bern,
Switzerland. International Institute for Sustainable Development and Swiss College of
Agriculture. Available at: http://www.iisd.org/pdf/2007/infasa_common_principles.pdf
[Accessed 30 March 2012]
Haque, A.K.E. (2004). Sanitary and phyto-sanitary barriers to trade and its impact on the
environment: the case of shrimp farming in Bangladesh. IUCN Bangladesh Country Office,
Dhaka, p. 63.
Hamid, A.M. and Alauddin, M. (1998). Coming out of their homesteads: Employment for rural
women in shrimp aquaculture in coastal Bangladesh. International Journal of Social
Economics, 25, pp. 314–337.
Hagler, M. (1997).Shrimp: the devastating delicacy, a Greenpeace report. Available at:
http://archive.greenpeace.org/oceans/shrimpaquaculture/shrimpreport.html. [Accessed 12
February 2012]
Harmeling, S. (2010). Global Climate Risk Index 2010. Germanwatch. Bonn.Germany. Available at:
http://germanwatch.org/klima/cri2010.pdf [Accessed 30 May 2011]
Hardi, P. and T. Zdan (1997). Assessing sustainable development: principles in practice.
International Institute for Sustainable Development. Winnipeg.
Hostmanna, M., Bernauerb, T., Joachimmoslera, H., Reicherta, P. and Truffer, B. (2005). Multi-
attribute value theory as a framework for conflict resolution in rive rehabilitation. Journal of
Multi-criteria Decision Analysis, 13, pp. 91–102.
Hämäläinen, R.P. and Lauri, H. (1995). ‘HIPRE 3+ User’s Guide’, Systems Analysis Laboratory,
Helsinki University of Technology. Availabe at: http://www.sal.hut.fi/Downloadables/hpdemo.
html [Accessed 10 April 2012]

131
Sustainability of Changing Agricultural Systems in the Coastal Zone of Bangladesh
Hayashi, K. (2000). Multicriteria analysis for agricultural resource management: a critical survey
and future perspectives. Eur. J. Oper. Res. 122, pp. 486–500.
Hayati, D. Ranjbar Z., and Karami, E. (2011). Measuring agricultural sustainability. In E. Lichtfouse
(ed.), biodiversity, biofuels, agroforestry and conservation agriculture. Sustainable
Agriculture Reviews. Springer Netherlands. 5, pp.73-100
Islam, M.R.& Koudstaal, R. (2003). Coastal zone management: an analysis of different policy
documents. Working paper 09. Program Development Office for ICZM, p. 52
Islam, M.R. & Ahmad, M. (2004). Living in the coast: problems, opportunities and challenges.
Program Development Office for Integrated Coastal Zone Management Plan Project; Water
Resources Planning Organization. Dhaka, Banglades
Islam, M. R., Ahmad, M., Huq, H. and Osman, M.S. (2006). State of the coast 2006. Program
Development Office for Integrated Coastal Zone Management Plan Project. Water
Resources Planning Organization. Dhaka, Bangladesh.
ICID (International Commission on Irrigation and Drainage). (2000). ICID strategy for implementing
sector vision: water for food and rural development and country position paper. Hanoi: ICID.
Islam, M.R. (2006a). Managing diverse land uses in coastal Bangladesh: institutional approaches.
In: C.T. Hoanh, T.P. Tuong, J.W. Gowing & B. Hardy (eds). Environment and livelihoods in
tropical coastal zones, pp 237–248. CAB International. Available at:
http://www.iwmi.cgiar.org/publications/CABI_Publications/CA_CABI_Series/Coastal_Zones/
Hoanh_1845931076-Chapter18.pdf [Accessed 10 January 2012]
Islam, A.(1999). Effects of shrimp farming on the physico-chemical and biological qualities of water.
Bangladesh Agricultural University. Mymensingh, Bangladesh.
IPCC (Intergovernmental Panel on Climate Change). (2007). Climate change 2007: synthesis
report. Intergovernmental panel on climate change. Available at:
http://www.ipcc.ch/pdf/assessment-report/ar4/syr/ar4_syr.pdf [Accessed 12 February 2011]
132
Sustainability of Changing Agricultural Systems in the Coastal Zone of Bangladesh
Inglis, A. (1991) Harvesting local forestry knowledge: A comparison of RRA and conventional
surveys. RRA Notes 12, pp. 32-40. Available at:http://pubs.iied.org/pdfs/G01395.pdf
[Accessed 10 February 2012]
Islam, M.M. (2002). An analysis of the role of extension methodology on poverty reduction: A
comparative study of aquaculture extension programmes in the Northwest Fisheries
Extension Project (NFEP) command area, Bangladesh. A thesis submitted to the University
of Wolverhampton in partial fulfilment of the requirements for the Degree of Doctor of
Philosophy. Availabe at:
http://wlv.openrepository.com/wlv/bitstream/2436/29559/1/Islam%2520thesis.pdf
[Accessed 21 May 2012]
Karim, M. (1986). Brackish water shrimp culture demonstration in Bangladesh. Madras, Bay of
Bengal Programme for Fisheries Development. FAO, Rome, Italy
Karim, M. and Stellwagen, J. (1998). Shrimp aquaculture. Fourth Fisheries Project, Department of
Fisheries: Final report, Dhaka, 6, p101
Kori, N.(1996).The Impact of shrimp cultivation on soils and environment in Paikgacha region,
Khulna(Limited to Polders 20, 21, 22, 23 and 24). Khulna, Bangladesh.
Kashem, A. M. (2006). Agriculture. Banglapedia: The National Encyclopedia of Bangladesh.
Asiatic Society of Bangladesh. Dhaka. Bangladesh
Keeney, R. L., Raiffa, H. (1976). Decisions with multiple objectives. Preferences and value
tradeoffs. John Wiley & Sons, Inc.
Lynam, J.K. and Herdt, W.R. (1989). Sense and sustainability: sustainability as an objective in
international agricultural research. Agricultural Economics, 3, pp. 381–398.
MoWR (Ministry of Water Resources). (2005). Coastal zone policy. Ministry of Water Resources,
Government of the People’s Republic of Bangladesh. Dhaka, Bangladesh

133
Sustainability of Changing Agricultural Systems in the Coastal Zone of Bangladesh
Mahmood, N. (2006). Prawan (Changri). Banglapedia - the National Encyclopedia of Bangladesh.
Asiatic Society of Bangladesh. Dhaka, Bangladesh.
Mainuddin, K., Rahman, A., Islam, N. and Quasem, S. (2011). Planning and costing agriculture’s
adaptation to climate change in the salinity-prone cropping system of Bangladesh.
Bangladesh Centre for Advanced Studies. Dhaka. Bangladesh.
MoA(Ministry of Agriculture) and FAO(Food and Agriculture Organization of the United
Nations).(2010). Towards a food secure Bangladesh: national medium term priority
framework of Bangladesh (2010-2015). The Ministry of Agriculture, Government of Peoples
Republic of Bangladesh and Food and Agriculture Organization of the United Nations.
Available at:
ftp://ftp.fao.org/TC/TCA/NMTPF/Country%20NMTPF/Bangladesh/Status/BgdCPF201015.pd
f [Accesed 10 February 2012]
MoA (Ministry of Agriculture). (2006). Handbook agricultural statistics. Government of Peoples
Republic of Bangladesh. Dhaka, Bangladesh
MoA (Ministry of Agriculture). (2010). National agriculture policy 2010 (Final draft). Government of
Peoples Republic of Bangladesh. Dhaka, Bangladesh
Miranda, I.J. (2001): Multicriteria analysis applied to the sustainable agriculture problem.
International Journal of Sustainable Development & World Ecology, 8(1), pp. 67-77.
Meadows, D. (1998). Indicators and Information Systems for Sustainable Development. The
Sustainable Institute, Hartland Four Corners.USA.
Miller, G. (2001).The development of indicators for sustainable tourism: results of a delphi survey
of tourism researchers. Tourism Management. 22 (4), pp. 351–36.
Marttunen, M., Ha¨ma¨la¨inen, R. P. (1995). Decision analysis interviews in environmental impact
assessment. European Journal of Operational Research 87 (3), 551–563.

134
Sustainability of Changing Agricultural Systems in the Coastal Zone of Bangladesh
Mustajoki J., Ha¨ma¨la¨inen P. R. and Marttunen M. (2003). Participatory multicriteria decision
analysis with Web-HIPRE: a case of lake regulation policy. Environmental Modelling &
Software, 19, pp. 537–547.
Mahmood, N. Chowdhury, J. M. Hossain, M. M. Haider, S. M. B (1994). A review of the state of environment relating to marine fisheries of Bangladesh. In: Holmgren(ed.), Bay of Bengal Programme (BOB) of the FAO.
Monju, T.H. (2000). Commercial shrimp culture: environment, gender and socio-economic changes. OXFAM (GB), Bangladesh
Nishat, A. (1988). Review of present activities and state of art of the coastal areas of Bangladesh.
In: Coastal area resource development and management Part II. Coastal Area Resource
Development and Management Association (CARDMA).Dhaka, pp. 23– 35.
NPDM (National Plan for Disaster Management: 2007-15). (2007). Ministry of Food and Disaster
Management. Government of the People’s Republic of Bangladesh. Dhaka, Bangladesh
NFPCSP (National Food Policy Capacity Strengthening Programme). (2008). Trends in the
availability of agricultural land in Bangladesh. Terms of reference #1. For the research
proposal to be funded under NFPCSP Phase II. Implemented by FAO in collaboration with
FPMU/Ministry of Food and Disaster Management of Bangladesh with financial support of
EU and USAID. Dhaka. Bangladesh
OECD (Organization for Economic Co-operation and Development). (2001). Environmental
indicators for agriculture. Methods and Results. OECD Publications, Paris, France, 3, p. 409.
OECD (Organization for Economic Co-Operation and Development). (1999). Environmental indicators for agriculture. Concepts and Framework. Paris, French, 3 Available at: http://Www.Oecd.Org/Greengrowth/Sustainableagriculture/40680795.Pdf [Accessed 15 July 2012]
PC (Planning Commission). (2010). Bangladesh economic review-2010 (English version), Export
data 2009-10. Export Promotion Bureau, Ministry of Finance. Dhaka. Bangladesh
Pieri, C., Dumanski, J., Hamblin, A., and Young, A. (1995). Land quality indicators. World Bank
Discussion Paper No. 315. Washington: World Bank.

135
Sustainability of Changing Agricultural Systems in the Coastal Zone of Bangladesh
Pretty, J. (2008). Agricultural sustainability: concepts, principles and evidence. Philosophical
Transitions of the Royal Society Biological Science. 363, pp. 447-465. Available at:
http://rstb.royalsocietypublishing.org/ [Accessed 6 March 2011]
PBS. (2008). Another major cyclone, Bangladesh worries about climate change. PBS News Hour,
2008
PDO-ICZMP. (2003).Coastal livelihoods – situation and context. Programme Development Office
for Integrated Coastal Zone Management Plan. Dhaka. Bangladesh
Peng Y. and Shi Y. (2002). Editorial: Multiple criteria decision making and operations research.
Annals of Operations Research. Springer, 197, pp. 1-4
Rahman, A. (1995). Beel Dakatia: environmental consequences of a development disaster.
University Press Limited. Dhaka, Bangladesh
Rasul, G. and Thapa, G. B. (2003). Sustainability of ecological and conventional agricultural
systems in Bangladesh: an assessment based on environmental, economic and social
perspectives. Agricultural Systems. Elsevier Ltd, 79, pp. 27–351. . Available at
http://www.sciencedirect.com/ [ Accessed 28 February 2011]
Richard, J. and Emmerij L. (2009). Environmental sustainability: from protecting the environment to
preserving ecological systems. Briefing Note Number 11. United Nations Intellectual History
Project, Ralph Bunche Institute for International Studies. The CUNY Graduate Center.
Avialable at: http://www.unhistory.org/briefing/11Sustainability.pdf. www.UNhistory.org
[Accessed 10 July 2012]
Rashid, E. H. (1991).Geography of Bangladesh. University Press Limited. Dhaka, Bangladesh
Rashid, E. H. and Kabir, B. (1998). Case study: Bangladesh, water resources and population
pressures in the Ganges river basin: water and population dynamics. In: Sherbinin A. D.,
Dompka V. and Bromley L. (eds) Case Studies and Policy Implications and Foreword by
136
Sustainability of Changing Agricultural Systems in the Coastal Zone of Bangladesh
Malin Falkenmark. Avialble at: http://www.aaas.org/international/ehn/waterpop/front.htm
[Accesed 20 March 2012]
Rahman, A.A., Mallick, L.D., Haque, N and Nishat, A. (2002). Trends in natural resource
management in Bangladesh: looking for integration and a new institutional framework.
Natural Resource Management Workshop. Bangladesh Centre for Advanced Studies
(BCAS). Dhaka, Bangladesh
Rattray, J. and C Jones, C.M. (2007). Essential elements of questionnaire design and
development. Journal of Clinical Nursing. Blackwell Publishing Ltd, 16, pp. 234–243.
Robson C. (1993). Real world research: A resource for social scientist and practitioner research.
Oxford: Blackwell
Roy, R. and Chan, W. N. (2011). An assessment of agricultural sustainability indicatorsin Bangladesh: review and synthesis. Environmentalist, 32, pp. 99–110.
Sarah, J. Cowell, Walter Wehrmeyer, Peter W. Argust, J. Graham S. Robertson. (1999).
Sustainability and the primary extraction industries: theories and Practice. Resources Policy,
25, pp. 277–286.
Suvedī, S. (2005). International watercourses law for the 21st century. Ashgate Publishing, Ltd..
pp. 154–166. Avialable at : http://www.springerlink.com/content/l842n0822t6077q0/.54
[Accessed on July 10 2012]
Smith, A. H., Lingas, O.E and Rahman, M. (2000). Contamination of drinking-water by arsenic in
Bangladesh: a public health emergency. Bulletin of the World Health Organization, 2000, 78
(9). Ref. No. 00-0751. Available at: http://www.who.int/bulletin/archives/78(9)1093.pdf.
[Accessed on 17 march 2012]
Shamsuddoha, M. and Chowdhury, K.R. (2007). Climate Change Impact and Disaster
Vulnerabilities in the Coastal Areas of Bangladesh. COAST Trust and Equity and Justice
Working Group. Dhaka, Bangladesh.

137
Sustainability of Changing Agricultural Systems in the Coastal Zone of Bangladesh
Swarta, R. J., Raskinb, P. and Robinsonc, J. (2004). The problem of the future: sustainability
science and scenario analysis. Global Environmental Change, Elsevier Ltd., 14, pp.137–
146.
SRDI (Soil Resource Development Institute). (2001). Soil salinity in Bangladesh-2000. Dhaka.
Bangladesh, p.113.
SRDI (Soil Resource Development Institute). (1998). Soil salinity map of Bangladesh-1997. Dhaka.
Bangadesh
SRDIa (Soil Resource Development Institute). (2001). Land and soil resources use guideline.
Shyamanagar upazila. Satkhira District. Government of Bangladesh.
SRDIb (Soil Resource Development Institute). (1997). Land and soil resources use guideline.
Kaliganj upazila. Satkhira District. Government of Bangladesh.
SRDIc (Soil Resource Development Institute). (1991). Land and Soil Resources Use Guideline.
Kalaroa Upazila. Satkhira District. Government of Bangladesh.
SRDId (Soil Resource Development Institute). (1993). Land and soil resources use guideline.
Bhola Sadar upazila. Bhola District. Government of Bangladesh.
SRDIe (Soil Resource Development Institute). (2008). Land and soil resources use guideline.
Dumuria upazila. Khulna District. Government of Bangladesh.
Simpson, M. and Tuson, J. (1995). Using observations in small-scale research: A beginner's guide.
Edinburgh: Scottish Council for Research in Education. ERIC Document 394991.
Scholz, R.W., Tietje, O. (2002). Embedded Case Study Methods. Integrating Quantitative and
Qualitative Knowledge. SAGE, Thousand Oaks, p. 314.
Tiwari, N.D, Loof, R., and Paudyal, N.G. (1999).Environmental-economic decision-making in
lowland irrigated agriculture using multi-criteria analysis techniques. Agricultural Systems,
60, pp.99-112.

138
Sustainability of Changing Agricultural Systems in the Coastal Zone of Bangladesh
UN (United Nations). (1987). Report of the world commission on environment and development:
Our common future. Available at: http://www.un-documents.net/ocf-02.htm. [ Assessed 12
March 2011]
UN (United Nations). (2007). Indicators of sustainable development: guidelines and methodologies.
Third Edition. United Nations publication. New York. USA.
UNDP (United Nations Development Programme). (2011). Human Development Report 2011.
Sustainability and Equity: A Better Future for All. ISBN: 9780230363311.
UNEP (United Nations Environmnetal Programe) and GoB (Governmnet of Bangladesh). (2001).
Sate of the environment report Bangladesh. United Nations Environmental Programme and
Government of Bangladesh. Thailand.
Uddin, F.M.A. and Haque, T.J. (2008). Agrarian transition and livelihoods of the rural poor:
agricultural land market. Unnayan Onneshan – The Innovators. Dhaka, Bangladesh.
Uddin, K. M. A. and Kaudstaa, R. (2003). Delineation of the coastal zone. Working Paper (WP005).
Program Development Office for Integrated Coastal Zone Management Plan (PDO-ICZMP).
Dhaka. Bangladesh
UFO (Upazila Fishery Office). (2011). Upazila report on fisheries-2011 (Unpublished). UFO.
Shyamnagar, Satkhira, Bangladesh
vanLoon W.G., G.S. Patil and B.L. Hugar. (2005).Agricultural Sustainability: Strategies for
Assessment. SAGE Publications. New Delhi, India.
Van der Werf, H.M.G., Petit, J. (2002). Evaluation of the environmental impact of agriculture at the
farm level: a comparison and analysis of 12 indicator-based methods. Agric. Ecosyst.
Environ. 93, pp. 31–145.
Waltner-Toews, D., Kay J., Murray, T. P. and Neudoerffer, C. (2004). Adaptive methodology for
ecosystem sustainability and health (AMESH): An introduction. In A. E. Ochoa-Arias (ed.),

139
Sustainability of Changing Agricultural Systems in the Coastal Zone of Bangladesh
Community Operational Research: Systems Thinking for Community Development. New
York: Kluwer / Plenum Press.
Walker, B. (2010). Study: millions in Bangladesh exposed to arsenic in drinking water. Avialble at:
http://www.cnn.com/2010/WORLD/asiapcf/06/20/bangladesh.arsenic.poisoning/index.html?h
pt=T1 [Accessed 3 March 2012]
Walker, J. (2002). Environmental indicators and sustainable agriculture. In: McVicar, T.R., Li Rui,
Walker, J., Fitzpatrick, R.W. and Liu Changming (eds), Regional Water and Soil
Assessment for Managing Sustainable Agriculture in China and Australia, ACIAR
Monograph No. 84, pp. 323–332. Available at:
http://aciar.gov.au/files/node/468/mn84section4technologytransferchapters24-29.pdf
[Accessed 17 July 2012]
William, W.and Gravgaard A.-K. (2010). Bangladesh fights for survival against climate change," by,
The Washington Times". Pulitzercenter.org. Available at:
http://pulitzercenter.org/articles/bangladesh-fights-survival-against-climate-change
[Accessed 7 March 2010]
WB (World Bank). (2011). World Bank – agriculture – Bangladesh. Bangladesh: priorities for
agriculture and rural development. Available at:
http://web.worldbank.org/WBSITE/EXTERNAL/COUNTRIES/SOUTHASIAEXT/EXTSAREG
TOPAGRI/0,,contentMDK:20273763~menuPK:548213~pagePK:34004173~piPK:34003707
~theSitePK:452766,00.html [Accessed 3 March 2012]
WFP (World Food Programme). (2005). Food security at a glance: Bangladesh. Available at:
http://www.foodsecurityatlas.org/bgd/country/food-security-at-a-glance. [Accessed 3 March
2012]
WARPO (Water Resources Planning Organization). (2006). Coastal Development Strategy.
Ministry of Water Resources. Government of the People’s Republic of Bangladesh

140
Sustainability of Changing Agricultural Systems in the Coastal Zone of Bangladesh
Web-HIPRE. (2012). Web-HIPRE global Decision Supports. Version 1.22. System Analysis
Laboratory. Helsinki University of Technology. Available at: http://www.hipre.hut.fi/
[Accessed 12 May 2012]

141
Sustainability of Changing Agricultural Systems in the Coastal Zone of Bangladesh
Appendices

142
Sustainability of Changing Agricultural Systems in the Coastal Zone of Bangladesh
Appendix-Tables
Table AP1.1: Productivity indicators of rice
Indicators Study Areas
Shyamnagar Kaliganj Kalaroa Dumuria Bhola Sadar
Land use in three seasons (hectare) 18.96 59.4 75.6 18.34 73.82
Total production (tonnes) 42.92 261.75 395.22 119.44 211.06
Market value of per kg rice (In Tk.) 19.05 19.38 20.29 22.33 13.82
Total price of total production (in Tk.) 817626 5072715 8018608 2667095.2 2916849.20
Total cost of total production (In Tk.) 523296 2865694 2970074 620820.37 1464169.50
Net income (in Tk.) 294330 2207021 5048534 2046275 1452680
Net income (In $) 3924.4 29426.95 67313.79 27283.66 19369.06
Productivity: Yield (tonnes/hectare) 2.28 4.41 5.25 6.51 2.86
Net income yield ($/ha) 206.98 495.40 890.39 1487.66 262.38
Average yield of the World (tonnes/hectare) 4.37
Average yield of Bangladesh_2008 (tonnes/hectare) 2.8
Note: 1$ US=Tk.75 (based on study period), Source: Based on questionnaire survey, 2011.
Table AP1.2: Productivity indicators of aro-ecosystem
Indicators Agro-Ecosystem (Sub division)
Study Areas
Shyamnagar Kaliganj Kalaroa Dumuria Bhola Sadar
Land Use(ha)
Rice+ Other crops 10.50(11.2%) 37.86(19.27%) 44.78(87.77%) 8.63(35.56%) 48.99(100%)
Aquatic Resources 83.25(88.8%) 158.58(80.73%) 6.24(12.23%) 15.64(64.44%) -
Total Land(ha) 93.75(100%) 196.43(100%) 51.02(100%) 24.27(100%) 48.99(100%)
Food Production (tonne)
Rice+ Other crops 42.92(68.85%) 272.84(81.78%) 423.55(99.95%) 120.87(96%) 227.13(100%)
Aquatic Resources 19.42(31.15%) 60.79(18.22%) 0.20(0.05%) 5.03(4%) -
Total 62.34(100%) 333.63(100%) 423.75(100%) 125.9(100%) 227.13(100%)
Food production(tonne/ha) 0.66 1.70 8.31 5.19 4.64
Net Income($)
Rice+ Other crops 3924.4(13.45%) 30878.3(15.4%) 80377.49(99.33%) 29232.56(66.70%) 26651.44(100%)
Aquatic Resources 25245.8(86.55%) 169557.7(84.6%) 536.26(0.67%) 14593.07(33.30%) -
Total 29170.2(100%) 200436(100%) 80913.75(100%) 43825.63(100%) 26651.44(100%)
Income($/ha) 311.15 1020.39 1585.92 1805.75 544.01
Food Protein(kg)
Rice+ Other crops 2918.56(45.50%) 17978.81(62.16%) 28127.64(99.87%) 8546.23(94.42%) 15621.37(100%)
Aquatic Resources 3495.6(54.50%) 10942.38(37.84%) 35.85(0.13%) 505.4(5.58%) -
Total 6414.16(100%) 28921.19(100%) 28163.49(100%) 9051.63(100%) 15621.37(100%)
Food Protein(kg/ha) 68.42 147.23 552.00 372.00 318.87
Food Energy (J/ha)
Rice+ Other crops 6.2X10¹¹ 3.8X10¹² 5.9X10¹² 1.7X10¹² 3.1X10¹²
Aquatic Resources 9.7X10¹⁰ 3.0X10¹¹ 1.0X10⁹ 2.5X10¹⁰ -
Total 7.2X10¹¹ 4.1X10¹² 5.9X10¹² 1.8X10¹² 3.1X10¹²
Food Energy(j/ha) 7.6X10⁹ 2.1X10¹⁰ 1.2X10¹¹ 7.2X10¹⁰ 6.4X10¹⁰
Source: Based on questionnaire survey, 2011.
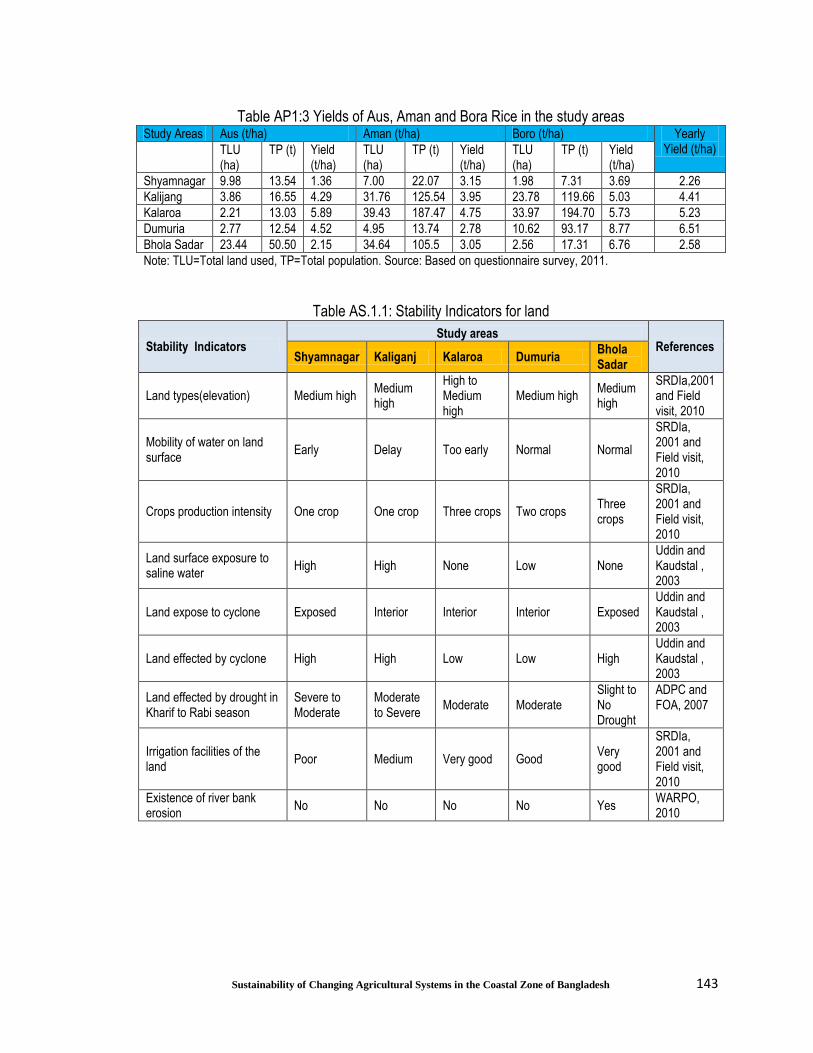
143
Sustainability of Changing Agricultural Systems in the Coastal Zone of Bangladesh
Table AP1:3 Yields of Aus, Aman and Bora Rice in the study areas Study Areas Aus (t/ha) Aman (t/ha) Boro (t/ha) Yearly
Yield (t/ha) TLU (ha)
TP (t) Yield (t/ha)
TLU (ha)
TP (t) Yield (t/ha)
TLU (ha)
TP (t) Yield (t/ha)
Shyamnagar 9.98 13.54 1.36 7.00 22.07 3.15 1.98 7.31 3.69 2.26
Kalijang 3.86 16.55 4.29 31.76 125.54 3.95 23.78 119.66 5.03 4.41
Kalaroa 2.21 13.03 5.89 39.43 187.47 4.75 33.97 194.70 5.73 5.23
Dumuria 2.77 12.54 4.52 4.95 13.74 2.78 10.62 93.17 8.77 6.51
Bhola Sadar 23.44 50.50 2.15 34.64 105.5 3.05 2.56 17.31 6.76 2.58
Note: TLU=Total land used, TP=Total population. Source: Based on questionnaire survey, 2011.
Table AS.1.1: Stability Indicators for land
Stability Indicators Study areas
References Shyamnagar Kaliganj Kalaroa Dumuria
Bhola Sadar
Land types(elevation) Medium high Medium high
High to Medium high
Medium high Medium high
SRDIa,2001 and Field visit, 2010
Mobility of water on land surface
Early Delay Too early Normal Normal
SRDIa, 2001 and Field visit, 2010
Crops production intensity One crop One crop Three crops Two crops Three crops
SRDIa, 2001 and Field visit, 2010
Land surface exposure to saline water
High High None Low None Uddin and Kaudstal , 2003
Land expose to cyclone Exposed Interior Interior Interior Exposed Uddin and Kaudstal , 2003
Land effected by cyclone High High Low Low High Uddin and Kaudstal , 2003
Land effected by drought in Kharif to Rabi season
Severe to Moderate
Moderate to Severe
Moderate Moderate Slight to No Drought
ADPC and FOA, 2007
Irrigation facilities of the land
Poor Medium Very good Good Very good
SRDIa, 2001 and Field visit, 2010
Existence of river bank erosion
No No No No Yes WARPO, 2010

144
Sustainability of Changing Agricultural Systems in the Coastal Zone of Bangladesh
Table AS1.2: Ranking for land related indicators
Properties Qualitative Ranking
Quantitative Ranking
Remarks
Land Related
Land Types
Highland 5 Land which is above normal flood-level. It is good for various vegetables and orchard trees
Medium highland
4 Land which normally is flooded up to about 90 cm deep during the flood season. It is good for rice and jute.
Medium lowland
3 Land which normally is flooded between 90 and 180 cm deep during the flood season. It is very good for rice, jute, oilseeds etc.
Lowland 2 Land which normally is flooded between 180 and 300 cm deep during the flood season. It is good for deep water rice and local Boro rice.
Very lowland 1 Land which normally is flooded above 300 cm during the flood season. It is good for deep water rice.
Mobility of Water on Land
Too Early 5 Water moved from the land surface within Ashshin (September-November)
Early 4 Water moved from the land surface after Ashshin (September-November) but within Kartik (October-November)
Normal 3 Water moved from the land surface after Kartik (October-November) but within Ogrohaean (November-December)
Delay 2 Water moved from the land surface after Ogrohaean (November-December) but within second week of Poush (December-January)
Too Delay 1 Water moved from the land surface after second week of Poush (December-January)
Crop production Intensity
Three crops 3 Land produce three crops in a year
Two crops 2 Land produce two crops in a year
One crops 1 Land produce four crops in a year
Land surface exposure to saline water
None 3
Low 2
High 1
Land Exposure to Cyclone
Interior 2
Exposed 1
Land Effected by Cyclone
Low 3
Medium 2
High 1
Land effected by drought in kharif to rabi season
No 4
Lightly 3
Moderate 2
Severe 1
Irrigation facilities of the land
Very good 4 Depend on ground, surface and rain water
Good 3 Depend on ground and rain water
Medium 2 Depend on partly surface water and rain water
Poor 1 Depends on mostly rainwater
Existence of river bank erosion
No 2
Yes 1
Sources: SRDI, 2001, Note: Quantitative eanking (estimated.), 2011
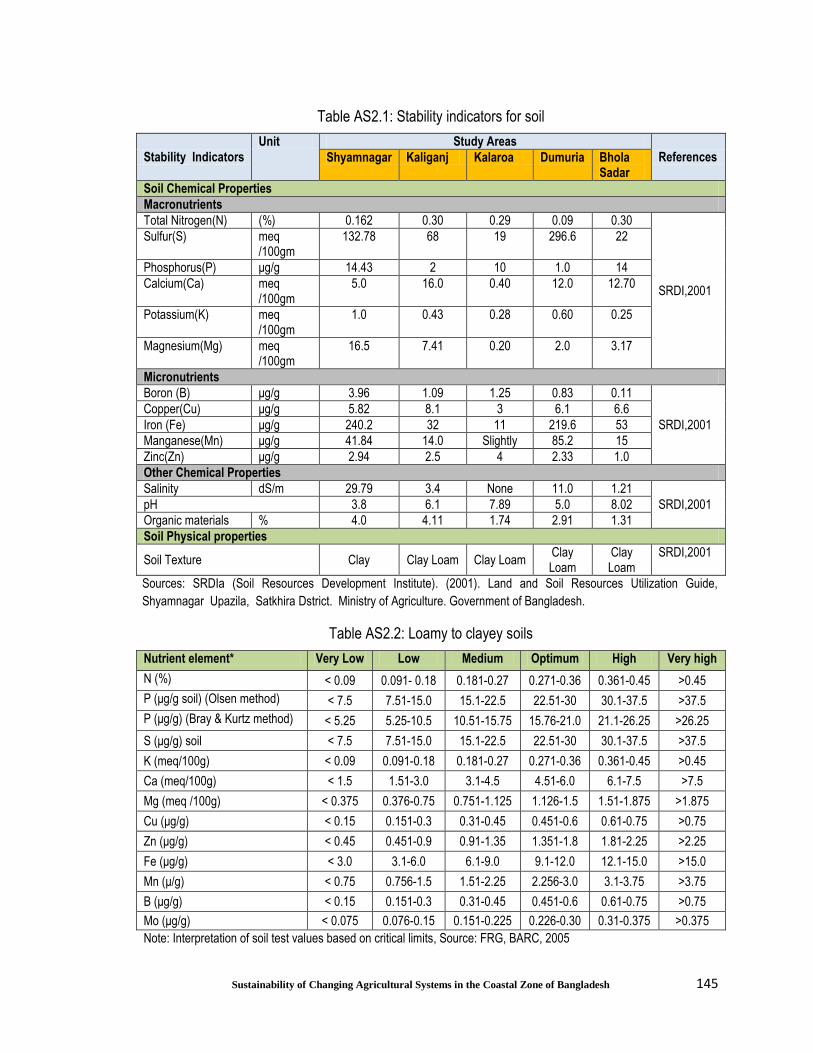
145
Sustainability of Changing Agricultural Systems in the Coastal Zone of Bangladesh
Table AS2.1: Stability indicators for soil
Stability Indicators
Unit Study Areas
References Shyamnagar Kaliganj Kalaroa Dumuria Bhola Sadar
Soil Chemical Properties
Macronutrients
Total Nitrogen(N) (%) 0.162 0.30 0.29 0.09 0.30
SRDI,2001
Sulfur(S) meq /100gm
132.78 68 19 296.6 22
Phosphorus(P) μg/g 14.43 2 10 1.0 14
Calcium(Ca) meq /100gm
5.0 16.0 0.40 12.0 12.70
Potassium(K) meq /100gm
1.0 0.43 0.28 0.60 0.25
Magnesium(Mg) meq /100gm
16.5 7.41 0.20 2.0 3.17
Micronutrients
Boron (B) μg/g 3.96 1.09 1.25 0.83 0.11
SRDI,2001
Copper(Cu) μg/g 5.82 8.1 3 6.1 6.6
Iron (Fe) μg/g 240.2 32 11 219.6 53
Manganese(Mn) μg/g 41.84 14.0 Slightly 85.2 15
Zinc(Zn) μg/g 2.94 2.5 4 2.33 1.0
Other Chemical Properties
Salinity dS/m 29.79 3.4 None 11.0 1.21
SRDI,2001 pH 3.8 6.1 7.89 5.0 8.02
Organic materials % 4.0 4.11 1.74 2.91 1.31
Soil Physical properties
Soil Texture Clay Clay Loam Clay Loam Clay Loam
Clay Loam
SRDI,2001
Sources: SRDIa (Soil Resources Development Institute). (2001). Land and Soil Resources Utilization Guide,
Shyamnagar Upazila, Satkhira Dstrict. Ministry of Agriculture. Government of Bangladesh.
Table AS2.2: Loamy to clayey soils
Nutrient element* Very Low Low Medium Optimum High Very high
N (%) < 0.09 0.091- 0.18 0.181-0.27 0.271-0.36 0.361-0.45 >0.45
P (μg/g soil) (Olsen method) < 7.5 7.51-15.0 15.1-22.5 22.51-30 30.1-37.5 >37.5
P (μg/g) (Bray & Kurtz method) < 5.25 5.25-10.5 10.51-15.75 15.76-21.0 21.1-26.25 >26.25
S (μg/g) soil < 7.5 7.51-15.0 15.1-22.5 22.51-30 30.1-37.5 >37.5
K (meq/100g) < 0.09 0.091-0.18 0.181-0.27 0.271-0.36 0.361-0.45 >0.45
Ca (meq/100g) < 1.5 1.51-3.0 3.1-4.5 4.51-6.0 6.1-7.5 >7.5
Mg (meq /100g) < 0.375 0.376-0.75 0.751-1.125 1.126-1.5 1.51-1.875 >1.875
Cu (μg/g) < 0.15 0.151-0.3 0.31-0.45 0.451-0.6 0.61-0.75 >0.75
Zn (μg/g) < 0.45 0.451-0.9 0.91-1.35 1.351-1.8 1.81-2.25 >2.25
Fe (μg/g) < 3.0 3.1-6.0 6.1-9.0 9.1-12.0 12.1-15.0 >15.0
Mn (μ/g) < 0.75 0.756-1.5 1.51-2.25 2.256-3.0 3.1-3.75 >3.75
B (μg/g) < 0.15 0.151-0.3 0.31-0.45 0.451-0.6 0.61-0.75 >0.75
Mo (μg/g) < 0.075 0.076-0.15 0.151-0.225 0.226-0.30 0.31-0.375 >0.375
Note: Interpretation of soil test values based on critical limits, Source: FRG, BARC, 2005
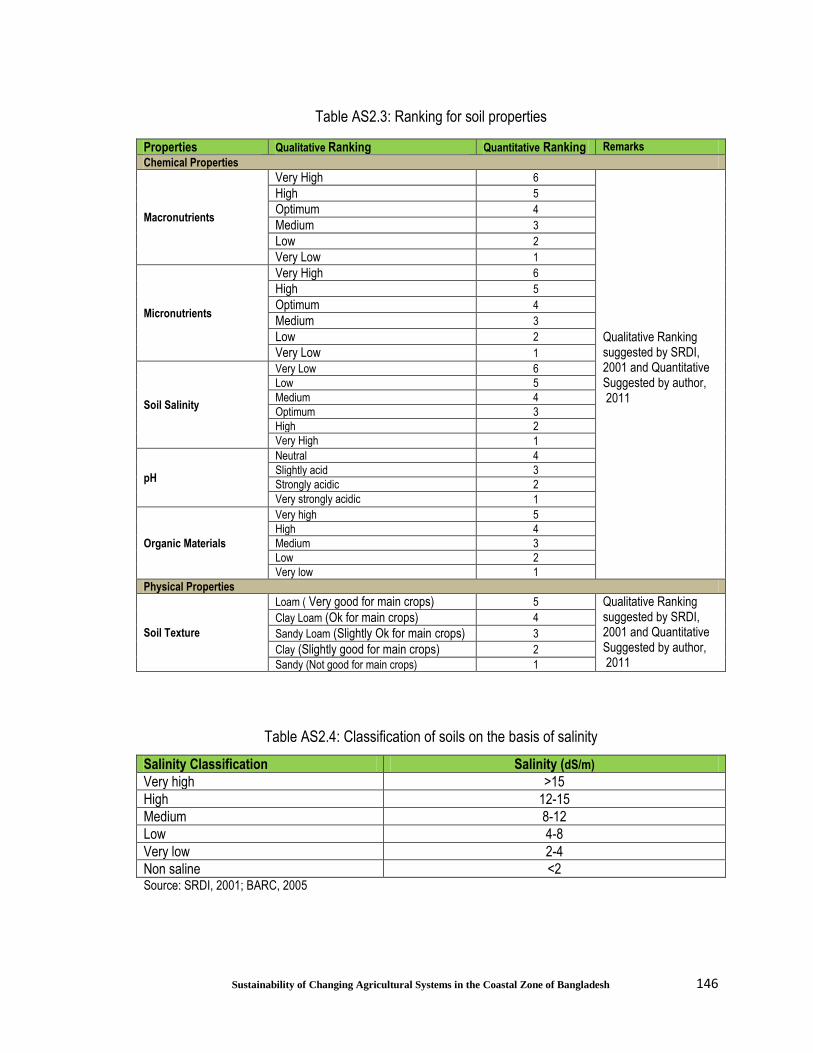
146
Sustainability of Changing Agricultural Systems in the Coastal Zone of Bangladesh
Table AS2.3: Ranking for soil properties
Properties Qualitative Ranking Quantitative Ranking Remarks
Chemical Properties
Macronutrients
Very High 6
Qualitative Ranking suggested by SRDI, 2001 and Quantitative Suggested by author, 2011
High 5
Optimum 4
Medium 3
Low 2
Very Low 1
Micronutrients
Very High 6
High 5
Optimum 4
Medium 3
Low 2
Very Low 1
Soil Salinity
Very Low 6
Low 5
Medium 4
Optimum 3
High 2
Very High 1
pH
Neutral 4
Slightly acid 3
Strongly acidic 2
Very strongly acidic 1
Organic Materials
Very high 5
High 4
Medium 3
Low 2
Very low 1
Physical Properties
Soil Texture
Loam ( Very good for main crops) 5 Qualitative Ranking suggested by SRDI, 2001 and Quantitative Suggested by author, 2011
Clay Loam (Ok for main crops) 4
Sandy Loam (Slightly Ok for main crops) 3
Clay (Slightly good for main crops) 2 Sandy (Not good for main crops) 1
Table AS2.4: Classification of soils on the basis of salinity
Salinity Classification Salinity (dS/m)
Very high >15
High 12-15
Medium 8-12
Low 4-8
Very low 2-4
Non saline <2 Source: SRDI, 2001; BARC, 2005
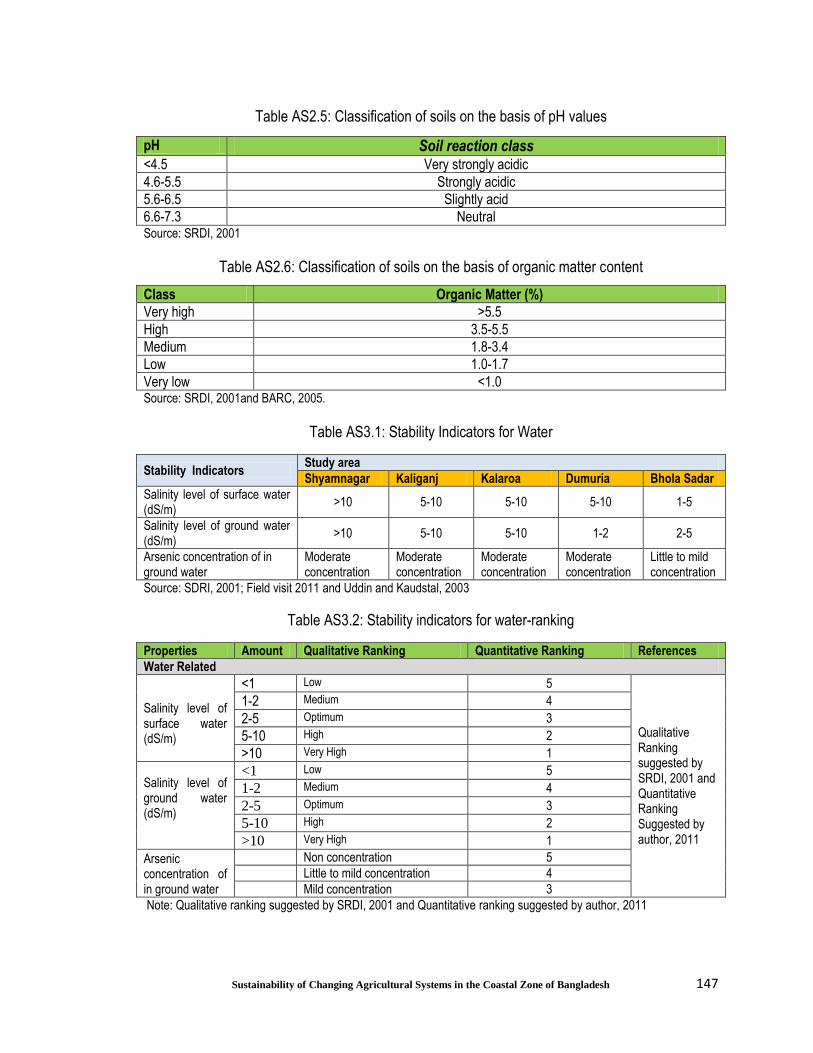
147
Sustainability of Changing Agricultural Systems in the Coastal Zone of Bangladesh
Table AS2.5: Classification of soils on the basis of pH values
pH Soil reaction class <4.5 Very strongly acidic 4.6-5.5 Strongly acidic 5.6-6.5 Slightly acid 6.6-7.3 Neutral Source: SRDI, 2001
Table AS2.6: Classification of soils on the basis of organic matter content
Class Organic Matter (%)
Very high >5.5
High 3.5-5.5
Medium 1.8-3.4
Low 1.0-1.7
Very low <1.0 Source: SRDI, 2001and BARC, 2005.
Table AS3.1: Stability Indicators for Water
Stability Indicators Study area
Shyamnagar Kaliganj Kalaroa Dumuria Bhola Sadar
Salinity level of surface water (dS/m)
>10 5-10 5-10 5-10 1-5
Salinity level of ground water (dS/m)
>10 5-10 5-10 1-2 2-5
Arsenic concentration of in ground water
Moderate concentration
Moderate concentration
Moderate concentration
Moderate concentration
Little to mild concentration
Source: SDRI, 2001; Field visit 2011 and Uddin and Kaudstal, 2003
Table AS3.2: Stability indicators for water-ranking
Properties Amount Qualitative Ranking Quantitative Ranking References
Water Related
Salinity level of surface water (dS/m)
<1 Low 5
Qualitative Ranking suggested by SRDI, 2001 and Quantitative Ranking Suggested by author, 2011
1-2 Medium 4
2-5 Optimum 3
5-10 High 2
>10 Very High 1
Salinity level of ground water (dS/m)
<1 Low 5
1-2 Medium 4
2-5 Optimum 3
5-10 High 2
>10 Very High 1
Arsenic concentration of in ground water
Non concentration 5
Little to mild concentration 4
Mild concentration 3
Note: Qualitative ranking suggested by SRDI, 2001 and Quantitative ranking suggested by author, 2011

148
Sustainability of Changing Agricultural Systems in the Coastal Zone of Bangladesh
Table AS5.1: Stability indicators for others
Stability Indicators
Study area Ref.
Shyamnagar Kaliganj Kalaroa Dumuria Bhola sadar
Withdraw of upstream water
Effected Effected Effected Effected Not Effected WARP, 2010
Drying of river Observed Observed Observed Observed Not observed
Field visit, 2010
Stability of embankment
Poorly managed and protected
Well managed and protected
Poorly managed and protected
Well managed and protected
Well managed and protected
Field visit, 2010
Transportation system
Moderate Good Good Good Poor Field visit, 2010
Table AS5.2: Ranking for other stability indicators
Properties Qualitative Ranking
Quantitative Ranking
Remarks References
Withdraw of upstream water
Not Effected 2 Effects are reported in literature WARP, 2010 Effected 1 Effects not reported in literature
Dying of river
Not Observed 2 Remain flow during summer and winter season Field visit, 2010
Observed 1 Flow of water stopped
Stability of embankment
Well protected 2 Embankment did not fail over 20 years Field visit, 2010
Poorly protected 1 Embankment failed within 20 years
Transportation system
Good 3 Connected with national high way
Field visit, 2010
Moderate 2 Somewhat connected with national high way
Poor 1 Not connected with national high away
Note: Suggested by author, 2011

149
Sustainability of Changing Agricultural Systems in the Coastal Zone of Bangladesh
Table AE1.1: Efficiency indicator of rice
Parameters Study Area
Shyamnagar Kaliganj Kalaroa Dumuria Bhola Sadar
Total land area for rice cultivation(ha) 10.50 37.86 44.78 8.63 48.99
Total income from input(in $) 6977.28 38209.3 39601 8277.6 19522.3
Total cost of output(in $) 10901.68 67636.2 1069144.8 35561.27 38891.32
Hectare wise efficiency in rice($/hectare) 373.75 777.31 1503.09 3161.49 395.37
Energy from output(J)
Total Harvest 6.32X10¹¹ 3.85X10¹² 5.81X10¹² 1.76X10¹² 3.1X10¹²
Mass of Stalks 1.0X10¹² 6.2X10¹² 9.4X10¹² 2.8X10¹² 5.0X10¹²
Total Output Energy 1.6X10¹² 1.0X10¹³ 1.5X10¹³ 4.6X10¹² 8.1X10¹²
Energy from Inputs(J)
Seed 2.6X10¹⁰ 8.7X10¹⁰ 6.7X10¹⁰ 1.7X10¹⁰ 6.9X10¹⁰
Fertilizer
Urea (N)* 2.0X10¹¹ 1.1X10¹² 1.7X10¹² 3.1X10¹¹ 1.0X10¹²
TSP (K)* 3.0X10¹⁰ 1.8X10¹¹ 2.7X10¹¹ 4.5X10¹⁰ 1.0X10¹¹
MOP (P)* 9.2X10⁹ 4.6X10¹⁰ 7.6X10¹⁰ 1.2X10¹⁰ 3.3X10¹⁰
Gypsum* 6.2X10⁹ 3.1X10¹⁰ 5.3X10¹⁰ 5.5X10⁹ -
Agro-Chemicals/Pesticide (Liquid)* 3.5X10¹⁰ 1.2X10¹¹ 1.1X10¹⁰ 2.3X10¹⁰ 6.9X10¹⁰
Diesel* 1.4X10¹⁰ 5.2X10¹¹ 5.0X10¹¹ 7.8X10¹⁰ 5.8X10¹⁰
Bullock Labour 2.3X10¹⁰ 7.1X10¹⁰ 9.1*1010 2.2X10¹⁰ 8.9X10¹⁰
Human Labour 3.2X10⁹ 1.3X10¹⁰ 1.1X10¹⁰ 3.0X10⁹ 1.1X10¹⁰
Total Input Energy(J) 3.5X10¹¹ 2.1X10¹² 2.9X10¹² 5.1X10¹¹ 1.5X10¹²
Overall energy Efficiency 4.73 4.69 5.27 8.92 5.6
Primary Energy Efficiency 1.81 1.79 2.02 3.42 2.14
Non-renewable primary energy efficiency 2.13 1.95 2.15 3.72 2.42
Non Renewable energy fraction 85.1% 92% 94.1% 91.9% 88.40%
Renewable energy fraction 14.9% 8% 5.9% 8.1% 11.6%
Note: (1) *Aspects of the operations that consume non-renewable energy. (2) N, P and K stands for Nitrogen, Potash and Phosphate, (2) Table E1.1 is based on Table E1.3, E1.4, E1.5, E1.6 and E 1.7.

150
Sustainability of Changing Agricultural Systems in the Coastal Zone of Bangladesh
Table AE1.2: Efficiency indicators of agro-ecosystem
Parameters Study Area
Shyamnagar Kaliganj Kalaroa Dumuria Bhola Sadar
Total input from agro-ecosystem($) 84503.48 361702.5 126302.9 68439.91 47360.2
Total output from agro-ecosystem ($) 55333.3 161267 45389.1 24614.3 20708.8
Ratio of output to input 1.53 2.24 2.78 2.78 2.29
Energy from output(J)
Total Harvest 7.16X10¹¹ 4.11X10¹² 5.88X10¹² 1.75X10¹² 3.13X10¹²
Mass of Stalks 1.02X10¹² 6.46X10¹² 1.0X10¹³ 2.86X10¹² 5.38X10¹²
Total output energy 1.73X10¹² 1.06X10¹³ 1.60X10¹³ 4.61X10¹² 8.51X10¹²
Energy from Inputs(J)
Seed 2.6X10¹⁰ 8.7X10¹⁰ 6.7X10¹⁰ 1.7X10¹⁰ 6.9X10¹⁰
Fertilizer
Urea (N)* 3.7X10¹¹ 2.49X10¹² 1.7X10¹² 4.3X10¹¹ 1.0X10¹²
TSP (K)* 3.6X10¹⁰ 2.51X10¹¹ 2.70X10¹¹ 5.47X10¹⁰ 1.0X10¹¹
MOP (P)* 9.2X10⁹ 4.6X10¹⁰ 7.6X10¹⁰ 1.2X10¹⁰ 3.3X10¹⁰
Gypsum* 6.2X10⁹ 3.1X10¹⁰ 5.3X10¹⁰ 5.5X10⁹ -
Agro-chemicals/Pesticide(Liquid)* 3.5X10¹⁰ 1.2X10¹¹ 1.1X10¹⁰ 2.3X10¹⁰ 6.9X10¹⁰
Lime* 2.72X10⁹ 7.8X10⁹ - 1.4X10⁸ -
Cow dung 1.8X10¹¹ 4.14X10¹¹ - 3.6X10¹⁰ -
Fish Feed 1.2X10¹¹ 1.94X10¹¹ - 5.7X10¹⁰ -
Diesel* 1.4X10¹⁰ 5.2X10¹¹ 5.0X10¹¹ 7.8X10¹⁰ 5.8X10¹⁰
Bullock Labour 2.3X10¹⁰ 7.1X10¹⁰ 9.1*1010 2.2X10¹⁰ 8.9X10¹⁰
Power Tiller* 4.4X10¹¹ 9.98X10¹¹ - 2.9X10⁹ 4.4X10¹¹
Human Labour 7.52X10⁹ 2.3X10¹⁰ 1.1X10¹⁰ 5.93X10⁹ 1.1X10¹⁰
Total input energy(J) 1.3X10¹² 5.3X10¹² 2.9X10¹² 8.3X10¹¹ 1.5X10¹²
Overall energy efficiency 1.37 2.01 5.53 5.54 5.9
Primary energy efficiency 0.57 0.78 2.04 2.10 2.16
Non-renewable primary energy efficiency
0.78 0.92 2.17 2.52 2.44
Non Renewable energy fraction 72.4% 84.97% 94.12% 83.44% 88.40%
Renewable energy fraction 27.6% 15.0% 5.9% 16.6% 11.6%
Note: (1) *Aspects of the operations that consume non-renewable energy, (2) N, P and K stands for Nitrogen, Potash
and Phosphate (3)Estimation of stalks without aquatic resources (4) Table E1.2 is based on Table E1.3, E1.4, E1.5, E1.6, E1.7, E1.8 and E1.9.
Table AE1.3: Total inputs used for rice production
Total Inputs Used Study Areas
Shyamnagar kaliganj Kalaroa Dumuria Bhola Sadar
Land (ha) 18.96 59.4 75.6 18.34 73.82
Seed(kg) 1760.10 5946.74 4567.55 1128.62
Urea(kg) 3355.92 17820 28350 5135
TSP(kg) 2730.24 16394 24267 4034
MOP(kg) 833.20 4158 6804 1100
Gypsum(kg) 618.36 3148.2 5292 550.20
Boron(kg) - 178.20 453.60 -
Cow dung(kg) - - - -
Liquid Pesticide(L) 294.34 1029.92 917.38 1766.56
Diesel(L) 321.10 11701.61 11201.96 192.05
Human labour(man day)* 1636 6726 5711.37 1533
Source: Questionnaire survey, 2011. Note: (1) *A man day was considered to be 8.00 hours in a day. (2) Per hectare 0.35 solid/powder pesticide is used and 1.2L liquid pesticide is used (Estimated).

151
Sustainability of Changing Agricultural Systems in the Coastal Zone of Bangladesh
Table AE1.4: Unit price observed for inputs used in rice production in study areas
Unit price Study Areas
Shyamnagar kaliganj Kalaroa Dumuria Bhola Sadar
Seed(Th/kg) 40 38 40
Urea(Tk/kg) 12 14 12 12 12
TSP(Tk/kg) 22 22 22 22 22
MOP(Tk/kg) 15 18 15 15 15
Gypsum(Tk/kg) 5 6 5 5 -
Boron(Tk/kg) 150 150 160 - -
Cow dung(Tk/kg) 6-7 4-5 5-6 5-6 3-4
Liquid Pesticide(Tk/L) 250 250 250 250 250
Diesel(Tk/L) 55 55 55 55 55
Human labour(Tk/Man day) 150 150 160 170 120
Source: Questionnaire survey, 2011. Note: Man-day = the amount of work per operation (day ha1); LH = the labor hours per day (8 h day1 in this study).
Table AE1.5: Output parameters of rice production
Crops
Study Areas
Shyamnagar Kaliganj Kalaroa Dumuria Bhola Sadar
TH MS* TH MS TH MS TH MS TH MS
Grain (Rice) 42.96 64.44 261.75 392.63 395.22 592.83 119.44 179.16 211.03 316.55
Wheat - - - - 0.33 0.42 - -
Aquatic Resources 19.42 - 60.79 - 0.20 - 5.3 - - -
Jute - - - - 18.07 36.14 - - - -
Oil seeds ( Sesame, Mustard)
- - 0.07 0.09 0.30 0.38 - - 0.19 0.23
Leguminous crops (Masoor Dhal, Kesari Dhal, Mung Dhal, Palen Dhal, Boot Dhal)
- - - - 1.75 2.19 - - 4.23 5.29
Vegetables (Potato, Bringel, Onion, Garlic, Kachur Mukhi, Oal Kachu, Indian spinach,
- - 11.01 2.2 14.07 2.94 1.43 0.29 10.46 2.09
Spices(Turmeric) - - - - 6.8 - - - - -
Fruits(Mango, Betel Nut)
- - - - 5.1 - - - 1.19 -
Source: Questionnaire survey, 2011. Note: (1) TH=Total Harvest (in tonne), MS=Mass of Stalks (in tonne), (2) 1.25kg stalks per 1 kg grain (estimated)*, (3) 0.2kg stalks per 1kg vegetable (estimated)*, (4) 2kg stalks per 1kg jute (estimated).

152
Sustainability of Changing Agricultural Systems in the Coastal Zone of Bangladesh
Table AE1.6: Energy co-efficient of different inputs and outputs
Input Crops Energy(MJkg-1) Output Energy(MJkg-1)
Seed
Jute 16.91
Main product
Jute fibre (cap.) 19.12
Rice 14.70 Jute fibre (oli.) 17.84
Wheat 14.70 Rice grain 14.70
Potato 4.06 Wheat grain 14.70
Lentil 14.40 Lentil grain 14.40
Dhaincha 14.70 Potato tuber 4.06
Fertilizer
Urea (Nitrogen) 60.10
By-product
Jute stick 16.91
MOP (Potash) 11.10 Rice straw 15.59
TSP(Phosphate) 11.10 Wheat straw 15.76
Gypsum 10.0* Lentil stover 12.50
Agrochemicals Solid/powder 12.00
Liquid 120.00
Diesel 56.31 MJ L-1
Human labour 1.96 MJ hr-1
Aquatic resources(estimated) 5.0
Source: Khan and Hossin, 2007; *vanloon et al., 2005
Table AE1.7: Protein and energy value in different agricultural products
Agricultural Production Protein (g/100g)
Energy (Kcal/100g)
Energy (J/kg)
Rice 6.8 345 1.4E+07
Wheat 11.8 346 1.4E+07
Potato 1.6 97 4054600
Mustard 4.0 34 this is for leaves 1421200
Til (Sesame) 18.3 563 2.4E+07
Masoor Dhal 25.1 343 1.4E+07
Kesari Dhal 28.2 345 1.4E+07
Mung Dhal 24.0 334 1.4E+07
Palen Dhal 24.0(est 334 1.4E+07
Boot Dhal 24.0(est) 334 1.4E+07
Turmeric 6.3 349 1.5E+07
Garlic 6.3 145 6061000
Onion 1.8 59 2466200
Chilli 2.9 29 1212200
Ladies Finger 1.9 35 1463000
Bringel 1.4 24 1003200
Indian Spinach 2.0 26 1086800
Mukhi Kachu (Colocasia esculenta) 3.0 97 4054600
Oal Kachu 3.0 97 4054600
Vegetable 1.7 (est) 50 (est) 2090000
Bitter Gourd 2.1 60 2508000
Sweet Pumpkin 1.4 25 1045000
Pumpkin(Kumra) 0.7(est) 17(est) 710600
Water melon 0.5 17(est) 710600
Betel nut 4.9 249 1E+07
Mango 0.6 74 3093200
Aquatic production (fishes) 18 (avg, not dried) 120 (avg, not dried) 5016000
Source: Gopalan et al., 1996

153
Sustainability of Changing Agricultural Systems in the Coastal Zone of Bangladesh
Table AE1.8: Energy efficiency in aquatic resources
Parameters Study Areas
Shyamnagar Kaliganj Kalaroa Dumuria
Total Fish Harvest 9.71X10¹⁰ 3.04X10¹¹ 1X10⁹ 2.52X10¹⁰
Mass of Stalks - - -
Total Output Energy 9.71X10¹⁰ 3.04X10¹¹ 1X10⁹ 2.52X10¹⁰
Fish Fry - - - -
Fertilizer
Cow dung - - - -
Urea (N)* 2X10¹¹ 1.42X10¹² 1.21X10¹¹
TSP (K)* 6X10⁹ 6.87X10¹⁰ - 9.88X10⁹
Lime and others - - - -
Power tiller 8X10⁹ 1.82X10¹⁰ - 1.67X10⁹
Human Labour 7X10¹¹ 1.68X10¹² - 5.01X10¹¹
Total Input Energy(J) 3.5X10¹¹ 2.3X10¹² 5.3X10¹¹
Overall energy Efficiency 4.68 4.36 8.58
Primary Energy Efficiency 1.79 1.67 3.29
Non-renewable primary energy efficiency 2.10 1.82 3.56
Non Renewable energy fraction 85.4% 91.64% 92.40%
Note: (1) *Aspects of the operations that consume non-renewable energy (2) N, P and K stands for Nitrogen, Potash and Phosphate.
Table AE1.9: Total inputs used for aquatic resources production
Input Parameters Study Areas
Shyamnagar Kaliganj Dumuria
Power tiller(Hours) 1346.15 3030.38 277.5
Labour 2200 5001 1492
Fertilizer
Cow dung(kg) 14000 33091.8 2886
Urea(kg) 2800 23637 2020
TSP(kg) 515 6190 890
Lime(kg) 20888 60023.5 1071.62
Feed(kg) 10708.6 167456 21808.29
Source: Questionnaire survey, 2011

154
Sustainability of Changing Agricultural Systems in the Coastal Zone of Bangladesh
Table AD1.1: Number of farmers not using chemical pesticide for agriculture
Indicators Study Areas
Shyamanagr Kaliganj Kalaroa Dumuria Bhola Sadar
Non-Chemical Response to Pest Stress 8 25 25 12 17
Number of total farmer 45 60 59 22 26
Source: Questionnaire survey, 2011
Table AD1.2: Farmers’ perception about critical month’s water availability
Stage Dry Spell
length(days) Drought Perception Ranking Score
Highest Ranking
Transplanting Stage
0 No water scarcity 4 1
4
0-5 Slightly water scarcity 3 0.75
5-8 Mild water scarcity 2 0.2
8-15 Moderate water scarcity
1 0.25
More than 15 Severe water scarcity 0 0
Flowering Stage
0 No water scarcity 4 1
4 0-5 Slightly water scarcity 3 0.75
5-7 Mild water scarcity 2 0.2
7-12 Moderate water scarcity
1 0.25
More than 12 Severe water scarcity 0 0 Source: FGD, 2011. Note: Based on the length of dry spells and crop phonological stages in study areas
Table AD1.3: Critical months of water availability for main crop (rice)
Study Areas Transplanting Stage Flowering Stage
Ranking Score Ranking Score
Shyamanagr 3 0.75 3 0.75
Kaliganj 3 0.75 3 0.75
Kalaroa 2 0.2 2 0.2
Dumuria 2 0.2 2 0.2
Bhola Sadar 2 0.2 2 0.2
Standard 4 1 4 1 Source: FGD, 2011
Table AD1.4: Number of farmers followed traditional and modern methods of seeds preservation
Indicators Study Areas
Shyamanagr Kaliganj Kalaroa Dumuria Bhola Sadar
Follow traditional system of seed preservation
45 57 54 20 26
Follow improved system of seed preservation
0 3 5 2 0
Number of total farmer 45 60 59 22 26
Source: Questionnaire survey, 2011

155
Sustainability of Changing Agricultural Systems in the Coastal Zone of Bangladesh
Table AD1.5: Ranking-seed preservation system
Indicators Ranking Score
Traditional system of seed preservation 1 0.5
Improve system of seed preservation 2 1
Highest ranking 2 1
Table AD1.6: Number of farmer followed traditional seeds preservation methods
Indicators Study Areas
Score for traditional system
Score for improve system
Total score
Probable highest score
Score in 10
Shyamanagr 45X0.5=22.5 0X2=0 22.5 45X2=90 (22.5/90)*10= 2.5
Kaliganj 57X0.5=28.5 3X2=6 34.5 60X2=120 2.88
Kalaroa 54X0.5=27 5X2=10 37 59X2=118 3.12
Dumuria 20X0.5=10 2X2=4 14 22X2=44 3.18
Bhola Sadar 26X0.5=13 0X2=0 13 26X2=52 2.5
Source: Questionnaire survey, 2011
Table AD1.7: Number of farmer reported of availability of seeds
Indicators Study Areas
Shyamanagr Kaliganj Kalaroa Dumuria Bhola Sadar
Availability of seed 42 57 59 22 23
Number of total farmer 45 60 59 22 26
Source: Questionnaire survey, 2011
Table AD1.8: Number of farmer reported of good price of products
Indicators Study Areas
Shyamanagr Kaliganj Kalaroa Dumuria Bhola Sadar
Good Price of the products 38 30 27 10 8
Number of total farmer 45 60 59 22 26
Source: Questionnaire survey, 2011
Table AD1.9: Number of farmer reported of availability of market
Indicators Study Areas
Shyamanagr Kaliganj Kalaroa Dumuria Bhola Sadar
Availability of market 45 55 50 22 20
Number of total farmer 45 60 59 22 26
Source: Questionnaire survey, 2011

156
Sustainability of Changing Agricultural Systems in the Coastal Zone of Bangladesh
Table AD1.10: Number of farmer engaged in other economic activities
Indicators Study Areas
Shyamanagr Kaliganj Kalaroa Dumuria Bhola Sadar
Other Economic Activities 28 26 35 10 18
Number of total farmer 45 60 59 22 26
Source: Questionnaire survey, 2011
Table AD1.11: Number of years when farmer’s income fall below a critical level
Indicators Study Areas
Shyamanagr Kaliganj Kalaroa Dumuria Bhola Sadar
Numbers of Years 3* 3* 1 2 4 Source: Literature survey and FGD, 2010. * Agriculture losses occurred due to cyclone effect. After 2009 Aila Cyclone,
farmer of the study areas observed losses in agriculture for one to three years
Table AD1.12: Ranking of years of economic hardship
Numbers of Economic Hardship Years Ranking Score Highest Ranking
0 11 1.00
11
1 10 0.91
2 9 0.82
3 8 0.73
4 7 0.64
5 6 0.55
6 5 0.45
7 4 0.36
8 3 0.27
9 2 0.18
10 1 0.09 Source: Developed by us, 2010
Table AD1.13: Number of farmer received agricultural training
Indicators Study Areas
Shyamanagr Kaliganj Kalaroa Dumuria Bhola Sadar
Received agricultural training 6 11 2 5 3
Number of total farmer 45 60 59 22 26
Source: Questionnaire survey, 2011
Table AD1.14: Number of farmer took advices from block supervisor
Indicators Study Areas
Shyamanagr Kaliganj Kalaroa Dumuria Bhola Sadar
Take advices from Block Supervisor 3 7 3 1 1
Number of total farmer 45 60 59 22 26
Source: Questionnaire survey, 2011
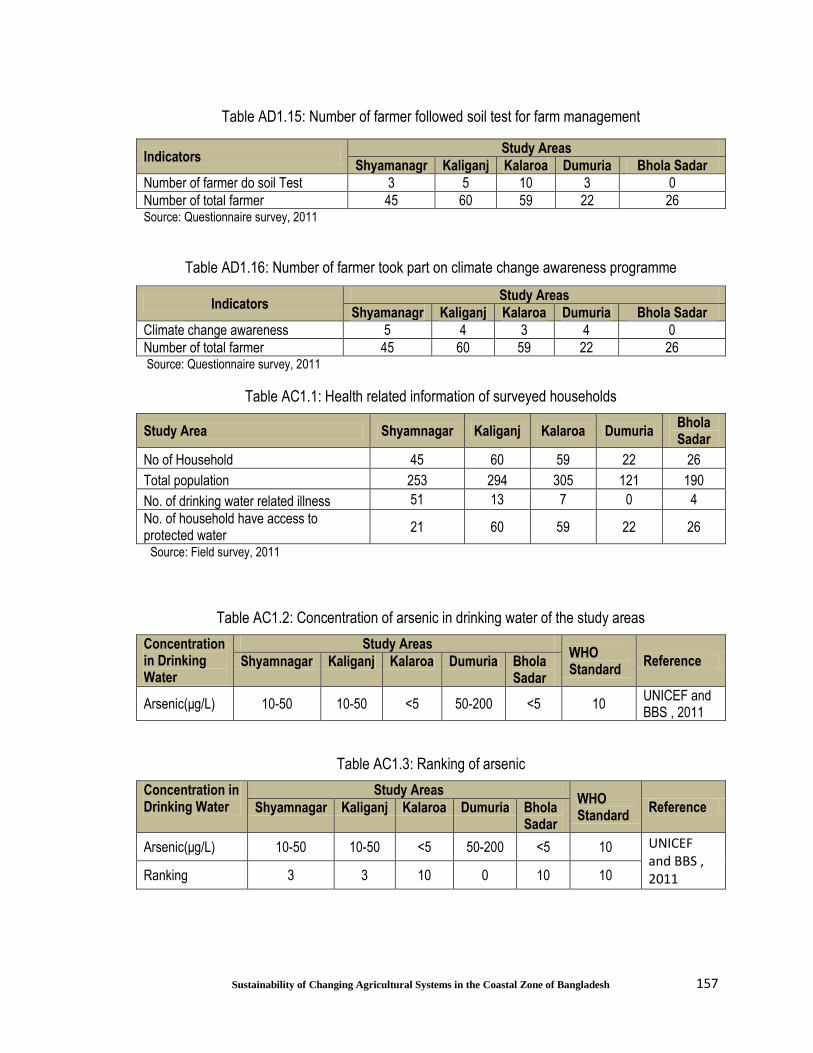
157
Sustainability of Changing Agricultural Systems in the Coastal Zone of Bangladesh
Table AD1.15: Number of farmer followed soil test for farm management
Indicators Study Areas
Shyamanagr Kaliganj Kalaroa Dumuria Bhola Sadar
Number of farmer do soil Test 3 5 10 3 0
Number of total farmer 45 60 59 22 26 Source: Questionnaire survey, 2011
Table AD1.16: Number of farmer took part on climate change awareness programme
Indicators Study Areas
Shyamanagr Kaliganj Kalaroa Dumuria Bhola Sadar
Climate change awareness 5 4 3 4 0
Number of total farmer 45 60 59 22 26 Source: Questionnaire survey, 2011
Table AC1.1: Health related information of surveyed households
Study Area Shyamnagar Kaliganj Kalaroa Dumuria Bhola Sadar
No of Household 45 60 59 22 26
Total population 253 294 305 121 190
No. of drinking water related illness 51 13 7 0 4
No. of household have access to protected water
21 60 59 22 26
Source: Field survey, 2011
Table AC1.2: Concentration of arsenic in drinking water of the study areas
Concentration in Drinking Water
Study Areas WHO Standard
Reference Shyamnagar Kaliganj Kalaroa Dumuria Bhola Sadar
Arsenic(μg/L) 10-50 10-50 <5 50-200 <5 10 UNICEF and BBS , 2011
Table AC1.3: Ranking of arsenic
Concentration in Drinking Water
Study Areas WHO Standard
Reference Shyamnagar Kaliganj Kalaroa Dumuria Bhola Sadar
Arsenic(μg/L) 10-50 10-50 <5 50-200 <5 10 UNICEF and BBS , 2011 Ranking 3 3 10 0 10 10
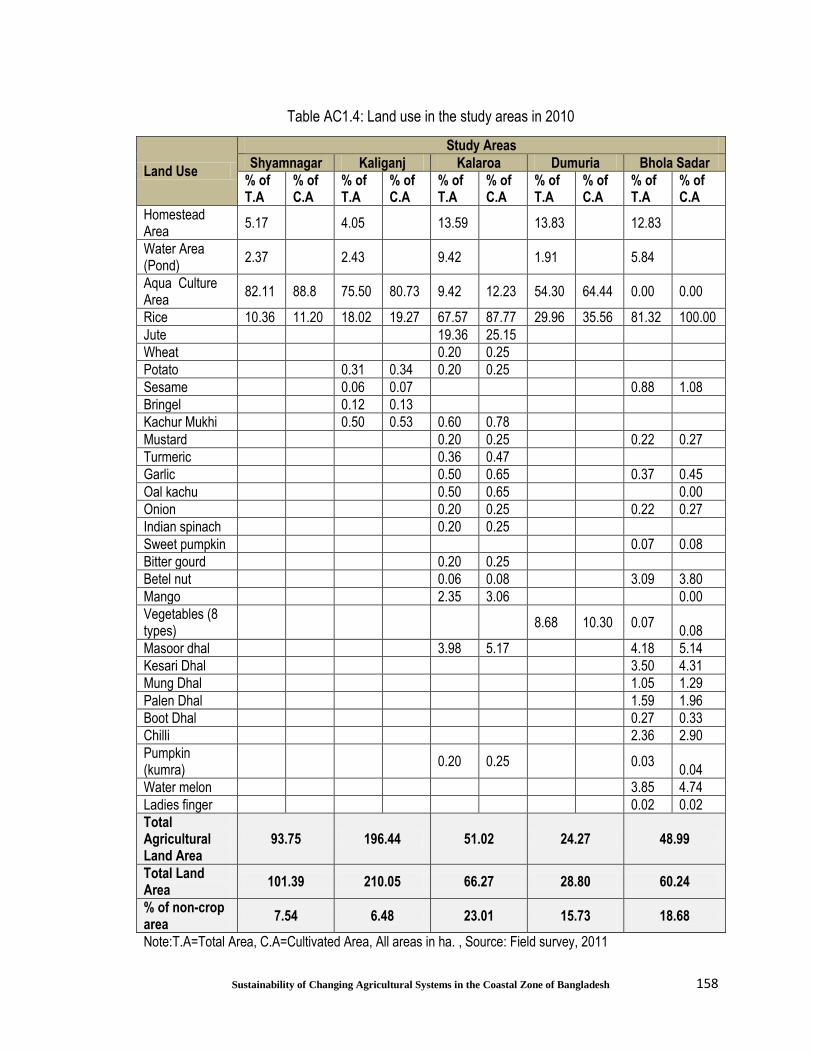
158
Sustainability of Changing Agricultural Systems in the Coastal Zone of Bangladesh
Table AC1.4: Land use in the study areas in 2010
Land Use
Study Areas
Shyamnagar Kaliganj Kalaroa Dumuria Bhola Sadar
% of T.A
% of C.A
% of T.A
% of C.A
% of T.A
% of C.A
% of T.A
% of C.A
% of T.A
% of C.A
Homestead Area
5.17 4.05 13.59 13.83 12.83
Water Area (Pond)
2.37 2.43 9.42 1.91 5.84
Aqua Culture Area
82.11 88.8 75.50 80.73 9.42 12.23 54.30 64.44 0.00 0.00
Rice 10.36 11.20 18.02 19.27 67.57 87.77 29.96 35.56 81.32 100.00
Jute 19.36 25.15
Wheat 0.20 0.25
Potato 0.31 0.34 0.20 0.25
Sesame 0.06 0.07 0.88 1.08
Bringel 0.12 0.13
Kachur Mukhi 0.50 0.53 0.60 0.78
Mustard 0.20 0.25 0.22 0.27
Turmeric 0.36 0.47
Garlic 0.50 0.65 0.37 0.45
Oal kachu 0.50 0.65 0.00
Onion 0.20 0.25 0.22 0.27
Indian spinach 0.20 0.25
Sweet pumpkin 0.07 0.08
Bitter gourd 0.20 0.25
Betel nut 0.06 0.08 3.09 3.80
Mango 2.35 3.06 0.00
Vegetables (8 types)
8.68 10.30 0.07 0.08
Masoor dhal 3.98 5.17 4.18 5.14
Kesari Dhal 3.50 4.31
Mung Dhal 1.05 1.29
Palen Dhal 1.59 1.96
Boot Dhal 0.27 0.33
Chilli 2.36 2.90
Pumpkin (kumra)
0.20 0.25 0.03 0.04
Water melon 3.85 4.74
Ladies finger 0.02 0.02
Total Agricultural Land Area
93.75 196.44 51.02 24.27 48.99
Total Land Area
101.39 210.05 66.27 28.80 60.24
% of non-crop area
7.54 6.48 23.01 15.73 18.68
Note:T.A=Total Area, C.A=Cultivated Area, All areas in ha. , Source: Field survey, 2011
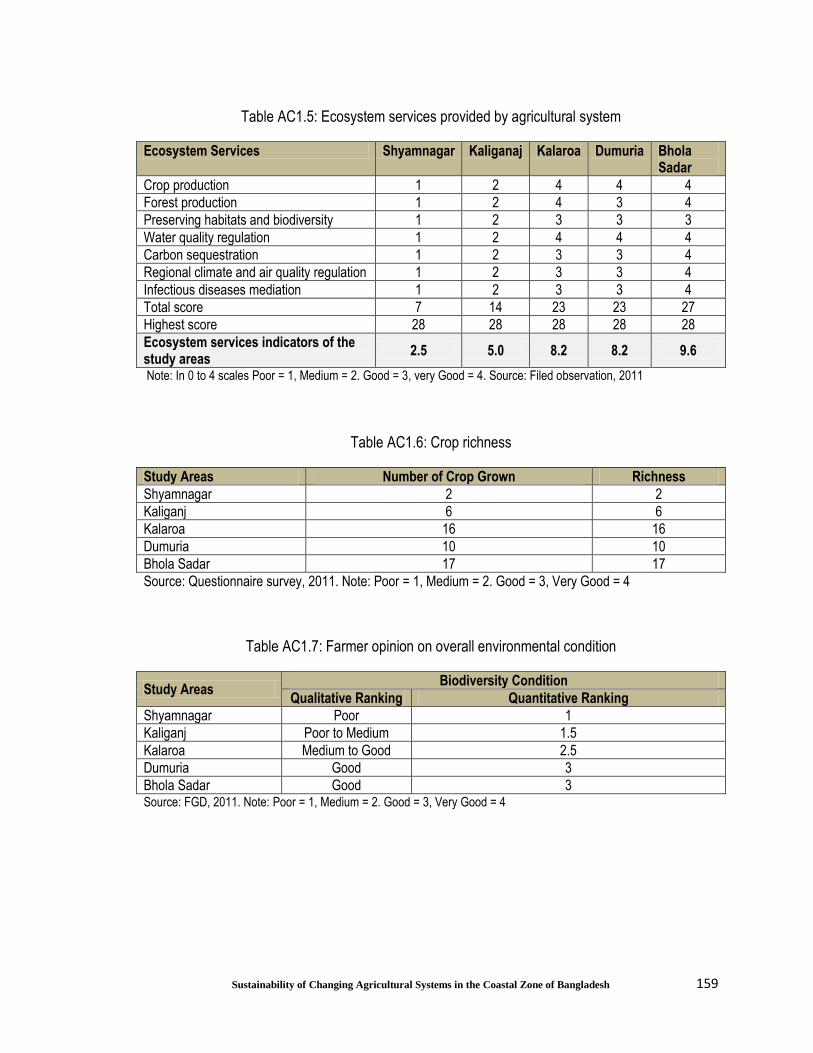
159
Sustainability of Changing Agricultural Systems in the Coastal Zone of Bangladesh
Table AC1.5: Ecosystem services provided by agricultural system
Ecosystem Services Shyamnagar Kaliganaj Kalaroa Dumuria Bhola Sadar
Crop production 1 2 4 4 4
Forest production 1 2 4 3 4
Preserving habitats and biodiversity 1 2 3 3 3
Water quality regulation 1 2 4 4 4
Carbon sequestration 1 2 3 3 4
Regional climate and air quality regulation 1 2 3 3 4
Infectious diseases mediation 1 2 3 3 4
Total score 7 14 23 23 27
Highest score 28 28 28 28 28
Ecosystem services indicators of the study areas
2.5 5.0 8.2 8.2 9.6
Note: In 0 to 4 scales Poor = 1, Medium = 2. Good = 3, very Good = 4. Source: Filed observation, 2011
Table AC1.6: Crop richness
Study Areas Number of Crop Grown Richness
Shyamnagar 2 2
Kaliganj 6 6
Kalaroa 16 16
Dumuria 10 10
Bhola Sadar 17 17
Source: Questionnaire survey, 2011. Note: Poor = 1, Medium = 2. Good = 3, Very Good = 4
Table AC1.7: Farmer opinion on overall environmental condition
Study Areas Biodiversity Condition
Qualitative Ranking Quantitative Ranking
Shyamnagar Poor 1
Kaliganj Poor to Medium 1.5
Kalaroa Medium to Good 2.5
Dumuria Good 3
Bhola Sadar Good 3 Source: FGD, 2011. Note: Poor = 1, Medium = 2. Good = 3, Very Good = 4
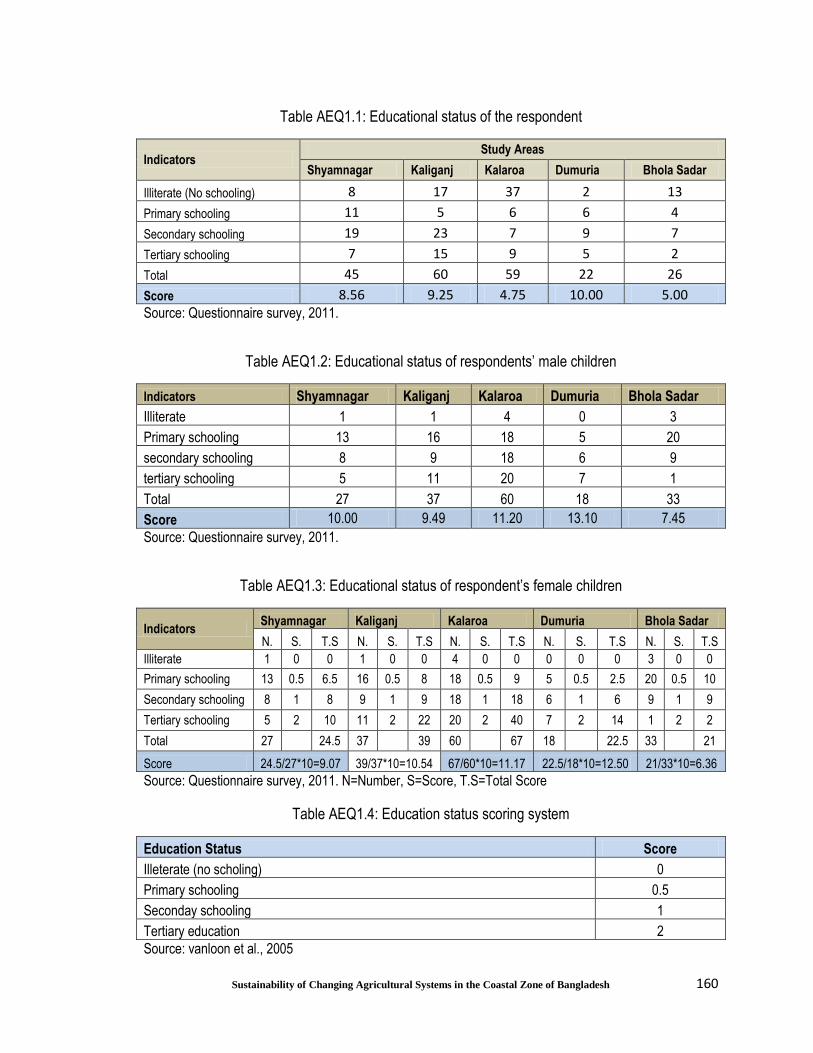
160
Sustainability of Changing Agricultural Systems in the Coastal Zone of Bangladesh
Table AEQ1.1: Educational status of the respondent
Indicators Study Areas
Shyamnagar Kaliganj Kalaroa Dumuria Bhola Sadar
Illiterate (No schooling) 8 17 37 2 13
Primary schooling 11 5 6 6 4
Secondary schooling 19 23 7 9 7
Tertiary schooling 7 15 9 5 2
Total 45 60 59 22 26
Score 8.56 9.25 4.75 10.00 5.00 Source: Questionnaire survey, 2011.
Table AEQ1.2: Educational status of respondents’ male children
Indicators Shyamnagar Kaliganj Kalaroa Dumuria Bhola Sadar
Illiterate 1 1 4 0 3
Primary schooling 13 16 18 5 20
secondary schooling 8 9 18 6 9
tertiary schooling 5 11 20 7 1
Total 27 37 60 18 33
Score 10.00 9.49 11.20 13.10 7.45
Source: Questionnaire survey, 2011.
Table AEQ1.3: Educational status of respondent’s female children
Indicators Shyamnagar Kaliganj Kalaroa Dumuria Bhola Sadar
N. S. T.S N. S. T.S N. S. T.S N. S. T.S N. S. T.S
Illiterate 1 0 0 1 0 0 4 0 0 0 0 0 3 0 0
Primary schooling 13 0.5 6.5 16 0.5 8 18 0.5 9 5 0.5 2.5 20 0.5 10
Secondary schooling 8 1 8 9 1 9 18 1 18 6 1 6 9 1 9
Tertiary schooling 5 2 10 11 2 22 20 2 40 7 2 14 1 2 2
Total 27 24.5 37 39 60 67 18 22.5 33 21
Score 24.5/27*10=9.07 39/37*10=10.54 67/60*10=11.17 22.5/18*10=12.50 21/33*10=6.36
Source: Questionnaire survey, 2011. N=Number, S=Score, T.S=Total Score
Table AEQ1.4: Education status scoring system
Education Status Score
Illeterate (no scholing) 0
Primary schooling 0.5
Seconday schooling 1
Tertiary education 2
Source: vanloon et al., 2005
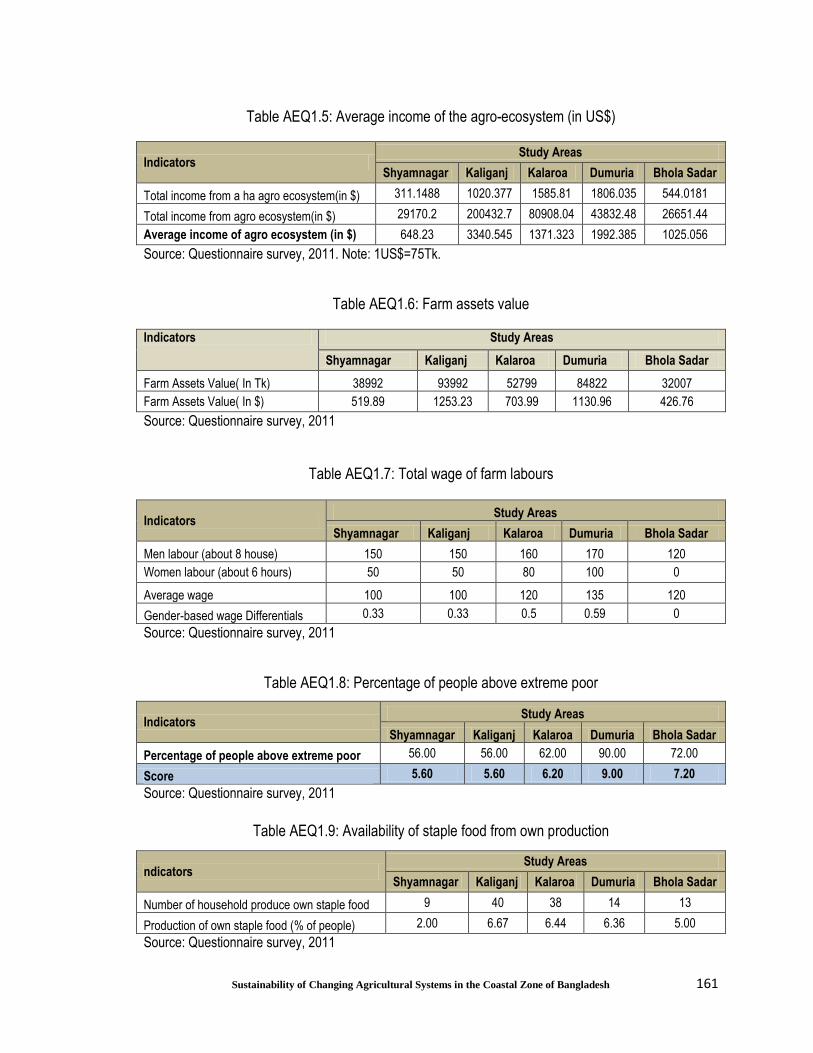
161
Sustainability of Changing Agricultural Systems in the Coastal Zone of Bangladesh
Table AEQ1.5: Average income of the agro-ecosystem (in US$)
Indicators Study Areas
Shyamnagar Kaliganj Kalaroa Dumuria Bhola Sadar
Total income from a ha agro ecosystem(in $) 311.1488 1020.377 1585.81 1806.035 544.0181
Total income from agro ecosystem(in $) 29170.2 200432.7 80908.04 43832.48 26651.44
Average income of agro ecosystem (in $) 648.23 3340.545 1371.323 1992.385 1025.056
Source: Questionnaire survey, 2011. Note: 1US$=75Tk.
Table AEQ1.6: Farm assets value
Indicators Study Areas
Shyamnagar Kaliganj Kalaroa Dumuria Bhola Sadar
Farm Assets Value( In Tk) 38992 93992 52799 84822 32007
Farm Assets Value( In $) 519.89 1253.23 703.99 1130.96 426.76
Source: Questionnaire survey, 2011
Table AEQ1.7: Total wage of farm labours
Indicators Study Areas
Shyamnagar Kaliganj Kalaroa Dumuria Bhola Sadar
Men labour (about 8 house) 150 150 160 170 120
Women labour (about 6 hours) 50 50 80 100 0
Average wage 100 100 120 135 120
Gender-based wage Differentials 0.33 0.33 0.5 0.59 0
Source: Questionnaire survey, 2011
Table AEQ1.8: Percentage of people above extreme poor
Indicators Study Areas
Shyamnagar Kaliganj Kalaroa Dumuria Bhola Sadar
Percentage of people above extreme poor 56.00 56.00 62.00 90.00 72.00
Score 5.60 5.60 6.20 9.00 7.20
Source: Questionnaire survey, 2011
Table AEQ1.9: Availability of staple food from own production
ndicators Study Areas
Shyamnagar Kaliganj Kalaroa Dumuria Bhola Sadar
Number of household produce own staple food 9 40 38 14 13
Production of own staple food (% of people) 2.00 6.67 6.44 6.36 5.00
Source: Questionnaire survey, 2011
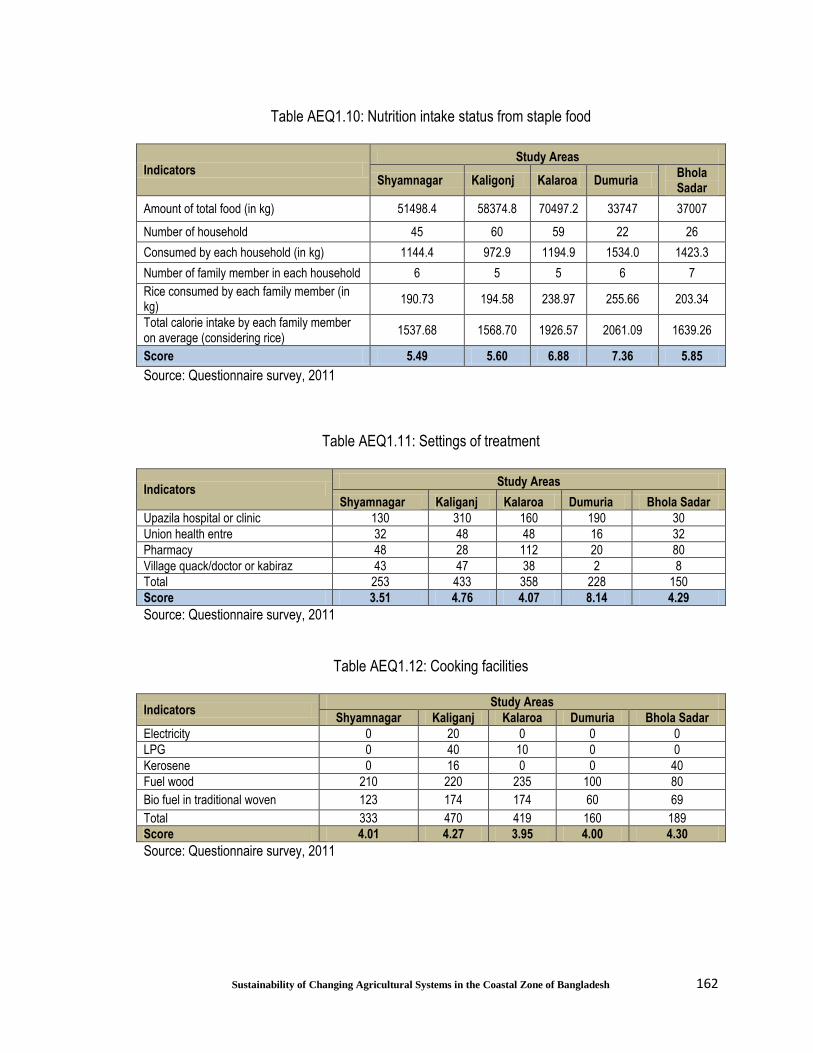
162
Sustainability of Changing Agricultural Systems in the Coastal Zone of Bangladesh
Table AEQ1.10: Nutrition intake status from staple food
Indicators Study Areas
Shyamnagar Kaligonj Kalaroa Dumuria Bhola Sadar
Amount of total food (in kg) 51498.4 58374.8 70497.2 33747 37007
Number of household 45 60 59 22 26
Consumed by each household (in kg) 1144.4 972.9 1194.9 1534.0 1423.3
Number of family member in each household 6 5 5 6 7
Rice consumed by each family member (in kg)
190.73 194.58 238.97 255.66 203.34
Total calorie intake by each family member on average (considering rice)
1537.68 1568.70 1926.57 2061.09 1639.26
Score 5.49 5.60 6.88 7.36 5.85
Source: Questionnaire survey, 2011
Table AEQ1.11: Settings of treatment
Indicators Study Areas
Shyamnagar Kaliganj Kalaroa Dumuria Bhola Sadar
Upazila hospital or clinic 130 310 160 190 30
Union health entre 32 48 48 16 32
Pharmacy 48 28 112 20 80
Village quack/doctor or kabiraz 43 47 38 2 8
Total 253 433 358 228 150
Score 3.51 4.76 4.07 8.14 4.29
Source: Questionnaire survey, 2011
Table AEQ1.12: Cooking facilities
Indicators Study Areas
Shyamnagar Kaliganj Kalaroa Dumuria Bhola Sadar
Electricity 0 20 0 0 0
LPG 0 40 10 0 0
Kerosene 0 16 0 0 40
Fuel wood 210 220 235 100 80
Bio fuel in traditional woven 123 174 174 60 69
Total 333 470 419 160 189
Score 4.01 4.27 3.95 4.00 4.30
Source: Questionnaire survey, 2011
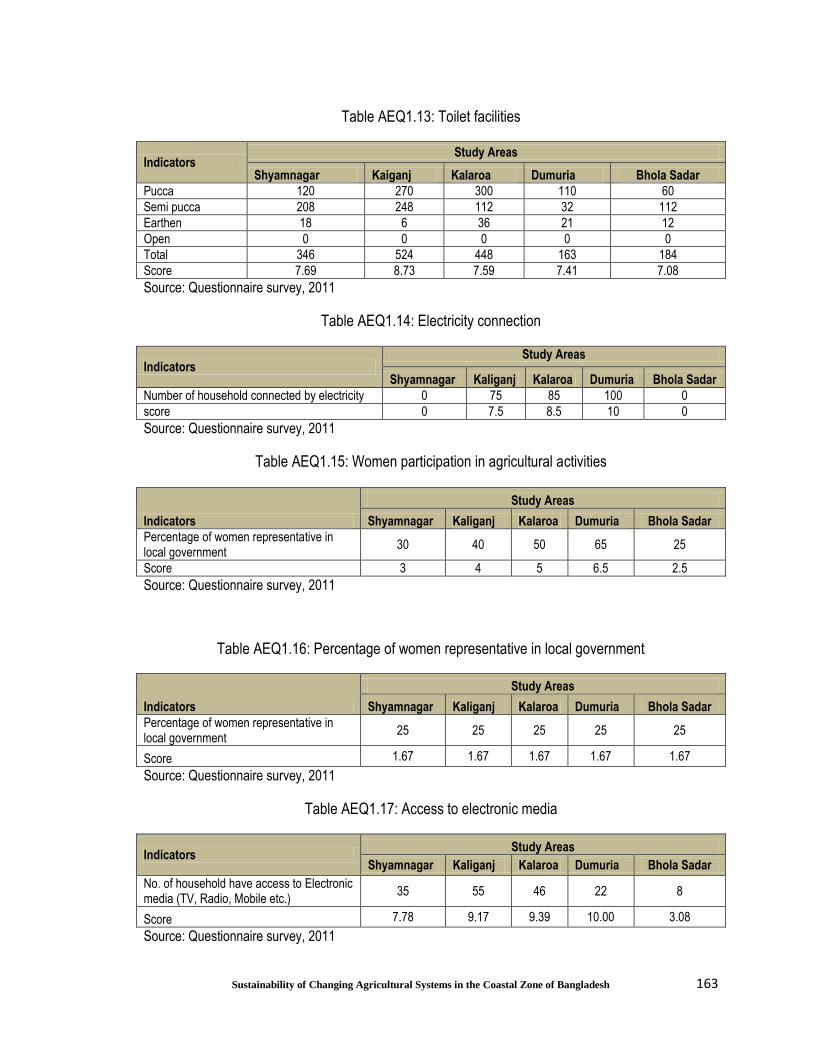
163
Sustainability of Changing Agricultural Systems in the Coastal Zone of Bangladesh
Table AEQ1.13: Toilet facilities
Indicators Study Areas
Shyamnagar Kaiganj Kalaroa Dumuria Bhola Sadar
Pucca 120 270 300 110 60
Semi pucca 208 248 112 32 112
Earthen 18 6 36 21 12
Open 0 0 0 0 0
Total 346 524 448 163 184
Score 7.69 8.73 7.59 7.41 7.08
Source: Questionnaire survey, 2011
Table AEQ1.14: Electricity connection
Indicators Study Areas
Shyamnagar Kaliganj Kalaroa Dumuria Bhola Sadar
Number of household connected by electricity 0 75 85 100 0
score 0 7.5 8.5 10 0
Source: Questionnaire survey, 2011
Table AEQ1.15: Women participation in agricultural activities
Indicators
Study Areas
Shyamnagar Kaliganj Kalaroa Dumuria Bhola Sadar
Percentage of women representative in local government
30 40 50 65 25
Score 3 4 5 6.5 2.5
Source: Questionnaire survey, 2011
Table AEQ1.16: Percentage of women representative in local government
Indicators
Study Areas
Shyamnagar Kaliganj Kalaroa Dumuria Bhola Sadar
Percentage of women representative in local government
25 25 25 25 25
Score 1.67 1.67 1.67 1.67 1.67
Source: Questionnaire survey, 2011
Table AEQ1.17: Access to electronic media
Indicators Study Areas
Shyamnagar Kaliganj Kalaroa Dumuria Bhola Sadar
No. of household have access to Electronic media (TV, Radio, Mobile etc.)
35 55 46 22 8
Score 7.78 9.17 9.39 10.00 3.08
Source: Questionnaire survey, 2011

164
Sustainability of Changing Agricultural Systems in the Coastal Zone of Bangladesh
Appendix - Questionnaire
Questionnaire on Sustainability of changing agricultural systems in the
coastal region of Bangladesh
Part-1: General information
1.1 Code:
1.2 Age:
1.3 Address:
Village: Union: Upazila: District:
1.4 Sex: Female � Male �
1.5 Marital status: Unmarried � Married � Widow � Widower �
1.6 Educational level of the respondent:
Education Level Please Tick
Gen
eral
ed
uca
tio
n
Can write name
Can read and write
Primary
Secondary
Diploma
SSC
HSC
Bachelor
Honours
Masters
Others
Mad
rash
a E
du
cati
on
Can write name
Can write and read
Elementary
Alim (12th Grade)
Fazil(14th grade)
Kamil (16th Grade)
Others
Question No: Date:
GPS information:

165
Sustainability of Changing Agricultural Systems in the Coastal Zone of Bangladesh
1.7 Number of family member:
1.8 Structure of the family: Joint Family � Single family �
1.9 Age of the children:
Childre
n No.
and sex
1 2 3 4 5 6 7 8 9 10
M F M F M F M F M F M F M F M F M F M F
Age( in
years)
Note: M=male, F=female
1.10 Educational status of the children:
Childre
n No. &
sex
Education Level General Education Madrasha Education
No
.
M F CW
N
CR&
W
P S D SS
C
HS
C
B H M O CW
N
CW&
R
E A F K O
Note: CWN=Can Write Name; CR&W=Can Read and Write; P=Primary; S=Secondary; D=Diploma; B=Bachelor; H=Honours; M=Masters; O=Others; E=Elementary; A=Alim; F=Fazil; and K=Kamil

166
Sustainability of Changing Agricultural Systems in the Coastal Zone of Bangladesh
1.11 Occupation:
Family member Occupation
Household head
Wife
1st children
2nd children
3rd children
4th children
5th children
6th children
Others
1.12 Usual food intake (by family member):
Time Items
Morning
Noon
Night
Others
1.13 Information about disease among family members:
Name of the disease(in last one year) Effected person’s age Sex
M F
Diarrhoea
Stomach pain
Cholera
Lose motion
Decentre
Hookworm infection
Ring worm
Itching
Allergic reaction
Skin disease
Cold
Influenza
Fever
Malaria
Typhoid
Dengue
High blood pressure
Low blood pressure
Hart disease
Tuberculosis
Diabetes
Jaundice (Hepatitis)
Arsenicosis
Anaemia
Lead poisoning

167
Sustainability of Changing Agricultural Systems in the Coastal Zone of Bangladesh
Malnutrition
Polio
Scabies
Blindness
Cataract
Drossiness
Other diseases (agro chemical related disease)
1.14 Sources of drinking, household use and irrigation water:
Sl. No. Name of the Sources Uses
Household Dinking Irrigation
Tube well
Deep tube well
Open well
Shallow well
Protected well
Hand pump/paddle pump
River
Pond
Wetlands
Rain water
Others
1.15 Land area of homestead (in local unit1):
1.16 Area of agriculture land (in local unit):
1.17 Number of Ghare:
1.18 Area of Ghare:
1.19 Number of pond:
1.20 Area of pond:
1.21 Total family income (in a year):
1.22 Assets:
1 1 Acre = 100 De5cimals, 1 Bigha = 33 Decimals, 1 Kattha = 720 sq.ft., 1 Bigha = 20

168
Sustainability of Changing Agricultural Systems in the Coastal Zone of Bangladesh
Name of the Assets Number Prices(In Tk.)
TV
Radio
Van
Mobile
Bicycle
Cow/Buffalo Carts
Furniture
Others
1.23 Housing materials: No. of
House
Materials used
Wall Roof Structure Floor
B T M P O B T M P O B T M P O B T M P O
Note: B=bamboo, T=Tin, P= Plastic, M=Mud, O=Others
1.24 What is the sharing mechanism of agriculture productions? Share Amount of production
Farmer share
Land Owner share
Other Information
4.16: Is there any migration among family members. If yes, who migrated and why and
where? How long? What are the ages of the migrants?
Part-2: Information of crop production
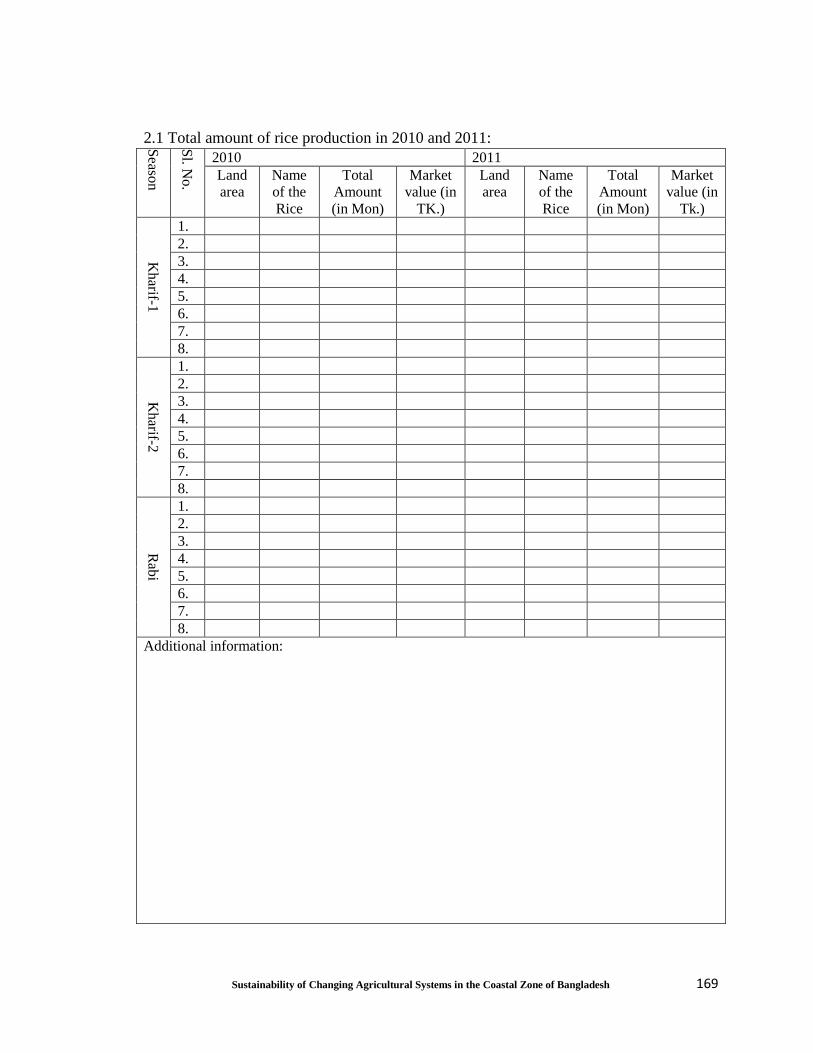
169
Sustainability of Changing Agricultural Systems in the Coastal Zone of Bangladesh
2.1 Total amount of rice production in 2010 and 2011: S
eason
Sl. N
o.
2010 2011
Land
area
Name
of the
Rice
Total
Amount
(in Mon)
Market
value (in
TK.)
Land
area
Name
of the
Rice
Total
Amount
(in Mon)
Market
value (in
Tk.)
Kh
arif-1
1.
2.
3.
4.
5.
6.
7.
8.
Kharif-2
1.
2.
3.
4.
5.
6.
7.
8.
Rab
i
1.
2.
3.
4.
5.
6.
7.
8.
Additional information:

170
Sustainability of Changing Agricultural Systems in the Coastal Zone of Bangladesh
2.2 Total amount of fish production in 2010 and 2011: S
eason
Sl.N
o.
2010 2011
Po
nd
area
Gh
are area
Fish
name
Total
Amount
(in Mon)
Market
value
(in
Tk.)
Po
nd
area
Gh
are arae
Fish
name
Total
Amount
(in
Mon)
Market
value
(in Tk.)
Su
mm
er
1
2
3
4
5
7
Win
ter
1
2
3
4
5
6
Additional information: (How much fish can they catch from river, wetlands and sea? Type of
caught fishes, catching cost and market value etc.)

171
Sustainability of Changing Agricultural Systems in the Coastal Zone of Bangladesh
2.3 Total amount of other crops production in 2010 and 2011:
Sea
son
Sl.N
o
2010 2011
Land
area
Crops
Name
Total
Amount
(in
Mon)
Market
value (in
Tk.)
Land
area
Crops
Name
Total
Amount
(in
Mon)
Market
value (in
TK.)
Kh
arif-1
1
2
3
4
5
6
7
8
Kh
arif-2
1
2
3
4
5
6
7
8 R
ab
i
1
2
3
4
5
6
7
8

172
Sustainability of Changing Agricultural Systems in the Coastal Zone of Bangladesh
Additional information:
2.4 Total amount of poultry production in 2010 and 2011:
Poultry
2010 2011
Total
number
Market value
(in TK.)
Total number Market value
(in TK.)
Hen for meat
Hen for egg
Duck for egg
Duck for
meat
Pigeons for
meat
Additional information:
2.5 Total amount of cattle production in 2010 and 2011:
Cattle
2010 2011
Total
number
Market value (in TK.)
Total
number
Market value (In TK.)
Milk Meat Others
(skin,
cow
dung
etc.)
Milk Meat Others
(skin,
cow
dung
etc.)
Cow for
milk/plough
Caw for
meat/plough/
cart
Goat/ Ram

173
Sustainability of Changing Agricultural Systems in the Coastal Zone of Bangladesh
Buffalo for
milk
Buffalo for
meat/plough/
cart
Additional information:
2.6 Total amount of vegetables production in 2010 and 2011:
Sea
son
Sl.N
o
2010 2011
Land
area
Vegetables
name
Total
Amoun
t
(in
Mon)
Mark
et
value
(in
TK.)
Land
area
Vegetabl
es name
Total
Amoun
t
(in
Mon)
Marke
t value
(In
TK.)
Kh
arif-1
1
2
3
4
5
6
7
8
Kh
arif-2
1
2
3

174
Sustainability of Changing Agricultural Systems in the Coastal Zone of Bangladesh
4
5
6
7
8
Rab
i
1
2
3
4
5
6
7
8
Additional information:
2.7 Total amount of homestead production in 2010 and 2011:
Sl.N
o
2010 2011
Land
area
crops/
vegetable/
fruits/
vegetation
name
Total
Amoun
t/numb
er
Marke
t value
Lan
d
area
crops/
vegetable
s/fruits/
vegetatio
n Name
Total
Amoun
t/numb
er
Marke
t value
1
2
3
4

175
Sustainability of Changing Agricultural Systems in the Coastal Zone of Bangladesh
5
6
7
8
Additional information (Name of the trees in the homestead area):
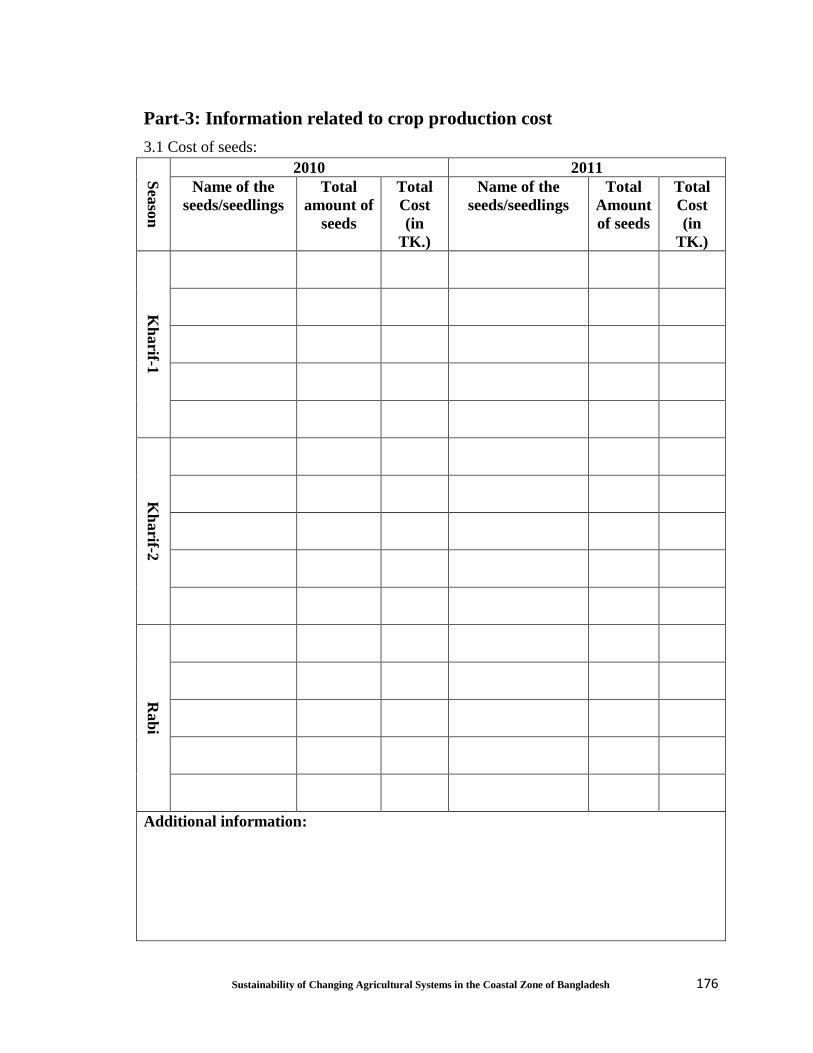
176
Sustainability of Changing Agricultural Systems in the Coastal Zone of Bangladesh
Part-3: Information related to crop production cost
3.1 Cost of seeds:
Sea
son
2010 2011
Name of the
seeds/seedlings
Total
amount of
seeds
Total
Cost
(in
TK.)
Name of the
seeds/seedlings
Total
Amount
of seeds
Total
Cost
(in
TK.)
Kh
arif-1
Kh
arif-2
Rab
i
Additional information:

177
Sustainability of Changing Agricultural Systems in the Coastal Zone of Bangladesh
3.2 Cost of fertilizer:
Sea
son
2010 2011
Name of the fertilizer Total
amoun
t (in
kg)
Tota
l
Cost
(in
TK.)
Name of the fertilizer Total
Amoun
t (in
kg)
Tota
l
Cost
(in
TK.)
Commerci
al
Chemic
al
Commerci
al
Chemic
al
Kh
arif-1
Kh
arif-2
Ra
bi
Additional information ( Organic fertilizer):

178
Sustainability of Changing Agricultural Systems in the Coastal Zone of Bangladesh
3.3 Cost of pesticide:
Sea
son
2010 2011
Name of the
insecticide
Total
amoun
t (in
kg/
litter)
Tota
l
Cost
(in
TK.)
Name of the
insecticide
Total
Amoun
t (in
kg/
litter)
Tota
l
Cost
(in
TK.)
Commerci
al
Chemic
al
Commerci
al
Chemic
al
Kh
arif-1
Kh
arif-2
Rab
i
Additional information:

179
Sustainability of Changing Agricultural Systems in the Coastal Zone of Bangladesh
3.4 Cost of irrigation:
Sea
son
2010 2011
Source of
Irrigation
Total
amount (in
litter)
Total Cost
(in TK.)
Source of
irrigation
Total
Amount
(in litter)
Total
Cost
(in
TK.)
Kh
arif-1
Kh
arif-2
Rab
i
Additional information:

180
Sustainability of Changing Agricultural Systems in the Coastal Zone of Bangladesh
3.5 Cost of labour:
Sea
son
2010 2011
Name of
the
crops
Number
of
labour
Total
workin
g days
Total
Cost
(in
TK.)
Name of
the
crops
Number
of labour
Total
workin
g days
Total
Cost
(in
TK.)
Kh
arif-1
Kh
arif-2
Rab
i
Additional information:
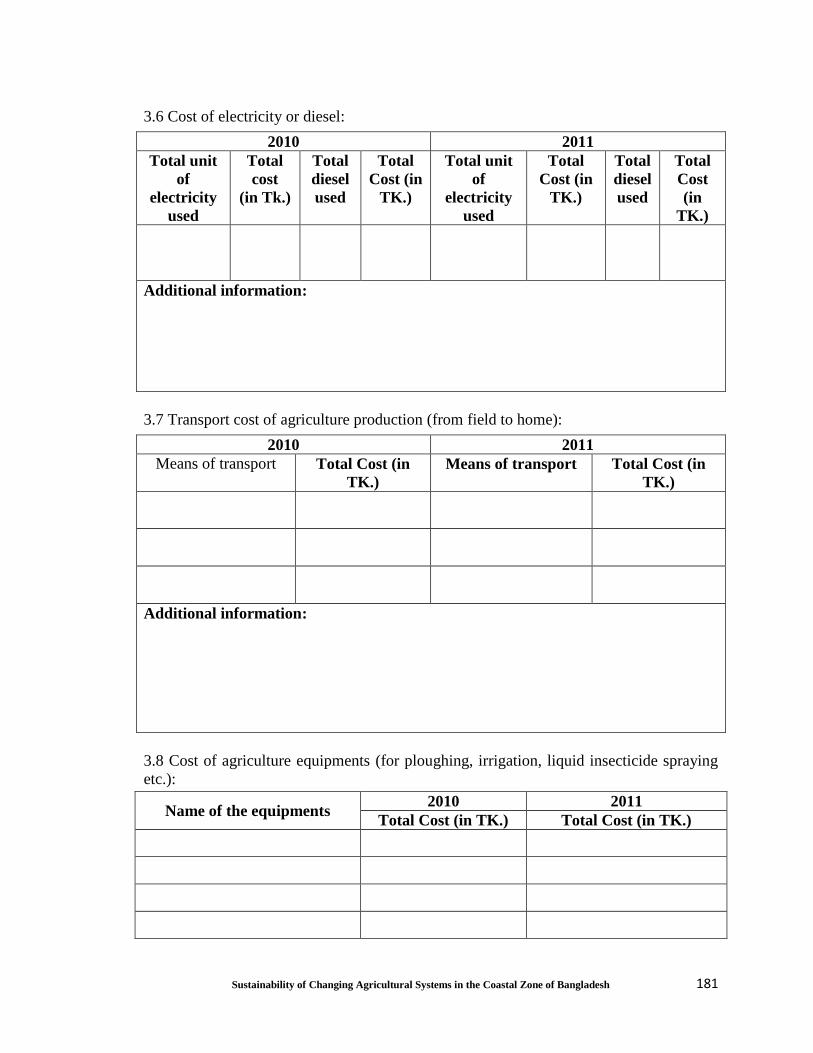
181
Sustainability of Changing Agricultural Systems in the Coastal Zone of Bangladesh
3.6 Cost of electricity or diesel:
2010 2011
Total unit
of
electricity
used
Total
cost
(in Tk.)
Total
diesel
used
Total
Cost (in
TK.)
Total unit
of
electricity
used
Total
Cost (in
TK.)
Total
diesel
used
Total
Cost
(in
TK.)
Additional information:
3.7 Transport cost of agriculture production (from field to home):
2010 2011
Means of transport Total Cost (in
TK.)
Means of transport Total Cost (in
TK.)
Additional information:
3.8 Cost of agriculture equipments (for ploughing, irrigation, liquid insecticide spraying
etc.):
Name of the equipments 2010 2011
Total Cost (in TK.) Total Cost (in TK.)
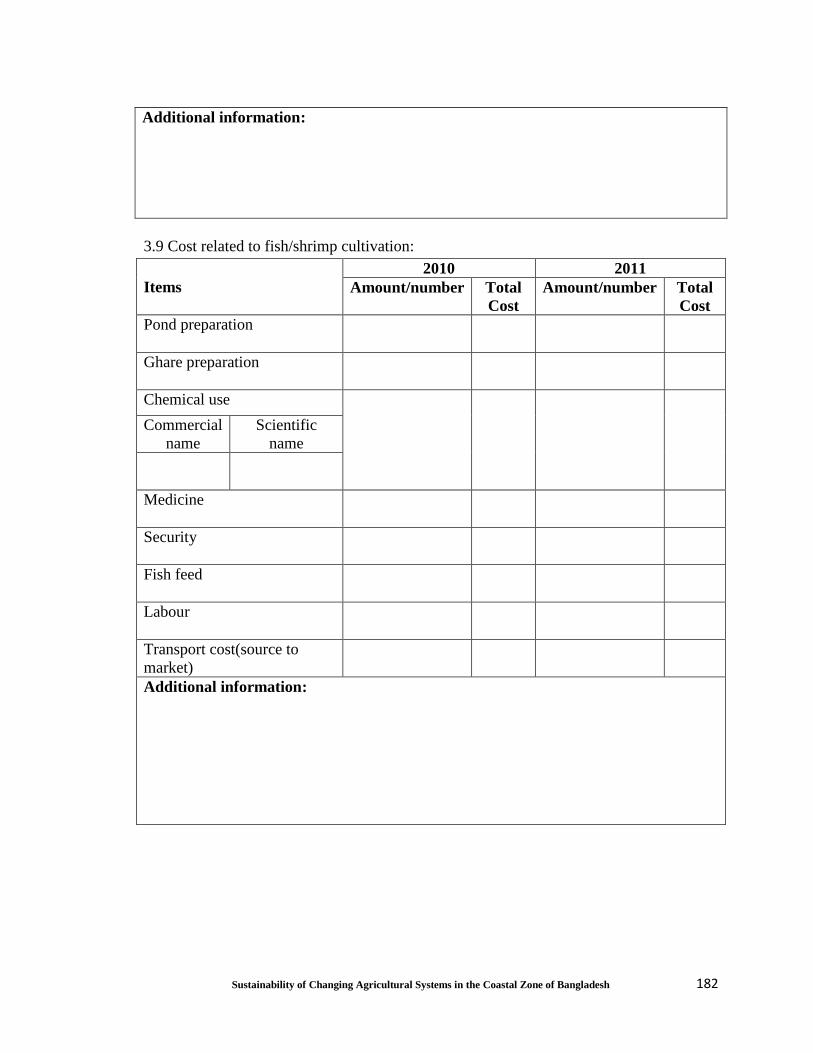
182
Sustainability of Changing Agricultural Systems in the Coastal Zone of Bangladesh
Additional information:
3.9 Cost related to fish/shrimp cultivation:
Items
2010 2011
Amount/number Total
Cost
Amount/number Total
Cost
Pond preparation
Ghare preparation
Chemical use
Commercial
name
Scientific
name
Medicine
Security
Fish feed
Labour
Transport cost(source to
market)
Additional information:
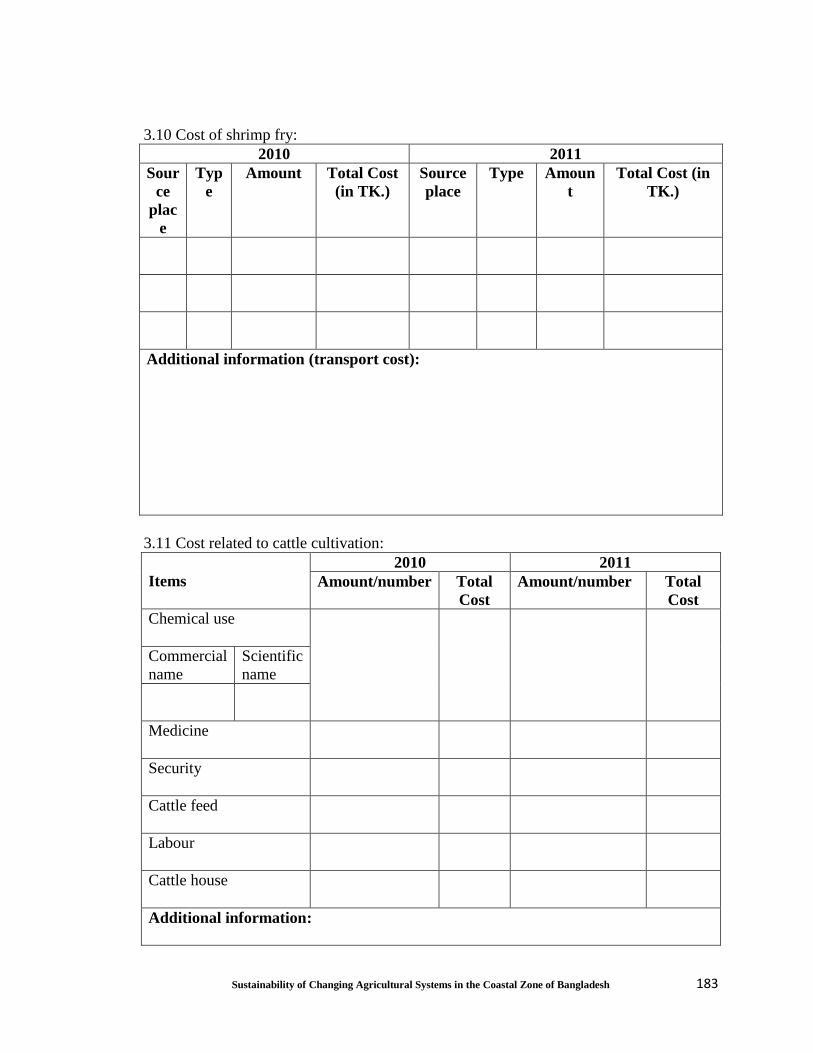
183
Sustainability of Changing Agricultural Systems in the Coastal Zone of Bangladesh
3.10 Cost of shrimp fry:
2010 2011
Sour
ce
plac
e
Typ
e
Amount Total Cost
(in TK.)
Source
place
Type Amoun
t
Total Cost (in
TK.)
Additional information (transport cost):
3.11 Cost related to cattle cultivation:
Items
2010 2011
Amount/number Total
Cost
Amount/number Total
Cost
Chemical use
Commercial
name
Scientific
name
Medicine
Security
Cattle feed
Labour
Cattle house
Additional information:
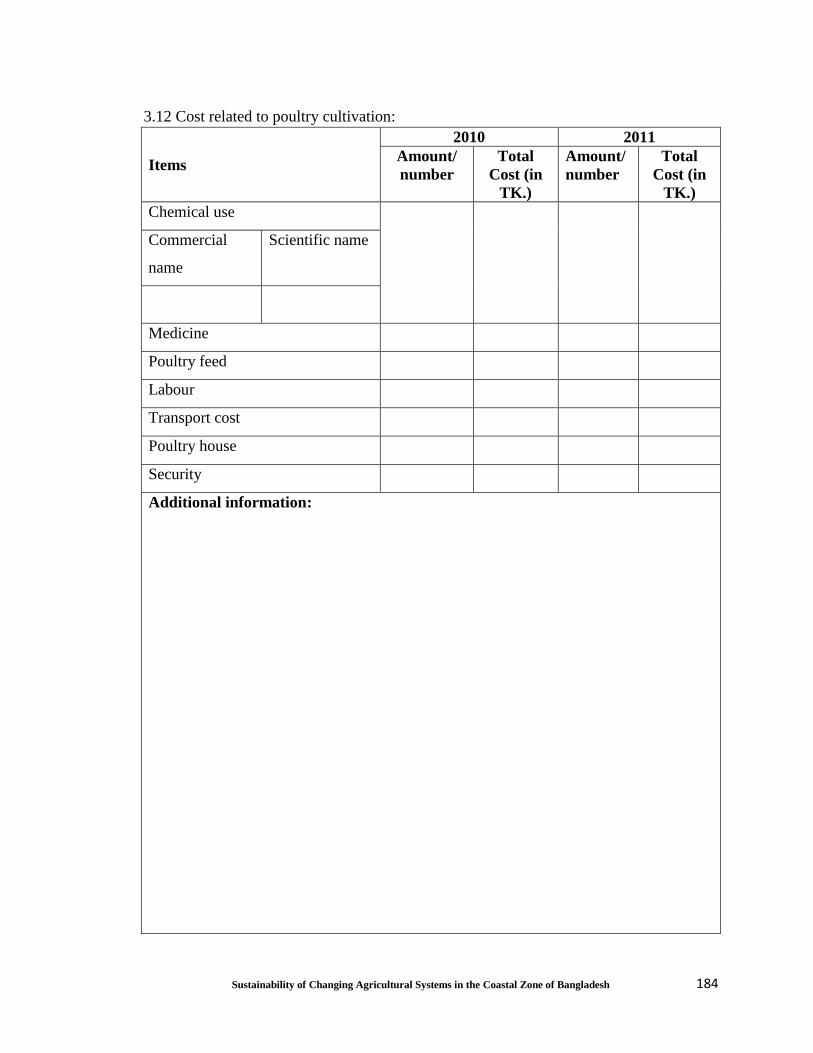
184
Sustainability of Changing Agricultural Systems in the Coastal Zone of Bangladesh
3.12 Cost related to poultry cultivation:
Items
2010 2011
Amount/
number
Total
Cost (in
TK.)
Amount/
number
Total
Cost (in
TK.)
Chemical use
Commercial
name
Scientific name
Medicine
Poultry feed
Labour
Transport cost
Poultry house
Security
Additional information:
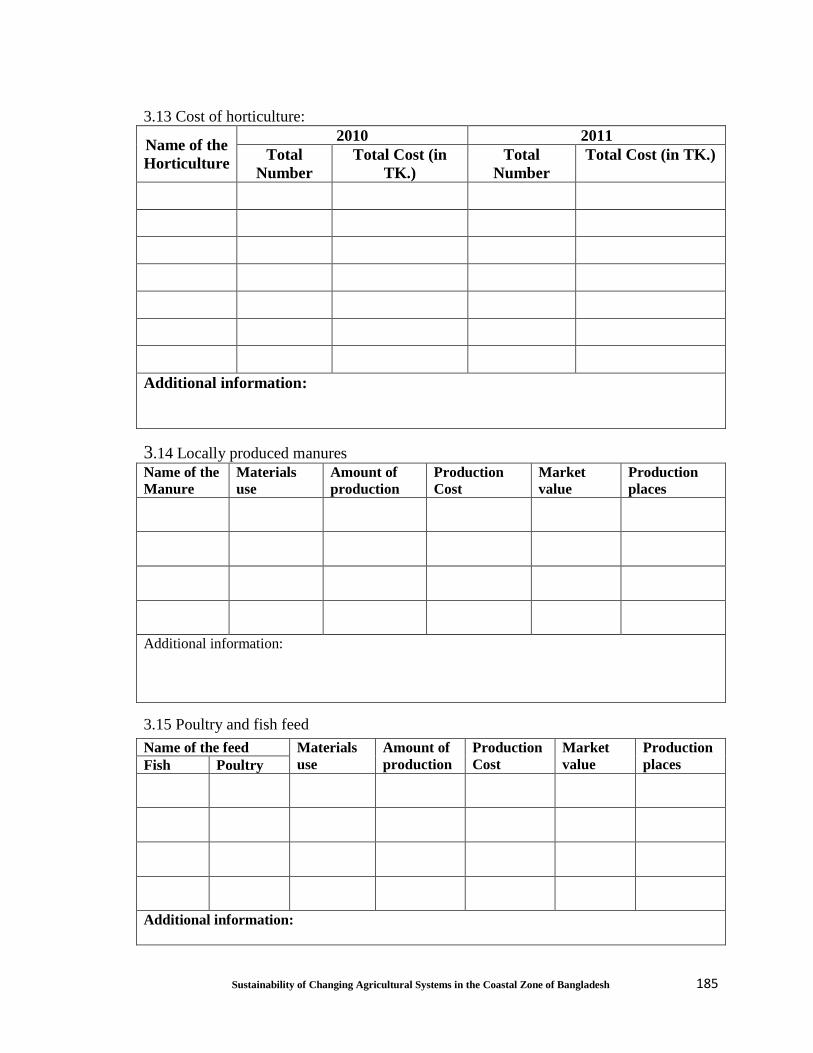
185
Sustainability of Changing Agricultural Systems in the Coastal Zone of Bangladesh
3.13 Cost of horticulture:
Name of the
Horticulture
2010 2011
Total
Number
Total Cost (in
TK.)
Total
Number
Total Cost (in TK.)
Additional information:
3.14 Locally produced manures
Name of the
Manure
Materials
use
Amount of
production
Production
Cost
Market
value
Production
places
Additional information:
3.15 Poultry and fish feed
Name of the feed Materials
use
Amount of
production
Production
Cost
Market
value
Production
places Fish Poultry
Additional information:
186
Sustainability of Changing Agricultural Systems in the Coastal Zone of Bangladesh
Part-4: Other information
4.1 How many hours a woman work inside and outside (agriculture field/pond/ghare etc.)
of home?
At Home Outside Home
Field Ghare Pond Homestead
4.2 What roles do women play in agricultural productions?
4.3 Do you produce your seeds? If yes, where do you produce? If no, from where do you
buy your seeds?
4.4 What seeds are not available? How do you manage them?
4.5 How do you preserve your seeds? How do you presurve?

187
Sustainability of Changing Agricultural Systems in the Coastal Zone of Bangladesh
4.6 Do you have any access of common resources? If yes, where do you have access?
What do you do there? Amount of production? Cost of collected goods? What is the
market value of collected goods?
4.7 Where do you sale your products? Is the market of your product available?
Sl.No Name of the products
2010 2011 Availability of
Market
Sale place/people Sale
place/people
Yes No
Additional information:

188
Sustainability of Changing Agricultural Systems in the Coastal Zone of Bangladesh
4.8 How do you preserve your agricultural products2?
4.9 Do you have any agriculture loan? If yes, from where did you get that loan and
purpose of the loan?
Sources:
Amount:
Purpose:
4.10 Do you have any micro credit? If yes, from where did you get that credit? What are
the purposes of taking credit?
4.11 Do you involve with any NGOs activities? If yes, what are those?
4.12 Are you a member of any NGOs. If yes, what is the name of the NGO?
2 Preservation of agricultural products (fish, seed, crops, vegetables etc.)
189
Sustainability of Changing Agricultural Systems in the Coastal Zone of Bangladesh
4.13 Do you take any suggestion from NGOs/block supervisor for agriculture activities?
4.14 Do you avail any kind of government support for agricultural activities? If yes what
are those?
4.15 What is your source of recreation3?
4.16 Where do you go for your health care?
1.7 What safety measures do you maintain or take in using fertilizer spreading pesticide?
4.18 What do you know about climate change impacts on agriculture?
3 Recreation Source= Recreation (TV, dish antenna, radio, cinema, local cultural programme, sports etc.)

190
Sustainability of Changing Agricultural Systems in the Coastal Zone of Bangladesh
4.19: Do you know about any awareness programme on adaptation of agriculture in
climate change? If yes, what is that? Who organize that programme?

191
Sustainability of Changing Agricultural Systems in the Coastal Zone of Bangladesh
Appendix - Figures
Figure 1.1: Administrative map of Shyamnagar Upazila

192
Sustainability of Changing Agricultural Systems in the Coastal Zone of Bangladesh
Figure 1.2: Google imagery of the Munshiganj area
A
Figure 1.3: Administrative map of Nalta village

193
Sustainability of Changing Agricultural Systems in the Coastal Zone of Bangladesh
Figure 1.4: Google imagery of the Nalta area
Figure 1.5: Administrative map of Jogikhali

194
Sustainability of Changing Agricultural Systems in the Coastal Zone of Bangladesh
Figure 1.6: Google imagery of the Jogikhali area
Figure 1.7: Administrative map of Dumuria
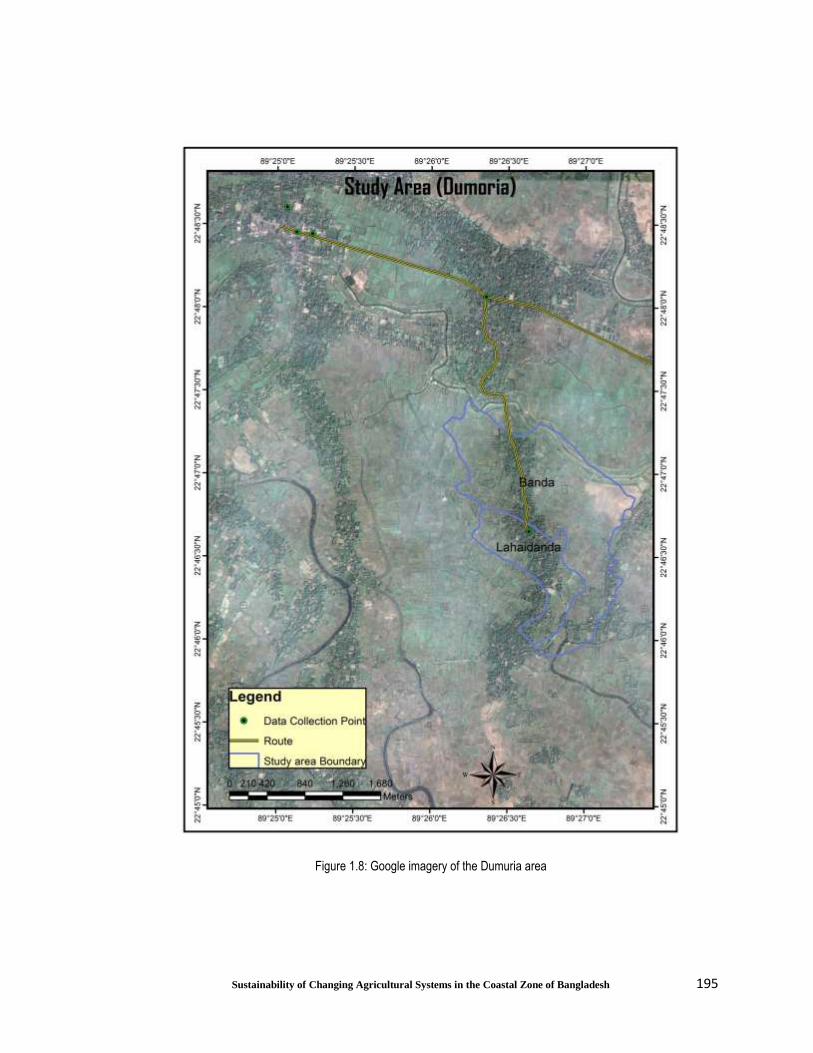
195
Sustainability of Changing Agricultural Systems in the Coastal Zone of Bangladesh
Figure 1.8: Google imagery of the Dumuria area
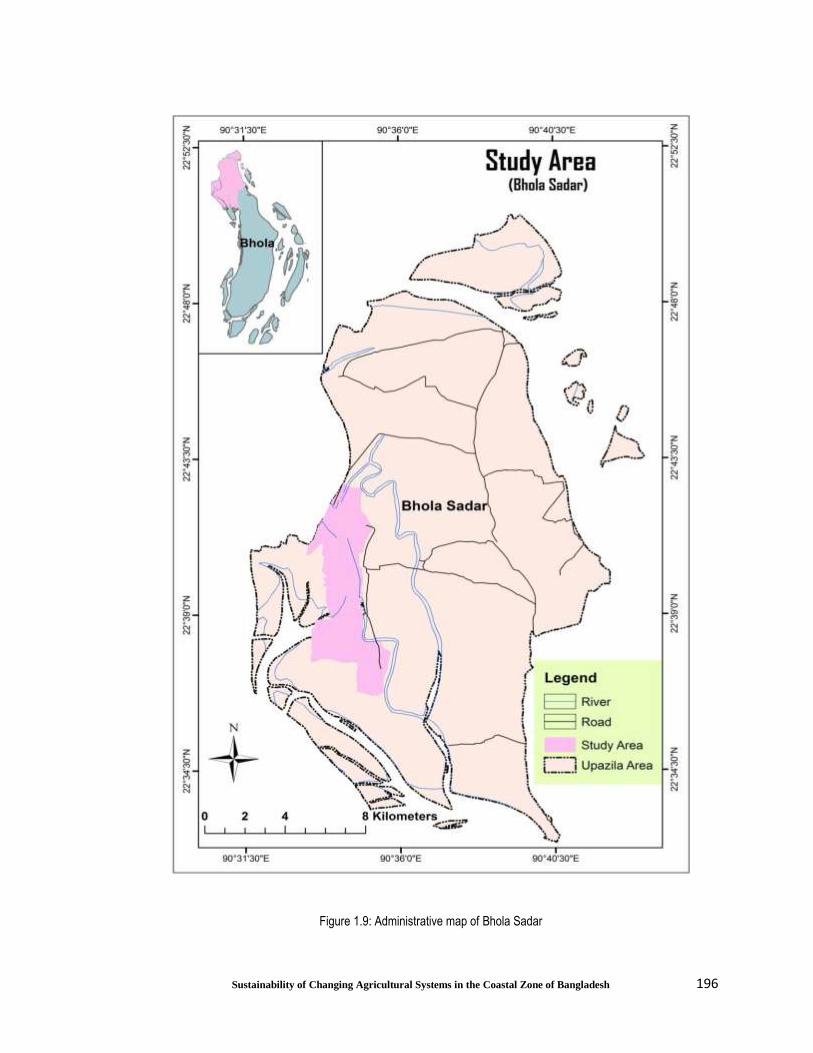
196
Sustainability of Changing Agricultural Systems in the Coastal Zone of Bangladesh
Figure 1.9: Administrative map of Bhola Sadar

197
Sustainability of Changing Agricultural Systems in the Coastal Zone of Bangladesh
Figure 1.10: Google imagery of the Kunja Patti village

198
Sustainability of Changing Agricultural Systems in the Coastal Zone of Bangladesh
Appendix-MCDA Results
Appendix- MCDA result of productivity Value Tree 0 Productivity 1 Rice 0.300 2 Productivity 0.400 3 Shyamnagar 0.106 3 Kalijang 0.207 3 Bhola Sadar 0.134 3 Kalaroa 0.246 3 Dumuria 0.306 2 NetnIncome Y. 0.600 3 Shyamnagar 0.062 3 Kalijang 0.148 3 Bhola Sadar 0.078 3 Kalaroa 0.267 3 Dumuria 0.445 1 Agro-Ecosystme 0.700 2 Net Income 0.500 3 Shyamnagar 0.059 3 Kalijang 0.194 3 Bhola Sadar 0.103 3 Kalaroa 0.301 3 Dumuria 0.343 2 Protein Yield 0.250 3 Shyamnagar 0.047 3 Kalijang 0.101 3 Bhola Sadar 0.219 3 Kalaroa 0.378 3 Dumuria 0.256 2 Energy Yield 0.250 3 Shyamnagar 0.027 3 Kalijang 0.074 3 Bhola Sadar 0.225 3 Kalaroa 0.422 3 Dumuria 0.253
Composite Priorities Shyamnagar Kalijang Kalaroa Dumuria Bhola Sada NetnIncome 0.011 0.027 0.048 0.080 0.014 Net Income 0.021 0.068 0.105 0.120 0.036 Protein Yi 0.008 0.018 0.066 0.045 0.038 Energy Yie 0.005 0.013 0.074 0.044 0.039 Productivi 0.013 0.025 0.030 0.037 0.016 Overall 0.057 0.150 0.323 0.326 0.144

199
Sustainability of Changing Agricultural Systems in the Coastal Zone of Bangladesh
Appendix- MCDA result of stability Value Tree 0 Stability 1 Land 0.200 2 L.T. 0.200 5 Shyamanagr 0.195 5 Kaliganj 0.195 5 Kalaroa 0.219 5 Dumuria 0.195 5 Bhola Sadar 0.195 2 M.O.W 0.100 5 Shyamanagr 0.250 5 Kaliganj 0.125 5 Kalaroa 0.250 5 Dumuria 0.188 5 Bhola Sadar 0.188 2 C.P.I 0.100 5 Shyamanagr 0.100 5 Kaliganj 0.100 5 Kalaroa 0.300 5 Dumuria 0.200 5 Bhola Sadar 0.300
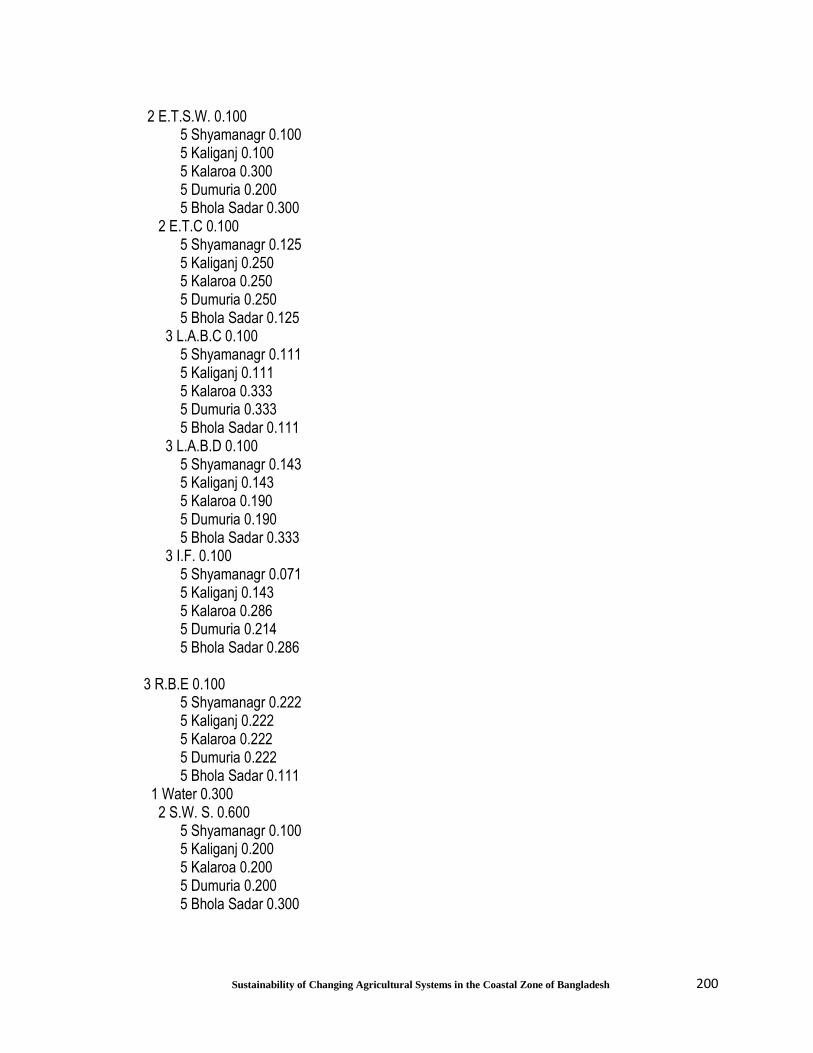
200
Sustainability of Changing Agricultural Systems in the Coastal Zone of Bangladesh
2 E.T.S.W. 0.100 5 Shyamanagr 0.100 5 Kaliganj 0.100 5 Kalaroa 0.300 5 Dumuria 0.200 5 Bhola Sadar 0.300 2 E.T.C 0.100 5 Shyamanagr 0.125 5 Kaliganj 0.250 5 Kalaroa 0.250 5 Dumuria 0.250 5 Bhola Sadar 0.125 3 L.A.B.C 0.100 5 Shyamanagr 0.111 5 Kaliganj 0.111 5 Kalaroa 0.333 5 Dumuria 0.333 5 Bhola Sadar 0.111 3 L.A.B.D 0.100 5 Shyamanagr 0.143 5 Kaliganj 0.143 5 Kalaroa 0.190 5 Dumuria 0.190 5 Bhola Sadar 0.333 3 I.F. 0.100 5 Shyamanagr 0.071 5 Kaliganj 0.143 5 Kalaroa 0.286 5 Dumuria 0.214 5 Bhola Sadar 0.286 3 R.B.E 0.100 5 Shyamanagr 0.222 5 Kaliganj 0.222 5 Kalaroa 0.222 5 Dumuria 0.222 5 Bhola Sadar 0.111 1 Water 0.300 2 S.W. S. 0.600 5 Shyamanagr 0.100 5 Kaliganj 0.200 5 Kalaroa 0.200 5 Dumuria 0.200 5 Bhola Sadar 0.300
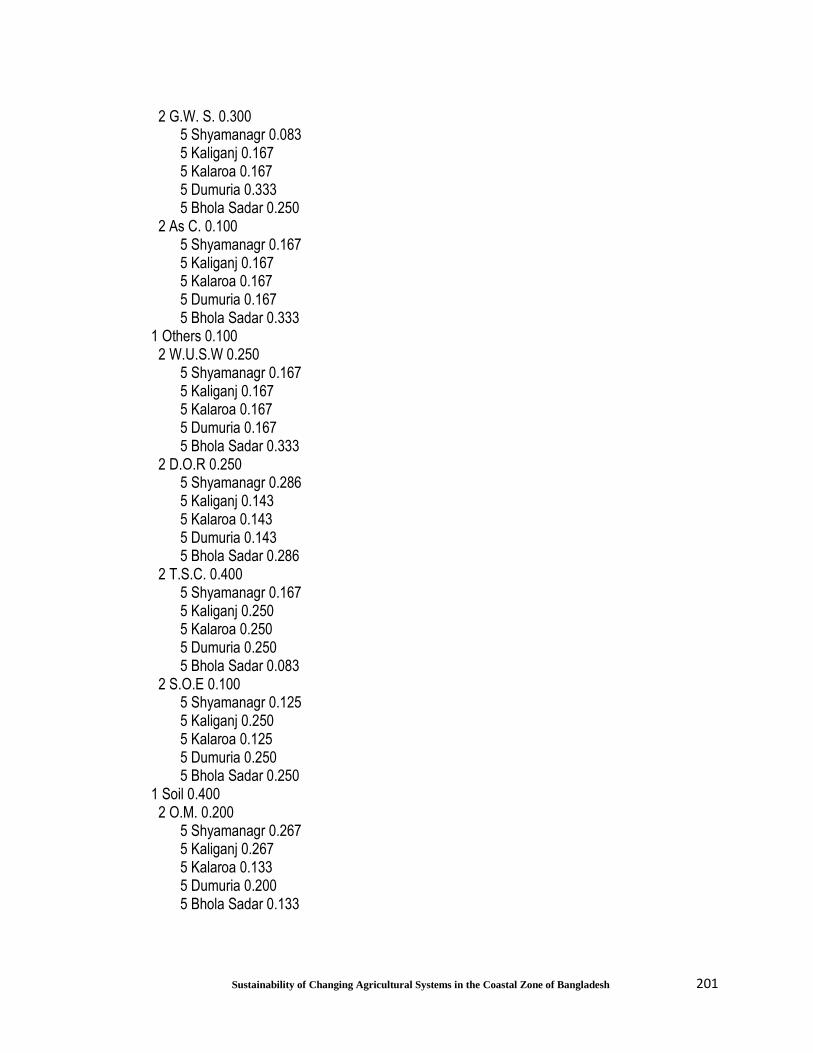
201
Sustainability of Changing Agricultural Systems in the Coastal Zone of Bangladesh
2 G.W. S. 0.300 5 Shyamanagr 0.083 5 Kaliganj 0.167 5 Kalaroa 0.167 5 Dumuria 0.333 5 Bhola Sadar 0.250 2 As C. 0.100 5 Shyamanagr 0.167 5 Kaliganj 0.167 5 Kalaroa 0.167 5 Dumuria 0.167 5 Bhola Sadar 0.333 1 Others 0.100 2 W.U.S.W 0.250 5 Shyamanagr 0.167 5 Kaliganj 0.167 5 Kalaroa 0.167 5 Dumuria 0.167 5 Bhola Sadar 0.333 2 D.O.R 0.250 5 Shyamanagr 0.286 5 Kaliganj 0.143 5 Kalaroa 0.143 5 Dumuria 0.143 5 Bhola Sadar 0.286 2 T.S.C. 0.400 5 Shyamanagr 0.167 5 Kaliganj 0.250 5 Kalaroa 0.250 5 Dumuria 0.250 5 Bhola Sadar 0.083 2 S.O.E 0.100 5 Shyamanagr 0.125 5 Kaliganj 0.250 5 Kalaroa 0.125 5 Dumuria 0.250 5 Bhola Sadar 0.250 1 Soil 0.400 2 O.M. 0.200 5 Shyamanagr 0.267 5 Kaliganj 0.267 5 Kalaroa 0.133 5 Dumuria 0.200 5 Bhola Sadar 0.133
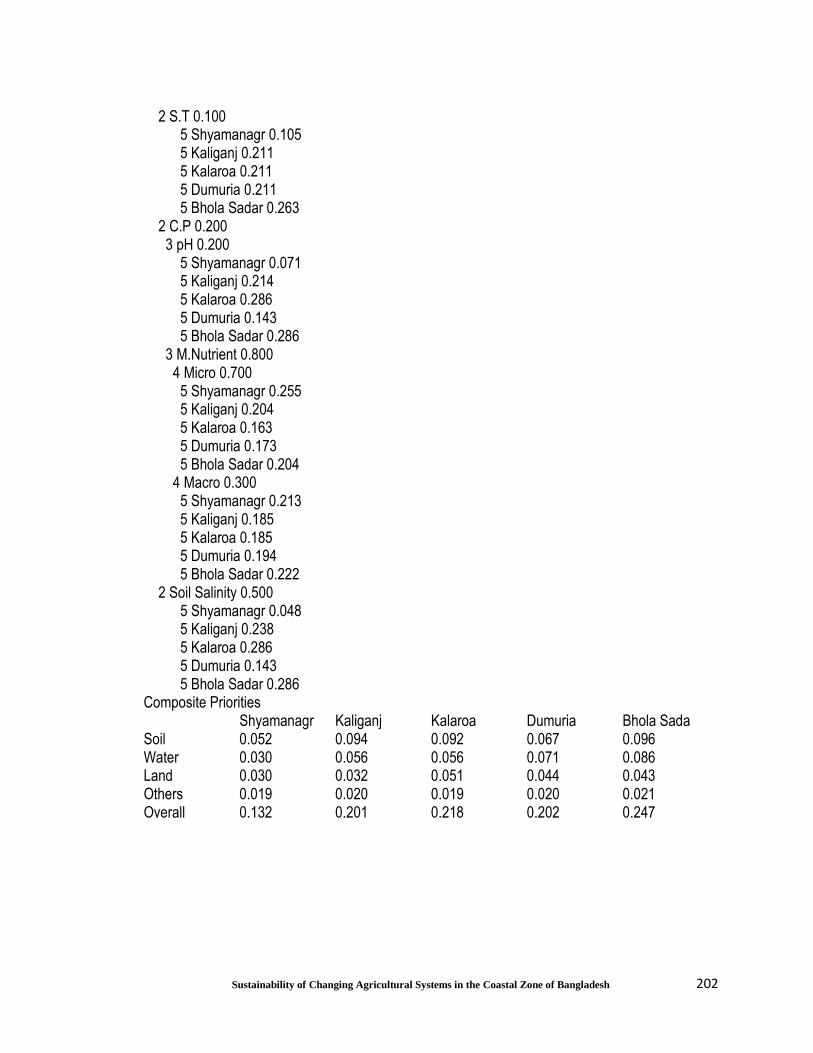
202
Sustainability of Changing Agricultural Systems in the Coastal Zone of Bangladesh
2 S.T 0.100 5 Shyamanagr 0.105 5 Kaliganj 0.211 5 Kalaroa 0.211 5 Dumuria 0.211 5 Bhola Sadar 0.263 2 C.P 0.200 3 pH 0.200 5 Shyamanagr 0.071 5 Kaliganj 0.214 5 Kalaroa 0.286 5 Dumuria 0.143 5 Bhola Sadar 0.286 3 M.Nutrient 0.800 4 Micro 0.700 5 Shyamanagr 0.255 5 Kaliganj 0.204 5 Kalaroa 0.163 5 Dumuria 0.173 5 Bhola Sadar 0.204 4 Macro 0.300 5 Shyamanagr 0.213 5 Kaliganj 0.185 5 Kalaroa 0.185 5 Dumuria 0.194 5 Bhola Sadar 0.222 2 Soil Salinity 0.500 5 Shyamanagr 0.048 5 Kaliganj 0.238 5 Kalaroa 0.286 5 Dumuria 0.143 5 Bhola Sadar 0.286 Composite Priorities Shyamanagr Kaliganj Kalaroa Dumuria Bhola Sada Soil 0.052 0.094 0.092 0.067 0.096 Water 0.030 0.056 0.056 0.071 0.086 Land 0.030 0.032 0.051 0.044 0.043 Others 0.019 0.020 0.019 0.020 0.021 Overall 0.132 0.201 0.218 0.202 0.247
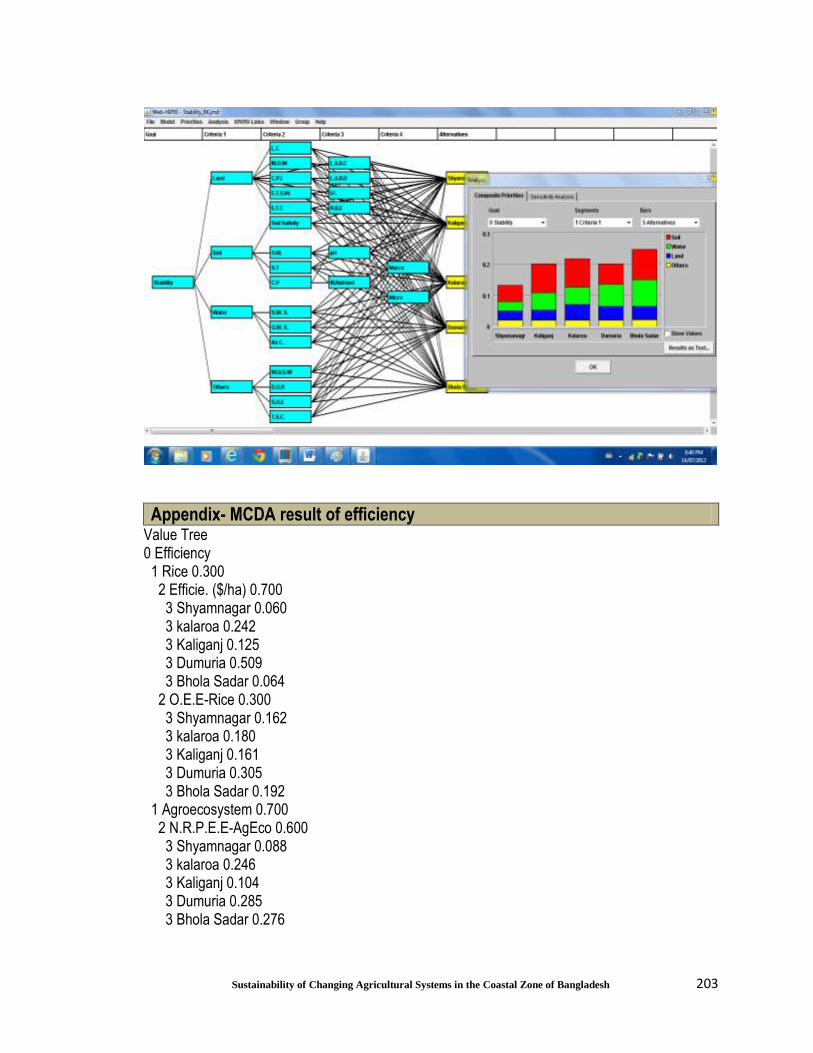
203
Sustainability of Changing Agricultural Systems in the Coastal Zone of Bangladesh
Appendix- MCDA result of efficiency Value Tree 0 Efficiency 1 Rice 0.300 2 Efficie. ($/ha) 0.700 3 Shyamnagar 0.060 3 kalaroa 0.242 3 Kaliganj 0.125 3 Dumuria 0.509 3 Bhola Sadar 0.064 2 O.E.E-Rice 0.300 3 Shyamnagar 0.162 3 kalaroa 0.180 3 Kaliganj 0.161 3 Dumuria 0.305 3 Bhola Sadar 0.192 1 Agroecosystem 0.700 2 N.R.P.E.E-AgEco 0.600 3 Shyamnagar 0.088 3 kalaroa 0.246 3 Kaliganj 0.104 3 Dumuria 0.285 3 Bhola Sadar 0.276
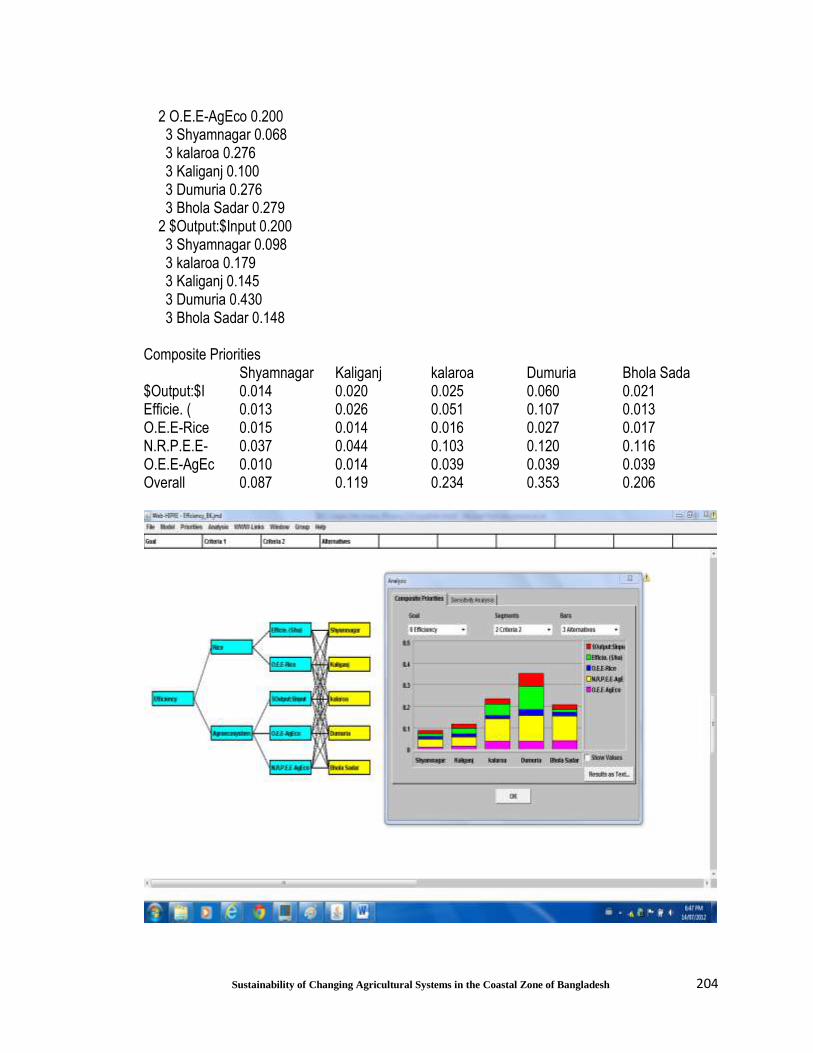
204
Sustainability of Changing Agricultural Systems in the Coastal Zone of Bangladesh
2 O.E.E-AgEco 0.200 3 Shyamnagar 0.068 3 kalaroa 0.276 3 Kaliganj 0.100 3 Dumuria 0.276 3 Bhola Sadar 0.279 2 $Output:$Input 0.200 3 Shyamnagar 0.098 3 kalaroa 0.179 3 Kaliganj 0.145 3 Dumuria 0.430 3 Bhola Sadar 0.148 Composite Priorities Shyamnagar Kaliganj kalaroa Dumuria Bhola Sada $Output:$I 0.014 0.020 0.025 0.060 0.021 Efficie. ( 0.013 0.026 0.051 0.107 0.013 O.E.E-Rice 0.015 0.014 0.016 0.027 0.017 N.R.P.E.E- 0.037 0.044 0.103 0.120 0.116 O.E.E-AgEc 0.010 0.014 0.039 0.039 0.039 Overall 0.087 0.119 0.234 0.353 0.206
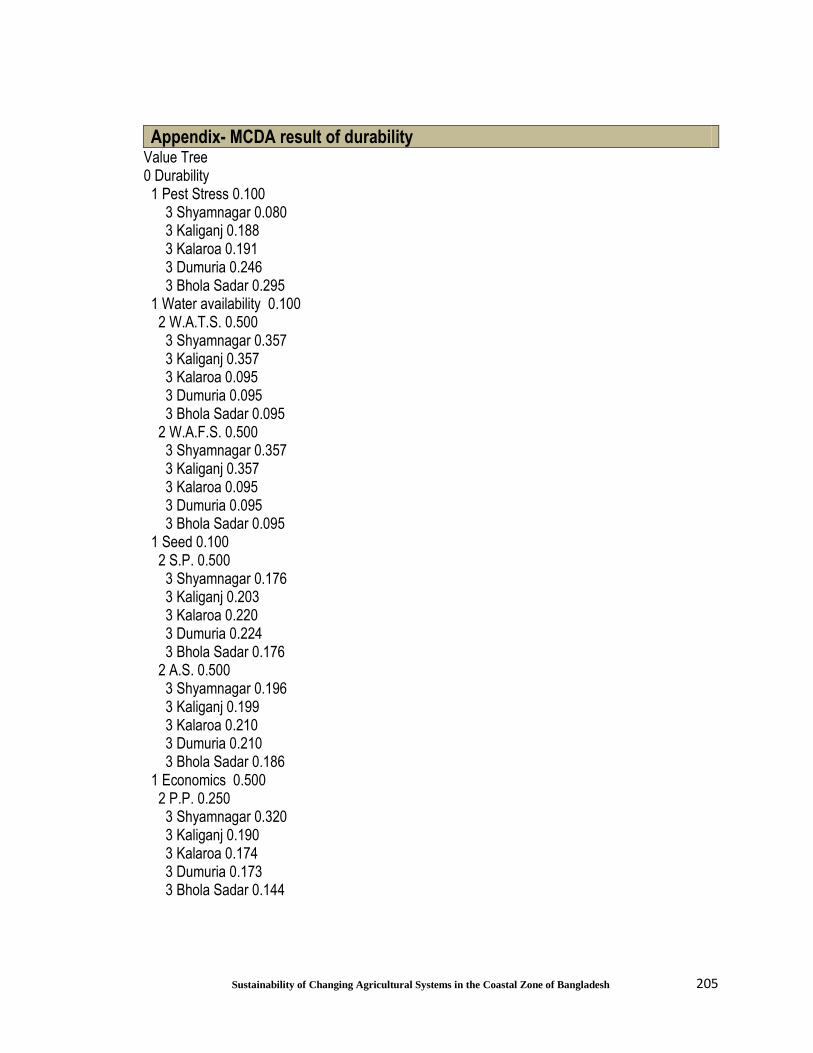
205
Sustainability of Changing Agricultural Systems in the Coastal Zone of Bangladesh
Appendix- MCDA result of durability Value Tree 0 Durability 1 Pest Stress 0.100 3 Shyamnagar 0.080 3 Kaliganj 0.188 3 Kalaroa 0.191 3 Dumuria 0.246 3 Bhola Sadar 0.295 1 Water availability 0.100 2 W.A.T.S. 0.500 3 Shyamnagar 0.357 3 Kaliganj 0.357 3 Kalaroa 0.095 3 Dumuria 0.095 3 Bhola Sadar 0.095 2 W.A.F.S. 0.500 3 Shyamnagar 0.357 3 Kaliganj 0.357 3 Kalaroa 0.095 3 Dumuria 0.095 3 Bhola Sadar 0.095 1 Seed 0.100 2 S.P. 0.500 3 Shyamnagar 0.176 3 Kaliganj 0.203 3 Kalaroa 0.220 3 Dumuria 0.224 3 Bhola Sadar 0.176 2 A.S. 0.500 3 Shyamnagar 0.196 3 Kaliganj 0.199 3 Kalaroa 0.210 3 Dumuria 0.210 3 Bhola Sadar 0.186 1 Economics 0.500 2 P.P. 0.250 3 Shyamnagar 0.320 3 Kaliganj 0.190 3 Kalaroa 0.174 3 Dumuria 0.173 3 Bhola Sadar 0.144

206
Sustainability of Changing Agricultural Systems in the Coastal Zone of Bangladesh
2 A.M. 0.250 3 Shyamnagar 0.221 3 Kaliganj 0.202 3 Kalaroa 0.187 3 Dumuria 0.221 3 Bhola Sadar 0.170 2 L.D 0.250 3 Shyamnagar 0.223 3 Kaliganj 0.155 3 Kalaroa 0.212 3 Dumuria 0.163 3 Bhola Sadar 0.248 2 Y.O.E.H 0.250 3 Shyamnagar 0.191 3 Kaliganj 0.191 3 Kalaroa 0.238 3 Dumuria 0.214 3 Bhola Sadar 0.167 1 Ag. Know 0.200 2 A.T. 0.400 3 Shyamnagar 0.193 3 Kaliganj 0.265 3 Kalaroa 0.048 3 Dumuria 0.329 3 Bhola Sadar 0.167 2 A.B.S 0.200 3 Shyamnagar 0.208 3 Kaliganj 0.369 3 Kalaroa 0.161 3 Dumuria 0.142 3 Bhola Sadar 0.120 2 Soil Test 0.200 3 Shyamnagar 0.147 3 Kaliganj 0.182 3 Kalaroa 0.371 3 Dumuria 0.299 3 Bhola Sadar 0.000 2 C.C.A 0.200 3 Shyamnagar 0.270 3 Kaliganj 0.163 3 Kalaroa 0.124 3 Dumuria 0.443 3 Bhola Sadar 0.000
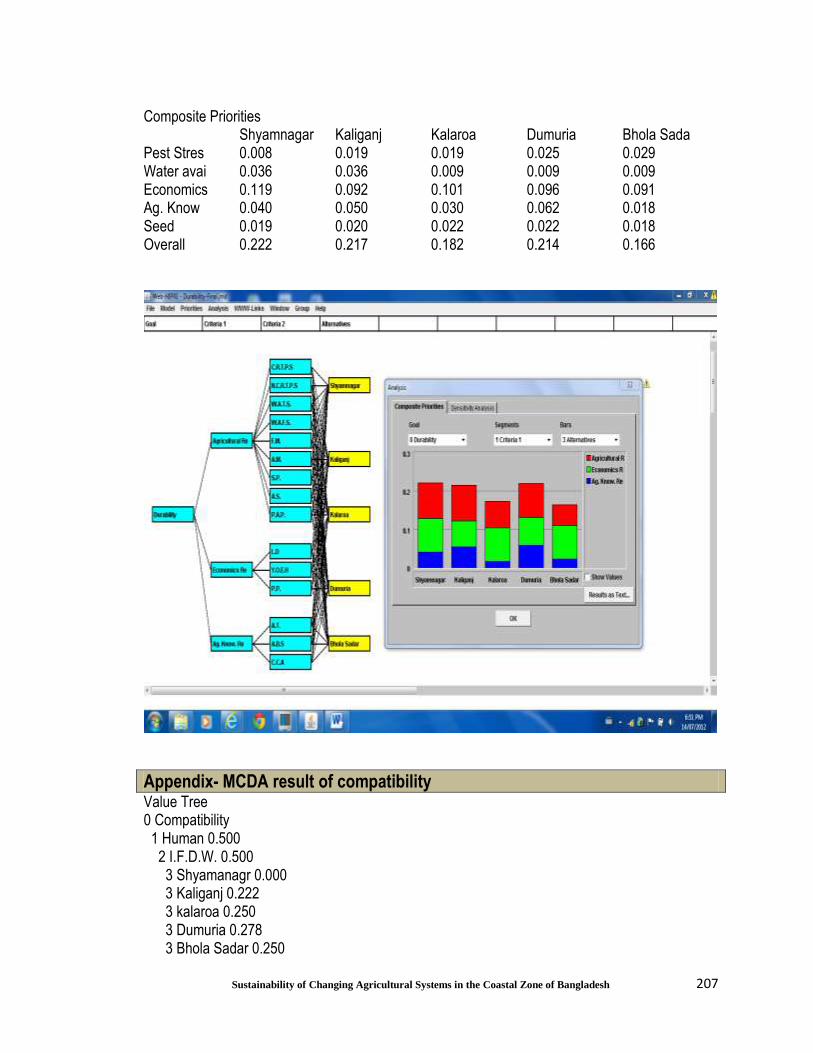
207
Sustainability of Changing Agricultural Systems in the Coastal Zone of Bangladesh
Composite Priorities Shyamnagar Kaliganj Kalaroa Dumuria Bhola Sada Pest Stres 0.008 0.019 0.019 0.025 0.029 Water avai 0.036 0.036 0.009 0.009 0.009 Economics 0.119 0.092 0.101 0.096 0.091 Ag. Know 0.040 0.050 0.030 0.062 0.018 Seed 0.019 0.020 0.022 0.022 0.018 Overall 0.222 0.217 0.182 0.214 0.166
Appendix- MCDA result of compatibility Value Tree 0 Compatibility 1 Human 0.500 2 I.F.D.W. 0.500 3 Shyamanagr 0.000 3 Kaliganj 0.222 3 kalaroa 0.250 3 Dumuria 0.278 3 Bhola Sadar 0.250

208
Sustainability of Changing Agricultural Systems in the Coastal Zone of Bangladesh
2 A.C.I.D.W. 0.200 3 Shyamanagr 0.115 3 Kaliganj 0.115 3 kalaroa 0.385 3 Dumuria 0.000 3 Bhola Sadar 0.385 2 P.W.S. 0.300 3 Shyamanagr 0.111 3 Kaliganj 0.222 3 kalaroa 0.222 3 Dumuria 0.222 3 Bhola Sadar 0.222 1 Bio. Surroundings 0.500 2 O.B.I 0.300 3 Shyamanagr 0.089 3 Kaliganj 0.140 3 kalaroa 0.311 3 Dumuria 0.223 3 Bhola Sadar 0.236 2 P.N.C.A. 0.200 3 Shyamanagr 0.106 3 Kaliganj 0.091 3 kalaroa 0.322 3 Dumuria 0.220 3 Bhola Sadar 0.261 2 C.E.S 0.200 3 Shyamanagr 0.091 3 Kaliganj 0.136 3 kalaroa 0.227 3 Dumuria 0.273 3 Bhola Sadar 0.273 2 Crop Richiness 0.200 3 Shyamanagr 0.039 3 Kaliganj 0.118 3 kalaroa 0.314 3 Dumuria 0.196 3 Bhola Sadar 0.333 2 O.E.C. 0.100 3 Shyamanagr 0.091 3 Kaliganj 0.136 3 kalaroa 0.227 3 Dumuria 0.273 3 Bhola Sadar 0.273

209
Sustainability of Changing Agricultural Systems in the Coastal Zone of Bangladesh
Composite Priorities Shyamanagr Kaliganj kalaroa Dumuria Bhola Sada I.F.D.W. 0.000 0.056 0.063 0.069 0.063 A.C.I.D.W. 0.012 0.012 0.038 0.000 0.038 P.W.S. 0.017 0.033 0.033 0.033 0.033 O.B.I 0.013 0.021 0.047 0.033 0.035 P.N.C.A. 0.011 0.009 0.032 0.022 0.026 C.E.S 0.009 0.014 0.023 0.027 0.027 Crop Richi 0.004 0.012 0.031 0.020 0.033 O.E.C. 0.005 0.007 0.011 0.014 0.014 Overall 0.070 0.163 0.279 0.219 0.270
Appendix- MCDA result of equity Value Tree 0 Equity 1 Education 0.200 2 E.S.O.F 0.200 4 Shyamanagr 0.228 4 Kaliganj 0.246 4 Kalaroa 0.127 4 Dumuria 0.266 4 Bhola Sadar 0.133
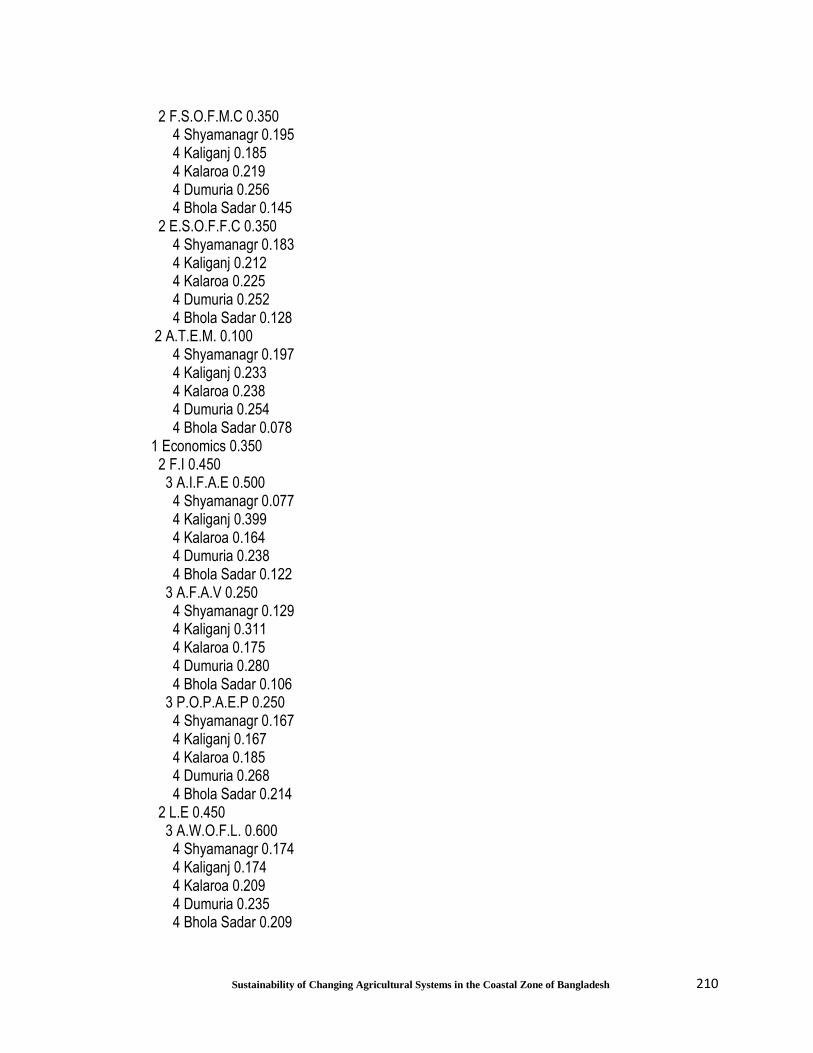
210
Sustainability of Changing Agricultural Systems in the Coastal Zone of Bangladesh
2 F.S.O.F.M.C 0.350 4 Shyamanagr 0.195 4 Kaliganj 0.185 4 Kalaroa 0.219 4 Dumuria 0.256 4 Bhola Sadar 0.145 2 E.S.O.F.F.C 0.350 4 Shyamanagr 0.183 4 Kaliganj 0.212 4 Kalaroa 0.225 4 Dumuria 0.252 4 Bhola Sadar 0.128 2 A.T.E.M. 0.100 4 Shyamanagr 0.197 4 Kaliganj 0.233 4 Kalaroa 0.238 4 Dumuria 0.254 4 Bhola Sadar 0.078 1 Economics 0.350 2 F.I 0.450 3 A.I.F.A.E 0.500 4 Shyamanagr 0.077 4 Kaliganj 0.399 4 Kalaroa 0.164 4 Dumuria 0.238 4 Bhola Sadar 0.122 3 A.F.A.V 0.250 4 Shyamanagr 0.129 4 Kaliganj 0.311 4 Kalaroa 0.175 4 Dumuria 0.280 4 Bhola Sadar 0.106 3 P.O.P.A.E.P 0.250 4 Shyamanagr 0.167 4 Kaliganj 0.167 4 Kalaroa 0.185 4 Dumuria 0.268 4 Bhola Sadar 0.214 2 L.E 0.450 3 A.W.O.F.L. 0.600 4 Shyamanagr 0.174 4 Kaliganj 0.174 4 Kalaroa 0.209 4 Dumuria 0.235 4 Bhola Sadar 0.209
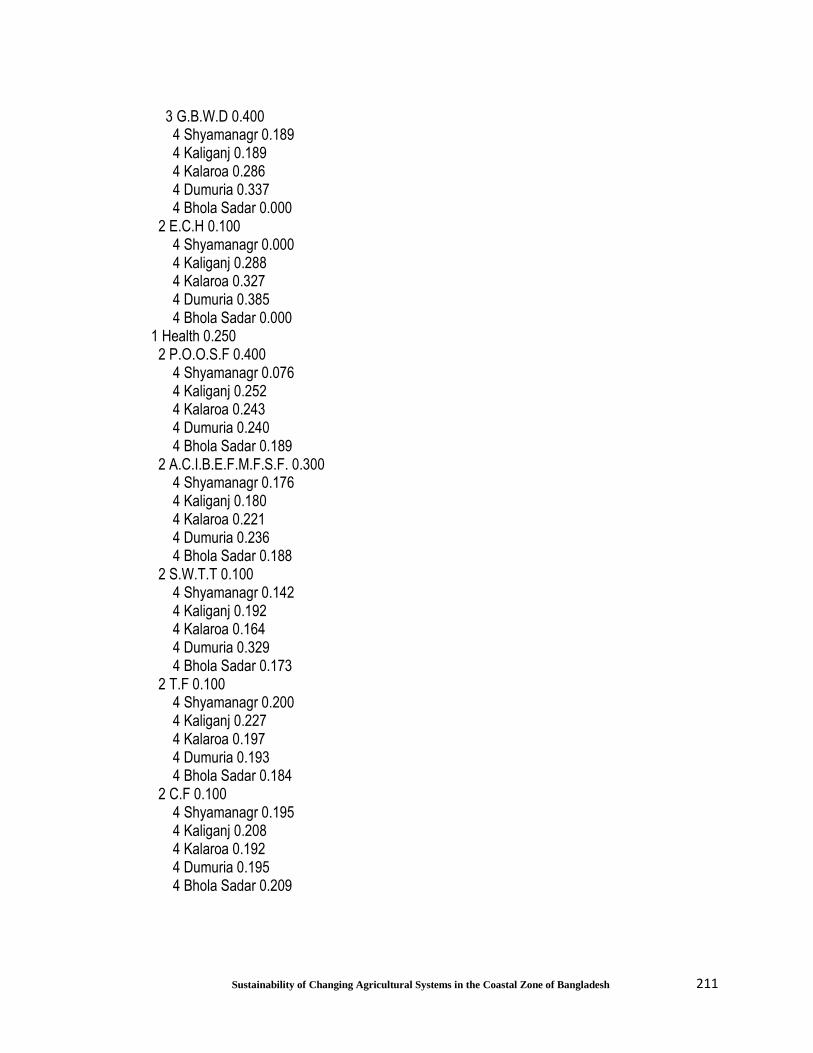
211
Sustainability of Changing Agricultural Systems in the Coastal Zone of Bangladesh
3 G.B.W.D 0.400 4 Shyamanagr 0.189 4 Kaliganj 0.189 4 Kalaroa 0.286 4 Dumuria 0.337 4 Bhola Sadar 0.000 2 E.C.H 0.100 4 Shyamanagr 0.000 4 Kaliganj 0.288 4 Kalaroa 0.327 4 Dumuria 0.385 4 Bhola Sadar 0.000 1 Health 0.250 2 P.O.O.S.F 0.400 4 Shyamanagr 0.076 4 Kaliganj 0.252 4 Kalaroa 0.243 4 Dumuria 0.240 4 Bhola Sadar 0.189 2 A.C.I.B.E.F.M.F.S.F. 0.300 4 Shyamanagr 0.176 4 Kaliganj 0.180 4 Kalaroa 0.221 4 Dumuria 0.236 4 Bhola Sadar 0.188 2 S.W.T.T 0.100 4 Shyamanagr 0.142 4 Kaliganj 0.192 4 Kalaroa 0.164 4 Dumuria 0.329 4 Bhola Sadar 0.173 2 T.F 0.100 4 Shyamanagr 0.200 4 Kaliganj 0.227 4 Kalaroa 0.197 4 Dumuria 0.193 4 Bhola Sadar 0.184 2 C.F 0.100 4 Shyamanagr 0.195 4 Kaliganj 0.208 4 Kalaroa 0.192 4 Dumuria 0.195 4 Bhola Sadar 0.209

212
Sustainability of Changing Agricultural Systems in the Coastal Zone of Bangladesh
1 Gender issue 0.200 2 W.P.I.A.A. 0.500 4 Shyamanagr 0.143 4 Kaliganj 0.190 4 Kalaroa 0.238 4 Dumuria 0.310 4 Bhola Sadar 0.119 2 G.B.G.D 0.500 4 Shyamanagr 0.200 4 Kaliganj 0.200 4 Kalaroa 0.200 4 Dumuria 0.200 4 Bhola Sadar 0.200 Composite Priorities Shyamanagr Kaliganj Kalaroa Dumuria Bhola Sada Education 0.040 0.042 0.041 0.051 0.026 Economics 0.046 0.089 0.076 0.097 0.042 Health 0.034 0.054 0.055 0.060 0.047 Gender iss 0.034 0.039 0.044 0.051 0.032 Overall 0.154 0.224 0.216 0.259 0.147
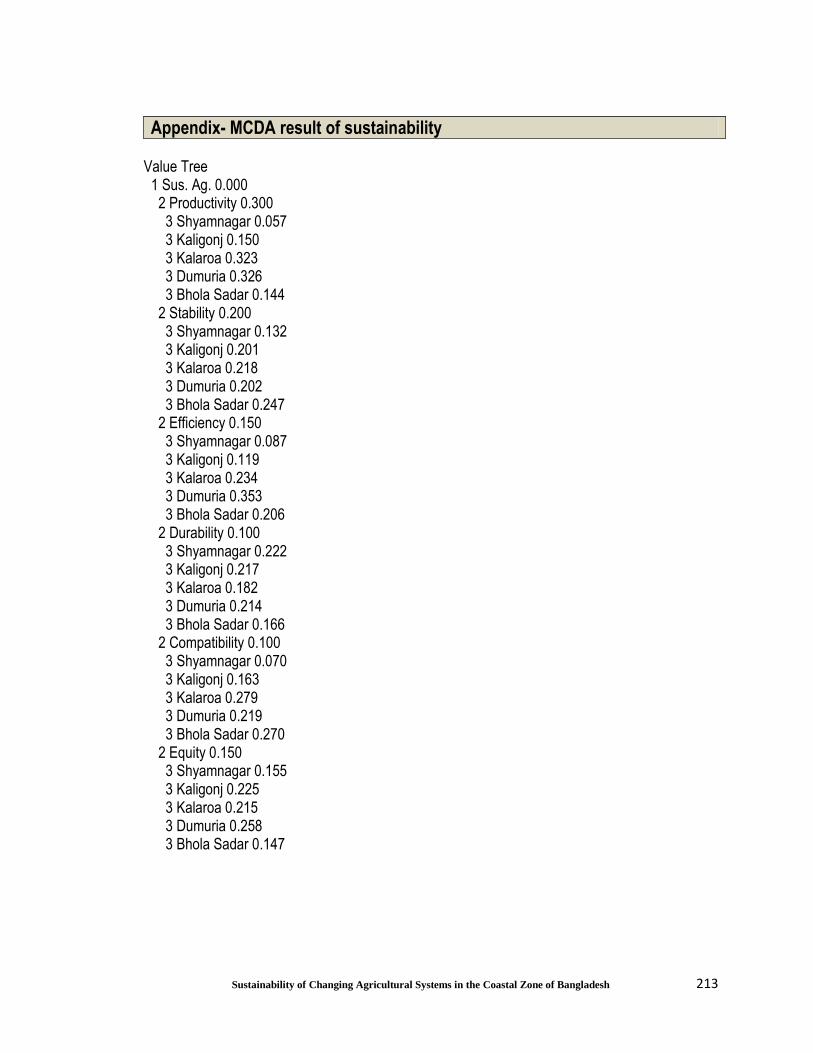
213
Sustainability of Changing Agricultural Systems in the Coastal Zone of Bangladesh
Appendix- MCDA result of sustainability Value Tree 1 Sus. Ag. 0.000 2 Productivity 0.300 3 Shyamnagar 0.057 3 Kaligonj 0.150 3 Kalaroa 0.323 3 Dumuria 0.326 3 Bhola Sadar 0.144 2 Stability 0.200 3 Shyamnagar 0.132 3 Kaligonj 0.201 3 Kalaroa 0.218 3 Dumuria 0.202 3 Bhola Sadar 0.247 2 Efficiency 0.150 3 Shyamnagar 0.087 3 Kaligonj 0.119 3 Kalaroa 0.234 3 Dumuria 0.353 3 Bhola Sadar 0.206 2 Durability 0.100 3 Shyamnagar 0.222 3 Kaligonj 0.217 3 Kalaroa 0.182 3 Dumuria 0.214 3 Bhola Sadar 0.166 2 Compatibility 0.100 3 Shyamnagar 0.070 3 Kaligonj 0.163 3 Kalaroa 0.279 3 Dumuria 0.219 3 Bhola Sadar 0.270 2 Equity 0.150 3 Shyamnagar 0.155 3 Kaligonj 0.225 3 Kalaroa 0.215 3 Dumuria 0.258 3 Bhola Sadar 0.147
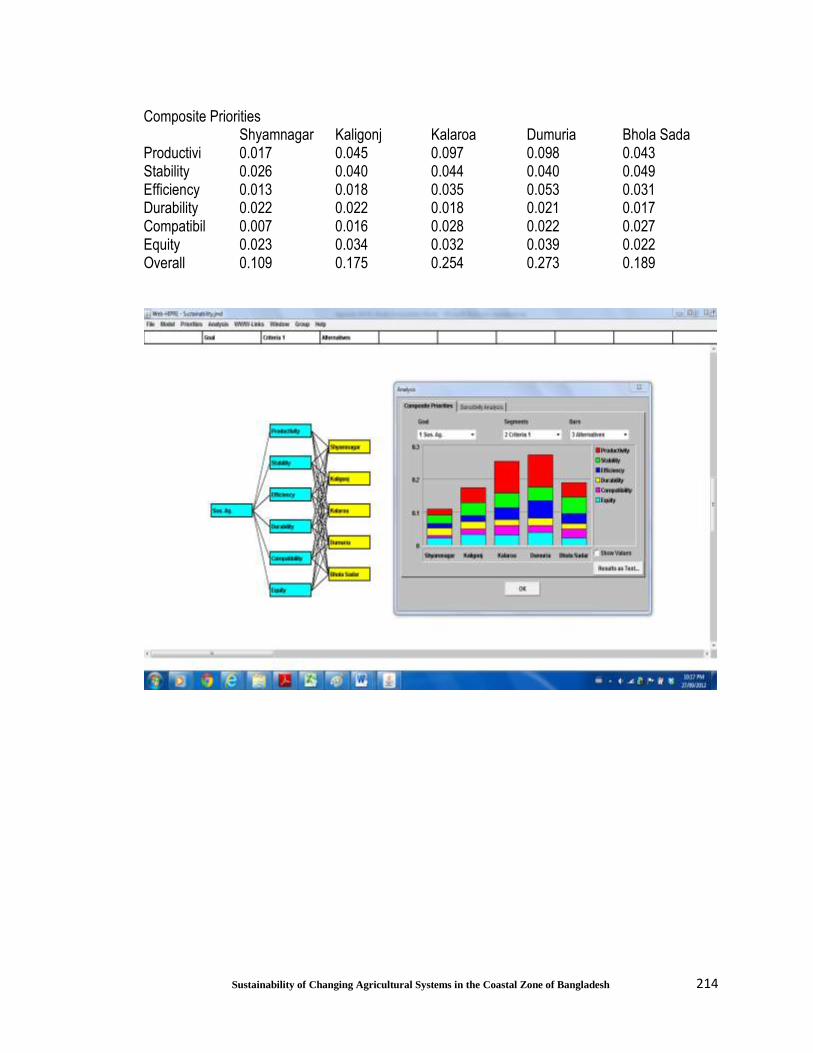
214
Sustainability of Changing Agricultural Systems in the Coastal Zone of Bangladesh
Composite Priorities Shyamnagar Kaligonj Kalaroa Dumuria Bhola Sada Productivi 0.017 0.045 0.097 0.098 0.043 Stability 0.026 0.040 0.044 0.040 0.049 Efficiency 0.013 0.018 0.035 0.053 0.031 Durability 0.022 0.022 0.018 0.021 0.017 Compatibil 0.007 0.016 0.028 0.022 0.027 Equity 0.023 0.034 0.032 0.039 0.022 Overall 0.109 0.175 0.254 0.273 0.189