Embed Size (px)
Citation preview

Corporate Sustainability Report 2010-11Tata Motors Ltd.
Sustainability in motion

About this report 1
MD’s statement 2
About Tata Motors 4
Vision and Mission 6
Defining priorities 7
The pivot point 13
Economic performance 17
Environmental stewardship 21
Product safety and Innovation 29
People in motion 33
Occupational health and safety 37
Community development 41
Disclosure on Management Approach 46
Assurance statement 48
GRI content index 50
Glossary 53

About this report
This is Tata Motors Limited’s seventh1 Sustainability Report covering data from 01 April 2010 to 31 March 2011. The report includes performance data and information related to Indian operations at Jamshedpur, Lucknow, Pune, Pantnagar and Sanand. The report does not include performance data and information related to Joint Ventures and subsidiaries.
This report is based on Global Reporting Initiative’s G3.1 Guidelines and is externally assured. Further, this Report serves as our Communication on Progress on the United Nations Global Compact principles.
1 The report covering our performance for the year 2004-05 and 2005-06 were limited to internal circulation. 2006-07 onwards, we have
reported our performance on the public domain and can be accessed at: http://www.tatamotors.com/sustainability/sustainability.php
Motion is described as a change in position of an object in comparison to a frame of reference. It is a function of velocity, acceleration, displacement and time. Motion is always relative and never absolute.
Sustainability in Motion reflects our continuous and relentless quest for business excellence and value creation in a responsible manner. Today, we are all set to grow at pace never seen before and are gearing up to face unknown challenges. Our people provide us with the right impetus through their unwavering commitment and innovative minds. This has and will continue to help us surpass numerous milestones while keeping a track on the past, focussing on the present and planning for the future.
Robust management systems, sound work ethics, better fuel efficiency standards, improved passenger safety, increased material recycling, conservation of energy and water, managing wastes, etc. are some of the examples of sustainability in motion at Tata Motors Limited.
4.54%of total energy requirement was met through renewable energy
48,620 tCO2e emissions avoided through usage of renewable energy
2.47%of net turnover was spent on R&D activities
61.80%domestic market share in commercial vehicles
58.57%materials and services procured from local vendors
13,788 used engines reconditioned through ‘Recon’ business
25kmpl by Indica Ev2,the highest mileage for any car in the country
75,000 people benefited from Amrutdhara – drinking water project
1

2
Dear Stakeholders,
I take great pride in introducing “Sustainability in Motion” Tata Motors Limited’s seventh Corporate Sustainability Report for the financial year 2010-11. This report provides comprehensive information on our sustainability performance, highlighting our strengths and discussing opportunities for improvement. The report also showcases our effort to create a portfolio of sustainable vehicles that meet varying consumer needs without compromising usability.
The global automotive sector demonstrated a fast-track recovery in this year with a growth of over 22 percent for passenger vehicles and 38 percent for commercial vehicles, while the Indian automobile industry demonstrated a healthy growth of over 29 percent and 27 percent respectively. The Indian automobile sector has a leading edge over global players in terms of value-for-money products and continues to benefit from the large scale of economies coupled with technology improvements. Some of the major factors that have led to such growth are rise in working population, increase in disposable income, changing consumer culture and availability of good road connectivity. In contrast to this, increasing inflation and interest rates, rising fuel prices, varying commodity costs, intense price
competition and complex regulations tend to dampen this growth. At Tata Motors, our product portfolio in commercial vehicles and passenger cars combined with wide distribution channels enables us to take advantage of various opportunities in national and international markets, thereby ensuring long term sustainability of business.
During the year, we achieved all-time high sales of 458,828 commercial vehicles – a growth of 22 percent over the previous year and a robust market share of 61 percent. With the introduction of several new models, the intermediate and heavy truck sales increased by 30 percent. Ace, the sub-one ton pick-up achieved the highest ever annual sales with a growth of 25 percent over the previous year. Passenger bus sales grew substantially across diesel and CNG powered variants, while our new low-floor city buses received an overwhelming market response. Since we entered the passenger car segment in 1999, our total sales figure crossed two million in this year. We achieved the highest ever annual sales this year – a growth of 23 percent over last year, while the sales of Nano - the people’s car launched in 2010 crossed 100,000. Overall, the total export sales also witnessed a record increase of 70 percent to about 58,000 vehicles.
This year, we showcased ‘Pixel’ - a concept city car for the future at the Geneva Motor Show and launched Aria - a premium crossover vehicle with high-end features. We also launched Elan - a high end variant of the Manza sedan. Ace Zip and Magic Iris were test marketed in various parts of the country and were formally launched. We also launched Venture - a multi purpose vehicle (MPV) on the Ace platform. These launches complete the Ace family which now ranges from Ace Zip and Magic Iris at the lower end to Super Ace and Venture on the higher end. The Prima range of world trucks launched in 2010 was expanded with the introduction of Prima Construck range of tippers. We continue to develop and build on our in-house capabilities and work with the right partners to ensure that we have competitive product offerings.
MD’s statement
Motion is described as a change in position of an object in comparison to a frame of reference. It is a function of velocity, acceleration, displacement and time. Motion is always relative and never absolute.
Sustainability in Motion reflects our continuous and relentless quest for business excellence and value creation in a responsible manner.

MD’s statement
With the increasing focus on climate change and the subsequent need to control and reduce carbon emissions, we undertook several energy conservation initiatives. These initiatives have helped our plants save 230,959 GJ of energy, translating into reduction of 47,818 tCO2e of greenhouse gas emissions. Our endeavour to harness wind energy through our 20.85 MW wind power project has resulted in a reduction of 48,620 tCO2e of greenhouse gas emissions. Till date, United Nations Framework Convention for Climate Change (UNFCCC) has issued 27,554 CERs for this project. Along with process improvisation, reduction of vehicular emissions during use is also a major focus area. As a responsible automotive manufacturer, we continue to develop vehicles and technologies to reduce our process and product carbon footprint. Some of our significant achievements include showcasing of CNG parallel hybrid low-floor city buses during the Commonwealth Games in Delhi, launching BS IV compliant variants of the Indica and Indigo CS, and developing Indica eV2 and Indigo eCS that have segment leading fuel efficiencies.
We address health and safety related issues at two levels – operations and products. We follow a zero accident policy and our endeavour is to ensure a safe operating environment. At the plant level, we have created a team of cross-location employees that helps enhance safety standards and processes. We have also developed a bay ownership concept to ensure workplace safety across operations. We deeply regret the sad demise of two personnel, one in Lucknow and other in Jamshedpur. We have taken necessary counter measures to ensure that such incidents do not repeat. Towards this end, we recently completed a diagnostic of the existing safety systems through DuPont and are taking steps to further strengthen our safety standards though our Zero Accident Plan (ZAP). A host of initiatives on health and wellness were organised across all operations. At Pune, a health index was developed and an ergonomics study was carried out to improve the workplace environment.
Through our Engineering and Research Centre, we have continuously focused on improving the active and passive safety features of our vehicles. We are the only automobile manufacturer in the country having an in-house crash test facility.
In order to improve road safety and enhance employability of the youth, we have developed a pedagogic approach towards training of drivers. The State Institute of Automotive and Driving skills in Muktsar, Punjab, is a joint effort of Government of Punjab and Tata Motors. This institute offers driving courses that have been approved by the Directorate General of Employment and Training (DGE&T), Ministry of Labour. We have plans to set up another five such centres across the country. We are also working on a cost effective driver training module that will help to develop skilled drivers in large numbers to meet the acute shortage of skilled drivers. Our target is to train 3.4 million people in driving skills within the next 10 years followed by one million every year, starting in 2022. The pilot project will be launched in the second quarter of the next financial year.
During this year, we launched several social responsibility initiatives based on the outcome of stakeholder engagement. We have linked our focus areas of health, education, employability and environment to the Human Rights Charter, Bharat Nirman Programme and Millennium Development Goals. Till date, we have reached out to over 500,000 people through our social responsibility programmes.
I reinforce Tata Motors’ commitment to conduct business in a sustainable manner, creating value for our stakeholders over the long term. I sincerely invite your views and suggestions on this report.
P M TelangManaging Director – India Operations
Tata Motors Limited
3

4
Category Commercialvehicles*
Passengervehicles#
Total
Industry sales(numbers)
2009-10
2010-11
Growth (%)
2009-10
2010-11
Growth (%)
2009-10
2010-11
Company Sales(numbers)
Company marketshare (%)
582,933
742,091
27.3
373,842
458,828
22.7
64.1
61.8
1,900,704
2,466,814
29.8
260,020
319,712
23.0
13.7
13.0
2,483,637
3,208,905
29.2
633,862
778,540
22.8
25.5
24.32 Source: Organisation Internationale des Constructeurs d’Automobiles (OICA) statistics : http://oica.net/wp-content/uploads/ranking-2010.pdf
3 For more information, please refer: http://tatamotors.com/know-us/company-profile.php
4 For more information, please refer: http://tatamotors.com/products-services/passenger.php?ref=worldwide
Source: Society of Indian Automobile Manufacturers (SIAM) report and company analysis*Including Magic and Winger sales#Including Fiat and Jaguar Land Rover branded cars.
Our drive to become India’s largest automobile company started in the year 1945. We are the leading mnufacturers in the commercial vehicle segment and among the top three in passenger vehicles with winning products in the compact, midsize car and utility vehicle segments in India. We are the world’s fourth largest truck and bus manufacturer2. We were the first Indian company under the engineering sector to be listed in the New York Stock Exchange in the year 2004 which further expanded our horizon in international markets. Our global operations are located at South Korea, Thailand and Spain through our subsidiaries and associate companies. Through our subsidiaries, we are engaged in engineering and automotive solutions, construction equipment manufacturing, automotive vehicle components manufacturing, machine tools and factory automation solutions, high-precision tooling, plastic and electronic components for automotive
and computer applications, and automotive retailing and service operations3.
Our manufacturing operations are classified into two business units - Commercial Vehicle Business Unit (CVBU) and Passenger Car Business Unit (PCBU). Our market presence is spread across Europe, Africa, the Middle East, South East Asia, South Asia and South America. Our product range includes passenger cars, utility vehicles, light commercial vehicles, medium and heavy commercial vehicles. Our manufacturing units in India are located at Jamshedpur, Pune, Lucknow, Pantnagar and Sanand and our corporate office is located in Mumbai. A detailed list of our product offerings and services can be found on our website4.
Keeping in mind the progressive needs of customers, we make vehicles that consume lesser fuel, have low
About Tata Motors
environmental impact and demonstrate superior performance. This year saw multiple product launches in the passenger car segment including Indica Vista Drivetech4, Indigo e-CS, Aria, Indica eV2 and Manza. Indigo e-CS and Indica eV2 have raised the bar for fuel efficiency by demonstrating a segment leading mileage of 23.03 kmpl and 25 kmpl respectively. Aria and Manza address the dual need luxury and robustness with high performing features along with stunning interiors and exteriors. Similarly, in the commercial vehicle segment, we launched Ace Zip, Magic Iris, Venture and Prima Construck.
This year, the domestic sales volumes increased by 22.8 percent to 778,540 vehicles from 633,862 vehicles in 2009-10, while export volumes showed improvement and increased by 70.3 percent to 58,089 vehicles from 34,109 vehicles in 2009-10.

5About Tata Motors
Awards and AccoladesEnvironment, Safety and Social Responsibility:
Manufacturing Excellence:
Business Performance:

6
Commercial Vehicle Business Unit (CVBU)
Our Vision
To be a world class corporate constantly furthering the interest of all its stakeholders.
Our Mission
Shareholders: To consistently create shareholder value by generating returns in excess of Weighted Average Cost of Capital (WACC) during the upturn and at least equal to Weighted Average Cost of Capital (WACC) during the downturn of the business cycle.
Customers: To strengthen the Tata brand and create lasting relationships with the customers by working closely with business partners to provide superior value for money over the life cycle.
Employees: To create a seamless organization that incubates and promotes innovation, excellence and the Tata core values.
Vendor and Channel Partners: To foster a long-term relationship so as to introduce a broad range of innovative products and services, that would benefit our customers and other stakeholders.
Community: To proactively participate in reshaping the country’s economic growth. To take a holistic approach towards environmental protection
Passenger Car Business Unit (PCBU)
Vision
To develop TATA into a world class Indian car brand for innovative and superior value vehicles.
World class in:-
Superior value in offering:-
Mission
To,

Defining priorities 7

Defining priorit ies8
Over the years, the automobile industry has contributed greatly in improving the quality of life of millions of people by providing access to efficient and cost effective modes of transport. On the other hand, the industry has also come under the radar for issues related to environment and safety. Over time, we have taken steps to address these issues as effectively as possible. This year, we conducted an assessment for revisiting material issues identified in the previous year. All the issues of material significance were identified and assessed against six materiality filters - financial impacts and risks, legal drivers, internal policy drivers, peer based performance, stakeholder concerns and opportunity for innovation. The assessment confirmed climate change management, supply chain management, materials management, occupational health and safety and community stewardship as key material issues on which our stakeholders expect our response.
Managing our impacts on climate change is a material issue for us by virtue of our processes and products that are heavily dependent on fossil fuels as a source of energy. Rising fuel costs and impending legislations impede the growth of the auto sector. Today, the sectoral focus is on developing fuel efficient vehicles, vehicles that are powered by alternative fuels and that have a low environmental impact over their life cycle. We have and will continue to research development of fuel efficient and alternate fuel vehicles,
which will have a minimum impact on greenhouse gas emissions across their life cycle. In our processes too, we strive to increase energy efficiency, in order to minimize our carbon footprint.
Procurement of appropriate raw materials and spare parts at the right time is essential for our efficient functioning. Equally important is the delivering of finished goods to our dealers and distributors. We acknowledge that our supply chain has a significant contribution on our sustainability performance and thereby our long term growth. We have initiated several programmes to enhance environmental and social consciousness within our supply chain. Our ultimate aim is to ensure that our supply chain has an equal understanding of our sustainability vision and strategy.
Optimising material use is one of our focus areas, with an aim of reducing consumption of virgin material and increasing recycle and reuse of waste. Through ERC, there is a dedicated focus on reduction and elimination of usage of toxic materials like hexavalent chromium, lead, asbestos, arsenic, ozone depleting substances etc. Material substitution also helps to contribute towards reducing the weight of the vehicles, thereby directly impacting fuel consumption and related greenhouse gas emissions. There is a serious focus on enhancing vehicle recoverability
and recyclability to ensure appropriate disposal at end of vehicle life.
We address health and safety related issues at two levels – operations and products. We follow a zero accident policy and our endeavour is to ensure a safe operating environment. Within our plants, we have taken a number of steps to improve occupational health and safety of our workforce. Customer safety is of paramount importance to us, and we continue to implement features in our vehicles to enhance vehicular safety. Through research efforts, we also focus on passerby safety, to minimize negative impacts that may occur in case of accidents.
We consciously work hard to improve the quality of life of the community across our operations through well designed programmes in association with local authorities and non-profit organizations. Our focus areas are health, education, employability and environment, and we have linked them to the Human Rights Charter, Bharat Nirman Programme and Millennium Development Goals. As a Tata Group company we follow the Tata Corporate Sustainability (CS) protocol to assess the progress of our community initiatives. This has helped us mature from having a community based focus to a business linked strategic initiative with a nationwide footprint in managing our social responsibility programmes.

9Defining priorit ies
Engage withstakeholders
Identify issuesand concerns
Prioritise theissues andconcerns
Address theissues andconcerns
Set goalsand targets
Implementstrategicinitiativesand review
Report backto stakeholders
Learnings andfeedback
Engaging with stakeholders is critical to our business and we view stakeholder interaction as a means to identify business opportunities and minimize risks. Given the wide variety of stakeholders we have, and their varying needs, we have established a number of formal and informal mechanisms to engage with them. Our stakeholders play a key role towards ensuring the longevity and sustainability of our business. We consider them as partners in our success and strive towards inclusive growth.
We provide our shareholders with regular updates through financial publications and print media. We have undertaken a number of investor friendly initiatives such as sending reminders to investors who have not claimed their dues, odd lot scheme, sending nomination forms, shareholders discount scheme, arranging factory visits and many more. At the corporate level, we engage with our shareholders through the Investors’ Grievance Committee which is assigned with the responsibility of redressal of investor’s grievances.
Our customers are our prime stakeholders and we have established a robust Customer Relationship Management (CRM) framework to engage with them on a regular as well as need basis. Our CRM is an online common platform for our sales and spare parts service activities and all channel partners. It gives us an online, real-time market and customer interaction and information capability. We conduct regular customer satisfaction surveys to assess the current levels of customer satisfaction and seek suggestions for product and service innovations.
The PCBU uses the internationally recognised JD Power survey results to assess customer satisfaction. The survey is conducted on random sampling basis covering all key domestic players in the industry and the results are reported as customer and sales satisfaction scores. The
Customer Satisfaction Index (CSI) study measures satisfaction among vehicle owners who visited their authorised dealership service centre for maintenance or repair work during the first 12 to 24 months of ownership of the vehicle. The study measures overall satisfaction by examining five factors: service quality, vehicle pick-up, service advisor, service facility and service initiation. PCBU was ranked 5th during 2009 and 2010 JD Power Customer Satisfaction Index study, up from 11th in the 2008 study. PCBU has scored 779 points (in the 1000 point scale) which is an improvement of 29 points over the 2009 score.
Every year Taylor Nelson Sofres (TNS) conducts a syndicated survey for assessing customer satisfaction for CVBU covering the leading commercial vehicle manufacturers in India. The survey takes into consideration international benchmarks on customer engagement levels of global players from findings of J D Power & Co. In the TNS approach, customer engagement is derived as a weighted average of
Stakeholder engagement model at Tata Motors

Defining priorit ies
scores on overall satisfaction, advocacy, loyalty and competitive advantage. The index score varies on a 200 point scale from -66 to +134. The results of the survey are segment wise and the segment classification is aligned with SIAM. This year, CVBU was the leader in satisfaction scores in medium and heavy commercial vehicle (M&HCV) truck (90 points), light commercial vehicle (LCV) truck (87 points) and LCV bus (93 points) segments. In both these segments our satisfaction score was the highest ever for any year in 2011.
We provide our existing as well as prospective customers with appropriate product and service information. Such access mechanisms are a part of ISO/TS16949:2009, a formal Quality Management System implemented across our operations. In order to increase customer interaction we have extended customer touch points to the web, call centres, SMS, toll free lines and a 24x7 helpline. We have a ‘Customer Centricity’ initiative that connects the sales and service function with back-end operations to deliver customer expectations. We also have assigned executives that address the requirements of key accounts. In September 2010, ‘Dealer Customer Meet’ was organized in 20 cities across India. A total of 123 officers from PCBU and ERC visited different dealers and interacted with dealer sales teams, service teams, technicians and customers. Root causes for customer grievances were identified and specific plans of action were prepared to address the concerns.
All product related issues are reviewed regularly in customer satisfaction, quality assurance and ERC meetings and specific actions are implemented as appropriate.
We have a variety of formal and informal mechanisms to engage with employees. We conduct periodic employee satisfaction surveys to determine areas of improvement in our systems and take concrete steps to meet employee expectations. Town hall meetings, internal newsletters and magazines provide employees with important information regarding our growth plans and strategy. We have established employee suggestion schemes at operational level to improve process efficiencies. Performance appraisals and feedback conducted on an annual basis, help to address the learning and development needs of employees and facilitate their career growth. We have a robust system for employees to report any instances of non adherence to the Tata Code of Conduct (TCoC). Reported instances are reviewed and addressed by our Ethics and Compliance Committee on a periodic basis.
We have a vast network of suppliers and dealers across the country and we have established relationship management programmes with them. We conduct supplier and dealer meets to discuss any issues of concern, areas of innovation and any other information pertinent to our business. Our management has maintained an open door policy for suppliers and dealers. Our Board periodically reviews and assesses any issues that arise with our suppliers and dealers.
We have established vendor parks near our operations in Sanand and Pantnagar to facilitate close interactions with our suppliers, minimize lead time, reduce travel costs and reduce packaging requirements. We share a special relationship with many of our suppliers and have helped them expand their businesses. We have also helped a number of suppliers improve their environmental and social performance by increasing awareness and supporting them to achieve ISO 14001 and OHSAS 18001 certifications.
Type of review Frequency Changes driven
Balanced Scorecard Month, Quarter, Annually Personal team/ResourcesEmployee survey Annually Personal and policiesPerformance review Annual with semi-annual updates Personal and teamFocus group andSkip level meetings Monthly Personal and PoliciesTBEM (internal and external) Half yearly and Annually Processes and linkages improvement initiativesSelf evaluation Weekly and Monthly Personal actionsPersonal Development Plan Half Yearly Personal and team
Mechanisms to measure effectiveness of senior leadership:
10

11Defining priorit ies
Suppliers play a key role in our innovation and value creation processes by being partners in co-development of parts, providing technological inputs at the design stage and then building capacity to supply. PCBU uses a systematic supplier quality initiative (SQI) process for development of suppliers. Technology days and vendor meets are organized on a regular basis to facilitate learning and sharing of technologies and future plans. Increased engagement with dealers has been initiated through quarterly dealer and dealer council meets.
We have dedicated Corporate Social Responsibility cells across our plants and also at the corporate level. Periodic community needs assessment surveys are conducted to understand expectations of the communities in which we operate. We develop our engagement strategies in line with these expectations. Our programmes are designed to have active participation from communities, local governance bodies and NGOs, making them co-owners of the initiatives. We undertake impact assessment studies to understand the effectiveness of our initiatives and have regular reviews as per the Tata CS Protocol.
Capturing ideas across the value chainSystematic processes to capture ideas
Processes to capitalize on diverse ideas, cultures and thinking Examples of ideas captured and implemented
Team structures, Suggestion scheme, share café, Idea generations, Job rotations, Systematic employee movement within domestic and international business, etc
NPI, Material cost movement for model LPT2515/48TC through employee CFTs, EDP programme
VOC, Customer clinic, Dealer/Distributor meets, key accounts by leaders, Naka visits, Auto Expo, CRM, etc
Improvements in rear axle, Strong chassis frame, Load body & clutch plate
Development of volunteers, Community centres, Periodic group meetings, Government liaison, Student community, etc
Soak pits, Bunds, Alternate energy, Anti pollution drives, Nirmal Gram plans
Product / Country managers and regional managers along with focus team from distributors capturing customers’ requirements, etc
Engine heating system in extreme cold conditions, Reducing Engine wear in extreme hot conditions
Supplier meets, Technology day, SRM availability, etc. Advanced Break System, Hydro forming
From employees
From customers
From suppliers
From community
From international business related customers / employees
12 Defining priorit ies
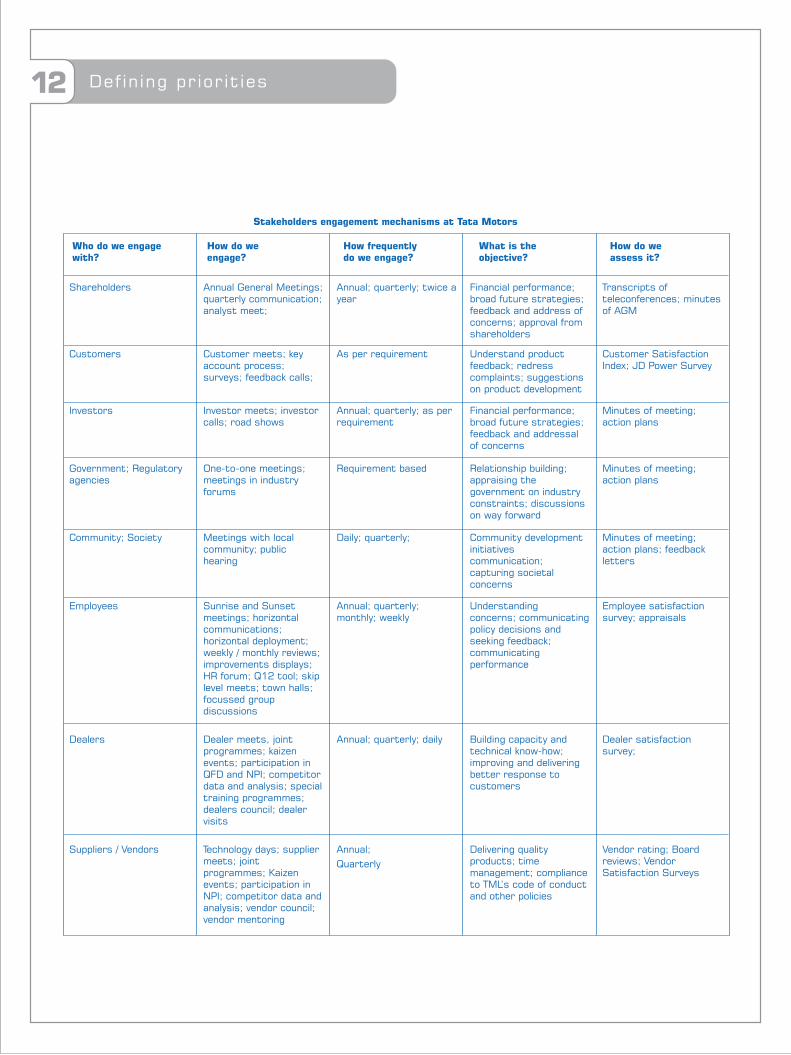
Who do we engage How do we How frequently What is the How do wewith? engage? do we engage? objective? assess it?
Shareholders Annual General Meetings; quarterly communication; analyst meet;
Annual; quarterly; twice a year
Financial performance; broad future strategies; feedback and address of concerns; approval from shareholders
Transcripts of teleconferences; minutes of AGM
Customers Customer meets; key account process; surveys; feedback calls;
As per requirement Understand product feedback; redress complaints; suggestions on product development
Customer Satisfaction Index; JD Power Survey
Investors Investor meets; investor calls; road shows
Annual; quarterly; as per requirement
Financial performance; broad future strategies; feedback and addressal of concerns
Minutes of meeting; action plans
Government; Regulatory agencies
One-to-one meetings; meetings in industry forums
Requirement based Relationship building; appraising the government on industry constraints; discussions on way forward
Minutes of meeting; action plans
Community; Society Meetings with local community; public hearing
Daily; quarterly; Community development initiatives communication; capturing societal concerns
Minutes of meeting; action plans; feedback letters
Employees Sunrise and Sunset meetings; horizontal communications; horizontal deployment; weekly / monthly reviews; improvements displays; HR forum; Q12 tool; skip level meets; town halls; focussed group discussions
Annual; quarterly; monthly; weekly
Understanding concerns; communicating policy decisions and seeking feedback; communicating performance
Employee satisfaction survey; appraisals
Dealers Dealer meets, joint programmes; kaizen events; participation in QFD and NPI; competitor data and analysis; special training programmes; dealers council; dealer visits
Annual; quarterly; daily Building capacity and technical know-how; improving and delivering better response to customers
Dealer satisfaction survey;
Suppliers / Vendors Technology days; supplier meets; joint programmes; Kaizen events; participation in NPI; competitor data and analysis; vendor council; vendor mentoring
Annual;Quarterly
Delivering quality products; time management; compliance to TML’s code of conduct and other policies
Vendor rating; Board reviews; Vendor Satisfaction Surveys
Stakeholders engagement mechanisms at Tata Motors

13The pivot point

14
Our philosophy on corporate governance is founded on a rich legacy of fair, ethical and transparent governance practices, many of which were in place even before they were mandated. We have adopted highest standards of professionalism, honesty, integrity and ethical behaviour, and incorporated them in our way of conducting business. Through this robust governance mechanism, the Board along with its committees undertakes its fiduciary responsibilities to all its stakeholders.
We continue to strengthen our corporate governance practices through implementation of specific models and methods. The Tata Business Excellence Model (TBEM) is a means to drive business excellence and also track progress on long term strategic objectives. The TCoC articulates values, ethics and business principles guiding our Board and employees on ethical behaviour. It also acts as an appropriate mechanism to report and address concerns pertaining to non-adherence to the code. We are in full compliance with the requirements under Clause 49 of the Listing Agreement with the Indian Stock Exchanges. Our risk management and internal control functions are geared up to meet the requirements of progressive governance standards.
The Board of Directors along with its Committees provides leadership and guidance to our management and directs, supervises and controls our performance. Mr. Carl-Peter Forster was appointed as Tata Motors Group CEO & Managing Director with effect from 01 April 2010. The Board currently comprises of 13 Directors, out of which 10 are non-executive.
To address the various governance requirements we have the following committees: Audit Committee, Remuneration Committee, Investors’ Grievance Committee, Executive Committee, Ethics and Compliance Committee and Nominations Committee. We have health, safety and environment committees at each of the plants. A steering committee headed by the Managing Director tracks safety, health and environment performance, addresses issues and identifies areas of improvement on a monthly basis. Our enterprise risk management (ERM) framework maps the strategic, operational, financial and governance risks related to the business strategy and assesses potential weaknesses in the internal processes. Detailed information on committees of the Board and their functioning can be sourced from our 2010-11 Annual Report5.
Name of the Director Position of Responsibility
Mr. Ratan N Tata Non Executive Chairman
Mr. Ravi Kant Non Executive , Vice Chairman
Mr. J J Irani Non Executive
Mr. R Gopalakrishnan* Non Executive, Independent
Mr. N N Wadia Non Executive, Independent
Mr. S M Palia Non Executive, Independent
Mr. R A Mashelkar Non Executive, Independent
Mr. S Bhargava Non Executive, Independent
Mr. N Munjee Non Executive, Independent
Mr. V K Jairath Non Executive, Independent
Mr. R Sen Non Executive, Independent
Mr. Ralf Speth Non Executive
Mr. Carl - Peter Forster Group CEO and Managing Director
Mr. P M Telang Managing Director - India Operations
The pivot point
5Annual Report Page 42 - http://tatamotors.com/investors/ annualreports-pdf/annual-report-2010-11.pdf
*Ceased to be a Director w.e.f September 1, 2010

15The pivot point
Corporate ethics at Tata Motors
The Tata Code of Conduct (TCoC) plays an important role in infusing the principles of ethics, transparency and responsibility across our operations. The conformance of employees to TCoC is monitored by the Ethics and Compliance Committee. It ensures that each employee on becoming a part of Tata Motors abides by the content and motive of our ethical practices. All our employees undergo a one hour refresher course on TCoC on an annual basis which covers aspects of ethics, human rights and corruption. Any cases of non-compliance are taken seriously, and persons involved are penalized as per the terms of TCoC. We have appointed a lady ethics counsellor across locations as a part of our Sexual Harassment Redressal Mechanism. The status on ethical concerns is presented in the Audit Committee meetings on a periodic basis. The TCoC framework classifies the types of concerns as per the following six categories employee relations; environment, health and safety; diversity, equal opportunity and respect in the workplace (including sexual harassment complaints); financial impropriety; legal compliance; and unfair business practices. During FY 2010-11 a total of 60 concerns were received under the TCoC, of which 21 were valid and subsequently resolved.
Management systems
An enterprise process model (EPM) manual comprising of enterprise level processes and their sub-processes helps us conduct business in an effective and efficient manner. The model is continuously upgraded to ensure that it evolves in line with process changes, changing business needs and global paradigm shifts. This has helped us evolve a uniform approach to all business processes across all manufacturing locations. We have successfully implemented ERP SAP, which has given us the advantage of reliable, consistent and accurate data. Additionally, our CRM-DMS (Customer Relationship Management – Dealer Management System) is a unique initiative, implemented through
a centralized online system. This is deployed to all the channel partners.
All our manufacturing locations have adopted and are certified for management systems related to quality, environment, occupational health and safety. Our plants at Jamshedpur, Lucknow and Pune are also certified to SA8000 social accountability standard, under the purview of which they are subject to regular human rights reviews and impact assessments. We have mandated that all suppliers involved in automotive production and relevant service parts adopt the ISO 9001/TS 16949 quality management system framework, as applicable, for implementation, management and improvement of their work processes.
Lobbying with a purpose
We have a legacy of being involved in making sound policy decisions, to drive change and foster public policies that are beneficial to industry and the nation as a whole. We are active members of a number of associations, through which we endeavour to put forth our views, work with our peers and influence strategic decision making at all levels. Some of the bodies of which we are members are:
Indo German Chamber of Commerce
Manufacturers (SIAM)
Manufacturers (AIAM)
Development Council, Mumbai
Commerce
Classification Total concerns received
Employee relations 32
Environment, Health & Safety 8
Diversity, Equal opportunity &respect in the workplace (including sexual harassment complaints) 4
Financial impropriety 13
Legal compliance 0
Unfair business practices 3
Total 60

16 The pivot point

Economicperformance 17

18 Economic performance
Economic Value Generatedand Distributed (in ` billion)
Economic Value Generated 521.36
Gross Revenue 521.36
Economic Value Distributed 494.82
Operating Costs 441.93
Employee Benefits and Wages 22.94
Payments to providers of capital 26.11
Payments to government 3.84
Economic Value Retained 26.54
Our sales (including exports) of commercial and passenger vehicles for FY 2010-11 stood at 836,629 units, representing a growth of 25.2 percent as compared to the previous year. This growth was supported by significant revival of export-import trade, infrastructure development, increased mining and construction activities, favourable financing environment and healthy freight availability. However, in recent months there have been developments which have the potential to adversely impact growth in the commercial vehicles market. These include slow-down in industrial sector and high inflation which has necessitated rise in interest rates. The Reserve Bank of India (RBI) has projected wholesale price index (WPI) inflation during FY 2011-12 to remain around 9 percent up to September 2011, and decline thereafter to 6 percent by March 2012. This is based on expectations of strong inflationary pressures emanating from high global commodity prices, as well as domestic price pressures and demand-supply mismatches.
We recorded a sale of 778,540 vehicles in this year, a growth of 22.8 percent over the previous year in the domestic market representing a 24.3 percent market share. We exported 58,089 vehicles from India, a growth of 70.3 percent over the previous year. Our commercial vehicles sales in India increased by 22.7 percent year-on-year to 458,828 units, resulting in a market share of 61.8 percent. Growth in M&HCV segment has been accompanied by a structural alignment and shift in favour of higher tonnage trucks. Passenger vehicles, including Fiat and Jaguar and Land Rover vehicles distributed in India grew by 23.0 percent year-on-year to 319,712 units, resulting in a market share of 13.0 percent. Sales of Nano crossed 100,000 mark during FY 2010-11 and our total passenger vehicles sales crossed the two million mark, since inception.
Our gross revenue for the year ended March 31, 2011 was ` 521.36 billion, posting a growth of 35.9 percent over ` 383.64 billion in the previous year. Cost pressure, including commodity
price increase, resulted in a reduction in the operating margins to 9.9 percent and an operating profit (EBITDA) of ` 47.71 billion in the year, posting a growth of 14.2 percent over ` 41.78 billion the previous year.
In FY 2011-12, we plan to focus on vehicles specific to rural markets that are expected to drive growth. We will continue transforming and strengthening our existing product portfolio through improved value propositions and benefitting from emerging trends. Competitive intensity and increasing costs in the passenger vehicle segment could pose a risk to operating margins, but we aim to address this issue by sustaining a low cost base with continuous cost reduction efforts and enhance customer care through an expanded sales and service network in India.
Integrated Cost Reduction – collaborating to create value
The ‘Integrated Cost Reduction’ drive was a multi functional initiative across the PCBU to reduce redundant costs and resource wastage across the supply chain. The aim was to generate innovative ways of meeting the customer needs without compromising on value. The effort was led by ERC and procurement teams with equal participation from manufacturing and quality departments forming cross functional teams (CFTs) that helped to drive improvements in business areas across the value chain. Each CFT was given a specific target for reduction of cost of aggregates. The teams worked under platforms like direct material cost, variable conversion, fixed conversion cost and working capital. 22 CFTs started working this year along with 200 dedicated officers. The initiative has gathered momentum and has started to provide results through collaboration across locations.
Building a robust supply chain
This year we won an Architecture Excellence Award in the IT Service Management category at the ICMG World Conclave. Our competitive advantage includes a world class CRM solution with integrated dealer management system (DMS) used by over

19Economic performance
2,500 channel partners. Further the supplier self service initiative with design collaboration solution has been extended to an additional 550 vendors this year.
At an organizational level, we have been successful in implementing the model of third party logistics. These logistics providers immensely cut down on the overall transportation costs and time as they follow a hub and spoke model in delivering the consignments efficiently. This has ensured that we have an enhanced control on our inventory. This also helps in reducing fuel costs and thereby the related emissions. An important aspect of our initiative to green the supply chain has been to seek transparent disclosure from all our vendors on the hazardous material content in each part that they supply. The amount of heavy metals present in the parts have to be declared and are procured only if they meet our stringent material criteria. The chemical composition of the parts is thoroughly checked by our cross-functional team of experts.
At Sanand and Pantnagar, adjacent to our plant boundary, we have established a vendor park with all basic amenities in place which would house vendors supplying exclusively to Tata Motors. We aim to source more than 60 percent of our components from the vendor park, thus increasing our resource efficiency and decreasing our emissions due to reduction in logistics related transportation. Through these vendor parks we have created employment for about 3,750 persons in and around Sanand, out of which 750 are on fixed roll and 3,000 on contract roll. Apart from this, there are about 1,000 persons employed with tier-2 vendors and support functions like logistics, canteens etc. The employment numbers will increase considerably with the scale of operation. Almost 95 percent of the materials supplied from the vendor park are transported in trolleys and returnable packaging. This initiative is aimed at ensuring flow of component supplies on a real-time basis, and there-by reducing logistics and inventory costs as well as lowering
uncertainties in the long-distance supply-chain. In the reporting period, our manufacturing plants sourced approximately 58.57 percent of materials and services from vendors within their state of operations.
Additionally we have specific initiatives to enhance the environmental and social performance of our vendors. Every vendor in the vendor park has installed vortex flow meters for monitoring water usage which gives readings remotely at set frequencies. This helps in analyzing consumption pattern and thus optimizing the water use based on production and manpower engagement.
Environment procurement policy
Our aim is to adopt a holistic approach to the procurement process by expanding awareness of our environment policy and TCoC amongst vendors, contractors and service providers. To this effect we formulated an environment procurement policy that provides guidance on evaluating the environmental performance of our business associates along with quality and cost. In line with this policy we have taken an initiative to encourage our vendors and service providers to establish their own environment management systems. Awareness campaigns to improve their manufacturing process, reducing their carbon footprint and use of hazardous chemicals have also been formulated under the aegis of this policy. At our Jamshedpur plant, close to 1,120 service providers have participated in the awareness sessions. We have seen vendors implement ideas to reduce packaging material and increase use of recycled material as a result of the various programmes conducted, since the inception of this policy. One such outcome has been the use of retainer bins, which are used to pack the consignments and once delivered, these bins are reclaimed by the supplier for reuse. This has significantly cut down our packaging material footprint. We aim to create awareness and promote good environmental practices and management systems in our supply chain with the aid of ISO14001 certification for our channel partners.

20 Economic performance
Supplier performance enhancement
Under the policy initiative of supplier performance enhancement, we conduct in house vendor council meetings to formulate a sound system for evaluation and enhancement of supplier performance. At PCBU, the meetings are held under the guidance of the Head-Car Plant, Head-Supply chain management, Head-Quality and Assistant General Manager-Vendor development. In order to make the evaluation system more comprehensive, new metrics were identified for continuous evaluation of supplier performance in this year. These include a monthly quality index,
monthly delivery index and a monthly vendor rating system based on quality, cost, delivery, design development and management systems. The grading of suppliers would be done based on these parameters on a scale of ‘A’ to ‘E’, with ‘A’ being the best. This would help our suppliers improve their performance and work towards continuous improvement. Further, we conduct surprise audits under the TCoC framework and third party audits under the purview of SA8000 to ensure that there are no incidents of human rights violations including child labour and forced labour in our supply chain.

21Environmentalstewardship

22 Environmental stewardship
Material Unit of Quantity Measurement
2008-09 2009-10 2010-11
Steel Tonnes 153,240 185,205 220,133
Steel Tubes Tonnes 8 30 82
Non-Ferrous alloys Tonnes 2,635 3,339 5,040
Ferrous Alloys Tonnes 1,251 1,372 1,716
Steel Melting Scrap Tonnes 43,281 53,418 62,195
Paints, Oils & Lubricants Tonnes 7,896 7,684 12,151
Kilo Litres 9,692 10,024 13,349
Tyres, tubes & flaps Numbers 4,086,280 4,555,111 7,243,420
Engines Numbers 69,002 104,309 135,181
We use a systematic approach to manage environmental issues. We focus on environmental management to help preserve the long-term health of people and ecosystems and build strong positive relationships with local communities. We have been at the forefront in developing vehicles that meet the various environmental protection regulations, while striving to go beyond compliance. We have developed an organization wide environment policy that highlights the use of environmentally sustainable technologies and practices for prevention of pollution and continual improvement in environmental performance. This policy comprehensively addresses the need to conserve natural resources and energy, minimize waste generation, enhance recovery and recycling of material and develop eco-friendly waste disposal practices. Our endeavour has been to establish environmental management as an integral part of the standard operating systems to achieve best-in-class performance. Further, an intranet web site ‘Yugandhara’ is used for creating climate change consciousness amongst the employees. This year, we have invested ` 346.90 million towards environment management activities across operations.
Resource efficiency
The primary materials and components we use in our vehicle production are steel sheets and plates, castings, forgings, tyres, fuel injection equipment, batteries, electrical items
and rubber and plastic parts, consumables (paints, oils, thinner, welding consumables, chemicals, adhesives and sealants) and fuels. We also require aggregates like axles, engines, gear boxes and cabs for our vehicles, which are manufactured by us or by our subsidiaries, affiliates or strategic suppliers. Close to 80 percent of the parts in our vehicles are made at our vendor’s end and assembled in our plants. Use of alternative material has been a key focus area for our ERC department over the years. This year we have reused 37,373 tonnes of metal scrap and forgings in our process thereby avoiding use of virgin material.
Jute and polypropylene based composite was used for the first time for headlining application on Tata Nano as a replacement to glass fibres. Jute fibres are safe for handling and have a lower life cycle energy consumption as compared to glass fibres.
Increasing life of aggregates – ‘Recon’ business
Our reconditioning business was started to service customers who require an overhauling of aggregates. Instead of going to a local mechanic workshop, the customer can approach any of our designated channel partners and exchange the failed vehicular aggregate assemblies for a reconditioned one, thereby avoiding a complete overhaul. This also ensures that the customer is assured of better quality and a renewed warranty for the reconditioned part. This has enabled us
Typical material breakdown of vehicle(in percentage)
17,386.73 17,784.50
37,373.00
FY 2008-09 FY 2009-10 FY 2010-11
Recycled metal scrap and forgings(in tonnes)
0.0360
0.0286
0.0520
FY 2008-09 FY 2009-10 FY 2010-11
Recycled material used (in tonnes per vehicle produced)
74
Metals
Polymers
Elastomers
Glass
Fluids
M.O.N.M
Others
12
5
3
5
0.181

23Environmental stewardship
to rapidly adapt to rising material costs by improving resource efficiency and reclaiming material value.
Our reconditioning business is based out of Lucknow where we have a dedicated facility for reconditioning the aggregates to the desired quality and enhance the life of the product. Through a network of close to 700 dealers, we source old aggregates from our customers and dispatch reconditioned ones. In 2010-11 a total of 13,788 engines and 8,690 other parts were reconditioned. We have also taken multiple steps for further resource conservation like reusing engine oil for multiple testing cycles. A 200 litre engine oil barrel can now be used to test 170 engines instead of 85. The total turnover of this business is close to ` 780 million.
The hazardous wastes generated are disposed as per the rules and regulations prescribed by the respective State Pollution Control Board (SPCB) as per the Hazardous Wastes Management & Handling Rules. We follow a system of waste segregation at source through standardized colour coded bins. We have also installed secondary containment measures to manage spills on the shop floor. In Jamshedpur, there are close to 80 secondary containment points across the plant. At Jamshedpur and Lucknow the wet garbage from our canteens is converted to usable organic manure through converters.
Reusing paint sludge and thinner
At PCBU Pune, approximately 390 tonnes of hazardous paint sludge was sent for processing to an authorized party for conversion to paint. Although the paint obtained from this process does not meet the quality standards for automobile painting, we procure the same for floor painting. Before the introduction of this process, the paint sludge was incinerated and this process has eliminated the emissions caused due to this incineration. A similar initiative is practiced at our Jamshedpur plant where we utilize close to 35 MT of paint sludge every month. Apart from utilization of paint sludge, at our Jamshedpur plant, we have also developed a process to convert the incinerator ash to pavement bricks that can be used in walkways within the plant. This model has been very successful and ash from the incineration of phosphate sludge, oil / paint soaked jute gloves, rags, cardboard etc has been utilised effectively. Through this, we have significantly reduced the amount of hazardous incineration ash that is sent to landfills.
Category of Non-Hazardous FY 2008-09 FY 2009-10 FY 2010-11waste (in tonnes)
Plastic waste 142.26 89.70 204.33
Metallic scrap 15,669.67 10,869.79 8,002.15
Other waste (cartons, jute bags, woodwaste, rubber waste, canteen waste,sand etc) 100,692.05 90,049.21 66,565.12
Total 116,503.98 101,008.70 74,771.60
24 Environmental stewardship
Category of hazardouswaste disposed FY 2008-09 FY 2009-10 FY 2010-11
Sludge6 (tonnes) 4,536.28 4,299.25 4,812.81
Used batteries (tonnes) 32.14 37.76 198.19
Used oil7 (tonnes) 150.93 168.00 497.68
Oil contaminated materials8 (tonnes) 44.83 23.56 55.31
Other hazardous waste9 (tonnes) 209.97 402.15 936.65
Other hazardous waste10 (KL) 131.24 121.66 231.90
Other hazardous waste11 (Nos) 7,284.00 4,314.00 7,906.00
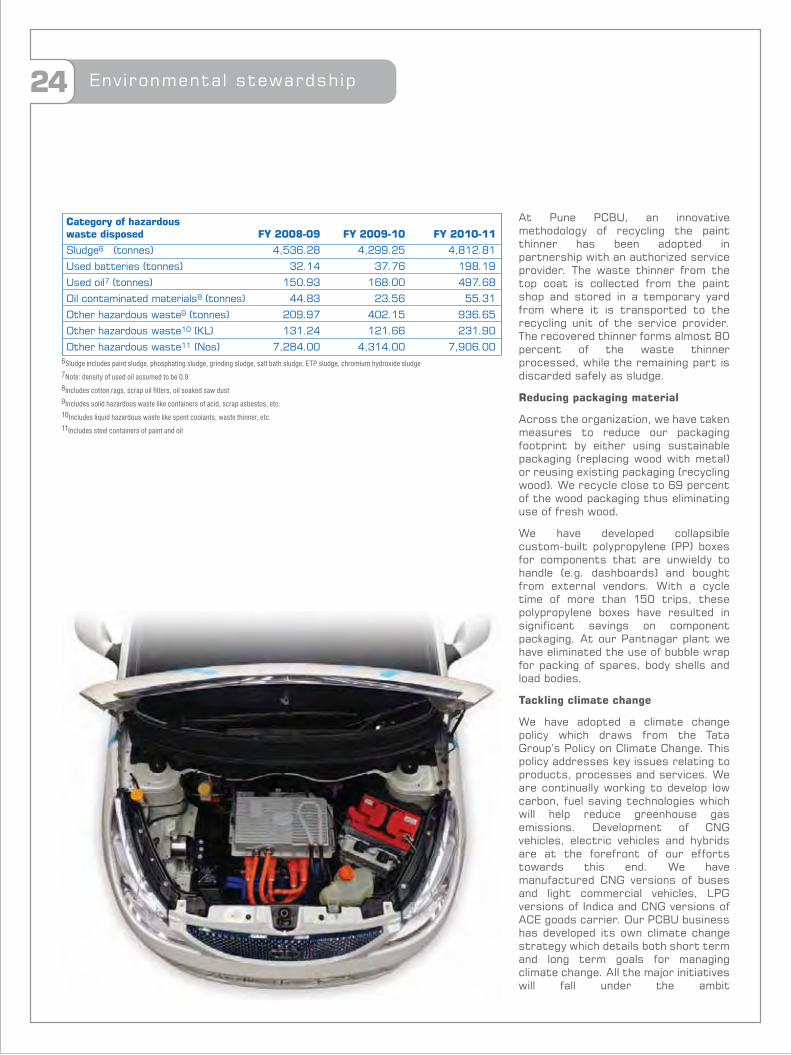
At Pune PCBU, an innovative methodology of recycling the paint thinner has been adopted in partnership with an authorized service provider. The waste thinner from the top coat is collected from the paint shop and stored in a temporary yard from where it is transported to the recycling unit of the service provider. The recovered thinner forms almost 80 percent of the waste thinner processed, while the remaining part is discarded safely as sludge.
Reducing packaging material
Across the organization, we have taken measures to reduce our packaging footprint by either using sustainable packaging (replacing wood with metal) or reusing existing packaging (recycling wood). We recycle close to 69 percent of the wood packaging thus eliminating use of fresh wood.
We have developed collapsible custom-built polypropylene (PP) boxes for components that are unwieldy to handle (e.g. dashboards) and bought from external vendors. With a cycle time of more than 150 trips, these polypropylene boxes have resulted in significant savings on component packaging. At our Pantnagar plant we have eliminated the use of bubble wrap for packing of spares, body shells and load bodies.
Tackling climate change
We have adopted a climate change policy which draws from the Tata Group’s Policy on Climate Change. This policy addresses key issues relating to products, processes and services. We are continually working to develop low carbon, fuel saving technologies which will help reduce greenhouse gas emissions. Development of CNG vehicles, electric vehicles and hybrids are at the forefront of our efforts towards this end. We have manufactured CNG versions of buses and light commercial vehicles, LPG versions of Indica and CNG versions of ACE goods carrier. Our PCBU business has developed its own climate change strategy which details both short term and long term goals for managing climate change. All the major initiatives will fall under the ambit
6Sludge includes paint sludge, phosphating sludge, grinding sludge, salt bath sludge, ETP sludge, chromium hydroxide sludge
7Note: density of used oil assumed to be 0.9
8Includes cotton rags, scrap oil filters, oil soaked saw dust
9Includes solid hazardous waste like containers of acid, scrap asbestos, etc.
10Includes liquid hazardous waste like spent coolants, waste thinner, etc.
11Includes steel containers of paint and oil

25Environmental stewardship
FY 2008-09 FY 2009-10 FY 2010-11
Total energy consumed(in GJ)
1,814,251
2,015,820
2,284,654
1,384,129
1,683,7131,897,114
FY 2008-09 FY 2009-10 FY 2010-11 FY 2008-09 FY 2009-10 FY 2010-11
Total annualized energy savings(in GJ)
Total energy savings(in GJ per vehicle produced)
FY 2008-09 FY 2009-10 FY 2010-11
Total energy consumed(in GJ per vehicle produced)
3.714
3.325
3.174
2.833 2.7772.635
109,460
175,975
230,959
0.224
0.2900.321
Indirect energyconsumed
Direct energyconsumed
Indirect energy Direct energy
of this strategy with concrete execution plans and monitoring systems. Clean development mechanism is an important aspect of our climate change strategy. For our 20.85MW wind power project, United Nations Framework Convention for Climate Change (UNFCCC) has issued 27,554 CERs on January 20, 2011 for the period 2008-09.
In our operations, the major fuels used for energy are high speed diesel (HSD), light diesel oil (LDO), furnace oil (FO), liquefied petroleum gas (LPG), propane and petrol. Our indirect energy consumption is the energy purchased externally in the form of electricity. We utilise wind energy at our Pune complex and solar energy for lighting and heating purposes at our Lucknow plant, which together amount to 4.54 percent of our total energy12 consumption.
We achieved annualized energy savings of 230,959 GJ through the conservation initiatives across our operations, an increase of 30 percent from the previous year. This was possible due to increased awareness and active participation from the workforce in conservation initiatives. A number of energy saving ideas implemented at the shop floor were contributed by our employees. In Pune PCBU, for the first time, climate change CFTs were formed and were assigned targets for reduction. With the help of numerous energy saving initiatives across all our plants, we have been able to reduce our specific GHG emissions over the last year13. Some of the major initiatives
undertaken across the organization include:
variable frequency drives
efficient and lower wattage lamps
canteens and hostels
from hot wash
painting to robotic painting
and using direct fired burners
through reflective coating of the roof
burners in plant and waste heat recovery from furnace flue gases to heat water for process
Green infrastructure
While conservation initiatives are prominent across our operations, a lot of effort is also directed towards use of alternative clean technologies. In Jamshedpur, translucent poly carbonate sheets have been provided covering close to 50 percent of the shop floor roofing to increase natural light thereby minimizing daytime lighting load. A new technology of using light pipes as a source of light has been tried in Jamshedpur and will be implemented in Lucknow by the first quarter of FY 2011-12. The light pipes unlike conventional roof lighting ensure that there is uniform dispersion of light and additionally prevent build up of
12For Jamshedpur, the data collection exercise for last year revealed that
data management systems with regard to energy usage could be
strengthened. Having progressively improved these systems the total
energy consumption for previous years has been revised and restated.
13Since amendments were made to the energy parameters for our Jamshedpur
plant, a minor variation of GHG emissions has resulted for the years 2008-09
and 2009-10 from values reported in our 2009-10 Sustainability Report

26 Environmental stewardship
FY 2008-09 FY 2009-10 FY 2010-11
GHG emissions reduction achieved(in tonnes of CO2e)
25,236.63
40,572.00
47,817.92
heat. While lighting is just one aspect of creating a green building, we have also developed a comprehensive green building policy which encourages the use of materials from recycled content, minimization of waste and use of hazardous materials, minimization of energy and water consumption right from the conceptualization phase. Our plant at Lucknow has considered factors such as double bricked walls, double skinned sheeting and sandwiched roof for temperature control and comfortable working environment while designing new shops. CVBU Pune received the “GOLD” rating (for its green factory building) from Indian Green Building Council (IGBC) and is the first-of-its-kind in India and for the Tata Group. All existing buildings at Pimpri operations are rated as GOLD rating factory buildings. Tata Motors is the first company to receive this award for existing factory buildings.
New avenues of energy
At our Lucknow plant, there has been a drastic increase in electrical energy consumption due to commencement of
a new production facility. Hike in electricity tariff has further increased the energy cost. In order to harness the abundant availability of sunlight, a pilot solar power project of 25KW, the first among all the locations was set up by the Energy Management Cell. Learnings from its operations will be used as inputs for achieving the future goal of setting up a 1 MW solar plant at Lucknow. Apart from resulting in cost savings over the long run, the project will significantly reduce our carbon footprint.
Cutting emissions due to travel
We have invested heavily to provide bus transportation facilities for all our employees. We have increased the number of trips and the coverage of pick up and drop stations encouraging more employees to utilise the said transportation. This serves a dual purpose of cutting down on the emissions due to the commute of our employees, as well as ensures their safety. Over 50 percent of buses used for employee commuting are CNG based and hence have lower emission levels.
FY 2008-09 FY 2009-10 FY 2010-11
Total GHG emissions(in tonnes of CO2e per vehicle produced)
369,827
420,810
482,997
96,380
117,175129,725
Indirectemissions
Directemissions
FY 2008-09 FY 2009-10 FY 2010-11
GHG emission reductions achieved(in tonnes of CO2e per vehicle produced)
0.052
0.0670.066
27Environmental stewardship
Partnering for a cause
In Jharkand, Gram Vikas Kendra (GVK), a NGO actively supported by our Jamshedpur plant has been recognised as a regional resource agency (RRA) under the National Environment Awareness Campaign (NEAC). The NEAC was launched by the Ministry of Environment & Forests, Government of India in 1986. Several NGOs, educational and training institutions, professional associations, scientific bodies, community organizations and a whole range of other agencies participate in the campaign. These bodies singularly or in partnership with other organizations, organise programmes for creating environmental awareness followed by field action at the local, regional and national level.
Through coordination between NEAC, GVK and Tata Motors, Jamshedpur has been able to network with around 500 NGOs in the state of Jharkand highlighting the importance of bio-diversity conservation and the immediate steps to be taken.
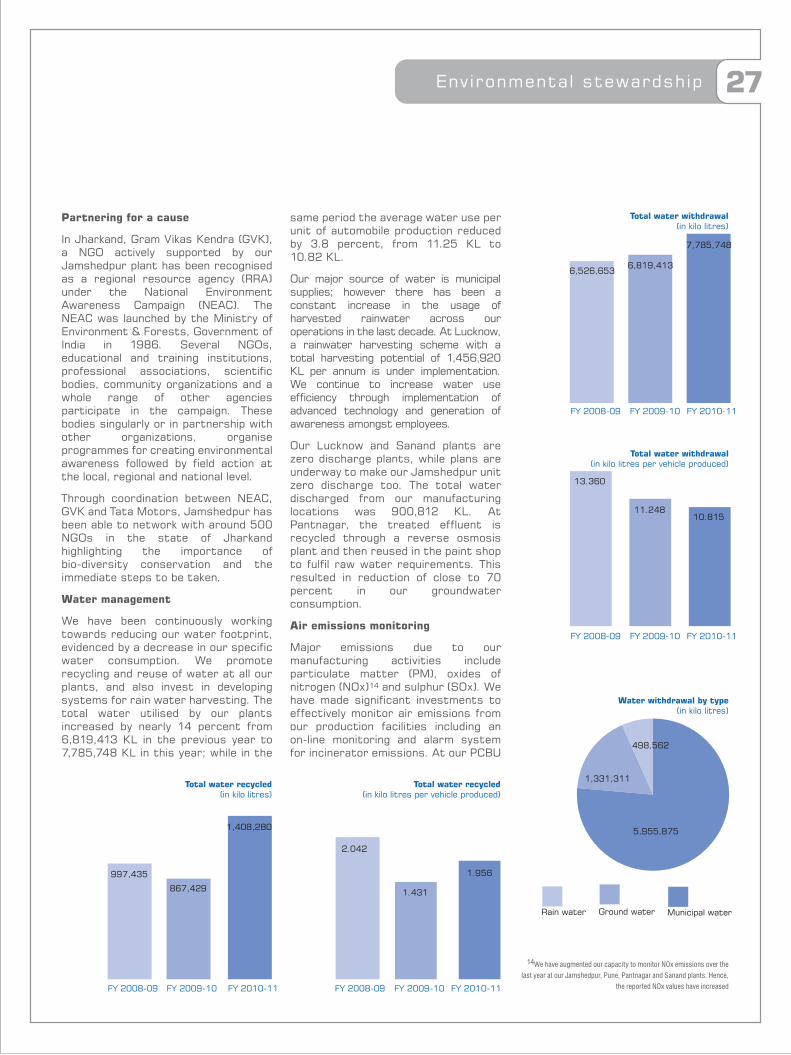
Water management
We have been continuously working towards reducing our water footprint, evidenced by a decrease in our specific water consumption. We promote recycling and reuse of water at all our plants, and also invest in developing systems for rain water harvesting. The total water utilised by our plants increased by nearly 14 percent from 6,819,413 KL in the previous year to 7,785,748 KL in this year; while in the
same period the average water use per unit of automobile production reduced by 3.8 percent, from 11.25 KL to 10.82 KL.
Our major source of water is municipal supplies; however there has been a constant increase in the usage of harvested rainwater across our operations in the last decade. At Lucknow, a rainwater harvesting scheme with a total harvesting potential of 1,456,920 KL per annum is under implementation. We continue to increase water use efficiency through implementation of advanced technology and generation of awareness amongst employees.
Our Lucknow and Sanand plants are zero discharge plants, while plans are underway to make our Jamshedpur unit zero discharge too. The total water discharged from our manufacturing locations was 900,812 KL. At Pantnagar, the treated effluent is recycled through a reverse osmosis plant and then reused in the paint shop to fulfil raw water requirements. This resulted in reduction of close to 70 percent in our groundwater consumption.
Air emissions monitoring
Major emissions due to our manufacturing activities include particulate matter (PM), oxides of nitrogen (NOx)14 and sulphur (SOx). We have made significant investments to effectively monitor air emissions from our production facilities including an on-line monitoring and alarm system for incinerator emissions. At our PCBU
FY 2008-09 FY 2009-10 FY 2010-11 FY 2008-09 FY 2009-10 FY 2010-11
Water withdrawal by type(in kilo litres)
Total water recycled(in kilo litres)
Total water recycled(in kilo litres per vehicle produced)
FY 2008-09 FY 2009-10 FY 2010-11
Total water withdrawal(in kilo litres)
6,526,6536,819,413
7,785,748
1,331,311
997,435
867,429
1,408,280
2.042
1.431
1.956
498,562
Rain water Ground water Municipal water
5,955,875
FY 2008-09 FY 2009-10 FY 2010-11
Total water withdrawal(in kilo litres per vehicle produced)
13.360
11.24810.815
14We have augmented our capacity to monitor NOx emissions over the
last year at our Jamshedpur, Pune, Pantnagar and Sanand plants. Hence,
the reported NOx values have increased

28 Environmental stewardship
FY 2008-09 FY 2009-10 FY 2010-11
FY 2008-09 FY 2009-10 FY 2010-11
Total air emissions(in tonnes)
Total air emissions(in tonnes per vehicle produced)
413.37341.86
641.16
0.846
0.564
0.891
0.195
0.0700.090
0.1710.7960.763
43.92
42.35
123.29372.55 482.74
140.73
facility in Pune, we have set up a volatile organic compound (VOC) emission reduction roadmap at the paint shop to significantly mitigate harmful effects. We have installed an automatic thinner collection system and optimized the paint flow rate and air pressure, in order to reduce VOC emissions. Other initiatives like reduction of thinner pressure during the flushing cycle and sequencing of paint cycles have been incorporated. Switching over from LDO to propane in some of our operations has further helped in reducing the overall air emissions. At Jamshedpur this year we have installed a fume extraction system in the melting shop of the foundry. Scrubbers have been installed
to enable the neutralization of Tri Ethyl Amine ensuring that the air quality parameters do not exceed the prescribed limits.
We use R134a which has zero ozone depleting potential as a refrigerant in our products. We also ensure that no refrigerant is released to the atmosphere during any service, repair and maintenance of air-conditioning equipment of products. Ozone depleting substances (ODS) are no longer used in the manufacturing supporting processes or in our production at Pantnagar and Sanand. Our Lucknow, Pune and Jamshedpur plants used 101.8 kg of CFC-11 equivalent ODS in the reporting period.
NOx SOx PM
NOx SOx PM

Product safetyand Innovation 29

30
We are committed to develop best-in-class products, with the latest technologies for passenger safety and comfort. World-class automotive research and development are key factors that contribute to our leadership. We have set up two in-house ERCs that house India's only certified crash test facility. We pursue state-of-the-art technologies to address safety issues and have a safety roadmap in place which is reviewed at the steering committee level. During the year we spent ` 11.87 billion, 2.47 percent of the net turnover, on research and development activities including expenditure on capital assets purchased for research and development.
During the year, we filed 141 patent applications and 41 design applications. Till date, we have been granted 11 patents and 36 design registrations. We invested in facilities for optimization and emission measurements and for enhancing safety performance. Some of these technologies are:
for vehicle level performance development and various calibrations for utility vehicles and passenger cars
for light, medium and heavy commercial vehicles
dynamometer emission lab for passenger cars and small commercial vehicles for Euro V emission norms onward
safety regulations such as mobile crash test barrier for side impact testing (as per US regulations), rear impact testing (as per Korean regulation)
flicker free lighting system for high speed digital photography during crash events
selective laser sintering (SLS) technology for ‘ready to test’ plastic prototype parts
Major technology absorption projects undertaken during FY 2010-11 include:
Technology for Status
Development of navigation system on Aria Implemented in production
Vehicle vibration reduction during shut down of engine forAria and magic Iris by using high damping SBR engine mounts
Venture tuning of a Torsional Vibration Damper (TVD)
Inflatable curtains for side impact protection Implemented
Technology for indigenized high temperature cables Development in developed for use on vehicles progress
EE - Architecture Development methodology for vehicles
Symptom Driven Diagnostics development for vehicles
Product safetyand Innovation
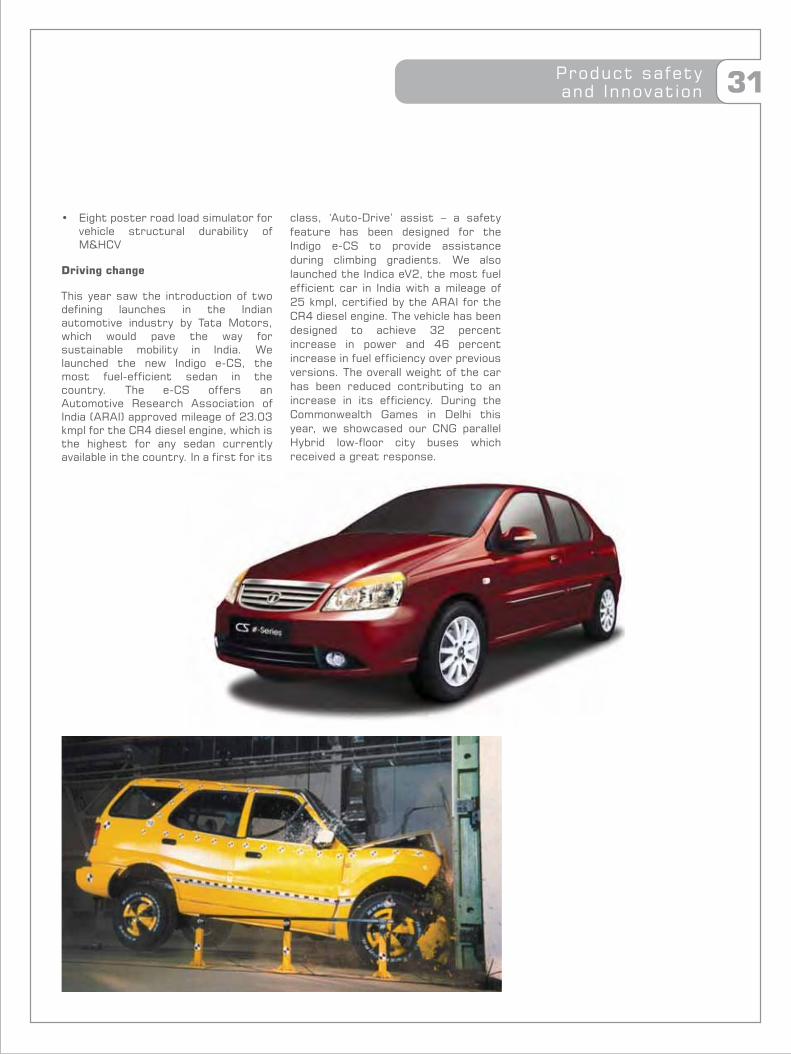
31Product safetyand Innovation
M&HCV
Driving change

32
Acing the race
The Ace has helped many small time business owners grow from an unorganized set up to an organized set up. About 55 percent of the Ace’s customer base is formed by first time users who purchase the vehicle to start a goods transportation business. The Ace became the single largest commercial vehicle brand in 2010 with
a sale of over 100,000 units. The first mover advantage combined with the Ace’s combination of reliability, safety, comfort and affordability induced a paradigm shift in the goods transportation business. Our Lucknow plant is currently working on custom made body solutions on the Ace platform for different business needs for both local and export markets.
Product safetyand Innovation
People in motion 33

34 People in motion
Our employees are the driving force that enables us to create value in the work that we do. We understand that the most essential factor determining our success is motivated employees and communication plays an important role in understanding their needs. We undertake employee engagement initiatives which help us understand their needs and address their concerns. Various formal and informal methods are employed to determine employee satisfaction which help us in identification of critical issues and devising action plans to assist our workforce.
As a responsible organization, we prefer to hire our non management cadre employees from local communities, thereby uplifting the economic status of the areas where we operate. We are also guided by the respective state laws regarding local hiring of non management workforce. We hire our management cadre employees purely based on merit. FY 2010-11 saw us attracting substantial talent to fill some key senior leadership positions. The permanent manpower headcount also increased by 7 percent to 26,214.
A significant portion of our workforce is contractor based and we work
closely with them to ensure the contract labour entering our premises are well-equipped and trained to carry out the operations in a safe and efficient manner. This year, contract workforce was engaged for a total of 35.53 million man-hours across our plants16. We prohibit the deployment of child labour and forced labour in our sites and our security personnel have been trained to maintain a strict vigil on under-age workers entering the premises. As part of their induction, all our security personnel are imparted training on basic human rights aspects. These aspects are covered under the ambit of the Industrial Relations (IR) department and activities under SA 8000. We value Human Rights as defined by the International Labour Organization and have a dedicated Human Rights Policy. 100 percent of our business units are analyzed for risks related to corruption as per the Sarbanes-Oxley Act, and all our employees are trained in our anti corruption policies and procedures, as per the TCoC. We do not engage any individual below the age of 18 for any of our operations or services with the exception of a Government approved job training or an apprenticeship programme.
Our primary objective is enhancing employee competencies and instilling in them the ability to face the complexity of the competitive market. We have various training and development programmes designed to identify their skills and further aid their development. Training is provided as per desired requirements catering to the specific areas of operations. Our permanent workmen received training for a total of 545,860 manhours (amounting to 37.57 manhours of training per workman per year) and our contract workers received training for a total of 54,083 manhours during this year. Our management level employees received training for 497,300 manhours (amounting to 42.57 man hours of training per management employee per year).
Skill development, employee growth and employee retention were our areas of focus during the year. As part of
Category FY 2010-11designation Permanent employees
M F Total
Senior management 802 21 823
Middle management 7,198 293 7,491
Junior management (Executive) 3,187 182 3,369
Workmen 14,324 207 14,531
TOTAL15 25,511 703 26,214
Employee turnover FY 2010-11
<30 years 30-50 years >50 years Male Female
Senior management 0 10 2 11 1
Middle management 139 80 3 211 11
Junior management 20 8 1 27 2
Workmen 19 9 3 30 1
TOTAL 178 107 9 279 15
15We also had 18,095 temporary workmen as on 31st March 201116The number of contract labour varies over time, depending on our requirements, and hence, we have reported the number of contract man hours worked. It is for the same reason that we cannot give information about the region wise breakup of contract labour

35Workforce development
organization wide efforts towards climate change mitigation and sustainability our plants have designed awareness training programmes for employees which have been well received. At Jamshedpur, close to 5,800 employees have been covered under the awareness sessions on climate change and sustainability. We promote initiatives to learn from our peers, subsidiaries and joint ventures. Joint forums have been organized for learning and sharing with Jaguar Land Rover (JLR) and Fiat. Employees who show aptitude for engineering and management excellence are sponsored for advanced technical / management programmes in reputed institutes. Structured training programmes based on Tata leadership practices and transition point training programmes at each vital level of leadership are the formal methods used for developing and enhancing personal leadership skills. Specialized courses in management from premier institutes help in keeping the leaders abreast of contemporary management tools and thinking.
We promote employee well being during their tenure as well as after their retirement. Benefits such as gratuity, superannuation, Bhavishya Kalyan Yojana (BKY), post retirement medicare scheme, provident fund and compensated absences are provided to employees. Every year we have a number of employees who have completed their service with the organization and we provide them training to prepare them for the challenges and opportunities that arise after retirement. Both management and non-management cadre are covered under this two day program. The spouses of the retiring employees are also made a part of the training to get them accustomed to this new phase. At CVBU Pune, this year 3,360 man-hours were invested in retirement training for employees and their spouses.
Our performance evaluation systems are aligned to our business results and identify high performing individuals. 100 percent of our management cadre employees undergo performance evaluation and career development
reviews annually. We promote equal opportunity by employing candidates purely on the basis of merit. Remuneration is solely provided on the basis of rank and merit. We also abide by all the legal requirements of wage payments. We are transparent in our communications with union members and have discussions with respect to occurrence of all operational changes.
Providing equal opportunity
Tata Motors is proud of the fact that more than 700 women colleagues work at the shop floor across functions and locations. At Pantnagar, women operate heavy as well as high precision machines and components at the Pantnagar powertrain shop. The Prima (world truck) assembly line also has a dedicated all-women section to work on the fitting and testing of electrical components.
Rewarding union employees
Our excellent union-management relationship is built on a foundation of mutual respect and trust and the union shares the management’s objective of business growth and provides unwavering support. We have encouraged constructive and co-operative union relations through a participative culture. Senior leaders communicate and engage with non-management employees through approaches such as sunrise meetings and union meetings. To recognize their contribution to the firm, we offer a medical benefit scheme for our PCBU union employees in Pune which entitles the employees to get their medical expenses reimbursed till a period of 15 years from retirement (inclusive of voluntary retirement on medical grounds)
Vehicle and profit linked payment scheme
This year we started the vehicle and profit linked payment scheme (VPLP) scheme at PCBU Pune. This scheme is designed to pay the unionised employees a bonus based on parameters like quality and productivity, company’s performance (measured in terms of operating profit) and the individual’s performance.
FY 2008-09 FY 2009-10 FY 2010-11
FY 2008-09 FY 2009-10 FY 2010-11
Total man-hours of training(Permanent workforce)
Total man-hours of training (Contract labour)
239,188
420,528
545,860
7,252
20,053
54,083
People in motion
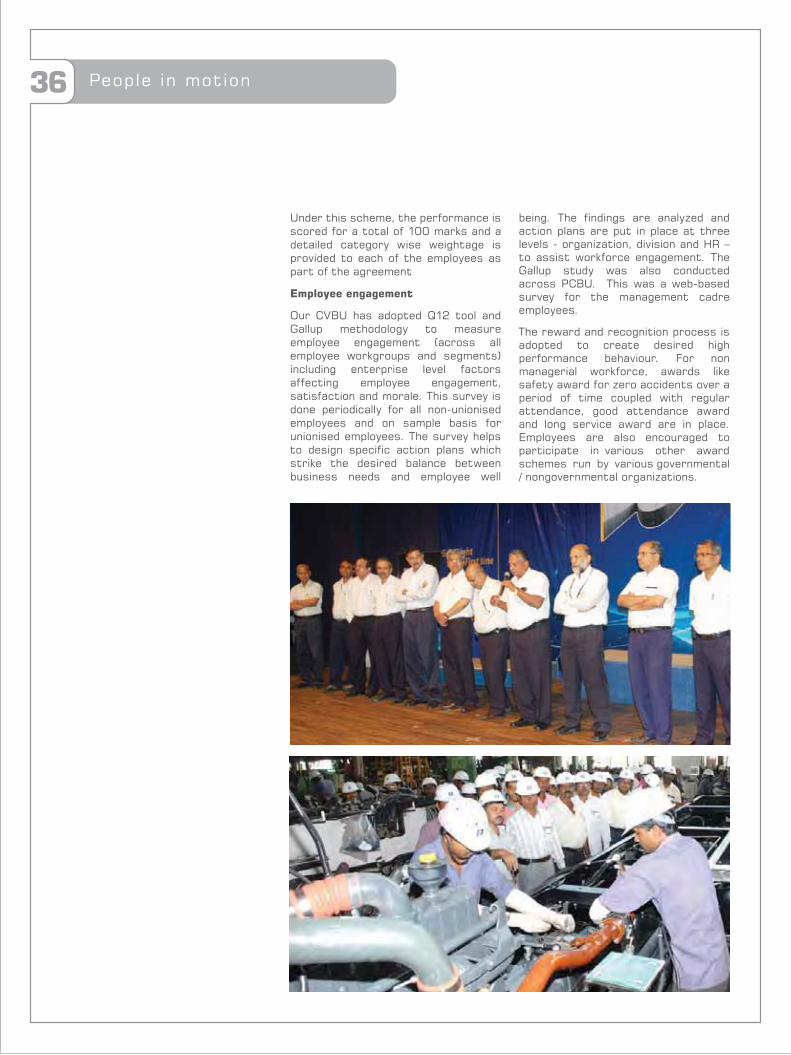
36 People in motion
Under this scheme, the performance is scored for a total of 100 marks and a detailed category wise weightage is provided to each of the employees as part of the agreement
Employee engagement
Our CVBU has adopted Q12 tool and Gallup methodology to measure employee engagement (across all employee workgroups and segments) including enterprise level factors affecting employee engagement, satisfaction and morale. This survey is done periodically for all non-unionised employees and on sample basis for unionised employees. The survey helps to design specific action plans which strike the desired balance between business needs and employee well
being. The findings are analyzed and action plans are put in place at three levels - organization, division and HR – to assist workforce engagement. The Gallup study was also conducted across PCBU. This was a web-based survey for the management cadre employees.
The reward and recognition process is adopted to create desired high performance behaviour. For non managerial workforce, awards like safety award for zero accidents over a period of time coupled with regular attendance, good attendance award and long service award are in place. Employees are also encouraged to participate in various other award schemes run by various governmental / nongovernmental organizations.

Occupational healthand safety 37

38 Occupational healthand safety
Workplace safety
Ensuring safe working conditions is of paramount importance to us. We believe that a safe workplace instils a sense of security and confidence among our workforce which enhances our productivity. We have put in place a companywide occupational health and safety policy. This policy coupled with our strong implementation and assessment measures helps us achieve our objective of minimizing workplace injuries as well as occupational diseases.
We strive to ensure that every individual working within our plant premises is protected from any inherent risks related to workplace safety. Towards this end, we recently completed a diagnostic of the existing safety systems through DuPont and are taking steps to raise the safety standards continuously. This activity would enable us to identify the gaps and assess the as-is scenario. As part of this assessment, a safety perception survey was also conducted to understand employee insights on safety.
Across our plants, we have dedicated teams of safety and health professionals working to devise safer work procedures. Safety measures have been ingrained into the standard operating procedures at each of the processes at our facilities. Work related hazards have been identified in specific areas of operations including the foundry, paint shop, welding line, etc. and their individual task related safety procedures have been devised. We have procedures in place to ensure that all the workers entering the plant premises are medically fit to carry out the job they are assigned. We have made it mandatory for all workers to
undergo a primary health check-up on joining and similar checkups at regular intervals. A host of initiatives on health and wellness were taken across the plants. At Pune a ‘Health Index’ was created and an ergonomics study was conducted to improve the workplace environment.
Safety observations and incidents receive a high priority, with the top management being directly involved in all such matters. A steering committee headed by the Managing Director addresses safety, health and environment issues on a monthly basis, in order to track performance and identify areas of improvement. Workplace safety is supported by a divisional safety council structure comprising of the divisional head, safety steward, maintenance and production representative, medical officer and safety officer from the plant safety department. Workmen participate in various proactive safety and IR committees to suggest and aid implementation of improvements at the workplace. Currently 210 of our employees are part of statutory plant level safety committees with equal representation from management and
Total safety performance of plants - permanent employees
2008-09 2009-10 2010-11
Near misses 240 1,350 1,632
Reportable injuries17 161 145 113
Lost days18 8,065 1,931 2,179
Fatalities 1 0 0
Minor injuries 1,056 814 783
Man-hours worked 87,476,234 97,479,879 115,075,960
Total safety performance of plants - contract labour
2010-11
Near misses 54
Reportable injuries 25
Lost days 6,579
Fatalities 1
Minor injuries+First aid case 630
Manhours worked 35,531,130
Note: Safety performance does not include near misses, minor injuries and first aid cases from Jamshedpur. We are currently upgrading our systems to capture this data in Jamshedpur and will report the same in future.
17Injuries that are reportable as per Factories Act, 1948 (injuries where the person injured is prevented from working for a period of forty eight hours or more immediately following the accident)18Lost day per fatality = 6000 man days, as per the Factories Act, 1948. We have restated the lost days for FY 2008-09 and FY 2009-10 by including lost days due to fatalities in line with the Factories Act.

Occupational healthand safety
non-management staff. In addition to the statutory plant level safety committees, we also have management level safety committees at each of our plants.
While the number of reportable injuries has been steadily decreasing, the number of near misses has increased due to increased awareness of safety among our employees. All reportable injuries are duly communicated and investigated. Of all the reportable injuries to our employees, three have been sustained by female associates resulting in a loss of 149 work days. Inspite of having heightened safety awareness and safe work practices in place, we are sad to report the demise of two19 personnel at our operations. We are committed to our goal of achieving zero fatalities in our operations. ZAP meetings are held across all plants and defined bay owners champion these meetings. The injury rate and lost day rate are given in the graphs below20:
Contractor safety management
To address the issue of inculcating a safety culture within our contract workforce, we have developed a centralized system for contractor safety management. The salient features of this system are:
guidelines along with work order
contractor as per requirements of the safety department (list of equipments, certifications, list of employees and their medical
records etc)
training for all contractors before commencing work inside the factory premises
protective equipment (PPE) clause in the contractors work order
prescribed format) by all contractors by second of every month.
trainings to contractor workmen
contractor work area
their safety initiatives and rewarding near miss reporting and incident free workdays
We select service providers based on techno-commercial evaluation including evaluation of their safety practices. Additionally, we have a monthly safety committee meeting with the service provider, which is also a common platform for raising any grievances. The head of the contract cell and its senior members are part of this meeting and devise a plan to execute the action points, with the measures being reviewed in following safety meeting. Going forward we intend to have bi-annual safety performance evaluation of the service providers to inculcate awareness on improved safety practices.
FY 2008-09 FY 2009-10 FY 2010-11
FY 2008-09 FY 2009-10 FY 2010-11
Injury rate
Lost day rate
0.12
Employees
0.18
0.15
0.20
0.30
0.37
45.52
18.44
3.963.79
130.06
37.03
19One temporary employee and one contract personnel20Note: Injury Rate and Lost Day Rate have been calculated considering
200,000 man hours worked, as defined by GRI. We have also included 6000 man days lost per fatality as per Factories Act, 1948 in these figures.
39
Employees
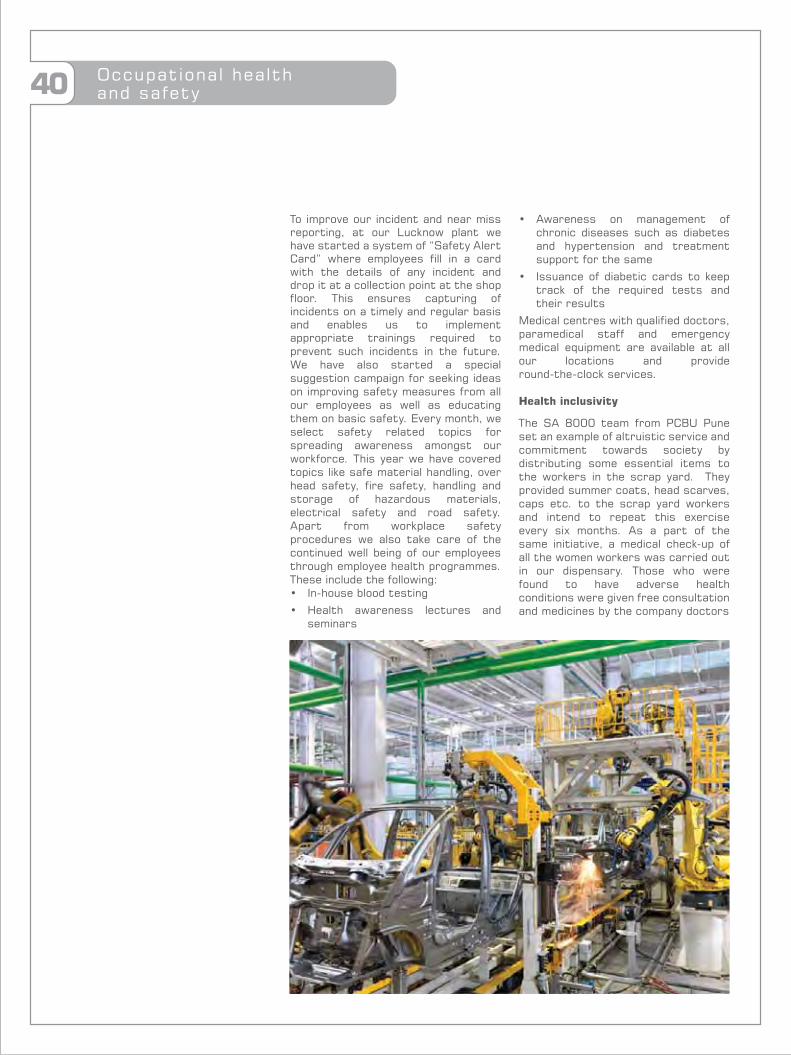
40
To improve our incident and near miss reporting, at our Lucknow plant we have started a system of “Safety Alert Card” where employees fill in a card with the details of any incident and drop it at a collection point at the shop floor. This ensures capturing of incidents on a timely and regular basis and enables us to implement appropriate trainings required to prevent such incidents in the future. We have also started a special suggestion campaign for seeking ideas on improving safety measures from all our employees as well as educating them on basic safety. Every month, we select safety related topics for spreading awareness amongst our workforce. This year we have covered topics like safe material handling, over head safety, fire safety, handling and storage of hazardous materials, electrical safety and road safety. Apart from workplace safety procedures we also take care of the continued well being of our employees through employee health programmes. These include the following:
seminars
chronic diseases such as diabetes and hypertension and treatment support for the same
track of the required tests and their results
Medical centres with qualified doctors, paramedical staff and emergency medical equipment are available at all our locations and provide
Health inclusivity
The SA 8000 team from PCBU Pune set an example of altruistic service and commitment towards society by distributing some essential items to the workers in the scrap yard. They provided summer coats, head scarves, caps etc. to the scrap yard workers and intend to repeat this exercise every six months. As a part of the
all the women workers was carried out in our dispensary. Those who were found to have adverse health conditions were given free consultation and medicines by the company doctors
Occupational healthand safety

41Communitydevelopment

42 Community development
We have gained the reputation of being a socially conscious company and continue to develop programmes for the benefit of the communities surrounding our operations. We have well designed programmes which we implement through associations with local authorities and non-profit organizations. Our CSR execution process comprises:
1. Needs identification of communities2. Prioritization of identified needs3. Selection of identified needs which
are congruent with CSR mission statements
4. Designing projects for addressing selected needs
5. Arrangement of resources and implementation of projects
6. Evaluation of the impacts at the end of project
7. Phase out after ensuring that the community has the potential to sustain
Health, education, employability and environment are four major focus areas of our social responsibility agenda. In all our social responsibility initiatives, we undertake specific need-based activities, after a thorough understanding of the local culture and requirements. The CSR teams at all locations implement these programmes with adequate support from professionals and experienced local personnel. This year we have spent ̀14.79 million on community infrastructure
initiatives across our plants.
We appreciate our employees’ voluntary involvement in numerous projects through monetary contributions and investment of their time. Targets for community service are logged in the plant, divisional and departmental balance score cards, which are then tracked on a monthly basis. To track the impacts of our activities, a group level assessment framework called the Tata CS Protocol has been developed. This protocol is based on the TBEM framework and assessment as per the protocol is conducted each year by our internal assessors. In addition to the CS protocol, in December this year, we conducted a dip stick survey at Sanand, covering eight villages where we had initiated development programmes. The survey was conducted across 160 households with the help of assessment questionnaires by our employee volunteers.
Communities comprising villages and urbanized areas in and around our plants are identified for the engagement process. The CSR team alongwith service and Government collaboration departments at Mumbai oversee national level initiatives like:
improving the quality of technical education imparted at the Industrial Training Institutes (ITIs)
governments for starting driver training institutes
improving the implementation of programmes
for training programmes for the underprivileged
Health
50 villages
villages in the next three years
respiratory problems
Education
Employability
provided to nearly 7,000 people annually
formed and sustained
Environment

43Community development
Enhancing employability
Providing vocational training to the local community is one of our major focus areas. From helping farmers practice new and improved methods of farming to training women in handicraft skills, and facilitating cooperative societies, we are actively involved in initiatives to make the community self sustainable. Apart from this we train the village youth in basic computer skills, motor mechanics, welding, electrical work, carpentry and other trades relevant to industry, which has ensured their employability.
At our Pune facility this year, we organized a 45 day training program for 108 people including 38 women. The training program was called “Train the Driver”. The prelude to this initiative was marked by Tata Motors advocating the mechanization of waste collection and transportation at Pimpri, to ease the work of waste collection and segregation. Recycling agents were trained to manoeuvre the waste collecting mobile units. They were also equipped with basic skills, training and exposure in case of minor breakdowns and complications related to their vehicles. To this effect, the training modules were designed to cover topics such as basics of driving, improvisation in case of various terrain, traffic conditions and road safety and ones role in maintaining the same. Over 90 percent of the persons trained belonged to socially marginalized sections of the society.
We have partnered with Ramakrishna Mission, an NGO working for rural upliftment, to impart Mechanic Motor Vehicle training to tribal youth. More than 170 students have been trained since the inception of the programme in 2004. While most of the passed out students have found employment at dealerships and workshops, 13 of them have opened their own garages and become entrepreneurs.
Our Lucknow plant has adopted two government ITIs under PPP initiative and assisted them in improving their infrastructure and updating their curriculum to suit industry requirements. Lucknow Plant’s
in-house training center inducted 495 candidates this year, out of which 354 belonged to scheduled categories, in line with our affirmative action policy. In an initiative to enhance employability of women, the batch also includes 25 female trainees. Nearly half of the current permanent workforce and more than two-thirds of the non-permanent workforce at the Lucknow plant comprises of SC/ST and OBC categories and persons from economically weaker sections of the society.
Further, the Samaj Vikas Kendra (SVK) organizes skill based trainings like stitching/weaving and jute craft. It promotes “chikankari”, traditionally a highly acclaimed handicraft of Lucknow, through training. It also provides a sustainable platform for sale of these products and other traditional items such as handmade candles, rakhis, paintings etc. through self help groups (SHGs).
At Sanand, 1,467 individuals were trained by ITIs out of which 672 are currently working in our plant through service providers and vendors. 174 youth have been specially trained by Tata Motors in electrical works, carpentry, bar-bending, scaffolding, plumbing and computer based skills.

44 Community development
Health
Navjagrat Manav Samaj (NJMS) a registered society supported by Tata Motors Jamshedpur is part of the community services department, which is dedicated to the cause of identifying, treating and rehabilitating leprosy afflicted persons and their families. The basic aim is to bring the leprosy afflicted families into the mainstream through medical, housing, psychological and economic support. The main services of NJMS are:
patients
destitute men and women
in seven ashrams
children
skills enhancement of youth
During the year 115,596 persons were examined and 51 new cases were brought under treatment. In the year 1989-90, the prevalence rate of
leprosy in the operational area was 21 per 1000 persons which has gone down to below 1 per 1000 persons. Weekly medical clinics are conducted in the ashrams for providing treatment for all ailments. During this year, 2,289 patients were treated for various ailments and presently there is no new
187 patients were hospitalised and treated for ulcers and various ailments. Elderly patients were identified from the ashrams and taken to the old age home run by NJMS. During the year, a cataract operation
exclusively for leprosy patients in collaboration with Jamshedpur Eye Hospital. In this camp patients from various ashrams were examined for cataract and 27 patients underwent a
to encourage leprosy affected children to go to school, regular meetings held with their parents to motivate them to educate their children, which have resulted in 215 children from the ashrams studying in various schools in Jamshedpur.
supported by Sumant Moolgaokar
made a commitment to provide safe drinking water to 100 water stressed villages in the country. Till date we have been able to cover 30 villages and have benefitted over 75,000 people. This year, we contributed ` 2.78 million to the Sumant Mulgaokar Development
drinking water to villagers across our locations of operations. In order to improve sanitary conditions in villages
blocks benefitting five villages. We also gave over 3,000 medical consultations
mobile medical van. Those found with ailments were prescribed and administered medicine. This year 34 dedicated schools and anganwadi health check-ups were also conducted
providing curative services for primary illness in remote villages and creating awareness among masses regarding cleanliness, personal hygiene and
Training Coverage ofprogramme population
Modern agriculture training 310
Mushroom production 50
Vermin composting 160
Horticulture and timber plantation 210
Sewing, Stitching and Embroidery 150
Computer training 125

45Community development
health issues. This year 198 clinics were conducted across 20 villages where close to 3,800 patients were treated and 6,800 children were immunized. Sanand also played host to the most successful blood donation camp in Tata Motors, where a total of 510 units of blood were donated.
Education
Our initiatives in education are focused around building infrastructure for schools, instituting scholarships for the marginalized sections of the student community and organizing various skill building workshops both for the teachers and the students. In order to address some of the educational issues faced by the rural poor, we started an educational initiative called Vidyadhanam.
Vidyadhanam has touched lives of over 289 scholars (spread across 50 villages) from 20 rural schools in Pune. The scholarship is a rolling scholarship from 7th Standard to 10th Standard.
As part of the scholarship, the company organizes various skill development workshops covering varied topics - theatre, adventure sports, spoken English, science and mathematics. These workshops are organised with help of volunteers and expert agencies. More than 5000 volunteering hours were invested by over 50 volunteers for the programme.
Teachers also undergo training programmes on various pedagogical methods, on adolescent psychology by skillful trainers. For example a half day workshop on science and astronomy for the teachers of the Zilla Parishad Schools from Bhima and Bhama river basin was organised at Muktangan, IUCCA on 25th November, 2010.
The positive impact of Vidyadhanam on academic performance of students as well as on the improved attendance and enrollment ratio in schools is evident
from the impact assessment study conducted in July 2010. The findings are given the table below.
At our Pantnagar plant, infrastructure development was carried out at Udiangar Primary School. The school building was renovated and classes were painted with meaningful and relevant messages reflected through the BaLA- Building as Learning Aid – paintings. The sequential painting of subjects like mathematics, science and english helped each student to read and learn just by glancing at the walls. Another development was to support poor students through Books to Read project. A library was also set up in the school to build habit of reading amongst the students.
Environment
We focus on tree plantation, wasteland development, encouraging usage of biogas plants, and rainwater harvesting initiatives. We organized a one day training session for the teachers of our partner schools at YASHDA. The training programme was called Paryavaran Mitra which has been designed by Centre for Environment and Education. Through this training programme, we intend to strengthen the eco clubs at our respective schools. We were also involved in the creation of over 200 rainwater harvesting structures in villages near Jamshedpur, in order to provide perennial irrigation water to farmers. We undertake tree plantation activities and monitoring of survival of species on a large scale across our plants and set annual targets for the same. At Lucknow, the survival of plants is monitored by the Samaj Vikas Kendra team along with Vriksh Suraksha Samity members at villages. As an added dimension, we counsel villagers about social forestry and importance of plantation for environment during our plantation visits. At Sanand, this year close to 40,000 saplings were planted across 112 villages.
SEVA: Volunteers Story
Kailash Jagtap, Heavy Dyes, Production Engineering
Kailash Jagtap is a volunteer who has been associated with the Vidyadhanam Initiative since its inception. He mentors students from the Zilla Parishad School at Dhamangaon in the Bhimashankar tribal belt. Being an avid trekker, Kailash has been proactively organizing lots of skill building workshops for the students. He has organized programmes like adventure sports (which include rock climbing, river crossing, photography and many others). He has been instrumental in organizing various skill building workshops. “We will do whatever it takes to uplift these children and provide them with a holistic schooling experience” he adds.
Indicator June 2008 June 2010
Pass percentage 60% Above 95%
Attendance 67% Above 95%
Enrollment ratio 70% 110%
Sex ratio (boy –girl) 60:40 (approx) 45:55 (approx)

46 Disclosure onManagement Approach
Economic Indicators
Our economic performance has been steadily improving and we have consolidated our position as the market leader in commercial vehicles in India, and are among the top three in passenger vehicles in the country. We are also the fourth largest truck and bus manufacturer in the world. The company features in the fortune top 500 companies worldwide, and intend to grow further. Our economic policies are formulated based on a number of factors, including market conditions, consumer preferences, our past performance, government regulations and our governance practices, amongst others. We have imbibed a cost reduction culture, where each employee contributes to cost reduction through suggestions. We have adopted a culture of mutual value creation with our customers and suppliers through unique approaches such as our reconditioning business and establishment of vendor parks. We continue to strengthen our corporate citizenship agenda by sharing the wealth we generate with the community and returning a significant proportion back to the society.
Environmental Indicators
Keeping an eye on our growth plans, we have enhanced our spend on technology to address environmental concerns. The Tata Business Excellence Model for our commercial and passenger vehicles businesses outlines our commitment to preserve the environment as do our environment policy and climate change policy. We have also developed a green building policy and an environmental procurement policy to focus our synergies to develop an efficient supply chain. A steering committee headed by the Managing Director addresses safety, health and environment issues on a monthly basis, in order to track performance and identify areas of improvement. Our manufacturing divisions are certified for ISO 14001:2004 - environmental management system. We have laid emphasis on conservation initiatives, especially energy, waste management and water conservation. Through our ERC, we have also taken efforts to use materials that are environmentally benign, in our process and products. We are compliant with all the laws of countries to which we export our vehicles.
Labour Practices Indicators
With the growth in the automotive industry and & technological upgradations, there is an increased requirement of highly skilled and qualified persons. We believe people are our biggest assets and have set forth a plan for attracting and retaining talent. We encourage a holistic approach to learning and development through our well established in house training facilities and approaches. Workplace safety is an area of high focus for us and we have issued an organisation-wide health and safety policy. All our manufacturing divisions are certified for OHSAS 18001:2007 - safety and occupational health management systems. We strive to ensure that every individual working within our plant premises is protected from any inherent risks related to workplace safety. Towards this end, we recently completed a diagnostic of the existing safety systems through DuPont and are taking steps to raise the safety standards continuously. To address the issue of inculcating a safety culture within our contract workforce, we have developed a centralized system for contractor safety management. Our non-management workforce has the right to exercise freedom of association and collective bargaining. Safety observations and incidents receive a high priority, with the top management being directly involved in all such matters. A steering committee headed by the Managing Director addresses safety, health and environment issues on a monthly basis, in order to track performance and identify areas of improvement.

47
Human Rights Indicators
The Tata Code of Conduct emphasises the importance of workplace ethics and every employee is expected to adhere to the Code. We have a whistle blower policy in place to detect and remedy any non compliance to the TCoC or any laws or regulations. Our formal grievance redressal mechanisms ensure transparent disclosure and resolution of employee concerns. We believe that ensuring adequate workplace conditions, practices, and policies to protect our employees makes good business sense and have developed a strict policy against bribery and corruption. All our employees undergo a one hour refresher course on TCoC on an annual basis which covers aspects of ethics, human rights and corruption. We respect human rights at the workplace as defined by the International Labour Organisation and our plants at Jamshedpur, Lucknow and Pune are also certified to SA8000 social accountability standard, under the purview of which they are subject to regular human rights reviews and impact assessments. We do not employ any children or forced labour and all our partners, subsidiaries, dealers, etc. are expected to follow our Human Rights Policy.
Society Indicators
Our social responsibility programmes are in sync with the goals and vision of the organization. Our well defined CSR execution process demonstrates our approach towards the needs of communities. The areas that we focus on are enhancing employability, conserving the environment, promoting healthcare and imparting education. We undertake impact assessment studies to understand the effectiveness of our initiatives and have regular reviews as per the Tata CS Protocol. As a responsible automobile manufacturer we have entered into a partnership with the Government of Punjab to facilitate the promotion of safe driving and road safety. The TCoC has outlined mechanisms to ensure that corruption of all forms is prohibited and dealt with strictly, including termination of a defaulting employee. The TCoC21 has also detailed policies on anti competitive behaviour and regulatory compliance. The Executive Committee of the Board formed a Corporate Social Responsibility (CSR) Committee in January 2006, comprising the Managing Director and the Senior Management which meets from time to time to oversee the social activities of the organisation.
Product Responsibility Indicators
Backed by our strong research and development capabilities, we have always strived to develop products which are safe and best in class products. We have invested heavily in developing facilities like a crash test facility and a hemi anechoic chamber, amongst others. We have continuously focused on adopting new technologies and making innovative use of constrained resources to differentiate our products. Over four million of our vehicles are on the road, and they are a testimony of the quality of our products and of the experience we offer. Tata Motors has built a pan India network through its channel partners to deliver a superior buying experience to the consumer. We follow the terms of the TCoC to ensure that we meet all regulatory compliance requirements. We are guided by the Bureau of Indian Standards regarding product labelling and by the Advertising Standards Council of India for our marketing communications.
Disclosure onManagement Approach
21 http://www.tata.com/aboutus/articles/inside.aspx ?artid=NyGNnLHkaAc

48 Independent assurance statement
Introduction
Det Norske Veritas AS (‘DNV’) has been commissioned by the management of Tata Motors Limited (‘TML’ or ‘the Company’) to carry out an assurance engagement on the Company’s Sustainable Development Report 2011 (‘the Report’) in its printed format. This engagement focused on qualitative and quantitative information provided in the Report, and underlying management and reporting processes. The engagement was carried out against DNV Protocol for Verification of Sustainability Reporting (VeriSustain)1 including verification of application level and adherence to principles of the Global Reporting Initiative Sustainability Reporting Guidelines 2011 (GRI G3.1).
This assurance statement is aimed at the readers of the Report. TML is responsible for the collection, analysis, aggregation and presentation of information within the Report. DNV’s responsibility in performing this work is to the management of TML only and in accordance with terms of reference agreed with the Company. The assurance engagement is based on the assumption that the data and information provided to us is complete, sufficient and authentic. DNV disclaims any liability or responsibility to a third party for decisions, whether investment or otherwise, based on this assurance statement.
Scope of Assurance
The scope of DNV’s assurance engagement, as agreed upon with TML included the verification of the content, focus and quality of the information on environment and social performance presented in the Report, covering the period April 2010 to
March 2011. The assurance engagement included:
practices and performance described in the Report as well as references made in the Report to the annual report;
requirements of VeriSustain with a moderate level of assurance;
principles set out in the Global Reporting Initiative Sustainability Reporting Guidelines 2011 (GRI G3.1) and confirmation of the TML’s declared Application Level;
processes and tools for collecting, aggregating and reporting qualitative data inside the Report.
information and performance data as set forth in GRI G3.1 and presented in the Report;
Verification Methodology
This engagement was carried out during July and August 2011 by a multidisciplinary team of qualified and experienced DNV sustainability report assurance professionals. The Report has been evaluated against the principles of Materiality, Stakeholder Inclusiveness, Completeness, Responsiveness, Reliability and Neutrality, as set out in VeriSustain, and the GRI G3.1.
As part of our verification we visited the following operations in addition to the TML office at Mumbai, India:
During the assurance engagement,
DNV has taken a risk-based approach, meaning that we concentrated our verification efforts more on the issues of high material relevance to TML’s business and stakeholders. As part of the engagement we have challenged the sustainability-related statements and assertions made in the Report and assessed the robustness of the underlying data management system, information flow and controls. For example, we have:
data and other information made available to DNV by TML;
interviews with more than 75 senior TML representatives, including data owners and decision-makers from different functions and locations of the Company;
the processes for generating, gathering and managing the quantitative and qualitative data included in the Report;
processes for completeness and reliability. This including assessments of methods, practices, tools and competence used in collection, aggregation and reporting of data as it is transferred and managed at different levels of the organisation.
Conclusions
In DNV’s opinion, based on the work carried out, the Report is a fair representation of the Company’s sustainability-related strategies, management systems and performance. The Report, along with the referenced information in the annual report, meets the general
1 w w w . d n v . c o m / s e r v i c e s / a s s e s s m e n t / c o r p o r a t e _ r e s p o n s i b i l i t y / s e r v i c e s _ s o l u t i o n s / s u s t a i n a b i l i t y r e p o r t i n g / o r d e r /

49Independent assurance statement
content and quality requirements of the GRI G3.1, and DNV confirms that the GRI requirements for Application Level ‘A+’ have been met. We have evaluated the Report’s adherence to the following principles on a scale of ‘Good’, ‘Acceptable’ and ‘Needs Improvement’:
Materiality: Acceptable. The methodology of materiality determination used for the Report uses the perspectives of senior representatives from various functions of the company. The outcome has not missed out any significant, known material issues, but the process should be strengthened by more specific framework to bring out material issues that reflect short, medium and long term impacts. In addition, input from external stakeholders should be included in the materiality assessment process.
Stakeholder Inclusiveness: Acceptable. The Company demonstrates engagement with all important stakeholders through various channels. The engagement process can be further strengthened by formally documenting and reviewing the needs and expectations expressed by stakeholders through different engagement channels.
Responsiveness: Acceptable. The Company has responded to stakeholder concerns through its policies and management systems, and this is reflected in the Report. However, In light of the expectations of external stakeholders and Report readers, TML should consider to disclose the goals and targets on material aspects in subsequent reports.
Completeness: Acceptable. The Report limits its boundary to Indian
operations and the reason for this limitation is specified in the Report. The Report provides partial disclosures in response to certain GRI G3.1 disclosure requirements; these are denoted in the GRI index. It is evident that TML acknowledges the need for continuous improvement and is committed to expanding the reporting scope and boundary.
Reliability: Acceptable. Although no systematic or material errors have been detected, DNV has identified some manual discrepancies in data which have subsequently been corrected. More focus to develop clearer data protocols would help improve data consistency and accuracy.
Neutrality: Good. The information contained in the Report is presented in a neutral tone.
Opportunities for Improvement
The following is an excerpt from the observations and opportunities reported back to the management of TML. However, these do not affect our conclusions on the Report, and they are indeed generally consistent with the management objectives already in place.
internal review and auditing of internal data management system will help further improve the reporting process by increasing the reliability of reported data.
that involve the manual collation and adjustment of data. Automation would help reduce the risk of errors.
sustainability in the value chain.
DNV’s Independence
DNV states its independence and impartiality with regards to this engagement. DNV confirms that throughout the reporting period there were no services provided which could impair our independence and objectivity. DNV also maintained complete impartiality towards people interviewed during the assignment.
19 August 2011, Bangalore, India
For Det Norske Veritas AS,
Santhosh Jayaram
Lead VerifierHead, Sustainability and Business Excellence (South Asia)Det Norske Veritas AS, India
Antonio Astone
ReviewerGlobal Manager, Corporate Responsibility ServicesDet Norske Veritas AS, Italy

50 GRI content index
Contents Page GRI/UNGC Reference Remarks/Additional InformationAbout this report 1 2.1, 3.1, 3.6,
3.7, 3.8
MD’s message 2-3 1.1
1.2 – Key impacts, risks and opportunities have been detailed in relevant sections
3.2 – Our previous report was published for the year 2009-10. It can be accessed at http://www.tatamotors.com/sustainability/sustainability.php
3.3 – Reporting cycle is annual
3.7 - Specific limitations (if any) pertaining the performance indicators reported have been detailed in the individual sections
3.8 – We have reported on the sustainability performance of the manufacturing operations where we have 100 percent control over their systems and processes
3.9 - Relevant explanations have been provided in the individual section where necessary
3.10 – Specific values for the year 2009-10 have been changed from the previous report. This is because we have excluded production figures for the Tata Manza from this year onwards because it is manufactured at our JV facility in Ranjangaon, which is out of the report scope. Other re-statements of information, if any, have been reported in the relevant sections
3.11 – The Sanand plant has been included in the scope of reporting this year, because it started operations in 2010-11
About Tata Motors 4-5 2.2, 2.3,
2.7, 2.10
2.5 - Please refer our Annual Report 2010-11 for additional information. It can be accessed through our corporate website at: http://www.tatamotors.com /investors/annualreports-pdf/annual-report-2010-11.pdf
2.6 - Please refer our Annual Report 2010-11 for additional information. It can be accessed through our corporate website at: http://www.tatamotors.com /investors/annualreports-pdf/annual-report-2010-11.pdf (page 53)
2.7 - Our significant markets of exports include Africa (21 countries), Europe (4 countries), Latin America (1 country), Middle East (9 countries), SAARC region (6 countries) and ASEAN region (4 countries). Please refer our Annual Report 2010-11 for additional information. It can be accessed through our corporate website at: http://www.tatamotors.com/investors/annualreports-pdf /annual-report-2010-11.pdf (page 23). Additional information can also be obtained at: http://www.tatamotors.com/know-us/company-profile.php
2.8 - Aspects of scale are addressed in relevant sections of the report. Please refer our Annual Report 2010-11 for additional information. It can be accessed through our corporate website at: http://www.tatamotors.com/investors/ annualreports-pdf/annual-report-2010-11.pdf. (page 30, 53, 62) Details of employees are mentioned in the Workforce Development section.
2.9 - Please refer our Annual Report 2010-11 for additional information. It can be accessed through our corporate website at: http://www.tatamotors.com/ investors/annualreports-pdf/annual-report-2010-11.pdf (page 17-18, page 53)
SO7 – There have been no legal actions against us for anti-competitive behaviour, anti-trust, and monopoly practices
SO8 - There were no fines imposed on us for any non compliance with laws and regulations in the reporting period
We also have a Climate Change policy and Environment Policy. Details of the same are mentioned in our previous report:
http://www.tatamotors.com/sustainability/sustainability.php
Vision and Mission 6 4.8
Defining priorities 7-12 3.5, 3.5, 4.14, 4.15, 4.16, 4.17
4.15 - We have a wide variety of stakeholders with varying needs. We engage with each of the stakeholders to address different issues and concerns as delineated in this section
13-16 4.1 – Please refer our Annual Report 2010-11 for additional information. It can be accessed through our corporate website at:
http://www.tatamotors.com/investors/annualreports-pdf/annual-report-2010-11.pdf (page 42)
4.4 - Please refer our Annual Report 2010-11 for additional information. It can be accessed through our corporate website at:
http://www.tatamotors.com/investors/annualreports-pdf/annual-report-2010-11.pdf (page 41-48)
4.5 - Please refer our Annual Report 2010-11 for additional information. It can be accessed through our corporate website at:
http://www.tatamotors.com/investors/annualreports-pdf/annual-report-2010-11.pdf (page 45)
4.6 - Please refer our Annual Report 2010-11 for additional information. It can be accessed through our corporate website at:
http://www.tatamotors.com/investors/annualreports-pdf/annual-report-2010-11.pdf (page 43-44)
4.7 - Please refer our Annual Report 2010-11 for additional information. It can be accessed through our corporate website at:
http://www.tatamotors.com/investors/annualreports-pdf/annual-report-2010-11.pdf (page 45-46). Further information is available at:
http://www.tatamotors.com/know-us/bod.php
4.11 – Precautionary principles are implicit
The pivot point 4.1, 4.2, 4.3, 4.4, 4.6, 4.7, 4.9, 4.10, 4.13,
HR3, HR4, HR11, SO3, SO5
UNGC:Principle 1Principle 2Principle 3Principle 4Principle 5Principle 6Principle 10

51GRI content index
LA13 - Details are available at: http://www.tatamotors.com/know-us/bod.php . Please refer our Annual Report 2010-11 for additional information. It can be accessed through our corporate website at:
http://www.tatamotors.com/investors/annualreports-pdf/annual-report-2010-11.pdf (page 43-48)
SO4 – Actions are taken in response to corruption as per the Tata Code of Conduct. There have been no incidents of corruption this year.
SO6 - We have not made any financial contribution to any political party or politician
EC3 - Please refer our Annual Report 2010-11 for additional information. It can be accessed through our corporate website at: http://www.tatamotors.com/investors /annualreports-pdf/annual-report-2010-11.pdf (page 85, 96, 131)
EC4 – We have not received any significant financial assistance from the government
EC5 – We abide by all national regulations of wage payments and pay equal to or above minimum wage requirements at all our plants. The entry level wage for males and females is equal
HR1 – All our investment agreements and contracts mandate adherence to the TCoC, which includes human rights clauses
HR2 – All our business partners sign and abide by the TCoC which mandates that they adhere to all laws related to human rights
EC1, EC6,HR5,HR6,HR7,HR10
17-20Economic performance
EN9 – No water sources are significantly affected by our withdrawals
EN11 – None of our operations are located close protected or reserved areas
EN12, EN13, EN15 – Not Applicable
EN14 – While we do not have a specific policy for biodiversity, we do undertake initiatives to promote the same at all our locations of operations. Details of these initiatives have been detailed in our previous report accessible at: http://www.tatamotors.com/sustainability/pdf/GRI-09-10.pdf (page numbers 36 and 37)
EN17 - We are enhancing our capacities to monitor other relevant GHG emissions. Other scope 3 GHG emissions are not reported for 2010-11
EN23 – There were no significant spills (spills greater than 159 litres-one barrel in a single occurrence of an incident) as a result of our operations in the reporting period
EN24 – We do not import or export any waste deemed hazardous under the terms of the Basel Convention Annex I, II, III, and VIII
EN25 – No water body or habitat is significantly affected by our water discharge or runoff
EN27 (partial) – We do not use any packaging materials for any of our vehicles
EN28 – We have not had any fines or sanctions imposed on us for non compliance with environmental laws
EN29 – The most significant environmental impact of transporting products and materials, and members of the workforce is the associated air emissions. We are enhancing our capacities to capture this data and will report on the same in the next reporting period.
EC2, EN1, EN2, EN3, EN4, EN5, EN7, EN8, EN10, EN16, EN18, EN19, EN20, EN21, EN22, EN30
UNGC:Principle 7Principle 8Principle 9
21-28Environmental stewardship
PR1 (partial) – A study has been done based on ELV rules for all vehicles to be exported to European markets. For more information, please refer to: http://www.tatamotors.com/sustainability/ELV/resource- sustainability.php
PR2 – There have been no incidents of non-compliance with regulations and voluntary codes concerning health and safety impacts of products during their life cycle
PR3 – Information about our products has to be disclosed as per Bureau of Indian Standards. The vehicle stickers and manuals are in compliance with all the standards that govern us, based on the laws of the land where we sell our vehicles. We are in compliance with all standards that govern us.
PR4 - There have been no incidents of non-compliance with regulations and voluntary codes concerning product and service information and labelling.
PR6 – We adhere to all laws related to marketing, communications and advertising. In India, we abide by the standards defined by Advertising Standards Council of India. The TCoC governs our advertising and marketing communications, and ensures our compliance to all related laws.
PR7 - There have been no incidents of non-compliance with regulations and voluntary codes concerning marketing communications, including advertising, promotion, and sponsorship
PR8 – Not Applicable
PR9 – There have been no fines imposed on us for non compliance with laws regarding use of our products
EN6, EN26,29-32Product safety and Innovation
LA2 - 135 of our new employee hires in 2010-11 left the organisation in the reporting periodLA3 - Please refer our Annual Report 2010-11 for additional information. It can be accessed through our corporate website at:http://www.tatamotors.com/investors/annualreports-pdf/annual-report-2010-11.pdf (page 85, 96, 131)LA4 – 55.39 percent of our permanent employees are covered by collective bargaining agreementsLA5 – We abide by the Industrial Disputes Act, 1947 regarding notice period to be given before any operational changeLA10 – Currently, we do not capture training man-hours according to employee cadre. We aim to do so in the next reporting period
EC7, LA1, LA2, LA10, LA11, LA12, SO2, HR8
UNGC:Principle 1Principle 2Principle 3 Principle 4Principle 5 Principle 6
33-36People in motion
Contents Page GRI/UNGC Reference Remarks/Additional Information

52 GRI content index
4.12 – We subscribe to the United Nations Global Compact and Millennium Development Goals
SO1 - All our operations have implemented local community engagements and development programmes
SO9 – During our community engagement programmes and assessments, we have not come across any significant negative impacts on the community due to our presence in the area
SO10 – Not Applicable
Community development 41-45 EC8
Disclosure on Management Approach
46-47 DMA – ECDMA – ENDMA – SODMA - HRDMA – PR
Assurance Statement 48-49
50-52
3.12
GRI Content index 3.13
Back Cover 2.4, 3.4
LA14 – Everything else being equal, the ratio of basic salary of men to women is 1:1
LA15 (partial) – 65 of our women employees availed of maternity leave this year, out of which 34 are permanent employees
HR9 – All our manufacturing locations except Jamshedpur are in designated industrial areas. At Jamshedpur, there have been no cases of violation of rights of indigenous people.
EC7, LA1, LA2, LA10, LA11, LA12, SO2,
HR8
33-36People in motion
LA9 – Our formal agreements with trade unions cover health and safety aspects LA6, LA7, LA837-40Occupational healthand safety
Contents Page GRI/UNGC Reference Remarks/Additional Information

Glossary
AIAM - Association of Indian Automobile Manufacturers
ARAI - Automotive Research Association of India
ASSOCHAM - The Associated Chambers of Commerce and Industry of India
BS - Bharat Stage
BSC - Balanced Scorecard
CEO - Chief Executive Officer
CER - Certified Emission Reduction
CFC - Chlorofluorocarbon
CFT - Cross Functional Team
CII - Confederation of Indian Industry
CNG - Compressed Natural Gas
CRM - Customer Relationship Management
CSI - Customer Satisfaction Index
CVBU - Commercial Vehicles Business Unit
DMS - Dealer Management System
EBITDA - Earnings Before Interest, Taxes, Depreciation and Amortization
EPM - Enterprise Process Model
ERC - Engineering Research Centre
ERM - Enterprise Risk Management
ERP - Enterprise Resource Planning
ESP - Electro Static Precipitator
ETP - Effluent Treatment Plant
EV - Electrical Vehicle
FIBRES - Fact & Information Base Reverse Engineering Of Strategies
FO - Furnace Oil
FY - Financial Year
GDP - Gross Domestic Product
GHG - Green House Gases
GJ - Giga Joules
Gm - Gram
HSD - High Speed Diesel
ICR - Integrated Cost Reduction
IGBC - Indian Green Building Council
INSSAN - Indian National Suggestion Schemes'' Association
ITI - Industrial Training Institute
JLR - Jaguar Land Rover
KL - Kilo Litre
LDO - Light Diesel Oil
LPG - Liquefied Petroleum Gas
MHCV - Medium and Heavy Commercial Vehicle
MoU - Memorandum of Understanding
MPV - Multi Purpose Vehicle
MT - Metric Tonne
MW - Mega Watt
NEAC - National Environment Awareness Campaign
NGO - Non Governmental Organization
NJMS - Navjagrat Manav Samaj
NPI - New Product Introduction
ODS - Ozone Depleting Substance
OHSAS - Occupational Health and Safety Assessment Series
PCBU - Passenger Car Business Unit
PCMC - Pimpri Chinchwad Municipal Corporation
PP - Polypropylene
PPP - Public Private Partnership
PVC - Poly Vinyl Chloride
QFD - Quality Function Deployment
RAC - Royal Automobile Club
RBI - Reserve Bank of India
RRA - Regional Resource Agencies
SAP - Systems, Applications and Products
SIAM - Society of Indian Automobile Manufacturers
SLS - Selective Laser Sintering
SPCB - State Pollution Control Board
SQI - Supplier Quality Initiative
SRM - Supplier Relationship Management
TBEM - Tata Business Excellence Model
TCOC - Tata Code of Conduct
TML - Tata Motors Limited
TPT - Transition Point Training
TVD - Torsional Vibration Damper
UNFCCC - United Nations Framework Convention for Climate Change
US - United States
VFD - Variable Frequency Drive
VOC - Volatile Organic Compounds
VPLP - Vehicle and Profit Linked Payment
VRMG - Voluntary Retirement on Medical Grounds
WPI - Wholesale Price Index
ZAP - Zero Accident Plan
53

At Tata Motors, we value our stakeholders, and their views are of prime importance to us. Please send in your valuable feedback to: Mr. G S UppalHead – Corporate Sustainability, IR and AdminEmail: [email protected]: 91 22 6665 7224
Our Registered Office:Bombay House, 24, Homi Mody Street, Mumbai 400 001, India.