Embed Size (px)
Citation preview
2016
Sustainability Fact Bookand GRI index
2016 in briefImportant events
SEB has established a green bond framework and a dedicated green loan portfolio of SEK 11.8 bn.
New evaluation approach to environmental, social and governance related factors in equity research – the SAFE model.
As the only Nordic bank, SEB was included in the Dow Jones Sustainability Index.
86 per cent of our employ-ees believe that SEB’s work to integrate sustainability is important for our business and the long-term profita-bility of the bank.
New shareholders are automatically offered a subscription of the Annual Report or the Annual Review. Order printed copies of the Sustainability Report at www.sebgroup.com/sustainabilityOrder printed copies of the Annual Report and the Annual Review at www.sebgroup.com/ir
ANNUAL REPORT Information on SEB’s business, strategy, risk management and corporate governance.Detailed information on SEB’s financial position and results.
ANNUAL REVIEW An abbreviated version of the Annual Report.
SUSTAINABILITY REPORT Annual report on SEB’s performance and future ambitions within Responsible Business, People and Community as well as Environment.
SUSTAINABILITY FACT BOOK AND GRI INDEX The Global Reporting Initiative (GRI) Index and key non-financial data for the same areas as in the Sustainability Report.
CAPITAL ADEQUACY AND RISK MANAGEMENT REPORT (PILLAR 3) Disclosure on capital adequacy and risk management in accor- dance with regulatory requirements.
INTERIM REPORTS AND FACT BOOKSQuarterly reports on SEB’s financial performance. Detailed information on SEB’s financial position and results in fact books.
Financial information and publications =
SEB Fact Book Annual Accounts 2016 N
Fact Book Annual Accounts 2016STOCKHOLM 1 FEBRUARY 2017
SEB Annual Accounts 2016 1
Annual Accounts 2016
STOCKHOLM 1 FEBRUARY 2017
“We have supported our customers all through a year marked by uncertainty. Business sentiment and customer activity grew more positive in the fourth quarter. One year into our business plan, SEB has a robust financial position, a growing customer base and a clear strategy set on delivering world-class service.”
Annika Falkengren
ContentsKey performance indicators
Economic indicators 1
Environmental indicators 2–3
Responsible business indicators 4–6
People indicators 7–13
GRI Index 14–21
Standard disclosures 14
Specific standard disclosures 15–17
Material aspects and boundaries 18–21
SEB Sustainability Fact Book 2016
Short facts Key performance indicators
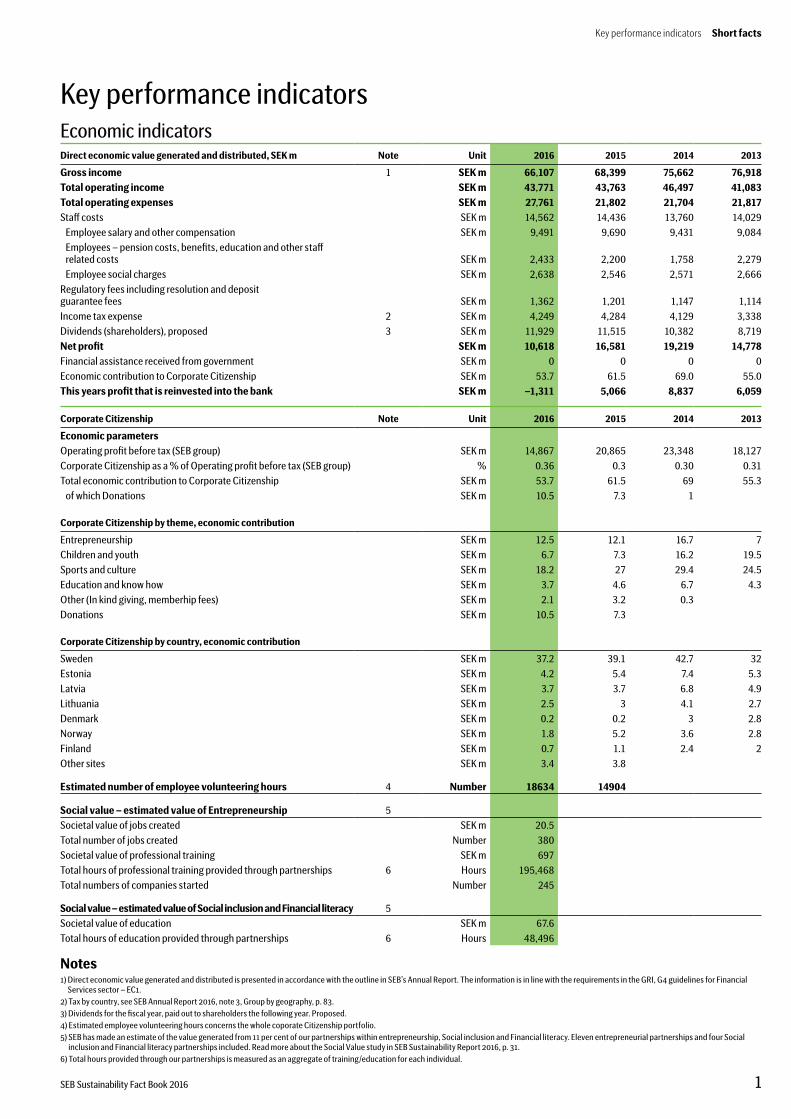
Key performance indicatorsEconomic indicatorsDirect economic value generated and distributed, SEK m Note Unit 2016 2015 2014 2013
Gross income 1 SEK m 66,107 68,399 75,662 76,918Total operating income SEK m 43,771 43,763 46,497 41,083Total operating expenses SEK m 27,761 21,802 21,704 21,817Staff costs SEK m 14,562 14,436 13,760 14,029 Employee salary and other compensation SEK m 9,491 9,690 9,431 9,084 Employees – pension costs, benefits, education and other staff
related costs SEK m 2,433 2,200 1,758 2,279 Employee social charges SEK m 2,638 2,546 2,571 2,666Regulatory fees including resolution and deposit guarantee fees SEK m 1,362 1,201 1,147 1,114Income tax expense 2 SEK m 4,249 4,284 4,129 3,338Dividends (shareholders), proposed 3 SEK m 11,929 11,515 10,382 8,719Net profit SEK m 10,618 16,581 19,219 14,778Financial assistance received from government SEK m 0 0 0 0Economic contribution to Corporate Citizenship SEK m 53.7 61.5 69.0 55.0This years profit that is reinvested into the bank SEK m –1,311 5,066 8,837 6,059
Corporate Citizenship Note Unit 2016 2015 2014 2013
Economic parametersOperating profit before tax (SEB group) SEK m 14,867 20,865 23,348 18,127Corporate Citizenship as a % of Operating profit before tax (SEB group) % 0.36 0.3 0.30 0.31Total economic contribution to Corporate Citizenship SEK m 53.7 61.5 69 55.3 of which Donations SEK m 10.5 7.3 1
Corporate Citizenship by theme, economic contribution
Entrepreneurship SEK m 12.5 12.1 16.7 7Children and youth SEK m 6.7 7.3 16.2 19.5Sports and culture SEK m 18.2 27 29.4 24.5Education and know how SEK m 3.7 4.6 6.7 4.3Other (In kind giving, memberhip fees) SEK m 2.1 3.2 0.3Donations SEK m 10.5 7.3
Corporate Citizenship by country, economic contribution
Sweden SEK m 37.2 39.1 42.7 32Estonia SEK m 4.2 5.4 7.4 5.3Latvia SEK m 3.7 3.7 6.8 4.9Lithuania SEK m 2.5 3 4.1 2.7Denmark SEK m 0.2 0.2 3 2.8Norway SEK m 1.8 5.2 3.6 2.8Finland SEK m 0.7 1.1 2.4 2Other sites SEK m 3.4 3.8
Estimated number of employee volunteering hours 4 Number 18634 14904
Social value – estimated value of Entrepreneurship 5Societal value of jobs created SEK m 20.5Total number of jobs created Number 380Societal value of professional training SEK m 697Total hours of professional training provided through partnerships 6 Hours 195,468Total numbers of companies started Number 245
Social value – estimated value of Social inclusion and Financial literacy 5Societal value of education SEK m 67.6Total hours of education provided through partnerships 6 Hours 48,496
Notes1) Direct economic value generated and distributed is presented in accordance with the outline in SEB’s Annual Report. The information is in line with the requirements in the GRI, G4 guidelines for Financial
Services sector – EC1.2) Tax by country, see SEB Annual Report 2016, note 3, Group by geography, p. 83.3) Dividends for the fiscal year, paid out to shareholders the following year. Proposed. 4) Estimated employee volunteering hours concerns the whole coporate Citizenship portfolio.5) SEB has made an estimate of the value generated from 11 per cent of our partnerships within entrepreneurship, Social inclusion and Financial literacy. Eleven entrepreneurial partnerships and four Social
inclusion and Financial literacy partnerships included. Read more about the Social Value study in SEB Sustainability Report 2016, p. 31. 6) Total hours provided through our partnerships is measured as an aggregate of training/education for each individual.
Key performance indicators Short facts
1SEB Sustainability Fact Book 2016
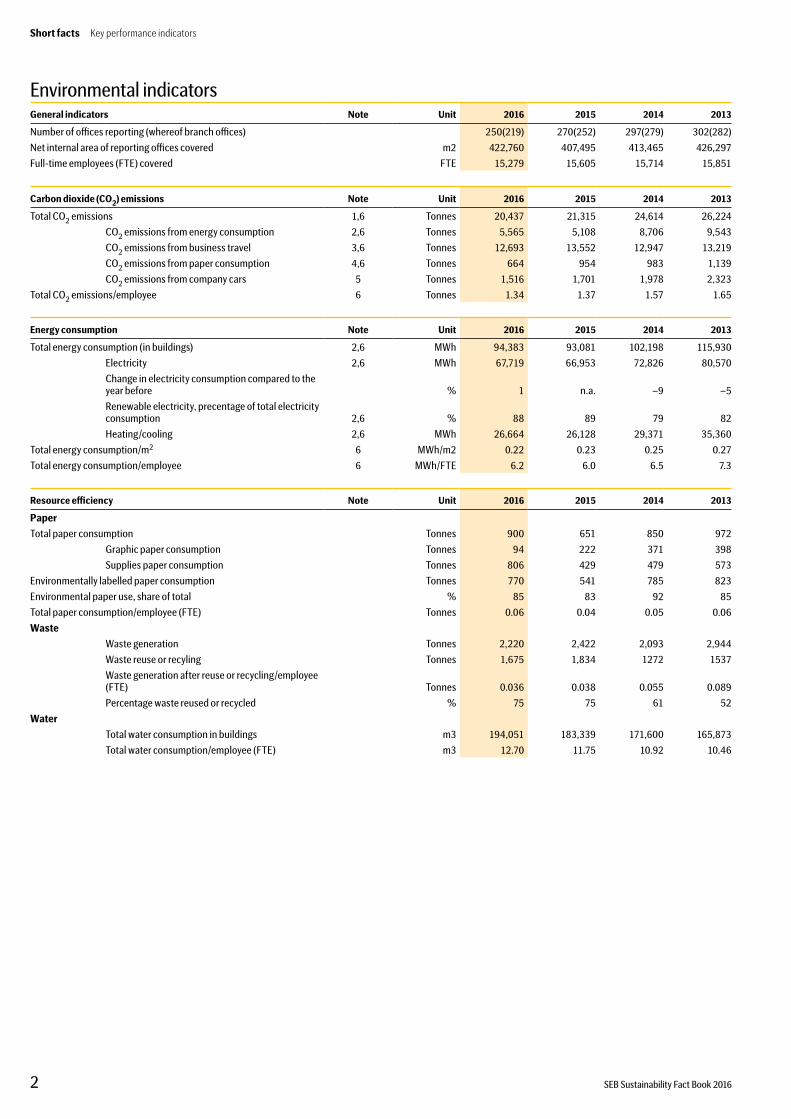
Environmental indicatorsGeneral indicators Note Unit 2016 2015 2014 2013
Number of offices reporting (whereof branch offices) 250(219) 270(252) 297(279) 302(282)
Net internal area of reporting offices covered m2 422,760 407,495 413,465 426,297
Full-time employees (FTE) covered FTE 15,279 15,605 15,714 15,851
Carbon dioxide (CO2) emissions Note Unit 2016 2015 2014 2013
Total CO2 emissions 1,6 Tonnes 20,437 21,315 24,614 26,224
CO2 emissions from energy consumption 2,6 Tonnes 5,565 5,108 8,706 9,543
CO2 emissions from business travel 3,6 Tonnes 12,693 13,552 12,947 13,219
CO2 emissions from paper consumption 4,6 Tonnes 664 954 983 1,139
CO2 emissions from company cars 5 Tonnes 1,516 1,701 1,978 2,323
Total CO2 emissions/employee 6 Tonnes 1.34 1.37 1.57 1.65
Energy consumption Note Unit 2016 2015 2014 2013
Total energy consumption (in buildings) 2,6 MWh 94,383 93,081 102,198 115,930
Electricity 2,6 MWh 67,719 66,953 72,826 80,570
Change in electricity consumption compared to the year before % 1 n.a. –9 –5
Renewable electricity, precentage of total electricity consumption 2,6 % 88 89 79 82
Heating/cooling 2,6 MWh 26,664 26,128 29,371 35,360
Total energy consumption/m2 6 MWh/m2 0.22 0.23 0.25 0.27
Total energy consumption/employee 6 MWh/FTE 6.2 6.0 6.5 7.3
Resource efficiency Note Unit 2016 2015 2014 2013
Paper
Total paper consumption Tonnes 900 651 850 972
Graphic paper consumption Tonnes 94 222 371 398
Supplies paper consumption Tonnes 806 429 479 573
Environmentally labelled paper consumption Tonnes 770 541 785 823
Environmental paper use, share of total % 85 83 92 85
Total paper consumption/employee (FTE) Tonnes 0.06 0.04 0.05 0.06
Waste
Waste generation Tonnes 2,220 2,422 2,093 2,944
Waste reuse or recyling Tonnes 1,675 1,834 1272 1537
Waste generation after reuse or recycling/employee (FTE) Tonnes 0.036 0.038 0.055 0.089
Percentage waste reused or recycled % 75 75 61 52
Water
Total water consumption in buildings m3 194,051 183,339 171,600 165,873
Total water consumption/employee (FTE) m3 12.70 11.75 10.92 10.46
2 SEB Sustainability Fact Book 2016
Short facts Key performance indicators
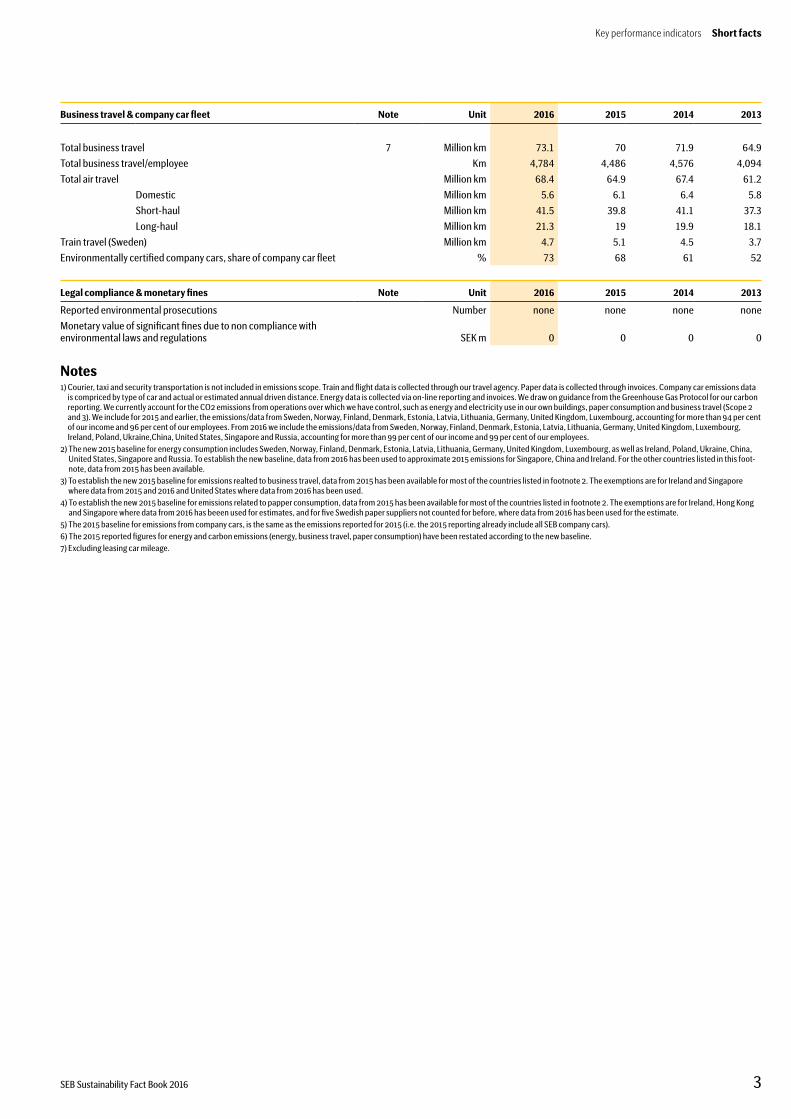
Business travel & company car fleet Note Unit 2016 2015 2014 2013
Total business travel 7 Million km 73.1 70 71.9 64.9
Total business travel/employee Km 4,784 4,486 4,576 4,094
Total air travel Million km 68.4 64.9 67.4 61.2
Domestic Million km 5.6 6.1 6.4 5.8
Short-haul Million km 41.5 39.8 41.1 37.3
Long-haul Million km 21.3 19 19.9 18.1
Train travel (Sweden) Million km 4.7 5.1 4.5 3.7
Environmentally certified company cars, share of company car fleet % 73 68 61 52
Legal compliance & monetary fines Note Unit 2016 2015 2014 2013
Reported environmental prosecutions Number none none none none
Monetary value of significant fines due to non compliance with environmental laws and regulations SEK m 0 0 0 0
Notes1) Courier, taxi and security transportation is not included in emissions scope. Train and flight data is collected through our travel agency. Paper data is collected through invoices. Company car emissions data
is compriced by type of car and actual or estimated annual driven distance. Energy data is collected via on-line reporting and invoices. We draw on guidance from the Greenhouse Gas Protocol for our carbon reporting. We currently account for the CO2 emissions from operations over which we have control, such as energy and electricity use in our own buildings, paper consumption and business travel (Scope 2 and 3). We include for 2015 and earlier, the emissions/data from Sweden, Norway, Finland, Denmark, Estonia, Latvia, Lithuania, Germany, United Kingdom, Luxembourg, accounting for more than 94 per cent of our income and 96 per cent of our employees. From 2016 we include the emissions/data from Sweden, Norway, Finland, Denmark, Estonia, Latvia, Lithuania, Germany, United Kingdom, Luxembourg, Ireland, Poland, Ukraine,China, United States, Singapore and Russia, accounting for more than 99 per cent of our income and 99 per cent of our employees.
2) The new 2015 baseline for energy consumption includes Sweden, Norway, Finland, Denmark, Estonia, Latvia, Lithuania, Germany, United Kingdom, Luxembourg, as well as Ireland, Poland, Ukraine, China, United States, Singapore and Russia. To establish the new baseline, data from 2016 has been used to approximate 2015 emissions for Singapore, China and Ireland. For the other countries listed in this foot-note, data from 2015 has been available.
3) To establish the new 2015 baseline for emissions realted to business travel, data from 2015 has been available for most of the countries listed in footnote 2. The exemptions are for Ireland and Singapore where data from 2015 and 2016 and United States where data from 2016 has been used.
4) To establish the new 2015 baseline for emissions related to papper consumption, data from 2015 has been available for most of the countries listed in footnote 2. The exemptions are for Ireland, Hong Kong and Singapore where data from 2016 has beeen used for estimates, and for five Swedish paper suppliers not counted for before, where data from 2016 has been used for the estimate.
5) The 2015 baseline for emissions from company cars, is the same as the emissions reported for 2015 (i.e. the 2015 reporting already include all SEB company cars).6) The 2015 reported figures for energy and carbon emissions (energy, business travel, paper consumption) have been restated according to the new baseline.7) Excluding leasing car mileage.
Key performance indicators Short facts
3SEB Sustainability Fact Book 2016
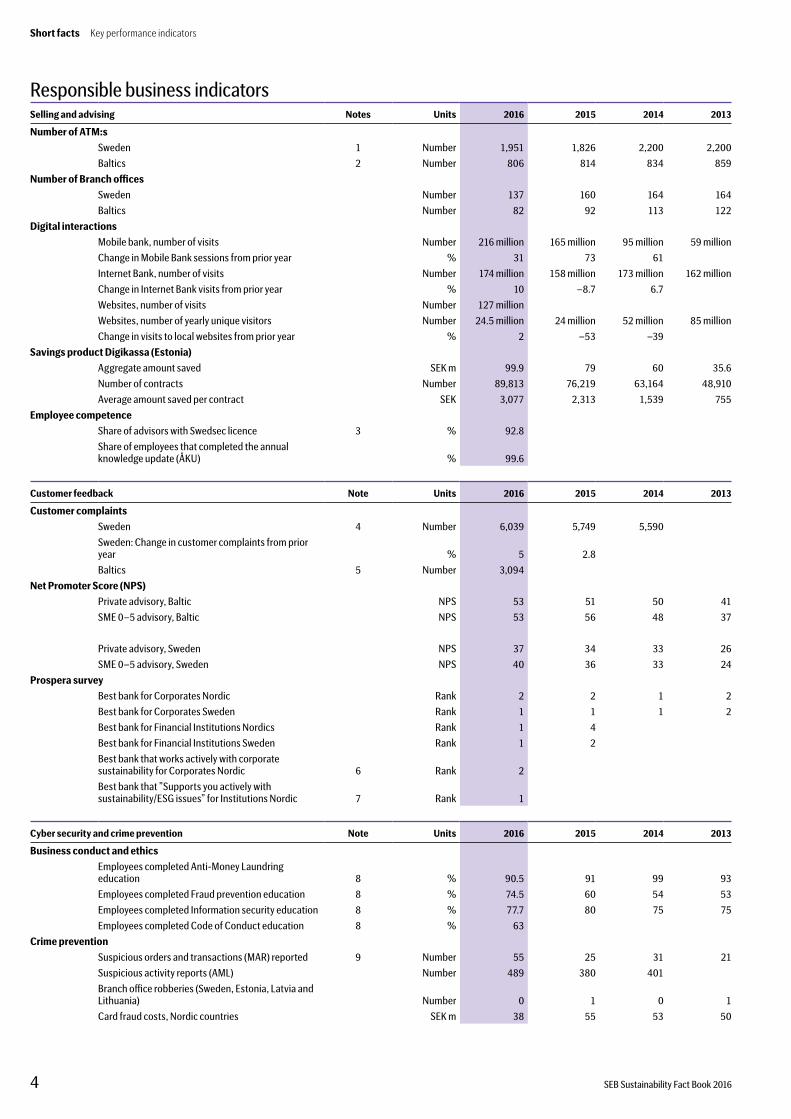
Responsible business indicatorsSelling and advising Notes Units 2016 2015 2014 2013
Number of ATM:s
Sweden 1 Number 1,951 1,826 2,200 2,200
Baltics 2 Number 806 814 834 859
Number of Branch offices
Sweden Number 137 160 164 164
Baltics Number 82 92 113 122
Digital interactions
Mobile bank, number of visits Number 216 million 165 million 95 million 59 million
Change in Mobile Bank sessions from prior year % 31 73 61
Internet Bank, number of visits Number 174 million 158 million 173 million 162 million
Change in Internet Bank visits from prior year % 10 –8.7 6.7
Websites, number of visits Number 127 million
Websites, number of yearly unique visitors Number 24.5 million 24 million 52 million 85 million
Change in visits to local websites from prior year % 2 –53 –39
Savings product Digikassa (Estonia)
Aggregate amount saved SEK m 99.9 79 60 35.6
Number of contracts Number 89,813 76,219 63,164 48,910
Average amount saved per contract SEK 3,077 2,313 1,539 755
Employee competence
Share of advisors with Swedsec licence 3 % 92.8
Share of employees that completed the annual knowledge update (ÅKU) % 99.6
Customer feedback Note Units 2016 2015 2014 2013
Customer complaints
Sweden 4 Number 6,039 5,749 5,590
Sweden: Change in customer complaints from prior year % 5 2.8
Baltics 5 Number 3,094
Net Promoter Score (NPS)
Private advisory, Baltic NPS 53 51 50 41
SME 0–5 advisory, Baltic NPS 53 56 48 37
Private advisory, Sweden NPS 37 34 33 26
SME 0–5 advisory, Sweden NPS 40 36 33 24
Prospera survey
Best bank for Corporates Nordic Rank 2 2 1 2
Best bank for Corporates Sweden Rank 1 1 1 2
Best bank for Financial Institutions Nordics Rank 1 4
Best bank for Financial Institutions Sweden Rank 1 2
Best bank that works actively with corporate sustainability for Corporates Nordic 6 Rank 2
Best bank that ”Supports you actively with sustainability/ESG issues” for Institutions Nordic 7 Rank 1
Cyber security and crime prevention Note Units 2016 2015 2014 2013
Business conduct and ethics
Employees completed Anti-Money Laundring education 8 % 90.5 91 99 93
Employees completed Fraud prevention education 8 % 74.5 60 54 53
Employees completed Information security education 8 % 77.7 80 75 75
Employees completed Code of Conduct education 8 % 63
Crime prevention
Suspicious orders and transactions (MAR) reported 9 Number 55 25 31 21
Suspicious activity reports (AML) Number 489 380 401
Branch office robberies (Sweden, Estonia, Latvia and Lithuania) Number 0 1 0 1
Card fraud costs, Nordic countries SEK m 38 55 53 50
4 SEB Sustainability Fact Book 2016
Short facts Key performance indicators
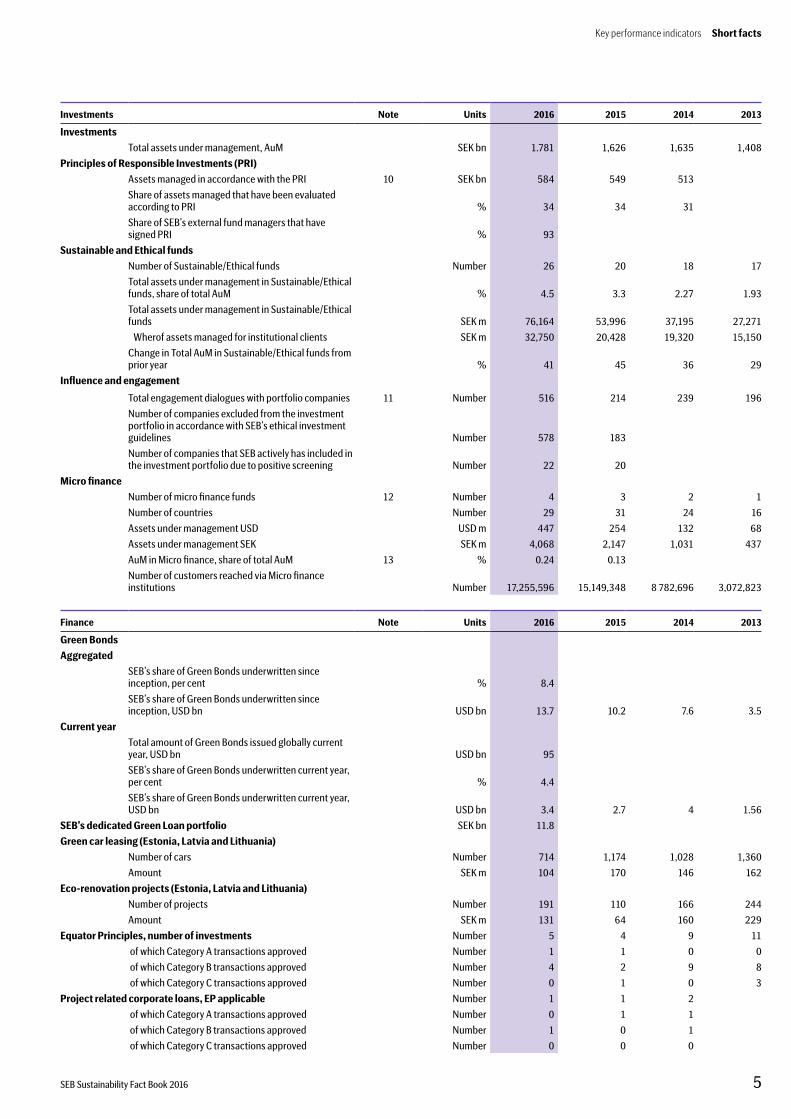
Investments Note Units 2016 2015 2014 2013
Investments
Total assets under management, AuM SEK bn 1.781 1,626 1,635 1,408
Principles of Responsible Investments (PRI)
Assets managed in accordance with the PRI 10 SEK bn 584 549 513
Share of assets managed that have been evaluated according to PRI % 34 34 31
Share of SEB’s external fund managers that have signed PRI % 93
Sustainable and Ethical funds
Number of Sustainable/Ethical funds Number 26 20 18 17
Total assets under management in Sustainable/Ethical funds, share of total AuM % 4.5 3.3 2.27 1.93
Total assets under management in Sustainable/Ethical funds SEK m 76,164 53,996 37,195 27,271
Wherof assets managed for institutional clients SEK m 32,750 20,428 19,320 15,150
Change in Total AuM in Sustainable/Ethical funds from prior year % 41 45 36 29
Influence and engagement
Total engagement dialogues with portfolio companies 11 Number 516 214 239 196
Number of companies excluded from the investment portfolio in accordance with SEB’s ethical investment guidelines Number 578 183
Number of companies that SEB actively has included in the investment portfolio due to positive screening Number 22 20
Micro finance
Number of micro finance funds 12 Number 4 3 2 1
Number of countries Number 29 31 24 16
Assets under management USD USD m 447 254 132 68
Assets under management SEK SEK m 4,068 2,147 1,031 437
AuM in Micro finance, share of total AuM 13 % 0.24 0.13
Number of customers reached via Micro finance institutions Number 17,255,596 15,149,348 8 782,696 3,072,823
Finance Note Units 2016 2015 2014 2013
Green Bonds
Aggregated
SEB’s share of Green Bonds underwritten since inception, per cent % 8.4
SEB’s share of Green Bonds underwritten since inception, USD bn USD bn 13.7 10.2 7.6 3.5
Current year
Total amount of Green Bonds issued globally current year, USD bn USD bn 95
SEB’s share of Green Bonds underwritten current year, per cent % 4.4
SEB’s share of Green Bonds underwritten current year, USD bn USD bn 3.4 2.7 4 1.56
SEB’s dedicated Green Loan portfolio SEK bn 11.8
Green car leasing (Estonia, Latvia and Lithuania)
Number of cars Number 714 1,174 1,028 1,360
Amount SEK m 104 170 146 162
Eco-renovation projects (Estonia, Latvia and Lithuania)
Number of projects Number 191 110 166 244
Amount SEK m 131 64 160 229
Equator Principles, number of investments Number 5 4 9 11
of which Category A transactions approved Number 1 1 0 0
of which Category B transactions approved Number 4 2 9 8
of which Category C transactions approved Number 0 1 0 3
Project related corporate loans, EP applicable Number 1 1 2
of which Category A transactions approved Number 0 1 1
of which Category B transactions approved Number 1 0 1
of which Category C transactions approved Number 0 0 0
Key performance indicators Short facts
5SEB Sustainability Fact Book 2016
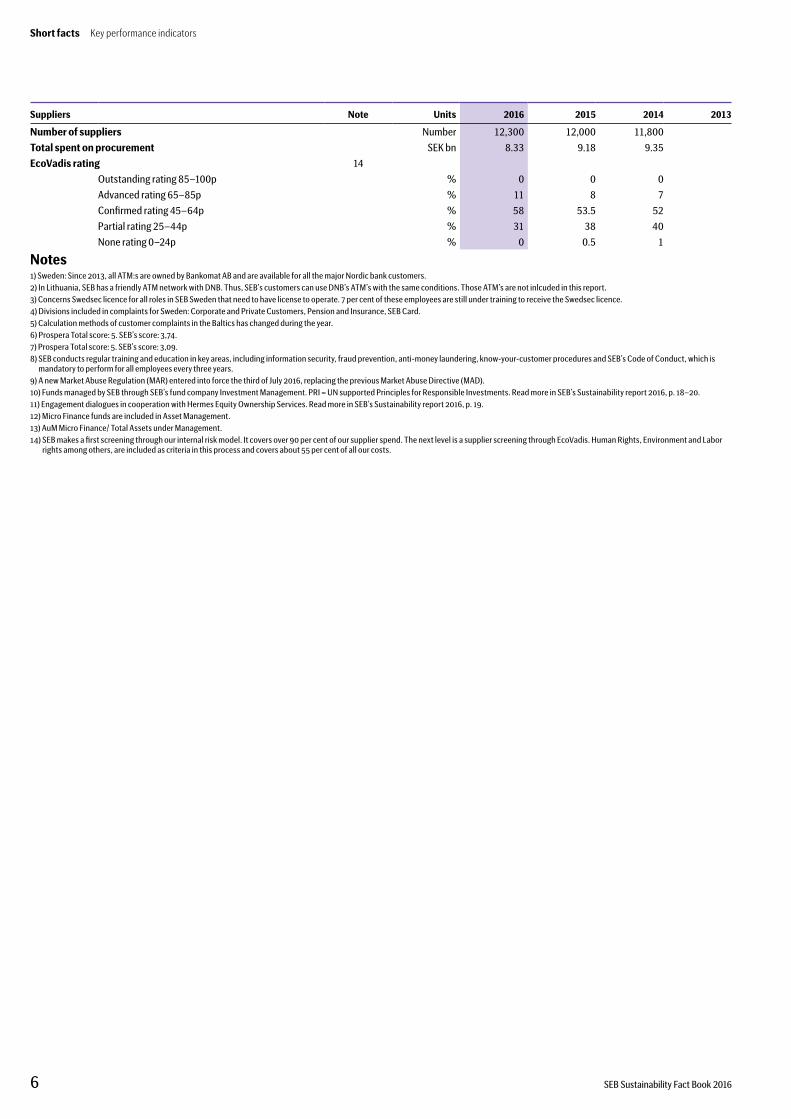
Suppliers Note Units 2016 2015 2014 2013
Number of suppliers Number 12,300 12,000 11,800
Total spent on procurement SEK bn 8.33 9.18 9.35
EcoVadis rating 14
Outstanding rating 85–100p % 0 0 0
Advanced rating 65–85p % 11 8 7
Confirmed rating 45–64p % 58 53.5 52
Partial rating 25–44p % 31 38 40
None rating 0–24p % 0 0.5 1
Notes1) Sweden: Since 2013, all ATM:s are owned by Bankomat AB and are available for all the major Nordic bank customers.2) In Lithuania, SEB has a friendly ATM network with DNB. Thus, SEB’s customers can use DNB’s ATM’s with the same conditions. Those ATM’s are not inlcuded in this report.3) Concerns Swedsec licence for all roles in SEB Sweden that need to have license to operate. 7 per cent of these employees are still under training to receive the Swedsec licence.4) Divisions included in complaints for Sweden: Corporate and Private Customers, Pension and Insurance, SEB Card.5) Calculation methods of customer complaints in the Baltics has changed during the year.6) Prospera Total score: 5. SEB’s score: 3,74. 7) Prospera Total score: 5. SEB’s score: 3,09.8) SEB conducts regular training and education in key areas, including information security, fraud prevention, anti-money laundering, know-your-customer procedures and SEB’s Code of Conduct, which is
mandatory to perform for all employees every three years. 9) A new Market Abuse Regulation (MAR) entered into force the third of July 2016, replacing the previous Market Abuse Directive (MAD).10) Funds managed by SEB through SEB’s fund company Investment Management. PRI = UN supported Principles for Responsible Investments. Read more in SEB’s Sustainability report 2016, p. 18–20.11) Engagement dialogues in cooperation with Hermes Equity Ownership Services. Read more in SEB’s Sustainability report 2016, p. 19. 12) Micro Finance funds are included in Asset Management.13) AuM Micro Finance/ Total Assets under Management.14) SEB makes a first screening through our internal risk model. It covers over 90 per cent of our supplier spend. The next level is a supplier screening through EcoVadis. Human Rights, Environment and Labor
rights among others, are included as criteria in this process and covers about 55 per cent of all our costs.
6 SEB Sustainability Fact Book 2016
Short facts Key performance indicators
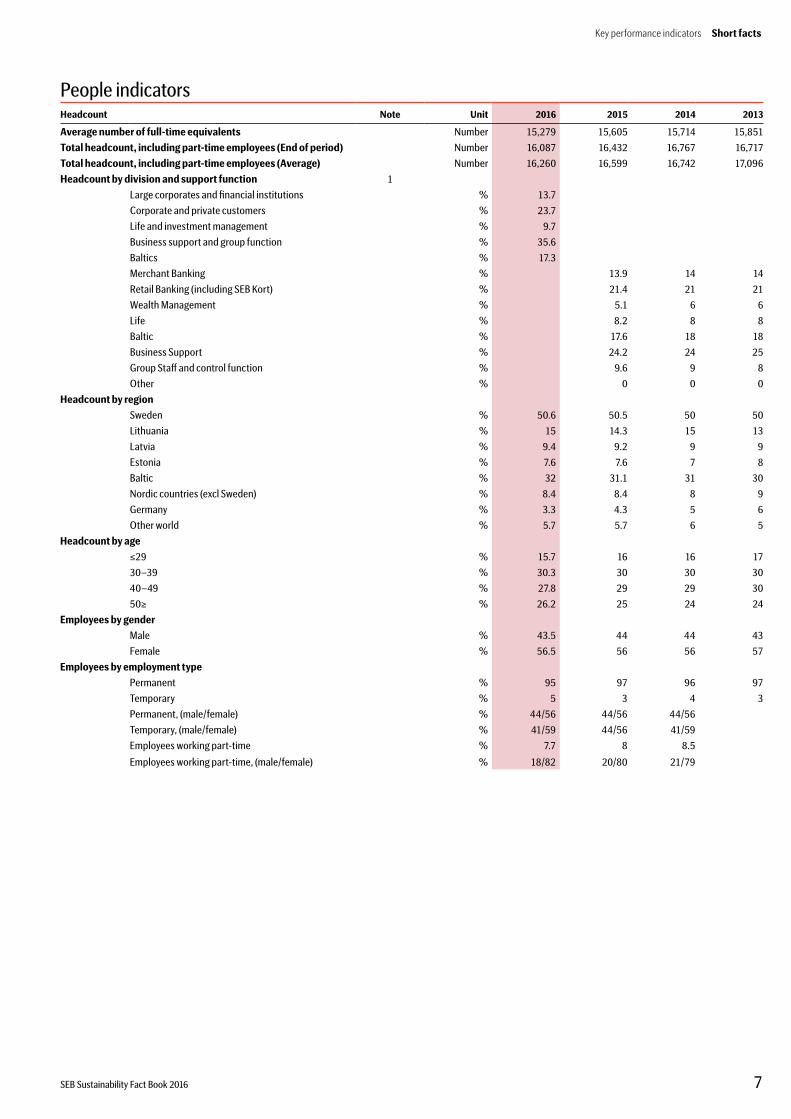
People indicatorsHeadcount Note Unit 2016 2015 2014 2013
Average number of full-time equivalents Number 15,279 15,605 15,714 15,851
Total headcount, including part-time employees (End of period) Number 16,087 16,432 16,767 16,717
Total headcount, including part-time employees (Average) Number 16,260 16,599 16,742 17,096
Headcount by division and support function 1
Large corporates and financial institutions % 13.7
Corporate and private customers % 23.7
Life and investment management % 9.7
Business support and group function % 35.6
Baltics % 17.3
Merchant Banking % 13.9 14 14
Retail Banking (including SEB Kort) % 21.4 21 21
Wealth Management % 5.1 6 6
Life % 8.2 8 8
Baltic % 17.6 18 18
Business Support % 24.2 24 25
Group Staff and control function % 9.6 9 8
Other % 0 0 0
Headcount by region
Sweden % 50.6 50.5 50 50
Lithuania % 15 14.3 15 13
Latvia % 9.4 9.2 9 9
Estonia % 7.6 7.6 7 8
Baltic % 32 31.1 31 30
Nordic countries (excl Sweden) % 8.4 8.4 8 9
Germany % 3.3 4.3 5 6
Other world % 5.7 5.7 6 5
Headcount by age
≤29 % 15.7 16 16 17
30–39 % 30.3 30 30 30
40–49 % 27.8 29 29 30
50≥ % 26.2 25 24 24
Employees by gender
Male % 43.5 44 44 43
Female % 56.5 56 56 57
Employees by employment type
Permanent % 95 97 96 97
Temporary % 5 3 4 3
Permanent, (male/female) % 44/56 44/56 44/56
Temporary, (male/female) % 41/59 44/56 41/59
Employees working part-time % 7.7 8 8.5
Employees working part-time, (male/female) % 18/82 20/80 21/79
Key performance indicators Short facts
7SEB Sustainability Fact Book 2016
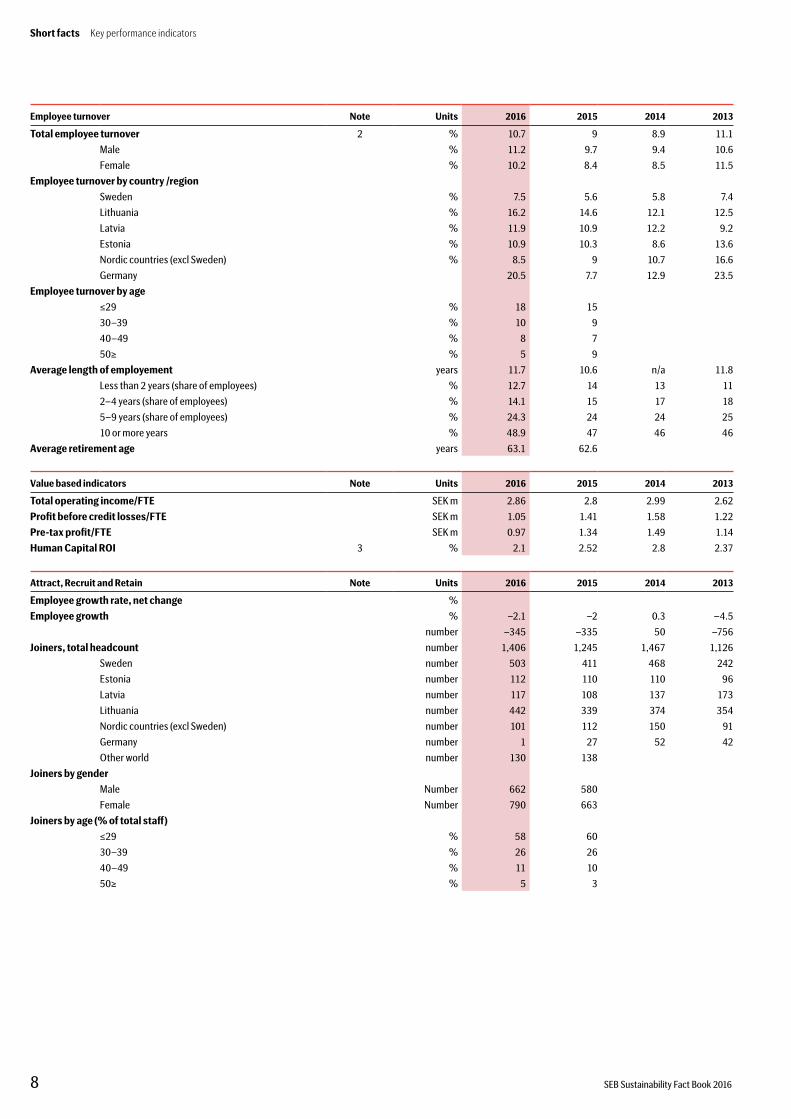
Employee turnover Note Units 2016 2015 2014 2013
Total employee turnover 2 % 10.7 9 8.9 11.1
Male % 11.2 9.7 9.4 10.6
Female % 10.2 8.4 8.5 11.5
Employee turnover by country /region
Sweden % 7.5 5.6 5.8 7.4
Lithuania % 16.2 14.6 12.1 12.5
Latvia % 11.9 10.9 12.2 9.2
Estonia % 10.9 10.3 8.6 13.6
Nordic countries (excl Sweden) % 8.5 9 10.7 16.6
Germany 20.5 7.7 12.9 23.5
Employee turnover by age
≤29 % 18 15
30–39 % 10 9
40–49 % 8 7
50≥ % 5 9
Average length of employement years 11.7 10.6 n/a 11.8
Less than 2 years (share of employees) % 12.7 14 13 11
2–4 years (share of employees) % 14.1 15 17 18
5–9 years (share of employees) % 24.3 24 24 25
10 or more years % 48.9 47 46 46
Average retirement age years 63.1 62.6
Value based indicators Note Units 2016 2015 2014 2013
Total operating income/FTE SEK m 2.86 2.8 2.99 2.62
Profit before credit losses/FTE SEK m 1.05 1.41 1.58 1.22
Pre-tax profit/FTE SEK m 0.97 1.34 1.49 1.14
Human Capital ROI 3 % 2.1 2.52 2.8 2.37
Attract, Recruit and Retain Note Units 2016 2015 2014 2013
Employee growth rate, net change %
Employee growth % –2.1 –2 0.3 –4.5
number –345 –335 50 –756
Joiners, total headcount number 1,406 1,245 1,467 1,126
Sweden number 503 411 468 242
Estonia number 112 110 110 96
Latvia number 117 108 137 173
Lithuania number 442 339 374 354
Nordic countries (excl Sweden) number 101 112 150 91
Germany number 1 27 52 42
Other world number 130 138
Joiners by gender
Male Number 662 580
Female Number 790 663
Joiners by age (% of total staff)
≤29 % 58 60
30–39 % 26 26
40–49 % 11 10
50≥ % 5 3
8 SEB Sustainability Fact Book 2016
Short facts Key performance indicators
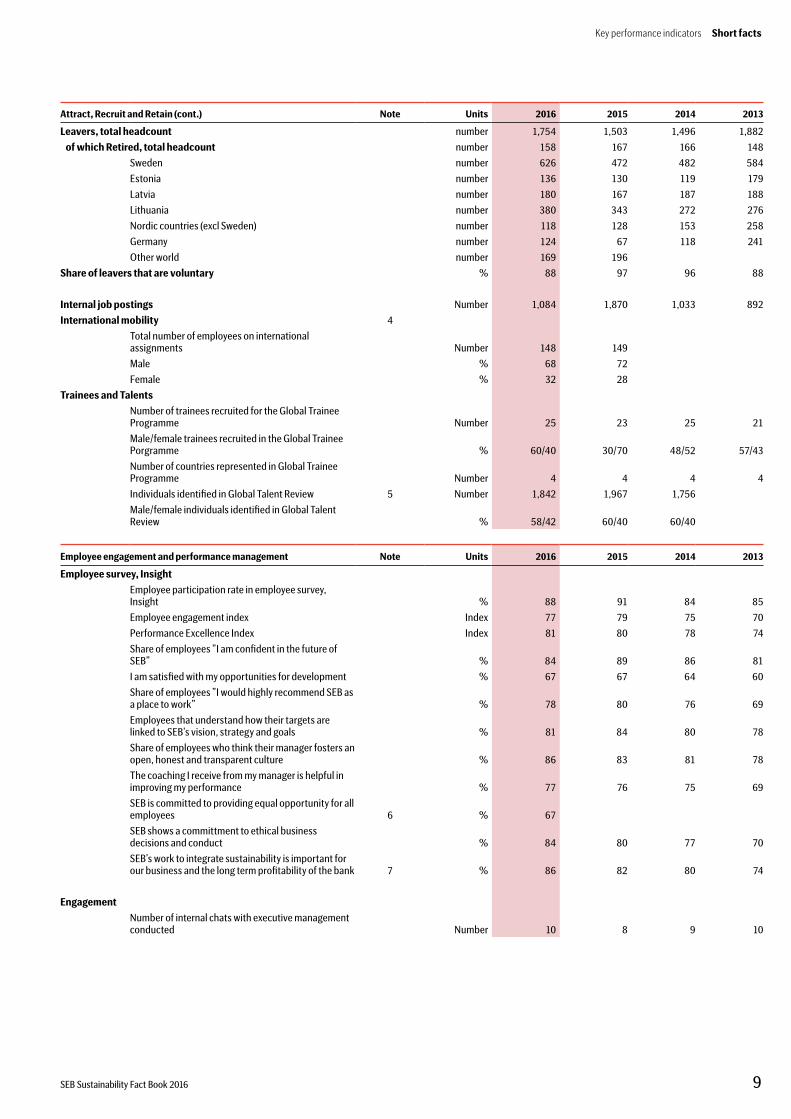
Attract, Recruit and Retain (cont.) Note Units 2016 2015 2014 2013
Leavers, total headcount number 1,754 1,503 1,496 1,882
of which Retired, total headcount number 158 167 166 148
Sweden number 626 472 482 584
Estonia number 136 130 119 179
Latvia number 180 167 187 188
Lithuania number 380 343 272 276
Nordic countries (excl Sweden) number 118 128 153 258
Germany number 124 67 118 241
Other world number 169 196
Share of leavers that are voluntary % 88 97 96 88
Internal job postings Number 1,084 1,870 1,033 892
International mobility 4
Total number of employees on international assignments Number 148 149
Male % 68 72
Female % 32 28
Trainees and Talents
Number of trainees recruited for the Global Trainee Programme Number 25 23 25 21
Male/female trainees recruited in the Global Trainee Porgramme % 60/40 30/70 48/52 57/43
Number of countries represented in Global Trainee Programme Number 4 4 4 4
Individuals identified in Global Talent Review 5 Number 1,842 1,967 1,756
Male/female individuals identified in Global Talent Review % 58/42 60/40 60/40
Employee engagement and performance management Note Units 2016 2015 2014 2013
Employee survey, Insight
Employee participation rate in employee survey, Insight % 88 91 84 85
Employee engagement index Index 77 79 75 70
Performance Excellence Index Index 81 80 78 74
Share of employees ”I am confident in the future of SEB” % 84 89 86 81
I am satisfied with my opportunities for development % 67 67 64 60
Share of employees ”I would highly recommend SEB as a place to work” % 78 80 76 69
Employees that understand how their targets are linked to SEB’s vision, strategy and goals % 81 84 80 78
Share of employees who think their manager fosters an open, honest and transparent culture % 86 83 81 78
The coaching I receive from my manager is helpful in improving my performance % 77 76 75 69
SEB is committed to providing equal opportunity for all employees 6 % 67
SEB shows a committment to ethical business decisions and conduct % 84 80 77 70
SEB’s work to integrate sustainability is important for our business and the long term profitability of the bank 7 % 86 82 80 74
Engagement
Number of internal chats with executive management conducted Number 10 8 9 10
Key performance indicators Short facts
9SEB Sustainability Fact Book 2016
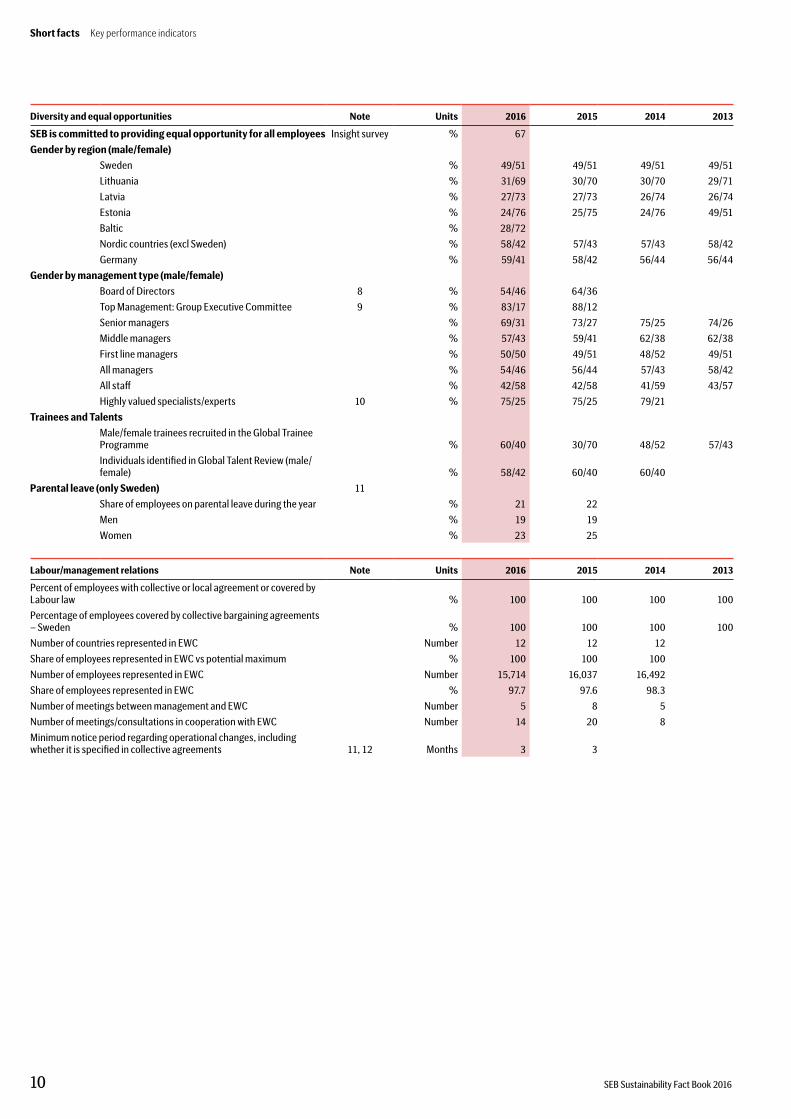
Diversity and equal opportunities Note Units 2016 2015 2014 2013
SEB is committed to providing equal opportunity for all employees Insight survey % 67
Gender by region (male/female)
Sweden % 49/51 49/51 49/51 49/51
Lithuania % 31/69 30/70 30/70 29/71
Latvia % 27/73 27/73 26/74 26/74
Estonia % 24/76 25/75 24/76 49/51
Baltic % 28/72
Nordic countries (excl Sweden) % 58/42 57/43 57/43 58/42
Germany % 59/41 58/42 56/44 56/44
Gender by management type (male/female)
Board of Directors 8 % 54/46 64/36
Top Management: Group Executive Committee 9 % 83/17 88/12
Senior managers % 69/31 73/27 75/25 74/26
Middle managers % 57/43 59/41 62/38 62/38
First line managers % 50/50 49/51 48/52 49/51
All managers % 54/46 56/44 57/43 58/42
All staff % 42/58 42/58 41/59 43/57
Highly valued specialists/experts 10 % 75/25 75/25 79/21
Trainees and Talents
Male/female trainees recruited in the Global Trainee Programme % 60/40 30/70 48/52 57/43
Individuals identified in Global Talent Review (male/female) % 58/42 60/40 60/40
Parental leave (only Sweden) 11
Share of employees on parental leave during the year % 21 22
Men % 19 19
Women % 23 25
Labour/management relations Note Units 2016 2015 2014 2013
Percent of employees with collective or local agreement or covered by Labour law % 100 100 100 100
Percentage of employees covered by collective bargaining agreements – Sweden % 100 100 100 100
Number of countries represented in EWC Number 12 12 12
Share of employees represented in EWC vs potential maximum % 100 100 100
Number of employees represented in EWC Number 15,714 16,037 16,492
Share of employees represented in EWC % 97.7 97.6 98.3
Number of meetings between management and EWC Number 5 8 5
Number of meetings/consultations in cooperation with EWC Number 14 20 8
Minimum notice period regarding operational changes, including whether it is specified in collective agreements 11, 12 Months 3 3
10 SEB Sustainability Fact Book 2016
Short facts Key performance indicators
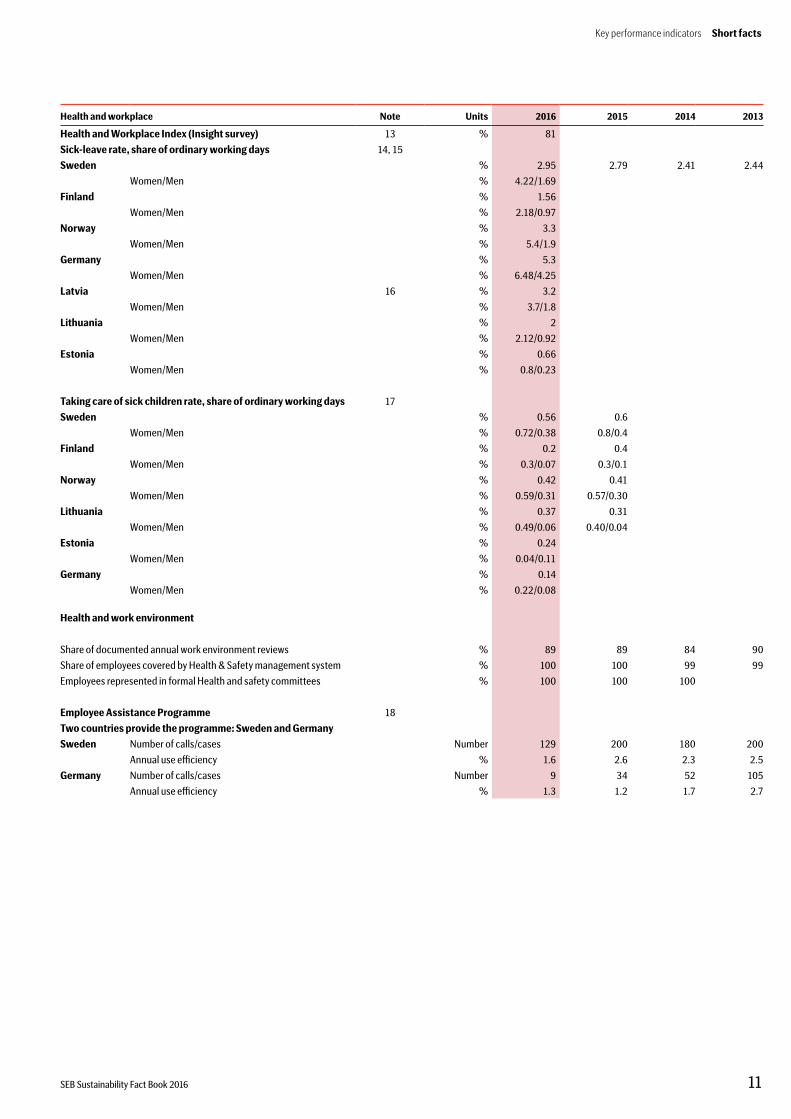
Health and workplace Note Units 2016 2015 2014 2013
Health and Workplace Index (Insight survey) 13 % 81
Sick-leave rate, share of ordinary working days 14, 15
Sweden % 2.95 2.79 2.41 2.44
Women/Men % 4.22/1.69
Finland % 1.56
Women/Men % 2.18/0.97
Norway % 3.3
Women/Men % 5.4/1.9
Germany % 5.3
Women/Men % 6.48/4.25
Latvia 16 % 3.2
Women/Men % 3.7/1.8
Lithuania % 2
Women/Men % 2.12/0.92
Estonia % 0.66
Women/Men % 0.8/0.23
Taking care of sick children rate, share of ordinary working days 17
Sweden % 0.56 0.6
Women/Men % 0.72/0.38 0.8/0.4
Finland % 0.2 0.4
Women/Men % 0.3/0.07 0.3/0.1
Norway % 0.42 0.41
Women/Men % 0.59/0.31 0.57/0.30
Lithuania % 0.37 0.31
Women/Men % 0.49/0.06 0.40/0.04
Estonia % 0.24
Women/Men % 0.04/0.11
Germany % 0.14
Women/Men % 0.22/0.08
Health and work environment
Share of documented annual work environment reviews % 89 89 84 90
Share of employees covered by Health & Safety management system % 100 100 99 99
Employees represented in formal Health and safety committees % 100 100 100
Employee Assistance Programme 18
Two countries provide the programme: Sweden and Germany
Sweden Number of calls/cases Number 129 200 180 200
Annual use efficiency % 1.6 2.6 2.3 2.5
Germany Number of calls/cases Number 9 34 52 105
Annual use efficiency % 1.3 1.2 1.7 2.7
Key performance indicators Short facts
11SEB Sustainability Fact Book 2016
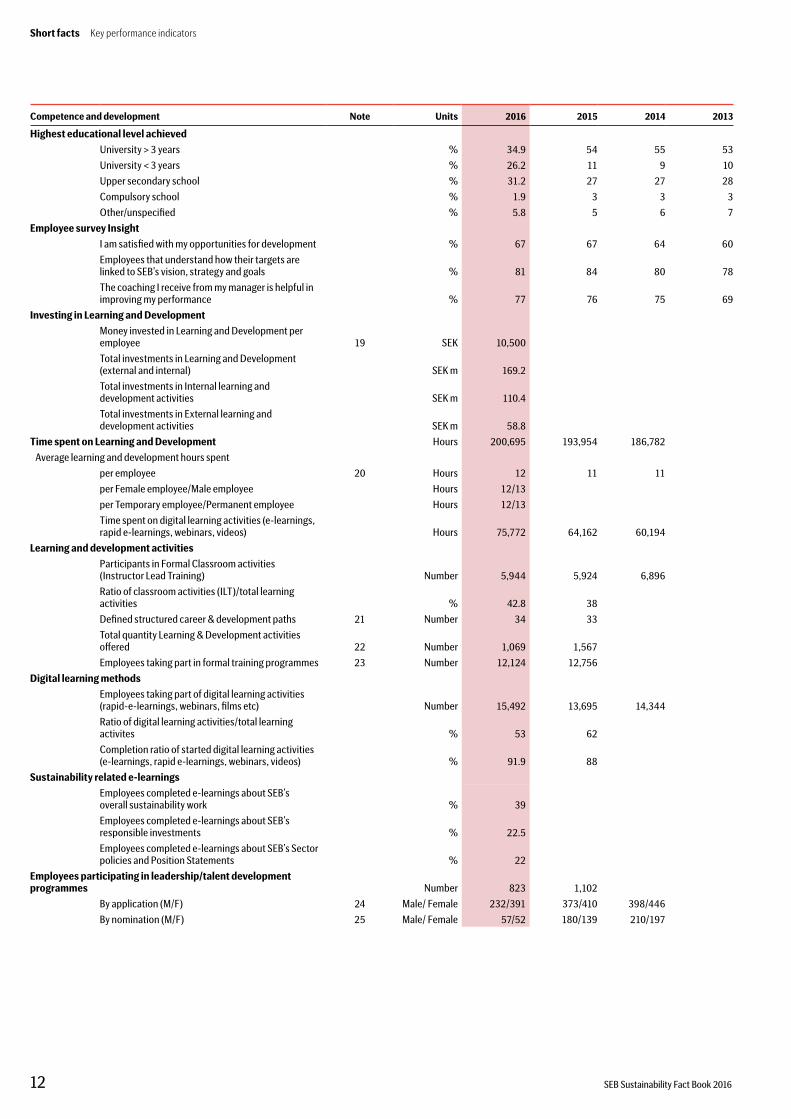
Competence and development Note Units 2016 2015 2014 2013
Highest educational level achieved
University > 3 years % 34.9 54 55 53
University < 3 years % 26.2 11 9 10
Upper secondary school % 31.2 27 27 28
Compulsory school % 1.9 3 3 3
Other/unspecified % 5.8 5 6 7
Employee survey Insight
I am satisfied with my opportunities for development % 67 67 64 60
Employees that understand how their targets are linked to SEB’s vision, strategy and goals % 81 84 80 78
The coaching I receive from my manager is helpful in improving my performance % 77 76 75 69
Investing in Learning and Development
Money invested in Learning and Development per employee 19 SEK 10,500
Total investments in Learning and Development (external and internal) SEK m 169.2
Total investments in Internal learning and development activities SEK m 110.4
Total investments in External learning and development activities SEK m 58.8
Time spent on Learning and Development Hours 200,695 193,954 186,782
Average learning and development hours spent
per employee 20 Hours 12 11 11
per Female employee/Male employee Hours 12/13
per Temporary employee/Permanent employee Hours 12/13
Time spent on digital learning activities (e-learnings, rapid e-learnings, webinars, videos) Hours 75,772 64,162 60,194
Learning and development activities
Participants in Formal Classroom activities (Instructor Lead Training) Number 5,944 5,924 6,896
Ratio of classroom activities (ILT)/total learning activities % 42.8 38
Defined structured career & development paths 21 Number 34 33
Total quantity Learning & Development activities offered 22 Number 1,069 1,567
Employees taking part in formal training programmes 23 Number 12,124 12,756
Digital learning methods
Employees taking part of digital learning activities (rapid-e-learnings, webinars, films etc) Number 15,492 13,695 14,344
Ratio of digital learning activities/total learning activites % 53 62
Completion ratio of started digital learning activities (e-learnings, rapid e-learnings, webinars, videos) % 91.9 88
Sustainability related e-learnings
Employees completed e-learnings about SEB’s overall sustainability work % 39
Employees completed e-learnings about SEB’s responsible investments % 22.5
Employees completed e-learnings about SEB’s Sector policies and Position Statements % 22
Employees participating in leadership/talent development programmes Number 823 1,102
By application (M/F) 24 Male/ Female 232/391 373/410 398/446
By nomination (M/F) 25 Male/ Female 57/52 180/139 210/197
12 SEB Sustainability Fact Book 2016
Short facts Key performance indicators
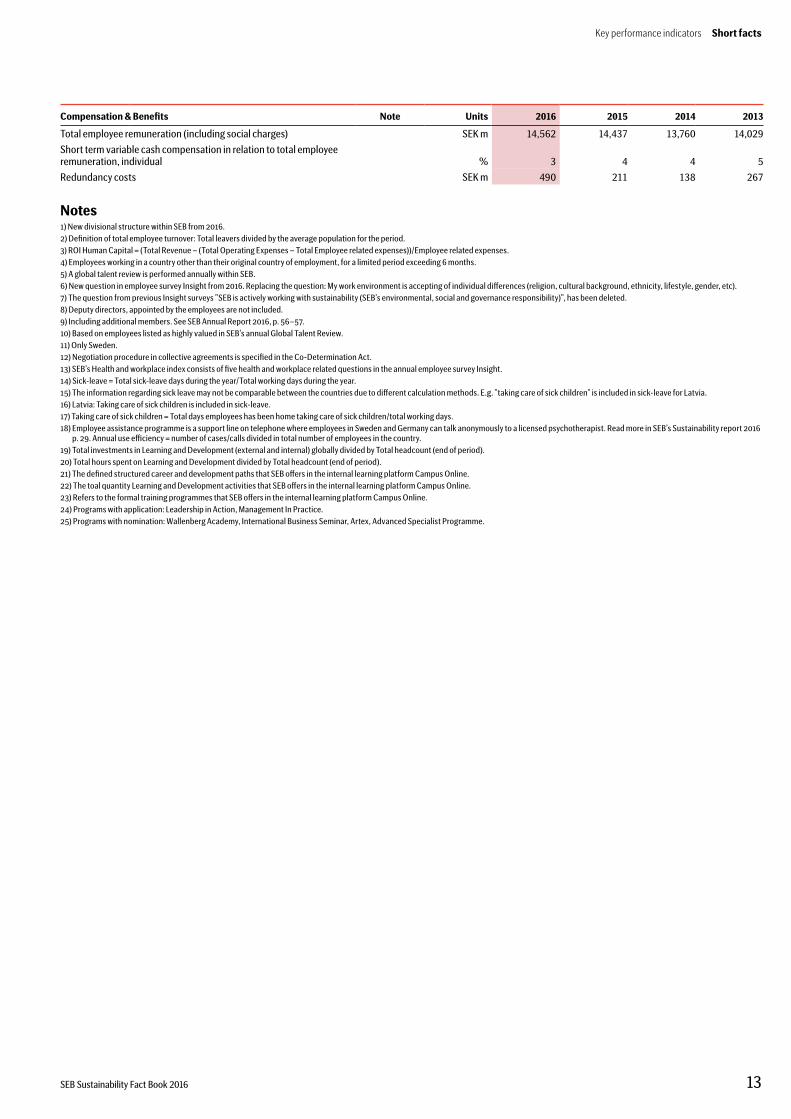
Compensation & Benefits Note Units 2016 2015 2014 2013
Total employee remuneration (including social charges) SEK m 14,562 14,437 13,760 14,029
Short term variable cash compensation in relation to total employee remuneration, individual % 3 4 4 5
Redundancy costs SEK m 490 211 138 267
Notes1) New divisional structure within SEB from 2016. 2) Definition of total employee turnover: Total leavers divided by the average population for the period.3) ROI Human Capital = (Total Revenue – (Total Operating Expenses – Total Employee related expenses))/Employee related expenses.4) Employees working in a country other than their original country of employment, for a limited period exceeding 6 months.5) A global talent review is performed annually within SEB. 6) New question in employee survey Insight from 2016. Replacing the question: My work environment is accepting of individual differences (religion, cultural background, ethnicity, lifestyle, gender, etc).7) The question from previous Insight surveys ”SEB is actively working with sustainability (SEB’s environmental, social and governance responsibility)”, has been deleted. 8) Deputy directors, appointed by the employees are not included.9) Including additional members. See SEB Annual Report 2016, p. 56–57.10) Based on employees listed as highly valued in SEB’s annual Global Talent Review. 11) Only Sweden.12) Negotiation procedure in collective agreements is specified in the Co-Determination Act.13) SEB’s Health and workplace index consists of five health and workplace related questions in the annual employee survey Insight. 14) Sick-leave = Total sick-leave days during the year/Total working days during the year. 15) The information regarding sick leave may not be comparable between the countries due to different calculation methods. E.g. "taking care of sick children" is included in sick-leave for Latvia.16) Latvia: Taking care of sick children is included in sick-leave. 17) Taking care of sick children = Total days employees has been home taking care of sick children/total working days.18) Employee assistance programme is a support line on telephone where employees in Sweden and Germany can talk anonymously to a licensed psychotherapist. Read more in SEB’s Sustainability report 2016
p. 29. Annual use efficiency = number of cases/calls divided in total number of employees in the country.19) Total investments in Learning and Development (external and internal) globally divided by Total headcount (end of period). 20) Total hours spent on Learning and Development divided by Total headcount (end of period). 21) The defined structured career and development paths that SEB offers in the internal learning platform Campus Online. 22) The toal quantity Learning and Development activities that SEB offers in the internal learning platform Campus Online. 23) Refers to the formal training programmes that SEB offers in the internal learning platform Campus Online. 24) Programs with application: Leadership in Action, Management In Practice.25) Programs with nomination: Wallenberg Academy, International Business Seminar, Artex, Advanced Specialist Programme.
Key performance indicators Short facts
13SEB Sustainability Fact Book 2016
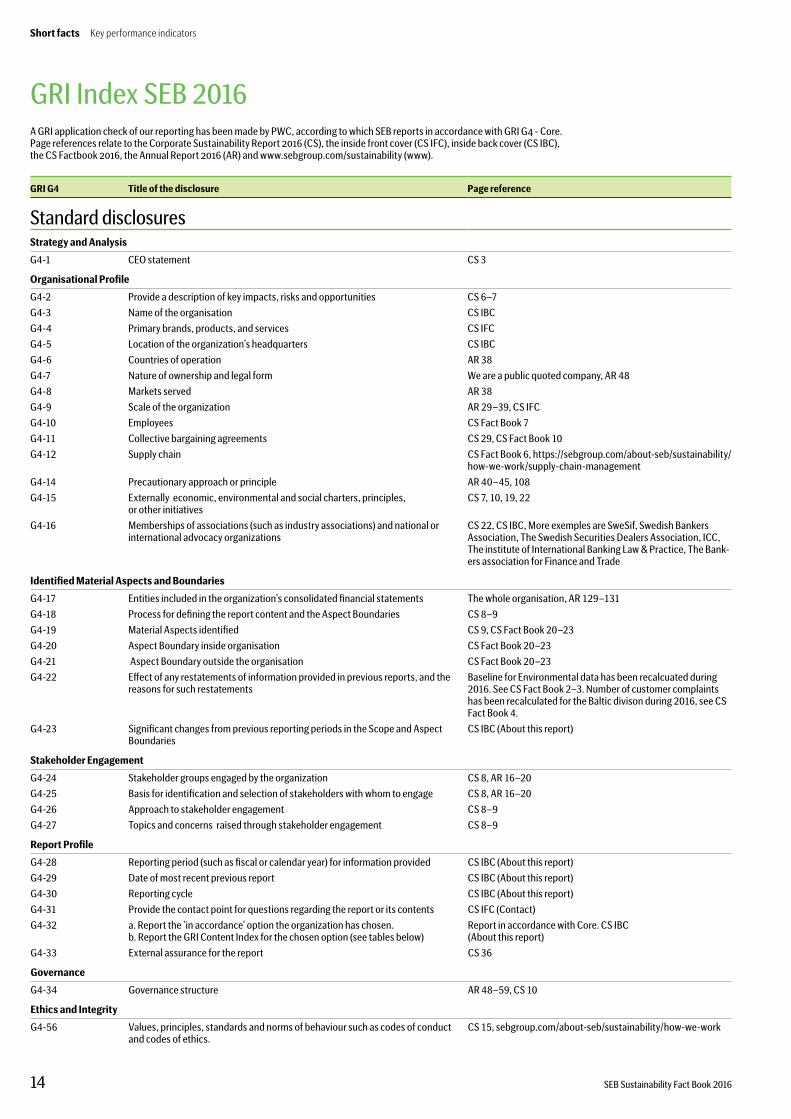
GRI Index SEB 2016 A GRI application check of our reporting has been made by PWC, according to which SEB reports in accordance with GRI G4 - Core.Page references relate to the Corporate Sustainability Report 2016 (CS), the inside front cover (CS IFC), inside back cover (CS IBC), the CS Factbook 2016, the Annual Report 2016 (AR) and www.sebgroup.com/sustainability (www).
GRI G4 Title of the disclosure Page reference
Standard disclosuresStrategy and Analysis
G4-1 CEO statement CS 3
Organisational Profile
G4-2 Provide a description of key impacts, risks and opportunities CS 6–7
G4-3 Name of the organisation CS IBC
G4-4 Primary brands, products, and services CS IFC
G4-5 Location of the organization’s headquarters CS IBC
G4-6 Countries of operation AR 38
G4-7 Nature of ownership and legal form We are a public quoted company, AR 48
G4-8 Markets served AR 38
G4-9 Scale of the organization AR 29–39, CS IFC
G4-10 Employees CS Fact Book 7
G4-11 Collective bargaining agreements CS 29, CS Fact Book 10
G4-12 Supply chain CS Fact Book 6, https://sebgroup.com/about-seb/sustainability/how-we-work/supply-chain-management
G4-14 Precautionary approach or principle AR 40–45, 108
G4-15 Externally economic, environmental and social charters, principles, or other initiatives
CS 7, 10, 19, 22
G4-16 Memberships of associations (such as industry associations) and national or international advocacy organizations
CS 22, CS IBC, More exemples are SweSif, Swedish Bankers Association, The Swedish Securities Dealers Association, ICC, The institute of International Banking Law & Practice, The Bank-ers association for Finance and Trade
Identified Material Aspects and Boundaries
G4-17 Entities included in the organization’s consolidated financial statements The whole organisation, AR 129–131
G4-18 Process for defining the report content and the Aspect Boundaries CS 8–9
G4-19 Material Aspects identified CS 9, CS Fact Book 20–23
G4-20 Aspect Boundary inside organisation CS Fact Book 20–23
G4-21 Aspect Boundary outside the organisation CS Fact Book 20–23
G4-22 Effect of any restatements of information provided in previous reports, and the reasons for such restatements
Baseline for Environmental data has been recalcuated during 2016. See CS Fact Book 2–3. Number of customer complaints has been recalculated for the Baltic divison during 2016, see CS Fact Book 4.
G4-23 Significant changes from previous reporting periods in the Scope and Aspect Boundaries
CS IBC (About this report)
Stakeholder Engagement
G4-24 Stakeholder groups engaged by the organization CS 8, AR 16–20
G4-25 Basis for identification and selection of stakeholders with whom to engage CS 8, AR 16–20
G4-26 Approach to stakeholder engagement CS 8–9
G4-27 Topics and concerns raised through stakeholder engagement CS 8–9
Report Profile
G4-28 Reporting period (such as fiscal or calendar year) for information provided CS IBC (About this report)
G4-29 Date of most recent previous report CS IBC (About this report)
G4-30 Reporting cycle CS IBC (About this report)
G4-31 Provide the contact point for questions regarding the report or its contents CS IFC (Contact)
G4-32 a. Report the 'in accordance' option the organization has chosen. b. Report the GRI Content Index for the chosen option (see tables below)
Report in accordance with Core. CS IBC (About this report)
G4-33 External assurance for the report CS 36
Governance
G4-34 Governance structure AR 48–59, CS 10
Ethics and Integrity
G4-56 Values, principles, standards and norms of behaviour such as codes of conduct and codes of ethics.
CS 15, sebgroup.com/about-seb/sustainability/how-we-work
14 SEB Sustainability Fact Book 2016
Short facts Key performance indicators
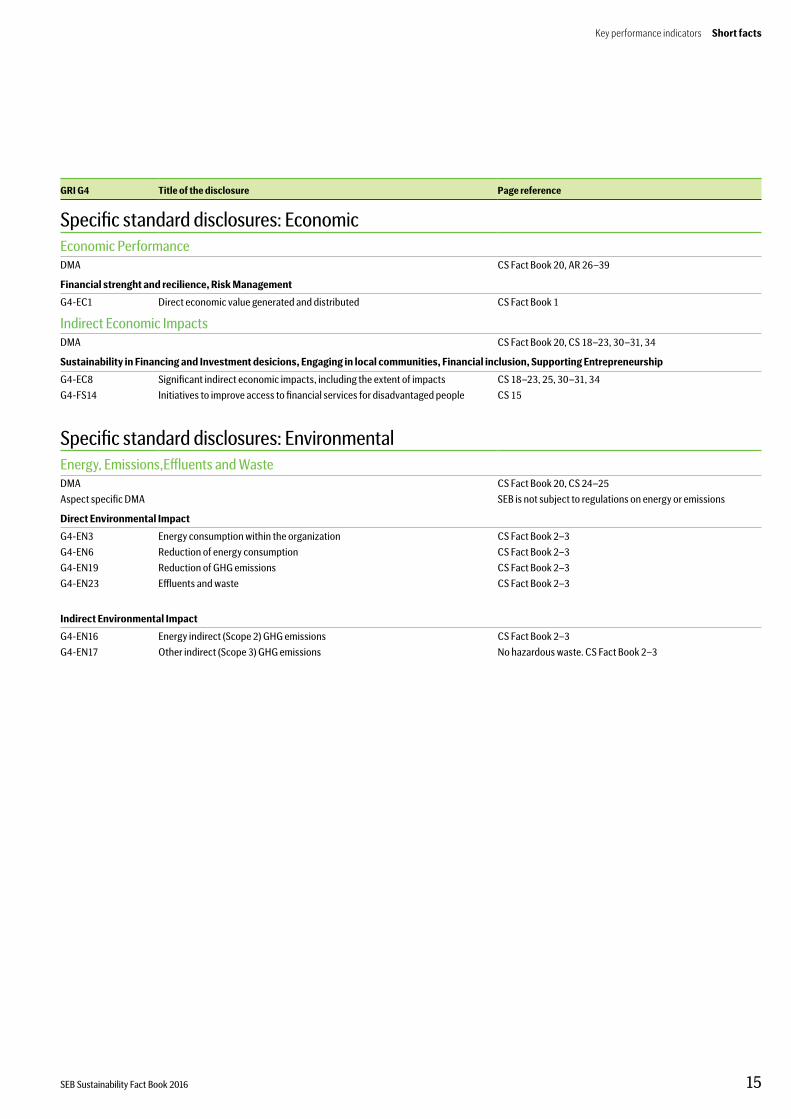
GRI G4 Title of the disclosure Page reference
Specific standard disclosures: EconomicEconomic Performance DMA CS Fact Book 20, AR 26–39
Financial strenght and recilience, Risk Management
G4-EC1 Direct economic value generated and distributed CS Fact Book 1
Indirect Economic ImpactsDMA CS Fact Book 20, CS 18–23, 30–31, 34
Sustainability in Financing and Investment desicions, Engaging in local communities, Financial inclusion, Supporting Entrepreneurship
G4-EC8 Significant indirect economic impacts, including the extent of impacts CS 18–23, 25, 30–31, 34
G4-FS14 Initiatives to improve access to financial services for disadvantaged people CS 15
Specific standard disclosures: EnvironmentalEnergy, Emissions,Effluents and WasteDMA CS Fact Book 20, CS 24–25
Aspect specific DMA SEB is not subject to regulations on energy or emissions
Direct Environmental Impact
G4-EN3 Energy consumption within the organization CS Fact Book 2–3
G4-EN6 Reduction of energy consumption CS Fact Book 2–3
G4-EN19 Reduction of GHG emissions CS Fact Book 2–3
G4-EN23 Effluents and waste CS Fact Book 2–3
Indirect Environmental Impact
G4-EN16 Energy indirect (Scope 2) GHG emissions CS Fact Book 2–3
G4-EN17 Other indirect (Scope 3) GHG emissions No hazardous waste. CS Fact Book 2–3
Key performance indicators Short facts
15SEB Sustainability Fact Book 2016
GRI G4 Title of the disclosure Page reference
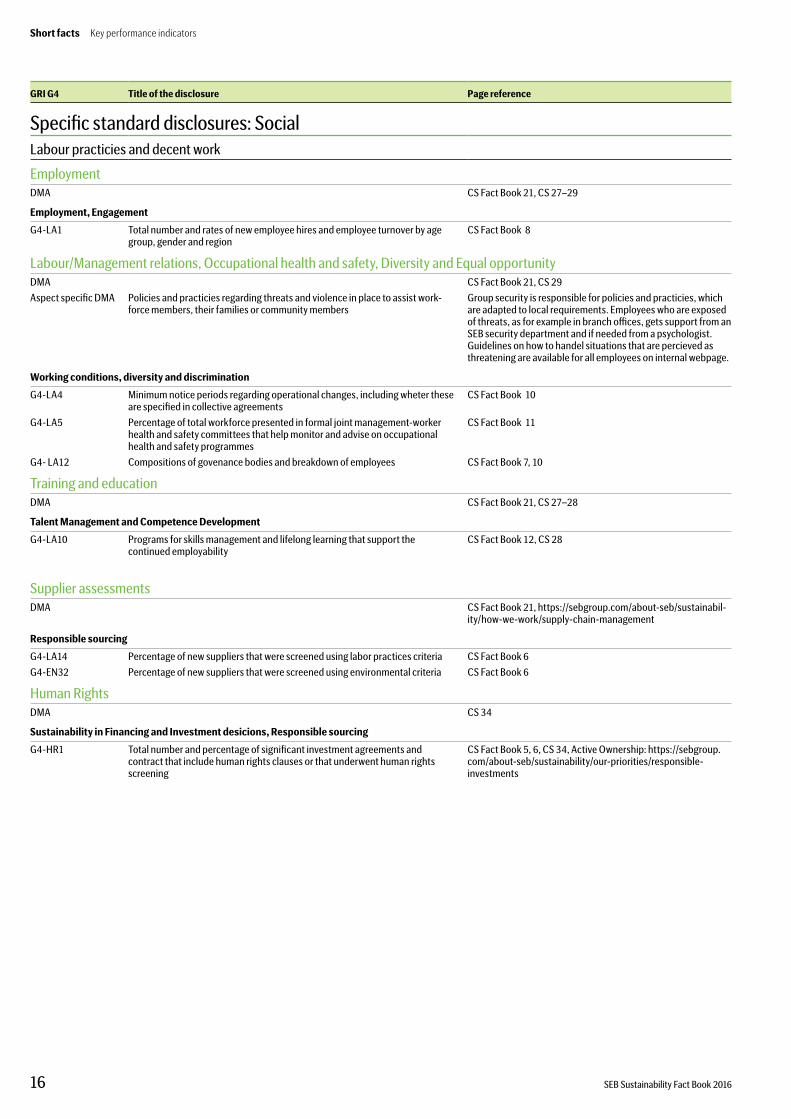
Specific standard disclosures: SocialLabour practicies and decent work
EmploymentDMA CS Fact Book 21, CS 27–29
Employment, Engagement
G4-LA1 Total number and rates of new employee hires and employee turnover by age group, gender and region
CS Fact Book 8
Labour/Management relations, Occupational health and safety, Diversity and Equal opportunityDMA CS Fact Book 21, CS 29
Aspect specific DMA Policies and practicies regarding threats and violence in place to assist work-force members, their families or community members
Group security is responsible for policies and practicies, which are adapted to local requirements. Employees who are exposed of threats, as for example in branch offices, gets support from an SEB security department and if needed from a psychologist. Guidelines on how to handel situations that are percieved as threatening are available for all employees on internal webpage.
Working conditions, diversity and discrimination
G4-LA4 Minimum notice periods regarding operational changes, including wheter these are specified in collective agreements
CS Fact Book 10
G4-LA5 Percentage of total workforce presented in formal joint management-worker health and safety committees that help monitor and advise on occupational health and safety programmes
CS Fact Book 11
G4- LA12 Compositions of govenance bodies and breakdown of employees CS Fact Book 7, 10
Training and educationDMA CS Fact Book 21, CS 27–28
Talent Management and Competence Development
G4-LA10 Programs for skills management and lifelong learning that support the continued employability
CS Fact Book 12, CS 28
Supplier assessments DMA CS Fact Book 21, https://sebgroup.com/about-seb/sustainabil-
ity/how-we-work/supply-chain-management
Responsible sourcing
G4-LA14 Percentage of new suppliers that were screened using labor practices criteria CS Fact Book 6
G4-EN32 Percentage of new suppliers that were screened using environmental criteria CS Fact Book 6
Human Rights DMA CS 34
Sustainability in Financing and Investment desicions, Responsible sourcing
G4-HR1 Total number and percentage of significant investment agreements and contract that include human rights clauses or that underwent human rights screening
CS Fact Book 5, 6, CS 34, Active Ownership: https://sebgroup.com/about-seb/sustainability/our-priorities/responsible-investments
16 SEB Sustainability Fact Book 2016
Short facts Key performance indicators
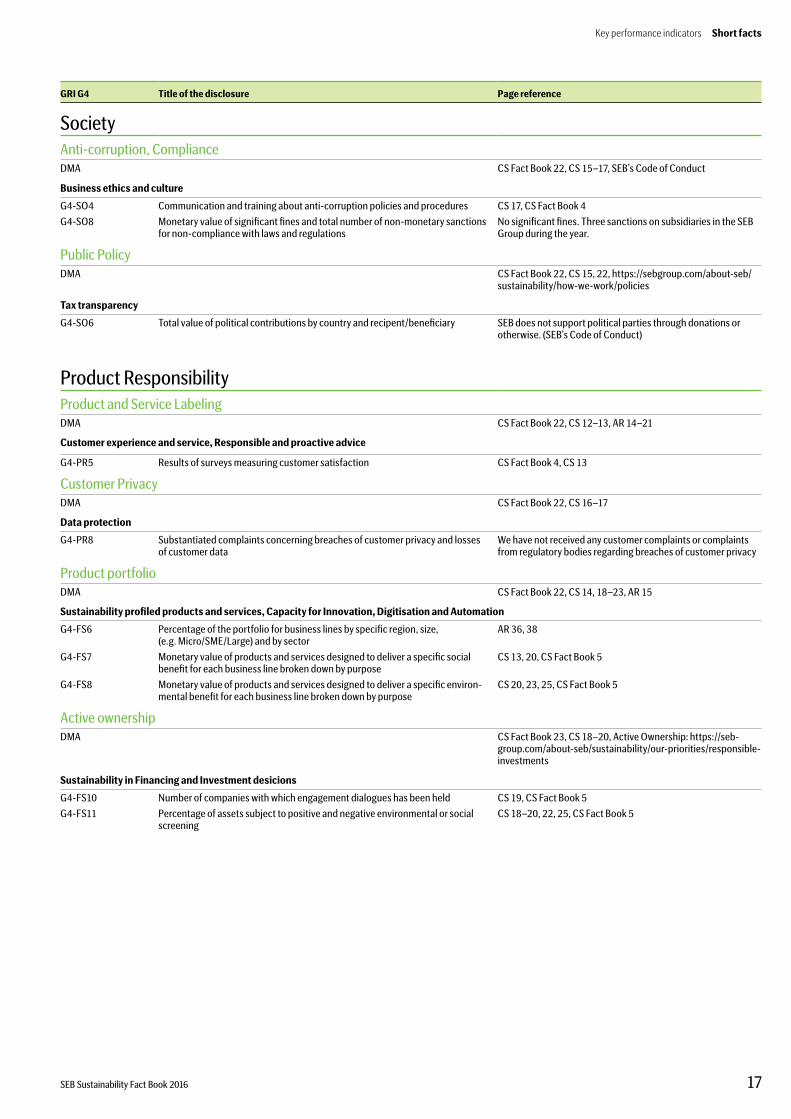
GRI G4 Title of the disclosure Page reference
SocietyAnti-corruption, ComplianceDMA CS Fact Book 22, CS 15–17, SEB’s Code of Conduct
Business ethics and culture
G4-SO4 Communication and training about anti-corruption policies and procedures CS 17, CS Fact Book 4
G4-SO8 Monetary value of significant fines and total number of non-monetary sanctions for non-compliance with laws and regulations
No significant fines. Three sanctions on subsidiaries in the SEB Group during the year.
Public PolicyDMA CS Fact Book 22, CS 15, 22, https://sebgroup.com/about-seb/
sustainability/how-we-work/policies
Tax transparency
G4-SO6 Total value of political contributions by country and recipent/beneficiary SEB does not support political parties through donations or otherwise. (SEB’s Code of Conduct)
Product ResponsibilityProduct and Service LabelingDMA CS Fact Book 22, CS 12–13, AR 14–21
Customer experience and service, Responsible and proactive advice
G4-PR5 Results of surveys measuring customer satisfaction CS Fact Book 4, CS 13
Customer PrivacyDMA CS Fact Book 22, CS 16–17
Data protection
G4-PR8 Substantiated complaints concerning breaches of customer privacy and losses of customer data
We have not received any customer complaints or complaints from regulatory bodies regarding breaches of customer privacy
Product portfolioDMA CS Fact Book 22, CS 14, 18–23, AR 15
Sustainability profiled products and services, Capacity for Innovation, Digitisation and Automation
G4-FS6 Percentage of the portfolio for business lines by specific region, size, (e.g. Micro/SME/Large) and by sector
AR 36, 38
G4-FS7 Monetary value of products and services designed to deliver a specific social benefit for each business line broken down by purpose
CS 13, 20, CS Fact Book 5
G4-FS8 Monetary value of products and services designed to deliver a specific environ-mental benefit for each business line broken down by purpose
CS 20, 23, 25, CS Fact Book 5
Active ownershipDMA CS Fact Book 23, CS 18–20, Active Ownership: https://seb-
group.com/about-seb/sustainability/our-priorities/responsible-investments
Sustainability in Financing and Investment desicions
G4-FS10 Number of companies with which engagement dialogues has been held CS 19, CS Fact Book 5
G4-FS11 Percentage of assets subject to positive and negative environmental or social screening
CS 18–20, 22, 25, CS Fact Book 5
Key performance indicators Short facts
17SEB Sustainability Fact Book 2016
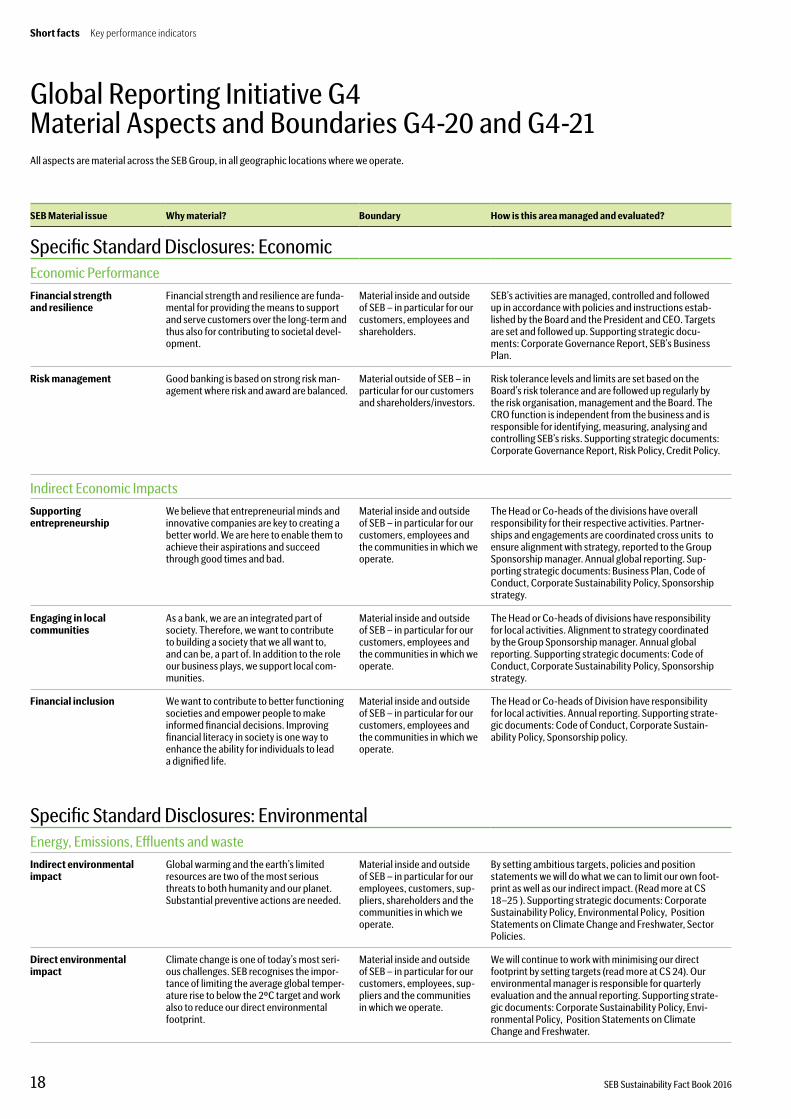
Global Reporting Initiative G4 Material Aspects and Boundaries G4-20 and G4-21All aspects are material across the SEB Group, in all geographic locations where we operate.
SEB Material issue Why material? Boundary How is this area managed and evaluated?
Specific Standard Disclosures: EconomicEconomic PerformanceFinancial strength and resilience
Financial strength and resilience are funda-mental for providing the means to support and serve customers over the long-term and thus also for contributing to societal devel-opment.
Material inside and outside of SEB – in particular for our customers, employees and shareholders.
SEB’s activities are managed, controlled and followed up in accordance with policies and instructions estab-lished by the Board and the President and CEO. Targets are set and followed up. Supporting strategic docu-ments: Corporate Governance Report, SEB's Business Plan.
Risk management Good banking is based on strong risk man-agement where risk and award are balanced.
Material outside of SEB – in particular for our customers and shareholders/investors.
Risk tolerance levels and limits are set based on the Board’s risk tolerance and are followed up regularly by the risk organisation, management and the Board. The CRO function is independent from the business and is responsible for identifying, measuring, analysing and controlling SEB’s risks. Supporting strategic documents: Corporate Governance Report, Risk Policy, Credit Policy.
Indirect Economic ImpactsSupporting entrepreneurship
We believe that entrepreneurial minds and innovative companies are key to creating a better world. We are here to enable them to achieve their aspirations and succeed through good times and bad.
Material inside and outside of SEB – in particular for our customers, employees and the communities in which we operate.
The Head or Co-heads of the divisions have overall responsibility for their respective activities. Partner-ships and engagements are coordinated cross units to ensure alignment with strategy, reported to the Group Sponsorship manager. Annual global reporting. Sup-porting strategic documents: Business Plan, Code of Conduct, Corporate Sustainability Policy, Sponsorship strategy.
Engaging in local communities
As a bank, we are an integrated part of society. Therefore, we want to contribute to building a society that we all want to, and can be, a part of. In addition to the role our business plays, we support local com-munities.
Material inside and outside of SEB – in particular for our customers, employees and the communities in which we operate.
The Head or Co-heads of divisions have responsibility for local activities. Alignment to strategy coordinated by the Group Sponsorship manager. Annual global reporting. Supporting strategic documents: Code of Conduct, Corporate Sustainability Policy, Sponsorship strategy.
Financial inclusion We want to contribute to better functioning societies and empower people to make informed financial decisions. Improving financial literacy in society is one way to enhance the ability for individuals to lead a dignified life.
Material inside and outside of SEB – in particular for our customers, employees and the communities in which we operate.
The Head or Co-heads of Division have responsibility for local activities. Annual reporting. Supporting strate-gic documents: Code of Conduct, Corporate Sustain-ability Policy, Sponsorship policy.
Specific Standard Disclosures: EnvironmentalEnergy, Emissions, Effluents and wasteIndirect environmental impact
Global warming and the earth’s limited resources are two of the most serious threats to both humanity and our planet. Substantial preventive actions are needed.
Material inside and outside of SEB – in particular for our employees, customers, sup-pliers, shareholders and the communities in which we operate.
By setting ambitious targets, policies and position statements we will do what we can to limit our own foot-print as well as our indirect impact. (Read more at CS 18–25 ). Supporting strategic documents: Corporate Sustainability Policy, Environmental Policy, Position Statements on Climate Change and Freshwater, Sector Policies.
Direct environmental impact
Climate change is one of today’s most seri-ous challenges. SEB recognises the impor-tance of limiting the average global temper-ature rise to below the 2⁰C target and work also to reduce our direct environmental footprint.
Material inside and outside of SEB – in particular for our customers, employees, sup-pliers and the communities in which we operate.
We will continue to work with minimising our direct footprint by setting targets (read more at CS 24). Our environmental manager is responsible for quarterly evaluation and the annual reporting. Supporting strate-gic documents: Corporate Sustainability Policy, Envi-ronmental Policy, Position Statements on Climate Change and Freshwater.
18 SEB Sustainability Fact Book 2016
Short facts Key performance indicators
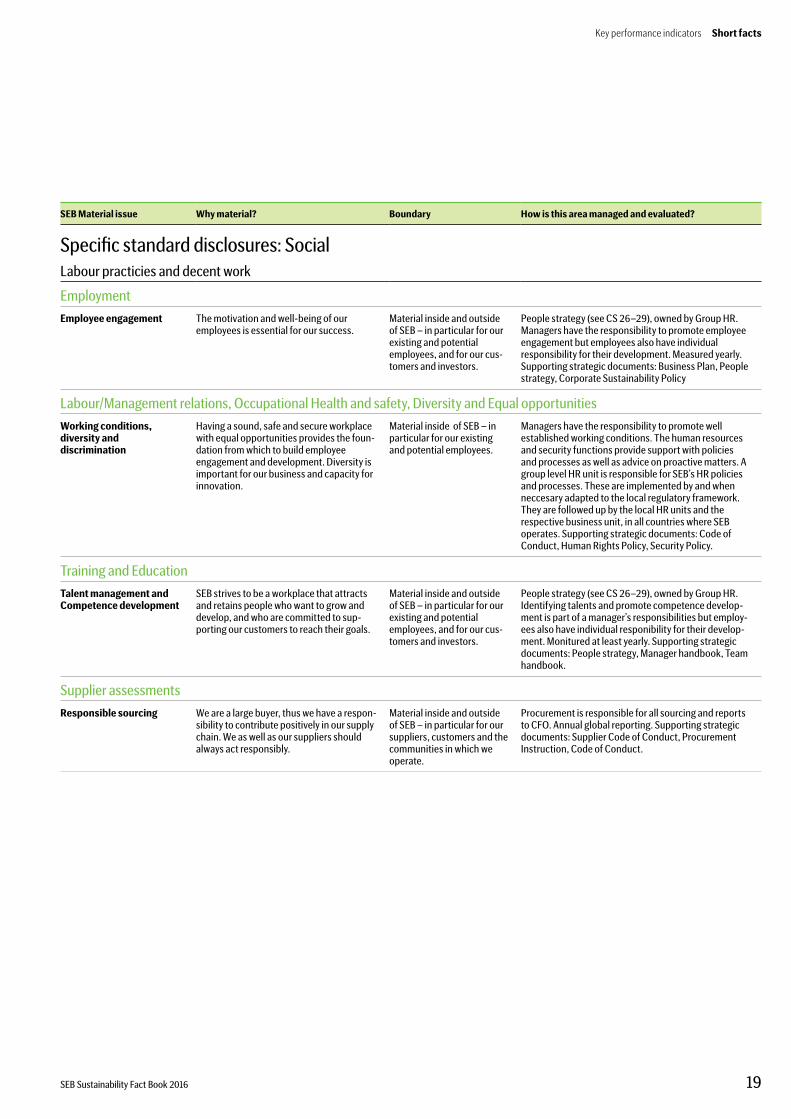
SEB Material issue Why material? Boundary How is this area managed and evaluated?
Specific standard disclosures: SocialLabour practicies and decent work
EmploymentEmployee engagement The motivation and well-being of our
employees is essential for our success. Material inside and outside of SEB – in particular for our existing and potential employees, and for our cus-tomers and investors.
People strategy (see CS 26–29), owned by Group HR. Managers have the responsibility to promote employee engagement but employees also have individual responsibility for their development. Measured yearly. Supporting strategic documents: Business Plan, People strategy, Corporate Sustainability Policy
Labour/Management relations, Occupational Health and safety, Diversity and Equal opportunitiesWorking conditions, diversity and discrimination
Having a sound, safe and secure workplace with equal opportunities provides the foun-dation from which to build employee engagement and development. Diversity is important for our business and capacity for innovation.
Material inside of SEB – in particular for our existing and potential employees.
Managers have the responsibility to promote well established working conditions. The human resources and security functions provide support with policies and processes as well as advice on proactive matters. A group level HR unit is responsible for SEB’s HR policies and processes. These are implemented by and when neccesary adapted to the local regulatory framework. They are followed up by the local HR units and the respective business unit, in all countries where SEB operates. Supporting strategic documents: Code of Conduct, Human Rights Policy, Security Policy.
Training and EducationTalent management and Competence development
SEB strives to be a workplace that attracts and retains people who want to grow anddevelop, and who are committed to sup-porting our customers to reach their goals.
Material inside and outside of SEB – in particular for our existing and potential employees, and for our cus-tomers and investors.
People strategy (see CS 26–29), owned by Group HR. Identifying talents and promote competence develop-ment is part of a manager’s responsibilities but employ-ees also have individual responibility for their develop-ment. Monitured at least yearly. Supporting strategic documents: People strategy, Manager handbook, Team handbook.
Supplier assessmentsResponsible sourcing We are a large buyer, thus we have a respon-
sibility to contribute positively in our supply chain. We as well as our suppliers should always act responsibly.
Material inside and outside of SEB – in particular for our suppliers, customers and the communities in which we operate.
Procurement is responsible for all sourcing and reports to CFO. Annual global reporting. Supporting strategic documents: Supplier Code of Conduct, Procurement Instruction, Code of Conduct.
Key performance indicators Short facts
19SEB Sustainability Fact Book 2016
SEB Material issue Why material? Boundary How is this area managed and evaluated?
Society
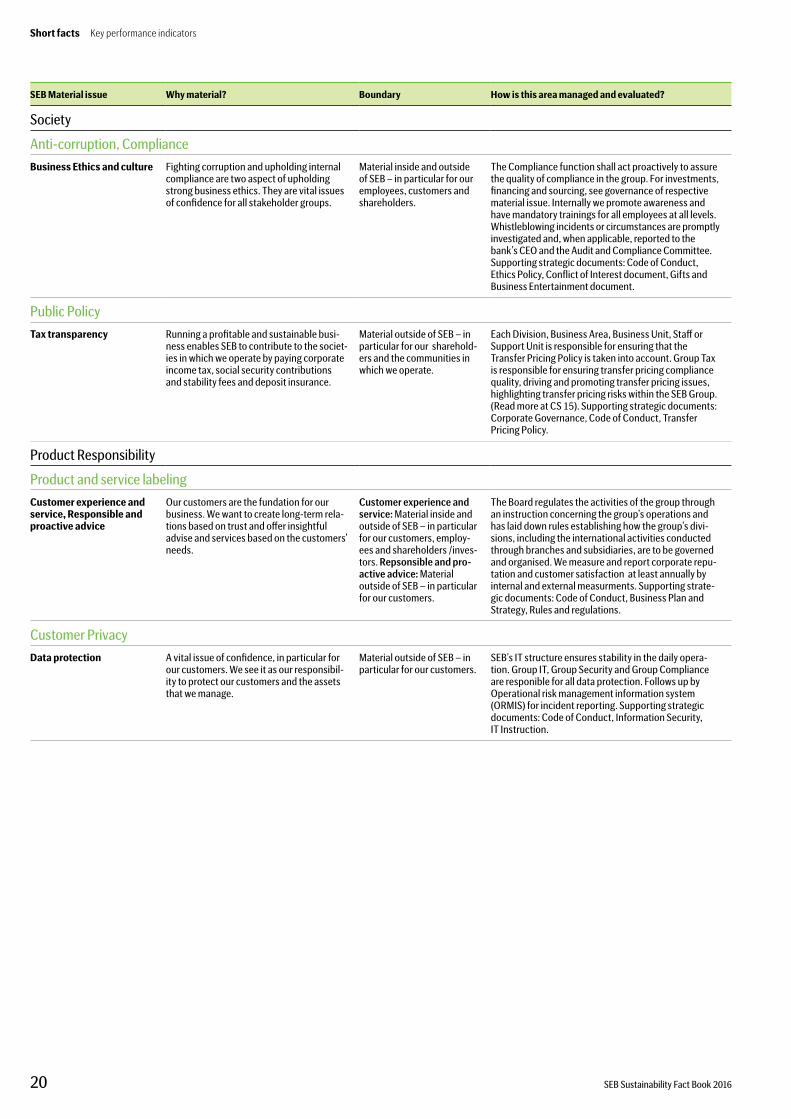
Anti-corruption, ComplianceBusiness Ethics and culture Fighting corruption and upholding internal
compliance are two aspect of upholding strong business ethics. They are vital issues of confidence for all stakeholder groups.
Material inside and outside of SEB – in particular for our employees, customers and shareholders.
The Compliance function shall act proactively to assure the quality of compliance in the group. For investments, financing and sourcing, see governance of respective material issue. Internally we promote awareness and have mandatory trainings for all employees at all levels. Whistleblowing incidents or circumstances are promptly investigated and, when applicable, reported to the bank’s CEO and the Audit and Compliance Committee. Supporting strategic documents: Code of Conduct, Ethics Policy, Conflict of Interest document, Gifts and Business Entertainment document.
Public PolicyTax transparency Running a profitable and sustainable busi-
ness enables SEB to contribute to the societ-ies in which we operate by paying corporate income tax, social security contributions and stability fees and deposit insurance.
Material outside of SEB – in particular for our sharehold-ers and the communities in which we operate.
Each Division, Business Area, Business Unit, Staff or Support Unit is responsible for ensuring that the Transfer Pricing Policy is taken into account. Group Tax is responsible for ensuring transfer pricing compliance quality, driving and promoting transfer pricing issues, highlighting transfer pricing risks within the SEB Group. (Read more at CS 15). Supporting strategic documents: Corporate Governance, Code of Conduct, Transfer Pricing Policy.
Product Responsibility
Product and service labelingCustomer experience and service, Responsible and proactive advice
Our customers are the fundation for our business. We want to create long-term rela-tions based on trust and offer insightful advise and services based on the customers’ needs.
Customer experience and service: Material inside and outside of SEB – in particular for our customers, employ-ees and shareholders /inves-tors. Repsonsible and pro-active advice: Material outside of SEB – in particular for our customers.
The Board regulates the activities of the group through an instruction concerning the group’s operations and has laid down rules establishing how the group’s divi-sions, including the international activities conducted through branches and subsidiaries, are to be governed and organised. We measure and report corporate repu-tation and customer satisfaction at least annually by internal and external measurments. Supporting strate-gic documents: Code of Conduct, Business Plan and Strategy, Rules and regulations.
Customer PrivacyData protection A vital issue of confidence, in particular for
our customers. We see it as our responsibil-ity to protect our customers and the assets that we manage.
Material outside of SEB – in particular for our customers.
SEB’s IT structure ensures stability in the daily opera-tion. Group IT, Group Security and Group Compliance are responible for all data protection. Follows up by Operational risk management information system (ORMIS) for incident reporting. Supporting strategic documents: Code of Conduct, Information Security, IT Instruction.
20 SEB Sustainability Fact Book 2016
Short facts Key performance indicators
SEB Material issue Why material? Boundary How is this area managed and evaluated?
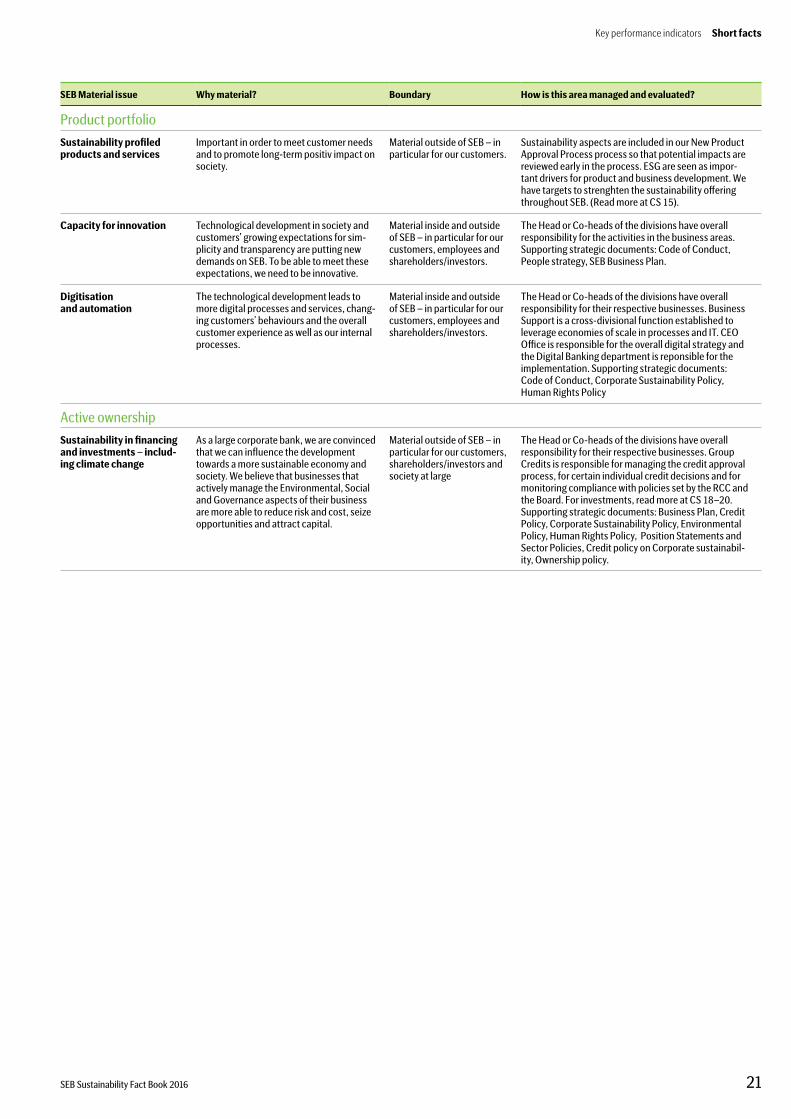
Product portfolioSustainability profiled products and services
Important in order to meet customer needs and to promote long-term positiv impact on society.
Material outside of SEB – in particular for our customers.
Sustainability aspects are included in our New Product Approval Process process so that potential impacts are reviewed early in the process. ESG are seen as impor-tant drivers for product and business development. We have targets to strenghten the sustainability offering throughout SEB. (Read more at CS 15).
Capacity for innovation Technological development in society and customers’ growing expectations for sim-plicity and transparency are putting new demands on SEB. To be able to meet these expectations, we need to be innovative.
Material inside and outside of SEB – in particular for our customers, employees and shareholders/investors.
The Head or Co-heads of the divisions have overall responsibility for the activities in the business areas. Supporting strategic documents: Code of Conduct, People strategy, SEB Business Plan.
Digitisation and automation
The technological development leads to more digital processes and services, chang-ing customers’ behaviours and the overall customer experience as well as our internal processes.
Material inside and outside of SEB – in particular for our customers, employees and shareholders/investors.
The Head or Co-heads of the divisions have overall responsibility for their respective businesses. Business Support is a cross-divisional function established to leverage economies of scale in processes and IT. CEO Office is responsible for the overall digital strategy and the Digital Banking department is reponsible for the implementation. Supporting strategic documents: Code of Conduct, Corporate Sustainability Policy, Human Rights Policy
Active ownershipSustainability in financing and investments – includ-ing climate change
As a large corporate bank, we are convinced that we can influence the development towards a more sustainable economy and society. We believe that businesses that actively manage the Environmental, Social and Governance aspects of their business are more able to reduce risk and cost, seize opportunities and attract capital.
Material outside of SEB – in particular for our customers, shareholders/investors and society at large
The Head or Co-heads of the divisions have overall responsibility for their respective businesses. Group Credits is responsible for managing the credit approval process, for certain individual credit decisions and for monitoring compliance with policies set by the RCC and the Board. For investments, read more at CS 18–20. Supporting strategic documents: Business Plan, Credit Policy, Corporate Sustainability Policy, Environmental Policy, Human Rights Policy, Position Statements and Sector Policies, Credit policy on Corporate sustainabil-ity, Ownership policy.
Key performance indicators Short facts
21SEB Sustainability Fact Book 2016