Embed Size (px)
Citation preview
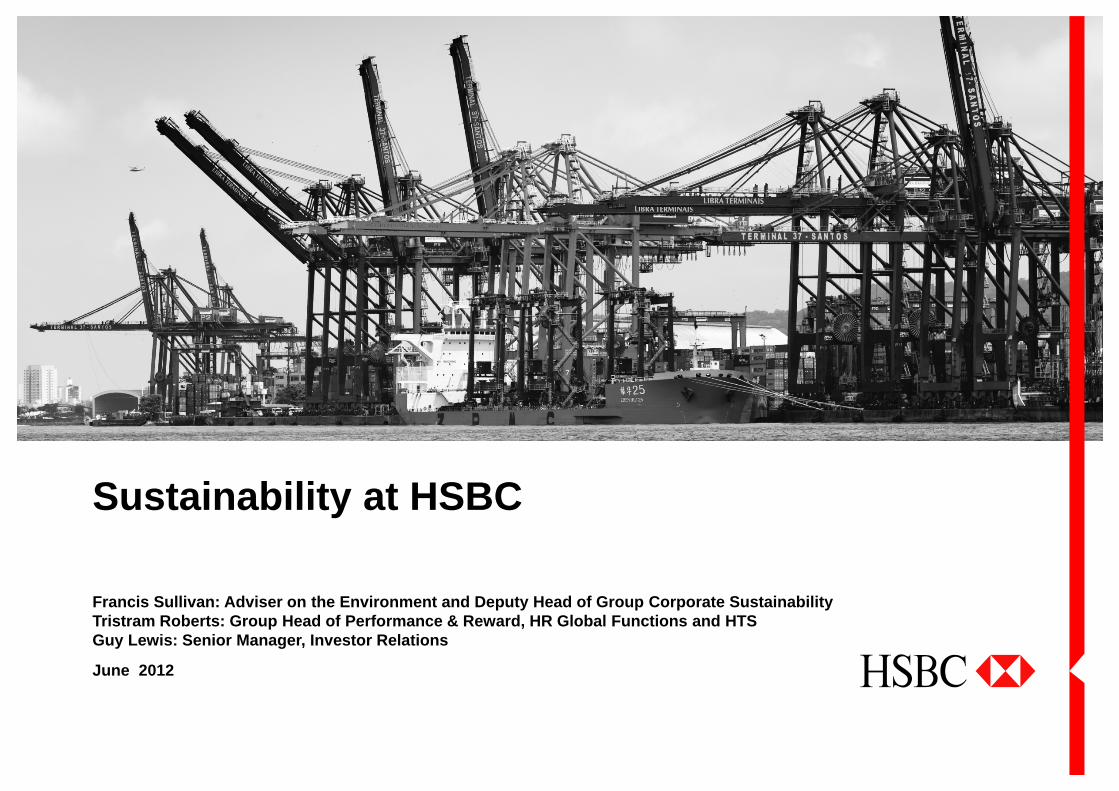
Sustainability at HSBC
June 2012
Francis Sullivan: Adviser on the Environment and Deputy Head of Group Corporate SustainabilityTristram Roberts: Group Head of Performance & Reward, HR Global Functions and HTSGuy Lewis: Senior Manager, Investor Relations
Forward-looking statements
This presentation and subsequent discussion may contain certain forward-looking statements with respect to the financial condition, results of operations and business of the Group. These forward-looking statements represent the Group’s expectations or beliefs concerning future events and involve known and unknown risks and uncertainty that could cause actual results, performance or events to differ materially from those expressed or implied in such statements. Additional detailed information concerning important factors that could cause actual results to differ materially is available in our Annual Report and Accounts 2011 and Interim Management Statement issued on 08 May 2012. Past performance cannot be relied on as a guide to future performance.This presentation contains non-GAAP financial information. Reconciliation of non-GAAP financial information to the most directly comparable measures under GAAP are provided in the ‘Reconciliation of reported and underlying profit before tax’ supplement available at www.hsbc.com.
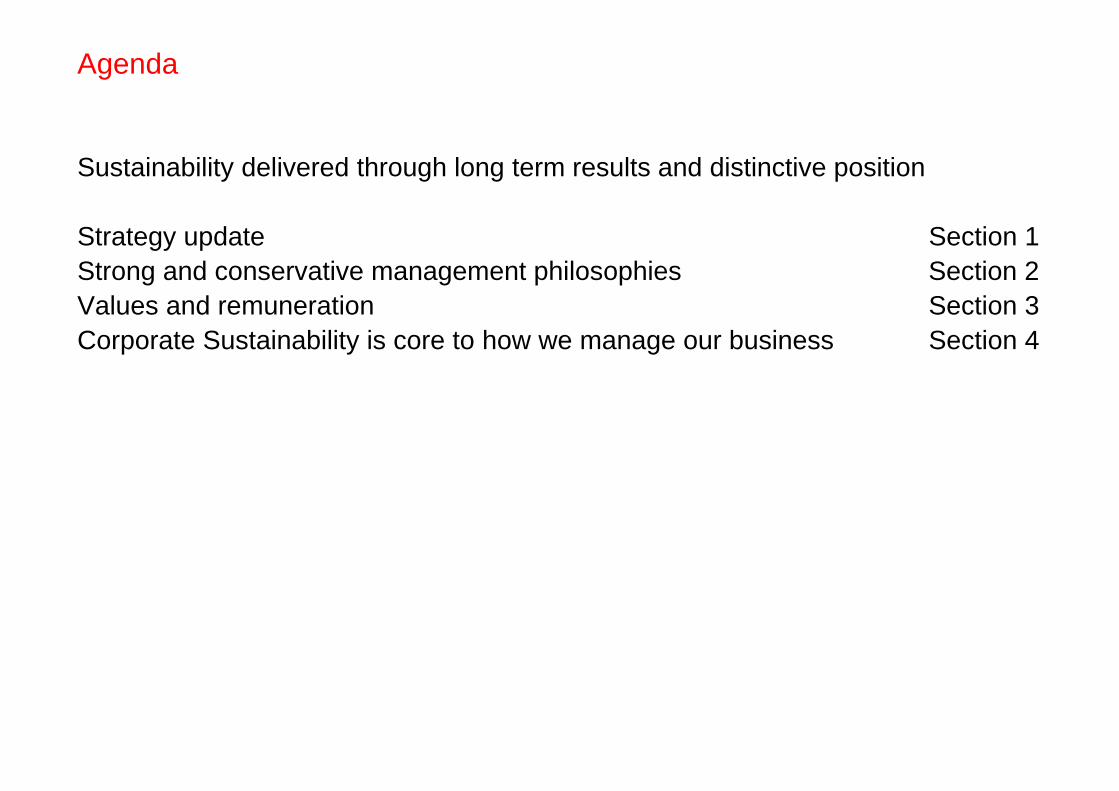
Agenda
Sustainability delivered through long term results and distinctive position
Strategy update Section 1Strong and conservative management philosophies Section 2Values and remuneration Section 3Corporate Sustainability is core to how we manage our business Section 4
‘The overriding accountability of the Group Management Board, led by the Group Chief Executive is to deliver sustainable long term value for shareholders through consistent performance delivery and safe and compliant execution of the Group’s business in a manner that, at the same time, maintains the confidence of all other key stakeholders in the business including depositors, counterparties, long term creditors, customers, regulators, employees and governments.’

Strategy update
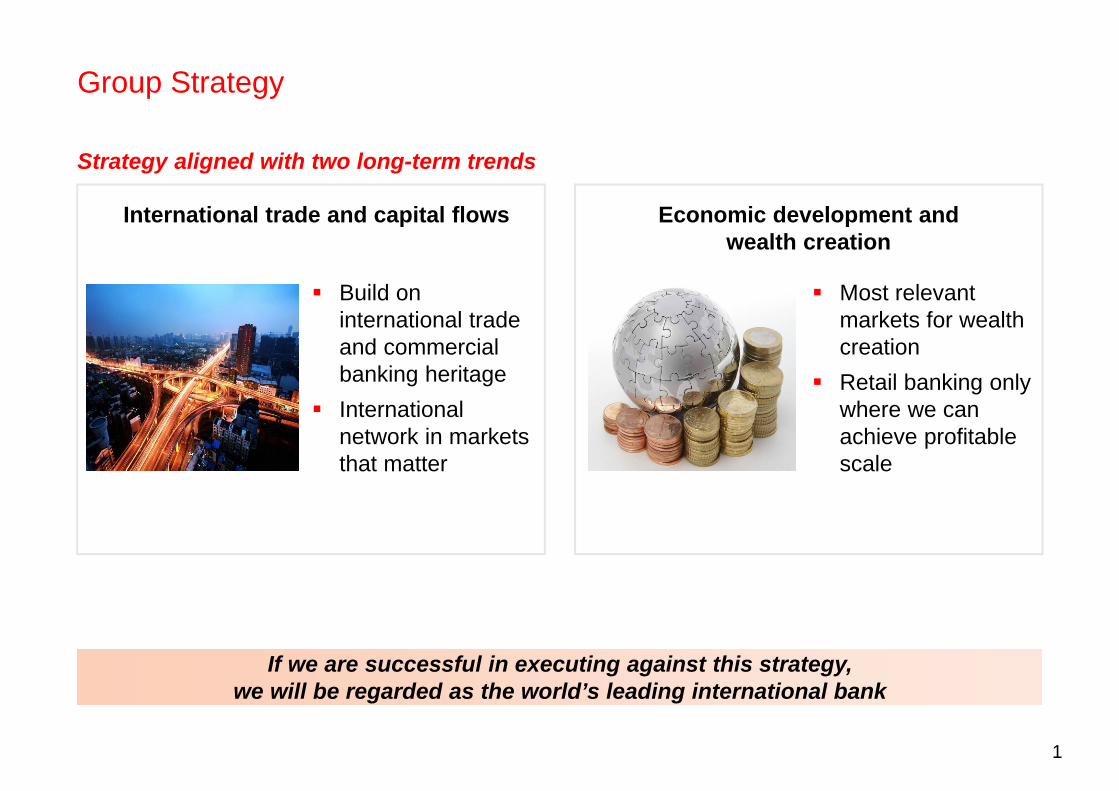
If we are successful in executing against this strategy, we will be regarded as the world’s leading international bank
International trade and capital flows
Build on international trade and commercial banking heritage
International network in markets that matter
Strategy aligned with two long-term trends
Economic development and wealth creation
Most relevant markets for wealth creation
Retail banking only where we can achieve profitable scale
Group Strategy
1
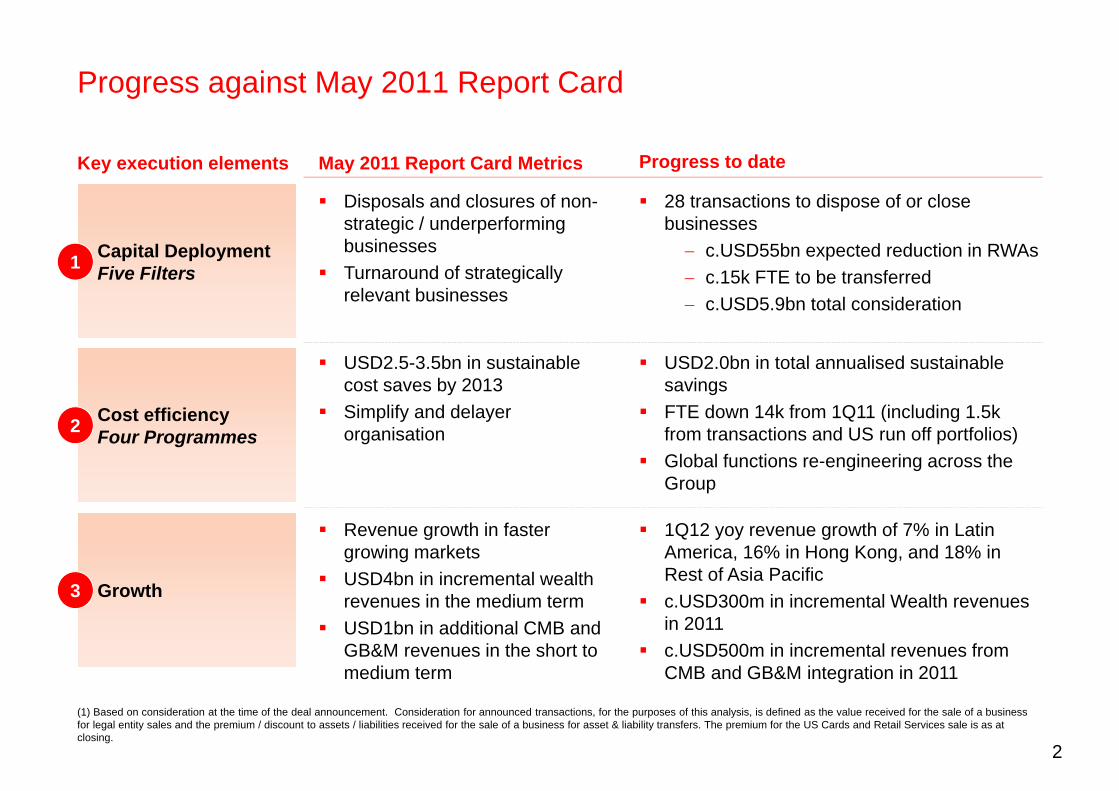
Progress against May 2011 Report Card
Key execution elements
Capital DeploymentFive Filters
Cost efficiencyFour Programmes
Growth
May 2011 Report Card Metrics
Disposals and closures of non-strategic / underperforming businesses
Turnaround of strategically relevant businesses
USD2.5-3.5bn in sustainable cost saves by 2013
Simplify and delayer organisation
Revenue growth in faster growing markets
USD4bn in incremental wealth revenues in the medium term
USD1bn in additional CMB and GB&M revenues in the short to medium term
Progress to date
28 transactions to dispose of or close businesses
c.USD55bn expected reduction in RWAs c.15k FTE to be transferred c.USD5.9bn total consideration
USD2.0bn in total annualised sustainable savings
FTE down 14k from 1Q11 (including 1.5k from transactions and US run off portfolios)
Global functions re-engineering across the Group
1Q12 yoy revenue growth of 7% in Latin America, 16% in Hong Kong, and 18% in Rest of Asia Pacific
c.USD300m in incremental Wealth revenues in 2011
c.USD500m in incremental revenues from CMB and GB&M integration in 2011
1
2
3
2
(1) Based on consideration at the time of the deal announcement. Consideration for announced transactions, for the purposes of this analysis, is defined as the value received for the sale of a business for legal entity sales and the premium / discount to assets / liabilities received for the sale of a business for asset & liability transfers. The premium for the US Cards and Retail Services sale is as at closing.
Purpose
Values
Strategy
Outcome
Reason why we exist
We enable businesses to thrive and economies to prosper, helping people fulfil their hopes and dreams and realise their ambitions
How we behave and conduct business
Act with courageous integrity Dependable and do the right thing Open to different ideas and cultures Connected to customers, regulators and each other
Where and how we compete
International network connecting faster growing and developed markets Develop Wealth and invest in Retail only in markets
where we can achieve profitable scale
Delivering consistent returns: 50% of earnings retained 35% to shareholders as dividends 15% variable pay
Being the world’s leading international Bank
HSBC Vision
3
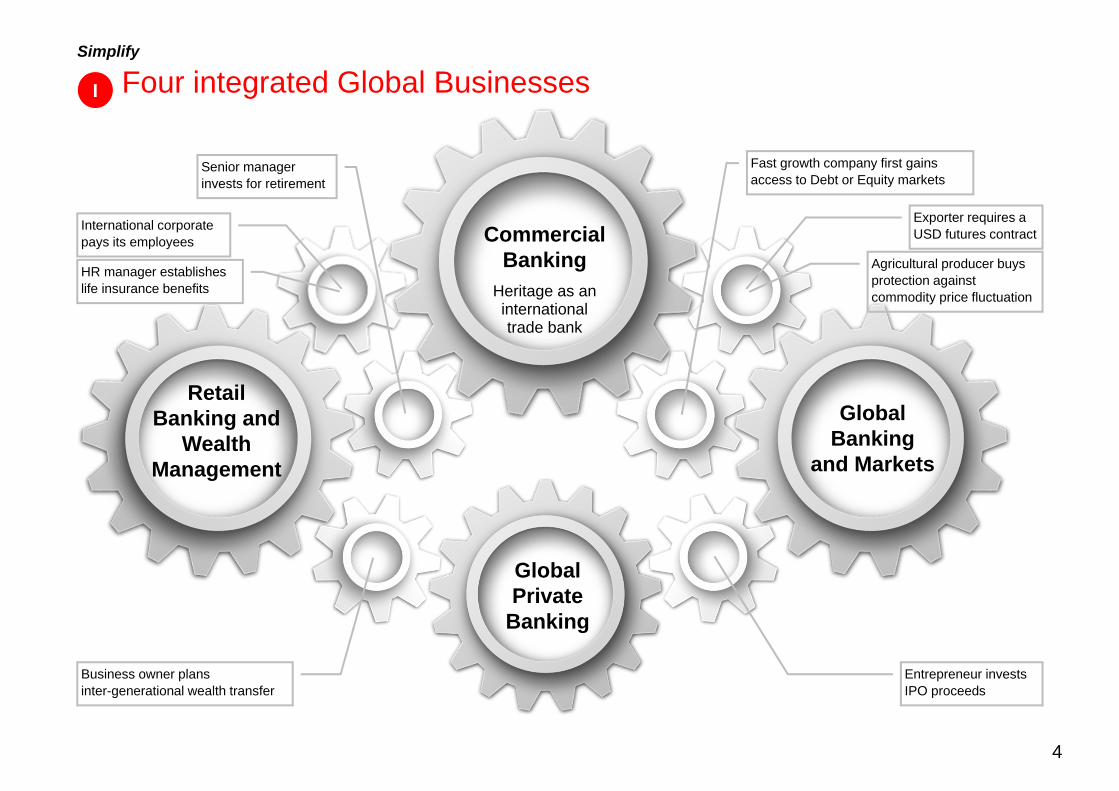
Simplify
Four integrated Global Businesses
Entrepreneur invests IPO proceeds
RetailBanking and
Wealth Management
Commercial Banking
Heritage as an international trade bank
Global Private
Banking
Global Banking
and Markets
Fast growth company first gains access to Debt or Equity markets
Exporter requires a USD futures contract
Agricultural producer buys protection against commodity price fluctuation
Business owner plans inter-generational wealth transfer
Senior manager invests for retirement
International corporate pays its employees
HR manager establishes life insurance benefits
I
4
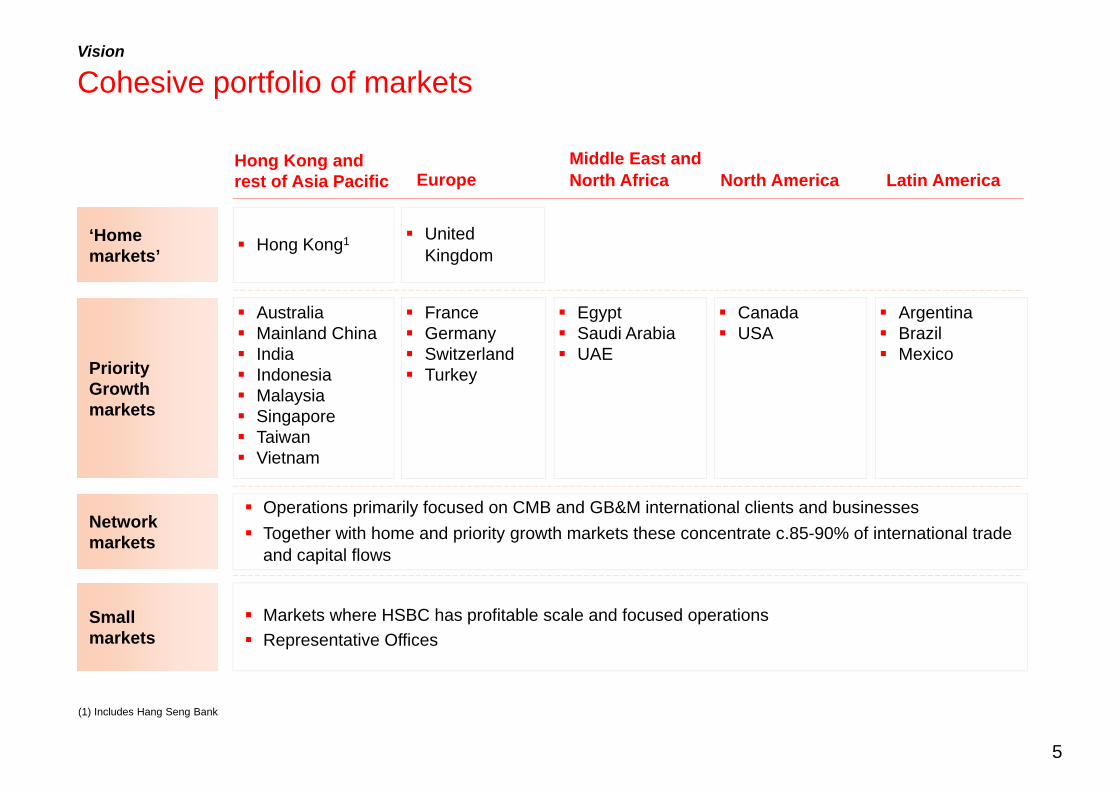
Network markets
Smallmarkets
‘Homemarkets’
PriorityGrowthmarkets
Hong Kong and rest of Asia Pacific
Operations primarily focused on CMB and GB&M international clients and businesses Together with home and priority growth markets these concentrate c.85-90% of international trade
and capital flows
Markets where HSBC has profitable scale and focused operations Representative Offices
North America Latin America
Hong Kong1
Middle East and North AfricaEurope
United Kingdom
Egypt Saudi Arabia UAE
France Germany Switzerland Turkey
Canada USA
Australia Mainland China India Indonesia Malaysia Singapore Taiwan Vietnam
Argentina Brazil Mexico
Vision
(1) Includes Hang Seng Bank
Cohesive portfolio of markets
5
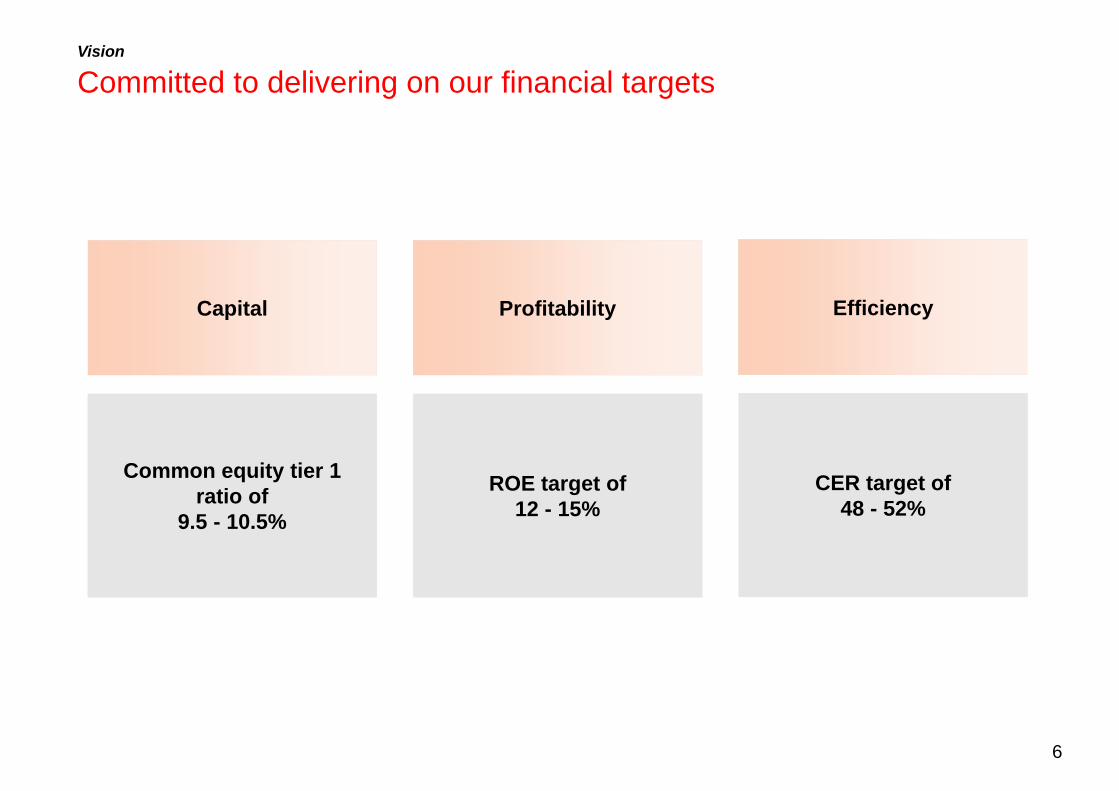
Committed to delivering on our financial targets
Capital
Common equity tier 1 ratio of
9.5 - 10.5%
Efficiency
CER target of 48 - 52%
Profitability
ROE target of 12 - 15%
Vision
6
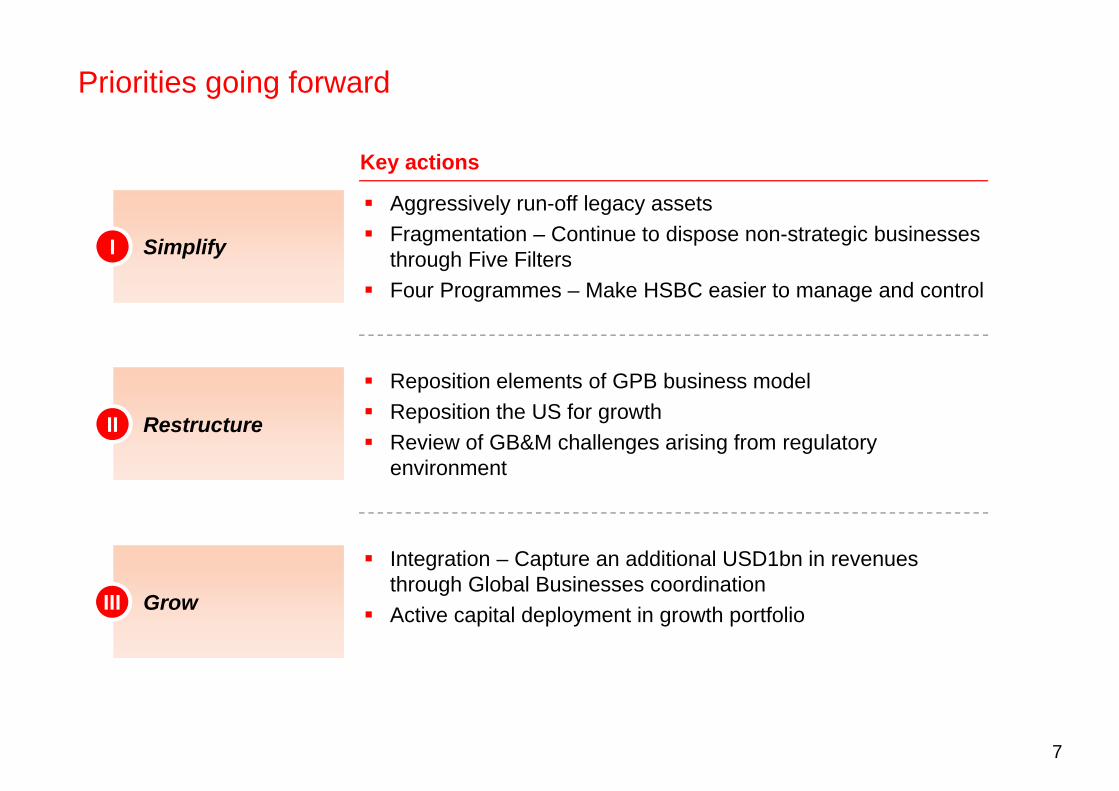
Priorities going forward
Key actions
SimplifyI
Aggressively run-off legacy assets Fragmentation – Continue to dispose non-strategic businesses
through Five Filters Four Programmes – Make HSBC easier to manage and control
Integration – Capture an additional USD1bn in revenues through Global Businesses coordination
Active capital deployment in growth portfolioGrowIII
RestructureII
Reposition elements of GPB business model Reposition the US for growth Review of GB&M challenges arising from regulatory
environment
7
Group FTE000’s
Ten global functions (e.g. HR, Finance, Marketing) to manage resources globally
Easier to enforce global controls so that every geography meets the highest standard
Target business and operating models being implemented across global businesses
As we dispose and close non-strategic businesses, we are able to organise resources at the centre
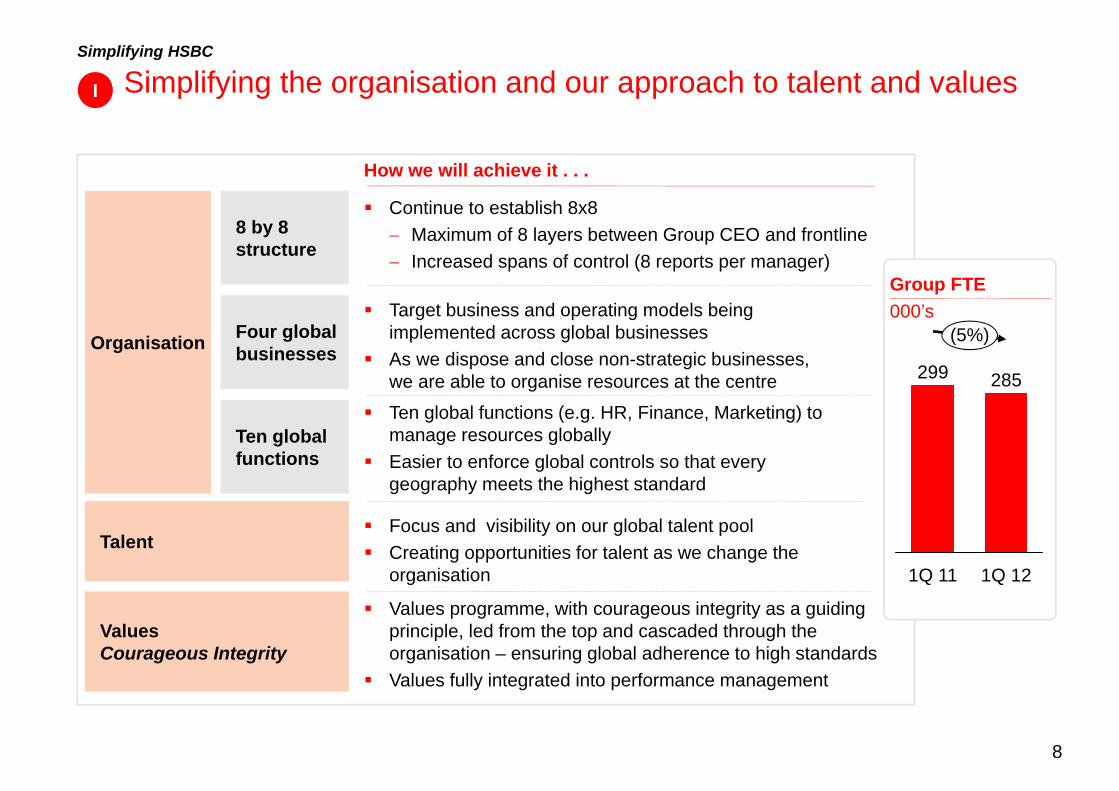
Simplifying the organisation and our approach to talent and values
How we will achieve it . . .
Continue to establish 8x8 Maximum of 8 layers between Group CEO and frontline Increased spans of control (8 reports per manager)
Focus and visibility on our global talent pool Creating opportunities for talent as we change the
organisation
Values programme, with courageous integrity as a guiding principle, led from the top and cascaded through the organisation – ensuring global adherence to high standards
Values fully integrated into performance management
Four global businesses
8 by 8 structure
ValuesCourageous Integrity
Ten global functions
Organisation
I
(5%)
1Q 12
285
1Q 11
299
Talent
Simplifying HSBC
8
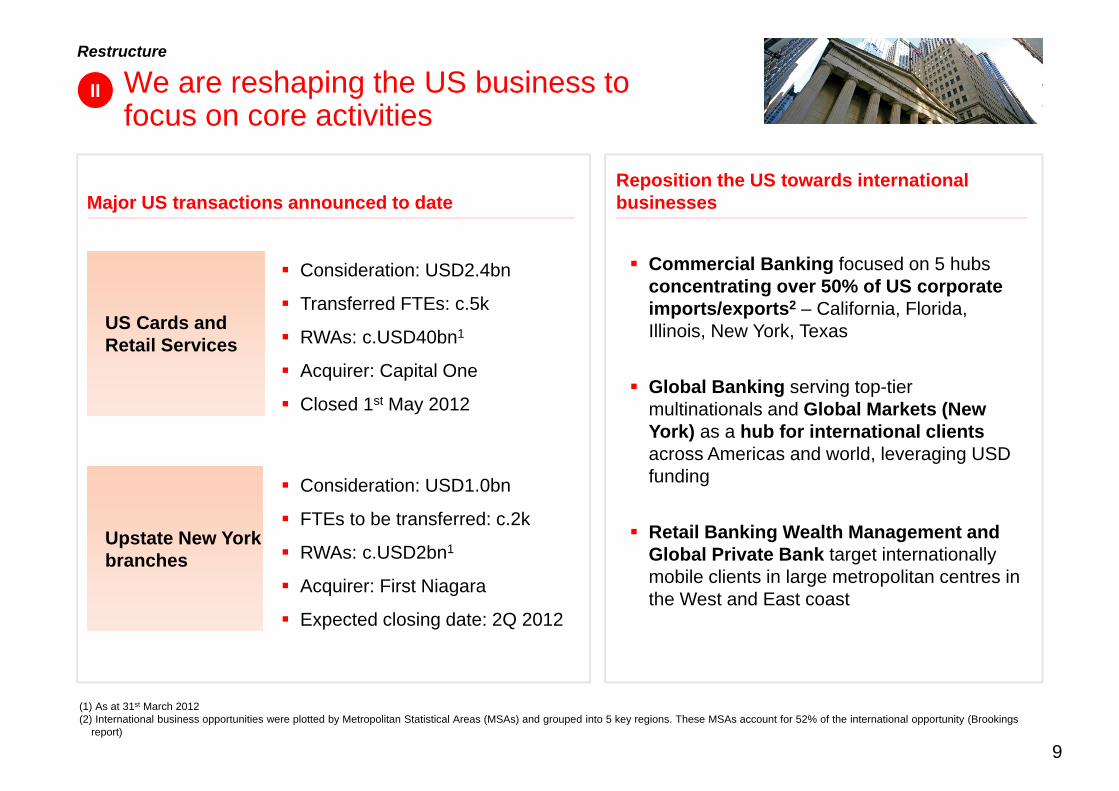
We are reshaping the US business to focus on core activities
II
Major US transactions announced to date
Consideration: USD2.4bn
Transferred FTEs: c.5k
RWAs: c.USD40bn1
Acquirer: Capital One
Closed 1st May 2012
Consideration: USD1.0bn
FTEs to be transferred: c.2k
RWAs: c.USD2bn1
Acquirer: First Niagara
Expected closing date: 2Q 2012
Reposition the US towards international businesses
Commercial Banking focused on 5 hubs concentrating over 50% of US corporate imports/exports2 – California, Florida, Illinois, New York, Texas
Global Banking serving top-tier multinationals and Global Markets (New York) as a hub for international clientsacross Americas and world, leveraging USD funding
Retail Banking Wealth Management and Global Private Bank target internationally mobile clients in large metropolitan centres in the West and East coast
US Cards and Retail Services
Upstate New York branches
Restructure
(1) As at 31st March 2012(2) International business opportunities were plotted by Metropolitan Statistical Areas (MSAs) and grouped into 5 key regions. These MSAs account for 52% of the international opportunity (Brookings
report)
9
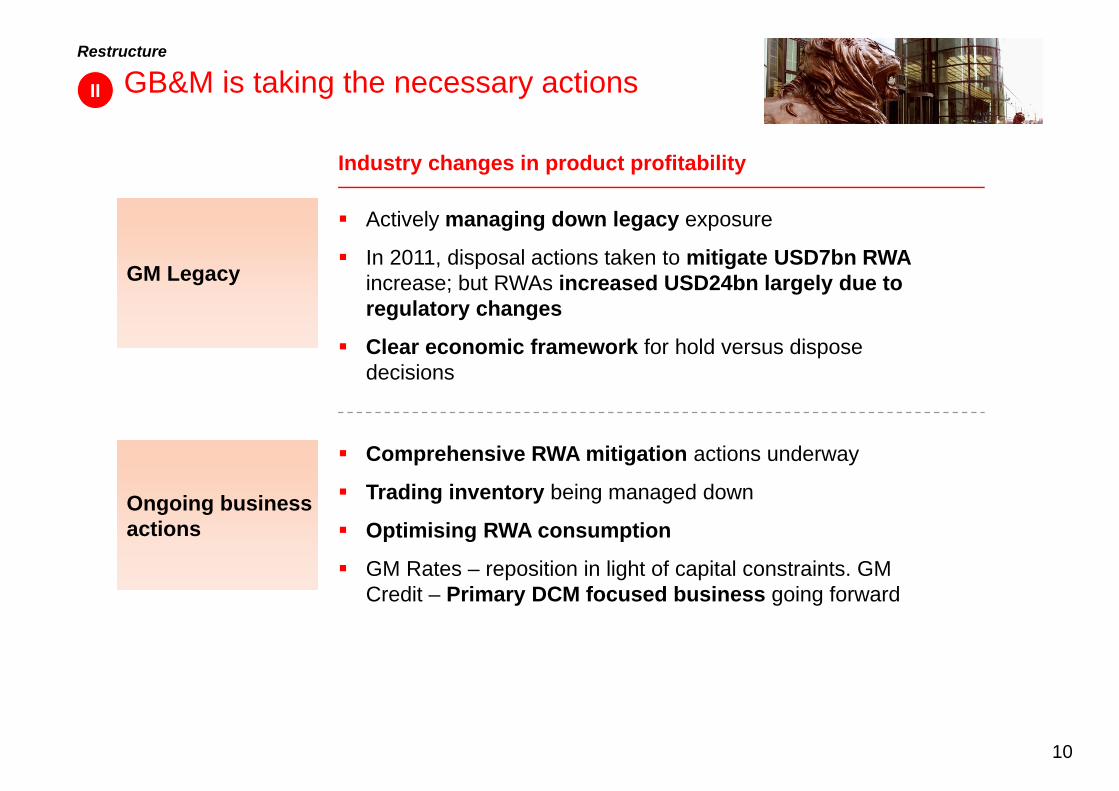
GB&M is taking the necessary actions
Actively managing down legacy exposure
In 2011, disposal actions taken to mitigate USD7bn RWAincrease; but RWAs increased USD24bn largely due to regulatory changes
Clear economic framework for hold versus dispose decisions
GM Legacy
Ongoing business actions
Comprehensive RWA mitigation actions underway
Trading inventory being managed down
Optimising RWA consumption
GM Rates – reposition in light of capital constraints. GM Credit – Primary DCM focused business going forward
Industry changes in product profitability
Restructure
II
10
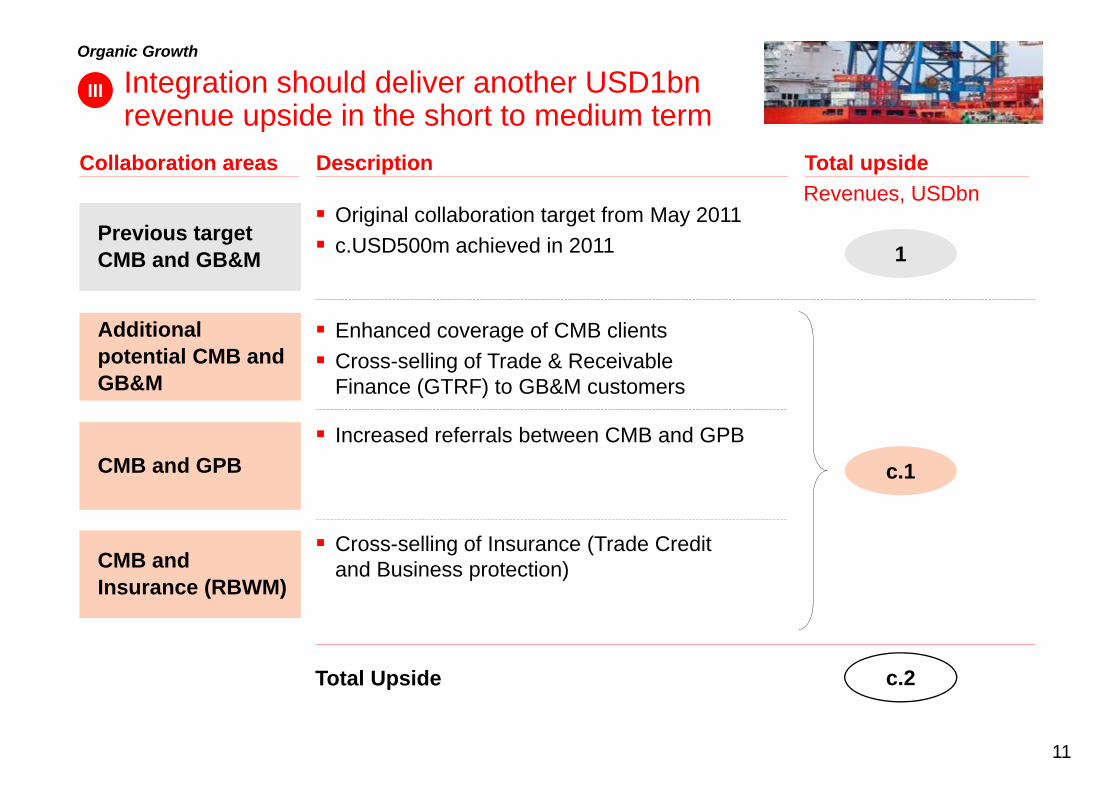
Total upsideRevenues, USDbn
III
Total Upside
Collaboration areas
CMB and GPB
CMB and Insurance (RBWM)
Previous target CMB and GB&M
Additional potential CMB and GB&M
Description
Original collaboration target from May 2011 c.USD500m achieved in 2011
Enhanced coverage of CMB clients Cross-selling of Trade & Receivable
Finance (GTRF) to GB&M customers
Increased referrals between CMB and GPB
Cross-selling of Insurance (Trade Credit and Business protection)
c.1
1
c.2
Organic Growth
Integration should deliver another USD1bn revenue upside in the short to medium term
11
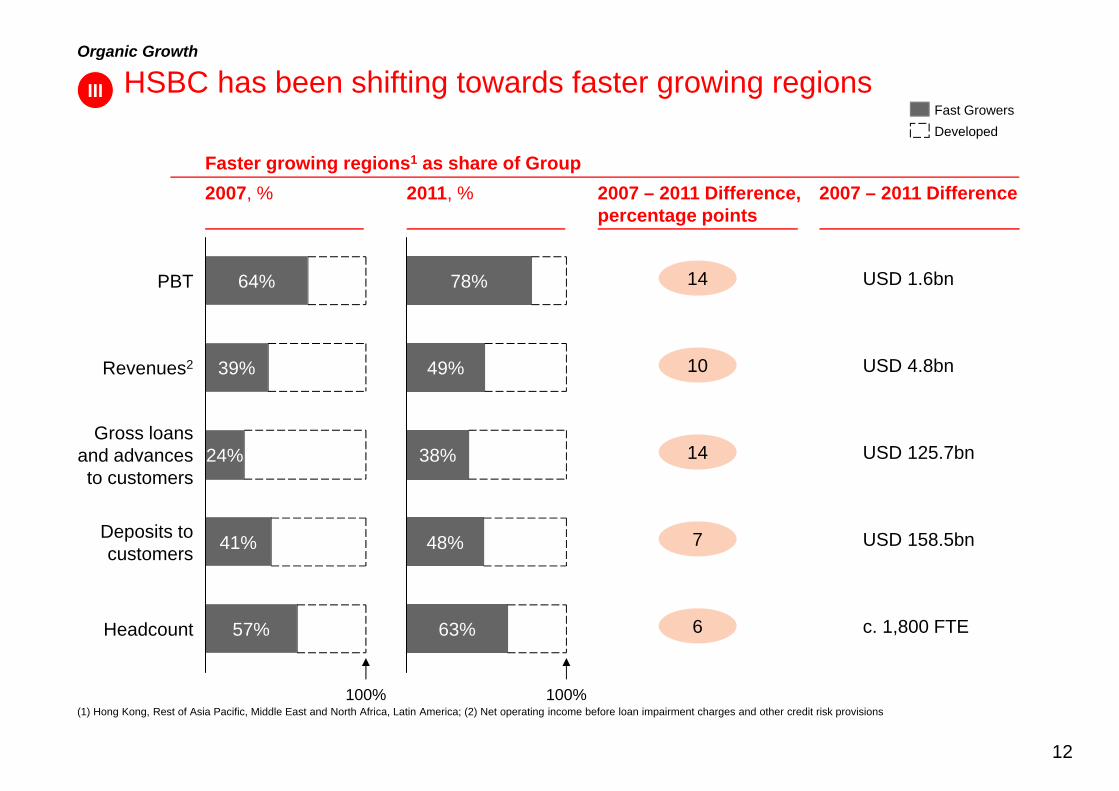
2007, % 2007 – 2011 Difference, percentage points
10
14
14
7
6
2011, %Faster growing regions1 as share of Group
USD 4.8bn
USD 1.6bn
USD 125.7bn
USD 158.5bn
c. 1,800 FTE
2007 – 2011 Difference
(1) Hong Kong, Rest of Asia Pacific, Middle East and North Africa, Latin America; (2) Net operating income before loan impairment charges and other credit risk provisions
Deposits tocustomers 41%
Gross loansand advancesto customers
24%
Revenues2 39%
PBT 64%
100%
Headcount 57%
Fast GrowersDeveloped
63%
48%
38%
49%
78%
100%
III
Organic Growth
HSBC has been shifting towards faster growing regions
12
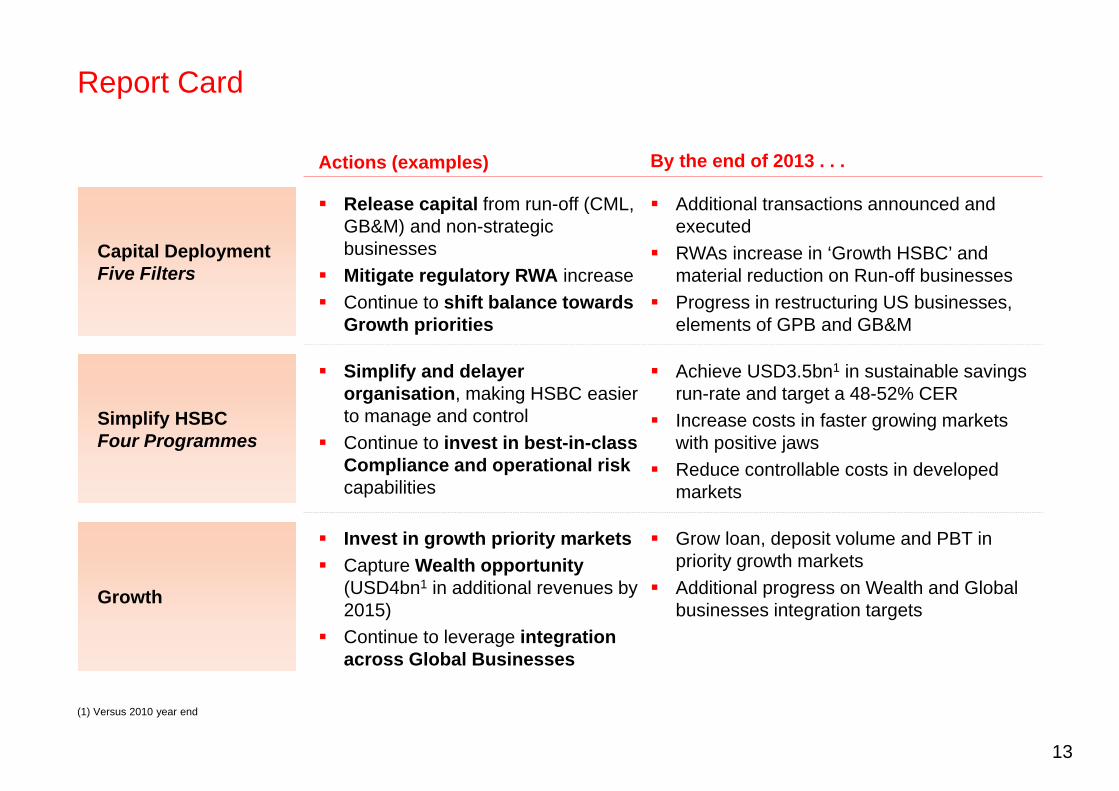
Report Card
Actions (examples) By the end of 2013 . . .
Capital DeploymentFive Filters
Release capital from run-off (CML, GB&M) and non-strategic businesses
Mitigate regulatory RWA increase Continue to shift balance towards
Growth priorities
Additional transactions announced and executed
RWAs increase in ‘Growth HSBC’ and material reduction on Run-off businesses
Progress in restructuring US businesses, elements of GPB and GB&M
Simplify HSBCFour Programmes
Simplify and delayer organisation, making HSBC easier to manage and control
Continue to invest in best-in-class Compliance and operational riskcapabilities
Achieve USD3.5bn1 in sustainable savings run-rate and target a 48-52% CER
Increase costs in faster growing markets with positive jaws
Reduce controllable costs in developed markets
Growth
Invest in growth priority markets Capture Wealth opportunity
(USD4bn1 in additional revenues by 2015)
Continue to leverage integration across Global Businesses
Grow loan, deposit volume and PBT in priority growth markets
Additional progress on Wealth and Global businesses integration targets
(1) Versus 2010 year end
13
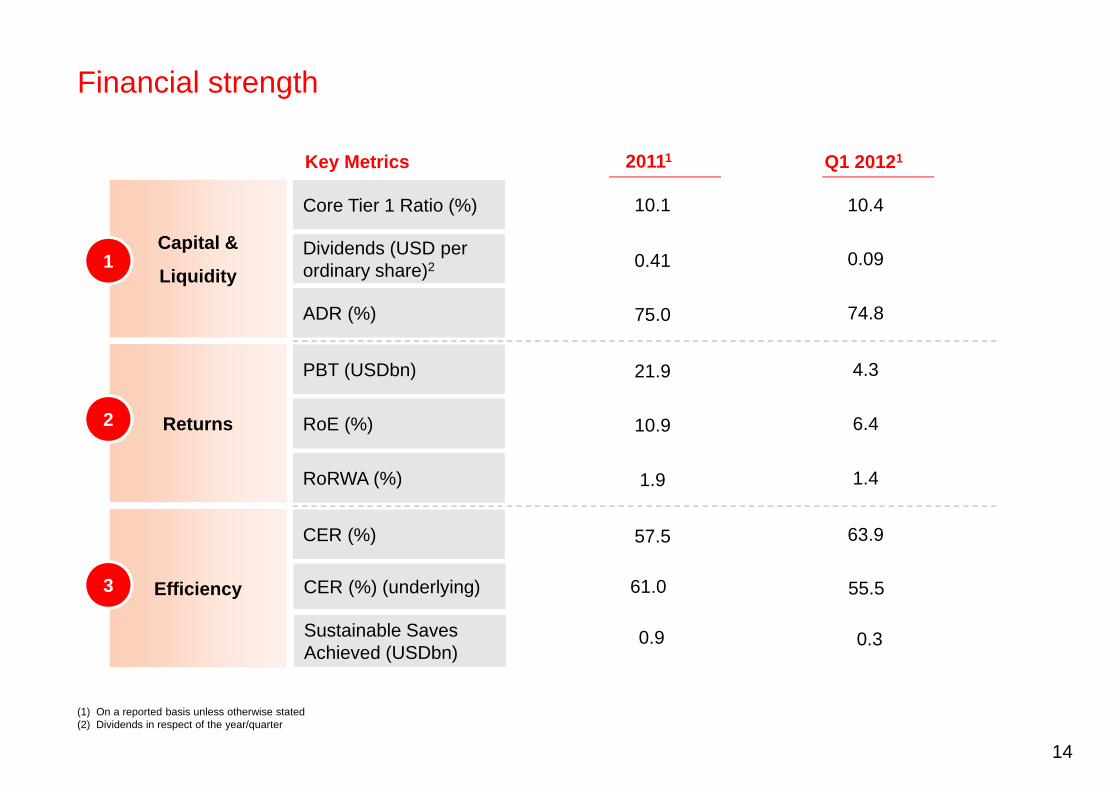
Financial strength
Key Metrics 20111 Q1 20121
(1) On a reported basis unless otherwise stated(2) Dividends in respect of the year/quarter
Returns
Efficiency
Capital &
Liquidity
Core Tier 1 Ratio (%)
Dividends (USD per ordinary share)2
ADR (%)
PBT (USDbn)
RoE (%)
RoRWA (%)
CER (%)
Sustainable Saves Achieved (USDbn)
10.1
0.41
75.0
21.9
10.9
1.9
57.5
0.9
10.4
0.09
74.8
4.3
6.4
1.4
63.9
0.3
CER (%) (underlying) 61.0 55.5
1
2
3
14
Strong and conservative management philosophies
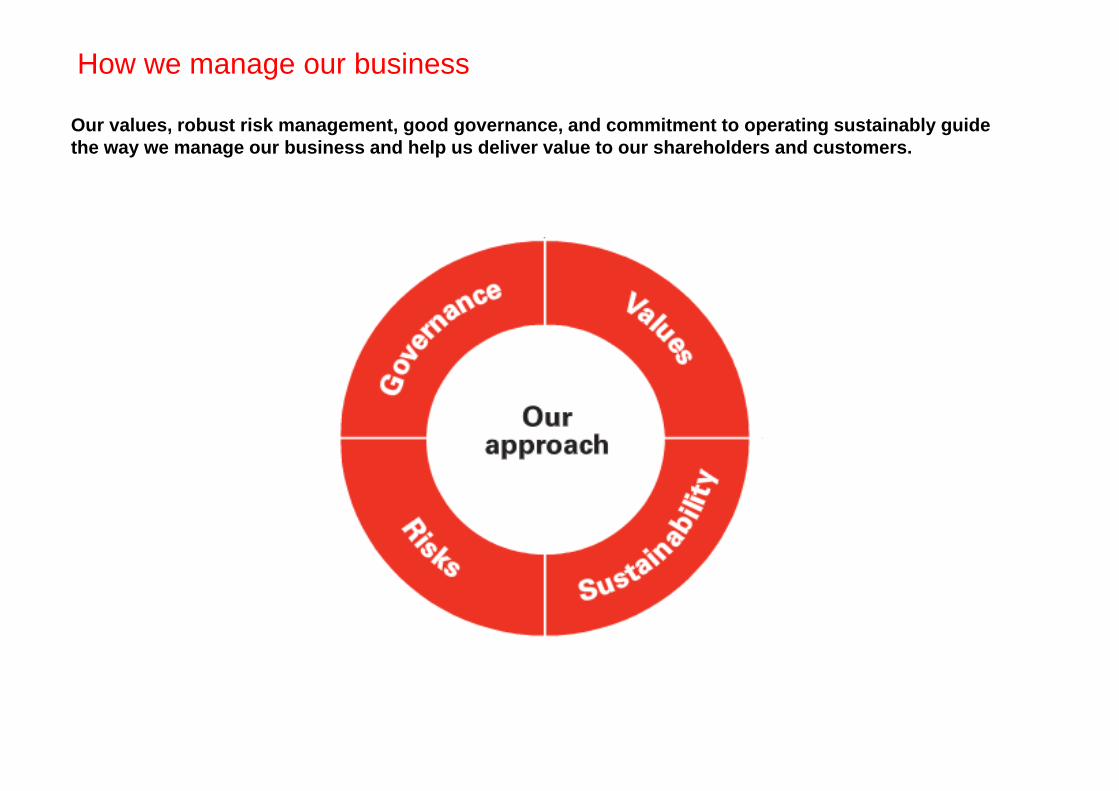
How we manage our business
Our values, robust risk management, good governance, and commitment to operating sustainably guide the way we manage our business and help us deliver value to our shareholders and customers.
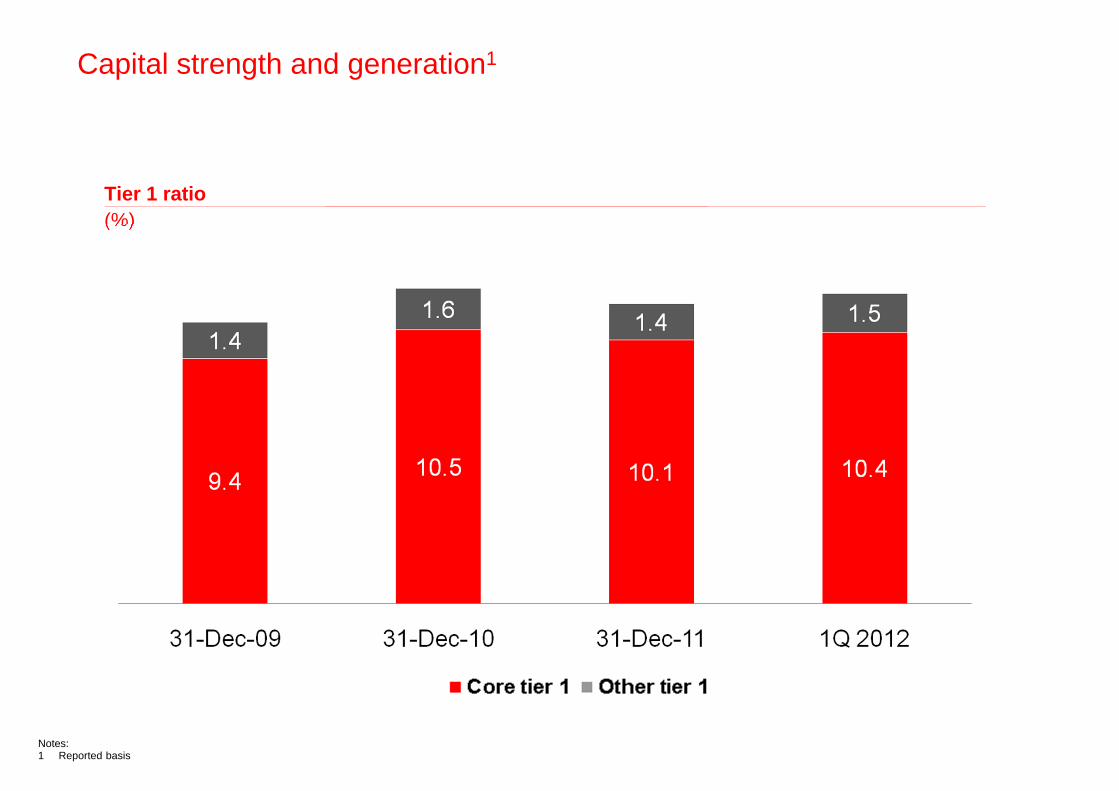
Capital strength and generation1
Tier 1 ratio (%)
Notes:1 Reported basis
Values and remuneration
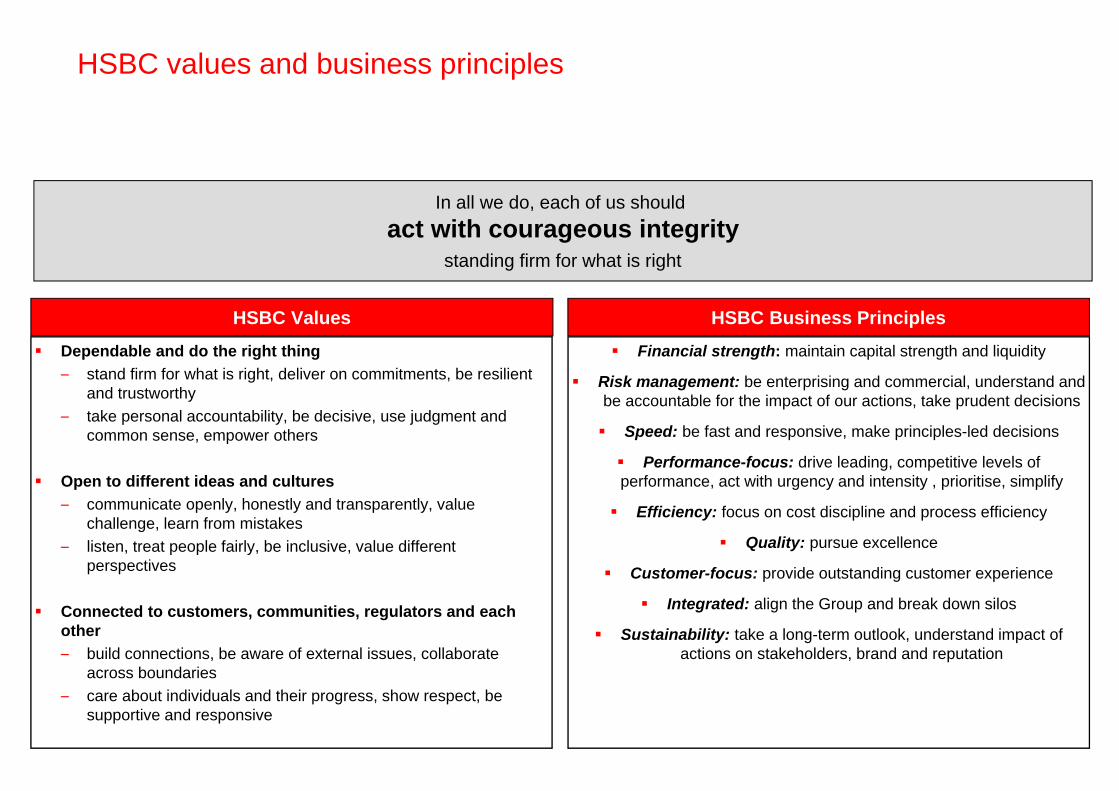
HSBC values and business principles
HSBC Values HSBC Business Principles
In all we do, each of us should act with courageous integrity
standing firm for what is right
Dependable and do the right thing– stand firm for what is right, deliver on commitments, be resilient
and trustworthy– take personal accountability, be decisive, use judgment and
common sense, empower others
Open to different ideas and cultures– communicate openly, honestly and transparently, value
challenge, learn from mistakes– listen, treat people fairly, be inclusive, value different
perspectives
Connected to customers, communities, regulators and each other– build connections, be aware of external issues, collaborate
across boundaries– care about individuals and their progress, show respect, be
supportive and responsive
Financial strength: maintain capital strength and liquidity
Risk management: be enterprising and commercial, understand and be accountable for the impact of our actions, take prudent decisions
Speed: be fast and responsive, make principles-led decisions
Performance-focus: drive leading, competitive levels of performance, act with urgency and intensity , prioritise, simplify
Efficiency: focus on cost discipline and process efficiency
Quality: pursue excellence
Customer-focus: provide outstanding customer experience
Integrated: align the Group and break down silos
Sustainability: take a long-term outlook, understand impact of actions on stakeholders, brand and reputation
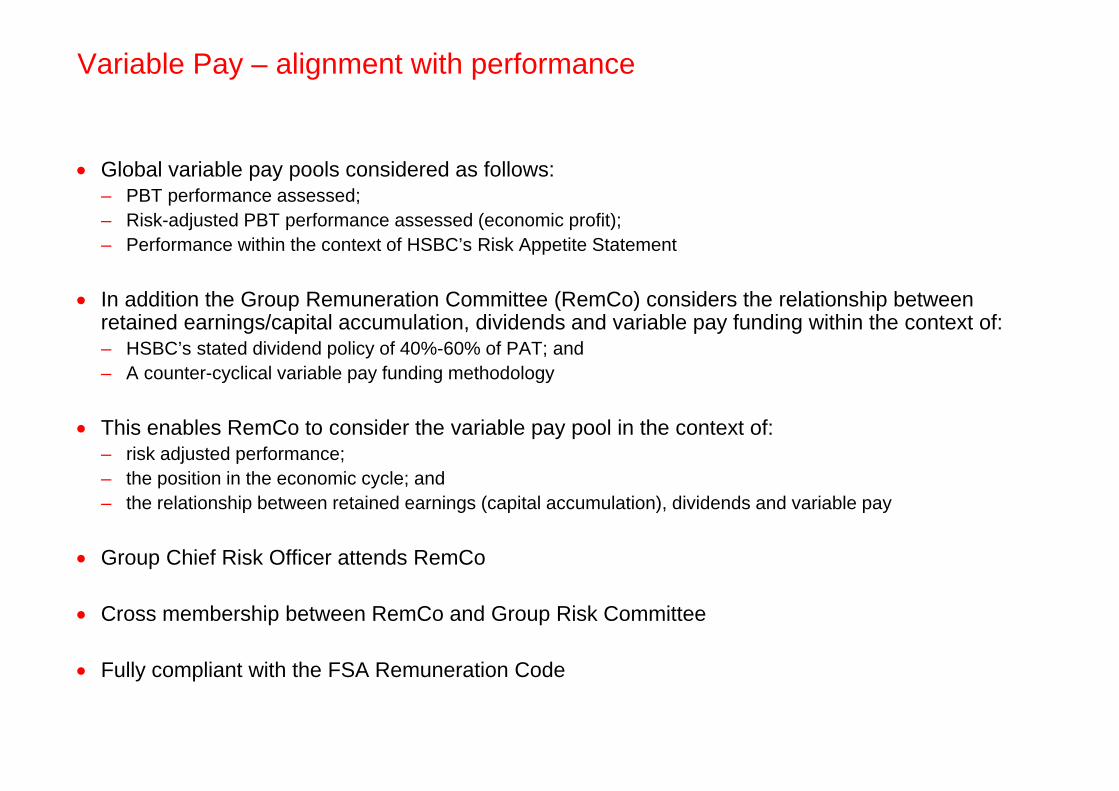
Variable Pay – alignment with performance
Global variable pay pools considered as follows:– PBT performance assessed;– Risk-adjusted PBT performance assessed (economic profit);– Performance within the context of HSBC’s Risk Appetite Statement
In addition the Group Remuneration Committee (RemCo) considers the relationship between retained earnings/capital accumulation, dividends and variable pay funding within the context of:– HSBC’s stated dividend policy of 40%-60% of PAT; and– A counter-cyclical variable pay funding methodology
This enables RemCo to consider the variable pay pool in the context of: – risk adjusted performance;– the position in the economic cycle; and– the relationship between retained earnings (capital accumulation), dividends and variable pay
Group Chief Risk Officer attends RemCo
Cross membership between RemCo and Group Risk Committee
Fully compliant with the FSA Remuneration Code
26 HIGHLY RESTRICTED
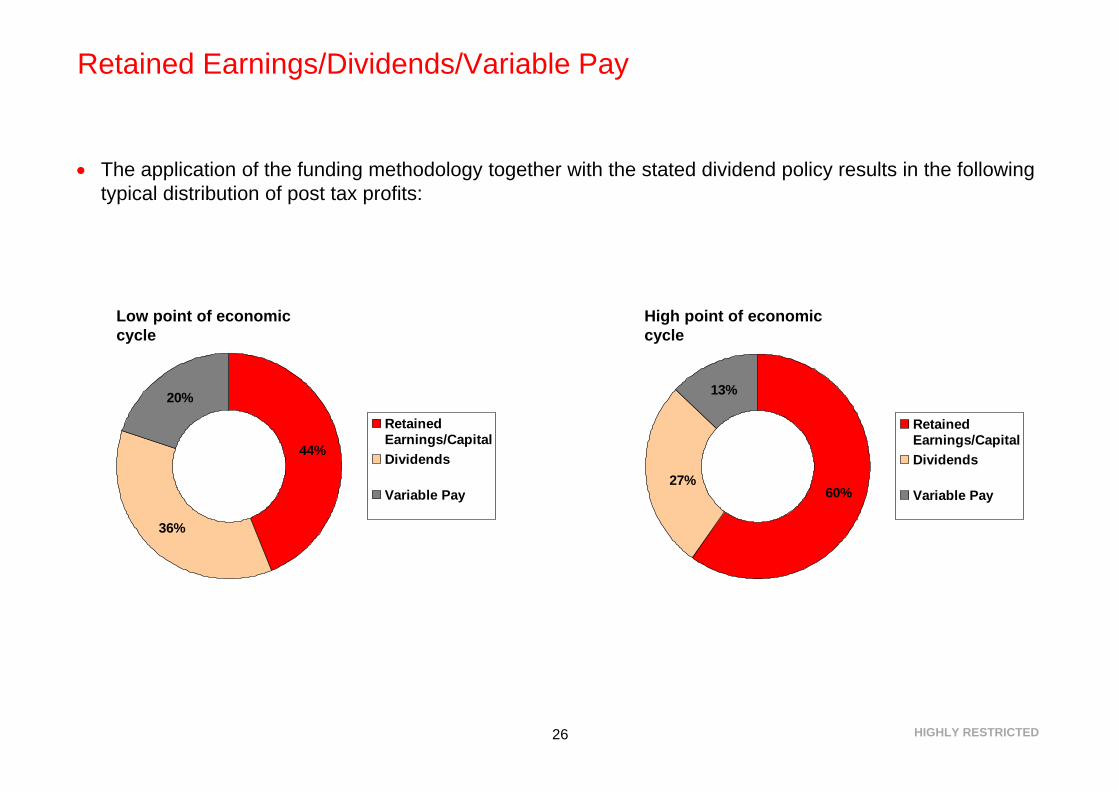
Retained Earnings/Dividends/Variable Pay
The application of the funding methodology together with the stated dividend policy results in the following typical distribution of post tax profits:
36%
44%
20%
RetainedEarnings/CapitalDividends
Variable Pay 60%
13%
27%
RetainedEarnings/CapitalDividends
Variable Pay
Low point of economic cycle
High point of economic cycle
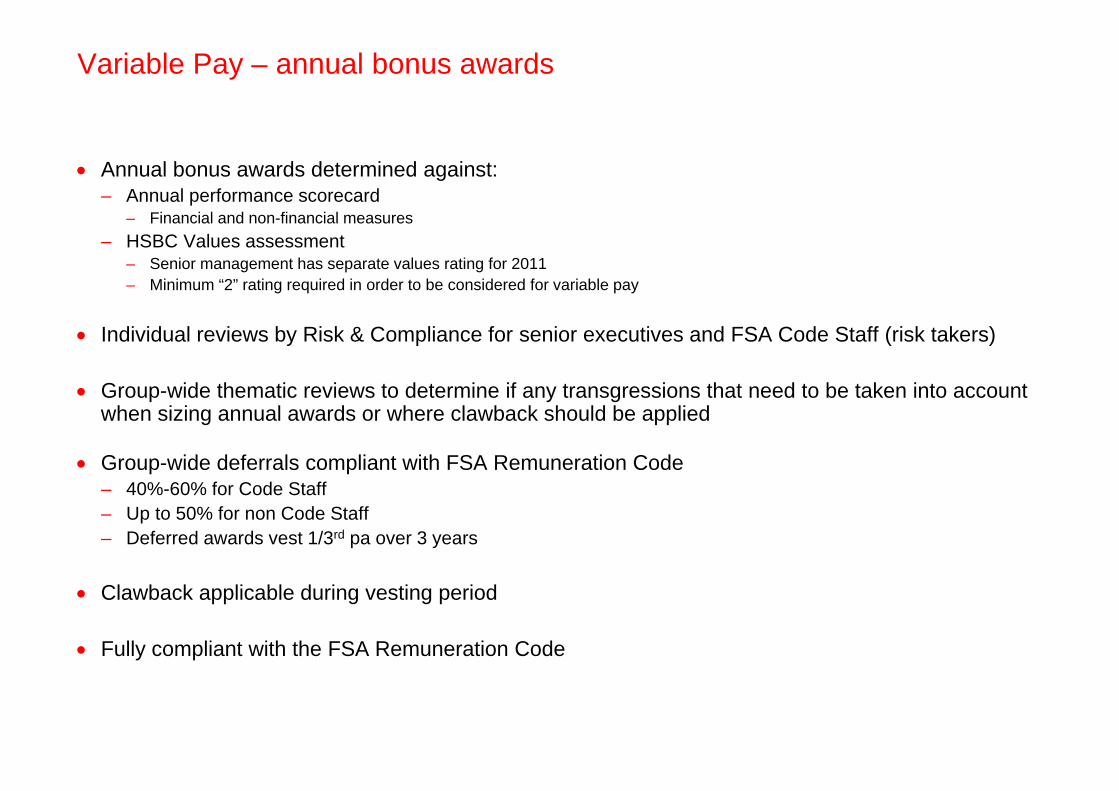
Variable Pay – annual bonus awards
Annual bonus awards determined against:– Annual performance scorecard
– Financial and non-financial measures– HSBC Values assessment
– Senior management has separate values rating for 2011– Minimum “2” rating required in order to be considered for variable pay
Individual reviews by Risk & Compliance for senior executives and FSA Code Staff (risk takers)
Group-wide thematic reviews to determine if any transgressions that need to be taken into account when sizing annual awards or where clawback should be applied
Group-wide deferrals compliant with FSA Remuneration Code– 40%-60% for Code Staff– Up to 50% for non Code Staff– Deferred awards vest 1/3rd pa over 3 years
Clawback applicable during vesting period
Fully compliant with the FSA Remuneration Code
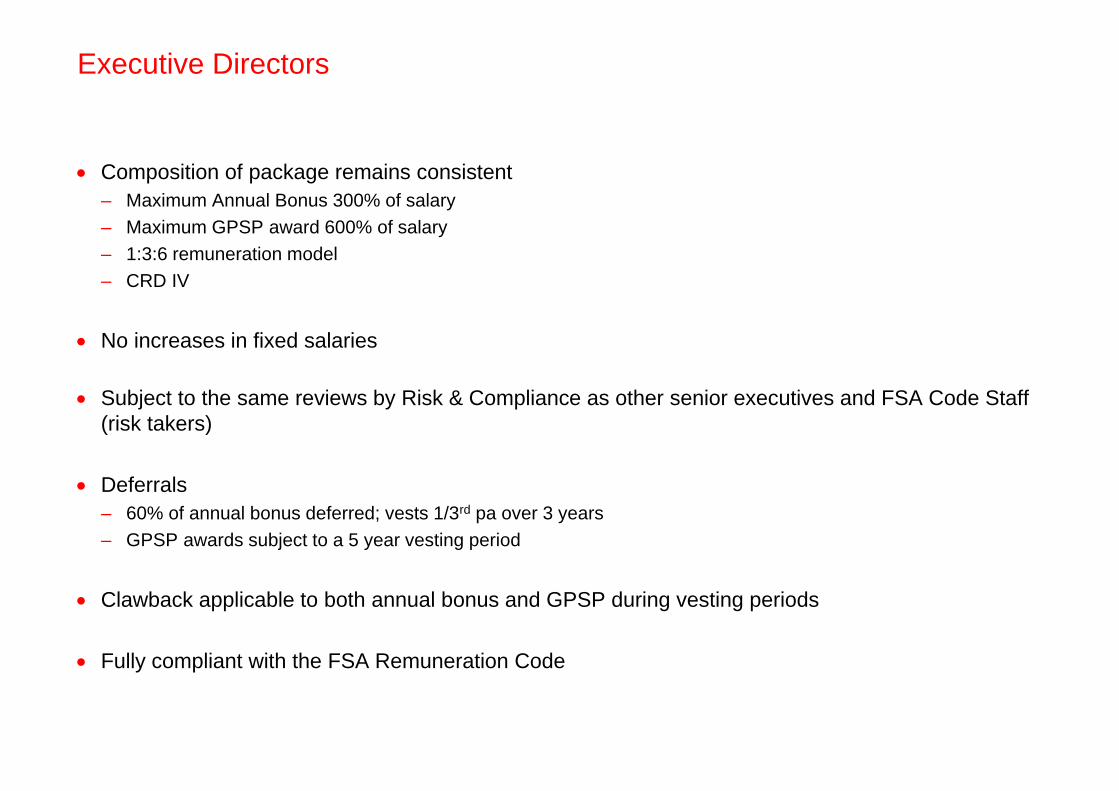
Executive Directors
Composition of package remains consistent– Maximum Annual Bonus 300% of salary– Maximum GPSP award 600% of salary– 1:3:6 remuneration model– CRD IV
No increases in fixed salaries
Subject to the same reviews by Risk & Compliance as other senior executives and FSA Code Staff (risk takers)
Deferrals– 60% of annual bonus deferred; vests 1/3rd pa over 3 years– GPSP awards subject to a 5 year vesting period
Clawback applicable to both annual bonus and GPSP during vesting periods
Fully compliant with the FSA Remuneration Code
Corporate Sustainability is core to how we manage our business
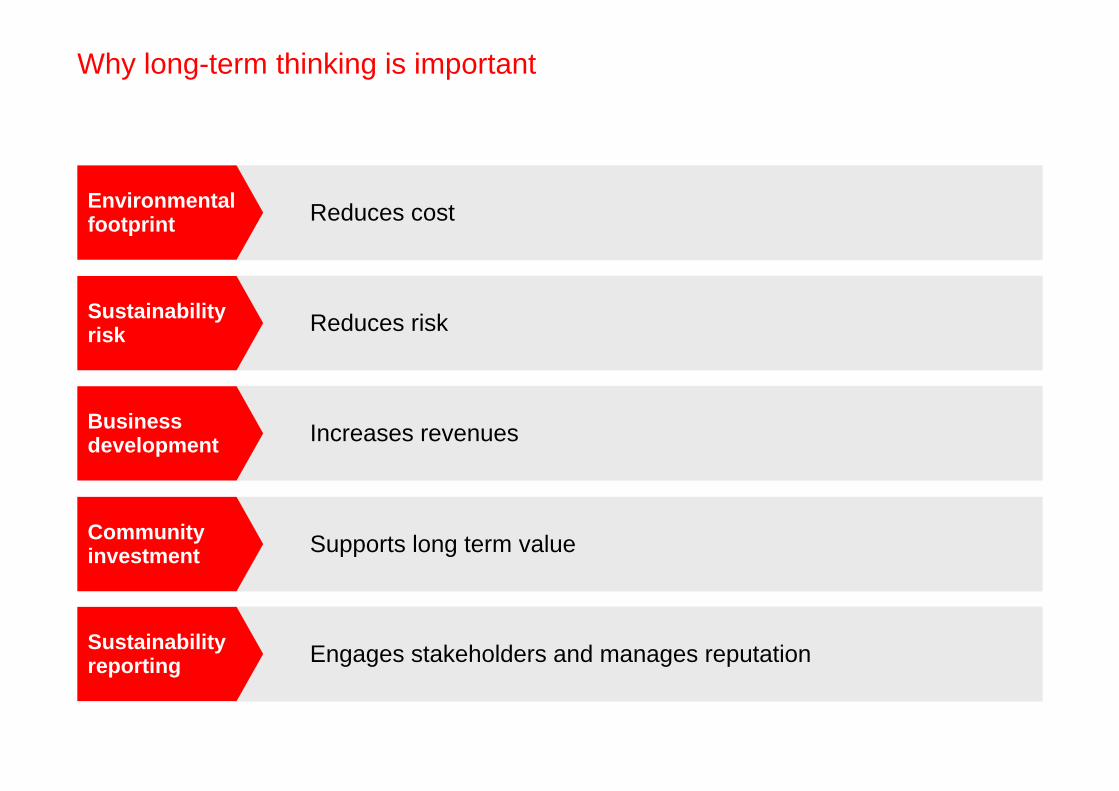
Why long-term thinking is important
Reduces cost
Reduces risk
Increases revenues
Supports long term value
Environmental footprint
Sustainability risk
Business development
Community investment
Engages stakeholders and manages reputation Sustainability reporting
Efficiency as part of the HSBC Technology & Services strategy- Reduces cost
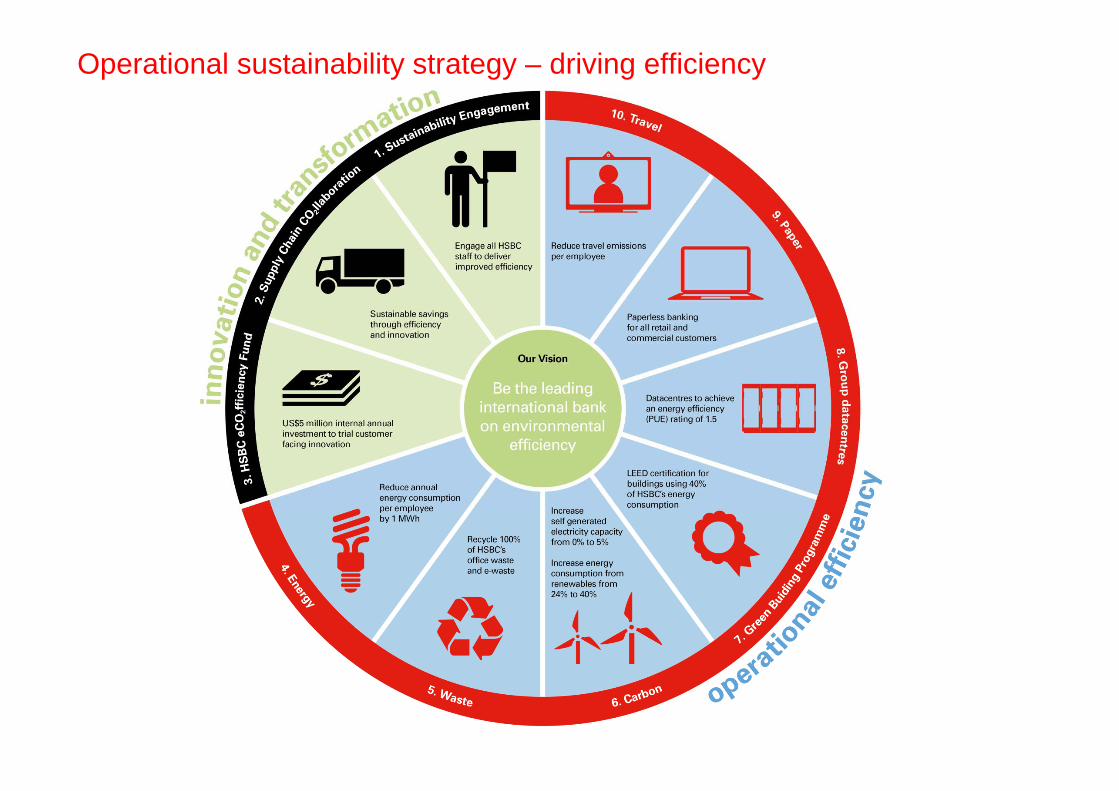
Operational sustainability strategy – driving efficiency
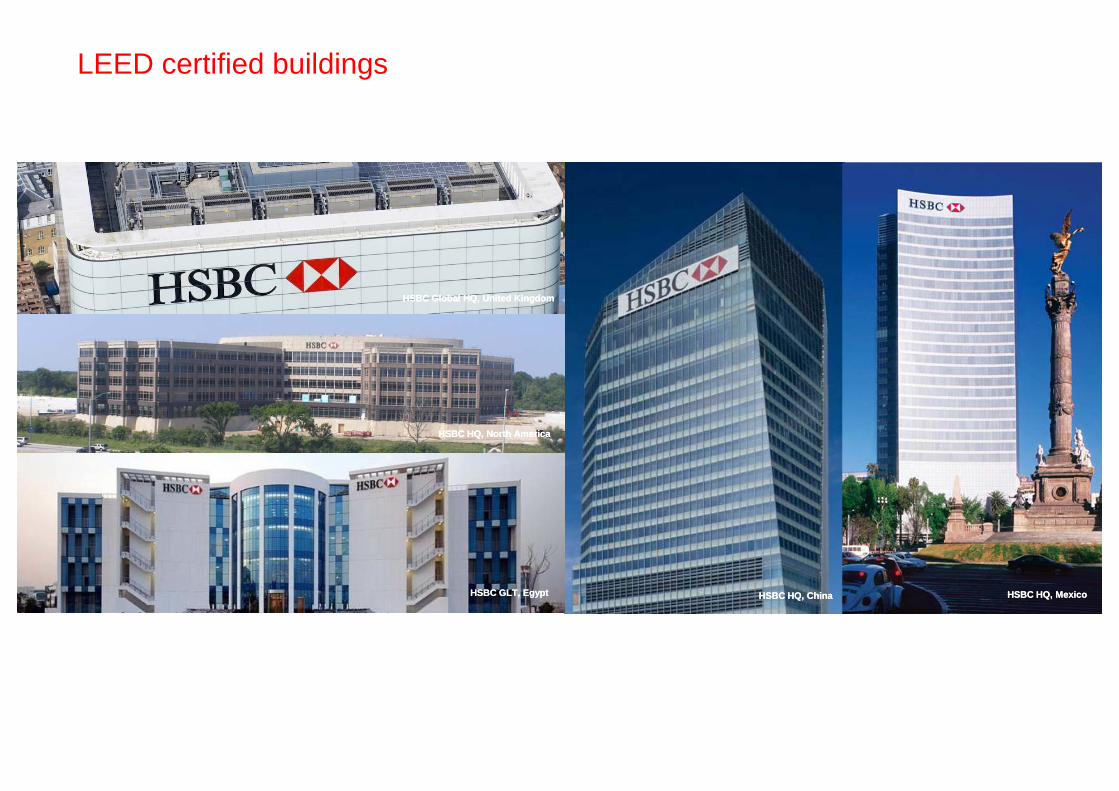
LEED certified buildings
HSBC Building Shanghai, ChinaHSBC Building Shanghai, ChinaHSBC HQ, MexicoHSBC HQ, MexicoHSBC HQ, ChinaHSBC HQ, ChinaHSBC GLT, EgyptHSBC GLT, Egypt
HSBC Global HQ, United KingdomHSBC Global HQ, United Kingdom
HSBC HQ, North AmericaHSBC HQ, North America
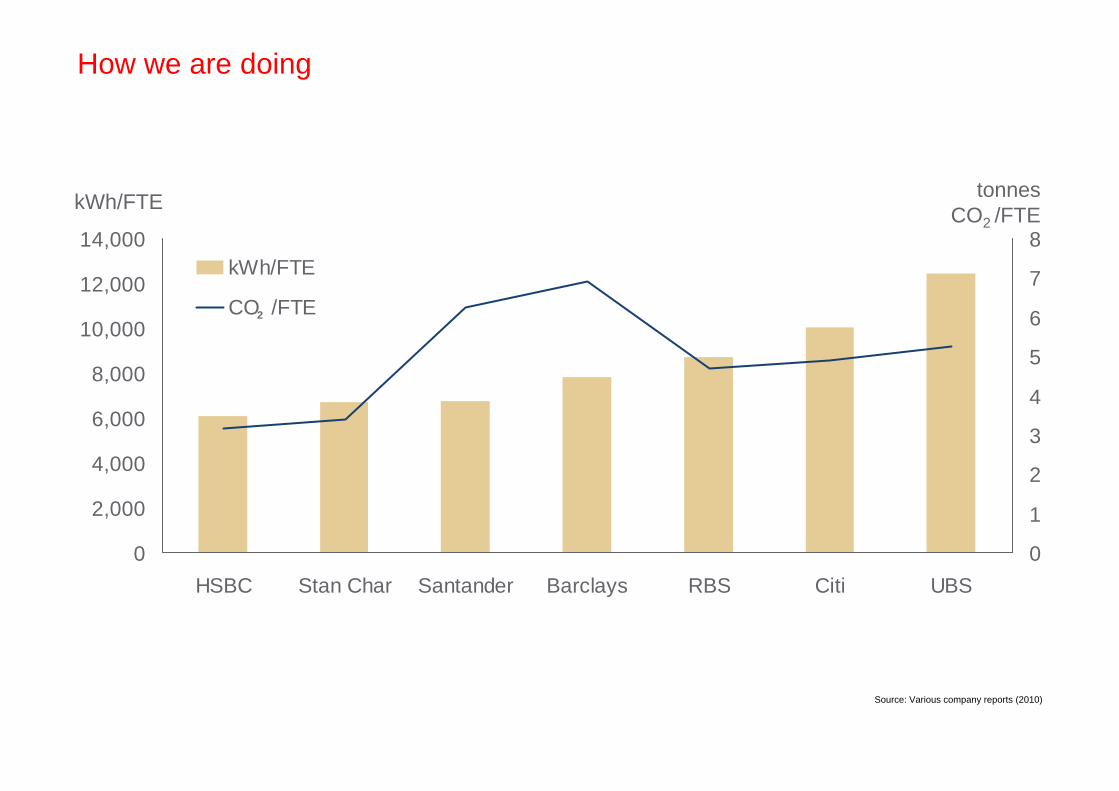
How we are doing
kWh/FTE
0
2,000
4,000
6,000
8,000
10,000
12,000
14,000
HSBC Stan Char Santander Barclays RBS Citi UBS0
1
2
3
4
5
6
7
8kWh/FTE
CO /FTE2
tonnesCO2 /FTE
Source: Various company reports (2010)
Management of sustainability risk- Reduces risk
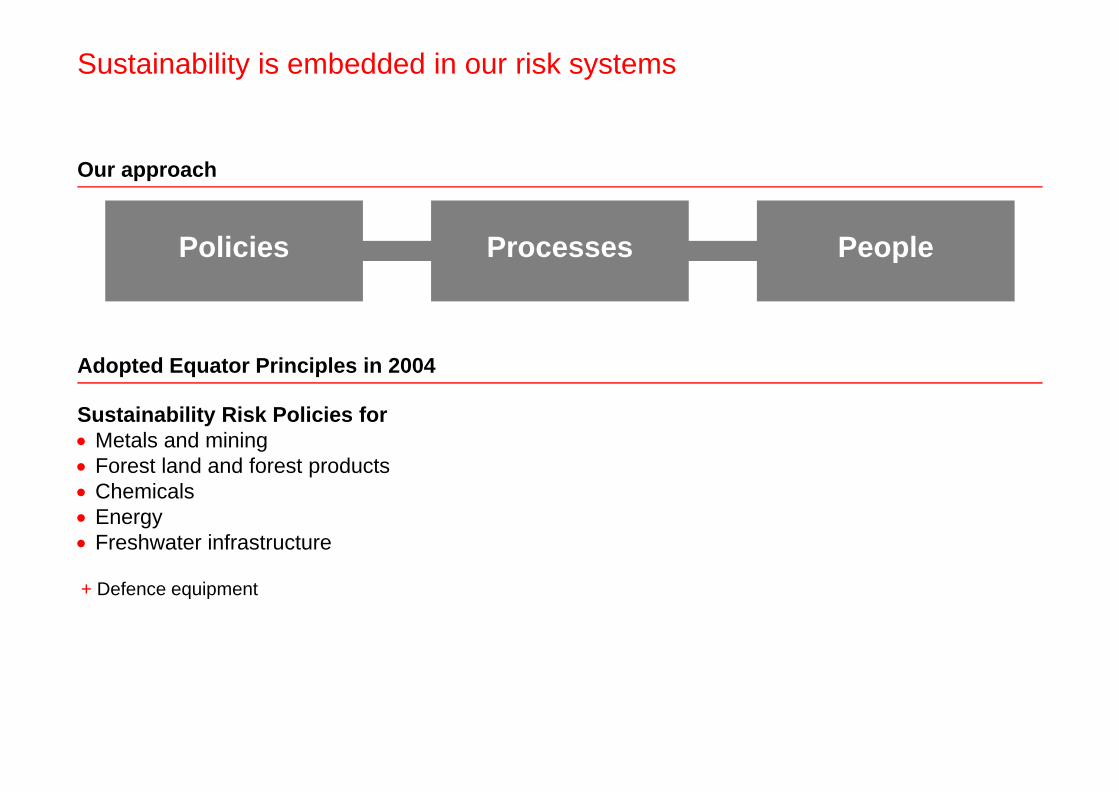
Sustainability is embedded in our risk systems
Sustainability Risk Policies for Metals and mining Forest land and forest products Chemicals Energy Freshwater infrastructure
+ Defence equipment
Our approach
Adopted Equator Principles in 2004
Policies Processes People
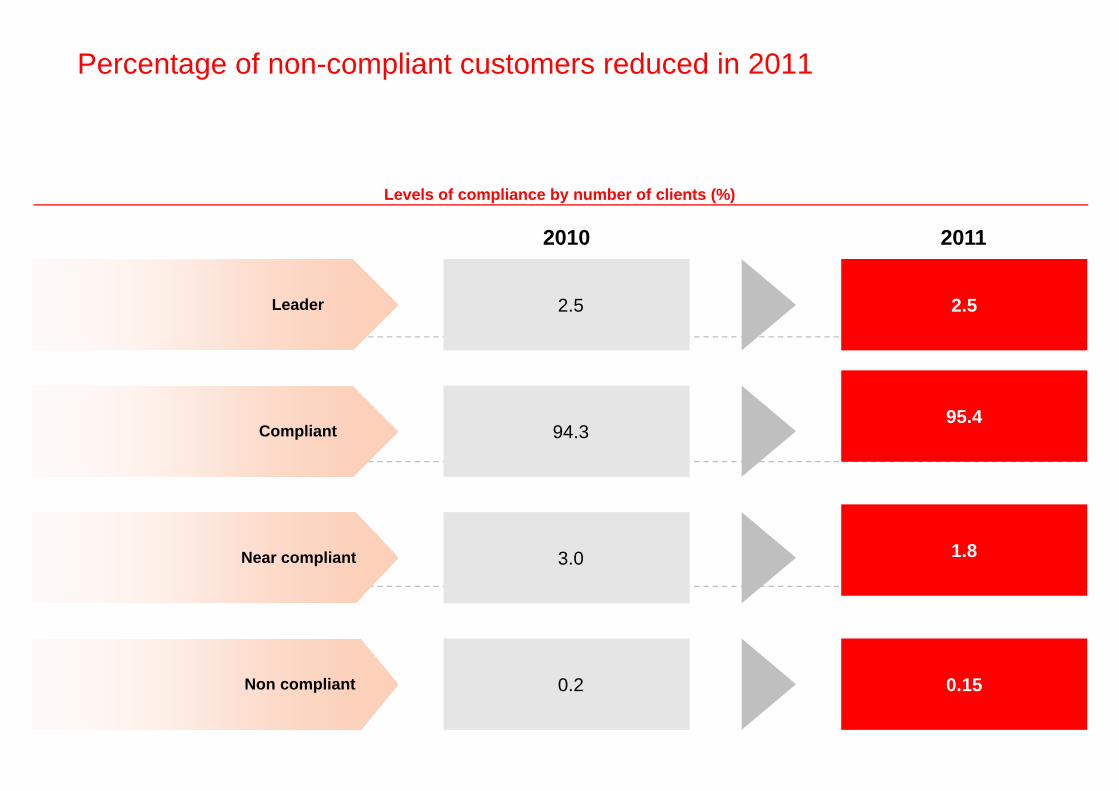
Percentage of non-compliant customers reduced in 2011
Levels of compliance by number of clients (%)
94.395.4
3.0 1.8
0.2 0.15
2.5 2.5
Compliant
Near compliant
Non compliant
Leader
2010 2011
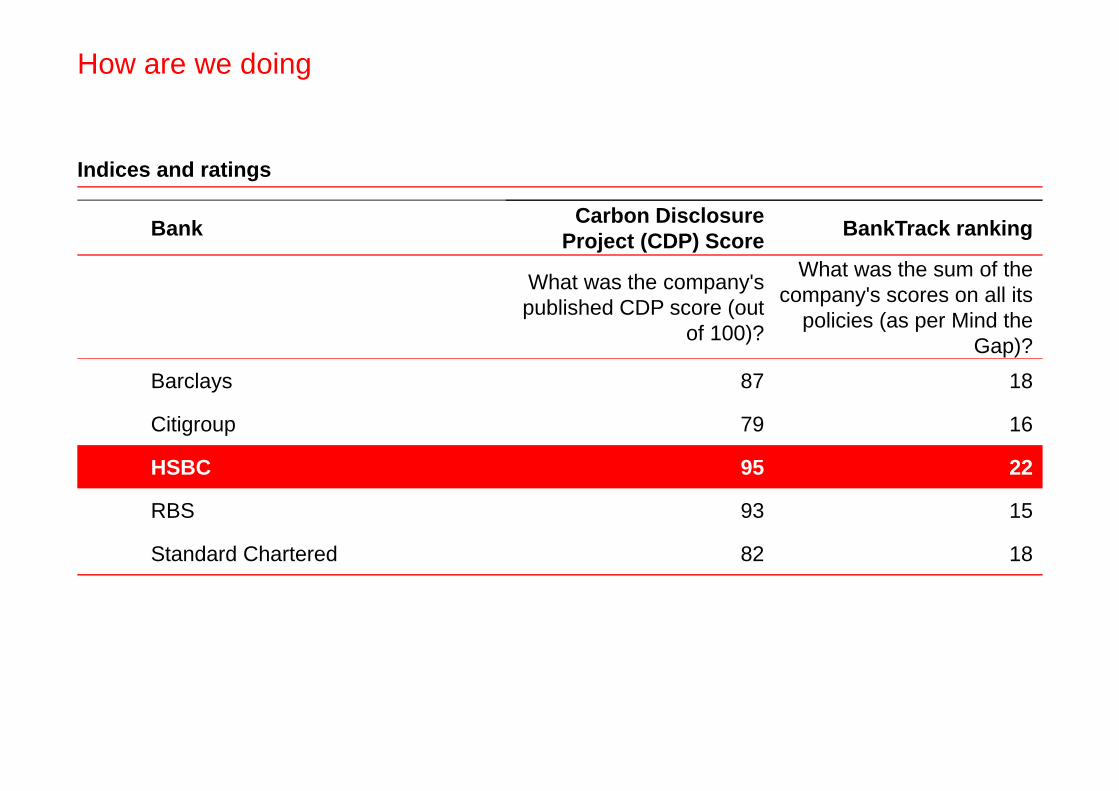
How are we doing
Bank Carbon Disclosure Project (CDP) Score BankTrack ranking
What was the company's published CDP score (out
of 100)?
What was the sum of the company's scores on all its
policies (as per Mind the Gap)?
Barclays 87 18
Citigroup 79 16
HSBC 95 22
RBS 93 15
Standard Chartered 82 18
Indices and ratings
Positioned to capture opportunities arising from transition to low carbon economy- Increases revenues
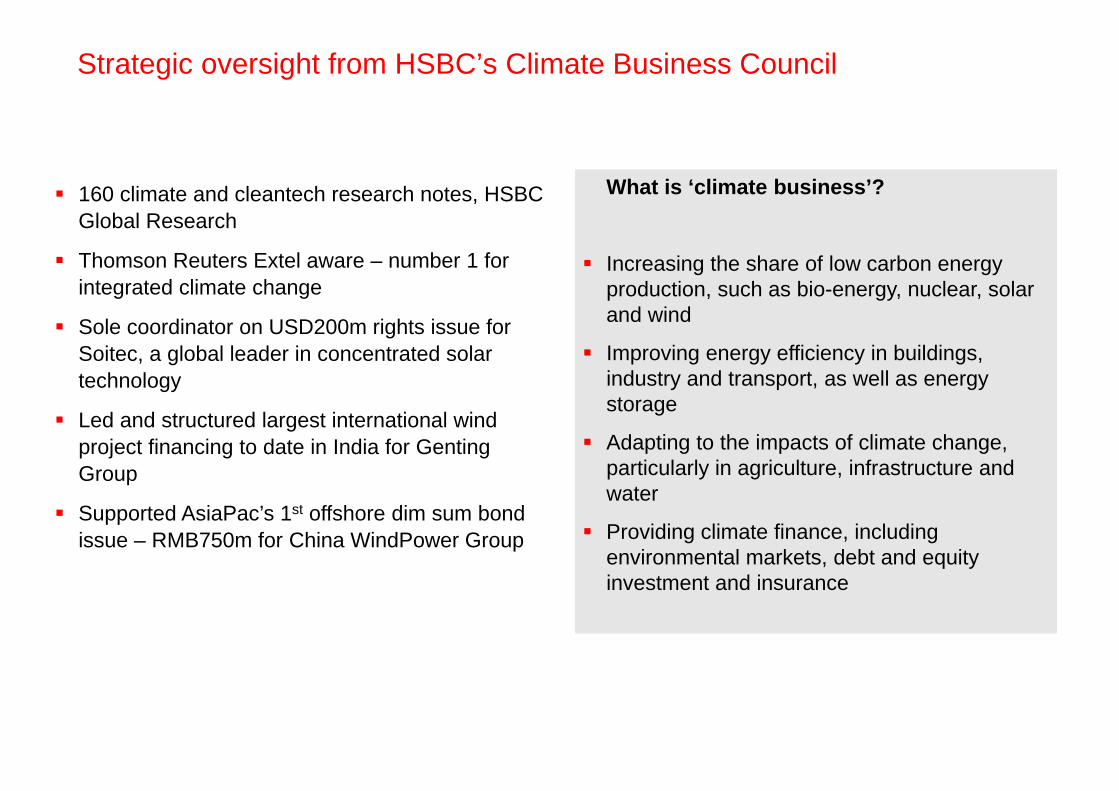
Strategic oversight from HSBC’s Climate Business Council
160 climate and cleantech research notes, HSBC Global Research
Thomson Reuters Extel aware – number 1 for integrated climate change
Sole coordinator on USD200m rights issue for Soitec, a global leader in concentrated solar technology
Led and structured largest international wind project financing to date in India for Genting Group
Supported AsiaPac’s 1st offshore dim sum bond issue – RMB750m for China WindPower Group
What is ‘climate business’?
Increasing the share of low carbon energy production, such as bio-energy, nuclear, solar and wind
Improving energy efficiency in buildings, industry and transport, as well as energy storage
Adapting to the impacts of climate change, particularly in agriculture, infrastructure and water
Providing climate finance, including environmental markets, debt and equity investment and insurance
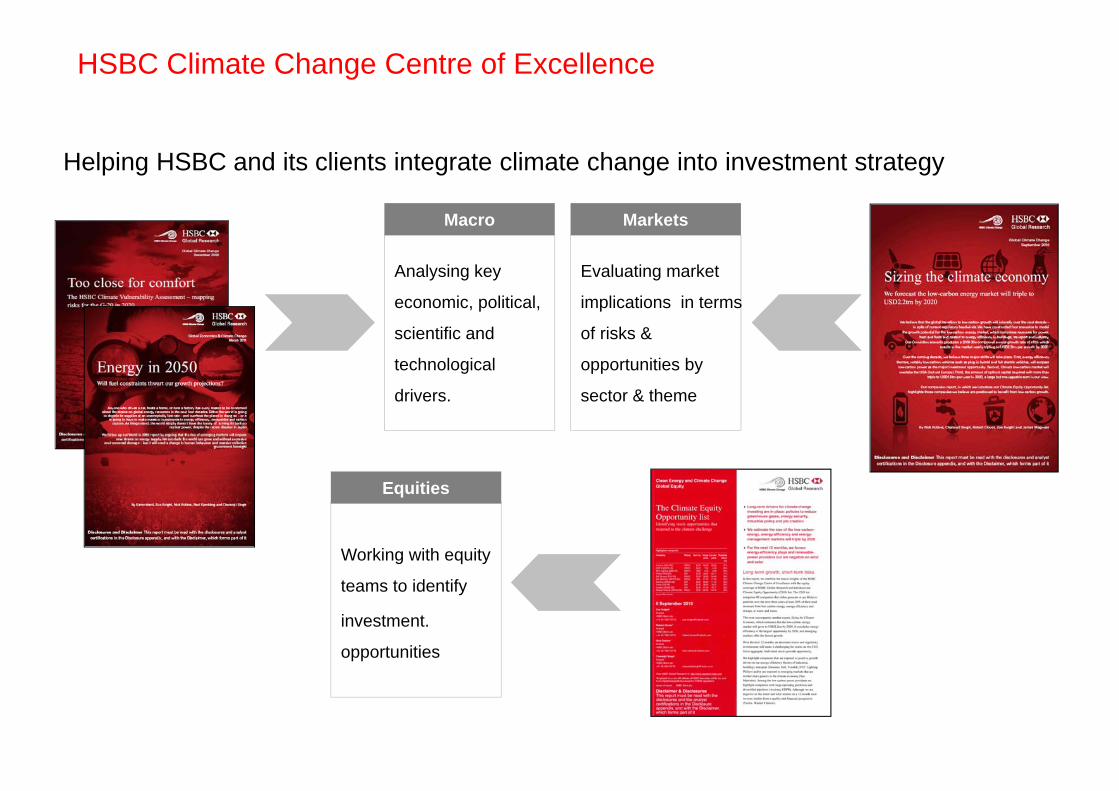
Helping HSBC and its clients integrate climate change into investment strategy
Analysing key
economic, political,
scientific and
technological
drivers.
Evaluating market
implications in terms
of risks &
opportunities by
sector & theme
Working with equity
teams to identify
investment.
opportunities
Macro Markets
Equities
HSBC Climate Change Centre of Excellence
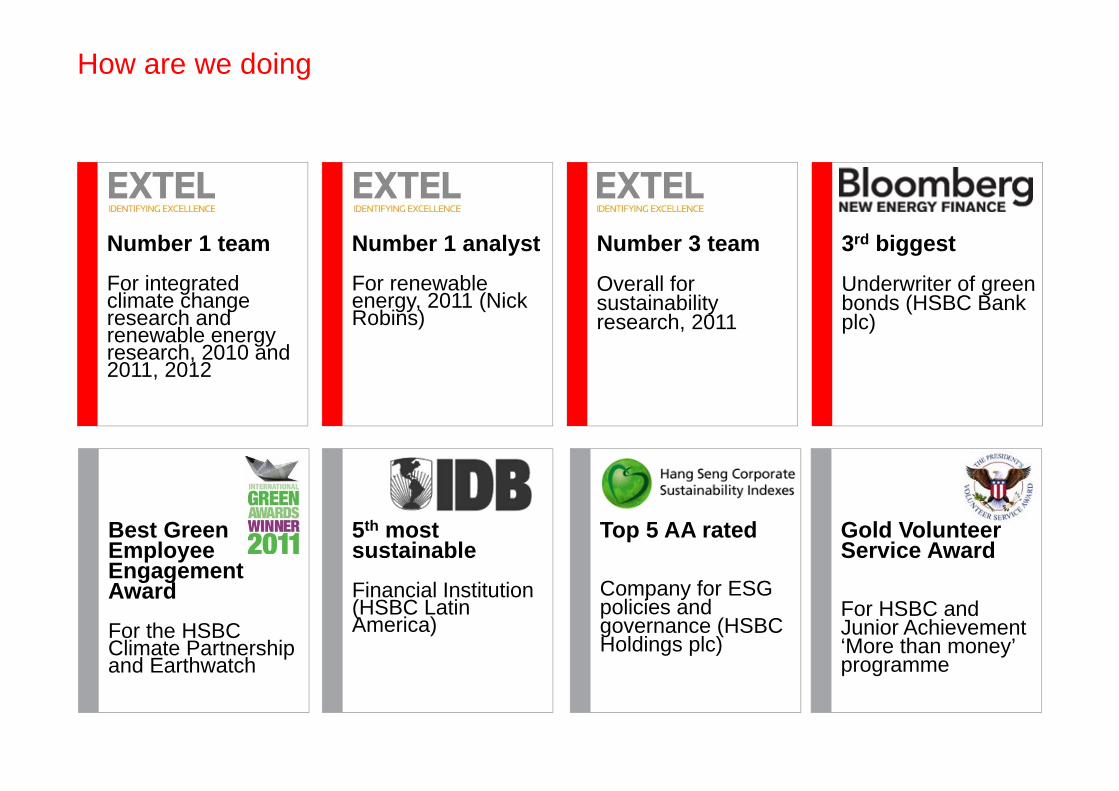
How are we doing
Number 3 team
Overall for sustainability research, 2011
3rd biggest
Underwriter of green bonds (HSBC Bank plc)
Number 1 team
For integrated climate change research and renewable energy research, 2010 and 2011, 2012
Number 1 analyst
For renewable energy, 2011 (Nick Robins)
Best Green Employee Engagement Award
For the HSBC Climate Partnership and Earthwatch
5th most sustainable
Financial Institution (HSBC Latin America)
Top 5 AA rated
Company for ESG policies and governance (HSBC Holdings plc)
Gold Volunteer Service Award
For HSBC and Junior Achievement ‘More than money’ programme
Investing in communities and long-term socio-economic development- Supports long term value
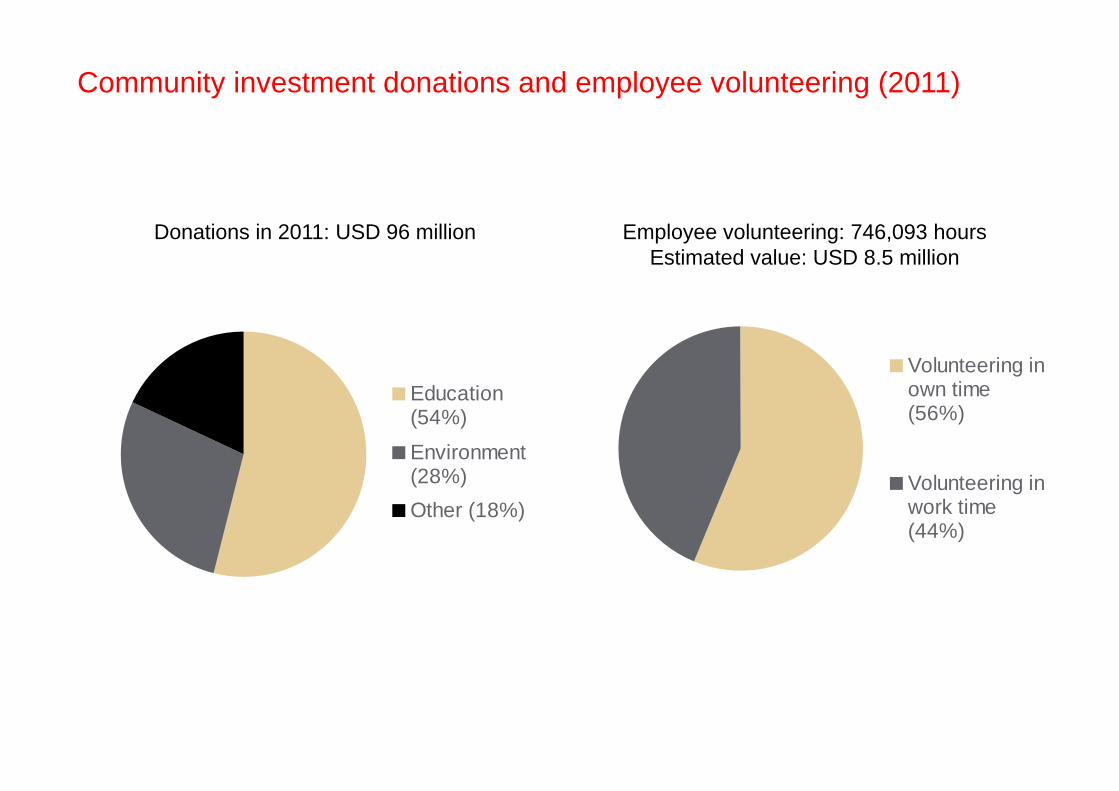
Community investment donations and employee volunteering (2011)
Donations in 2011: USD 96 million
Education(54%)
Environment(28%)Other (18%)
Volunteering inown time(56%)
Volunteering inwork time(44%)
Employee volunteering: 746,093 hoursEstimated value: USD 8.5 million
Conclusion
‘The overriding accountability of the Group Management Board, led by the Group Chief Executive is to deliver sustainable long term value for shareholders through consistent performance delivery and safe and compliant execution of the Group’s business in a manner that, at the same time, maintains the confidence of all other key stakeholders in the business including depositors, counterparties, long term creditors, customers, regulators, employees and governments.’
Contacts and further information
Guy Lewis
Senior Manager, Investor Relations
+44 (0) 207 992 1938


![Descendant Chart Uvedale Barrington Tristram [snr] · Descendant Chart Uvedale Barrington Tristram [snr] November 14, 2017 at 5:43 PM Uvedale Barrington Tristram [snr] Birth 18 Dec](https://img.pdfslide.us/doc/110x75/5e18828f8e0ee51fc4748346/descendant-chart-uvedale-barrington-tristram-snr-descendant-chart-uvedale-barrington.jpg)