Embed Size (px)
Citation preview

© 2016 SASB™
Sustainability Accounting Standards BoardIndustry-Based Standards to Guide Disclosure and Action on Material Sustainability Information
Jean Rogers, PhD - CEO and FounderJanine Guillot - Director of Capital Markets Policy and Outreach
Presentation to CalPERS Investment CommitteeMarch 14, 2016
Agenda Item 7a, Attachment 1, Page 1 of 30

The SASB MissionImproved non-financial disclosure enhances market efficiency
2
The mission of SASB is to develop and disseminate sustainability accounting standards that help public corporations disclose material, decision-useful information to investors.
That mission is accomplished through a rigorous process that includes evidence-based research and broad, balanced stakeholder participation.
Facts about SASB
Independent 501(c)(3) nonprofit
American National Standards Institute (ANSI) accredited standards developer
Developing industry-specific standards for 10 sectors and 79 industries
Guided by the U.S. Supreme Court’s definition of materiality, SASB prioritizes material sustainability factors for disclosure to investors
3/14/2016 © 2016 SASB™
Agenda Item 7a, Attachment 1, Page 2 of 30

Strong LeadershipSASB Board of Directors: Informed by experience, commitment, and vision
3
Mary Schapiro – Vice ChairPromontory Advisory Board Vice ChairFormer Chairman – SEC
Michael R. Bloomberg – ChairPhilanthropist, Founder of Bloomberg LP, and the 108th Mayor of New York City
© 2016 SASB™
Audrey ChoiCEO – Institute for Sustainable Investing, Morgan Stanley
Jack EhnesCEO – CalSTRS
Steven O. Gunders, CPA, MBAPartner – Deloitte & Touche LLP (Retired)
Dan Hanson, CFAPartner and Director of U.S. Equities – Jarislowsky Fraser USA
Robert H. HerzFormer Chairman – FASB
Erika Karp, MBACEO – Cornerstone Capital Inc.
Shawn LytlePresident – Delaware Management Holdings, Inc.
Clara Miller President – The F.B. Heron Foundation
Catherine Odelbo, MBAExecutive Vice President, Corporate Strategy and Partnerships – Morningstar Inc.
Kevin ParkerCEO – Sustainable Insight Capital Management
Aulana Peters, JDFormer Commissioner – SEC
Arnie Pinkston, JDGeneral Counsel, Allergan (Retired)
Curtis RavenelGlobal Head, Sustainable Business and Finance –Bloomberg LP
Jean Rogers, PhD, PEChief Executive Officer & Founder – SASB (Ex-officio)
Laura Tyson, PhDDirector, Institute for Business and Social Impact – Berkeley Haas School of Business
Elisse Walter, JDFormer Chairman – SEC
Edward D. White, JDManaging Partner – Fahr LLC
3/14/2016
Agenda Item 7a, Attachment 1, Page 3 of 30

The Materiality MethodSASB’s approach grew out of research done at Harvard University
From Transparency to PerformanceIndustry-Based Sustainability Reporting on Key IssuesJuly, 2010
Steve LydenbergDomini Social Investment and IRI Fellow, Harvard University
Jean Rogers, PhDSASB, formerly Arup and Loeb fellow, Harvard University
David Wood, PhDInitiative for Responsible Investment, Harvard University
4 © 2016 SASB™3/14/2016
Agenda Item 7a, Attachment 1, Page 4 of 30

The SASB DifferenceSASB standards are created for the market, by the market
Decision-Useful
Cost-Effective
Material
Industry-Specific
Evidence-Based
Market-Informed
5 © 2016 SASB™3/14/2016
Agenda Item 7a, Attachment 1, Page 5 of 30

SASB’s View of SustainabilitySASB identifies disclosure topics across five key dimensions of sustainability
6
Environment• GHG emissions• Air quality • Energy management• Fuel management• Water and wastewater
management• Waste and hazardous
materials management• Biodiversity impacts
Social capital• Human rights and community
relations• Access and affordability• Customer welfare• Data security and customer
privacy• Fair disclosure and labeling• Fair marketing and advertising
Human capital• Labor relations• Fair labor practices• Diversity and inclusion• Compensation and benefits• Recruitment, development,
and retention
Business model and innovation• Lifecycle impacts of products
and services• Environmental and social
impacts on assets and operations
• Product packaging • Product quality and safety
Leadership and governance• Systemic risk management• Accident and safety
management• Business ethics and
transparency of payments• Competitive behavior• Regulatory capture and
political influence• Materials sourcing• Supply chain management
Business model and innovation
Social capital
Human capital
Leadership and
governance
Environment
UNIVERSE OF SUSTAINABILITY
ISSUES
© 2016 SASB™3/14/2016
Agenda Item 7a, Attachment 1, Page 6 of 30

Designed for Integration Into Mandatory Public FilingsAn integrated reporting environment without regulation
7 © 2016 SASB™3/14/2016
True and fair representation of performance on material factors
SASB Accounting Metrics
US GAAP
Agenda Item 7a, Attachment 1, Page 7 of 30

Definition of Materiality from an Investor’s PerspectiveSASB is guided by the U.S. Supreme Court definition in identifying disclosure topics
8
“Material information” is defined by the U.S. Supreme Court as presenting a substantial likelihood that the disclosure of the omitted fact would have been viewed by the reasonable investor as having significantly altered the “total mix” of information made available.
TSC Industries, Inc. v. Northway, Inc., 426 U.S. 438 (1976)
3/14/2016 © 2015 SASB™
Agenda Item 7a, Attachment 1, Page 8 of 30

A Market-Driven ResponseSASB addresses needs of all market participants—both investors and issuers
9
Issuers
A minimum set of disclosure topics that are likely to have material impacts on companies in an industry
Cost-effective disclosures using industry-standard metrics
Ability to benchmark performance against competitors and set targets for improving performance
A way to satisfy the requirements of Regulation S-K in the U.S. and Directive 2014/95/EU in Europe
Investors
Standardized, publicly available information on material sustainability factors
Comparable data for benchmarking and evaluating company performance
Reliable information in a trusted channel subject to internal controls (i.e., 10-K and 20-F)
Metrics to guide more focused corporate engagement efforts
© 2016 SASB™3/14/2016
Agenda Item 7a, Attachment 1, Page 9 of 30

Balanced ParticipationSASB’s standards-setting process is inclusive and informed by industry expertise
© 2016 SASB™10
IWG Participation
31%Corporate
Professionals
31%Investors
37%Public Interest & Intermediaries $11.0T
SASB INDUSTRY WORKING GROUPS REFLECT BROAD-BASED INTEREST
PARTICIPANTS
>2,800
ASSETS UNDER MANAGEMENT
$23.4T
MARKET CAPITALIZATION
3/14/2016
Agenda Item 7a, Attachment 1, Page 10 of 30

Rigorous, Transparent ProcessSASB standards are rooted in evidence and shaped by consensus
11
IndustryResearch Vetting
Public Comment
ProvisionalStandardsRelease
StandardsDevelopment
Evidence-based discovery
Industry working group engagement and evaluation
Disclosure topics and metrics consensus and definition
Feedback and refinement
Road testing by companies
UNIVERSE OF ESG ISSUES
UNIVERSE OF ESG ISSUES
Codification
© 2016 SASB™
2016: Deep consultation with issuers, internal review, cost-benefit analysis2017: Code and basis for conclusion
3/14/2016
Agenda Item 7a, Attachment 1, Page 11 of 30

Known Value DriversSASB standards address business issues known to impact value creation and risk
12
FinancialImpact
Types of Financial Drivers
COST OF CAPITALREVENUE COST ASSETS &
LIABILITIES
Demand for Core Products and Services
Intangible Assets and Long-Term
Growth
Operational Efficiency/Cost
Structure
Valuation of Core Assets
and Liabilities
Governance, License to
Operate and Risk
© 2016 SASB™
SASB Disclosure Topics & Metrics(Industry-Specific)
Evidence of Impact
3/14/2016
Agenda Item 7a, Attachment 1, Page 12 of 30

Shaped By ConsensusSASB topics must achieve a high level of consensus among all stakeholder types
13 © 2016 SASB™
0
10
20
30
40
50
60
70
80
90
100
Health Care Financials Technology &Communications
Non-RenewableResources
Transportation Services ResourceTransformation
Consumption 1 Consumption 2 RenewableResources &Alternative
Energy
Infrastructure
Per
cen
tage
Stakeholder-specific feedback on likely materiality of all proposed disclosure topics(% of respondents, by interest group, who think suggested topics are likely to constitute material information)
All % Corporations % Investors/Analysts %
3/14/2016
Agenda Item 7a, Attachment 1, Page 13 of 30

14
Supported by External ResearchHarvard research validates SASB’s standards-development process
“Corporate Sustainability: First Evidence on Materiality,” Working Paper by Mozaffar Khan, George Serafeim, and Aaron YoonHarvard Business School, 2015
Findings:
Using SASB’s framework, Harvard researchers found that firms with good performance on ‘material sustainability issues’ and concurrently poor performance on ‘immaterialsustainability issues’ enjoy the strongest financial returns. These results speak to the efficiency of firms’ sustainability investments, and also have implications for asset managers who have committed to the integration of sustainability factors in their capital allocation decisions.
They also found that 80 percent of disclosures are immaterial, having no correlation to positive performance.
3/14/2016 © 2016 SASB™
Agenda Item 7a, Attachment 1, Page 14 of 30

Robust StandardsSASB standards contain industry-specific disclosure topics, metrics, and guidance
15 © 2016 SASB™
SASB Standard
Industry-specific
disclosure topics
Technical protocol for
compiling data
Accounting metrics for each disclosure topic
3/14/2016
Agenda Item 7a, Attachment 1, Page 15 of 30

16
Cost-Effective DisclosuresSASB provides a cost-effective way to report on material sustainability factors
SASB standards average 5 topics and 14 metrics (78 percent quantitative) per industry.
3/14/2016 © 2016 SASB™
SASB metrics are aligned with existing frameworks, regulations, and certifications whenever possible.
Agenda Item 7a, Attachment 1, Page 16 of 30

17 © 2016 SASB™
Major Themes from Standards SettingInteresting patterns have begun to emerge after 10 sectors and 79 industries
CLIMATE CHANGEEvent readiness in health care delivery, carbon intensity of reserves in oil and gas, emissions from refining, vulnerability of real estate and insurance, impact on crop yields
PRODUCT ALIGNMENT & SAFETYCounterfeit drugs, food quality and nutrition, car and airline safety, responsible gambling and drinking, product design and take-back
RESOURCE INTENSITY & SCARCITY24/7 health care facilities and data centers, fuel management in transportation, rare earth minerals in manufacturing, water consumption in beverages, oil and gas, and agriculture
ACCESS & AFFORDABILITY OF SERVICESOrphan drugs and pricing, access to medicine and coverage, transparency in procedures and billing, financial inclusion and capacity building
FINANCING & RESPONSIBLE LENDINGResponsible lending and transparency of terms in mortgages, consumer finance and education, financial literacy initiatives
$33.8T
$29.1T
$26.9T
$8.3T
$3.9T
Market cap of companies affected
Percentage of U.S. equity market
93%
80%
75%
23%
11%
3/14/2016
Agenda Item 7a, Attachment 1, Page 17 of 30

18 © 2016 SASB™
Climate Change: Ubiquitous But DifferentiatedClimate change affects majority of capital markets, but industry impacts are unique
Event readiness in Health Care Delivery
Carbon intensity of reserves in Oil & Gas – Exploration & Production
Emissions from refining in Oil & Gas –Refining & Marketing
Vulnerability of real estate in Insurance
Impact on crop yields in Agricultural Products
Financed emissions in Commercial Banks
$33.8TMarket cap of companies affected
Percentage of U.S. equity market impacted
93%
CLIMATE CHANGEImpacts 72 of 79 industries
Source: SASB Research, September 2015
3/14/2016
Agenda Item 7a, Attachment 1, Page 18 of 30
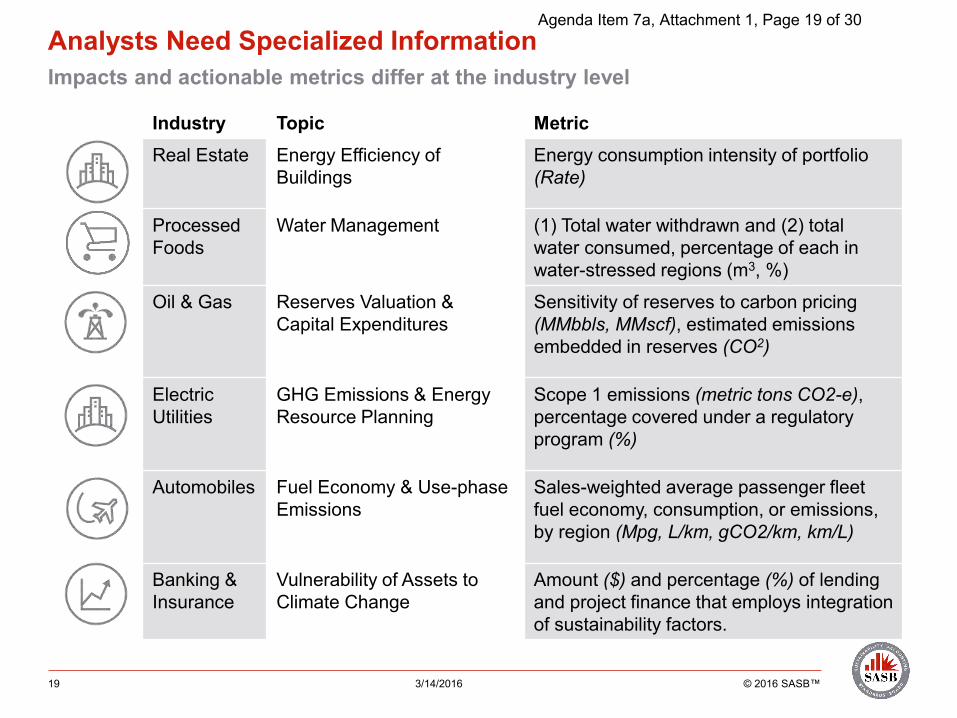
Industry Topic MetricReal Estate Energy Efficiency of
BuildingsEnergy consumption intensity of portfolio (Rate)
Processed Foods
Water Management (1) Total water withdrawn and (2) total water consumed, percentage of each in water-stressed regions (m3, %)
Oil & Gas Reserves Valuation & Capital Expenditures
Sensitivity of reserves to carbon pricing (MMbbls, MMscf), estimated emissions embedded in reserves (CO2)
ElectricUtilities
GHG Emissions & Energy Resource Planning
Scope 1 emissions (metric tons CO2-e), percentage covered under a regulatory program (%)
Automobiles Fuel Economy & Use-phase Emissions
Sales-weighted average passenger fleet fuel economy, consumption, or emissions, by region (Mpg, L/km, gCO2/km, km/L)
Banking & Insurance
Vulnerability of Assets to Climate Change
Amount ($) and percentage (%) of lending and project finance that employs integration of sustainability factors.
Analysts Need Specialized InformationImpacts and actionable metrics differ at the industry level
19 3/14/2016 © 2016 SASB™
Agenda Item 7a, Attachment 1, Page 19 of 30

20 © 2016 SASB™
SASB’s Climate Risk FrameworkSASB frames the impacts of the climate change in a way that is relevant to investors
3/14/2016
Agenda Item 7a, Attachment 1, Page 20 of 30

21 © 2016 SASB™
Types of Climate Risk Across IndustriesSASB has mapped climate risk for all industries of the economy
3/14/2016
Agenda Item 7a, Attachment 1, Page 21 of 30

Carbon Footprint is Not EnoughGHG emissions are important, but other more prevalent risks are poorly disclosed
© 2016 SASB™22
0% 20% 40% 60% 80% 100%
Type of risk
Affected market
cap
% of U.S. equity market
OVERALL CLIMATE RISK $27.5T 93%
Physical Effects $18.1T 61%
Transition to a Low-
Carbon Economy$26.3T 89%
Climate Regulation $6.3T 21%
Capital markets data from Jan. 4, 2016; figures for U.S.-listed, non-OTC securities; figures include impacts from both primary and secondary risk types; disclosure data from FY 2012-2014 10-K and 20-F filings of the top 10 U.S.-listed companies by revenue for each industry, resulting in a total of 690 companies.
State of Disclosure on Climate Risk in 10-K and 20-F
3/14/2016
Agenda Item 7a, Attachment 1, Page 22 of 30

Cost-Effective AlignmentSample of how SASB climate metrics align with a variety of approaches already in use
© 2016 SASB™23 3/14/2016
Agenda Item 7a, Attachment 1, Page 23 of 30

Climate risk manifests differently in each industry
Understanding climate risk requires specialized disclosures
Climate risk is systemic in nature
SASB and Climate RiskA look at investor exposure to climate risk and an analysis of corporate disclosure
24 3/14/2016 © 2016 SASB™
Climate risk has tangible, identifiable financial implications
Climate risk is not adequately disclosed
Agenda Item 7a, Attachment 1, Page 24 of 30

Making An ImpactSASB standards draw wide interest across the global capital markets
© 2016 SASB™25
50%
4%
32% Other Countries
4%
6%4%
STANDARDS DOWNLOADSby
>55,000
Top Equity Markets1. U.S. ($26.1T)2. E.U. ($7.6T)3. China ($6.3T)4. Japan ($4.5T)5. India ($3.3T)
Equity Market Source: WFE, January 2016
>6,000USERSin
>110COUNTRIES
Figures represent percentage of total standards downloads by region
3/14/2016
Agenda Item 7a, Attachment 1, Page 25 of 30

SASB standards are designed for use by investors,supplying information that is material, decision-useful, and cost-effective
SASB standards are developed through a rigorous process,that is evidence-based, transparent, and involves broadmarket participation
SASB provides a market standard for the public disclosure of material sustainability information
Toward a Market StandardStandardized disclosure promotes market efficiency and sustainable outcomes
26 © 2016 SASB™3/14/2016
Agenda Item 7a, Attachment 1, Page 26 of 30

Agenda Item 7a, Attachment 1, Page 27 of 30
© 2016 SASB™
Appendix
Agenda Item 7a, Attachment 1, Page 28 of 30

29 © 2016 SASB™
Water RiskSASB’s disclosure topics cover a range of industry-specific impacts from water risk
Crop cultivation and product processing in Agricultural Products
Environmental footprint of hardware infrastructure in Software & IT Services
Access and production efficiency in Alcoholic and Non-Alcoholic Beverages
Water-intensity of manufacturing in Chemicals
Water use for hydrating, cleaning, cooling, and waste disposal in Meat, Poultry & Dairy
$18.0TMarket cap of companies affected
Percentage of U.S. equity market impacted
50%
WATERImpacts 32 of 79 industries
Source: SASB Research, September 2015
3/14/2016
Agenda Item 7a, Attachment 1, Page 29 of 30

Industry Topic Metric
Pharma-ceuticals
Water Efficiency Process Mass Intensity (PMI) for water (kg input to kg API output)
Semi-conductors
Water Management in Manufacturing
Total water withdrawn (m3), percentage (%)recycled and from water-stressed regions
Processed Foods
Environmental Impacts of Ingredient Supply Chains
Food ingredients sourced from water-stressed regions (%)
Oil & Gas Water Management Hydraulically fractured wells where ground or surface water quality deteriorated compared to a baseline (%)
Chemicals Water Management Number of incidents of non-compliance with water quality permits, standards, and regulations (#)
Meat, Dairy & Poultry
Environmental Impacts of Animal Supply Chains
Contract producers in water-stressed regions (%)
SASB’s Water-Related Disclosure Topics and MetricsImpacts and actionable metrics differ at the industry level
30 © 2016 SASB™3/14/2016
Agenda Item 7a, Attachment 1, Page 30 of 30
![Meyer Schapiro on style in art and science · Terry Smith Meyer Schapiro on style in art and science 2 square brackets] for those lectures when Schapiro did not announce one. Taking](https://img.pdfslide.us/doc/110x75/5e8008101768de1fca76ddcc/meyer-schapiro-on-style-in-art-and-science-terry-smith-meyer-schapiro-on-style-in.jpg)