Embed Size (px)
Citation preview
PH: S0273-1223(96)00374-5
8) Pergamon Waf. Sci. T~ch. Vol. 33. No.9. pp. 93-99. 1996Copyright @ 19961AWQ. Published by Elsevier SCIence Ltd
Prmted In Greal Brilain. All righls reserved.0273-1223196 $15'00 + 0'00
SUSPENDED SOLIDS IN COMBINEDSEWER FLOWS
Kapil Gupta and Adrian J. Saul
Department ofCivil and Structural Engineering. The University ofSheffield.Mappin Street. Sheffield SI 4DT, UK
ABSTRACf
Many studies have identified the first flush phenomenon as being the relatively high concentration ofpollutants in the initial phases of combined sewer flow following a storm. One way of controlling the firstflush is by the provision of a storage tank such that the effluent can be discharged in a controlled manner. Tooptimise the storage volume, both the total pollutant load discharged and the temporal variation in pollutantconcentration within an event need to be predicted. Sophisticated models to predict the pollutantconcentrations in urban sewer flows, for example QSIM and MOUSETRAP are already available. However,the data requirements for these models are extensive. which usually limit their application to major orenvironmentally sensitive schemes.
This paper describes attempts to relate the peak concentration of suspended solids in combined sewer flowsto observed storm characteristics. In this study, it was hypothesised that the peak c',ncentrations of suspendedsolids could be related to the hydrological parameters of maximum rainfall intensity, storm duration, andantecedent dry weather period prior to the storm which are commonly used as the basic parameters for urbansewer design. Data from two sites at Great Harwood and Clayton-Ie-Moors in the North-west of England hasbeen used in the study and an attempt has been made to define an upper limit of the first flush concentrationof suspended solids corresponding to storms which have been categorised into bands defined by their peakrainfall intensity. Copyright © 1996 IAWQ. Published by Elsevier Science Ltd.
KEYWORDS
Combined sewer flows; first flush; peak concentrations; peak loads; sewer sediments; suspended solids;urban stormwater pollution.
INTRODUCfION
The focus of urban drainage in the 1990s has shifted from not only the need to provide structurally sounddrainage systems with an adequate hydraulic capacity but also to meet environmental quality objectives forreceiving watercourses. There has therefore been a need to identify cost-effective management solutions andto develop appropriate technical procedures and tools for the control of urban sewer flow quality. Nationalprogrammes of research. for example. the US Environmental Protection Agency's (EPA) National UrbanRunoff Programme. the Urban Pollution Management Programme in the UK and the French NationalProgramme on Runoff Pollution have been carried out to address these issues and these programmes havehighlighted the need for an integrated catchment wide approach to pollution control.
To minimise the pollutants discharged to the receiving watercourse. it is frequently recommended thatstorage tanks be incorporated into the design of combined sewer systems. If such tanks are to be effective in
93
94 K. GUPTA and A. J. SAUL
controlling the level of pollutants discharged to the environment, it is important that the optimum pollutionload is retained within the system for a minimum storage volume and at an economic construction cost.Presently, the preferred approach is to base the size and location of the storage volume on environmentalquality standards to meet agreed environmental quality objectives of receiving waters. Mathematicalsimulation models to predict the quality of sewer flows, (QSIM and MOUSETRAP) have been developedfor this purpose. It is now possible to utilise this suite of mathematical models to predict the effect of the sizeand location of a storage tank within a particular sewer system catchment and these models have been shownto be capable of producing acceptable results and to aid the decision process. However, the data collectionrequirements of these and other detailed quality models are quite onerous which limit the application ofthese models to major investigations (Clifforde and Tyson, 1993). It has been recommended in the UrbanPollution Management (UPM) Manual (FWR, 1994) that a simplified urban pollution model should bedeveloped for most planning studies even when detailed models are being used. A simpler approach is tobase the design methodology to estimate the required size of a storage tank on empirically derivedrelationships between the pollutants (concentration and load) in the sewer flow and the hydrological andcatchment characteristics which influence the sewer flow quality.
In this study, it was hypothesised that the peak concentrations of suspended solids could be related to thehydrological parameters of maximum rainfall intensity, storm duration, and antecedent dry weather period(ADWP) prior to the storm which are commonly used as the basic parameters of design for urban sewerdesign. Data from two sites at Great Harwood and Clayton-Ie-Moors in the North-west of England havebeen used in the study and an attempt has been made to define an upper limit of the first flush concentrationof suspended solids corresponding to storms which have been categorised into bands defmed by their peakrainfall intensity.
THE FIRST FLUSH
The first flush of pollutants has been identified as the relatively high proportion of the total storm pollutionload that occurs in the initial part of the combined sewer runoff. Thornton and Saul (1986) and Pearson et al.(1986) defined the first flush as the initial period of storm flow during which the concentration of pollutantswas significantly higher than those observed during the latter stages of the storm event. Previous studiese.g., Ashley et al. (1992), Geiger, (1987), Mance, (1982), Saul and Thornton, (1988) and Stotz and Krauth:(1984) have highlighted that the time of day, the antecedent dry weather conditions, the length of theantecedent dry weather period, the magnitude and pollutant characteristics of the dry weather and the stonnflows, together with the characteristics of the sewer system and the layout and size of the catchment area, allinfluence the temporal variability in the concentration and the load of the pollutants. Also, the depositedsediment in sewers during the dry weather period may be re-entrained and transported downstream as a firstflush in the concentration and load of pollutants.
Many research studies have identified, for example, Jewell and Adrian (1982), that the derivation offunctional relationships between stormwater pollutant loadings and various independent variables was madedifficult by two main factors. First, the inherent variability of stormwater data caused by the random natureof storm events and associated sampling and analysis errors, and secondly, by the large number ofindependent variables and parameters that may influence stormwater pollution washoff. Various studies(H6main, 1981; Jewell and Adrian. 1982; Desbordes and Servat, 1984; Pearson et al., 1986; Driver andTroutman, 1989; Gupta and Saul, 1994) utilising multiple stepwise regression techniques have been made todevelop predictive equations relating stormwater runoff pollutant concentrations and loadings to storm andcatchment characteristics, for example, average intensity of runoff, total volume of runoff, peak rainfallintensity and the antecedent dry weather period. The work presented in this paper attempts to define the peakconcentration of suspended solids in the first flush to the various storm characteristics and the sewer flowcharacteristics.
DATA USED
Suspended solids 9S
The data used in this study are based on the results of a fieldwork monitoring programme of research carriedout at Great Harwood in the Northwest of England (Thornton and Saul. 1986). This work fonned part of theUK Urban Pollution Management (UPM) programme of research in which a comprehensive water qualitysampling and monitoring programme was carried out in an attempt to characterise the pollution in bothstonnwater and combined sewer flow. The samples were usually analysed for TSS, COD, BOD, NH4N andVSS and the results of this work are held on an extensive data base known as the WRc Sewer QualityArchive (1987). Further details of both site and instrumentation have been reported elsewhere (Saul andThornton, 1988). At Clayton-Ie-Moors a total of 210 storms were monitored and of these 71 were deemed"GOOD". with a "GOOD" stonn being one which had a full rainfall record and at least three flow andquality samples. whilst the results of 52 were defined as "BEST" where a "BEST" stonn was defined as onefor which the data included a full rainfall record. a complete tlow record for at least an hour. and at least fourflow and quality data points in the first hour of the event. In the present study, only the stonns labelled"BEST" have been used to characterise the relationships between pollutant load and runoff. The totalnumber of storms recorded at Great Harwood was 230 and of these 79 and 57 were classified in the"GOOD" and "BEST" category respectively. In addition. it has been shown that the AOWP was consideredan important factor contributing to the first flush of pollutants in the sewer system. and hence only thosestonns for which the AOWP was known have been used in this analysis. This resulted in 34 "BEST" stormsat Great Harwood and 38 "BEST" storms at Clayton-Ie-Moors being considered for further study. However.a subsequent visual examination of the stonns highlighted that for a few events having a peak rainfallintensity of < 10 mmlhr. uncharacteristically high peaks in pollutant concentration that did not correspond topeaks in rainfall or flowrate were observed and for these stonns it was therefore hypothesised that the peaksof pollution were derived from sources other than the rainfall runoff or in-sewer sediment processes, forexample. industrial discharges. Considering the fact that a large number of industries were located in thevicinity of the catchments, it was highly likely that these large values of pollutant concentrations werecaused by such industrial inputs and hence the events which exhibited such high concentrations in pollutionwere subsequently omitted from the data set.
POLLUTOGRAPH COMPARISONS
from the results obtained in an earlier study (Gupta and Saul, 1994). the first flush load was shown to be afunction of the maximum rainfall intensity, the AOWP and the stonn duration. The maximum rainfallintensity has been identified to be an important variable, because it is the impact of the falling rainfall thatcontributes to the rate of the washoff of surface pollutants and sediments and subsequently thecorresponding peak magnitude of the sewer flow intluences the movement of the in-sewer sediments withinthe sewer system. The AOWP has been identified as important, because it detennines the length of theperiod for which pollutants are allowed to build-up over the catchment surface and in the sewer system. Thestonn duration was considered important. because this has an influence on the exhaustion of the sources ofpollution and due to the fact that in flow full or surcharged systems which take a long time to empty. thepollutants may be deposited in the sewers during the recession limb of the sewer flow hydrograph. However.the peak TSS concentration was poorly correlated to the maximum rainfall intensity. the AOWP and thestonn duration. It was therefore hypothesised that some relationship might be obtained if the pollutographs(expressed as concentrations (mg/l) of each stonn) were classified by these three variables namely. themaximum rainfall intensity, AOWP and stonn duration. Therefore, for both the Great Harwood and Clayton•Ie-Moors catchment, the analysis was carried out by classifying the pollutographs of the observed storms asfollows:
(a) By stonn duration : All the pollutographs having durations in the range of 1-2 hours were plottedtogether (Storms of duration less than I hour were not considered because the BEST storms were defined asthose with a minimum record of I hour). These were then examined visually in an attempt to observe anypatterns or trends in the peak value and shape of the pollutograph as a function of the stonn duration. Thisanalysis was repeated for the pollutographs of stonns with durations in the range of 2-3 hrs and >3 hrs. Thestonns were also sub classified as occurring either in SUMMER (May-October) or WINTER (November -....'n,t-f
96 K. GUPTA and A. J. SAUL
April) (FSR. 1975) and were plotted together with the durations as mentioned above. However. no trendswere observed.
(b) By antecedent dO' weather period fADWP): The poUutographs were classified in the following arbitraryrange of ADWP, i.e. <12 hrs, 12-24 hrs, and >24 hrs and sub-classified as occurring either in SUMMER orWINTER. Again. observations of the storms within each category revealed that there was no noticeablerelationship between the peak and shape of the pollutograph to the ADWP.
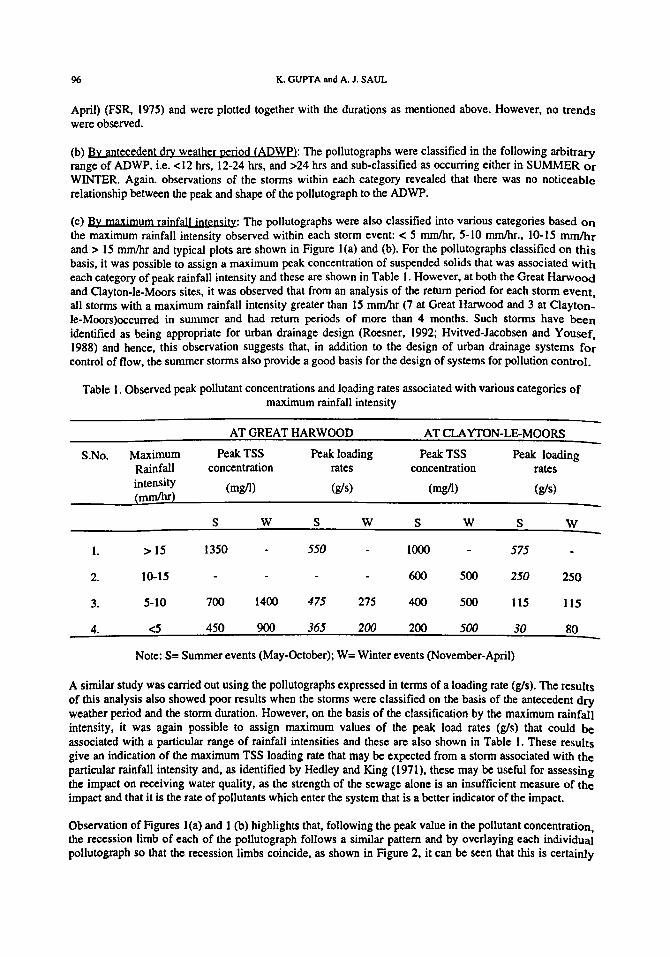
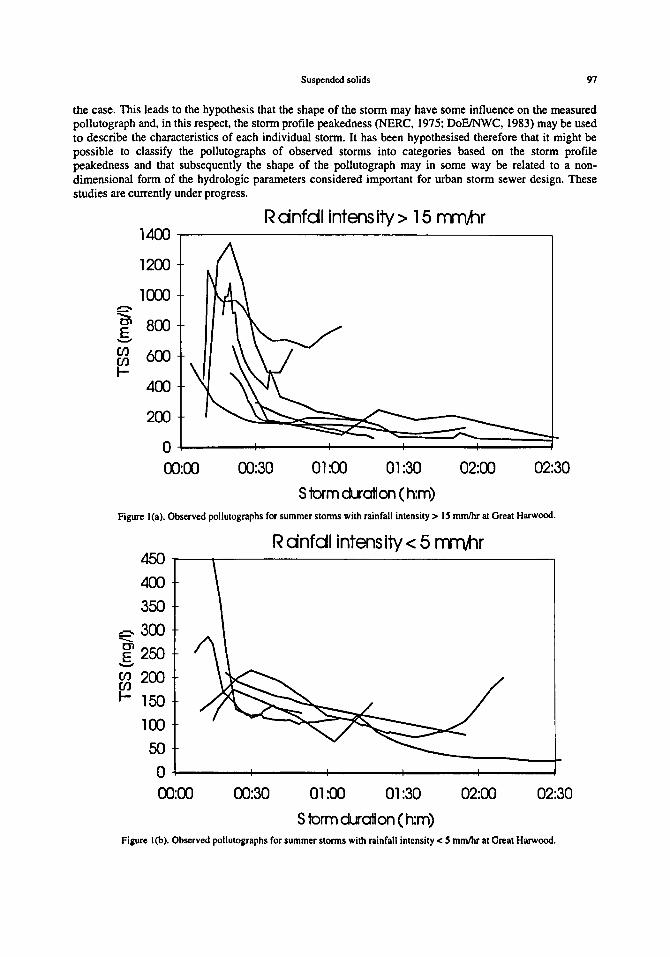
(c) By maxjmum rajnfall intensity: The pollutographs were also classified into various categories based onthe maximum rainfall intensity observed within each storm event: < 5 mmlhr, 5-10 mmIhr., 10-15 rnmIhrand> 15 mm/hr and typical plots are shown in Figure l(a) and (b). For the pollutographs classified on thisbasis. it was possible to assign a maximum peak concentration of suspended solids that was associated witheach category of peak rainfall intensity and these are shown in Table I. However. at both the Great Harwoodand Clayton-Ie-Moors sites, it was observed that from an analysis of the return period for each storm event.all storms with a maximum rainfall intensity greater than IS mmIhr (7 at Great Harwood and 3 at Clayton•le-Moors)occurred in summer and had return periods of more than 4 months. Such storms have beenidentified as being appropriate for urban drainage design (Roesner. 1992; Hvitved-Jacobsen and Yousef.1988) and hence, this observation suggests that, in addition to the design of urban drainage systems forcontrol of flow. the summer storms also provide a good basis for the design of systems for pollution control.
Table 1. Observed peak pollutant concentrations and loading rates associated with various categories ofmaximum rainfall intensity
AT GREAT HARWOOD AT CLAYTON-LE-MOORS
S.No. Maximum Peak TSS Peak loading PeakTSS Peak loadingRainfall concentration rates concentration ratesintensity (mgll) (gls) (mgll) (gls)(mmJhr)
S W S W S W S W
1. > 15 1350 550 1000 575
2. 10-15 600 500 250 250
3. 5-10 700 1400 475 275 400 500 115 115
4. <5 450 900 365 200 200 500 30 80
Note: S= Summer events (May-October); W= Winter events (November-April)
A similar study was carried out using the pollutographs expressed in terms of a loading rate (gls). The resultsof this analysis also showed poor results when the storms were classified on the basis of the antecedent dryweather period and the storm duration. However, on the basis of the classification by the maximum rainfallintensity, it was again possible to assign maximum values of the peak load rates (g/s) that could beassociated with a particular range of rainfall intensities and these are also shown in Table 1. These resultsgive an indication of the maximum TSS loading rate that may be expected from a storm associated with theparticular rainfall intensity and. as identified by Hedley and King (1971), these may be useful for assessingthe impact on receiving water quality, as the strength of the sewage alone is an insufficient measure of theimpact and that it is the rate of pollutants which enter the system that is a better indicator of the impact.
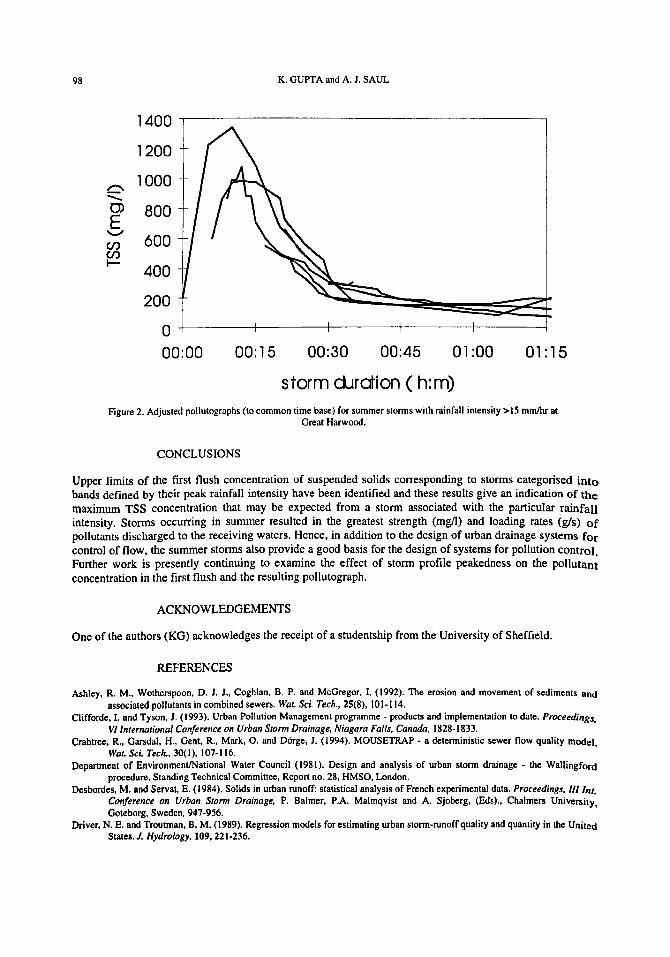
Observation of Figures I(a) and 1 (b) highlights that. following the peak value in the pollutant concentration.the recession limb of each of the pollutograph follows a similar pattern and by overlaying each individualpollutograph so that the recession limbs coincide, as shown in Figure 2. it can be seen that this is certainly
Suspended solids 97
the case. This leads to the hypothesis that the shape of the storm may have some influence on the measuredpollutograph and, in this respect, the storm profile peakedness (NERC, 1975; DoFlNWC, 1983) may be usedto describe the characteristics of each individual storm. It has been hypothesised therefore that it might bepossible to classify the pollutographs of observed storms into categories based on the storm profilepeakedness and that subsequently the shape of the pollutograph may in some way be related to a non•dimensional form of the hydrologic parameters considered important for urban storm sewer design. Thesestudies are currently under progress.
Rdnfdl intens ity > 15 I'TlTVhr1400
1200
leXXlC'-.C'I 800E.........
Cf.l 600Cf.lI-
400
200
000:00 00:30 01:00 01:30
S10rm duration (h:m)
02:00 02:30
Figure I(a). Observed pollutographs for summer storms with rainfall intensity> 15 mm/hr at Great Harwood.
Rdnfdl intens ity < 5 rrmtlr
02:3002:0001:00 01:30
S10rm duration (h:m)
00:30
4SO r---~------------------,
400350
C'3oo-.~250.........~ 2001-150
100
50
O-lo----+------+-----+-----l-------f00:00
Figure I(b). Observed pollutographs for summer storms with rainfall intensity < 5 mmlhr at Great Harwood.
98 K. GUPTA and A. J. SAUL
1400
1200
,.-... 1000::::::::.0> 800E'-J
600en~
400
200
000:00 00:15 00:30 00:45 01 :00 01: 15
storm ciJrdion ( h: m)Figure 2. Adjusted pollutographs (to common time base) for summer storms with rainfall intensity >15 mmlhr at
Great Harwood.
CONCLUSIONS
Upper limits of the first flush concentration of suspended solids corresponding to storms categorised intobands defined by their peak rainfall intensity have been identified and these results give an indication of themaximum TSS concentration that may be expected from a storm associated with the particular rainfallintensity. Storms occurring in summer resulted in the greatest strength (mgll) and loading rates (gls) ofpollutants discharged to the receiving waters. Hence, in addition to the design of urban drainage systems forcontrol of flow, the summer storms also provide a good basis for the design of systems for pollution control.Further work is presently continuing to examine the effect of storm profile peakedness on the pollutantconcentration in the first flush and the resulting pollutograph.
ACKNOWLEDGEMENTS
One of the authors (KG) acknowledges the receipt of a studentship from the University of Sheffield.
REFERENCES
Ashley, R. M.• Wotherspoon, D. J. J., Coghlan, B. P. and McGregor. 1. (1992). The erosion and movement of sediments andassociated pollutants in combined sewers. Wat. Sci. Tech., 25(8). 101-114.
Clifforde, I. and Tyson. J. (1993). Urban Pollution Management programme - products and implementation to date. Proceedings.VI International Conference on Urban Storm Drainage, Niagara Falls. Canada. 1828-1833.
Crabtree, R.. Garsdal, H., Gent. R.. Mark. O. and D6rge, J. (1994). MOUSETRAP - a deterministic sewer flow quality model.Wat. Sci. Tech.• 30(1).107-116.
Department of EnvironmentlNational Water Council (1981). Design and analysis of urban storm drainage - the Wallingfordprocedure, Standing Technical Committee, Report no. 28, HMSO, London.
Desbordes, M. and Servat. E. (1984). Solids in urban runoff: statistical analysis of French experimental data. Proceedings. 1// Int.Conference on Urban Storm Drainage, P. Balmer. P.A. Malmqvist and A. Sjoberg. (Eds)., Chalmers University,Goteborg, Sweden, 947-956.
Driver. N. E. and Troutman. B. M. (1989). Regression models for estimating urban storm-runoff quality and quantity in the UnitedStates. J. Hydrology, 109.221-236.
Suspended solids 99
Ellis. J. B. (1989). The quality of urban discharges. In: Urban discharges and receiving water quality impacts. Advances in waterpollution control No.7. Pergamom Press, Oxford, 1-8.
Foundation for Water Research, UK (1994). Urban Pollution Management Manual.Geiger, W. F. (1987). Flushing Effects in Combined Sewer Systems. Proceedings, IV Intemational Conference on Urban Storm
Drainage, Lausanne. 40-46.Gupta, K. and Saul, A. J. (1994). Storage tank design for the retention of pollutants. Proceedings HYDROTOP'94, April 12-15.
Marseilles, France.Hedley. G. and King. M. V. (1971). Suggested correlation between storm sewage characteristics and storm overflow performance.
Proc. ICE, 48. 399-411.Hemain. J. C. (1981). Statistical analysis of runoff quality data from French and US catchments. Procudings. II International
Conference on Urban Storm Drainage. Urbana, Illinois. USA, June 14-19. vol. 2, 133-140.Hvitved-Jacobsen. T. and Yousef. Y. A. (1988). Analysis of rainfall series in the design of urban drainage control systems. Wat.
Res.. 22(4), 491-496.Jewell, T. K. and Adrian, D. D. (1982). Statistical Analysis to derive improved stormwater quality models. J. Water Pollut.
Control Fed., 54.489-499.Mance. G. (1982). Factors affecting the quality of urban storm discharges in the UK. I International Seminar on Urban Drainage
Systems, Sept. 7-9, 317-337.Natural Environment Research Council (1975). Flood Studies Report. UK.Pearson, L. G.• Thornton, R. c.. Saul, A. 1. and Howard, K. (1986). An introductory analysis of the factors affecting the
concentration of pollutants in the first foul flush of a combined storm sewer system. Proceedings, IntemationalConference on Urban Stormwater Quality and Effects Upon Receiving Waters. Wageningen, 93-102.
Roesner. L. A. (1992). Current water quality issues in storrnwater management in the United States. Proceedings. InternationalSymposium on Urban Stonnwater Management, Sydney. February 4-7. 428-439.
Saul. A. J. and Thornton. R. C. (1988). Hydraulic performance and control of pollutants discharged from a combined sewerstorage overflow. Wat. Sci. Tech., 21(819), 747-756.
Stotz, G. and Krauth. K. L. (1984). Factors affecting first flushes in combined sewers. Proceedings, III Int. Conference on Urbanstonn drainage. Goteborg. Sweden. June 4-8. 869-878.
Thornton. R. C. and Saul, A. J. (1986). Some quality characteristics of combined sewer flows. Public Health Engineer, 14,35-38.Water Research Centre. Swindon. UK (1987). Sewer Flow Quality Archive.