Embed Size (px)
Citation preview
Suspended Particles and Urban Design Criteria: High Resolution Measurement of Respiratory Health and Geospatial information for Newborns and Young Children in Barcelona and Portland
Philip SperanzaSperanza-Viader Urban Design & Computing
University of Oregon321 Mill Street, Suite 5Eugene, Oregon, 97401
Marc ViaderSperanza-Viader Urban Design & Computing
Institute of Advanced Architecture of CatalunyaAvinguda Sarri 19, 6 6
Barcelona, Catalunya, Spain, [email protected]
1 Introduction
Unborn, new-born and young children’s physiological development may be significantly affected by the air quality in urban environments. This requires not only knowledge of air quality including suspended particles but small-scale geospatial understanding of public space. Respiratory and neurological diseases in children such as asthma and air born chemicals have been linked together by health specialists in Europe and the United States [1] [2]. The air quality in the public space where these sensitive members of society pass through, play, eat and learn goes mostly unmeasured at the small-scale. Most US and European cities possess fewer than five active suspended particle PM air quality stations for any single airborne quality.
This research investigates the creation of an affordable handheld instrument and geospatial analysis tool at the small scale of suspended particles PM 2.5 and smaller 0.5 micrometers with urban design characteristics. Measurements are taken along sidewalks in Barcelona’s Eixample neighborhood, and in Portland, Oregon’s Pearl neighborhood: 1) at 33m increments across standard 100m blocks in a 3 x 3 block test area and 2) along the daily route of a typical two-year-old child from home to public realm and back. The study uses expertise in computing, urban design and health science using parametric architectural software and table-based quantitative, qualitative and geospatial information to empower behavioral change.
Keyword
Air Pollution, Parametric, Urban, Architecture

2 Background / Contextualization
Identification of sample air quality criteria
The identification of a first air quality criteria to measure and analyze air pollution began by researching the following list of US EPA criteria publically accessible via web-based maps of major cities:
CO CO2 Lead - TSP (LC) Lead - PM10 (LC) NO NO2 Ozone PM10 PM2.5 SO2 PM2.5 (limited) IMPROVE - Interagency Monitoring of Protected Visual Environments NATTS - National Air Toxics Trends Stations NCore - NCore Multi-pollutant Monitoring Network
We subsequently interviewed respiratory health expert Jordi Sunyer at the Centre for Environmental Research in Barcelona. We identified suspended particles PM 2.5 as effective criteria, especially contributions from automobile combustion, disc brakes and rubber tires. In 2006 Barcelona’s annual average PM count was 50µg/m3 with OMS recommendation not to exceed 20µg/m3 without sensitivity to asthma and bronchitis in children [3](WHO).
Table 1: Concentrated PM10 observed in world cities, World Health Organization, OMS
Scale of measured criteria: urban design and computing context
Suspended particles go unmeasured at the small-scale of public space related to urban form, parcel use and transportation. Manhattan, for example, has only one active PM sensor located below Canal Street. In Portland, Oregon, only one active sensor exists [4]. One PM sensor exists in the Eixample study area in downtown Barcelona L’aire. The investigation focuses on the street level space in front of buildings. 100 x 100 meter long Eixample blocks are measured at twelve locations in Barcelona and 200 x 200 feet long blocks in Portland in later data collection.
Measurement in cities using the senses [5] [6] complements top down formal design. Everyday experiences over time, or phenomenon, may be measured [7] and urban activities may emerge from ‘loose spaces’ in cities [8]. Carlo Ratti’s MIT’s SENSEable Cities lab has led the urban computing field to include issues of information access at the small scale human senses in cities[9].
We utilized a previously developer [citation] small-scale mapping technique for 3 x 3 block areas in Barcelona, taking measurements at the center of sidewalks in public right-of-ways at 33m increments [10]. This mapping method allows measurable variations, or parameters, in urban design characteristic to emerge including building heights, open space, adjacent traffic lanes, bus routes, bicycle lanes, landscaping buffers such as trees and low bushes and urban furniture. Other air pollution tools include a network of everyday citizens such as “Smart Citizen” [11] and a neighborhood study in Portland focusing on registered air pollution contributors by Richard Beckwith of Intel Labs [12].
3 Method
To create a geospatial understanding of PM air pollution at the small-scale a parametric modeling approach is used combining: 1) a PM sensor device measuring geo-locational point-data and 2) a table based mapping organization to analyze and visualize various urban design data types.
PM Sensor
A Sharp Optical Dust Sensor [13] with an Arduino Uno and later USB connected with a Raspberry Pi were used with the objective to produce an affordable location based point sensor for PM 2.5. A python script was written to process the PM concentrations and sound measurements. We targeted a 0.5 micrometer concentration of PM that is more accurate than PM 2.5 US EPA standard. A GPS module was used to add latitude and longitude data. An LCD display was added to verify data sent via WiFi module in CSV table format. An SD secure digital card was used to record data.
The sensor device is designed to take measurements at the 33m point increments first assigned via a My Places Google map with 108 pin locations and exported from KML to CSV format. The device uses a ‘butterfly net’ technique walking along the center of sidewalks within a one-meter tolerance of the 108 points to capture data (UAV for future tests). At each point location ten measurements are taken and averaged by the Arduino. The Raspberry Pi creates a CSV file for both the PM and noise data collection for all108 points. Future techniques are being explored to increase the automation and accuracy of data collection including the use of building addresses and variations in data capture sensitivity to make possible collection via bicycle.
Data measurement is taken at three levels: ground, inhalation level and at 5m above the ground to analyze differences in urban design characteristics and PM level. A helium balloon is used for the sensor 5m above ground connected via a lite-weight, six-wire cable (future wi-fi module possible). A third Sharp Optical Dust Sensor is hung to 10cm above ground level.
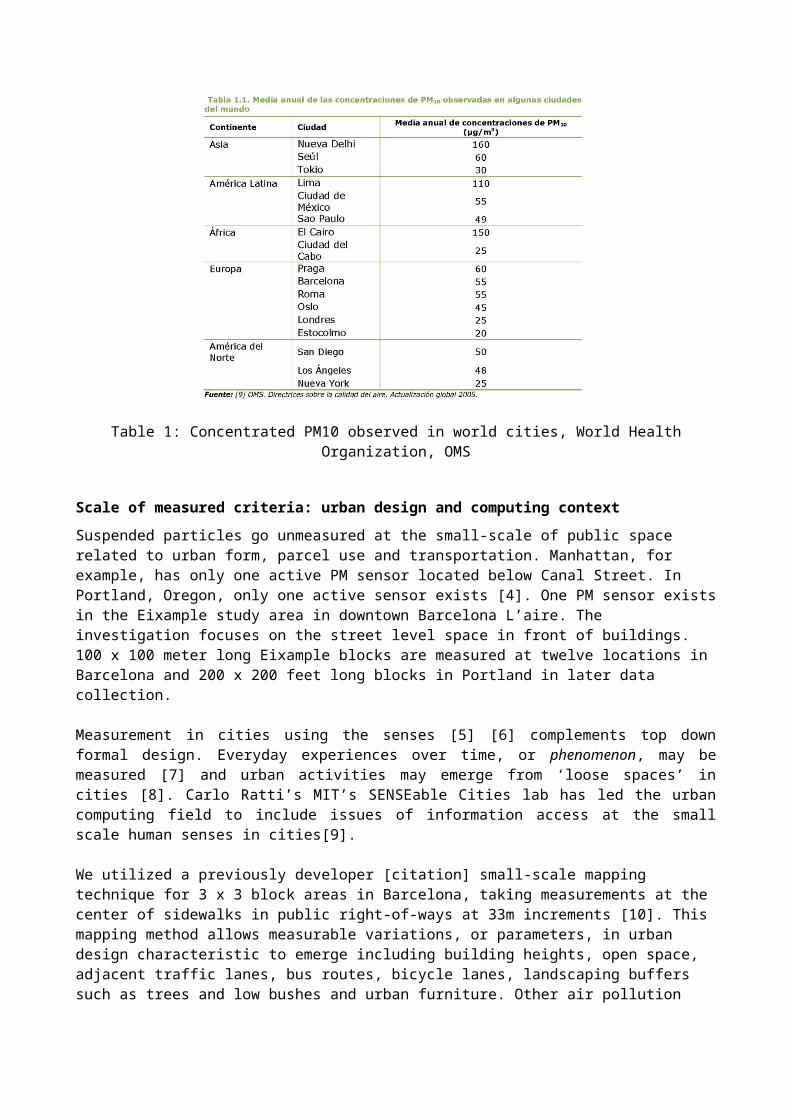
Figure 1: PM sensor device assembly
Geospatial Information, GI, Urban Analysis Tool
The research data of PM and sound are analyzed and visualized geospatially using Rhino Grasshopper [14] (Rutten) with plugins and custom scripting. Traditional planning geospatial information systems software such as ESRI ArcGIS [15] (ArcGIS) use table based data including latitude and longitude. This model is used in Rhino Grasshopper with two basic plugins and scripting: 1) ELK plugin using open street maps files in OSM format with existing building, highway, bike and rail data and 2) HUMAN plugin using CSV files with data including latitude, longitude and other quantitative and qualitative data [16] (Heumann). Output visualization of this tool includes colored underlay maps, a series of lines in the z-vector, a surface topography and future curve defined topography.
Criteria used to select the 3 x 3 Eixample district test area included:- Regularity of the city grid (100m square)- Regularity of the urban wall- At least one public open space at block center- Regularity of the public right-of-way - Variations in traffic lanes, bus routes and bus shelters, bike share and bike lanes.
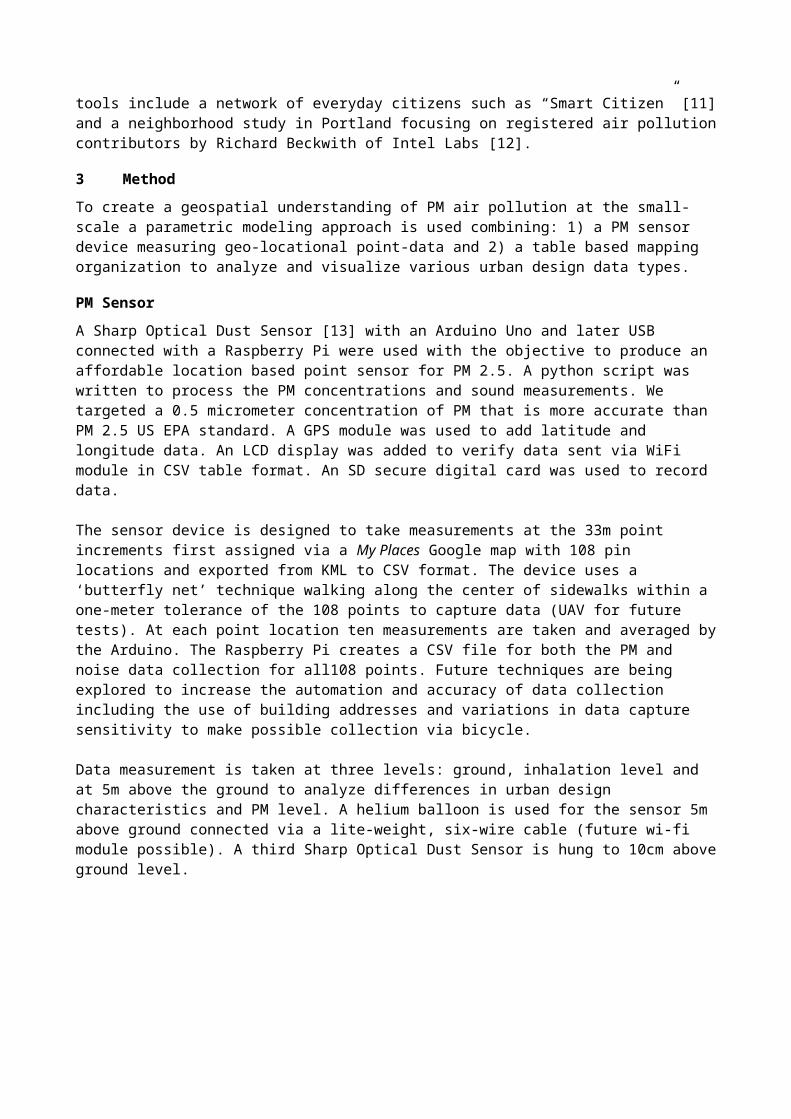
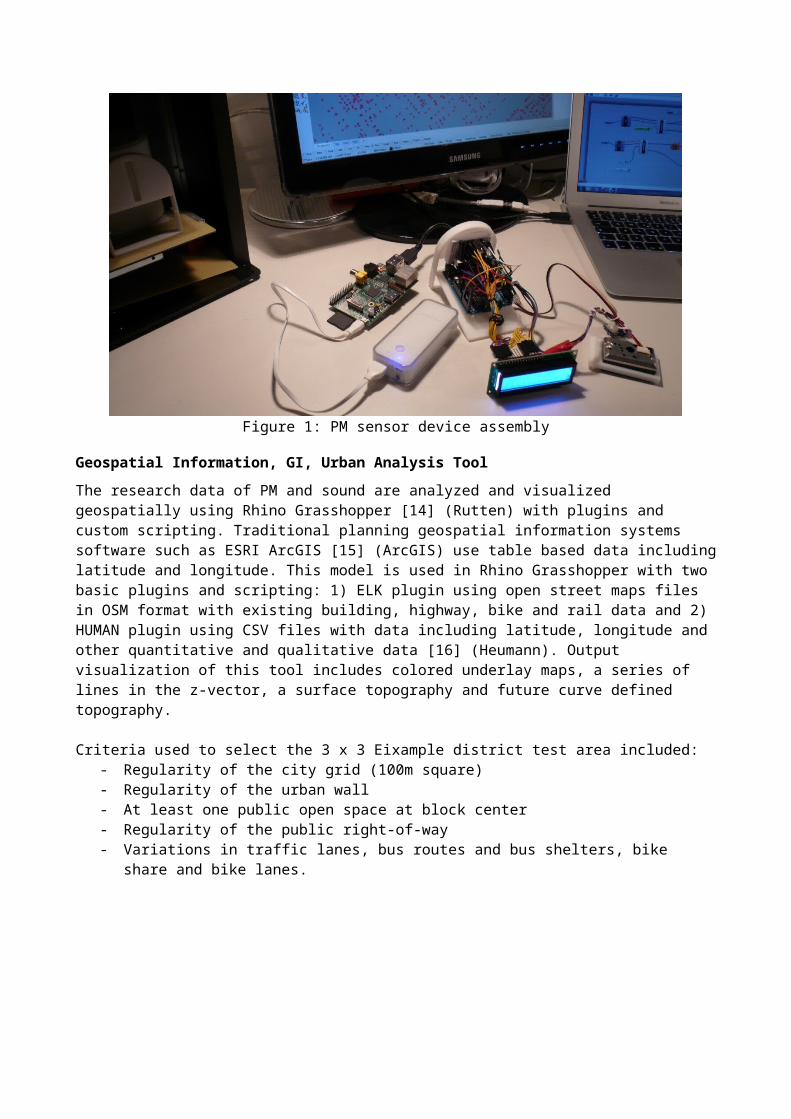
Figure 3, 3 x 3 block study area and 108 data points
The 108 points are uploaded to the Raspberry Pi as a CSV file. Using a GPS module on the handheld device a ‘butterfly net’ script is written to capture data when the device is walked in the 3 x 3 test area and passed within a 1m radius of each of the 108 points. Walking protocol was developed including pace and device orientation.
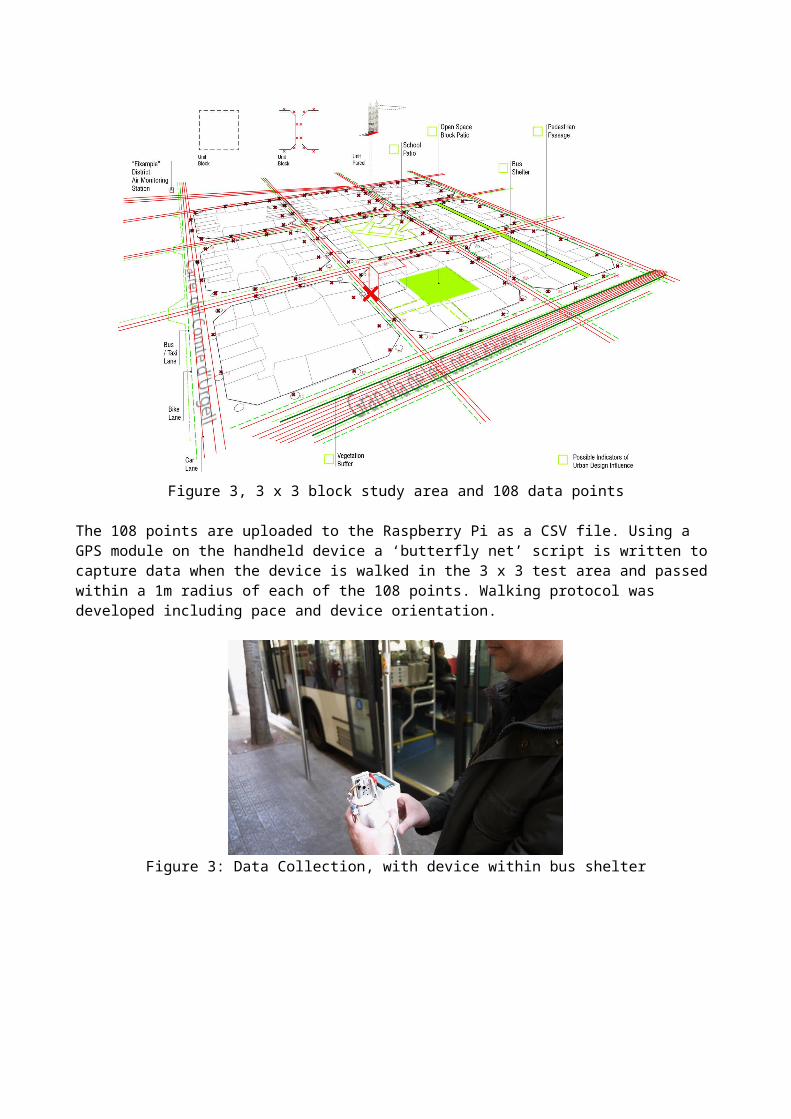
Figure 3: Data Collection, with device within bus shelter
4 Data: Collection and Analysis
Barcelona
Collection Test Area in Barcelona
Measurements were taken on March 24, 2014, in the 3 x 3 block Test Area 01 in Barcelona’s Eixample district between Compte de Urgell and Villaroel, and Arago and Gran Via. Pre-test measurements were taken the prior day. Data was taken at one height holding the device. Future data will include ground level, inhalation level and at 5m above grade. Test observations included spring pollen, the influence of wind and the need for various protocols, control tests and observation recording.
Collection Limits and Future Prototype Criteria
Natural Environment
The sensitivity of the Sharp sensor was calibrated using a Dylos DC1100 Pro [17] (Dylos) and later a battery powered Dylos DC 1700 for onsite control testing and other control test will use high quality lab equipment of Xavier Querol of the Spanish Research Council, CSIC in Barcelona. The Sharp sensor in the device performed with greater inconsistency with higher ‘jumps’ in data recording than the Dylos but was judged adequate to identify significant PM differences between locations. Future in-lab control tests will study the effects of observed wind, pollen, distance to source, sensor orientation and time of exposure. Tests will be taken at high and low traffic. A wind damper and improved sound sensor will be added. Additional ambient environment sensors such as anemometer wind sensors may be added.
Figure 4: Data Collection, adjacent private vehicles, taxis, motorcycles
Built Urban Environment
Test observations of urban design criteria included possible sources of data variation:- Effects within or around bus shelters- Ground-level storefront uses (example, car painting shop on Urgell and pizza shop)- Building height- Street slope- Street orientation to sea and mountains- Distance to criteria such as traffic lanes, pedestrian medians and vegetation buffers (example, Gran
Via)- Zoning use sensitive to children including schools and parks
The Everyday Route
Future tests will track the possible everyday route of a two-year old child across but not limited to Test Area 01 including interior residence locations, schools, shops, parks and other open spaces. These tests will examine the affects of the built design characteristics in plan, section and 3D.
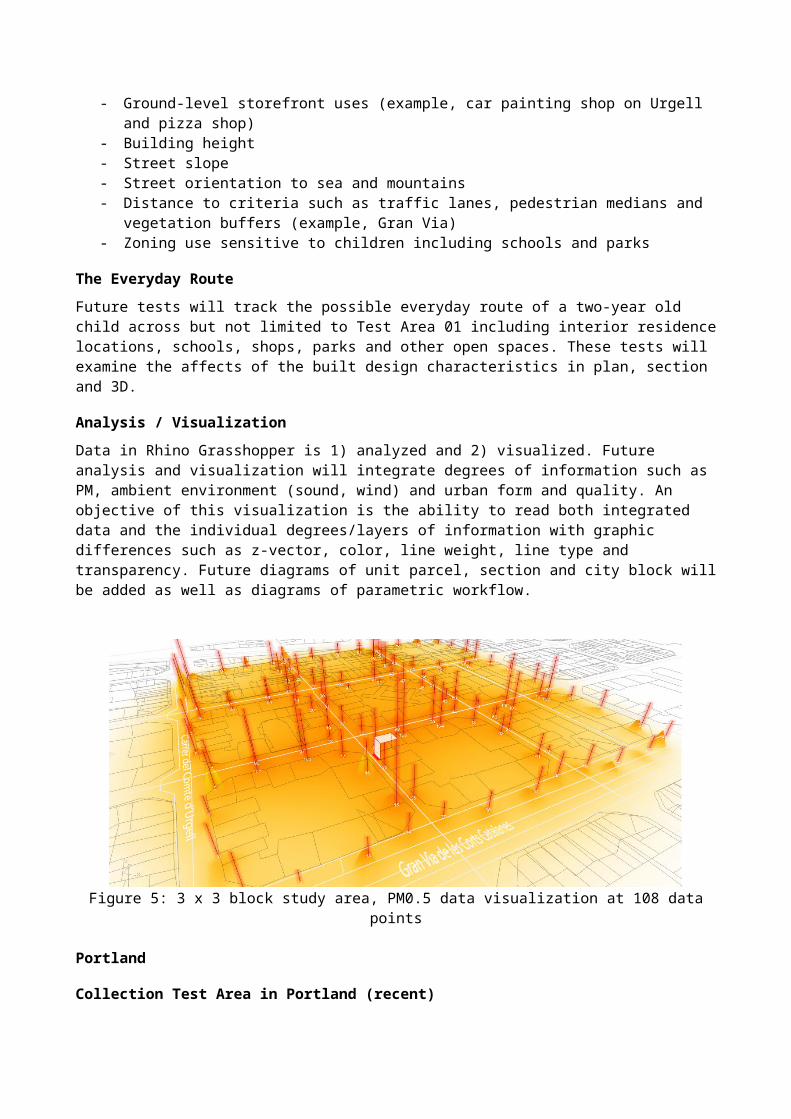
Analysis / Visualization
Data in Rhino Grasshopper is 1) analyzed and 2) visualized. Future analysis and visualization will integrate degrees of information such as PM, ambient environment (sound, wind) and urban form and quality. An objective of this visualization is the ability to read both integrated data and the individual degrees/layers of information with graphic differences such as z-vector, color, line weight, line type and transparency. Future diagrams of unit parcel, section and city block will be added as well as diagrams of parametric workflow.
Figure 5: 3 x 3 block study area, PM0.5 data visualization at 108 data points
Portland
Collection Test Area in Portland (recent)
Comparative measurements were taken device recently in Portland using the Dylos 1700 and a decibel recording. Tests were done on June 7, 2014, in the 5 x 5 block Test Area 01 in Portland’s Pearl district between NW 13th Avenue and NW Park Avenue, and NW Glisan and W Burnside Street. Pre-test measurements were taken the prior week in Eugene, Oregon. Data was taken at one height holding the device. For sound measurement a smart phone app [18] (Decibel Ultra), external microphone and wind screen were used. Test observations included spikes at restaurant locations especially pizzerias, consistently lower readings at adjacent park and tree locations and the need to periodically reset the Dylos 1700.
Observations
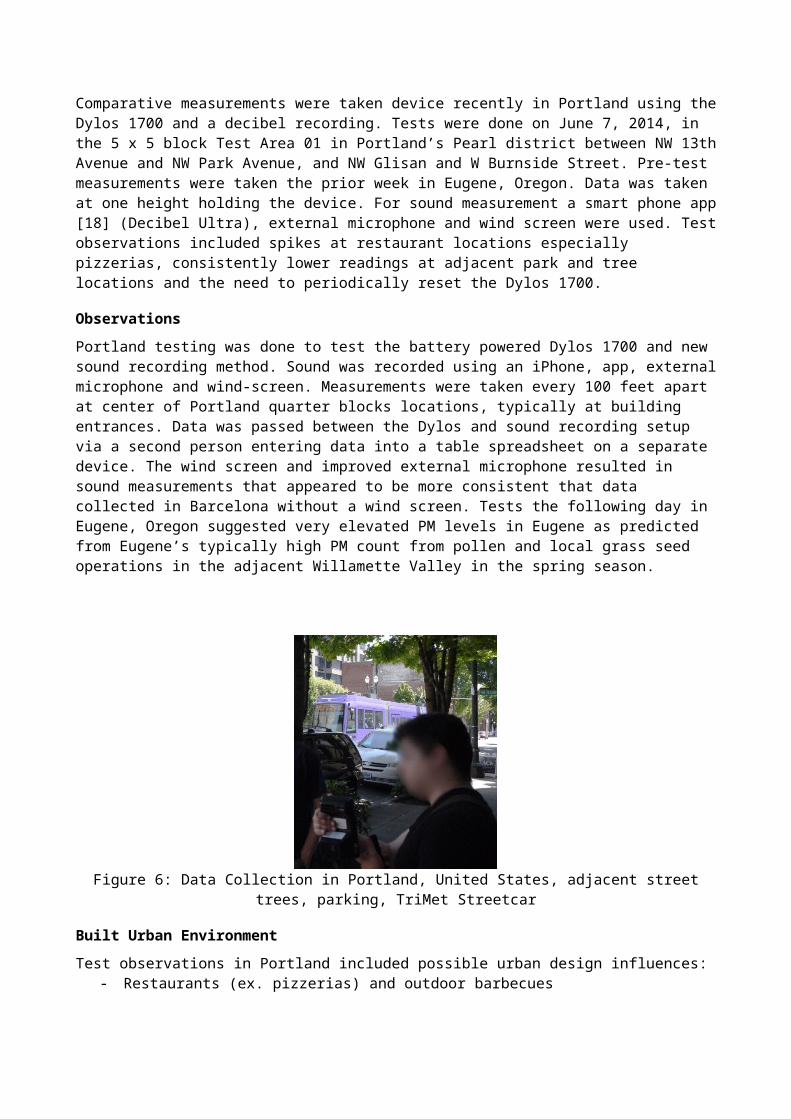
Portland testing was done to test the battery powered Dylos 1700 and new sound recording method. Sound was recorded using an iPhone, app, external microphone and wind-screen. Measurements were taken every 100 feet apart at center of Portland quarter blocks locations, typically at building entrances. Data was passed between the Dylos and sound recording setup via a second person entering data into a table spreadsheet on a separate device. The wind screen and improved external microphone resulted in sound measurements that appeared to be more consistent that data collected in Barcelona without a wind screen. Tests the following day in Eugene, Oregon suggested very elevated PM levels in Eugene as predicted from Eugene’s typically high PM count from pollen and local grass seed operations in the adjacent Willamette Valley in the spring season.
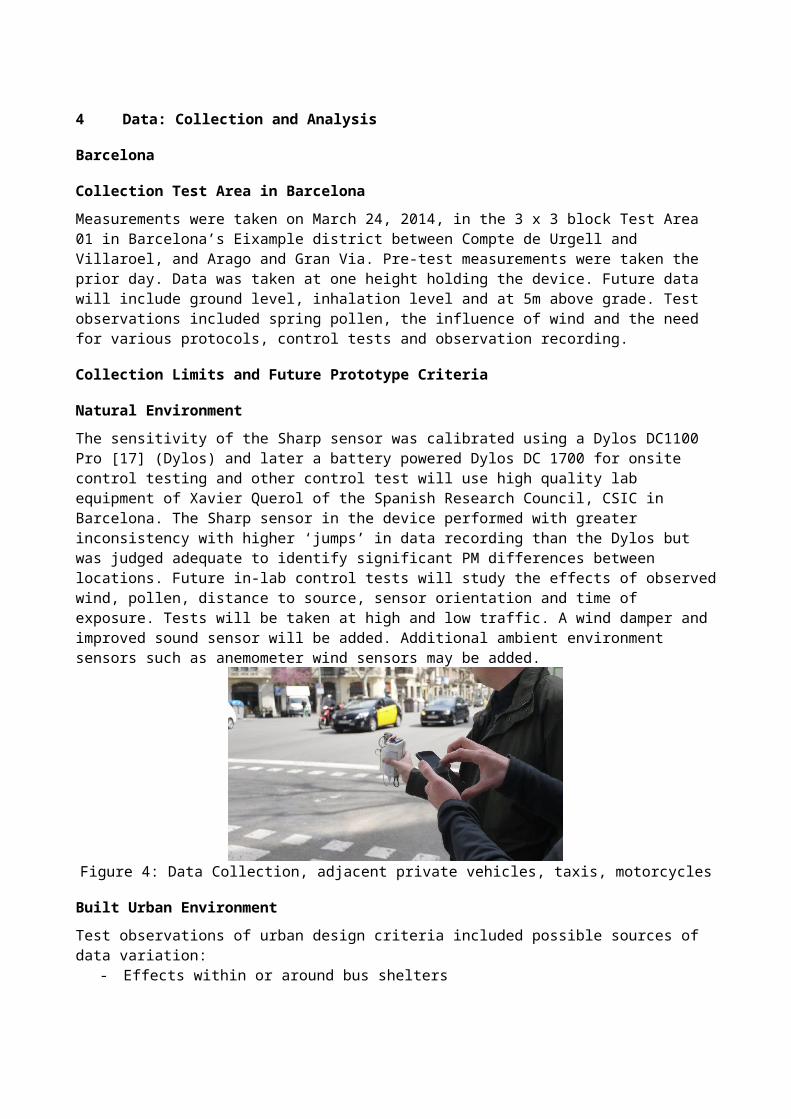
Figure 6: Data Collection in Portland, United States, adjacent street trees, parking, TriMet Streetcar
Built Urban Environment
Test observations in Portland included possible urban design influences:- Restaurants (ex. pizzerias) and outdoor barbecues- Adjacent open park space (ex. North Park Blocks) - Street trees and rain gardens - Street slope - Street orientation to westerly prevailing wind locations- Traffic (ex. Burnside Street) - Zoning use (ex. residential over commercial in the Pearl district). Future test at industrial zoning us
in the Portland East Side ‘industrial sanctuary’ may be useful.Many of these observations were entered in a general notes column proceeding the PM and sound data columns. Future tests may attempt to measure some of these phenomena and urban characteristics in a more quantifiable method.
Analysis / Visualization (forth coming)
The comparative testing in Portland was done only recently at the time of this paper. Carefully comparative analysis and visualization will follow with challenges to include:
- Device consistency.- Measurements of wind, humidity and temperature at locations.- Consideration of geospatial urban scale and data point location differences.- Time of day and year consideration.- Urban design characteristics: building heights, street widths, sidewalks, parking, rain gardens, street
trees, low vegetation and traffic lanes.- Other user based urban design differences between Barcelona and Portland including: pedestrian
behaviors, bikes, bike-share, motorcycle and moped numbers, private vehicles and the impact of transit vehicles such as buses, streetcars, car share and metro use.
5 Conclusions and Future Research
Information Flow and Scale
The result of this research-in-progress is a confirmation of the importance of scale of suspended particle PM air quality and urban design characteristics at the small scale within an overall regularized block structure. For example, PM measurement at the sidewalk along the high traffic of Gran Via de Les Corts Catalan was low. This may be a result of broad airflow at this atypically wide street, limited vehicular traffic of two lanes including taxi/bus lanes, adjacent pedestrian and bike lanes and or a low vegetation wall buffering the additional six lanes of vehicle traffic. The accuracy of measuring twelve points around each 100m x 100m Eixample block provides this detail, filling a gap in the research of PM air quality in cities.
Figure 7: Gran Via de Les Corts Catalanes, sidewalk and pedestrian / bike median and vegetation buffer
Deployment and Attachment
The mobility of the device allows a more diverse investigation of urban design characteristics than fixed monitoring stations do not afford. Bruno Latour’s idea of ‘attachment’ suggests that we better understand the environment by capturing its meaning dynamically over time [19] (Latour). Information technology allows this new understanding of the built environment. Future data will be collected on foot, on bicycles, via UAV (currently in discussion with the mayor’s office of Barcelona) or via public infrastructure such as city buses, street cleaners or police vehicles. We also noticed that the relatively low sensitivity of the Sharp sensor ($25) was acceptable with high jumps in data readings. Data sensitivity may be enhanced using a combination of more costly Dylos 1700 portable sensors ($400), tuned with high-end devices ($10-20,000) from the Spanish Research Council.
Urban Design
The relatively fine scale of PM air pollution measurement may require even smaller scaled measurements of typical urban design conditions such as block structure, open space, street width, pedestrian buffers and vegetation. Future tests including the everyday path of a two-year old child will provide additional information about known sensitive location such as homes, kindergartens, parks, benches along sidewalks and pedestrian streets with proven connections of indoor and outdoor air quality [20] (Sunyer). Additional neighborhoods and different urban morphology may be tested. The aim of this information is not only to inform city planners and government agencies but more importantly to empower everyday citizens, namely parents of children, with improved decision making for the healthy growth of our next generation.
6 References
[1] M. Pederson, et al 2013. “Ambient air pollution and low birth weight: a European cohort study (ESCAPE)” The Lancet Respiratory Medicine, Volume 1, Issue 9, Pages 695 - 704, November 2013, http://www.thelancet.com/journals/lanres/article/PIIS2213-2600%2813%2970192-9/abstract
[2] C. Pope, M. Ezzati and D. Dockery. 2009, “Fine-Particulate Air Pollution and Life Expectancy in the United States” The New England Journal of Medicine, n engl j med 360;4 nejm.org January 22, 2009, http://www.uphe.org/wp-content/uploads/2011/12/nejm-improved-life-expectancy-and-air-quality.pdf
[3] WHO, World Health Organization (Organització Mundial de la Salud)[4] AirData, Interactive Map, US EPA, PM2.5 criteria selection,
http://www.epa.gov/airdata/ad_maps.html[5] K. Lynch (1960) The Images of the City. Cambridge: The MIT Press [6] Vitiello, R and Willcocks, M (2006) The Difference is in the Detail. Place Branding Vol. 2, 3, 248-
262.[7] Norberg-Schulz, C (1976) “The Phenomenon of Place.” Architectural Association Quarterly 8. No.
4. London: AA. Pg 3-10[8] K. Franck and Lepori, R (2007) Architecture from the Inside Out: From the Body, the Senses, the
Site and the Community. London: Routledge [9] Nabian, Offenhuber, Vanky and Ratti (2013), “Data dimension: accessing urban data and
making it accessible,” Proceedings of the Institution of Civil Engineers Urban Design and Planning 166 February 2013 Issue DP1, Pages 60–75 http://dx.doi.org/10.1680/udap.12.00011
[10] author (2013) Green Design, Materials and Manufacturing Processes, “Parametric Places 22@: Smart Urban Analysis Tools and Place Branding Value.” SIM Conference Proceedings Editors: Helena Bartolo et al. London: Taylor & Francis Group. pp. 701-705
[11] IaaC / Cisco (2014), Citizen Sensor, citi-sense.nilu.no, http://www.iaac.net/events/citizen-sensors-fablab-barcelona-iaac-launches-a-new-crowdfunding-campaign-for-smart-citizens-269
[12] K. Wong (2013), “Intel squeezes into smart (and crowded) sustainable cities space”, GreenBiz.Com, June 28, http://www.greenbiz.com/news/2013/06/28/intel-squeezes-crowded-and-smart-sustainable-cities-space
[13] Sharp Optical Sensor (0.35mg min; 0.1mg/m3). GP2Y1010AU0F[14] D. Rutten (2007 1st ed.) Grasshopper & Galapagos. Seattle: Robert McNeel & Associates.[15] ArcGIS (1999 1st ed.) Environmental Systems Research Institute[16] A. Heumann (2011 1st ed.). Human (Formerly Heumann Design/Tech), Plugin to Rhinoceros 3D by
Robert McNeel & Associates[17] Dylos DC1100-Pro Sensor, particle sensor, DC 1700-Pro rechargeable,
http://www.dylosproducts.com/ornodcproair.html[18] Decibel Ultra (2013) P.Schaefer
https://itunes.apple.com/us/app/decibel-ultra/id410139517?mt=8[19] Latour, B & Yaneva, A (2008) “Give Me a Gun and I Will Make All Buildings Move: An Ant’s
View of Architecture.” In R. Geiser (ed.), Explorations in Architecture: Teaching, Design, Research. Basel: Birkhäuser. 80.
[20] J. Sunyer (2014), Interviews with Jordi Sunyer conducted between January and March of 2014 at the CREAL Biomedical Center, Passeo Maritimo, Barcelona