Embed Size (px)
Citation preview

SuspendedEducationinCalifornia
ByDanielJ.Losen1,TiaMartinez2andJonGillespie3
April10,2012
TheCenterforCivilRightsRemediesatthe

Suspended Education in California Civil Rights Project/Proyecto Derechos Civiles April 10, 2012
Acknowledgements The Center for Civil Rights Remedies at the UCLA Civil Rights Project would like to thank Laurie Russman, CRP project coordinator, for her valuable assistance and Lisa Quay for her editing support. We are grateful to Atlantic Philanthropies and the California Endowment for supporting this effort to get this important information into the hands of educators, policymakers and all advocates for children and their civil rights.

Suspended Education in California Civil Rights Project/Proyecto Derechos Civiles April 10, 2012
Suspended Education in California
By Daniel J. Losen4, Tia Martinez5 and Jon Gillespie6
The Civil Rights Project has been examining out-of-school suspensions since 1999 due to concerns about the frequency of suspensions, observed racial disparities in their systemic use and the possible negative impact, especially for children of color. Most important, a robust study of school discipline by the Council of State Governments tracked every middle school student in Texas over 6 years and has helped educators crystalize what the evidence has always suggested: that the frequent use of out-of-school suspensions has no academic benefits, is strongly associated with low achievement, a heightened risk for dropping out and a greater likelihood of juvenile justice involvement.7 If suspending a student out-of-school for minor infractions is a counterproductive educational response, logic dictates that it should be reserved as a measure of last resort. Unfortunately, education policy makers and parents are not fully aware of just how many students are at risk for being suspended. For the first time, this report and companion spreadsheet covering nearly 500 districts reveals to the public the unusually high levels of risk for suspension as well as the stark differences in discipline when these risks are presented by race, gender and disability status. The alarming findings suggest not only a hidden crisis for many historically disadvantaged subgroups in too many districts but also a widespread need to reform discipline policy for California’s public schools. Data released from the Office for Civil Rights (OCR) at the US Department of Education revealed that more than 400,000 students were suspended out-of-school at least one time during the 2009-10 school year in California.8 That’s enough students suspended out-of-school to fill every seat in all the professional baseball and football stadiums in the state, with no guarantee of any adult supervision.9 OCR collected data from districts on the number of students who were suspended just once during the year and the number suspended more than once. The analysis in this report combined these two mutually exclusive categories in order to report the number of students suspended one or more times as a percentage of their total enrollment. We describe this percentage throughout this report as the “risk” for suspension. To avoid confusion, it is important to note that the California Department of Education (CDE) reported over 750,000 total suspensions for this same year. The number of students in this report is consistent with the number of suspensions in the CDE report because many students were suspended two, three, or even more times that year. Statewide sample reveals large racial disparities: There are large numbers of students suspended from every racial group, but the disparities between groups are often profound. Across California, as illustrated in the graph in figure 1, nearly 1 out of every 5 African American students (18%), 1 in 9 American Indian students (11%), and 1 in 14 Latino

Suspended Education in California Civil Rights Project/Proyecto Derechos Civiles April 10, 2012
students (7%) in the state sample were suspended at least once in 2009-10, compared to 1 in 17 white students (6%) and 1 in 33 Asian American students (3%). Asian American rates varied when further broken down by subgroups of this category (e.g. Hawaiian and Pacific Islanders reported separately from other Asian groups). Unfortunately, the data were only available for enough districts to calculate a statewide rate.10 Figure 1. Students in California suspended at least once during the 2009-10 school year as a percent of total enrollment
Source: CRDC, 2009-1010 The number of students suspended in California for all races combined adds up to 402,855 individual students suspended at least once. This represents a conservative estimate because not every district in California was included in the OCR sample. When the number of suspended students is divided by the total enrollment of 5,673,080 for the sampled districts, the result is that 7.1% of all students in California were suspended at least once over the course of the 2009-2010 school year. The same basic calculation was used to calculate all the suspension risks described in this report and in the accompanying spreadsheet for each racial group.11 The large racial disparities observed in the statewide sample are often more pronounced at the district level. Similarly, the suspension risk for English learners was just 6.3% statewide, but the spreadsheet reveals that in 17 districts the risk for suspension for LEP students exceeded 20% of their total enrollment. Crisis Revealed in California’s Districts: In the ten largest districts we were able to further disaggregate our findings to reveal that the high frequency of suspension is even more pronounced when racial and gender differences are combined. Specifically, the risk for suspension skyrockets among male students, especially for African Americans and American Indians. Among the 10 largest districts in the state by enrollment, rates of suspension for African American, American Indian, and Latino young males peak in
18%
11%
7%6%
3%
0%
5%
10%
15%
20%
AfricanAmerican AmericanIndian La<no White AsianPacificIslander
N=488districtsenrolling5,673,080students;16JuvenileJus<ceFacili<esexcludedfromtheanalysis

Suspended Education in California Civil Rights Project/Proyecto Derechos Civiles April 10, 2012
Stockton City Unified, where 38% of African American males, 28% of American Indian males, and 19% of Latino males were suspended out of school at least once during the school year (see Table 1). The resulting gaps in suspension rates between male students of color and white male students are marked. For example, in Los Angeles Unified School District African American male suspension rates were 18 percentage points higher than White male suspension rates (23% vs. 5%). Table 1. Out-of-school suspension rates by race/ethnicity and gender for the largest 10 California school districts School District Risk of Suspension
African American
American Indian Latino White
Asian Pacific Islander
Los Angeles Unified Male 23% 9% 8% 5% 3% Female 11% 4% 3% 1% 1% San Diego Unified Male 17% 14% 10% 5% 4% Female 8% 4% 4% 1% 1% Long Beach Unified Male 13% 5% 6% 3% 4% Female 7% 0% 3% 1% 1% Elk Grove Unified Male 26% 23% 13% 9% 5% Female 14% 7% 6% 3% 2% San Bernardino City Unified Male 33% 25 15% 16% 9% Female 19% 17% 8% 8% 4% Santa Ana Unified Male 17% 0% 10% 5% 4% Female 8% 0% 5% 2% 1% Capistrano Unified Male 4% 0% 5% 2% 1% Female 2% 0% 2% 1% 0% San Juan Unified Male 30% 21% 15% 12% 6% Female 14% 7% 6% 4% 2% Oakland Unified Male 26% 24% 10% 4% 6% Female 15% 0% 5% 2% 2% Stockton City Unified Male 38% 28% 19% 23% 13% Female 18% 17% 9% 11% 5%

Suspended Education in California Civil Rights Project/Proyecto Derechos Civiles April 10, 2012
Source: CRDC, 2009-1010 Districts selected by size of enrollment and availability of data. We excluded districts in which we had reason to suspect that the data was not accurate because a district reported more suspensions than students for any subgroup (resulting in a suspension rate of over 100%). 12 Interestingly, none of the largest districts in the state were among the ten districts where students had the highest risk of being suspended out of school, even when we eliminated all districts with less than 1000 students. The graph in Figure 2 shows the average risk by racial group for these highest suspending districts. Figure 2. Average suspension rates in the 10 highest suspending districts in California, 2009-2010
Source: CRDC, 2009-2010 In districts with the highest suspension rates in the state, just under a quarter of the entire student body –nearly one of every four students of all races and ages – received at least one suspension that school year. These districts had not only the highest district wide rates for all students, but often very large differences in the risk for suspension between different racial groups, with Black students suspended on average at a rate that was a full 20 percentage points higher than White students. The breakdown in each district that was used to construct the risks in the graph above is provided in the table below.
41%
25%
21% 21%
14%
0%
10%
20%
30%
40%
50%
Allstudents AfricanAmerican
AmericanIndian
La<no White AsianPacificIslander
Percentoftotalstudentswithatleastoneschool
suspension
.
Suspended Education in California Civil Rights Project/Proyecto Derechos Civiles April 10, 2012
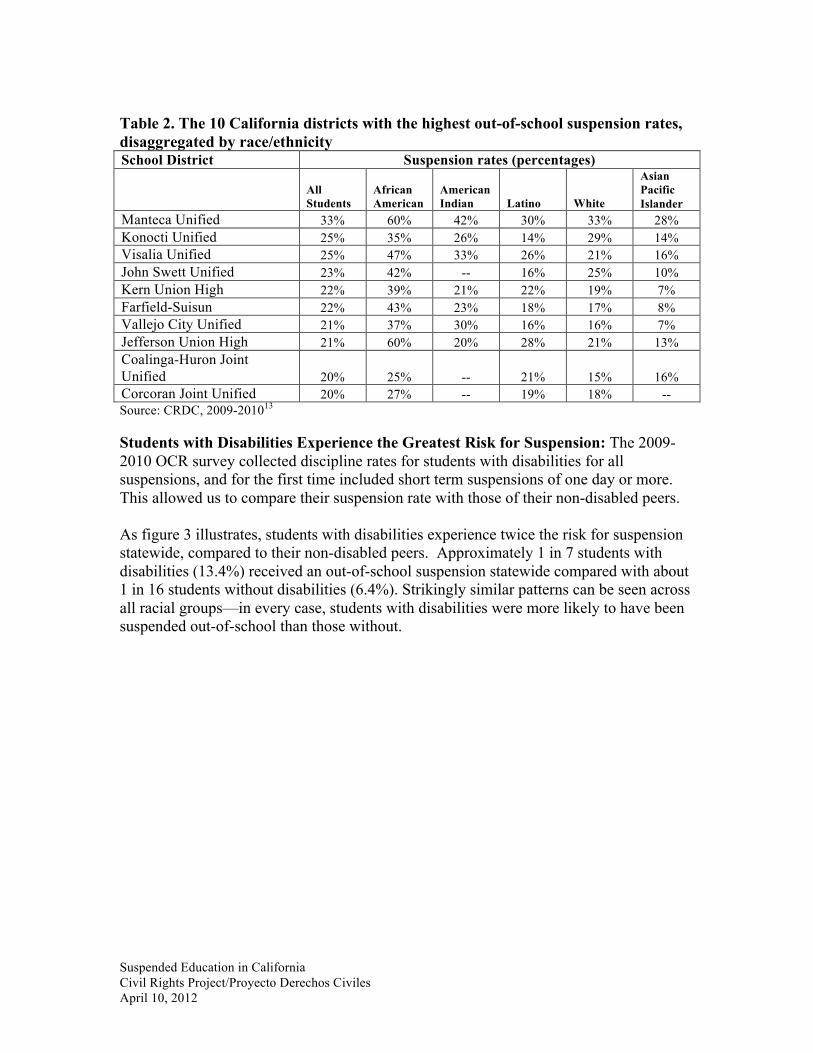
Table 2. The 10 California districts with the highest out-of-school suspension rates, disaggregated by race/ethnicity School District Suspension rates (percentages)
All Students
African American
American Indian Latino White
Asian Pacific Islander
Manteca Unified 33% 60% 42% 30% 33% 28% Konocti Unified 25% 35% 26% 14% 29% 14% Visalia Unified 25% 47% 33% 26% 21% 16% John Swett Unified 23% 42% -- 16% 25% 10% Kern Union High 22% 39% 21% 22% 19% 7% Farfield-Suisun 22% 43% 23% 18% 17% 8% Vallejo City Unified 21% 37% 30% 16% 16% 7% Jefferson Union High 21% 60% 20% 28% 21% 13% Coalinga-Huron Joint Unified 20% 25% -- 21% 15% 16% Corcoran Joint Unified 20% 27% -- 19% 18% -- Source: CRDC, 2009-201013 Students with Disabilities Experience the Greatest Risk for Suspension: The 2009-2010 OCR survey collected discipline rates for students with disabilities for all suspensions, and for the first time included short term suspensions of one day or more. This allowed us to compare their suspension rate with those of their non-disabled peers. As figure 3 illustrates, students with disabilities experience twice the risk for suspension statewide, compared to their non-disabled peers. Approximately 1 in 7 students with disabilities (13.4%) received an out-of-school suspension statewide compared with about 1 in 16 students without disabilities (6.4%). Strikingly similar patterns can be seen across all racial groups—in every case, students with disabilities were more likely to have been suspended out-of-school than those without.

Suspended Education in California Civil Rights Project/Proyecto Derechos Civiles April 10, 2012
Figure 3. Statewide suspension risk by race for students with (SWD) and without disabilities (SWOD) in California, 2009-2010
Source: CRDC, 2009-2010: N=488districtsenrolling5,673,080students;16JuvenileJusticeFacilitiesexcludedfromtheanalysis These are sobering disparities given that federal law expressly requires schools to provide a behavioral assessment and a behavioral improvement plan for students with disabilities who exhibit behavioral problems to ensure that they receive the supports and services they need.14 In light of these essential supports and services, one would expect the rates among students with disabilities to be equal to or less than students without disabilities. Pursuant to the requirements of the Individuals with Disabilities Education Act of 2004, California has begun a review of each school district for large racial disparities in discipline among students with disabilities. This federal law requires further district level interventions where the disparities meet a threshold established by the state. The data revealed in this report, and especially the statewide risk for African American males with disabilities at 28%, suggests that a great deal of work remains to be done in California. Applying these three lenses together—race, gender, and disability--yields a more disturbing image than any one category alone. In an analysis of the 5 largest districts (see Table 3), the group with the consistently highest risk of suspension is African American male students with disabilities, with suspension rates reaching highs of 59% in San Bernardino City Unified and 36% in Los Angeles Unified.
13%
28%
14%12%
11%
5%6%
16%
10%
7%5%
3%
0%
5%
10%
15%
20%
25%
30%
AllRaces African‐American AmericanIndianorAlaskaNa<ve
La<no White AsianorPacificIslander
StudentswithDisabili<es
StudentswithoutDisabili<es

Suspended Education in California Civil Rights Project/Proyecto Derechos Civiles April 10, 2012
Table 3. Suspension rates by gender, race, and disability status for the 5 largest school districts in California, 2009-201015
School District Suspension Risks for males with disabilities (percentages) African
American American
Indian Latino White Asian Pacific
Islander D WD D WD D WD D WD D WD Los Angeles Unified 36% 20% 13% 8% 11% 7% 9% 4% 4% 3% San Diego Unified 25% 15% 33% 10% 16% 8% 12% 5% 8% 3% Long Beach Unified 20% 11% -- 6% 10% 5% 7% 3% 5% 3% Elk Grove Unified 35% 24% 29% 21% 18% 13% 15% 8% 6% 5% San Bernardino City 59% 29% 50% 20% 33% 13% 30% 14% 13% 8%
School District Suspension Risks for females with disabilities (percentages)
African American
American Indian Latino White
Asian Pacific
Islander D WD D WD D WD D WD D WD Los Angeles Unified 20% 10% 12% 3% 4% 3% 2% 11% 2% 1% San Diego Unified 16% 7% -- 4% 6% 4% 5% 11% 4% 1% Long Beach Unified 12% 7% -- 0% 5% 2% 4% 12% 2% 1% Elk Grove Unified 21% 13% -- 8% 8% 6% 8% 3% 2% 2% San Bernardino City 30% 18% -- 13% 15% 7% 18% 8% -- 4%
Source: CRDC, 2009-2010 Note: D = Students with disabilities; WD = Students without disabilities. Districts ranked by size of enrollment.16 Discussion: While the sheer magnitude of the problem and the size of the disparities between student subgroups are shocking, these data become even more troubling when considered alongside the research evidence on the efficacy of out-of-school suspensions.17 In addition to the Texas study referenced at the outset, decades of studies have shown that removing students from classrooms for disciplinary reasons does not serve a useful educational purpose for either the students receiving the punishment or their classmates.18 Simply put, research has disproven the theory that “we must kick out the bad kids so the good kids can learn.” To be clear, the issue here is not whether students should ever be suspended, but rather whether the frequent use of out-of-school suspension is effective in helping schools provide a safe and productive educational environment—and the evidence clearly indicates this is not the case. Not only is it counterintuitive to punish a disengaged student by giving them a day off school, but research also suggests that such suspensions do not even act as a deterrent to future misbehavior. Indeed, there is some evidence that suspension may actually increase incidents of misbehavior, effectively making the environment even less productive. Researchers have found that students suspended early in middle school are more likely to receive suspensions by eighth grade, suggesting an increase as opposed to an overall decrease in misbehavior.19 Furthermore, as the American Academy of Pediatrics pointed out, suspensions are not an effective means of engaging parents, particularly low-income and single parents already under a great deal of stress.20

Suspended Education in California Civil Rights Project/Proyecto Derechos Civiles April 10, 2012
Further, out-of-school suspension also significantly increases the risk of negative life outcomes for the student suspended. Researchers report a strong connection between a student being suspended and an increased likelihood of dropping out of school and future involvement in the juvenile justice system.21 The most recent and comprehensive Texas study, issued by the Council of State Governments, found that, for students with similar demographic, achievement, and socioeconomic profiles, those with one or more suspensions or expulsions were 5 times more likely to drop out—and 6 times more likely to repeat a grade level—than those students with no disciplinary actions. Furthermore, even students with minimal disciplinary troubles—those with just one disciplinary action for a relatively minor “discretionary” offense—were nearly 3 times more likely to have contact with the juvenile justice system within a year.22 Moreover, the negative impact of a school’s heavy reliance on out-of-school suspension policy goes beyond just those students who are suspended. Schools with higher suspension rates tend to have lower ratings in terms of academic quality and school climate. 23 Researchers who controlled for race and poverty found that high-suspending districts tend to have worse outcomes overall on standardized tests.24 At a time when data-driven accountability and teacher effectiveness are the watchwords of education reform, we should be tracking suspension risks and replacing discipline policies that may harm students with ones that research suggests are more effective. Fortunately, the evidence base also illuminates alternatives to removing scores of students out of our schools every day. The Council of State Governments study compared similar schools in the same state and district and found that the frequency of discipline varied dramatically in schools that were otherwise nearly identical, except for the educators themselves and their disciplinary policies and practices. This suggests that individual districts and schools within a state, working with the same resources and within the same statutory framework, have the ability to affect their school disciplinary rates. Indeed, educators trained in child and adolescent development and classroom management have a number of methods at their disposal to improve student behavior. Furthermore, system-wide approaches such as Positive Behavior Intervention and Supports (PBIS), which relies on data monitoring, shifts in school culture and policy, and a tiered system of supports, have been demonstrated in numerous settings to be effective in reducing disciplinary removal from the classroom while simultaneously boosting achievement.25 Conclusion While the State of California does report the numbers of suspensions and some of the reasons for the suspensions to the public, the greater community has not been given a clear picture of who is being suspended. We believe that educators, policy makers, and the public at-large have a right to know this information. Although we utilize the data to reveal large problems, the data can also be used to prompt remedies and find where solutions are already working, as some districts are not suspending high percentages of students from any subgroup.

Suspended Education in California Civil Rights Project/Proyecto Derechos Civiles April 10, 2012
We conclude by urging educators, families, and communities to work together to improve policies and practices. The data presented here leave no doubt that we face a challenging, entrenched problem, but we have good reason to believe that much can be done to make a significant difference in the lives of all students. We know how to educate children successfully without relying on the ineffective, harmful practice of removing the very students who have the most to gain from staying in school.

Suspended Education in California Civil Rights Project/Proyecto Derechos Civiles April 10, 2012
Appendix: Methods The data used in this report comes from the Civil Rights Data Collection (CRDC), a survey administered by the U.S. Department of Education, Office for Civil Rights (OCR). This survey sampled a subset of all districts in California. Ultimately, it gathered data from 504 school districts serving approximately 90 percent of all students in the state. Because in 2009-2010, the CRDC does not require every district in the state to submit data, the absolute number of students reported as suspended represents an undercount for the state. When the districts reported their data to OCR, each district was required to certify that the data was accurate and these certifications were checked before OCR published the data. OCR required this sample of districts to report the unduplicated number of students who were suspended one or more times during the 2009-2010 school year. This data should not be confused with the data recently released by the California Department of Education, which provided the total number of suspensions handed out over the course of the school year. In contrast, the OCR data and our measure looks at the unduplicated count of students receiving one or more out of school suspensions over the course of the school year. The number of students from OCR’s data (402,855 students) is consistent with the number of suspensions in the CDE report (over 750,000) because many students were suspended two, three, or even more times that year. In our analysis, we calculate the number of students suspended at least once as a percentage of their enrollment for students at the state and district level, by race and disability status and, for a subset of districts, by race, disability, and gender status. We describe this percentage throughout this report as the “risk” for suspension For both statewide and district level analyses, we excluded data from state-run, long-term juvenile justice institutions. Given the unique nature of suspending a student who is already confined to a correctional institution as punishment for misbehavior, and the instability of this population, we feel a separate analysis is warranted. For all district level analyses, including the ranking of the 10 districts with the highest suspension rates for all students, we included only those districts with 1000 or more students enrolled. When reporting any individual data on a named district, we took further precautions and excluded any district when we had reason to suspect that the data was not accurate, either because a district reported more suspensions than students for any subgroup (resulting in a suspension rate of over 100%) or they reported no suspensions whatsoever district wide (resulting in a suspension rate of 0%). If any district had fewer than 30 students enrolled in any racial subgroup, we also did not report a suspension rate for that subgroup. Final note: we excluded from our analysis the risk for suspension of students with disabilities who did not have an IEP, but received supports or services exclusively under section 504 of the Rehabilitation Act of 1973. The suspension numbers for students in

Suspended Education in California Civil Rights Project/Proyecto Derechos Civiles April 10, 2012
this category were not disaggregated by race or gender and the numbers were typically very low.

Suspended Education in California Civil Rights Project/Proyecto Derechos Civiles April 10, 2012
References: 1 Daniel J. Losen, J.D., M. Ed., is the Director of the Center for Civil Rights Remedies at The Civil Rights Project at UCLA. 2 Tia Martinez, J.D., M.P.P. is an independent consultant. 3 Jon Gillespie, M.S.W is a Research Associate with the Center for Civil Rights Remedies at The Civil Rights Project and a Ph.D. candidate at UCLA. 4 Daniel J. Losen, J.D., M. Ed., is the Director of the Center for Civil Rights Remedies at The Civil Rights Project at UCLA. 5 Tia Martinez, J.D., M.P.P. is an independent consultant. 6 Jon Gillespie, M.S.W is a Research Associate with the Center for Civil Rights Remedies at The Civil Rights Project and a Ph.D. candidate at UCLA. 7 Fabelo, T., Thompson, M., Plotkin, M., Carmichael, D., Marchbanks III, M., and Booth, E. (2011). Breaking Schools’ Rules: A Statewide Study of How School Discipline Relates to Students’ Success and Juvenile Justice Involvement, Council of State Governments Justice Center. Retrieved April 8, 2012 from http://knowledgecenter.csg.org/drupal/system/files/Breaking_School_Rules.pdf 8 The Civil Rights Data Collection (CRDC) by the Office for Civil Rights gathered data from 504 school districts in California, serving nearly 90 percent of all students in the state. 9 Size of sports arenas for each team retrieved on April 6, 2012 from http://en.wikipedia.org/wiki/List_of_professional_sports_teams_in_California 10 Suspension risk for Hawaiian and Pacific Islanders are reported for those districts that provided the disaggregated data and are available in the spreadsheet that accompanies this report. 11 The district level data reported here were provided to the public by the federal government. The raw data can be obtained from the following federal website: http://ocrdata.ed.gov. 12 The concerns described in the methods section led to the exclusion of Corona Norco Unified School District. Of the remaining districts, we only included those large districts where disaggregated data was available through OCR’s web interface at www.ocrdata.ed. For three of the ten largest districts remaining (Fresno Unified, San Francisco Unified, and Garden Grove Unified) data disaggregated by gender was not available through OCR. We worked down the list of districts in order of enrollment and substituted the next three largest districts with disaggregated data available through OCR (San Juan Unified, Oakland Unified, and Stockton). 13 We included only districts in the sample with 1000 or more students and excluded districts in which we had reason to suspect that the data was not accurate because a district reported more suspensions than students for any subgroup (resulting in a suspension rate of over 100%). If there were fewer than 30 students enrolled in any racial subgroup, we did not report a suspension rate. 14 In addition, federal law requires that students with disabilities receive due process protections to ensure that they are not suspended because of their disability or when the misbehavior is a result of a school’s failure to provide appropriate special education supports and services. The additional due process protections, however, only apply if a suspension or series of suspensions goes over ten days. 15 For students with disabilities (IDEA): Out-of-school suspension is an instance in which a child is temporarily removed from his/her regular school for disciplinary purposes to another setting (e.g., home, behavior center). This includes both removals in which no IEP services are provided because the removal is 10 days or less as well as removals in which the child continues to receive services according to his/her IEP. For students without disabilities and students with disabilities served solely under Section 504:

Suspended Education in California Civil Rights Project/Proyecto Derechos Civiles April 10, 2012
Out-of-school suspension means excluding a student from school for disciplinary reasons for one school day or longer. This does not include students who served their suspension in the school. This chart does not account for suspensions of students with 504 plans because OCR did not disaggregate suspensions of that subgroup by race. 16 San Bernardino was substituted for Fresno because Fresno’s disability data was not available. 17 A more extensive review of the research on the harms of out-of-school suspensions and alternatives is Losen, D.J. (2011). Discipline Policies, Successful Schools, and Racial Justice. Boulder, CO: National Education Policy Center. Retrieved on April 8, 2012 from http://civilrightsproject.ucla.edu/research/k-12-education/school-discipline/discipline-policies-successful-schools-and-racial-justice. 18 American Psychological Association Zero Tolerance Task Force. (2008). Are zero tolerance policies effective in the schools? An evidentiary review and recommendations. American Psychologist, 63, 852-862. 19 Raffaele Mendez, L. (2003) Predictors of suspension and negative school outcomes: A longitudinal investigation. In Wald & Losen (Eds.), (2003). Deconstructing the School to Prison Pipeline. San Francisco: Jossey-Bass. 24-25.;Raffaele Mendez, L.M. & Knoff, H.M. (2003). Who gets suspended from school and why: A demographic analysis of schools and disciplinary infractions in a large school district. Education and Treatment of Children, 26. 30-51.;Tobin, P.H., Guerra, N.G., and Kendall, P.C. (1995). Prediction and prevention of antisocial behavior in children and adolescents. Journal of Consulting and Clinical Psychology, 63, 515-517. 20 American Academy of Pediatrics. (2003, November). Policy Statement: Out-of-school suspension and expulsion. (A statement of reaffirmation for this policy was published on August 1, 2008), Vol. 112 No. 5, 1206-1209. Retrieved November 29, 2010 from http://aappolicy.aappublications.org/cgi/content/full/pediatircs;112/5/1206. 21 Balfanz R. et al. (2003). High Poverty Secondary Schools and the Juvenile Justice System. In Wald & Losen (Eds.), Deconstructing The School To Prison Pipeline, 77-78. San Francisco: Jossey-Bass. 22 Fabelo, T., Thompson, M., Plotkin, M., Carmichael, D., Marchbanks III, M., and Booth, E. (2011). Breaking Schools’ Rules: A Statewide Study of How School Discipline Relates to Students’ Success and Juvenile Justice Involvement, Council of State Governments Justice Center. Retrieved April 8, 2012 from http://knowledgecenter.csg.org/drupal/system/files/Breaking_School_Rules.pdf 23 Losen, D.J. and Skiba, R.J. (2011), Suspended Education: Urban Middle Schools in Crisis, Southern Poverty Law Center, Retrieved April 8, 2012 from http://civilrightsproject.ucla.edu/research/k-12-education/school-discipline/suspended-education-urban-middle-schools-in-crisis. 24 Skiba, R.J., & Rausch, M.K. (2006). Zero tolerance, suspension, and expulsion: Questions of equity and effectiveness. In C.M. Evertson, & C.S. Weinstein (Eds.), Handbook for Classroom Management: Research, Practice, and Contemporary Issues (pp. 1063-1089). Mahwah, NJ: Lawrence Erlbaum Associates. 25 Losen, D.J. (2011). Good Discipline: Legislation for Education Reform. Boulder, CO: National Education Policy Center. Retrieved April 8, 2012 from http://civilrightsproject.ucla.edu/research/k-12-education/school-discipline/discipline-policies-successful-schools-and-racial-justice.