Embed Size (px)
Citation preview
Linux TroubleshootingResolving Critical Issues
Mike LatimerSoftware Engineer

2
Agenda
• What are critical issues?‒ Definition and Challenges
‒ Supportconfig and Critical Issues
• Crashes‒ Kernel Crashes
‒ Application Crashes
• Performance Problems‒ CPU
‒ Memory
‒ Disk

What are Critical Issues?

4
Critical Issues
• Critical issues are those which directly impact business processes‒ Crashes
‒ Kernel Crashes
‒ If machines are down, everything else is down
‒ Application Crashes
‒ Complete application level failure (server continues to run)
‒ Poor Performance
‒ I/O bottlenecks
‒ Task or Memory management problems
‒ Other Issues
‒ Application misconfiguration, library problems, human error, etc...

5
Critical Issue Challenges
• Time sensitive!
• Executive level visibility
• Technically complicated
‒ Third party involvement
‒ Hardware and/or software vendors
‒ Cross team developer involvement
‒ Userspace / kernel space
‒ Specific kernel driver / core kernel functionality

6
Approach to Critical Issues
• Ask for help early in the process
‒ Distribution support
‒ Project community
‒ Note: Upstream may be on a much newer codebase!
• Understand the problem first
‒ Accurate details help others get up to speed
‒ Troubleshooting should narrow the scope of the problem
• Continue your investigation!

7
Understand the Critical Issue
• Primary priorities:
‒Restore business services
‒ Identify root cause
• Gather evidence quickly and restore services
‒ sosreport
‒ supportconfig
‒ siga, cfg2html, etc...

8
Supportconfig and Critical Issues
• Supportconfig‒ https://en.opensuse.org/Supportutils
‒ Gather as much troubleshooting information as possible
‒ Reduce problem resolution time
• Supportconfig Layout‒ Topics
‒ Text files
‒ Commands
‒ Relevant commands are in multiple text files

9
Supportconfig Output

10
Supportconfig File Contents
11
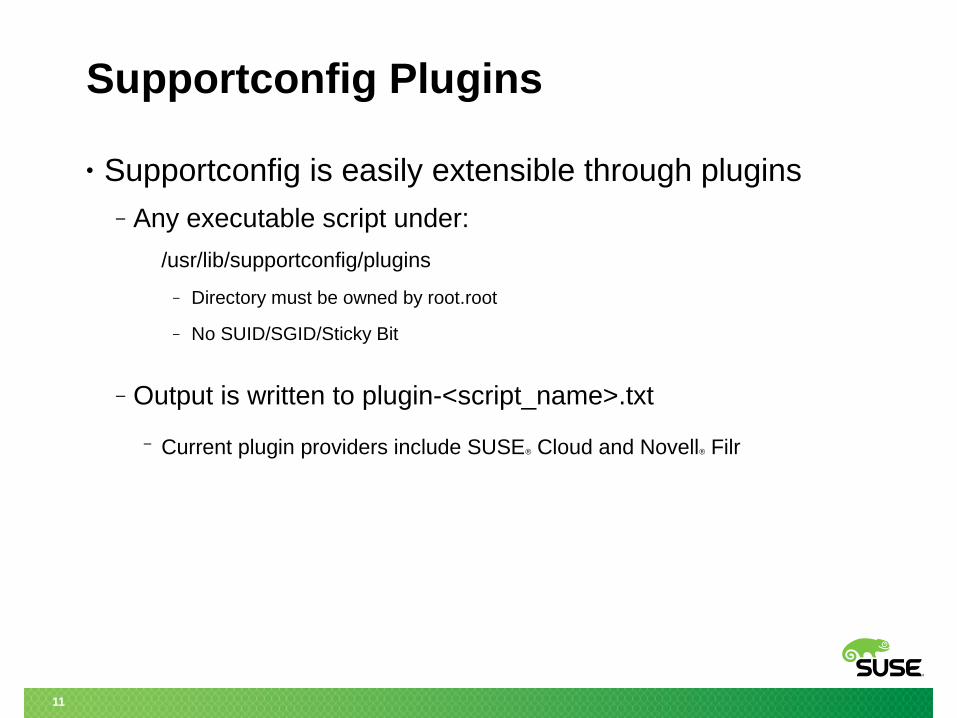
Supportconfig Plugins
• Supportconfig is easily extensible through plugins‒ Any executable script under:
/usr/lib/supportconfig/plugins
‒ Directory must be owned by root.root
‒ No SUID/SGID/Sticky Bit
‒ Output is written to plugin-<script_name>.txt
‒ Current plugin providers include SUSE® Cloud and Novell® Filr

12
Sample Plugin

13
Analyzing SupportConfig Output
• Manually‒ grep is your friend!
• Automatic through SCA tools‒ Patterns exist to match known issues
‒ SUSE® Support, Development and users contribute patterns
‒ Automatic analysis performed when attaching supportconfig archives to support incidents
‒ Appliance: https://susestudio.com/a/Vj5bpn/sca-appliance
‒ Command line: scatool

14
Using SCA Tools
• SCA Appliance‒ Use FTP to upload
SC archive for processing
• scatool‒ Analyzes SC
archive, or execute supportconfig on remote server
‒ Can email report to designee

Crashes
16
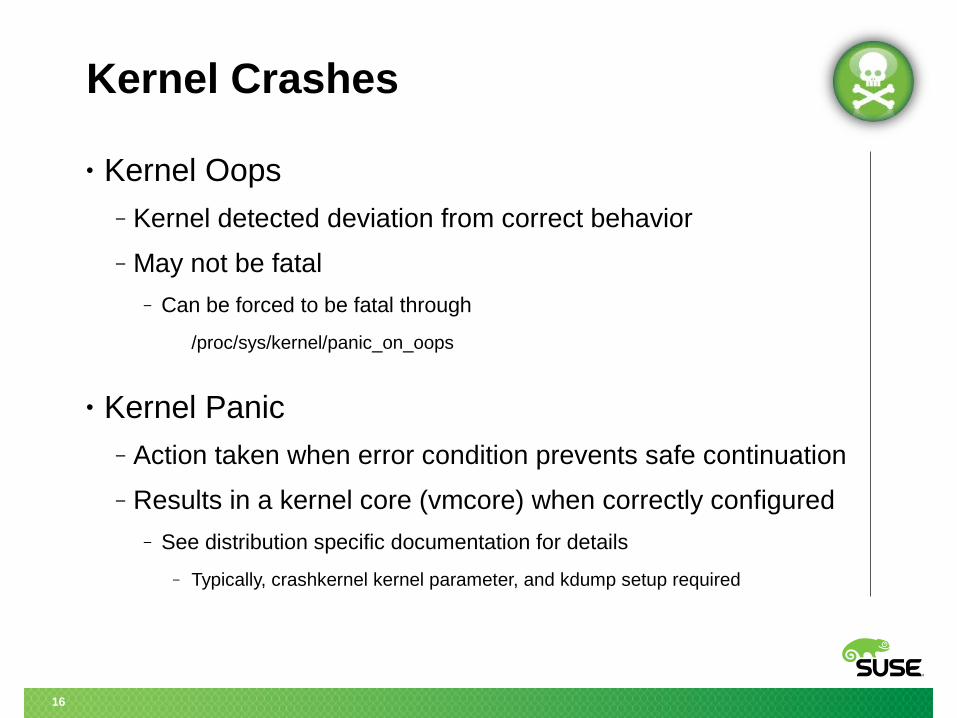
Kernel Crashes
• Kernel Oops‒ Kernel detected deviation from correct behavior
‒ May not be fatal
‒ Can be forced to be fatal through
/proc/sys/kernel/panic_on_oops
• Kernel Panic‒ Action taken when error condition prevents safe continuation
‒ Results in a kernel core (vmcore) when correctly configured
‒ See distribution specific documentation for details
‒ Typically, crashkernel kernel parameter, and kdump setup required
17
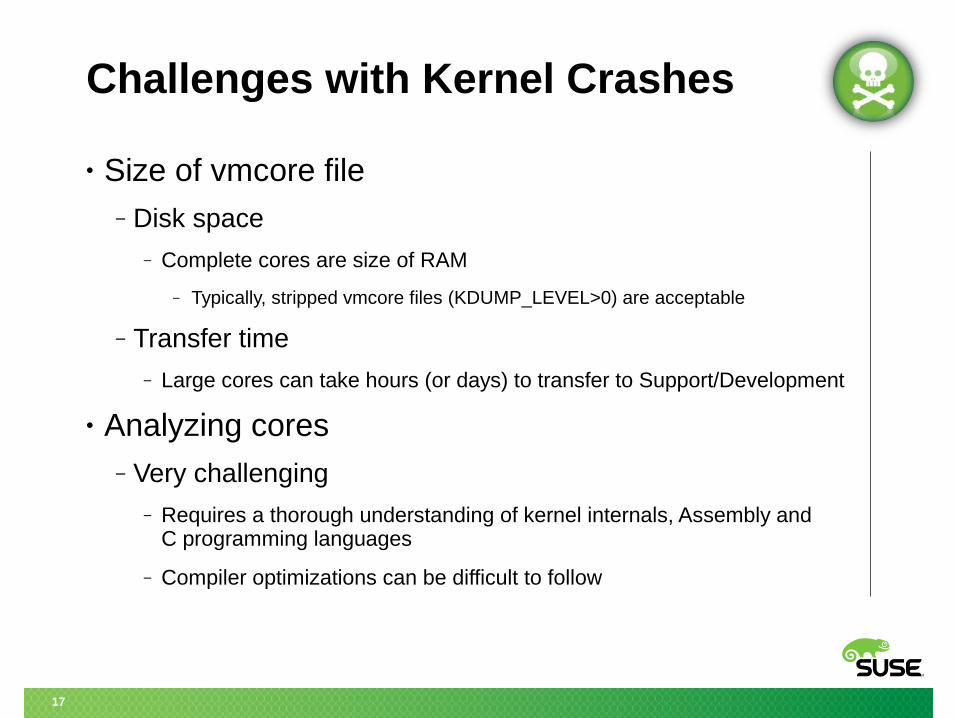
Challenges with Kernel Crashes
• Size of vmcore file‒ Disk space
‒ Complete cores are size of RAM
‒ Typically, stripped vmcore files (KDUMP_LEVEL>0) are acceptable
‒ Transfer time
‒ Large cores can take hours (or days) to transfer to Support/Development
• Analyzing cores‒ Very challenging
‒ Requires a thorough understanding of kernel internals, Assembly and C programming languages
‒ Compiler optimizations can be difficult to follow
18
Kernel Crash Tools
• supportconfig‒ Critical for ensuring Support understands the environment
‒ basic-environment.txt includes the kernel version and architecture
‒ basic-health-check.txt describes the running environment
‒ crash.txt contains crash configuration details
‒ messages.txt contains messages.log leading up to crash
‒ etc...
• crash‒ Primary tool for analyzing kernel core dumps
• analyzevmcore‒ Script which creates an analysis file on existing vmcore files

19
Basic Crash Usage
• Crash requirements:‒ A crashdump file
‒ The kernel which generated the corefile
‒ A corresponding debuginfo kernel
• Key crash commands:
sys System information (kernel version)
mach Machine overview
log Log buffer dump (dmesg)
runq Display CPU runqueues
bt (-a) Backtrace (all) tasks

20
The debuginfo kernel
• Most Linux kernels (including SUSE® Linux Enterprise Server) are stripped of symbols‒ Crash requires these symbols in order to open the core
‒ Debuginfo kernels are typically available from distribution vendor.
‒ For example, debuginfo kernels are available for all normal SLES kernels through the 'Debuginfo' update channel
# zypper mr -e SLES12-Debuginfo-Pool# zypper mr -e SLES12-Debuginfo-Updates# zypper in kernel-default-debuginfo
21
analyzevmcore
• Benefits‒ Speed!
‒ Analysis is ready in minutes
‒ nts_analyzevmcore_[date].txt
‒ Key details in analysis can be used to search for existing bugs
‒ Core can still be transferred to Support for further investigation
• Challenges‒ A debuginfo kernel is still required for the analysis
‒ -d [debuginfo] Use a manually downloaded debuginfo RPM
‒ SUSE specific – due to the debuginfo download process

22
Application Crashes
• Illegal behavior of a user space application can result in a crash‒ Depending on the type of crash and ulimit settings, a core
file may be generated
‒ The `ulimit -c` limit can restrict the creation of application cores
‒ Application crashes can be less complicated than kernel cores, but apps dependent upon many different libraries can be difficult to analyze
• Prior to analyzing an application crash, check application logs

23
Application Crash Tools
• chkbin‒ Provided with supportutils
‒ Performs a sanity check on binaries
‒ Verifies all dependent libraries exist
‒ Verifies all associated RPMs
• valgrind‒ Provided in the SUSE® Software Developer Kit (SDK)
‒ Performs memory management and threading checks
valgrind --tool=memcheck --trace-children=yes [program]

24
Analyzing Application Cores
• Application cores are written to the working directory‒ This is commonly the / directory
• Analyzing these cores is only possible with:‒ The binary which generated the crash
‒ All libraries loaded into the crashing application space
‒ The debuginfo version of the binary and all libraries
Note! Application cores must be analyzed on the machine which generated the core, or in an identical environment
25
Creating an Application Core Archive
• getappcore‒ Provided with supportutils RPM
‒ Creates a tarball containing all the components required for analyzing application cores on another machine
‒ Crashing binary
‒ All libraries loaded into the application space
‒ Log file containing RPM version numbers for all gathered components
• Running getappcore:getappcore -ur [SR number] -b [binary] [corefile]

Performance Problems
27
Troubleshooting CPU Issues
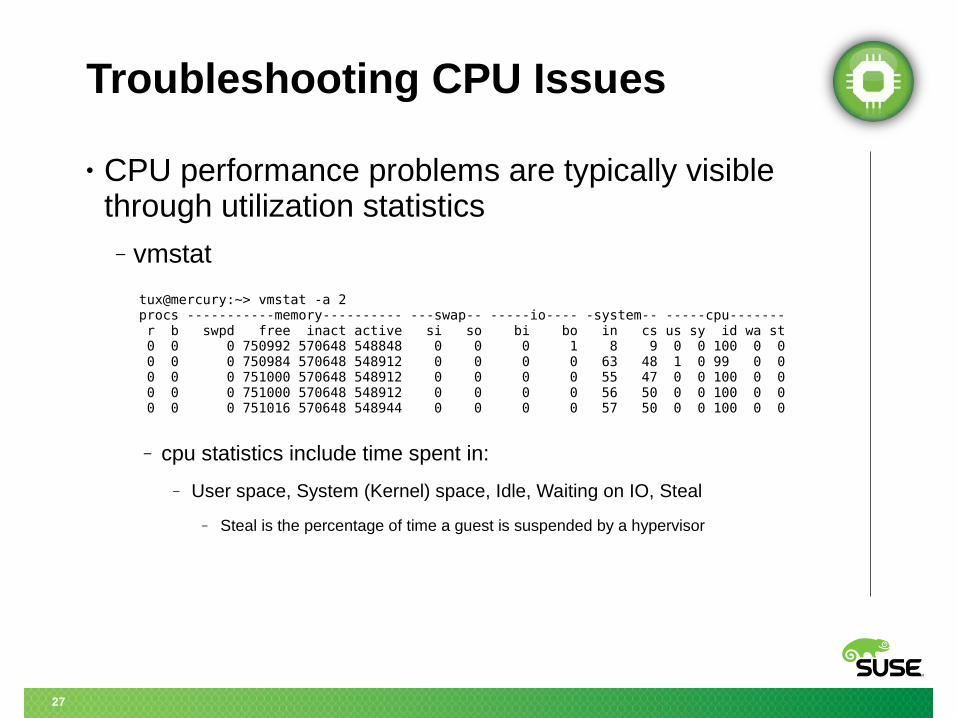
• CPU performance problems are typically visible through utilization statistics‒ vmstat
‒ cpu statistics include time spent in:
‒ User space, System (Kernel) space, Idle, Waiting on IO, Steal
‒ Steal is the percentage of time a guest is suspended by a hypervisor
tux@mercury:~> vmstat -a 2procs -----------memory---------- ---swap-- -----io---- -system-- -----cpu------- r b swpd free inact active si so bi bo in cs us sy id wa st 0 0 0 750992 570648 548848 0 0 0 1 8 9 0 0 100 0 0 0 0 0 750984 570648 548912 0 0 0 0 63 48 1 0 99 0 0 0 0 0 751000 570648 548912 0 0 0 0 55 47 0 0 100 0 0 0 0 0 751000 570648 548912 0 0 0 0 56 50 0 0 100 0 0 0 0 0 751016 570648 548944 0 0 0 0 57 50 0 0 100 0 0

28
Troubleshooting CPU Issues
• top
‒ Stats similar to vmstat plus load average
‒ Average number of jobs in the runqueue over 1, 5, and 15 minutes
tux@mercury:~> top -n 1top - 17:06:28 up 2:10, 5 users, load average: 0.00, 0.00, 0.00Tasks: 85 total, 1 running, 83 sleeping, 1 stopped, 0 zombieCpu(s): 5.5% us, 0.8% sy, 0.8% ni, 91.9% id, 1.0% wa, 0.0% hi, 0.0% siMem: 515584k total, 506468k used, 9116k free, 66324k buffersSwap: 658656k total, 0k used, 658656k free, 353328k cached PID USER PR NI VIRT RES SHR S %CPU %MEM TIME+ COMMAND 1 root 16 0 700 272 236 S 0.0 0.1 0:01.33 init 2 root 34 19 0 0 0 S 0.0 0.0 0:00.00 ksoftirqd/0 3 root 10 -5 0 0 0 S 0.0 0.0 0:00.27 events/0 4 root 10 -5 0 0 0 S 0.0 0.0 0:00.01 khelper 5 root 10 -5 0 0 0 S 0.0 0.0 0:00.00 kthread 11 root 10 -5 0 0 0 S 0.0 0.0 0:00.05 kblockd/0 12 root 20 -5 0 0 0 S 0.0 0.0 0:00.00 kacpid 472 root 20 0 0 0 0 S 0.0 0.0 0:00.00 pdflush 473 root 15 0 0 0 0 S 0.0 0.0 0:00.06 pdflush 475 root 11 -5 0 0 0 S 0.0 0.0 0:00.00 aio/0

29
Troubleshooting CPU Issues
• Kernel Backtraces‒ Magic Keys (SysRq) can be used to trigger kernel
backtraces of all running processes
‒ Ensure magic keys are enabled:
echo 1 > /proc/sys/kernel/sysrq
‒ Trigger a backtrace:
echo t > /proc/sysrq-trigger
‒ Comparing multiple backtraces can show stuck processes
• SLES System Analysis and Tuning Guide‒ Tuning the Task Scheduler
30
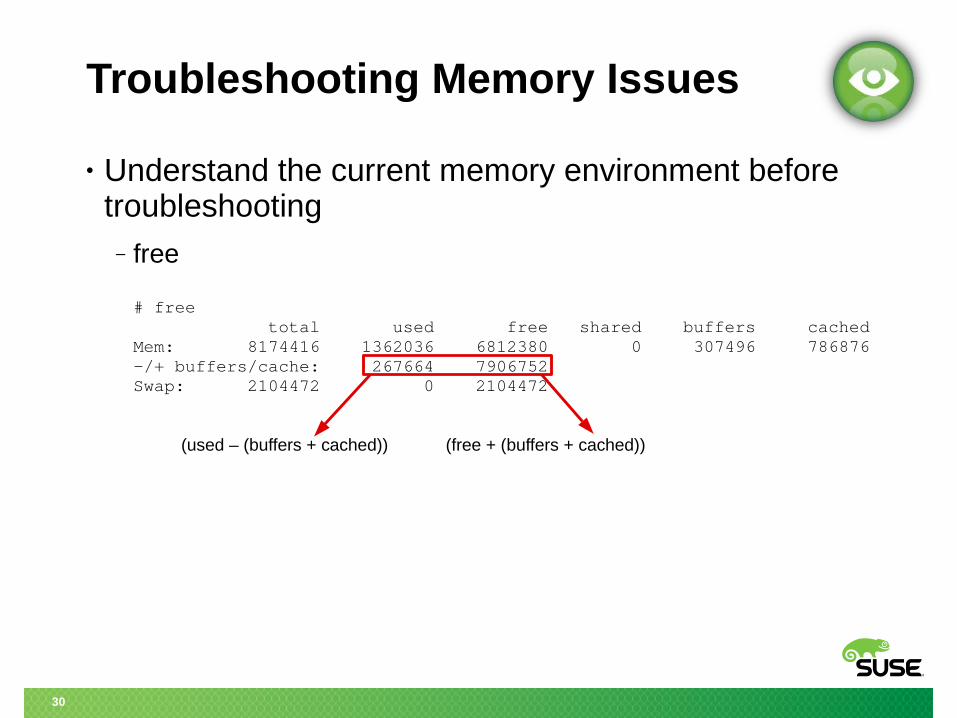
Troubleshooting Memory Issues
• Understand the current memory environment before troubleshooting‒ free
# free total used free shared buffers cachedMem: 8174416 1362036 6812380 0 307496 786876-/+ buffers/cache: 267664 7906752Swap: 2104472 0 2104472
(used – (buffers + cached)) (free + (buffers + cached))

31
Troubleshooting Memory Issues
• /proc/meminfo# cat /proc/meminfoMemTotal: 12133944 kBMemFree: 129496 kBBuffers: 140728 kBCached: 11014792 kBSwapCached: 0 kBActive: 1456400 kBInactive: 9838596 kBActive(anon): 120668 kBInactive(anon): 23576 kBActive(file): 1335732 kBInactive(file): 9815020 kBUnevictable: 0 kBMlocked: 0 kBSwapTotal: 2104472 kBSwapFree: 2104472 kBDirty: 32 kBWriteback: 0 kBAnonPages: 139520 kBMapped: 51588 kBShmem: 4768 kBSlab: 640252 kB
Swap stats:Total: Total amount of swapFree: Amount of free swap
Memory statistics, similar to theoutput of the free command
Anonymous pages:Memory allocated by malloc

32
Troubleshooting Memory Issues
• /proc/meminfo# cat /proc/meminfo...SReclaimable: 414976 kBSUnreclaim: 225276 kBKernelStack: 1984 kBPageTables: 10912 kBNFS_Unstable: 0 kBBounce: 0 kBWritebackTmp: 0 kBCommitLimit: 8171444 kBCommitted_AS: 418024 kBVmallocTotal: 34359738367 kBVmallocUsed: 313220 kBVmallocChunk: 34359421920 kBHardwareCorrupted: 0 kBAnonHugePages: 16384 kBHugePages_Total: 0HugePages_Free: 0HugePages_Rsvd: 0HugePages_Surp: 0Hugepagesize: 2048 kBDirectMap4k: 6148 kB
• Full details at /usr/src/linux/Documentation/filesystems/proc.txt
Overcommit memory stats: Limit: Current memory limit AS: Amount of memory committed
HugePages stats: Anon: Transparent Hugepages Total: Number of pages allocated Free: Number of unused pages

33
Troubleshooting Memory Issues
• /proc/zoneinfo‒ Contains an overview of each zone of memory, including
watermarks for memory freeing
min: Minimum amount of memory that must be freelow: Point at which the kernel begins memory reclaim processhigh: Point at which the memory reclaim process halts
• /proc/buddyinfo‒ Shows 'order of 2' memory allocations
‒ Pre-allocated blocks of contiguous memory (4K – 4M in size)
‒ Memory fragmentation exists when no free higher order allocations exist
34
Troubleshooting Memory Issues
• Overcommitting memory is the ability to allocate more memory than physically exists in the server‒ Overcommit modes:
‒ 0 Default mode, allow reasonable overcommit
‒ Kills processes in low memory conditions (oom-killer)
‒ 1 Always overcommit
‒ 2 Never overcommit, only allocate a percentage of RAM
‒ Refuses allocation attempts, rather than killing process
• Swapping‒ Some swapping does not indicate a memory problem

35
Troubleshooting Memory Issues
• Hugepages‒ Non-swappable reserved memory, usable only by
applications which support hugepages
‒ Memory is effectively lost, if no applications support hugepages
• Transparent Hugepages‒ Dynamic allocation of hugepages, usable by any process
‒ Best for systems with >128GB of RAM
‒ Performance degradation can be seen when under memory pressure
‒ Disable using
echo never > /sys/kernel/mm/transparent_hugepage/enabled
36
Troubleshooting I/O Issues
• Filesystem disk barriers‒ Disk write cache flushes, not required for battery
backed disks
• Understand the environment:‒ vmstat
‒ Shows number of blocks read/written to the disk
‒ iostat
‒ Show detailed statistics on each block device
‒ In a multipath environment, iostat can be used to monitor individual paths and the multipath pseudo node
# iostat -x 1 /dev/sda /dev/sdb /dev/dm-1

37
Troubleshooting I/O Issues
• Benchmarking‒ Be sure to benchmark the disk, not the cache!
‒ Sync the disks to write all dirty pages (sync)
‒ Drop the disk caches (echo 3 > /proc/sys/vm/drop_caches)
‒ Reading: Use dd to read a large file to /dev/null
‒ dd if=/data/testfile of=/dev/null bs=4k count=10000
‒ Writing: Use dd to read from /dev/zero (or a large file on another filesystem) and write to a filesystem or a raw device
‒ dd if=/tmp/largfile of=/dev/sdc conv=fdatasync bs=4k

38
Troubleshooting I/O Issues
• I/O Scheduler‒ Completely Fair Queuing (CFQ)
‒ Every thread gets a fair share of I/O resources
‒ NOOP
‒ No I/O rescheduling is performed, just passed to lower layers
‒ Deadline
‒ Latency-oriented scheduler
‒ Each I/O request has a deadline that if expired takes precedence over the normal sector queue
‒ Scheduler is changed through
‒ Kernel parameter: elevator=SCHEDULER
‒ On a disk-by-disk basis through: /sys/block/DEVICE/queue/scheduler

39
Troubleshooting I/O Issues
• If all else fails, blocktraces can be gathered to show how I/O is queued and dispatched to disk‒ Requires the -trace kernel
‒ blktrace watches the specified disks and logs all activity
‒ blktrace -d /dev/sdX /dev/dm-X -D /tmp/blktrace
‒ blkparse is used to analyze the output of blktrace
‒ The blkparse analysis is complicated and typically requires development assistance

Other Issues

41
Application Misconfiguration
• Regardless of the application, common troubleshooting steps include:‒ Check all log files (application specific and system logs)
‒ Use chkbin to verify binary appears sane
‒ Also confirms shared libraries appear sane
‒ Use strace look for file open calls and errors
• Supportconfig!‒ Grepping through supportconfig logs can be VERY useful

42
Library Problems
• Library problems include:‒ Missing library
‒ Incorrect (old) version found
‒ Library corruption
• Can be very difficult to track down‒ Check library dependencies using ldd
‒ Verify installed packages with rpm -V
‒ Use ldconfig -p to confirm libraries are properly found

43
Library Problems
• strace and ltrace can be used to find problems with specific symbols‒ strace -s 500 -f -o strace.log -ttT <problem application>
‒ Track down symbol errors using nm
‒ nm -AD [library] | grep [symbol]
‒ The nm output reports whether the symbol exists in the library, or must be provided by another library
‒ T Symbol exists in the text section
‒ U Symbol is undefined (and must be found elsewhere)

44
Library Issue Example
• Problem: ‒ Segfault when running YaST2 sw_single
• Error Message: ‒ Gtk-Message: Failed to load module "gnomesegvhandler":
libgnomesegvhandler.so: cannot open shared object file: No such file or directory /usr/lib/YaST2/bin/y2base: relocation error: /usr/lib64/libzypp.so.908: symbol gztell64, version ZLIB_1.2.3.3 not defined in file libz.so.1 with link time reference
• Utility: strace ‒ strace -s 500 -f -o /tmp/strace-zypp.log yast2 sw_single
‒ Search for unique part of error message: “gztell64”
‒ Search for library used: “libz.so.1”
45
Library Issue Example (continued)
• Utility: ldd‒ print shared library dependencies.
‒ ldd /usr/lib/YaST2/bin/y2base | less
‒ Shows libz.so.1, and where it is linked in from.
• Utility: ldconfig‒ /etc/ld.so.conf:
‒ ordered list of directories in which ldconfig will search for libraries.
‒ Determine which libraries are linked in:
‒ ldconfig -p | less - prints out list of libraries stored in current cache.
‒ In this case, three different libz.so.1 libraries exist:libz.so.1 (libc6,x86-64) => /usr/local/lib/libz.so.1libz.so.1 (libc6,x86-64) => /lib64/libz.so.1libz.so.1 (libc6) => /lib/libz.so.1

46
Library Issue Example (continued)
• Utility: nm‒ list symbols from object files.
‒ nm -AD /usr/local/lib/libz.so.1 | grep gztell/usr/local/lib/libz.so.1:0000000000003d10 T gztell
‒ * Notice there is a function defined but not 64 bit one.
‒ nm -AD /lib64/libz.so.1 | grep gztell/lib64/libz.so.1:000000000000cf10 T gztell/lib64/libz.so.1:000000000000ced0 T gztell64
‒ * Notice both functions defined including the one in the error message

47
Library Issue Example (continued)
• Utility: chkbin‒ Binary check tool which comes with supportutils rpm.
‒ Command:
‒ chkbin /usr/lib/YaST2/bin/y2base
‒ Check Log:
‒ /var/log/nts_chkbin_y2base_14908.txt
/usr/local/lib/libz.so.1 - from RPM: [ SymLink ] ->/usr/local/lib/libz.so.1.2.3 - from RPM: [ Not Owned ] :MD5SUM 073585b611a8a1f8b0a671175350637d

48
Human Error
• Mistakes can easily trigger a critical situation
‒ Deleting or changing critical files or libraries
• Backtrack for a quick resolution
‒ Check bash history for questionable commands
‒ Check most recently installed RPMs (rpm -qa –last)
‒ Verify installed RPMs (supportconfig -v)
• Compare supportconfig to known good server
‒ Consider regular supportconfig runs for a server history
• Make sure you have good backups!


Unpublished Work of SUSE. All Rights Reserved.This work is an unpublished work and contains confidential, proprietary and trade secret information of SUSE. Access to this work is restricted to SUSE employees who have a need to know to perform tasks within the scope of their assignments. No part of this work may be practiced, performed, copied, distributed, revised, modified, translated, abridged, condensed, expanded, collected, or adapted without the prior written consent of SUSE. Any use or exploitation of this work without authorization could subject the perpetrator to criminal and civil liability.
General DisclaimerThis document is not to be construed as a promise by any participating company to develop, deliver, or market a product. It is not a commitment to deliver any material, code, or functionality, and should not be relied upon in making purchasing decisions. SUSE makes no representations or warranties with respect to the contents of this document, and specifically disclaims any express or implied warranties of merchantability or fitness for any particular purpose. The development, release, and timing of features or functionality described for SUSE products remains at the sole discretion of SUSE. Further, SUSE reserves the right to revise this document and to make changes to its content, at any time, without obligation to notify any person or entity of such revisions or changes. All SUSE marks referenced in this presentation are trademarks or registered trademarks of Novell, Inc. in the United States and other countries. All third-party trademarks are the property of their respective owners.