Embed Size (px)
Citation preview

Susan Steck, PhD, MPH, RD Department of Epidemiology and Biostatistics
Cancer Prevention and Control Program Affiliated Scholar, Center for Research in Nutrition and Health Disparities
Arnold School of Public Health University of South Carolina

CANCER PREVENTION & CONTROL PROGRAM
No competing interests
Research Support ◦ National Institutes of Health: F31 National Research Service Predoctoral Award to Dr. Fred
Tabung Established Investigator Award in Cancer Prevention and
Control from NCI (K05CA136975) to Dr. James Hebert ◦ Prevent Cancer Foundation – Living in Pink Grant ◦ American Institute for Cancer Research (beginning January 2015)

CANCER PREVENTION & CONTROL PROGRAM

CANCER PREVENTION & CONTROL PROGRAM
Anti-inflammatory: ◦ Phytochemicals and micronutrients found in
vegetables and fruit ◦ Fiber/Whole grains ◦ Certain spices and seasonings
Pro-inflammatory: ◦ Saturated fatty acids ◦ Trans fatty acids ◦ Cholesterol
Adherence to healthy diet patterns, such as Mediterranean diet, reduces concentrations of inflammatory biomarkers.

CANCER PREVENTION & CONTROL PROGRAM
Inflammatory response is necessary for normal immune response.
NSAIDs reduce risk of some cancers, but with adverse side effects.
Dietary modification is likely to be safer, perhaps more beneficial than NSAIDs use.
Diet as a whole is likely to be more important than single constituents.

CANCER PREVENTION & CONTROL PROGRAM
Be able to classify an individual’s diet ranging from the extremes of pro- to anti-inflammatory and to adapt to diverse populations
Provide individuals with a tool to modify the inflammatory potential of their diet and researchers with a global measure of this inflammatory potential of the diet

CANCER PREVENTION & CONTROL PROGRAM
1) 1943 articles on 45 food parameters identified and scored
5) -World composite database for 45 food parameters based on data from 11 countries -Calculate world mean and standard deviation for each of the 45 food parameters.
4) Inflammatory effect score calculated from 2) and 3)
2) Weight articles by study design and calculate pro- and anti-inflammation fractions
3) Adjust scores if total weighted articles is <236
6) Based on available dietary intake data calculate z-scores and centered percentiles for each of the food parameters for each individual in the study, based on the world average and standard deviation.
8) Sum all of the “component specific DII scores” to create the “overall DII score” for an individual. .
7) Multiply centered percentile by the inflammatory effect score to obtain “component-specific DII score.”
Dietary intake made available to the scoring algorithm
Shivappa et al, 2014, PHN
CANCER PREVENTION & CONTROL PROGRAM
Due to the large number of articles on inflammation, the search was limited to six well known inflammatory markers:
IL-1β, IL-4, IL-6, IL-10, TNF-α, CRP A total of 45 food parameters were included in the search Variations in the names of food parameters were used to ensure
full representation Each food parameter was individually combined with the list of
inflammatory terms A total of 1943 articles published through 2010 qualified and
were indexed and scored

CANCER PREVENTION & CONTROL PROGRAM
Scoring Strategy
One of three possible values was assigned based on the effect of the particular food parameter on each inflammatory biomarker:
+1 if pro-inflammatory 0 if produced no change in inflammatory biomarker -1 if anti-inflammatory

CANCER PREVENTION & CONTROL PROGRAM
Type of Study Study Design Value Human Experimental 10
Prospective Cohort 8 Case-Control 7 Cross-sectional 6
Animal Experimental 5 Cell Culture Experimental 3

CANCER PREVENTION & CONTROL PROGRAM
Using these weighted values, a score for each food parameter was calculated using the following steps:
◦ Step 1: Divide the weighted pro- and anti-inflammatory
articles by total weighted number of articles. ◦ Step 2: Subtract the anti-inflammatory fraction from
the pro-inflammatory fraction.

CANCER PREVENTION & CONTROL PROGRAM
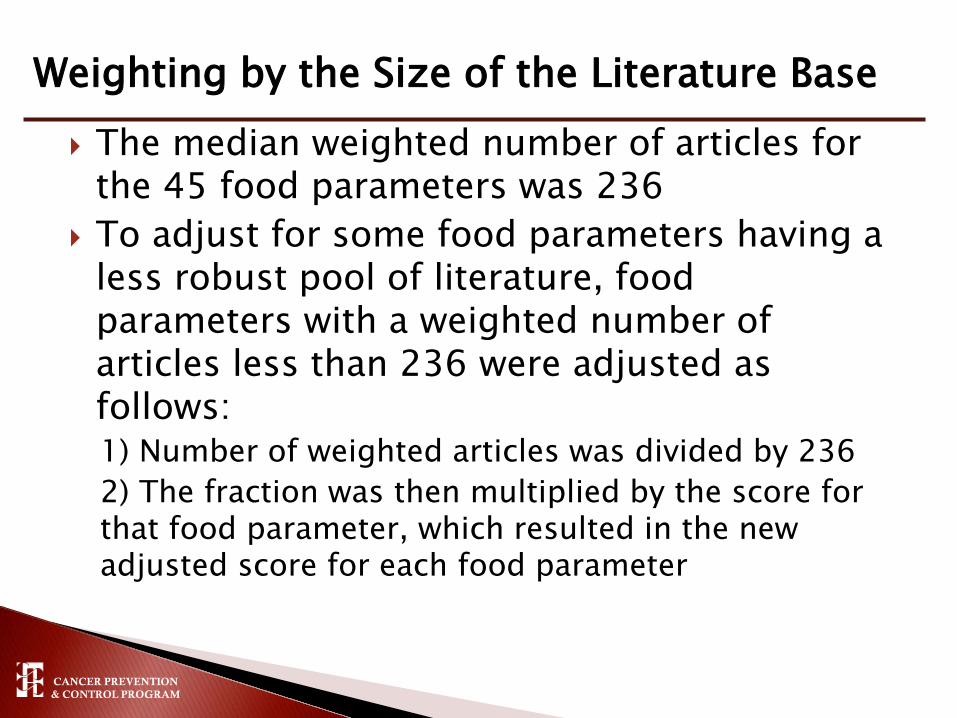
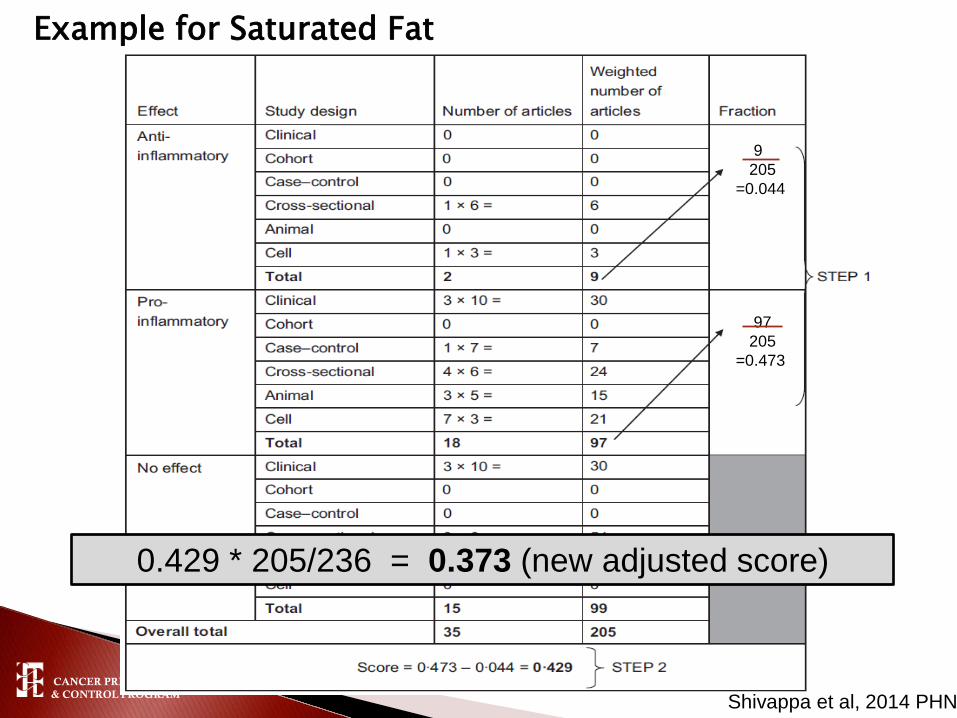
Example for Saturated Fat
9 205 =0.044
97 205 =0.473
Shivappa et al, 2014 PHN
CANCER PREVENTION & CONTROL PROGRAM
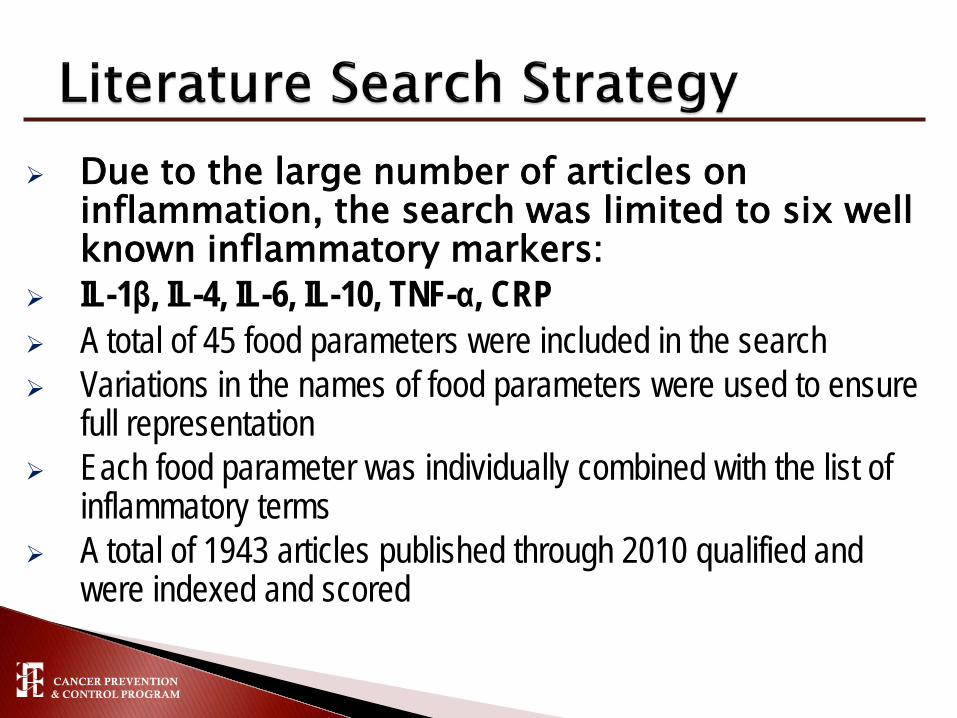
The median weighted number of articles for the 45 food parameters was 236
To adjust for some food parameters having a less robust pool of literature, food parameters with a weighted number of articles less than 236 were adjusted as follows: 1) Number of weighted articles was divided by 236 2) The fraction was then multiplied by the score for that food parameter, which resulted in the new adjusted score for each food parameter
Weighting by the Size of the Literature Base
CANCER PREVENTION & CONTROL PROGRAM
Example for Saturated Fat
9 205 =0.044
97 205 =0.473
Shivappa et al, 2014 PHN
0.429 * 205/236 = 0.373 (new adjusted score)

CANCER PREVENTION & CONTROL PROGRAM Shivappa et al, 2014, PHN

CANCER PREVENTION & CONTROL PROGRAM
1) 1943 articles on 45 food parameters identified and scored
5) -World composite database for 45 food parameters based on data from 11 countries -Calculate world mean and standard deviation for each of the 45 food parameters.
4) Inflammatory effect score calculated from 2) and 3)
2) Weight articles by study design and calculate pro- and anti-inflammation fractions
3) Adjust scores if total weighted articles is <236
6) Based on available dietary intake data calculate z-scores and centered percentiles for each of the food parameters for each individual in the study, based on the world average and standard deviation.
8) Sum all of the “component specific DII scores” to create the “overall DII score” for an individual. .
7) Multiply centered percentile by the inflammatory effect score to obtain “component-specific DII score.”
Dietary intake made available to the scoring algorithm
Shivappa et al, 2014, PHN

CANCER PREVENTION & CONTROL PROGRAM
More negative scores represent anti-inflammatory diet whereas more positive scores represent pro-inflammatory diet
Approximate range is -10 to 10

CANCER PREVENTION & CONTROL PROGRAM
Seasonal Variation in Blood Cholesterol Study (SEASONS) (n=~500) ◦ DII calculated from 24 hour recalls and structured 7 day food records ◦ Third tertile of DII compared to first tertile associated with 47% to 61%
increased odds of having elevated CRP (>3mg/L)
Women’s Health Initiative (WHI) ancillary study (n=2600): ◦ DII calculated from baseline FFQ ◦ More pro-inflammatory diet associated with higher: IL-6 (p<0.0001) hs-CRP [OR for elevated CRP = 1.34 (1.01, 1.78) for Q5 vs Q1] TNFalpha R2 (p<0.002) Overall inflammatory biomarker score derived from a combination of
the three biomarkers (p<0.0001)

CANCER PREVENTION & CONTROL PROGRAM
Secondary data analyses of prospective cohort studies ◦ Iowa Women’s Health Study (colorectal cancer) ◦ Women’s Health Initiative (colorectal and breast cancers) ◦ NIH-AARP (colorectal cancers)
DII calculated from baseline FFQs Multiple covariate-adjusted Cox proportional hazards regression
models used to calculate hazard ratios (HR) and 95%CIs

CANCER PREVENTION & CONTROL PROGRAM
0.6
0.8
1
1.2
1.4
1.6
1.8
Q1 Q2 Q3 Q4 Q5
Colorectal cancer
Shivappa et al. 2014 CEBP
Haz
ard
ratio
DII Quintile

CANCER PREVENTION & CONTROL PROGRAM
0.6
0.8
1
1.2
1.4
1.6
1.8
Q1 Q2 Q3 Q4 Q5
Colorectal cancer
Colon cancer
Shivappa et al. 2014 CEBP
Haz
ard
ratio
DII Quintile

CANCER PREVENTION & CONTROL PROGRAM
0.6
0.8
1
1.2
1.4
1.6
1.8
Q1 Q2 Q3 Q4 Q5
Colorectal cancer
Colon cancer
Rectal cancer
Shivappa et al. 2014 CEBP
Haz
ard
ratio
DII Quintile

CANCER PREVENTION & CONTROL PROGRAM
0.6
0.8
1
1.2
1.4
1.6
1.8
Q1 Q2 Q3 Q4 Q5
Colorectal cancer
Colon cancer
Proximal coloncancer
Tabung et al. under review
Haz
ard
ratio
DII Quintile

CANCER PREVENTION & CONTROL PROGRAM
0.6
0.8
1
1.2
1.4
1.6
1.8
Q1 Q2 Q3 Q4
Males
Females
Wirth et al. under review
Haz
ard
ratio
DII Quartile

CANCER PREVENTION & CONTROL PROGRAM
T1 (-7.055, <-
2.366) (healthiest)
T2 (-2.366, <0.468)
T3 (0.468, 5.789) (least healthy)
Ptrend
Breast cancer cases, n=5841 2155 1912 1774
Breast cancer HR (95%CI)a 1.00 (ref) 0.95 (0.89, 1.01) 0.99 (0.92, 1.06) 0.89
HER2+ cases, n=662 215 222 225
HER2+ cancer HR (95%CI)a 1.00 (ref) 1.12 (0.92, 1.35) 1.29 (1.05, 1.59) 0.01
Breast cancer mortality, n=406 117 136 153
Breast cancer mortality HR (95%CI) b 1.00 (ref) 1.06 (0.81, 1.37) 1.30 (0.99, 1.71) 0.04
aadjusted for age, race/ethnicity, body mass index, physical activity, education, smoking status, mammography within 2 years of baseline, age at menarche, number of live births, oophorectomy status, hormone therapy use, NSAID use, dietary modification trial arm, hormone therapy trial arm, calcium and vitamin D trial arm, and total energy intake; badjusted for age, race/ethnicity, body mass index, physical activity, education, smoking status, mammography within 2 years of baseline, hormone therapy use, NSAID use, dietary modification trial arm, hormone therapy trial arm, calcium and vitamin D trial arm, total energy intake, estrogen receptor status, progesterone receptor status, stage and time since diagnosis
Tabung et al. in preparation

CANCER PREVENTION & CONTROL PROGRAM
Diet assessment at only one time point (baseline)
FFQ measurement error
Generalizability
Potential residual or unmeasured confounding
0.0
0.5
1.0
1.5
Day Shift Night Shift RotatingShift
Mean DII by Shift Work in NHANES 2005-2010
Wirth et al. 2014 JOEM

CANCER PREVENTION & CONTROL PROGRAM
More pro-inflammatory DII scores were associated positively with inflammatory biomarkers.
More pro-inflammatory DII scores were associated with increased risk of colorectal cancer among postmenopausal women in the IWHS and WHI. ◦ Increased risk for men observed in the NIH-AARP though no
association for women in NIH-AARP
The DII was not associated with invasive breast cancer risk ◦ Suggestion of increased risk for HER2+ cancers and for breast
cancer mortality

CANCER PREVENTION & CONTROL PROGRAM
Examining DII using post-diagnosis dietary data in relation to cancer survival.
The DII can be applied in studies utilizing 24 hour recall, food record or FFQ dietary assessment data.
An “app” is under development to assist clinicians in screening patients, and to help consumers move toward a more anti-inflammatory diet.

CANCER PREVENTION & CONTROL PROGRAM
Fred Tabung, Postdoctoral Fellow Harvard School of Public Health
James Hebert, Director, Cancer Prevention and Control Program, Distinguished Professor EPID, USC
Judith Ockene, Professor
Yunsheng Ma, Assoc. Professor
Tom Hurley, Statistician, CPCP, USC
Jiajia Zhang, Assoc. Professor, BIOS, USC
Mike Wirth, Res. Asst. Professor. CPCP, USC
UMass Medical School
Nitin Shivappa, Postdoctoral Fellow, CPCP, USC
Angela Liese, Professor, EPID, USC

CANCER PREVENTION & CONTROL PROGRAM
Ilir Agalliu Albert Einstein College of Medicine Cindy Blair University of Minnesota Bette Caan Kaiser Permanente Division of Research Rowan T. Chlebowski UCLA School of Medicine Jo L. Freudenheim SUNY Dept. of Social and Preventive Medicine Melanie Hingle Univ. Ariz. Dept. of Nutritional Sciences Gloria Ho Albert Einstein College of Medicine Lifang Hou Northwestern Univ. Feinberg School of Medicine David Jacobs University of Minnesota Li Jiao Baylor College of Medicine Karen K. Johnson Univ. of Tennessee Health Science Center Dorothy S. Lane Stony Brook Univ. School of Medicine Lisa W. Martin GWU School of Medicine and Health Sciences Amy E. Millen SUNY Dept. of Preventive Medicine Yasmin Mossavar-Rahmani Albert Einstein College of Medicine Hannah L. Park UC Irvine Dept. of Epidemiology Anna Prizment University of Minnesota Lihong Qi UC Davis School of Medicine Milagros C. Rosal UMass Medical School James M. Shikany UAB School of Medicine Linda Snetselaar The University of Iowa Frances A. Tylavsky Univ. of Tennessee Health Science Center Mara Z. Vitolins Wake Forest School of Medicine Jean Wactawski-Wende SUNY Dept. of Social and Preventive Medicine


CANCER PREVENTION & CONTROL PROGRAM Shivappa et al, 2014, PHN

CANCER PREVENTION & CONTROL PROGRAM Shivappa et al, 2014, PHN