Embed Size (px)
Citation preview
Survival comorbidity
Mrs Retha SteenkampSenior StatisticianUK Renal Registry
UK Renal Registry2011 Annual Audit Meeting
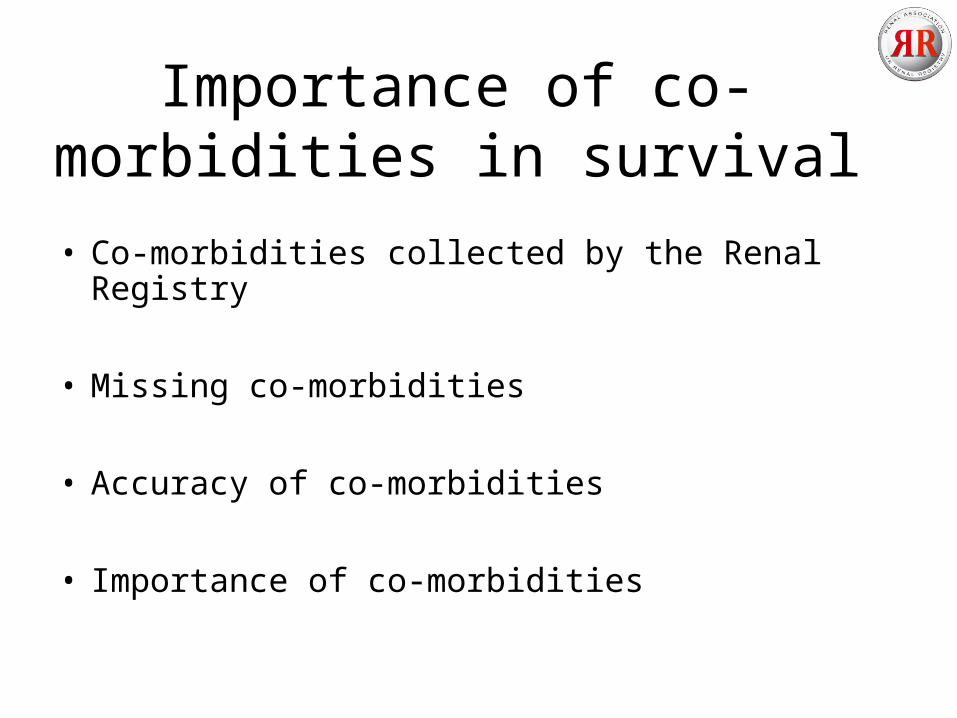
Importance of co-morbidities in survival
• Co-morbidities collected by the Renal Registry
• Missing co-morbidities
• Accuracy of co-morbidities
• Importance of co-morbidities
Co-morbidities collected by the Renal Registry
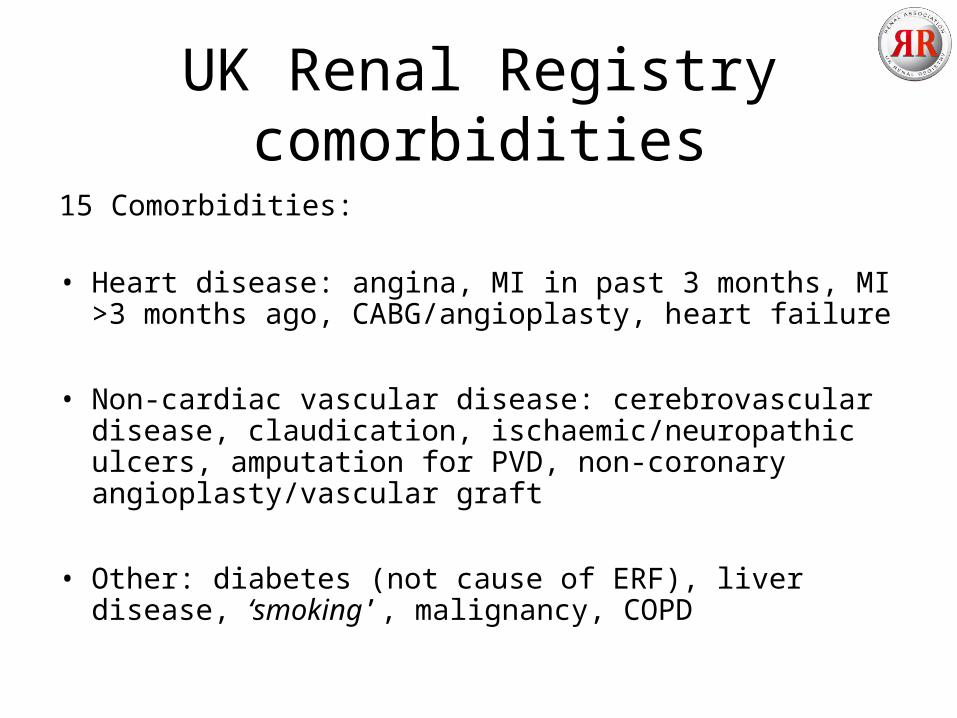
UK Renal Registry comorbidities
15 Comorbidities:
• Heart disease: angina, MI in past 3 months, MI >3 months ago, CABG/angioplasty, heart failure
• Non-cardiac vascular disease: cerebrovascular disease, claudication, ischaemic/neuropathic ulcers, amputation for PVD, non-coronary angioplasty/vascular graft
• Other: diabetes (not cause of ERF), liver disease, ‘smoking’, malignancy, COPD
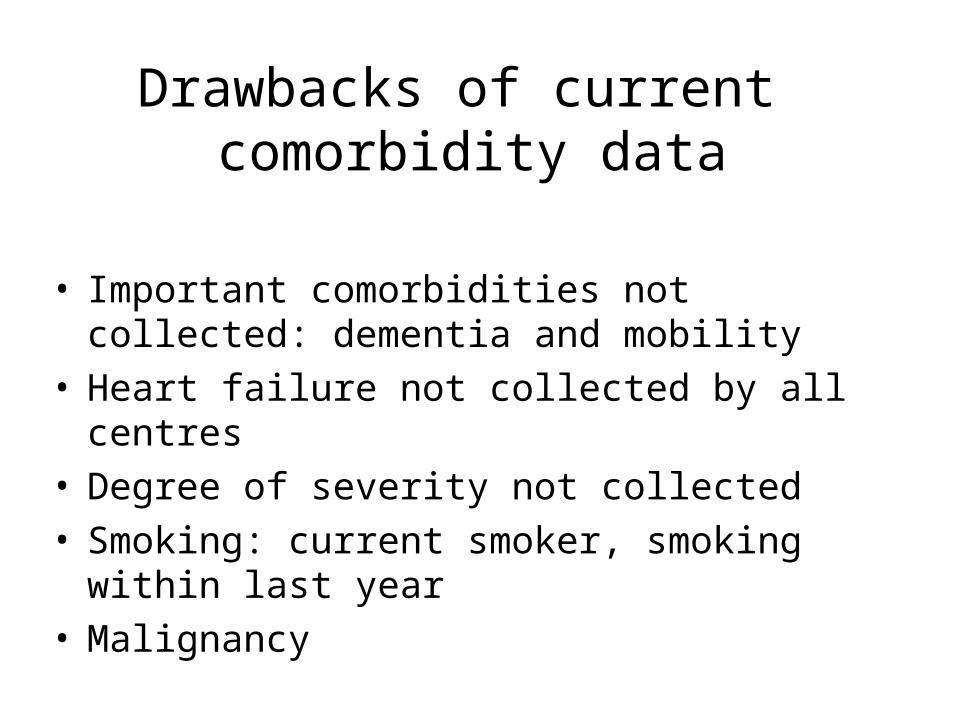
Drawbacks of current comorbidity data
• Important comorbidities not collected: dementia and mobility
• Heart failure not collected by all centres • Degree of severity not collected• Smoking: current smoker, smoking within last
year• Malignancy
Missing co-morbidities
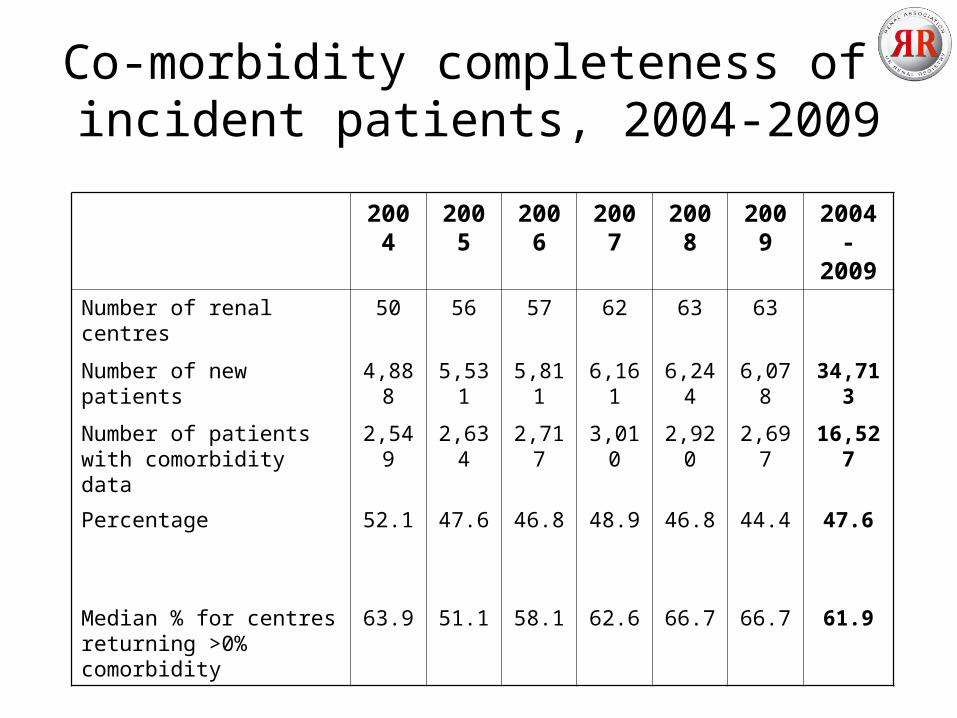
Co-morbidity completeness of incident patients, 2004-2009
2004 2005 2006 2007 2008 2009 2004-2009
Number of renal centres 50 56 57 62 63 63
Number of new patients 4,888 5,531 5,811 6,161 6,244 6,078 34,713
Number of patients with comorbidity data
2,549 2,634 2,717 3,010 2,920 2,697 16,527
Percentage 52.1 47.6 46.8 48.9 46.8 44.4 47.6
Median % for centres returning >0% comorbidity
63.9 51.1 58.1 62.6 66.7 66.7 61.9
Problems caused by missing co-morbidity data
• Not adjusting for comorbidity might lead to inadequate case-mix adjustment
• Case-mix adjustment in statistical models are limited to complete cases- Loss of statistical power- Loss of information- Selection bias- Lack of generalisability
• Most standard statistical methods assumes complete data
Patterns and effects of missing co-morbidity data - 1
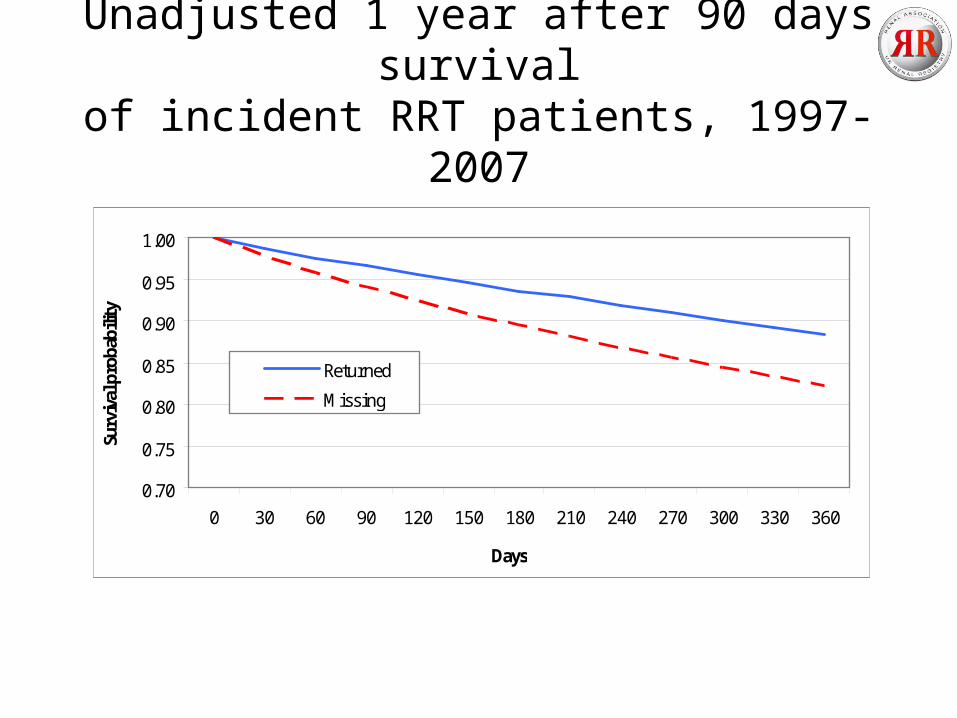
• Patients with missing co-morbidity data do considerably worse
• Proportion of patients with co-morbid condition may be higher amongst those with missing co-morbidity data
• Multiple imputation found a higher prevalence of co-morbid conditions than seen in those with available data
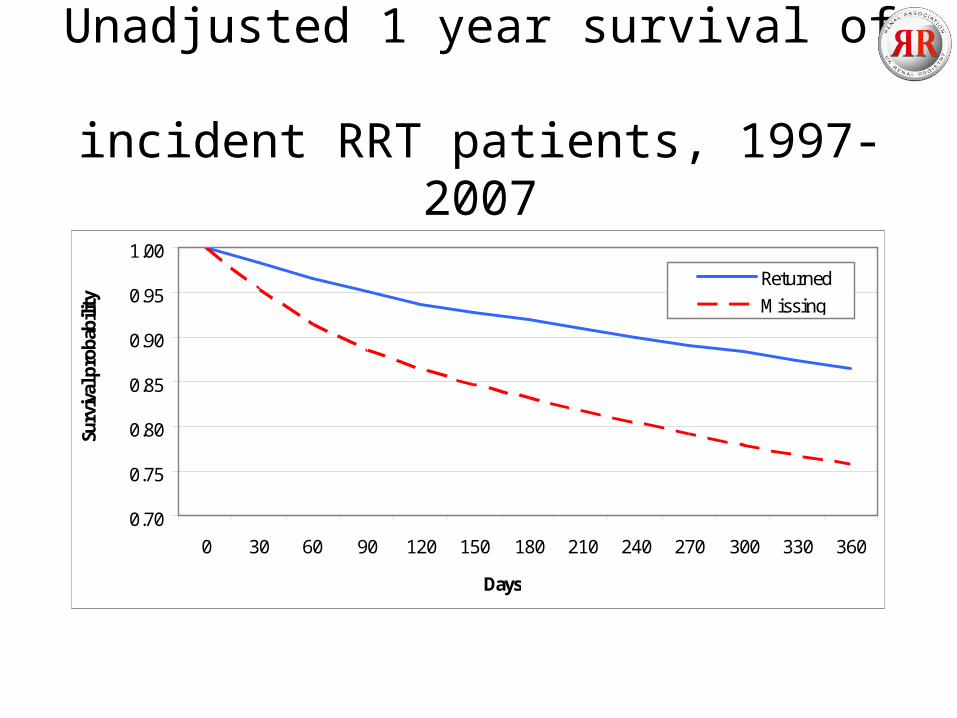
Unadjusted 1 year survival of incident RRT patients, 1997-2007
0.70
0.75
0.80
0.85
0.90
0.95
1.00
0 30 60 90 120 150 180 210 240 270 300 330 360
Days
Surv
ival
pro
babi
lity
ReturnedMissing
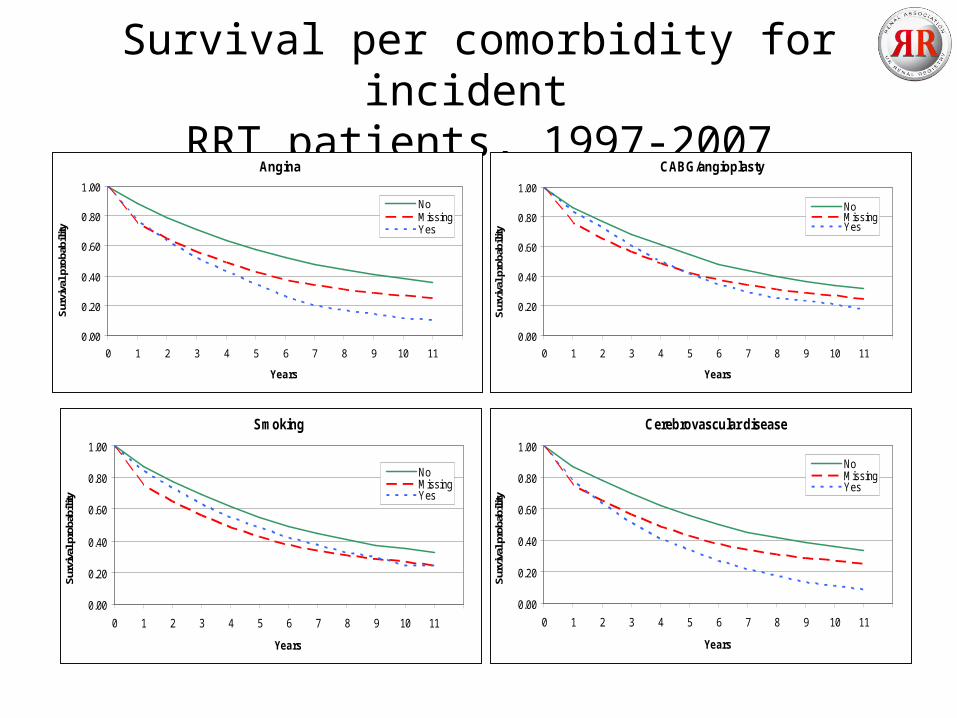
Survival per comorbidity for incident RRT patients, 1997-2007
Angina
0.00
0.20
0.40
0.60
0.80
1.00
0 1 2 3 4 5 6 7 8 9 10 11
Years
Sur
viva
l pro
babi
lity
NoMissingYes
CABG/angioplasty
0.00
0.20
0.40
0.60
0.80
1.00
0 1 2 3 4 5 6 7 8 9 10 11
Years
Sur
viva
l pro
babi
lity
NoMissingYes
Cerebrovascular disease
0.00
0.20
0.40
0.60
0.80
1.00
0 1 2 3 4 5 6 7 8 9 10 11
Years
Surv
ival
pro
babi
lity
NoMissingYes
Smoking
0.00
0.20
0.40
0.60
0.80
1.00
0 1 2 3 4 5 6 7 8 9 10 11
Years
Surv
ival
pro
babi
lity
NoMissingYes
Patterns and effects of missing co-morbidity data – 2
• Treating missing co-morbidity data as indication of an absent co-morbidity (i.e. a tick only if yes policy) would lead to an attenuation of the association between co-morbidity and survival
Accuracy of co-morbidities
Accuracy of co-morbidity data – 1
• 17 regularly collected co-morbidities (USRDS data) were validated against co-morbidities collected for the ICED
• Findings for sensitivity:- reasonably good (>0.80) for only 1 co-morbidity- moderate (0.77-0.67) for 4 co-morbidities- intermediate (0.52-0.40) for 7 co-morbidities - poor (<0.40) for 5 co-morbidities- Average across all 17 co-morbidities was 0.59%- Higher in PD and diabetic patients- Less accurate for each co-morbidity added
• The study has shown that co-morbidities were severely underreported
Longenecker , JASN 2000
Accuracy of co-morbidity data – 2
• Self-reporting of 8 co-morbidities compared to medical records and physician reports
• Self-reporting varied with specific co-morbid condition. Substantial agreement for diabetes (k=0.93) and coronary artery intervention (k=0.79), but poor agreement for COPD (k=0.20)
• Co-morbidities reported by the physician equal or lower to patient self-reporting
• The study has shown that co-morbidities were severely underreported
Merkin, Journal of Clinical Epidemiology, 2007
Accuracy of co-morbidity data – 3
• The UK Renal Registry performed a data validation exercise in the Welsh centres
• Registry data was validated for completeness and accuracy against information held in the unit’s renal IT system and patient notes
• Twenty patients were randomly selected from each unit
• Only 2 renal centres were found to regularly capture co-morbidity data and completeness and accuracy was 87-100%
Accuracy of co-morbidity data – 4
• The ANZDATA registry investigated the accuracy of co-morbidities:– confirmed co-morbid conditions were accurately reported– result opinion based in the absence of a gold standard (Karamadoukis, NDT, 2009)
• Canadian Organ Replacement Register (CORR) assessed the quality of data collected by comparing with medical charts:– co-morbidities were under-reported– sensitivities ranged from 89% for hypertension to 47% for
PVD– specificity was >0.93 for all co-morbidities except
hypertension(Moist, CJASN, 2011)
Importance of co-morbidities
Importance of co-morbidities in patients on RRT -1
• The selection of modality and patient outcomes are affected by case-mix factors such as co-
morbidity
• Well completed co-morbidity data will enable the selection of patients based on their co-
morbidities for further study
• Individual patient co-morbidity and prognosis
• UK country and centre level comparisons and co-morbidities
• International co-morbidity comparisons
Variance explained by co-morbidity
• A study by van Manen et al. compared survival between 5 European countries
• After adjusting for age, gender, PRD, modality and country, adjusting for 5 co-morbidities (diabetes mellitus, ischaemic
heart disease, PVD, cerebrovascular disease and malignancy) explained only 1.9% of additional variation in outcome
on top of the 14.4%
van Manen, NDT, 2007
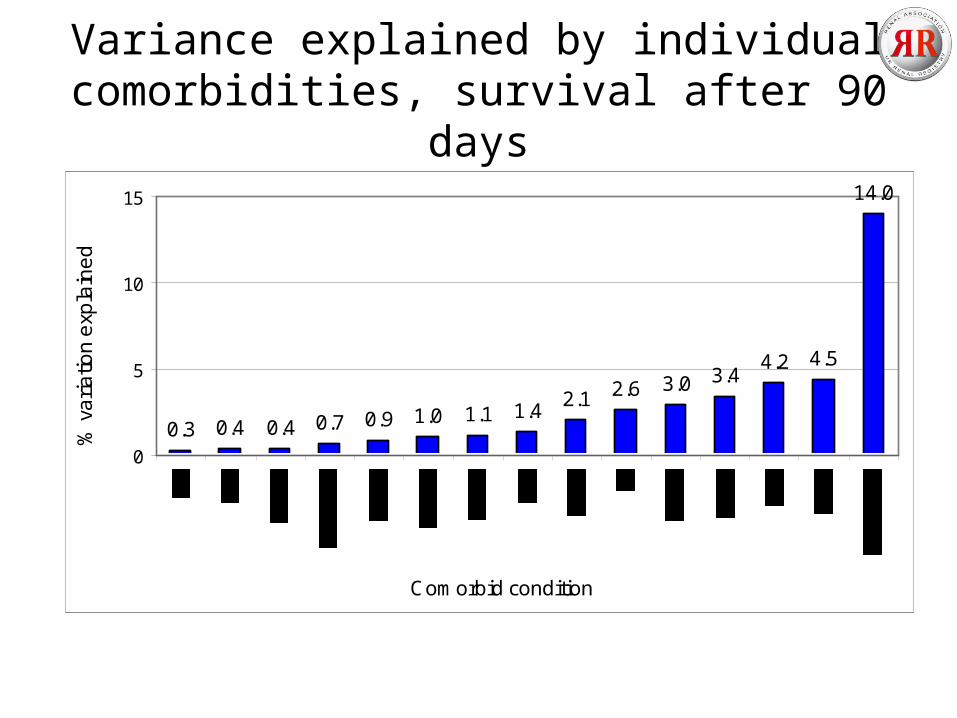
Variance explained by individual comorbidities, survival after 90 days
0.3 0.4 0.4 0.7 0.9 1.0 1.1 1.42.1 2.6 3.0 3.4
4.2 4.5
14.0
0
5
10
15
Comorbid condition
% v
ari
atio
n e
xpla
ine
d
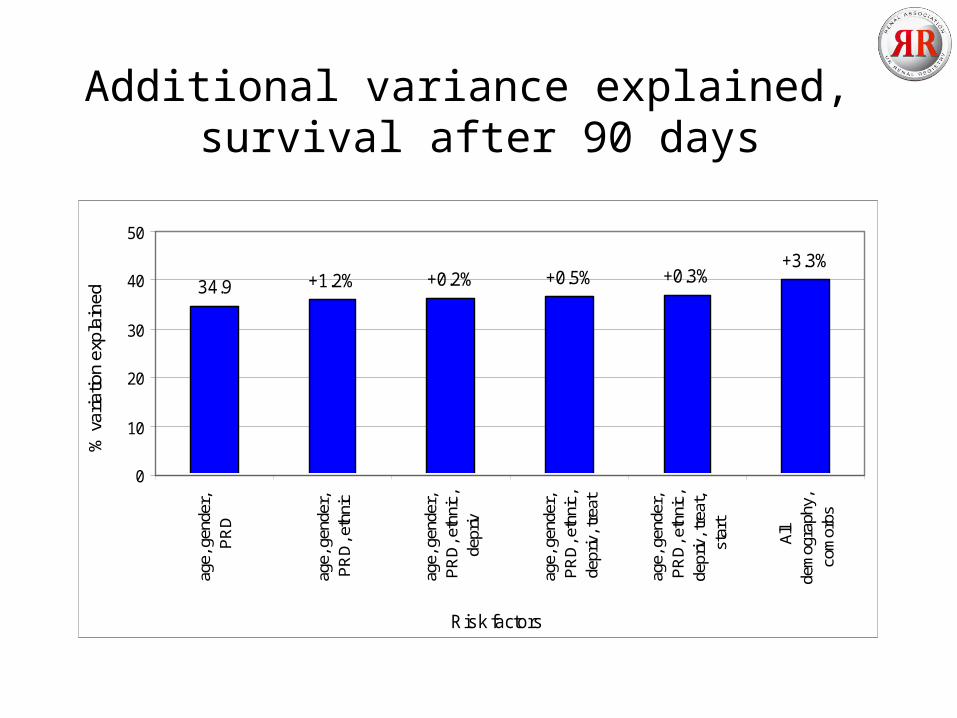
Additional variance explained, survival after 90 days
34.9 +1.2% +0.2% +0.5% +0.3%+3.3%
0
10
20
30
40
50
age,
gen
der,
PR
D
age,
gen
der,
PR
D, e
thni
c
age,
gen
der,
PR
D, e
thni
c,de
priv
age,
gen
der,
PR
D, e
thni
c,de
priv
, tre
at
age,
gen
der,
PR
D, e
thni
c,de
priv
, tre
at,
star
t
All
dem
ogra
phy,
com
orbs
Risk factors
% v
aria
tion
expl
aine
d
Prognostic co-morbidities
• Should co-morbidity collection be reduced to a core set with a strong association to
outcome?
• A study by Miskulin et al. tried to determine which co-morbidities are most prognostic and whether co-morbidities continue to
contribute to survival once laboratory and clinical factors have been accounted for
Prognostic co-morbidities - 2Result:
• 17 out of a total of 45 co-morbidities are most prognostic and provide equivalent discrimination and explained variance
compared to the 45 co-morbidities
• Variance explained increased from 13% to 17% upon adding co-morbidities to demographic and laboratory/clinical
parameters
Miskulin, CJASN, 2009
25
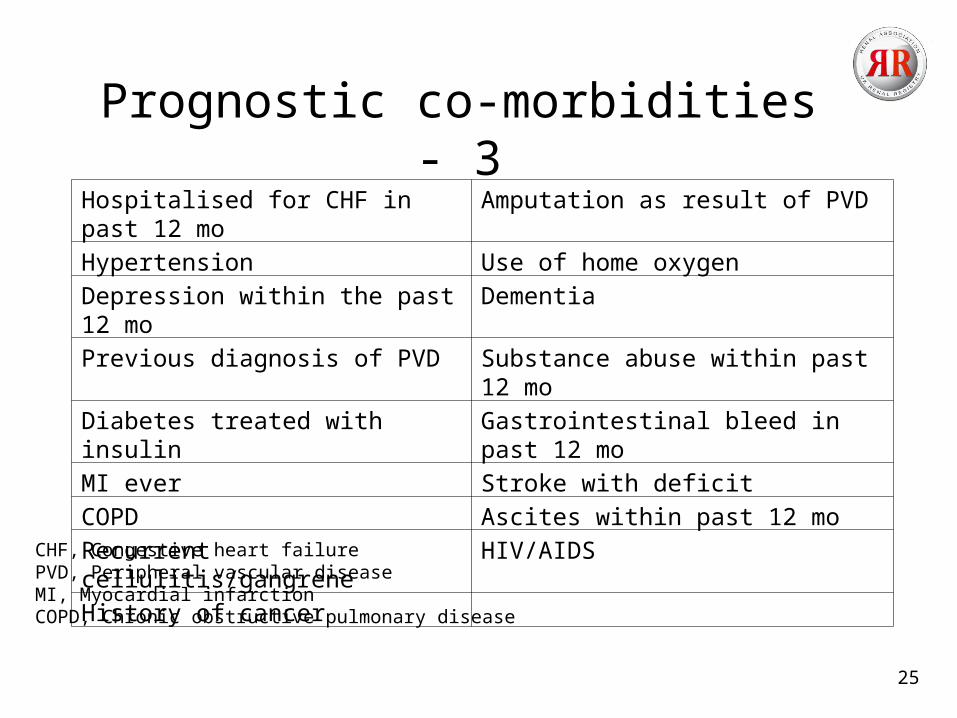
Prognostic co-morbidities - 3
Hospitalised for CHF in past 12 mo Amputation as result of PVD
Hypertension Use of home oxygen
Depression within the past 12 mo Dementia
Previous diagnosis of PVD Substance abuse within past 12 mo
Diabetes treated with insulin Gastrointestinal bleed in past 12 mo
MI ever Stroke with deficit
COPD Ascites within past 12 mo
Recurrent cellulitis/gangrene HIV/AIDS
History of cancer
CHF, Congestive heart failurePVD, Peripheral vascular diseaseMI, Myocardial infarctionCOPD, Chronic obstructive pulmonary disease
Is the severity of co-morbidities important?
• A study by Miskulin et al. investigated if the change in co-morbidity predict survival in incident dialysis patients
• Results: the increase in the severity of existing co-morbid conditions and
additional co-morbidities after start of RRT are important prognostic markers, independent of other case-mix factors
Miskulin, AJKD, 2003
Is the severity of co-morbidities important?
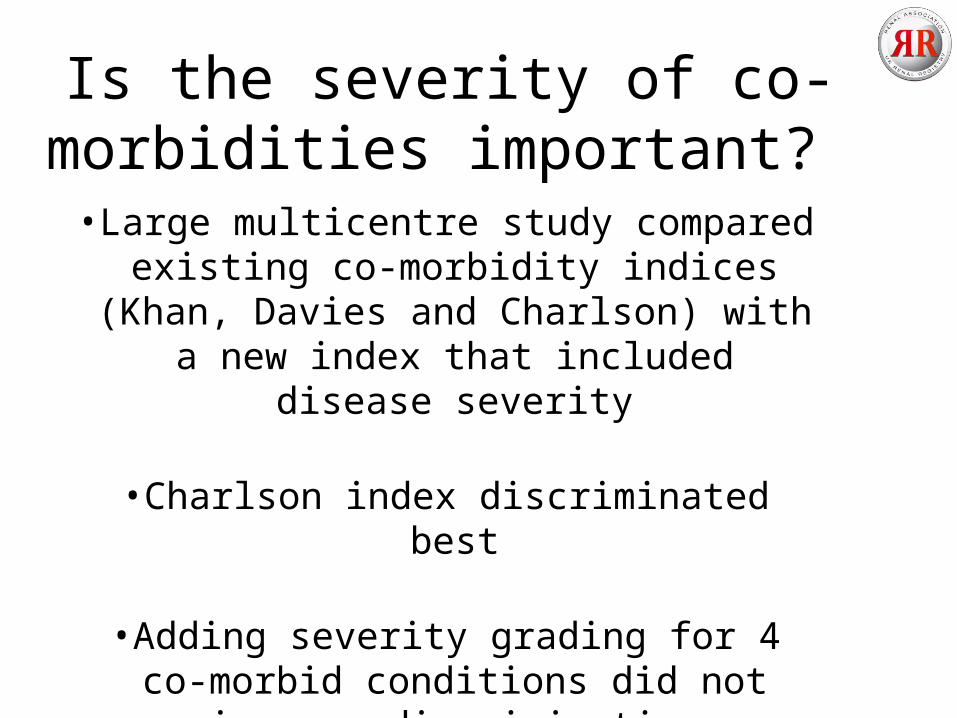
• Large multicentre study compared existing co-morbidity indices (Khan, Davies and
Charlson) with a new index that included disease severity
• Charlson index discriminated best
• Adding severity grading for 4 co-morbid conditions did not improve discrimination
van Manen, AJKD, 2002
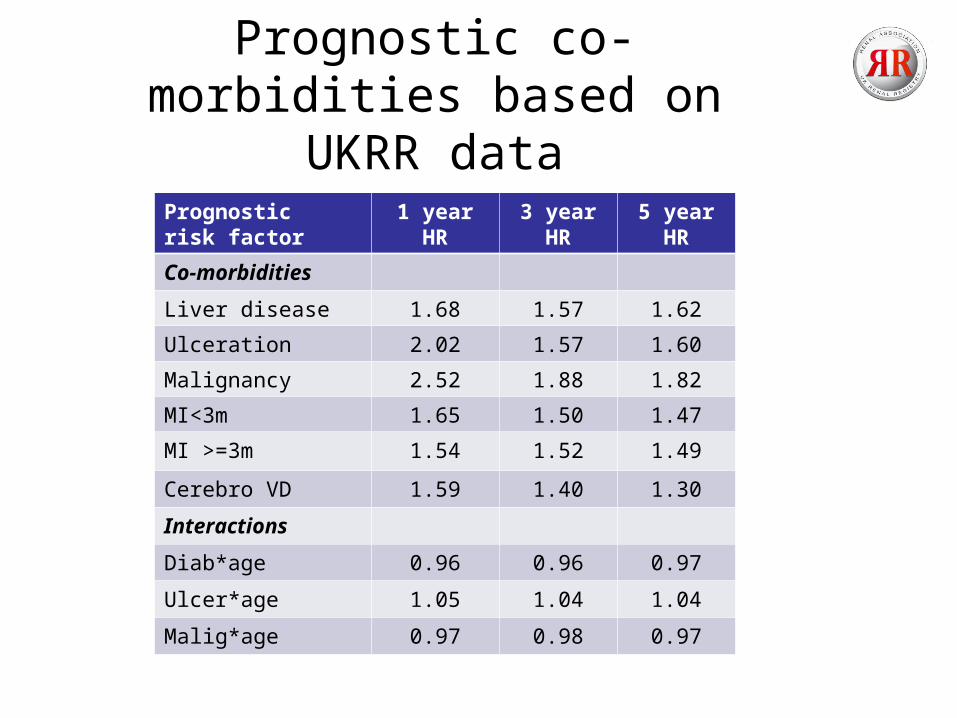
Prognostic co-morbidities based on UKRR data
Prognostic risk factor
1 year HR 3 year HR 5 year HR
Co-morbidities
Liver disease 1.68 1.57 1.62
Ulceration 2.02 1.57 1.60
Malignancy 2.52 1.88 1.82
MI<3m 1.65 1.50 1.47
MI >=3m 1.54 1.52 1.49
Cerebro VD 1.59 1.40 1.30
Interactions
Diab*age 0.96 0.96 0.97
Ulcer*age 1.05 1.04 1.04
Malig*age 0.97 0.98 0.97

Conclusion
• Outcome differences between patients with and without co-morbidity
• Co-morbid conditions are important predictors of outcome
• Important in explaining differences between centres and UK nations and important for individual prognosis
• Validation exercises have shown that co-morbidities are severely under-reported
• Co-morbidities do add to variance explained and add a modest amount of independent prognostic information that cannot be substituted by clinical/laboratory parameters
Acknowledgements
Many thanks to:
• UK renal centres and patients• Data and systems staff (UKRR)• Biostatisticians (UKRR)
Prognostic survival prediction tool
• Prognostic information is rarely discussed with patients because of clinical uncertainty about accuracy
• Promising methods for formulating prognosis applied to ESRD:
– Survival estimates using a statistical model– The clinician’s prediction of survival– Combination of the two methods
• Prognostic survival tool was developed and validated for HD population
LM Cohen, R Ruthazer, AH Moss, MJ Germain: Predicting six-month mortality for patients who are on maintenance hemodialysis. Clin J Am Soc Neprol 2010; 5:72-79
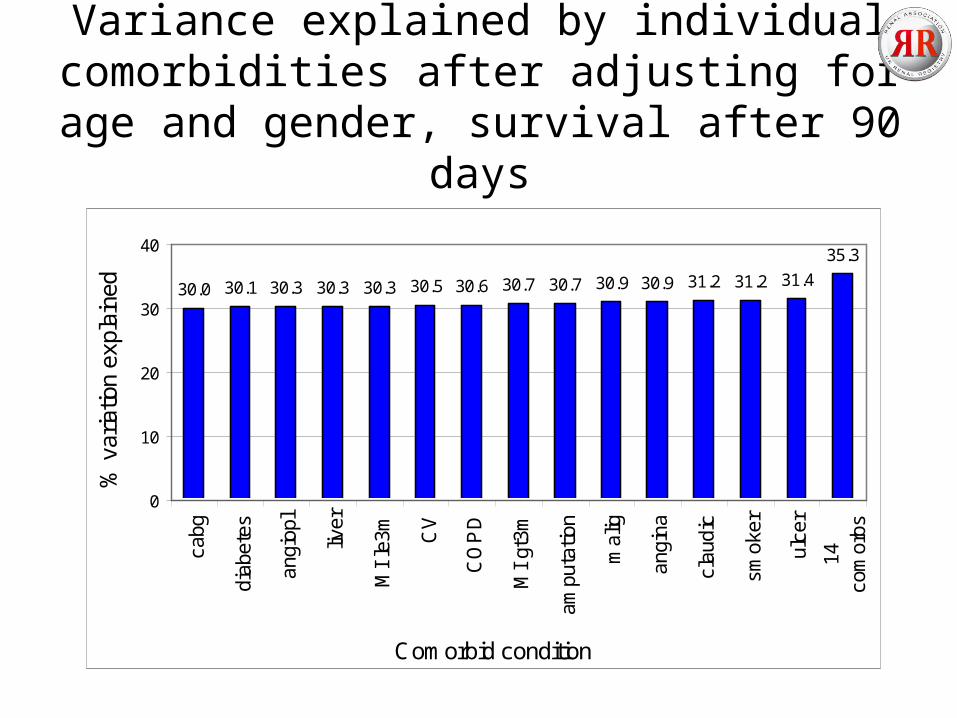
Variance explained by individual comorbidities after adjusting for age and
gender, survival after 90 days
30.0 30.1 30.3 30.3 30.3 30.5 30.6 30.7 30.7 30.9 30.9 31.2 31.2 31.4
35.3
0
10
20
30
40
cabg
diab
etes
angi
opl
liver
MI
le3m C
V
CO
PD
MI
gt3m
ampu
tatio
n
mal
ig
angi
na
clau
dic
smok
er
ulce
r
14co
mor
bs
Comorbid condition
% v
aria
tion
expl
aine
d
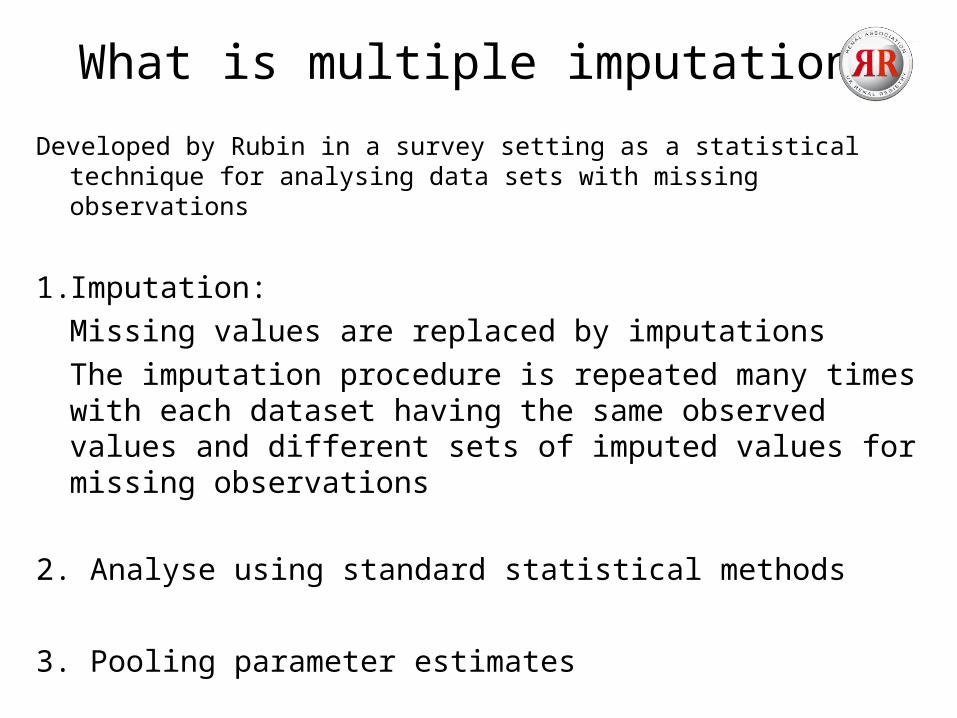
What is multiple imputation?
Developed by Rubin in a survey setting as a statistical technique for analysing data sets with missing observations
1. Imputation:
Missing values are replaced by imputations
The imputation procedure is repeated many times with each dataset having the same observed values and different sets of imputed values for missing observations
2. Analyse using standard statistical methods
3. Pooling parameter estimates
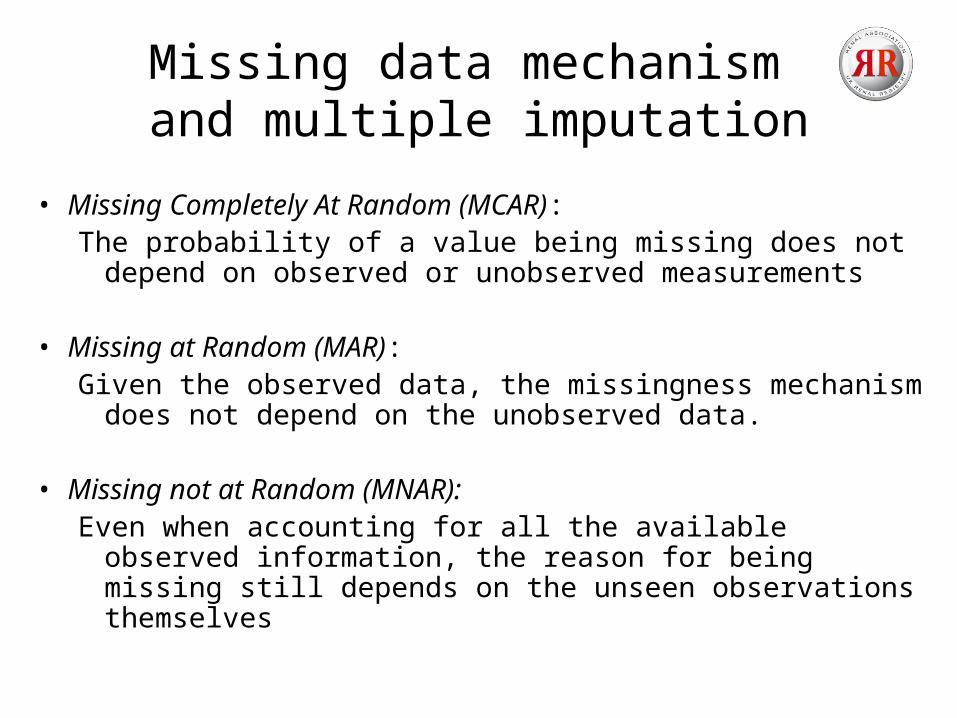
Missing data mechanism and multiple imputation
• Missing Completely At Random (MCAR):The probability of a value being missing does not depend
on observed or unobserved measurements
• Missing at Random (MAR): Given the observed data, the missingness mechanism does
not depend on the unobserved data.
• Missing not at Random (MNAR): Even when accounting for all the available observed
information, the reason for being missing still depends on the unseen observations themselves
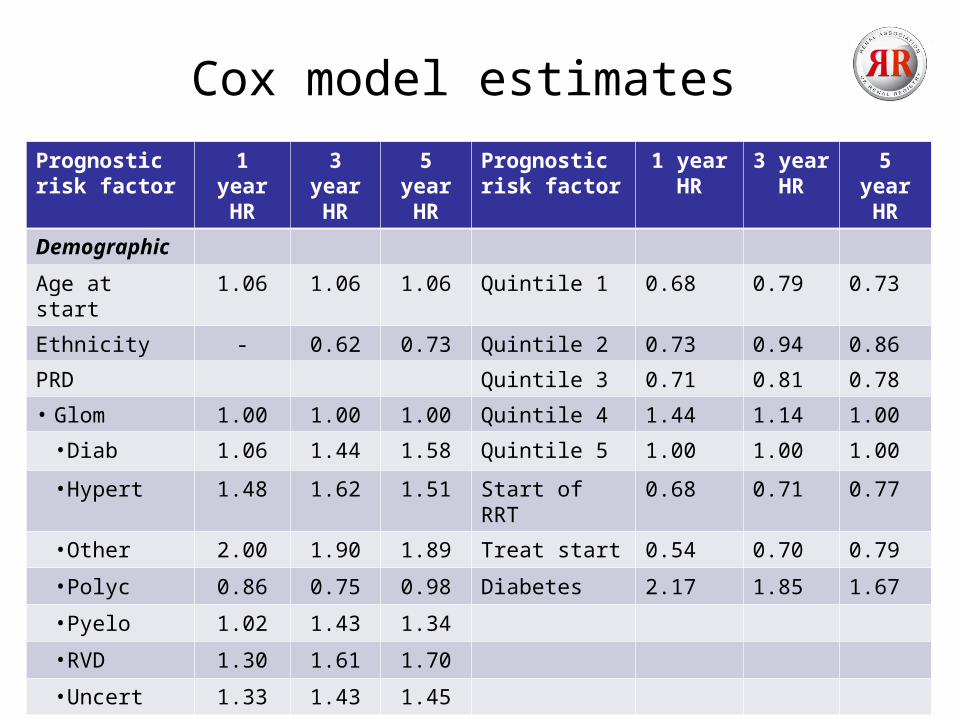
Cox model estimates
Prognostic risk factor
1 year HR
3 year HR
5 year HR
Prognostic risk factor
1 year HR
3 year HR
5 year HR
Demographic
Age at start 1.06 1.06 1.06 Quintile 1 0.68 0.79 0.73
Ethnicity - 0.62 0.73 Quintile 2 0.73 0.94 0.86
PRD Quintile 3 0.71 0.81 0.78
• Glom 1.00 1.00 1.00 Quintile 4 1.44 1.14 1.00
•Diab 1.06 1.44 1.58 Quintile 5 1.00 1.00 1.00
•Hypert 1.48 1.62 1.51 Start of RRT 0.68 0.71 0.77
•Other 2.00 1.90 1.89 Treat start 0.54 0.70 0.79
•Polyc 0.86 0.75 0.98 Diabetes 2.17 1.85 1.67
•Pyelo 1.02 1.43 1.34
•RVD 1.30 1.61 1.70
•Uncert 1.33 1.43 1.45
Unadjusted 1 year after 90 days survivalof incident RRT patients, 1997-2007
0.70
0.75
0.80
0.85
0.90
0.95
1.00
0 30 60 90 120 150 180 210 240 270 300 330 360
Days
Surv
ival
pro
babi
lity
Returned
Missing
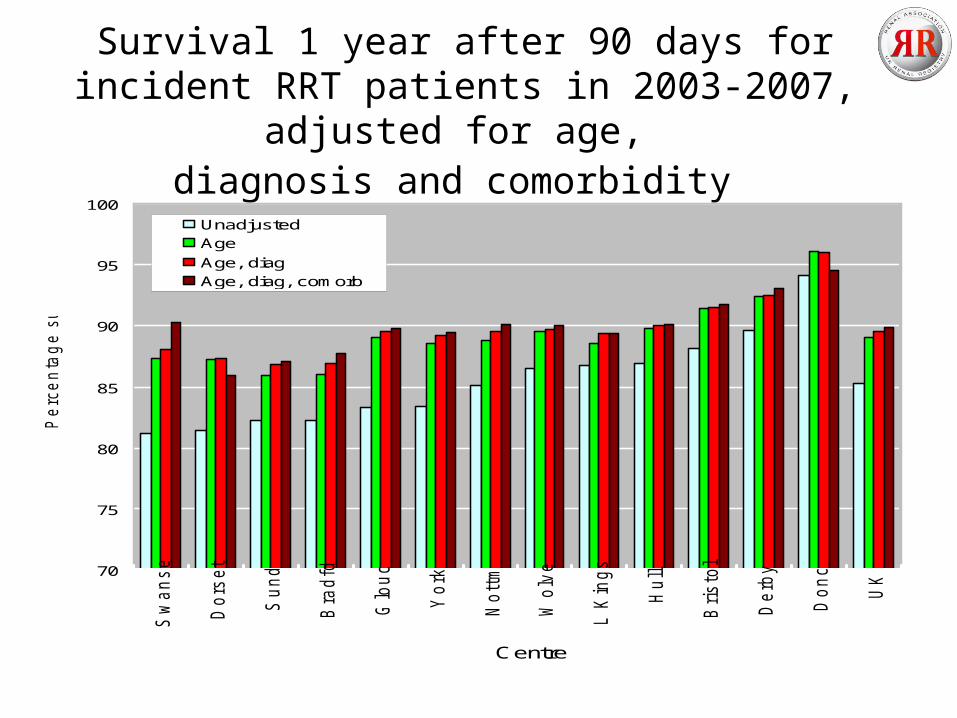
Survival 1 year after 90 days for incident RRT patients in 2003-2007, adjusted for age,
diagnosis and comorbidity
70
75
80
85
90
95
100
Sw
anse
Dors
et
Sund
Bra
dfd
Glo
uc
York
Nott
m
Wolv
e
L K
ings
Hull
Bristo
l
Derb
y
Donc
UK
Centre
Pe
rce
nta
ge
su
rviv
al
UnadjustedAge
Age, diagAge, diag, comorb
38
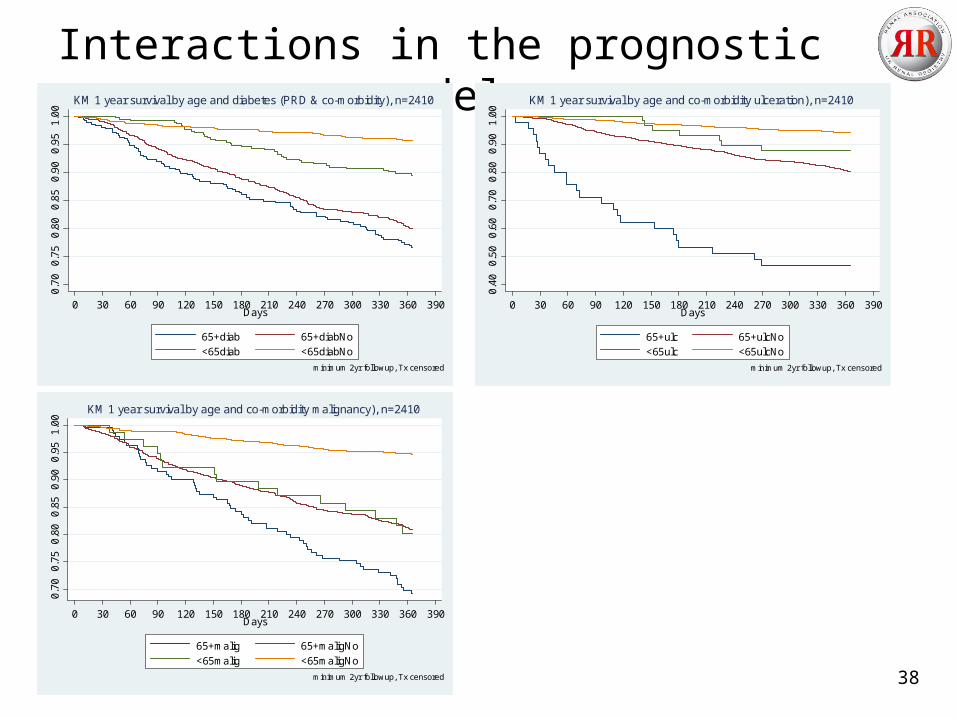
Interactions in the prognostic model0.
700.
750.
800.
850.
900.
951.
00
0 30 60 90 120 150 180 210 240 270 300 330 360 390Days
65+diab 65+diabNo
<65diab <65diabNo
minimum 2yr followup, Tx censored
KM 1 year survival by age and diabetes (PRD & co-morbidity), n=2410
0.40
0.50
0.60
0.70
0.80
0.90
1.00
0 30 60 90 120 150 180 210 240 270 300 330 360 390Days
65+ulc 65+ulcNo
<65ulc <65ulcNo
minimum 2yr followup, Tx censored
KM 1 year survival by age and co-morbidity ulceration), n=2410
0.70
0.75
0.80
0.85
0.90
0.95
1.00
0 30 60 90 120 150 180 210 240 270 300 330 360 390Days
65+malig 65+maligNo
<65malig <65maligNo
minimum 2yr followup, Tx censored
KM 1 year survival by age and co-morbidity malignancy), n=2410
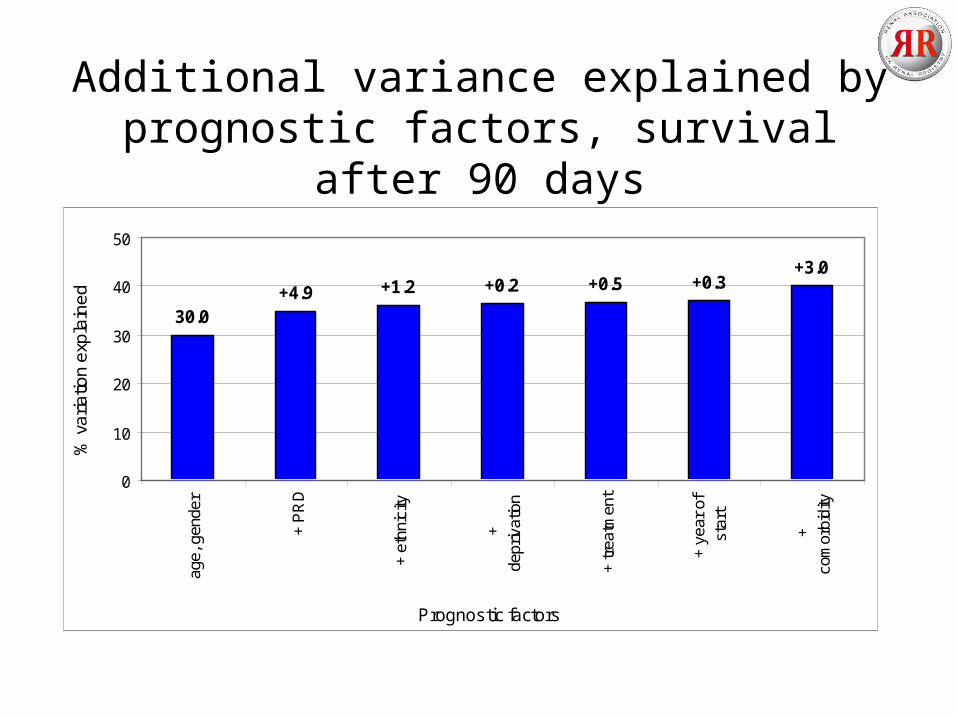
Additional variance explained by prognostic factors, survival after 90 days
+3.0+0.3+0.5+0.2+1.2+4.9
30.0
0
10
20
30
40
50
age,
gen
der
+ P
RD
+ e
thni
city
+de
priv
atio
n
+ tr
eatm
ent
+ ye
ar o
fst
art
+co
mor
bidi
ty
Prognostic factors
% v
ari
atio
n e
xpla
ine
d
Recording of comorbidities
• Comorbidities are captured at start of renal replacement therapy (RRT)
• Manual data entry into the renal IT system
• Process of data entry varies by renal centre:– Directly entered by senior medical staff (consultant)– Entered from updated form by data management staff
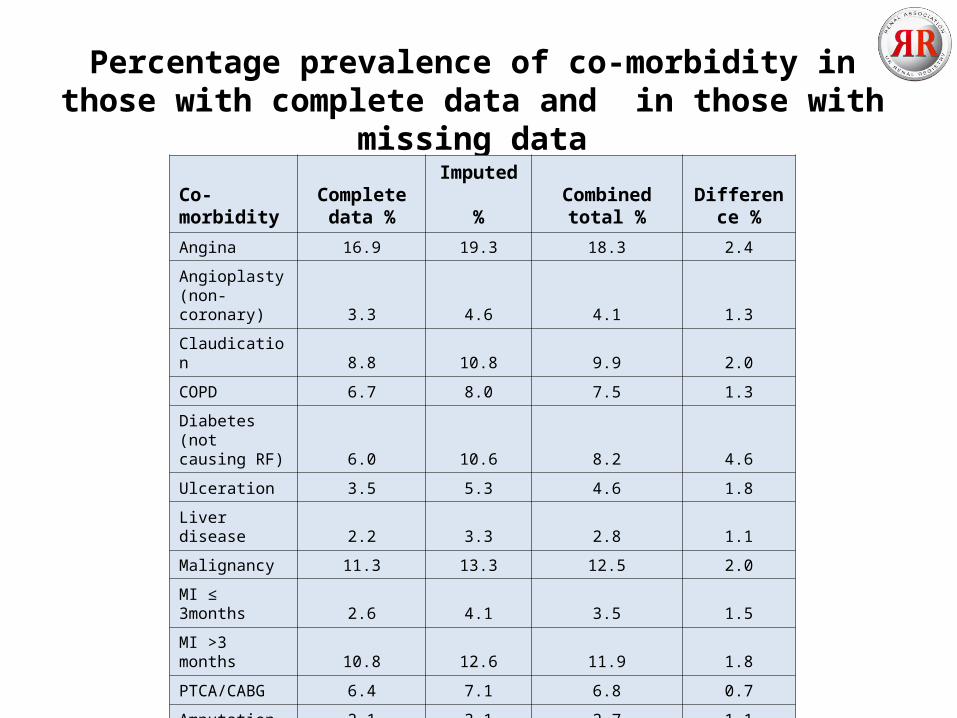
Percentage prevalence of co-morbidity in those with complete data and in those with missing data
Co-morbidity
Complete data %
Imputed %
Combined total %
Difference %
Angina 16.9 19.3 18.3 2.4
Angioplasty (non-coronary) 3.3 4.6 4.1 1.3
Claudication 8.8 10.8 9.9 2.0
COPD 6.7 8.0 7.5 1.3
Diabetes (not causing RF) 6.0 10.6 8.2 4.6
Ulceration 3.5 5.3 4.6 1.8
Liver disease 2.2 3.3 2.8 1.1
Malignancy 11.3 13.3 12.5 2.0
MI ≤ 3months 2.6 4.1 3.5 1.5
MI >3 months 10.8 12.6 11.9 1.8
PTCA/CABG 6.4 7.1 6.8 0.7
Amputation 2.1 3.1 2.7 1.1
Cerebro-vascular 10.5 12.1 11.4 1.6
Smoker 16.4 17.6 17.2 1.2
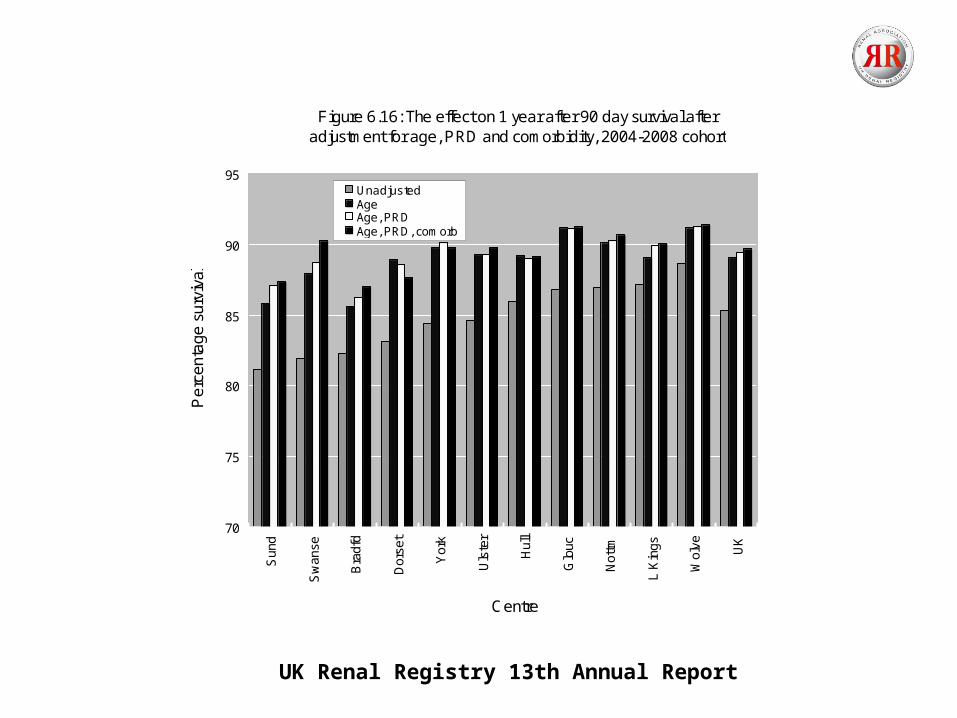
UK Renal Registry 13th Annual Report
Figure 6.16: The effect on 1 year after 90 day survival after adjustment for age, PRD and comorbidity, 2004-2008 cohort
70
75
80
85
90
95
Sun
d
Sw
anse
Bra
dfd
Dor
set
Yor
k
Uls
ter
Hul
l
Glo
uc
Not
tm
L K
ings
Wol
ve UK
Centre
Pe
rce
nta
ge
su
rviv
al
UnadjustedAgeAge, PRDAge, PRD, comorb