Embed Size (px)
Citation preview

Surveyor App Instructions – Updated July 28th, 2015
Surveyor App for FARO SCENE
Contents Installation ................................................................................................................................................ 2
Before Running the App ............................................................................................................................ 2
Activating the App ..................................................................................................................................... 5
Creating a Surface for Analysis ................................................................................................................. 6
Creating a Cut/Fill Map ............................................................................................................................. 7
Settings .................................................................................................................................................. 7
Create Topographic Contours ................................................................................................................... 7
Settings .................................................................................................................................................. 7
Create a TIN surface .................................................................................................................................. 8
Field to Finish ............................................................................................................................................ 8
Points on an Interval ................................................................................................................................. 9
Settings ................................................................................................................................................ 10
Using the drawing tools .......................................................................................................................... 10
Starting Fresh .......................................................................................................................................... 12
Using the Layers ...................................................................................................................................... 12
Exporting ................................................................................................................................................. 12
Updating .................................................................................................................................................. 13
Frequently Asked Questions ................................................................................................................... 13
Surveyor App Instructions – Updated July 28th, 2015
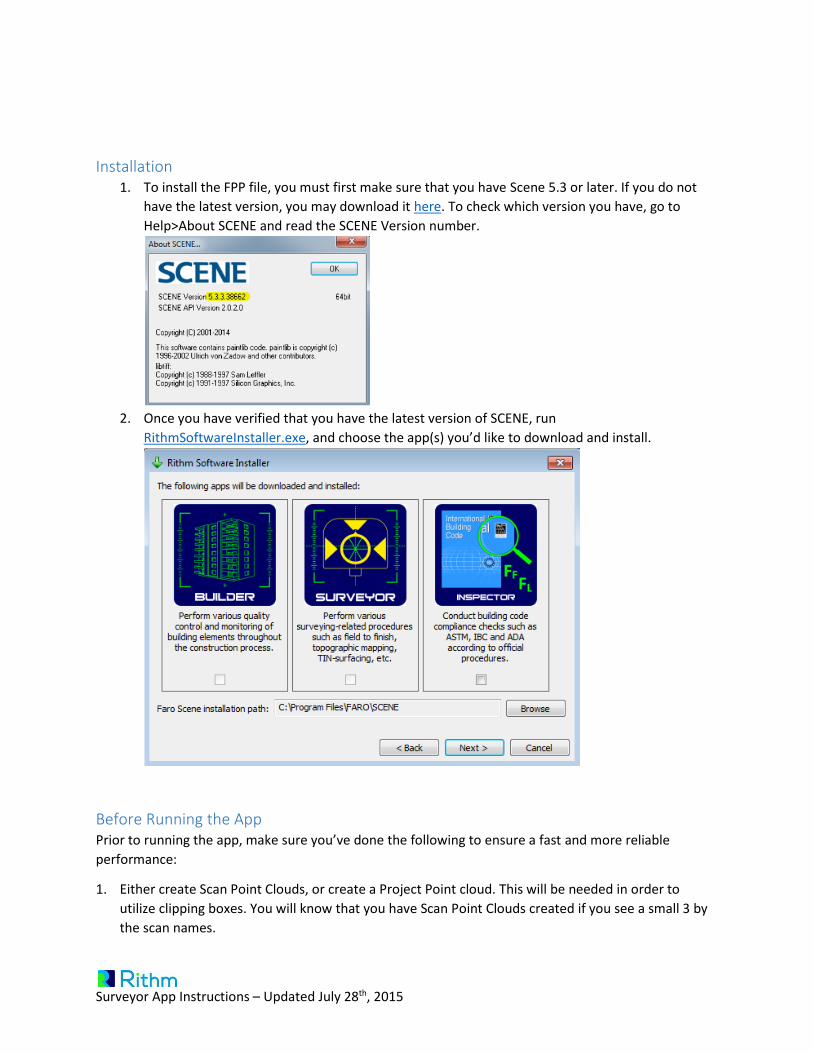
Installation 1. To install the FPP file, you must first make sure that you have Scene 5.3 or later. If you do not
have the latest version, you may download it here. To check which version you have, go to
Help>About SCENE and read the SCENE Version number.
2. Once you have verified that you have the latest version of SCENE, run
RithmSoftwareInstaller.exe, and choose the app(s) you’d like to download and install.
Before Running the App Prior to running the app, make sure you’ve done the following to ensure a fast and more reliable
performance:
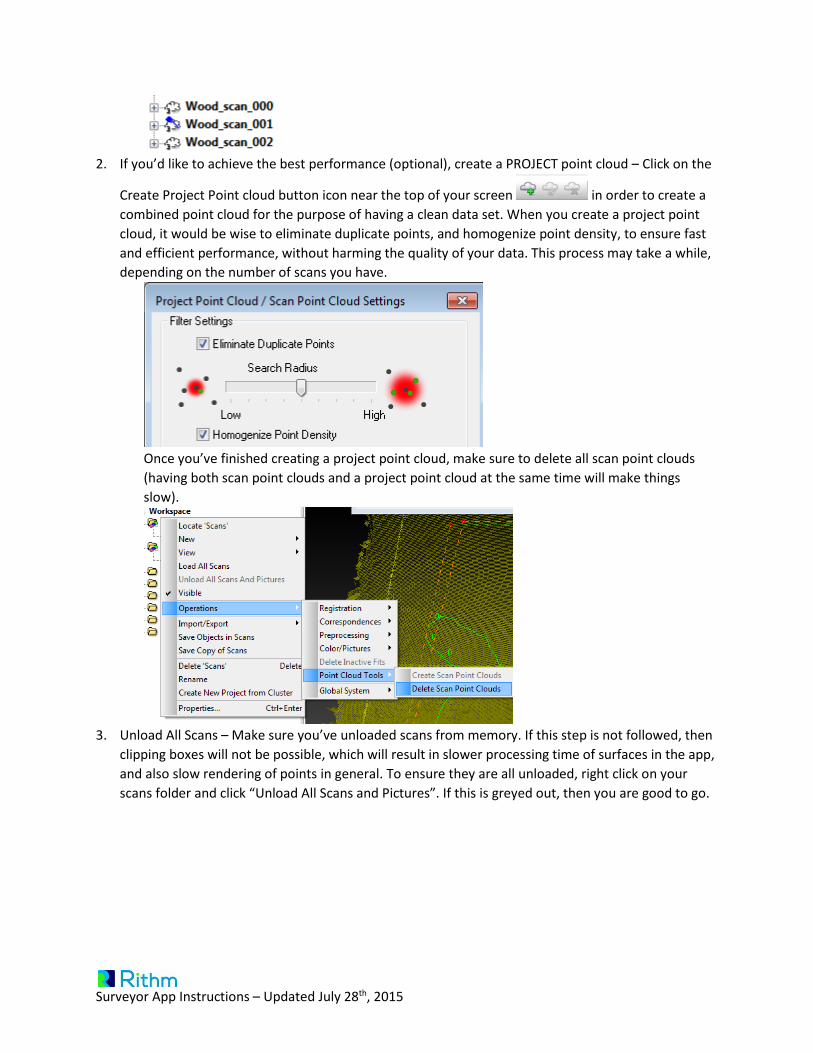
1. Either create Scan Point Clouds, or create a Project Point cloud. This will be needed in order to
utilize clipping boxes. You will know that you have Scan Point Clouds created if you see a small 3 by
the scan names.
Surveyor App Instructions – Updated July 28th, 2015
2. If you’d like to achieve the best performance (optional), create a PROJECT point cloud – Click on the
Create Project Point cloud button icon near the top of your screen in order to create a
combined point cloud for the purpose of having a clean data set. When you create a project point
cloud, it would be wise to eliminate duplicate points, and homogenize point density, to ensure fast
and efficient performance, without harming the quality of your data. This process may take a while,
depending on the number of scans you have.
Once you’ve finished creating a project point cloud, make sure to delete all scan point clouds
(having both scan point clouds and a project point cloud at the same time will make things
slow).
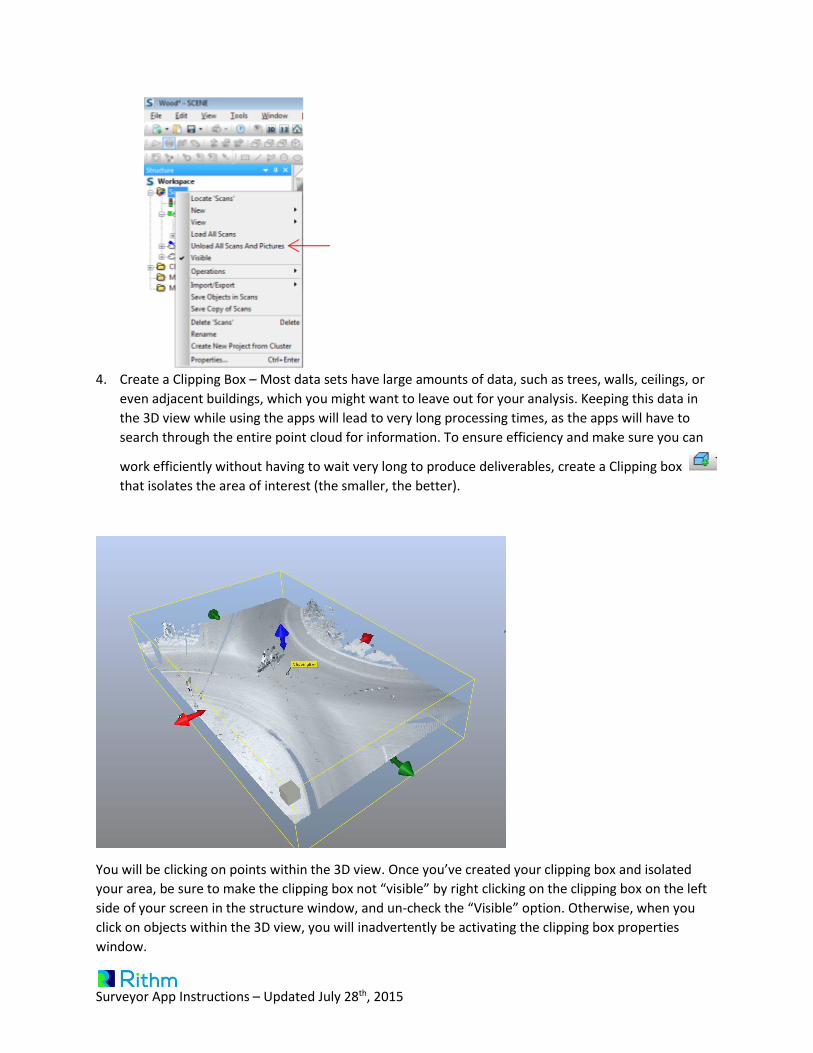
3. Unload All Scans – Make sure you’ve unloaded scans from memory. If this step is not followed, then
clipping boxes will not be possible, which will result in slower processing time of surfaces in the app,
and also slow rendering of points in general. To ensure they are all unloaded, right click on your
scans folder and click “Unload All Scans and Pictures”. If this is greyed out, then you are good to go.
Surveyor App Instructions – Updated July 28th, 2015
4. Create a Clipping Box – Most data sets have large amounts of data, such as trees, walls, ceilings, or
even adjacent buildings, which you might want to leave out for your analysis. Keeping this data in
the 3D view while using the apps will lead to very long processing times, as the apps will have to
search through the entire point cloud for information. To ensure efficiency and make sure you can
work efficiently without having to wait very long to produce deliverables, create a Clipping box
that isolates the area of interest (the smaller, the better).
You will be clicking on points within the 3D view. Once you’ve created your clipping box and isolated
your area, be sure to make the clipping box not “visible” by right clicking on the clipping box on the left
side of your screen in the structure window, and un-check the “Visible” option. Otherwise, when you
click on objects within the 3D view, you will inadvertently be activating the clipping box properties
window.
Surveyor App Instructions – Updated July 28th, 2015
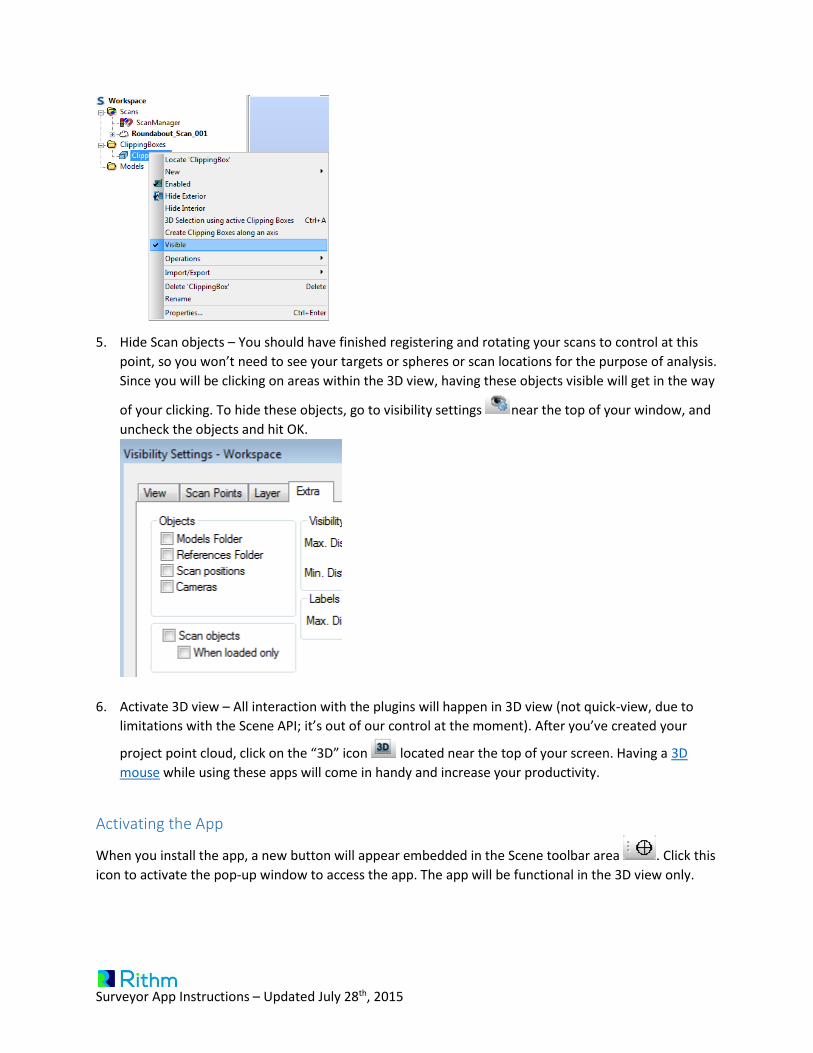
5. Hide Scan objects – You should have finished registering and rotating your scans to control at this
point, so you won’t need to see your targets or spheres or scan locations for the purpose of analysis.
Since you will be clicking on areas within the 3D view, having these objects visible will get in the way
of your clicking. To hide these objects, go to visibility settings near the top of your window, and
uncheck the objects and hit OK.
6. Activate 3D view – All interaction with the plugins will happen in 3D view (not quick-view, due to
limitations with the Scene API; it’s out of our control at the moment). After you’ve created your
project point cloud, click on the “3D” icon located near the top of your screen. Having a 3D
mouse while using these apps will come in handy and increase your productivity.
Activating the App
When you install the app, a new button will appear embedded in the Scene toolbar area . Click this
icon to activate the pop-up window to access the app. The app will be functional in the 3D view only.
Surveyor App Instructions – Updated July 28th, 2015
You will see a lock icon the first time this app runs, and will be required to activate the plugin prior
to using any features. Click on the icon, and enter your license in the screen. If you do not have a license
and you need to obtain one, you may either request a 7 day trial license, or purchase a license.
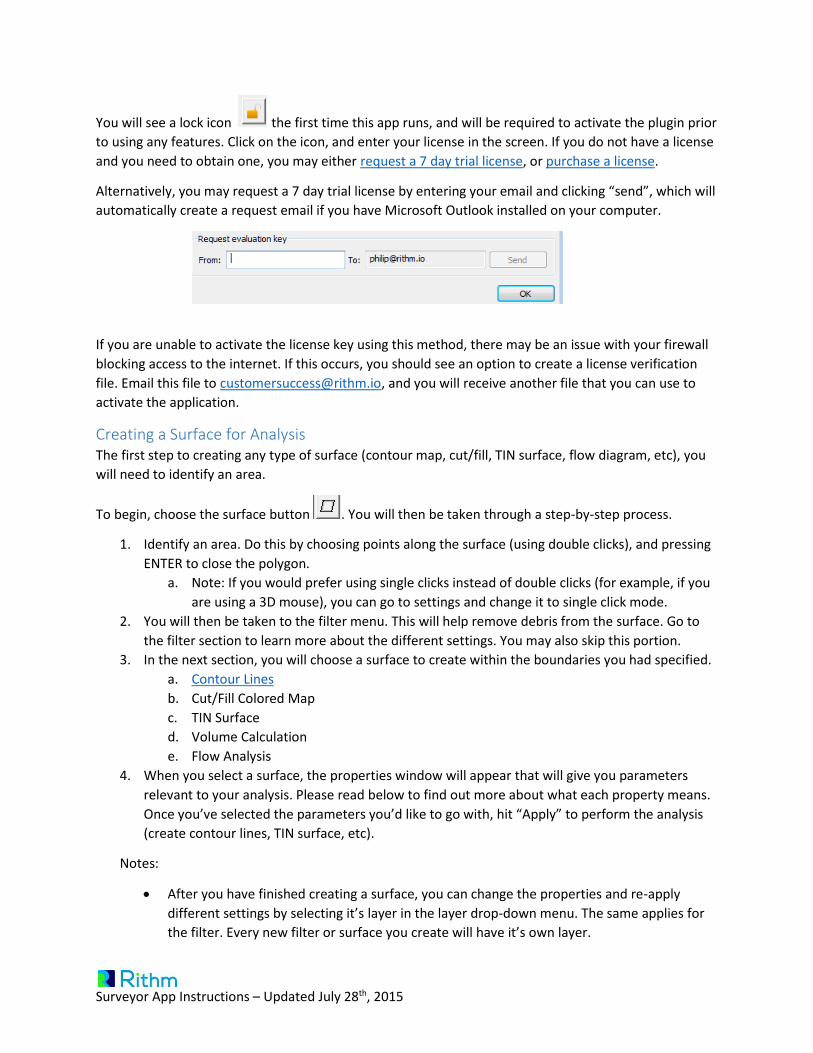
Alternatively, you may request a 7 day trial license by entering your email and clicking “send”, which will
automatically create a request email if you have Microsoft Outlook installed on your computer.
If you are unable to activate the license key using this method, there may be an issue with your firewall
blocking access to the internet. If this occurs, you should see an option to create a license verification
file. Email this file to [email protected], and you will receive another file that you can use to
activate the application.
Creating a Surface for Analysis The first step to creating any type of surface (contour map, cut/fill, TIN surface, flow diagram, etc), you
will need to identify an area.
To begin, choose the surface button . You will then be taken through a step-by-step process.
1. Identify an area. Do this by choosing points along the surface (using double clicks), and pressing
ENTER to close the polygon.
a. Note: If you would prefer using single clicks instead of double clicks (for example, if you
are using a 3D mouse), you can go to settings and change it to single click mode.
2. You will then be taken to the filter menu. This will help remove debris from the surface. Go to
the filter section to learn more about the different settings. You may also skip this portion.
3. In the next section, you will choose a surface to create within the boundaries you had specified.
a. Contour Lines
b. Cut/Fill Colored Map
c. TIN Surface
d. Volume Calculation
e. Flow Analysis
4. When you select a surface, the properties window will appear that will give you parameters
relevant to your analysis. Please read below to find out more about what each property means.
Once you’ve selected the parameters you’d like to go with, hit “Apply” to perform the analysis
(create contour lines, TIN surface, etc).
Notes:
After you have finished creating a surface, you can change the properties and re-apply
different settings by selecting it’s layer in the layer drop-down menu. The same applies for
the filter. Every new filter or surface you create will have it’s own layer.
Surveyor App Instructions – Updated July 28th, 2015
5. If you close scene or the 3D view and re-open it, surfaces will not be re-drawn. This is to
conserve disk space and prevent long processing times/crashing. However, the boundaries of
the surfaces, as well as the properties and layer, are automatically preserved. To bring the
surface back into view (so you can, for example, export it out to DXF or LandXML), select the
surface from the layer menu to open it’s properties, then hit “apply” to recreate the surface
(contour lines, cut/fill map, TIN surface, etc.)
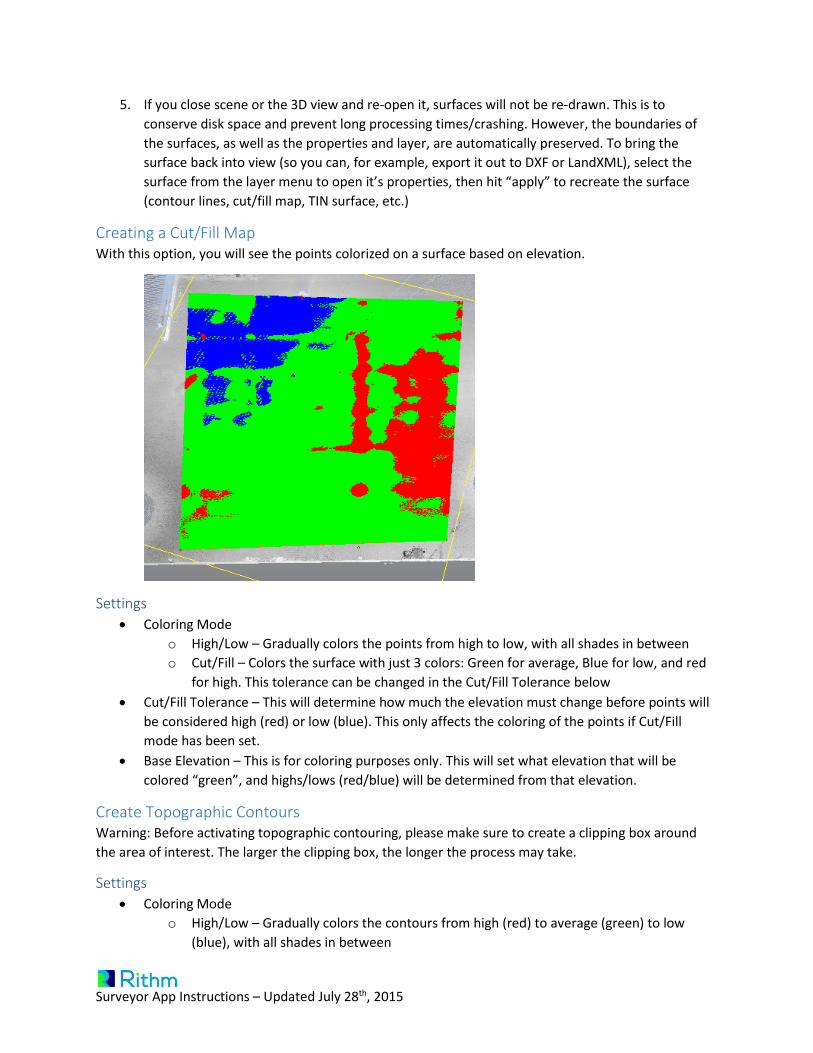
Creating a Cut/Fill Map With this option, you will see the points colorized on a surface based on elevation.
Settings
Coloring Mode
o High/Low – Gradually colors the points from high to low, with all shades in between
o Cut/Fill – Colors the surface with just 3 colors: Green for average, Blue for low, and red
for high. This tolerance can be changed in the Cut/Fill Tolerance below
Cut/Fill Tolerance – This will determine how much the elevation must change before points will
be considered high (red) or low (blue). This only affects the coloring of the points if Cut/Fill
mode has been set.
Base Elevation – This is for coloring purposes only. This will set what elevation that will be
colored “green”, and highs/lows (red/blue) will be determined from that elevation.
Create Topographic Contours Warning: Before activating topographic contouring, please make sure to create a clipping box around
the area of interest. The larger the clipping box, the longer the process may take.
Settings
Coloring Mode
o High/Low – Gradually colors the contours from high (red) to average (green) to low
(blue), with all shades in between
Surveyor App Instructions – Updated July 28th, 2015
o Cut/Fill – Colors the surface with just 3 colors: Green for average, Blue for low, and red
for high. This tolerance can be changed in the Cut/Fill Tolerance below
Cut/Fill Tolerance – This will determine how much the elevation must change before points will
be considered high (red) or low (blue). This only affects the coloring of the points if Cut/Fill
mode has been set.
Point Spacing – This will determine how defined the contours look. For more gradual/rounded
contours, go with a larger point spacing. For contours with sharper turns that much more finely
follows the ground, those a smaller point spacing. Smaller point spacing will use more points
and take significantly longer to process and may not be necessary.
Base Elevation – This is for coloring purposes only. This will set what elevation that will be
colored “green”, and highs/lows (red/blue) will be determined from that elevation.
After you change the settings, hit “Apply”
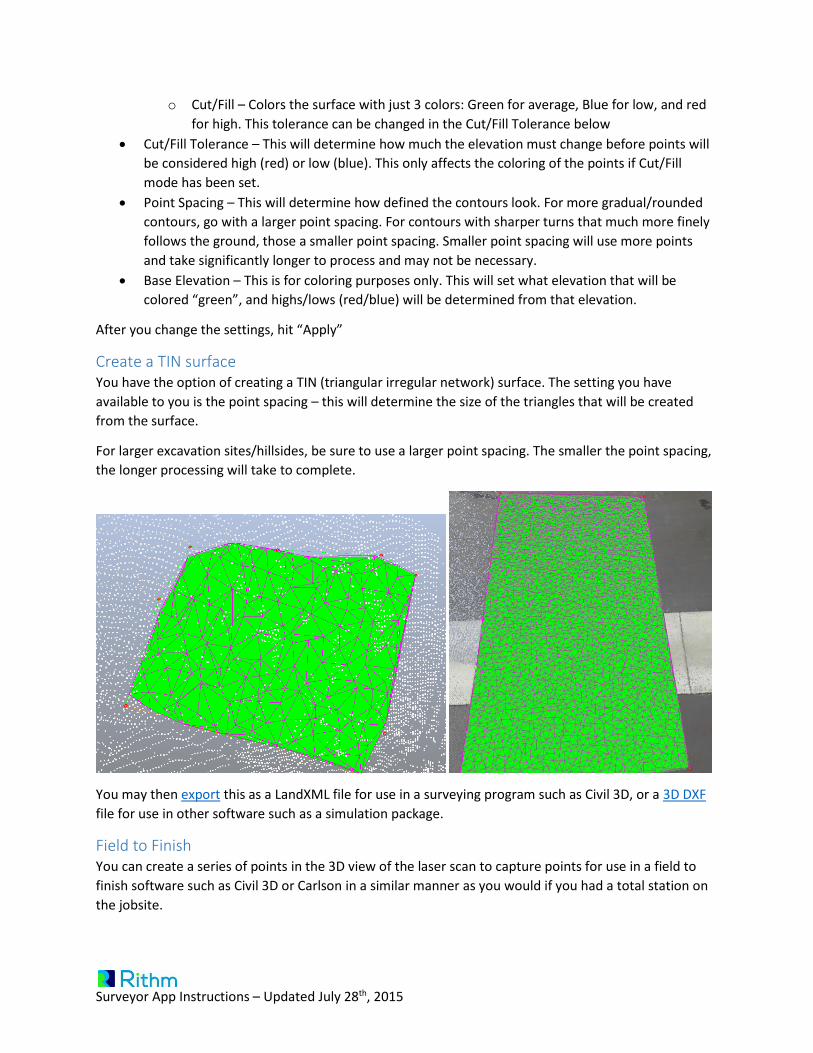
Create a TIN surface You have the option of creating a TIN (triangular irregular network) surface. The setting you have
available to you is the point spacing – this will determine the size of the triangles that will be created
from the surface.
For larger excavation sites/hillsides, be sure to use a larger point spacing. The smaller the point spacing,
the longer processing will take to complete.
You may then export this as a LandXML file for use in a surveying program such as Civil 3D, or a 3D DXF
file for use in other software such as a simulation package.
Field to Finish You can create a series of points in the 3D view of the laser scan to capture points for use in a field to
finish software such as Civil 3D or Carlson in a similar manner as you would if you had a total station on
the jobsite.
Surveyor App Instructions – Updated July 28th, 2015
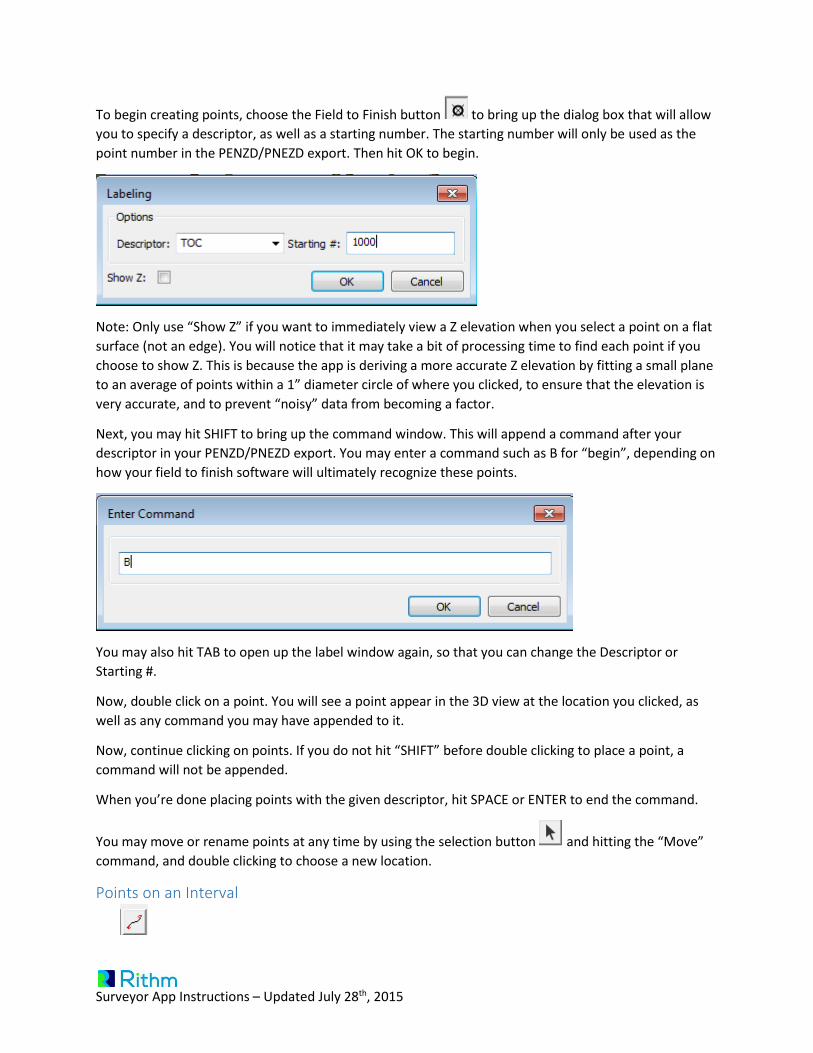
To begin creating points, choose the Field to Finish button to bring up the dialog box that will allow
you to specify a descriptor, as well as a starting number. The starting number will only be used as the
point number in the PENZD/PNEZD export. Then hit OK to begin.
Note: Only use “Show Z” if you want to immediately view a Z elevation when you select a point on a flat
surface (not an edge). You will notice that it may take a bit of processing time to find each point if you
choose to show Z. This is because the app is deriving a more accurate Z elevation by fitting a small plane
to an average of points within a 1” diameter circle of where you clicked, to ensure that the elevation is
very accurate, and to prevent “noisy” data from becoming a factor.
Next, you may hit SHIFT to bring up the command window. This will append a command after your
descriptor in your PENZD/PNEZD export. You may enter a command such as B for “begin”, depending on
how your field to finish software will ultimately recognize these points.
You may also hit TAB to open up the label window again, so that you can change the Descriptor or
Starting #.
Now, double click on a point. You will see a point appear in the 3D view at the location you clicked, as
well as any command you may have appended to it.
Now, continue clicking on points. If you do not hit “SHIFT” before double clicking to place a point, a
command will not be appended.
When you’re done placing points with the given descriptor, hit SPACE or ENTER to end the command.
You may move or rename points at any time by using the selection button and hitting the “Move”
command, and double clicking to choose a new location.
Points on an Interval
Surveyor App Instructions – Updated July 28th, 2015
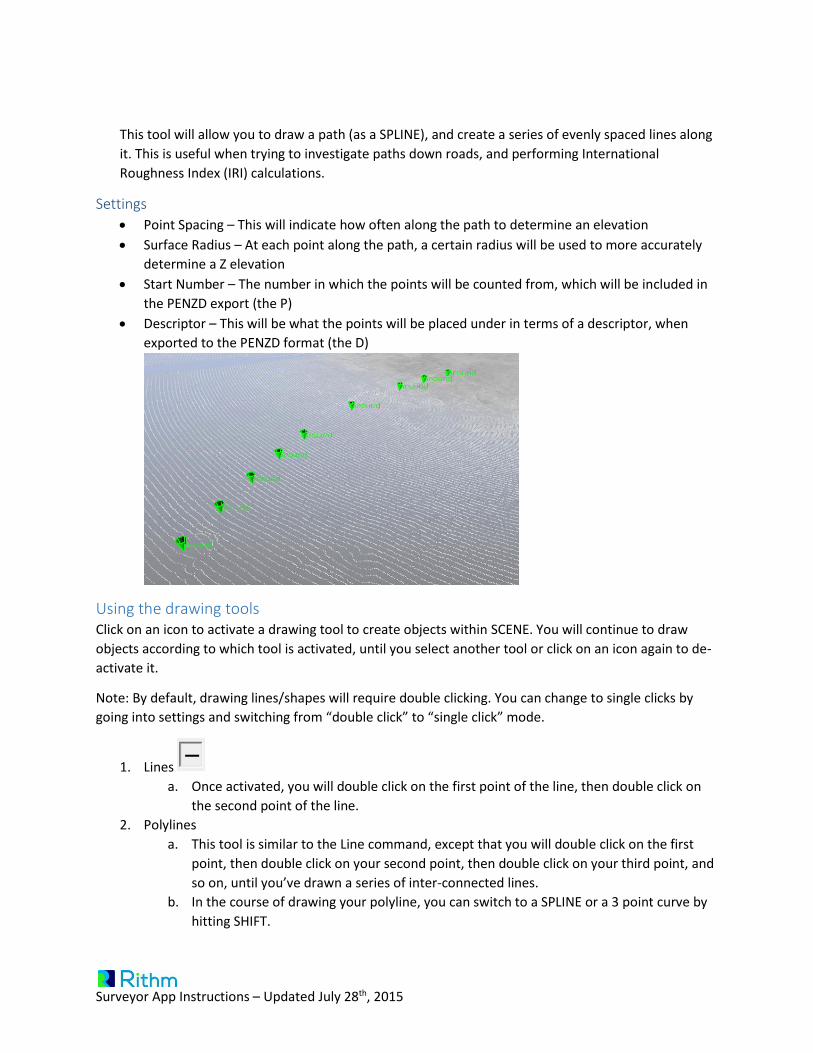
This tool will allow you to draw a path (as a SPLINE), and create a series of evenly spaced lines along
it. This is useful when trying to investigate paths down roads, and performing International
Roughness Index (IRI) calculations.
Settings
Point Spacing – This will indicate how often along the path to determine an elevation
Surface Radius – At each point along the path, a certain radius will be used to more accurately
determine a Z elevation
Start Number – The number in which the points will be counted from, which will be included in
the PENZD export (the P)
Descriptor – This will be what the points will be placed under in terms of a descriptor, when
exported to the PENZD format (the D)
Using the drawing tools Click on an icon to activate a drawing tool to create objects within SCENE. You will continue to draw
objects according to which tool is activated, until you select another tool or click on an icon again to de-
activate it.
Note: By default, drawing lines/shapes will require double clicking. You can change to single clicks by
going into settings and switching from “double click” to “single click” mode.
1. Lines
a. Once activated, you will double click on the first point of the line, then double click on
the second point of the line.
2. Polylines
a. This tool is similar to the Line command, except that you will double click on the first
point, then double click on your second point, then double click on your third point, and
so on, until you’ve drawn a series of inter-connected lines.
b. In the course of drawing your polyline, you can switch to a SPLINE or a 3 point curve by
hitting SHIFT.
Surveyor App Instructions – Updated July 28th, 2015
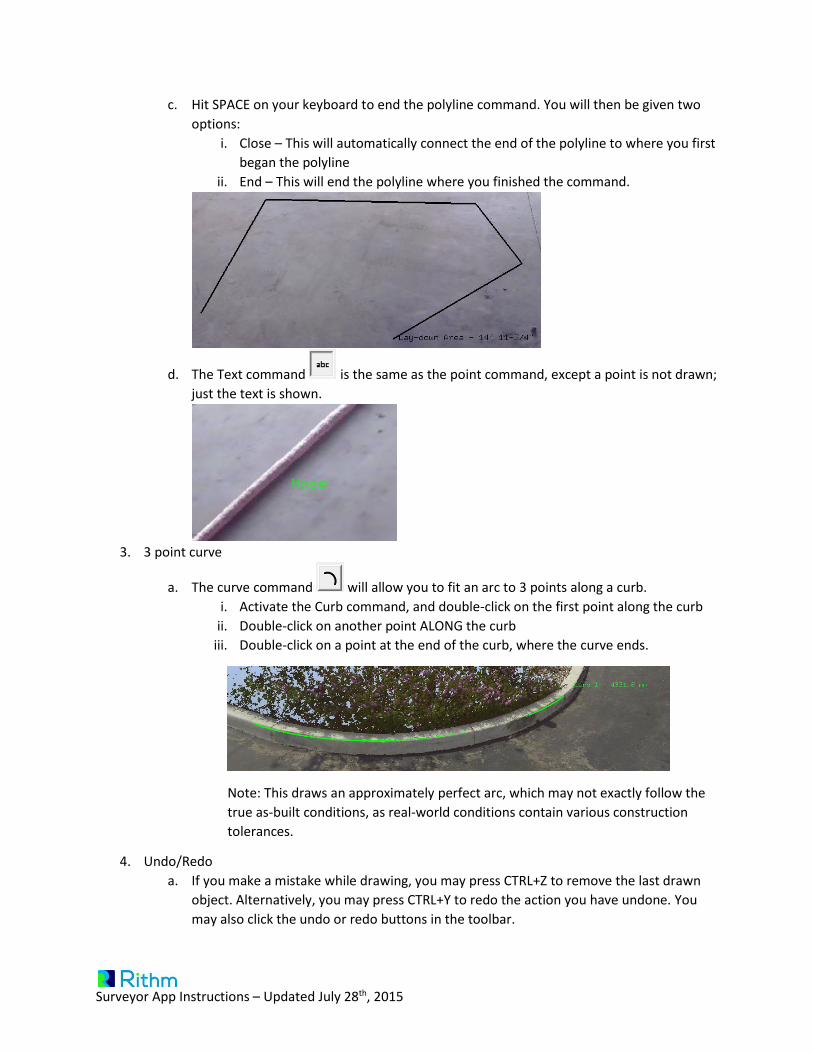
c. Hit SPACE on your keyboard to end the polyline command. You will then be given two
options:
i. Close – This will automatically connect the end of the polyline to where you first
began the polyline
ii. End – This will end the polyline where you finished the command.
d. The Text command is the same as the point command, except a point is not drawn;
just the text is shown.
3. 3 point curve
a. The curve command will allow you to fit an arc to 3 points along a curb.
i. Activate the Curb command, and double-click on the first point along the curb
ii. Double-click on another point ALONG the curb
iii. Double-click on a point at the end of the curb, where the curve ends.
Note: This draws an approximately perfect arc, which may not exactly follow the
true as-built conditions, as real-world conditions contain various construction
tolerances.
4. Undo/Redo
a. If you make a mistake while drawing, you may press CTRL+Z to remove the last drawn
object. Alternatively, you may press CTRL+Y to redo the action you have undone. You
may also click the undo or redo buttons in the toolbar.
Surveyor App Instructions – Updated July 28th, 2015
Starting Fresh
Use the cleanup button to remove all drawn objects, surfaces, and points created in the project
with the Surveyor App. This will also remove all layers.
Using the Layers Everything you draw using the Surveyor App will be associated with a layer. You can only change layers
when you are not currently executing a command.
1. Colors can be edited. This will change the colors of all objects within a
given layer.
2. The currently selected layer will be the “active Layer”. Everything drawn will be associated with
the Active Layer. You may switch to another layer by selecting the drop-down menu, and you
may add additional layers.
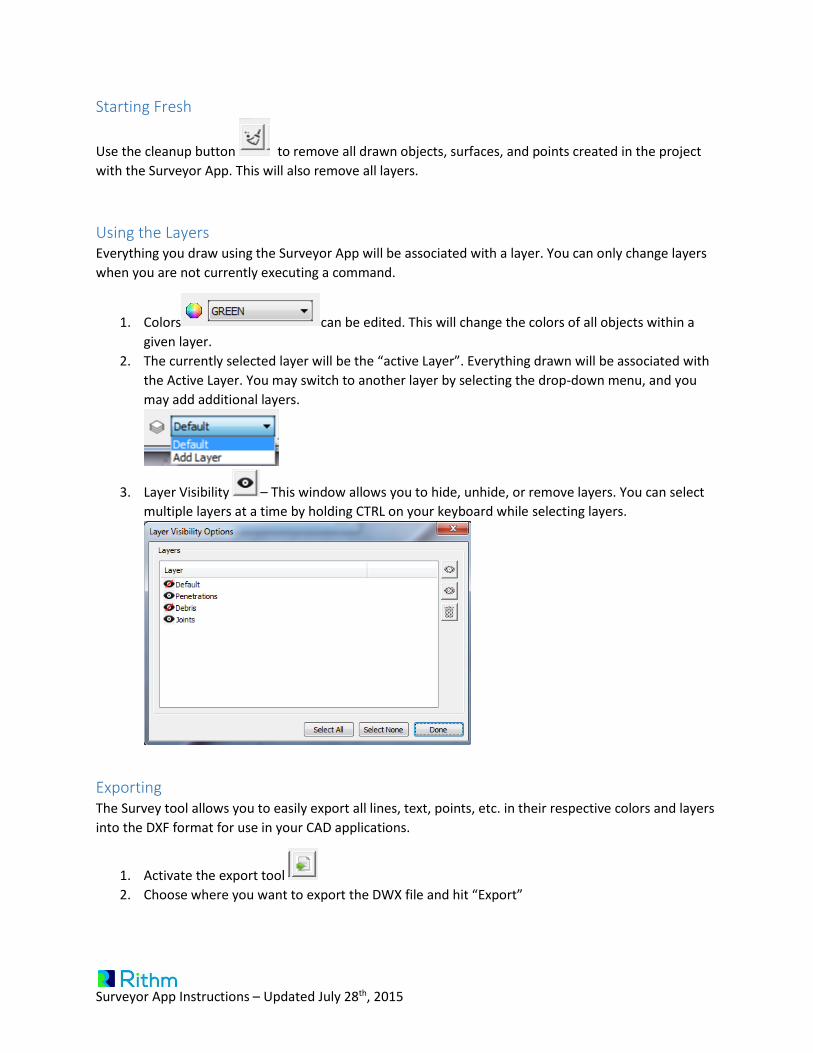
3. Layer Visibility – This window allows you to hide, unhide, or remove layers. You can select
multiple layers at a time by holding CTRL on your keyboard while selecting layers.
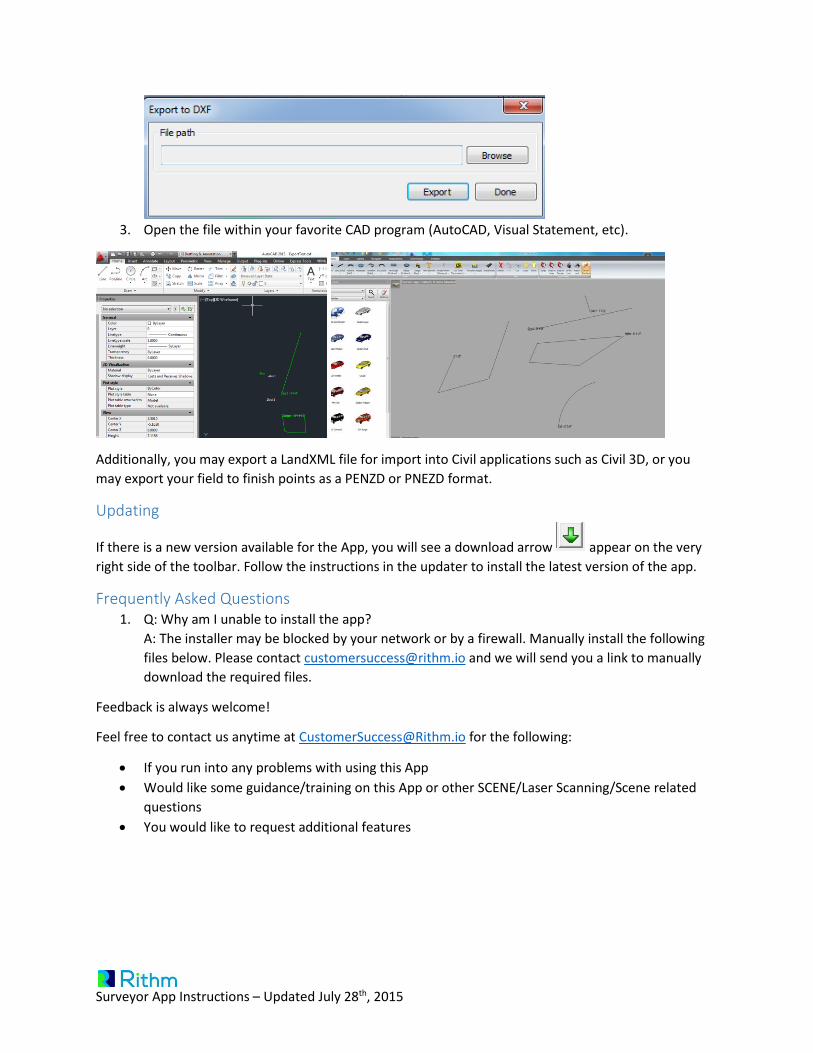
Exporting The Survey tool allows you to easily export all lines, text, points, etc. in their respective colors and layers
into the DXF format for use in your CAD applications.
1. Activate the export tool
2. Choose where you want to export the DWX file and hit “Export”
Surveyor App Instructions – Updated July 28th, 2015
3. Open the file within your favorite CAD program (AutoCAD, Visual Statement, etc).
Additionally, you may export a LandXML file for import into Civil applications such as Civil 3D, or you
may export your field to finish points as a PENZD or PNEZD format.
Updating
If there is a new version available for the App, you will see a download arrow appear on the very
right side of the toolbar. Follow the instructions in the updater to install the latest version of the app.
Frequently Asked Questions 1. Q: Why am I unable to install the app?
A: The installer may be blocked by your network or by a firewall. Manually install the following
files below. Please contact [email protected] and we will send you a link to manually
download the required files.
Feedback is always welcome!
Feel free to contact us anytime at [email protected] for the following:
If you run into any problems with using this App
Would like some guidance/training on this App or other SCENE/Laser Scanning/Scene related
questions
You would like to request additional features