Embed Size (px)
Citation preview

SURVEYING FORUM
2016 Annual Meeting
Agenda • Overview of NCEES website and member
board resources • Transition of the PS exam to CBT • Examinee volumes and pass rates • State updates on state-specific surveying
exams
Agenda • Survey Education Award • Forum on the future of surveying • Pokémon Go and Geospatial Professions • UAS use without proper FAA certification • Deregulation of survey licensing • Inefficiencies with surveying mobility

NCEES website and Member Resources section
http://www.ncees.org
PS transition to CBT • PS exam will be Linear-on-the-Fly-Testing (LOFT). • The exam will be available for year-round testing. • Examinees will have a unique form similar in difficulty
and assembled around the same minimal competence ability level.
• All examinees will be tested on the same topics.
PS transition to CBT • Each form will have 100 items.
– 85 will be scored and contribute to their result. – 15 will be pretest items (not contributing to their result, but
will be evaluated based on responses and may be in a future pool).
• An electronic version of the reference book will be provided on screen at the test center.
• Alternative item types (AITs) will be introduced with the PS exam.

PS transition to CBT • PS exam appointments begin on October 3, 2016.
Currently, – 121 examinees have scheduled with Pearson VUE to
take the exam in the October–December window. – 76 examinees are registered with NCEES and waiting on
their boards to approve them. – 38 examinees are approved but have not yet scheduled
their appointment with Pearson VUE.
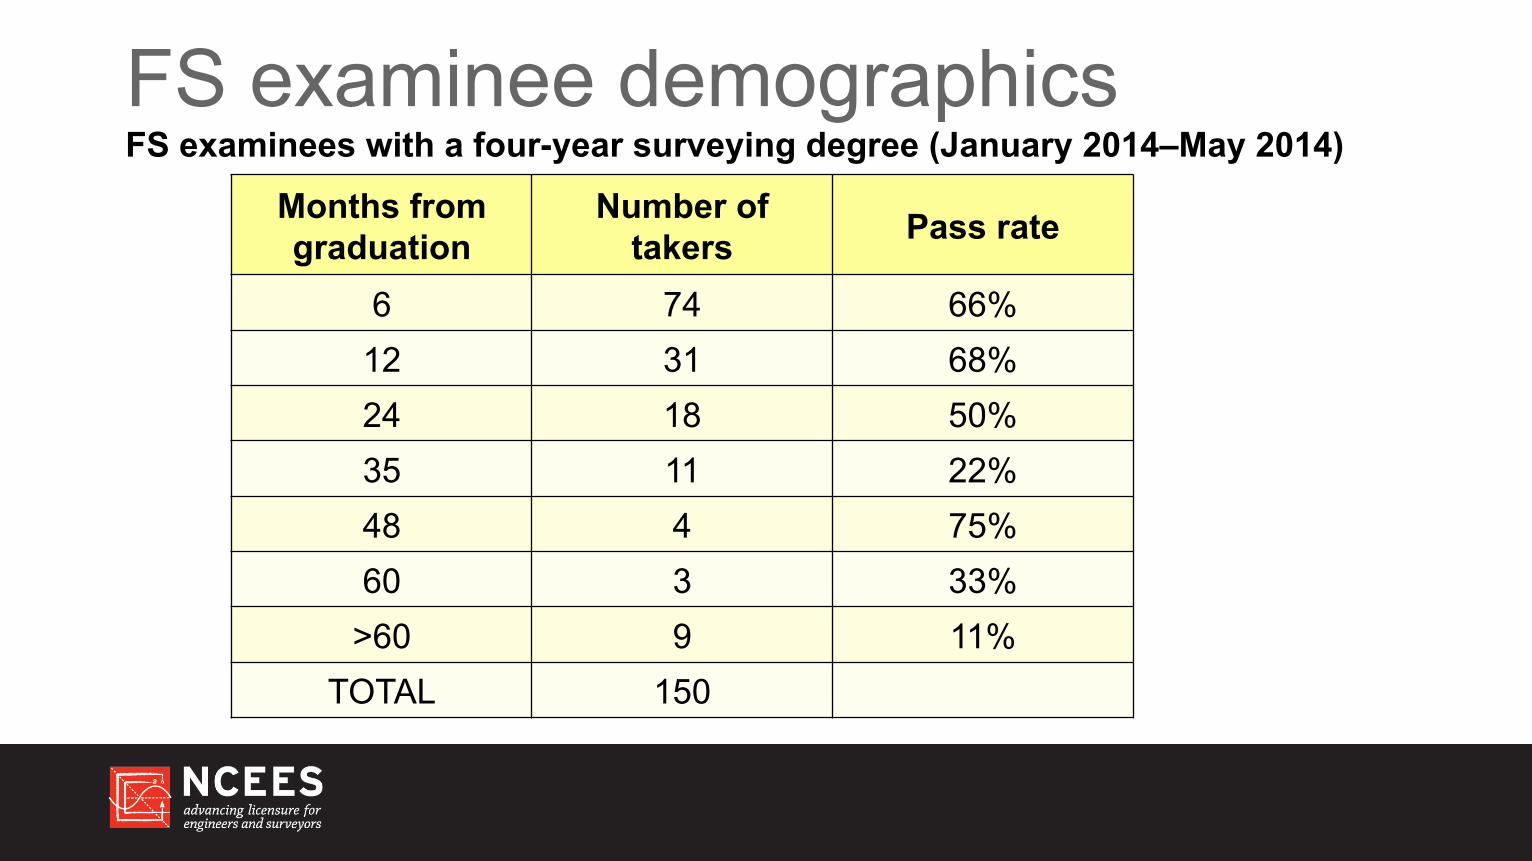
FS examinee demographics FS examinees with a four-year surveying degree (January 2014–May 2014)
Months from graduation
Number of takers Pass rate
6 74 66% 12 31 68% 24 18 50% 35 11 22% 48 4 75% 60 3 33%
>60 9 11% TOTAL 150
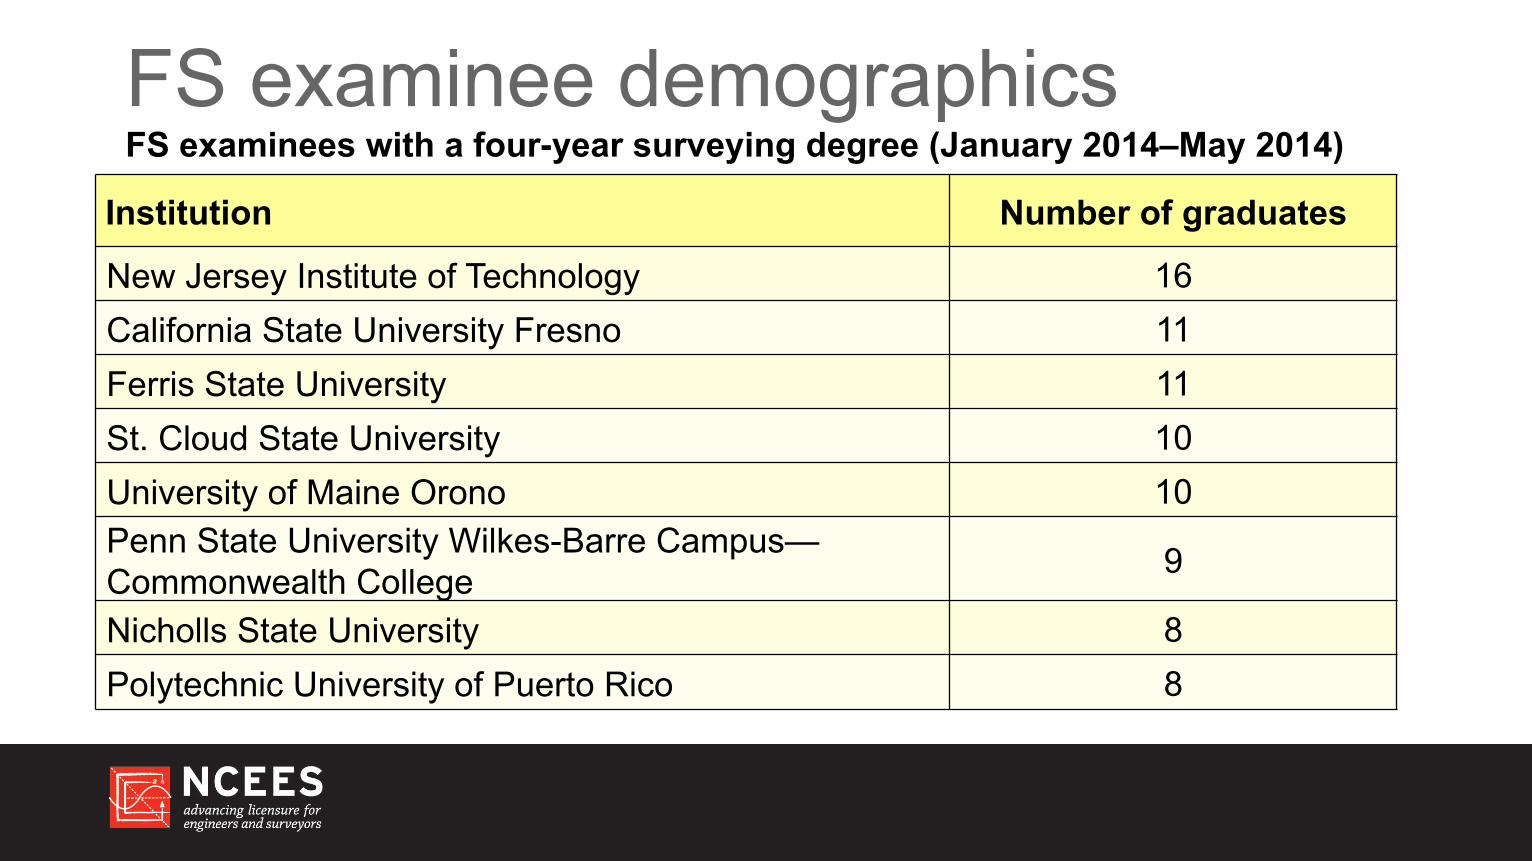
FS examinee demographics FS examinees with a four-year surveying degree (January 2014–May 2014)
Institution Number of graduates
New Jersey Institute of Technology 16 California State University Fresno 11 Ferris State University 11 St. Cloud State University 10 University of Maine Orono 10 Penn State University Wilkes-Barre Campus— Commonwealth College 9
Nicholls State University 8 Polytechnic University of Puerto Rico 8
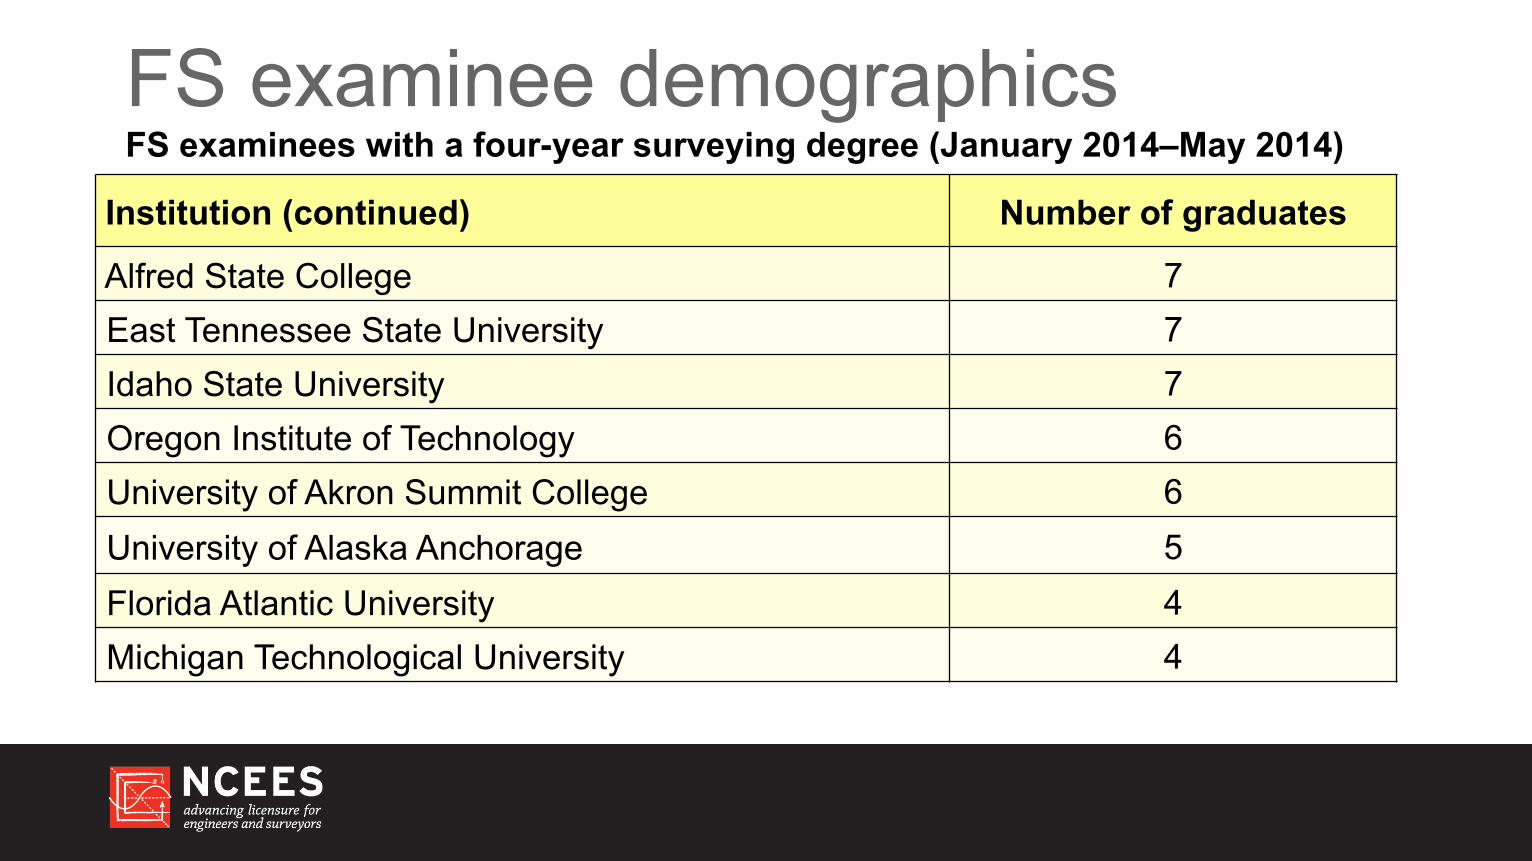
FS examinee demographics FS examinees with a four-year surveying degree (January 2014–May 2014)
Institution (continued) Number of graduates
Alfred State College 7 East Tennessee State University 7 Idaho State University 7 Oregon Institute of Technology 6 University of Akron Summit College 6 University of Alaska Anchorage 5 Florida Atlantic University 4 Michigan Technological University 4
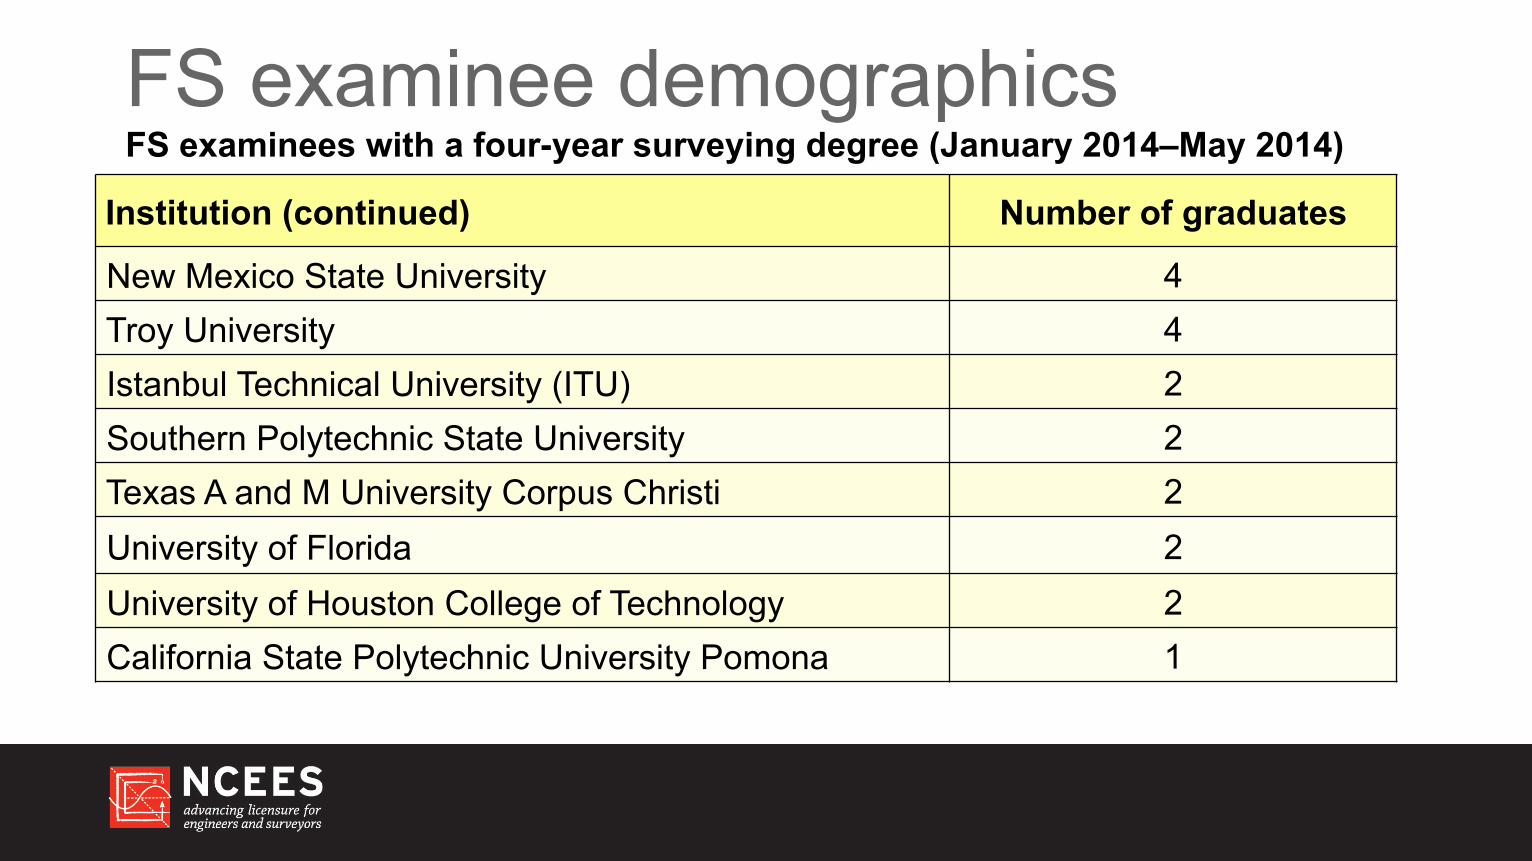
FS examinee demographics FS examinees with a four-year surveying degree (January 2014–May 2014)
Institution (continued) Number of graduates
New Mexico State University 4 Troy University 4 Istanbul Technical University (ITU) 2 Southern Polytechnic State University 2 Texas A and M University Corpus Christi 2 University of Florida 2 University of Houston College of Technology 2 California State Polytechnic University Pomona 1
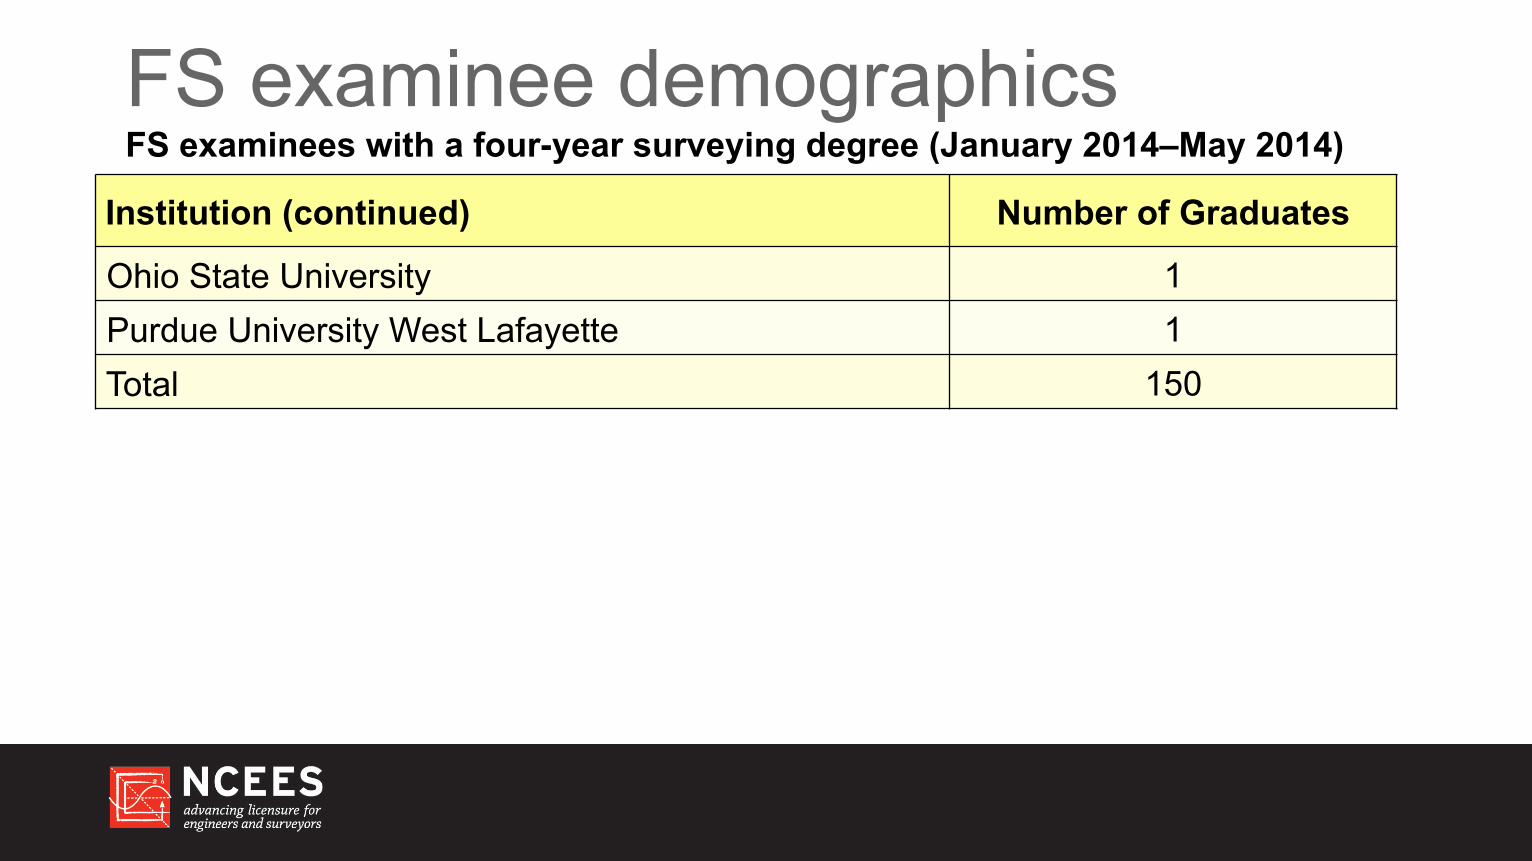
FS examinee demographics FS examinees with a four-year surveying degree (January 2014–May 2014)
Institution (continued) Number of Graduates
Ohio State University 1 Purdue University West Lafayette 1 Total 150
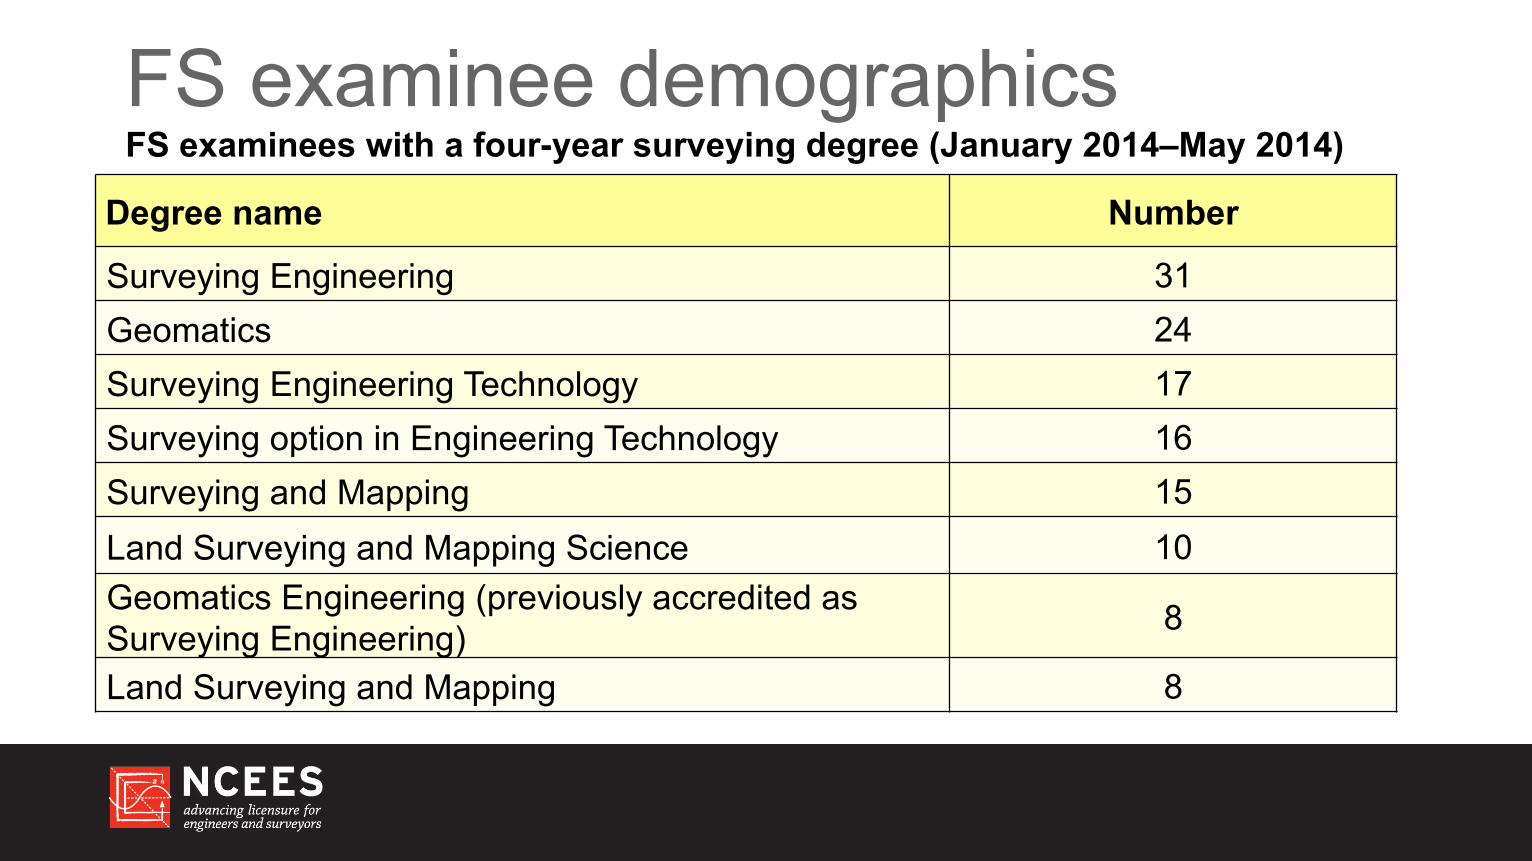
FS examinee demographics FS examinees with a four-year surveying degree (January 2014–May 2014)
Degree name Number
Surveying Engineering 31 Geomatics 24 Surveying Engineering Technology 17 Surveying option in Engineering Technology 16 Surveying and Mapping 15 Land Surveying and Mapping Science 10 Geomatics Engineering (previously accredited as Surveying Engineering) 8
Land Surveying and Mapping 8
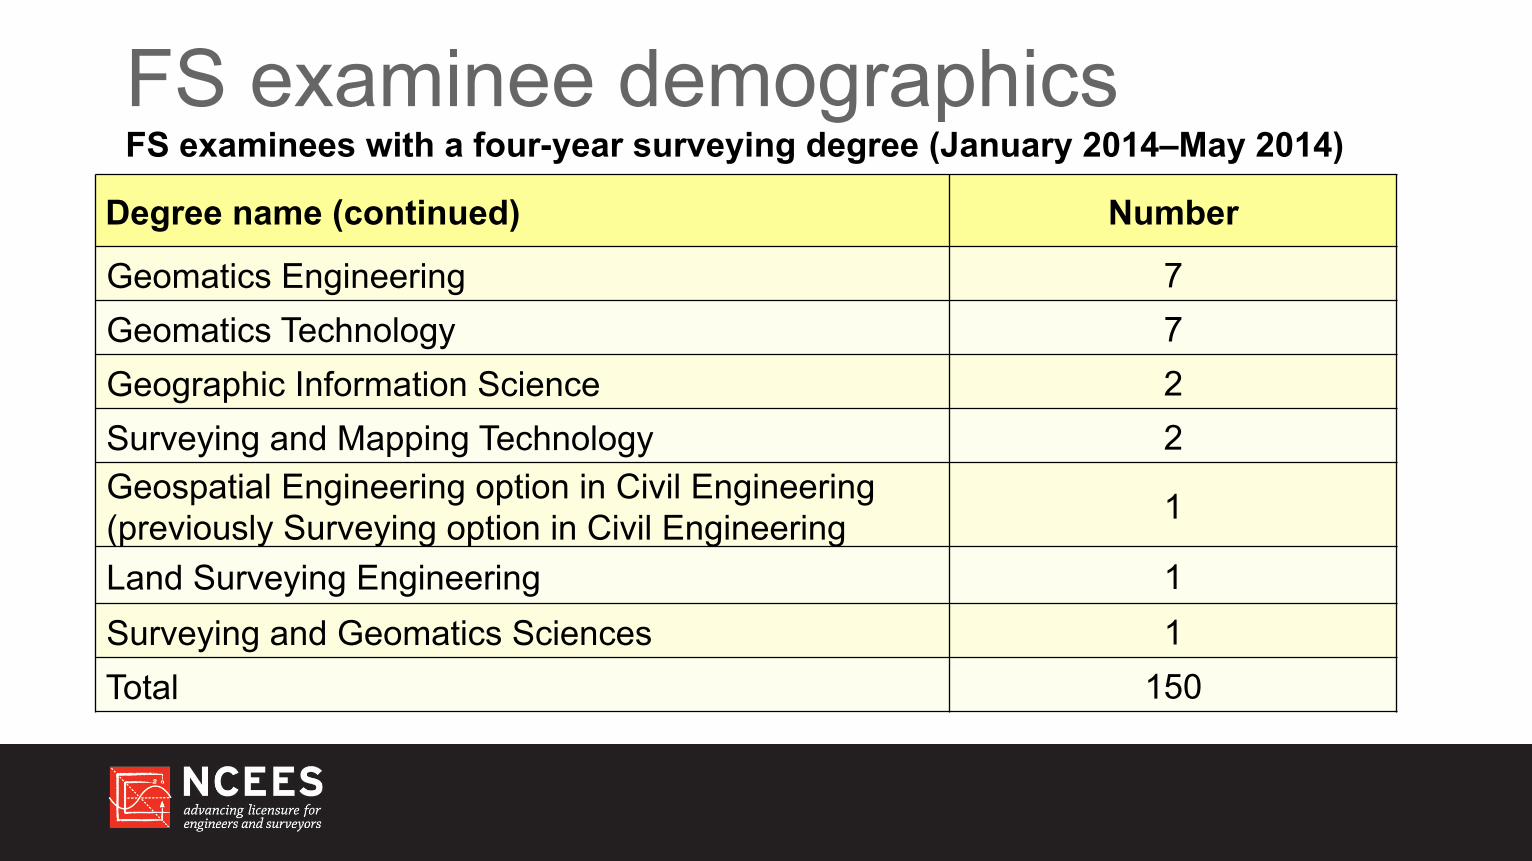
FS examinee demographics FS examinees with a four-year surveying degree (January 2014–May 2014)
Degree name (continued) Number
Geomatics Engineering 7 Geomatics Technology 7 Geographic Information Science 2 Surveying and Mapping Technology 2 Geospatial Engineering option in Civil Engineering (previously Surveying option in Civil Engineering 1
Land Surveying Engineering 1 Surveying and Geomatics Sciences 1 Total 150
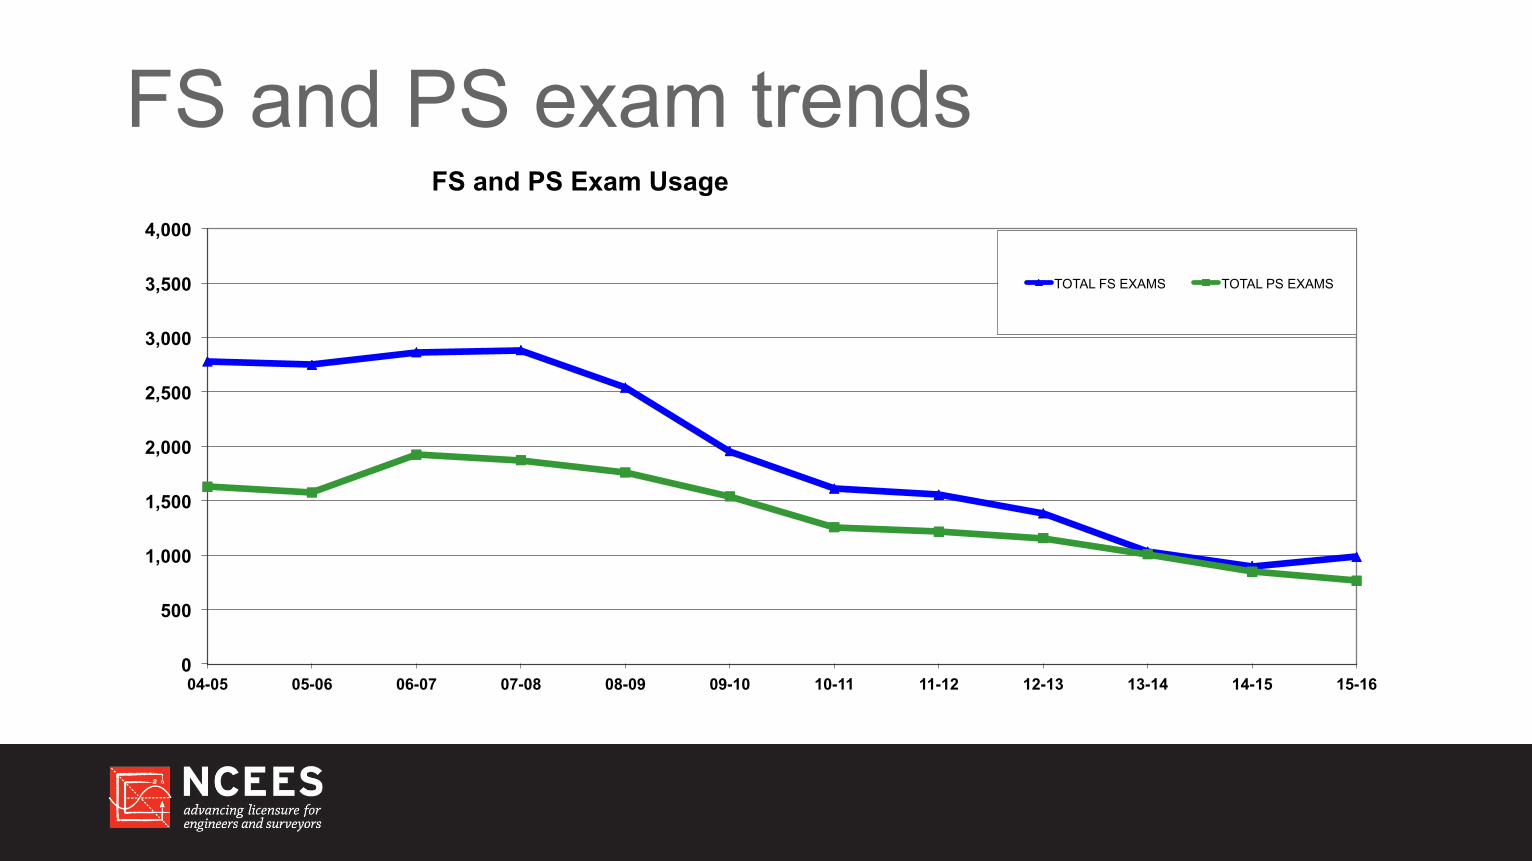
FS and PS exam trends
0
500
1,000
1,500
2,000
2,500
3,000
3,500
4,000
04-05 05-06 06-07 07-08 08-09 09-10 10-11 11-12 12-13 13-14 14-15 15-16
FS and PS Exam Usage
TOTAL FS EXAMS TOTAL PS EXAMS

FS exam window trends
0
50
100
150
200
250
300
350
2014_C01.02 2015_C01.02 2016_C01.03 2014_C04.05 2015_C04.05 2016_C04.06 2014_C07.08 2015_C07.08 2016_C07.09 2014_C10.11 2015_C10.11
FS Volumes by Year and Window
2014_C01.02 2015_C01.02 2016_C01.03 2014_C04.05 2015_C04.05 2016_C04.06 2014_C07.08 2015_C07.08 2016_C07.09 2014_C10.11 2015_C10.11
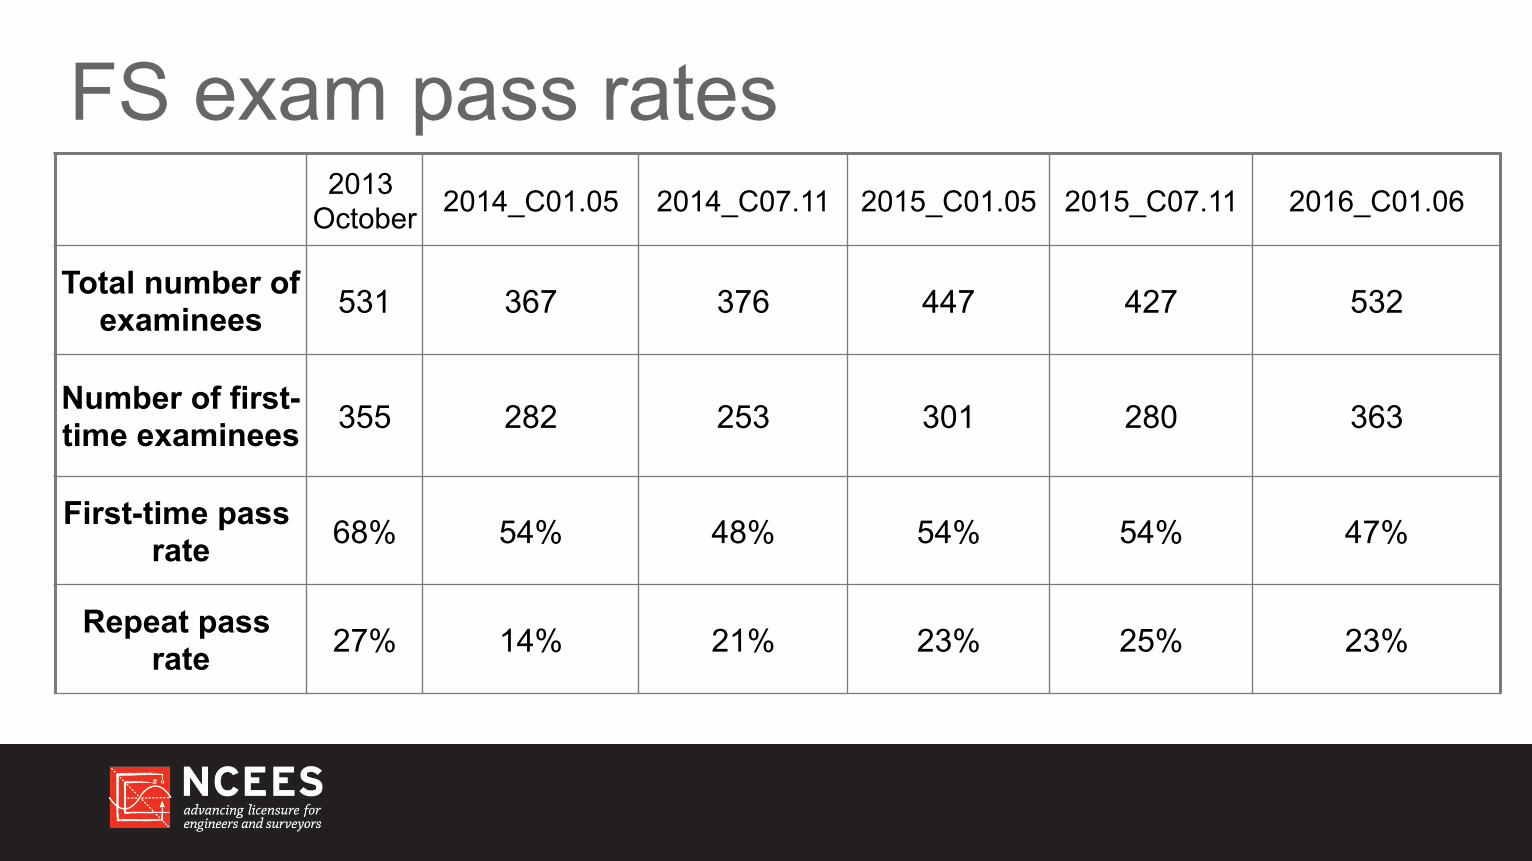
FS exam pass rates 2013
October 2014_C01.05 2014_C07.11 2015_C01.05 2015_C07.11 2016_C01.06
Total number of examinees 531 367 376 447 427 532
Number of first-time examinees 355 282 253 301 280 363
First-time pass rate 68% 54% 48% 54% 54% 47%
Repeat pass rate 27% 14% 21% 23% 25% 23%
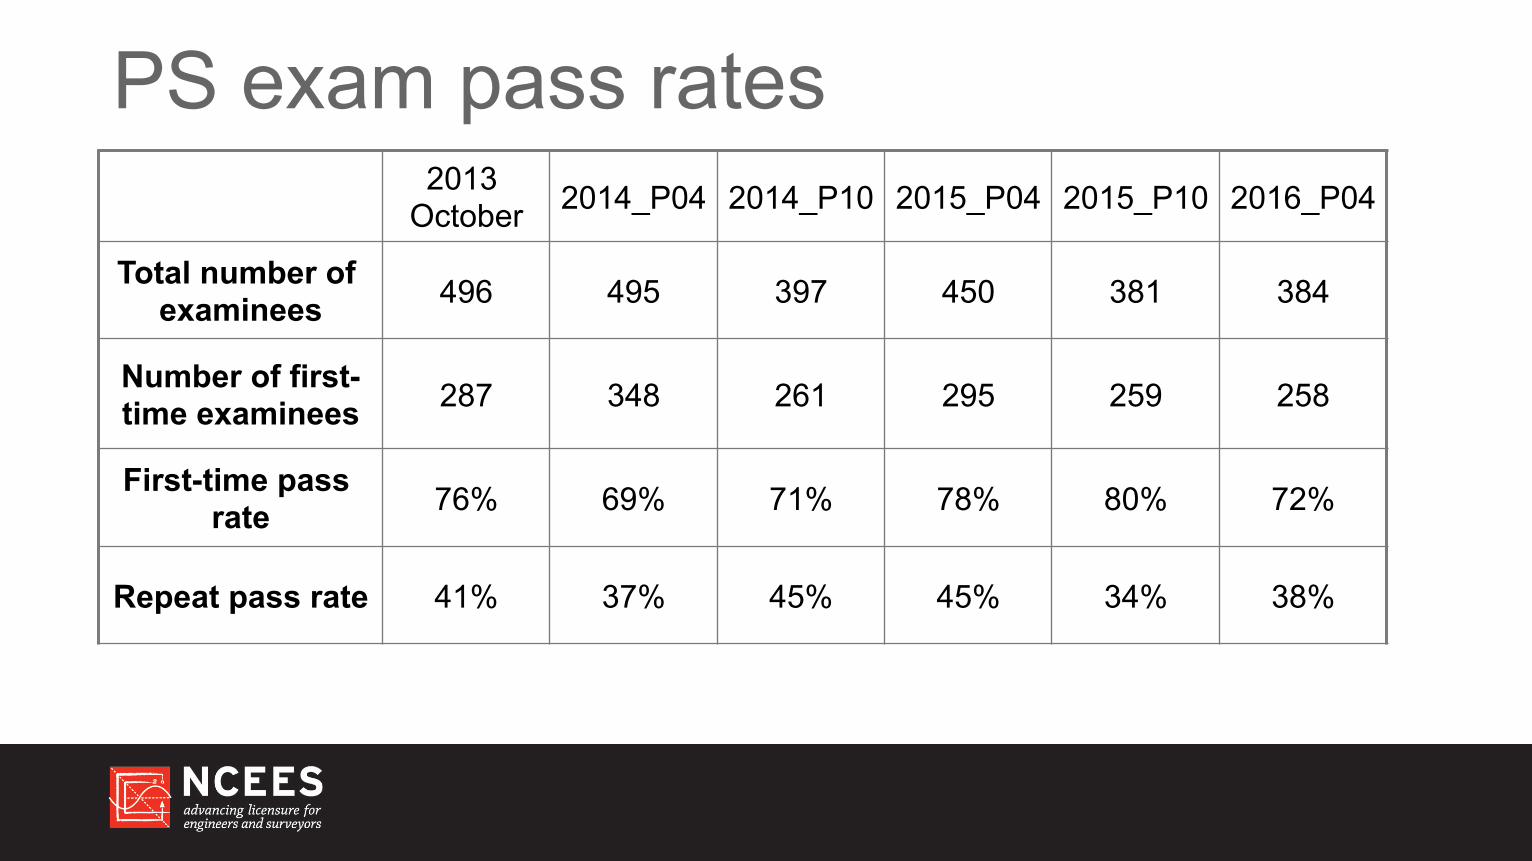
PS exam pass rates 2013
October 2014_P04 2014_P10 2015_P04 2015_P10 2016_P04
Total number of examinees 496 495 397 450 381 384
Number of first-time examinees 287 348 261 295 259 258
First-time pass rate 76% 69% 71% 78% 80% 72%
Repeat pass rate 41% 37% 45% 45% 34% 38%
Agenda • State updates on state-specific surveying exams • Survey Education Award • Forum on the future of surveying • Pokémon Go and Geospatial Professions • UAS use without proper FAA certification • Deregulation of survey licensing • Inefficiencies with surveying mobility
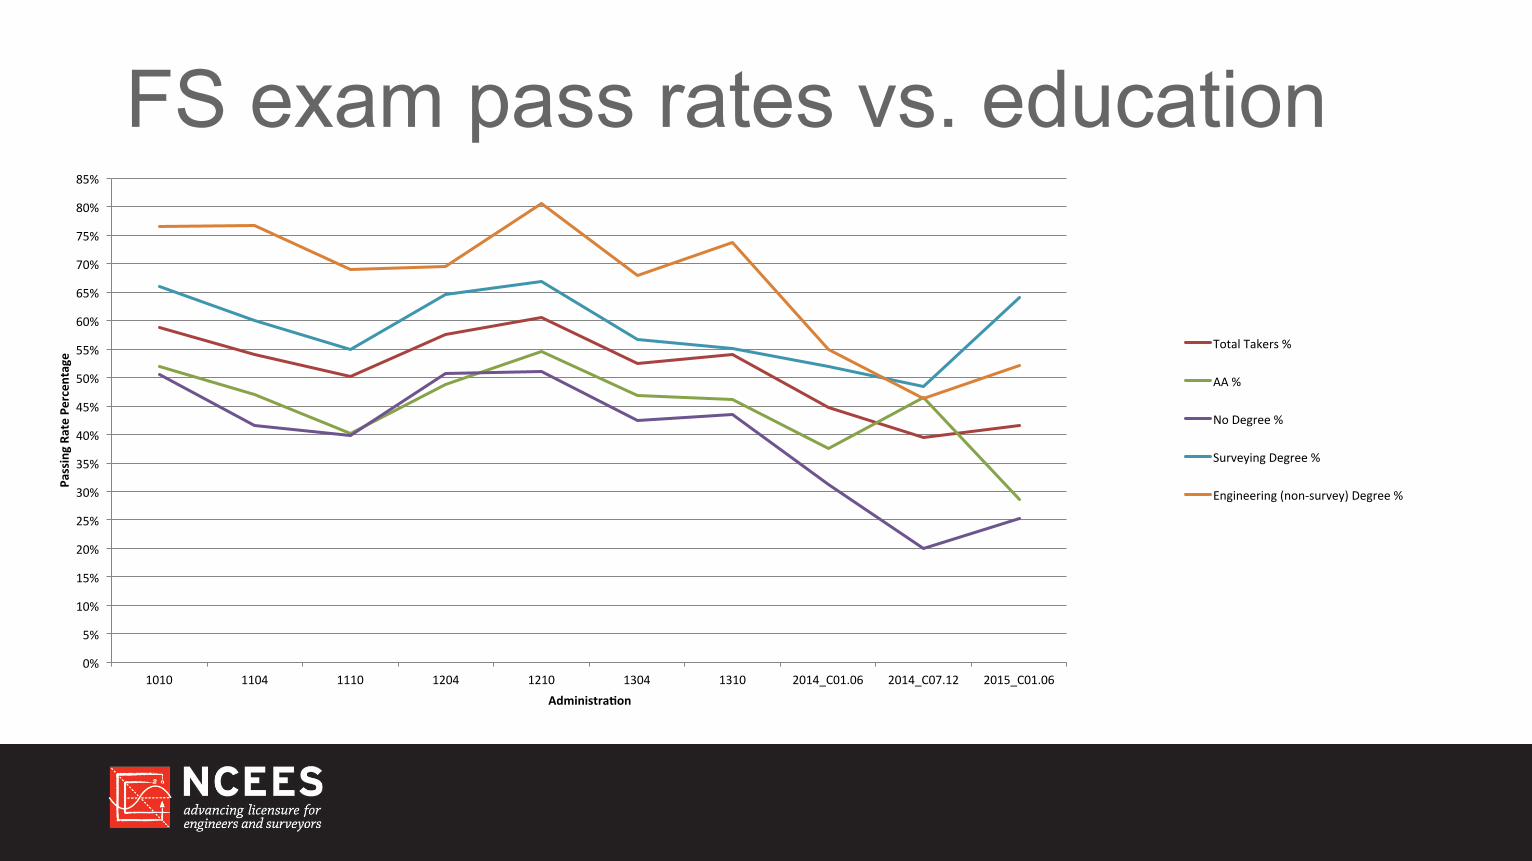
FS exam pass rates vs. education
0%
5%
10%
15%
20%
25%
30%
35%
40%
45%
50%
55%
60%
65%
70%
75%
80%
85%
1010 1104 1110 1204 1210 1304 1310 2014_C01.06 2014_C07.12 2015_C01.06
Passing Ra
te Percentage
Administra0on
Total Takers %
AA %
No Degree %
Surveying Degree %
Engineering (non-‐survey) Degree %
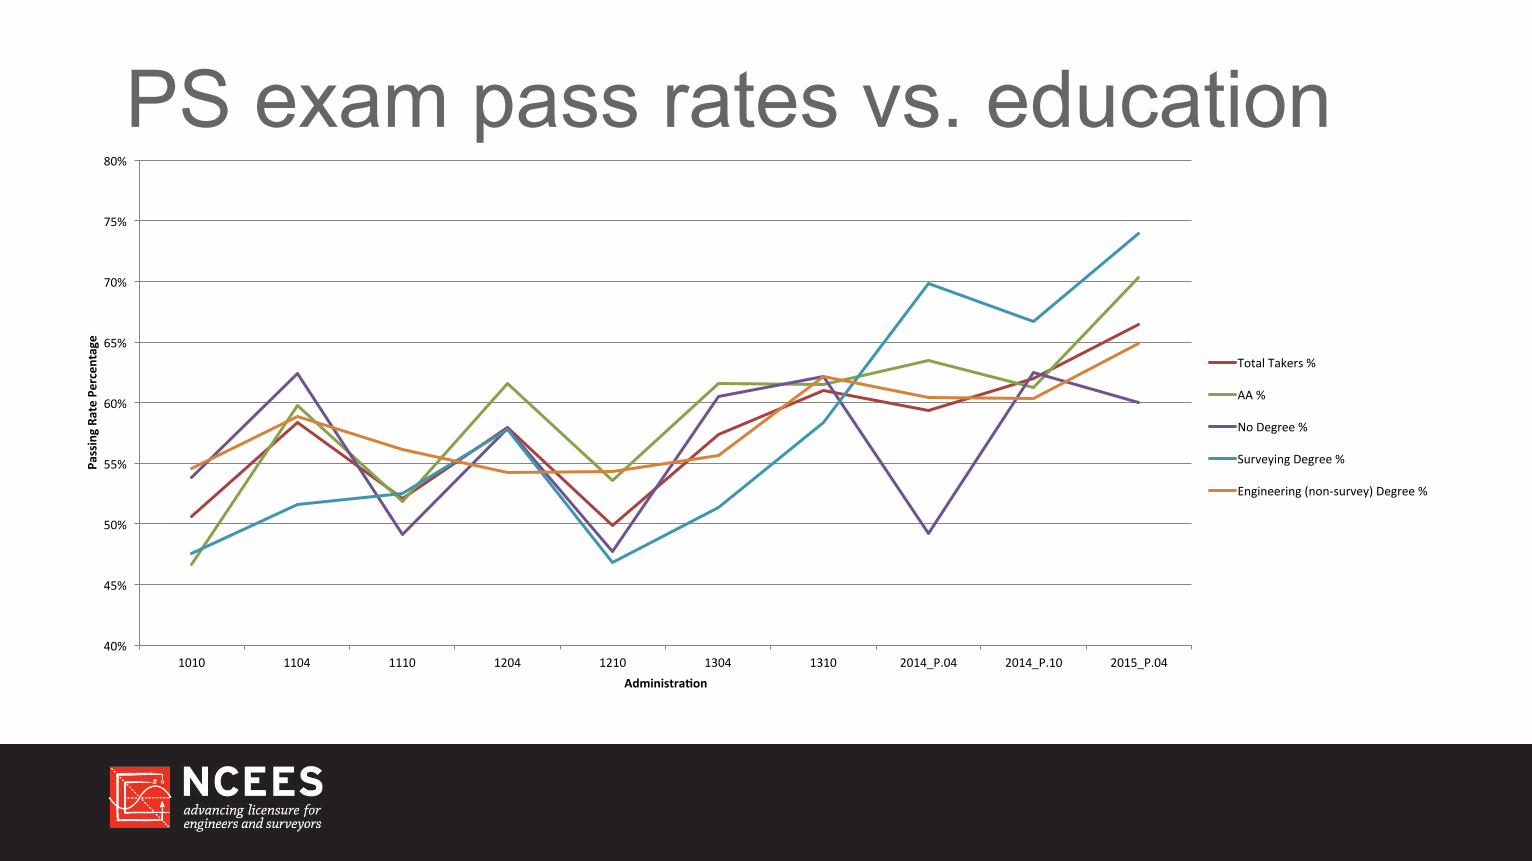
PS exam pass rates vs. education
40%
45%
50%
55%
60%
65%
70%
75%
80%
1010 1104 1110 1204 1210 1304 1310 2014_P.04 2014_P.10 2015_P.04
Passing Ra
te Percentage
Administra0on
Total Takers %
AA %
No Degree %
Surveying Degree %
Engineering (non-‐survey) Degree %


![[PPT]Chapter #1: Basics of Surveying - Faculty Personal ...faculty.kfupm.edu.sa/CE/kaluwfi/Surveying/CE260 CH 1.ppt · Web viewChapter #1: Basics of Surveying 1.1 Surveying Defined](https://img.pdfslide.us/doc/110x75/5abdf95a7f8b9aa3088c4dc9/pptchapter-1-basics-of-surveying-faculty-personal-ch-1pptweb-viewchapter.jpg)