Embed Size (px)
Citation preview
SURVEY RESULTS FOR RESIDENTS OF
HARDIN, JEFFERSON AND ORANGE COUNTIES
Prepared by Dr. James Vanderleeuw, Director, Lamar University Center
for Public Policy Studies, with Dr. Jason Sides and Dr. Thomas Sowers, Department of Political Science, Lamar University. Also, Lamar
University students Adeola Adeyemo, Macy Deng, Sarah Irwin, Joanna
Joseph, Candida Rodriguez and Brian Williams.
In collaboration with Catholic Charities, Carol Fernandez, CEO and the
Lamar University Community Outreach Program, Elton Payne, Director.
Funding provided by Entergy.
Methodology
Permission was requested from church, civic and nonprofit leaders to distribute
surveys to members of their congregation/organization; at least three attempts were
made to contact all such groups where an email address or phone number could be
obtained.
The identification of, and collection of information on churches and agencies
began in the summer of 2012. The effort to contact church and community
organization leaders began during the fall of 2012 and continued through the
summer of 2013. The report was finalized by February 2014.
In all, 26 organizations form Hardin, Orange and Jefferson counties participated in
the study. This effort yielded 384 returned surveys.
The following tables display needs regarding Employment (tables 1-4), Education
(tables 5-7) and Housing (Table 8). Following these tables are respondent
socioeconomic characteristics and a list of participating organizations.
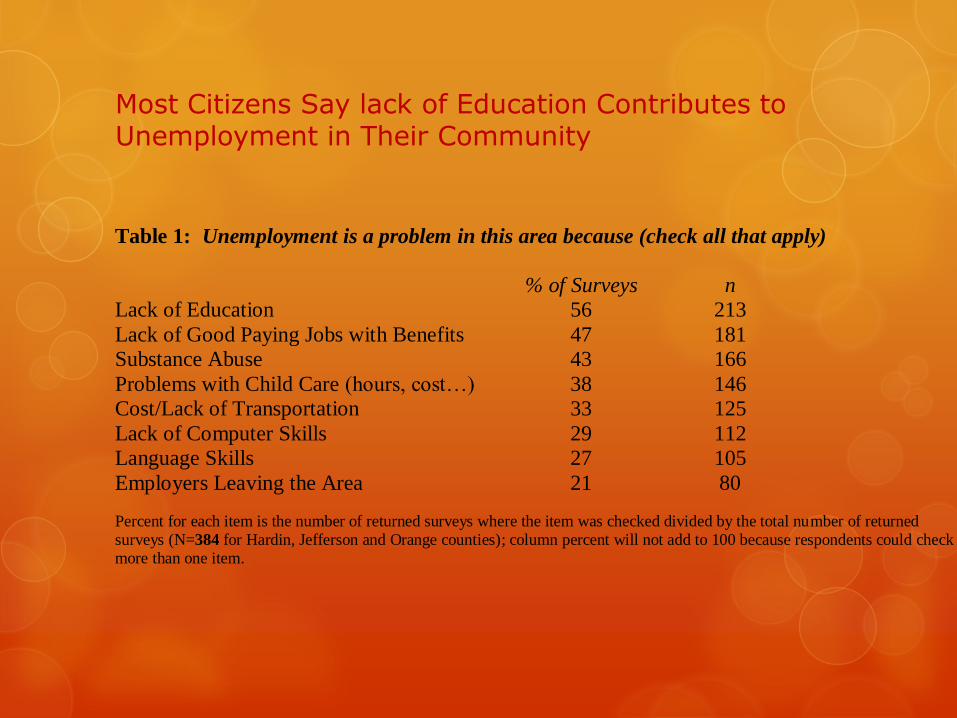
Most Citizens Say lack of Education Contributes to Unemployment in Their Community
Table 1: Unemployment is a problem in this area because (check all that apply)
% of Surveys n
Lack of Education 56 213
Lack of Good Paying Jobs with Benefits 47 181
Substance Abuse 43 166
Problems with Child Care (hours, cost…) 38 146
Cost/Lack of Transportation 33 125
Lack of Computer Skills 29 112
Language Skills 27 105
Employers Leaving the Area 21 80
Percent for each item is the number of returned surveys where the item was checked divided by the total number of returned surveys (N=384 for Hardin, Jefferson and Orange counties); column percent will not add to 100 because respondents could check more than one item.
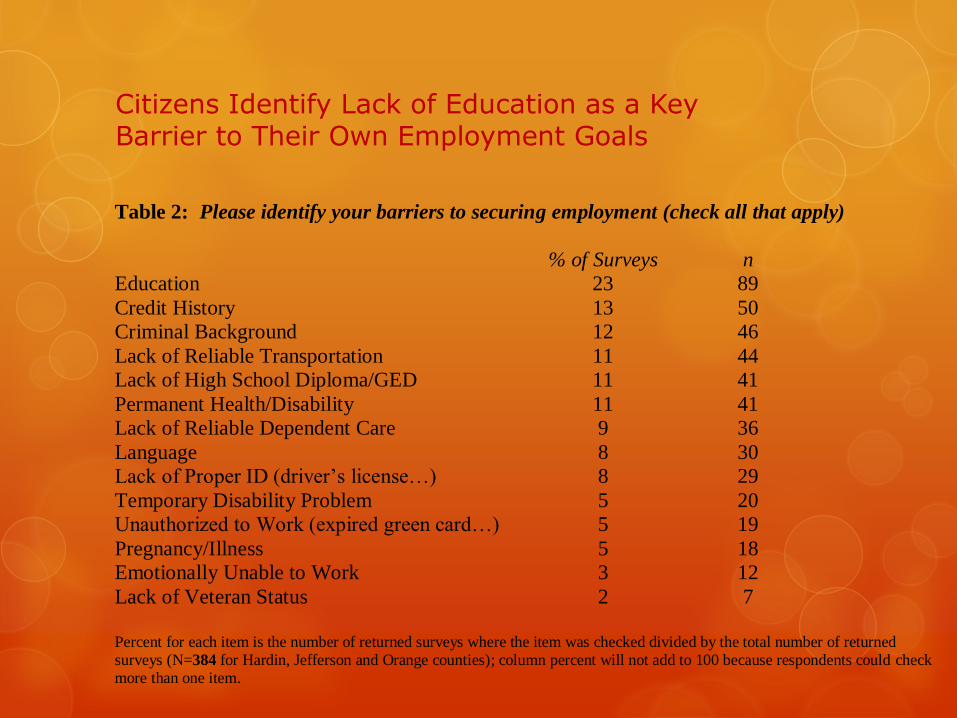
Citizens Identify Lack of Education as a Key Barrier to Their Own Employment Goals
Table 2: Please identify your barriers to securing employment (check all that apply)
% of Surveys n
Education 23 89
Credit History 13 50
Criminal Background 12 46
Lack of Reliable Transportation 11 44
Lack of High School Diploma/GED 11 41
Permanent Health/Disability 11 41
Lack of Reliable Dependent Care 9 36
Language 8 30
Lack of Proper ID (driver’s license…) 8 29
Temporary Disability Problem 5 20
Unauthorized to Work (expired green card…) 5 19
Pregnancy/Illness 5 18
Emotionally Unable to Work 3 12
Lack of Veteran Status 2 7
Percent for each item is the number of returned surveys where the item was checked divided by the total number of returned surveys (N=384 for Hardin, Jefferson and Orange counties); column percent will not add to 100 because respondents could check more than one item.
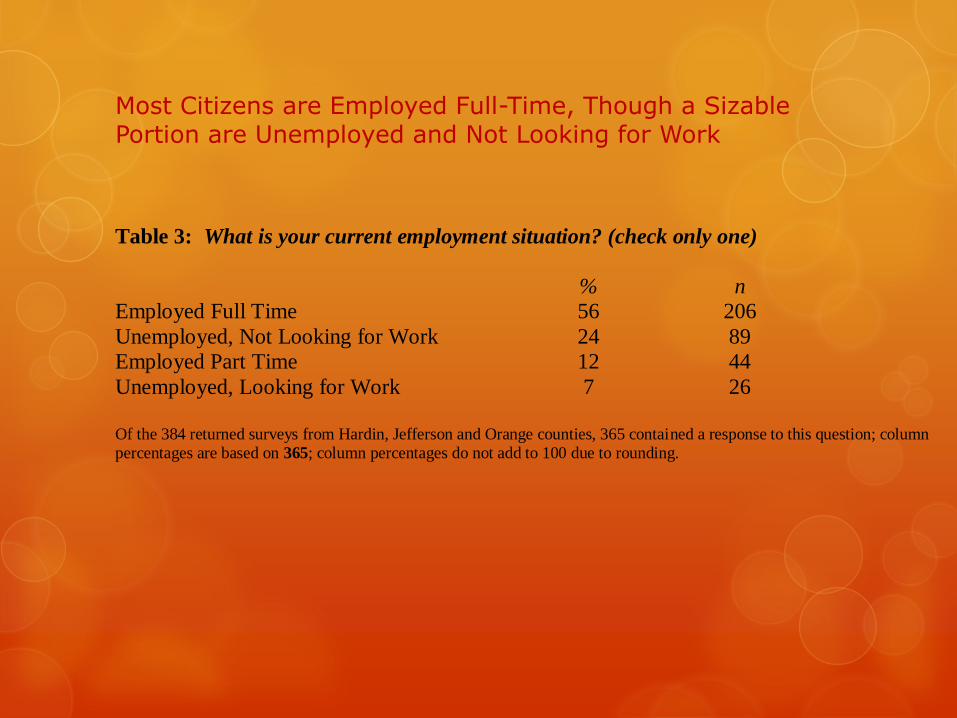
Most Citizens are Employed Full-Time, Though a Sizable Portion are Unemployed and Not Looking for Work
Table 3: What is your current employment situation? (check only one)
% n
Employed Full Time 56 206
Unemployed, Not Looking for Work 24 89
Employed Part Time 12 44
Unemployed, Looking for Work 7 26
Of the 384 returned surveys from Hardin, Jefferson and Orange counties, 365 contained a response to this question; column percentages are based on 365; column percentages do not add to 100 due to rounding.
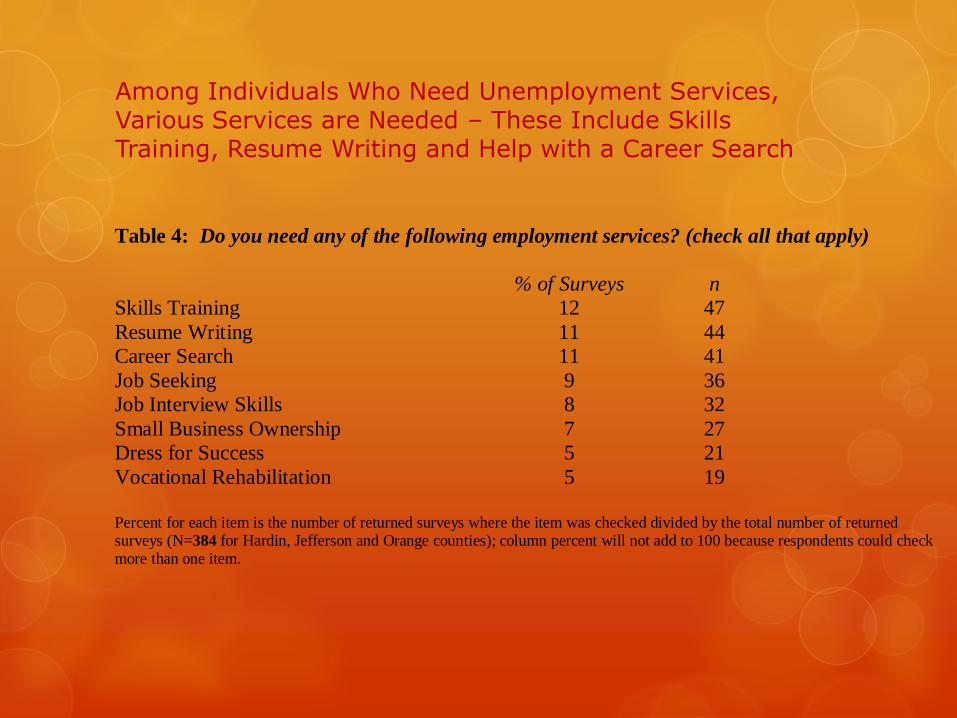
Among Individuals Who Need Unemployment Services, Various Services are Needed – These Include Skills Training, Resume Writing and Help with a Career Search
Table 4: Do you need any of the following employment services? (check all that apply)
% of Surveys n
Skills Training 12 47
Resume Writing 11 44
Career Search 11 41
Job Seeking 9 36
Job Interview Skills 8 32
Small Business Ownership 7 27
Dress for Success 5 21
Vocational Rehabilitation 5 19
Percent for each item is the number of returned surveys where the item was checked divided by the total number of returned surveys (N=384 for Hardin, Jefferson and Orange counties); column percent will not add to 100 because respondents could check more than one item.
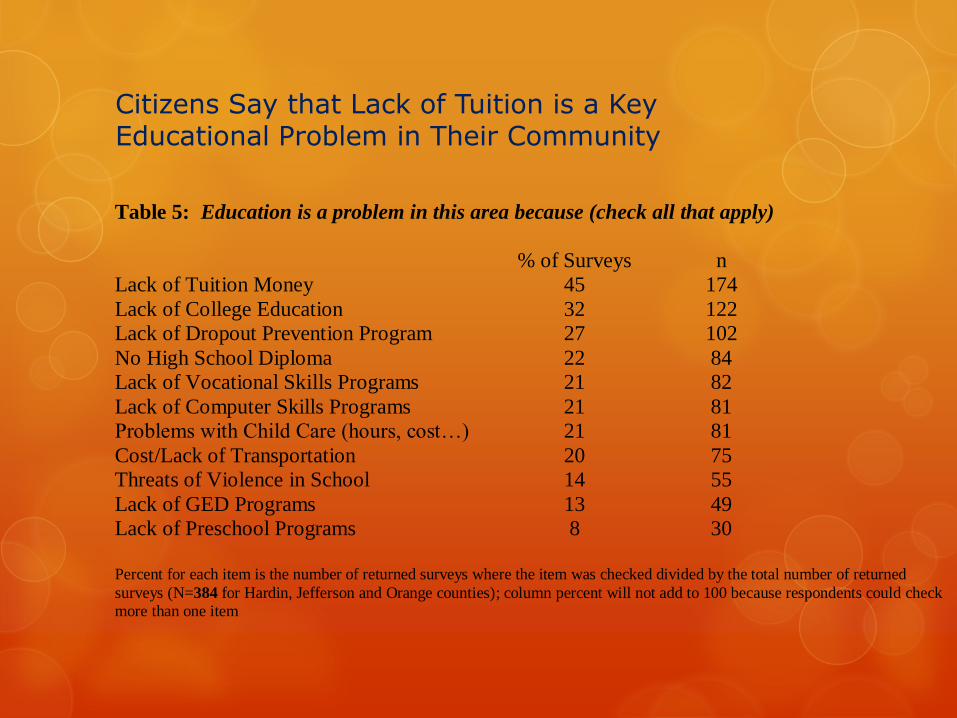
Citizens Say that Lack of Tuition is a Key Educational Problem in Their Community
Table 5: Education is a problem in this area because (check all that apply)
% of Surveys n
Lack of Tuition Money 45 174
Lack of College Education 32 122
Lack of Dropout Prevention Program 27 102
No High School Diploma 22 84
Lack of Vocational Skills Programs 21 82
Lack of Computer Skills Programs 21 81
Problems with Child Care (hours, cost…) 21 81
Cost/Lack of Transportation 20 75
Threats of Violence in School 14 55
Lack of GED Programs 13 49
Lack of Preschool Programs 8 30
Percent for each item is the number of returned surveys where the item was checked divided by the total number of returned
surveys (N=384 for Hardin, Jefferson and Orange counties); column percent will not add to 100 because respondents could check more than one item
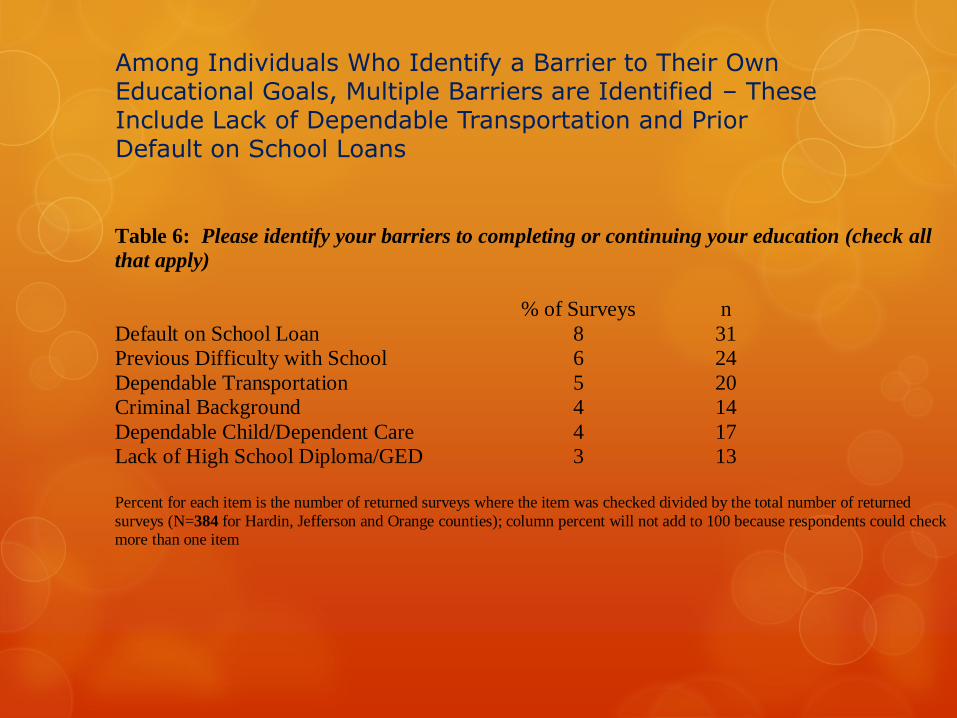
Among Individuals Who Identify a Barrier to Their Own Educational Goals, Multiple Barriers are Identified – These Include Lack of Dependable Transportation and Prior Default on School Loans
Table 6: Please identify your barriers to completing or continuing your education (check all
that apply)
% of Surveys n
Default on School Loan 8 31
Previous Difficulty with School 6 24
Dependable Transportation 5 20
Criminal Background 4 14
Dependable Child/Dependent Care 4 17
Lack of High School Diploma/GED 3 13
Percent for each item is the number of returned surveys where the item was checked divided by the total number of returned
surveys (N=384 for Hardin, Jefferson and Orange counties); column percent will not add to 100 because respondents could check more than one item
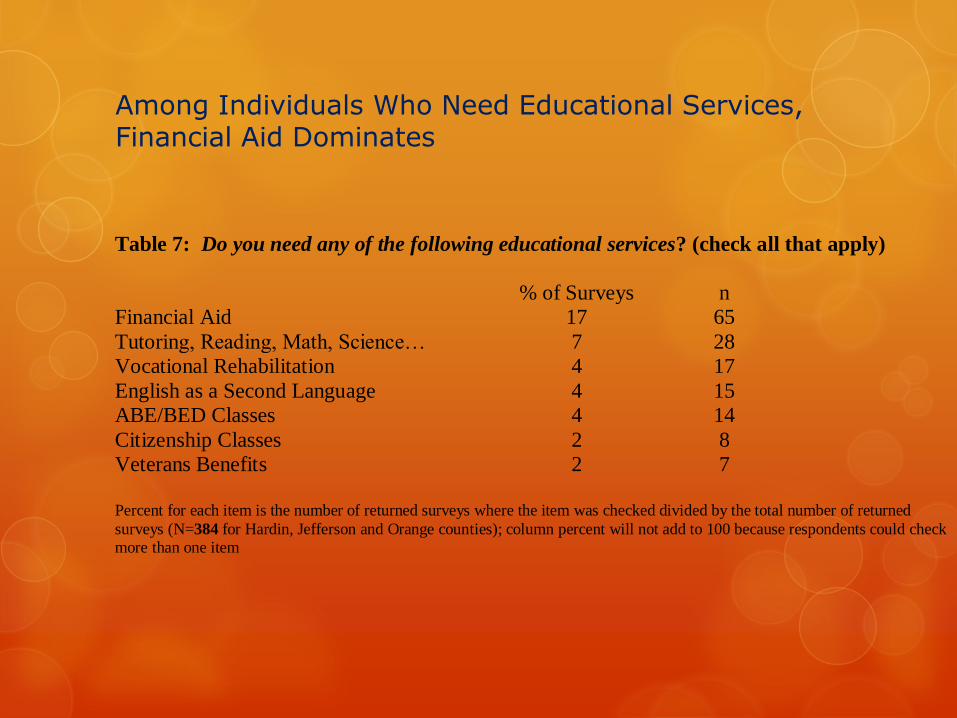
Among Individuals Who Need Educational Services, Financial Aid Dominates
Table 7: Do you need any of the following educational services? (check all that apply)
% of Surveys n
Financial Aid 17 65
Tutoring, Reading, Math, Science… 7 28
Vocational Rehabilitation 4 17
English as a Second Language 4 15
ABE/BED Classes 4 14
Citizenship Classes 2 8
Veterans Benefits 2 7
Percent for each item is the number of returned surveys where the item was checked divided by the total number of returned
surveys (N=384 for Hardin, Jefferson and Orange counties); column percent will not add to 100 because respondents could check more than one item

Citizens Say Cost is a Problem to Obtaining Housingin Their Community
Table 8: Housing is a problem in this area because (check all that apply)
% of Surveys n
Monthly Cost of Rent/House Payment 36 138
Affordable Rental House/Apt not Available 28 106
Move-in-Costs (deposit for rent, utilities) 24 93
Long Wait List for Section 8 or Other Housing
Assistance 21 82
Affordable Single Family House not Available for
Purchase 21 80
Housing Not Avail in Accept Neighborhoods 19 74
Lack of Shelters for Families, Women, Men 17 65
Lack of Assistance for Repairs/Maintenance 15 58
Lack of Supportive Services 13 49
Lack of Public Housing 10 38
Housing Size Does Not Meet Family Needs 9 33
Percent for each item is the number of returned surveys where the item was checked divided by the total number of returned surveys (N=384 for Hardin, Jefferson and Orange counties); column percent will not add to 100 because respondents could check more than one item
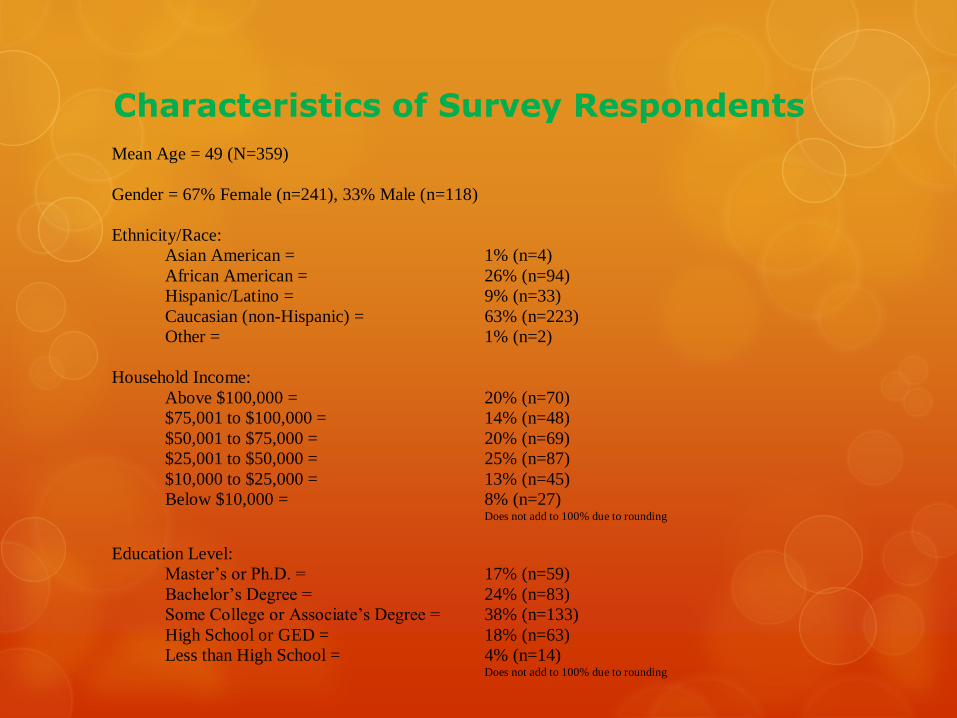
Characteristics of Survey Respondents
Mean Age = 49 (N=359)
Gender = 67% Female (n=241), 33% Male (n=118)
Ethnicity/Race:
Asian American = 1% (n=4)
African American = 26% (n=94)
Hispanic/Latino = 9% (n=33)
Caucasian (non-Hispanic) = 63% (n=223)
Other = 1% (n=2)
Household Income:
Above $100,000 = 20% (n=70)
$75,001 to $100,000 = 14% (n=48)
$50,001 to $75,000 = 20% (n=69)
$25,001 to $50,000 = 25% (n=87)
$10,000 to $25,000 = 13% (n=45)
Below $10,000 = 8% (n=27) Does not add to 100% due to rounding
Education Level:
Master’s or Ph.D. = 17% (n=59)
Bachelor’s Degree = 24% (n=83)
Some College or Associate’s Degree = 38% (n=133)
High School or GED = 18% (n=63)
Less than High School = 4% (n=14) Does not add to 100% due to rounding
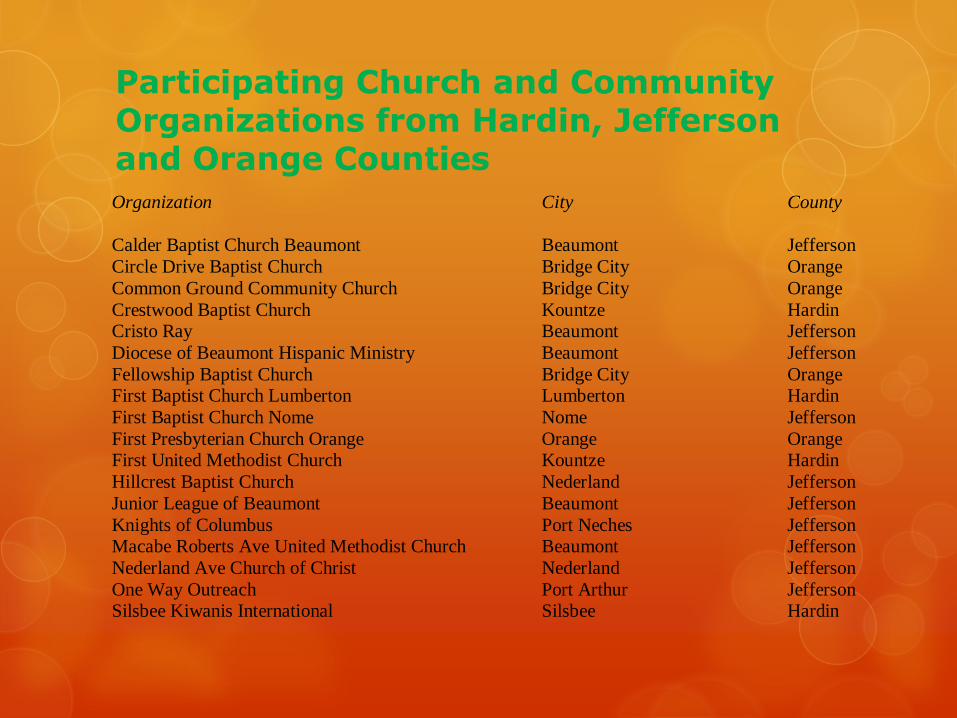
Participating Church and Community Organizations from Hardin, Jefferson and Orange CountiesOrganization City County
Calder Baptist Church Beaumont Beaumont Jefferson
Circle Drive Baptist Church Bridge City Orange
Common Ground Community Church Bridge City Orange
Crestwood Baptist Church Kountze Hardin Cristo Ray Beaumont Jefferson
Diocese of Beaumont Hispanic Ministry Beaumont Jefferson
Fellowship Baptist Church Bridge City Orange First Baptist Church Lumberton Lumberton Hardin
First Baptist Church Nome Nome Jefferson
First Presbyterian Church Orange Orange Orange First United Methodist Church Kountze Hardin
Hillcrest Baptist Church Nederland Jefferson
Junior League of Beaumont Beaumont Jefferson
Knights of Columbus Port Neches Jefferson Macabe Roberts Ave United Methodist Church Beaumont Jefferson
Nederland Ave Church of Christ Nederland Jefferson
One Way Outreach Port Arthur Jefferson Silsbee Kiwanis International Silsbee Hardin