Embed Size (px)
Citation preview

SURVEY ON THE ACCESS TO FINANCE OF SMALL
AND MEDIUM-SIZED ENTERPRISES IN THE EURO AREA
OCTOBER 2011
TO MARCH 2012
APRIL 2012
© European Central Bank, 2012 Address Kaiserstrasse 29, 60311 Frankfurt am Main, Germany Postal address Postfach 16 03 19, 60066 Frankfurt am Main, Germany Telephone +49 69 1344 0 Internet http://www.ecb.europa.eu Fax +49 69 1344 6000 All rights reserved. Reproduction for educational and non-commercial purposes is permitted provided that the source is acknowledged. ISSN 1831-9998 (online)

ECB Survey on the access to finance of small and medium-sized enterprises in the euro area
April 2012
1
This report presents the main features of the results of the sixth round of the survey on the
access to finance of small and medium-sized enterprises in the euro area (SAFE),
conducted between 29 February and 29 March 2012 on behalf of the European Central
Bank (ECB). The total sample size for the euro area was 7,511 firms, of which 6,969
(93%) had less than 250 employees.1 The report provides evidence mainly on the change
in the financial situation, financing needs and access to external financing of small and
medium-sized enterprises (SMEs) in the euro area, compared with large firms, during the
preceding six months, i.e. the period from October 2011 to March 2012.2 In addition, it
provides an overview of developments in SME access to finance across euro area
countries.
1 THE FINANCIAL SITUATION OF EURO AREA SMES
In the period from October 2011 to March 2012 (H2 2011), which was characterised by a
weakening of economic activity in the euro area, a net3 2% of euro area SMEs reported a
contraction in turnover. This was mainly driven by SMEs in the construction sector
where a net 17% reported a decrease in turnover, only partially offset by SMEs in the
industry sector, where on balance 10% reported an increase in turnover. In addition, the
turnover contraction occurred particularly in the segment of older firms (10 years and
older) while younger SMEs continued to report on balance an increase in turnover during
the survey period. The development for euro area SMEs represented a deterioration
compared with the previous six-month period when SMEs reported on balance an increase
in turnover (9% in H1 2011; see Chart 1). In addition, on balance, a higher percentage
(27%) than in the previous survey period (15%) of euro area SMEs reported a
deterioration of their profits, in particular in the construction (44%) and the trade (30%)
sectors. In line with this, a higher net percentage of SMEs mentioned increased labour
and other costs (46% and 67% respectively, up from 43% and 59%), likely reflecting in
particular increases in energy prices.
1 See Annex 2 for details on the weighting scheme. 2 The reference period for the previous survey round (H1 2011) was April to September 2011. 3 Net percentages refer to the difference between firms reporting an increase and those reporting a decrease.

ECB Survey on the access to finance of small and medium-sized enterprises in the euro area April 2012
2
Euro area SMEs reported a slight further decline in their leverage (ratio of debt to assets),
similar to the net percentage in the previous six-month period (5%, compared with 6%),
with the exception of the construction sector where firms reported an increase in leverage
(on balance 7%). This decline reflects the continued need to deleverage from substantial
levels of debt, but also a decline in the availability of debt financing in the survey period
(see below). At the same time, SMEs’ leverage developments were heterogeneous across
euro area countries (see country section below). Notwithstanding their deleveraging, and
as in the previous survey period, SMEs reported on balance similar net interest expenses
to those in the previous wave (24%, compared with 25%).
Large firms also reported, on balance, a decline in their profits, for the first time since the
second half of 2009 (4%, after a net increase of 10% in H1 2011; see Chart 1a in Annex
1A). However, the net percentage was much lower than for SMEs. In addition, large firms
continued to report on balance an increase in turnover, although the net percentage was
lower than in the previous six-month period (32%, down from 45%). Large firms’
leverage continued declining (in net terms 6% of the large firms mentioned this, compared
with 7% in H1 2011), similar to the situation for SMEs. Overall, for large firms, the
financial situation appears to remain clearly more favourable than for SMEs.
Chart 1
CHANGE IN THE INCOME AND DEBT SITUATION OF EURO AREA SMES (over the preceding six months; net percentage of respondents)
‐60
‐40
‐20
0
20
40
60
80
'09 '10 '11 '09 '10 '11 '09 '10 '11 '09 '10 '11 '09 '10 '11 '09 '10 '11
Turnover Labour costs Other costs Net interestexpenses
Profit Debt‐to‐assetsratio
Base: All SMEs. Note: The net percentage is the difference between the percentage of firms reporting an increase for a given factor and that reporting a decrease.
ECB Survey on the access to finance of small and medium-sized enterprises in the euro area
April 2012
3
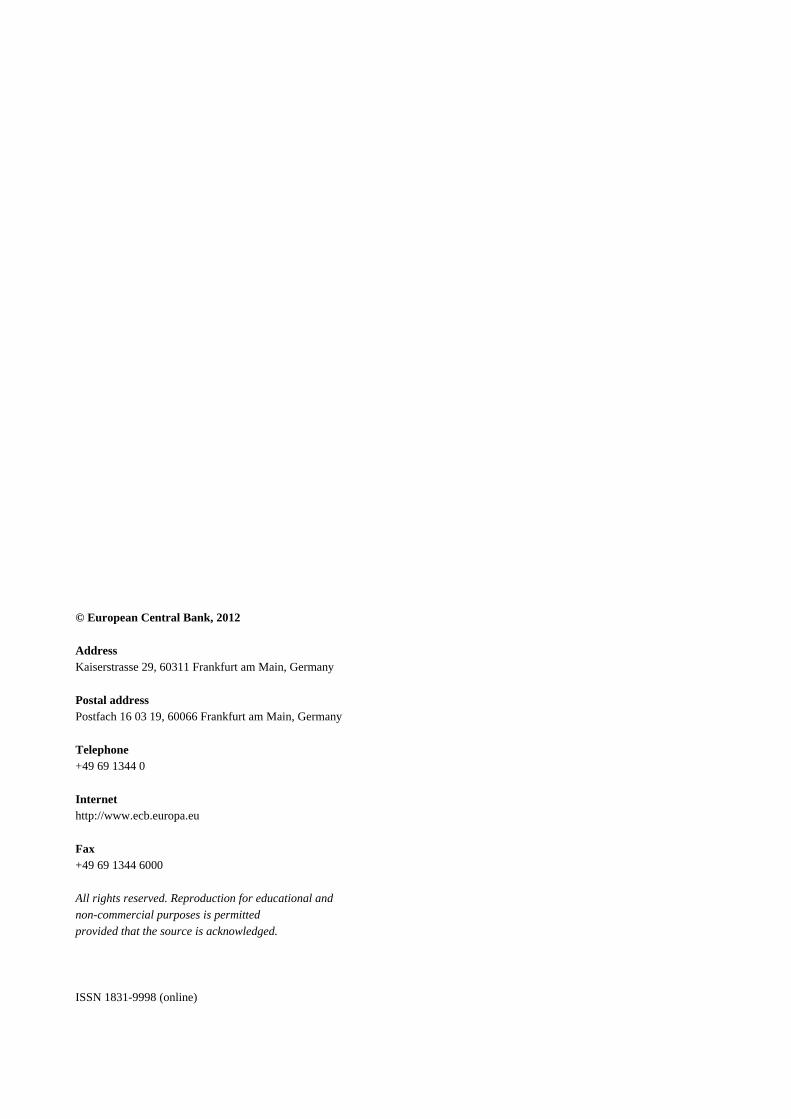
“Finding customers” remained the dominant concern for euro area SMEs also in this
survey period (with 27% of SMEs mentioning this issue, up from 23% in H1 2011; see
Chart 2). At the same time, the importance of “Access to finance” was broadly
unchanged as a concern for euro area SMEs (17% mentioned this, after 16% in H1 2011),
remaining below the peak reached in H2 2009 (19%). In line with the evidence on the
financial situation, “Access to finance” was mentioned as the most pressing concern in
particular in the construction sector (22%). Other areas like “Competition” and
“Availability of skilled staff or experienced managers” were mentioned somewhat less
frequently (12% and 14% respectively). Interestingly, SMEs up to 5 years old mentioned
“Finding customers” and “Access to finance” similarly often as their most pressing
problem (both around 20%). For large firms, “Access to finance” (mentioned by 14%, up
from 11%) was less of an issue, while “Finding customers” and “Availability of skilled
staff or experienced managers” were their dominant concerns (20% and 18%, broadly
unchanged from 19% and 18% respectively; see Chart 2a in Annex 1A).
Chart 2
THE MOST PRESSING PROBLEM FACED BY EURO AREA SMES (percentage of respondents)
0
5
10
15
20
25
30
Findingcustomers
Competition Access tofinance
Costs ofproductionor labour
Availabilityof skilledstaff or
experiencedmanagers
Regulation Other Don't know
H1 2009 H2 2009 H1 2010 H2 2010 2011 H1 2011 H2
Base: All SMEs.

ECB Survey on the access to finance of small and medium-sized enterprises in the euro area April 2012
4
2 EXTERNAL FINANCING NEEDS AND ACCESS TO FINANCE OF EURO AREA SMES
2.1 SOURCES OF EXTERNAL FINANCING OF EURO AREA SMES
Compared with the previous survey round, the composition of SMEs’ sources of external
financing changed little between October 2011 and March 2012. The percentage of euro
area SMEs using bank loans (35%, up from 33% in H1 2011) and bank overdrafts or
credit lines (42%, up from 40%) increased somewhat in comparison with the previous
round, bank financing remaining their most important source of external financing (see
Chart 3). The use of trade credit also increased during the survey period, whereas the
importance of leasing, hire purchase and factoring appears to have declined.
Chart 3
SOURCES OF EXTERNAL FINANCING OF EURO AREA SMES (over the preceding six months; percentage of respondents)
0
5
10
15
20
25
30
35
40
45
Overdrafts and creditlines
Bank loans Trade credit Leasing, hirepurchase andfactoring
H1 2009 H2 2009 H1 2010 H2 2010 2011 H1 2011 H2
Base: All SMEs. 2.2 EXTERNAL FINANCING NEEDS OF EURO AREA SMES
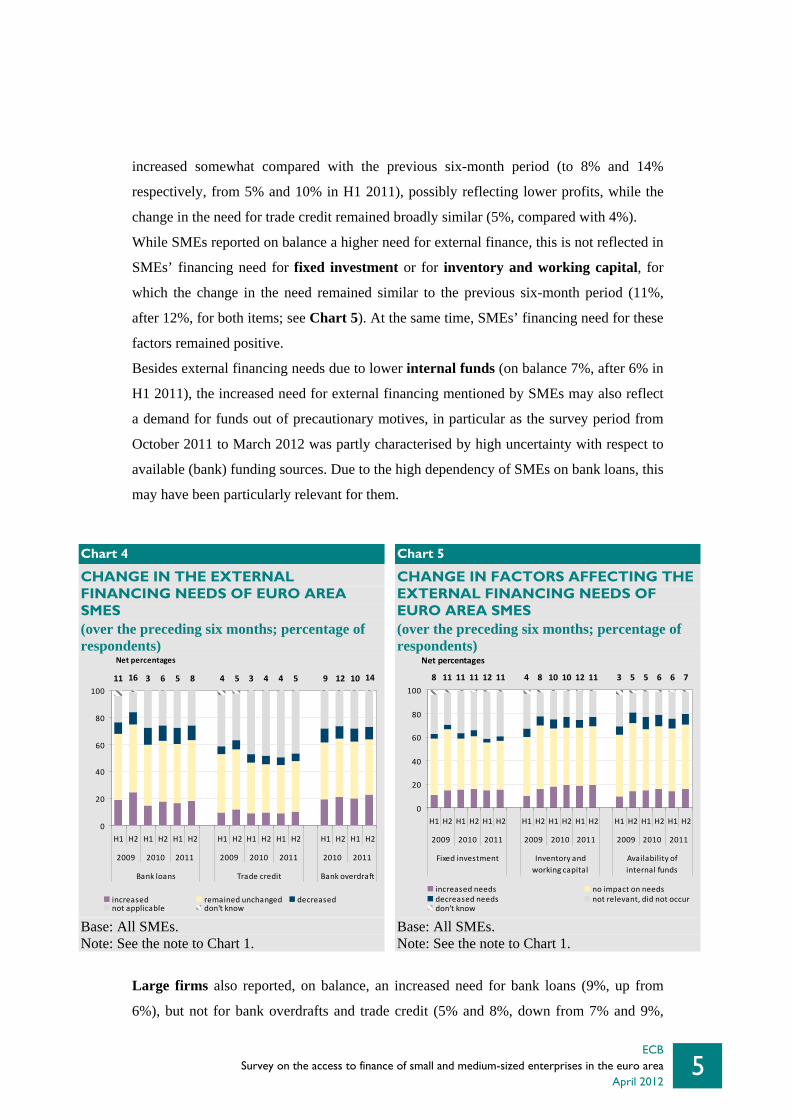
As in the previous survey round, more SMEs reported an increase (19%, up from 17% in
H1 2011) of their need (demand) for bank loans than a decrease (11%, compared with
12%; see Chart 4).4 In net terms, SMEs’ need for bank loans and bank overdrafts
4 Regardless of whether they have applied or not for external financing, all survey respondents are asked about their needs for each source of external financing (i.e. bank loans, bank overdrafts and credit lines, trade credit, equity and debt securities issuance).
ECB Survey on the access to finance of small and medium-sized enterprises in the euro area
April 2012
5
increased somewhat compared with the previous six-month period (to 8% and 14%
respectively, from 5% and 10% in H1 2011), possibly reflecting lower profits, while the
change in the need for trade credit remained broadly similar (5%, compared with 4%).
While SMEs reported on balance a higher need for external finance, this is not reflected in
SMEs’ financing need for fixed investment or for inventory and working capital, for
which the change in the need remained similar to the previous six-month period (11%,
after 12%, for both items; see Chart 5). At the same time, SMEs’ financing need for these
factors remained positive.
Besides external financing needs due to lower internal funds (on balance 7%, after 6% in
H1 2011), the increased need for external financing mentioned by SMEs may also reflect
a demand for funds out of precautionary motives, in particular as the survey period from
October 2011 to March 2012 was partly characterised by high uncertainty with respect to
available (bank) funding sources. Due to the high dependency of SMEs on bank loans, this
may have been particularly relevant for them.
Chart 4
CHANGE IN THE EXTERNAL FINANCING NEEDS OF EURO AREA SMES (over the preceding six months; percentage of respondents)
Chart 5
CHANGE IN FACTORS AFFECTING THE EXTERNAL FINANCING NEEDS OF EURO AREA SMES (over the preceding six months; percentage of respondents)
11 16 3 6 5 8 4 5 3 4 4 5 9 12 10 14
0
20
40
60
80
100
H1 H2 H1 H2 H1 H2 H1 H2 H1 H2 H1 H2 H1 H2 H1 H2
2009 2010 2011 2009 2010 2011 2010 2011
Bank loans Trade credit Bank overdraft
increased remained unchanged decreasednot applicable don't know
Net percentages
8 11 11 11 12 11 4 8 10 10 12 11 3 5 5 6 6 7
0
20
40
60
80
100
H1 H2 H1 H2 H1 H2 H1 H2 H1 H2 H1 H2 H1 H2 H1 H2 H1 H2
2009 2010 2011 2009 2010 2011 2009 2010 2011
Fixed investment Inventory andworking capital
Availability ofinternal funds
increased needs no impact on needsdecreased needs not relevant, did not occurdon't know
Net percentages
Base: All SMEs. Note: See the note to Chart 1.
Base: All SMEs. Note: See the note to Chart 1.
Large firms also reported, on balance, an increased need for bank loans (9%, up from
6%), but not for bank overdrafts and trade credit (5% and 8%, down from 7% and 9%,
ECB Survey on the access to finance of small and medium-sized enterprises in the euro area April 2012
6
respectively). Their financing need for fixed investment remained broadly unchanged (on
balance 24%) and declined for working capital (19%, down from 22%) compared with the
previous survey period (see Charts 4a and 5a in Annex 1A).
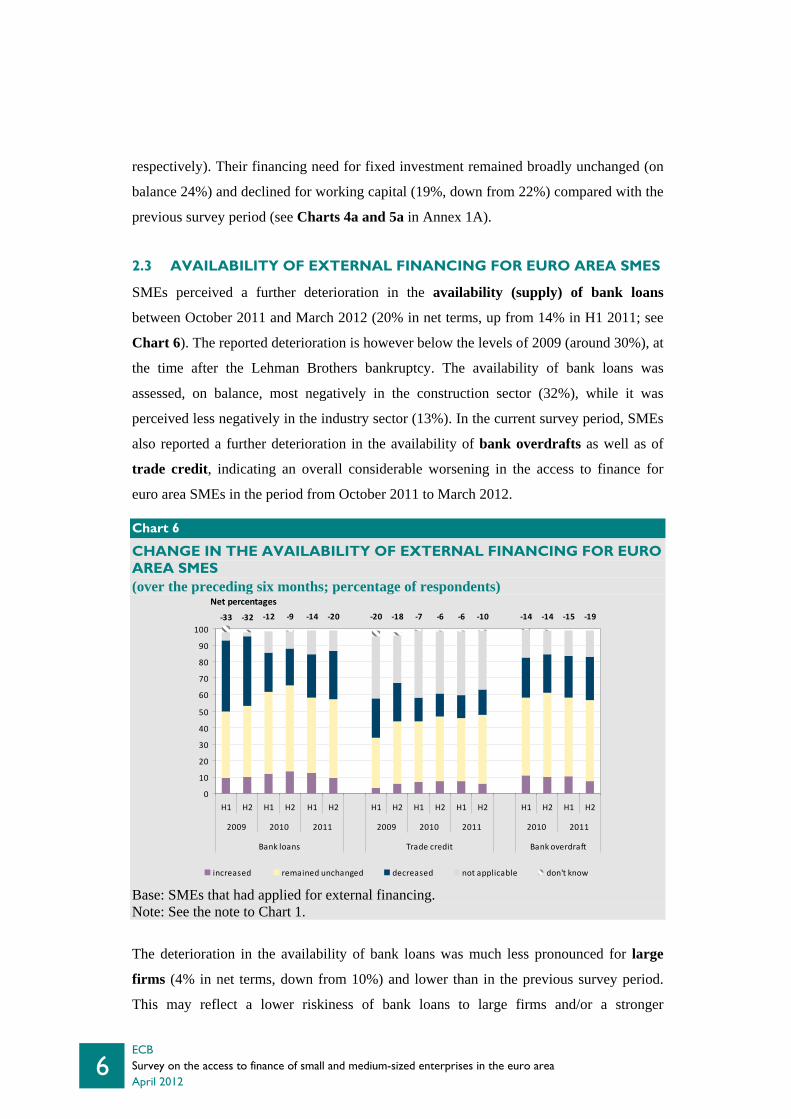
2.3 AVAILABILITY OF EXTERNAL FINANCING FOR EURO AREA SMES
SMEs perceived a further deterioration in the availability (supply) of bank loans
between October 2011 and March 2012 (20% in net terms, up from 14% in H1 2011; see
Chart 6). The reported deterioration is however below the levels of 2009 (around 30%), at
the time after the Lehman Brothers bankruptcy. The availability of bank loans was
assessed, on balance, most negatively in the construction sector (32%), while it was
perceived less negatively in the industry sector (13%). In the current survey period, SMEs
also reported a further deterioration in the availability of bank overdrafts as well as of
trade credit, indicating an overall considerable worsening in the access to finance for
euro area SMEs in the period from October 2011 to March 2012.
The deterioration in the availability of bank loans was much less pronounced for large
firms (4% in net terms, down from 10%) and lower than in the previous survey period.
This may reflect a lower riskiness of bank loans to large firms and/or a stronger
Chart 6
CHANGE IN THE AVAILABILITY OF EXTERNAL FINANCING FOR EURO AREA SMES (over the preceding six months; percentage of respondents)
‐33 ‐32 ‐12 ‐9 ‐14 ‐20 ‐20 ‐18 ‐7 ‐6 ‐6 ‐10 ‐14 ‐14 ‐15 ‐19
0
10
20
30
40
50
60
70
80
90
100
H1 H2 H1 H2 H1 H2 H1 H2 H1 H2 H1 H2 H1 H2 H1 H2
2009 2010 2011 2009 2010 2011 2010 2011
Bank loans Trade credit Bank overdraft
increased remained unchanged decreased not applicable don't know
Net percentages
Base: SMEs that had applied for external financing. Note: See the note to Chart 1.

ECB Survey on the access to finance of small and medium-sized enterprises in the euro area
April 2012
7
negotiation power of large firms, which overall avoided a stronger worsening in an
environment of tightened bank financing conditions in the fourth quarter of 2011. Large
firms also reported, on balance, a deterioration in the availability of bank overdrafts and
trade credit (12% and 4%, compared with 9% and 4% respectively; see Chart 6a in
Annex 1A).
Turning to the factors affecting the deterioration in the availability of external financing,
SMEs referred in particular to the worsening of the general economic outlook (35% in
net terms, up from 30%; see Chart 7). They also reported a further worsening in their
firm-specific outlook (13%, up from 7%). These demand-driven factors may reflect
higher risks related to the weakening economic activity, which banks take into account in
their lending policy. Such higher risks may also be reflected in SMEs’ somewhat less
positive assessment of their own capital and credit history (on balance 1% and 3%
respectively, down from 4% and 7% in H1 2011). These factors were however less
negative than in 2009, when the downturn in economic activity was much more severe.
However, supply restrictions in the provision of bank loans increased in the period from
October 2011 to March 2012. In net terms, 23% (compared with 20% in H1 2011) of the
SMEs pointed to a lower willingness of banks to provide a loan, which was close to
SMEs’ perception in 2009 (on balance 25% perceived a lower willingness at that time),
i.e. in the period after the Lehman bankruptcy.
Chart 7
CHANGE IN FACTORS HAVING AN IMPACT ON THE AVAILABILITY OF EXTERNAL FINANCING TO EURO AREA SMES (over the preceding six months; percentage of respondents)
‐54 ‐36 ‐15 ‐19 ‐30 ‐35 ‐27 ‐15 ‐2 ‐5 ‐7 ‐13 ‐10 ‐3 2 2 4 1 ‐6 1 6 7 7 3 ‐25 ‐25 ‐16 ‐16 ‐20 ‐23
0
20
40
60
80
100
H1 H2 H1 H2 H1 H2 H1 H2 H1 H2 H1 H2 H1 H2 H1 H2 H1 H2 H1 H2 H1 H2 H1 H2 H1 H2 H1 H2 H1 H2
2009 2010 2011 2009 2010 2011 2009 2010 2011 2009 2010 2011 2009 2010 2011
General economicoutlook
Firm‐specific outlook Firm's own capital Firm's credit history Willingness of banksto provide a loan
increased remained unchanged decreased not applicable don't know
Net percentages
Base: All SMEs. Note: See the note to Chart 1.

ECB Survey on the access to finance of small and medium-sized enterprises in the euro area April 2012
8
Large firms also attributed the deterioration in the availability of bank loans mostly to the
worsening general economic outlook (36% in net terms, up from 30% in H1 2011; see
Chart 7a in Annex 1A). In addition, they also perceived a lower willingness of banks to
provide a loan (15% in net terms, up from 8%), but less than SMEs did.
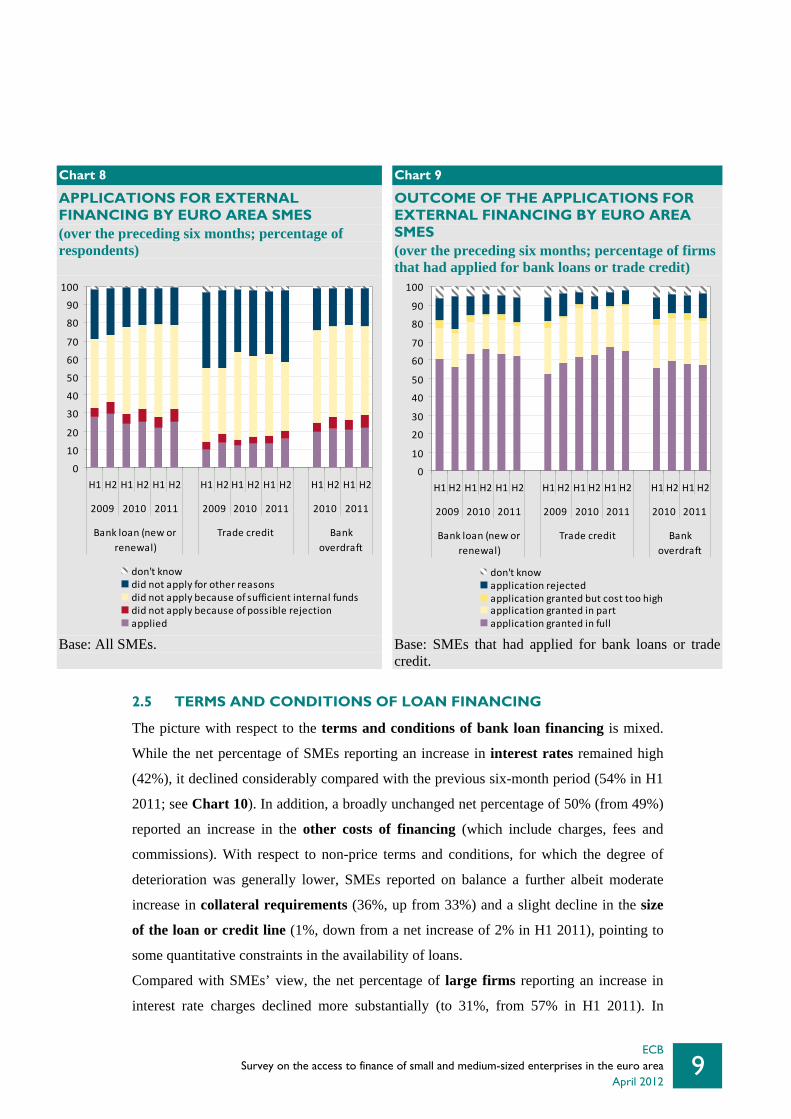
2.4 APPLICATIONS FOR EXTERNAL FINANCING AND THEIR
SUCCESS
Between October 2011 and March 2012, 25% of the SMEs applied for a bank loan (up
from 22% in H1 2011), while 47% (down from 51% in H1 2011) did not apply because of
sufficient internal funds (see Chart 8), broadly in line with the reported deteriorated profit
situation of SMEs (see Section 1). The percentage of firms not applying for a loan for fear
of rejection stayed broadly stable (at 7%, compared with 6% in the previous survey
round).
When asked about the actual outcome of their bank loan applications, 13% of the SMEs
reported that their application had been rejected (up from 10% in H1 2011; see Chart 9).
This is the highest percentage since the peak of 18% in the second half of 2009, thus
reflecting SMEs’ constraints in their access to bank loans in the period from October 2011
to March 2012. In particular micro firms (1 to 9 employees; see Annex 2) reported a
substantial rejection rate (20%, up from 15% in H1 2011). At the same time, 62%
(practically unchanged from 63% in H1 2011) of the SMEs reported that they had
received the full amount of their loan application (compared with the low of 56% in H2
2009). The deterioration was more pronounced for the loans which were only granted in
part, for which the percentage declined to 16%, from 18% in the previous survey round,
and was the lowest percentage since the start of the SAFE in 2009. This may reflect that
banks applied a very cautious lending policy in particular for riskier loans, accepting
applications only in part possibly related to lacking collateral. For bank overdrafts, SMEs
also reported an increase in the rejection rate (to 14%, from 10% in H1 2011).
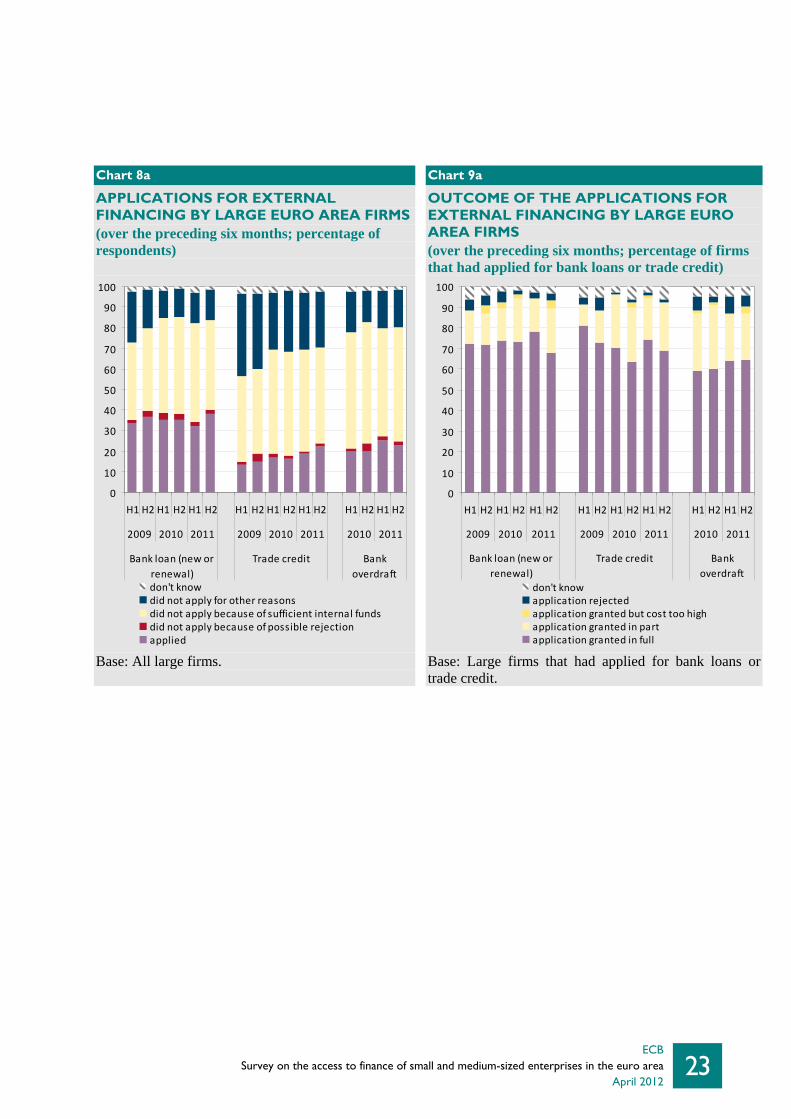
For large firms, the rejection rate for bank loans remained lower (unchanged at 3%; see
Chart 9a in Annex 1A). However, their success when applying for a bank loan declined
substantially, to 68% (down from 78%), which is the lowest value since the start of the
SAFE in 2009. By contrast, the percentage of bank loan applications only partly satisfied
increased (to 21%, from 16%). This also tends to confirm a possible increased scrutiny of
banks aiming at differentiating between loan applications.
ECB Survey on the access to finance of small and medium-sized enterprises in the euro area
April 2012
9
Chart 8
APPLICATIONS FOR EXTERNAL FINANCING BY EURO AREA SMES (over the preceding six months; percentage of respondents)
Chart 9
OUTCOME OF THE APPLICATIONS FOR EXTERNAL FINANCING BY EURO AREA SMES (over the preceding six months; percentage of firms that had applied for bank loans or trade credit)
0
10
20
30
40
50
60
70
80
90
100
H1 H2 H1 H2 H1 H2 H1 H2 H1 H2 H1 H2 H1 H2 H1 H2
2009 2010 2011 2009 2010 2011 2010 2011
Bank loan (new orrenewal)
Trade credit Bankoverdraft
don't knowdid not apply for other reasonsdid not apply because of sufficient internal fundsdid not apply because of possible rejectionapplied
0
10
20
30
40
50
60
70
80
90
100
H1 H2 H1 H2 H1 H2 H1 H2 H1 H2 H1 H2 H1 H2 H1 H2
2009 2010 2011 2009 2010 2011 2010 2011
Bank loan (new orrenewal)
Trade credit Bankoverdraft
don't knowapplication rejectedapplication granted but cost too highapplication granted in partapplication granted in full
Base: All SMEs.
Base: SMEs that had applied for bank loans or trade credit.
2.5 TERMS AND CONDITIONS OF LOAN FINANCING
The picture with respect to the terms and conditions of bank loan financing is mixed.
While the net percentage of SMEs reporting an increase in interest rates remained high
(42%), it declined considerably compared with the previous six-month period (54% in H1
2011; see Chart 10). In addition, a broadly unchanged net percentage of 50% (from 49%)
reported an increase in the other costs of financing (which include charges, fees and
commissions). With respect to non-price terms and conditions, for which the degree of
deterioration was generally lower, SMEs reported on balance a further albeit moderate
increase in collateral requirements (36%, up from 33%) and a slight decline in the size
of the loan or credit line (1%, down from a net increase of 2% in H1 2011), pointing to
some quantitative constraints in the availability of loans.
Compared with SMEs’ view, the net percentage of large firms reporting an increase in
interest rate charges declined more substantially (to 31%, from 57% in H1 2011). In

ECB Survey on the access to finance of small and medium-sized enterprises in the euro area April 2012
10
addition, compared with the previous survey period, large firms reported, on balance, a
smaller increase in collateral requirements (26%, down from 29% in H1 2011; see Chart
10a in Annex 1A).
Chart 10
CHANGE IN THE TERMS AND CONDITIONS OF BANK LOANS GRANTED TO EURO AREA SMES (over the preceding six months; net percentage of firms that had applied for bank loans)
5 7 17 44 54 42 33 35 43 48 49 50 ‐5 ‐7 ‐1 3 2 ‐1 32 38 34 30 33 36 32 34 29 27 30 31
0
20
40
60
80
100
H1 H2 H1 H2 H1 H2 H1 H2 H1 H2 H1 H2 H1 H2 H1 H2 H1 H2 H1 H2 H1 H2 H1 H2 H1 H2 H1 H2 H1 H2
2009 2010 2011 2009 2010 2011 2009 2010 2011 2009 2010 2011 2009 2010 2011
Level of interestrates
Level of the othercosts of financing
Available size of loanor credit line
Collateralrequirements
Other requirements
increased by the bank unchanged decreased by the bank don't know
Net percentages
Base: SMEs that had applied for bank loans or trade credit. Note: The net percentage is the difference between the percentage of firms reporting that the given factor has increased and the percentage reporting that it has decreased.
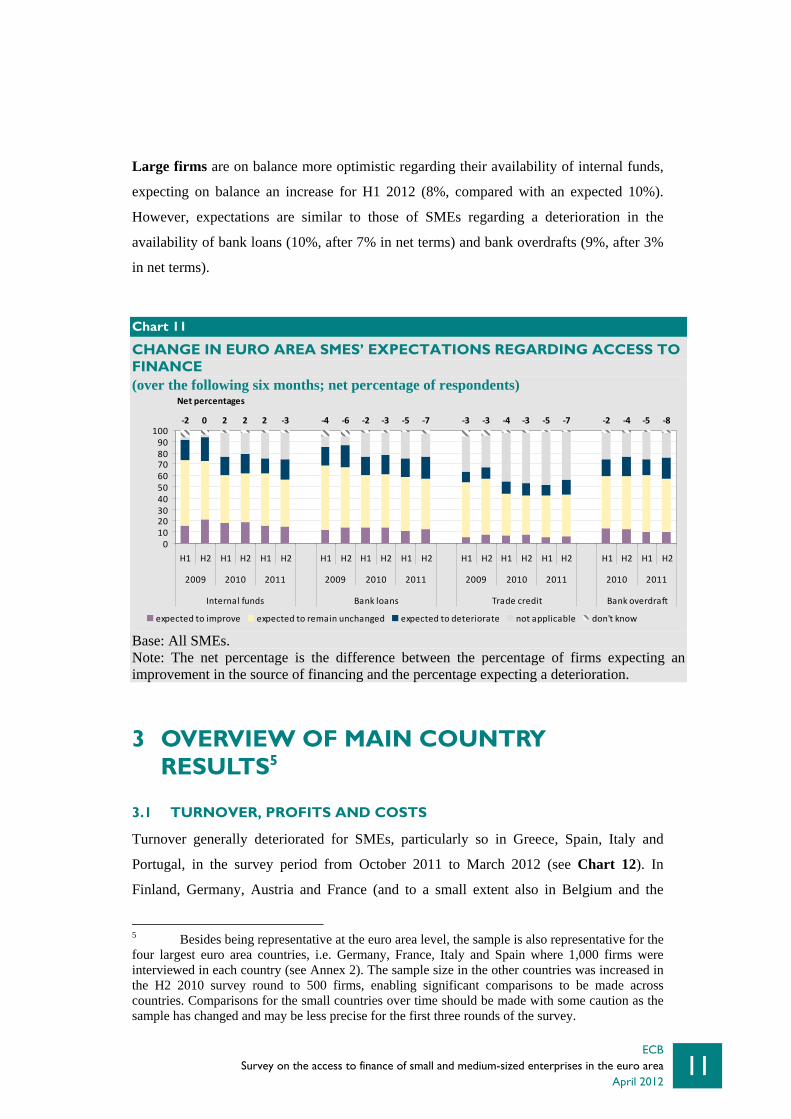
2.6 EXPECTATIONS REGARDING ACCESS TO FINANCE
For the coming six-month period (April to September 2012), SMEs expect, on balance, a
slight further deterioration of their access to bank loans and bank overdrafts (7% and 8%
respectively, compared with an expected 5% for both for the period from October 2011 to
March 2012; see Chart 11). In addition, while SMEs had expected on balance an
improvement of their internal funds for H2 2011 (2%), they now expect a deterioration for
the coming six months (on balance 3%), reflecting expectations of ongoing modest
economic activity in H1 2012. However, sector developments were heterogeneous. While
SMEs in the construction sector were most pessimistic regarding their internal funds (on
balance 14% expecting a deterioration), SMEs in the industry sector expected an
improvement of their internal funds in the coming six months (on balance 3%). In
addition, younger SMEs expected on balance a slight increase in their internal funds over
the coming six months, whereas older SMEs (10 years or older) were more pessimistic, on
balance expecting a decline.
ECB Survey on the access to finance of small and medium-sized enterprises in the euro area
April 2012
11
Large firms are on balance more optimistic regarding their availability of internal funds,
expecting on balance an increase for H1 2012 (8%, compared with an expected 10%).
However, expectations are similar to those of SMEs regarding a deterioration in the
availability of bank loans (10%, after 7% in net terms) and bank overdrafts (9%, after 3%
in net terms).
3 OVERVIEW OF MAIN COUNTRY RESULTS5
3.1 TURNOVER, PROFITS AND COSTS
Turnover generally deteriorated for SMEs, particularly so in Greece, Spain, Italy and
Portugal, in the survey period from October 2011 to March 2012 (see Chart 12). In
Finland, Germany, Austria and France (and to a small extent also in Belgium and the
5 Besides being representative at the euro area level, the sample is also representative for the four largest euro area countries, i.e. Germany, France, Italy and Spain where 1,000 firms were interviewed in each country (see Annex 2). The sample size in the other countries was increased in the H2 2010 survey round to 500 firms, enabling significant comparisons to be made across countries. Comparisons for the small countries over time should be made with some caution as the sample has changed and may be less precise for the first three rounds of the survey.
Chart 11
CHANGE IN EURO AREA SMES’ EXPECTATIONS REGARDING ACCESS TO FINANCE (over the following six months; net percentage of respondents)
‐2 ‐4 ‐6 ‐2 ‐3 ‐5 ‐7 ‐3 ‐3 ‐4 ‐3 ‐5 ‐7 ‐2 ‐4 ‐5 ‐80 2 2 2 ‐3
0102030405060708090
100
H1 H2 H1 H2 H1 H2 H1 H2 H1 H2 H1 H2 H1 H2 H1 H2 H1 H2 H1 H2 H1 H2
2009 2010 2011 2009 2010 2011 2009 2010 2011 2010 2011
Internal funds Bank loans Trade credit Bank overdraft
expected to improve expected to remain unchanged expected to deteriorate not applicable don't know
Net percentages
Base: All SMEs. Note: The net percentage is the difference between the percentage of firms expecting an improvement in the source of financing and the percentage expecting a deterioration.

ECB Survey on the access to finance of small and medium-sized enterprises in the euro area April 2012
12
Netherlands), SMEs reported increased turnover in net terms, but also in these countries
the percentages were lower than during spring and summer 2011.
Chart 12
CHANGE IN THE TURNOVER AND PROFIT OF SMES ACROSS EURO AREA COUNTRIES (over the preceding six months; net percentages)
‐100
‐80
‐60
‐40
‐20
0
20
40
60
'09 '10 '11 '09 '10 '11 '09 '10 '11 '09 '10 '11 '09 '10 '11 '09 '10 '11 '09 '10 '11 '09 '10 '11 '09 '10 '11 '09 '10 '11 '09 '10 '11 '09 '10 '11
BE DE IE GR ES FR IT NL AT PT FI euro area
Turnover Profi t
Base: All SMEs. Note: See the note to Chart 1.
Chart 13
CHANGE IN LABOUR AND OTHER COSTS (RAW MATERIAL AND OTHER INPUT COSTS) OF SMES ACROSS EURO AREA COUNTRIES (over the preceding six months; net percentages)
‐60
‐40
‐20
0
20
40
60
80
100
'09 '10 '11 '09 '10 '11 '09 '10 '11 '09 '10 '11 '09 '10 '11 '09 '10 '11 '09 '10 '11 '09 '10 '11 '09 '10 '11 '09 '10 '11 '09 '10 '11 '09 '10 '11
BE DE IE GR ES FR IT NL AT PT FI euroarea
Labour costs Other costs
Base: All SMEs. Note: See the note to Chart 1.
Together with the deterioration in turnover, SMEs in most euro area countries reported on
balance a decrease of profits (with the net percentages in Spain (-60%) and Greece (-

ECB Survey on the access to finance of small and medium-sized enterprises in the euro area
April 2012
13
71%) being the most negative). Conversely, in net terms, 8% of German and Finnish
SMEs pointed to persistent increases in their profits. In most countries, SMEs continued to
report on balance rising labour and other costs, with the exception of Greece where
labour costs were reported to be falling. The survey also suggests that labour cost
increases were more contained in Ireland, Spain and Portugal (see Chart 13).
According to the survey results, there are signs that the deleveraging process has
continued from October 2011 to March 2012, with the notable exception of Italian SMEs.
The deleveraging process for the SMEs would seem more pronounced in Germany, the
Netherlands and Finland, but would also seem present in most other countries with the
exception of Italy and Portugal. The Italian SMEs, in particular, report increasing their
leverage, with the net percentage jumping from 6% to 24% in this survey round. As recent
data on loan developments show a decline in small-sized loans extended by banks to
companies in Italy, one possible explanation of this result could be that this change has
more to do with the asset side of the SMEs’ balance sheet and a possible reduction in the
amount and/or value of assets available to SMEs (see Chart 14).
Chart 14
CHANGE IN THE RATIO OF DEBT TO TOTAL ASSETS OF SMES ACROSS EURO AREA COUNTRIES (over the preceding six months; net percentages)
‐30
‐20
‐10
0
10
20
30
'09 '10 '11 '09 '10 '11 '09 '10 '11 '09 '10 '11 '09 '10 '11 '09 '10 '11 '09 '10 '11 '09 '10 '11 '09 '10 '11 '09 '10 '11 '09 '10 '11 '09 '10 '11
BE DE IE GR ES FR IT NL AT PT FI euroarea
Base: All SMEs. Note: See the note to Chart 1.
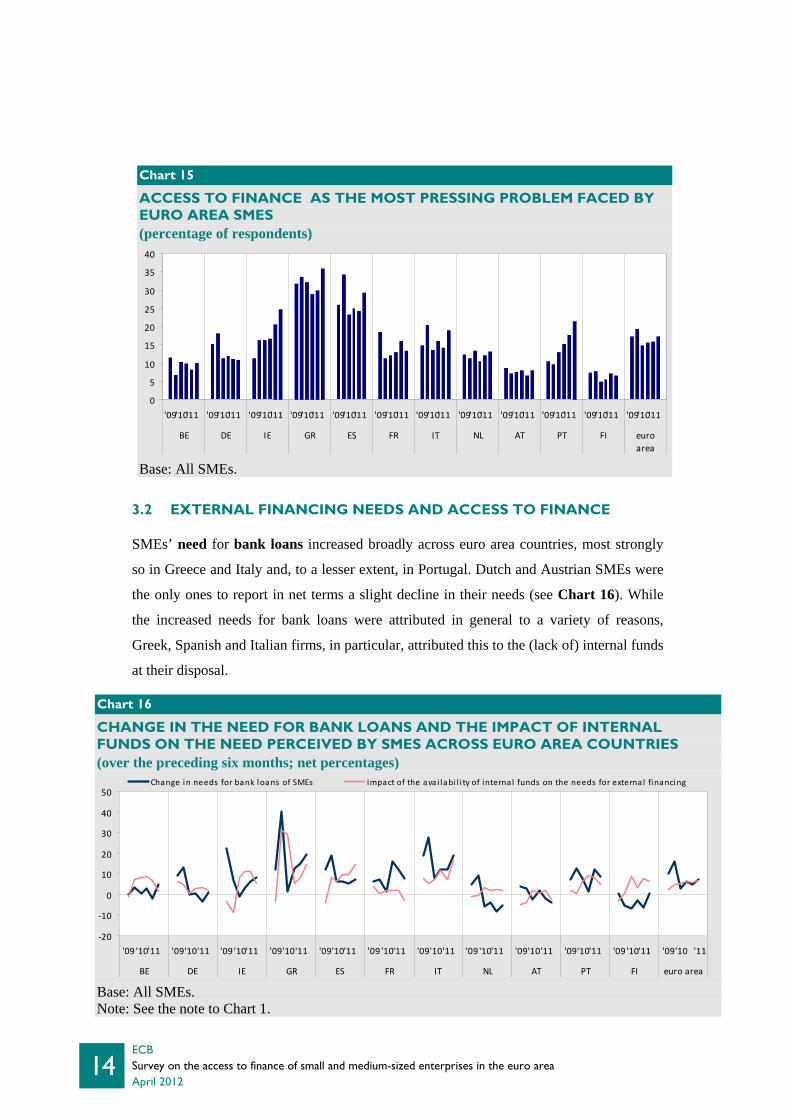
The importance of “Access to finance” increased as a concern for most euro area SMEs,
except for German, French and Finnish firms (see Chart 15). With respect to previous
survey rounds, the concern reached a peak, even higher than in H2 2009, in Greece,
Ireland and Portugal.
ECB Survey on the access to finance of small and medium-sized enterprises in the euro area April 2012
14
Chart 15
ACCESS TO FINANCE AS THE MOST PRESSING PROBLEM FACED BY EURO AREA SMES (percentage of respondents)
0
5
10
15
20
25
30
35
40
'09 '10 '11 '09 '10 '11 '09 '10 '11 '09 '10 '11 '09 '10 '11 '09 '10 '11 '09 '10 '11 '09 '10 '11 '09 '10 '11 '09 '10 '11 '09 '10 '11 '09 '10 '11
BE DE IE GR ES FR IT NL AT PT FI euroarea
Base: All SMEs. 3.2 EXTERNAL FINANCING NEEDS AND ACCESS TO FINANCE
SMEs’ need for bank loans increased broadly across euro area countries, most strongly
so in Greece and Italy and, to a lesser extent, in Portugal. Dutch and Austrian SMEs were
the only ones to report in net terms a slight decline in their needs (see Chart 16). While
the increased needs for bank loans were attributed in general to a variety of reasons,
Greek, Spanish and Italian firms, in particular, attributed this to the (lack of) internal funds
at their disposal.
Chart 16
CHANGE IN THE NEED FOR BANK LOANS AND THE IMPACT OF INTERNAL FUNDS ON THE NEED PERCEIVED BY SMES ACROSS EURO AREA COUNTRIES (over the preceding six months; net percentages)
‐20
‐10
0
10
20
30
40
50
'09 '10 '11 '09 '10 '11 '09 '10 '11 '09 '10 '11 '09 '10 '11 '09 '10 '11 '09 '10 '11 '09 '10 '11 '09 '10 '11 '09 '10 '11 '09 '10 '11 '09 '10 '11
BE DE IE GR ES FR IT NL AT PT FI euro area
Change in needs for bank loans of SMEs Impact of the ava i labi l i ty of internal funds on the needs for externa l financing
Base: All SMEs. Note: See the note to Chart 1.

ECB Survey on the access to finance of small and medium-sized enterprises in the euro area
April 2012
15
Turning to the supply of finance, survey results suggest a general deterioration of the
availability of bank credit for SMEs in most euro area countries, with the exception of
Germany (see Chart 17). This concerns the availability of both bank loans and bank
overdraft facilities. Also here there are differences, and the net percentage of SMEs
reporting a deterioration of bank loan availability is highest in Greece (45%), Ireland and
Portugal (both at 35%). Compared with the previous wave, bank credit availability would
seem to have worsened most in Belgium, Spain and Italy. Improvements can instead be
observed (starting from negative numbers) in Germany, the Netherlands, Austria and
Finland.
In most countries, SMEs perceived the general economic outlook to be the main factor
affecting bank loan availability. SMEs in Italy, Spain and Greece reported, as an
additional important explanatory factor, the deterioration of their firm-specific outlook
with respect to their sales and profitability or business plans. Pure supply-side factors (i.e.
the willingness of banks to provide loans) would seem to have worsened further across
countries, particularly in Italy if compared with the previous survey rounds. While
German and Finnish SMEs reported on balance that the willingness of banks to provide
loans has remained broadly unchanged or slightly improved, nearly 50% of the SMEs in
Greece and Spain perceived instead a further deterioration in banks’ willingness to
provide a loan.
Chart 17
CHANGE IN THE AVAILABILITY OF BANK LOANS AND OVERDRAFTS, AS PERCEIVED BY SMES ACROSS EURO AREA COUNTRIES (over the preceding six months; net percentages)
‐60
‐50
‐40
‐30
‐20
‐10
0
10
20
'09 '10 '11 '09 '10 '11 '09 '10 '11 '09 '10 '11 '09 '10 '11 '09 '10 '11 '09 '10 '11 '09 '10 '11 '09 '10 '11 '09 '10 '11 '09 '10 '11 '09 '10 '11
BE DE IE GR ES FR IT NL AT PT FI euroarea
Bank loan Bank overdraft
Base: All SMEs that applied for external financing. Note: See the note to Chart 1.

ECB Survey on the access to finance of small and medium-sized enterprises in the euro area April 2012
16
In line with the overall euro area picture, from October 2011 to March 2012, a slightly
larger percentage of SMEs across countries applied for a bank loan than in the previous
survey. Looking at the success of these applications, SMEs in Greece reported
considerably higher rejection rates (38%; see Chart 18) than SMEs in other countries.
Also SMEs in Italy (19%), Spain (16%), Ireland (17%) and Portugal (18%) reported
rejection rates higher than the euro area average. With respect to previous survey rounds,
rejection rates have increased or remained broadly unchanged in most countries with the
exception of Germany, the Netherlands and Ireland, where instead they declined.
Chart 18
OUTCOME OF APPLICATIONS FOR BANK LOANS BY SMES ACROSS EURO AREA COUNTRIES (over the preceding six months; percentage of firms that had applied for bank loans)
0
10
20
30
40
50
60
70
80
90
100
BE DE IE GR ES FR IT NL AT PT FI euroarea
Applied and got everything Applied but refused because cost too highApplied but was rejected Applied and got most of itApplied and got a limited part of it don't know
Firms that applied for a bank loan (new or renewal; excluding overdrafts and credit lines) (over the preceding six months; percentages)
BE DE IE GR ES FR IT NL AT PT FI euro area
H2 2011 29 20 22 24 30 32 28 13 22 17 16 25 Base: All SMEs that had applied for bank loans.

ECB Survey on the access to finance of small and medium-sized enterprises in the euro area
April 2012
17
Turning to the terms and conditions of bank financing (see Chart 19), in most countries
the net percentage of firms reporting an increase of lending rates and “other costs of
financing” was positive but lower than in the previous wave. Italy, Spain, Greece and
Portugal showed the highest net percentages of SMEs reporting an increase in interest
rates, while German SMEs reported in net terms a decline in interest rates charged by
banks. Also the increases in non-price terms and conditions (i.e. collateral requirements,
covenants and other guarantees) were generally perceived as significant.
Chart 19
CHANGE IN THE TERMS AND CONDITIONS OF BANK LOANS TO SMES ACROSS EURO AREA COUNTRIES (over the preceding six months; net percentages)
‐60
‐40
‐20
0
20
40
60
80
100
'09 '10 '11 '09 '10 '11 '09 '10 '11 '09 '10 '11 '09 '10 '11 '09 '10 '11 '09 '10 '11 '09 '10 '11 '09 '10 '11 '09 '10 '11 '09 '10 '11 '09 '10 '11
BE DE IE GR ES FR IT NL AT PT FI euroarea
Level of interest rates Level of other costs of financing
Base: All SMEs that applied for a bank loan. Note: See the note to Chart 1.
Regarding expectations of future developments in access to finance for the coming six
months, SMEs in most euro area countries were, in net terms, expecting a deterioration in
the availability of bank loans until the end of summer 2012 (see Chart 20). In Greece,
SMEs tended to foresee a further strong deterioration, while Germany and Finland stood
out as the two countries where the balance of opinion regarding the expected SME access
to bank loans was slightly tilted to the upside.

ECB Survey on the access to finance of small and medium-sized enterprises in the euro area April 2012
18
Chart 20
SMES’ EXPECTATIONS REGARDING ACCESS TO BANK LOANS ACROSS EURO AREA COUNTRIES (over the following six months; net percentages)
‐50
‐40
‐30
‐20
‐10
0
10
20
'09 '10 '11 '09 '10 '11 '09 '10 '11 '09 '10 '11 '09 '10 '11 '09 '10 '11 '09 '10 '11 '09 '10 '11 '09 '10 '11 '09 '10 '11 '09 '10 '11 '09 '10 '11
BE DE IE GR ES FR IT NL AT PT FI euro area
Base: All SMEs that had applied for external financing. Note: See the note to Chart 1.

ECB Survey on the access to finance of small and medium-sized enterprises in the euro area
April 2012
19
ANNEX 1: LARGE FIRMS – OVERVIEW OF THE SURVEY REPLIES
Chart 1a
CHANGE IN THE INCOME AND DEBT SITUATION OF LARGE EURO AREA FIRMS (over the preceding six months; net percentage of respondents)
‐40
‐20
0
20
40
60
80
'09 '10 '11 '09 '10 '11 '09 '10 '11 '09 '10 '11 '09 '10 '11 '09 '10 '11
Turnover Labour costs Other costs Net interestexpenses
Profit Debt‐to‐assetsratio
Base: All large firms. Note: The net percentage is the difference between the percentage of firms reporting an increase for a given factor and that reporting a decrease.

ECB Survey on the access to finance of small and medium-sized enterprises in the euro area April 2012
20
Chart 2a
THE MOST PRESSING PROBLEM FACED BY LARGE EURO AREA FIRMS (percentage of respondents)
0
5
10
15
20
25
Findingcustomers
Competition Access tofinance
Costs ofproductionor labour
Availabilityof skilledstaff or
experiencedmanagers
Regulation Other Don't know
H2 2009 H1 2010 H2 2010 2011 H1 2011 H2
Base: All large firms. Note: The results for H1 2009 are not comparable and therefore not shown.
Chart 3a
SOURCES OF EXTERNAL FINANCING OF LARGE EURO AREA FIRMS (over the preceding six months; percentage of respondents)
0
10
20
30
40
50
60
70
80
Internal funds Overdrafts andcredit lines
Bank loans Trade credit Leasing, hirepurchase andfactoring
H1 2009 H2 2009 H1 2010 H2 2010 2011 H1 2011 H2
Base: All large firms.

ECB Survey on the access to finance of small and medium-sized enterprises in the euro area
April 2012
21
Chart 4a
CHANGE IN THE EXTERNAL FINANCING NEEDS OF LARGE EURO AREA FIRMS (over the preceding six months; percentage of respondents)
Chart 5a
CHANGE IN FACTORS AFFECTING THE EXTERNAL FINANCING NEEDS OF LARGE EURO AREA FIRMS (over the preceding six months; percentage of respondents)
5 6 7 1 6 9 0 ‐2 4 7 9 8 ‐1 ‐1 7 5
01020
3040506070
8090
100
H1 H2 H1 H2 H1 H2 H1 H2 H1 H2 H1 H2 H1 H2 H1 H2
2009 2010 2011 2009 2010 2011 2010 2011
Bank loans Trade credit Bankoverdraft
increased remained unchanged decreasednot applicable don't know
Net percentages
9 19 17 27 24 24 4 3 12 17 22 19 ‐2 2 4 2 6 5
0102030405060708090
100
H1 H2 H1 H2 H1 H2 H1 H2 H1 H2 H1 H2 H1 H2 H1 H2 H1 H2
2009 2010 2011 2009 2010 2011 2009 2010 2011
Fixed investment Inventory andworking capital
Availability ofinternal funds
increased needs no impact on needsdecreased needs not relevant, did not occurdon't know
Net percentages
Base: All large firms. Note: See the note to Chart 1a.
Base: All large firms. Note: See the note to Chart 1a.
Chart 6a
CHANGE IN THE AVAILABILITY OF EXTERNAL FINANCING FOR LARGE EURO AREA FIRMS (over the preceding six months; percentage of respondents)
‐41 ‐29 8 6 ‐10 ‐4 ‐15 ‐13 5 ‐1 ‐4 ‐4 ‐4 2 ‐9 ‐12
0102030405060708090
100
H1 H2 H1 H2 H1 H2 H1 H2 H1 H2 H1 H2 H1 H2 H1 H2
2009 2010 2011 2009 2010 2011 2010 2011
Bank loans Trade credit Bank overdraft
increased remained unchanged decreased not applicable don't know
Net percentages
Base: Large firms that had applied for external financing. Note: See the note to Chart 1a.

ECB Survey on the access to finance of small and medium-sized enterprises in the euro area April 2012
22
Chart 7a
CHANGE IN FACTORS HAVING AN IMPACT ON THE AVAILABILITY OF EXTERNAL FINANCING TO LARGE EURO AREA FIRMS (over the preceding six months; percentage of respondents)
‐66 ‐30 16 12 ‐30 ‐36 ‐34 ‐8 29 25 1 ‐5 ‐3 3 29 33 28 25 2 10 16 24 11 15 ‐20 ‐14 5 4 ‐8 ‐15
0102030405060708090
100
H1 H2 H1 H2 H1 H2 H1 H2 H1 H2 H1 H2 H1 H2 H1 H2 H1 H2 H1 H2 H1 H2 H1 H2 H1 H2 H1 H2 H1 H2
2009 2010 2011 2009 2010 2011 2009 2010 2011 2009 2010 2011 2009 2010 2011
General economicoutlook
Firm‐specificoutlook
Firm's own capital Firm's credit history Willingness of banksto provide a loan
increased remained unchanged decreased not applicable don't know
Net percentages
Base: All large firms. Note: See the note to Chart 1a.
ECB Survey on the access to finance of small and medium-sized enterprises in the euro area
April 2012
23
Chart 8a
APPLICATIONS FOR EXTERNAL FINANCING BY LARGE EURO AREA FIRMS (over the preceding six months; percentage of respondents)
Chart 9a
OUTCOME OF THE APPLICATIONS FOR EXTERNAL FINANCING BY LARGE EURO AREA FIRMS (over the preceding six months; percentage of firms that had applied for bank loans or trade credit)
0
10
20
30
40
50
60
70
80
90
100
H1 H2 H1 H2 H1 H2 H1 H2 H1 H2 H1 H2 H1 H2 H1 H2
2009 2010 2011 2009 2010 2011 2010 2011
Bank loan (new orrenewal)
Trade credit Bankoverdraft
don't knowdid not apply for other reasonsdid not apply because of sufficient internal fundsdid not apply because of possible rejectionapplied
0
10
20
30
40
50
60
70
80
90
100
H1 H2 H1 H2 H1 H2 H1 H2 H1 H2 H1 H2 H1 H2 H1 H2
2009 2010 2011 2009 2010 2011 2010 2011
Bank loan (new orrenewal)
Trade credit Bankoverdraft
don't knowapplication rejectedapplication granted but cost too highapplication granted in partapplication granted in full
Base: All large firms.
Base: Large firms that had applied for bank loans or trade credit.

ECB Survey on the access to finance of small and medium-sized enterprises in the euro area April 2012
24
Chart 10a
CHANGE IN THE TERMS AND CONDITIONS OF BANK LOANS GRANTED TO LARGE EURO AREA FIRMS (over the preceding six months; net percentage of firms that had applied for bank loans)
11 ‐9 6 42 57 31 38 39 30 37 39 40 6 1 15 8 15 8 27 33 30 29 29 26 37 36 27 24 28 30
0
20
40
60
80
100
H1 H2 H1 H2 H1 H2 H1 H2 H1 H2 H1 H2 H1 H2 H1 H2 H1 H2 H1 H2 H1 H2 H1 H2 H1 H2 H1 H2 H1 H2
2009 2010 2011 2009 2010 2011 2009 2010 2011 2009 2010 2011 2009 2010 2011
Level of interestrates
Level of the othercosts of financing
Available size of loanor credit line
Collateralrequirements
Other requirements
increased by the bank unchanged decreased by the bank don't know
Net percentages
Base: Large firms that had applied for bank loans or trade credit. Note: The net percentage is the difference between the percentage of firms reporting that the given factor has increased and the percentage reporting that it has decreased.
Chart 11a
CHANGE IN LARGE EURO AREA FIRMS’ EXPECTATIONS REGARDING ACCESS TO FINANCE (over the following six months; net percentage of respondents)
4 8 20 23 10 8 0 0 15 8 ‐10 2 2 4 ‐6 6 8 ‐9‐7 ‐1 ‐4 ‐3
0102030405060708090
100
H1 H2 H1 H2 H1 H2 H1 H2 H1 H2 H1 H2 H1 H2 H1 H2 H1 H2 H1 H2 H1 H2
2009 2010 2011 2009 2010 2011 2009 2010 2011 2010 2011
Internal funds Bank loans Trade credit Bank overdraft
expected to improve expected to remain unchanged expected to deteriorate not applicable don't know
Net percentages
Base: All large firms. Note: The net percentage is the difference between the percentage of firms expecting an improvement in the source of financing and the percentage expecting a deterioration.

ECB Survey on the access to finance of small and medium-sized enterprises in the euro area
April 2012
25
ANNEX 2: METHODOLOGICAL INFORMATION ON THE SURVEY AND GENERAL CHARACTERISTICS OF THE FIRMS IN THE SAMPLE
This annex presents an overview of the methodology of the survey and the general
characteristics of the euro area firms that participated in this survey.
BACKGROUND
The data presented in this report were collected through a survey of companies in the euro
area. The first two survey rounds were carried out by Gallup, while the following rounds
were carried out by IPSOS MORI, in cooperation with the IPSOS network of national
research agencies in the various Member States. To the best of our knowledge, there were
no breaks attributable to the change of provider. Some changes in the questionnaire (for
instance, the change to the wording of “internal funds” and “equity”, and additional
questions on bank overdrafts) may have caused a break in the series between the H2 2009
and H1 2010 rounds.
The survey interviews for this round were conducted between 29 February and 29 March
2012.
SAMPLE SELECTION
The companies in the sample were selected randomly from the Dun & Bradstreet database
of firms. The sample was stratified by firm size class, economic activity and country. The
number of firms in each of these strata of the sample was adjusted to increase the accuracy
of the survey across activities and size classes. For example, the proportion of small firms
selected for the sample was higher than their economic weight. The results were then
corrected using the appropriate weights (as described below).
The total euro area sample size was 7,511 firms, of which 6,969 had fewer than 250
employees.
As regards the stratification by firm size class, the sample was constructed to offer the
same precision for micro (1 to 9 employees), small (10 to 49 employees) and medium-
sized (50 to 249 employees) firms. In addition, a sample of large firms (250 or more
employees) was included in order to be able to compare developments for SMEs with
those for large firms.
ECB Survey on the access to finance of small and medium-sized enterprises in the euro area April 2012
26
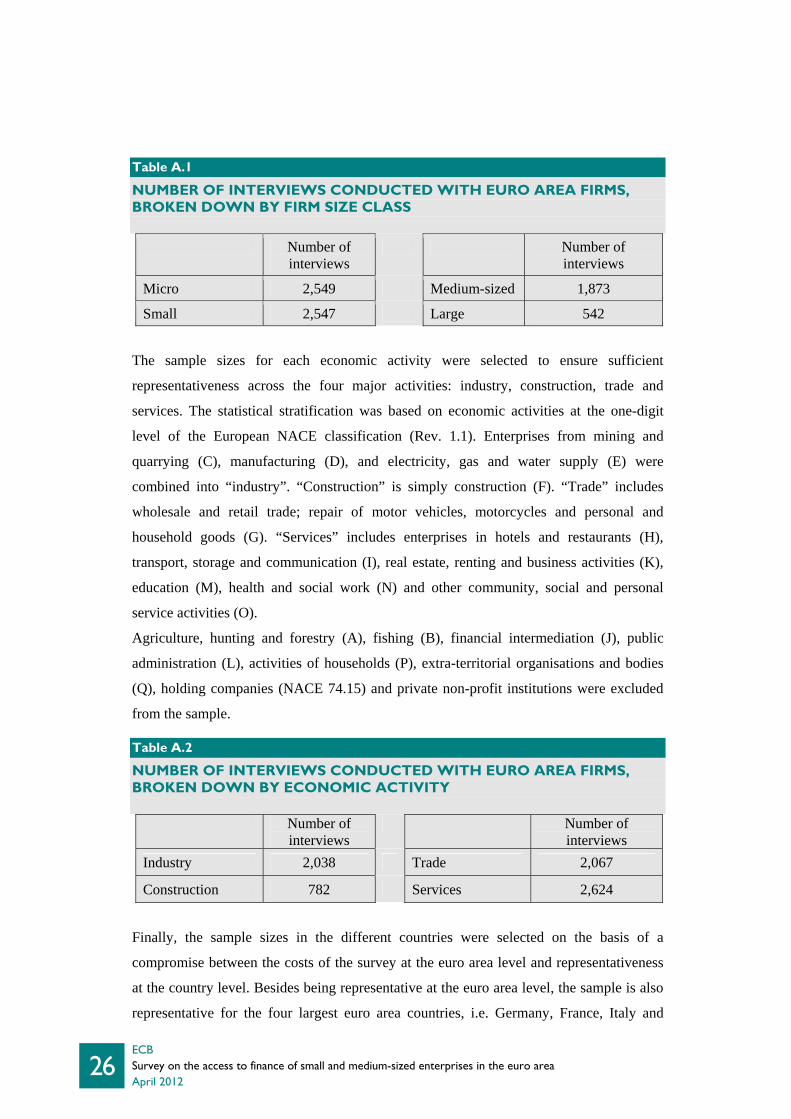
Table A.1
NUMBER OF INTERVIEWS CONDUCTED WITH EURO AREA FIRMS, BROKEN DOWN BY FIRM SIZE CLASS
Number of interviews
Number of interviews
Micro 2,549 Medium-sized 1,873
Small 2,547 Large 542
The sample sizes for each economic activity were selected to ensure sufficient
representativeness across the four major activities: industry, construction, trade and
services. The statistical stratification was based on economic activities at the one-digit
level of the European NACE classification (Rev. 1.1). Enterprises from mining and
quarrying (C), manufacturing (D), and electricity, gas and water supply (E) were
combined into “industry”. “Construction” is simply construction (F). “Trade” includes
wholesale and retail trade; repair of motor vehicles, motorcycles and personal and
household goods (G). “Services” includes enterprises in hotels and restaurants (H),
transport, storage and communication (I), real estate, renting and business activities (K),
education (M), health and social work (N) and other community, social and personal
service activities (O).
Agriculture, hunting and forestry (A), fishing (B), financial intermediation (J), public
administration (L), activities of households (P), extra-territorial organisations and bodies
(Q), holding companies (NACE 74.15) and private non-profit institutions were excluded
from the sample.
Table A.2
NUMBER OF INTERVIEWS CONDUCTED WITH EURO AREA FIRMS, BROKEN DOWN BY ECONOMIC ACTIVITY
Number of interviews
Number of interviews
Industry 2,038 Trade 2,067
Construction 782 Services 2,624
Finally, the sample sizes in the different countries were selected on the basis of a
compromise between the costs of the survey at the euro area level and representativeness
at the country level. Besides being representative at the euro area level, the sample is also
representative for the four largest euro area countries, i.e. Germany, France, Italy and

ECB Survey on the access to finance of small and medium-sized enterprises in the euro area
April 2012
27
Spain (see the section entitled “Weighting” below for information on the weights used).
The sample size in the seven other euro area countries that are included in the survey
every six months (Belgium, Ireland, Greece, the Netherlands, Austria, Portugal and
Finland) was increased in the H2 2010 round to 500 firms in each country, enabling some
significant results to be drawn from these countries. The six smallest countries in the euro
area (Estonia, Cyprus, Luxembourg, Malta, Slovenia and Slovakia) were included in the
sample. Since they represent less than 3% of the total number of employees in the euro
area, this had only a very marginal impact on the results for the euro area as a whole.
In terms of euro area countries, the sample structure for this survey round was as follows:
Table A.3
NUMBER OF INTERVIEWS CONDUCTED WITH EURO AREA FIRMS, BROKEN DOWN BY COUNTRY Number of interviews Number of interviews Belgium 503 Italy 1,000 Germany 1,000 Netherlands 500 Ireland 500 Austria 500 Greece 500 Portugal 503 Spain 1,000 Finland 500 France 1,005
FIELDWORK
All interviews were conducted by telephone (CATI). The person interviewed in each
company was a top-level executive (general manager, financial director or chief
accountant).
QUESTIONNAIRE
The questionnaire used for the survey is available on the ECB’s website. It was translated
into the respective languages for the purposes of the survey. In this round, as is the case
every two years, it included additional questions on loan financing, as well as growth
expectations and perceived obstacles to growth aspirations.
WEIGHTING
In order to restore the modified proportions, with regard to company size and economic
activity (see the section “Sample selection” above), calibrated weights were used. Since
the economic weight of the companies varies according to the size of the company, there
are two main classes of weights which can be used: (i) weights that restore the proportions

ECB Survey on the access to finance of small and medium-sized enterprises in the euro area April 2012
28
of the number of firms in each size class, economic activity and country; and (ii) weights
that restore the proportions of the economic weight of each size class, economic activity
and country. In this report, the second set of weights is used, as the objective is to measure
the effect of access to finance on economic variables. The number of persons employed is
used as a proxy for economic weight.6
The calibration targets were derived from the latest figures of Eurostat’s Structural
Business Statistics in terms of the number of persons employed, by economic activity, size
class and country, with figures from national accounts and from different country-specific
registers to cover for activities not included in the Structural Business Statistics
regulations, as well as from figures from the SME performance review, prepared by EIM
for the European Commission.
DESCRIPTIVE STATISTICS OF THE SAMPLE OF FIRMS
Chart A.1
BREAKDOWN OF FIRMS INTO SIZE CLASSES
Chart A.2
BREAKDOWN OF FIRMS ACROSS COUNTRIES
7%
34%
34%25%
large firms
medium-sized firms
small firms
micro firms
Sample size: 7,511
Belgium7%
Germany13%
Ireland7%
Greece7%
Spain13%France
13%
Italy13%
Netherlands7%
Austria7%
Portugal7%
Finland7%
Sample size: 7,511
Note: Firms have been classified according to size in terms of the number of employees:
micro firms have between 1 and 9 employees, small firms between 10 and 49, medium-
sized firms between 50 and 249, and large firms have 250 or more.
6 According to official statistics, 92% of firms in the euro area are micro firms (with 1 to 9 employees), 7% are small firms, 1% are medium-sized firms and 0.2% are large firms. However, in terms of economic weight, as measured by the number of persons employed, micro firms represent 31%, small firms 22%, medium-sized firms 16% and large firms 30% of all firms.

ECB Survey on the access to finance of small and medium-sized enterprises in the euro area
April 2012
29
Chart A.3
BREAKDOWN OF FIRMS ACROSS ECONOMIC ACTIVITIES
Chart A.4
BREAKDOWN OF FIRMS BY FIRM AGE
35%
10%
27%
28%construction
industry
services
trade
Sample size: 7,511
12%
75%
5%6% more than 10
yearsbetween 5 and 10yearsbetween 2 and 4yearsless than 2 years
don't know/ noanswer
Sample size: 7,511
Chart A.5
BREAKDOWN OF FIRMS ACCORDING TO OWNERSHIP
57%
2%
2%4%
24%
12%
listed on the stockmarket
family orentrepreneurs
other firms or businessassociates
venture capital firms orbusiness angels
one natural persononly
other
Sample size: 7,511