Embed Size (px)
Citation preview

LIFE – DairyClim - September 2017 LIFE14 CCM/BE/001187 __________________________________________________________________________________
Survey on grasslands loss and proportion
of grazed areas

LIFE – DairyClim - September 2017 LIFE14 CCM/BE/001187 __________________________________________________________________________________
1
Table of contents 1 Introduction .......................................................................................................................... 2
2 Grassland development in the three countries ........................................................................ 4
Belgium ........................................................................................................... 4
Denmark ......................................................................................................... 4
Luxembourg .................................................................................................... 5
3 Grassland practices ................................................................................................................ 6
3.1 Materials & Methods...................................................................................................... 6
3.1.1 Statistical analysis ................................................................................................... 6
3.2 Results........................................................................................................................... 7
3.2.1 Overview of the farms from the three countries ....................................................... 7
Description of grazing practices for lactating cows ............................................11
Information from grazing farms .......................................................................11
3.2.2 Permanent and temporary grasslands .....................................................................13
Temporary grassland.......................................................................................13
Permanent grassland ......................................................................................15
Comparison of temporary and permanent grasslands .......................................16
Comparison of grazing farms with no-grazing ones ...........................................16
3.2.3 Opinions about grazing...........................................................................................18
Reasons for stopping grazing ...........................................................................21
Reasons for keeping grazing ............................................................................23
Future of grazing.............................................................................................23
3.2.4 Life Cycle Assessment (LCA) - grassland ...................................................................24
3.3 Discussion .....................................................................................................................27
3.3.1 Comparison with official figures ..............................................................................27
Wallonia.........................................................................................................27
Denmark ........................................................................................................27
Luxembourg ...................................................................................................28
Comparison between the three countries ........................................................29
3.4 Conclusion and summary for policy makers ....................................................................30
3.5 References ....................................................................................................................31

LIFE – DairyClim - September 2017 LIFE14 CCM/BE/001187 __________________________________________________________________________________
2
1 Introduction
The DairyCLIM Life Project is a European Life project started on 1.10.2015 for 48 months. The general
aim of the project is the development of feeding strategies to decrease greenhouse gases emissions
and the estimation of the carbon footprint of dairy farming in Belgium, Luxembourg and Denmark. In
fact, agriculture is usually considered responsible for 14% of the production of greenhouse gases (GHG)
as described in the report from FAO by Tubiello et al. (2014). Out of these, methane mainly produced
by dairy cows represents 76% of total emissions. However, the particular digestive tract with the
presence of the rumen allows the ruminants to convert forage even of poor quality into milk and meat.
For that reason, cattle are important for the global production of protein and fat, especially in countries
where climate is fit for a high proportion of grasslands. Thus, the objective of the Life Dairyclim project
is to highlight the importance of grasslands in dairy farming as potential carbon si nk contributing to
the mitigation of GHG emissions from the agricultural sector. It aims also to increase grazing practice.
The role of grassland in climate change is important as they are generally considered contributing to
GHG mitigation by playing a role of carbon sink (Soussana et al., 2010). The mitigation potential of
grassland could be influenced by type of grassland, utilization including grazing intensity and rotational
use of pastures. Furthermore, grazing has demonstrated several advantages as improving animal
welfare (Burow et al., 2011), decreasing production costs (Dillon et al., 2005), preserving the landscape
and the biodiversity (EAA, 2016) or having a good image on the consumer (De Olde et al., 2016).
It seemed thus useful as part of the project to survey the dairy sector of the three countries to get an
overview of the dairy farms, the role of grassland and grazing practices, of the perceptions and of the
expectations of the farmers about grazing. Before presenting the results of this s urvey, a short
introduction based on statistic information will present data about grassland – and development in
the areas in the three countries.
Grazing is decreasing in most of European countries. A survey about grazing practices was published
during the Grass day about the “Future of Grazing” on 7/9/2014. The Table 1 shows the figures
provided by the participating countries.

LIFE – DairyClim - September 2017 LIFE14 CCM/BE/001187 __________________________________________________________________________________
3
Table 1. Grazing practices in European countries (Grass day, EGF 2014, Aberyshtmith)
Country Year
reference
% of cattle grazing
Trend Comments
Norway 2016 90 %
Slightly decreasing
n.a.
Sweden 2016 100 % n.a.1 Welfare legislation – 6 weeks to 4 months outside
Finland 2016 70 % n.a. Cows in tie stalls have to be outdoors for 60 days between 1/5 till 30/9
Ireland 2016 95-100 % Stable n.a.
United
Kingdom 2016 80-90 % n.a.
95 % in Nothern Ireland 70% in Wales
The
Netherlands 2014 70 % n.a. Premium to support grazing
Belgium 2016 60-85%; 90% in
Wallonia
Decreasing in Flanders
n.a.
Luxembourg 2016 75% Slightly decreasing
73% in 2014 – 75-85 % Free access in 2010
France 2016 75-95 % 90 % in 2014 – 90-95 % in 2011
n.a.
Switzerland 2016 80-97 % 75-90% in 2014 85-100 % in 2011
n.a.
Denmark 2016 25 % Decreasing 25-30% in 2014
30-35 % in 2011
Germany 2016 10-50 % Decreasing 42 % of dairy cows grazing in 2009
Austria 2016 40 % Stable 25 % in 2011
Poland 2016 20 % Quickly decreasing
n.a.
Estonia 2011 35 % n.a. n.a.
Lithuania 2014 50-70 % n.a. n.a.
Czech Republic 2016 3% Deep decrease 20 % in 2010
Bosnia and
Herzegovina 2011 5% n.a. n.a.
Slovenia 2016 20 % Slightly decreasing
25 % in 2010
Hungary 2016 2-3 % n.a. Grazing dairy cows
Bulgaria 2016 50 % dairy
cows n.a. Only in small farms
1n.a. : not applicable
LIFE – DairyClim - September 2017 LIFE14 CCM/BE/001187 __________________________________________________________________________________
4
2 Grassland development in the three countries
Belgium
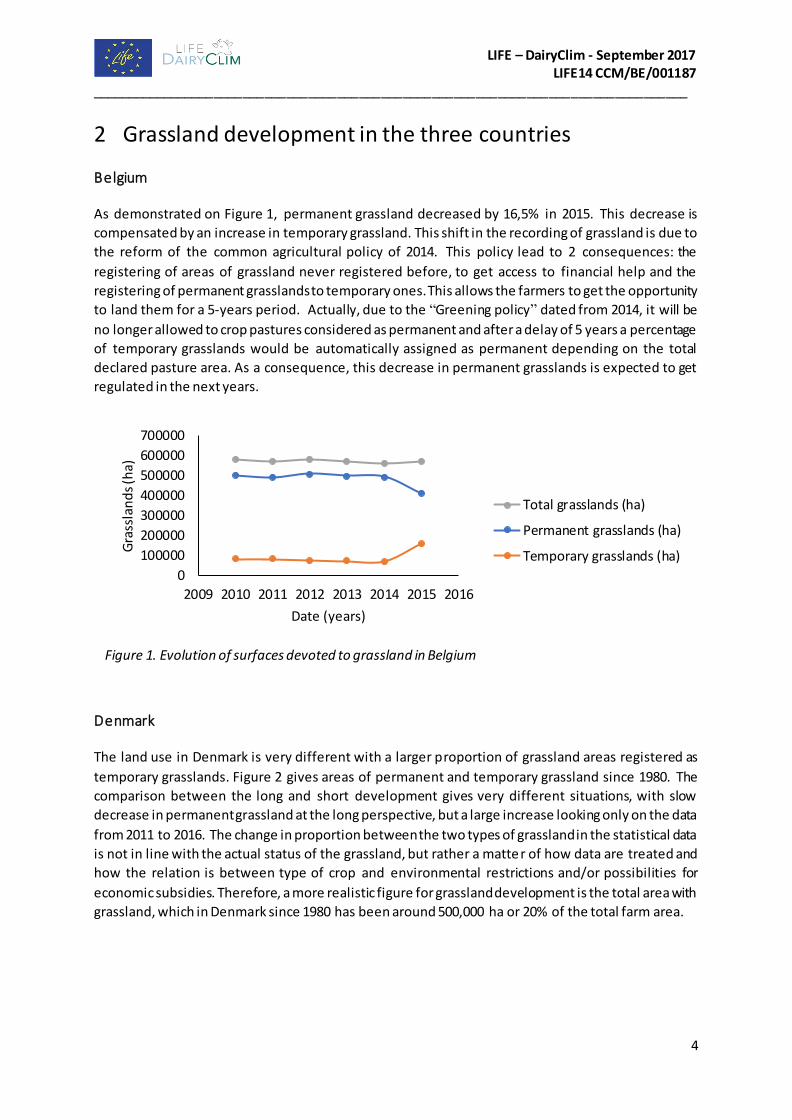
As demonstrated on Figure 1, permanent grassland decreased by 16,5% in 2015. This decrease is
compensated by an increase in temporary grassland. This shift in the recording of grassland is due to
the reform of the common agricultural policy of 2014. This policy lead to 2 consequences: the
registering of areas of grassland never registered before, to get access to financial help and the
registering of permanent grasslands to temporary ones. This allows the farmers to get the opportunity
to land them for a 5-years period. Actually, due to the “Greening policy” dated from 2014, it will be
no longer allowed to crop pastures considered as permanent and after a delay of 5 years a percentage
of temporary grasslands would be automatically assigned as permanent depending on the total
declared pasture area. As a consequence, this decrease in permanent grasslands is expected to get
regulated in the next years.
Denmark
The land use in Denmark is very different with a larger proportion of grassland areas registered as
temporary grasslands. Figure 2 gives areas of permanent and temporary grassland since 1980. The
comparison between the long and short development gives very different situations, with slow
decrease in permanent grassland at the long perspective, but a large increase looking only on the data
from 2011 to 2016. The change in proportion between the two types of grassland in the statistical data
is not in line with the actual status of the grassland, but rather a matter of how data are treated and
how the relation is between type of crop and environmental restrictions and/or possibilities for
economic subsidies. Therefore, a more realistic figure for grassland development is the total area with
grassland, which in Denmark since 1980 has been around 500,000 ha or 20% of the total farm area.
0
100000
200000
300000
400000
500000
600000
700000
2009 2010 2011 2012 2013 2014 2015 2016
Gra
ssla
nd
s (h
a)
Date (years)
Total grasslands (ha)
Permanent grasslands (ha)
Temporary grasslands (ha)
Figure 1. Evolution of surfaces devoted to grassland in Belgium

LIFE – DairyClim - September 2017 LIFE14 CCM/BE/001187 __________________________________________________________________________________
5
Luxembourg
In Luxembourg, few changes in permanent and temporary grassland areas are noticed. The decrease
in temporary grassland areas corresponds to an increase in permanent grassland (Figure 3). It
highlights the efficiency of Luxembourg policies for grassland conservation.
Figure 2. Evolution of surfaces devoted to grassland in Denmark.
Figure 3. Evolution of surfaces devoted to grassland in Luxembourg
0
10000
20000
30000
40000
50000
60000
70000
80000
90000
2009 2010 2011 2012 2013 2014 2015 2016
Gra
ssla
nd
(ha)
Date (years)
Total grassland (ha)
Permanent grassland (ha)
Temporary grassland (ha)
LIFE – DairyClim - September 2017 LIFE14 CCM/BE/001187 __________________________________________________________________________________
6
3 Grassland practices
3.1 Materials & Methods
Eighteen questions about grazing were formulated focusing on the description of the farm, of grazing
practices and of perceptions and expectations of farmers. In Belgium, hard copies of questionnaires
were sent to the Walloon dairy producers by the “Comité du Lait” on 10 December 2015.
Questionnaires and information about the survey and the project were also disseminated in
conferences for dairy farmers and by the internet. The questionnaires received after 31 March 2016
were not taken into consideration.
In parallel, the survey was available on the website of the project. The Luxembourg team expected the
farmers to fill in the form through this way. However, many farmers from Luxembourg expressed the
desire to be accompanied by an advisor. Thus, the decision was taken at the end of January 2016 to
provide the CONVIS advisors from the milk control service with hard copies during a 6 weeks period so
that they could ask the farmers personally to participate at the survey. Finally , 62 completed forms
were received at the end of March 2016.
In Denmark, a mail with a short introduction and a link to questionnaire was sent – by ARLA coop
Denmark - to 2550 dairy farmers delivering milk to ARLA Denmark, representing 80% of all the dairy
farmers in Denmark.
3.1.1 Statistical analysis
The statistical analyses were performed using SAS (SAS Institute, 2002). Descriptive procedures were
used (proc univariate – proc means) for the analysis of numeric values. The proc freq statement was
used for the analysis of the categorical variables. Chi-square test and Fisher- test were used to test
equality of proportions. Cell chi-square allowed to determine the importance of the participation of
each cell to the global F-value. On data about permanent and temporary grasslands, after descriptive
analysis by proc univariate and proc means, further analysis was performed using a GLM procedure,
for surface, production, use of organic and mineral fertilizer, testing differences between countries,
lands, systems and interactions between these factors.

LIFE – DairyClim - September 2017 LIFE14 CCM/BE/001187 __________________________________________________________________________________
7
3.2 Results
The number of received filled forms per country is presented in Table 1. The mean response rate has
reached 23.9%. From this total, some questionnaires presenting obvious mistakes or an insufficient
rate of answers were not considered.
A total of 1439 filled forms was thus analysed. A global analysis was firstly undertaken then each
country presented a more specific report.
Table 2. Number of questionnaires sent, collected and estimation of answer rates per country and in total.
Country Sent forms Filled forms Used forms Answer rate
Wallonia 3152 1016 1004 32,2 %
Denmark 2550 386 375 15,1 %
Luxembourg 430 62 60 14,4 %
Total 6132 1464 1439 23,9 %
3.2.1 Overview of the farms from the three countries
The first question of the questionnaire required the farmers to specify their system of exploi tation.
Out of the 1439 collected forms, 16 did not mention the exploitation type (1%).
37%
47%
37%
21%
11%*
27%
14%*
38%*
15%
28%*
4%*
21%
0% 20% 40% 60% 80% 100%
BE
DK
LU
Milk
Mik & Meat
Milk & Crops
Milk, Meat & Crops
Figure 4. Activities in the dairy farms from each country. Statistical differences (p<0,05) are
highlighted by “*”. BE is Belgium. DK is Denmark. LU is Luxembourg

LIFE – DairyClim - September 2017 LIFE14 CCM/BE/001187 __________________________________________________________________________________
8
Not surprisingly, the more represented was the conventional system (1287 forms – 89%) while 136
organic farms were recorded (9,6%). Belgium and Denmark presented a similar proportion of organic
farming reaching around 10% (BE: 9,2% - DK: 11%). In Luxembourg, only 3 farms were included in
organic system (3%) but it must be assumed that 2 other farms did not answer the question. Thirty –
nine % of farms were specialized in milk production (Figure 4). Belgian farms had more diversified
activities (milk, meat &crops; p<0,05) (Figure 4).
In only 17% of the forms, the presence of 2 or more people on the farm was indicated. The most
frequently the second worker was between 30-40 years old (42%), 33% of the answers indicated a
second worker aged of less than 30 years.
The majority of surveyed people (42%) was 50-60 years old, confirming the aging of the farmer
community. Young people (<30 y) were less than 12% while people over 60 years represented still 15%.
The distribution of the age of farmers did not differ between the countries ( Figure 5).
< 30 years, 1.3%
30-40 years, 11.8%
40-50 years, 29.1%
50-60 years, 39.6%
>60 years, 18.2%
DK< 30
years, 1.7%
30-40 years, 11.2%
40-50 years, 27.8%
50-60 years, 44.5%
>60 years, 14.8%
BE
< 30 years, 1.7%
30-40 years, 26.7%
40-50 years, 41.6%
50-60 years, 25.0%
>60 years, 5.0%
LU
Figure 5. Age of the main manager of the farm: figures from the compiled dataset and from each
country. BE is Belgium. DK is Denmark. LU is Luxembourg.
< 30 years, 1.60%
30-40 years, 12.00%
40-50 years, 28.70%
50-60 years, 42.50%
>60 years, 15.20%
Total

LIFE – DairyClim - September 2017 LIFE14 CCM/BE/001187 __________________________________________________________________________________
9
The figures of the compiled dataset described the standard farm from the 3 countries as exploiting
agricultural area less than 100 ha (61%), with less than 100 cows (71%) producing less than 8000 L/y
(53%) (Figures 6 and 7). For 83 % of the farms the annual milk yield could be estimated between less
than 6000 L and <10000 L/y (Figure 8). Highest performance remained exceptional (5,6% of farmers
with more than 250 ha, 5% with more than 250 cows and 2% with an annual milk yield over 12000 L/y).
*
*
*
* *
**
**
*
*
*
0
5
10
15
20
25
30
35
<50ha 50-75 ha 75-100 ha 100-125 ha 125-150 ha 150-200 ha 200-250 ha > 250 ha
% o
f a
nsw
ers
Total BE DK LU
Figure 6. Surfaces of the dairy farms from each country and comparison with the compiled dataset. Statistical differences (p<0,05) are highlighted by “*”. BE is Belgium. DK is Denmark. LU is Luxembourg.
*
** *
*
*
*
*
*
*
0
10
20
30
40
50
60
70
<50 50-100 100-150 150-200 200-250 >250
Total BE DK LU
Figure 7. Number of dairy cows per farm in each country and comparison with the compiled dataset. Statistical differences (p<0,05) are highlighted by “*”. BE is Belgium. DK is Denmark. LU is Luxembourg.
% o
f an
swe
rs

LIFE – DairyClim - September 2017 LIFE14 CCM/BE/001187 __________________________________________________________________________________
10
From more specific analysis of the data, it appears that Denmark and Belgium farms differed from each
other in farm size regarding the surface and the number of lactating cows. Due to the low number of
answers Luxembourg data did not reach often the significant level of statistics (Figure 6-7).
The Danish average milk yield was superior to these from the 2 other countries. It must be noticed the
high percentage of Luxembourg farms recording an average milk yield ranging between 8000 -10000
kg superior to the percentage demonstrated in Belgium and Denmark (Figure 8).
*
**
*
*
*
*
0
10
20
30
40
50
60
70
<6000 kg 6000-8000 kg 8000-10000 kg 10000-12000 kg >12000 kg
% o
f a
nsw
ers
Total BE DK LU
Figure 8. Average annual milk yield per cow and per farm in each country and comparison with the compiled dataset. Statistical differences (p<0,05) are highlighted with an “*”. BE is Belgium. DK is Denmark. LU is Luxembourg.

LIFE – DairyClim - September 2017 LIFE14 CCM/BE/001187 __________________________________________________________________________________
11
Description of grazing practices for lactating cows
Access to pastures was provided to young stock (63%), heifers (89%), lactating cows (80%) and dried
cows (77%).
From all the received filled forms, 1147 declared to let lactating cows grazing (80%). These forms were
further analysed to give a description of grazing practices. The proportion of grazing cows was
significant lower in Denmark compared with the other countries.
Information from grazing farms
Results from farms that actually used grazing showed that the grazing period lasted for 4 months or
more in 95% of forms. No major difference appeared between countries but more Danish farms grazed
for 2-4 months (11%; p<0,05).
Dairy cows grazed day/night for 66%, during the day for 29% and only a few hours per day for 5%.
Danish farms showed lower proportion of day/night grazing: only 29% kept cows outside during the
night (p<0,05). Grazing during only the daytime was reported in 63% of Danish farms (p<0,05) and 52%
of Luxembourg farms (p<0,1). Proportion of Luxembourg farms grazing only a few hours a day tended
to be more important (14%; p<0,1). The area available for grazing was 21,2 ± 18,5 ha (n=1086; median
=16 ha, min: 0,6 ha, max: 200 ha). In organic farms, the surface allocated for grazing was larger: 18,8
± 14,0 ha (n=127; median =15 ha, min: 0,9 ha, max: 95 ha) while in conventional farms the grazed
surface was 21,2 ± 18,5 ha (n=1086; median =16 ha, min: 0,6 ha, max: 200 ha). The grazeable area for
lactating cows was in Belgium 19,8 ± 14,3 ha (n = 902; min = 0,9; max= 77 ha), in Denmark 32,9 ± 34,0
ha (n = 136; min = 2; max = 200 ha) and in Luxembourg 14,2 ± 8,5 ha (n = 48; min = 1; max = 33 ha).
Figure 9. Dairy cattle having access to pastures: percentage of each category in the compiled dataset and in each country. BE is Belgium. DK is Denmark. LU is Luxembourg.
0
10
20
30
40
50
60
70
80
90
100
young heifers lactating cows dried cows
% o
f a
nsw
ers
Total BE DK LU
LIFE – DairyClim - September 2017 LIFE14 CCM/BE/001187 __________________________________________________________________________________
12
Complementation was supplied in permanence to the cows for 74% of farmers, most of the time for
12%, sometimes for 11% and never for 2%. The complementing feed was concentrates (64%), grass
silage (61%), maize silage (31%), cereals (28%), hay (25%) and other (19%). More than one component
was reported frequently: 2 components (26%), 3 components (28%), 4 components (17%), more than
4 (7%).
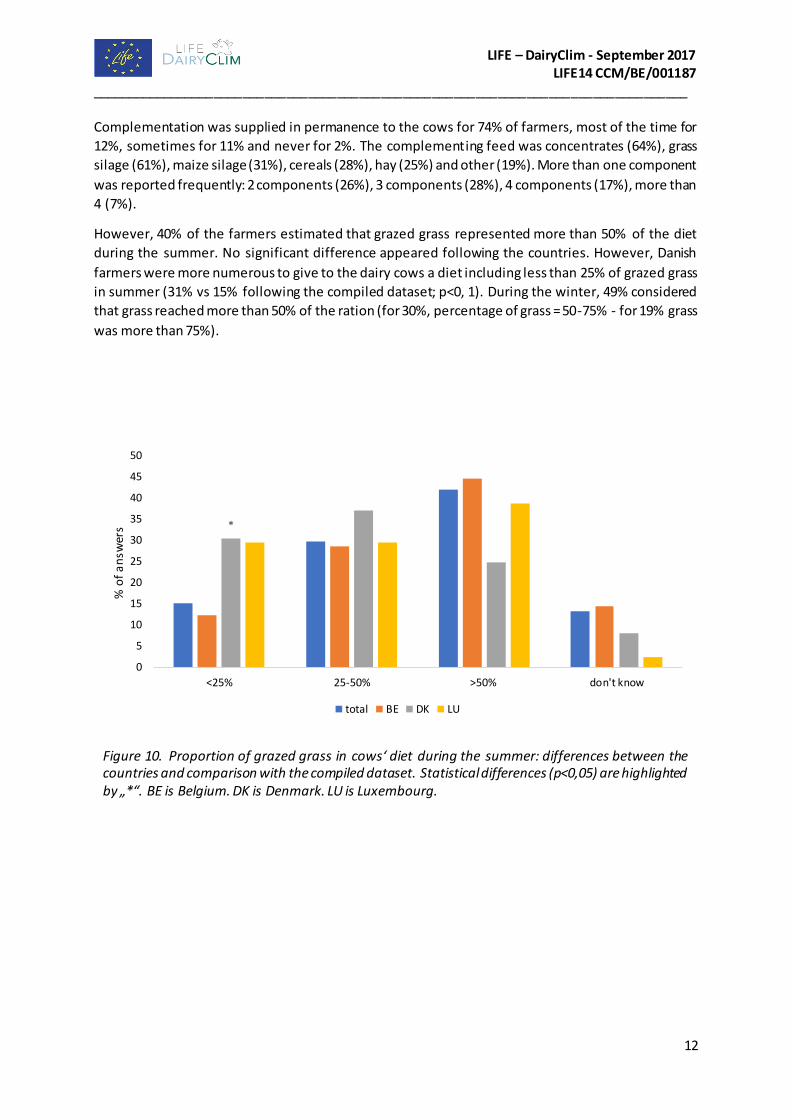
However, 40% of the farmers estimated that grazed grass represented more than 50% of the diet
during the summer. No significant difference appeared following the countries. However, Danish
farmers were more numerous to give to the dairy cows a diet including less than 25% of grazed grass
in summer (31% vs 15% following the compiled dataset; p<0, 1). During the winter, 49% considered
that grass reached more than 50% of the ration (for 30%, percentage of grass = 50-75% - for 19% grass
was more than 75%).
Figure 10. Proportion of grazed grass in cows‘ diet during the summer: differences between the countries and comparison with the compiled dataset. Statistical differences (p<0,05) are highlighted by „*“. BE is Belgium. DK is Denmark. LU is Luxembourg.
*
0
5
10
15
20
25
30
35
40
45
50
<25% 25-50% >50% don't know
% o
f a
nsw
ers
total BE DK LU

LIFE – DairyClim - September 2017 LIFE14 CCM/BE/001187 __________________________________________________________________________________
13
3.2.2 Permanent and temporary grasslands
The questionnaire aimed, also, to collect figures about permanent and temporary grasslands to
estimate the relative importance of surfaces and to get information about their use and management.
A sort was made to take into account only the forms including figures about surface different from
nihil.
Temporary grassland
The Table 2 gives an overview of the figures describing the management of temporary grasslands in
the 3 countries (compiled dataset) and for each country respectively. Figure 12 provides information
about the use of the temporary grasslands (silage, hay, grazing for dairy cows and heifers). No used
areas had to be mentioned too. It has to be noted that some figures about mineral fertilizer used on
temporary grassland (e.g the maximum value of 1300) reflected some misunderstanding of the
question. These weird values were very limited.
*
0
5
10
15
20
25
30
35
40
45
50
<25% 25-50% 50-75% >75% don't know
% o
f a
nsw
ers
total BE DK LU
Figure 11. Proportion of grazed grass in cows‘ diet during the winter: differences between the countries and comparison with the compiled dataset. Statistical differences (p<0,05) are highlighted by „*“. BE is Belgium. DK is Denmark. LU is Luxembourg.

LIFE – DairyClim - September 2017 LIFE14 CCM/BE/001187 __________________________________________________________________________________
14
Table 3. Temporary grassland; overview of figures from the compiled dataset and from each country. Mean ±SD1
(n6)
All countries BE3 DK4 LU5
Surface (ha)
35,6 ± 46,3 (831)
16,6 ± 21,3 (427)
58,3 ± 57,5 ha (371)
26,0 ± 22,0 (33)
Estimated production (t DM2/ha)
10,4 ± 5,6 (447)
11,3 ± 3,6 (81)
9,9 ± 2,9 (355)
9,1 ± 2,4 (11)
Cuts (/grazing. season) 3,4 ± 1,3
(635) 3,1 ± 1,3
(402) 3,9 ± 1,2
(201) 3,6 ± 0,8
(32)
Organic fertilizer (t/ha) 35,2 ± 22,9
(684) 29,0 ± 17,6
(324) 41,7 ± 26,0
(335) 28,4 ± 11,9
(25) Mineral fertilizer (kg N/ha)
150,0 ± 161 (660)
172,0 ± 196 (323)
124,9 ± 116 (312)
178,0 ± 101 (25)
1SD: standard deviation; 2DM: dry matter; 3BE: Belgium; 4DK: Denmark; 5LU: Luxembourg; 6n: number of samples
The use of the temporary grasslands in the compiled data set and for each country is presented in
Figure 12. From those figures, it seems that arable grasslands were mainly valued as silage.
0% 20% 40% 60% 80% 100%
Overall mean
BE
DK
LU
Silage
Hay
Grazing of lacting cow
Grazing of heifers
Not utilised
Figure 12. Use of temporary grasslands: values from the compiled dataset and of each country. BE is Belgium. DK is Denmark. LU is Luxembourg.

LIFE – DairyClim - September 2017 LIFE14 CCM/BE/001187 __________________________________________________________________________________
15
Permanent grassland
General overview on the main characteristics of permanent grasslands is given in Table 3. The use of
these surfaces is described in Figure 13. From these figures, it seems that these were mainly allocated
to grazing of dairy cows and heifers.
Table 4. Permanent grass; overview of figures from the compiled dataset and from each country.
Mean ±SD1 (n6)
All countries BE3 DK4 LU5
Surface (ha)
38,4 ± 32,6 (1242)
45,3 ± 28,8 (883)
14,7 ± 17,1 (308)
61,2 ± 71,0 (51)
Estimated production (t DM2/ha)
5,7 ± 4,7 (395)
10,2 ± 5,7 (105)
3,9 ± 2,7 (278)
7,7 ± 2,4 (12)
Cuts (/grazing season) 1,9 ± 1,7
(1124) 2,3 ± 1,6
(829) 0,4 ± 1,0
(252) 3,3 ± 1,1
(43)
Organic fertilizer (t/ha) 22,7 ± 30,4
(825) 27,3 ± 33,1
(599) 6,5 ± 14,3
(184) 28,5 ± 10,1
(42) Mineral fertilizer (kg N/ha)
126 ± 160 (889)
149,2 ± 175,1 (626)
56,2 ± 84,5 (254)
164,0 ± 114 (38)
1SD: standard deviation; 2DM: dry matter; 3BE: Belgium; 4DK: Denmark; 5LU: Luxembourg; 6n: number of samples
0% 20% 40% 60% 80% 100%
Overall mean
BE
DK
LU
Silage
Hay
Grazing of lacting cows
Grazing of heifers
Not utilised
Figure 13. Use of permanent grasslands: values from the compiled dataset and of each country.
BE is Belgium. DK is Denmark. LU is Luxembourg.

LIFE – DairyClim - September 2017 LIFE14 CCM/BE/001187 __________________________________________________________________________________
16
Comparison of temporary and permanent grasslands
Considering the compiled dataset, the areas of permanent (PG) and temporary grasslands (TG) are
similar (PT: 35,6 ± 46,3 ha; PG: 38,4 ± 32,2 ha). However, Danish farmers registered a higher surface
of temporary grasslands (58,3 ± 57,5 ha) even greater when organic farms were distinguished (130,6
± 83,9 ha). In Luxembourg and in Belgium, mean surface of permanent grasslands was higher than 45
ha while Danish figures mentioned mean PG area of 14,7 ± 17,1 ha.
Provided data on production were statistically lower in permanent grasslands compared with
temporary ones. This difference was particularly apparent in Danish data (PG:3,68 t DM/ha vs TG: 8,58
t DM/ha; p<0,001). The difference was observed whatever the studied system (conventional farms:4 t
DM/ha vs 3,37 t DM/ha in organic; ns).
Regarding fertilization, the use of organic fertilizer was the same in Luxembourg and Belgium whatever
the type of grasslands. No significant difference between these 2 countries could be observed. On the
contrary, the use of organic and mineral fertilizers was less intense in Denmark on permanent
grasslands while organic fertilizer on temporary grassland of Denmark was higher compared with the
2 other countries.
Comparison of grazing farms with no-grazing ones
The comparison was made on 1421 filled questionnaires (1141 from conventional farms – 280 from
organic ones). No organic farm was no grazing. The same proportion between grazing and no grazing
of farms specialized in dairy production was determined in grazing and no grazing farms. However, the
agricultural surface and the number of cows were larger in no grazing farms with higher proportion of
farms of more than 150 ha and of more than 100 dairy cows. The percentage of milk yield over 10000
kg per cow per year was also increased in no grazing farms. On the other hand, zero grazing farms were
more interested in crops + dairy production (36% of the no grazing vs 16% of grazing farms; p<0,05).
Figure 14. Activities developed on farms following the grazing practices. Statistical differences (p<0,05) are highlighted by “*”.
*
*
*
*
*
0
10
20
30
40
50
60
milk milk and meat milk and crops milk meat crops
% o
f an
swe
rs
Total Grazing No grazing

LIFE – DairyClim - September 2017 LIFE14 CCM/BE/001187 __________________________________________________________________________________
17
Figure 15. Effect of surface of farms on grazing practice. Statistical differences (p<0,05) are highlighted by “*”.
*
* **
*
*
*
*
0
5
10
15
20
25
30
35
<50ha 50-75 ha 75-100 ha 100-125 ha 125-150 ha 150-200 ha 200-250 ha > 250 ha
% o
f a
nsw
ers
Total Grazing No grazing
Figure 16. Effect of the number of dairy cows on grazing practices. Statistical differences (p<0,05) are highlighted by “*”
*
*
** *
*
*
*
*
*
*
0
5
10
15
20
25
30
35
40
45
50
<50 50-100 100-150 150-200 200-250 >250
% o
f a
nsw
ers
Total Grazing No grazing

LIFE – DairyClim - September 2017 LIFE14 CCM/BE/001187 __________________________________________________________________________________
18
3.2.3 Opinions about grazing
In the questionnaire, a first set of questions addressed all the surveyed people while the second one
was more specific for grazing exploitations.
Despite no question in relationship with their well -being was present in the questionnaire, the feeling
of malaise of dairy farmers was perceptible as some Luxembourg and Walloon farmers used this means
to talk about their worries and difficulties.
Opinions about the potential benefits of grazing were asked regarding production costs (Figure 18),
animal welfare (Figure 19), landscape preservation (Figure 20) and environment (Figure 21). Farmers
had to indicate whether they find the assertion correct, false or had no opinion about it. Results from
the combined dataset and country by country are presented. Statistical differences are highlighted.
Danish farmers were the more critical about grazing. Only landscape preservation was recognized as a
benefit of grazing.
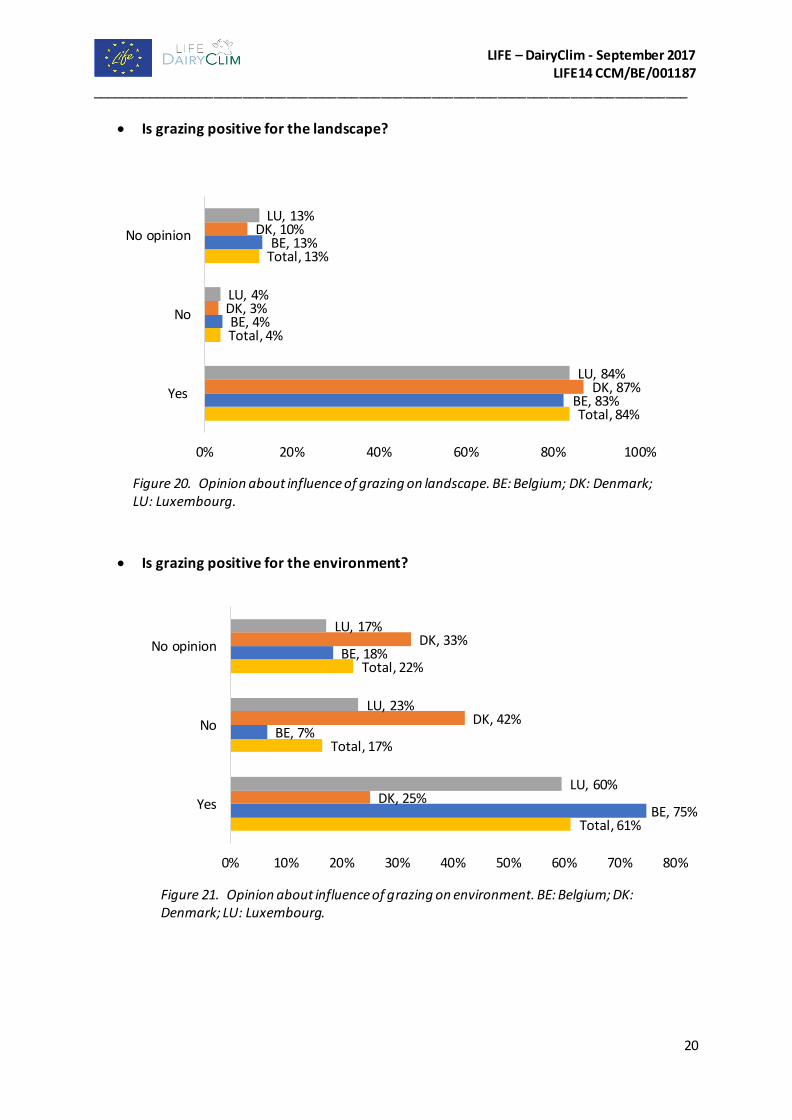
Positive effect on environment was the less cited one (61,3%). Moreover, grazing was considered as
negative for environment in 16,6%. This high percentage is due to the very negative opinion of Danish
farmers. 42,2% of Danish farmers considered that grazing had a negative effect on environment.
The opinion about benefits of grazing was largely dependent on the grazing practices of the farms.
Grazing farmers were very convinced about beneficial effects of grazing on animal welfare (95,4%) and
on landscape preservation (86,1%). Around 80% estimated that grazing decreased production costs.
Effect on environment was less cited: only 72% of grazing farmers thought that grazing could preserve
or improve environment and 20% had no opinion on this topic. Around 70% of no grazing farmers
*
*
*
**
*
*
*
0
10
20
30
40
50
60
<6000 kg 6000-8000 kg 8000-10000 kg 10000-12000 kg >12000 kg
% o
f a
nsw
ers
Total Grazing No grazing
Figure 17. Average annual milk yield following grazing practices. Statistical differences (p<0,05) are highlighted by “*”

LIFE – DairyClim - September 2017 LIFE14 CCM/BE/001187 __________________________________________________________________________________
19
thought that grazing could affect production costs and preserve landscape. For them the effect on
animal welfare was not positive or dubious (no opinion) (67% of answers). Regarding impact on
environment, only 16,5% thought it could be beneficial. Moreover, more than 50% considered that the
influence of grazing was negative on the environment.
• Does grazing decrease production costs?
• Does grazing favour animal welfare?
Figure 18. Opinion about influence of grazing on production costs. BE: Belgium; DK: Denmark; LU: Luxembourg.
Total, 70%
Total, 16%
Total, 14%
BE , 78%
BE , 11%
BE , 11%
DK, 47%
DK, 28%
DK, 25%
LU, 73%
LU, 17%
LU, 10%
0% 20% 40% 60% 80% 100%
Yes
No
No opinion
Figure 19. Opinion about influence of grazing on animal welfare. BE: Belgium; DK: Denmark; LU: Luxembourg.
Total, 84%
Total, 7%
Total, 9%
BE, 94%
BE, 2%
BE, 4%
DK, 53%
DK, 22%
DK, 25%
LU, 94%
LU, 2%
LU, 4%
0% 20% 40% 60% 80% 100%
Yes
No
No opinion
LIFE – DairyClim - September 2017 LIFE14 CCM/BE/001187 __________________________________________________________________________________
20
• Is grazing positive for the landscape?
• Is grazing positive for the environment?
Figure 20. Opinion about influence of grazing on landscape. BE: Belgium; DK: Denmark; LU: Luxembourg.
Total, 84%
Total, 4%
Total, 13%
BE, 83%
BE, 4%
BE, 13%
DK, 87%
DK, 3%
DK, 10%
LU, 84%
LU, 4%
LU, 13%
0% 20% 40% 60% 80% 100%
Yes
No
No opinion
Figure 21. Opinion about influence of grazing on environment. BE: Belgium; DK: Denmark; LU: Luxembourg.
Total, 61%
Total, 17%
Total, 22%
BE, 75%
BE, 7%
BE, 18%
DK, 25%
DK, 42%
DK, 33%
LU, 60%
LU, 23%
LU, 17%
0% 10% 20% 30% 40% 50% 60% 70% 80%
Yes
No
No opinion
LIFE – DairyClim - September 2017 LIFE14 CCM/BE/001187 __________________________________________________________________________________
21
Reasons for stopping grazing
This set of questions addressed farmers with no-grazing dairy cows for a total of 280 questionnaires.
It represented 35 forms from Belgium (12,5%), 236 from Denmark (84,3%) and 9 forms from
Luxembourg (3,2%).
Seven choices were proposed (Figure 22). Answers were given by conventional farms (n =279) and one
exploitation undetermined. Only 7,4% of addressed farmers did not provide at least one answer.
Only 20% of farmers gave only one factor explaining their choice so that the proposed factors were
combined. Factors linked to environment (climate and/or soil) represented 20%, those in relationship
with the management (management and/or pastures far and/or limited pastures available) 70% and
those in relation with the economic factors (decrease in milk yield) 70%. The importance of the related
factors differed between the countries: Belgian farmers highlighted the difficulties in management
(27/35) and economic factors (26/35), climatic reasons were given in 9/35 of answers. For Danish
farmers, climatic reasons were more represented (98/236). In Luxembourg, difficulties in management
were reported in 8/9 questionnaires. No relation with climate conditions appeared.

LIFE – DairyClim - September 2017 LIFE14 CCM/BE/001187 __________________________________________________________________________________
22
Figure 22. Reason for no grazing in the global dataset (Total) and in each country. BE: Belgium;
DK: Denmark; LU: Luxembourg.
Total
Total
Total
Total
Total
Total
Total
BE
BE
BE
BE
BE
BE
BE
DK
DK
DK
DK
DK
DK
DK
LU
LU
LU
LU
LU
LU
LU
0% 20% 40% 60% 80% 100%
Pastures too far from stable
Limited gazeable areas
Reduction in milk yield
Difficult management
Poor climatic conditions
Poor soil conditions
Economic reasons

LIFE – DairyClim - September 2017 LIFE14 CCM/BE/001187 __________________________________________________________________________________
23
Reasons for keeping grazing
Only farmers with cows grazing received these questions. It represented 96,5% of the farms in
Belgium, 37% in Denmark, and 84,8% in Luxembourg.
Future of grazing
Farmers were asked about their perspectives regarding grazing:
• Eighty-six % expected keeping or increasing grazing practices.
• Ten percent considered they would decrease grazing and 4% thought they would stop it.
• No opinion was recorded in 13%. No difference appeared between countries.
BE
BE
BE
BE
BE
BE
DK
DK
DK*
DK
DK*
DK
LU
LU
LU
LU
LU
LU
Total
Total
Total
Total
Total
Total
0% 20% 40% 60% 80% 100%
Lowering production costs
Improve animal welfare
Positive image toward consumers
Positive for landscape preservation
Requirements from dairy companies
Requirement for land use
Figure 22. Reason for grazing in the global dataset and grazing in each country. Statistical
differences (p<0,05) are highlighted by “*”. BE: Belgium; DK: Denmark; LU: Luxembourg.

LIFE – DairyClim - September 2017 LIFE14 CCM/BE/001187 __________________________________________________________________________________
24
3.2.4 Life Cycle Assessment (LCA) - grassland
Dairy farming across the world relay on various degrees of utilization of grass as either pasture, hay or
silage. Several studies have shown that proportion of grassland has an impact on the environmental
performance. Guerci et al. (2013) comparing twelve different farming systems observed that
proportion of grassland of the farmed area was negatively correlated to the emission of GHG per kg
milk, and that the three farms with the lowest emission also were the farms with the highest
proportion of grazing. This could indicate that not only the proportion of grassland, but also the way
of using the grass growth has an impact on the emission. These inconsistencies in effect on GHG of
different systems may partly be due to differences in the models used for calculation as well as the
type of farms chosen as representative for the systems. Permanent grassland compared to temporary
grassland, being part of an arable crop rotation system, is one factor. Several studies have shown that
soil carbon sequestration is different from these types of grassland systems, with an expected higher
annual sequestration in temporary grassland compared to permanent pasture, but also a high release
of carbon when temporary grassland is turned into annual crops like maize or grain (Soussana et al.,
2010). These effects might have an importance even at the emission at farm level. In general, higher
milk yield is associated with lower emission per kg of milk, which is an obstacle for pasture based
system which have a lower yield than confinement system. Some emission might be reduced though,
like methane emission from storage of slurry compared to methane emission from deposition during
grazing, while on the other hand, emission of N2O from manure deposited is much higher than from
manure applied to land after storage. Even the enteric methane emission might be different as content
of starch and fat in the feed is related to a reduced methane production, and in pasture based diet the
level of these two nutrients is often lower than in economical optimal ration fed indoor.
All together it is not obvious to understand how system differing in proportion, type and utilization of
grassland affects the environmental impact of dairy farming. The aim with this action is therefore to
add additional knowledge to understand how farming differing in these aspects performs in relation
to the release of greenhouse gasses, land use and biodiversity.
This action used a combination of farm data and modelling of the farm production to estimate the
environmental impact of dairy production at farm and product scale.
Information from the questionnaire sent to dairy farmers together with additional national statistical
information and other literature sources was used to define two systems, both with conventional
farming, typical for Luxembourg (LUX) and Belgium (BEL) and two systems, either conventional (DK-
con) or organic (DK-org) typically for Denmark. These systems represent a large variation in grassland
utilization (silage vs grazing), proportion of grass in the feeding regime and the type of grassland
(temporary vs permanent) and grassland management. All farm data were based on dataset from year
2015.

LIFE – DairyClim - September 2017 LIFE14 CCM/BE/001187 __________________________________________________________________________________
25
Table 5. Basic information Luxembourg Belgium Denmark Conventional Conventional Organic Conventional
General data
Soil, clay % 19 19 5 5 Rainfall (mm annually) 865 821 842 842 Precipitation (mm annully) 653 530 547 535 Specific data
Herd (dairy cows) 74 70 169 168 Milk (kg/cow.year) 8 389 8 254 9 199 9 980 Stocking rate (LU1/ha) 1,99 1,73 1,26 1,95 Milk (kg ECM2/ ha farm land) 9 519 8 102 6 641 11 103 Crop type (% of land size)
Permanent grassland 57% 55% 9% 7% Temporary grassland 11% 11% 48% 32% Maize 18% 5% 3% 31% Feed intake (kg DM/year. cow)
Pasture 2 355 2 956 2 161 550 Grass silage/hay 1 898 2 838 3 358 2 792 Maize silage 2 225 693 925 3 525 1DM: dry matter; 2ECM: Energy Corrected Milk
The actual area at farm level was estimated with focus on balance between roughage net production
and herd demand (DMI, net energy and protein) as well as between manure excretion and use of
fertilizer – which has to be evaluated and corrected as part of initiation of the model. If necessary in
order to established realistic crop rotation some minor areas with grain as cash crops was included.
This was an important part of the work going from farm data to model as some of the farms (LU and
BE 49% and DK 15%) from the questioner had beef and crop production together with dairy.
Simulation of each scenario was done by running the model for a period of 10 years with average
annually climate data for each location. In order to have possibilities for comparing different types of
dairy systems and products directly, the model farm area represent only the area needed for producing
the home-grown feed for the dairy herd (cows and young stock). To include a product approach, life
cycle assessment (LCA) was the system boundary extended in order to include also the emissions
related to the imported resources such as feed and fertilizer. The functional unit in the study was one
kg energy corrected milk (ECM) from kg milk sold at the farm gate and one kg of live weight gain,
including both cows and heifers, but not bulls and calves.

LIFE – DairyClim - September 2017 LIFE14 CCM/BE/001187 __________________________________________________________________________________
26
Table 6. Product environmental impact for milk and meat – after allocation
Luxemburg Belgium Denmark Conventional Conventional Organic Conventional Allocation to milk (%) 85% 83% 87% 88% Per kg milk GHG1 (g CO2 eq.) 1 010 999 933 949 Soil carbon sequestration, (g CO2 eq.)
44 82 38 37
Land use (m2) 1.12 0.94 1.47 1.00 Biodiversity damage index 0.36 0.26 0.12 0.52 Per kg live weight gain
GHG (g CO2 eq.) 6 850 6 976 6 174 6 223 Soil carbon sequestration (g CO2 eq.)
301 569 252 240
Land use (m2) 7,59 6,58 9,75 6,58 Biodiversity damage index 2,41 1,79 0,81 3,39 1GHG: greenhouse gases
LIFE – DairyClim - September 2017 LIFE14 CCM/BE/001187 __________________________________________________________________________________
27
3.3 Discussion
3.3.1 Comparison with official figures
Updated official figures about the dairy sector were difficult to find. For example, the report published
in 2017 by the Walloon government takes into account figures from 2015 and discrimination between
dairy and other sectors is not systematic. Official data from Denmark and Luxembourg are from 2015
too. Data provided by the governments of each country partner of the survey are often not comparable
as they consider different aspects of agriculture, e.g not discriminate dairy from other activities, use
range of data different from those from the study.
Wallonia
In Wallonia, comparison with official sources (L’agriculture Wallone en chiffres, 2017) showed the
same key of repartition between conventional and organic farms as this observed in the survey. The
number of dairy farms was estimated at 3569 units following figures of 2015. However, the survey was
delivered to 3152 dairy producers by the mean of the Comité du Lait responsible for milk quality
analysis for all dairy exploitations. This difference between figures could be due to the fact that the
survey took place at the end of 2015. Yet the number of dairy farms decreases steadily. On the other
hand, the official figure could be enhanced by some farms detaining a very small number of dairy cows
and not delivering to the dairy plants. This hypothesis could be confirmed by the difference between
the number of cows estimated at 53 animals per farm, lower than the figure from the survey.
The mean agricultural surface was estimated at 58 ha without discrimination between dairy and meat
farms (L’agriculture Wallone en chiffres, 2017). This is coherent with the results of our survey.
Denmark
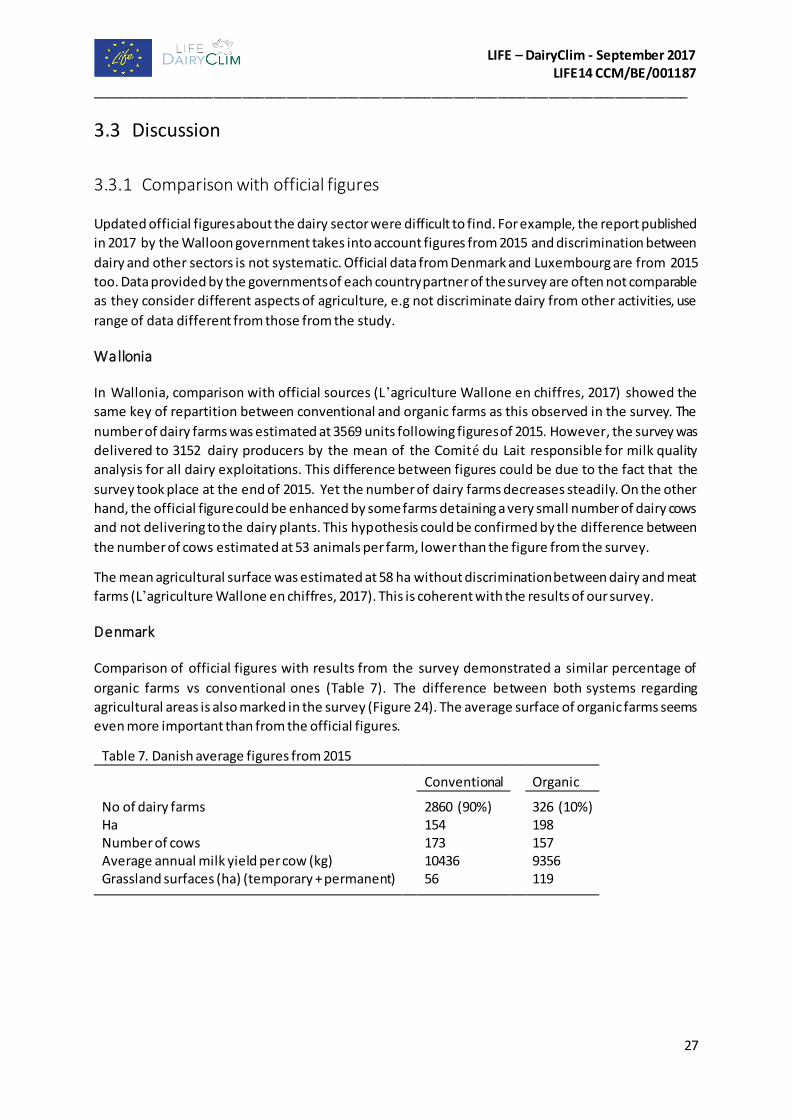
Comparison of official figures with results from the survey demonstrated a similar percentage of
organic farms vs conventional ones (Table 7). The difference between both systems regarding
agricultural areas is also marked in the survey (Figure 24). The average surface of organic farms seems
even more important than from the official figures.
Table 7. Danish average figures from 2015
Conventional Organic No of dairy farms 2860 (90%) 326 (10%) Ha 154 198 Number of cows 173 157 Average annual milk yield per cow (kg) 10436 9356 Grassland surfaces (ha) (temporary + permanent) 56 119

LIFE – DairyClim - September 2017 LIFE14 CCM/BE/001187 __________________________________________________________________________________
28
In the survey, no difference between the systems appeared in the number of cows. The figures of the
survey indicated 39% of organic dairy farms with 100 to 150 cows vs 45% in conventional ones. This
is in accordance with the official figures.
The milk yield is slightly lower in organic farms with 49% of the farmers indicating that their average
milk yield per cow per year was comprised between 8000 and 10000 kg. On the other hand, 52% of
the conventional system estimated its annual milk production at between 10000 to 12000 kg. These
figures are slightly above the official ones. Grassland surfaces reported in the survey were above
official estimations.
Luxembourg
In Luxembourg, 2022 agricultural exploitations were active following the report “L’agriculture
Luxembourgeoise en chiffres” (2016). Out of them, 515 were specialized in dairy production (25% vs
35% in the survey) and 8% in meat, milk and crop (vs 21% in the survey). Only 83 farms were organic
(4%) which corresponds to the percentage reached in the survey. The mean agricultural surface was
estimated at 65 ha while farms declaring surface between 70 and 100 ha reached 17,3% and those of
more than 100 ha, 23%. Figures from the survey showed more bigger entities with 26,7% of farms
claiming between 75 and 100 ha and 50% above 100 ha.
In 2015, 46903 dairy cows were present in Luxembourg. If only the farms specialized in milk are taking
into account, a mean of 91 cows per farm on average could be considered. This figure is in accordance
with results of the survey. Milk yield reported from official figures was lower than estimated from the
survey: the average annual milk production per cow was estimated at between 7000 and 8000 kg
compared with 30% of the farmers producing from 6000 to 8000 kg and 64,4% from 8000 to 10000 kg
in the survey. It is noteworthy that these official figures took into consideration the deliveries to the
dairy plants. Thus, an amount of the total milk yield of exploitations could be used by other means, for
0
5
10
15
20
25
30
35
40
45
50
<50ha 50-75 ha 75-100 ha 100-125 ha 125-150 ha 150-200 ha 200-250 ha > 250 ha
% o
f a
nsw
ers
conv org
Figure 24. Surface of dairy farms in Denmark following the system. Data from the survey. Conv: conventional, org: organic
LIFE – DairyClim - September 2017 LIFE14 CCM/BE/001187 __________________________________________________________________________________
29
example to feed calves or by direct trade. On the other hand, the que stionnaires were sent only to
dairy farmers explaining discrepancies between official figures and those from the survey.
In each country, some little discrepancies between official data and results were noticed probably due
to the more restricted target than official sources addressing all agricultural exploitations.More
generally, the panel of farmers who have answered is representative of the farmers of each country.
Comparison between the three countries
The three surveyed countries are very different. The farm size is far greater in Denmark whatever the
criteria: surface, number of cows or milk yield. Even organic farms had more surface than conventional
ones. Grazing practice, accordingly with this increased size, grazing was less practiced in Denmark. The
proportion of no grazing affected the answers of Danish farmers and their perception about grazing.
This point was already highlighted by Kristensen et al., 2010. In Luxembourg, intensification of dairy
farms is increasing with a negative impact on grazing. In Wallonia, intensification process is less
pronounced and grazing practices still play a key role.

LIFE – DairyClim - September 2017 LIFE14 CCM/BE/001187 __________________________________________________________________________________
30
3.4 Conclusion and summary for policy makers
In Europe, dairy farmers feel disappointed by the milk crisis. In our survey, the feeling of malaise of
dairy farmers was perceptible. One of the chosen strategy is the intensification of farm management.
Anyway, the number of farmers is decreasing in the European Union. Less young people are motivated
for this profession so that ageing of farmers is very pronounced. These features were also
demonstrated in our study. Thus, the agricultural sector is crucial for the preservation of grassland that
otherwise got abandoned or became shrubs. While the intensive use of grasslands might cause
damage for the environment, the LCA analysis performed in our study showed that intensive Danish
systems gave the highest GHG emission per area of farm land, but also the lowest emission per kg of
product. The impact of intensive management has thus to be considered at both levels: in relationship
with the farm area and per kg of milk produced. A dynamic point of view is also necessary as carbon
sequestration is fluctuating with land use change and ploughing of permanent and temporary
grasslands.
Results of this survey showed huge variation between Denmark and Belgium/Luxembourg in the role
of grassland. Some general conclusion can be made.
• Intensification of dairy sector hinders grazing for different reasons:
- Not enough surfaces in the surroundings of the farm to let cows grazing
- Not enough grasslands to feed the animals
- Increased labour and difficult management of pastures
- Competition between resources provided by grasslands e.g. silage production and
grazing
• Although cows are grazing, large amount of supplement feed is allocated
• At the moment, most dairy farmers grazing wish keeping grazing, even increasing it.
Preservation of grassland is a huge society concern. It is thus necessary to intensify the education of
the farmers about impact of their sector on the environment. Our survey shows that they are not very
aware of that issue. Moreover, landscape and environment preservation by the farmers could be
highlighted as environmental services and valued. Effect of national policies on grassland preservation
is still limited but could be an incentive for grazing as showed by the recent measures decided by the
Luxembourg government. An increase in organic sector can help preserving grassland surfaces.

LIFE – DairyClim - September 2017 LIFE14 CCM/BE/001187 __________________________________________________________________________________
31
3.5 References
Anonymousa (2017) L’agriculture Luxembourgeoise en chiffres, 2016
http://www.statistiques.public.lu/fr/publications/thematique/entreprises/agriculture-en-
chiffres/lux-landwirtschaft-fr.pdf
Anonymousb. (2017) L’agriculture wallonne en chiffres, www.agriculture.wallonie.be
Anonymousc (2017) BASEMAP02 Technical documentation of a model for elaboration of a land-use and land-cover map for Denmark, nr 95.
Burow E., Thomsen P.T., Sørensen J. T. and Rousing T. (2011) The effect of grazing on cow mortality in Danish dairy herds. Preventive Veterinary Medicine 100, 237-241.
De Olde E, Oudshoorn FW, Sørensen CG, Bokkers EAM, De Boer (2016) Assessing sustainability at farm-level: Lessons learned from a comparison of tools in practice Ecological Indicators 66, 391-404.
Dillon P., Roche J.R., Shalloo L. and Horan B. (2005) Optimising financial return from grazing in temperate pastures. Utilisation of grazed grass in temperate animal systems. Grassland Science in Europe 13
EAA (2017) https://www.eea.europa.eu/themes/landuse/intro.
EAA (2016) Mapping and assessing the condition of Europe's ecosystems: progress and challenges .
Guerci, M., Knudsen, M. T., Bava, L., Zucali, M., Schönbach, P., & Kristensen, T. (2013). Parameters affecting the environmental impact of a range of dairy farming systems in Denmark, Germany and Italy. Journal of cleaner production, 54, 133-141.
Kristensen, T., Madsen, M.L., Noe, E. (2010) The use of grazing in intensive dairy production and
assessment of farmers attitude towards grazing. Grassland Science in Europe , 15, 964-966.
Soussana, J.-F., Tallec, T., Blanfort, V. (2010). Mitigating the greenhouse gas balance of ruminant
production systems through carbon sequestration in grasslands. Animal, 4 (3), 334-350.
Tubiello F.N., Salvatore M., Cóndor Golec R.D., Ferrara A., Rossi S., Biancalani R., Federici S., Jacobs H.,
Flammini A. (2014). Agriculture, Forestry and Other Land Use Emissions by Sources and Removals by
Sinks. 1990-2011 Analysis. In FAO Statistics Division