Embed Size (px)
Citation preview

Survey of Research Integrity Measures Utilized in Biomedical Research Laboratories
Final Report
Prepared by: American Institutes for Research 1000 Thomas Jefferson St N.W.
Washington DC 20007
Prepared for: Department of Health and Human Services
DHHS Office of Research Integrity Tower Building
7th Floor 1101 Wooton Parkway Rockville MD 20852
Project Officer:
Lawrence J. Rhoades, Ph.D. Director, Division of Education and Integrity
Office of Research Integrity
Contracting Officer: Ms. Jane Carlson
GovWorks U.S. Department of the Interior
October 31, 2003
Survey of Research Integrity Measures Utilized in Biomedical Research Laboratories
Final Report
Prepared by:
David Rodbard, M.D. Gavan O’Shea, Ph.D.
Michael Keeney, Ph.D. Roger Levine, Ph.D.
Ann Win, B.A. Lily Clark, B.A.
Wen-Hung Chen, Ph.D. Daniel Sherman, Ph.D.
American Institutes for Research
1000 Thomas Jefferson St NW Washington DC 20007
Prepared for:
Department of Health and Human Services DHHS Office of Research Integrity
Tower Building 7th Floor
1101 Wooton Parkway Rockville MD 20852
Project Officer:
Lawrence J. Rhoades, Ph.D. Director, Division of Education and Integrity
Office of Research Integrity
Contracting Officer: Ms. Jane Carlson
GovWorks U.S. Department of the Interior
October 31, 2003

Office of Research Integrity, DHHS iii American Institutes for Research
TABLE OF CONTENTS
Page
EXECUTIVE SUMMARY .............................................................................................................1 INTRODUCTION ...........................................................................................................................5
Study Design...........................................................................................................................5 Organization of this Report.....................................................................................................6
METHODS ......................................................................................................................................8 Sample Selection.....................................................................................................................8 Data Extraction and Preliminary Screening............................................................................8 Descriptive Statistics for Population and Proposed Sample .................................................12 Development of the Survey Items.........................................................................................12 Web-Based Survey Methodology.........................................................................................13 IRB and OMB Clearance ......................................................................................................14 Pilot Testing ..........................................................................................................................15 Response Rate.......................................................................................................................15 Comparison of Respondents and Non-Respondents.............................................................16 Preliminary Data Analysis ....................................................................................................17 Analysis of Frequency Histograms and Cumulative Distribution Function and
Development and Rationale for Rules for Censoring Data ............................................17 Statistical Analysis................................................................................................................20 Development of Composite Variables ..................................................................................22 Additional Analyses..............................................................................................................24 Graphical Displays................................................................................................................25 Qualitative Analysis of Suggestions from Respondents to Promote Research Integrity in
Biomedical Research Laboratories (Survey item 62) .....................................................25 RESULTS ......................................................................................................................................26
A. Characteristics of Survey Respondents (Survey Items Q49−61)..........................................27 B. Data for Basic Scientists, and Comparison with Clinical and Epidemiological
Investigators..........................................................................................................................34 1. Methods of Data Collection (Survey Items 1–4) ............................................................43 2. Data Control and Integrity Methods (Survey Items 5–10) .............................................48 3. Data Retention (Survey items 11–13).............................................................................50 4. Laboratory Meetings for Data Review, Supervision and Mentoring (Survey items 14–
25, 26, 27–29, 50) ...........................................................................................................51 5. Publication practices (Survey items 30–37 and Composite Variable # 2)......................57 6. Guidelines regarding publications (Survey Items 38–43 and Composite Variable # 3).58
Office of Research Integrity, DHHS iv American Institutes for Research
7. Training Re Research Integrity (Survey Items 44–48) ...................................................60 8. Characteristics of the Principal Investigator ...................................................................60 9. Multiple Regression........................................................................................................62 Data Control and Integrity Measures (Y1) ............................................................................62 Publication Practices (Y2) .....................................................................................................63 Publication Guidelines (Y3) ..................................................................................................63
C. Correlation Matrices .............................................................................................................64 D. Suggestions from Respondents to promote research integrity in biomedical research
laboratories............................................................................................................................72 DISCUSSION................................................................................................................................83
Major Findings...........................................................................................................................83 Nature of the population of researchers supported by NIH extramural research grants.......83 Size of Laboratory.................................................................................................................84 Total Current Level of Funding ............................................................................................85
Nature of Methods Utilized to Promote Research Integrity ......................................................85 Data Collection Methods ......................................................................................................85 Data Integrity ........................................................................................................................86 Supervision and Mentoring...................................................................................................86 Publication Practices.............................................................................................................87 Publication Guidelines ..........................................................................................................87 Research Integrity Training: .................................................................................................88
Statistical Methodology for Analysis ........................................................................................89 Composite Variables.............................................................................................................89
Problems Encountered and Limitations of the Study ................................................................90 Currency of the Database defining the Underlying Population ............................................90 Use of a Random Sample......................................................................................................90 Response Rate.......................................................................................................................91 Unequal Sample Size for Various Subgroups.......................................................................91 Representativeness of the Respondents ................................................................................92 Limitations of Self-Report ....................................................................................................93 Limitations of the Survey Instrument ...................................................................................93 Limitations of the Analysis...................................................................................................94 Analysis of Subgroups ..........................................................................................................94
Statistical Methodology .............................................................................................................95 Measures of central tendency................................................................................................95 Analyses of variability ..........................................................................................................95 Methodology.........................................................................................................................96
Office of Research Integrity, DHHS v American Institutes for Research
Generalizability to all NIH funded researchers. ........................................................................96 Additional analytical approaches to the present data: ...............................................................97 Conclusions................................................................................................................................98
Office of Research Integrity, DHHS vi American Institutes for Research
A. List of Exhibits Page
Exhibit 1: Response Rate for the Survey1 ................................................................................15 Exhibit 2. Comparison of Characteristics of Non-Respondents and Respondents1.................16 Exhibit 3. Definition of Rules for Censoring of ORI Survey Data1.........................................18 Exhibit 4. Distribution of Gender of Survey Respondents (Q60)1...........................................27 Exhibit 5. Distribution of Professional Degree of Survey Respondents (Q53)1 ......................28 Exhibit 6. Principal Fields of Inquiry1 .....................................................................................29 Exhibit 7. Role as “Laboratory Director” (Q49)1.....................................................................30 Exhibit 8. Number of Years as a PI (Q52)1..............................................................................31 Exhibit 9. Distribution of Sources of Funding of Survey Respondents1..................................32 Exhibit 10A. Sources of Funding by Gender and by Professional Degree1 .................................33 Exhibit 10B. Sources of Funding by Gender and by Professional Degree1 .................................34 Exhibit 11. Grant Applications and Funding2 ............................................................................36 Exhibit 12. Basic Scientists........................................................................................................38 Exhibit 13A. Methods for Collecting and Storage of Data2 .........................................................44 Exhibit 13B. Methods for Collecting and Storage of Data2 .........................................................45 Exhibit 14. Analysis of Data Collection Methods by Gender and Degree1 ...............................46 Exhibit 15. Nature of Data Collection Methods1 .......................................................................47 Exhibit 16. Data Control Measures2...........................................................................................49 Exhibit 17A. Data Retention of Data That Are Unlikely to be Published, Data That Have Been
Published, and Data Relevant to a Patent Application1...........................................50 Exhibit 17B. Data Retention2........................................................................................................51 Exhibit 18. Laboratory Meetings2 ..............................................................................................53 Exhibit 19. Measures of Supervision by Principal Investigator of Researchers in His/Her
Laboratory2 ..............................................................................................................56 Exhibit 20. Publication Practices (Q30–Q37)1...........................................................................57 Exhibit 21A. Use of Guidelines for Six Criteria Related to Publication Policies and Practices1 .59 Exhibit 21B. Use of Guidelines for Six Criteria Related to Publication Policies and Practices1 .61 Exhibit 22. Correlations Among Frequency of use of Media for Storing Data1........................66 Exhibit 23. Correlations Among Data Control and Integrity Mechanisms1 ..............................67 Exhibit 24. Correlations Among Publication Practices1 ............................................................68 Exhibit 25. Correlations Among Availability and Use of Publication Guidelines1 ...................69
1 Analysis based on data from all respondents who replied to 50% or more of the survey items. 2 Analysis performed separately according to primary field of research: basic sciences, clinical- or epidemiological investigation, or all respondents combined.
Office of Research Integrity, DHHS vii American Institutes for Research
Exhibit 26. Correlations Among Amount of Funding and Number of Researchers Supervised or Mentored1............................................................................................................70
Exhibit 27. Correlations Among Respondent Age, Years as a Principal Investigator, and Number and Dollar-value of Current Grants1 .........................................................71
Exhibit 28. Suggestions from Respondents to promote research integrity in biomedical research laboratories (Q62)1 ....................................................................................73

Office of Research Integrity, DHHS viii American Institutes for Research
LIST OF APPENDICES
A. Survey Instrument
B. Time Course of Responses
C. Summary of Descriptive Statistics by Principal Scientific Area (Basic Sciences, Clinical- and Epidemiological Investigation)3
D. Summary of Descriptive Statistics for all Respondents4
E. Free-text Responses to an Open-ended Survey Item (Item 62) Requesting Suggestions and Recommendations, Organized by Major Topic Areas
3 This is a subset of the data presented in Appendix D. 4 “All respondents” refers to the combined set of basic scientists, clinical- and epidemiological-investigators. Only the data from subjects who responded to more than 50% of the survey items were included.
Office of Research Integrity, DHHS 1 American Institutes for Research
EXECUTIVE SUMMARY
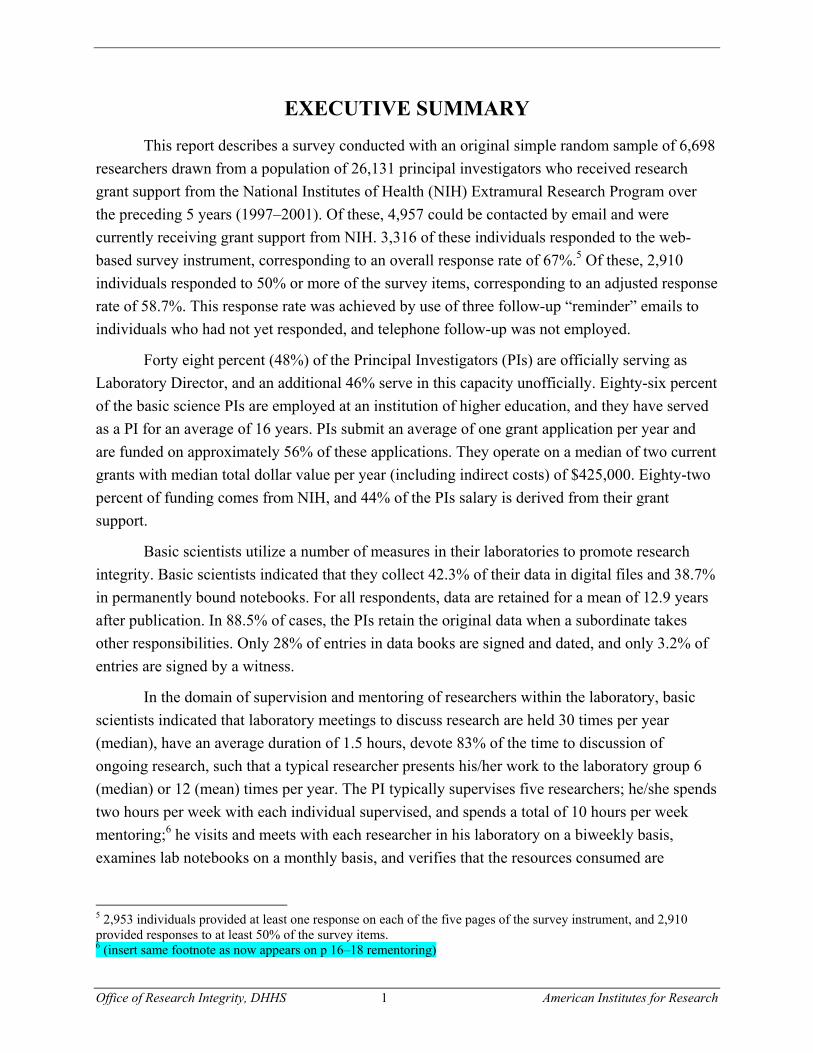
This report describes a survey conducted with an original simple random sample of 6,698 researchers drawn from a population of 26,131 principal investigators who received research grant support from the National Institutes of Health (NIH) Extramural Research Program over the preceding 5 years (1997–2001). Of these, 4,957 could be contacted by email and were currently receiving grant support from NIH. 3,316 of these individuals responded to the web-based survey instrument, corresponding to an overall response rate of 67%.5 Of these, 2,910 individuals responded to 50% or more of the survey items, corresponding to an adjusted response rate of 58.7%. This response rate was achieved by use of three follow-up “reminder” emails to individuals who had not yet responded, and telephone follow-up was not employed.
Forty eight percent (48%) of the Principal Investigators (PIs) are officially serving as Laboratory Director, and an additional 46% serve in this capacity unofficially. Eighty-six percent of the basic science PIs are employed at an institution of higher education, and they have served as a PI for an average of 16 years. PIs submit an average of one grant application per year and are funded on approximately 56% of these applications. They operate on a median of two current grants with median total dollar value per year (including indirect costs) of $425,000. Eighty-two percent of funding comes from NIH, and 44% of the PIs salary is derived from their grant support.
Basic scientists utilize a number of measures in their laboratories to promote research integrity. Basic scientists indicated that they collect 42.3% of their data in digital files and 38.7% in permanently bound notebooks. For all respondents, data are retained for a mean of 12.9 years after publication. In 88.5% of cases, the PIs retain the original data when a subordinate takes other responsibilities. Only 28% of entries in data books are signed and dated, and only 3.2% of entries are signed by a witness.
In the domain of supervision and mentoring of researchers within the laboratory, basic scientists indicated that laboratory meetings to discuss research are held 30 times per year (median), have an average duration of 1.5 hours, devote 83% of the time to discussion of ongoing research, such that a typical researcher presents his/her work to the laboratory group 6 (median) or 12 (mean) times per year. The PI typically supervises five researchers; he/she spends two hours per week with each individual supervised, and spends a total of 10 hours per week mentoring;6 he visits and meets with each researcher in his laboratory on a biweekly basis, examines lab notebooks on a monthly basis, and verifies that the resources consumed are
5 2,953 individuals provided at least one response on each of the five pages of the survey instrument, and 2,910 provided responses to at least 50% of the survey items. 6 (insert same footnote as now appears on p 16–18 rementoring)
Office of Research Integrity, DHHS 2 American Institutes for Research
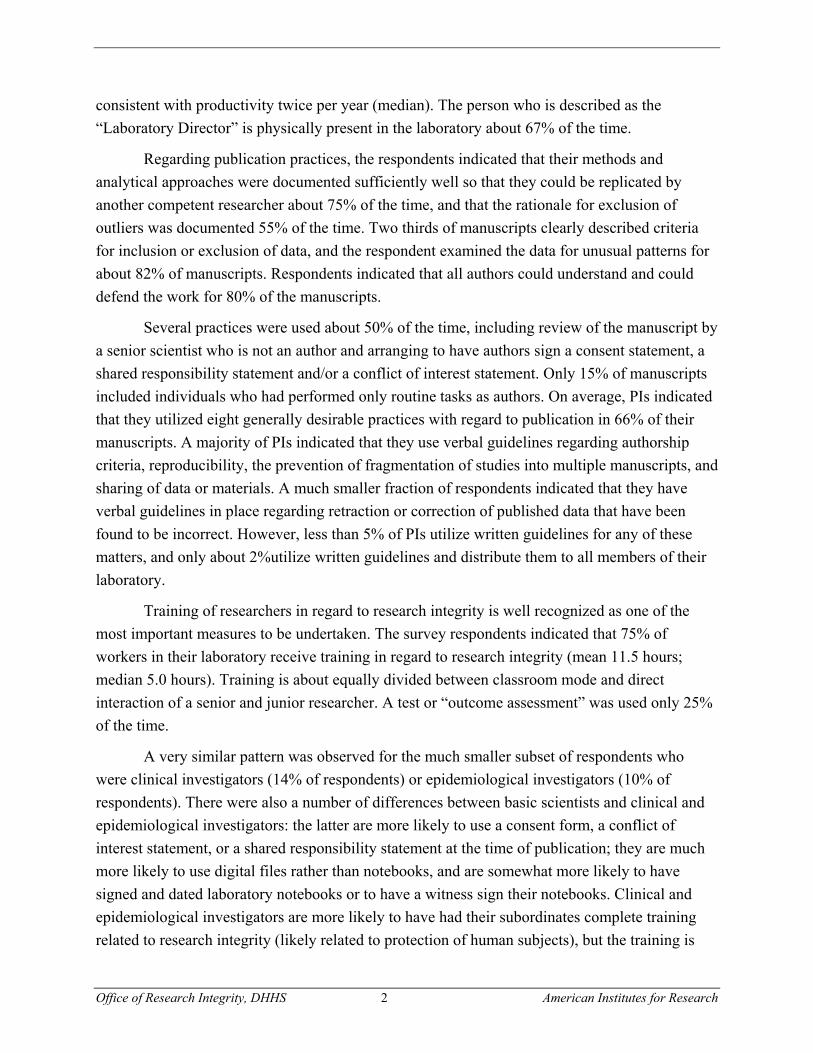
consistent with productivity twice per year (median). The person who is described as the “Laboratory Director” is physically present in the laboratory about 67% of the time.
Regarding publication practices, the respondents indicated that their methods and analytical approaches were documented sufficiently well so that they could be replicated by another competent researcher about 75% of the time, and that the rationale for exclusion of outliers was documented 55% of the time. Two thirds of manuscripts clearly described criteria for inclusion or exclusion of data, and the respondent examined the data for unusual patterns for about 82% of manuscripts. Respondents indicated that all authors could understand and could defend the work for 80% of the manuscripts.
Several practices were used about 50% of the time, including review of the manuscript by a senior scientist who is not an author and arranging to have authors sign a consent statement, a shared responsibility statement and/or a conflict of interest statement. Only 15% of manuscripts included individuals who had performed only routine tasks as authors. On average, PIs indicated that they utilized eight generally desirable practices with regard to publication in 66% of their manuscripts. A majority of PIs indicated that they use verbal guidelines regarding authorship criteria, reproducibility, the prevention of fragmentation of studies into multiple manuscripts, and sharing of data or materials. A much smaller fraction of respondents indicated that they have verbal guidelines in place regarding retraction or correction of published data that have been found to be incorrect. However, less than 5% of PIs utilize written guidelines for any of these matters, and only about 2%utilize written guidelines and distribute them to all members of their laboratory.
Training of researchers in regard to research integrity is well recognized as one of the most important measures to be undertaken. The survey respondents indicated that 75% of workers in their laboratory receive training in regard to research integrity (mean 11.5 hours; median 5.0 hours). Training is about equally divided between classroom mode and direct interaction of a senior and junior researcher. A test or “outcome assessment” was used only 25% of the time.
A very similar pattern was observed for the much smaller subset of respondents who were clinical investigators (14% of respondents) or epidemiological investigators (10% of respondents). There were also a number of differences between basic scientists and clinical and epidemiological investigators: the latter are more likely to use a consent form, a conflict of interest statement, or a shared responsibility statement at the time of publication; they are much more likely to use digital files rather than notebooks, and are somewhat more likely to have signed and dated laboratory notebooks or to have a witness sign their notebooks. Clinical and epidemiological investigators are more likely to have had their subordinates complete training related to research integrity (likely related to protection of human subjects), but the training is

Office of Research Integrity, DHHS 3 American Institutes for Research
shorter, more likely to be done by a self-paced method, and more likely to be accompanied by an outcomes assessment. These characteristics raise the possibility that the training was primarily directed to the subject of protection of human research subjects and not directed to a more general presentation regarding research integrity.
The total of 3,316 respondents offered more than 1,600 free-text comments making recommendations about what could be done to promote research integrity7. Foremost among these, were requests for educational materials that could be used in their laboratory for training and for guidelines. There was considerable interest in web-based materials. Researchers indicated that they were concerned about potential imposition of excessive or restrictive regulations that could hamper the productivity of their research.
This study provides a set of baseline data, which can be used to evaluate the impact of potential interventions to improve the frequency and quality of practices to promote research integrity.
Conclusions Based on the analysis and interpretation of both the quantitative and qualitative responses, we would make the following recommendations:
1) There appears to be a need for the development and dissemination of new and improved educational materials to promote research integrity in biomedical research laboratories. There appears to be a strong demand for these materials in multiple forms and formats, for multiple audiences.
2) There appears to be the need for development of written guidelines on a number of topics, for widespread distribution to biomedical researchers. Less than 5% of NIH-funded PIs and Laboratory Directors currently use written guidelines describing recommended practices for authorship, reproducibility, prevention of fragmentation of publications, prevention of multiple submissions of the same manuscript to more than one journal simultaneously, and promotion of sharing of data, methods, reagents and other materials, and for the proper handling of correction or retraction of any publication has been discovered to be erroneous or fraudulent.
3) There appears to be the need for development of outcome assessments that can be used to evaluate the effectiveness of training courses in regard to research integrity. These may involve cognitive aspects (awareness of principles or rules) but should also consider an assessment of changes in behaviors.
7 Some individuals provided multiple comments, others provided none.

Office of Research Integrity, DHHS 4 American Institutes for Research
4) In view of the findings that most researchers use loose-leaf notebooks, and do not sign or date their data books, nor arrange to have the data books witnessed, there appears to be a need for promotion of the development and adoption of electronic systems for recording data that would provide an “audit trail” to indicate accesses to and changes to the data.
5) It would be desirable to repeat a survey of the type conducted in the present study on a periodic basis to assess changes in response to interventions and other changes that may occur longitudinally with time.
6) In view of the many very substantive comments received as part of the qualitative data, the direct comments of the respondents (Appendix D) are most deserving of further study and review bythose seeking to understand current issues regarding methods to promote research integrity in biomedical research laboratories.
Office of Research Integrity, DHHS 5 American Institutes for Research
INTRODUCTION
The present study was commissioned by the Office of Research Integrity (ORI) Department of Health and Human Services (DHHS) Office of Research Integrity (ORI) to obtain baseline data on measures currently employed in biomedical research laboratories to promote research integrity. Although much has been written about matters related to scientific misconduct, and the possible measures to promote research integrity8, there are no previous studies of the extent to which various methods are employed by the mainstream biomedical research workforce. The original intent of the ORI had been to obtain information regarding the practices of “Laboratory Directors.” However, the NIH does not maintain a database of laboratory directors, and the definition of laboratory director may vary depending on scientific discipline, geographical regions, institutions, and even individuals. Accordingly, we have used the status of “Principal Investigator” as a proxy for Laboratory Director. In the survey instrument, we ask respondents to self-identify as to whether or not they are a laboratory director either officially or unofficially. For the present study, DHHS ORI elected not to study the scientists in the NIH intramural research program. This study consisted of several steps:
1) development of the survey instrument;
2) adaptation of the survey instrument to the web;
3) obtaining necessary clearances;
4) implementation of the survey including pilot studies;
5) data analysis; and
6) preparation of the final report.
Study Design
ORI originally intended that the study would involve 5,000 biomedical research scientists and had the optimistic expectation that it would be possible to achieve a response rate of 70%. Based on preliminary pilot studies, we expected that 16.0% of the email addresses in the database would not be operative, and that 11.87% of individuals would no longer be receiving grants from NIH. Accordingly, we increased the sample size to 6,698. By virtue of use of reminder emails sent three times at intervals of one to two weeks, we achieved a response rate of 67% of the estimated “eligibles” (biomedical scientists with operative email addresses and currently receiving funding from NIH), or 8 For literature review, cf. Mulqueen, C, and Rodbard, D. Survey of Research Integrity methods Utilized in Biomedical Research Laboratories: Literature Review. American Institutes for Research, Technical Report, November 2001.
Office of Research Integrity, DHHS 6 American Institutes for Research
approximately 50% of the total number of individuals in the sample. We obtained responses from 3,316 individuals. After screening out individuals who indicated that they did not collect data in any of the four most conventional types, or who failed to answer at least one item on each of the several pages of the survey, we obtained a set of 3,306 respondents. Of these, 2,910 responded to 50% or more of the items. This group of 2,910 subjects was used for the data analysis.
In order to reduce the burden on the study participants, we reduced the time required to complete the survey instrument, by creating two versions. Each of these versions omitted one of two sections of 15 survey items. This made it possible for most participants to complete the survey within 15 minutes, but it also resulted in approximately a two-fold decrease in the number of respondents for 30 of the survey items.
Both the quantitative and qualitative data collected by the survey proved to be extremely informative. The overwhelming majority of the respondents were principally engaged in basic biomedical research, and only a small percentage was principally engaged in clinical or epidemiological investigation. Preliminary analyses showed significant heterogeneity in the population, such that the basic scientists differed in several respects from the clinical and epidemiological investigators both in terms of basic demographics and in terms of some of their publication practices. These two considerations, combined with the original intent of the ORI to characterize the measures used to promote research integrity in biomedical research laboratories led us to focus most of our attention on this core group. In several instances, we shall compare the basic scientists with the clinical and epidemiological investigators, either to show common patterns or to highlight observed differences.
Organization of this Report
The main body of this report will present and discuss the most important findings.
These will be presented in terms of the responses to individual survey items, and clustered into several topics of interest (see box).
Office of Research Integrity, DHHS 7 American Institutes for Research
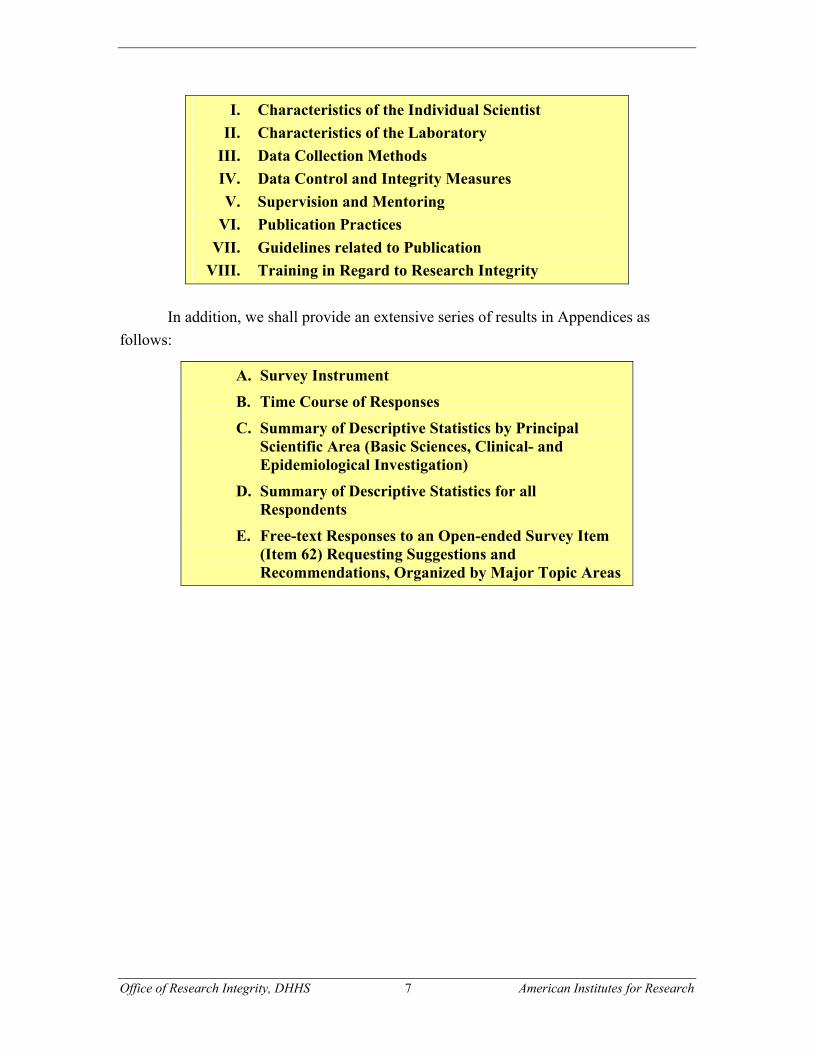
I. Characteristics of the Individual Scientist II. Characteristics of the Laboratory
III. Data Collection Methods IV. Data Control and Integrity Measures V. Supervision and Mentoring
VI. Publication Practices VII. Guidelines related to Publication
VIII. Training in Regard to Research Integrity In addition, we shall provide an extensive series of results in Appendices as
follows:
A. Survey Instrument
B. Time Course of Responses
C. Summary of Descriptive Statistics by Principal Scientific Area (Basic Sciences, Clinical- and Epidemiological Investigation)
D. Summary of Descriptive Statistics for all Respondents
E. Free-text Responses to an Open-ended Survey Item (Item 62) Requesting Suggestions and Recommendations, Organized by Major Topic Areas

Office of Research Integrity, DHHS 8 American Institutes for Research
METHODS
Sample Selection9
The population to be sampled for this research consists of principal investigators who have received funding from the National Institutes of Health to conduct biomedical or behavioral research since 1997. The NIH Consolidated Grant Application File (CGAF), which was linked to the NIH IMPAC-II database provided the population data. The research sample, chosen from the population of grantees, was originally selected to comprise 5,000 unique principal investigators. Subsequently, following initial pilot studies to estimate the percentage of email addresses that were functional and the percentage of individuals who were current NIH grantees, the sample size was expanded to 6,698. We obtained information concerning database fields from IMPAC Definitions And Specifications at the following URL: http://silk.nih.gov/PUBLIC/[email protected](VIA10.
Data Extraction and Preliminary Screening
The QRC Division of Macro International Inc. of Bethesda, MD extracted data from the NIH grant award database for the following grants awarded between FY 1995 and FY 2000: (a) Research Project Grants (traditional)–R01; (b) Small Research Grants–R03; (c) Research Career Program Awards K-series, individually identified; (d) Minority Biomedical Research Support (MBRS); (e) Support of Continuing Research Excellence (SCORE)–S06, S11, and S14; (f) Research Initiatives for Scientific Enhancement (RISE)–R25; and (g) Research Centers in Minority Institutions (RCMI)–G12. The final dataset contained 153,746 records representing unique awards (which included the name of the principal investigator). Of these 153,746 records, approximately 2,170 (or 1.4%) did not contain any institutional address information for the PI. These 2,170 records were also distributed similarly to the entire file. The final list of variables was also included as an attachment (i.e., final data fields.xls). AIR received the dataset as a zipped Microsoft Excel file.
Prior to selecting the sample, an AIR researcher screened the data for problems such as duplicate entries, outliers, and missing values using procedures outlined in
9 The methodology is described in considerable detail. Some readers may wish to proceed directly to the following Results section. 10 Information was originally obtained in December, 2001 and confirmed to be available October 15, 2003. See sections 111 and 123 for Discipline, Specialty, Field (DSF) codes and Scientific Class, Discipline, or Field Codes.

Office of Research Integrity, DHHS 9 American Institutes for Research
Tabachnick and Fidell (1996).11 We noted the following issues with the data and took these steps to resolve them:
• Dates: Dates were provided in century date format (e.g., a five-digit number reflecting number of days since a specified start date). Century dates are not interpretable without the start date, which was not available to AIR until after the population dataset had been completed. Since it was critical to identify the most recent grant when a principal investigator had been awarded multiple grants, but the actual date represented by this number was not important, the century dates were used with the highest value interpreted as the most recent date. The data for budget period start date and budget period end date were strongly related (r = .988). The difference was usually between 364 and 365 days, with the presence of a few 2-year grants.
• PI Age: The values for age were dates of birth, a format not directly suitable for the current research. We computed a new variable AGE by selecting only the year from the value BIRTHDAY, and then subtracting this value from 2002. This calculation produced original values for age ranging from –17 to 98 (mean = 51.04, SD = 9.50). Inspecting a sample of the negative values for BIRTHDAY revealed that the original data set contained dates in the future for date of birth. Analysis of the original range suggested that values less than 22.5 and greater than 79.6 were outliers (greater than + or –3 SD) and revealed natural break points at age = 29 and age = 84. Consequently, values for age 28 and below and 85 and above were recoded as missing for further analyses.
• PI Names: There were 187 instances of principal investigators in the initial sample of 5,000 with multiple versions of their name in the file (mostly two versions, in five instances three). Inspection of these instances suggested the majority reflected one of three situations: (a) change in marital status of female investigators (e.g., the same IDNUMBER could be listed as Smith, Jones, and SmithJones); (b) truncated versions of lengthy names (such as LAUFFENBURGER versus LAUFFEN); or (c) the addition of unnecessary spaces after the name such as Smith[space] versus Smith). These were corrected individually by choosing either the longest name, the multiple name, or the name without the extra spaces. In one instance, there were two completely different names for one ID Number. One name was selected. This reduced the data set by 314 observations.
11 Tabachnick, B. G. & Fidell, L. S. (1996). Using multivariate statistics (3rd ed). New York: HarperCollins.

Office of Research Integrity, DHHS 10 American Institutes for Research
• Department Names: There are 1,827 unique values for department name in just the first 55,000 grants, which were names rather than categories. Consequently, data for this variable were determined to be of limited usefulness and not used further.
• PI Degrees: The variables indicating academic degrees awarded to the principal investigator (DEGREE) contained duplicate, inconsistent, and extraneous information. The data set included three degree variables (DEGREE1, DEGREE2, and DEGREE3). It appeared that some grant applicants listed degrees 1, 2, and 3 in order received, while others listed them according to descending academic level (PHD, MS, and BA). Some listed only graduate degrees, while others included bachelor and masters-level degrees even when the data set also reflected award of doctoral degrees. As would be expected when the data are initially collected as text inputs, comparable degrees were not coded consistently. For example, PH.D, PHD, PDH, PHD*, PH, PH[; and both MD and M.D. appeared within the data. Consequently, we limited data on academic degree to four categories: only PhD, only MD, both PhD and MD, or neither PhD nor MD.
• Discipline, Specialty, Field (DSF) Codes:12 The data set included 209 unique DSF codes. Consequently, data for this variable were determined to be of limited usefulness and not used further.
• Scientific Class, Discipline, or Field Code:7 The primary scientific class, discipline, or field code included at least 53 possible categories. We selected data from the most recent grant for each PI. We noted several codes that were not listed in the descriptive document for the IMPAC (Information for Management, Planning, Analysis, and Coordination) extramural program database.
• Mailing Addresses: As would be expected when the data are initially collected as text inputs, the structure of the mailing address variables was inconsistent across individuals and within individuals across different grants. For example, Address Line 1 and Address line 2 were not consistently either department or organization name. Sometimes the PI name was in line 1, with the mailing address in subsequent lines. Sometimes line 5 contained the city, state, zip, while in other cases these were in separate city, state, zip variables, sometimes both but without complete data. One PI in part 1 contained an
Office of Research Integrity, DHHS 11 American Institutes for Research
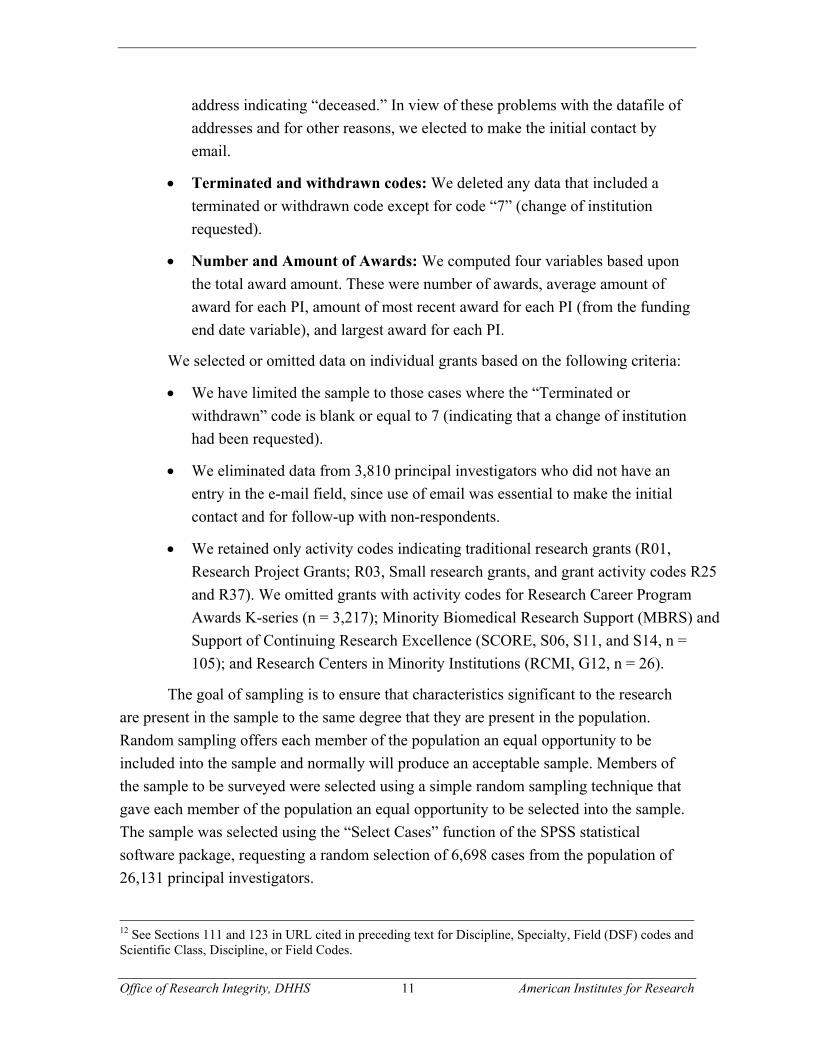
address indicating “deceased.” In view of these problems with the datafile of addresses and for other reasons, we elected to make the initial contact by email.
• Terminated and withdrawn codes: We deleted any data that included a terminated or withdrawn code except for code “7” (change of institution requested).
• Number and Amount of Awards: We computed four variables based upon the total award amount. These were number of awards, average amount of award for each PI, amount of most recent award for each PI (from the funding end date variable), and largest award for each PI.
We selected or omitted data on individual grants based on the following criteria:
• We have limited the sample to those cases where the “Terminated or withdrawn” code is blank or equal to 7 (indicating that a change of institution had been requested).
• We eliminated data from 3,810 principal investigators who did not have an entry in the e-mail field, since use of email was essential to make the initial contact and for follow-up with non-respondents.
• We retained only activity codes indicating traditional research grants (R01, Research Project Grants; R03, Small research grants, and grant activity codes R25 and R37). We omitted grants with activity codes for Research Career Program Awards K-series (n = 3,217); Minority Biomedical Research Support (MBRS) and Support of Continuing Research Excellence (SCORE, S06, S11, and S14, n = 105); and Research Centers in Minority Institutions (RCMI, G12, n = 26).
The goal of sampling is to ensure that characteristics significant to the research are present in the sample to the same degree that they are present in the population. Random sampling offers each member of the population an equal opportunity to be included into the sample and normally will produce an acceptable sample. Members of the sample to be surveyed were selected using a simple random sampling technique that gave each member of the population an equal opportunity to be selected into the sample. The sample was selected using the “Select Cases” function of the SPSS statistical software package, requesting a random selection of 6,698 cases from the population of 26,131 principal investigators.
12 See Sections 111 and 123 in URL cited in preceding text for Discipline, Specialty, Field (DSF) codes and Scientific Class, Discipline, or Field Codes.

Office of Research Integrity, DHHS 12 American Institutes for Research
Descriptive Statistics for Population and Proposed Sample
We computed descriptive statistics for a large number of variables for the underlying population and for the sample. The criteria included the following: gender, age and degree(s) of the principal investigator, grant activity code, nature of the organization (e.g., institution of higher education), and scientific class, discipline, or field), average amount of award per PI, number of awards per PI, largest award per PI, total amount of awards per PI, dollar amount of PI’s most recent award, and date of most recent award. Only trivial differences emerged between population and sample means and standard deviations, again supporting the position that the sample accurately represents the population on important characteristics.
Development of the Survey Items
The survey items were developed by a team of five investigators with considerable collective experience in the development and analysis of surveys. Considerations included: relevance to the goals of the ORI, coverage of all major subject matter areas, clarity, brevity, simplicity, ease of understanding by a broad and diverse group of individuals in the underlying population and sample, and precision. For example, if a question were to be asked about events for the “previous year,” there might be confusion as to whether this referred to the calendar year, the academic year, the fiscal year, or the immediately preceding 12 month period. Accordingly, we specified, in almost all cases, that we were interested in the immediate preceding 12-month intervals. We tried to focus the respondent to consider only their NIH-funded or federally funded research. In some cases, it would have been desirable to ask the respondent, to enter his or her estimate of the percentage of time that they exhibited some behavior, such as storing data in permanently bound data books. However, based on prior experience, we felt that this would place an undue burden on the respondent, and result in an increased amount of time to complete the survey, and hence a reduced response rate. Accordingly, to simplify the decision making for the respondent, we provided “radio-buttons” that would force the selection a given category, e.g., 0% of the time, 1–33% of the time, etc. We utilized text boxes for entry of a numerical response only in a few cases where we felt that the respondent would be likely to know the answer fairly precisely (e.g., number of current active grants, dollar value of current active grants, number of mentees, number of supervised researchers, number of laboratory meetings in the past year, average duration of laboratory meetings, etc.).
We sought to minimize the chance that the respondent would reply with “hearsay” evidence of which he or she could not be certain. Hence, we asked only about the

Office of Research Integrity, DHHS 13 American Institutes for Research
behavior of the respondent himself/herself, and not about the behavior, beliefs, or values of others. Likewise, we discarded potential questions about the institution when the respondent might not be aware of the answer. To achieve satisfactory precision of the questions, it was sometimes necessary to utilize a slightly more detailed question than would be used in common daily parlance. The survey items were subjected to a critique by a series of researchers (biomedical researchers, social and behavioral scientists, survey researchers, and others) on several occasions to evaluate whether the survey items were appropriately understood and interpreted, and to seek advice regarding inclusion, exclusion or modification of the survey items. A database was developed to monitor changes in the survey items on successive iterations. This included notes regarding the reasons for change, the date of change, and the person making the change. A draft of the survey was provided to and discussed with the Project Officer on several occasions, and the Project Officer distributed drafts of the survey instrument to a Technical Advisory Panel for discussion and comment. Meetings and teleconferences were convened to permit the AIR research staff to meet with the Project Officer and with the Technical Advisory Panel. In the final stages of development, we sought to reduce the number of survey items in order to retain the ability to achieve a 15 minute response time for most participants. As a result, after conducting a power analysis, it was decided to create two versions of the survey instrument that would be administered at random to survey respondents. The two versions each omitted a block of 14 survey items: items 27–40 in Version A, and items 11–24 in Version B, respectively. We utilized an automated system to randomize the order of presentation of items 27–34 in version B, in order to minimize or eliminate “order effects” due to influences from the questions, answers, or ideas generated from exposure to the previously asked questions.
Web-Based Survey Methodology
The survey instrument was entered into a web based form for testing and time trials, initially using the “Informant” (later termed “Edoceon”) proprietary web-based survey development tool developed by AIR. Subsequently, the survey was entirely re-hosted using html and XML, with data transfer to SAS.
The web based data collection system was developed using Microsoft SQL Server 7 and ASP technology. Survey web pages are developed in HTML, VBScript and JavaScript and data were stored in a SQL Server 7 database. The system was highly customized to handle several idiosyncratic requirements of this particular data collection effort. Our web-based data collection system:
• allowed users to register their login ID and password at the first time they logged in to ensure security
Office of Research Integrity, DHHS 14 American Institutes for Research
• randomly assigned two versions (A and B) of the survey instrument
• presented questions 16 to 23 in random order to avoid “order effects”
• allowed respondents to log off and return to complete the survey at a later time
• provided respondents with the option of refusing to answer any item
• assigned unique internal identification numbers to each respondent to protect confidentiality and to prevent duplicate response
• checked validity of responses and provided notification to users of any inconsistent or improbable responses for selected items
• provided both email and phone technical support
• allowed real-time monitoring of response rate and percentage of completed survey instruments
• automatically sent three reminders at 7–10 day intervals to non-respondents
• provided “24/7” availability and technical support, with hosting on a third-party server
• provided compatibility with a wide range of platforms with a wide variety of browsers to ensure that the vast majority of potential respondents will not encounter technical difficulties.
The web based survey functioned very effectively and reliably. Of the nearly 5,626 individuals in the sample, we received less than 6 requests for a hard copy of the survey form. We provided these individuals with a hard copy, and data from those individuals was entered by AIR staff manually. We received a number of emails from participants and responded whenever appropriate.
IRB and OMB Clearance
The experimental design and protocol, and prototypes of the survey instrument, cover letter of invitation and follow-up letters were submitted for review by the East Coast Institutional Review Board (IRB) of the American Institutes for Research. This study was rated as “not greater than minimal risk” and approved with an expedited review.
AIR participated in preparing the package for review by the Office of Management and Budget. The survey was approved and given an OMB number of 0990-0262 (issued June 19, 2002; expired June 30, 2003).

Office of Research Integrity, DHHS 15 American Institutes for Research
Pilot Testing
We conducted a small-scale pilot test by sending an email to 1,092 individuals to verify whether the email addresses were correct. From this, we obtained an estimate that 16.0% (100*175/1,092) of the email addresses were no longer operative. Further, we sent an inquiry to 903 members of the sample asking the individual to respond if they were no longer an NIH-funded principal investigator. Making the conservative assumption of a 70% response rate for this inquiry, we estimated that 11.87% = 100*(75/903)/(0.70) of the members of the sample were no longer principal investigators. Combining the information regarding operative email addresses and current status as an NIH-funded PI, we estimated that 74.0% of the names in the sample would be eligible to participate in the study and 26.0% would not be eligible to participate. The value of 74.0% was calculated as 100*[1 – (1 – 0.16)(1 – 0.12)]. The calculated response rate was adjusted accordingly (cf. Appendix B).
Response Rate
Calculation of the response rate is summarized in Exhibit 1.
Exhibit 1: Response Rate for the Survey Number %
1. Size of population 26,131
2. Size of Sample 6,698
3. Sample size corrected for number of functional email addresses
5,626
4. Sample size corrected for email addresses and for individuals no longer serving as PIs on NIH-funded grants
4,957 100.0%
5. Total number of Respondents 3,316 67.0%
6. Respondents with ‘complete’ response by first criterion: “Submit” on every page
2,953 59.6%
7. Respondents with ‘complete’ response by second criterion: 50% of responses were complete
2,910 58.7%
Exhibit 1. Summary of Population, Sample, “Eligible” candidates (with functioning email address and currently serving as a PI on an NIH funded research grant), and respondents.
ORI had hoped to achieve a somewhat higher response rate, e.g., 70% to 80%. However, after three reminder emails, the response rate essentially plateaued. This study was not designed with provision for telephone follow-up.

Office of Research Integrity, DHHS 16 American Institutes for Research
Comparison of Respondents and Non-Respondents
We sought to investigate whether the properties of the respondents were similar to those of the non-respondents. We examined a number of properties of these two groups: gender, degree, age, type of organization or institution, mean dollar value of grant awards, number of awards, total awards. These analyses were performed with no truncation or censoring of the variables. There was no significant difference at the P < 0.05 level for gender and size of the mean award. The other variables showed differences that were statistically significant at the P < 0.01 level. Respondents tended to be slightly older (by 1.5 years) and have higher values for mean award, maximum award, number of awards, and total dollar value of awards (Exhibit 2).
Exhibit 2. Comparison of Characteristics of Non-Respondents and Respondents
Variable Non-Respondents (Mean ± Std. Dev.)
Respondents (Mean ± Std. Dev.)
Gender (% male) 66.0% 65.6%
Degree (% PhD) 69.8% 71.1%
Age (years) 52.4 ± 9.0 50.9 ± 8.2
Organization (% higher education)
83.6% 82.4%
Mean Award ($) $212,000 ± $123,000 $232,000 ± $127,000
Maximum Award ($) $263,000 ± $199,000 $295,000 ± $187,000
Number of Awards 4.5 ± 3.7 5.5 ± 4.0
Total Awards ($ millions) $M 1.1 ± 1.2 $M 1.3 ± 1.3
Exhibit 2. Comparison of characteristics of non-respondents and respondents. Results are shown as Mean ± 1 standard deviation. Differences between groups were significant at the P < 0.01 level except for gender and mean award size (NS). These analyses were based on 6,698 observations
In most cases we were dealing with a total sample size of 5,626individuals (2,310 non-respondents and 3,316 respondents). With an average of 2,813 individuals in each of the respondent and non-respondent categories, the standard error of the mean is (2,813)1/2
or 53-fold smaller than the standard deviation. These tiny standard errors of the mean are primarily responsible for the significance of the differences. The magnitudes of the differences do not appear to be substantial or likely to alter the conclusions or interpretation of the present study. In retrospect, it is not surprising that individuals who are older, have received more NIH grant awards, larger awards, and larger cumulative awards, would be somewhat more likely to respond to the survey.
Office of Research Integrity, DHHS 17 American Institutes for Research
Preliminary Data Analysis
Data cleaning: Approximately 0.3% of respondents indicated that they never retain data in any of the four principal methods described in survey items 1–4. This was interpreted to mean that they were not involved in research activities, and all responses from this tiny subset of the data were excluded from further analysis.
If the respondent answered less than 50% of the questions, then all data for that individual were excluded. This was to avoid inclusion of data from subjects who might have responded to a few of the questions but failed to complete the questionnaire. This was desirable in view of our interest in correlating the responses to different questions, which could be biased if a few individuals responded only to a few questions. This resulted in the exclusion of responses from 276 individuals.
Analysis of Frequency Histograms and Cumulative Distribution Function and Development and Rationale for Rules for Censoring Data
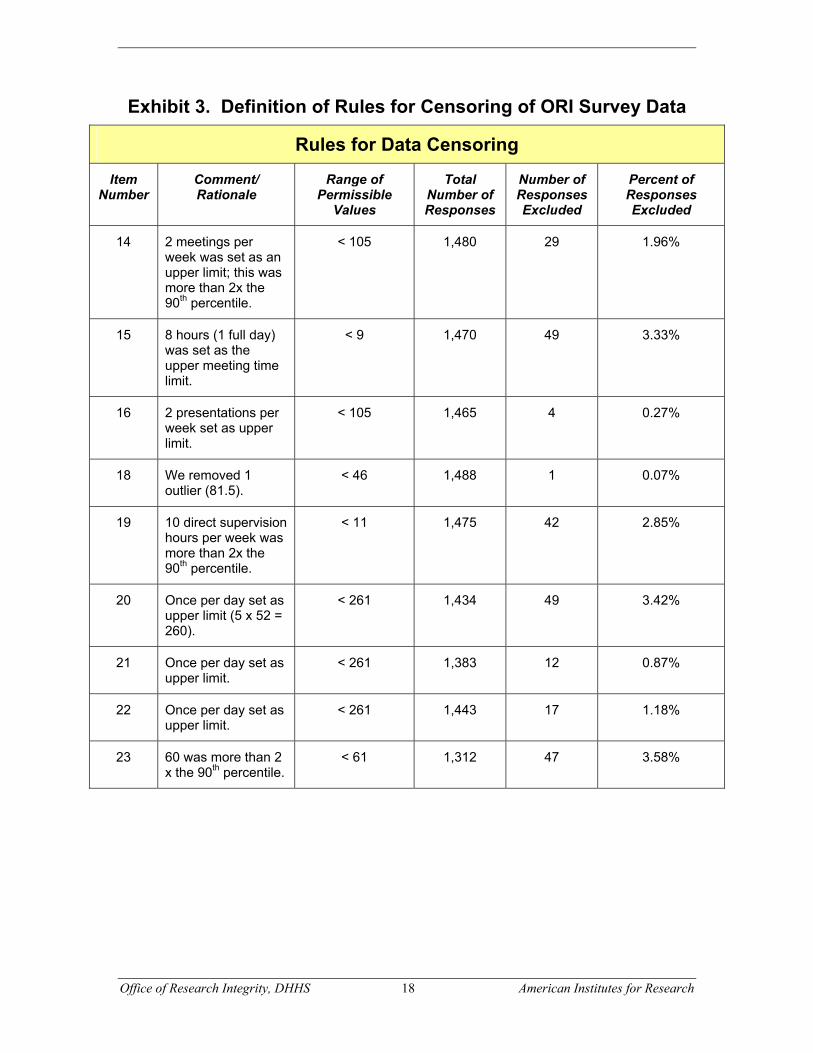
Exhibit 3 shows the criteria that were used to screen the data for atypical or aberrant values that were either physically impossible or implausible. In many cases we utilized values that were more than two-fold higher than the 90th percentile for the frequency distribution of responses.
Office of Research Integrity, DHHS 18 American Institutes for Research
Exhibit 3. Definition of Rules for Censoring of ORI Survey Data
Rules for Data Censoring
Item Number
Comment/ Rationale
Range of Permissible
Values
Total Number of Responses
Number of Responses Excluded
Percent of Responses Excluded
14 2 meetings per week was set as an upper limit; this was more than 2x the 90th percentile.
< 105 1,480 29 1.96%
15 8 hours (1 full day) was set as the upper meeting time limit.
< 9 1,470 49 3.33%
16 2 presentations per week set as upper limit.
< 105 1,465 4 0.27%
18 We removed 1 outlier (81.5).
< 46 1,488 1 0.07%
19 10 direct supervision hours per week was more than 2x the 90th percentile.
< 11 1,475 42 2.85%
20 Once per day set as upper limit (5 x 52 = 260).
< 261 1,434 49 3.42%
21 Once per day set as upper limit.
< 261 1,383 12 0.87%
22 Once per day set as upper limit.
< 261 1,443 17 1.18%
23 60 was more than 2 x the 90th percentile.
< 61 1,312 47 3.58%

Office of Research Integrity, DHHS 19 American Institutes for Research
Exhibit 3. Definition of Rules for Censoring of ORI Survey Data (Continued)
Rules for Data Censoring
Item Number
Comment/ Rationale
Range of Permissible
Values
Total Number of Responses
Number of Responses Excluded
Percent of Responses Excluded
25 We removed two outliers (120 and 150).
< 61 3,019 2 0.07%
27 100 hours per week was set as the cutoff.
< 101 2,985 5 0.17%
28 100 hours per week set as the cutoff.
< 101 3,004 4 0.13%
29 100 hours per week set as the cutoff.
< 101 3,003 3 0.10%
54 Upper limit set at 25; this represented 1 grant application every 2.5 months over 5 years.
< 25 2,918 24 0.82%
55 Upper limit set at 20; this was 4 grants per year and is 4 x the 90th percentile.
< 21 2,927 8 0.27%
56 We removed two outliers (1,130 and 1,250).
< 23 2,937 2 0.07%
57 Below $10,000 and above $10 million were viewed as unreasonable amounts of annual federal funding.
> 10,000 and < 10,000,000
2,781 47 1.69%

Office of Research Integrity, DHHS 20 American Institutes for Research
Statistical Analysis
Descriptive Statistics Twenty four of the survey items utilized a 5 point ordinal response scale (0%, 1–
33%, 34–66%, 67–99%, 100%).13 We have presented the data in terms of the calculated mean and standard error of the mean (sem). The mean, variance and standard deviation were calculated using standard formulas for grouped data, using the midpoint of each category as the value for calculation. For example, entries in the category 1–33 were assigned a value at the midpoint. 16.5%. Responses in the category 33–66% were given a value of 50.0%, and similarly, responses in the category or interval 67–99 were given a value of 83.5%.) Strictly speaking the midpoints should have been 16.67, 50, and 83.33, but the differences due to this adjustment were trivial. In preliminary analyses we demonstrated that there would be only trivial changes in outcomes if we were to use an equidistant spaced scale (1,2,3,4,5) for the five categories.
For twenty survey items14 where the respondents were provided with a text box to enter a numerical value (number of years as a PI, number of scientists mentored, number of laboratory meetings in the past 12 months, current research support (dollars), etc.), we first constructed a frequency distribution and cumulative frequency distribution to examine the general nature of the distribution and to check for outliers. As might be expected, the tails of the distribution often included some unusual or even bizarre values (e.g., a level of grant support of 340, which might have been intended to represent $340,000). We set limits for acceptable responses (Exhibit 3), and values outside that range were omitted (“censored”). For the remaining values, we used SAS to compute the sample mean, sample standard deviation, and standard error of the mean. In addition, we calculated the median, 25th, and 75th percentiles and the range.
Analysis of Variability: In addition to focusing on the measures of central tendency (mean, median), it is important to consider the large degree of variability of the responses. One can convert the standard error of the mean (as displayed in several of the exhibits and in Appendices C and D) into the standard deviation by multiplying by the square root of the number of observations for any particular survey item. Also, one can calculate the “inter-quartile range” as the difference between the 75th and 25th percentiles for those survey items that resulted in a continuous response variable. The inter-quartile is approximately 2.36 standard deviations in the case of a response variable with a “normal distribution.” For example, in many cases, very few Principal Investigators
13 Survey items 1–10, 17,24, 30–37, 44,48,59 utilized the same kind of five-point response scale 14 Survey items 14–16, 18–23, 25,27–29, 45, 52–57 employed a text box for continuous variables

Office of Research Integrity, DHHS 21 American Institutes for Research
employ a research integrity measure 100% of the time; often, the majority of respondents will use a particular measure between 34 and 66% of the time, while a sizeable minority may use them less than 33% of the time.
The results for all respondents are summarized in Appendix D. Analyses of the data in this exhibit indicated that there were several cases where there was heterogeneity between the results for individuals who self-classified as basic scientists, clinical investigators, or epidemiological investigators in survey item 50.
Basic scientists were those who indicated that their primary research activities involved: genetic/genomic, biochemical (subcellular), cell biology, studies of organs (liver, heart, etc.) or of “non-human organisms (such as chimpanzees or fruit flies).” In this survey item, we did not permit the respondents to select more than one option, since the goal was to force a response “that best characterizes the work funded by my NIH grants.” Approximately 2,185 respondents described themselves as basic scientists by this criterion, whereas only 407 described themselves as clinical investigators (study of individual humans (e.g., clinical research including clinical trials)), and only 296 categorized themselves as epidemiological investigators (type of research: “populations of humans, epidemiology, or health services research”). In view of the marked disparity in the size of these groups, we shall describe results separately and also examine the differences between these groups. There was no simple correlation of degree (PhD, MD, PhD/MD, or “Other professional degree”) and nature of the principal type of research. For example, many PhDs conduct clinical and epidemiological research; many clinicians conduct basic sciences research (with the NIH-funded studies), and PhD/MDs tend to be considerably more concentrated in basic research than either PhDs or MDs. Several differences were apparent when comparing basic scientists and clinical investigators, which were not apparent when comparing MDs, PhDs, and PhD/MDs.
When results involved a “binomial distribution” or could be mapped into a binomial distribution, we computed the standard error of the proportion (sep) and the 95% confidence limits or interval (placed at approximately p ± 2 sep). This would apply to percentages of individuals who describe themselves as being “Laboratory Director” or who indicate that they “Strongly Agree” or “Agree” with the statement “In the past, I had a mentor who prepared me well to be a good mentor to the researchers who work I supervise today” (survey item 26).
Survey results regarding the retention of data (survey items 11,12,13) were analyzed using an approach similar to that of survival analysis or “life tables.” The intervals provided to the respondents were 0 to 2 years; 3 to 4 years; 5 to 9 years, 10 to 15 years and “16 or more” years. The midpoints of these intervals were taken as 1.5, 4, 7.5,
Office of Research Integrity, DHHS 22 American Institutes for Research
13, and 19 years, respectively15. It was assumed that 50% of the data discarded during one of these intervals were discarded before the midpoint of the interval and the remainder by the close of the interval. Results were plotted as % of data still being retained versus time. The “median survival time” for the data was then estimated.
Additional analyses included the following: unpaired Student’s t tests (two sided, assuming homogeneity of variance, alpha level = 0.01 in view of the multiplicity of comparisons being made), correlation matrices for groups of variables and linear regression analyses. We also computed multiple linear regression, e.g., for a response variable (or composite response variable) as a function of status as laboratory director (survey item 49), whether the respondent previously had a mentor who prepared him/her to be a good mentor to the researchers he/she now supervised (survey item 26), and the size of the laboratory (number of researchers supervised ≤3 or ≥ 4).
Development of Composite Variables
It is difficult to synthesize results from more than 60 individual survey items. The items had been developed, a priori, and were administered in groups that were intended to be coherent and addressing a common theme.
We expected, and observed, a high degree of correlation of responses for the several items within a given category or general subject matter. By obtaining a composite measure, we expected to be able to reduce the level of variance and thus obtain an improved “signal to noise ratio,” i.e., a stronger and more significant effect. Further, consistency of results for multiple related and correlated survey items helps to establish the “robustness” of results.
The three composite variables that were created include the following:
Composite Variable # 1: “Data control and integrity measures,” based on the responses to six items, survey items 5–10. For each of these questions, we set a threshold of a response of ≥ 34%. Thus, to gain a “point” for any one of these questions, the respondent would need to claim that he/she has engaged in this practice 34–66% of the time (in terms of experiments), 67–99%, or 100%, corresponding to a subjective response that might be characterized as “generally” (about 50% of the time), “usually” (about 83% of the time), or “always” (100% of the time). Accordingly, the score for each individual could range from 0 to 6. We excluded data from any individual who failed to respond to any of the 6 survey
15 We expected that the respondents would interpret the intervals as 0–2.99, 3–4.99, 5–9.99, 10–15.99, and ≥ 16, respectively. These values were used for calculation of the midpoints.
Office of Research Integrity, DHHS 23 American Institutes for Research
items, or if any of the responses were “Don’t Know.” In turn, the responses were re-expressed as a percentage or score:
Y1 = 100 (Sum of points)/6
Composite Variable # 2: “Publication Practices (Survey items 30–37).” This composite variable was computed in a manner very similar to that of Composite Variable # 1. For the 8 survey items 30–37, we provided a “point” if the response was ≥ 34%, and no points if the response was in the range 0–33% of manuscripts (not experiments). Each of the survey items 30, 32–37 corresponded to a “better” or approved practice if true. However, survey item 31 reflected a practice that is generally regarded as inappropriate, i.e., the inclusion of someone as an author if his/her only contribution was to perform repetitive or routine tasks needed to complete the research. Accordingly, the scale for this survey item was reversed, and a point was assigned only if the response was 0 to 66%, and no point was assigned if the response was 67–99% or 100%. Data were excluded if the respondent failed to answer one or more of the 8 survey items, or if any of the responses were “Don’t Know.” The resulting composite variable originally had a range from 0 to 8. This was re-expressed using a percentage scale:
Y2 = 100 (Sum of Points)/8
Composite Variable # 3: “Guidelines for Publications” (Survey Items 38–43).” We allowed for four types of guidelines for any given subject area:
1) written guidelines for all members of the laboratory 2) written guidelines for some members of the laboratory 3) verbal (oral) guidelines for all members of the laboratory 4) verbal (oral) guidelines for some members of the laboratory.
In turn, this means that we could analyze results in terms of “any” guidelines (written or verbal) for some or all members of the laboratory (responses 1–4, above); in terms of written guidelines (only responses 1 and 2); verbal guidelines (only responses 3 and 4); guidelines for all members of the laboratory—irrespective of whether the guidelines were written or verbal (only responses 1 or 3), or guidelines for some members of the laboratory (only responses 2 and 4). For simplicity, we elected to analyze results in terms of “any guidelines.” Based on preliminary analyses, we know that only about 5% or less of the respondents indicated that they used written guidelines for some or all members of their laboratory. Hence, use of “any” guidelines is primarily reflecting the use of verbal guidelines, and predominantly distributed to some rather than all members of the laboratory.

Office of Research Integrity, DHHS 24 American Institutes for Research
We excluded responses from individuals who had failed to respond to all six of the survey items (38–43), or who had responded “Don’t Know” to one or more of these items. We then computed the sum of the points, so the response variable had a range from 0 to 6. This was re-expressed using a percentage score as:
Y3 = 100 (Sum of Points)/6
The use of these three composite variables enables us to combine or collapse the information present in 20 survey items into just three scores which summarize the results from nearly half of the questions that relate to research integrity measures.
Additional Analyses
Dichotomizing of continuous variables: In several cases it is convenient to convert either continuous or discrete variables into a dichotomized variable. For example, the “wealth” of institutions in terms of level of grant support for research from NIH may be dichotomized. Based on data provided by the NIH Office of Extramural Research, we observed that 42 institutions received half of the funding from NIH over the 5 year period 1998–2002, and that nearly 800 other institutions received the other half. Hence, we identified the respondents from those 42 institutions and compared them with the approximately equal number of respondents from all of the other institutions. Similarly, we dichotomized variables as follows:
Prior mentor (survey item 26): regard “Strongly Agree” or “Agree” as 1; other responses as “0”; exclude individuals if they indicated “Don’t Know”
Size of Lab: number of supervised researchers ≥ 5 vs ≤ 4 (excluding responses of “Don’t Know”)
Size of Lab: number of mentees ≥ 4 vs ≤3 (excluding responses of “Don’t Know”)
Level of current Research funding: ≥ $450,000 versus < $450,000
Number of Federal Grants: ≥ 2 versus ≤ 1
Years as PI: ≥ 14 vs ≤13 years (excluding responses of “Don’t Know”)
Status of Laboratory Director: Laboratory Director “No” = 0; “Yes” (officially unofficially) = 1;
Gender: Male = 0; Female = 1.

Office of Research Integrity, DHHS 25 American Institutes for Research
Graphical Displays
We have employed a wide variety of graphical displays to present the data including bar charts, stacked bar (or column) charts, pie charts, x-y plots (scattergrams), and displays of mean ± 1 sem or of the mean and 95% confidence interval (95% CI) for a continuous variable or for an estimate of a proportion for binomial variables. For each case, we have attempted to select the type of graphical display that will most clearly present the evidence for the magnitude of an effect or otherwise to make the data as compact and manageable as possible. In this study we have a very large number of potential comparisons, e.g. comparing the result for a response variable (dependent variable) as a function of perhaps a dozen independent variables (gender, degree, age, years as PI, field of science, wealth of the institution, laboratory director status, size of laboratory (number of researchers supervised, number of mentees), number of grants, level of funding from grants, experience with a previous mentor, etc.). A convenient approach to screen these effects was to examine the ratio of the response to any one of the survey items for a particular group or subgroup of respondents relative to the mean response for the entire population of survey respondents. A large number of such graphs were constructed in preliminary analyses.
Qualitative Analysis of Suggestions from Respondents to Promote Research Integrity in Biomedical Research Laboratories (Survey item 62)
The penultimate question in this Survey of Research Integrity Measures Utilized in Biomedical Research Laboratories, was a large text-box preceded by the instruction:
“We would be very interested in your suggestions about measures that researchers, institutions, professional societies, journal editors and editorial boards, foundations, or government agencies could undertake to promote scientific integrity and the responsible conduct of research. Please enter your comments in the space below.”
All responses to question 62 were examined by one reviewer. Based on this initial review, a series of 15 primary content topics were created, in view of the fact that there appeared to be recurrent themes (cf. Table E.1 in Appendix E). In addition, we created two secondary codes (“little or no value to response” and “other”). Each comment was then re-read and labeled with all applicable content codes. This coding enabled us to obtain a count of the number of responses that address the topic of each code.
Exhibit 28 (page 71) displays the dominant themes of responses and shows the frequency of recommendations for each topic. Four topics were referenced more than 100
Office of Research Integrity, DHHS 26 American Institutes for Research
times. The majority (10) of the codes were applicable to between 50–100 comments. Only two codes were referenced less than 50 times. Over 200 comments did not appear to be principally related to one of the 16 major topics. Accordingly they were assigned code “17 – Other”. These comments were very heterogeneous in nature and could not be easily catalogued using a small set of categories.
RESULTS
We have conducted analyses for four separate groups of survey respondents: basic scientists, clinical investigators, and epidemiological investigators, and the entire set of respondents. The dataset for this subset of analyses accordingly to principal field of research is presented in Appendix C. The dataset for all respondents is presented in Appendix D.16
16 Appendix D includes all of the results shown in Appendix C, and in addition provides breakdowns by other variables not shown in Appendix C.

Office of Research Integrity, DHHS 27 American Institutes for Research
A. CHARACTERISTICS OF SURVEY RESPONDENTS (SURVEY ITEMS Q49−61)
Some of the most important and interesting “demographic” variables and other characteristics of the respondents are shown in Exhibits 4–11. Seventy five percent of survey respondents were men (Exhibit 4). Seventy three percent were PhDs (Exhibit 5).
Exhibit 4. Distribution of Gender of Survey Respondents (Q60)
Male75%
Female25%
Male
Female
Exhibit 4. Distribution of Gender of all17 Survey Respondents. 75% of the respondents were male. (N = 2,900)
17 By “all respondents” (here and throughout) we indicate that this applies to basic scientists, clinical and epidemiological investigators who otherwise met the screening requirements, most notably, a response to at least 50% of the items on the survey.
Office of Research Integrity, DHHS 28 American Institutes for Research
Exhibit 5. Distribution of Professional Degree of Survey Respondents (Q53)
73%
17%
9% 1%PhD Only
MD Only
Both PhD andMDOther Grad.Degree
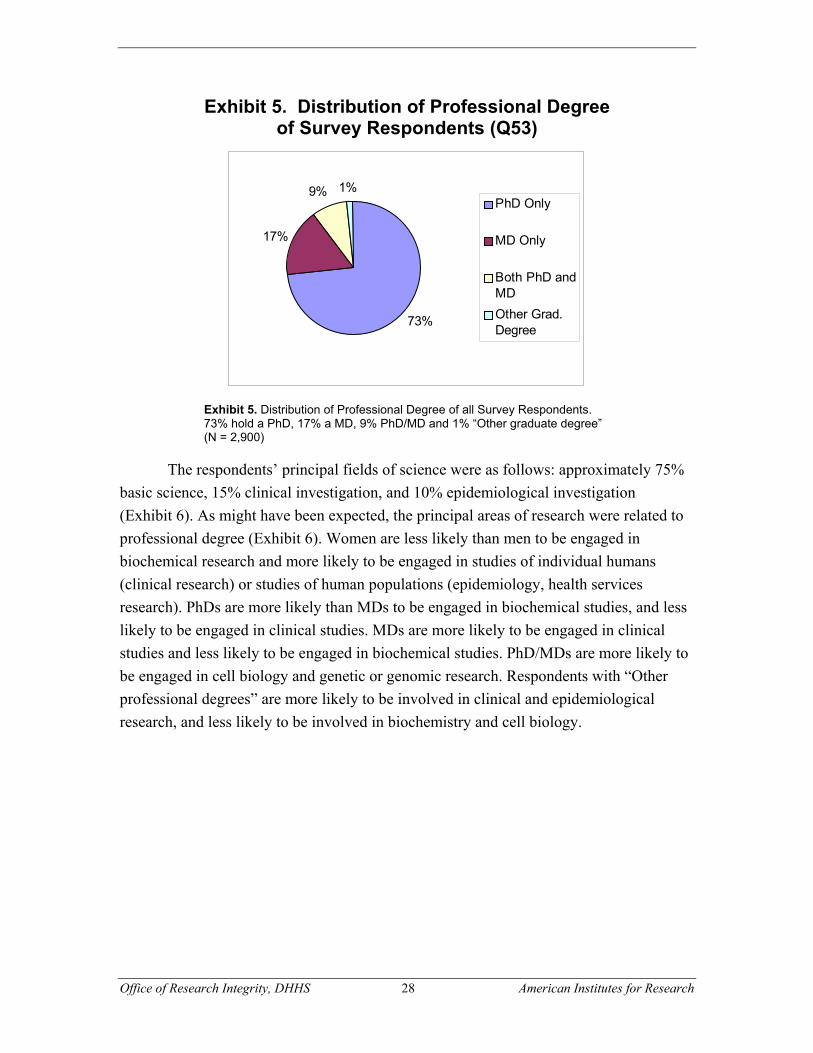
Exhibit 5. Distribution of Professional Degree of all Survey Respondents. 73% hold a PhD, 17% a MD, 9% PhD/MD and 1% “Other graduate degree” (N = 2,900)
The respondents’ principal fields of science were as follows: approximately 75% basic science, 15% clinical investigation, and 10% epidemiological investigation (Exhibit 6). As might have been expected, the principal areas of research were related to professional degree (Exhibit 6). Women are less likely than men to be engaged in biochemical research and more likely to be engaged in studies of individual humans (clinical research) or studies of human populations (epidemiology, health services research). PhDs are more likely than MDs to be engaged in biochemical studies, and less likely to be engaged in clinical studies. MDs are more likely to be engaged in clinical studies and less likely to be engaged in biochemical studies. PhD/MDs are more likely to be engaged in cell biology and genetic or genomic research. Respondents with “Other professional degrees” are more likely to be involved in clinical and epidemiological research, and less likely to be involved in biochemistry and cell biology.

Office of Research Integrity, DHHS 29 American Institutes for Research
Exhibit 6. Principal Fields of Inquiry
0%
25%
50%
75%
100%
All
Mal
eFe
mal
ePh
D
MD
PhD
/MD
Oth
er
Human PopulationsIndividual HumansNon-Human OrganismsOrganCell BiologyBiochemicalGenetic or Genomic
Exhibit 6. Distribution of principal fields of inquiry, by gender and professional degree for all survey respondents. For the entire group, 75% of the researchers regard themselves as engaged in one of the fields of basic research. A slightly higher fraction of men, and lower fraction of women identify their field as basic research. Women have a larger involvement in epidemiological research, possibly correlating with a degree such as MPH. Among PhDs there is a small but significant increase in the amount of basic research; this is especially true for PhD/MDs. MDs have a larger fraction engaged in clinical research. The group with “Other graduate degrees” has the lowest fraction in basic research and the highest fraction in epidemiological or health services research (research dealing with “human populations,” and also a high percentage in research involving individual humans. (N = 2,888)
Office of Research Integrity, DHHS 30 American Institutes for Research
Seventy eight percent (78%) of respondents were in the 40−60 year-old age range. Fourty-two percent (42%) of respondents were laboratory directors, and another 44.0% of respondents performed a number of duties typically associated with this position (Exhibit 7). Only 14.0% of respondents indicated that they were not the laboratory director, either “officially” or “unofficially.”
Exhibit 7. Role as “Laboratory Director” (Q49)
0%
25%
50%
75%
100%
All
Mal
e
Fem
ale
PhD
MD
PhD
/MD
Oth
er
Exhibit 7. Role as “laboratory director,” showing mean and 95% confidence interval (CI) by gender and by principal professional degrees for all respondents. The ORI was interested in conducting a study of “laboratory directors. “However, NIH records permit us to identify “principal investigators” but not “laboratory directors.“ Accordingly, the emphasis for the present study is on “PIs”. We asked whether the respondent has the title of “laboratory directory” officially (Yes), unofficially (“Maybe”—where the PI performs some or many of the functions of a laboratory director), or “No”. We have analyzed the results by combining the responses that were “Yes” or “Maybe,” contrasting them with the responses that were “No”. This permitted the calculation of the standard error of a proportion, for a binomial variable. We constructed approximate 95% confidence limits for the proportion as UCL = (P + 2*SEp) and LCL = (P – 2* SEp), respectively. A lower percentage of women than men self-identify as the laboratory director. A higher percentage of PhD/MD and PhD PIs identify themselves as Laboratory Directors, whereas a smaller percentage of MDs so identify. A smaller percentage of persons with “Other graduate degrees” are self-designated as laboratory directors. (N=2,894)
The respondents had served as Principal Investigators for a mean of 15 years (median 14 years) (Exhibit 8).

Office of Research Integrity, DHHS 31 American Institutes for Research
Exhibit 8. Number of Years as a PI (Q52)
0
5
10
15
20
All
Mal
e
Fem
ale
PhD
MD
PhD
/MD
Oth
er
Exhibit 8. Number of years as a PI. We have constructed approximate 95% confidence limits for the number of years as a PI, using UCL = (mean + 2*sem), and LCL = (mean – 2*sem), respectively. There is a significantly longer duration as PIs for men than for women.Respondents with a PhD have a slightly longer duration as a PI than MDs, PhD/MDs, or persons with ”Other graduate degrees.” Data for all respondents (N = 2,905)
The majority of respondents (84%) conducted their research at institutions of higher education. The median number of researchers supervised was approximately 5, and the median number of mentees was approximately 4. The vast majority of grant and contract-based funding (81%) was obtained from the NIH (Exhibits 9, 10A, 10B).
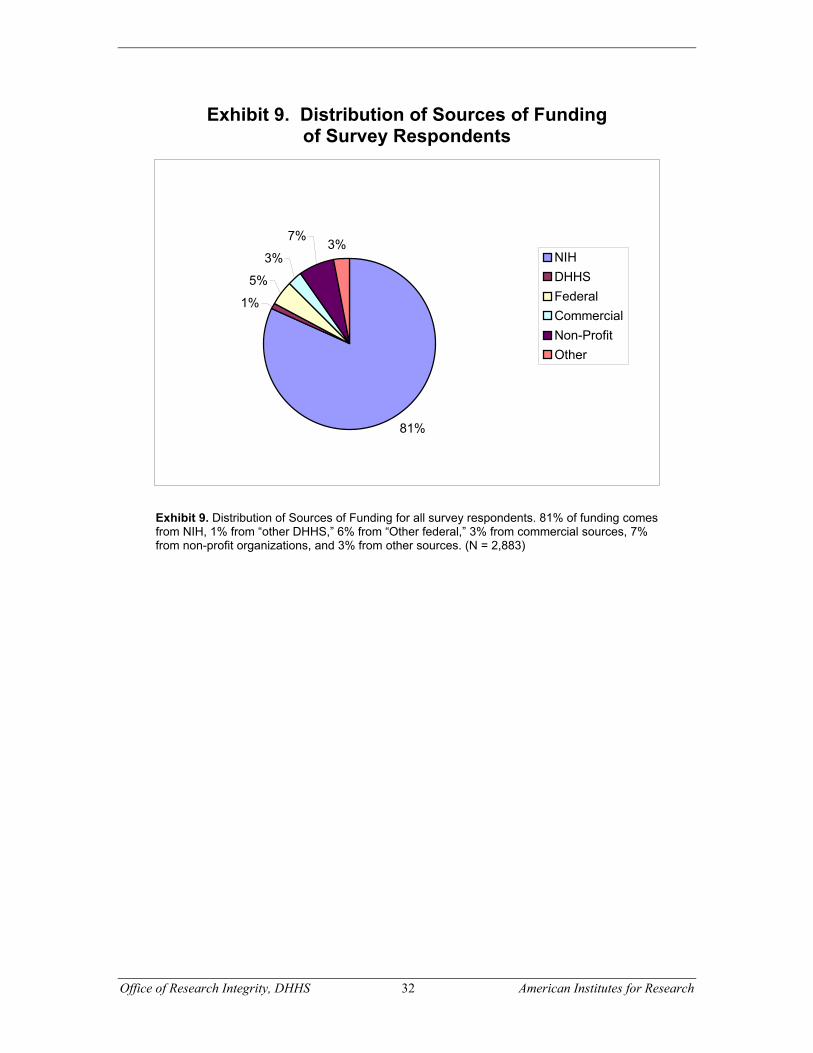
Office of Research Integrity, DHHS 32 American Institutes for Research
Exhibit 9. Distribution of Sources of Funding of Survey Respondents
81%
1%
5%
3%
7%3%
NIHDHHSFederalCommercialNon-ProfitOther
Exhibit 9. Distribution of Sources of Funding for all survey respondents. 81% of funding comes from NIH, 1% from “other DHHS,” 6% from “Other federal,” 3% from commercial sources, 7% from non-profit organizations, and 3% from other sources. (N = 2,883)
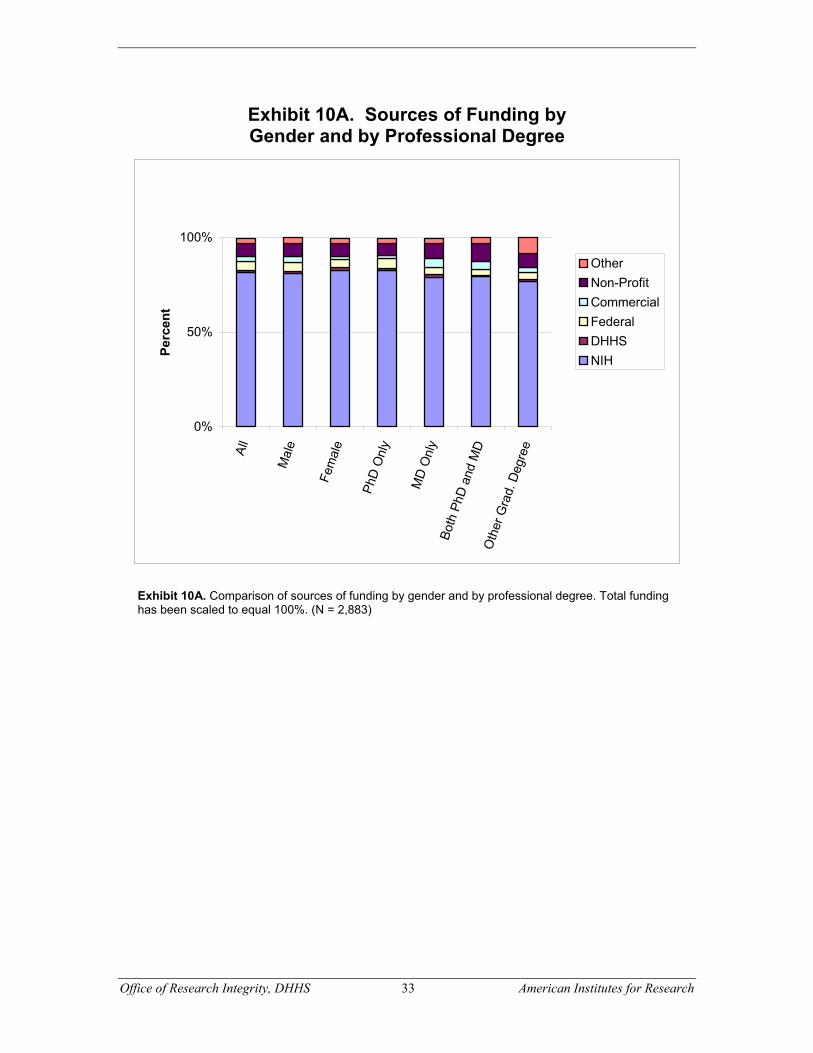
Office of Research Integrity, DHHS 33 American Institutes for Research
Exhibit 10A. Sources of Funding by Gender and by Professional Degree
0%
50%
100%Al
l
Mal
e
Fem
ale
PhD
Onl
y
MD
Onl
yBo
th P
hD a
nd M
DO
ther
Gra
d. D
egre
e
Perc
ent
OtherNon-ProfitCommercialFederalDHHSNIH
Exhibit 10A. Comparison of sources of funding by gender and by professional degree. Total funding has been scaled to equal 100%. (N = 2,883)

Office of Research Integrity, DHHS 34 American Institutes for Research
Exhibit 10B. Sources of Funding by Gender and by Professional Degree
75%
80%
85%
90%
95%
100%Al
l
Mal
e
Fem
ale
PhD
Onl
y
MD
Onl
yBo
th P
hD a
nd M
DO
ther
Gra
d. D
egre
e
Perc
ent
OtherNon-ProfitCommercialFederalDHHSNIH
Exhibit 10B. Data from Exhibit 10A with an expanded vertical scale ranging from 75% to 100%, to faciliate the analysis of the segment corresponding to funding from sources other than NIH. MDs have a larger fraction of funding from commercial sources than do other groups. “Other graduate degree” individuals have a larger fraction of funding from “Other” sources than do other groups. (N = 2,883)
B. DATA FOR BASIC SCIENTISTS, AND COMPARISON WITH CLINICAL AND EPIDEMIOLOGICAL INVESTIGATORS
Most respondents had submitted between two and four grants during the previous five years, resulting in one or two currently funded projects (Exhibit 11). The average annual dollar amount of respondents’ grant and contract funding was slightly below $700,000 dollars, although considerable variability in funding level was observed and the distribution was positively skewed (median = $450,000). On average, 45% of the personal income of the respondents was tied to their research funding.
When analyzing results from all respondents, women have a higher % of their income as “soft money”—i.e., income derived from research than men. However, in all other categories regarding grant applications and funding shown in Exhibit 11, women had values in the range of 85%–95% of the corresponding values for men. Also, when analyzing results from all respondents, MDs had a slightly smaller number of grants when compared with PhDs and compared to the entire group, a smaller number of
Office of Research Integrity, DHHS 35 American Institutes for Research
researchers supervised, and a lower % of income related to grants, but higher than average values in all other categories. Individuals with the combined PhD/MD degrees showed values above the mean for all respondents except for number of current grants and number of grants funded in the past 5 years.

Office of Research Integrity, DHHS 36 American Institutes for Research
Exhibit 11. Grant Applications and Funding
Principal field of investigator
Number of grant applications
Number funded
% Funded
Current number of grants
Median current grant funding
% of Funding from NIH
% of respondent’s income based on research funding
Average size of grant
(Q54) (Q55) (Q55) (Q54) (Q56) (Q57) (Q58) (Q59) (Q57)/(Q56)
Basic 5.0 ± 0.07
(N = 2,171)
2.8 ± 0.04
(2,171)
56.0% 2.4 ± 0.03
(2,206)
$425,000
(2,075)
82.2% ± 0.44%
(2,193)
44.3% ± 0.74%
(2,203)
$180,850*
Clinical 5.0 ± 0.16
(400)
3.0 ± 0.10
(400)
60.0% 2.7 ± 0.10
(407)
$455,000
(373)
81.5% ± 1.09%
(401)
42.4% ± 1.76%
(408)
$170,412
Epidemiological 5.7 ± 0.21
(293)
3.3 ± 0.13
(293)
57.8% 2.9 ± 0.11
(300)
$600,000
(264)
76.3% ± 1.60%
(297)
53.4% ± 2.24%
(298)
$209, 059
All 5.1 ± 0.06
(2,853)
2.9 ± 0.04
(2,853)
56.9% 2.5 ± 0.03
(2,901)
$450,000
(2,707)
81.5% ± 0.40%
(2,883)
44.9% ± 0.65%
(2,902)
$180,000
Exhibit 11. Average size of grant was calculated as median (current number of grant dollars)/(Mean number of current grants).

Office of Research Integrity, DHHS 37 American Institutes for Research
Scientific Discipline
Analysis of data from all respondents indicated the following:
1) The majority of the respondents (2,185/2,888) regarded themselves as principally involved in one of five types of basic science. In contrast, only 406 individuals indicated that they were involved in clinical research and only 296 were primarily involved in epidemiological research.
2) The demographic characteristics in terms of gender, type of degree, age, years as Principal Investigator, and other characteristics (e.g., size of laboratory) varied significantly among the three groups of investigators.
The univariate descriptive statistics for the principal focus of the current study, basic scientists is shown in Exhibit 4. Results are presented for each of the survey items, in sequential order. In addition, results are presented for two composite variables corresponding to “Data Control and Integrity,” (survey items 5–10), and Publication Practices (survey items 30–37). For those survey items where the respondent has a choice on a scale (such as 0%, 1–33%, 34–66%, 67–99%, 100%), the entire distribution of responses is shown, together with the mean and standard error of the mean (designated as “Std. Err.”).
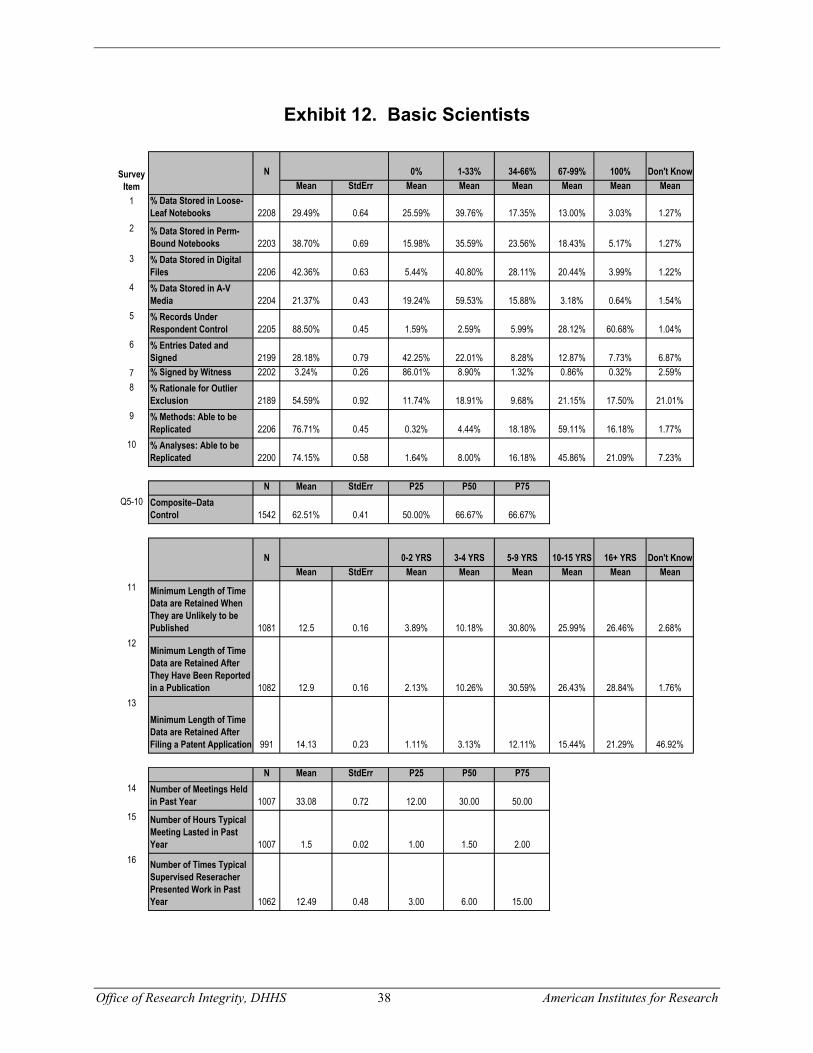
Office of Research Integrity, DHHS 38 American Institutes for Research
N 0% 1-33% 34-66% 67-99% 100% Don't KnowMean StdErr Mean Mean Mean Mean Mean Mean
1 % Data Stored in Loose-Leaf Notebooks 2208 29.49% 0.64 25.59% 39.76% 17.35% 13.00% 3.03% 1.27%
2 % Data Stored in Perm-Bound Notebooks 2203 38.70% 0.69 15.98% 35.59% 23.56% 18.43% 5.17% 1.27%
3 % Data Stored in Digital Files 2206 42.36% 0.63 5.44% 40.80% 28.11% 20.44% 3.99% 1.22%
4 % Data Stored in A-V Media 2204 21.37% 0.43 19.24% 59.53% 15.88% 3.18% 0.64% 1.54%
5 % Records Under Respondent Control 2205 88.50% 0.45 1.59% 2.59% 5.99% 28.12% 60.68% 1.04%
6 % Entries Dated and Signed 2199 28.18% 0.79 42.25% 22.01% 8.28% 12.87% 7.73% 6.87%
7 % Signed by Witness 2202 3.24% 0.26 86.01% 8.90% 1.32% 0.86% 0.32% 2.59%8 % Rationale for Outlier
Exclusion 2189 54.59% 0.92 11.74% 18.91% 9.68% 21.15% 17.50% 21.01%9 % Methods: Able to be
Replicated 2206 76.71% 0.45 0.32% 4.44% 18.18% 59.11% 16.18% 1.77%10 % Analyses: Able to be
Replicated 2200 74.15% 0.58 1.64% 8.00% 16.18% 45.86% 21.09% 7.23%
N Mean StdErr P25 P50 P75Q5-10 Composite–Data
Control 1542 62.51% 0.41 50.00% 66.67% 66.67%
N 0-2 YRS 3-4 YRS 5-9 YRS 10-15 YRS 16+ YRS Don't KnowMean StdErr Mean Mean Mean Mean Mean Mean
11 Minimum Length of Time Data are Retained When They are Unlikely to be Published 1081 12.5 0.16 3.89% 10.18% 30.80% 25.99% 26.46% 2.68%
12Minimum Length of Time Data are Retained After They Have Been Reported in a Publication 1082 12.9 0.16 2.13% 10.26% 30.59% 26.43% 28.84% 1.76%
13Minimum Length of TimeData are Retained After Filing a Patent Application 991 14.13 0.23 1.11% 3.13% 12.11% 15.44% 21.29% 46.92%
N Mean StdErr P25 P50 P7514 Number of Meetings Held
in Past Year 1007 33.08 0.72 12.00 30.00 50.0015 Number of Hours Typical
Meeting Lasted in Past Year 1007 1.5 0.02 1.00 1.50 2.00
16 Number of Times Typical Supervised Reseracher Presented Work in Past Year 1062 12.49 0.48 3.00 6.00 15.00
SurveyItem
Exhibit 12. Basic Scientists
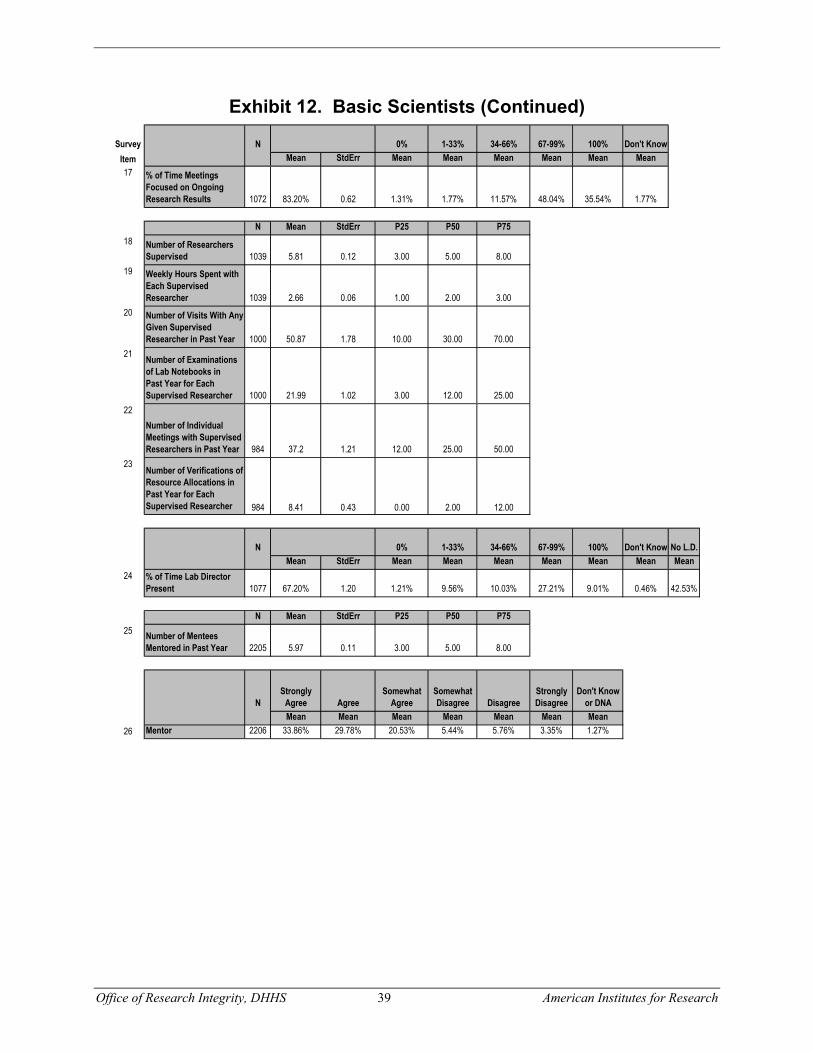
Office of Research Integrity, DHHS 39 American Institutes for Research
Survey N 0% 1-33% 34-66% 67-99% 100% Don't KnowItem Mean StdErr Mean Mean Mean Mean Mean Mean17 % of Time Meetings
Focused on Ongoing Research Results 1072 83.20% 0.62 1.31% 1.77% 11.57% 48.04% 35.54% 1.77%
N Mean StdErr P25 P50 P75
18 Number of Researchers Supervised 1039 5.81 0.12 3.00 5.00 8.00
19 Weekly Hours Spent with Each Supervised Researcher 1039 2.66 0.06 1.00 2.00 3.00
20 Number of Visits With Any Given Supervised Researcher in Past Year 1000 50.87 1.78 10.00 30.00 70.00
21 Number of Examinations of Lab Notebooks inPast Year for EachSupervised Researcher 1000 21.99 1.02 3.00 12.00 25.00
22Number of IndividualMeetings with Supervised Researchers in Past Year 984 37.2 1.21 12.00 25.00 50.00
23 Number of Verifications of Resource Allocations in Past Year for Each Supervised Researcher 984 8.41 0.43 0.00 2.00 12.00
N 0% 1-33% 34-66% 67-99% 100% Don't Know No L.D.Mean StdErr Mean Mean Mean Mean Mean Mean Mean
24 % of Time Lab Director Present 1077 67.20% 1.20 1.21% 9.56% 10.03% 27.21% 9.01% 0.46% 42.53%
N Mean StdErr P25 P50 P7525 Number of Mentees
Mentored in Past Year 2205 5.97 0.11 3.00 5.00 8.00
NStrongly
Agree AgreeSomewhat
AgreeSomewhat Disagree Disagree
Strongly Disagree
Don't Know or DNA
Mean Mean Mean Mean Mean Mean Mean26 Mentor 2206 33.86% 29.78% 20.53% 5.44% 5.76% 3.35% 1.27%
Exhibit 12. Basic Scientists (Continued)
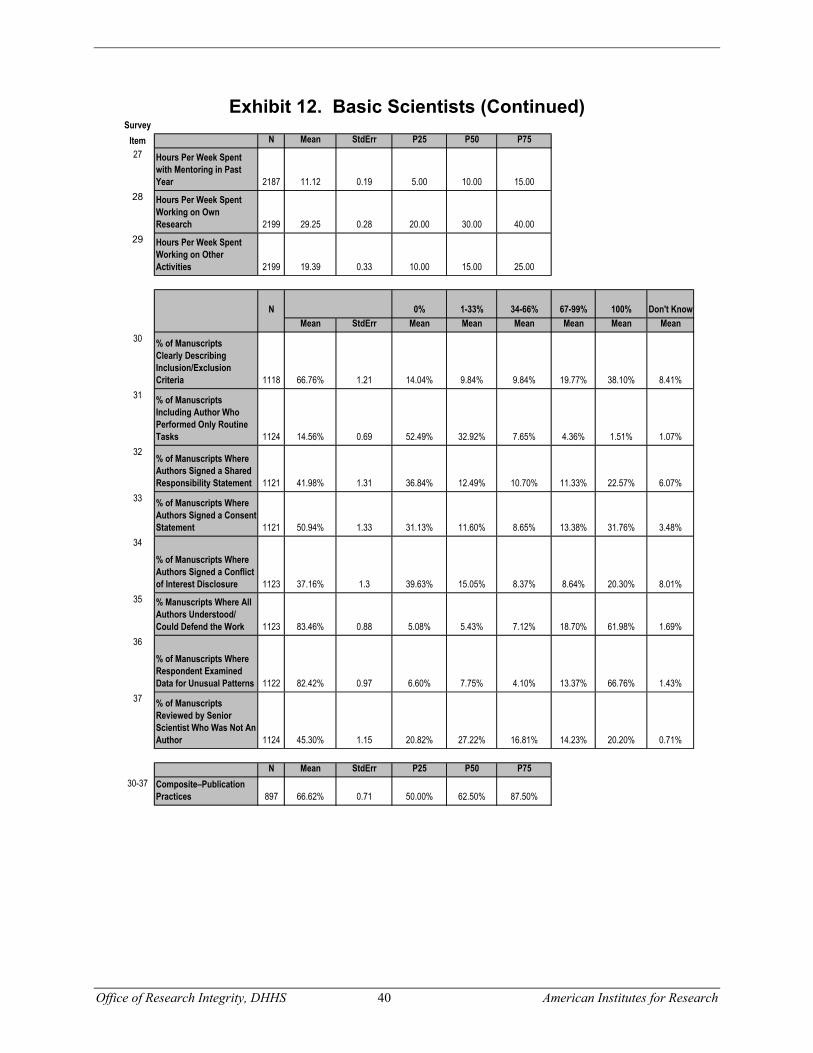
Office of Research Integrity, DHHS 40 American Institutes for Research
SurveyItem N Mean StdErr P25 P50 P7527 Hours Per Week Spent
with Mentoring in Past Year 2187 11.12 0.19 5.00 10.00 15.00
28 Hours Per Week Spent Working on Own Research 2199 29.25 0.28 20.00 30.00 40.00
29 Hours Per Week Spent Working on Other Activities 2199 19.39 0.33 10.00 15.00 25.00
N 0% 1-33% 34-66% 67-99% 100% Don't Know Mean StdErr Mean Mean Mean Mean Mean Mean
30 % of ManuscriptsClearly Describing Inclusion/Exclusion Criteria 1118 66.76% 1.21 14.04% 9.84% 9.84% 19.77% 38.10% 8.41%
31 % of Manuscripts Including Author Who Performed Only Routine Tasks 1124 14.56% 0.69 52.49% 32.92% 7.65% 4.36% 1.51% 1.07%
32 % of Manuscripts Where Authors Signed a Shared Responsibility Statement 1121 41.98% 1.31 36.84% 12.49% 10.70% 11.33% 22.57% 6.07%
33 % of Manuscripts Where Authors Signed a Consent Statement 1121 50.94% 1.33 31.13% 11.60% 8.65% 13.38% 31.76% 3.48%
34
% of Manuscripts Where Authors Signed a Conflict of Interest Disclosure 1123 37.16% 1.3 39.63% 15.05% 8.37% 8.64% 20.30% 8.01%
35 % Manuscripts Where All Authors Understood/Could Defend the Work 1123 83.46% 0.88 5.08% 5.43% 7.12% 18.70% 61.98% 1.69%
36
% of Manuscripts Where Respondent Examined Data for Unusual Patterns 1122 82.42% 0.97 6.60% 7.75% 4.10% 13.37% 66.76% 1.43%
37 % of Manuscripts Reviewed by Senior Scientist Who Was Not An Author 1124 45.30% 1.15 20.82% 27.22% 16.81% 14.23% 20.20% 0.71%
N Mean StdErr P25 P50 P7530-37 Composite–Publication
Practices 897 66.62% 0.71 50.00% 62.50% 87.50%
Exhibit 12. Basic Scientists (Continued)
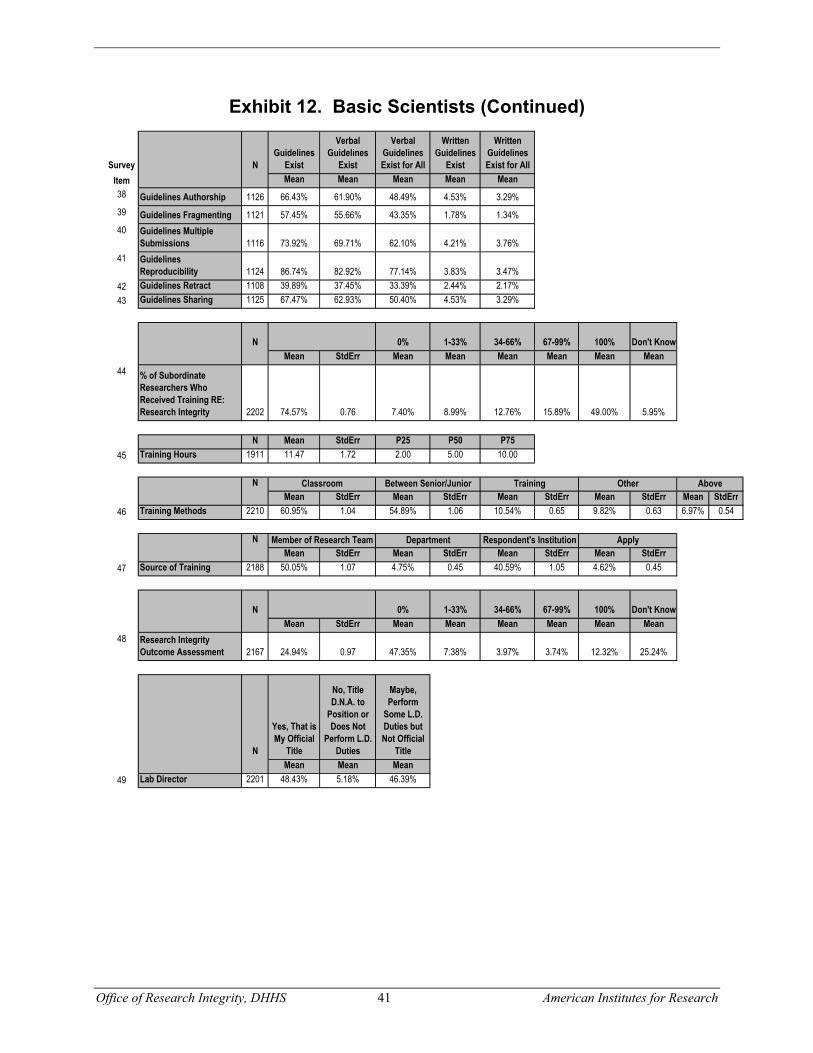
Office of Research Integrity, DHHS 41 American Institutes for Research
Survey NGuidelines
Exist
Verbal Guidelines
Exist
Verbal Guidelines Exist for All
Written Guidelines
Exist
Written Guidelines Exist for All
Item Mean Mean Mean Mean Mean38 Guidelines Authorship 1126 66.43% 61.90% 48.49% 4.53% 3.29%39 Guidelines Fragmenting 1121 57.45% 55.66% 43.35% 1.78% 1.34%40 Guidelines Multiple
Submissions 1116 73.92% 69.71% 62.10% 4.21% 3.76%41 Guidelines
Reproducibility 1124 86.74% 82.92% 77.14% 3.83% 3.47%42 Guidelines Retract 1108 39.89% 37.45% 33.39% 2.44% 2.17%43 Guidelines Sharing 1125 67.47% 62.93% 50.40% 4.53% 3.29%
N 0% 1-33% 34-66% 67-99% 100% Don't Know Mean StdErr Mean Mean Mean Mean Mean Mean
44 % of Subordinate Researchers Who Received Training RE: Research Integrity 2202 74.57% 0.76 7.40% 8.99% 12.76% 15.89% 49.00% 5.95%
N Mean StdErr P25 P50 P75
45 Training Hours 1911 11.47 1.72 2.00 5.00 10.00
NMean StdErr Mean StdErr Mean StdErr Mean StdErr Mean StdErr
46 Training Methods 2210 60.95% 1.04 54.89% 1.06 10.54% 0.65 9.82% 0.63 6.97% 0.54
NMean StdErr Mean StdErr Mean StdErr Mean StdErr
47 Source of Training 2188 50.05% 1.07 4.75% 0.45 40.59% 1.05 4.62% 0.45
N 0% 1-33% 34-66% 67-99% 100% Don't KnowMean StdErr Mean Mean Mean Mean Mean Mean
48 Research Integrity Outcome Assessment 2167 24.94% 0.97 47.35% 7.38% 3.97% 3.74% 12.32% 25.24%
N
Yes, That is My Official
Title
No, Title D.N.A. to
Position or Does Not
Perform L.D. Duties
Maybe, Perform
Some L.D. Duties but Not Official
TitleMean Mean Mean
49 Lab Director 2201 48.43% 5.18% 46.39%
ApplyRespondent's InstitutionDepartmentMember of Research Team
OtherClassroom Between Senior/Junior Training Above
Exhibit 12. Basic Scientists (Continued)

Office of Research Integrity, DHHS 42 American Institutes for Research
Survey NHigher
EducationResearch
OrganizationIndependent
Hospital
Education, Not Higher
Ed.
Other Specified
Org.
Other Non-Specified
Org.Item Mean Mean Mean Mean Mean Mean51 Institution 2210 86.11% 9.10% 3.76% 0.36% 0.45% 0.23%
N Mean StdErr P25 P50 P7552 Years as PI 2207 16.26 0.19 9.00 15.00 22.00
N Mean StdErr P25 P50 P7554 Grant Proposal/5 Years 2171 5.03 0.07 3.00 4.00 6.00 N Mean StdErr P25 P50 P75
55 Grants Funded/5 Years 2171 2.82 0.04 2.00 2.00 4.00
N Mean StdErr P25 P50 P7556
Current Number of Grants 2206 2.35 0.03 1.00 2.00 3.00
N Mean StdErr P25 P50 P7557 Current Grant Dollars 2075 $617,046.91 $14,646.54 $260,000.00 $425,000.00 $729,000.00
N
Mean StdErr Mean StdErr Mean StdErr Mean StdErr Mean StdErr Mean StdErr58 Sources of Funding 2193 82.22% 0.44 0.31% 0.07 4.74% 0.26 2.61% 0.17 7.04% 0.29 2.93% 0.20
N 0% 1-33% 34-66% 67-99% 100% Don't KnowMean StdErr Mean Mean Mean Mean Mean Mean
59 Percent Income from Grants 2203 44.25% 0.74 14.07% 31.91% 22.79% 18.52% 11.67% 1.04%
DHHS Orgs. Other than NIH
Commercial, For-Profit Firms
Federal Government Agencies Other than
DHHS/NIHNIH Other
Non-Profit or Not-for-Profit Foundations
Exhibit 12. Basic Scientists (Continued)

Office of Research Integrity, DHHS 43 American Institutes for Research
In view of the fact that the original goal of the Office of Research Integrity was to characterize the “Research Integrity Measures Utilized in Biomedical Research Laboratories” (emphasis added), we shall focus primarily on analysis of the data from only those who indicted that their research was in one of the basic sciences. We shall also compare their characteristics with those researchers principally involved in clinical and epidemiological investigation. The survey item that was used to make the crucial distinction between “basic” and clinical or epidemiological investigators was item 50:
Q 50. Research Category that Best Describes Respondent’s NIH-Funded Work
50. In the past year, the type of research that best describes the work funded by my NIH grants was:
Genetic/Genomic Biochemical (subcellular) Cell Biology Organ (such as heart or liver) Non-human organisms (such as chimpanzees or fruit flies) Individual humans (e.g., clinical research including clinical trials) Populations of humans, Epidemiology, Health Services Research
This survey item is especially important. It refers to work within the past year, which recognizes that the principal type of research can change, and it refers specifically to NIH-funded research, so as to exclude other activities (e.g. clinical care, teaching) and so as to exclude research studies conducted for other sponsors. The grouping of the first 5 categories under the banner of “basic sciences” was a decision made by the research team and is in accord with general convention. We did not inquire as to “what percentage of your research activity?” fell within each of the seven subject categories. Also, we did not provide options to indicate “Other” or “Don’t Know.”19
1. Methods of Data Collection (Survey Items 1–4)
One of the traditional teachings to promote scientific integrity and to minimize the risk of data fabrication, falsification or plagiarism (“FFP”) is that research data should be collected in permanently bound notebooks, signed and dated on a daily basis, and witnessed by an independent third party on a regular (e.g., daily) basis. These kinds of approaches should, in principle, permit monitoring of the authenticity and originality of the data. However, loose-leaf notebooks are often
19 The database obtained from NIH includes a data field intended to describe the scientific discipline of the PIs. However, the coverage in that field is very inconsistent: some fields such as immunology have a large number of sub-categories, while other scientific fields were not represented at all. The NIH database did not permit ready distinction between basic sciences, clinical and epidemiological investigation.

Office of Research Integrity, DHHS 44 American Institutes for Research
more convenient and make it easier to insert pages of computer printouts, photographs (of gels, cells, etc.), and make it possible to remove unwanted materials or to insert data at a later time. Often, data from different sources for a given experiment or set of experiments become available at different points in time and it is convenient and most practical to combine them in one location. This is easily accomplished in a loose-leaf notebook but fairly difficult with a permanently bound notebook. In many fields, computerized databases are the principal source of data and it may be difficult or impossible in practice to enter large datafiles either into loose-leaf notebooks or into permanently bound notebooks. Finally, some primary data may be in the form of photographs, videotapes, audiotapes, or other audiovisual (A-V) materials.
The data of Exhibit 13A indicates that, among the basic scientists, the most popular form of data collection involves digital files (42.4% ± 0.43% of data). This is followed by use of permanently bound notebooks (38.7% ± 0.69%), loose-leaf notebooks (29.5% ± 0.64%), and A-V media (21.37% ± 0.43%). The sum of these percentages is greater than 100%, representing the fact that some of the data are stored in two or more forms. There was a fairly consistent pattern, that the sum of the % of data stored in the four alternative forms was approximately 125%, indicating a redundancy of 25% on average. Basic scientists used permanently bound notebooks for a larger percentage of their data than did clinical investigators (15.38% ± 1.31%) or epidemiological investigators (9.26 ± 1.35%). Conversely, basic scientists used digital files for their data less than the other two groups of investigators (Exhibit 13A.).
Exhibit 13A. Methods for Collecting and Storage of Data % of Data Stored using Alternative Media
Principal field Loose-leaf Permanently-
Bound Digital Files Audio- Visual
Media
Basic 29.5 ± 0.64
(N = 2,208)
38.7 ± 0.69
(2,203)
42.4 ± 0.63
(2,206)
21.4 ± 0.43
(2,204)
Clinical 23.1 ± 1.56
(406)
15.4 ± 1.31
(405)
65.5 ± 1.67
(406)
14.2 ± 1.02
(407)
Epidemiological 11.5 ± 1.44
(296)
9.3 ± 1.35
(295)
76.9 ± 1.89
(297)
7.9 ± 0.93
(297)
All 26.7 ± 0.56
(2,900)
32.4 ± 0.61
(2,894)
49.2 ± 0.61
(2,899)
18.9 ± 0.38
(2,898)
Exhibit 13A. Values shown are Mean ± sem, with number of respondents (N) shown in parentheses.
Digital files were the most customary method for storage of data for all three groups of scientists. Basic scientists were more likely to use permanently bound databooks than the other two

Office of Research Integrity, DHHS 45 American Institutes for Research
groups. Many of these comparisons are highly statistically significant at the P < 0.01 or P < 0.001 level, indicating that the preferred methods of data collection does vary systematically and statistically significantly between fields. This provides evidence for “face validity,” since it could have been anticipated that epidemiologists would use loose-leaf and permanently bound notebooks and audiovisual materials considerably less than their basic science counterparts (Exhibit 13B.).
Exhibit 13B. Methods for Collecting and Storage of Data
% of PIs Reporting that they stored all data using a single type
of medium
Principal field Loose-leaf Permanently-Bound Digital Files
Audio-Visual Media
Basic 3.0% 5.2% 4.0% 0.6%
Clinical 6.4% 2.2% 23.9% 1.2%
Epidemiological 3.0% 3.0% 46.5% 0.3%
All 3.3% 4.6% 11.0% 0.7%
Exhibit 13B. Very Few respondents indicated that they use only a single form of data collection except in the case of digital files. The number of respondents was identical to those shown in Exhibit 10A. Clinical and epidemiological investigators commonly store all of their data in the form of digital files (two entries highlighted in bold font).
Interestingly, when we examine the popularity of various methods for collecting data for all subjects, classified by gender and degree, there did not appear to be large differences (Exhibit 14).
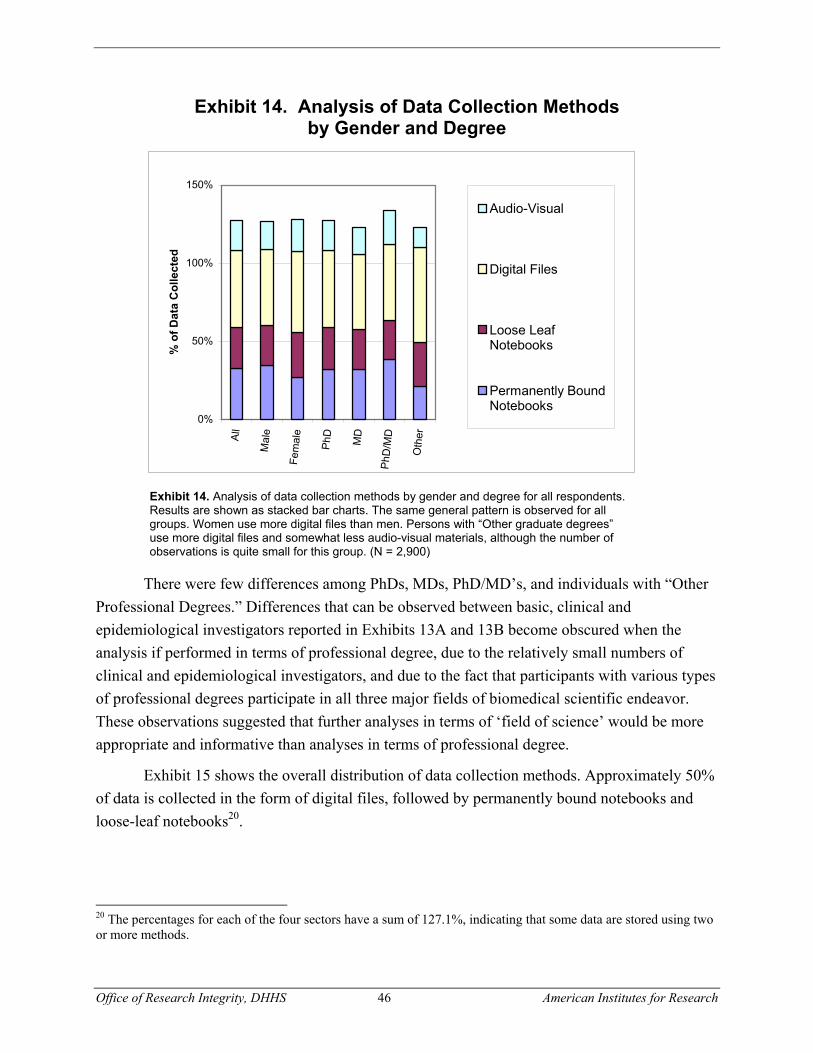
Office of Research Integrity, DHHS 46 American Institutes for Research
Exhibit 14. Analysis of Data Collection Methods by Gender and Degree
0%
50%
100%
150%
All
Mal
e
Fem
ale
PhD
MD
PhD
/MD
Oth
er
% o
f Dat
a C
olle
cted
Audio-Visual
Digital Files
Loose LeafNotebooks
Permanently BoundNotebooks
Exhibit 14. Analysis of data collection methods by gender and degree for all respondents. Results are shown as stacked bar charts. The same general pattern is observed for all groups. Women use more digital files than men. Persons with “Other graduate degrees” use more digital files and somewhat less audio-visual materials, although the number of observations is quite small for this group. (N = 2,900)
There were few differences among PhDs, MDs, PhD/MD’s, and individuals with “Other Professional Degrees.” Differences that can be observed between basic, clinical and epidemiological investigators reported in Exhibits 13A and 13B become obscured when the analysis if performed in terms of professional degree, due to the relatively small numbers of clinical and epidemiological investigators, and due to the fact that participants with various types of professional degrees participate in all three major fields of biomedical scientific endeavor. These observations suggested that further analyses in terms of ‘field of science’ would be more appropriate and informative than analyses in terms of professional degree.
Exhibit 15 shows the overall distribution of data collection methods. Approximately 50% of data is collected in the form of digital files, followed by permanently bound notebooks and loose-leaf notebooks20.
20 The percentages for each of the four sectors have a sum of 127.1%, indicating that some data are stored using two or more methods.

Office of Research Integrity, DHHS 47 American Institutes for Research
Exhibit 15. Nature of Data Collection Methods
32.41%
26.67%49.15%
18.91%
Permanently Bound NotebooksLoose Leaf NotebooksDigital FilesAudio-Visual
Exhibit 15. Nature of data collection methods for all respondents: This pie chart shows the distribution of data collection, using loose-leaf notebooks, permanently bound notebooks, digital files and audiovisual materials. The questions asked what proportion of data was stored in each of the four forms. We did not stipulate that the sum needed to add to 100%; indeed, we assumed that some of the data would be stored in two or more forms. For each of the four types of data collection, we calculated the mean % of data, over all respondents, using the midpoint of the intervals (e.g. 0%, 1–33, 34–66, 67–99, 100%). For the pie chart—we have taken the sum of the % collected using each type of medium as 100%. 49% of data are stored in digital files. This is followed by permanently bound notebooks (32.41%), loose leaf notebooks (26.67%), and audio-visual materials (18.91%). Digital files represents about a third of the data relative to the sum for all four types of data storage. (N = 2,900)
Of basic scientists, 5.2% indicate that they store all (100%) of their data in permanently bound notebooks, while 4.0% store all of their data in digital files, and 3.0% store all of their data in loose-leaf notebooks. These percentages are very different for clinical and epidemiological investigators where 23.9% and 46.5% of investigators collect and store all of their data as digital files (Exhibit 13B).

Office of Research Integrity, DHHS 48 American Institutes for Research
2. Data Control and Integrity Methods (Survey Items 5–10)
Six survey items (5–10) pertain to data “control” and integrity issues. Exhibit 16 shows the frequency of use of each of these 6 measures of data control and integrity for each of the three major groups of investigators and for all survey respondents. The six types of data control and integrity measures are sorted in order of decreasing frequency of use by basic scientists (or for all subjects). Basic scientists retain the “original records of primary data” when the person who generated the primary data is no longer participating with very high frequency: 88.50%. The PIs believe that their methods and analyses are replicable 76.7 and 74.2% of the time, respectively. Documentation regarding the rationale for exclusion of outlier data points or an atypical experiment were recorded only 54.6% of the time. In contrast, records were dated and signed only 28.2% of the time, and only 3.2% of entries in laboratory notebooks data were signed by a witness. Clinical and epidemiological investigators indicated that they retained the original primary data in a smaller percentage of cases than the basic scientists, but indicated that an independent qualified investigator could replicate the work and calculations for a higher percentage of experiments than for the basic scientists.
There are two very dramatic findings here: Basic scientists indicated that only 28.2% of their records are dated and signed, and only 3.2% are signed by a witness. The same general pattern applies to clinical and epidemiological investigators. (Note: these two questions were specified to apply only to laboratory notebooks, and the question was not being asked in regard to digital files).

Office of Research Integrity, DHHS 49 American Institutes for Research
Exhibit 16. Data Control Measures
0
50
100
Basic
Clin
ical
Epid
emio
logi
cal
All R
espo
nden
ts
% o
f cas
esRespondentcontrol (Q5)
Methodreplicable (Q9)
Analysisreplicable (Q10)
Outlierexclusion (Q8)
Date and Sign(Q6)
Witness (Q7)
Exhibit 16. Frequency of use of 6 data control and integrity measures, comparing basic scientists, clinical investigators, epidemiological investigators, and all respondents. The sequence (order) of the six measures (columns) is in order of decreasing frequency for ”All Respondents”. (N’s were 2,891, 2,871, 2,872, 2,842, 2,877, and 2,878 for survey items Q5–Q10, respectively.)
Signing and dating of laboratory notebooks, and having the data books witnessed, are both relevant to the issue of preventing data fabrication, falsification and plagiarism. These practices are also relevant to the issue of patent protection. However, since it is likely that only a very small percentage of NIH-funded research is directly related to patent applications, it is not entirely surprising that obtaining signatures by witnesses is a relatively rare occurrence.
Only 7.7% of basic scientists indicated that they sign and date 100% (all) of their research records in laboratory notebooks, and only 0.3% indicated that they obtain a signature from a witness for 100% (all) of the records in their notebooks.

Office of Research Integrity, DHHS 50 American Institutes for Research
3. Data Retention (Survey items 11–13)
Exhibit 17A shows the “survival curve” for data, as reported by all subjects in the survey, for a) “data that are unlikely to be published;” b) “data have been reported in a publication;” and c) “after filing a patent application.”
Exhibit 17A. Data Retention of Data That Are Unlikely to be Published, Data That Have Been Published, and Data
Relevant to a Patent Application
0%
25%
50%
75%
100%
0 10 20Years (midpoint of interval)
% o
f Dat
a R
etai
ned
Exhibit 17A. Data retention, comparing data that are not likely to be published, data that have been published, and data relevant to a patent application (Q11, Q12, Q13, respectively). Ordinate: % of data retained; Abscissa: Time (years) following data collection, publication, or filing of a patent, respectively. Note the nearly identical curves for data that are not likely to be published, and data that have been published. There appears to be a somewhat longer “median survival time” for data that are relevant to a filed patent application. However, a very large number of individuals did not respond to this question, or indicated that they “Don’t Know.” Data from all respondents. (N = 1,418, 1,418, and 1,274 for Q11, Q12, and Q13, respectively.)
The three curves are nearly superimposable, and that the median time for retention of records (when 50% of the data are still retained) is almost exactly 10 years. The mean retention time is somewhat greater, at 12.5 ± 0.16 years; 12.9 ± 0.15 years, and 14.13 ± 0.23 years for the three cases, respectively. 46.9% of respondents indicated that they “Don’t Know” with regard to the minimum length of time that data are retained “after filing a patent application.” (In addition, the number of individuals who responded to the survey item 13 was substantially smaller than

Office of Research Integrity, DHHS 51 American Institutes for Research
the number who responded to survey items 11 and 12.) The duration of retention of data was slightly smaller for clinical investigators and for epidemiological investigators, but the values for epidemiological investigators were extremely close to those for the basic scientists. In view of the fact that there were such small differences among the different subgroups, we did not pursue further analyses of other subgroups or factors. Data retention does not appear to be a problem, based on these self reports: only 3.9% of data that are unlikely to be published, or 2.1% of data that have been reported in a publication, are said to be retained for a minimum time of 0–2 years (which may be regarded as 0–2.99 years, since the next category begins with 3 years).
We also calculated the mean ± sem for the average “minimum duration of time” that records are retained. Results are shown in Exhibit 17B.
Exhibit 17B. Data Retention Minimum length of time data are retained (years)
Principal field of investigator
Data unlikely to be published
Data reported in a publication
After filing a patent
application
Basic 12.5 ± 0.16
(N = 1,081)
12.9 ± 0.16
(1,082)
14.1 ± 0.23
(991)
Clinical 11.3 ± 0.32
(202)
11.5 ± 0.36
(202)
13.6 ± 0.92
(171)
Epidemiological 12.2 ± 0.50
(140)
12.7 ± 0.51
(140)
12.5 ± 1.78
(118)
All 12.3 ± 0.14
(1,418)
12.7 ± 0.14
(1,418)
14.1 ± 0.23
(1,274)
Exhibit 17B. Retention of data (mean ± sem, years). Number of respondents in each category (N) are shown in parentheses. Note that fewer responses were obtained in regard to data retention following patent applications. For the calculation of the means, the midpoints of the intervals 0–2, 3–4, 5–9, 10–15, and >16 years were taken as 1.5, 4, 7.5, 13, and 19 years, respectively.
4. Laboratory Meetings for Data Review, Supervision and Mentoring (Survey items 14–25, 26, 27–29, 50)
When cases of scientific misconduct have been reported, it has not been unusual to find that the individual responsible for this misconduct was operating relatively free of supervision or review by his or her laboratory director, supervisor, or mentor. In some cases it was believed that this was because the laboratory was large, so that the person in charge had relatively little time to spend with each of the relatively junior scientists. Accordingly, at eight survey items addressed the issue of supervision and the related issue of mentorship of junior researchers by the PI or the

Office of Research Integrity, DHHS 52 American Institutes for Research
“Laboratory Director.” We shall review these data now. These survey items were asked of a randomly selected sub-sample of 50% of the survey respondents, or approximately 1,100 PIs.
Laboratory Meetings to Review Recently Collected Data: One of the most important methods for communication of results within a laboratory, is to have regularly scheduled laboratory meetings devoted primarily to discussion of on-going research, with presentations by the individuals who are actually doing the work to their peers, colleagues, mentors and supervisors. Frequent in-depth discussions and presentations can identify errors, problems, inconsistencies, lack of appropriate controls, difficulties with reproducibility, and allow other members of the laboratory to offer advice and suggestions, critiques or criticism, references to the literature, or knowledge regarding recent presentations at scientific meetings. These sessions, sometimes called “data clubs” (by analogy with the “journal clubs” which discuss findings from others as reported in the scientific literature) also offer an opportunity for several members of the laboratory to detect anomalies–e.g., “data which look too good” (with few outliers or variability that is less than usual), “data which have been generated too rapidly,” or data which have been generated without the necessary resources (equipment, animals, cells or reagents, staff support). Thus, there are multiple opportunities to identify clues that could help to detect fabrication of data. Further, this kind of scrutiny and inspection of the raw data, or something very close to the raw data (before data have been condensed into final tables and figures and text for presentation in a publication) would be expected to serve as a deterrent to any individual who was considering fabrication, falsification or plagiarism, since it would (or should) considerably increase the probability that any such activities would be detected by colleagues, peers, supervisors and mentors. Further, by promoting the appropriate conduct of science, such meetings can potentially increase the probability of success for the individual researcher, and hence help to eliminate some of the potential motives for “FFP” or other types of scientific misconduct.
Basic scientists indicated that they held an average of 33.08 ± 0.72 (median 30.0) meetings held in the prior 12 months. This corresponds to a meeting slightly more often than every other week. The 25th and 75th percentiles were 12 and 50, corresponding to a monthly meetings and a weekly meeting, respectively.
The meetings lasted an average of 1.5 hours (1.50 ± 0.02 h) (median 1.5 h, 25th and 75th percentiles of the distribution at 1.0 and 2.0 hours, respectively). At these meetings, the % of time that the meeting was focused on ongoing research was 83.2% ± 0.6%. The percentage of time that the meeting was devoted to discussion of ongoing research was somewhat higher for basic researchers than for clinical or epidemiological investigators. A typical researcher under the supervision of the PI presented details of his/her work 12.5 ± 0.5 times during the previous twelve months (the median was 6 times/y and the 25th and 75th percentiles were 3 and 15 times/y, respectively). This is a skewed distribution, where the mean is close to the 75th percentile.
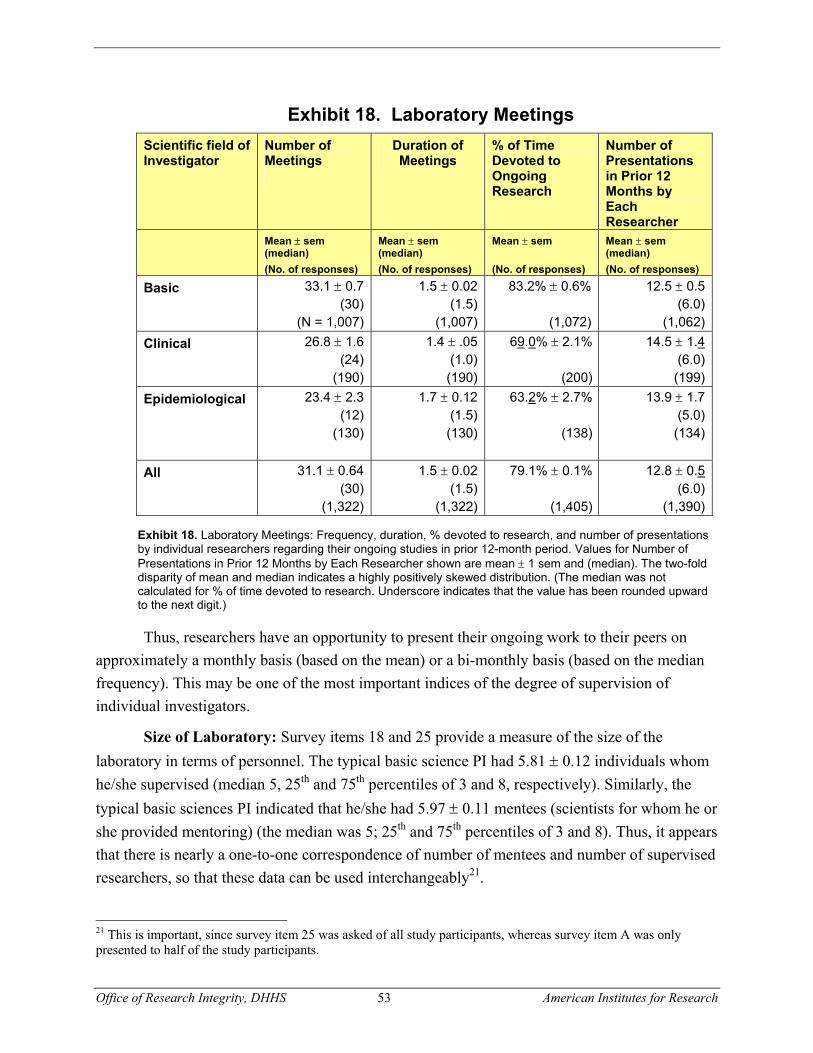
Office of Research Integrity, DHHS 53 American Institutes for Research
Exhibit 18. Laboratory Meetings Scientific field of Investigator
Number of Meetings
Duration of Meetings
% of Time Devoted to Ongoing Research
Number of Presentations in Prior 12 Months by Each Researcher
Mean ± sem (median) (No. of responses)
Mean ± sem (median) (No. of responses)
Mean ± sem (No. of responses)
Mean ± sem (median) (No. of responses)
Basic 33.1 ± 0.7 (30)
(N = 1,007)
1.5 ± 0.02 (1.5)
(1,007)
83.2% ± 0.6%
(1,072)
12.5 ± 0.5 (6.0)
(1,062)Clinical 26.8 ± 1.6
(24) (190)
1.4 ± .05 (1.0)(190)
69.0% ± 2.1%
(200)
14.5 ± 1.4 (6.0)(199)
Epidemiological 23.4 ± 2.3(12)
(130)
1.7 ± 0.12(1.5)(130)
63.2% ± 2.7%
(138)
13.9 ± 1.7 (5.0)(134)
All 31.1 ± 0.64(30)
(1,322)
1.5 ± 0.02(1.5)
(1,322)
79.1% ± 0.1%
(1,405)
12.8 ± 0.5 (6.0)
(1,390)
Exhibit 18. Laboratory Meetings: Frequency, duration, % devoted to research, and number of presentations by individual researchers regarding their ongoing studies in prior 12-month period. Values for Number of Presentations in Prior 12 Months by Each Researcher shown are mean ± 1 sem and (median). The two-fold disparity of mean and median indicates a highly positively skewed distribution. (The median was not calculated for % of time devoted to research. Underscore indicates that the value has been rounded upward to the next digit.)
Thus, researchers have an opportunity to present their ongoing work to their peers on approximately a monthly basis (based on the mean) or a bi-monthly basis (based on the median frequency). This may be one of the most important indices of the degree of supervision of individual investigators.
Size of Laboratory: Survey items 18 and 25 provide a measure of the size of the laboratory in terms of personnel. The typical basic science PI had 5.81 ± 0.12 individuals whom he/she supervised (median 5, 25th and 75th percentiles of 3 and 8, respectively). Similarly, the typical basic sciences PI indicated that he/she had 5.97 ± 0.11 mentees (scientists for whom he or she provided mentoring) (the median was 5; 25th and 75th percentiles of 3 and 8). Thus, it appears that there is nearly a one-to-one correspondence of number of mentees and number of supervised researchers, so that these data can be used interchangeably21.
21 This is important, since survey item 25 was asked of all study participants, whereas survey item A was only presented to half of the study participants.

Office of Research Integrity, DHHS 54 American Institutes for Research
Supervision We obtained seven measures of the degree of supervision. Separate survey items
addressed the following parameters:
1) Number of hours spent with each supervised researcher (Q19);
2) Number of visits with each supervised researchers in the past year (Q20);
3) Number of examinations of laboratory notebooks during the past year (Q21);
4) Number of individual meetings with each supervised researcher in the past year (Q22);
5) Number of times that the PI verified that the amount of resources utilized by each supervised researcher was consistent with the researchers activities (Q23)
6) Percent of time that the “Laboratory Director” was physically present at the location where most of the research of the PI occurs (Q24)
7) Number of hours per week that the PI spends mentoring (Q27)
Another related survey item asked the study participant whether she/he had previously had a mentor who prepared them well to be a mentor to the researchers whose work she/he currently supervise (Q26).
We shall now examine each of these measures of mentoring, and compare the basic scientists with the clinical and epidemiological investigators.
Exhibit 19 summarizes the data.
Due to the skewing of the distributions in some cases, it may be more appropriate to use medians rather than means for description of these results. Accordingly, basic scientists meet on average (median) with the researchers they supervise two hours per week, visit the researcher 30 times per year or slightly more than once every two weeks, examine notebooks once a month, and have about 25 meetings per year. They check to see that resource consumption was consistent with the reported results was twice per year (median) or 8.4 times per year when using the arithmetic mean. The Laboratory Director was physically present 67.2% of the time at the site where most of the research was being performed. Further, the typical basic researcher indicated that he/she was engaged in mentoring activities an average of 11.1 ± 0.2 hours per week (median 10 hours/week). If this time were evenly distributed among the median of 5.0 scientists that the PI supervises (Q18) or 5.0 that the PI mentors (Q25), this results in an estimate of 2 hours per week per mentee—which agrees perfectly with the median number of hours with each supervised

Office of Research Integrity, DHHS 55 American Institutes for Research
researcher as obtained from survey item (Q19). Thus, the results were consistent22. In each of these seven categories, the performance of the basic scientists was better than (and sometimes substantially and significantly better than) that of clinical or epidemiological investigators (Exhibit 16).
The majority of basic scientists indicated that they had previously had a mentor who prepared them to be a good mentor to those researchers whom they now supervise: 33.5% indicated that they “Strongly Agree” and 29.0% indicated that they “Agree” with that statement, for a total of 62.5% in these two categories (with 2.2% indicating “Don’t Know” in response to this question).
22 The survey included items for the respondent to enter the number of mentees and the number of supervised researchers in his/her laboratory. The numbers obtained were very similar, with a slightly smaller average for the number of mentees. The research team interpreted this to mean that the mentees were generally regarded as a subset of the number of supervised researchers. However, there was potential ambiguity, and the possibility exists that some of the respondents may have regarded these two survey items as referring to either partially overlapping sets or mutually exclusive sets. The present results do not permit us to make an exact statement regarding the total number of individuals within a given laboratory. However, an analysis of the number of mentees, number of supervised researchers, and total amount of current research funding, estimates of typical salary ranges, time spent with each supervised researcher, and total amount of time per week spent mentoring, all support the belief that the mentees were regarded as a subset of the supervised researchers by the majority of respondents.
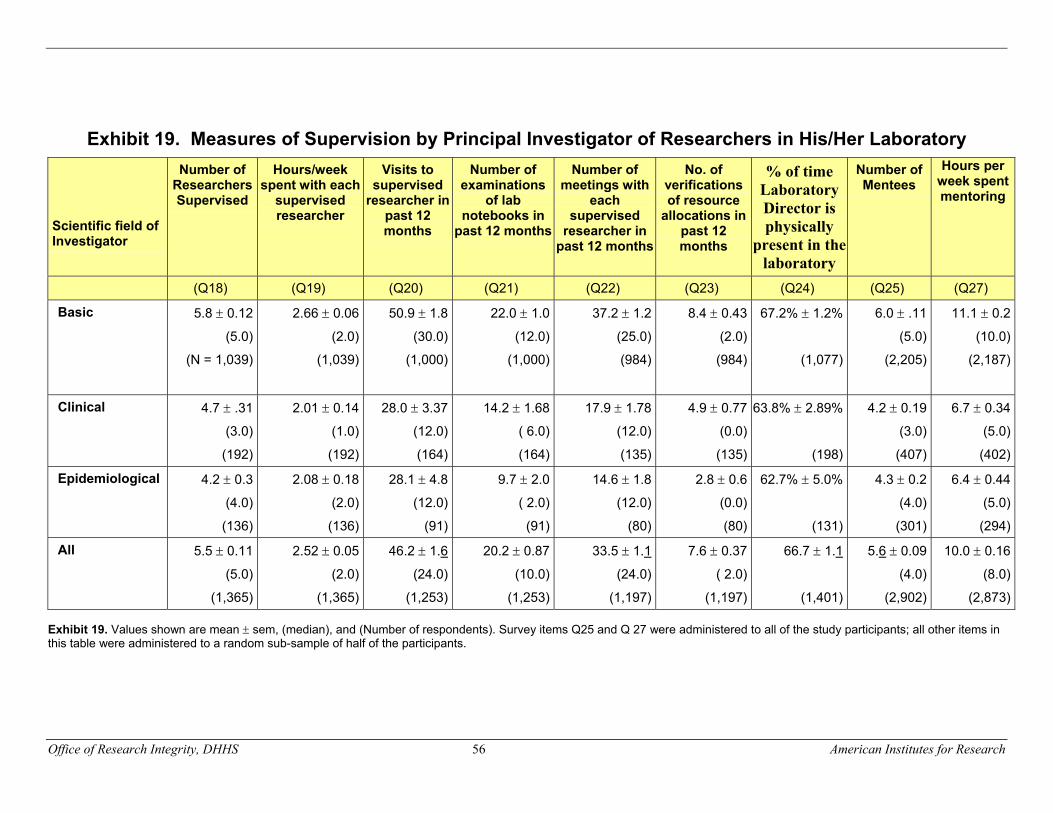
Office of Research Integrity, DHHS 56 American Institutes for Research
Exhibit 19. Measures of Supervision by Principal Investigator of Researchers in His/Her Laboratory
Scientific field of Investigator
Number of Researchers Supervised
Hours/week spent with each
supervised researcher
Visits to supervised
researcher in past 12 months
Number of examinations
of lab notebooks in
past 12 months
Number of meetings with
each supervised
researcher in past 12 months
No. of verifications of resource
allocations in past 12 months
% of time Laboratory Director is physically
present in the laboratory
Number of Mentees
Hours per week spent mentoring
(Q18) (Q19) (Q20) (Q21) (Q22) (Q23) (Q24) (Q25) (Q27)
Basic 5.8 ± 0.12
(5.0)
(N = 1,039)
2.66 ± 0.06
(2.0)
(1,039)
50.9 ± 1.8
(30.0)
(1,000)
22.0 ± 1.0
(12.0)
(1,000)
37.2 ± 1.2
(25.0)
(984)
8.4 ± 0.43
(2.0)
(984)
67.2% ± 1.2%
(1,077)
6.0 ± .11
(5.0)
(2,205)
11.1 ± 0.2
(10.0)
(2,187)
Clinical 4.7 ± .31
(3.0)
(192)
2.01 ± 0.14
(1.0)
(192)
28.0 ± 3.37
(12.0)
(164)
14.2 ± 1.68
( 6.0)
(164)
17.9 ± 1.78
(12.0)
(135)
4.9 ± 0.77
(0.0)
(135)
63.8% ± 2.89%
(198)
4.2 ± 0.19
(3.0)
(407)
6.7 ± 0.34
(5.0)
(402)
Epidemiological 4.2 ± 0.3
(4.0)
(136)
2.08 ± 0.18
(2.0)
(136)
28.1 ± 4.8
(12.0)
(91)
9.7 ± 2.0
( 2.0)
(91)
14.6 ± 1.8
(12.0)
(80)
2.8 ± 0.6
(0.0)
(80)
62.7% ± 5.0%
(131)
4.3 ± 0.2
(4.0)
(301)
6.4 ± 0.44
(5.0)
(294)
All 5.5 ± 0.11
(5.0)
(1,365)
2.52 ± 0.05
(2.0)
(1,365)
46.2 ± 1.6
(24.0)
(1,253)
20.2 ± 0.87
(10.0)
(1,253)
33.5 ± 1.1
(24.0)
(1,197)
7.6 ± 0.37
( 2.0)
(1,197)
66.7 ± 1.1
(1,401)
5.6 ± 0.09
(4.0)
(2,902)
10.0 ± 0.16
(8.0)
(2,873)
Exhibit 19. Values shown are mean ± sem, (median), and (Number of respondents). Survey items Q25 and Q 27 were administered to all of the study participants; all other items in this table were administered to a random sub-sample of half of the participants.

Office of Research Integrity, DHHS 57 American Institutes for Research
5. Publication practices (Survey items 30–37 and Composite Variable # 2)
The survey included eight items related to publication practices (Q30–Q38) with 1,124 respondents. The results are shown in Exhibit 20).23 The results are presented in order of decreasing frequency of a desirable practice by basic scientists.
Exhibit 20. Publication Practices (Q30–Q37) Item No. Characteristic Mean N
Q31 Did not include an authors who only performed routine or repetitive tasks16
85.44% ± 0.69% 1,482
Q35 % of manuscripts where all authors understood and could defend the work
83.46% ± 0.88% 1,480
Q36 % of manuscripts where PI examined data for unusual patterns
82.42% ± 0.97% 1,478
Q30 % of manuscripts clearly describing inclusion and exclusion criteria
66.76% ± 1.21% 1,473
Q33 % of manuscripts where the authors signed a consent form
50.94% ± 1.33% 1,477
Q37 % of manuscripts reviewed by a senior scientists who was not an author
45.30% ± 1.15% 1,482
Q32 % of manuscripts where the authors signed a shared responsibility statement
41.98% ± 1.31% 1,479
Q34 % of manuscripts where authors signed a conflict of interest statement
37.16% ± 1.30% 1,480
Exhibit 20. Publication Practices. Values shown are the mean ± 1 sem for frequency of each of eight practices. Data from all respondents.
We see that these publication practices—all of which would generally be regarded as desirable as ways to promote research integrity or in keeping with best practices—range in frequency from 37% to 85%. Since each of these measures is attempting to measure the rate of implementation of good practices, we have formed a composite variable For this variable, we provide a “point” if a given respondent indicates that he or she has implemented a desirable practice at least 34% of the time. Each respondent can obtain up to a maximum of 8 points, while the minimum score is 0 points. We calculated the sum of the total number of points, divided by 8, and expressed the result as a percentage score. The mean for the basic scientists was 66.62% ± 0.71% in terms of these publication practices, based on the self-report data. A “point” was given if the practice was used at least 34%–66% of the time (i.e., the response which has 50% as its midpoint), so that means that about 66% of the time respondents were using these criteria about
23 The responses for Q31 were replaced by their complement from unity. For example, if 14.56% of manuscripts included an author whose only contribution was a routine task (e.g., for a person providing technical assistance), then the complement, i.e. 100–14.56 = 85.44% of the manuscripts did not include someone whose only contribution was to perform repetitive or routine tasks.

Office of Research Integrity, DHHS 58 American Institutes for Research
50% of the time. The median was 62.50% (fairly close to the mean), and the 25th and 75th percentiles were 50% and 87.50%, respectively).
6. Guidelines regarding publications (Survey Items 38–43 and Composite Variable # 3)
Six survey items (Q38–Q43) addressed the issue of guidelines regarding publication practices. The practices concerned included:
1) Determination of authorship and order of authorship (Q38)
2) Separation of a single substantive report into multiple smaller fragmentary manuscripts (Q39)
3) Multiple simultaneous submissions of a given manuscript to more than one journal (Q40)
4) Evidence of reproducibility (Q41)
5) Correction or retraction of published information that is found to be erroneous (Q42)
6) Criteria and procedures for sharing of data, methods, reagents with competent professionals from outside the laboratory (Q43).
The results are summarized in Exhibit 21A. This exhibit shows the results for each of the six topics, summarized as any guidelines (verbal or written), to some or all members of the laboratory. The topic with the highest frequency of self-reported use of any of guidelines was “reproducibility.” A similar profile (of relative frequency of use of any types of guidelines) was seen whether we examine “any,” “verbal,” or “written” guidelines. It was relatively uncommon to have guidelines regarding fragmentation of manuscripts into smaller manuscripts. The lowest frequency of guidelines was seen for the topic of “correction or retraction of published information that was later discovered to be erroneous.” This should not be surprising, since this is a relatively uncommon occurrence and may need to be treated on an ad hoc basis.
Exhibit 21B shows that for the entire series of six guidelines, there was almost an identical pattern regarding the relative frequency of “any guideline,” verbal guidelines, verbal guidelines for all members of the laboratory, written guidelines, and written guidelines for all members of the laboratory. For example, written guidelines were reported to be in use by only 4.5% to 1.8% of the PIs depending on the topic area; written guidelines that were distributed to all members of the laboratory were reported to be in use by only 3.8% to 1.3% of PIs.

Office of Research Integrity, DHHS 59 American Institutes for Research
Exhibit 21A. Use of Guidelines for Six Criteria Related to Publication Policies and Practices
0%
25%
50%
75%
100%An
y G
uide
line
Verb
al
Verb
al fo
r All
Writ
ten
Writ
ten
for A
ll
% w
ith A
ny G
uide
lines
Authorship
No Fragmentation
Mult. Submissions
Reproducibility
Retractions
Sharing
Exhibit 21A. Summary display of use of guidelines for 6 criteria related to publication policies and practices by all respondents (Q38–Q43). “Any Guideline” means a positive response to any of four responses: verbal guidelines—some members of the lab; verbal guidelines—all members of the lab; written guidelines—some members of the laboratory; written guidelines for all members of the laboratory. Responses of “Don’t Know” and no response were excluded. Individuals who did not collect data in any form (Q1-Q4) were excluded. Individuals who failed to answer less than 50% of the items were excluded. The highest probability of a guideline was for Reproducibility (Q41). The second and third highest were for Authorship (Q38) and for Sharing (Q43). These were followed by guidelines regarding fragmentation of a piece of work (Q39), and finally, at a substantially lower level, for corrections or retractions of information in a published article (Q42). (It is understandable that the issue of retractions is the least common, since this is a relatively rare event, and often must be handled on an ad hoc basis. N’s were 1,482, 1,475, 1,468, 1,472, 1,454, 1,476 for survey items Q38–Q43, respectively.
Office of Research Integrity, DHHS 60 American Institutes for Research
7. Training Re Research Integrity (Survey Items 44–48)
It is generally believed, that one of the most important things that a PI or Laboratory Director can do to promote research integrity is to provide training on the subject to junior researchers operating under her/his supervision and direction. The survey included 5 items related to training (Q44–Q48). Of these, three were quantitative and two were qualitative.
Basic scientists indicated that 87.7% ± 1.3% of the researchers under their supervision received training in regard to research integrity. The training had a mean duration of 6.9 ± 0.5 hours (median 4.0 hours; 25th and 75th percentiles of 2 and 8 hours, respectively). An outcome assessment was reported to have been used in a mean of 56.3% ± 2.5% of cases.
8. Characteristics of the Principal Investigator
Status as Laboratory Director: For those who indicated that their primary field was one of the basic sciences, 48.4 indicated that they are officially a Lab Director. In addition, 46.4% indicated that they perform some of the duties of a laboratory director, but that they do not have that title in an official sense. Only 5.2% of the respondents indicated that the title did not apply “No, the title of “laboratory director” does not apply to my position OR I do not perform the duties of a laboratory director.” (Q49)
Prior experience with a good mentor: More than 63.6% ± 1.02% of 2,206 respondents indicated that they “Strongly Agree” or “Agree” with the statement that “In the past, I had a mentor who prepared me well to be a good mentor to the researchers whose work I supervise today.” A similar percentage (61.92%) was observed among clinical investigators and a very slightly smaller percentage among epidemiological investigators (57.0%).
Institutional Affiliation: PIs in the basic sciences were affiliated with institutions of higher education in 86.11% of cases.
Duration as a PI: The number of years as a PI was 16.26 ± 0.19 years The median is 15.0 years, and the 25th and 75th percentiles were 9.0 and 22.0.

Office of Research Integrity, DHHS 61 American Institutes for Research
Exhibit 21B. Use of Guidelines for Six Criteria Related to Publication Policies and Practices
0%
25%
50%
75%
100%
Any
Guid
eline
Verb
alVe
rbal
for A
ll
Writ
ten
Writ
ten
for A
ll
% w
ith A
ny G
uide
lines
Authorship
No Fragmentation
Mult. Submissions
Reproducibility
Retractions
Sharing
Exhibit 21B. Same data (all respondents) as for Exhibit 21A. Here the response for “Any Guideline” has been normalized to 100%. This facilitates examination of the 6 curves in Exhibit 18A, to examine whether they have the same shape. Indeed, it appears that the “falloff” for the four types of guidelines has exactly the same pattern, irrespective of the nature of the content of the guidelines. Only a tiny fraction of respondents employ written guidelines and distribute them to all members of their laboratory. “Verbal guidelines for all members of the laboratory” runs about 75% of the value for “Any Guideline”; written guidelines for all members of the laboratory run about 5–10% of the value for “any guidelines”. Exhibits 18A and 18B indicate a potential area for improvement: the possibility of distributing guidelines to all members of the laboratory, and the increased use of written guidelines above the present ~ 15%. This is especially the case, since it is difficult to document the nature of the guideline when it is distributed verbally, and it is impossible to quantify the impact when the guidelines are distributed to “some” members of the laboratory. (We would like to have been able to address this quantitatively in the present survey, but this would have added to the length and/or complexity of the survey, and there was a real possibility that many or most respondents would not have been able to make a reliable estimate of the % of the laboratory to whom the guidelines were distributed. This series of questions did not address how often the guidelines are distributed or discussed, what use they had, and what impact they may have had. Data from all respondents to the survey. (N values as in Exhibit 21A.)
History of Grant Applications: On average, the PIs had submitted 5.0 ± .07 grant applications over the previous five years (median = 4.0), and of these 2.82 ± .04 were funded (median = 2.0). Thus, the success rate for grants for the study participants was 50%–substantially above the average for all applications to NIH. On average, the respondents to the present survey were the successful, long term recipients of funding from NIH. The current number of federal grants (Q56) was 2.35 ± 0.03, and the current dollar amount of grant and contract support for total costs (direct and indirect costs) per year was $617,047 ± $14,647, with a median of

Office of Research Integrity, DHHS 62 American Institutes for Research
$425,000 and 25th and 75th percentiles of $260,000 and $729,000, respectively. Of the current funding, 82.22% comes from the NIH, with about 5.05% coming from elsewhere in DHHS or the federal government. The basic scientist respondents indicated that 44.25% ± 0.74% of their own personal income was based on their research funding.
9. Multiple Regression
We have analyzed the data for three dependent variables for the set of basic scientists, clinical investigators, and epidemiological investigators, considered separately:
Y1: composite variable re data control and integrity measures (Q5–Q10)
Y2: composite variable re publication practices (Q30–Q37)
Y3: composite variable re guidelines (Q38–Q43).
Each of these variables was first converted to a “z-score,” i.e., the mean of the variable for the entire group was subtracted from each value, and then the score was divided by the observed standard deviation for the group. In this manner, each variable is converted to a new variable with a mean (expectation) of zero, and a standard deviation (and variance) of unity (1.00):
z-score = (observation – mean)/(standard deviation)We have examined the effect of three independent variables in each case:
X1: Whether the PI has a previous mentor, who, in his won opinion, prepared him well to be a mentor to others (1 = “Strongly Agree” or “Agree”; 0 = Other responses) (Q26)
X2: Status as Laboratory Director (1 = “Yes”; 0 = “No” or “Maybe”)(Q49)
X3: Size of laboratory (Measured as 1 = Number of Mentees ≥ 4; 0 = Number of Mentees ≤ 3)
Data Control and Integrity Measures (Y1)
Basic Scientists: (df = 820): For the first dependent variable, Y1 (“Data control and Integrity Measures”) the only independent variable with a significant t-test for the regression coefficient was X2, Status as Laboratory Director. The t value was 2.65, corresponding to a P value of 0.0082, which is significant at the P < 0.01 level. The other independent variables did not have a significant effect at the P < 0.01 level. The R2 value was 0.0106, corresponding to a correlation of approximately 0.1.
Clinical Investigators: (df = 155): None of the independent variables had a significant effect. Note, however, that the number of observations and number of degrees of freedom are considerably lower than was the case for the basic scientists.
Office of Research Integrity, DHHS 63 American Institutes for Research
Epidemiological Investigators: (df = 99): The independent variable X2, “Status as Laboratory Director” was borderline significant at the P ~ 0.01 level, with a t value of 2.56 corresponding to a P value of 0.012.
Publication Practices (Y2)
Basic Scientists: (df = 556): For the second dependent variable, Y2 (“Publication Practices”) none of the three independent variables had a significant effect at the P < 0.01 level.
Clinical Investigators: (df = 96): None of the independent variables had a significant effect. Note, however, that the number of observations and number of degrees of freedom are considerably lower than was the case for the basic scientists. There was a “suggestive” effect (t = 2.15 corresponding to P < 0.034) for X3 = Laboratory Director Status.
Epidemiological Investigators: (df = 85): None of the three independent variables had a significant effect at the P < 0.01 level or even at the P < 0.05 level.
Publication Guidelines (Y3)
Basic Scientists: (df = 663): For the third dependent variable, Y3 (“Any Publication Guidelines”) two independent variables showed a significant t-test for the regression coefficient: X1, prior mentor, with t = 3.24 and P < 0.0013, and X3 = size of laboratory, with t = 2.71 corresponding to P ≤ 0.0068. However, the R2 value was extremely small, just 0.0314, corresponding to a correlation of 0.17.
Clinical Investigators: (df = 111): None of the independent variables had a significant effect.
Epidemiological Investigators: (df = 99): The independent variable X2, “Status as Laboratory Director” was significant at the P < 0.01, with a t value of 2.85 corresponding to a P = 0.0053. The other independent variables showed no significant effect. The adjusted R2 value was 0.0932, corresponding to a correlation of r = 0.305.
These results demonstrate the utility of multiple regression for evaluating the statistical significance of the results obtained, while at the same time controlling for other potentially confounding variables. Collectively, these indicate that status as Laboratory Director appears to influence the practices in regard to research integrity. However, we must be cautious regarding the interpretation. There are multiple interpretations.
Laboratory directors might feel that they have responsibilities in certain areas, and hence be more tempted than others (non-laboratory directors) to provide a “socially acceptable” response. Secondly, those who are engaged in certain activities (or groups of activities) might be
Office of Research Integrity, DHHS 64 American Institutes for Research
more likely to self-identify as a laboratory director. Finally, both the dependent and independent variables could be related to a third variable.
C. CORRELATION MATRICES
Correlation analyses, useful for identifying groups or classes of variables that co-vary, were conducted for a number of the survey questions. Below, the key findings from these analyses are presented, ordered by the variables examined in each case. The analyses are based on data from all of the respondents as presented in Appendix D).
Exhibit 22 (Data Storage): Note the negative correlation between the three major types of data storage media: loose-leaf notebooks, permanently bound notebooks, and digital files. In contrast, the correlations with Audio-visual media are much smaller (especially when analyzed in terms of r2), indicating that retention of data in this form is essentially unrelated to the other types of media.
Exhibit 23 (Data Control and Integrity Measures): The most striking correlation is between Q9 and Q10—the percentage of experiments where the details of the method, and the details of the analyses have been recorded in sufficient detail so that the results could be replicated. Use of witnesses to a data book is correlated with the practice of dating and signing the laboratory record by the researcher (r = 0.31). Replicability of the analyses is correlated with identification of data exclusion criteria, as might be expected. Retention of records (Q5) is correlated significantly with 4 of the remaining five practices, with a fairly high correlation (r = .19, .20) with notations of exclusion criteria (Q8) and ease of replication of methods (Q9).
Exhibit 24 (Publication Practices): The most striking correlations are those between Q32, Q33, Q34—signing statements regarding shared responsibility and consent to be an author, and a conflict of interest statement. (These practices were more common among clinical and epidemiological investigators, and among MDs relative to PhDs. This may be due to the fact that some very prominent journals in this field, e.g., New England Journal of Medicine, and the Journal of the American Medical Association, make some of these statements a prerequisite to publication.) Six of the possible seven correlations with Q30 (“criteria for inclusion or exclusion of data”) were statistically significant at the p < 0.01 level, suggesting that Q30 may be a useful index of publication policies and practices. Items Q 35, 36 and 37 were also highly and statistically significantly correlated—ability of the authors to understand and defend the work, checking for unusual patterns in the data, and review by a senior scientist who was not an author. The likelihood of inclusion of an individual as an author who had done only repetitive or routine tasks was correlated with the giving of a consent for authorship (Q33) and signing of an informed consent statement (Q34).
Office of Research Integrity, DHHS 65 American Institutes for Research
Exhibit 25 (Publication Guidelines): All 15 pair-wise correlations between these 6 variables were statistically significantly different from zero at the P < 0.01 level, with r values in the range 0.32 to 0.50. These correlations were computed using a dichotomized value, with Y = 1 if the response was >= 34% for use of any guideline.
Exhibit 26 (Funding, Supervision, and Mentoring): All of the correlations shown are significant at the p < 0.01 level. Thus, these guidelines appear to be provided “en bloc” at least in many cases. Note that most of the guidelines are verbal, and are not necessarily distributed to all members of the laboratory. This analysis was performed using “Any guidelines” (verbal or written, to some or to all members of the laboratory).
Exhibit 27 (Funding and Age): All six correlations are significant at the p < 0.01 level. The highest correlations are between age and number of years as a PI (r = 0.75), and between current dollar amount of grant funding and the number of currently active federal grants (r = 0.52).

Office of Research Integrity, DHHS 66 American Institutes for Research
Exhibit 22. Correlations Among Frequency of use of Media for Storing Data Storage Media Q1 Q2 Q3 Q4 Q1: Loose-Leaf Notebooks — Q2: Permanently Bound Notebooks -.23 — Q3: Digital Files -.27 -31 — Q4: Audio-Visual Media .07 .08 -.03 —
Note. N = 2,915. Correlations greater than r = 0.06 in absolute magnitude are significant at the p < 0.01 level and are shown in bold type font.
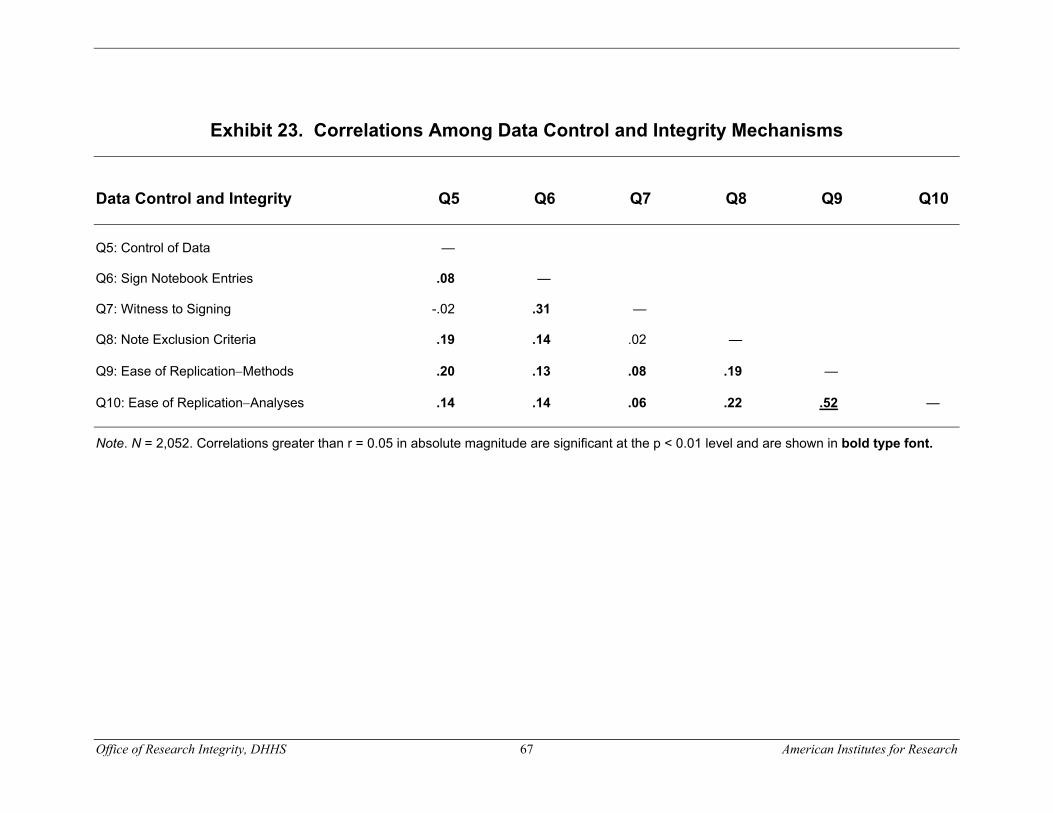
Office of Research Integrity, DHHS 67 American Institutes for Research
Exhibit 23. Correlations Among Data Control and Integrity Mechanisms
Data Control and Integrity Q5 Q6 Q7 Q8 Q9 Q10 Q5: Control of Data — Q6: Sign Notebook Entries .08 — Q7: Witness to Signing -.02 .31 — Q8: Note Exclusion Criteria .19 .14 .02 — Q9: Ease of Replication−Methods .20 .13 .08 .19 — Q10: Ease of Replication−Analyses .14 .14 .06 .22 .52 —
Note. N = 2,052. Correlations greater than r = 0.05 in absolute magnitude are significant at the p < 0.01 level and are shown in bold type font.
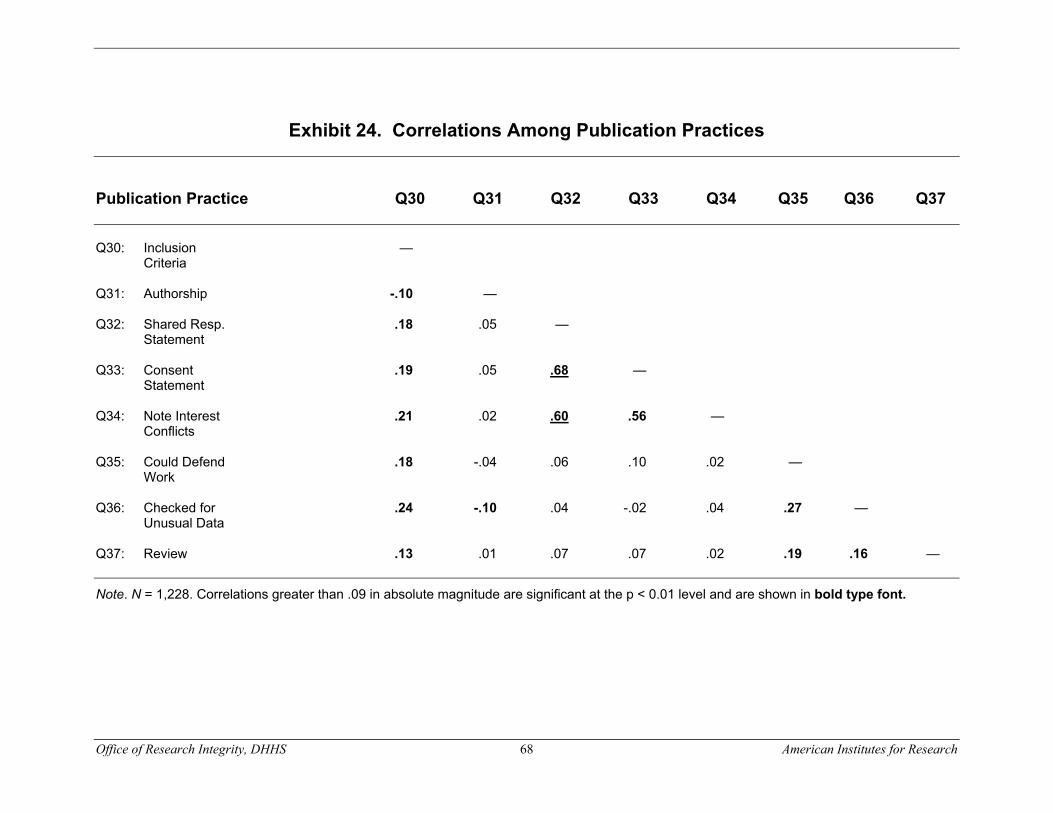
Office of Research Integrity, DHHS 68 American Institutes for Research
Exhibit 24. Correlations Among Publication Practices
Publication Practice Q30 Q31 Q32 Q33 Q34 Q35 Q36 Q37 Q30: Inclusion — Criteria Q31: Authorship -.10 — Q32: Shared Resp. .18 .05 — Statement Q33: Consent .19 .05 .68 — Statement Q34: Note Interest .21 .02 .60 .56 —
Conflicts Q35: Could Defend .18 -.04 .06 .10 .02 — Work Q36: Checked for .24 -.10 .04 -.02 .04 .27 —
Unusual Data Q37: Review .13 .01 .07 .07 .02 .19 .16 —
Note. N = 1,228. Correlations greater than .09 in absolute magnitude are significant at the p < 0.01 level and are shown in bold type font.

Office of Research Integrity, DHHS 69 American Institutes for Research
Exhibit 25. Correlations Among Availability and Use of Publication Guidelines Guideline Content Area Q38 Q39 Q40 Q41 Q42 Q43 Q38: Authorship Order — Q39: Report Fragmentation .49 — Q40: Simultaneous Journal Submissions .46 .50 — Q41: Results Can Be Reproduced .33 .36 .38 — Q42: Retraction of False Information .33 .41 .36 .32 — Q43: Data Sharing .35 .38 .32 .35 .40 —
Note. N = 1,487. All correlations are significant at the p < 0.01 level and are therefore shown in bold type font.

Office of Research Integrity, DHHS 70 American Institutes for Research
Exhibit 26. Correlations Among Amount of Funding and Number of Researchers Supervised or Mentored
Variable Q57 Q18 Q25 Q57: Dollar Amount of Annual Contract/Grant Funding — Q18: Average Number of Researchers Supervised in Past Year .32 — Q25: Average Number of Researchers Mentored in Past Year .19 .69 —
Note. N = 1,332. All correlations are significant at the p < 0.01 level and are therefore shown in bold type font.
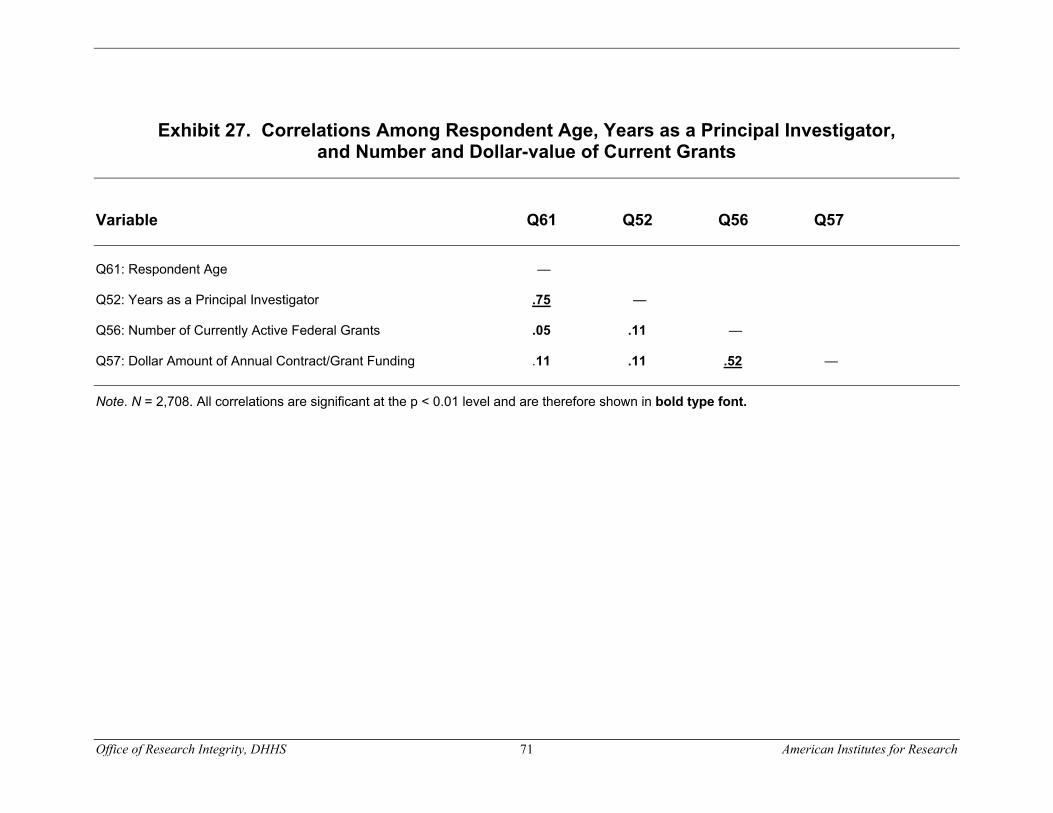
Office of Research Integrity, DHHS 71 American Institutes for Research
Exhibit 27. Correlations Among Respondent Age, Years as a Principal Investigator, and Number and Dollar-value of Current Grants
Variable Q61 Q52 Q56 Q57 Q61: Respondent Age — Q52: Years as a Principal Investigator .75 — Q56: Number of Currently Active Federal Grants .05 .11 — Q57: Dollar Amount of Annual Contract/Grant Funding .11 .11 .52 —
Note. N = 2,708. All correlations are significant at the p < 0.01 level and are therefore shown in bold type font.

Office of Research Integrity, DHHS 72 American Institutes for Research
D. SUGGESTIONS FROM RESPONDENTS TO PROMOTE RESEARCH INTEGRITY IN BIOMEDICAL RESEARCH LABORATORIES
Item 62 of the survey was as follows:
“We would be very interested in your suggestions about measures that researchers, institutions, professional societies, journal editors and editorial boards, foundations, or government agencies could undertake to promote scientific integrity and the responsible conduct of research. Please enter your comments in the space below.”
Exhibit 28 displays the dominant themes of responses and shows the frequency of recommendations for each topic. Four topics were referenced more than 100 times. The majority of the codes (10) were applicable to comments between 50–100 times. Only two codes were referenced less than 50 times. Over 200 comments did not appear to be principally related to one of the 16 major topics. Accordingly they were assigned code “17 – Other”. These comments were very heterogeneous in nature and could not be easily catalogued using a small set of categories.
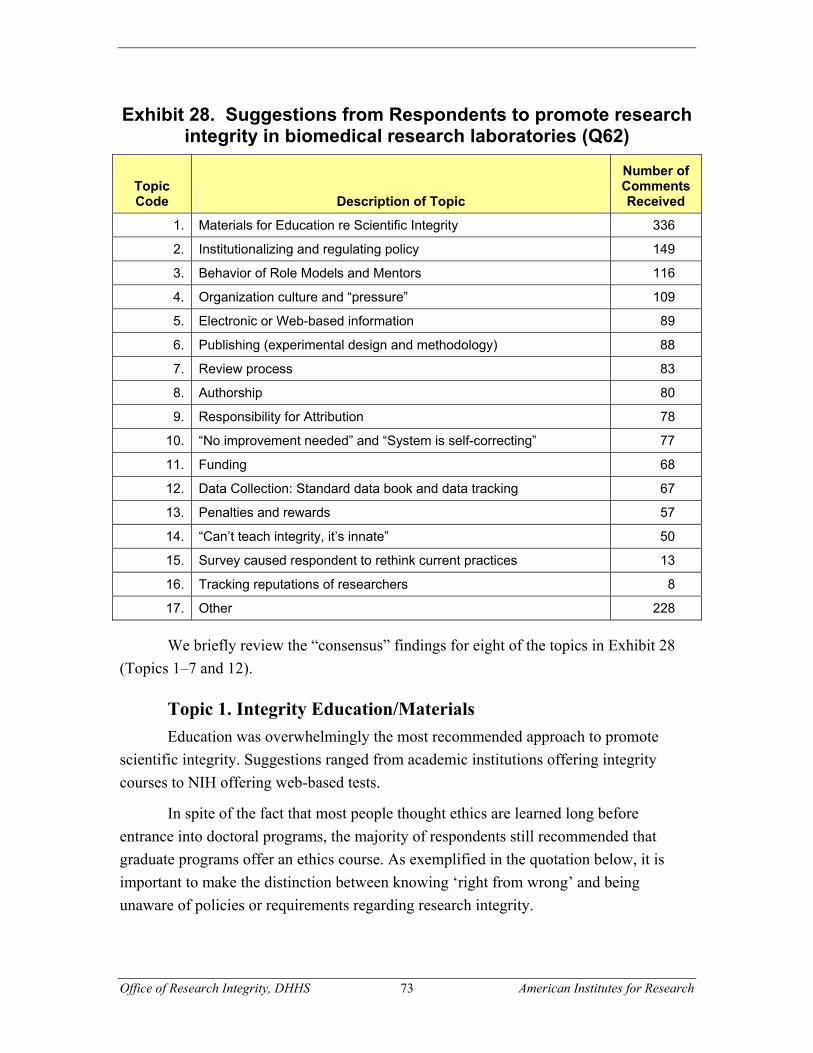
Office of Research Integrity, DHHS 73 American Institutes for Research
Exhibit 28. Suggestions from Respondents to promote research integrity in biomedical research laboratories (Q62)
Topic Code Description of Topic
Number of Comments Received
1. Materials for Education re Scientific Integrity 336
2. Institutionalizing and regulating policy 149
3. Behavior of Role Models and Mentors 116
4. Organization culture and “pressure” 109
5. Electronic or Web-based information 89
6. Publishing (experimental design and methodology) 88
7. Review process 83
8. Authorship 80
9. Responsibility for Attribution 78
10. “No improvement needed” and “System is self-correcting” 77
11. Funding 68
12. Data Collection: Standard data book and data tracking 67
13. Penalties and rewards 57
14. “Can’t teach integrity, it’s innate” 50
15. Survey caused respondent to rethink current practices 13
16. Tracking reputations of researchers 8
17. Other 228
We briefly review the “consensus” findings for eight of the topics in Exhibit 28 (Topics 1–7 and 12).
Topic 1. Integrity Education/Materials Education was overwhelmingly the most recommended approach to promote
scientific integrity. Suggestions ranged from academic institutions offering integrity courses to NIH offering web-based tests.
In spite of the fact that most people thought ethics are learned long before entrance into doctoral programs, the majority of respondents still recommended that graduate programs offer an ethics course. As exemplified in the quotation below, it is important to make the distinction between knowing ‘right from wrong’ and being unaware of policies or requirements regarding research integrity.

Office of Research Integrity, DHHS 74 American Institutes for Research
“Develop a clear set of guidelines as to what determines ethical conduct. I believe that my lab does science at the highest possible level of ethics, but I would never even consider having my people sign their work daily and have it witnessed. If this is an expectation then this must be defined by the funding agency! If it is already defined then it must be publicized more, because I am completely unaware of it.”
“I would make use of instructional videos and self-paced web-based tools especially for junior people going through my lab. I have only seen one pamphlet come across my desk in the last 8 years that directly addressed appropriate methods of lab notebook keeping and I use it for all new members of my lab.”
The general consensus from respondents is that a course will not prevent people from “cheating” on their research (because those few who plan to cheat are likely to do so in any event), but that a course can offer important and practical advice and guidelines for ethical behaviors during research.
Though more than 300 respondents recommended scientific integrity education, there were several themes among the types of education programs suggested.
• Discussion within labs • Mandatory course in graduate school • Online tutorials • Exams • Training • Training materials (pamphlets, videos) • Case-based studies
These recommendations present both formal and informal approaches to
educating scientists about expected research behaviors. Often, these suggestions were made in collaboration with other recommendations. These respondents said that integrity education would be more effective if other things such as providing strong mentoring and establishing clear policies were to accompany it.
One of the strongest recommendations within the topic of education is the importance of discussion. Many respondents noted that though courses can be beneficial, they are usually impersonal. One respondent suggested that, in addition to mandatory graduate coursework, research integrity be a part of discussion within the laboratory. Some respondents noted that this happens either informally through situations as they arise, or through more organized monthly lunches or meetings. Respondents typically considered this personal interaction with regards to integrity research as integral to encouraging certain behaviors. This suggests that PI’s should be given training regarding
Office of Research Integrity, DHHS 75 American Institutes for Research
regulations and then expected to convey those policies to the other members of their laboratories.
Unlike courses for graduate students, training programs could be designed for and made available to PI’s and foreign post-docs who did not matriculate through the graduate system in the United States (who presumably have not been exposed to the U.S.’s expectations and regulations regarding ethical research practices). Training should address issues such as authorship, documentation of laboratory results, and record keeping.
Topic 2. Institutionalizing and Regulating Policy Many respondents noted that they were skeptical that research integrity could be
“legislated” and successfully imposed by administrative requirements. Many respondents commented that current regulations (e.g., for IRBs and HIPAA), already were very burdensome. There was considerable concern among respondents that the intention of the survey was to form a basis for the creation of additional policies and paperwork for researchers, and concern that such regulations might have little gain or be counterproductive, while costly in terms of time.
There was considerable support for the idea of professional organizations and NIH, developing and disseminating a booklet, pamphlet, or web based materials with a written statement of guidelines regarding ethical research with each funded grant. One respondent noted that the American Psychological Association already does this well. This would clarify the expectations for grant researchers (i.e. if their funding agency expects PI’s to sign and date notebooks, utilize witnesses, use bound notebooks, etc.). Receiving these guidelines would also serve as friendly reminders to PI’s, which then might stimulate them to initiate discussions with members of their laboratory, help to modify laboratory rules, and change attitudes and behaviors.
“A simple set of guidelines might be provided with any new NIH grant award. This should indicate the nature and scope of “integrity in research”, the expectation that the PI should guide lab personnel in these areas, and suggestions about how the PI might do so. e.g. Importance of correct record-keeping.”
“If you start with the fundamental assumption that most (or a significant percentage of) investigators lack sufficient research integrity, you will create such an oppressive regulated environment that research will be completed stifled. You will discourage young investigators. Our institution has instituted a number of measures to improve research integrity including web-based self instruction programs (which are excellent) and

Office of Research Integrity, DHHS 76 American Institutes for Research
an oversight process for ensuring that any submitted publications are in accordance with IRB or IACUC protocols.
Survey respondents very clearly want to be aware and informed about regulations and expectations; they do not, however, want excessive regulations or bureaucracy impeding their ability to research.
Topic 3. Role-model and mentor behavior Over 100 respondents emphasized the importance of mentoring, but that opinion
was often offered in conjunction with education efforts. Proponents of mentoring agree that formal education helps convey the institution’s standards. However, they argue that mentoring plays a more important role in promoting ethical research.
(One of the highest instances of overlap between content codes was education and mentoring. We received 336 comments on topic 1 (education) and 116 comments relevant to topic 3, mentoring.)
“Although my graduate students have taken university training re scientific integrity, I think they learn more from my personal insistence that they do the proper controls and “tell it like it is,” even if it doesn’t fit with our preconceived notions or models. Thus, proper mentoring is crucial to promoting integrity in science.”
“The best method is an outstanding example set by the mentor/principal investigator. An atmosphere of low/zero tolerance for non-ethical activities at one’s institution also sets a very strong example. Editorials, discussion forums, etc. can also be quite powerful. For established researchers who already have a lot of formal training for other compliance issues, required formal training in integrity would be an additional and aggravating burden. However, formal training for beginning scientists, such as graduate school courses in ethics (as our institution does), provides a strong introduction to the relevant issues.”
“I think that it is very important the communication between the principal investigator and the fellow. This should be on a daily basis, a true mentorship. This is easier to realize when you are just starting the lab and the number of people working under the principal investigator is small. However, I realize that when the lab size becomes bigger (such as 10 fellows or more) than this communication is impossible to achieve, because the principal investigator has many other things to do and thus has to protect his/her time. It is a sort of vicious circle in this stressful and highly competitive environment: the more grant you have, the bigger the lab, the less interaction with your fellows, the higher the chances to violate scientific integrity.”
Office of Research Integrity, DHHS 77 American Institutes for Research
“We cannot teach honesty at this stage through formal instruction. Good judgment and high moral standards are learned already by the time we are in a Ph.D. program. Nevertheless, as professors, we certainly are aware that our students, co-workers and employees are learning from the examples that we set and from our reactions to improper or unethical behaviours of our colleagues.”
The success of mentoring relies on the personal relationship between mentor and mentee, the mentor modeling proper behavior through his/her own actions, and the mentor’s willingness to take the responsibility of addressing research integrity. Respondents make the convincing argument that senior researchers have a strong influence on what is considered “acceptable” or “unacceptable” in the lab. Therefore it is important for ORI to recognize and utilize this influential group in any policy or education efforts. As elaborated below, there is wisdom in senior researchers that should be respected and incorporated into any research integrity efforts by ORI.
“Also, we all have a pretty clear idea when the case is black and white. It is the gray areas that need discussion, and this really is best appreciated when one has experience. Even today, 19 years post-Ph.D., I am exposed to new situations and new pressures. Today’s decisions are different than those I would have made 10 years ago.”
Topic 4. Pressure to Publish; Culture of the Discipline, Institutional, Laboratory Many respondents took survey question #62 as an opportunity to comment on the
“bigger picture” of research, and how the current culture may produce barriers to ethical and careful research behavior. These comments related to the general environment of research, and included specific topics that are addressed directly at other points in this report (such as a fear of more regulations, discussed in topic # 2, above).
Many researchers’ livelihoods depend on winning grants and publishing frequently, both of which cause a lot of pressure that may lead individuals to rush certain projects. The most common complaint about the current research culture is the “publish or perish” mentality in most research environments. As one respondent articulates, the problem is not that there are a lot of researchers intending to cheat, but rather a system that pressures researchers to shift their priorities and/or attention to certain aspects of their projects.
“I feel that the best prevention is to provide a low-pressure environment, be especially careful to offer support and encouragement when projects are going poorly, encouraging rigorous self-criticism, and discussing with students and post-docs issues about the careful design, interpretation, and
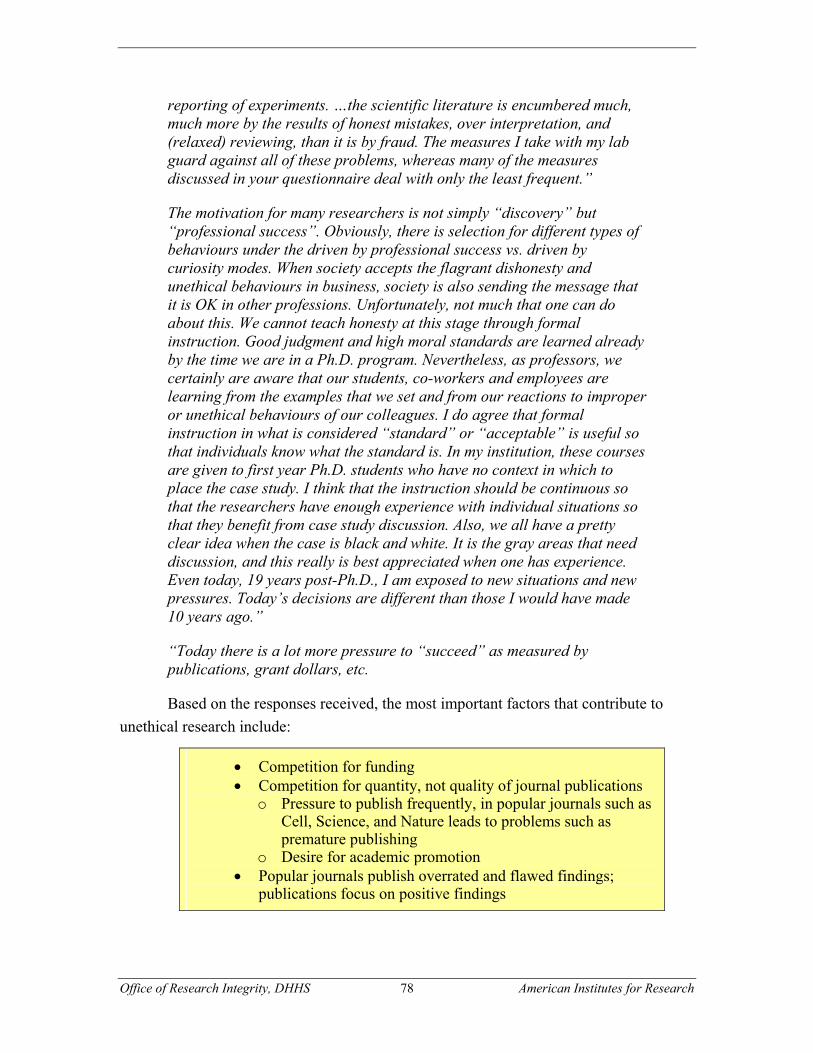
Office of Research Integrity, DHHS 78 American Institutes for Research
reporting of experiments. …the scientific literature is encumbered much, much more by the results of honest mistakes, over interpretation, and (relaxed) reviewing, than it is by fraud. The measures I take with my lab guard against all of these problems, whereas many of the measures discussed in your questionnaire deal with only the least frequent.”
The motivation for many researchers is not simply “discovery” but “professional success”. Obviously, there is selection for different types of behaviours under the driven by professional success vs. driven by curiosity modes. When society accepts the flagrant dishonesty and unethical behaviours in business, society is also sending the message that it is OK in other professions. Unfortunately, not much that one can do about this. We cannot teach honesty at this stage through formal instruction. Good judgment and high moral standards are learned already by the time we are in a Ph.D. program. Nevertheless, as professors, we certainly are aware that our students, co-workers and employees are learning from the examples that we set and from our reactions to improper or unethical behaviours of our colleagues. I do agree that formal instruction in what is considered “standard” or “acceptable” is useful so that individuals know what the standard is. In my institution, these courses are given to first year Ph.D. students who have no context in which to place the case study. I think that the instruction should be continuous so that the researchers have enough experience with individual situations so that they benefit from case study discussion. Also, we all have a pretty clear idea when the case is black and white. It is the gray areas that need discussion, and this really is best appreciated when one has experience. Even today, 19 years post-Ph.D., I am exposed to new situations and new pressures. Today’s decisions are different than those I would have made 10 years ago.”
“Today there is a lot more pressure to “succeed” as measured by publications, grant dollars, etc.
Based on the responses received, the most important factors that contribute to unethical research include:
• Competition for funding • Competition for quantity, not quality of journal publications
o Pressure to publish frequently, in popular journals such as Cell, Science, and Nature leads to problems such as premature publishing
o Desire for academic promotion • Popular journals publish overrated and flawed findings;
publications focus on positive findings

Office of Research Integrity, DHHS 79 American Institutes for Research
Respondents made a number of recommendations to improve the research culture. Below is a compiled list of their suggested solutions. This list overlaps with suggestions that are more relevant to other content codes (such as reviewing or authorship), so the reader is advised to refer to those sections for more detail.
Solutions proposed by the respondents to the survey included:
• Role of journals o Should exhibit pressure for proper citations (to ensure
authors do not claim referenced ideas as original) o Publish sufficient information in journals so experiments
can be repeated o Require signatures from all authors o Involve multiple scientists in reviewing papers and grants
to encourage the sense of fairness • Awareness of quality
o Web-based discussion forums to discuss misleading publications
o Impose consequences for publishing irreproducible findings
o Online feedback from ORI to PIs o Evaluate quality of publications (to counter the ‘publish or
perish’ mentality’s focus on quantity of publications) • Culture in research settings
o Create cultures within labs where it is safe to point out mistakes
o Create cultures within labs where the goal is to produce results through hard work, eliminating the pressure to produce specific results.
o Suggest that all oral presentations contain a brief statement about how research integrity is maintained on a day-to-day basis
• Funding o Prevent NIH-funded work from being patented or
commercialized o Minimize ties of funding and employment to the number
of publications o Research funding should be more easily available to
individuals with a proven track record of high quality and high integrity

Office of Research Integrity, DHHS 80 American Institutes for Research
Topic 5. Electronic or Web-based information The majority of almost 100 responses regarding web-based information
encouraged the idea of shifting integrity education efforts to on-line sources. These recommendations overlapped quite a bit with suggestions for education (Topic # 1, above). However, many of the respondents who recommended web-based training or courses suggested that training be geared towards PIs (as opposed to the Integrity Education courses offered to graduate students, discussed in Topic 1, above.)
The respondents offered a variety of opinions on several issues, e.g. whether the training should be mandatory or optional; whether or not PIs should take a test or receive a certification upon completion; and whether or not these online courses and tests should be tied to federal funding. The majority of the group supported the idea of having guidelines and training available online for researchers at all levels. Mandatory trainings or tests would be more controversial, though not entirely unwelcome.
In smaller numbers, respondents also suggested:
• Journals should publish data, materials, and methods from articles online for public access
• ORI provide electronic feedback to PIs to remind researchers of the importance of maintaining research integrity
• The use of electronic databases
Topic 6. Publishing The role of publishing articles is brought up in a variety of contexts in
respondent’s recommendations. Here we address recommendations that deal with journals and publishing specifically. One of the most common recommendations within this code is to publish negative results in addition to the current publication focus on positive results, as exemplified here:
“I feel it is just as important to publish negative studies as positive studies. The fact that the majority of publications only report positive studies does not let the scientific community know that data may be in conflict. This fact would promote more scientific integrity.”
It was clear that respondents do not hold journals, as institutions, primarily responsible for ensuring scientific integrity. However, respondents do have serious suggestions for how journals can positively contribute to the research culture by setting
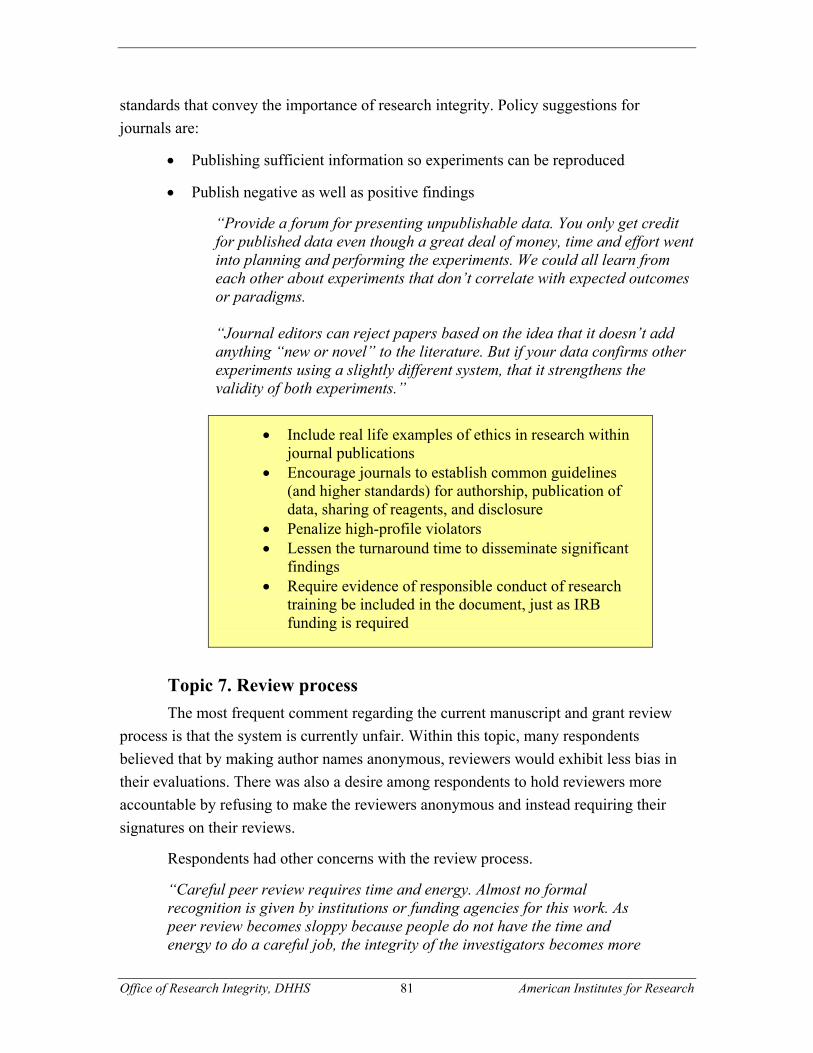
Office of Research Integrity, DHHS 81 American Institutes for Research
standards that convey the importance of research integrity. Policy suggestions for journals are:
• Publishing sufficient information so experiments can be reproduced
• Publish negative as well as positive findings
“Provide a forum for presenting unpublishable data. You only get credit for published data even though a great deal of money, time and effort went into planning and performing the experiments. We could all learn from each other about experiments that don’t correlate with expected outcomes or paradigms. “Journal editors can reject papers based on the idea that it doesn’t add anything “new or novel” to the literature. But if your data confirms other experiments using a slightly different system, that it strengthens the validity of both experiments.”
• Include real life examples of ethics in research within journal publications
• Encourage journals to establish common guidelines (and higher standards) for authorship, publication of data, sharing of reagents, and disclosure
• Penalize high-profile violators • Lessen the turnaround time to disseminate significant
findings • Require evidence of responsible conduct of research
training be included in the document, just as IRB funding is required
Topic 7. Review process The most frequent comment regarding the current manuscript and grant review
process is that the system is currently unfair. Within this topic, many respondents believed that by making author names anonymous, reviewers would exhibit less bias in their evaluations. There was also a desire among respondents to hold reviewers more accountable by refusing to make the reviewers anonymous and instead requiring their signatures on their reviews.
Respondents had other concerns with the review process.
“Careful peer review requires time and energy. Almost no formal recognition is given by institutions or funding agencies for this work. As peer review becomes sloppy because people do not have the time and energy to do a careful job, the integrity of the investigators becomes more

Office of Research Integrity, DHHS 82 American Institutes for Research
easily eroded by temptation and the pressure to publish, even when they know their work might be suspect.”
Other comments included the following:
• Senior scientists irresponsibly hand their reviewing duties to more junior, less experienced, less well qualified staff
• There is a need for higher standards in reviewer selection
Topic 12. Data collection: Standard data book and data tracking “A major tool that would help investigators would be better software for recording (and backing up) research data. Automated time and signature stamps as well as mechanisms for documenting record changes would greatly improve the processes without disrupting productivity. I would recommend that the NIH fund several contracts to develop such software and then make it open source and freely available to investigators. Palm technology or an equivalent would also be appropriate.”
Principal Conclusions from Recommendations of Survey Respondents Based on review of all of the comments received, and on the summary of the
various topics including that provided above, we believe that there is a majority or consensus view of the respondents who submitted a response to survey item # 62, as follows:
1) There is a need for a pamphlet of information re: research “dos and don’ts” to be used in courses and in informal discussion
2) There is a need for materials to be used in courses for graduate students
3) There is a need for materials to be used in courses for training of PIs—laboratory directors and mentors
4) There is a need for recommendations, standards, and best practices for training for mentors
Office of Research Integrity, DHHS 83 American Institutes for Research
DISCUSSION
MAJOR FINDINGS
The present study has a number of important findings.
Nature of the population of researchers supported by NIH extramural research grants
The present study provides several insights into the nature of the population of individuals supported by NIH research grants. Although some of this information had been available in the NIH Consolidated Grants Database (CGDB) maintained by the NIH Office of Extramural Research. However, other aspects of this have not been available. In the Results section (and Appendices C and D) we have characterized the researchers in terms of age, gender, degree, years as a PI, status as a laboratory director, number of grant applications, number of grants awarded, current level of grant support, sources of funding, field of science, size of laboratory, type of institution, and many other characteristics. This provides a profile of the “typical” NIH-funded grantee: PhD male, average age 52 (ages 50–70), in basic science, with a 56% success rate in terms of research grant applications, mean 16 years as a PI, serving as a “laboratory director” either officially or unofficially, supervising and mentoring, and physically present in the laboratory about two thirds of the time. It is possible that this is the first time that data have been available to describe the nature of the population. Data in appendices C and D make it possible to separately examine the profile for basic scientists, clinical investigators, epidemiological investigators, and for the entire set of respondents.
The finding of a success rate of 56% for grant applications may seem surprisingly high, in that the success rate for NIH research grants RO-1 in 2002 was 24.5% for new grants, 48.9% for continuation grants, and 31.2% overall (varying somewhat by year, by institute, and by subject matter).24 However, the current population of respondents represents only applicants who have previously received a research grant and most have received several grants in the past. Thus, the present sample was addressing the successful, long term recipients of NIH grants—largely individuals serving as Professor, Associate Professor at an institution of higher learning.
24 http://grants1.nih.gov/grants/award/success/rpgbyacttype7002.htm 11/2/03, http://grants1.nih.gov/grants/award/success/icact9802.xls 11/2/03

Office of Research Integrity, DHHS 84 American Institutes for Research
Size of Laboratory
Many individuals have criticized NIH for supporting “big science” at the expense of “little science” over the years. NIH has data regarding the distribution of size of the grants—in terms of dollars. The detailed description of the grants available to Health Science Administrators (HSAs) at NIH would indicate the number of individuals who were expected to work on any given project. The present study may be the first to show the size of the laboratory surrounding a “typical” NIH-supported PI. The data indicate that PIs supervised an average of five researchers, with a fairly narrow inter-quartile range (i.e., 25 percent of respondents supervised 3 or fewer researchers; 75 percent supervised 8 or fewer researchers).25 The way the survey instrument was constructed, there was some ambiguity regarding the size of the laboratory in terms of personnel. Two different survey items addressed this question: Q18 and Q25: the number of researchers supervised, and the number of researchers mentored, respectively. The survey item regarding number of researchers mentored was asked of only 50% of the sample. The results from the two questions were very similar. The ambiguity arose, because it is not clear, a priori, whether the respondents regarded the number of individuals mentored was a subset of the number of researchers supervised, or if it were possible that the total size of the laboratory consisted of (at most) the sum of the number of researchers mentored and number of researchers supervised.26 However, by comparing the total average size of NIH awards in the sample (median = $425,000) to an estimate of the average salary support provided under these grants, then an average laboratory size of 6 individuals appears appropriate, and it does not appear that the level of funding could support ten or 11 individuals.
Our results indicate that a small number of individuals do represent “big science,” to the extent that their self-report of research grant support was in excess of $5,000,000 per annum. There is the possibility that this may represent individuals who were involved in a “Centers” grant, or possibly a department chairman who regards the entire department as their own “laboratory” from the standpoint of responding to the survey questions. The present data allow one to examine the “tails of the distribution” of level of support for the PI. Such analyses will need to be done using the original or “raw” data before the cleaning or censoring as utilized in Exhibit 12, Appendix C, and Appendix D.
25 We did not obtain data on the number of FTEs. 26 No definition was given for the meaning and interpretation of “supervised” and “mentored.”
Office of Research Integrity, DHHS 85 American Institutes for Research
Total Current Level of Funding
The median total funding for each individual PI (from multiple NIH grants and from other sources—federal and nonfederal) has not been clearly available before: it is $425,000 for the basic scientists and $450,000 for all respondents in the survey. The CGDB provides data for the total (lifetime) amount of funding received, but does not have a record of the current level of funding received.
NATURE OF METHODS UTILIZED TO PROMOTE RESEARCH INTEGRITY
The principal purpose of the present study was to gather information regarding methods used in biomedical research laboratories to promote research integrity. The data of Exhibits 13A–21B and Appendices C and D permit a number of valuable interpretations.
Data Collection Methods
In view of the overwhelming prevalence of the use of digital data, especially for clinical and epidemiological investigators but also for basic scientists, it may be important to consider what kinds of data integrity methods are in place or could be in place to assure the authenticity of the data. If data are in unprotected files, they may readily be changed by an investigator or by others having access to the computer system. Thus, as commonly employed, digital files may be easier to change (in the context of data fabrication or falsification) than a permanently bound notebook which has been signed, dated, and witnesses (if recorded in indelible ink). However, electronic laboratory information systems, and document management systems are available which can provide password protection and other measures to prevent unauthorized access to or tampering with data. Appropriate backups can be made so that subsequent alterations of the data can be detected. Most importantly, some laboratory data systems provide an “audit trail,” to indicate whether anyone has viewed or altered the data, identify the person who made changes (with date and time), and provide an opportunity for the user to document why a value may have been changed or discarded, e.g., due to error, outliers, etc. Further, the original data can be recovered. While such systems do exist in certain specialized settings (particularly in some clinical health care settings, clinical laboratories, and some industrial settings), this kind of laboratory document system is the exception rather than the rule, and indeed, may apply only to a tiny fraction of the data collection. (The availability of such systems was not addressed in the present survey but would be important to address in future surveys).
Office of Research Integrity, DHHS 86 American Institutes for Research
A second major finding regarding data collection, is the extremely infrequent use of “witnessing” of the databooks (whether these be looseleaf—which is not really amenable or practical to witnessing unless each page were to be witnessed individually—or in permanently bound notebooks. The few individuals who indicated that the results were witnessed (mean 3.2 ± 0.3%) may be setting a good example, may represent some traditional or classical approaches, or may be involved in research which they believe will lead to possible commercial products and hence the possibility of patenting and potential financial return. It would be interesting in future studies to identify who uses witnessing of the databooks, why do they use it, and finally—how frequently and consistently are data witnessed? Further questions could be asked as to what makes use of witnessing practical or impractical (e.g., an institutional wide or corporate wide policy culture to utilize witnessing of databooks under specified circumstances).
Data Integrity
Researchers generally retain the data when junior researchers leave the laboratory. The databooks are generally sufficient to document the methods employed and analyses employed. However, in this case, as in most cases in the present study—the “glass of water is about two thirds full.” The composite scores for survey items 5–10 and 30–37 were 62.5% and 66.6%, respectively. It appears that documentation regarding methods and analysis is not 100% (survey items 8–10, 30, 36), so there is room for improvement. It appears that the reasons for discarding outliers is documented in 55% of cases (survey item 8). Elimination of outliers is a potential source of misleading results—whether this is done intentionally, or more frequently, unintentionally.
Supervision and Mentoring
The present survey employed a series of measures of supervision and mentoring. These included: amount of time spent mentoring, percentage of time that the laboratory director was physically present in the laboratory, frequency of meetings with subordinate researchers, frequency of visits to the place where the researcher was conducting the research, frequency of review of the databooks, number of times that the PI checks that the level of resources consumed were consistent with the work being performed, frequency and duration of laboratory meetings, and frequency of opportunities for each researcher to present his or her work before the laboratory meeting. As in the case for virtually all measures in the present study, there was a wide degree of variability, which is observable in terms of the entire frequency distribution (as shown for 24 of the responses in Exhibit 12 and in Appendices C and D) and in terms of the 25th and 75th percentile for an additional 20 variables. The “central tendency” has been characterized.

Office of Research Integrity, DHHS 87 American Institutes for Research
In general, the results show what appears to be a very high level of supervision and mentoring (Exhibit 40). These results are very encouraging to those who are responsible for monitoring of scientific integrity. Of course, scientific fraud and misconduct are indeed a fairly rare occurrence, and we speculate that this may represent a tiny fraction of the population of scientists. Accordingly, a very high level of (self-reported) mentoring and supervision by say 99 or 99.9% of scientists does not negate the possibility that lack of supervision or mentoring might have been one of the contributing factors in cases of scientific misconduct.
Publication Practices
The series of questions regarding publication practices was revealing. Once again, the “glass of water is three-quarters full”—with the majority of respondents indicating that they employ practices that would generally be regarded as promoting research integrity a substantial portion of the time. Once again, there appears to be room for improvement. Of course, it is not obligatory that each author consent to be an author in writing, file a conflict of interest statement, and be able to understand and defend the entire study. Occasionally, the inclusion of a person as an author who has contributed primarily or exclusively in terms of performing routine or technical functions may be justified, and may be a matter of judgment. The review of an article by a senior scientist who is not a coauthor is a desirable characteristic, but there is no reason to believe that this should or must be done in all cases, and it is done in an appreciable number of cases.
Publication Guidelines
Several of the survey items addressed the question of guidelines regarding publication. There were several striking findings. Firstly, only a small percentage (1.8–4.5%) indicated that they utilized written guidelines. Further, an even smaller percentage (1.3–3.8%) indicated that written guidelines were distributed to all members of the laboratory. In the absence of a written guideline, it is difficult or even impossible to know just what kind of guideline was being used, who had developed it, for whom it was intended, how frequently it was distributed or updated, and whether the guidelines would be regarded as reasonable and applicable. Most respondents indicated that the guidelines were “verbal” (more correctly “oral”), and distributed to some but not all members of the laboratory. Further, the frequency of use of guidelines varied systematically regarding the nature of the guideline. Guidelines regarding authorship, reproducibility, and not fragmenting papers were relatively common. Guidelines regarding sharing of methods, data, reagents, etc. and for dealing with the relatively uncommon situation of need for a correction or retraction of a published study were relatively rarely utilized. This series of
Office of Research Integrity, DHHS 88 American Institutes for Research
questions highlighted an area where there is a high probability that the scientific community as a whole could make improvements in current practices. Once can imagine that departments, institutions, professional organizations, national bodies (e.g., NAS, IOM) and funding agencies (e.g., NIH, NSF) could develop model guidelines and circulate them widely. The individual PI can retain discretion as to how she will implement it in her laboratory. There may be “good guidelines” and “poor guidelines.” Only by putting them into written form and subjecting them to review and scrutiny, can one expect that such guidelines would evolve into a commonly shared and held set of recommendations and precepts.
The series of questions on the survey instrument about “guidelines” are one in which there could have been some degree of exaggeration by some of the respondents. Simply by reading the question, one may make a logical inference that “I guess I should have guidelines in regard to this matter” whether or not any such guidelines have been consciously addressed previously. Then, the respondent might way “well, yes, we discussed that at one of our laboratory meetings or at a retreat”—at some unspecified time in the past. The then respondent could, in good conscience, indicate that verbal (oral) guidelines were in place for “some of the members” of his/her laboratory. Accordingly, a follow-up study might be well advised, to explore further the nature of the guidelines and several (or all) other aspects of the present study.
Research Integrity Training:
Training of individuals as they enter the scientific workforce should, in principle, be one of the most important methods to promote research integrity. The survey respondents indicated that a high percentage (75%) of individuals under their supervision receive training regarding research integrity (Exhibit 12). Duration of training has a mean of 11.5 hours and a median of 5.0 hours, with a distribution skewed toward higher values. We did not inquire regarding the nature of the subject matter that was involved in the training, the curriculum, the goals, etc. We do know that the respondents indicated that only a small proportion of the recipients of the training (25%) were subject to an “assessment,” i.e., a test or examination.
Interestingly, both clinical and epidemiological investigators indicated that they employ training and employ an assessment with a higher frequency than did the basic scientists. However, the subordinates of the clinical and epidemiological investigators received training for a shorter period of time (median = 4.0) than did those of the basic scientists (median = 5.0). This result may have the following explanation: Both clinical- and epidemiological-investigators commonly have to obtain approval from an Institutional Review Board (IRB) before performing their studies. Approval from the IRB
Office of Research Integrity, DHHS 89 American Institutes for Research
will usually imply that the PI (and other major researchers) must have completed a course on protection of human subjects. For many years, the NIH has provided a web site where one can obtain training regarding protection of human subjects. This instructional program commonly requires just 1–3 hours to complete, and has an “assessment” built in. The assessment requires the user to answer a few questions based on reading material that is provided by the web site. We speculate that it is quite possible that the differences in the responses of the basic scientists and the clinical- and epidemiological-investigators may have been due to the fact that the latter two groups were referring to this NIH web site as the basis for training. That would explain the high frequency of use, the higher frequency of use of an assessment, and the short duration. If this interpretation were correct, that would imply that clinical- and epidemiological-investigators are not receiving much, if any, additional training in regard to the promotion of research integrity. These finding suggest the need for further investigation in regard to the nature of the training.
Based on the very extensive set of comments received from the survey respondents to the “free text” question provided at the end of the survey (Q62), there is strong evidence that the members of the research community would welcome having materials provided to them from a suitable source, whether that source be NIH, other granting agencies, professional societies, or institutions. There was a call for information available in print and on the internet. One can imagine that a basic curriculum could be developed, made available in a pamphlet (and/or corresponding web site) and distributed to all members of the laboratory. Such training materials could include a curriculum or various options for curricula, guidelines, and might include a series of “case examples” for discussion between mentor and mentee, or among members of the laboratory.
STATISTICAL METHODOLOGY FOR ANALYSIS
Composite Variables
We have experimented with the creation of “composite variables” in an attempt to combine information from several survey items related to the same general theme, e.g., data control and integrity measures, publication practices, publication guidelines, to provide a more comprehensive description of our data. In constructing these composites, we were attempting to provide a “score” in each of three “dimensions” of the multidimensional concept of “promotion of research integrity.” There is a certain amount of redundancy among variables, in that they tend to be positively correlated. By the “law of averages,” the composite variable will generally have smaller variation and hence

Office of Research Integrity, DHHS 90 American Institutes for Research
better precision than the individual components, and thus will have an improved performance as a measure. Further, it reduces the number of items that need to be considered.
In addition to the three composite variables used, it would be interesting to study additional composites, such as “supervision and mentoring” (based on responses to survey items 18–27), training (e.g., based on a composite of the number receiving training and the frequency of an assessment, items 45, 47, 48), and use of guidelines. These variable could be created using factor analysis or other data-reduction approach to identify related variables and create a small number of new variables to summarize the data.
PROBLEMS ENCOUNTERED AND LIMITATIONS OF THE STUDY
The conduct of this study encountered a few problems.
Currency of the Database defining the Underlying Population
The database provided to us through the courtesy of the extramural program of NIH was one year old at the time that we received it, due to the lengthy and laborious process of “data cleaning” to try to remove inaccuracies and inconsistencies. With the progressive age of the database, the number of non-functional email addresses and the percentage of members of the database who are no longer receiving grants from NIH will both increase. That resulted in a reduced ability to contact the members of the random sample from the database, a lower number of respondents, a smaller effective sample size, and very slightly larger statistical confidence intervals for the results—a loss of sensitivity of the study. However, we still received a very large number of responses (2,910) so that the statistical sampling error (e.g., on a mean or on a proportion) was still very small. The somewhat ‘aged’ database also meant that we would be unable to detect any significant trends in terms of the grant recipients for the year 2002.
Use of a Random Sample
We elected to use a random sample, rather than study the entire population. In principle, we could send an email survey to every member of the population. However, that would increase the burden on the (generally very busy) scientists, and would be inconsistent with the “Paperwork Reduction Act” as enforced by the Office of Management and Budget. It is unlikely that increasing the size of the survey would have substantially altered the findings of the present study, based on power calculations developed prior to the conduct of the study. Indeed, a smaller sample size would have
Office of Research Integrity, DHHS 91 American Institutes for Research
been sufficient for many survey items to derive summary statistics with acceptable levels of precision. The size as selected appears to be a reasonable compromise, in permitting us to examine the characteristics of the clinical and epidemiological investigators who are present to a much smaller extent that the basic scientists.
Response Rate
The response rate of 57% was less than we had originally hoped. The ORI set initial expectations of a response rate of 70% to 80%. However, it is our considered opinion that the response rate was still very impressive and satisfactory, for the following reasons:
The response rate is reduced, relative to the maximum achievable, if one uses only a single modality, e.g., a web based survey in the present case. In principle, and nearly always in practice, one can increase the response rate by use of telephone follow-up. Likewise, one can improve response rate (at the risk of some bias) by offering an emolument to the members of the sample—e.g., as almost uniformly done in surveys conducted by commercial concerns. Third, the target population is extremely busy, with enormous time pressures. Many members of the scientific community work 50, 60, 70, 80 or more hours per week. They live in a world of multiple deadlines and demands on their time (e.g., university committees, clinical care), and in a very competitive world. Accordingly, the time required to fill out a questionnaire—even if only 15 minutes, is a distraction that many would postpone or indefinitely put off. Finally, the entire subject of “research integrity” and “responsible conduct of research” and its flipside, “scientific misconduct,” has a taboo or negative connotation. Some individual members of the sample may be concerned about a survey commissioned by the government, the principal source of funding for their research and laboratory, and hence the principal source of their own income. Some may even be concerned that this survey might be investigating them, and that despite reassurances about protection of confidentiality, they may be concerned that their responses might cast a negative shadow over themselves and somehow result in risk of loss of grant support. This is especially the case, when the DHHS is in the process of implementing new rules and regulations mandating the use of teaching of principles of responsible conduct of research for postdoctoral fellows and scientists in training—which was in fact underway at exactly the same time when this survey was conducted (August 2002–October 2002).
Unequal Sample Size for Various Subgroups
The respondents indicated that their principal field of scientific endeavor was in the basic biomedical sciences. This was advantageous for achieving our goal, of

Office of Research Integrity, DHHS 92 American Institutes for Research
characterizing basic scientists. However, this was disadvantageous when we wish to compare basic scientists with the clinical and epidemiological investigators. Also, the present survey instrument did not collect information, as to the extent to which individual researchers may have been engaged in research of multiple types or multiple levels. For example, in today’s multidisciplinary research world, where we often see collaborations extending from the genome to population studies, a given researcher might be doing 40% clinical work, 20% cell biology 20% genomic or genetic research and 20% epidemiology (e.g., in a study of BrCa1 and BrCa2 in patients with breast cancer and their families to name just one example). Accordingly, the trichotomy is a potentially inadequate and insufficient way to characterize the field or interests and professional affiliation of a given researcher. The survey item we used appears to be suitable for a single question. However, it would be desirable, in future studies, to include a second question, to ask the researcher, what percentage of their effort was directed to the series of research fields. In this manner, we could potentially obtain a much better characterization of the individual, and possibly develop indices of the degree to which the individual is ‘multidisciplinary.’ Thus, we recognize that the classification into three fields is an oversimplification, and it may obscure some relationships.
Representativeness of the Respondents
A fundamental question for any survey, is whether the respondents are representative of the underlying sample. We compared a number of characteristics of the respondents with those of the non-respodents, using information available to us from the NIH database (Exhibit 2). The respondents were very similar to the non-respondents. However, with the exception of 2 of 8 criteria, the differences observed were statistically significant at the P < 0.01 level. Thus, individuals who were younger by 1.5 years, received more grants (5.5 vs. 4.5 over 5 years), and received more dollars in grant support (mean award $20,000 higher), or who had served as a PI for a longer period of time, were more likely than their counterparts to respond to the survey. This should not be surprising: those individuals might have been more “personally invested” in the NIH, and thereby more willing to participate in the survey. The differences in the variables were small in absolute terms, and based on correlation and regression analysis, the differences observed should not substantially affect the responses to the questions regarding methods to promote research integrity.
Ideally, one would have liked to have been able to use another means to verify the representiveness of the respondents. One method to do so, would have been to conduct a telephone interview with a random sub-sample of the non-respondents, in order to determine whether their answers to questions were similar to those of the respondents.
Office of Research Integrity, DHHS 93 American Institutes for Research
Unfortunately, it was not possible to conduct such a telephone survey due to limitations of resources.
Limitations of Self-Report
The major limitation of the study, is that we are entirely dependent on the respondents “self-report.” For practical purposes, we have no independent method to corroborate their responses. For example, if they say that 75% of the researchers under their supervision receive training in regard to research integrity, we have no way to verify the result. Ideally one might use multiple methodologies to try to obtain verification, e.g., use of focus groups, conducting a survey of the supervisors and the subordinates of the PI (i.e., other members of the laboratory and department), or, ultimately, by an ethnographic study. However, such studies would be prohibitively expensive. Further, at the present time we have no reason to believe that the results are substantially biased. We do consider that there is a tendency for people to respond to questionnaires and surveys with a “socially acceptable” answer. Further, some respondents may have had an “agenda.” If a respondent believes that the level of regulation of the scientific enterprise is excessive, with excessive rules and regulations, or if they fear that regulations might increase excessively, then such an individual might provide responses which would tend to minimize the apparent risks of scientific misconduct, or exaggerate their own current and past activities to promote research integrity.
Limitations of the Survey Instrument
The survey instrument was not perfect and could be improved. It would be desirable to use more randomization of the sequential order of the questions so as to minimize possible ‘order effects.’ Several of the questions were ambiguous. For example, what is meant by “guidelines,” “mentoring,” “training” or “assessment”? It is unlikely that all 2,910 respondents had the same mental image for these words. To minimize the ‘mental burden’ on the respondents, we have categorized 24 of the first 61 questions in terms of a categorized variable (0%, 1–33% etc.). We might have obtained more precise answers if we asked the members of the sample to indicate an exact figure in a text box. However, that would require more time for thinking about the answer and for typing—and would be expected to reduce both the number of questions that could be included in the survey, and the overall response rate. In order to include more questions, it might be desirable to use more than two sub-sets of the questions (the ‘A’ and ‘B’ versions utilized in the present study). However, use of subsets, makes it impossible to correlate the responses for the questions that were provided to the two groups. Other, more complex designs, could be used in the future to ensure that all pairs or clusters of questions are

Office of Research Integrity, DHHS 94 American Institutes for Research
asked of a sufficient number of people that we could examine the correlation of responses.
Ideally, we would have liked to have been able to ask more questions, to provide a “branching logic” so that we could ask “follow-up questions” to pursue certain responses, and would have liked to be able to ask for the same information in different ways, so as to permit obtaining an estimate of reliability. As it was, we used a minimal degree of redundancy of survey items.
Some of the areas of ambiguity for the present survey instrument include the following:
1) impossibility of determining the relationship between supervised researchers and number of researchers mentored which will affect the estimate of the total number of individuals within the laboratory;
2) uncertainty whether the respondents regarded time spent mentoring as part of the time that they spent on their own research or not, (which will affect the estimate for the total number of hours worked per week). In the future, these two questions might be asked in addition to the other items.
Limitations of the Analysis
We have performed an extensive series of analyses. However, additional analyses are possible and would be desirable. First, for the qualitative responses (item 62) it would be desirable to conduct a formal “content analysis,” e.g., using analytical tools such as “Qualrus” for the analysis of qualitative data (http://www.qualrus.com/Qualrus.shtml). Secondly, it would be desirable to correlate the results of such a content analysis with the 61 quantitative variables obtained from the survey.
Analysis of Subgroups
We first analyzed the entire set of results from all respondents (omitting those who responded to less than 50% of the survey items but including those who designated themselves as basic scientists, clinical- and epidemiological investigators. Those results are provided in Appendix D and in Exhibits 4–8 and 14–15, 17A, 20–21. Then, we characterized the results from each of the groups separately (Exhibits 11–13, 16 17B, 18–19, and Appendix C) using a subset of the data in Appendix D. It would be interesting to repeat some of the analyses performed for the entire group on the individual subsets. Further, ORI has expressed an interest in study of the following subsets:
• Basic scientists who are laboratory directors (officially)
Office of Research Integrity, DHHS 95 American Institutes for Research
• Basic scientists who are laboratory directors (unofficially)
• Basic scientists who are not laboratory directors
Each of these three subgroups could be analyzed in conjunction with any of the other (approximately 61) variables. Unfortunately, it was not possible for us to study all possible potentially interesting combinations and permutations of variables.
STATISTICAL METHODOLOGY
Measures of central tendency
We have found it useful to utilize both means and medians. We use means for the categorized data, where the calculation of a median requires making an assumption regarding the nature of the distribution. We calculate both whenever we have continuous variables (numerical values entered into text-boxes). The medians are designated as “P50” to denote the 50th percentile in Appendices C and D. Many of the distributions are skewed, with wide disparity between means and medians, e.g., number of meetings per year, level of grant support, number of supervised researchers. We have found it useful to evaluate both means and medians when comparing the characteristics of the various subgroups of researchers.
Analyses of variability
One of the major finds of the present study (though not an unexpected one) is the wide degree of variability among different members of the scientific community. We have evaluated the variability in three ways: a) inspection of the frequency distribution, e.g., for the 24 variables which have a categorized response, as presented in Exhibit 4 and in Appendices C and D; b) presentation of data which makes it possible to calculate the standard deviation for every one of the quantitative variables, i.e., the standard deviation is calculated as the Sem * (square root of number of observations), and to calculate the “inter-quartile range”: the difference between the 75th percentile (designed in the Appendices as P75) and the 25th percentile (P25). Thus, the data as presented make it possible for the reader to observe the degree of variability and obtain quantitative estimates of that variability. (The interquartile range and median could also be calculated for the 24 categorical variables, assuming a uniform distribution within each category.) In evaluating the data, it is of interest to consider both the central tendency and the variability, especially when we are thinking in terms of possible approaches to improve the “standard of practice” so as to promote research integrity.

Office of Research Integrity, DHHS 96 American Institutes for Research
When data can be expressed as a proportion for a dichotomous variable, we can calculate the standard error of the proportion, and have done so for the percentage of respondents who indicated that they were either officially or unofficially serving as the ‘Laboratory Director.’
Methodology
This survey included 24 items where the respondent simply needed to check a “radio-button” corresponding to 0%, 1–33%, 34–66%, 67–99%, or 100%. This may be regarded as a modified “Likert” scale with three intervals (in thirds), but with two additional cases corresponding to “always” (100%) and “never” (0%). Since biomedical scientists are for the most part very quantitatively oriented, we believe that this kind of scale is more effective than use of an ordinal qualitative scale such as “Never” “Occasionally” “Often” “Usually” and “Always.” Further, it provides us with a numerical value (the midpoint of the interval) that we can use to calculate a mean and other descriptive statistics. We believe that by limiting the length of the questionnaire to something that could be completed within 15 minutes by most workers contributed to the high response rate obtained. Based on prior experience, we know that if we could have made phone calls to non-respondents we would have been able to increase the response rate further. However, such a procedure is very expensive and was not feasible within the limits of the available budget. The ability of the study participant to log-on, start the survey, complete it partially, logoff and then resume the questionnaire at a later time was very likely another factor that helped to increase the response rate.
GENERALIZABILITY TO ALL NIH FUNDED RESEARCHERS.
In view of the large sample size, the very respectable if not ideal response rate, and the consistency of results from multiple subgroups within the analysis, we believe that the present results are indeed generalizable to the population of biomedical scientists who are supported by NIH research grants. The number of respondents represents more than 10% of the entire population, and close to 15% of the number of “eligibles” in the entire population (Exhibit 1). The characteristics of the respondents and non-respondents were very similar (Exhibit 2), though they could be distinguished as statistically significantly different. Perhaps the only way to confirm this would be to conduct another study of the same population (though shifted in time). Also, the fact that the properties of the respondents who received the “A” and “B” versions of the survey for those 33 survey items that they had in common, provides credence to the notion that the results are reproducible, consistent and hence generalizable to the underlying population.

Office of Research Integrity, DHHS 97 American Institutes for Research
ADDITIONAL ANALYTICAL APPROACHES TO THE PRESENT DATA:
We believe it would be valuable to conduct additional multiple regression analyses to examine the relationship among the dependent variables (describing behaviors and practices related to scientific integrity) and the independent variables (characteristics of the PI, his laboratory and institution). These multiple regressions provide a convenient and efficient manner to perform tests of statistical significance, especially in the present case when we had few if any “a priori” hypotheses to test and where the data are basically descriptive. It will be interesting to try to analyze the qualitative responses further, and to correlate the qualitative responses with various responses from the quantitative data. Some may wish to utilize a more extensive graphical analysis, e.g., showing the frequency distributions (or preferably, the cumulative frequency distributions or cumulative distribution functions, cdf’s) for essentially all of the variables, superimposing the cdf’s for various subgroups (e.g., by gender, age, degree, years as PI, scientific field, wealth of the laboratory, wealth of the institution). Further, it will be interesting to compare various subgroups, e.g., subgroups of the basic scientists, e.g., “genetic/genomic,” biochemical, cell biology, organ level, non-human organisms. In view of the larger number of basic scientists, we should have a large enough number of observations to permit the comparisons among these subgroups.
It will be interesting and important, to repeat this study periodically in the future, so as to evaluate trends in the adoption and use of the various methods to promote research integrity, and to study differences among various sub-sets of biomedical researchers. In particular, with the widespread adoption of new regulations regarding the instruction in research integrity methods which went into effect at about the same time that this survey was conducted, it would be desirable to study the practices with a very similar survey at two-year intervals. It will be interesting to compare results, both on an independent sample, and on a small number of individuals who participated in this initial survey. In particular, that would allow us to ask those who have participated twice, whether the exposure to the survey was a factor in causing them to change their level of awareness, their philosophy, and their practices. (Quite a few of the qualitative responses suggested that respondents to the present survey felt that their views had been changed by exposure to this survey.)
Office of Research Integrity, DHHS 98 American Institutes for Research
CONCLUSIONS
The present study provides the first-ever “snapshot” of the current state of the art in terms of the frequency of use and popularity of several measures which are generally regarded as being of merit in terms of promoting the responsible conduct of research and research integrity.
The present study provides a basis for development of interventions to promote research integrity. There appears to be the need for development and dissemination of written guidelines for use by researchers, e.g., a pamphlet that can be distributed to all members of a laboratory on a regular basis and to all newcomers and trainees. Further, there is a need for development of a set of instructions and an educational program to accompany these guidelines and promote their use and to provide basic education related to scientific integrity. There is need for development of an “outcome assessment” to evaluate the effectiveness of training in regard to research integrity, and guidelines to assist others in developing their own outcome assessments. It would be desirable to increase the percentage of researchers who receive training (currently 75%), and evaluate whether a median duration of training of 5 hours is sufficient.
In view of the fact that nearly half of data are stored in digital files, and that only about a third of the data collected are in permanently bound notebooks, there is likely the need for a concerted effort to encourage the use of “laboratory information systems” or other “document management systems” that would provide an audit trail, making it possible to determine who entered data electronically, when (date and time), and who had access to it, and who modified it, when (date and time), and what comments or explanations (if any) were provided to justify the change. This would have the effect, of providing the safeguards for digital data that would be comparable to or better than the protections provided by permanently bound notebooks. These approaches should make it easier to detect fabrication or falsification of data, and thus might also serve as a deterrent to such practices.
Most NIH-funded biomedical researchers indicated that they employ practices that help to promote research integrity most of the time. However, very few utilize these practices all of the time, so there is significant room for improvement.