Embed Size (px)
Citation preview
April 2016
Statistics & Economic Research Branch
Survey of PAYE
Taxpayers 2015
Survey of PAYE Taxpayers 2015
The authors, Seán Kennedy ([email protected]), Gerry McGuinness
([email protected]) and Martina Shirran ([email protected]), are economists in the
Statistics and Economic Research Branch of the Office of the Revenue Commissioners and
are members of the Irish Government Economic and Evaluation Service (“IGEES”). Any
opinions expressed in this paper are the views of the authors and do not necessarily reflect
the views of the Office of the Revenue Commissioners. The authors alone are responsible
for the conclusions.
April 2016
1 Statistics & Economic Research Branch
Table of Contents
Table of Contents ................................................................................................ 1
List of Tables ...................................................................................................... 2
List of Figures ..................................................................................................... 2
Executive Summary ............................................................................................. 3
1 Introduction .................................................................................................. 4
1.1 Objectives ............................................................................................... 4
1.2 Summary of Methodology .......................................................................... 4
1.3 Response Rate ......................................................................................... 7
1.4 Data Management and Processing .............................................................. 8
1.5 Context – Employment and Demographics in Ireland ..................................... 8
1.6 Previous Customer Surveys in Ireland ......................................................... 9
1.7 International Surveys ............................................................................. 10
2 Customer Satisfaction .................................................................................. 11
2.1 Introduction .......................................................................................... 11
2.2 Satisfaction Levels by Taxpayer Type ........................................................ 12
2.3 Perceptions towards Tax Administration ..................................................... 15
2.4 Other Information Sources ...................................................................... 16
3 Customer Contacts and Preferred Channels ..................................................... 17
3.1 Introduction .......................................................................................... 17
3.2 Reasons for Contact ................................................................................ 18
3.3 Contact Demographics ............................................................................ 19
3.4 Channels of Contact and Channel Satisfaction ............................................. 20
3.5 Preferred Methods of Contact ................................................................... 21
3.6 Local Property Tax .................................................................................. 22
3.7 Reasons for Dissatisfaction ...................................................................... 23
4 Revenue’s Online Services ............................................................................ 24
4.1 Introduction .......................................................................................... 24
4.2 Revenue Website ................................................................................... 24
4.3 PAYE Information ................................................................................... 25
4.4 PAYE Anytime ........................................................................................ 26
4.5 Online Access and Use ............................................................................ 28
4.6 Service Improvements ............................................................................ 30
5 Using Personalisation to Improve Response Rates ............................................ 32
5.1 Introduction .......................................................................................... 32
5.2 Results ................................................................................................. 32
5.3 Discussion ............................................................................................. 33
6 Cluster Analysis ........................................................................................... 34
6.1 Introduction .......................................................................................... 34
6.2 Methodology .......................................................................................... 34
7 Conclusion .................................................................................................. 36
7.1 Summary and Discussion ........................................................................ 36
7.2 Acknowledgements ................................................................................. 37
Appendix ......................................................................................................... 38
Cover Letters ................................................................................................. 38
Survey Form (4 Pages) .................................................................................... 41
April 2016
2 Statistics & Economic Research Branch
List of Tables
Table 1 Perceptions of Tax Administration................................................................ 16 Table 2 Preferred Methods of Contact with Revenue .................................................. 22 Table 3 Selected Text Comments on Reasons for Dissatisfaction ................................. 23 Table 4 Selected Text Comments on Suggested Service Improvements ........................ 31 Table 5 Summary of Cluster Analysis ...................................................................... 35
List of Figures
Figure 1 Summary of Methodology ........................................................................... 5 Figure 2 Comparison of Districts – PAYE Sample and Sampling Frame ........................... 6 Figure 3 Number of Responses, by Post and Online, 3 Sep – 29 Oct .............................. 7 Figure 4 Demographics ........................................................................................... 9 Figure 5 Satisfaction with Revenue Customer Service, 2007, 2010 & 2015 ................... 11 Figure 6 Satisfaction Levels, by Demographics ......................................................... 13 Figure 7 Satisfaction Levels, by Age ........................................................................ 14 Figure 8 Easy to Claim Tax Credits & Entitlements, by Age ......................................... 14 Figure 9 Revenue Explains Tax Credits Clearly, 2007 & 2015 ...................................... 15 Figure 10 Sources for Tax Queries other than Revenue.ie .......................................... 16 Figure 11 Share Contacting Revenue ...................................................................... 17 Figure 12 Region of Respondents Contacting Revenue ............................................... 18 Figure 13 Reasons for Contacting Revenue .............................................................. 18 Figure 14 Contacting Revenue, by Demographics ...................................................... 19 Figure 15 Methods of Contact Used with Revenue in the Past 12 Months ...................... 20 Figure 16 Satisfaction with Method of Contact .......................................................... 21 Figure 17 Satisfaction with LPT Contact by Telephone................................................ 23 Figure 18 Purpose of Accessing Revenue Website ..................................................... 24 Figure 19 PAYE information is Easy to Find and Understand ........................................ 25 Figure 20 Reasons for Dissatisfaction with PAYE Information ...................................... 26 Figure 21 Reasons for Using PAYE Anytime .............................................................. 27 Figure 22 Satisfaction with PAYE Anytime ................................................................ 28 Figure 23 Reasons for Not Using PAYE Anytime ........................................................ 28 Figure 24 Internet Access and Use .......................................................................... 29 Figure 25 Social Media and Online Resources ........................................................... 30 Figure 26 Suggestions for Service Improvement ....................................................... 31 Figure 27 Response Rates, Standard and Personalised ............................................... 33
April 2016
3 Statistics & Economic Research Branch
Executive Summary
Revenue’s PAYE Survey 2015 was conducted between September and October 2015. Over
5,000 survey forms were issued to a random sample of PAYE taxpayers, drawn from a
population of 1.5 million. The overall response rate was 27%.
The survey is the third in a series of PAYE surveys since 2007, which means that some
results can be compared over time. The objective of the survey is to gather information on
a number of areas including (i) customer contact with Revenue, (ii) the use and
knowledge of Revenue’s online resources, (iii) preferred methods of contact with Revenue
and (iv) overall customer satisfaction and attitudes towards tax compliance.
The main highlights from the survey are as follows:
61% of respondents contacted Revenue in the 12 months prior to the survey. The
proportion contacting Revenue is down from 72% in 2010 but up from 46% in 2007.
The most common reasons cited for contacting Revenue in the past 12 months are to
claim tax credits and reliefs (38%), claim a tax refund (23%) and request a balancing
statement (22%).
68% agree or strongly agree that they are satisfied with the service they receive from
Revenue, while 23% somewhat agree that they are satisfied, indicating an overall
satisfaction rate of 91%. This level of satisfaction equals the last PAYE survey in 2010.
53% of respondents agree or strongly agree that Revenue explains tax credits and
entitlements in a way they can understand compared to 41% for the same question in
the 2007 survey. This suggests a significant improvement in communication with PAYE
taxpayers over the period.
Of those who responded, 85% strongly agree, agree or somewhat agree that Revenue
carries out the administration of the tax system fairly.
The most frequent contact is telephone, followed by calling in person and email.
The highest levels of satisfaction are recorded with email or MyEnquiries, 93% are
either very satisfied, satisfied or somewhat satisfied. This is closely followed by letter
(91%), calling in person to a Revenue public office (88%) and telephone (86%).
The online channel is the preferred method of contact with Revenue for all purposes,
typically followed by phone and then letter.
94% of PAYE Anytime users state they are satisfied with the service.
These survey results are assisting Revenue in further designing and implementing a
customer service programme that is both efficient to administer and that makes it as easy
as possible for taxpayers to comply with their obligations.
April 2016
4 Statistics & Economic Research Branch
1 Introduction
This report presents the results from the survey of PAYE taxpayers conducted by
Revenue’s Statistics & Economic Research Branch between September and October 2015.
A total of 5,000 letters were issued to taxpayers. The response rate was 27%. This is the
third such survey, following those conducted in 2007 and 2010, which means that some
results can be compared over time.1
1.1 Objectives
Understanding the PAYE taxpayer population, the largest component of Revenue’s
customer base, is important for the tax administration to fairly and efficiently collect taxes
and duties. A key objective of the survey is to quantify the views of the PAYE taxpayer
population on a number of aspects of Revenue’s customer service. These include
satisfaction and awareness of Revenue services, including online resources and PAYE
Anytime, in addition to attitudes towards tax compliance.
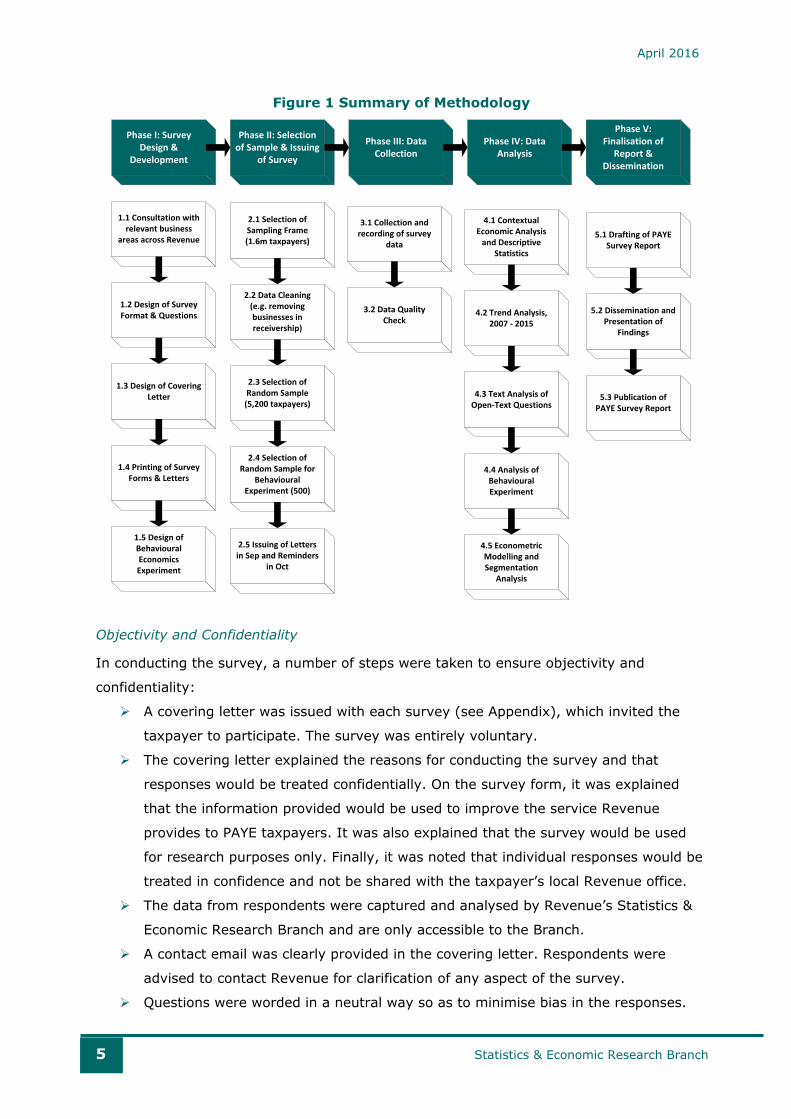
1.2 Summary of Methodology
A detailed methodological approach is undertaken to ensure rigorous analysis and
representative results. The methodology is outlined in this section and summarised in
Figure 1.
Sample Selection
Before a random sample can be selected, the sampling frame, the total population of PAYE
taxpayers from which the sample is drawn, must be identified. A number of objectives
were important in drawing the sample:
To ensure that the sample is fully representative of the PAYE population;
Without comprising objective one, sample taxpayers who are well placed, and likely, to
respond to the survey questions; and
Maintain, to the extent possible, consistency with the previous PAYE surveys.
Based on a comprehensive filtering exercise, a final sampling frame of 1,566,475 was
identified (from administrative tax records) from which to select a random sample of
5,200 taxpayers.
1 Results of Revenue customer services are published at: http://www.revenue.ie/en/about/publications/survey-
reports.html.
April 2016
5 Statistics & Economic Research Branch
Figure 1 Summary of Methodology
Objectivity and Confidentiality
In conducting the survey, a number of steps were taken to ensure objectivity and
confidentiality:
A covering letter was issued with each survey (see Appendix), which invited the
taxpayer to participate. The survey was entirely voluntary.
The covering letter explained the reasons for conducting the survey and that
responses would be treated confidentially. On the survey form, it was explained
that the information provided would be used to improve the service Revenue
provides to PAYE taxpayers. It was also explained that the survey would be used
for research purposes only. Finally, it was noted that individual responses would be
treated in confidence and not be shared with the taxpayer’s local Revenue office.
The data from respondents were captured and analysed by Revenue’s Statistics &
Economic Research Branch and are only accessible to the Branch.
A contact email was clearly provided in the covering letter. Respondents were
advised to contact Revenue for clarification of any aspect of the survey.
Questions were worded in a neutral way so as to minimise bias in the responses.
Phase I: Survey Design &
Development
Phase II: Selection of Sample & Issuing
of Survey
Phase III: Data Collection
Phase IV: Data Analysis
Phase V: Finalisation of
Report & Dissemination
1.1 Consultation with relevant business
areas across Revenue
1.2 Design of Survey Format & Questions
1.3 Design of Covering Letter
1.4 Printing of Survey Forms & Letters
1.5 Design of Behavioural Economics Experiment
2.1 Selection of Sampling Frame (1.6m taxpayers)
2.2 Data Cleaning (e.g. removing businesses in receivership)
2.3 Selection of Random Sample (5,200 taxpayers)
2.4 Selection of Random Sample for
Behavioural Experiment (500)
2.5 Issuing of Letters in Sep and Reminders
in Oct
3.1 Collection and recording of survey
data
3.2 Data Quality Check
4.1 Contextual Economic Analysis
and Descriptive Statistics
4.2 Trend Analysis, 2007 - 2015
4.3 Text Analysis of Open-Text Questions
4.4 Analysis of Behavioural Experiment
4.5 Econometric Modelling and Segmentation
Analysis
5.1 Drafting of PAYE Survey Report
5.2 Dissemination and Presentation of
Findings
5.3 Publication of PAYE Survey Report
April 2016
6 Statistics & Economic Research Branch
Comment boxes were offered throughout the survey form.
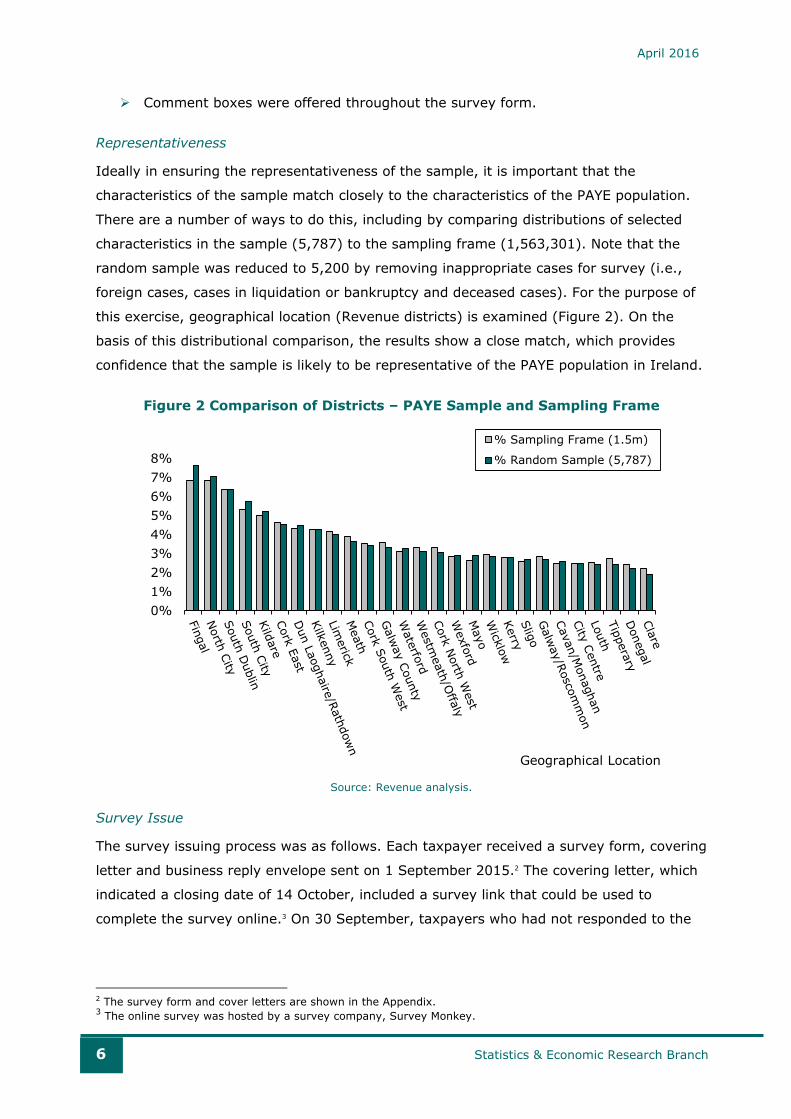
Representativeness
Ideally in ensuring the representativeness of the sample, it is important that the
characteristics of the sample match closely to the characteristics of the PAYE population.
There are a number of ways to do this, including by comparing distributions of selected
characteristics in the sample (5,787) to the sampling frame (1,563,301). Note that the
random sample was reduced to 5,200 by removing inappropriate cases for survey (i.e.,
foreign cases, cases in liquidation or bankruptcy and deceased cases). For the purpose of
this exercise, geographical location (Revenue districts) is examined (Figure 2). On the
basis of this distributional comparison, the results show a close match, which provides
confidence that the sample is likely to be representative of the PAYE population in Ireland.
Figure 2 Comparison of Districts – PAYE Sample and Sampling Frame
Source: Revenue analysis.
Survey Issue
The survey issuing process was as follows. Each taxpayer received a survey form, covering
letter and business reply envelope sent on 1 September 2015.2 The covering letter, which
indicated a closing date of 14 October, included a survey link that could be used to
complete the survey online.3 On 30 September, taxpayers who had not responded to the
2 The survey form and cover letters are shown in the Appendix. 3 The online survey was hosted by a survey company, Survey Monkey.
0%
1%
2%
3%
4%
5%
6%
7%
8%
% Sampling Frame (1.5m)
% Random Sample (5,787)
Response Rate
Geographical Location
April 2016
7 Statistics & Economic Research Branch
survey received a reminder letter.4 As part of the survey letter issue, a behavioural science
randomised control trial was conducted, which is outlined in Section 5.
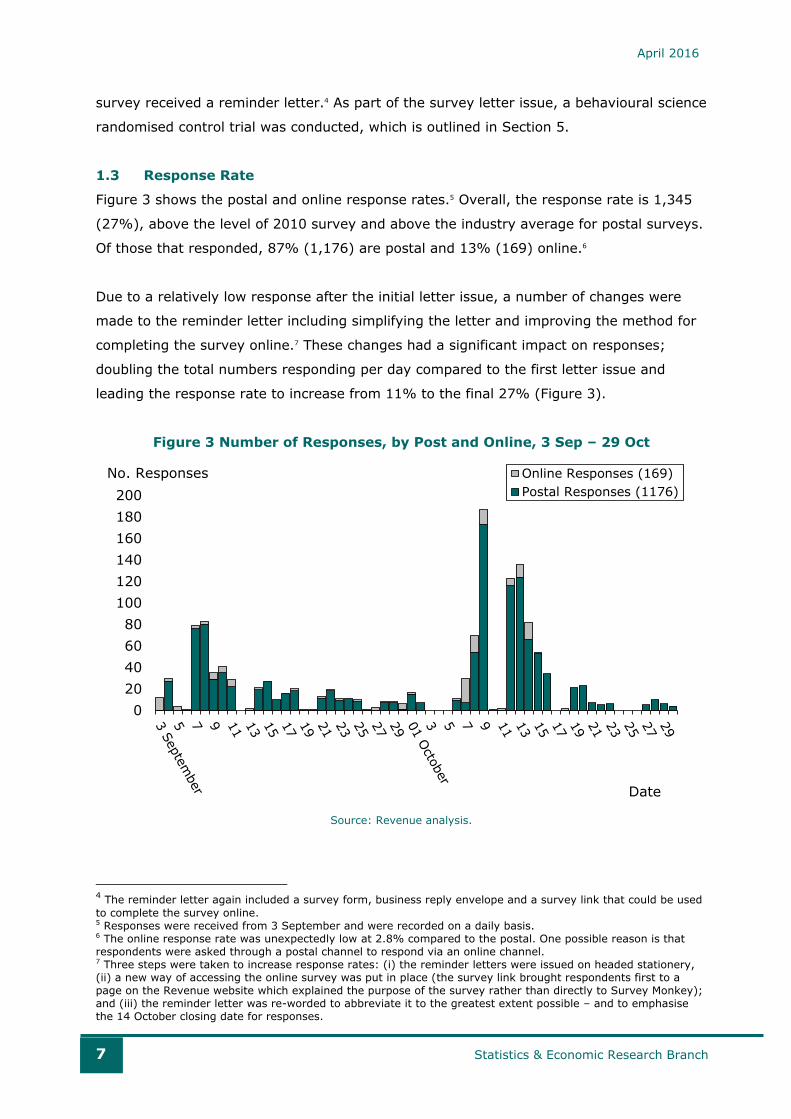
1.3 Response Rate
Figure 3 shows the postal and online response rates.5 Overall, the response rate is 1,345
(27%), above the level of 2010 survey and above the industry average for postal surveys.
Of those that responded, 87% (1,176) are postal and 13% (169) online.6
Due to a relatively low response after the initial letter issue, a number of changes were
made to the reminder letter including simplifying the letter and improving the method for
completing the survey online.7 These changes had a significant impact on responses;
doubling the total numbers responding per day compared to the first letter issue and
leading the response rate to increase from 11% to the final 27% (Figure 3).
Figure 3 Number of Responses, by Post and Online, 3 Sep – 29 Oct
Source: Revenue analysis.
4 The reminder letter again included a survey form, business reply envelope and a survey link that could be used
to complete the survey online. 5 Responses were received from 3 September and were recorded on a daily basis. 6 The online response rate was unexpectedly low at 2.8% compared to the postal. One possible reason is that
respondents were asked through a postal channel to respond via an online channel. 7 Three steps were taken to increase response rates: (i) the reminder letters were issued on headed stationery,
(ii) a new way of accessing the online survey was put in place (the survey link brought respondents first to a
page on the Revenue website which explained the purpose of the survey rather than directly to Survey Monkey);
and (iii) the reminder letter was re-worded to abbreviate it to the greatest extent possible – and to emphasise
the 14 October closing date for responses.
0
20
40
60
80
100
120
140
160
180
200
Online Responses (169)
Postal Responses (1176)
No. Responses
Date
April 2016
8 Statistics & Economic Research Branch
A number of comparisons with previous PAYE surveys are useful. In the previous two PAYE
surveys, taxpayers could only respond by post. In the current survey, taxpayers had the
option of responding by post (returning the completed survey in a freepost envelope) or
online (by following the survey link in the covering letter). There were 32 questions on the
2015 survey form. The number of survey questions for the 2007 and 2010 PAYE surveys
were 16 and 37 respectively, while the response rates were 38% and 19%.
1.4 Data Management and Processing
In order to manage survey responses efficiently, survey letters were opened on a daily
basis and compiled by the date received. The cut off date for responses was Friday 30th
October 2015. The total number of surveys submitted (online and postal) on that date was
1,345. There were 312 surveys returned unopened (DLOs). A sample (81 cases) of these
cases was checked to ascertain why the letter was not delivered and in some the address
was updated before the reminder letter was issued on Wednesday 30th September.
Survey monkey was also used for the manual data capture of the postal surveys. The data
quality of these was checked, 100 cases were chosen at random to be re-input. The 100
cases were checked against the original input data to ensure consistency. 84% of these
cases had less than five inconsistencies. Out of 1,345 surveys submitted (post and online),
some were either incomplete or entered on survey monkey incorrectly. The valid sample
for the purpose of this analysis is 1,301 (26%).
1.5 Context – Employment and Demographics in Ireland
It is important to view the survey findings in the context of Ireland’s economic
performance, and in particular the performance of the labour market, during the survey
period (September to October 2015). By September 2015, employment in Ireland had
grown significantly by 56,000 or 2.9% over the year. At the same time, employment was
1.96 million and the labour force was 2.18 million.
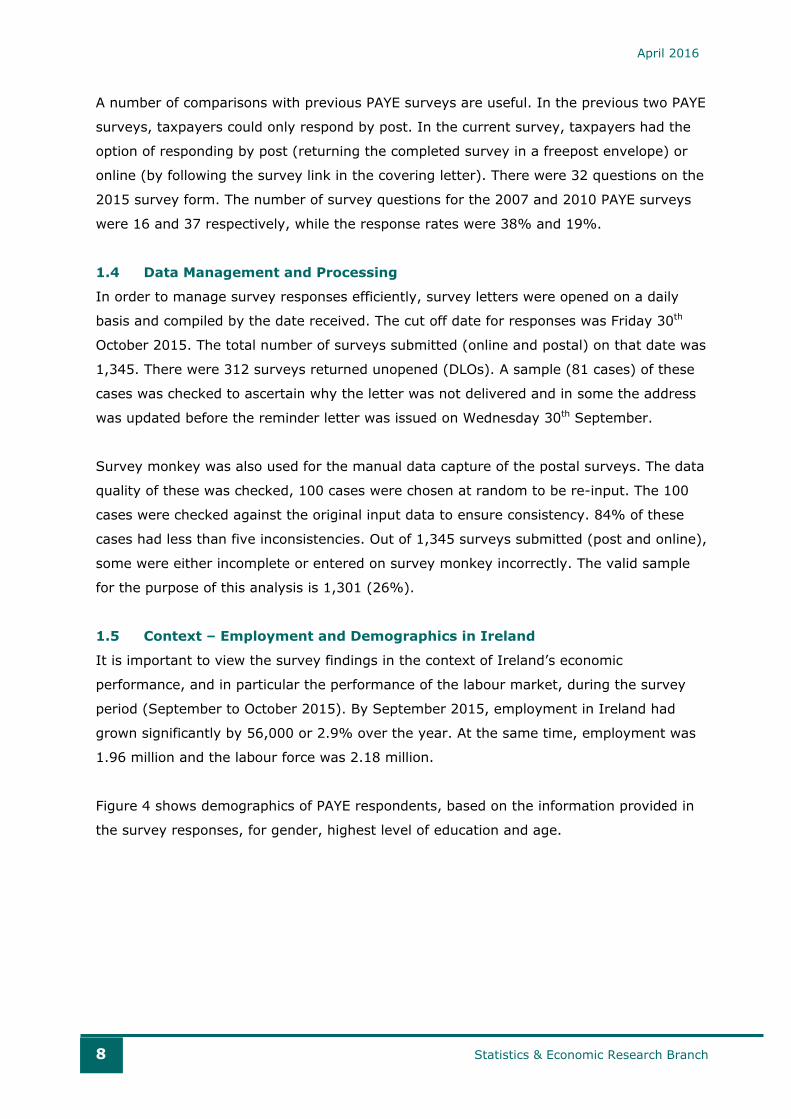
Figure 4 shows demographics of PAYE respondents, based on the information provided in
the survey responses, for gender, highest level of education and age.
April 2016
9 Statistics & Economic Research Branch
Figure 4 Demographics
A. Gender
B. Highest Level of Education
C. Age
Source: Revenue analysis. Note: In 2015 survey, 1,264 respond to the gender question, with 721 reporting as
female and 543 as male. In terms of education, 1,251 of the 1,301 surveyed answer. In terms of age, 1,257 or
97% respond to this question.
According to the analysis, 57% of respondents are female and 43% male. In terms of
educational attainment, 54% have a third-level qualification, 40% second-level and 5%
primary-level. 95% had education levels of secondary and above. 89% of the survey
respondents are between the ages of 26 and 66, while 4% are less than the age of 26 and
the remaining 7% are 66 years and over.
1.6 Previous Customer Surveys in Ireland
Ipsos MRBI conducted an Irish Civil Service Customer Satisfaction Survey in 2015.
Although the questions and the sample population differ, several of the key results are of
interest while examining the survey results later in this paper.
The survey finds that contacting Revenue by phone remains the most popular method
(53%, up from 50% in an earlier survey in 2009), followed by in person (17%), through
email (14%), online (8%) and in writing (7%). Overall service satisfaction with Revenue is
80% (with 7% neither satisfied nor dissatisfied) while the highest channel satisfaction is
online (93%) then writing (81%), email (80%), phone (79%) and in person (78%).
43%
57%
0%
10%
20%
30%
40%
50%
60%
Male Female
5%
40%
54%
0%
10%
20%
30%
40%
50%
60%
Primary Secondary Third level
4%
11%
26%
29%
23%
7%
0%
5%
10%
15%
20%
25%
30%
35%
16-25 26-33 34-44 45-55 56-66 Over 66
April 2016
10 Statistics & Economic Research Branch
1.7 International Surveys
It is also possible to view the results in an international context. According to the HMRC
Customer Survey (2008 – 2015)8, 79% of individual respondents dealt with HMRC in the
past year and 31% had dealings in the 3 months prior to the survey. The HMRC survey
shows a high dependency on phone (82%). Overall 76% of Personal Tax customers are
very or fairly satisfied, with 78% saying their experience was very or fairly
straightforward. The response rate to the most recent survey was 20%.
8https://www.gov.uk/government/uploads/system/uploads/attachment_data/file/460422/HMRC_Customer_Surv
ey_2008-15_Report.pdf
April 2016
11 Statistics & Economic Research Branch
2 Customer Satisfaction
2.1 Introduction
Revenue invests significantly in maintaining and improving customer service delivery. One
of the main objectives of this survey is to quantify levels of satisfaction among PAYE
taxpayers. Respondents were asked a number of questions relating to overall customer
service satisfaction, Revenue’s ability to explain tax credits and entitlements and whether
it is easy to claim tax refunds and credits.
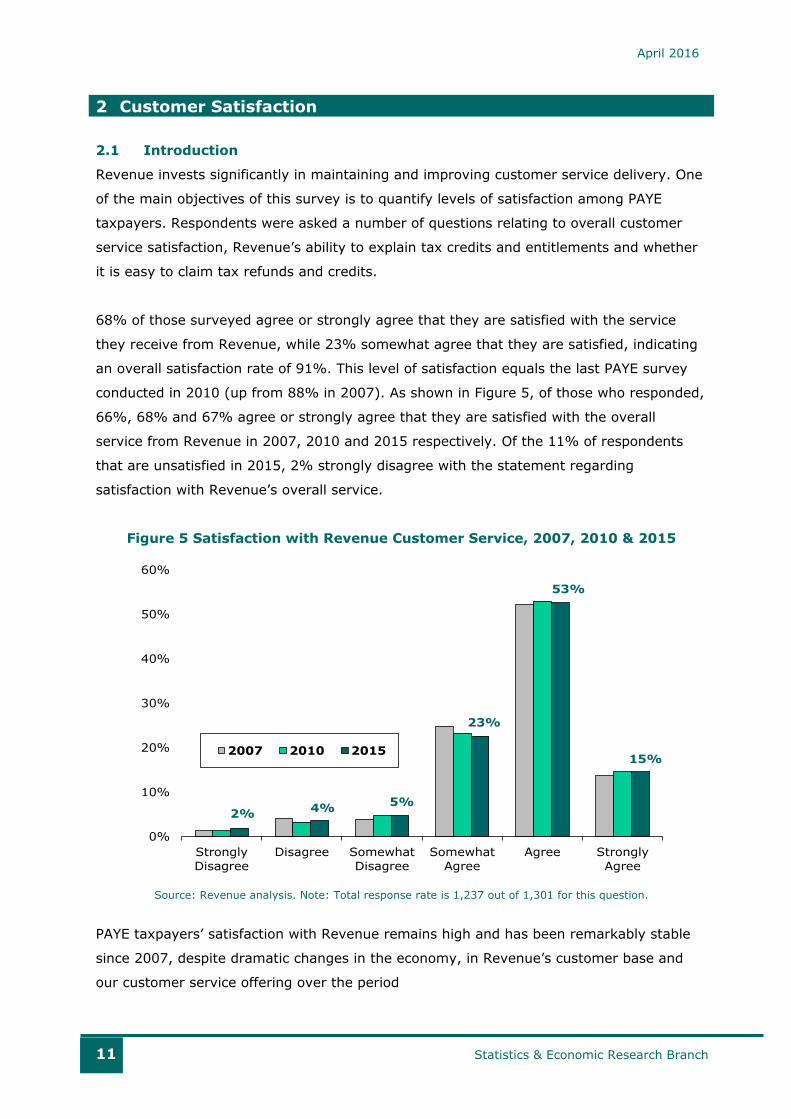
68% of those surveyed agree or strongly agree that they are satisfied with the service
they receive from Revenue, while 23% somewhat agree that they are satisfied, indicating
an overall satisfaction rate of 91%. This level of satisfaction equals the last PAYE survey
conducted in 2010 (up from 88% in 2007). As shown in Figure 5, of those who responded,
66%, 68% and 67% agree or strongly agree that they are satisfied with the overall
service from Revenue in 2007, 2010 and 2015 respectively. Of the 11% of respondents
that are unsatisfied in 2015, 2% strongly disagree with the statement regarding
satisfaction with Revenue’s overall service.
Figure 5 Satisfaction with Revenue Customer Service, 2007, 2010 & 2015
Source: Revenue analysis. Note: Total response rate is 1,237 out of 1,301 for this question.
PAYE taxpayers’ satisfaction with Revenue remains high and has been remarkably stable
since 2007, despite dramatic changes in the economy, in Revenue’s customer base and
our customer service offering over the period
2%4%
5%
23%
53%
15%
0%
10%
20%
30%
40%
50%
60%
Strongly
Disagree
Disagree Somewhat
Disagree
Somewhat
Agree
Agree Strongly
Agree
2007 2010 2015
April 2016
12 Statistics & Economic Research Branch
2.2 Satisfaction Levels by Taxpayer Type
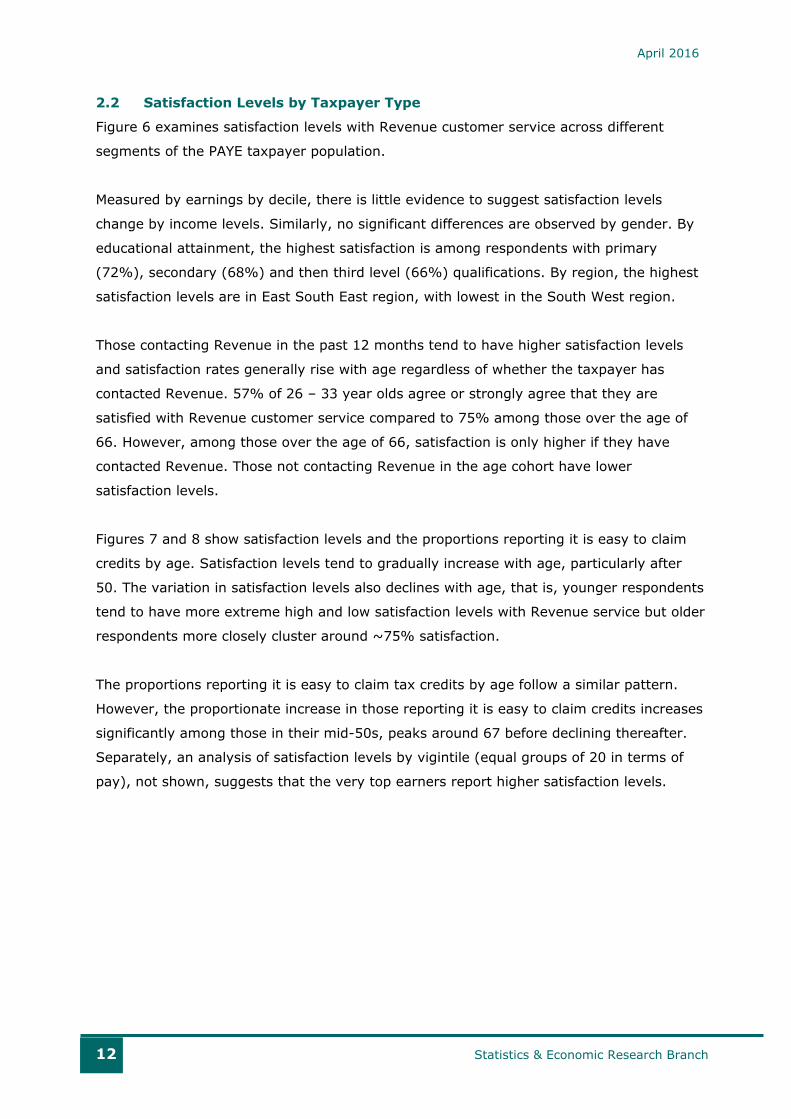
Figure 6 examines satisfaction levels with Revenue customer service across different
segments of the PAYE taxpayer population.
Measured by earnings by decile, there is little evidence to suggest satisfaction levels
change by income levels. Similarly, no significant differences are observed by gender. By
educational attainment, the highest satisfaction is among respondents with primary
(72%), secondary (68%) and then third level (66%) qualifications. By region, the highest
satisfaction levels are in East South East region, with lowest in the South West region.
Those contacting Revenue in the past 12 months tend to have higher satisfaction levels
and satisfaction rates generally rise with age regardless of whether the taxpayer has
contacted Revenue. 57% of 26 – 33 year olds agree or strongly agree that they are
satisfied with Revenue customer service compared to 75% among those over the age of
66. However, among those over the age of 66, satisfaction is only higher if they have
contacted Revenue. Those not contacting Revenue in the age cohort have lower
satisfaction levels.
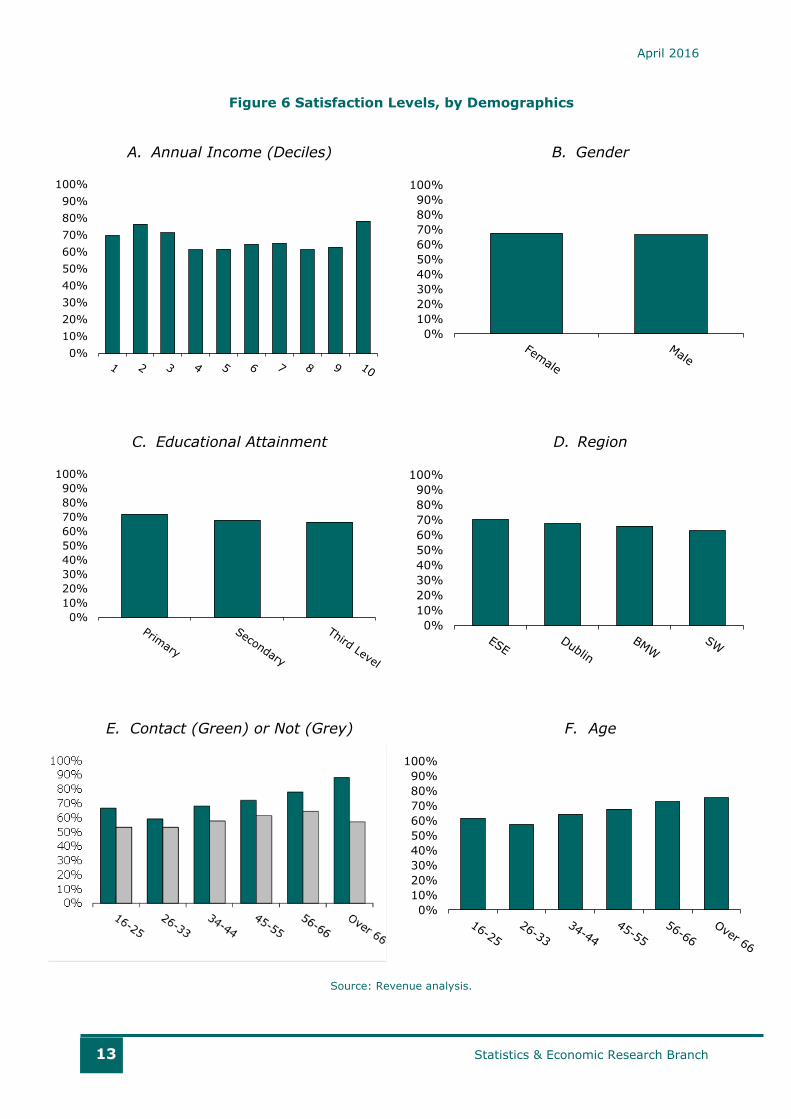
Figures 7 and 8 show satisfaction levels and the proportions reporting it is easy to claim
credits by age. Satisfaction levels tend to gradually increase with age, particularly after
50. The variation in satisfaction levels also declines with age, that is, younger respondents
tend to have more extreme high and low satisfaction levels with Revenue service but older
respondents more closely cluster around ~75% satisfaction.
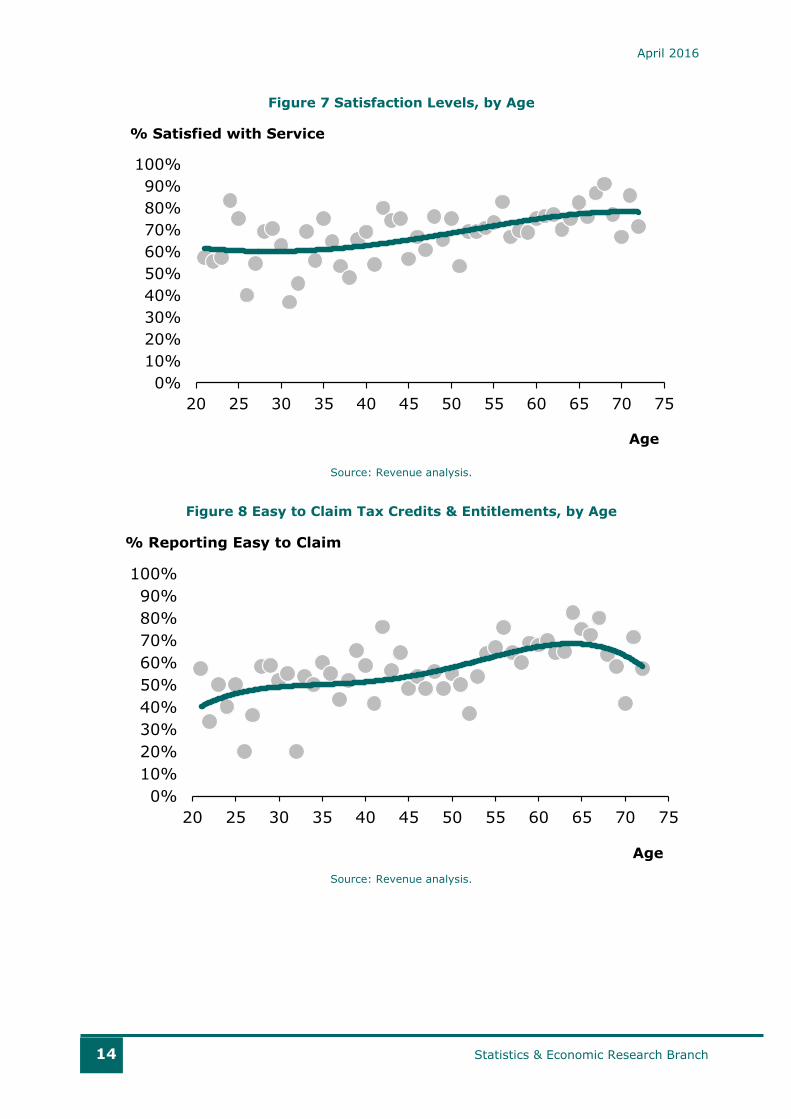
The proportions reporting it is easy to claim tax credits by age follow a similar pattern.
However, the proportionate increase in those reporting it is easy to claim credits increases
significantly among those in their mid-50s, peaks around 67 before declining thereafter.
Separately, an analysis of satisfaction levels by vigintile (equal groups of 20 in terms of
pay), not shown, suggests that the very top earners report higher satisfaction levels.
April 2016
13 Statistics & Economic Research Branch
Figure 6 Satisfaction Levels, by Demographics
A. Annual Income (Deciles)
B. Gender
C. Educational Attainment
D. Region
E. Contact (Green) or Not (Grey)
F. Age
Source: Revenue analysis.
0%
10%
20%
30%
40%
50%
60%
70%
80%
90%
100%
0%
10%
20%
30%
40%
50%
60%
70%
80%
90%
100%
0%
10%
20%
30%
40%
50%
60%
70%
80%
90%
100%
0%
10%
20%
30%
40%
50%
60%
70%
80%
90%
100%
0%
10%
20%
30%
40%
50%
60%
70%
80%
90%
100%
April 2016
14 Statistics & Economic Research Branch
Figure 7 Satisfaction Levels, by Age
Source: Revenue analysis.
Figure 8 Easy to Claim Tax Credits & Entitlements, by Age
Source: Revenue analysis.
0%
10%
20%
30%
40%
50%
60%
70%
80%
90%
100%
20 25 30 35 40 45 50 55 60 65 70 75
% Satisfied with Service
Age
0%
10%
20%
30%
40%
50%
60%
70%
80%
90%
100%
20 25 30 35 40 45 50 55 60 65 70 75
% Reporting Easy to Claim
Age
April 2016
15 Statistics & Economic Research Branch
2.3 Perceptions towards Tax Administration
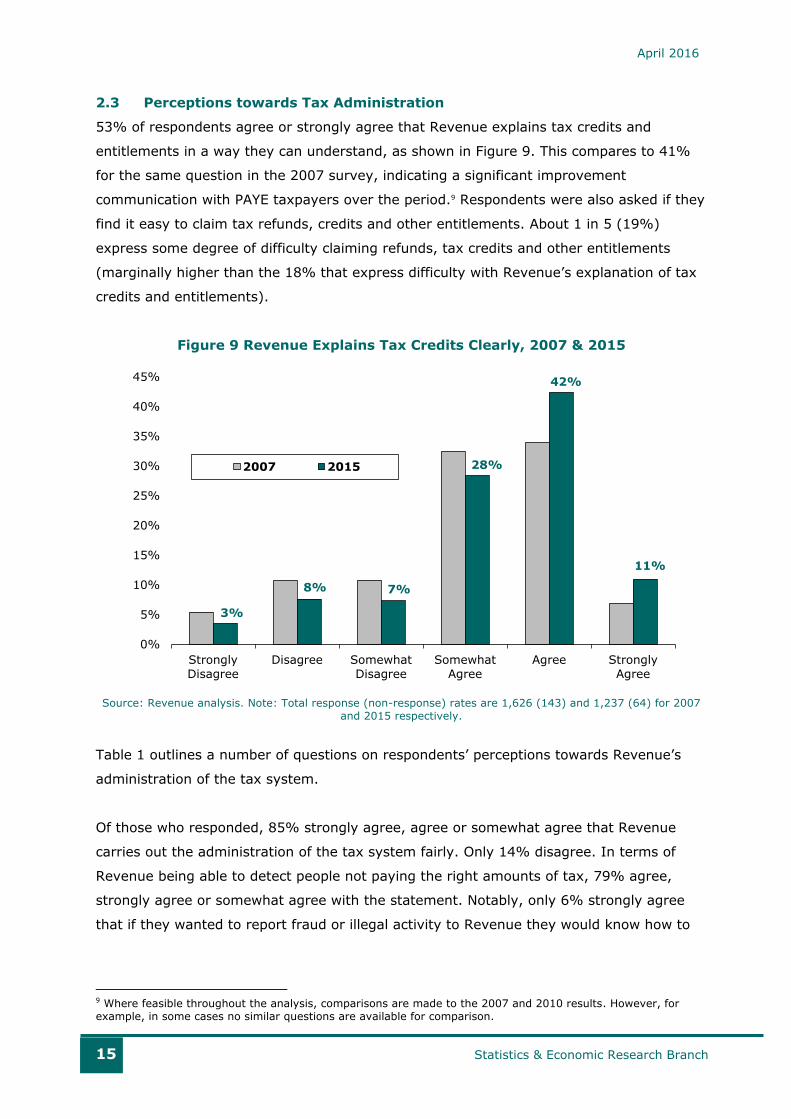
53% of respondents agree or strongly agree that Revenue explains tax credits and
entitlements in a way they can understand, as shown in Figure 9. This compares to 41%
for the same question in the 2007 survey, indicating a significant improvement
communication with PAYE taxpayers over the period.9 Respondents were also asked if they
find it easy to claim tax refunds, credits and other entitlements. About 1 in 5 (19%)
express some degree of difficulty claiming refunds, tax credits and other entitlements
(marginally higher than the 18% that express difficulty with Revenue’s explanation of tax
credits and entitlements).
Figure 9 Revenue Explains Tax Credits Clearly, 2007 & 2015
Source: Revenue analysis. Note: Total response (non-response) rates are 1,626 (143) and 1,237 (64) for 2007
and 2015 respectively.
Table 1 outlines a number of questions on respondents’ perceptions towards Revenue’s
administration of the tax system.
Of those who responded, 85% strongly agree, agree or somewhat agree that Revenue
carries out the administration of the tax system fairly. Only 14% disagree. In terms of
Revenue being able to detect people not paying the right amounts of tax, 79% agree,
strongly agree or somewhat agree with the statement. Notably, only 6% strongly agree
that if they wanted to report fraud or illegal activity to Revenue they would know how to
9 Where feasible throughout the analysis, comparisons are made to the 2007 and 2010 results. However, for
example, in some cases no similar questions are available for comparison.
3%
8% 7%
28%
42%
11%
0%
5%
10%
15%
20%
25%
30%
35%
40%
45%
Strongly
Disagree
Disagree Somewhat
Disagree
Somewhat
Agree
Agree Strongly
Agree
2007 2015
April 2016
16 Statistics & Economic Research Branch
do so. 41% report that they would not know how to do so. Revenue is currently reviewing
existing reporting mechanisms.
Table 1 Perceptions of Tax Administration
Source: Revenue analysis. Note: Total responses for each of the questions above are 1,223, 1,222, 1,196 and
1,209 respectively out of a total of 1,301 surveys returned.
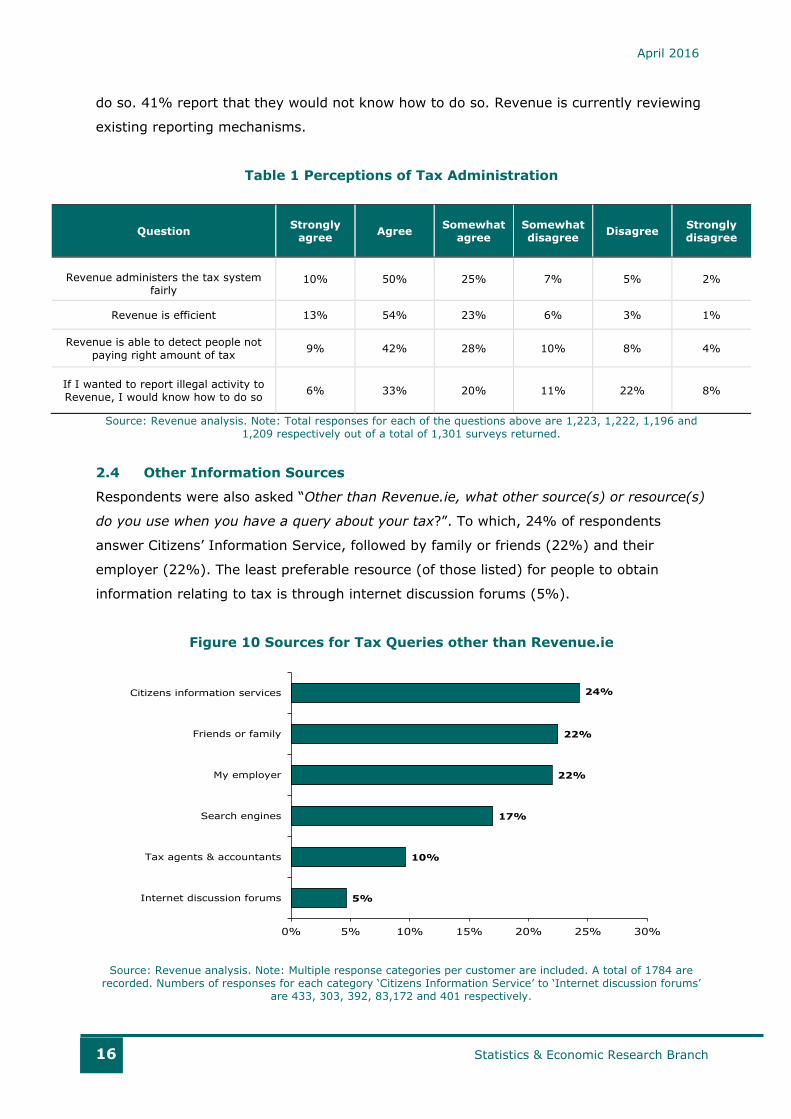
2.4 Other Information Sources
Respondents were also asked “Other than Revenue.ie, what other source(s) or resource(s)
do you use when you have a query about your tax?”. To which, 24% of respondents
answer Citizens’ Information Service, followed by family or friends (22%) and their
employer (22%). The least preferable resource (of those listed) for people to obtain
information relating to tax is through internet discussion forums (5%).
Figure 10 Sources for Tax Queries other than Revenue.ie
Source: Revenue analysis. Note: Multiple response categories per customer are included. A total of 1784 are
recorded. Numbers of responses for each category ‘Citizens Information Service’ to ‘Internet discussion forums’
are 433, 303, 392, 83,172 and 401 respectively.
5%
10%
17%
22%
22%
24%
0% 5% 10% 15% 20% 25% 30%
Internet discussion forums
Tax agents & accountants
Search engines
My employer
Friends or family
Citizens information services
Question Strongly
agree Agree
Somewhat
agree
Somewhat
disagree Disagree
Strongly
disagree
Revenue administers the tax system
fairly
10% 50% 25% 7% 5% 2%
Revenue is efficient 13% 54% 23% 6% 3% 1%
Revenue is able to detect people not
paying right amount of tax 9% 42% 28% 10% 8% 4%
If I wanted to report illegal activity to
Revenue, I would know how to do so 6% 33% 20% 11% 22% 8%
April 2016
17 Statistics & Economic Research Branch
3 Customer Contacts and Preferred Channels
3.1 Introduction
This section examines responses to a range of questions relating to channels of
communication between taxpayers and Revenue.
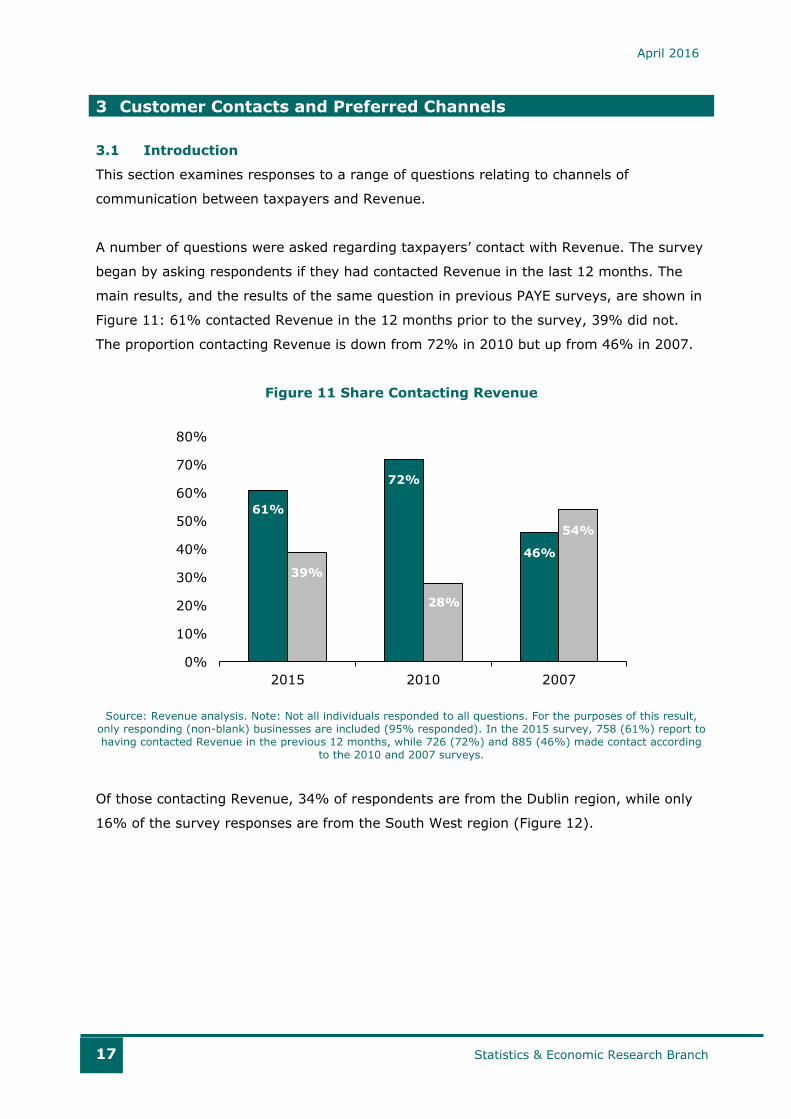
A number of questions were asked regarding taxpayers’ contact with Revenue. The survey
began by asking respondents if they had contacted Revenue in the last 12 months. The
main results, and the results of the same question in previous PAYE surveys, are shown in
Figure 11: 61% contacted Revenue in the 12 months prior to the survey, 39% did not.
The proportion contacting Revenue is down from 72% in 2010 but up from 46% in 2007.
Figure 11 Share Contacting Revenue
Source: Revenue analysis. Note: Not all individuals responded to all questions. For the purposes of this result,
only responding (non-blank) businesses are included (95% responded). In the 2015 survey, 758 (61%) report to
having contacted Revenue in the previous 12 months, while 726 (72%) and 885 (46%) made contact according
to the 2010 and 2007 surveys.
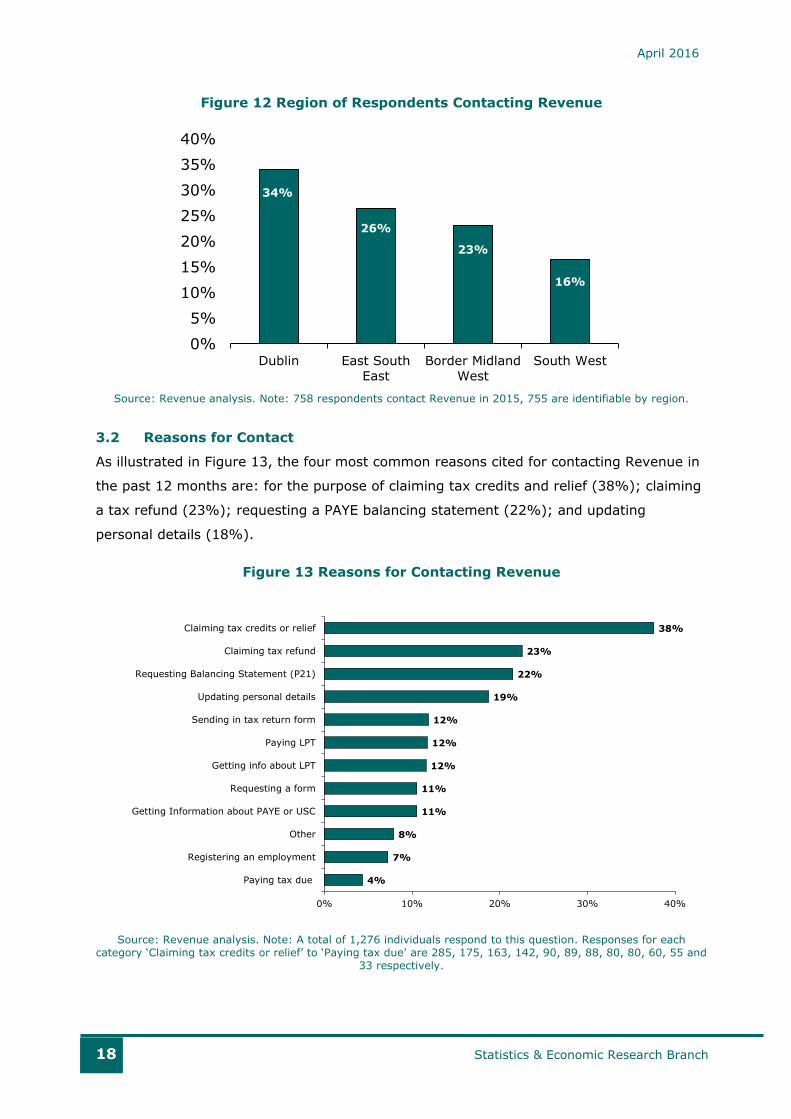
Of those contacting Revenue, 34% of respondents are from the Dublin region, while only
16% of the survey responses are from the South West region (Figure 12).
61%
72%
46%
39%
28%
54%
0%
10%
20%
30%
40%
50%
60%
70%
80%
2015 2010 2007
April 2016
18 Statistics & Economic Research Branch
Figure 12 Region of Respondents Contacting Revenue
Source: Revenue analysis. Note: 758 respondents contact Revenue in 2015, 755 are identifiable by region.
3.2 Reasons for Contact
As illustrated in Figure 13, the four most common reasons cited for contacting Revenue in
the past 12 months are: for the purpose of claiming tax credits and relief (38%); claiming
a tax refund (23%); requesting a PAYE balancing statement (22%); and updating
personal details (18%).
Figure 13 Reasons for Contacting Revenue
Source: Revenue analysis. Note: A total of 1,276 individuals respond to this question. Responses for each
category ‘Claiming tax credits or relief’ to ‘Paying tax due’ are 285, 175, 163, 142, 90, 89, 88, 80, 80, 60, 55 and
33 respectively.
34%
26%
23%
16%
0%
5%
10%
15%
20%
25%
30%
35%
40%
Dublin East SouthEast
Border MidlandWest
South West
4%
7%
8%
11%
11%
12%
12%
12%
19%
22%
23%
38%
0% 10% 20% 30% 40%
Paying tax due
Registering an employment
Other
Getting Information about PAYE or USC
Requesting a form
Getting info about LPT
Paying LPT
Sending in tax return form
Updating personal details
Requesting Balancing Statement (P21)
Claiming tax refund
Claiming tax credits or relief
April 2016
19 Statistics & Economic Research Branch
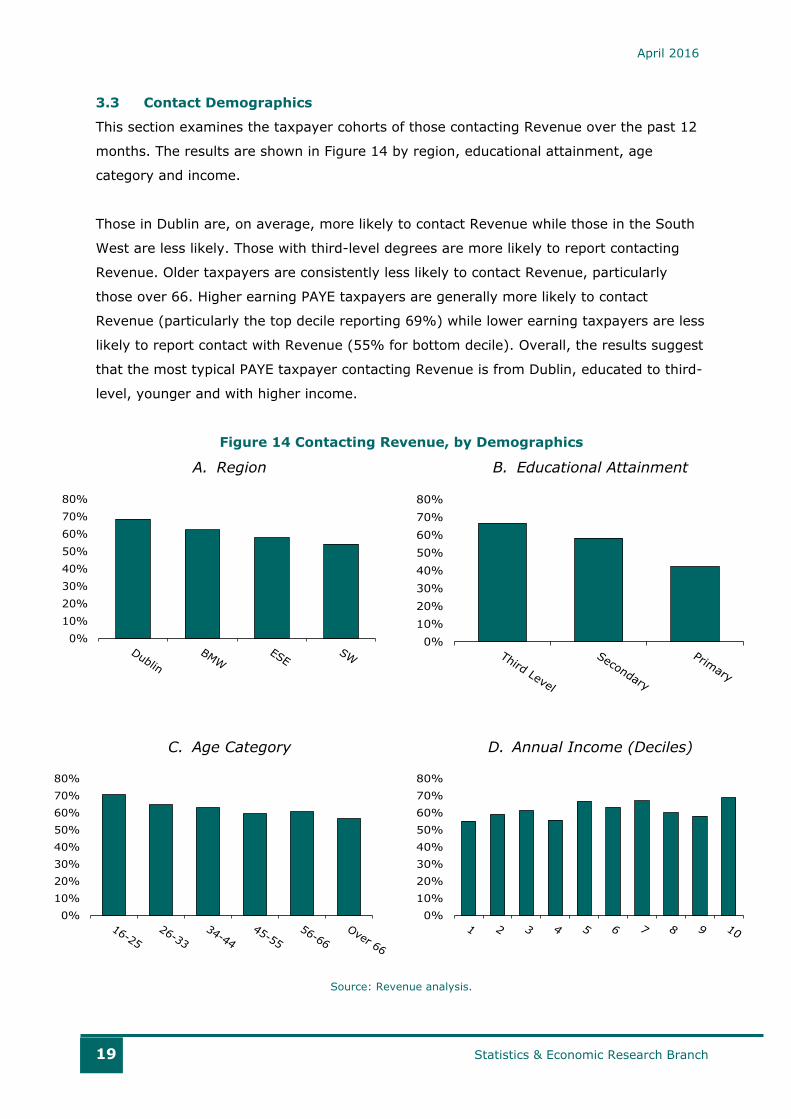
3.3 Contact Demographics
This section examines the taxpayer cohorts of those contacting Revenue over the past 12
months. The results are shown in Figure 14 by region, educational attainment, age
category and income.
Those in Dublin are, on average, more likely to contact Revenue while those in the South
West are less likely. Those with third-level degrees are more likely to report contacting
Revenue. Older taxpayers are consistently less likely to contact Revenue, particularly
those over 66. Higher earning PAYE taxpayers are generally more likely to contact
Revenue (particularly the top decile reporting 69%) while lower earning taxpayers are less
likely to report contact with Revenue (55% for bottom decile). Overall, the results suggest
that the most typical PAYE taxpayer contacting Revenue is from Dublin, educated to third-
level, younger and with higher income.
Figure 14 Contacting Revenue, by Demographics
A. Region
B. Educational Attainment
C. Age Category
D. Annual Income (Deciles)
Source: Revenue analysis.
0%
10%
20%
30%
40%
50%
60%
70%
80%
0%
10%
20%
30%
40%
50%
60%
70%
80%
0%
10%
20%
30%
40%
50%
60%
70%
80%
0%
10%
20%
30%
40%
50%
60%
70%
80%
April 2016
20 Statistics & Economic Research Branch
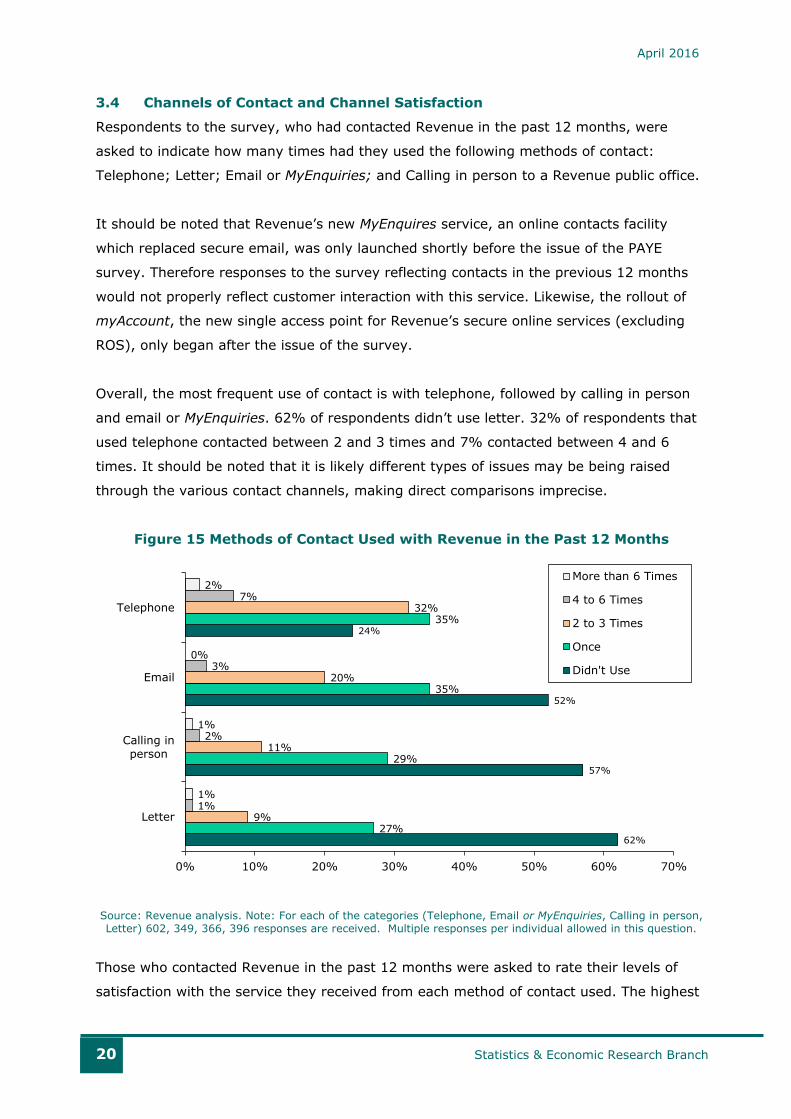
3.4 Channels of Contact and Channel Satisfaction
Respondents to the survey, who had contacted Revenue in the past 12 months, were
asked to indicate how many times had they used the following methods of contact:
Telephone; Letter; Email or MyEnquiries; and Calling in person to a Revenue public office.
It should be noted that Revenue’s new MyEnquires service, an online contacts facility
which replaced secure email, was only launched shortly before the issue of the PAYE
survey. Therefore responses to the survey reflecting contacts in the previous 12 months
would not properly reflect customer interaction with this service. Likewise, the rollout of
myAccount, the new single access point for Revenue’s secure online services (excluding
ROS), only began after the issue of the survey.
Overall, the most frequent use of contact is with telephone, followed by calling in person
and email or MyEnquiries. 62% of respondents didn’t use letter. 32% of respondents that
used telephone contacted between 2 and 3 times and 7% contacted between 4 and 6
times. It should be noted that it is likely different types of issues may be being raised
through the various contact channels, making direct comparisons imprecise.
Figure 15 Methods of Contact Used with Revenue in the Past 12 Months
Source: Revenue analysis. Note: For each of the categories (Telephone, Email or MyEnquiries, Calling in person,
Letter) 602, 349, 366, 396 responses are received. Multiple responses per individual allowed in this question.
Those who contacted Revenue in the past 12 months were asked to rate their levels of
satisfaction with the service they received from each method of contact used. The highest
62%
57%
52%
24%
27%
29%
35%
35%
9%
11%
20%
32%
1%
2%
3%
7%
1%
1%
0%
2%
0% 10% 20% 30% 40% 50% 60% 70%
Letter
Calling in
person
Telephone
More than 6 Times
4 to 6 Times
2 to 3 Times
Once
Didn't Use
April 2016
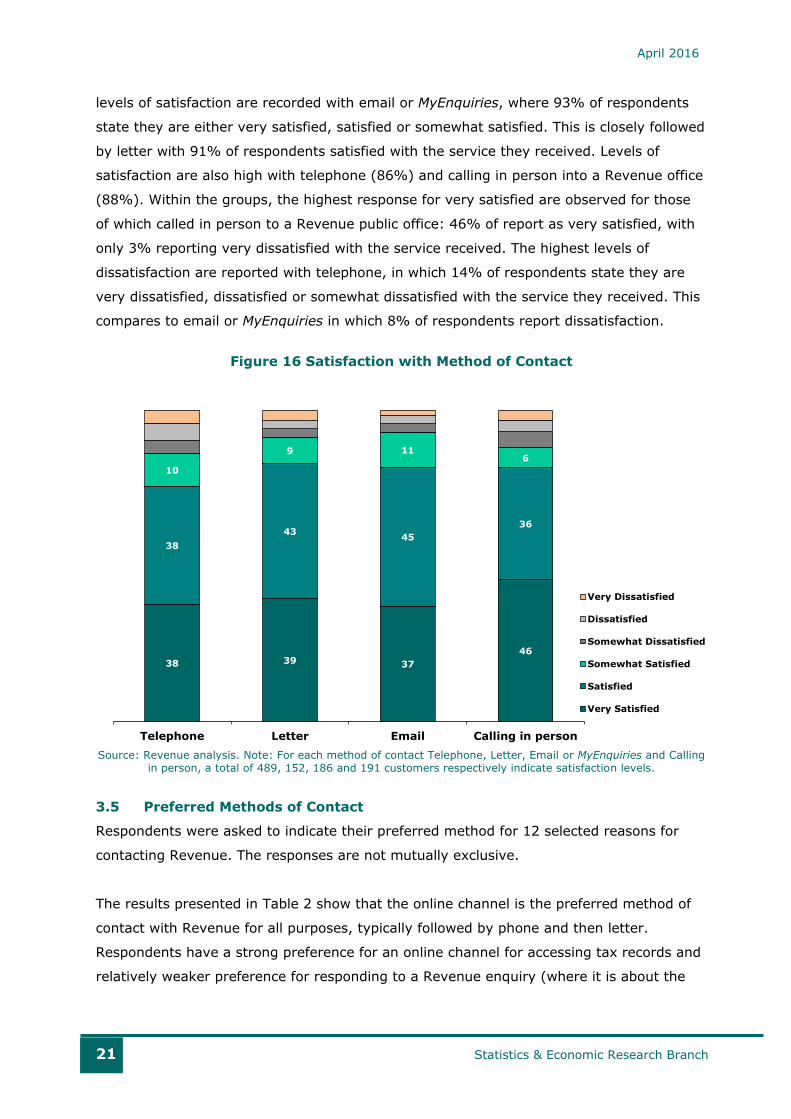
21 Statistics & Economic Research Branch
levels of satisfaction are recorded with email or MyEnquiries, where 93% of respondents
state they are either very satisfied, satisfied or somewhat satisfied. This is closely followed
by letter with 91% of respondents satisfied with the service they received. Levels of
satisfaction are also high with telephone (86%) and calling in person into a Revenue office
(88%). Within the groups, the highest response for very satisfied are observed for those
of which called in person to a Revenue public office: 46% of report as very satisfied, with
only 3% reporting very dissatisfied with the service received. The highest levels of
dissatisfaction are reported with telephone, in which 14% of respondents state they are
very dissatisfied, dissatisfied or somewhat dissatisfied with the service they received. This
compares to email or MyEnquiries in which 8% of respondents report dissatisfaction.
Figure 16 Satisfaction with Method of Contact
Source: Revenue analysis. Note: For each method of contact Telephone, Letter, Email or MyEnquiries and Calling
in person, a total of 489, 152, 186 and 191 customers respectively indicate satisfaction levels.
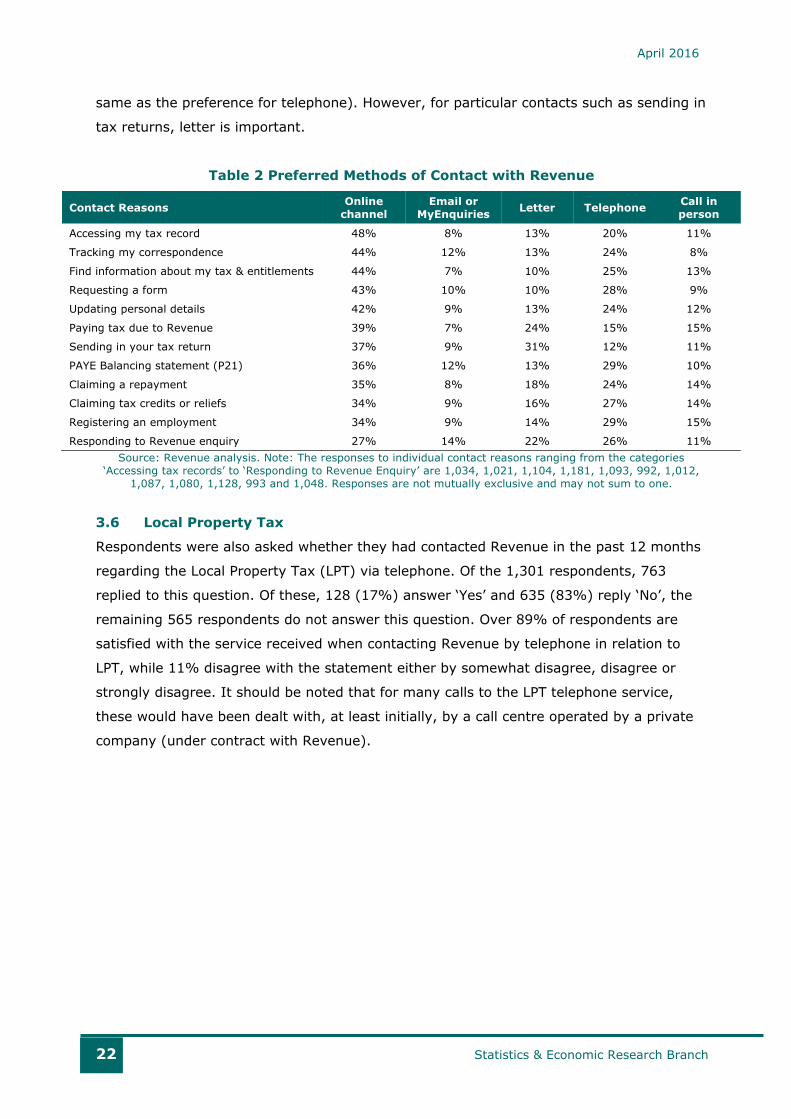
3.5 Preferred Methods of Contact
Respondents were asked to indicate their preferred method for 12 selected reasons for
contacting Revenue. The responses are not mutually exclusive.
The results presented in Table 2 show that the online channel is the preferred method of
contact with Revenue for all purposes, typically followed by phone and then letter.
Respondents have a strong preference for an online channel for accessing tax records and
relatively weaker preference for responding to a Revenue enquiry (where it is about the
38 39 37
46
38
4345
36
10
9 116
Telephone Letter Email Calling in person
Very Dissatisfied
Dissatisfied
Somewhat Dissatisfied
Somewhat Satisfied
Satisfied
Very Satisfied
April 2016
22 Statistics & Economic Research Branch
same as the preference for telephone). However, for particular contacts such as sending in
tax returns, letter is important.
Table 2 Preferred Methods of Contact with Revenue
Contact Reasons Online
channel
Email or
MyEnquiries Letter Telephone
Call in
person
Accessing my tax record 48% 8% 13% 20% 11%
Tracking my correspondence 44% 12% 13% 24% 8%
Find information about my tax & entitlements 44% 7% 10% 25% 13%
Requesting a form 43% 10% 10% 28% 9%
Updating personal details 42% 9% 13% 24% 12%
Paying tax due to Revenue 39% 7% 24% 15% 15%
Sending in your tax return 37% 9% 31% 12% 11%
PAYE Balancing statement (P21) 36% 12% 13% 29% 10%
Claiming a repayment 35% 8% 18% 24% 14%
Claiming tax credits or reliefs 34% 9% 16% 27% 14%
Registering an employment 34% 9% 14% 29% 15%
Responding to Revenue enquiry 27% 14% 22% 26% 11%
Source: Revenue analysis. Note: The responses to individual contact reasons ranging from the categories
‘Accessing tax records’ to ‘Responding to Revenue Enquiry’ are 1,034, 1,021, 1,104, 1,181, 1,093, 992, 1,012,
1,087, 1,080, 1,128, 993 and 1,048. Responses are not mutually exclusive and may not sum to one.
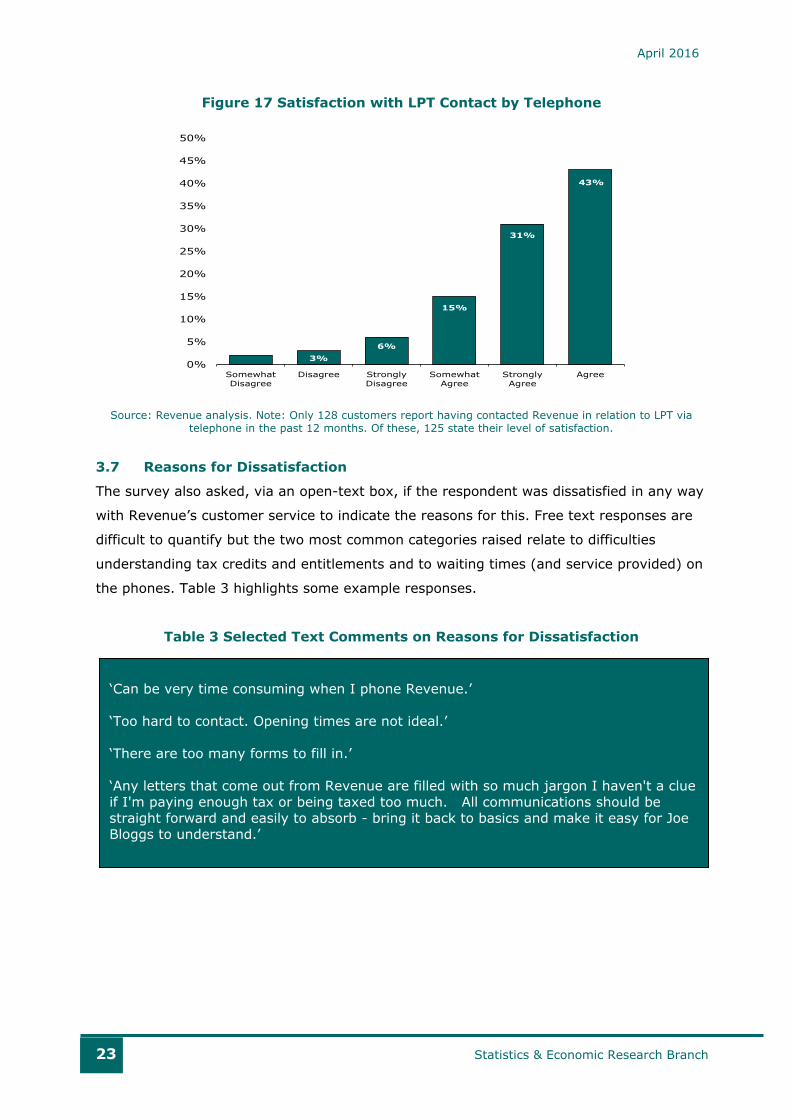
3.6 Local Property Tax
Respondents were also asked whether they had contacted Revenue in the past 12 months
regarding the Local Property Tax (LPT) via telephone. Of the 1,301 respondents, 763
replied to this question. Of these, 128 (17%) answer ‘Yes’ and 635 (83%) reply ‘No’, the
remaining 565 respondents do not answer this question. Over 89% of respondents are
satisfied with the service received when contacting Revenue by telephone in relation to
LPT, while 11% disagree with the statement either by somewhat disagree, disagree or
strongly disagree. It should be noted that for many calls to the LPT telephone service,
these would have been dealt with, at least initially, by a call centre operated by a private
company (under contract with Revenue).
April 2016
23 Statistics & Economic Research Branch
Figure 17 Satisfaction with LPT Contact by Telephone
Source: Revenue analysis. Note: Only 128 customers report having contacted Revenue in relation to LPT via
telephone in the past 12 months. Of these, 125 state their level of satisfaction.
3.7 Reasons for Dissatisfaction
The survey also asked, via an open-text box, if the respondent was dissatisfied in any way
with Revenue’s customer service to indicate the reasons for this. Free text responses are
difficult to quantify but the two most common categories raised relate to difficulties
understanding tax credits and entitlements and to waiting times (and service provided) on
the phones. Table 3 highlights some example responses.
Table 3 Selected Text Comments on Reasons for Dissatisfaction
3%
6%
15%
31%
43%
0%
5%
10%
15%
20%
25%
30%
35%
40%
45%
50%
Somewhat
Disagree
Disagree Strongly
Disagree
Somewhat
Agree
Strongly
Agree
Agree
‘Can be very time consuming when I phone Revenue.’
‘Too hard to contact. Opening times are not ideal.’
‘There are too many forms to fill in.’
‘Any letters that come out from Revenue are filled with so much jargon I haven't a clue
if I'm paying enough tax or being taxed too much. All communications should be straight forward and easily to absorb - bring it back to basics and make it easy for Joe Bloggs to understand.’
April 2016
24 Statistics & Economic Research Branch
4 Revenue’s Online Services
4.1 Introduction
Of the many channels of contact and information Revenue provides, online service has
become an increasingly effective mechanism for the provision of services to Revenue
customers. These services not only include the interactive facilities through PAYE Anytime
and the Revenue website but through email, Twitter and other online mechanisms for
disseminating information.10
4.2 Revenue Website
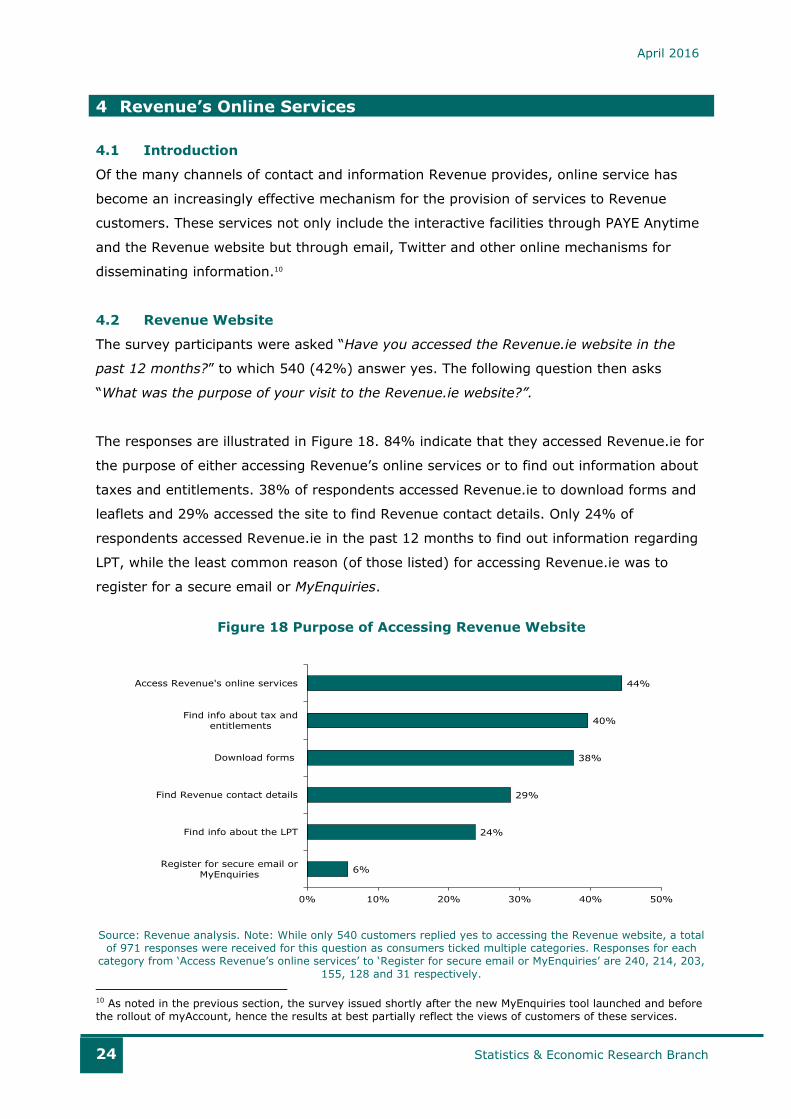
The survey participants were asked “Have you accessed the Revenue.ie website in the
past 12 months?” to which 540 (42%) answer yes. The following question then asks
“What was the purpose of your visit to the Revenue.ie website?”.
The responses are illustrated in Figure 18. 84% indicate that they accessed Revenue.ie for
the purpose of either accessing Revenue’s online services or to find out information about
taxes and entitlements. 38% of respondents accessed Revenue.ie to download forms and
leaflets and 29% accessed the site to find Revenue contact details. Only 24% of
respondents accessed Revenue.ie in the past 12 months to find out information regarding
LPT, while the least common reason (of those listed) for accessing Revenue.ie was to
register for a secure email or MyEnquiries.
Figure 18 Purpose of Accessing Revenue Website
Source: Revenue analysis. Note: While only 540 customers replied yes to accessing the Revenue website, a total
of 971 responses were received for this question as consumers ticked multiple categories. Responses for each
category from ‘Access Revenue’s online services’ to ‘Register for secure email or MyEnquiries’ are 240, 214, 203,
155, 128 and 31 respectively.
10 As noted in the previous section, the survey issued shortly after the new MyEnquiries tool launched and before
the rollout of myAccount, hence the results at best partially reflect the views of customers of these services.
6%
24%
29%
38%
40%
44%
0% 10% 20% 30% 40% 50%
Register for secure email or
MyEnquiries
Find info about the LPT
Find Revenue contact details
Download forms
Find info about tax and
entitlements
Access Revenue's online services
April 2016
25 Statistics & Economic Research Branch
4.3 PAYE Information
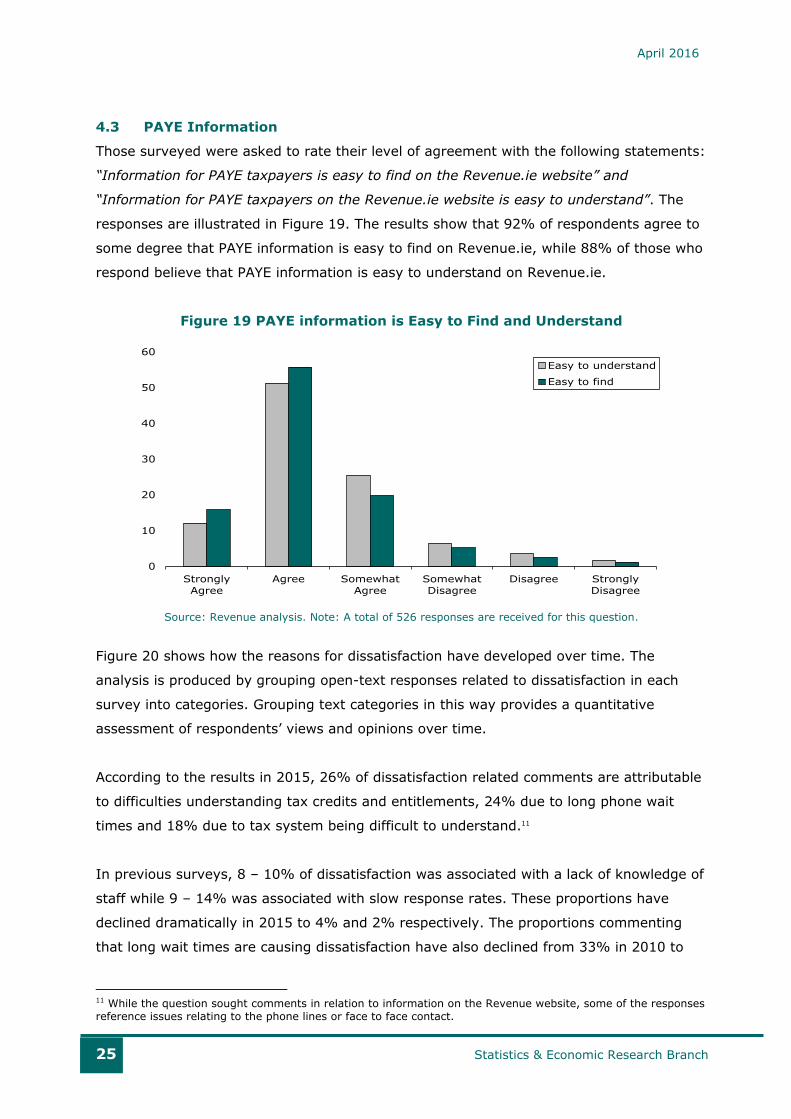
Those surveyed were asked to rate their level of agreement with the following statements:
“Information for PAYE taxpayers is easy to find on the Revenue.ie website” and
“Information for PAYE taxpayers on the Revenue.ie website is easy to understand”. The
responses are illustrated in Figure 19. The results show that 92% of respondents agree to
some degree that PAYE information is easy to find on Revenue.ie, while 88% of those who
respond believe that PAYE information is easy to understand on Revenue.ie.
Figure 19 PAYE information is Easy to Find and Understand
Source: Revenue analysis. Note: A total of 526 responses are received for this question.
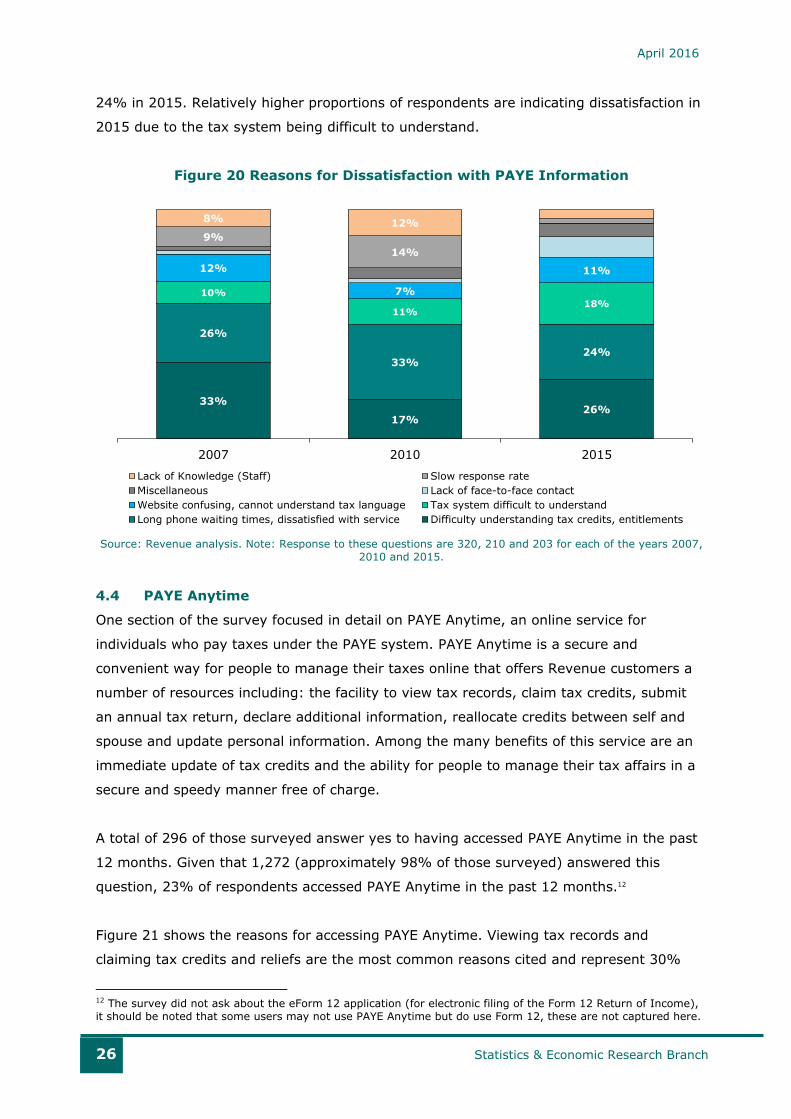
Figure 20 shows how the reasons for dissatisfaction have developed over time. The
analysis is produced by grouping open-text responses related to dissatisfaction in each
survey into categories. Grouping text categories in this way provides a quantitative
assessment of respondents’ views and opinions over time.
According to the results in 2015, 26% of dissatisfaction related comments are attributable
to difficulties understanding tax credits and entitlements, 24% due to long phone wait
times and 18% due to tax system being difficult to understand.11
In previous surveys, 8 – 10% of dissatisfaction was associated with a lack of knowledge of
staff while 9 – 14% was associated with slow response rates. These proportions have
declined dramatically in 2015 to 4% and 2% respectively. The proportions commenting
that long wait times are causing dissatisfaction have also declined from 33% in 2010 to
11 While the question sought comments in relation to information on the Revenue website, some of the responses
reference issues relating to the phone lines or face to face contact.
0
10
20
30
40
50
60
Strongly
Agree
Agree Somewhat
Agree
Somewhat
Disagree
Disagree Strongly
Disagree
Easy to understand
Easy to find
April 2016
26 Statistics & Economic Research Branch
24% in 2015. Relatively higher proportions of respondents are indicating dissatisfaction in
2015 due to the tax system being difficult to understand.
Figure 20 Reasons for Dissatisfaction with PAYE Information
Source: Revenue analysis. Note: Response to these questions are 320, 210 and 203 for each of the years 2007,
2010 and 2015.
4.4 PAYE Anytime
One section of the survey focused in detail on PAYE Anytime, an online service for
individuals who pay taxes under the PAYE system. PAYE Anytime is a secure and
convenient way for people to manage their taxes online that offers Revenue customers a
number of resources including: the facility to view tax records, claim tax credits, submit
an annual tax return, declare additional information, reallocate credits between self and
spouse and update personal information. Among the many benefits of this service are an
immediate update of tax credits and the ability for people to manage their tax affairs in a
secure and speedy manner free of charge.
A total of 296 of those surveyed answer yes to having accessed PAYE Anytime in the past
12 months. Given that 1,272 (approximately 98% of those surveyed) answered this
question, 23% of respondents accessed PAYE Anytime in the past 12 months.12
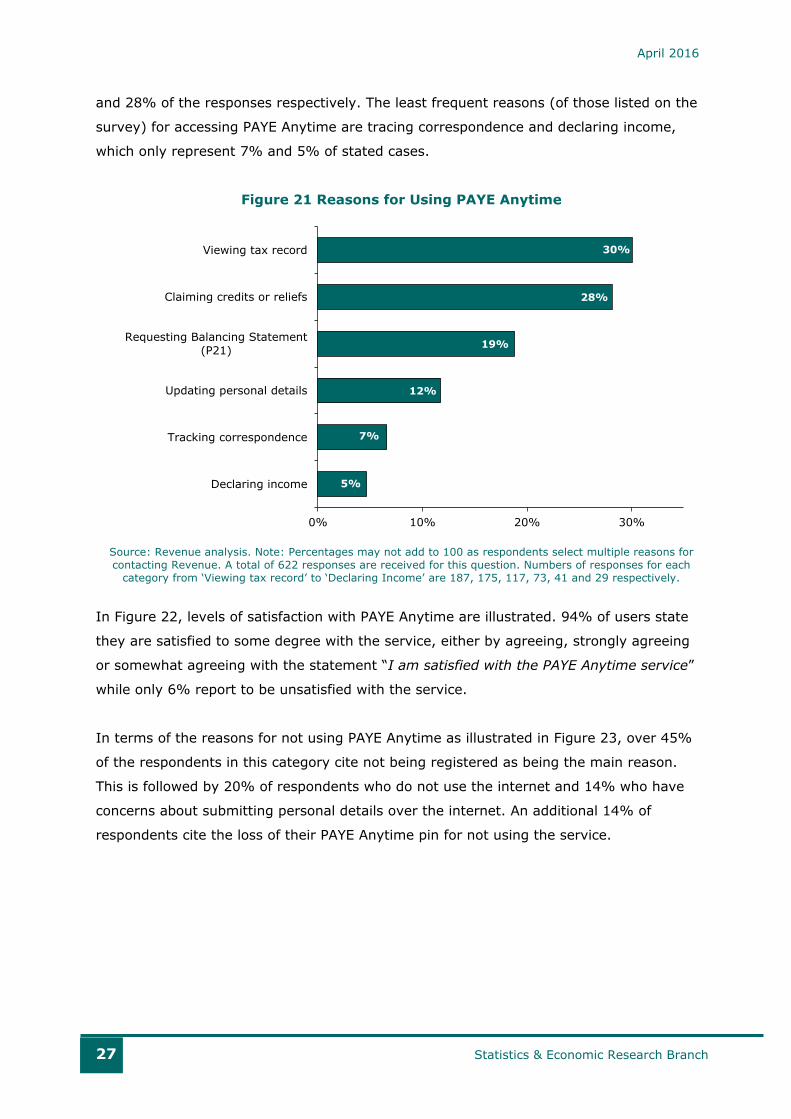
Figure 21 shows the reasons for accessing PAYE Anytime. Viewing tax records and
claiming tax credits and reliefs are the most common reasons cited and represent 30%
12 The survey did not ask about the eForm 12 application (for electronic filing of the Form 12 Return of Income),
it should be noted that some users may not use PAYE Anytime but do use Form 12, these are not captured here.
33%
17%26%
26%
33%24%
10%
11%18%
12%
7%
11%
9%
14%
8% 12%
2007 2010 2015
Lack of Knowledge (Staff) Slow response rate
Miscellaneous Lack of face-to-face contact
Website confusing, cannot understand tax language Tax system difficult to understand
Long phone waiting times, dissatisfied with service Difficulty understanding tax credits, entitlements
April 2016
27 Statistics & Economic Research Branch
and 28% of the responses respectively. The least frequent reasons (of those listed on the
survey) for accessing PAYE Anytime are tracing correspondence and declaring income,
which only represent 7% and 5% of stated cases.
Figure 21 Reasons for Using PAYE Anytime
Source: Revenue analysis. Note: Percentages may not add to 100 as respondents select multiple reasons for
contacting Revenue. A total of 622 responses are received for this question. Numbers of responses for each
category from ‘Viewing tax record’ to ‘Declaring Income’ are 187, 175, 117, 73, 41 and 29 respectively.
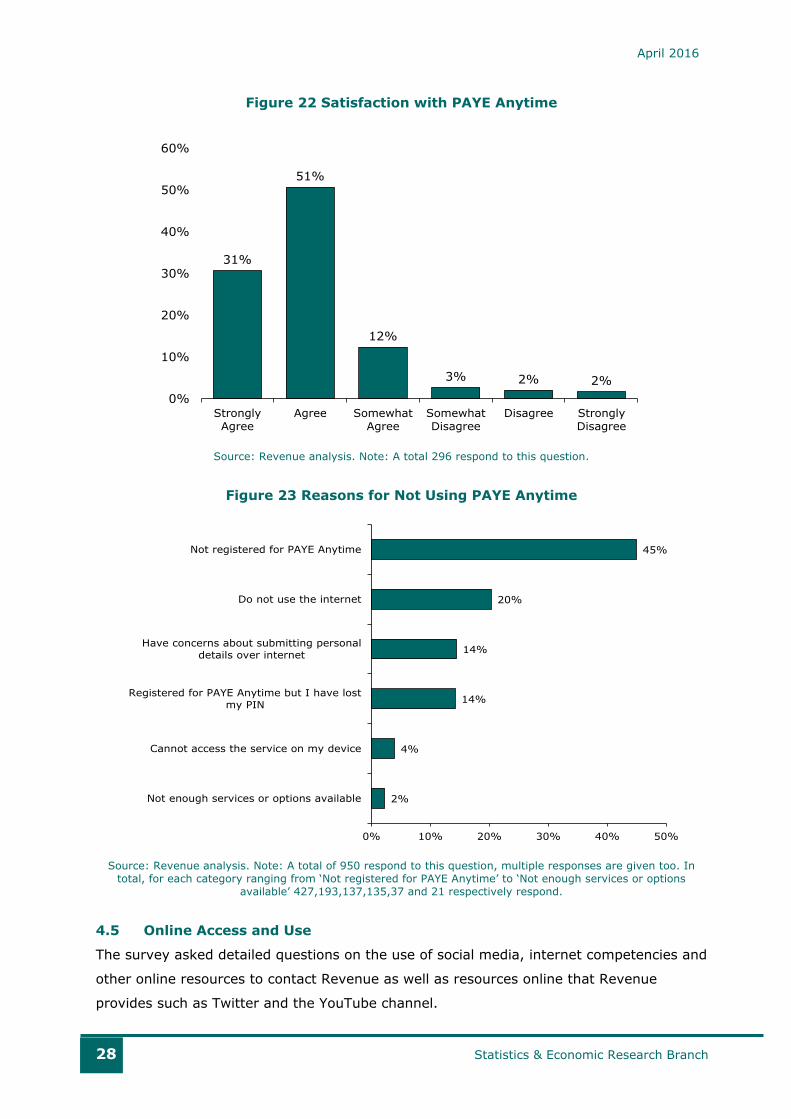
In Figure 22, levels of satisfaction with PAYE Anytime are illustrated. 94% of users state
they are satisfied to some degree with the service, either by agreeing, strongly agreeing
or somewhat agreeing with the statement “I am satisfied with the PAYE Anytime service”
while only 6% report to be unsatisfied with the service.
In terms of the reasons for not using PAYE Anytime as illustrated in Figure 23, over 45%
of the respondents in this category cite not being registered as being the main reason.
This is followed by 20% of respondents who do not use the internet and 14% who have
concerns about submitting personal details over the internet. An additional 14% of
respondents cite the loss of their PAYE Anytime pin for not using the service.
5%
7%
12%
19%
28%
30%
0% 10% 20% 30%
Declaring income
Tracking correspondence
Updating personal details
Requesting Balancing Statement
(P21)
Claiming credits or reliefs
Viewing tax record
April 2016
28 Statistics & Economic Research Branch
Figure 22 Satisfaction with PAYE Anytime
Source: Revenue analysis. Note: A total 296 respond to this question.
Figure 23 Reasons for Not Using PAYE Anytime
Source: Revenue analysis. Note: A total of 950 respond to this question, multiple responses are given too. In
total, for each category ranging from ‘Not registered for PAYE Anytime’ to ‘Not enough services or options
available’ 427,193,137,135,37 and 21 respectively respond.
4.5 Online Access and Use
The survey asked detailed questions on the use of social media, internet competencies and
other online resources to contact Revenue as well as resources online that Revenue
provides such as Twitter and the YouTube channel.
31%
51%
12%
3% 2% 2%
0%
10%
20%
30%
40%
50%
60%
StronglyAgree
Agree SomewhatAgree
SomewhatDisagree
Disagree StronglyDisagree
2%
4%
14%
14%
20%
45%
0% 10% 20% 30% 40% 50%
Not enough services or options available
Cannot access the service on my device
Registered for PAYE Anytime but I have lost
my PIN
Have concerns about submitting personaldetails over internet
Do not use the internet
Not registered for PAYE Anytime
April 2016
29 Statistics & Economic Research Branch
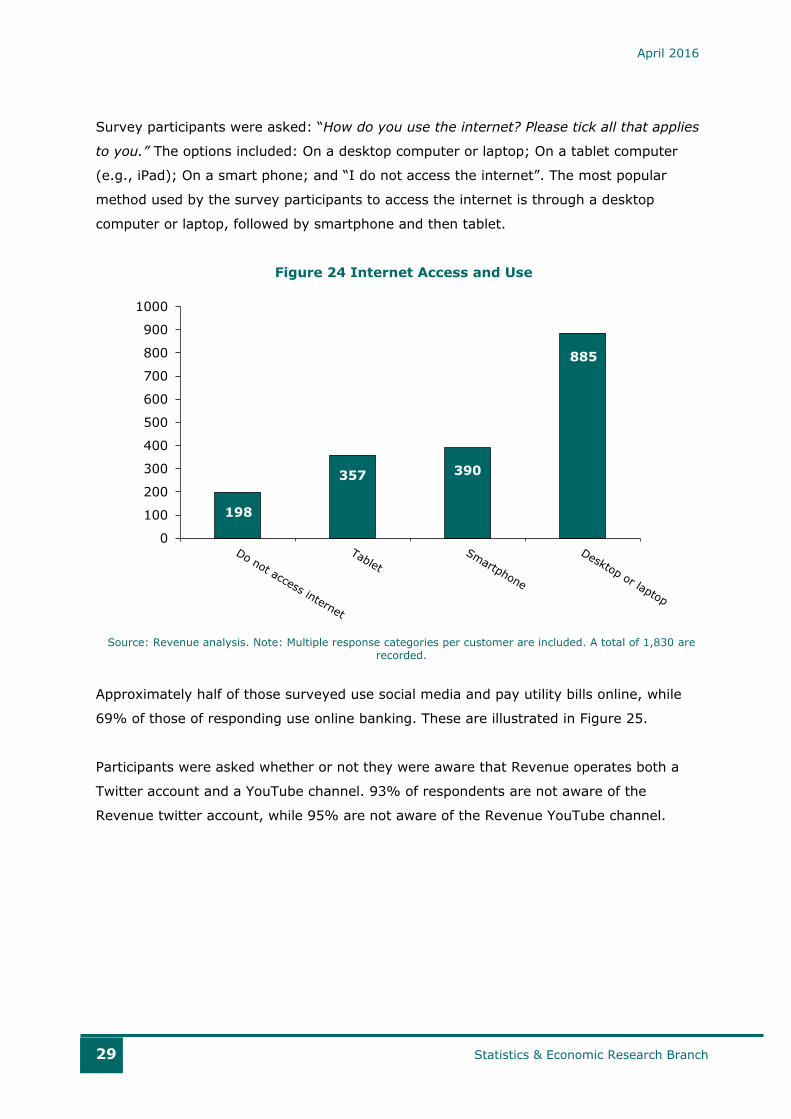
Survey participants were asked: “How do you use the internet? Please tick all that applies
to you.” The options included: On a desktop computer or laptop; On a tablet computer
(e.g., iPad); On a smart phone; and “I do not access the internet”. The most popular
method used by the survey participants to access the internet is through a desktop
computer or laptop, followed by smartphone and then tablet.
Figure 24 Internet Access and Use
Source: Revenue analysis. Note: Multiple response categories per customer are included. A total of 1,830 are
recorded.
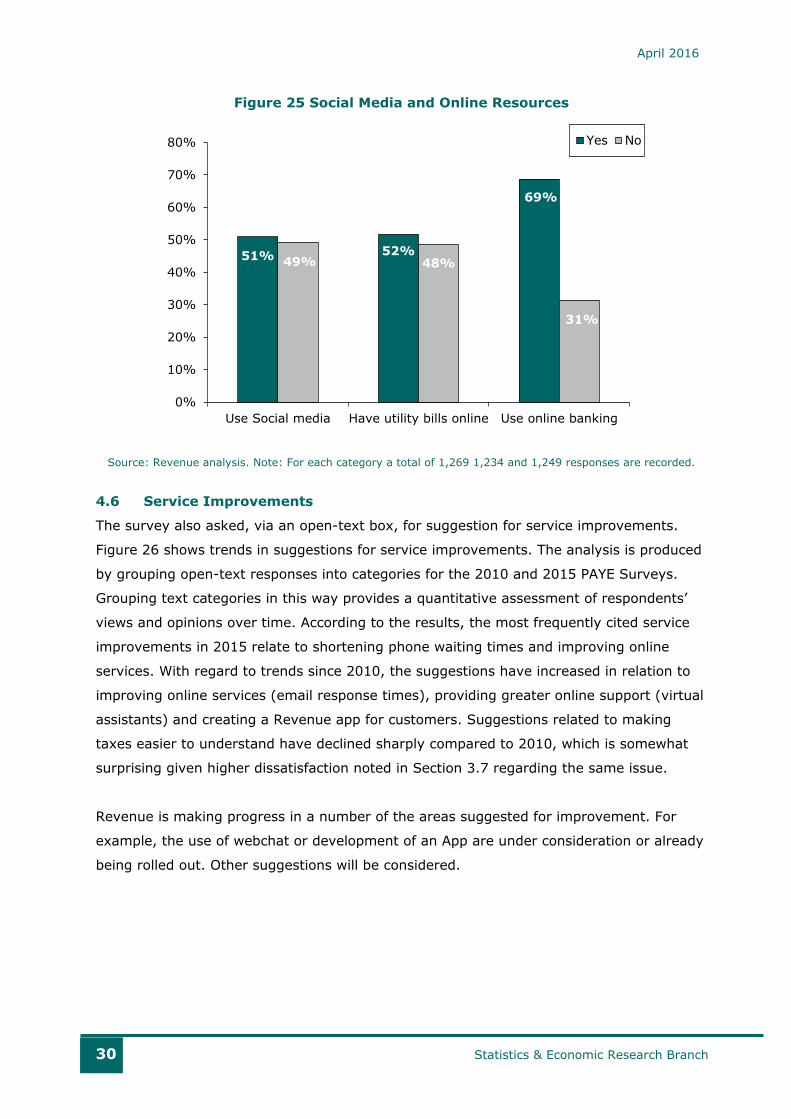
Approximately half of those surveyed use social media and pay utility bills online, while
69% of those of responding use online banking. These are illustrated in Figure 25.
Participants were asked whether or not they were aware that Revenue operates both a
Twitter account and a YouTube channel. 93% of respondents are not aware of the
Revenue twitter account, while 95% are not aware of the Revenue YouTube channel.
198
357 390
885
0
100
200
300
400
500
600
700
800
900
1000
April 2016
30 Statistics & Economic Research Branch
Figure 25 Social Media and Online Resources
Source: Revenue analysis. Note: For each category a total of 1,269 1,234 and 1,249 responses are recorded.
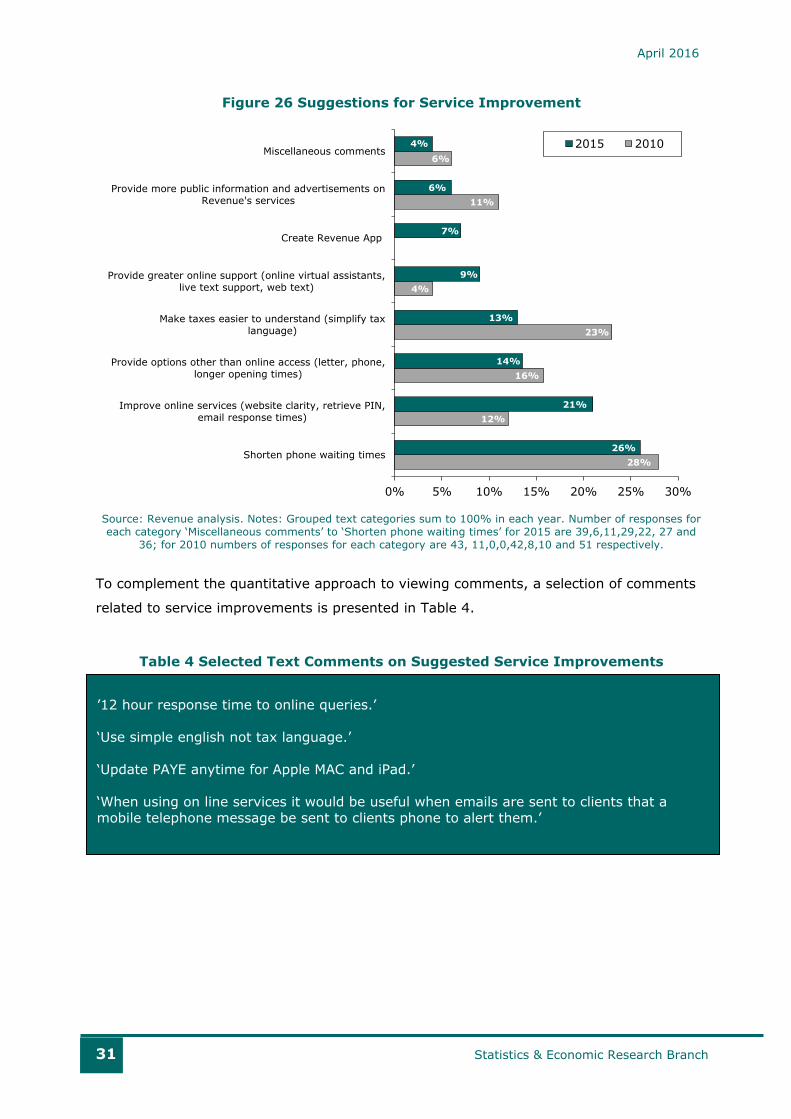
4.6 Service Improvements
The survey also asked, via an open-text box, for suggestion for service improvements.
Figure 26 shows trends in suggestions for service improvements. The analysis is produced
by grouping open-text responses into categories for the 2010 and 2015 PAYE Surveys.
Grouping text categories in this way provides a quantitative assessment of respondents’
views and opinions over time. According to the results, the most frequently cited service
improvements in 2015 relate to shortening phone waiting times and improving online
services. With regard to trends since 2010, the suggestions have increased in relation to
improving online services (email response times), providing greater online support (virtual
assistants) and creating a Revenue app for customers. Suggestions related to making
taxes easier to understand have declined sharply compared to 2010, which is somewhat
surprising given higher dissatisfaction noted in Section 3.7 regarding the same issue.
Revenue is making progress in a number of the areas suggested for improvement. For
example, the use of webchat or development of an App are under consideration or already
being rolled out. Other suggestions will be considered.
51% 52%
69%
49% 48%
31%
0%
10%
20%
30%
40%
50%
60%
70%
80%
Use Social media Have utility bills online Use online banking
Yes No
April 2016
31 Statistics & Economic Research Branch
Figure 26 Suggestions for Service Improvement
Source: Revenue analysis. Notes: Grouped text categories sum to 100% in each year. Number of responses for
each category ‘Miscellaneous comments’ to ‘Shorten phone waiting times’ for 2015 are 39,6,11,29,22, 27 and
36; for 2010 numbers of responses for each category are 43, 11,0,0,42,8,10 and 51 respectively.
To complement the quantitative approach to viewing comments, a selection of comments
related to service improvements is presented in Table 4.
Table 4 Selected Text Comments on Suggested Service Improvements
28%
12%
16%
23%
4%
0%
11%
6%
26%
21%
14%
13%
9%
7%
6%
4%
0% 5% 10% 15% 20% 25% 30%
Shorten phone waiting times
Improve online services (website clarity, retrieve PIN,
email response times)
Provide options other than online access (letter, phone,
longer opening times)
Make taxes easier to understand (simplify tax
language)
Provide greater online support (online virtual assistants,
live text support, web text)
Create Revenue App
Provide more public information and advertisements on
Revenue's services
Miscellaneous comments2015 2010
’12 hour response time to online queries.’
‘Use simple english not tax language.’
‘Update PAYE anytime for Apple MAC and iPad.’
‘When using on line services it would be useful when emails are sent to clients that a mobile telephone message be sent to clients phone to alert them.’
April 2016
32 Statistics & Economic Research Branch
5 Using Personalisation to Improve Response Rates
5.1 Introduction
As part of the survey issue, a randomised control trial (RCT) was conducted to test the
impact of personalisation on response rates. Previous research by Revenue (SME Survey
2013) has shown that response rates to surveys can be significantly enhanced if surveys
are accompanied by a personalised note.13
In this survey, 500 respondents were randomly selected to receive a personalised
salutation (for example, ‘Dear Mr. O’Connor’) in their cover letter. The remaining 4,500
taxpayers received the standard salutation, ‘Dear Customer’.14 Statistical testing was
undertaken post randomisation to ensure that the distribution of characteristics across the
groups is not statistically different.
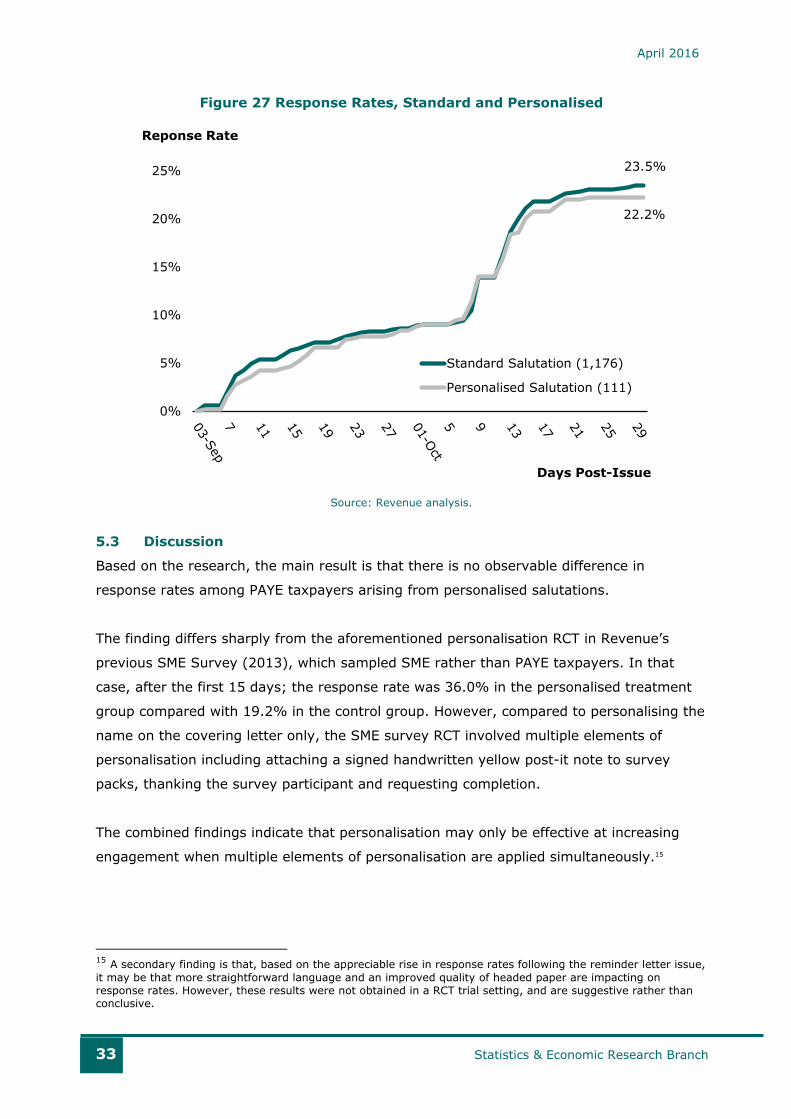
5.2 Results
Figure 27 shows the postal response rates by day starting 1st September. According to the
results, there is no statistically significant difference observed in response rates between
the two groups. The response rate is almost identical over the period.
The most striking impact on response rates is the reminder letter issued on the 30th
September, which dramatically increased response rates. This resulted, at least in part,
due to a number of important changes made to the letter following the relatively low initial
response rate. These included drafting a more straightforward letter and issuing the letter
on better quality headed paper.
13 Available here: http://www.revenue.ie/en/about/publications/survey-reports.html. 14 As reminder letters issued to customers who had not responded to the initial invitation to complete the survey,
anyone who had received a personalised initial letter also received a personalised reminder letter.
April 2016
33 Statistics & Economic Research Branch
Figure 27 Response Rates, Standard and Personalised
Source: Revenue analysis.
5.3 Discussion
Based on the research, the main result is that there is no observable difference in
response rates among PAYE taxpayers arising from personalised salutations.
The finding differs sharply from the aforementioned personalisation RCT in Revenue’s
previous SME Survey (2013), which sampled SME rather than PAYE taxpayers. In that
case, after the first 15 days; the response rate was 36.0% in the personalised treatment
group compared with 19.2% in the control group. However, compared to personalising the
name on the covering letter only, the SME survey RCT involved multiple elements of
personalisation including attaching a signed handwritten yellow post-it note to survey
packs, thanking the survey participant and requesting completion.
The combined findings indicate that personalisation may only be effective at increasing
engagement when multiple elements of personalisation are applied simultaneously.15
15 A secondary finding is that, based on the appreciable rise in response rates following the reminder letter issue,
it may be that more straightforward language and an improved quality of headed paper are impacting on
response rates. However, these results were not obtained in a RCT trial setting, and are suggestive rather than
conclusive.
23.5%
22.2%
0%
5%
10%
15%
20%
25%
Standard Salutation (1,176)
Personalised Salutation (111)
Reponse Rate
Days Post-Issue
April 2016
34 Statistics & Economic Research Branch
6 Cluster Analysis
6.1 Introduction
This section presents the results of an initial cluster analysis. The analysis provides a view
of the PAYE population based on statistical classification techniques. It allows for links
between multiple responses and provides identifiable taxpayer segments, which can be
used to better target customer service, such as marketing and education campaigns.
Broadly, cluster analysis can assist Revenue in answering questions like: who to help, who
to thank, who to educate, who to reassure and who to target.
6.2 Methodology
Cluster analysis is an unsupervised segmentation technique that seeks to identify and
classify groupings of cases which have relatively homogenous features within groups but
which are relatively heterogeneous between groups. The cases in one group are ‘closer’ to
each other than they are to the cases in other groups, where closeness is measured
depending on the techniques used.
The results represent an unsupervised natural characterisation of the responses to the
survey using a number of discriminatory factors were used including the taxpayers age,
income, and gender and satisfaction levels with Revenue. For the purposes of the cluster
analysis, some missing values have been interpolated or dropped so the proportions may
not correspond to previous analysis in the report.
According to the analysis, six distinct clusters are identified from 1,168 taxpayers who,
while sharing similar properties, can be separated from the other segments by a number
of features.16
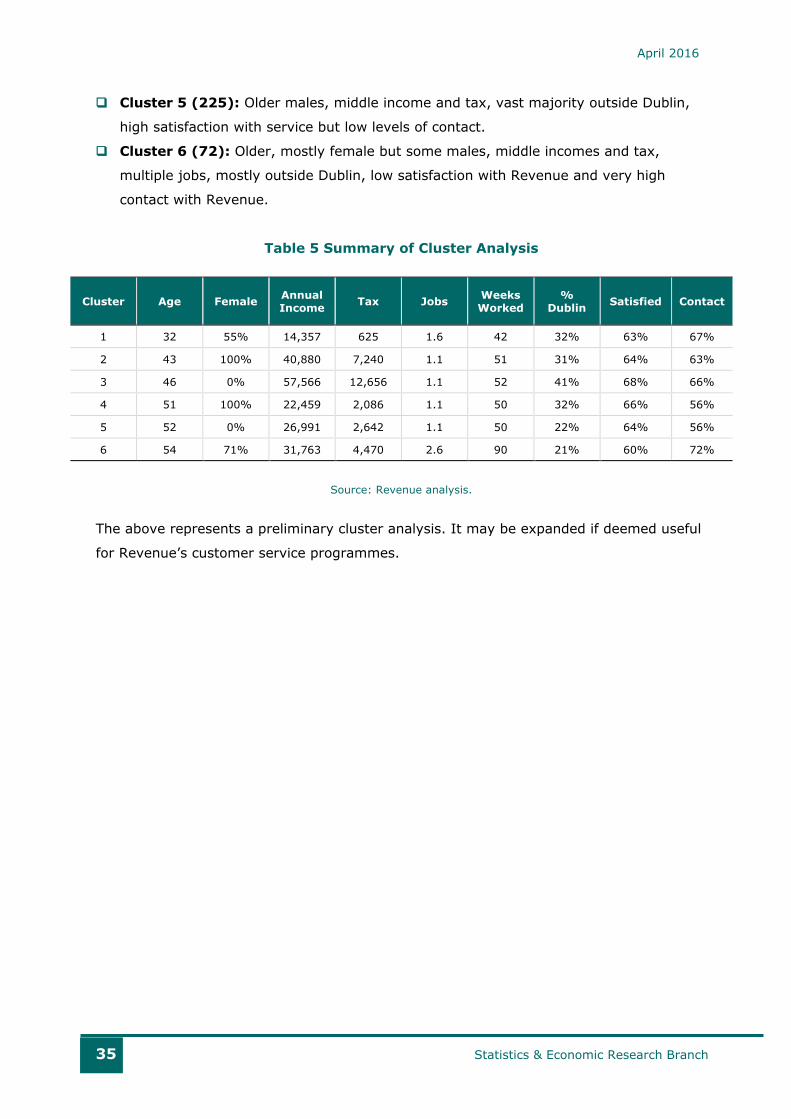
The clusters identified are as follows (number of taxpayers in each cluster in brackets):
Cluster 1 (149): Younger, evenly split by gender, low income and tax, part-time,
high contact with Revenue.
Cluster 2 (278): Middle-aged and female, high income and tax, full-time, moderate
satisfaction with Revenue.
Cluster 3 (194): Middle-aged and male, very high income and tax, full-time, mostly
in Dublin area, high satisfaction and high level of contact with Revenue
Cluster 4 (250): Older females, lower income and tax, mostly outside Dublin, high
satisfaction with service but low levels of contact.
16 Note that a case belonging to a particular segment may not display all the features of that segment
April 2016
35 Statistics & Economic Research Branch
Cluster 5 (225): Older males, middle income and tax, vast majority outside Dublin,
high satisfaction with service but low levels of contact.
Cluster 6 (72): Older, mostly female but some males, middle incomes and tax,
multiple jobs, mostly outside Dublin, low satisfaction with Revenue and very high
contact with Revenue.
Table 5 Summary of Cluster Analysis
Source: Revenue analysis.
The above represents a preliminary cluster analysis. It may be expanded if deemed useful
for Revenue’s customer service programmes.
Cluster Age Female Annual
Income Tax Jobs
Weeks
Worked
%
Dublin Satisfied Contact
1 32 55% 14,357 625 1.6 42 32% 63% 67%
2 43 100% 40,880 7,240 1.1 51 31% 64% 63%
3 46 0% 57,566 12,656 1.1 52 41% 68% 66%
4 51 100% 22,459 2,086 1.1 50 32% 66% 56%
5 52 0% 26,991 2,642 1.1 50 22% 64% 56%
6 54 71% 31,763 4,470 2.6 90 21% 60% 72%
April 2016
36 Statistics & Economic Research Branch
7 Conclusion
7.1 Summary and Discussion
Revenue is operating in an ever changing environment with evolving expectations from
our customers. This demands constant innovation to deliver further improvements in
customer service, with an emphasis on using the most effective business channels to
boost voluntary compliance, improve efficiency and enhance the customer experience.
Revenue places great value on the views of our customers. Further, understanding
taxpayer attitudes to Revenue and to taxation presents an important insight into their
compliance behaviour and their contacts with us. For these reasons, Revenue has
conducted a series of customer surveys over the last decade.
The responses to the PAYE 2015 survey show that Revenue’s customer service levels
remain strong and that our new initiatives are being positively received.
Satisfaction with Revenue among the PAYE taxpayer population remains high (91%) and
has been remarkably stable since 2007, despite dramatic changes in the economy over
the period. Other results, such as the 53% of respondents that agree or strongly agree
Revenue explains tax credits and entitlements in a way they can understand is up
compared to 41% for the same question in 2007. This suggests a significant improvement
communication with PAYE taxpayers over the period.
In previous surveys, 8 – 10% of dissatisfaction reported was associated with a lack of
knowledge of Revenue staff while 9 – 14% was associated with slow response rates. These
proportions have declined dramatically in 2015 to 4% and 2% respectively. The
proportions commenting that long wait times are causing dissatisfaction have also declined
from 33% in 2010 to 24% in 2015.
The survey results confirm that Revenue’s customer engagement strategy is on the right
path. The results are assisting Revenue in further designing and implementing a
programme of customer service that is both efficient to administer and that makes it as
easy as possible for taxpayers to comply with their obligations.
April 2016
37 Statistics & Economic Research Branch
7.2 Acknowledgements
Revenue would like to acknowledge and thank all those who responded to the survey,
without whom the survey would not have been possible. We would also like to thank
Revenue staff who provided invaluable input throughout the survey process. Ciaran Pringle
and Ken Monaghan, in the Communications team, provided expertise on survey design
and logistics, colleagues in the Revenue Print Centre, Cleo O’Beirne in ICTL Division
designed the online survey and Jonathan Grant and colleagues in Planning Division who
drafted the original survey questionnaire. We also thank all staff who volunteered to assist
with the data input.
April 2016
38 Statistics & Economic Research Branch
Appendix
Cover Letters
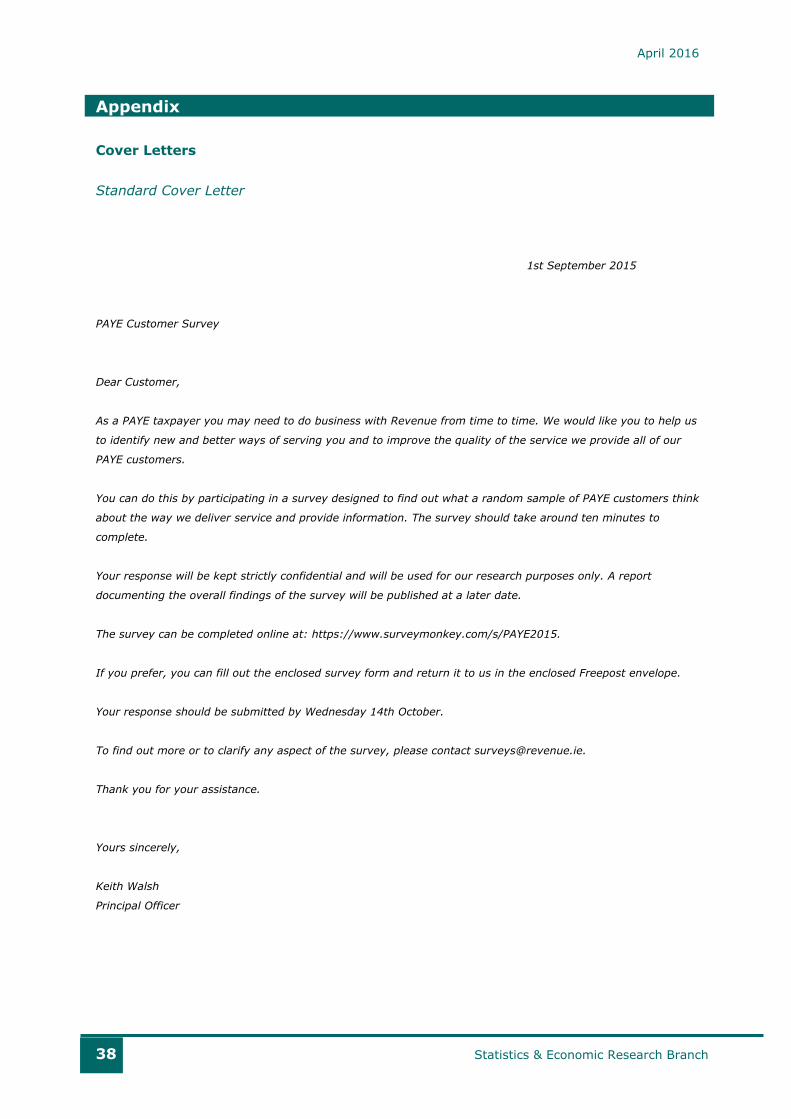
Standard Cover Letter
1st September 2015
PAYE Customer Survey
Dear Customer,
As a PAYE taxpayer you may need to do business with Revenue from time to time. We would like you to help us
to identify new and better ways of serving you and to improve the quality of the service we provide all of our
PAYE customers.
You can do this by participating in a survey designed to find out what a random sample of PAYE customers think
about the way we deliver service and provide information. The survey should take around ten minutes to
complete.
Your response will be kept strictly confidential and will be used for our research purposes only. A report
documenting the overall findings of the survey will be published at a later date.
The survey can be completed online at: https://www.surveymonkey.com/s/PAYE2015.
If you prefer, you can fill out the enclosed survey form and return it to us in the enclosed Freepost envelope.
Your response should be submitted by Wednesday 14th October.
To find out more or to clarify any aspect of the survey, please contact [email protected].
Thank you for your assistance.
Yours sincerely,
Keith Walsh
Principal Officer
April 2016
39 Statistics & Economic Research Branch
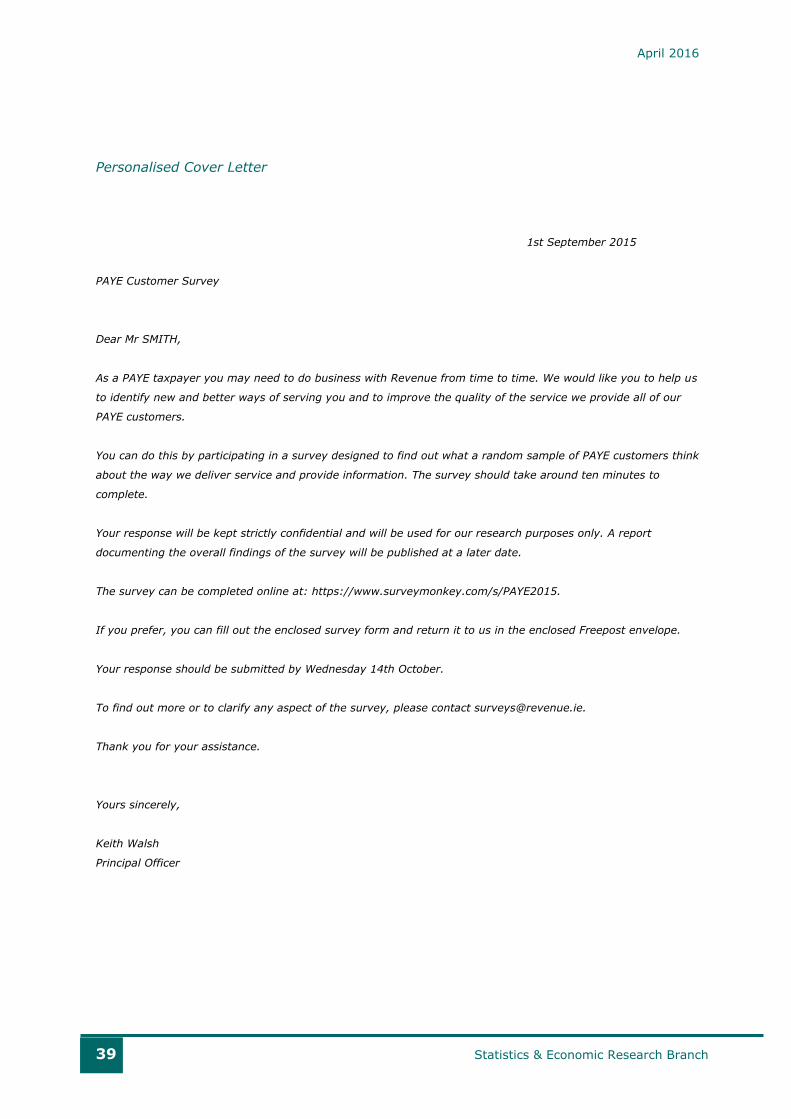
Personalised Cover Letter
1st September 2015
PAYE Customer Survey
Dear Mr SMITH,
As a PAYE taxpayer you may need to do business with Revenue from time to time. We would like you to help us
to identify new and better ways of serving you and to improve the quality of the service we provide all of our
PAYE customers.
You can do this by participating in a survey designed to find out what a random sample of PAYE customers think
about the way we deliver service and provide information. The survey should take around ten minutes to
complete.
Your response will be kept strictly confidential and will be used for our research purposes only. A report
documenting the overall findings of the survey will be published at a later date.
The survey can be completed online at: https://www.surveymonkey.com/s/PAYE2015.
If you prefer, you can fill out the enclosed survey form and return it to us in the enclosed Freepost envelope.
Your response should be submitted by Wednesday 14th October.
To find out more or to clarify any aspect of the survey, please contact [email protected].
Thank you for your assistance.
Yours sincerely,
Keith Walsh
Principal Officer
April 2016
40 Statistics & Economic Research Branch
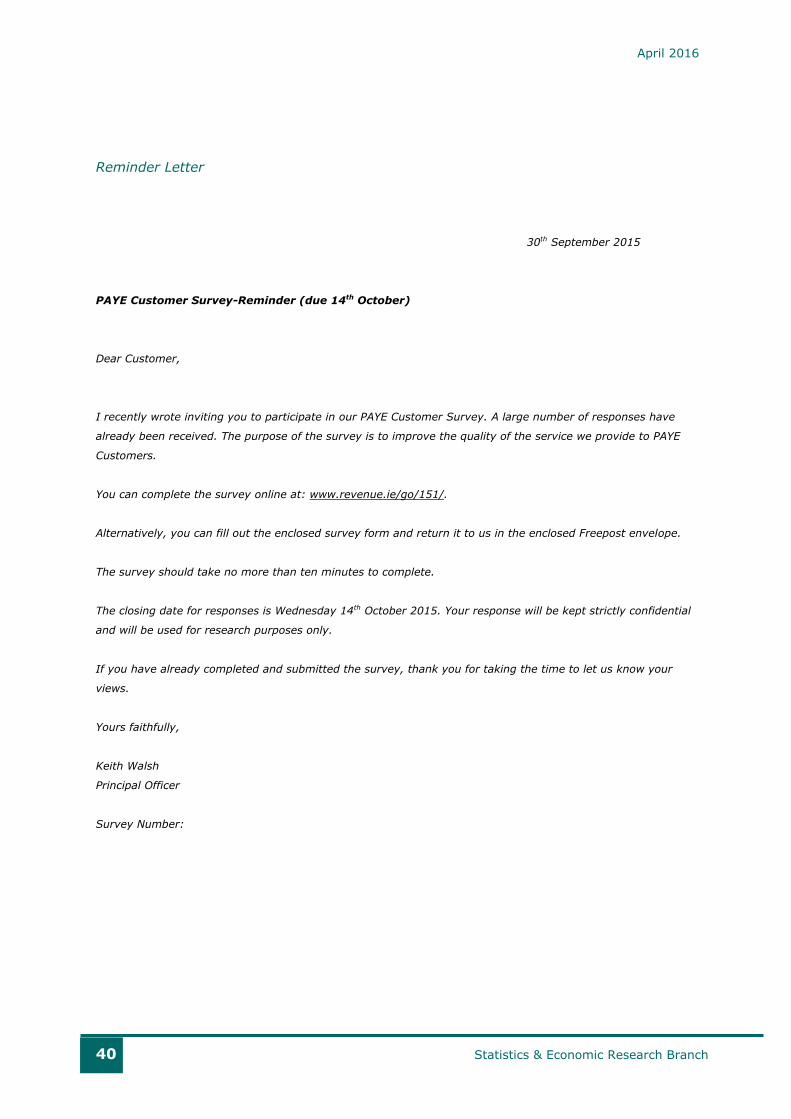
Reminder Letter
30th September 2015
PAYE Customer Survey-Reminder (due 14th October)
Dear Customer,
I recently wrote inviting you to participate in our PAYE Customer Survey. A large number of responses have
already been received. The purpose of the survey is to improve the quality of the service we provide to PAYE
Customers.
You can complete the survey online at: www.revenue.ie/go/151/.
Alternatively, you can fill out the enclosed survey form and return it to us in the enclosed Freepost envelope.
The survey should take no more than ten minutes to complete.
The closing date for responses is Wednesday 14th October 2015. Your response will be kept strictly confidential
and will be used for research purposes only.
If you have already completed and submitted the survey, thank you for taking the time to let us know your
views.
Yours faithfully,
Keith Walsh
Principal Officer
Survey Number:
April 2016
41 Statistics & Economic Research Branch
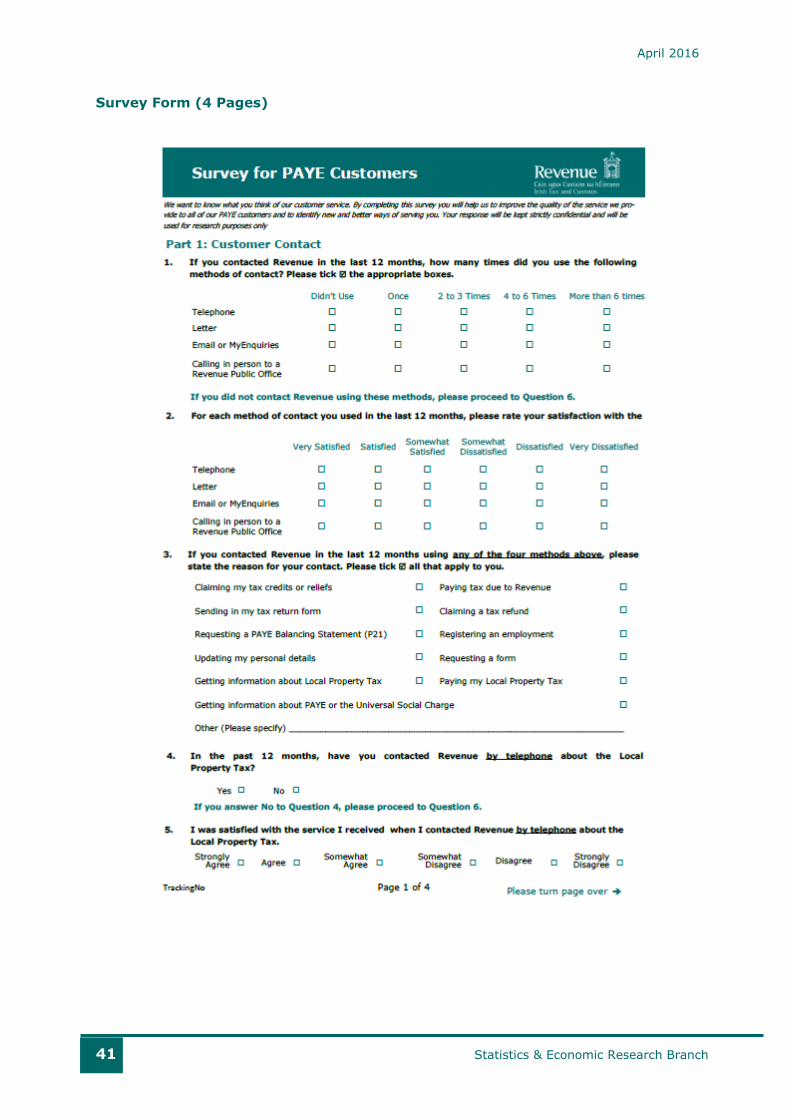
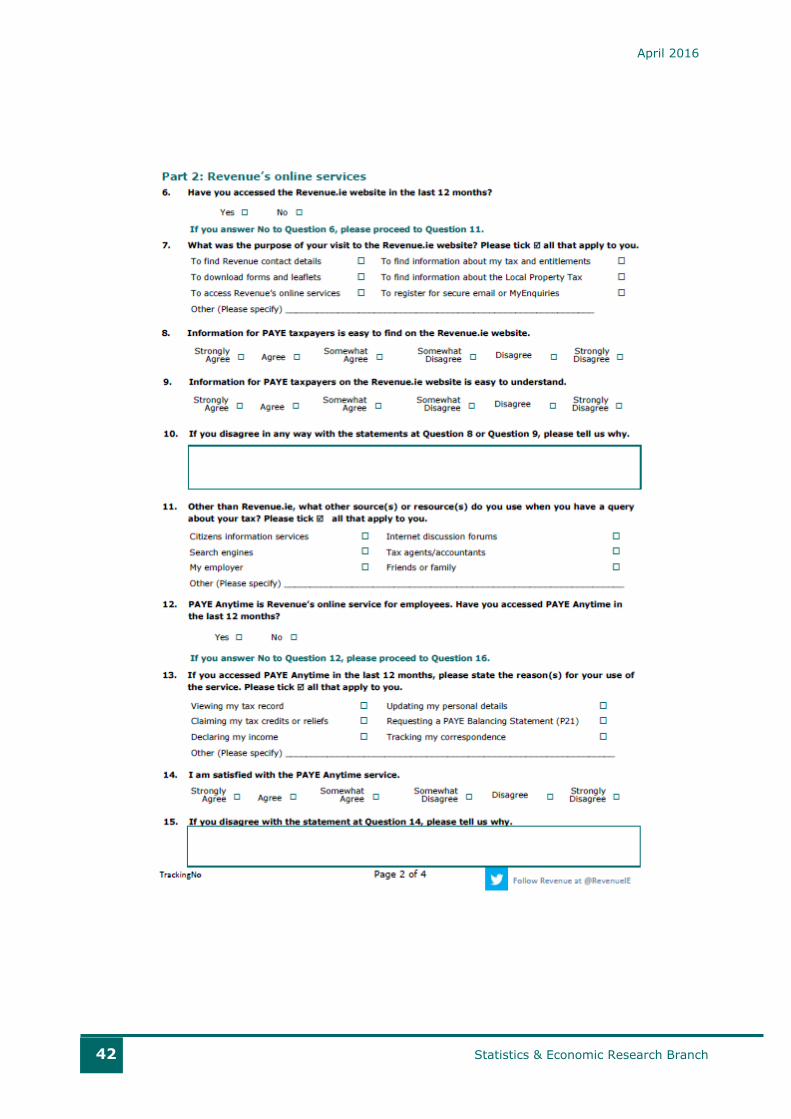
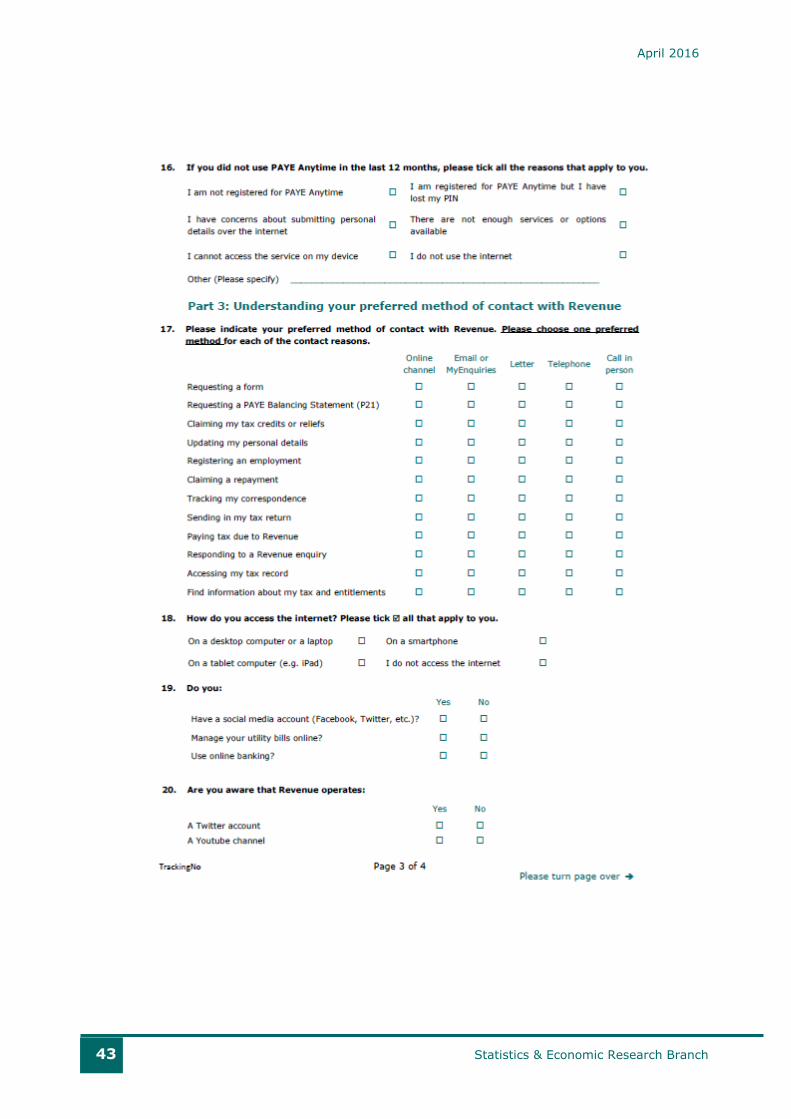
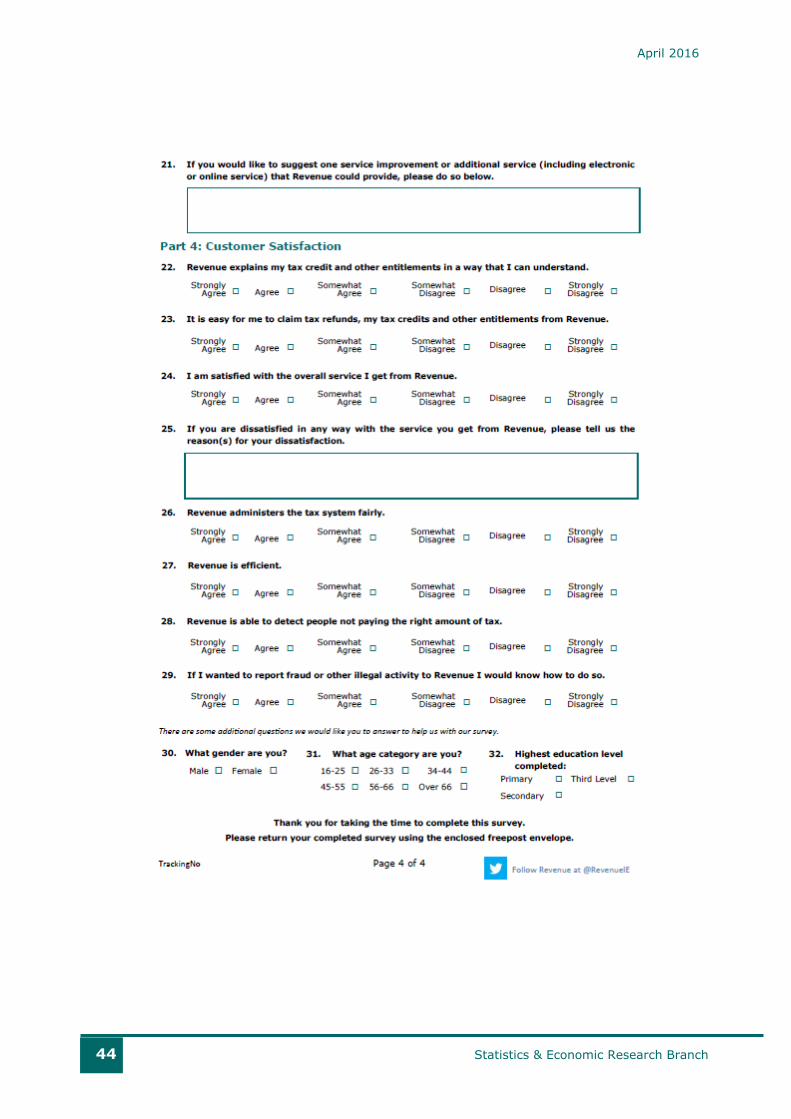
Survey Form (4 Pages)
April 2016
42 Statistics & Economic Research Branch
April 2016
43 Statistics & Economic Research Branch
April 2016
44 Statistics & Economic Research Branch