Embed Size (px)
Citation preview

Survey of NeedS & Provision 2010ServiceS for HomeleSS SiNgle PeoPle aNd couPleS iN eNglaNd
WWW.HomeleSS.org.uK/SNaP

1
Report Produced by Elizabeth Schertler Homeless Link Gateway House Milverton St London SE11 4AP © March 2010 Cover photos (Top left) Client from Stonham’s Hull Women’s Service; (bottom left and right) Clients from Faith Lodge, St Georges Crypt in Leeds. All photos © Robert Davidson

2
CONTENTS INTRODUCTION
6
THE SECTOR
10
Size of the Sector
10
Number of Bed Spaces
11
Rooms for Couples
12
Empty Beds
12
People using Day Centres
12
Staff Numbers and Staffing Methods
13
Funding
14
ORGANISATIONS
17
Top 3 Issues
17
Gaps in Service Provision
19
Client Involvement
21
Refusals and Local Connection
22
Evictions and Abandonments
24
Specialist Service Availability
25
Service Access Problems
30
INDIVIDUALS
32
Client Background 32
Client Links with Probation
34
Community Care Assessments
34
Targeted Service Provision
34
Client Issues
36
Client Outcomes
37
Client Move-On
37

3
CONTENTS CONTINUED Positive Outcomes
38
CONCLUSIONS
39
APPENDICES
41
LIST OF GRAPHS Graph 1 – Regional Breakdown of Sample
9
Graph 2 - % Increase in Service Availability 2008-2010
26
Graph 3 – Availability of Services
27
Graph 4 - Delivered In-House
29
Graph 5 - Delivered In-House in Partnership with and External Agency
29
Graph 6 - By Referral to External Service
29
Graph 7 – Targeted service provision
34
LIST OF TABLES Table 1 – Regional Breakdown of Sample
8
Table 2 – Number of Projects in the Survey
11
Table 3 – Bed Spaces by Room Type
11
Table 4 – Staff Numbers in Sample and Sector
13
Table 5 – Comparison of Annual Turnover 2009-2010
14
Table 6 – Primary Funding Stream of Projects
15
Table 7 – Current Funding Sources
16
Table 8 – Top Issue given by Projects
17
Table 9 – Biggest Gap in Service Provision
20
Table 10 – Reasons for Refusing Access by Project Type
23
Table 11 – Clients that are Evicted or Abandon their Accommodation
24
Table 12 – Reasons for Eviction
24
Table 13 – Number of Projects Providing Services 25
4
LIST OF TABLES CONTINUED Table 14 – Service Availability Comparison 2008-2010
26
Table 15 – Type of Service Delivery
28
Table 16 – Service Access Problems by Problem Type
30
Table 17 – Problems Accessing Services Comparison 2009-2010
31
Table 18 – Background of Clients Accessing Services Comparison 2008-2010
33
Table 19 – Client Issues Comparison 2008-2010
36
Table 20 – Client Move-On Comparison 2009-2010
37
Table 21 – Positive Move-On for Clients
38
Table 22 – Staffing Levels in Day Centres
42
Table 23 – Staffing Levels in Direct Access Hostels
42
Table 24 – Staffing Levels in 2nd Stage Accommodation Projects
42
Table 25 – Primary Funding Stream Comparison 2008-2010
42
Table 26 – Complete Service Availability Comparison 2008-2010
43
Table 27 – Service Access Problems Comparison 2009-2010
44
Table 28 – Client Background
45
Table 29 – Client Issues
46
Table 30 – Client Move-On
47

5
ACKNOWLEDGEMENTS Homeless Link would like to thank all the project managers who took the time to complete the telephone survey for both the pilot and the main survey. Without their willingness to give their time and information, this survey and therefore the data this report is primarily based on would not have been possible. Secondly we would like to thank Jonathan Mulligan and colleagues at Vision Twentyone who conducted the telephone survey for us and provided us with valuable advice throughout the survey process. Lastly, we would like to thank all Homeless Link staff who gave invaluable support to this report, by providing data from the Homeless UK database and sharing their expertise to put the survey findings into a wider context.
6
INTRODUCTION BACKGROUND TO SURVEY Major progress has been made in tackling homelessness over the past two decades. Successive governments have given priority to the issue and developed strategies and initiatives to address it. Partnership working with local authorities and the voluntary sector has ensured that change has happened on the ground. The homelessness sector has come on in leaps and bounds since the late 1980s and early 1990s and is working with the most socially excluded to motivate and support them into moving on to lead fulfilling lives. The challenge for the next decade is to build on this progress and for the next government, local authorities, the voluntary sector and homeless people themselves to work together to end all forms of homelessness once and for all. A fundamental cornerstone for ending homelessness and rough sleeping is the Places of Change programme and approach. This encapsulates the ethos and approach of the sector in the 21st century. It provides welcoming, high quality-buildings; motivated staff, empowering services and the involvement of the people using the service. This, combined with the recent ending rough sleeping by 2012 target, places us in an ideal position to succeed in our challenge of ending homelessness. The Survey of Needs and Provision (SNAP) provides us with the facts and figures to chart the changes happening to the sector, organisations and to individuals becoming homeless. Homeless Link published the first SNAP in February 2008, followed by the second in 2009. This 2010 report provides an updated picture of the extent and nature of specific services for single homeless people and couples without dependent children in England, and the clients that use them. The report is based on the findings of a telephone survey of homelessness provider organisations conducted on behalf of Homeless Link in November and December 2009 and on information taken from the Homeless UK (HUK) database. This year, the findings have been condensed to provide this summary report. WHAT CAN THE SURVEY DO FOR YOU? SNAP allows service providers, local authorities, commissioners and policy makers to see where services fit into the national picture. It provides key evidence on the characteristics of homeless people and their service needs. Information in SNAP can be used in the following ways: • As supporting evidence in proposals for service provision • To inform strategies for homelessness policy and services • To help determine decisions about awards of contracts for service provision • To complement other evidence as to the needs and background of homeless people • To begin to benchmark your service against wider provision. SCOPE SNAP covers homelessness services in England provided to single homeless people and couples without dependent children. Services for families were excluded from the analysis. The report covers three types of services – day centres, direct access hostels and second stage accommodation projects. Services primarily listed according to other definitions, such as advice agencies, were not included. It does not cover outreach services or floating support. Day centres provide services primarily for single people and couples who are homeless, insecurely housed or in temporary accommodation. Alongside food, drink and practical help,
7
these projects often provide support and advice services around substance misuse, housing, mental health, health, employment and education. Direct Access Hostels are projects that are open all year round for single homeless people and couples without dependent children, who are rough sleepers or in immediate or emergency need of accommodation. These usually accommodate people on a short-term basis. Second stage accommodation projects provide longer-term accommodation for homeless people, often to people moving on from direct access hostels. Where a project provides more than one type of service, for example where a building managed by an organisation contains a day centre and a hostel, questions have been asked about one type of service only. In addition, where a project did not agree with the category they were listed as under HUK, the survey has been completed using the respondent’s self-definition of the project. DATA The data source for all tables and charts in this report derives from the Homeless Link telephone survey, unless otherwise stated. Telephone Survey This year’s telephone survey is similar to the previous two years’ surveys although the wording of some questions has been improved, a few questions have been added, and some questions have been removed. In addition, it was possible to complete a pilot survey with 50 projects to refine the wording of questions as well as answer options available to survey respondents. This year, 500 projects were surveyed, representing almost a third of applicable projects on the HUK database. The survey was conducted on behalf of Homeless Link by a private research company, Vision Twentyone. The survey took approximately 50 minutes to complete per respondent. Homeless UK data This data source was established in 2005 by Resource Information Service (RIS) funded by CLG. RIS, which researches and publishes information about homelessness and other services to improve referrals and access to provision, has now merged with Homeless Link. Homeless UK data is classified according to service type and covers some services that are not exclusively for homeless people (e.g. Citizens Advice Bureaux). This report uses data on day centres, direct access hostels and second stage accommodation. Projects are defined by their referral route, so sometimes one project may have more than one geographical location (i.e. a series of shared houses with one central referral system). Big organisations (e.g. Salvation Army) are likely to have a number of projects. The data on day centres and direct access hostels on Homeless UK has been researched and built up over many years. Coverage checking helps ensure that data is as comprehensive as possible, subject to inevitable issues around boundaries relating to varying definitions of services. Data on second stage accommodation on Homeless UK is particularly subject to varying definitions and boundary issues (eg projects that serve both homeless people and other client groups). SURVEY METHOD The sample Using the November 2009 HUK data as the population, a sample of 500 services was selected. The proportion of day centres, direct access hostels and second stage accommodation projects interviewed was the same as the proportions in the HUK-based population. The sample was selected at random from the HUK database. When projects were contacted, the hostel or project manager was asked to complete the survey, rather than chief executives
8
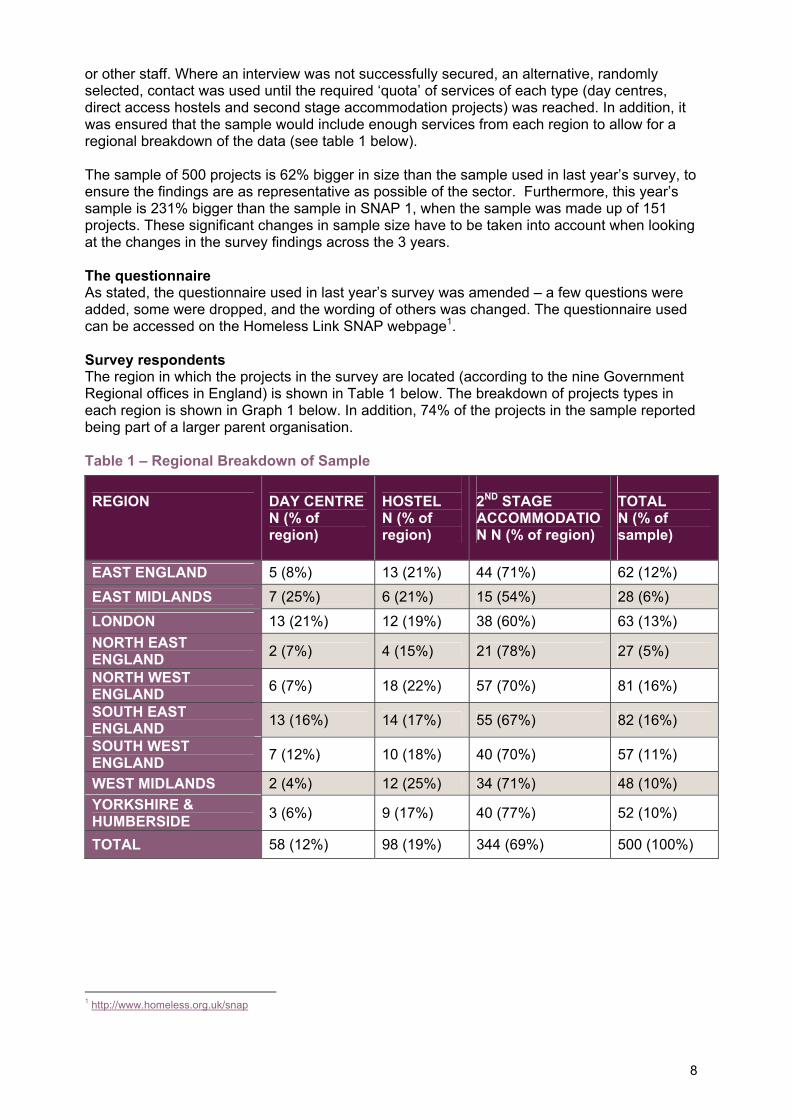
or other staff. Where an interview was not successfully secured, an alternative, randomly selected, contact was used until the required ‘quota’ of services of each type (day centres, direct access hostels and second stage accommodation projects) was reached. In addition, it was ensured that the sample would include enough services from each region to allow for a regional breakdown of the data (see table 1 below). The sample of 500 projects is 62% bigger in size than the sample used in last year’s survey, to ensure the findings are as representative as possible of the sector. Furthermore, this year’s sample is 231% bigger than the sample in SNAP 1, when the sample was made up of 151 projects. These significant changes in sample size have to be taken into account when looking at the changes in the survey findings across the 3 years. The questionnaire As stated, the questionnaire used in last year’s survey was amended – a few questions were added, some were dropped, and the wording of others was changed. The questionnaire used can be accessed on the Homeless Link SNAP webpage1. Survey respondents The region in which the projects in the survey are located (according to the nine Government Regional offices in England) is shown in Table 1 below. The breakdown of projects types in each region is shown in Graph 1 below. In addition, 74% of the projects in the sample reported being part of a larger parent organisation. Table 1 – Regional Breakdown of Sample
1 http://www.homeless.org.uk/snap
REGION
DAY CENTRE N (% of region)
HOSTEL N (% of region)
2ND STAGE ACCOMMODATION N (% of region)
TOTAL N (% of sample)
EAST ENGLAND 5 (8%) 13 (21%) 44 (71%) 62 (12%)
EAST MIDLANDS 7 (25%) 6 (21%) 15 (54%) 28 (6%)
LONDON 13 (21%) 12 (19%) 38 (60%) 63 (13%) NORTH EAST ENGLAND 2 (7%) 4 (15%) 21 (78%) 27 (5%)
NORTH WEST ENGLAND 6 (7%) 18 (22%) 57 (70%) 81 (16%)
SOUTH EAST ENGLAND 13 (16%) 14 (17%) 55 (67%) 82 (16%)
SOUTH WEST ENGLAND 7 (12%) 10 (18%) 40 (70%) 57 (11%)
WEST MIDLANDS 2 (4%) 12 (25%) 34 (71%) 48 (10%) YORKSHIRE & HUMBERSIDE 3 (6%) 9 (17%) 40 (77%) 52 (10%)
TOTAL 58 (12%) 98 (19%) 344 (69%) 500 (100%)

9
Graph 1 – Regional breakdown of Sample
0%
2%
4%
6%
8%
10%
12%
14%
16%
18%
EAST ENGLAND
EAST MID
LANDS
LONDON
NORTH EAST OF ENGLAND
NORTH WEST ENGLAND
SOUTH EAST ENGLAND
SOUTH WEST ENGLAND
WEST MID
LANDS
YORKSHIRE & H
UMBERSIDE
Region
% o
f Sam
ple
Sample Breakdown
10
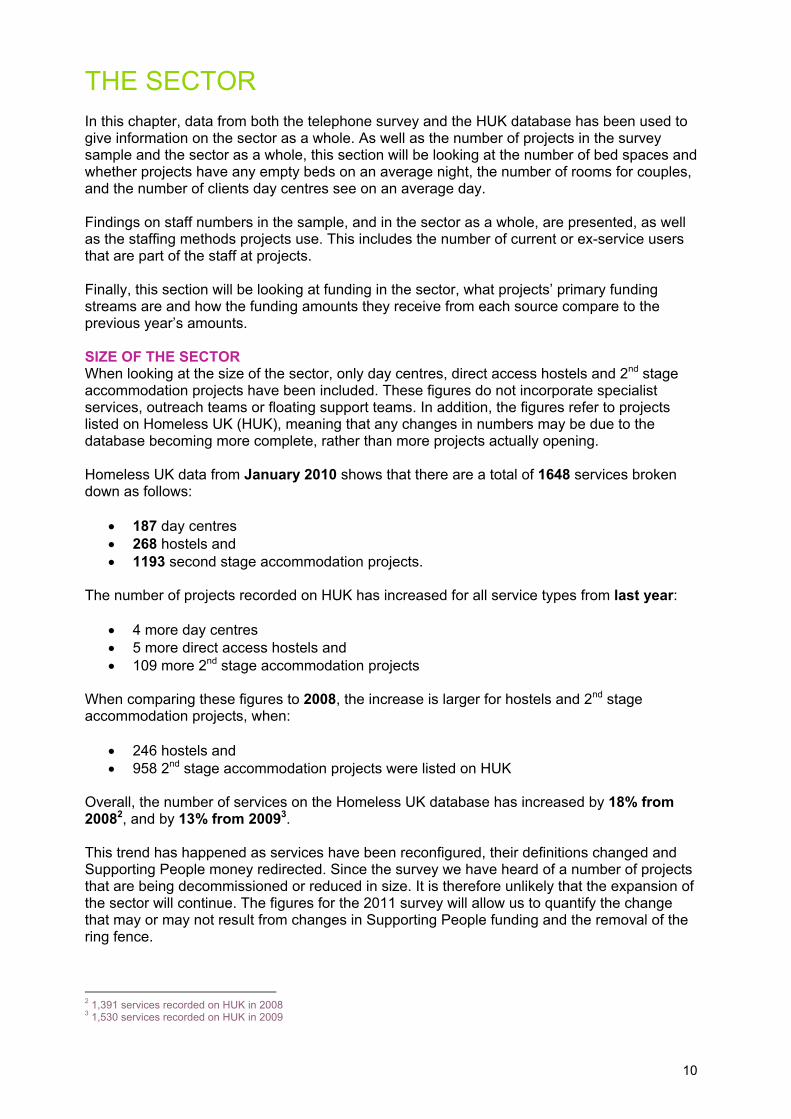
THE SECTOR In this chapter, data from both the telephone survey and the HUK database has been used to give information on the sector as a whole. As well as the number of projects in the survey sample and the sector as a whole, this section will be looking at the number of bed spaces and whether projects have any empty beds on an average night, the number of rooms for couples, and the number of clients day centres see on an average day. Findings on staff numbers in the sample, and in the sector as a whole, are presented, as well as the staffing methods projects use. This includes the number of current or ex-service users that are part of the staff at projects. Finally, this section will be looking at funding in the sector, what projects’ primary funding streams are and how the funding amounts they receive from each source compare to the previous year’s amounts. SIZE OF THE SECTOR When looking at the size of the sector, only day centres, direct access hostels and 2nd stage accommodation projects have been included. These figures do not incorporate specialist services, outreach teams or floating support teams. In addition, the figures refer to projects listed on Homeless UK (HUK), meaning that any changes in numbers may be due to the database becoming more complete, rather than more projects actually opening. Homeless UK data from January 2010 shows that there are a total of 1648 services broken down as follows:
• 187 day centres • 268 hostels and • 1193 second stage accommodation projects.
The number of projects recorded on HUK has increased for all service types from last year:
• 4 more day centres • 5 more direct access hostels and • 109 more 2nd stage accommodation projects
When comparing these figures to 2008, the increase is larger for hostels and 2nd stage accommodation projects, when:
• 246 hostels and • 958 2nd stage accommodation projects were listed on HUK
Overall, the number of services on the Homeless UK database has increased by 18% from 20082, and by 13% from 20093. This trend has happened as services have been reconfigured, their definitions changed and Supporting People money redirected. Since the survey we have heard of a number of projects that are being decommissioned or reduced in size. It is therefore unlikely that the expansion of the sector will continue. The figures for the 2011 survey will allow us to quantify the change that may or may not result from changes in Supporting People funding and the removal of the ring fence.
2 1,391 services recorded on HUK in 2008 3 1,530 services recorded on HUK in 2009
11
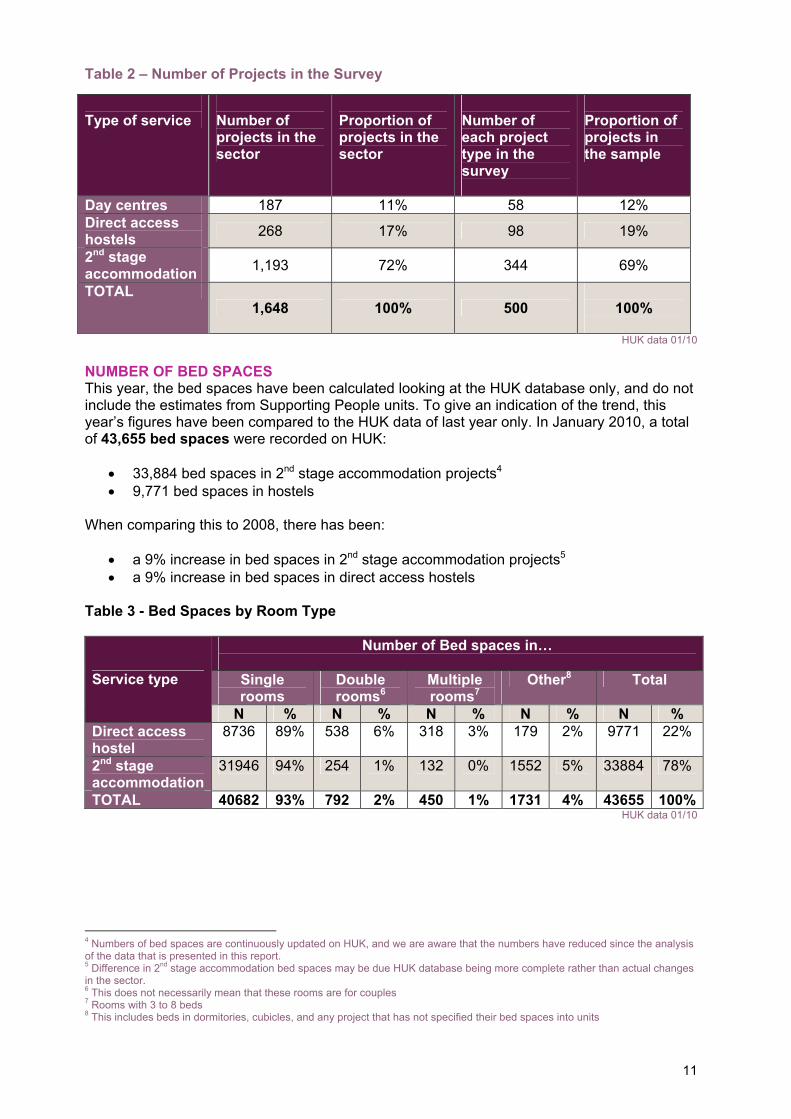
Table 2 – Number of Projects in the Survey Type of service
Number of projects in the sector
Proportion of projects in the sector
Number of each project type in the survey
Proportion of projects in the sample
Day centres 187 11% 58 12% Direct access hostels 268 17% 98 19%
2nd stage accommodation 1,193 72% 344 69%
TOTAL 1,648 100% 500
100%
HUK data 01/10
NUMBER OF BED SPACES This year, the bed spaces have been calculated looking at the HUK database only, and do not include the estimates from Supporting People units. To give an indication of the trend, this year’s figures have been compared to the HUK data of last year only. In January 2010, a total of 43,655 bed spaces were recorded on HUK:
• 33,884 bed spaces in 2nd stage accommodation projects4 • 9,771 bed spaces in hostels
When comparing this to 2008, there has been:
• a 9% increase in bed spaces in 2nd stage accommodation projects5 • a 9% increase in bed spaces in direct access hostels
Table 3 - Bed Spaces by Room Type
Number of Bed spaces in…
Single rooms
Double rooms6
Multiple rooms7
Other8 Total Service type
N % N % N % N % N % Direct access hostel
8736 89% 538 6% 318 3% 179 2% 9771 22%
2nd stage accommodation
31946 94% 254 1% 132 0% 1552 5% 33884 78%
TOTAL 40682 93% 792 2% 450 1% 1731 4% 43655 100%HUK data 01/10
4 Numbers of bed spaces are continuously updated on HUK, and we are aware that the numbers have reduced since the analysis of the data that is presented in this report. 5 Difference in 2nd stage accommodation bed spaces may be due HUK database being more complete rather than actual changes in the sector. 6 This does not necessarily mean that these rooms are for couples 7 Rooms with 3 to 8 beds 8 This includes beds in dormitories, cubicles, and any project that has not specified their bed spaces into units

12
Compared to last year, the proportion of bed spaces in single rooms has9:
• remained constant for 2nd stage accommodation projects • but has increased for direct access hostels from 86% to 89%
ROOMS SPECIFICALLY FOR COUPLES As the HUK database could not tell us how many of the double rooms listed were specifically for couples, as opposed to two single individuals sharing, a new question was included in this year’s survey to provide us with some information on how many rooms specifically for couples are available. • Out of the 442 accommodation based services in the survey, 26 services (6%) have rooms
that are specifically for couples • These 26 services reported a total of 392 rooms for couples. The most common number of
rooms available to couples cited by respondents was 2, and the number of rooms reported as available ranged from 1 to 68. The project that reported having 68 rooms is in Yorkshire and Humberside.
These figures suggest that the options for couples who are homeless and/or rough sleeping are limited, especially when considering that the number of homeless couples is increasing10. The shortage of provision for couples was highlighted by one respondent from a 2nd stage accommodation project in South West England, when asked about the biggest gap in their area: ‘Services for couples are very inadequate. We are the only project that can take on couples and provide move on flats for couples.’ EMPTY BEDS In order to get a sense of how high demand for services is and also where there is spare capacity we asked projects whether they had empty beds on an average night. Caution should be taken in looking at these figures as some projects will have some specialist provision and so may have an empty bed whilst waiting for someone with the relevant support needs to be referred:
• 79% of accommodation based projects (349) have no empty beds on an average night • Of the 21% who do have empty beds (93) they reported in total 212 empty beds, with
the highest proportion of empty beds being in Yorkshire and Humberside, and the lowest in the North East of England
• The number of beds reported as empty ranged from 1 to 17 • The most commonly reported number of empty beds was 1 • Last year, 81% of projects reported never having empty beds, with those who do giving
answers ranging from 1 to 12. The findings suggest that there is limited spare capacity for those who find themselves newly homeless or sleeping on the streets. This corresponds with the reasons given for projects refusing someone where 33% of hostels and 18% of projects overall reported being unable to accept people due to being full. PEOPLE USING DAY CENTRES 58 day centres were interviewed in the survey and were asked how many people accessed their services on an average day. In total 3895 clients were estimated to be seen by day centres on an average day, giving an average of 67 per day per centre.
9 This year’s data on bed spaces in single rooms has been taken from the Homeless UK database and not by estimation from the telephone survey responses as was the case last year, meaning that this year’s figures are more accurate. 10 See section on Client Background
13
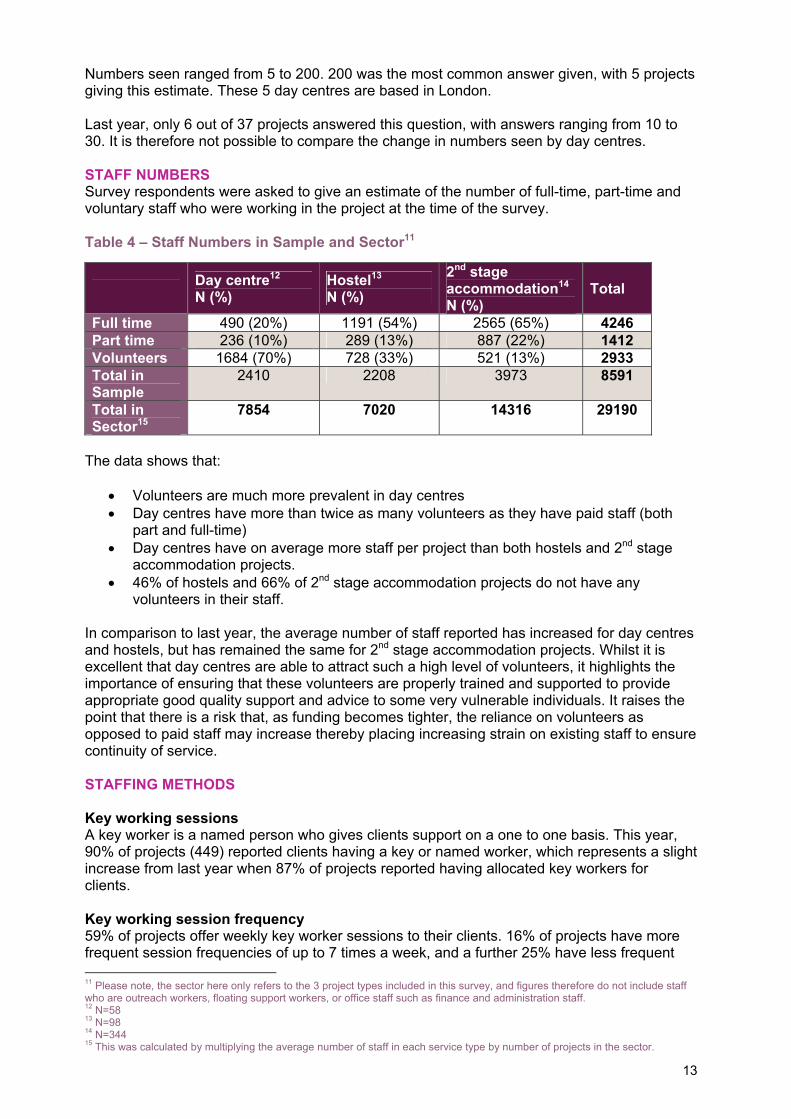
Numbers seen ranged from 5 to 200. 200 was the most common answer given, with 5 projects giving this estimate. These 5 day centres are based in London. Last year, only 6 out of 37 projects answered this question, with answers ranging from 10 to 30. It is therefore not possible to compare the change in numbers seen by day centres. STAFF NUMBERS Survey respondents were asked to give an estimate of the number of full-time, part-time and voluntary staff who were working in the project at the time of the survey. Table 4 – Staff Numbers in Sample and Sector11 Day centre12
N (%) Hostel13 N (%)
2nd stage accommodation14 N (%)
Total
Full time 490 (20%) 1191 (54%) 2565 (65%) 4246 Part time 236 (10%) 289 (13%) 887 (22%) 1412 Volunteers 1684 (70%) 728 (33%) 521 (13%) 2933 Total in Sample
2410 2208 3973 8591
Total in Sector15
7854 7020 14316 29190
The data shows that:
• Volunteers are much more prevalent in day centres • Day centres have more than twice as many volunteers as they have paid staff (both
part and full-time) • Day centres have on average more staff per project than both hostels and 2nd stage
accommodation projects. • 46% of hostels and 66% of 2nd stage accommodation projects do not have any
volunteers in their staff. In comparison to last year, the average number of staff reported has increased for day centres and hostels, but has remained the same for 2nd stage accommodation projects. Whilst it is excellent that day centres are able to attract such a high level of volunteers, it highlights the importance of ensuring that these volunteers are properly trained and supported to provide appropriate good quality support and advice to some very vulnerable individuals. It raises the point that there is a risk that, as funding becomes tighter, the reliance on volunteers as opposed to paid staff may increase thereby placing increasing strain on existing staff to ensure continuity of service. STAFFING METHODS Key working sessions A key worker is a named person who gives clients support on a one to one basis. This year, 90% of projects (449) reported clients having a key or named worker, which represents a slight increase from last year when 87% of projects reported having allocated key workers for clients. Key working session frequency 59% of projects offer weekly key worker sessions to their clients. 16% of projects have more frequent session frequencies of up to 7 times a week, and a further 25% have less frequent 11 Please note, the sector here only refers to the 3 project types included in this survey, and figures therefore do not include staff who are outreach workers, floating support workers, or office staff such as finance and administration staff. 12 N=58 13 N=98 14 N=344 15 This was calculated by multiplying the average number of staff in each service type by number of projects in the sector.
14
sessions, with fortnightly, monthly, or longer interval sessions. This has not changed from the previous year. CURRENT/EX-SERVICE USERS 53% of projects (267) actively try to recruit current or ex-service users as staff, and the data from this year’s survey shows that the proportion of such staff in projects has remained constant from the previous year:
• One third of projects report having current or ex-service users as volunteers or paid staff
• 7% of projects employ current service users • 33% of projects employ ex-service users
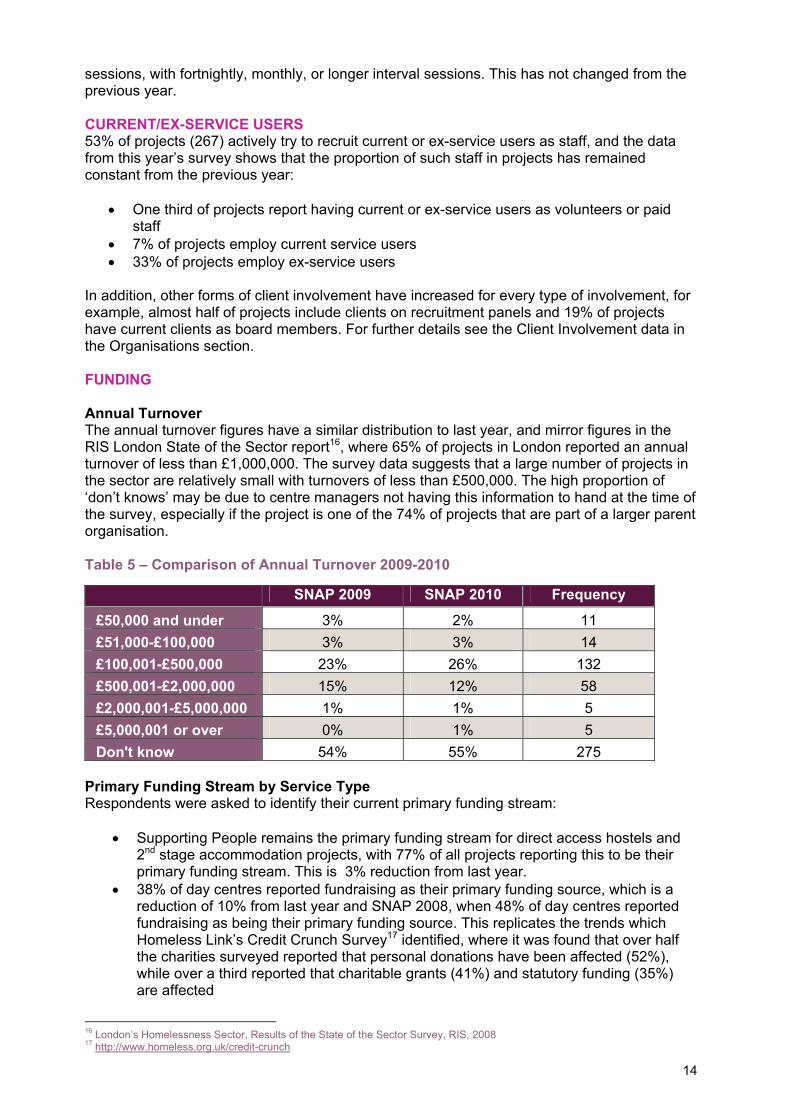
In addition, other forms of client involvement have increased for every type of involvement, for example, almost half of projects include clients on recruitment panels and 19% of projects have current clients as board members. For further details see the Client Involvement data in the Organisations section. FUNDING Annual Turnover The annual turnover figures have a similar distribution to last year, and mirror figures in the RIS London State of the Sector report16, where 65% of projects in London reported an annual turnover of less than £1,000,000. The survey data suggests that a large number of projects in the sector are relatively small with turnovers of less than £500,000. The high proportion of ‘don’t knows’ may be due to centre managers not having this information to hand at the time of the survey, especially if the project is one of the 74% of projects that are part of a larger parent organisation. Table 5 – Comparison of Annual Turnover 2009-2010 SNAP 2009 SNAP 2010 Frequency
£50,000 and under 3% 2% 11 £51,000-£100,000 3% 3% 14 £100,001-£500,000 23% 26% 132 £500,001-£2,000,000 15% 12% 58 £2,000,001-£5,000,000 1% 1% 5 £5,000,001 or over 0% 1% 5 Don't know 54% 55% 275
Primary Funding Stream by Service Type Respondents were asked to identify their current primary funding stream:
• Supporting People remains the primary funding stream for direct access hostels and 2nd stage accommodation projects, with 77% of all projects reporting this to be their primary funding stream. This is 3% reduction from last year.
• 38% of day centres reported fundraising as their primary funding source, which is a reduction of 10% from last year and SNAP 2008, when 48% of day centres reported fundraising as being their primary funding source. This replicates the trends which Homeless Link’s Credit Crunch Survey17 identified, where it was found that over half the charities surveyed reported that personal donations have been affected (52%), while over a third reported that charitable grants (41%) and statutory funding (35%) are affected
16 London’s Homelessness Sector, Results of the State of the Sector Survey, RIS, 2008 17 http://www.homeless.org.uk/credit-crunch
15
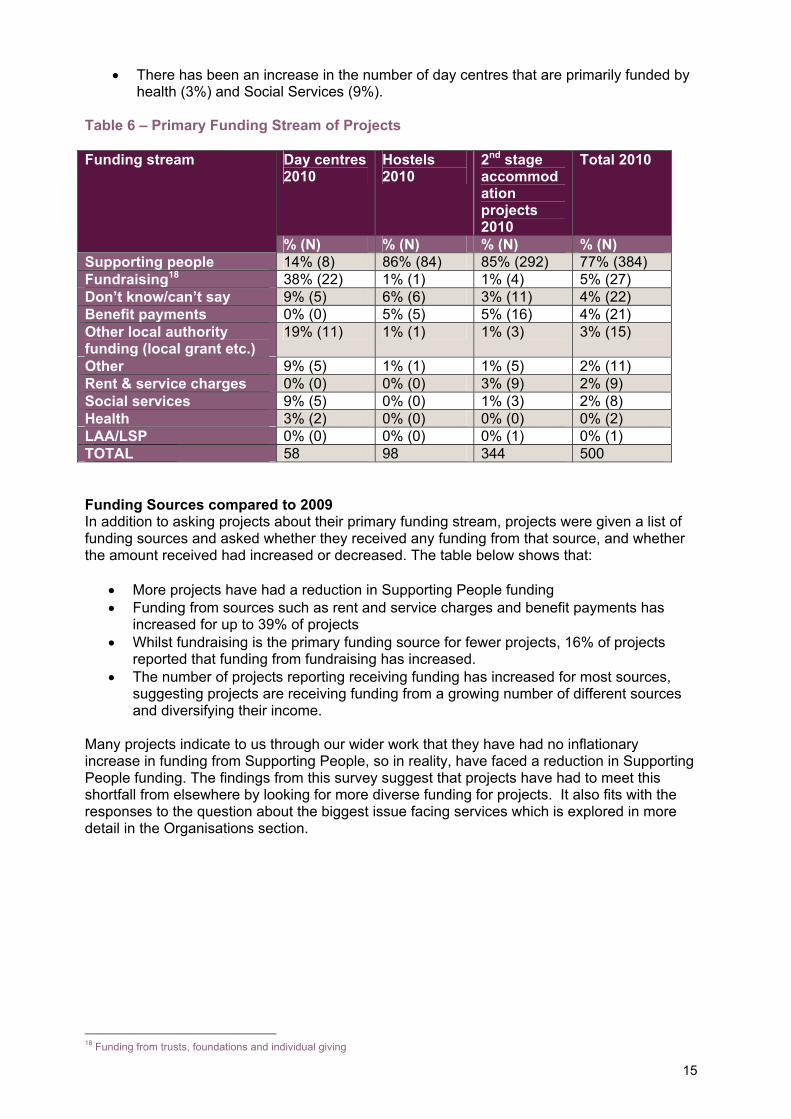
• There has been an increase in the number of day centres that are primarily funded by health (3%) and Social Services (9%).
Table 6 – Primary Funding Stream of Projects
Day centres 2010
Hostels 2010
2nd stage accommodation projects 2010
Total 2010 Funding stream
% (N) % (N) % (N) % (N) Supporting people 14% (8) 86% (84) 85% (292) 77% (384) Fundraising18 38% (22) 1% (1) 1% (4) 5% (27) Don’t know/can’t say 9% (5) 6% (6) 3% (11) 4% (22) Benefit payments 0% (0) 5% (5) 5% (16) 4% (21) Other local authority funding (local grant etc.)
19% (11) 1% (1) 1% (3) 3% (15)
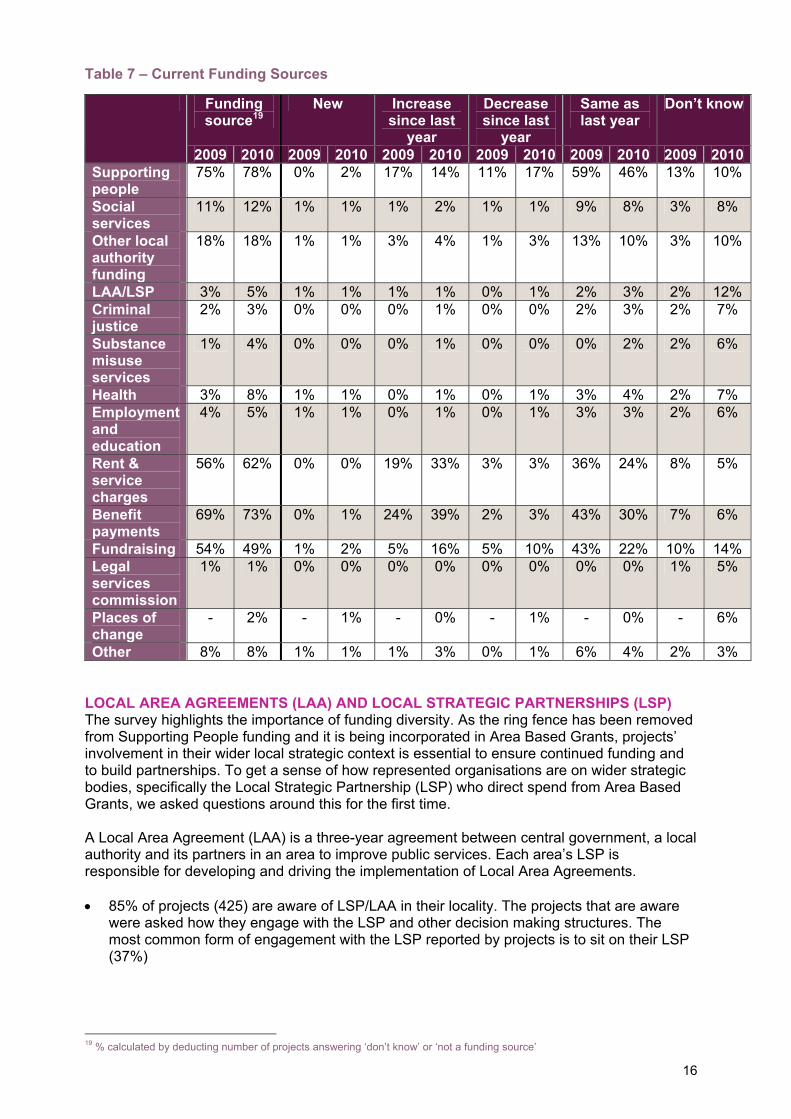
Other 9% (5) 1% (1) 1% (5) 2% (11) Rent & service charges 0% (0) 0% (0) 3% (9) 2% (9) Social services 9% (5) 0% (0) 1% (3) 2% (8) Health 3% (2) 0% (0) 0% (0) 0% (2) LAA/LSP 0% (0) 0% (0) 0% (1) 0% (1) TOTAL 58 98 344 500 Funding Sources compared to 2009 In addition to asking projects about their primary funding stream, projects were given a list of funding sources and asked whether they received any funding from that source, and whether the amount received had increased or decreased. The table below shows that:
• More projects have had a reduction in Supporting People funding • Funding from sources such as rent and service charges and benefit payments has
increased for up to 39% of projects • Whilst fundraising is the primary funding source for fewer projects, 16% of projects
reported that funding from fundraising has increased. • The number of projects reporting receiving funding has increased for most sources,
suggesting projects are receiving funding from a growing number of different sources and diversifying their income.
Many projects indicate to us through our wider work that they have had no inflationary increase in funding from Supporting People, so in reality, have faced a reduction in Supporting People funding. The findings from this survey suggest that projects have had to meet this shortfall from elsewhere by looking for more diverse funding for projects. It also fits with the responses to the question about the biggest issue facing services which is explored in more detail in the Organisations section.
18 Funding from trusts, foundations and individual giving
16
Table 7 – Current Funding Sources
Funding source19
New Increase since last
year
Decrease since last
year
Same as last year
Don’t know
2009 2010 2009 2010 2009 2010 2009 2010 2009 2010 2009 2010Supporting people
75% 78% 0% 2% 17% 14% 11% 17% 59% 46% 13% 10%
Social services
11% 12% 1% 1% 1% 2% 1% 1% 9% 8% 3% 8%
Other local authority funding
18% 18% 1% 1% 3% 4% 1% 3% 13% 10% 3% 10%
LAA/LSP 3% 5% 1% 1% 1% 1% 0% 1% 2% 3% 2% 12% Criminal justice
2% 3% 0% 0% 0% 1% 0% 0% 2% 3% 2% 7%
Substance misuse services
1% 4% 0% 0% 0% 1% 0% 0% 0% 2% 2% 6%
Health 3% 8% 1% 1% 0% 1% 0% 1% 3% 4% 2% 7% Employment and education
4% 5% 1% 1% 0% 1% 0% 1% 3% 3% 2% 6%
Rent & service charges
56% 62% 0% 0% 19% 33% 3% 3% 36% 24% 8% 5%
Benefit payments
69% 73% 0% 1% 24% 39% 2% 3% 43% 30% 7% 6%
Fundraising 54% 49% 1% 2% 5% 16% 5% 10% 43% 22% 10% 14% Legal services commission
1% 1% 0% 0% 0% 0% 0% 0% 0% 0% 1% 5%
Places of change
- 2% - 1% - 0% - 1% - 0% - 6%
Other 8% 8% 1% 1% 1% 3% 0% 1% 6% 4% 2% 3% LOCAL AREA AGREEMENTS (LAA) AND LOCAL STRATEGIC PARTNERSHIPS (LSP) The survey highlights the importance of funding diversity. As the ring fence has been removed from Supporting People funding and it is being incorporated in Area Based Grants, projects’ involvement in their wider local strategic context is essential to ensure continued funding and to build partnerships. To get a sense of how represented organisations are on wider strategic bodies, specifically the Local Strategic Partnership (LSP) who direct spend from Area Based Grants, we asked questions around this for the first time. A Local Area Agreement (LAA) is a three-year agreement between central government, a local authority and its partners in an area to improve public services. Each area’s LSP is responsible for developing and driving the implementation of Local Area Agreements. • 85% of projects (425) are aware of LSP/LAA in their locality. The projects that are aware
were asked how they engage with the LSP and other decision making structures. The most common form of engagement with the LSP reported by projects is to sit on their LSP (37%)
19 % calculated by deducting number of projects answering ‘don’t know’ or ‘not a funding source’

17
ORGANISATIONS Alongside more concrete data on whether projects refuse clients and why, this chapter explores what project managers feel are the most pressing issues and biggest service provision gaps in their area. We have included anonymised quotes of what project managers told us. We have also extracted any emerging trends in whether projects can access services such as drug, mental health or meaningful activity services for their clients, and whether these are delivered in-house, in-house with an external partner or by referring to an external agency. In addition, when looking at whether projects are reporting problems with accessing these services, we have separated different perceived causes for these problems, such as lack of internal resources, external agencies being inadequate and clients’ motivation affecting service access. These are compared to last year to identify early trends. As well as data on refusals, this chapter provides figures for local connection policies, client involvement levels and evictions and abandonments. TOP 3 ISSUES This year, the project managers responding to the survey were asked what the top 3 issues facing their projects were. This question was unprompted, and respondents were not given a set list of choices, so please note that, whilst for example only a few respondents felt that Eastern European migrants was the top issue for them, it does not mean that other projects feel that this is not an issue for them. Some projects only gave one key issue, and when all 3 issues given by projects were analysed in combination, the same top issues emerged20. To give the most appropriate analysis only the key issue has been presented as all 500 projects gave an answer. Table 8 – Top Issue given by Projects
KEY ISSUE Frequency % Funding 238 48 Move on housing/system 67 13 Premises-space/adequacy 32 6 Substance use 28 6 Benefits/finances 18 4 Employment/training 18 4 None/don't know 13 3 Mental health 10 2 Referral system 10 2 Governance/remit/paperwork 9 2 Access to services 9 2 Youth homelessness 7 1 Engagement/motivation 7 1 Networking/info sharing/inter-agency working 6 1 Anti-social/client behaviour 6 1 Eastern European clients 3 1 Other 19 4 TOTAL 500 100 20 The most recorded answer when looking at all the responses in combination were funding (33%), move on accommodation/support (14%), substance use (7%) and issues around premises/space (7%). These figures have been adjusted after removing any ‘none’ responses.
18
SOME KEY ISSUES IN MORE DETAIL Funding Most respondents answered just with ‘funding’, ‘money’ or ‘finances’. More specific answers included problems with SP funding, not being able to plan, staff shortage and lack of funding for staff training. Some mentioned that funding dictates who they can deliver services to and how that can affect clients. ‘Pressure to provide more for less. Demand for my service has increased, and funding is getting harder to get hold of.’ ‘There’s a worry as Supporting People are decommissioning quite a lot of services at the moment.’ ‘Lack of funding means that we’ve had to reduce pay and work longer hours – makes it harder to recruit quality staff.’
Lack of funding was also mentioned in connection with pay for staff, and not attracting or retaining the right individuals. Some positions cease to be funded meaning that there are issues around staff to client ratios. Volunteer recruitment and training was also connected to funding, with fewer paid staff being available to oversee this area of work. Move on accommodation and support 13% of services gave issues around move on arrangements as the top issue facing them. This included not having enough social housing stock, lack of specialist housing, lack of private rented move on schemes, and not having enough support once housed. ‘Adequate move-on scheme, including a second stage option with less support than our own service - an adequate "step down".’ ‘Area lacking affordable housing, rented accommodation and social housing.’ ‘Lack of move on for complex needs.’ Some respondents felt that the lack of adequate and appropriate move on arrangements can lead to a revolving doors scenario for many clients and services. This can be affected by factors as simple as adequate furnishings. ‘Credit crunch e.g. clients cost of furnishings. Not a lot of places where people can get free furnishings; means people are set up to fail because it's difficult to move on if they get to the flat they have and can’t afford furniture, decorating etc.’ Substance Use Alcohol and drug use was mentioned by 6% of services as the top issue facing them. This is referring to issues around behaviour as well as accessing appropriate services. One respondent highlighted how move-on arrangements are linked to this issue. ‘Alcohol reductions, really hard to get the clients to drink less alcohol. Move-ons will not allow this amount of alcohol consumption so again a hard move on.’ ‘There’s a growing number of drug and alcohol referrals and there’s just not capacity to take the number of people.’ Alcohol was mentioned more often than drug use, and also was explicitly referred to in connection to accommodation, motivation and effect on client progress.
19
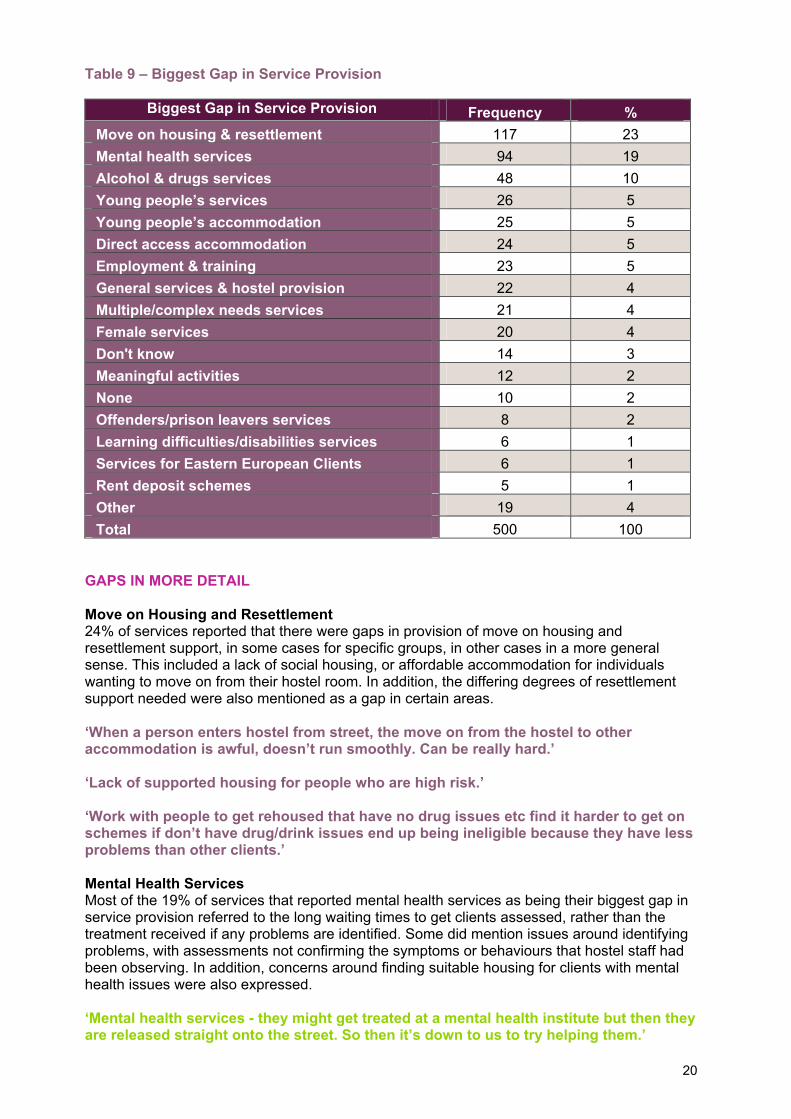
Premises – Provision and Adequacy This category refers to physical limitations linked to facilities and premises, as well as a lack of space in terms of bed spaces, and was the top issue for 6% of services. ‘Some buildings being used are very old and need replacing and updating so they are fit for purpose.’ Many respondents linked the recession to an increase in demand for hostel accommodation, as well as family break down. ‘Lack of accommodation. We get a lot more referrals than we have places available.’ Some projects reported having waiting lists, however, surprisingly, some respondents reported having voids and a lack of referrals. This seemed to be linked to the referral system, which was coded under a unique category, and was the top issue for 2% of services. ‘Voids being caused by having to hold beds for council but not giving them the referrals.’ In addition, the stipulation of clients having to have a local connection was mentioned by many as a limitation to their service delivery. Some respondents felt that the clients who were being referred to their service had ever increasing needs which they do not feel equipped to deal with or meet. This is also true for young people. ‘Increase in high, multiple-needs young people.’ ‘Client group is getting higher support, higher population of young people in Tamworth, offending becoming higher, project is low to medium support.’ GAPS IN SERVICE PROVISION Respondents were asked what they felt the biggest gap in service provision in their area is. This was a new question for this survey. This was also an open question with no specified answer options for the respondents. This means that only one gap per respondent was recorded without them being prompted in any way. The biggest gaps in service provision that were recorded were move on housing and resettlement , access to mental health services and alcohol and drugs services. Access to young people services and accommodation combined was also reported by 10% of services as the biggest gap in their area.
20
Table 9 – Biggest Gap in Service Provision
Biggest Gap in Service Provision Frequency % Move on housing & resettlement 117 23 Mental health services 94 19 Alcohol & drugs services 48 10 Young people’s services 26 5 Young people’s accommodation 25 5 Direct access accommodation 24 5 Employment & training 23 5 General services & hostel provision 22 4 Multiple/complex needs services 21 4 Female services 20 4 Don't know 14 3 Meaningful activities 12 2 None 10 2 Offenders/prison leavers services 8 2 Learning difficulties/disabilities services 6 1 Services for Eastern European Clients 6 1 Rent deposit schemes 5 1 Other 19 4 Total 500 100
GAPS IN MORE DETAIL Move on Housing and Resettlement 24% of services reported that there were gaps in provision of move on housing and resettlement support, in some cases for specific groups, in other cases in a more general sense. This included a lack of social housing, or affordable accommodation for individuals wanting to move on from their hostel room. In addition, the differing degrees of resettlement support needed were also mentioned as a gap in certain areas. ‘When a person enters hostel from street, the move on from the hostel to other accommodation is awful, doesn’t run smoothly. Can be really hard.’ ‘Lack of supported housing for people who are high risk.’ ‘Work with people to get rehoused that have no drug issues etc find it harder to get on schemes if don’t have drug/drink issues end up being ineligible because they have less problems than other clients.’ Mental Health Services Most of the 19% of services that reported mental health services as being their biggest gap in service provision referred to the long waiting times to get clients assessed, rather than the treatment received if any problems are identified. Some did mention issues around identifying problems, with assessments not confirming the symptoms or behaviours that hostel staff had been observing. In addition, concerns around finding suitable housing for clients with mental health issues were also expressed. ‘Mental health services - they might get treated at a mental health institute but then they are released straight onto the street. So then it’s down to us to try helping them.’

21
‘Mental health as although we can refer them to a mental health team they don’t always identify the problems and so if they don’t meet the criteria it puts you in an awkward position.’ ‘Long waiting lists for appropriate mental health services and substance misuse services. Mental health agencies will push off as drugs issue, drug services will say its mental health issues. Until the police get involved.’ Alcohol and Drug Services 10% of services identified alcohol and drug services as the biggest gap in provision in their area. This included waiting lists for services such as rehab and detox, as well as the general difficulty of finding housing for clients who are not yet able to address their drinking or drug use. ‘Alcohol services for adults. It seems to be very distant for waiting times and referrals. It is because of the different agencies that provide it.’ ‘Having somewhere for chronically excluded people, the rough sleepers who are in and out of hostels, somewhere for the chronic drinkers/drug users, to try and keep them off the streets and support them.’ Young People’s Services and Accommodation 5% of services specified accessing services for young people as a problem, whilst a further 5% of services detailed problems with finding appropriate accommodation and housing for young people. ‘Supported accommodation for young people, they need a medium level of support. There are only massive hostels or single living; we need more shared housing for smaller groups with the appropriate support.’ Respondents also noted the ongoing difficulty of encouraging young people to take up training or education knowing that benefits will be reduced. Employment and Training 5% of services highlighted the gap in service provision for over 25s who want to undertake training or education with the long term goal of improving their employability. Many reported that courses are often not offered to over 25s, or are very expensive, meaning that clients with no qualifications or experience are at a disadvantage when looking for employment. ‘Over 25's do not have as many options for training and benefits, difficult for us to get them in on courses and other activities if they are over this age. Bad for staff knowing that they cannot help them as well.’ ‘Clients would like to go to college but cant because they are too old to be entitled to free education or training. They haven’t got the skills required for a job. Need to go to college to bridge the gap. We need a scheme to help older people get back into education or training. Courses are expensive, they get stuck because they cant get onto training etc.’ CLIENT INVOLVEMENT
• 96% of projects involve their clients with residents’ or clients’ meetings • 84% of projects have a suggestions box for clients to communicate ideas • 77% of projects consult with service users • 58% of projects have service users as project representatives • 41% of projects have service users on their recruitment panel • 19% of projects have board members who are current clients
22
Compared to last year, the number of projects reporting client involvement has increased for every method, suggesting that projects are not only increasingly involving clients in their governance and decision making, but they are also doing so in a growing number of ways. To further explore client involvement, this year’s survey respondents were asked at what level clients were involved in the decision making process. The most basic level of involvement is information, followed by consultation, deciding together, acting together and, finally, supporting independent initiatives which is the highest level of decision making. ‘Information’ involves ensuring clients have access to the appropriate information regarding decisions being made in the project, ‘consultation’ refers to the process of obtaining clients’ views on matters when making decisions, at the ‘deciding together’ stage clients are actually involved in making decisions, ‘acting together’ suggests a more active role of the client, and ‘supporting independent initiatives’ suggests that clients are able to make changes or decisions in the project using their own initiative21. Most projects involve clients at the information and consultation levels (83% and 90% respectively), and almost half of the projects surveyed involve clients through acting together (47%) and support independent initiatives (43%). Some examples of client involvement given included: ‘Development squad, mystery shopping, audit team, health and safety champions’ ‘Facebook site for consultation’ ‘Members on panel for employing new people and run discussion groups’ PROJECT ACCESSIBILITY Refusals In total, 90% of projects (452) refuse clients access to their project for a number of reasons.
• The most common reasons overall are history of arson and not meeting the project’s client criteria.
• Refusals differ depending on the service type. Day Centres’ most given reason was a client having been previously banned, whereas for hostels it was history of arson and for 2nd stage accommodation projects it was the client not meeting the project criteria.
21 Seal, M., (2008). Not About Us Without Us: Client involvement in supported housing: Client Involvement in Supported Housing
23
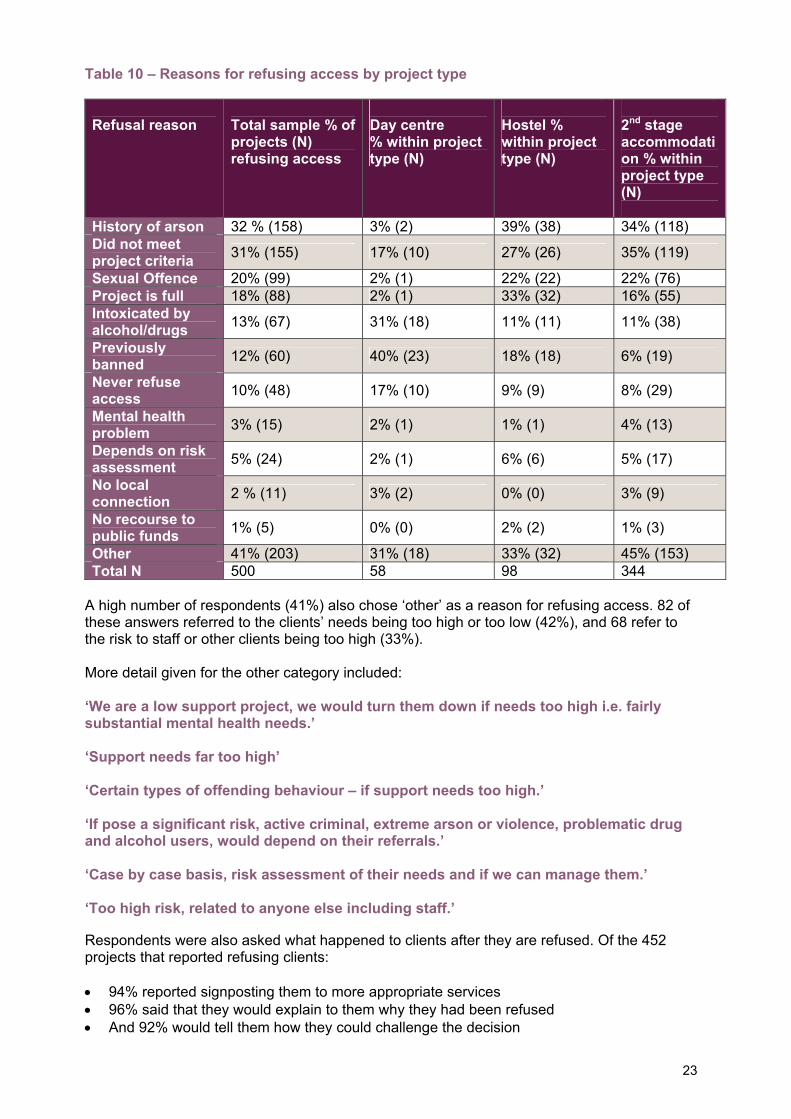
Table 10 – Reasons for refusing access by project type Refusal reason
Total sample % of projects (N) refusing access
Day centre % within project type (N)
Hostel % within project type (N)
2nd stage accommodation % within project type (N)
History of arson 32 % (158) 3% (2) 39% (38) 34% (118) Did not meet project criteria 31% (155) 17% (10) 27% (26) 35% (119)
Sexual Offence 20% (99) 2% (1) 22% (22) 22% (76) Project is full 18% (88) 2% (1) 33% (32) 16% (55) Intoxicated by alcohol/drugs 13% (67) 31% (18) 11% (11) 11% (38)
Previously banned 12% (60) 40% (23) 18% (18) 6% (19)
Never refuse access 10% (48) 17% (10) 9% (9) 8% (29)
Mental health problem 3% (15) 2% (1) 1% (1) 4% (13)
Depends on risk assessment 5% (24) 2% (1) 6% (6) 5% (17)
No local connection 2 % (11) 3% (2) 0% (0) 3% (9)
No recourse to public funds 1% (5) 0% (0) 2% (2) 1% (3)
Other 41% (203) 31% (18) 33% (32) 45% (153) Total N 500 58 98 344
A high number of respondents (41%) also chose ‘other’ as a reason for refusing access. 82 of these answers referred to the clients’ needs being too high or too low (42%), and 68 refer to the risk to staff or other clients being too high (33%). More detail given for the other category included: ‘We are a low support project, we would turn them down if needs too high i.e. fairly substantial mental health needs.’ ‘Support needs far too high’ ‘Certain types of offending behaviour – if support needs too high.’ ‘If pose a significant risk, active criminal, extreme arson or violence, problematic drug and alcohol users, would depend on their referrals.’ ‘Case by case basis, risk assessment of their needs and if we can manage them.’ ‘Too high risk, related to anyone else including staff.’ Respondents were also asked what happened to clients after they are refused. Of the 452 projects that reported refusing clients: • 94% reported signposting them to more appropriate services • 96% said that they would explain to them why they had been refused • And 92% would tell them how they could challenge the decision
24
84 projects gave an estimate of how many people they refused each week, giving a total of 245 people. The most common estimate given was 1, with answers ranging from 1 to 20. Local Connection Homeless people often have, or want, to leave the area they are from for a number of reasons, meaning that issues can arise when trying to access services in another area. This is especially true for London due to the close geographical proximity of different boroughs. Many agencies think there is no point referring clients to services if they do not have a ‘local connection’, such as having lived or worked in the area for a substantial time period.
• Respondents were asked whether they accepted clients from outside their borough/district, with 79% of projects answering yes (395), which is a 4% increase from last year
• Of the 395 projects that accept clients from outside their borough/district, the proportion of clients from within and outside the borough was recorded
• The average proportion for within borough/district clients was 82%, and 18% outside of the borough clients. The most common percentage split given was 90%/10%, with 81 projects reporting this split.
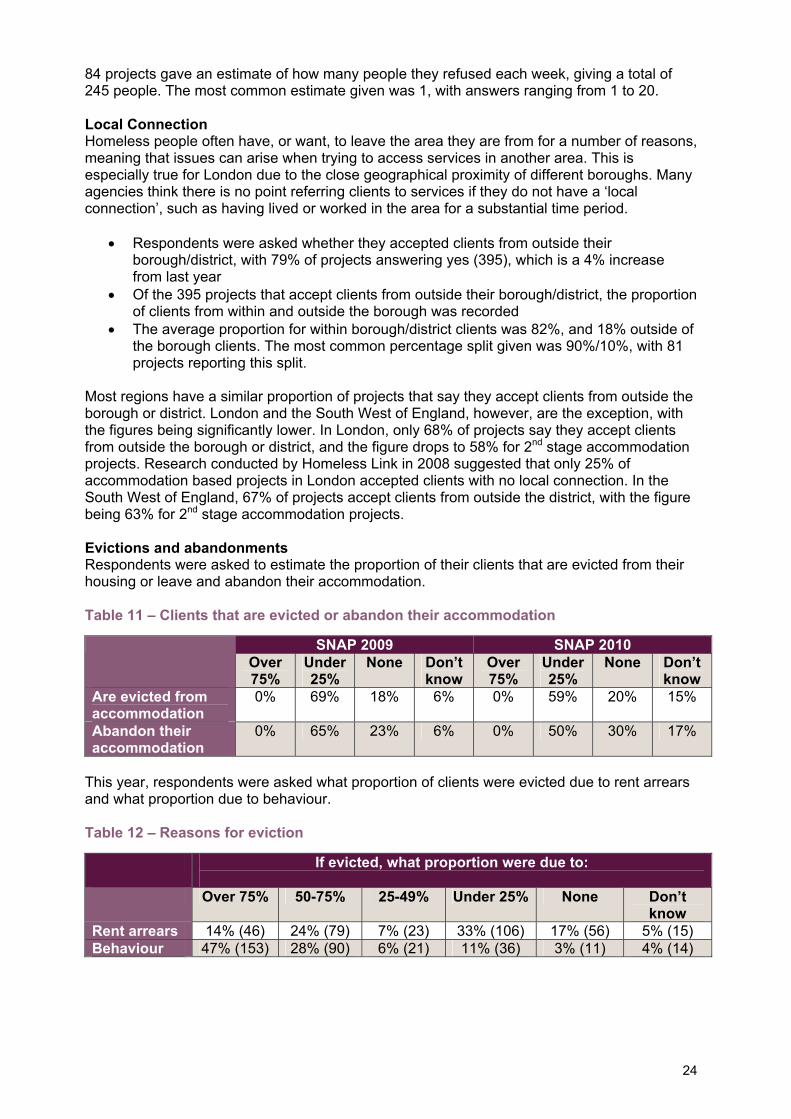
Most regions have a similar proportion of projects that say they accept clients from outside the borough or district. London and the South West of England, however, are the exception, with the figures being significantly lower. In London, only 68% of projects say they accept clients from outside the borough or district, and the figure drops to 58% for 2nd stage accommodation projects. Research conducted by Homeless Link in 2008 suggested that only 25% of accommodation based projects in London accepted clients with no local connection. In the South West of England, 67% of projects accept clients from outside the district, with the figure being 63% for 2nd stage accommodation projects. Evictions and abandonments Respondents were asked to estimate the proportion of their clients that are evicted from their housing or leave and abandon their accommodation. Table 11 – Clients that are evicted or abandon their accommodation
SNAP 2009 SNAP 2010 Over 75%
Under 25%
None Don’t know
Over 75%
Under 25%
None Don’t know
Are evicted from accommodation
0% 69% 18% 6% 0% 59% 20% 15%
Abandon their accommodation
0% 65% 23% 6% 0% 50% 30% 17%
This year, respondents were asked what proportion of clients were evicted due to rent arrears and what proportion due to behaviour. Table 12 – Reasons for eviction If evicted, what proportion were due to:
Over 75% 50-75% 25-49% Under 25% None Don’t
know Rent arrears 14% (46) 24% (79) 7% (23) 33% (106) 17% (56) 5% (15) Behaviour 47% (153) 28% (90) 6% (21) 11% (36) 3% (11) 4% (14)
25
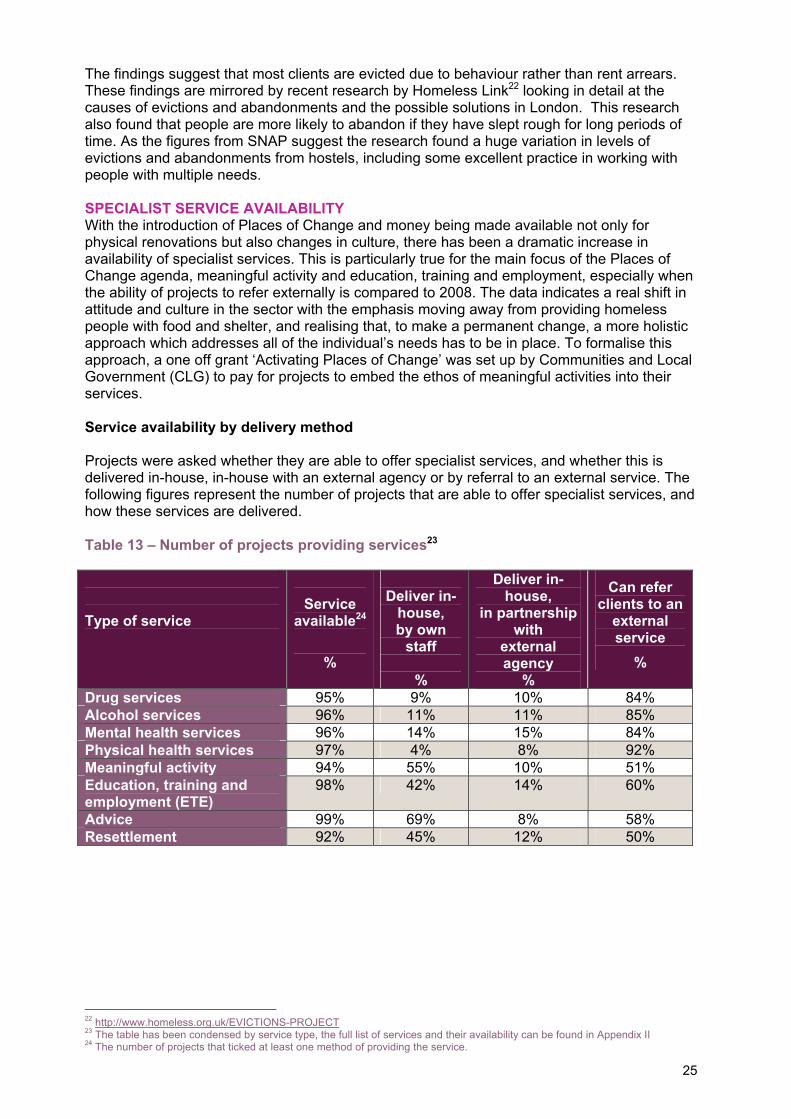
The findings suggest that most clients are evicted due to behaviour rather than rent arrears. These findings are mirrored by recent research by Homeless Link22 looking in detail at the causes of evictions and abandonments and the possible solutions in London. This research also found that people are more likely to abandon if they have slept rough for long periods of time. As the figures from SNAP suggest the research found a huge variation in levels of evictions and abandonments from hostels, including some excellent practice in working with people with multiple needs. SPECIALIST SERVICE AVAILABILITY With the introduction of Places of Change and money being made available not only for physical renovations but also changes in culture, there has been a dramatic increase in availability of specialist services. This is particularly true for the main focus of the Places of Change agenda, meaningful activity and education, training and employment, especially when the ability of projects to refer externally is compared to 2008. The data indicates a real shift in attitude and culture in the sector with the emphasis moving away from providing homeless people with food and shelter, and realising that, to make a permanent change, a more holistic approach which addresses all of the individual’s needs has to be in place. To formalise this approach, a one off grant ‘Activating Places of Change’ was set up by Communities and Local Government (CLG) to pay for projects to embed the ethos of meaningful activities into their services. Service availability by delivery method Projects were asked whether they are able to offer specialist services, and whether this is delivered in-house, in-house with an external agency or by referral to an external service. The following figures represent the number of projects that are able to offer specialist services, and how these services are delivered. Table 13 – Number of projects providing services23
Type of service
Service
available24
%
Deliver in-
house, by own
staff
%
Deliver in-house,
in partnership with
external agency
%
Can refer clients to an
external service
%
Drug services 95% 9% 10% 84% Alcohol services 96% 11% 11% 85% Mental health services 96% 14% 15% 84% Physical health services 97% 4% 8% 92% Meaningful activity 94% 55% 10% 51% Education, training and employment (ETE)
98% 42% 14% 60%
Advice 99% 69% 8% 58% Resettlement 92% 45% 12% 50% 22 http://www.homeless.org.uk/EVICTIONS-PROJECT 23 The table has been condensed by service type, the full list of services and their availability can be found in Appendix II 24 The number of projects that ticked at least one method of providing the service.
26
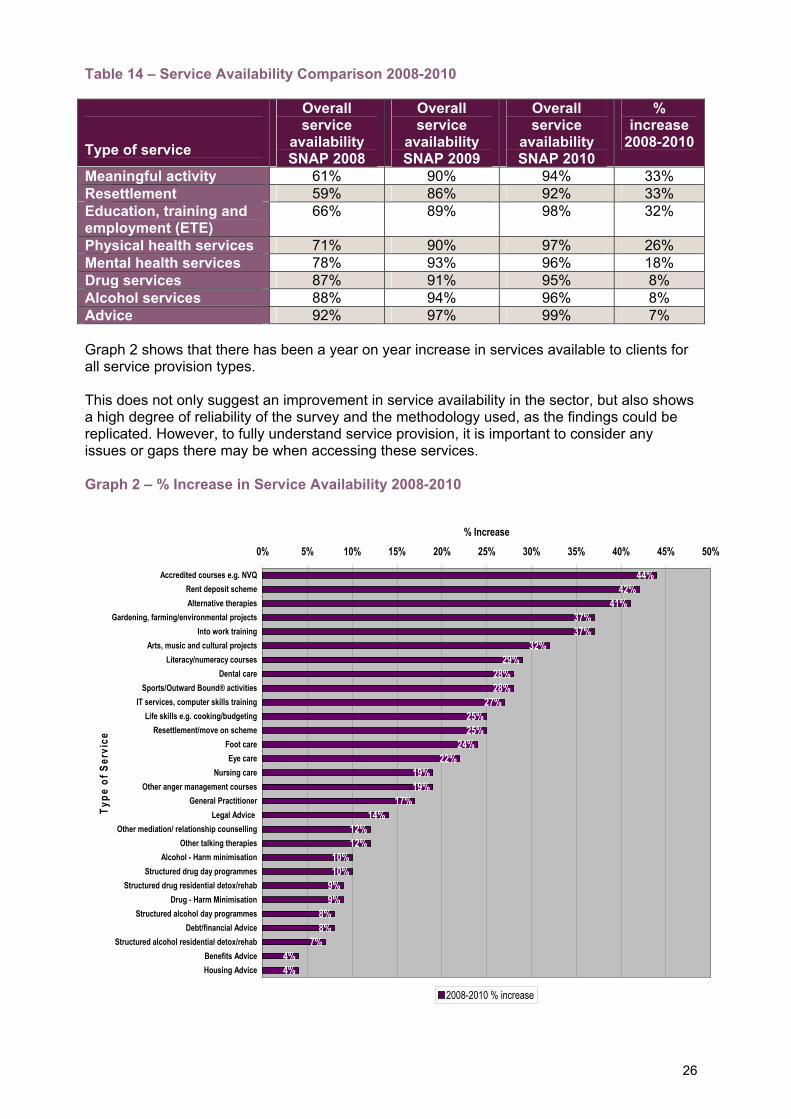
Table 14 – Service Availability Comparison 2008-2010 Type of service
Overall service
availability SNAP 2008
Overall service
availability SNAP 2009
Overall service
availability SNAP 2010
% increase
2008-2010
Meaningful activity 61% 90% 94% 33% Resettlement 59% 86% 92% 33% Education, training and employment (ETE)
66% 89% 98% 32%
Physical health services 71% 90% 97% 26% Mental health services 78% 93% 96% 18% Drug services 87% 91% 95% 8% Alcohol services 88% 94% 96% 8% Advice 92% 97% 99% 7% Graph 2 shows that there has been a year on year increase in services available to clients for all service provision types. This does not only suggest an improvement in service availability in the sector, but also shows a high degree of reliability of the survey and the methodology used, as the findings could be replicated. However, to fully understand service provision, it is important to consider any issues or gaps there may be when accessing these services. Graph 2 – % Increase in Service Availability 2008-2010
44%42%
41%37%37%
32%29%
28%28%
27%25%25%
24%22%
19%19%
17%14%
12%12%
10%10%
9%9%
8%8%
7%4%4%
0% 5% 10% 15% 20% 25% 30% 35% 40% 45% 50%
Accredited courses e.g. NVQRent deposit schemeAlternative therapies
Gardening, farming/environmental projectsInto work training
Arts, music and cultural projectsLiteracy/numeracy courses
Dental careSports/Outward Bound® activities
IT services, computer skills trainingLife skills e.g. cooking/budgeting
Resettlement/move on schemeFoot careEye care
Nursing careOther anger management courses
General PractitionerLegal Advice
Other mediation/ relationship counsellingOther talking therapies
Alcohol - Harm minimisationStructured drug day programmes
Structured drug residential detox/rehabDrug - Harm Minimisation
Structured alcohol day programmesDebt/financial Advice
Structured alcohol residential detox/rehabBenefits AdviceHousing Advice
Type
of S
ervi
ce
% Increase
2008-2010 % increase

27
Graph 3 – Availability of services
0% 10% 20% 30% 40% 50% 60% 70% 80% 90% 100%
Drug services
Residential detox/rehab
Day programmes
Harm minimisation
Needle exchange
Blood borne virus screening/vaccination
Alcohol services
Residential detox/rehab
Day programmes
Harm minimisation
Mental health services
CMHT services
Other talking therapies
Other anger management courses
Other mediation/ relationship counselling
Physical health services
Nursing care
General Practitioner
Dental care
Alternative therapies
Eye care
Foot care
TB screening/contact with TB clinic
Sexual health services
Meaningful activity
Sports/Outward Bound® activities
Gardening, farming or environmental projects
Arts, music and cultural projects
Education, training and employment (ETE)
IT, computer skills training
Literacy/numeracy courses
Into work training
Life skills
Accredited courses
General informal adult learning
Advice
Benefits
Debt/financial
Legal
Housing
Resettlement
Rent deposit scheme
Resettlement/move on scheme
Serv
ice
Type
Overall Availability
SNAP 2008 SNAP 2010
28
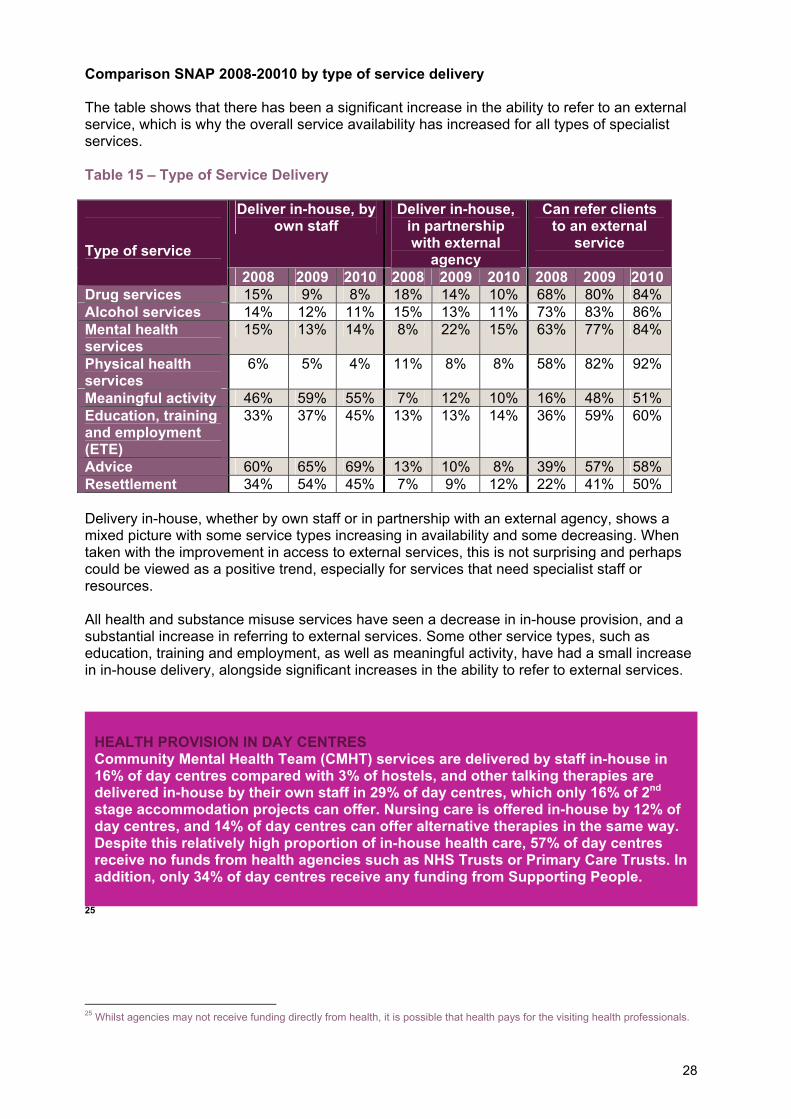
Comparison SNAP 2008-20010 by type of service delivery The table shows that there has been a significant increase in the ability to refer to an external service, which is why the overall service availability has increased for all types of specialist services. Table 15 – Type of Service Delivery
Deliver in-house, by own staff
Deliver in-house, in partnership with external
agency
Can refer clients to an external
service
Type of service
2008 2009 2010 2008 2009 2010 2008 2009 2010Drug services 15% 9% 8% 18% 14% 10% 68% 80% 84% Alcohol services 14% 12% 11% 15% 13% 11% 73% 83% 86% Mental health services
15% 13% 14% 8% 22% 15% 63% 77% 84%
Physical health services
6% 5% 4% 11% 8% 8% 58% 82% 92%
Meaningful activity 46% 59% 55% 7% 12% 10% 16% 48% 51% Education, training and employment (ETE)
33% 37% 45% 13% 13% 14% 36% 59% 60%
Advice 60% 65% 69% 13% 10% 8% 39% 57% 58% Resettlement 34% 54% 45% 7% 9% 12% 22% 41% 50% Delivery in-house, whether by own staff or in partnership with an external agency, shows a mixed picture with some service types increasing in availability and some decreasing. When taken with the improvement in access to external services, this is not surprising and perhaps could be viewed as a positive trend, especially for services that need specialist staff or resources. All health and substance misuse services have seen a decrease in in-house provision, and a substantial increase in referring to external services. Some other service types, such as education, training and employment, as well as meaningful activity, have had a small increase in in-house delivery, alongside significant increases in the ability to refer to external services.
25 25 Whilst agencies may not receive funding directly from health, it is possible that health pays for the visiting health professionals.
HEALTH PROVISION IN DAY CENTRES Community Mental Health Team (CMHT) services are delivered by staff in-house in 16% of day centres compared with 3% of hostels, and other talking therapies are delivered in-house by their own staff in 29% of day centres, which only 16% of 2nd stage accommodation projects can offer. Nursing care is offered in-house by 12% of day centres, and 14% of day centres can offer alternative therapies in the same way. Despite this relatively high proportion of in-house health care, 57% of day centres receive no funds from health agencies such as NHS Trusts or Primary Care Trusts. In addition, only 34% of day centres receive any funding from Supporting People.

29
Comparison 2008-2010 by service delivery type
0%
10%
20%
30%
40%
50%
60%
70%
80%
Drug services Alcohol services Mental healthservices
Physical healthservices
Meaningfulactivity
Education,training andemployment
(ETE)
Advice Resettlement
Type of Service
Serv
ice
Ava
ilabi
lity
200820092010
Graph 4 - Delivered In-House
0%
5%
10%
15%
20%
25%
Drug services Alcohol services Mental healthservices
Physical healthservices
Meaningfulactivity
Education,training andemployment
(ETE)
Advice Resettlement
Type of Service
Serv
ice
Ava
ilabi
lty
200820092010
Graph 5 - Delivered In-House in Partnership with an External Agency
Graph 6 - By Referral to External Service
0%
10%
20%
30%
40%
50%
60%
70%
80%
90%
100%
Drug services Alcohol services Mental healthservices
Physical healthservices
Meaningfulactivity
Education,training andemployment
(ETE)
Advice Resettlement
Type of Service
Serv
ice
Ava
ilabi
lity
200820092010
30
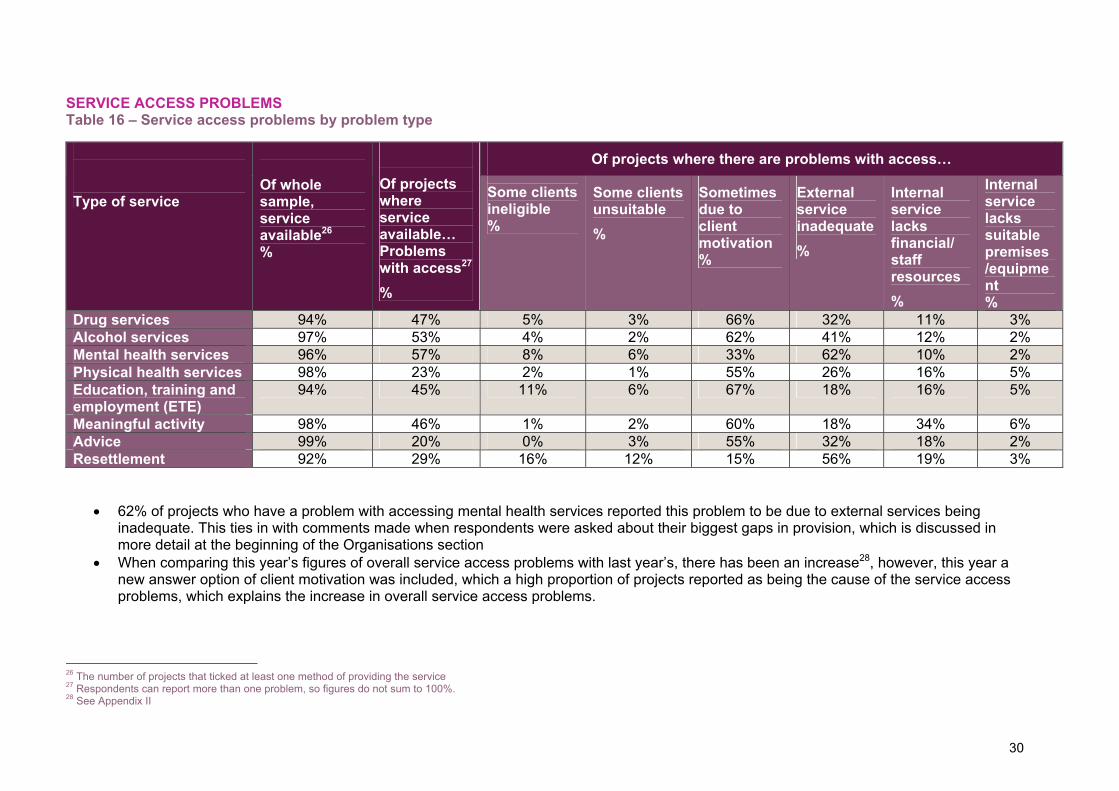
SERVICE ACCESS PROBLEMS Table 16 – Service access problems by problem type
• 62% of projects who have a problem with accessing mental health services reported this problem to be due to external services being inadequate. This ties in with comments made when respondents were asked about their biggest gaps in provision, which is discussed in more detail at the beginning of the Organisations section
• When comparing this year’s figures of overall service access problems with last year’s, there has been an increase28, however, this year a new answer option of client motivation was included, which a high proportion of projects reported as being the cause of the service access problems, which explains the increase in overall service access problems.
26 The number of projects that ticked at least one method of providing the service 27 Respondents can report more than one problem, so figures do not sum to 100%. 28 See Appendix II
Of projects where there are problems with access… Type of service
Of whole sample, service available26 %
Of projects where service available… Problems with access27
%
Some clients ineligible %
Some clients unsuitable %
Sometimes due to client motivation %
External service inadequate %
Internal service lacks financial/ staff resources %
Internal service lacks suitable premises /equipment %
Drug services 94% 47% 5% 3% 66% 32% 11% 3% Alcohol services 97% 53% 4% 2% 62% 41% 12% 2% Mental health services 96% 57% 8% 6% 33% 62% 10% 2% Physical health services 98% 23% 2% 1% 55% 26% 16% 5% Education, training and employment (ETE)
94% 45% 11% 6% 67% 18% 16% 5%
Meaningful activity 98% 46% 1% 2% 60% 18% 34% 6% Advice 99% 20% 0% 3% 55% 32% 18% 2% Resettlement 92% 29% 16% 12% 15% 56% 19% 3%
31
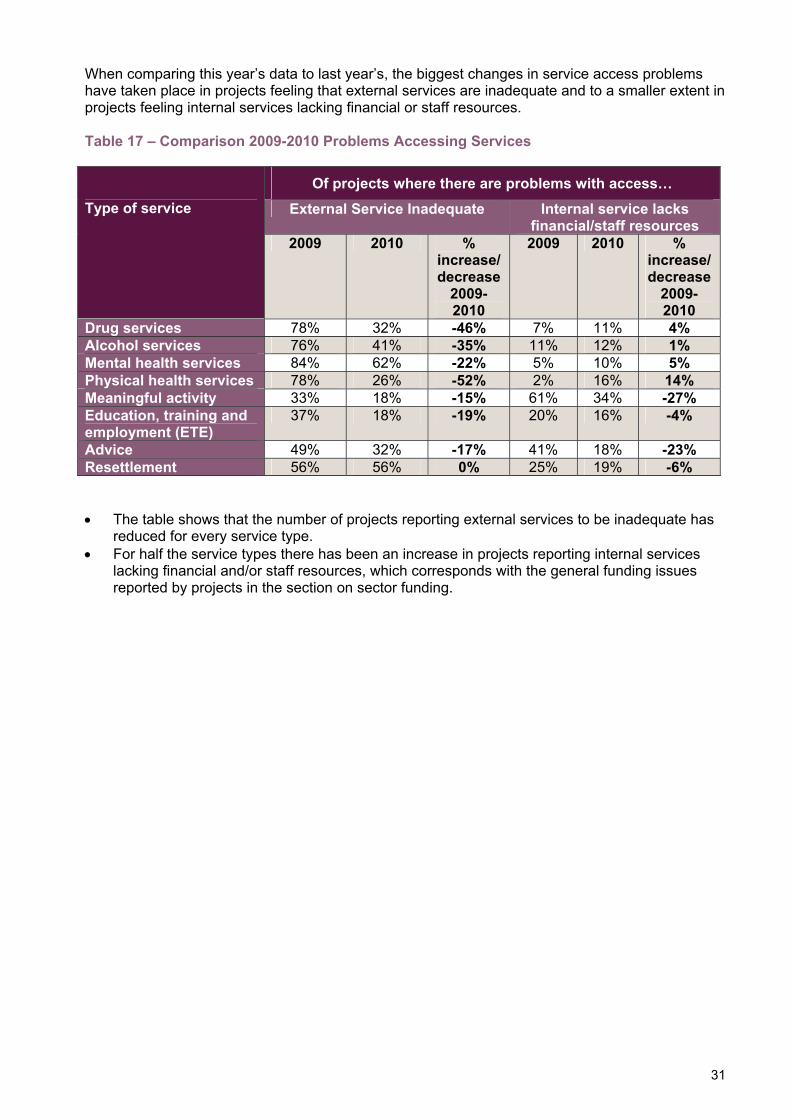
When comparing this year’s data to last year’s, the biggest changes in service access problems have taken place in projects feeling that external services are inadequate and to a smaller extent in projects feeling internal services lacking financial or staff resources. Table 17 – Comparison 2009-2010 Problems Accessing Services
Of projects where there are problems with access…
External Service Inadequate Internal service lacks financial/staff resources
Type of service
2009 2010 % increase/decrease
2009-2010
2009 2010 % increase/decrease
2009-2010
Drug services 78% 32% -46% 7% 11% 4% Alcohol services 76% 41% -35% 11% 12% 1% Mental health services 84% 62% -22% 5% 10% 5% Physical health services 78% 26% -52% 2% 16% 14% Meaningful activity 33% 18% -15% 61% 34% -27% Education, training and employment (ETE)
37% 18% -19% 20% 16% -4%
Advice 49% 32% -17% 41% 18% -23% Resettlement 56% 56% 0% 25% 19% -6% • The table shows that the number of projects reporting external services to be inadequate has
reduced for every service type. • For half the service types there has been an increase in projects reporting internal services
lacking financial and/or staff resources, which corresponds with the general funding issues reported by projects in the section on sector funding.
32
INDIVIDUALS This section focuses on the clients accessing the projects that were surveyed. As well as asking project managers to give an estimate of the proportions of clients from certain backgrounds, information on client issues and client outcomes was recorded. Projects that indicated seeing some clients from a particular client background group were also asked whether they provide targeted services for this group. In addition to asking projects where their clients move onto, a new question in this year’s survey explored the proportions of clients achieving other positive outcomes such as good health or paid work. CLIENT BACKGROUND Survey respondents were asked to estimate the proportion of clients29 from certain background groups that they see in their projects. CLIENT RECORDING SYSTEM 95% of projects reported having a client recording system, meaning that a large majority of the projects surveyed record the information needed for the following data. COMPARISON SNAP 2008-2010 Key trends that can be identified are:
• The number of projects that report no demand from couples has decreased significantly from 70% in 2008 to 23% in 2010, meaning that more projects are seeing homeless couples.
• The number of projects reporting a large majority of clients being men has decreased from 50% in 2008 to 38% in 2010.
These findings suggest that the individuals accessing homelessness services are changing from being predominantly single men to a diverse mix of people from all walks of life.
29 Please note that any of the questions asking respondents to give a proportion of client issues/background/outcomes are based on their estimates and therefore are not exact figures.
Figures on client background and client issues can be difficult to interpret as they are based on project estimates of the proportion of clients they are seeing. To give an example of how to best read the below table, the figures that have been highlighted can be interpreted as: • The number of projects that have a large majority of older people has decreased from
4% in 2008 to 1% in 2010 • However, the number of projects that report no demand from old people has also
decreased, from 36% in 2008 to 12% in 2010 • This suggests that there is an increasing demand for services for older people, but
projects that specifically cater for this group of people (and therefore report a large majority of their clients are older people) are reducing in number
33
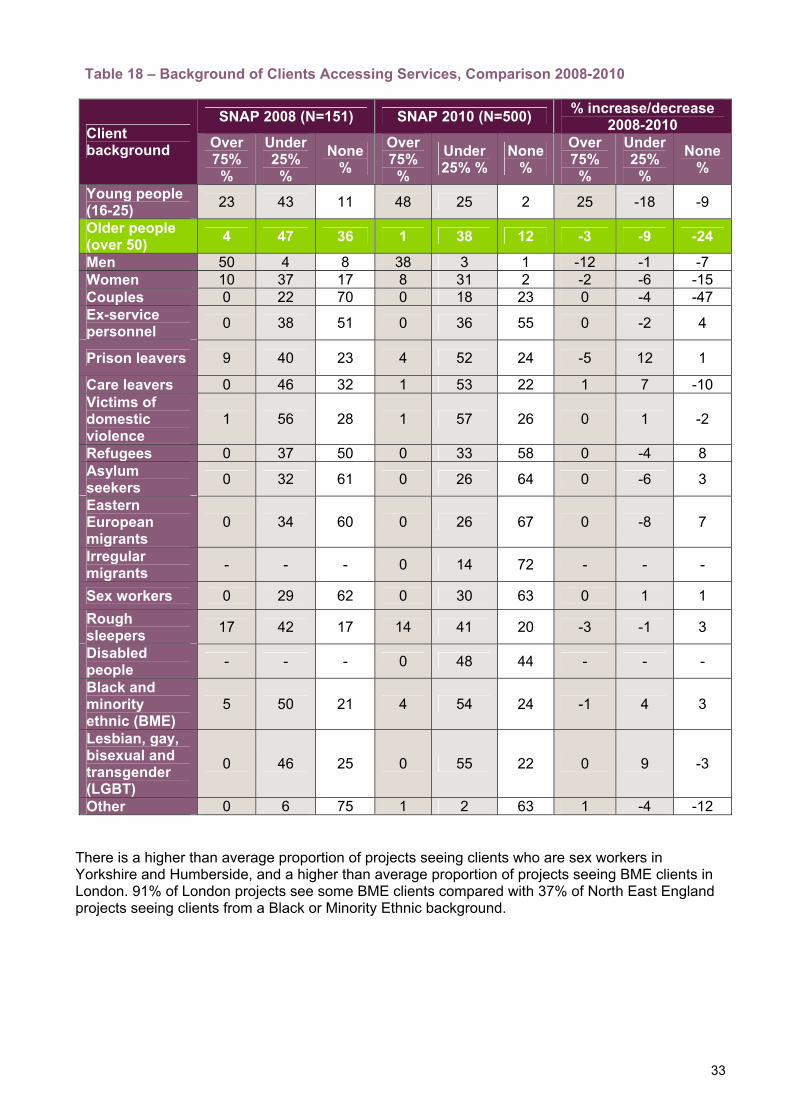
Table 18 – Background of Clients Accessing Services, Comparison 2008-2010
SNAP 2008 (N=151) SNAP 2010 (N=500) % increase/decrease 2008-2010 Client
background Over 75%
%
Under 25%
% None
% Over 75%
% Under 25% %
None %
Over 75%
%
Under 25%
% None
%
Young people (16-25) 23 43 11 48 25 2 25 -18 -9
Older people (over 50) 4 47 36 1 38 12 -3 -9 -24
Men 50 4 8 38 3 1 -12 -1 -7 Women 10 37 17 8 31 2 -2 -6 -15 Couples 0 22 70 0 18 23 0 -4 -47 Ex-service personnel 0 38 51 0 36 55 0 -2 4
Prison leavers 9 40 23 4 52 24 -5 12 1
Care leavers 0 46 32 1 53 22 1 7 -10 Victims of domestic violence
1 56 28 1 57 26 0 1 -2
Refugees 0 37 50 0 33 58 0 -4 8 Asylum seekers 0 32 61 0 26 64 0 -6 3
Eastern European migrants
0 34 60 0 26 67 0 -8 7
Irregular migrants - - - 0 14 72 - - -
Sex workers 0 29 62 0 30 63 0 1 1 Rough sleepers 17 42 17 14 41 20 -3 -1 3
Disabled people - - - 0 48 44 - - -
Black and minority ethnic (BME)
5 50 21 4 54 24 -1 4 3
Lesbian, gay, bisexual and transgender (LGBT)
0 46 25 0 55 22 0 9 -3
Other 0 6 75 1 2 63 1 -4 -12
There is a higher than average proportion of projects seeing clients who are sex workers in Yorkshire and Humberside, and a higher than average proportion of projects seeing BME clients in London. 91% of London projects see some BME clients compared with 37% of North East England projects seeing clients from a Black or Minority Ethnic background.
34
LINKS WITH PROBATION Respondents from the 364 projects who had some clients that were prison leavers were also asked how many of these clients had links to probation. 53% of these projects reported that a large majority of the clients had links with probation. This is an increase of 10% from last year’s 43%. COMMUNITY CARE ASSESSMENTS Projects were asked for the first time whether they had clients who were referred for a community care assessment, what proportion were eligible for a community care package and whether this was being delivered in house or whether clients were waiting for specialist accommodation. • 58% of projects (290) reported they had not referred any of their clients for a community care
assessment • 35% of services had referred a proportion of their clients for a community care assessment;
however, 40% of those had only done so for 4% or less of their clients • Of the services that had referred clients for an assessment, 42% reported that 50% or more of
the clients were eligible for community care, and 27% did not know whether the clients were eligible or not
• Of the services that had sent clients for an assessment and had at least some that were found to be eligible (110), 41% had no clients waiting for specialist accommodation, and 22% had a majority (75% or more) of their clients waiting for specialist accommodation
• 34% of services had no clients who were having a care package delivered in-house, and 33% had a care package delivered in-house to the majority of their clients who were eligible for community care.
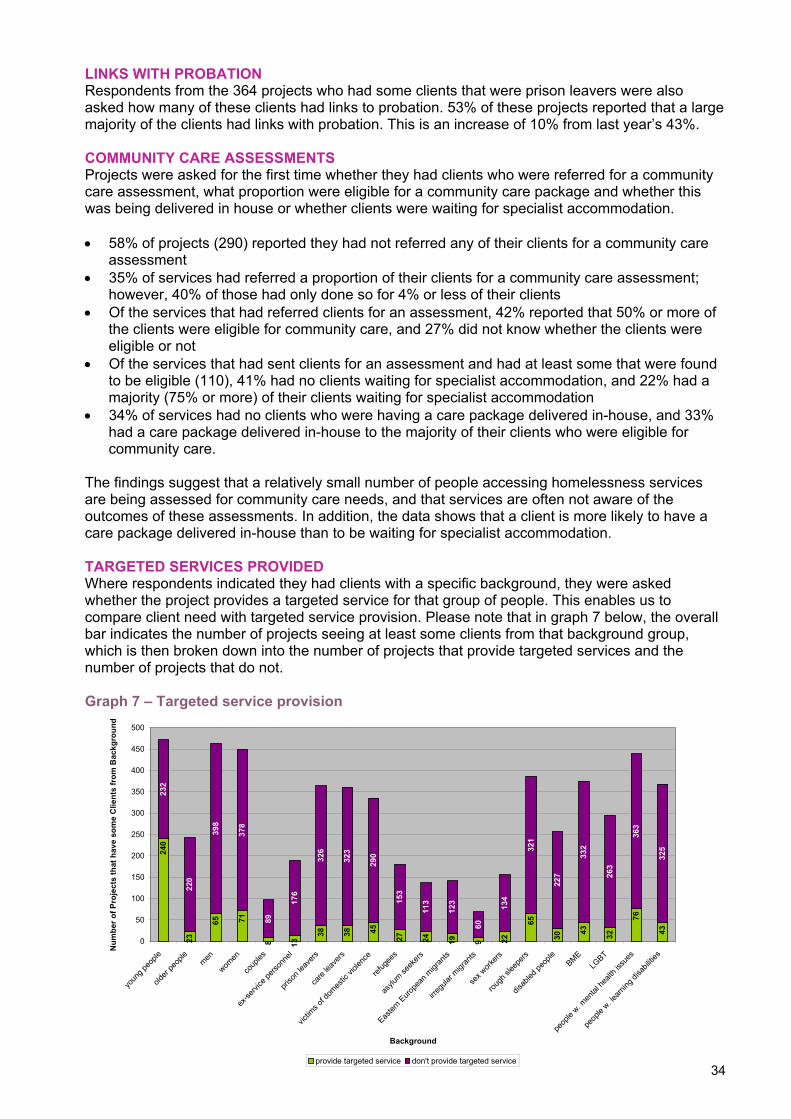
The findings suggest that a relatively small number of people accessing homelessness services are being assessed for community care needs, and that services are often not aware of the outcomes of these assessments. In addition, the data shows that a client is more likely to have a care package delivered in-house than to be waiting for specialist accommodation. TARGETED SERVICES PROVIDED Where respondents indicated they had clients with a specific background, they were asked whether the project provides a targeted service for that group of people. This enables us to compare client need with targeted service provision. Please note that in graph 7 below, the overall bar indicates the number of projects seeing at least some clients from that background group, which is then broken down into the number of projects that provide targeted services and the number of projects that do not. Graph 7 – Targeted service provision
240
23
65 71
8 13
38 38 45
27 24 19 9 22
65
30 43 32
76
43
232
220
398
378
89
176
326
323
290
153
113
123
60
134
321
227
332
263
363
325
0
50
100
150
200
250
300
350
400
450
500
youn
g peo
ple
older
peop
lemen
women
coup
les
ex-se
rvice
perso
nnel
priso
n lea
vers
care
leave
rs
victim
s of d
omes
tic vi
olenc
e
refug
ees
asylu
m seek
ers
Easter
n Euro
pean
migr
ants
irregu
lar m
igran
ts
sex w
orkers
rough
slee
pers
disab
led pe
ople
BMELG
BT
peop
le w. m
ental
healt
h iss
ues
peop
le w. le
arning
disa
bilitie
s
Background
Num
ber o
f Pro
ject
s th
at h
ave
som
e C
lient
s fr
om B
ackg
roun
d
provide targeted service don't provide targeted service
35
The graph shows that, overall, the sector is seeing increasing diversity, but does not appear to be developing targeted services in response to this. Some of these needs may be being met by referrals to external services:
• Despite the majority of projects seeing men and women, not many provide targeted services for these groups
• Only 17% of projects that see people with mental health issues provide targeted services for this group
• Just 12% of projects that report seeing people with learning disabilities provide any targeted services for this group of people
• Only 1 in 9 projects that see people from a black or minority ethnic background provide targeted services for this group
• Only 1 in 9 projects that see lesbian, gay, bisexual or transgender people provide targeted services for this group
• Just 13% of projects seeing victims of domestic violence provide targeted services for this group
36
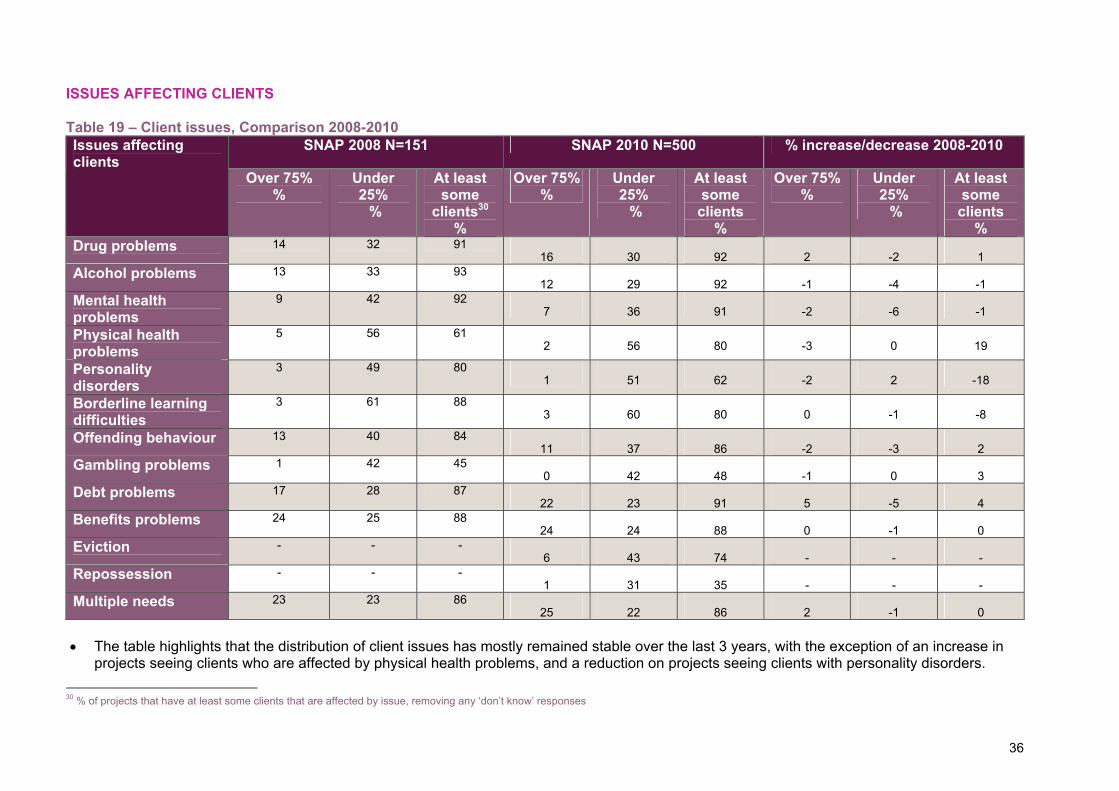
ISSUES AFFECTING CLIENTS Table 19 – Client issues, Comparison 2008-2010
• The table highlights that the distribution of client issues has mostly remained stable over the last 3 years, with the exception of an increase in
projects seeing clients who are affected by physical health problems, and a reduction on projects seeing clients with personality disorders. 30 % of projects that have at least some clients that are affected by issue, removing any ‘don’t know’ responses
SNAP 2008 N=151 SNAP 2010 N=500 % increase/decrease 2008-2010 Issues affecting clients
Over 75% %
Under 25% %
At least some
clients30 %
Over 75% %
Under 25% %
At least some
clients %
Over 75% %
Under 25% %
At least some
clients %
Drug problems 14 32 91 16 30 92 2 -2 1
Alcohol problems 13 33 93 12 29 92 -1 -4 -1
Mental health problems
9 42 92 7 36 91 -2 -6 -1
Physical health problems
5 56 61 2 56 80 -3 0 19
Personality disorders
3 49 80 1 51 62 -2 2 -18
Borderline learning difficulties
3 61 88 3 60 80 0 -1 -8
Offending behaviour 13 40 84 11 37 86 -2 -3 2
Gambling problems 1 42 45 0 42 48 -1 0 3
Debt problems 17 28 87 22 23 91 5 -5 4
Benefits problems 24 25 88 24 24 88 0 -1 0
Eviction - - - 6 43 74 - - -
Repossession - - - 1 31 35 - - -
Multiple needs 23 23 86 25 22 86 2 -1 0
37
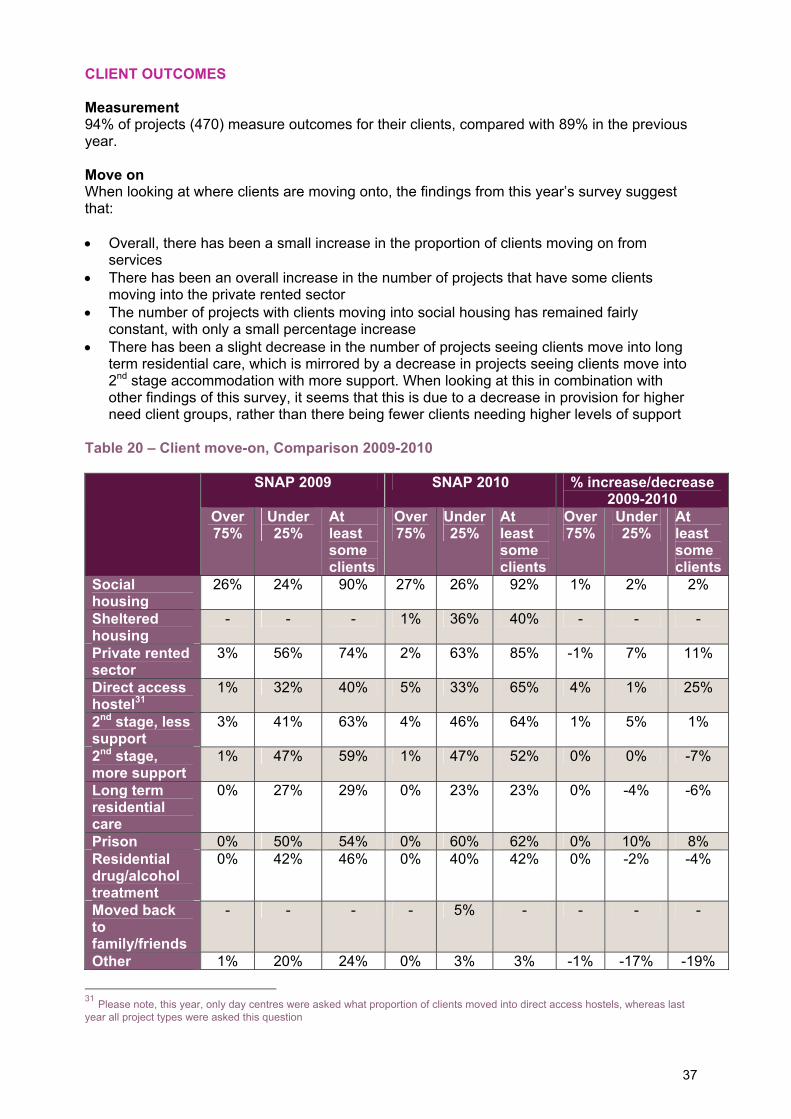
CLIENT OUTCOMES Measurement 94% of projects (470) measure outcomes for their clients, compared with 89% in the previous year. Move on When looking at where clients are moving onto, the findings from this year’s survey suggest that: • Overall, there has been a small increase in the proportion of clients moving on from
services • There has been an overall increase in the number of projects that have some clients
moving into the private rented sector • The number of projects with clients moving into social housing has remained fairly
constant, with only a small percentage increase • There has been a slight decrease in the number of projects seeing clients move into long
term residential care, which is mirrored by a decrease in projects seeing clients move into 2nd stage accommodation with more support. When looking at this in combination with other findings of this survey, it seems that this is due to a decrease in provision for higher need client groups, rather than there being fewer clients needing higher levels of support
Table 20 – Client move-on, Comparison 2009-2010
SNAP 2009 SNAP 2010 % increase/decrease 2009-2010
Over 75%
Under 25%
At least some clients
Over 75%
Under 25%
At least some clients
Over 75%
Under 25%
At least some clients
Social housing
26% 24% 90% 27% 26% 92% 1% 2% 2%
Sheltered housing
- - - 1% 36% 40% - - -
Private rented sector
3% 56% 74% 2% 63% 85% -1% 7% 11%
Direct access hostel31
1% 32% 40% 5% 33% 65% 4% 1% 25%
2nd stage, less support
3% 41% 63% 4% 46% 64% 1% 5% 1%
2nd stage, more support
1% 47% 59% 1% 47% 52% 0% 0% -7%
Long term residential care
0% 27% 29% 0% 23% 23% 0% -4% -6%
Prison 0% 50% 54% 0% 60% 62% 0% 10% 8% Residential drug/alcohol treatment
0% 42% 46% 0% 40% 42% 0% -2% -4%
Moved back to family/friends
- - - - 5% - - - -
Other 1% 20% 24% 0% 3% 3% -1% -17% -19%
31 Please note, this year, only day centres were asked what proportion of clients moved into direct access hostels, whereas last year all project types were asked this question

38
POSITIVE OUTCOMES This year, project managers were also asked about additional positive outcomes for clients. This can give some indication as to how the work that is being done around specialist service provision and client involvement is impacting positively on clients. • The findings show that there has been a positive impact from the increase in service
availability of education, training and employment as well as meaningful activity, with 91% of projects having some clients participating in desired training or education
• The relatively low numbers of projects with a high proportion of clients moving on to these positive outcomes may be explained by a very recent increase in service availability, meaning that the positive impact of this will reach a higher proportion of project clients in the coming years
• In addition, the impact of the significant increase in projects being able to access mental and physical health services can be seen when looking at the high proportion of projects reporting that over 75% of their clients are managing their overall health better
• 86% of projects have some clients that are moving onto paid work • 84% of projects have some clients that are participating in work like activities Table 21 – Positive move-on for clients
Proportion of clients that move on to… Over 75%
50-75% 25-49% Under 25%
None Don’t know
Paid work 1% (7) 11% (54)
20% (98)
54% (270)
6% (28) 9% (43)
Participates in desired training and/or education
11% (56)
21% (106)
23% (114)
36% (179)
2% (10) 7% (35)
Participates in leisure/cultural/faith and/or informal learning activities
11% (54)
16% (81)
14% (69)
40% (198)
6% (29) 14% (69)
Participates in any work-like activities
5% (27) 8% (40) 20% (98)
51% (257)
6% (30) 10% (48)
Managing their overall health better
42% (211)
26% (131)
12% (60)
9% (46) 1% (5) 9% (47)
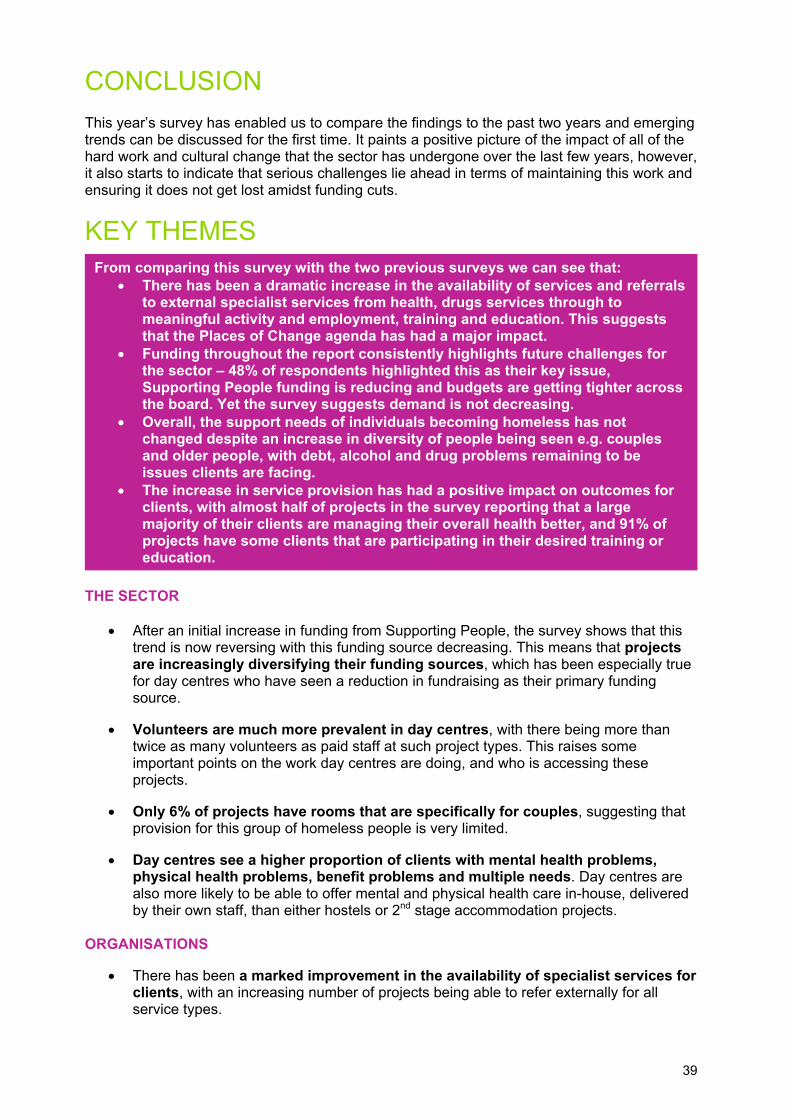
39
CONCLUSION This year’s survey has enabled us to compare the findings to the past two years and emerging trends can be discussed for the first time. It paints a positive picture of the impact of all of the hard work and cultural change that the sector has undergone over the last few years, however, it also starts to indicate that serious challenges lie ahead in terms of maintaining this work and ensuring it does not get lost amidst funding cuts.
KEY THEMES
THE SECTOR
• After an initial increase in funding from Supporting People, the survey shows that this trend is now reversing with this funding source decreasing. This means that projects are increasingly diversifying their funding sources, which has been especially true for day centres who have seen a reduction in fundraising as their primary funding source.
• Volunteers are much more prevalent in day centres, with there being more than
twice as many volunteers as paid staff at such project types. This raises some important points on the work day centres are doing, and who is accessing these projects.
• Only 6% of projects have rooms that are specifically for couples, suggesting that
provision for this group of homeless people is very limited.
• Day centres see a higher proportion of clients with mental health problems, physical health problems, benefit problems and multiple needs. Day centres are also more likely to be able to offer mental and physical health care in-house, delivered by their own staff, than either hostels or 2nd stage accommodation projects.
ORGANISATIONS
• There has been a marked improvement in the availability of specialist services for
clients, with an increasing number of projects being able to refer externally for all service types.
From comparing this survey with the two previous surveys we can see that: • There has been a dramatic increase in the availability of services and referrals
to external specialist services from health, drugs services through to meaningful activity and employment, training and education. This suggests that the Places of Change agenda has had a major impact.
• Funding throughout the report consistently highlights future challenges for the sector – 48% of respondents highlighted this as their key issue, Supporting People funding is reducing and budgets are getting tighter across the board. Yet the survey suggests demand is not decreasing.
• Overall, the support needs of individuals becoming homeless has not changed despite an increase in diversity of people being seen e.g. couples and older people, with debt, alcohol and drug problems remaining to be issues clients are facing.
• The increase in service provision has had a positive impact on outcomes for clients, with almost half of projects in the survey reporting that a large majority of their clients are managing their overall health better, and 91% of projects have some clients that are participating in their desired training or education.
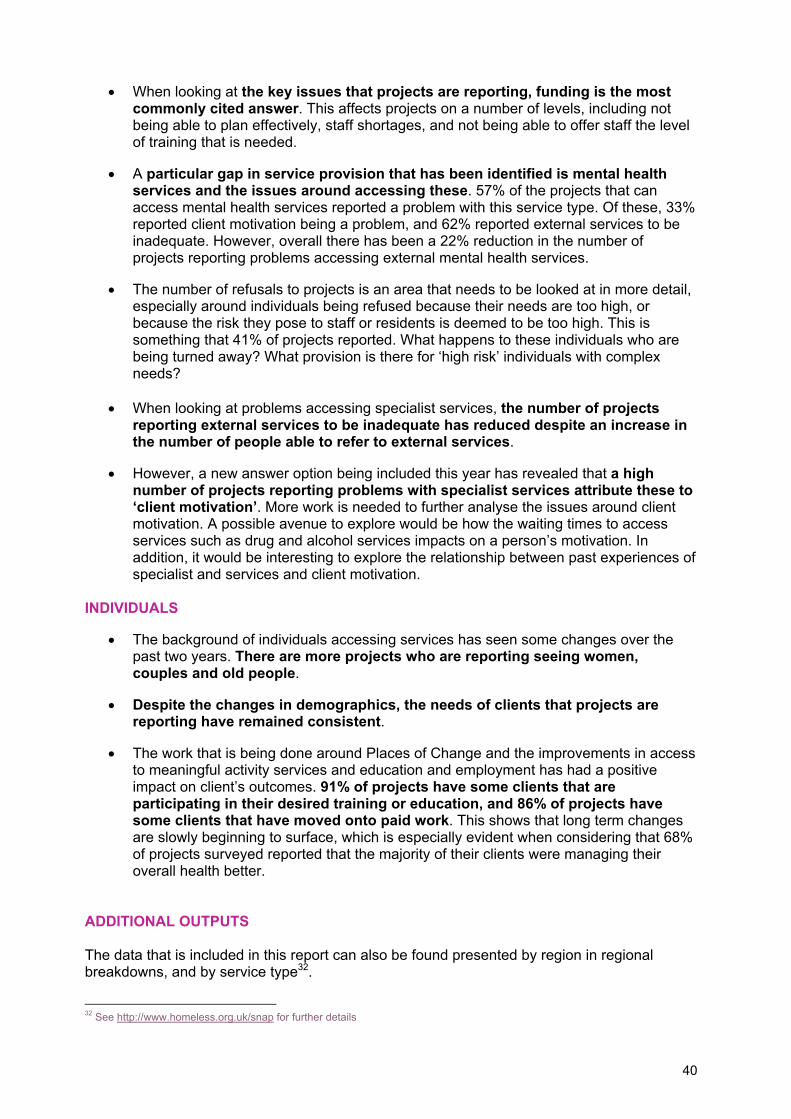
40
• When looking at the key issues that projects are reporting, funding is the most
commonly cited answer. This affects projects on a number of levels, including not being able to plan effectively, staff shortages, and not being able to offer staff the level of training that is needed.
• A particular gap in service provision that has been identified is mental health
services and the issues around accessing these. 57% of the projects that can access mental health services reported a problem with this service type. Of these, 33% reported client motivation being a problem, and 62% reported external services to be inadequate. However, overall there has been a 22% reduction in the number of projects reporting problems accessing external mental health services.
• The number of refusals to projects is an area that needs to be looked at in more detail,
especially around individuals being refused because their needs are too high, or because the risk they pose to staff or residents is deemed to be too high. This is something that 41% of projects reported. What happens to these individuals who are being turned away? What provision is there for ‘high risk’ individuals with complex needs?
• When looking at problems accessing specialist services, the number of projects
reporting external services to be inadequate has reduced despite an increase in the number of people able to refer to external services.
• However, a new answer option being included this year has revealed that a high
number of projects reporting problems with specialist services attribute these to ‘client motivation’. More work is needed to further analyse the issues around client motivation. A possible avenue to explore would be how the waiting times to access services such as drug and alcohol services impacts on a person’s motivation. In addition, it would be interesting to explore the relationship between past experiences of specialist and services and client motivation.
INDIVIDUALS
• The background of individuals accessing services has seen some changes over the past two years. There are more projects who are reporting seeing women, couples and old people.
• Despite the changes in demographics, the needs of clients that projects are
reporting have remained consistent.
• The work that is being done around Places of Change and the improvements in access to meaningful activity services and education and employment has had a positive impact on client’s outcomes. 91% of projects have some clients that are participating in their desired training or education, and 86% of projects have some clients that have moved onto paid work. This shows that long term changes are slowly beginning to surface, which is especially evident when considering that 68% of projects surveyed reported that the majority of their clients were managing their overall health better.
ADDITIONAL OUTPUTS The data that is included in this report can also be found presented by region in regional breakdowns, and by service type32.
32 See http://www.homeless.org.uk/snap for further details

41
APPENDICES APPENDIX I: THE SECTOR Table 22 - Staffing Levels in Day Centres N=58
Mean from survey sample
Mode (% of projects giving this answer) from
survey sample
Total
Full time 8 3 (41%) 490 Part time 4 0 (19%) 236 Volunteers 29 13 (26%) 1684 Total in sample 2410 Total in sector 7854
Table 23 - Staffing Levels in Direct Access Hostels N=98
Mean from survey sample
Mode (% of projects giving this answer) from
survey sample
Total
Full time 12 4 (9%) 1191 Part time 3 0 (28%) 289 Volunteers 7 0 (46%) 728 Total in sample 2208 Total in sector 7020
Table 24 - Staffing Levels in 2nd Stage Accommodation Projects N=344
Mean from survey sample
Mode (% of projects giving this answer) from
survey sample
Total
Full time 7 4 (13%) 2565 Part time 3 0 (26%) 887 Volunteers 2 0 (66%) 521 Total in sample 3973 Total in sector 14316
Table 25 - Primary Funding Stream Comparison 2008-2010
SNAP 2008
SNAP 2009
SNAP 2010
Funding stream % % % Frequency Supporting people 69% 80% 77% 384 Fundraising 14% 7% 5% 27 Don’t know/can’t say
- - 4% 22
Benefit payments 1% 6% 4% 21 Other local authority funding (local grant etc.)
7% 3% 3% 15
Other 4% 3% 2% 11 Rent & service charges
3% 1% 2% 9
Social services 1% 0% 2% 8 Health 1% 0% 0% 2 LAA/LSP 0% 0% 0% 1

42
APPENDIX II: ORGANISATIONS Table 26 - Service Availability Comparison 2008-2010 Type of service
Overall service availability SNAP 2008
Overall service availability SNAP 2009
Overall service availability SNAP 2010
Drug services 87% 91% 95% Structured treatment – residential detox/rehab
91% 95%
Structured treatment – day programmes
86%
92% 96%
Harm minimisation 87% 94% 96% Needle exchange - 89% 92% Blood borne virus screening/ vaccination
- 91% 93%
Alcohol services 88% 94% 96% Structured treatment – residential detox/rehab
93% 96%
Structured treatment – day programmes
89%
93% 97%
Harm minimisation 87% 95% 97% Mental health services 78% 93% 96% CMHT services - 94% 97% Other talking therapies 84% 93% 96% Other anger management courses 76% 92% 95% Other mediation/ relationship counselling
75% 93%
97%
Other - 22% 10% Physical health services 71% 90% 97% Nursing care 77% 86% 96% General Practitioner 82% 94% 99% Dental care 70% 91% 98% Alternative therapies 55% 85% 96% Eye care 66% 90% 98% Foot care 74% 89% 98% TB screening/contact with TB clinic
- 90%
97%
Sexual health services - 92% 98% Meaningful activity 61% 90% 94% Sports/Outward Bound® activities 67% 90% 95% Gardening, farming or environmental projects
53% 88% 90%
Arts, music and cultural projects 64% 92% 96% Other - 25% 17% Education, training and employment (ETE)
66% 89% 98%
IT services, computer skills training
71% 94% 98%
Literacy/numeracy courses 70% 94% 99% Into work training e.g. personal skills development, employment training & advice
62% 99%
Life skills e.g. cooking/budgeting 74%
95% 99%

43
Type of service
Overall service availability SNAP 2008
Overall service availability SNAP 2009
Overall service availability SNAP 2010
Accredited courses e.g. NVQ 55% 91% 96% General informal adult learning - 73% 94% Advice 92% 97% 99% Benefits 95% 97% 99% Debt/financial 91% 98% 99% Legal 85% 96% 99% Housing 95% 98% 99% Resettlement 59% 86% 92% Rent deposit scheme 46% 80% 88% Resettlement/move on scheme 71% 91% 96%
Table 27 - Service Access Problems Comparison 2009-2010
Type of service
Problems accessing service
2009 %
Problems accessing service 2010 %
Drug services 35% 47% Alcohol services 40% 53% Mental health services 46% 57% Physical health services 15% 23% Meaningful activity 25% 46% Education, training and employment (ETE)
22% 45%
Advice 18% 20% Resettlement 26% 29%
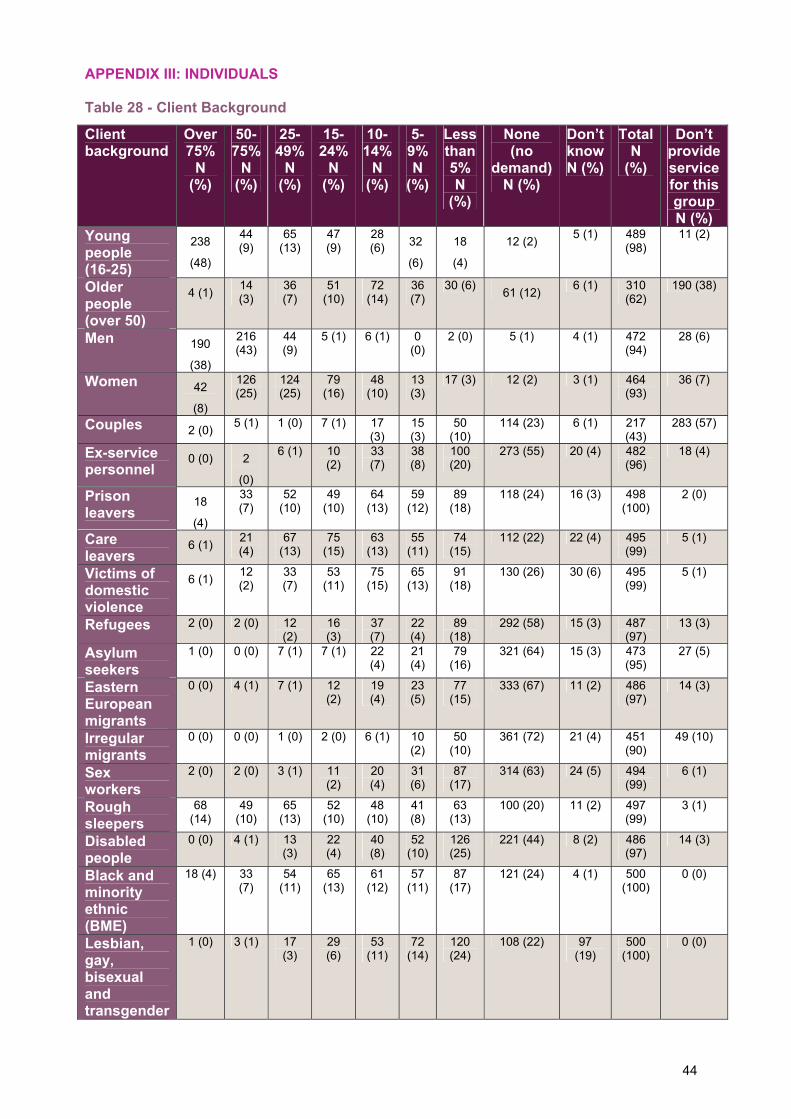
44
APPENDIX III: INDIVIDUALS Table 28 - Client Background
Client background
Over 75%
N (%)
50-75%
N (%)
25-49%
N (%)
15-24%
N (%)
10-14%
N (%)
5-9%N
(%)
Less than 5% N
(%)
None (no
demand)N (%)
Don’t know N (%)
Total N
(%)
Don’t provide service for this group N (%)
Young people (16-25)
238
(48)
44 (9)
65 (13)
47 (9)
28 (6) 32
(6)
18
(4)
12 (2) 5 (1) 489 (98)
11 (2)
Older people (over 50)
4 (1) 14 (3)
36 (7)
51 (10)
72 (14)
36 (7)
30 (6) 61 (12) 6 (1) 310 (62)
190 (38)
Men 190
(38)
216 (43)
44 (9)
5 (1) 6 (1) 0 (0)
2 (0) 5 (1) 4 (1) 472 (94)
28 (6)
Women 42
(8)
126 (25)
124 (25)
79 (16)
48 (10)
13 (3)
17 (3) 12 (2) 3 (1) 464 (93)
36 (7)
Couples 2 (0) 5 (1) 1 (0) 7 (1) 17 (3)
15 (3)
50 (10)
114 (23) 6 (1) 217 (43)
283 (57)
Ex-service personnel
0 (0) 2
(0)
6 (1) 10 (2)
33 (7)
38 (8)
100 (20)
273 (55) 20 (4) 482 (96)
18 (4)
Prison leavers
18
(4)
33 (7)
52 (10)
49 (10)
64 (13)
59 (12)
89 (18)
118 (24) 16 (3) 498 (100)
2 (0)
Care leavers
6 (1) 21 (4)
67 (13)
75 (15)
63 (13)
55 (11)
74 (15)
112 (22) 22 (4) 495 (99)
5 (1)
Victims of domestic violence
6 (1) 12 (2)
33 (7)
53 (11)
75 (15)
65 (13)
91 (18)
130 (26) 30 (6) 495 (99)
5 (1)
Refugees 2 (0) 2 (0) 12 (2)
16 (3)
37 (7)
22 (4)
89 (18)
292 (58) 15 (3) 487 (97)
13 (3)
Asylum seekers
1 (0) 0 (0) 7 (1) 7 (1) 22 (4)
21 (4)
79 (16)
321 (64) 15 (3) 473 (95)
27 (5)
Eastern European migrants
0 (0) 4 (1) 7 (1) 12 (2)
19 (4)
23 (5)
77 (15)
333 (67) 11 (2) 486 (97)
14 (3)
Irregular migrants
0 (0) 0 (0) 1 (0) 2 (0) 6 (1) 10 (2)
50 (10)
361 (72) 21 (4) 451 (90)
49 (10)
Sex workers
2 (0) 2 (0) 3 (1) 11 (2)
20 (4)
31 (6)
87 (17)
314 (63) 24 (5) 494 (99)
6 (1)
Rough sleepers
68 (14)
49 (10)
65 (13)
52 (10)
48 (10)
41 (8)
63 (13)
100 (20) 11 (2) 497 (99)
3 (1)
Disabled people
0 (0) 4 (1) 13 (3)
22 (4)
40 (8)
52 (10)
126 (25)
221 (44) 8 (2) 486 (97)
14 (3)
Black and minority ethnic (BME)
18 (4) 33 (7)
54 (11)
65 (13)
61 (12)
57 (11)
87 (17)
121 (24) 4 (1) 500 (100)
0 (0)
Lesbian, gay, bisexual and transgender
1 (0) 3 (1) 17 (3)
29 (6)
53 (11)
72 (14)
120 (24)
108 (22) 97 (19)
500 (100)
0 (0)
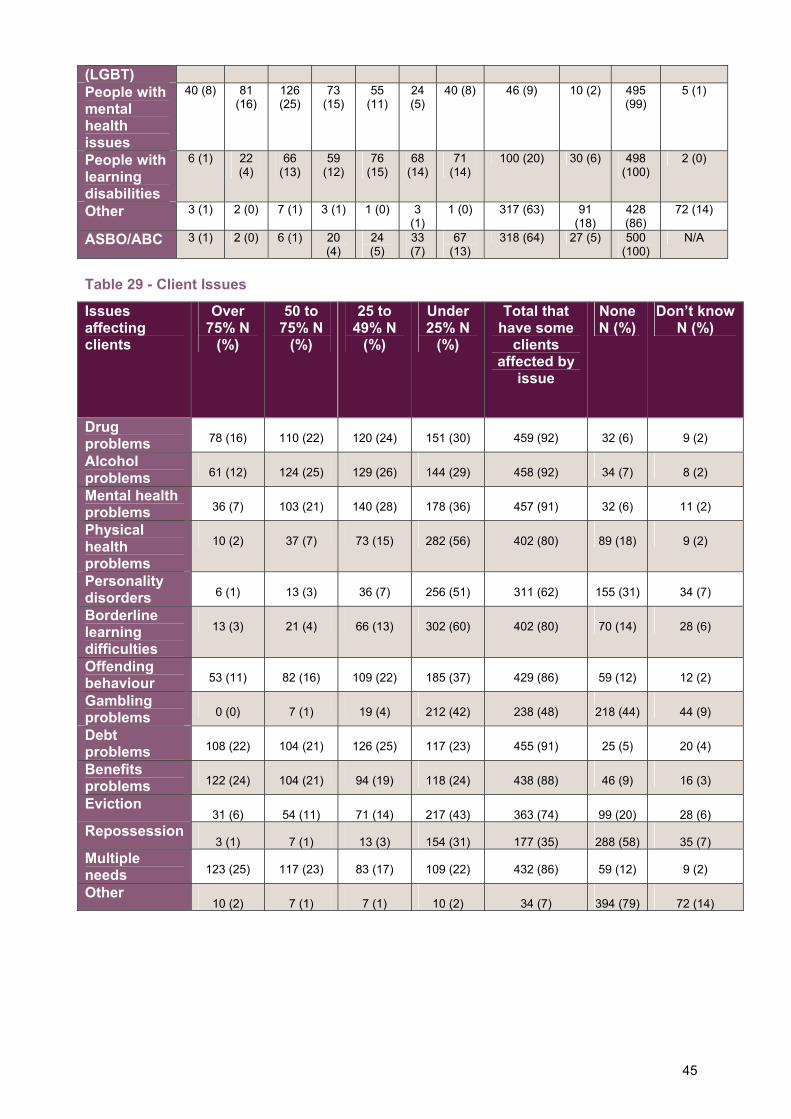
45
(LGBT) People with mental health issues
40 (8) 81 (16)
126 (25)
73 (15)
55 (11)
24 (5)
40 (8) 46 (9) 10 (2) 495 (99)
5 (1)
People with learning disabilities
6 (1) 22 (4)
66 (13)
59 (12)
76 (15)
68 (14)
71 (14)
100 (20) 30 (6) 498 (100)
2 (0)
Other 3 (1) 2 (0) 7 (1) 3 (1) 1 (0) 3 (1)
1 (0) 317 (63) 91 (18)
428 (86)
72 (14)
ASBO/ABC 3 (1) 2 (0) 6 (1) 20 (4)
24 (5)
33 (7)
67 (13)
318 (64) 27 (5) 500 (100)
N/A
Table 29 - Client Issues
Issues affecting clients
Over 75% N
(%)
50 to 75% N
(%)
25 to 49% N
(%)
Under 25% N
(%)
Total that have some
clients affected by
issue
None N (%)
Don’t know N (%)
Drug problems 78 (16) 110 (22) 120 (24) 151 (30) 459 (92) 32 (6) 9 (2)
Alcohol problems 61 (12) 124 (25) 129 (26) 144 (29) 458 (92) 34 (7) 8 (2)
Mental health problems 36 (7) 103 (21) 140 (28) 178 (36) 457 (91) 32 (6) 11 (2)
Physical health problems
10 (2) 37 (7) 73 (15) 282 (56) 402 (80) 89 (18) 9 (2)
Personality disorders 6 (1) 13 (3) 36 (7) 256 (51) 311 (62) 155 (31) 34 (7)
Borderline learning difficulties
13 (3) 21 (4) 66 (13) 302 (60) 402 (80) 70 (14) 28 (6)
Offending behaviour 53 (11) 82 (16) 109 (22) 185 (37) 429 (86) 59 (12) 12 (2)
Gambling problems 0 (0) 7 (1) 19 (4) 212 (42) 238 (48) 218 (44) 44 (9)
Debt problems 108 (22) 104 (21) 126 (25) 117 (23) 455 (91) 25 (5) 20 (4)
Benefits problems 122 (24) 104 (21) 94 (19) 118 (24) 438 (88) 46 (9) 16 (3)
Eviction 31 (6) 54 (11) 71 (14) 217 (43) 363 (74) 99 (20) 28 (6)
Repossession 3 (1) 7 (1) 13 (3) 154 (31) 177 (35) 288 (58) 35 (7)
Multiple needs 123 (25) 117 (23) 83 (17) 109 (22) 432 (86) 59 (12) 9 (2)
Other 10 (2) 7 (1) 7 (1) 10 (2) 34 (7) 394 (79) 72 (14)
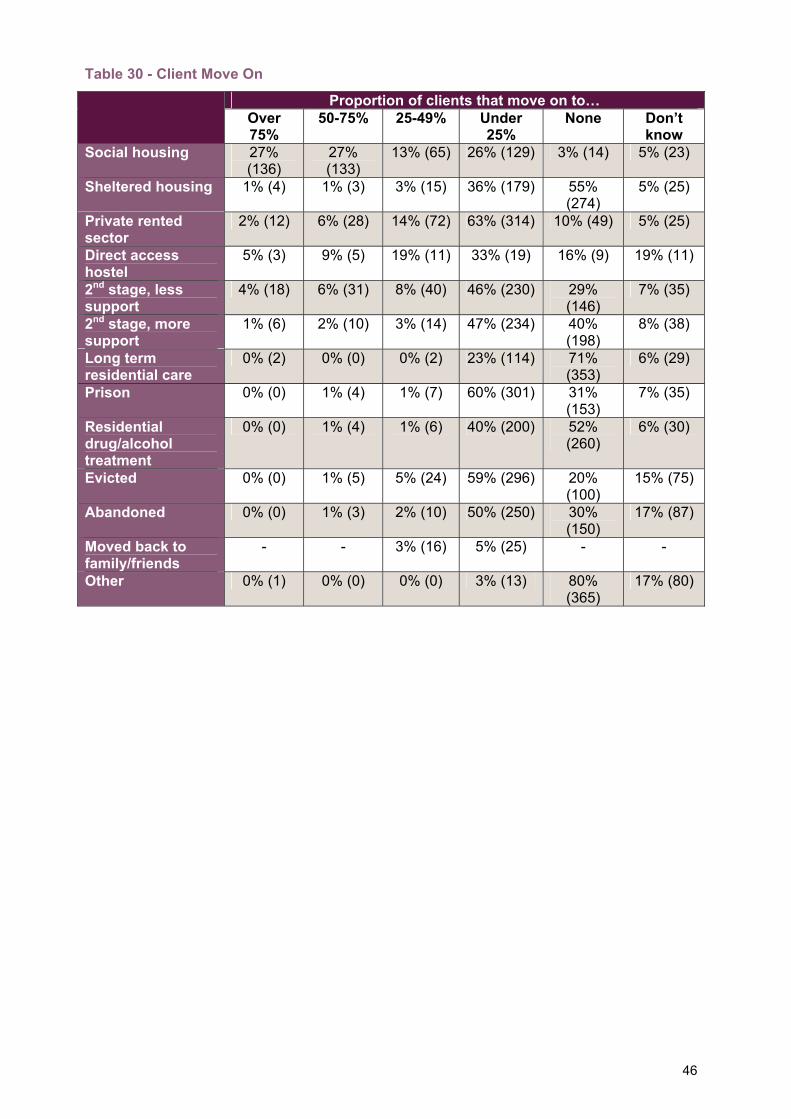
46
Table 30 - Client Move On
Proportion of clients that move on to… Over 75%
50-75% 25-49% Under 25%
None Don’t know
Social housing 27% (136)
27% (133)
13% (65) 26% (129) 3% (14) 5% (23)
Sheltered housing 1% (4) 1% (3) 3% (15) 36% (179) 55% (274)
5% (25)
Private rented sector
2% (12) 6% (28) 14% (72) 63% (314) 10% (49) 5% (25)
Direct access hostel
5% (3) 9% (5) 19% (11) 33% (19) 16% (9) 19% (11)
2nd stage, less support
4% (18) 6% (31) 8% (40) 46% (230) 29% (146)
7% (35)
2nd stage, more support
1% (6) 2% (10) 3% (14) 47% (234) 40% (198)
8% (38)
Long term residential care
0% (2) 0% (0) 0% (2) 23% (114) 71% (353)
6% (29)
Prison 0% (0) 1% (4) 1% (7) 60% (301) 31% (153)
7% (35)
Residential drug/alcohol treatment
0% (0) 1% (4) 1% (6) 40% (200) 52% (260)
6% (30)
Evicted 0% (0) 1% (5) 5% (24) 59% (296) 20% (100)
15% (75)
Abandoned 0% (0) 1% (3) 2% (10) 50% (250) 30% (150)
17% (87)
Moved back to family/friends
- - 3% (16) 5% (25) - -
Other 0% (1) 0% (0) 0% (0) 3% (13) 80% (365)
17% (80)