Embed Size (px)
Citation preview
Waste-To-Energy Research and Technology CouncilTechnology Council
Survey of Metal Recovery in the U.S. WTE Industryy
Werner SunkWaste-to-Energy Research and Technology Council (WTERT),gy gy ( ),
Earth Engineering Center, Columbia University
15th Annual North American Waste-to-Energy ConferenceMay 21th to 23th, 2007, Miami, Fl
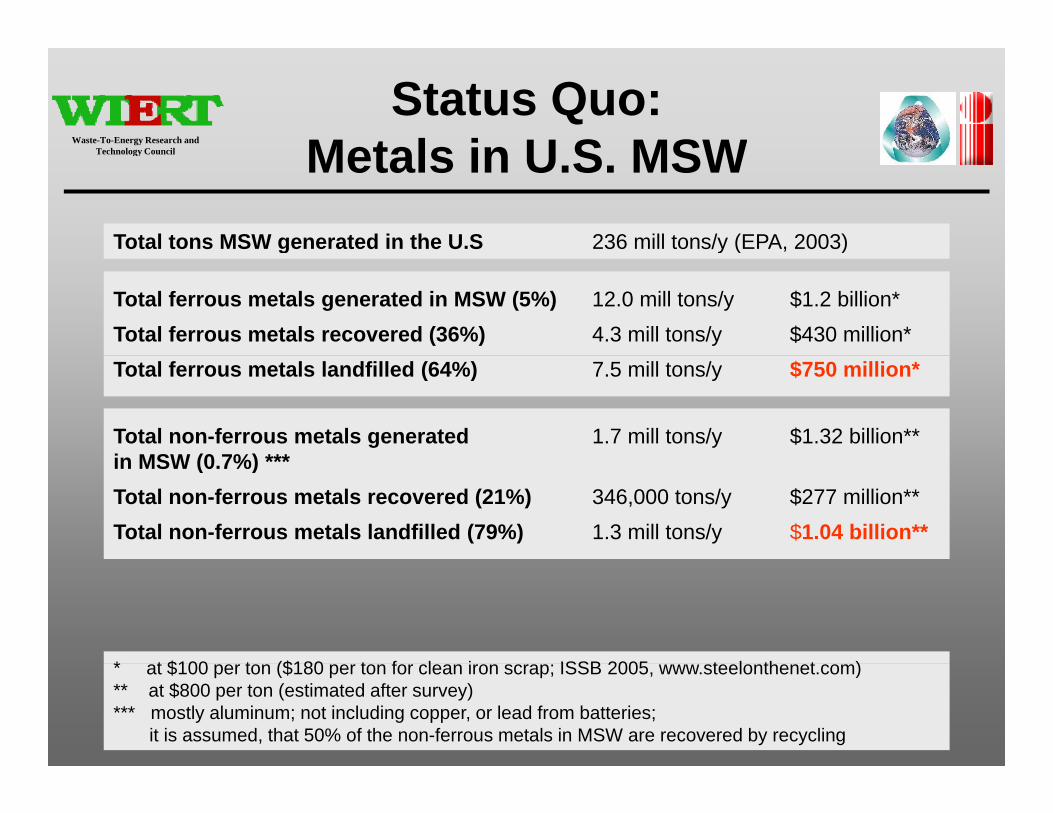
Status Quo: Metals in U S MSWWaste-To-Energy Research and
Technology Council Metals in U.S. MSWTotal tons MSW generated in the U.S 236 mill tons/y (EPA, 2003)
Technology Council
g y ( )
Total ferrous metals generated in MSW (5%) 12.0 mill tons/y $1.2 billion*Total ferrous metals recovered (36%) 4.3 mill tons/y $430 million*Total ferrous metals landfilled (64%) 7.5 mill tons/y $750 million*
Total non-ferrous metals generated 1.7 mill tons/y $1.32 billion** in MSW (0 7%) ***in MSW (0.7%) ***Total non-ferrous metals recovered (21%) 346,000 tons/y $277 million**Total non-ferrous metals landfilled (79%) 1.3 mill tons/y $1.04 billion**
* t $100 t ($180 t f l i ISSB 2005 t l th t )* at $100 per ton ($180 per ton for clean iron scrap; ISSB 2005, www.steelonthenet.com)** at $800 per ton (estimated after survey)*** mostly aluminum; not including copper, or lead from batteries;
it is assumed, that 50% of the non-ferrous metals in MSW are recovered by recycling
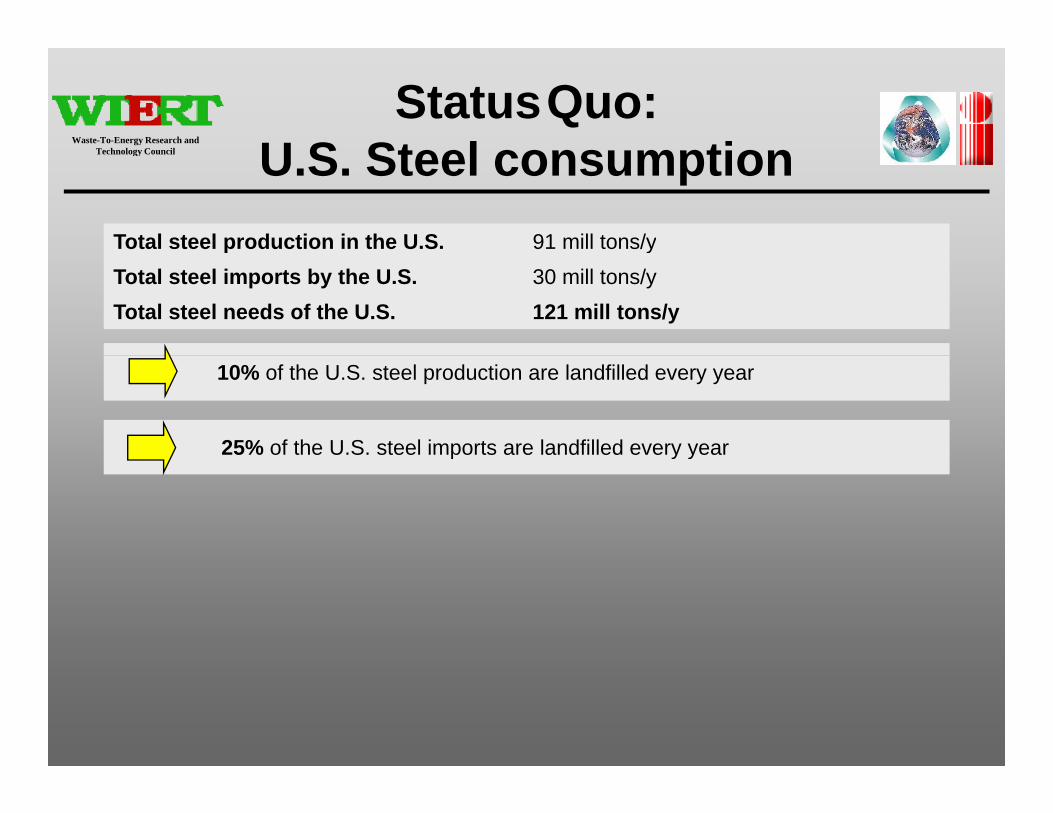
StatusQuo:U S Steel cons mptionWaste-To-Energy Research and
Technology Council
Total steel production in the U.S. 91 mill tons/y
U.S. Steel consumptionTechnology Council
p yTotal steel imports by the U.S. 30 mill tons/yTotal steel needs of the U.S. 121 mill tons/y
10% of the U.S. steel production are landfilled every year
25% of the U.S. steel imports are landfilled every yearp y y
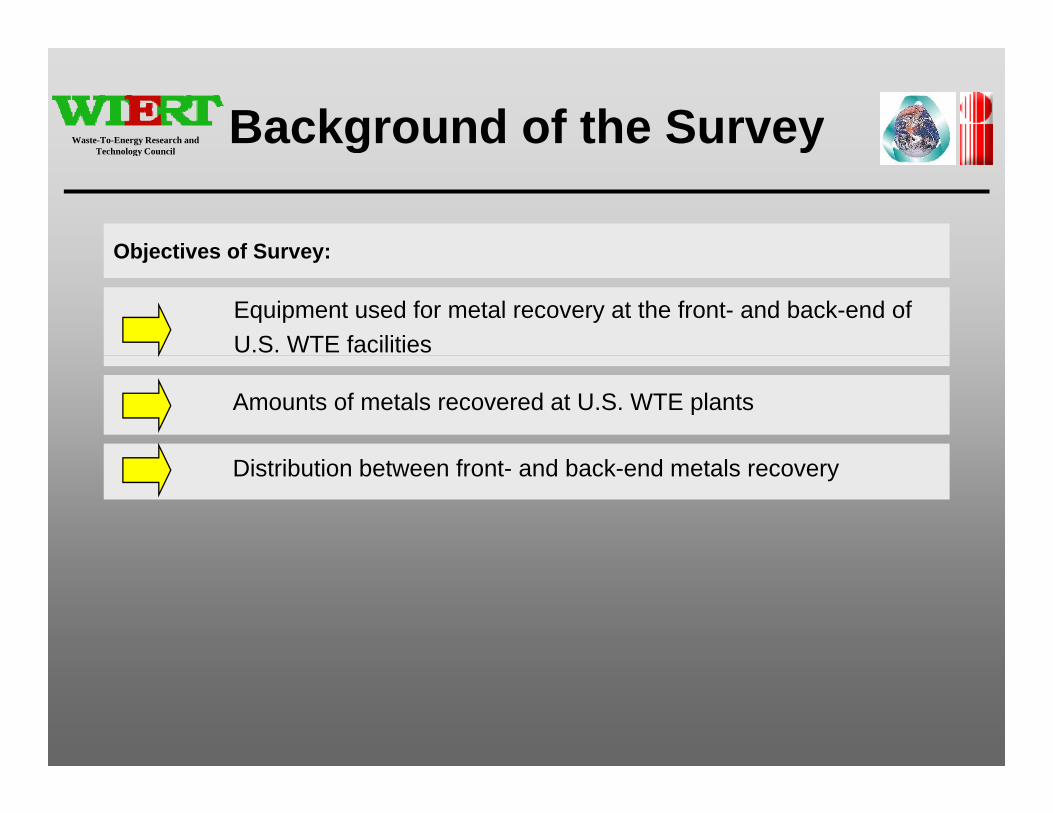
Background of the SurveyWaste-To-Energy Research and Technology Council
g y
Objectives of Survey:
Technology Council
Equipment used for metal recovery at the front- and back-end of U.S. WTE facilities
Objectives of Survey:
Amounts of metals recovered at U.S. WTE plants
Distribution between front- and back-end metals recovery

The QuestionnaireWaste-To-Energy Research and Technology Council
4. System used for metal recovery (processing and separation):
Technology Council
Questionnaire on WTE Metal Recovery
(Please describe the equipment used on separate sheet as detailed a possible)
pre-combustion post-combustion
Manual Shredder Screens/other mech. separation equipment
Name of WTE facility and operating company:
Address:
Name and e-mail of person responding to
Magnetic separation
Eddy current separation
other
5. Quality of ferrous and non-ferrous metals recovered:
Do you mix the magnetically and mechanically (e.g. grizzly feeder) recovered ferrous metals?person responding to
this questionnaire:
Position:
1. Total Tons MSW processed in 2004? 2 Total tons of ferrous metal recovered in 2004?
ferrous metals? Yes No
Do you mix the metal fractions recovered before and after combustion? Ferrous metals Yes No Non-ferrous metals Yes No If metals are sold separately, which stream is more valuable (per ton of metal)?
2. Total tons of ferrous metal recovered in 2004? % recovered at tipping floor before MSW processing % recovered after MSW shredding (for RDF plants only) % recovered from ash 3. Total tons of non-ferrous metal recovered in 2004? % recovered at tipping floor before MSW processing
Before combustion
After combustion
Do you perform any further on-site metal processing for beneficiation after recovery (such as cleaning, sorting/sifting, bailing, etc.)?
Yes No
If yes please describe % recovered after MSW shredding (for RDF plants only) % recovered from ash
If yes, please describe
Thank you for participating in this survey! Please send your response to Werner Sunk at WTERT
([email protected]; Fax 212 854 5213)
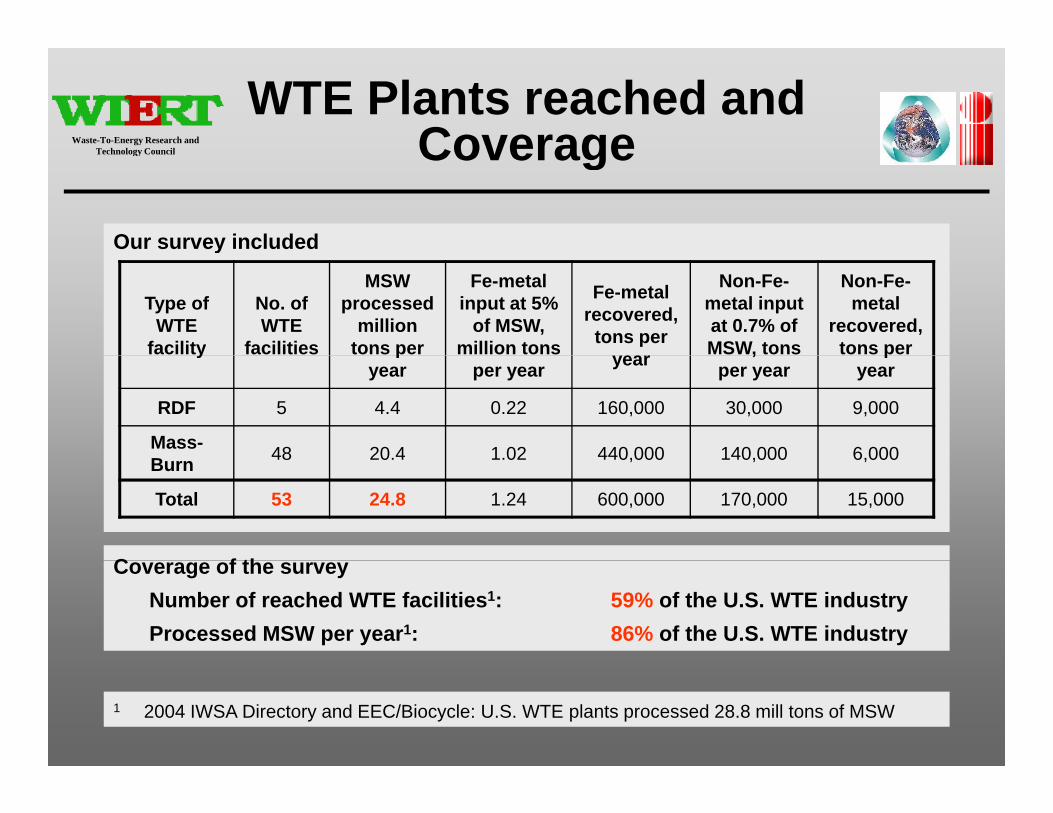
WTE Plants reached and CoverageWaste-To-Energy Research and
Technology Council Coverage
Our survey included
Technology Council
y
Type of WTE
facility
No. of WTE
facilities
MSW processed
million tons per
Fe-metal input at 5%
of MSW, million tons
Fe-metal recovered,
tons per
Non-Fe-metal input at 0.7% of MSW, tons
Non-Fe-metal
recovered, tons per y p
year per year year ,per year
pyear
RDF 5 4.4 0.22 160,000 30,000 9,000
Mass-B 48 20.4 1.02 440,000 140,000 6,000
C f th
Burn 48 20.4 1.02 440,000 140,000 6,000
Total 53 24.8 1.24 600,000 170,000 15,000
Coverage of the surveyNumber of reached WTE facilities1: 59% of the U.S. WTE industryProcessed MSW per year1: 86% of the U.S. WTE industry
1 2004 IWSA Directory and EEC/Biocycle: U.S. WTE plants processed 28.8 mill tons of MSW
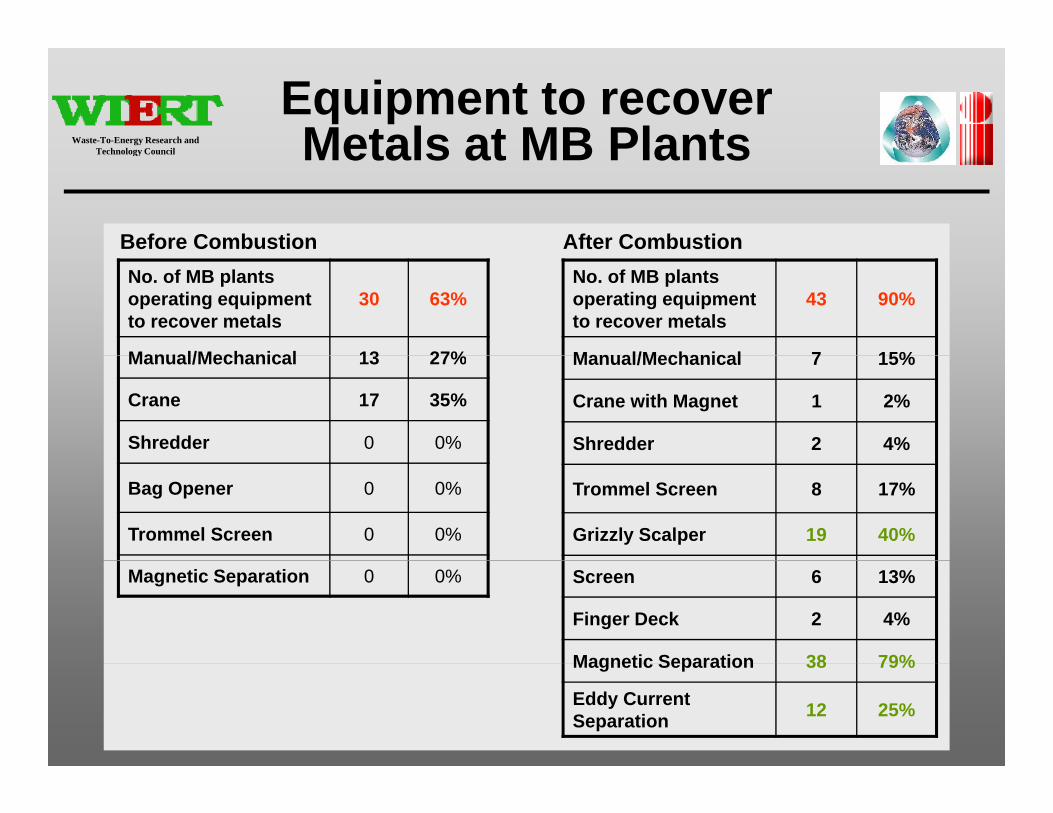
Equipment to recover Metals at MB PlantsWaste-To-Energy Research and
Technology Council Metals at MB Plants
Before Combustion After Combustion
Technology Council
No. of MB plants operating equipment to recover metals
30 63%
Manual/Mechanical 13 27%
No. of MB plants operating equipment to recover metals
43 90%
Manual/Mechanical 7 15%Manual/Mechanical 13 27%
Crane 17 35%
Shredder 0 0%
Manual/Mechanical 7 15%
Crane with Magnet 1 2%
Shredder 2 4%
Bag Opener 0 0%
Trommel Screen 0 0%
Trommel Screen 8 17%
Grizzly Scalper 19 40%
Magnetic Separation 0 0% Screen 6 13%
Finger Deck 2 4%
Magnetic Separation 38 79%Magnetic Separation 38 79%
Eddy Current Separation 12 25%
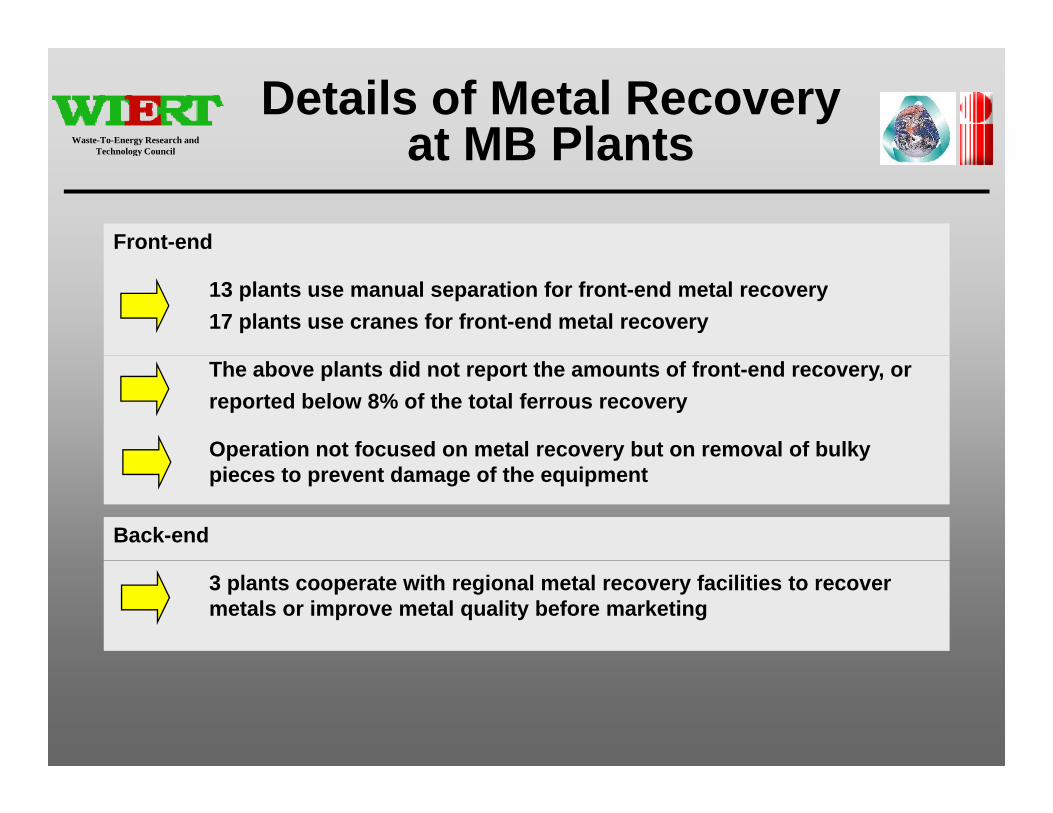
Details of Metal Recovery at MB PlantsWaste-To-Energy Research and
Technology Council at MB Plants
Front-end
Technology Council
13 plants use manual separation for front-end metal recovery17 plants use cranes for front-end metal recovery
The above plants did not report the amounts of front-end recovery, orreported below 8% of the total ferrous recovery
Operation not focused on metal recovery but on removal of bulky p y ypieces to prevent damage of the equipment
Back-end
3 plants cooperate with regional metal recovery facilities to recover metals or improve metal quality before marketing

Equipment to recover Metals at RDF PlantsWaste-To-Energy Research and
Technology Council Metals at RDF Plants
Before Combustion After Combustion
Technology Council
No. of RDF plants operating equipment to recover metals
5 100%
Manual/Mechanical 2 40%
No. of RDF plants operating equipment to recover metals
3 60%
Manual/Mechanical 2 40%Manual/Mechanical 2 40%
Crane 1 20%
Shredder 5 100%
Manual/Mechanical 2 40%
Crane with Magnet 0 0%
Shredder 1 20%
Bag Opener 1 20%
Trommel Screen 1 20%
Trommel Screen 0 0%
Grizzly Scalper 0 0%
Magnetic Separation 5 100% Screen 0 0%
Finger Deck 0 0%
Magnetic Separation 3 60%Magnetic Separation 3 60%
Eddy Current Separation 3 60%
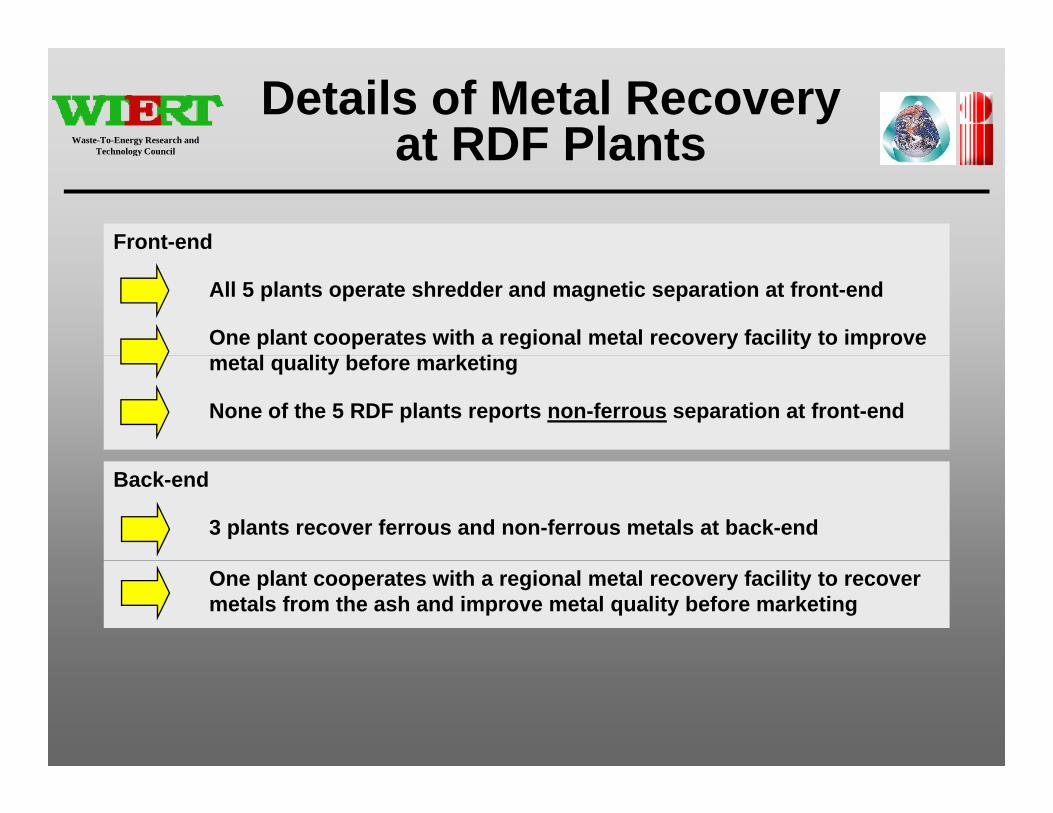
Details of Metal Recovery at RDF PlantsWaste-To-Energy Research and
Technology Council at RDF Plants
Front-end
Technology Council
All 5 plants operate shredder and magnetic separation at front-end
One plant cooperates with a regional metal recovery facility to improve t l lit b f k timetal quality before marketing
None of the 5 RDF plants reports non-ferrous separation at front-end
Back-end
3 plants recover ferrous and non-ferrous metals at back-end
One plant cooperates with a regional metal recovery facility to recover metals from the ash and improve metal quality before marketing

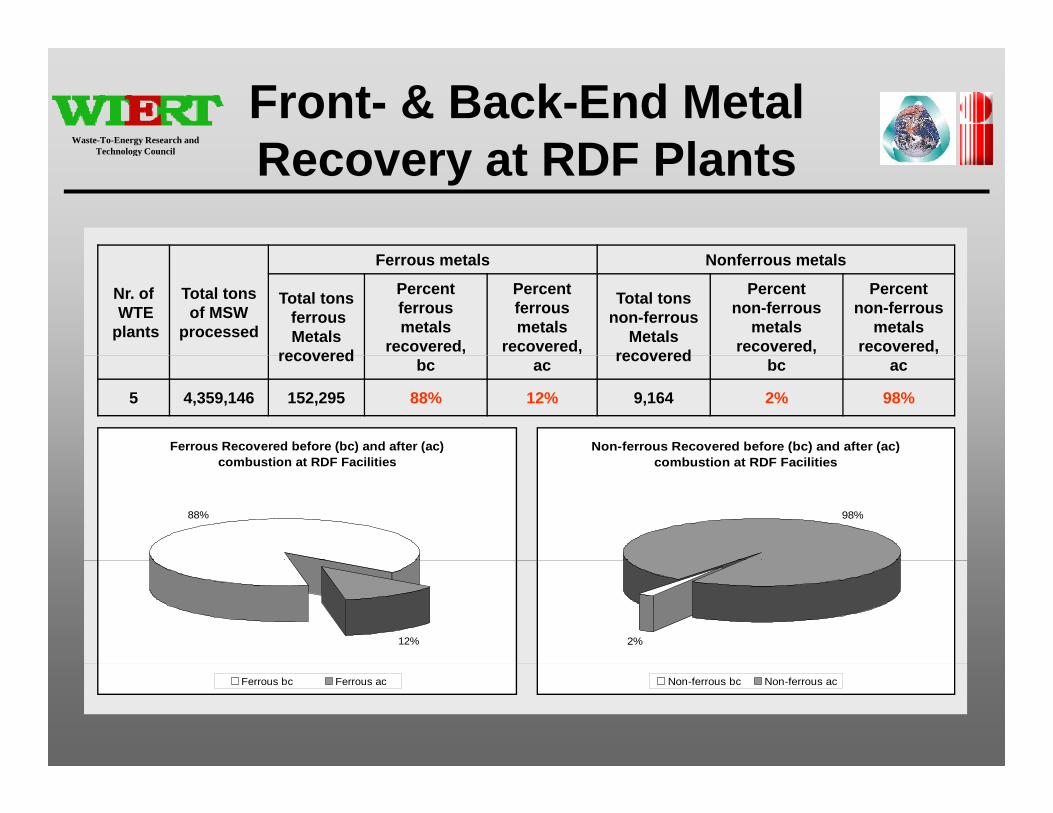
Front- & Back-End Metal Reco er at MB PlantsWaste-To-Energy Research and
Technology Council Recovery at MB PlantsTechnology Council
Nr. ofWTE
plants
Total tonsof MSW
processed
Ferrous metals Nonferrous metals
Total tonsferrousMetals
recovered
Percentferrousmetals
recovered,
Percentferrousmetals
recovered,
Total tonsnon-ferrous
Metalsrecovered
Percentnon-ferrous
metalsrecovered,
Percentnon-ferrous
metalsrecovered,recovered bc ac recovered bc ac
48 20,377,274 439,868 1% 99% 6,714 6% 94%
Ferrous Recovered before (bc) and after (ac) b ti t M B F iliti
Non-ferrous Recovered before (bc) and after (ac) b ti t M B F iliticombustion at Mass Burn Facilities
99%
combustion at Mass Burn Facilities
94%
1% 6%
Ferrous bc Ferrous ac Non-ferrous bc Non-ferrous ac
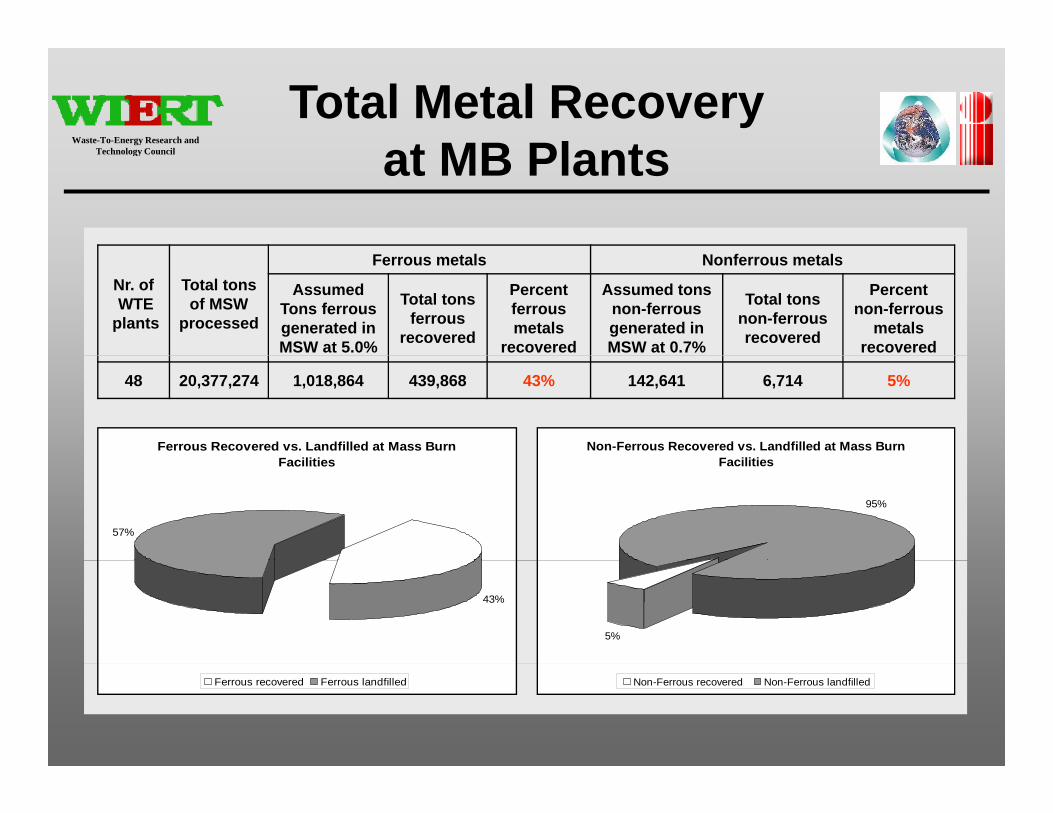
Total Metal Recovery at MB PlantsWaste-To-Energy Research and
Technology Council at MB PlantsTechnology Council
Nr. ofWTE
plants
Total tonsof MSW
processed
Ferrous metals Nonferrous metals
AssumedTons ferrousgenerated inMSW at 5.0%
Total tonsferrous
recovered
Percentferrousmetals
recovered
Assumed tonsnon-ferrousgenerated inMSW at 0.7%
Total tonsnon-ferrousrecovered
Percentnon-ferrous
metalsrecovered
48 20,377,274 1,018,864 439,868 43% 142,641 6,714 5%
Ferrous Recovered vs. Landfilled at Mass Burn F iliti
Non-Ferrous Recovered vs. Landfilled at Mass Burn F ilitiFacilities
57%
Facilities
95%
43%
5%
Ferrous recovered Ferrous landfilled Non-Ferrous recovered Non-Ferrous landfilled
Front- & Back-End Metal Reco er at RDF PlantsWaste-To-Energy Research and
Technology Council Recovery at RDF PlantsTechnology Council
Nr. ofWTE
plants
Total tonsof MSW
processed
Ferrous metals Nonferrous metals
Total tonsferrousMetals
recovered
Percentferrousmetals
recovered,
Percentferrousmetals
recovered,
Total tonsnon-ferrous
Metalsrecovered
Percentnon-ferrous
metalsrecovered,
Percentnon-ferrous
metalsrecovered,recovered bc ac recovered bc ac
5 4,359,146 152,295 88% 12% 9,164 2% 98%
Ferrous Recovered before (bc) and after (ac) b ti t RDF F iliti
Non-ferrous Recovered before (bc) and after (ac) b ti t RDF F iliticombustion at RDF Facilities
88%
combustion at RDF Facilities
98%
12% 2%
Ferrous bc Ferrous ac Non-ferrous bc Non-ferrous ac
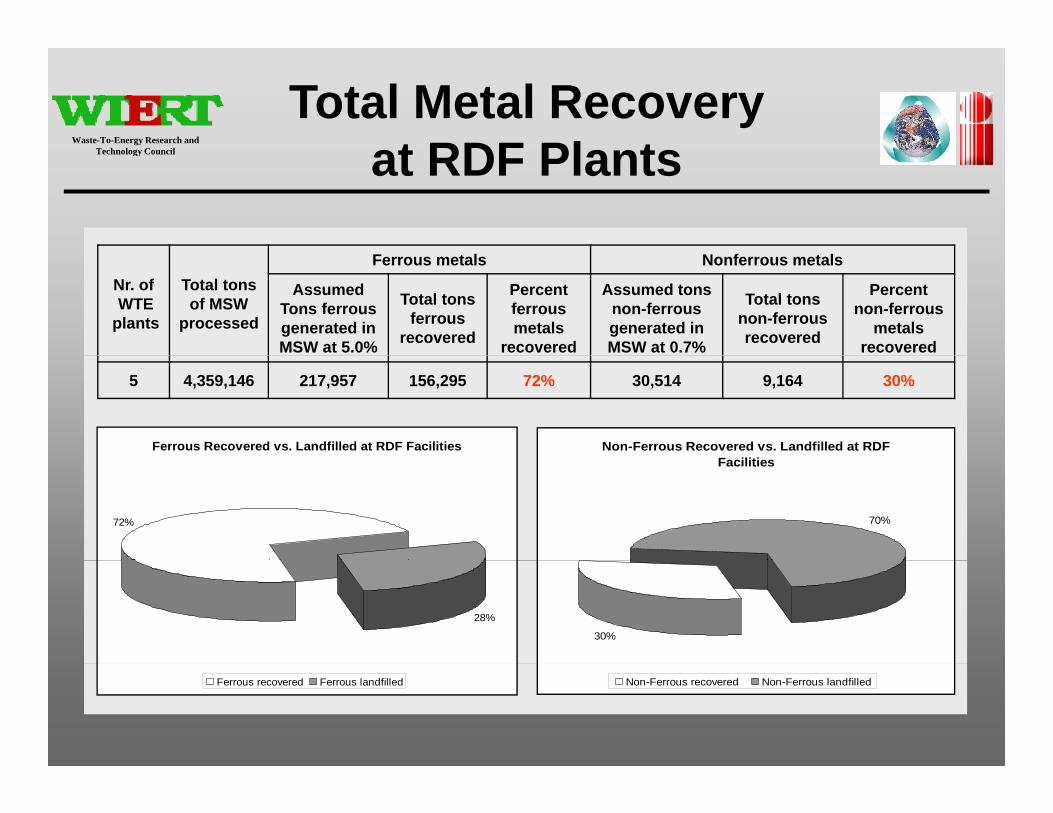
Total Metal Recovery at RDF PlantsWaste-To-Energy Research and
Technology Council at RDF PlantsTechnology Council
Nr. ofWTE
plants
Total tonsof MSW
processed
Ferrous metals Nonferrous metals
AssumedTons ferrousgenerated inMSW at 5.0%
Total tonsferrous
recovered
Percentferrousmetals
recovered
Assumed tonsnon-ferrousgenerated inMSW at 0.7%
Total tonsnon-ferrousrecovered
Percentnon-ferrous
metalsrecovered
5 4,359,146 217,957 156,295 72% 30,514 9,164 30%
Ferrous Recovered vs. Landfilled at RDF Facilities Non-Ferrous Recovered vs. Landfilled at RDF F iliti
72%
Facilities
70%
28%
30%
Ferrous recovered Ferrous landfilled Non-Ferrous recovered Non-Ferrous landfilled
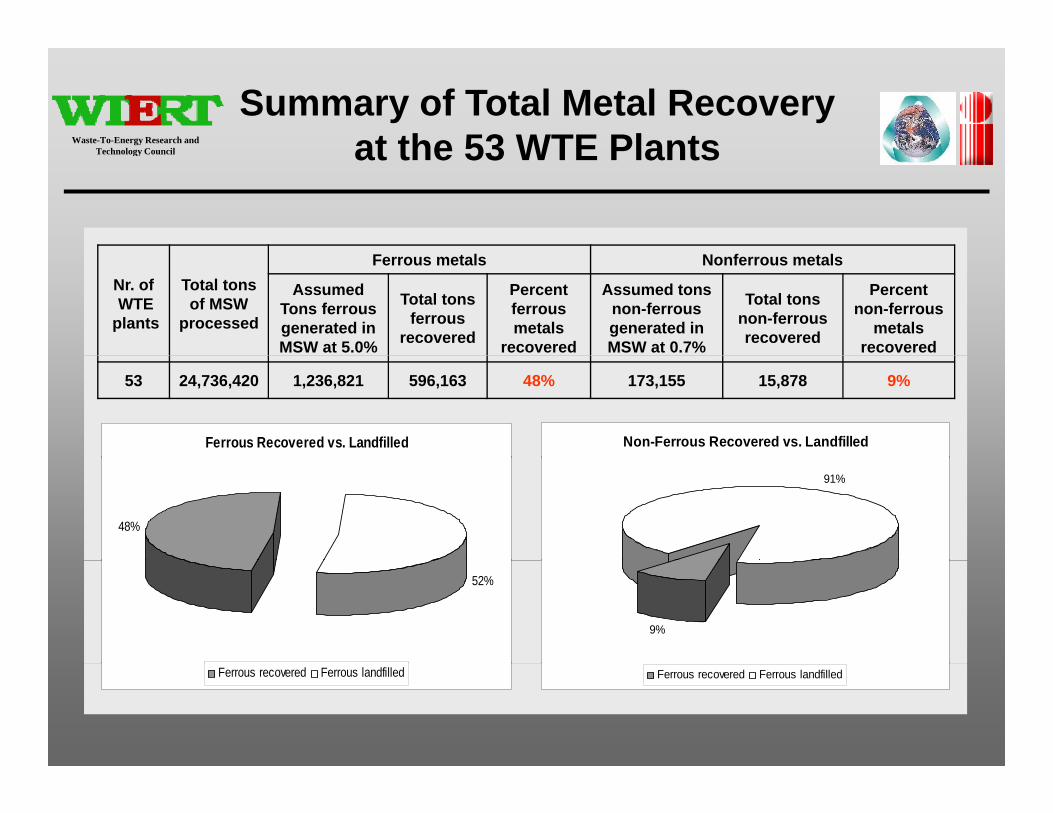
Summary of Total Metal Recovery at the 53 WTE PlantsWaste-To-Energy Research and
Technology Council at the 53 WTE PlantsTechnology Council
Nr. ofWTE
plants
Total tonsof MSW
processed
Ferrous metals Nonferrous metals
AssumedTons ferrousgenerated inMSW at 5.0%
Total tonsferrous
recovered
Percentferrousmetals
recovered
Assumed tonsnon-ferrousgenerated inMSW at 0.7%
Total tonsnon-ferrousrecovered
Percentnon-ferrous
metalsrecovered
53 24,736,420 1,236,821 596,163 48% 173,155 15,878 9%
Ferrous Recovered vs. Landfilled Non-Ferrous Recovered vs. Landfilled
48%
91%
52%
9%
Ferrous recovered Ferrous landfilled Ferrous recovered Ferrous landfilled

Conclusion: Detailed Reco er RatesWaste-To-Energy Research and
Technology Council
• Mass burn plants
Recovery RatesTechnology Council
ferrous recovery 43%p ferrous recovery
front-end ferrous recoveryback-end ferrous recovery
43%
1%99%
non-ferrous recovery
front-end non-ferrous recoveryback-end non-ferrous recovery
5%
6%94%
• RDF plants
back end non ferrous recovery 94%
ferrous recovery
front end ferrous recovery
71%
88%front-end ferrous recoveryback-end ferrous recovery
88%12%
non-ferrous recovery 30%
front-end non-ferrous recoveryback-end non-ferrous recovery
2%98%
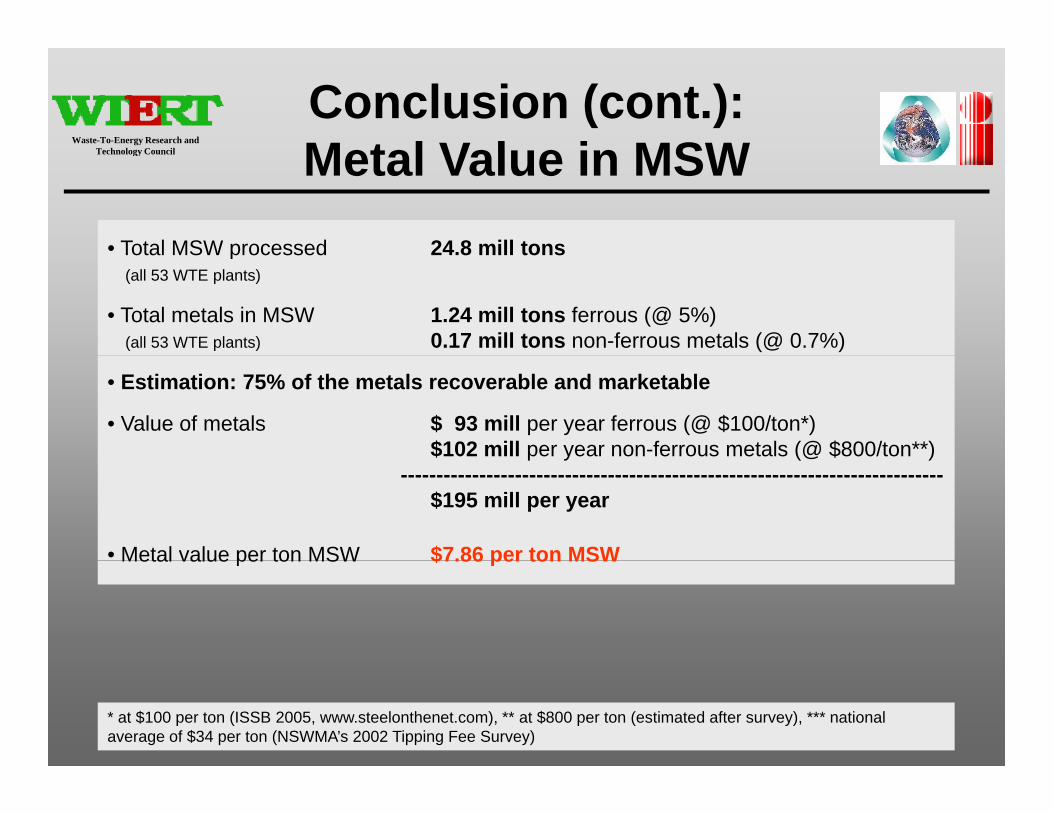
Conclusion (cont.): Metal Val e in MSWWaste-To-Energy Research and
Technology Council
• Total MSW processed 24.8 mill tons
Metal Value in MSW Technology Council
Total MSW processed 24.8 mill tons(all 53 WTE plants)
• Total metals in MSW 1.24 mill tons ferrous (@ 5%)(all 53 WTE plants) 0.17 mill tons non-ferrous metals (@ 0.7%)
• Estimation: 75% of the metals recoverable and marketable
• Value of metals $ 93 mill per year ferrous (@ $100/ton*)$102 mill per year non-ferrous metals (@ $800/ton**)$ p y (@ $ )
----------------------------------------------------------------------------$195 mill per year
• Metal value per ton MSW $7.86 per ton MSWMetal value per ton MSW $7.86 per ton MSW
* at $100 per ton (ISSB 2005, www.steelonthenet.com), ** at $800 per ton (estimated after survey), *** national average of $34 per ton (NSWMA’s 2002 Tipping Fee Survey)
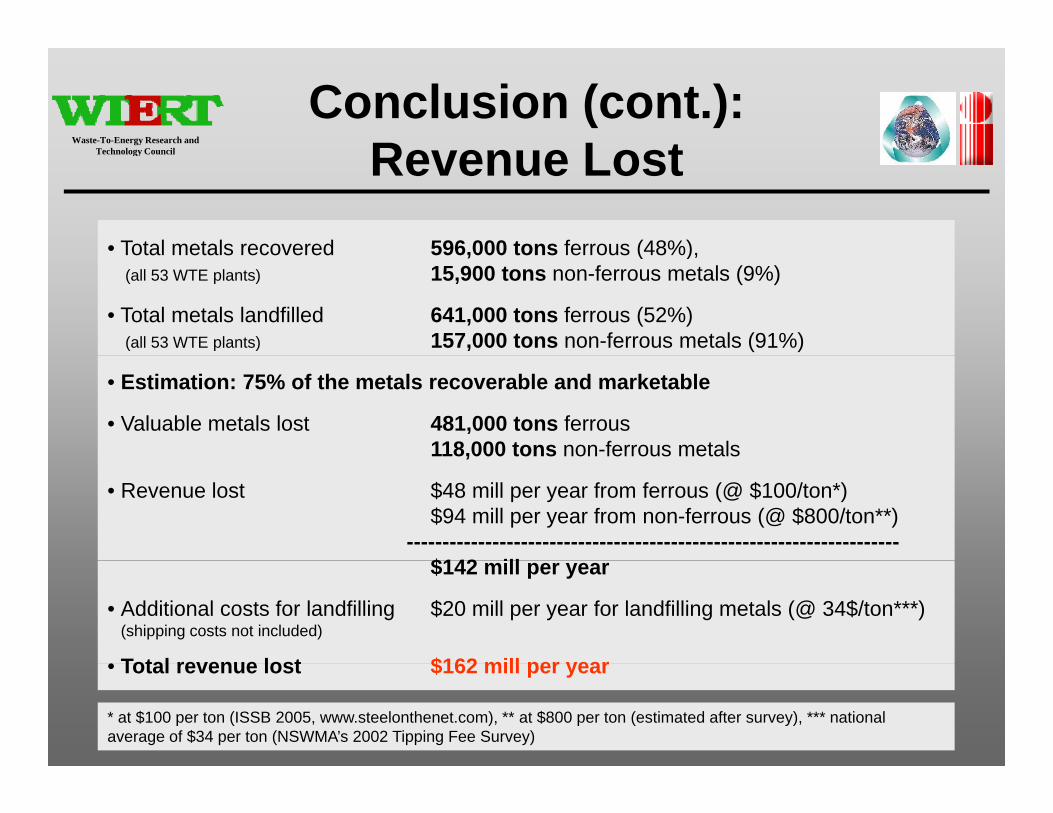
Conclusion (cont.): Re en e LostWaste-To-Energy Research and
Technology Council
• Total metals recovered 596,000 tons ferrous (48%)
Revenue LostTechnology Council
Total metals recovered 596,000 tons ferrous (48%),(all 53 WTE plants) 15,900 tons non-ferrous metals (9%)
• Total metals landfilled 641,000 tons ferrous (52%)(all 53 WTE plants) 157,000 tons non-ferrous metals (91%)
• Estimation: 75% of the metals recoverable and marketable
• Valuable metals lost 481,000 tons ferrous118,000 tons non-ferrous metals,
• Revenue lost $48 mill per year from ferrous (@ $100/ton*)$94 mill per year from non-ferrous (@ $800/ton**)
---------------------------------------------------------------------$142 ill$142 mill per year
• Additional costs for landfilling $20 mill per year for landfilling metals (@ 34$/ton***)(shipping costs not included)
Total revenue lost $162 mill per year• Total revenue lost $162 mill per year
* at $100 per ton (ISSB 2005, www.steelonthenet.com), ** at $800 per ton (estimated after survey), *** national average of $34 per ton (NSWMA’s 2002 Tipping Fee Survey)
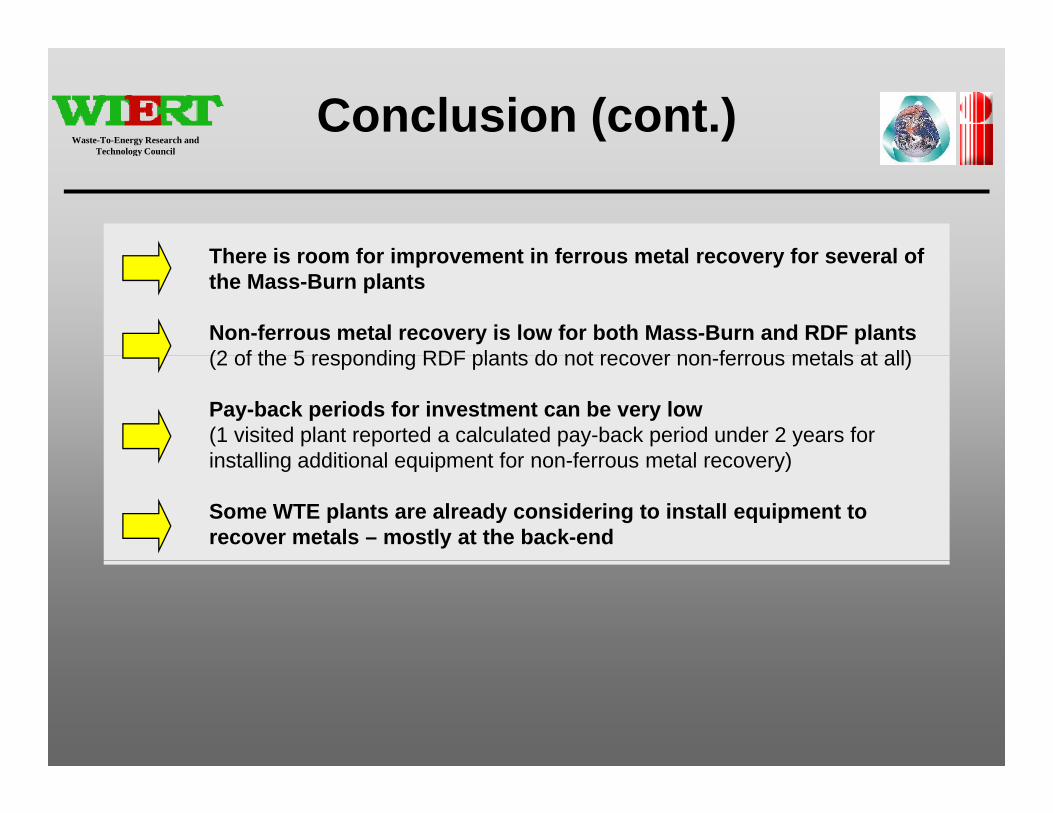
Conclusion (cont.)Waste-To-Energy Research and
Technology Council
There is room for improvement in ferrous metal recovery for several of
Technology Council
There is room for improvement in ferrous metal recovery for several of the Mass-Burn plants
Non-ferrous metal recovery is low for both Mass-Burn and RDF plants (2 of the 5 responding RDF plants do not recover non ferrous metals at all)(2 of the 5 responding RDF plants do not recover non-ferrous metals at all)
Pay-back periods for investment can be very low(1 visited plant reported a calculated pay-back period under 2 years for installing additional equipment for non ferrous metal recovery)installing additional equipment for non-ferrous metal recovery)
Some WTE plants are already considering to install equipment to recover metals – mostly at the back-end
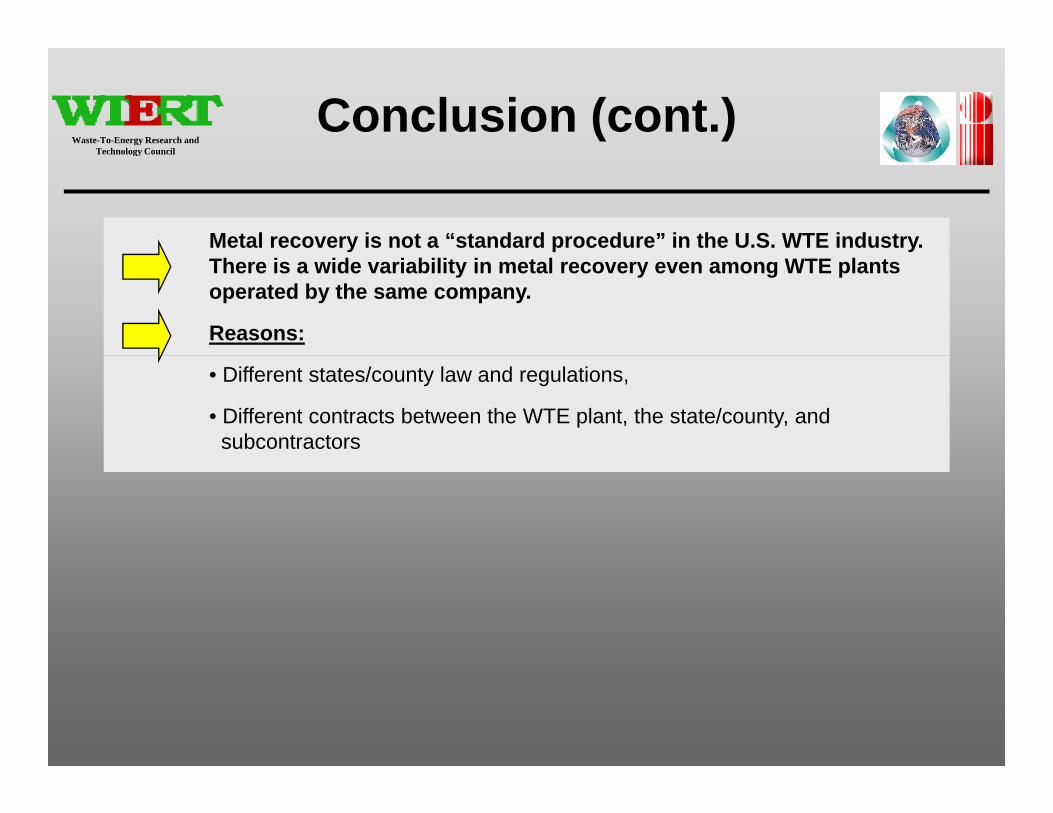
Conclusion (cont.)Waste-To-Energy Research and
Technology Council
Metal recovery is not a “standard procedure” in the U.S. WTE industry.
Technology Council
There is a wide variability in metal recovery even among WTE plants operated by the same company.
Reasons:
• Different states/county law and regulations,
• Different contracts between the WTE plant, the state/county, and subcontractors
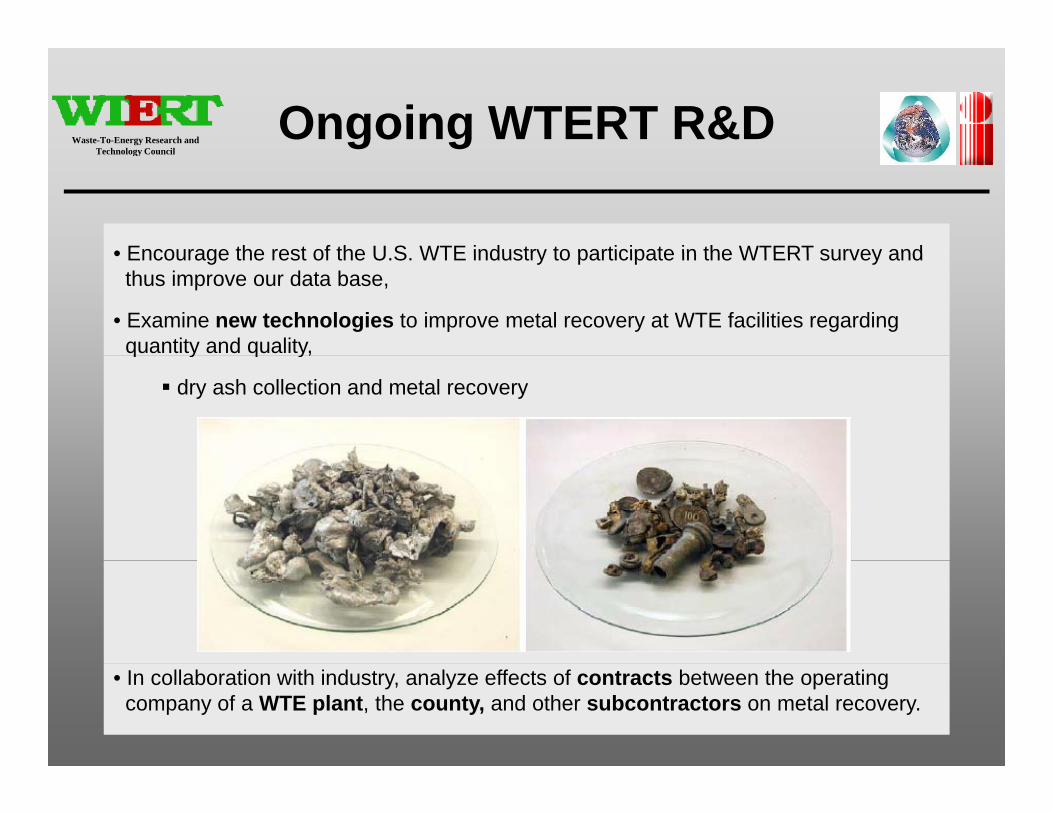
Ongoing WTERT R&DWaste-To-Energy Research and Technology Council
• Encourage the rest of the U S WTE industry to participate in the WTERT survey and
Technology Council
• Encourage the rest of the U.S. WTE industry to participate in the WTERT survey and thus improve our data base,
• Examine new technologies to improve metal recovery at WTE facilities regarding quantity and quality,q y q y,
dry ash collection and metal recovery
• In collaboration with industry, analyze effects of contracts between the operating company of a WTE plant, the county, and other subcontractors on metal recovery.
Waste-To-Energy Research and Technology CouncilTechnology Council
Thank You!
Werner Sunk, M.S.Waste-to-Energy Research and Technology Council (WTERT)gy gy ( )
Columbia University