Embed Size (px)
Citation preview
Survey of indoor air pollution and health symptoms at residential buildings
Sreemoyee Sarkar, Abantika Nandy, Soumendra Nath Talapatra*,
Rajlaxmi Basu, Aniruddha Mukhopadhyay
Department of Environmental Science, University of Calcutta 51/1 & 2 Hazra Road, Kolkata 700019, India
*Phone: 91-33-2461-5445
*E-mail address: [email protected]
ABSTRACT
This survey work summarizes the generation of indoor air pollutants (IAPs) through household
products and activities and also the probable health symptoms of IAPs were discussed through
questionnaire in the residential buildings of urban and semi urban area when compared to rural
(control) area by door to door survey. The IAPs are categorized as physical, chemical and biological
and surveyed as per the product(s) usage in the closed room of buildings. The survey results of IAPs
generated from household products and activities, these are asbestos, fine particulate matters and ash
as physical pollutants. The chemical pollutants are carbon mono and di oxide gases, phthalates; DDT,
chlordane, heptachlor, o-phenylphenol; PBDEs, Formaldehyde, Other Aldehydes, lead, benzene,
chloroform, para-dichlorobenzene, methylene chloride, perchloroethylene, styrene, benzene,
formaldehyde, terpenes, styrene, phthalate esters, toluene, Propellant, pesticides, PAH, NOx,
acrylamide, VOCs, acetone, HCl gas and biological pollutants are bacteria, fungi, viruses, house dust
mites, animal dander; cockroaches, microbial spore. In respect to established health impact data, the
health symptoms were recorded after survey in two areas viz. urban and semi urban area. The health
symptoms were recorded as eye, nose, and throat irritation; allergic reactions, respiratory irritation,
aggravated asthma, influenza and other infectious diseases may be the generation of IAPs. The urban
and semi urban area are compared with rural (control) area in which no symptoms were found as per
discussion. In the present survey it was concluded that the generation of IAPs may from household
products and activities in the urban and semi urban area due to less ventilation facilities when
compared to rural (control) area. This is a preliminary observation, further researches are needed in
relation to measurement of physical, chemical and biological indoor pollutants in closed room of
residential buildings and also health hazards study of residents by haematological, biochemical,
enzymological and genotoxicological parameters.
Keywords: Indoor Air pollution; Indoor Air Quality; Indoor Air Pollutants; Household products;
Health hazards symptoms; Ventilation
1. INTRODUCTION
The physical, chemical and biological pollutants found in indoor air often several times
higher than outdoors. In closed chamber, these cause effects ranging from odour, annoyance
International Letters of Natural Sciences Online: 2014-04-12ISSN: 2300-9675, Vol. 13, pp 17-30doi:10.18052/www.scipress.com/ILNS.13.17© 2014 SciPress Ltd., Switzerland
SciPress applies the CC-BY 4.0 license to works we publish: https://creativecommons.org/licenses/by/4.0/
and irritation to illness, cancer and even death (Health Canada, 1995). Over the past twenty
years indoor air quality as develop of indoor air pollution has received much attention. Many
complaints of health impacts in relation to indoor air pollution arise and the causes of these
complaints are often not identified, despite thorough measurements of indoor air in
modernized as well as urbanized residential buildings. To some extent, these complaints have
been blamed on energy-efficiency measures.
In a workshop on Indoor Air Quality Management organized by the European
Commission, it was identified that the attainment of health and comfort in the indoor
environment, combined with energy efficiency, requires both minimization of human
exposure to indoor air pollution, i.e. source control, and a well functioning and energy-
efficient heating, ventilating or air-conditioning system (Bluyssen, 1991). As a result of this
workshop, the "European Audit Project to Optimize Indoor Air Quality and Energy
Consumption in Office Buildings" was started. Fifty-six office buildings in nine European
countries were audited during the heating season of 1993-1994 (Bluyssen, et al., 1995a). The
audits were performed according to a standard procedure, within the framework of the
"European Audit Project to Optimize Indoor Air Quality and Energy Consumption in Office
Buildings", sponsored by the European Community through the Joule I1 programme. The
main aim of this EC-Audit was to develop assessment procedures and guidance on ventilation
and source control, to help assure good indoor air quality and optimize energy use in office
buildings. Fifteen institutes from 11 countries (the Netherlands, Denmark, France, Belgium,
United Kingdom, Greece, Switzerland, Finland, Norway, Germany and Portugal)
participated. Europe-wide agreement was reached on a common method that was developed
to investigate mainly indoor air quality in office buildings, including a questionnaire and
walk-through survey checklist (Clausen, et al., 1993).
It refers to the physical, chemical, and biological characteristics of air in the indoor
environment within a home, building, or an institution or commercial facility. Indoor air
pollution is a concern in the developed countries, where energy efficiency improvements
sometimes make houses relatively airtight, reducing ventilation and raising pollutant levels.
Indoor air problems can be subtle and do not always produce easily recognized impacts on
health. Different conditions are responsible for indoor air pollution in the rural areas and the
urban areas. The concentration of volatile organic compounds (VOCs) measured in indoor air
are often significantly higher than outdoors. There are various potential origins such as
human activities, infiltration from outdoor air, heating ventilation and air conditioning
(HVAC) systems (Wolkoff, 1995; Fanger, Lauridsen, Bluyssen, et al. 1988), bacterial and
fungal activities (Rivers, Pleil and Wiener, 1992; Batterman, Bartoletta and Burge, 1991) and
product emissions (Wallace, Pellizzari, Leaderer, et al. 1987; Wolkoff 1995; Wolkoff,
Jensen, Kjaer, et al. 1996; Hodgson, Rudd, Beal, et al. 2000). The concentrations are usually
orders of magnitude below the occupational threshold limit values (TLVs). However, some
VOCs may be present above their human odour thresholds (OTs). Beside odor annoyance,
VOCs at sub-TLV level may cause non-specific health effects such as eye and upper
respiratory airway irritation, headache and increased weariness (Molhave, 1986; Molhave,
1991; Seifert, 1999 and Pitten, Bremer and Kramer, 2000; Chan, 2003).
Health effects due to indoor air pollutants may be short-term as well as long-term.
Short-term problems include a stuffy, odorous environment and symptoms such as burning
eyes, skin irritation, and headaches. Long-term health problems have a longer latency period
or are chronic in nature. The magnitude and duration of detrimental health effects are
influenced by the time of exposure, concentration, presence of a preexisting unhealthy
condition and age. Health conditions involving some allergic reactions, including
18 Volume 13
hypersensitivity pneumonitis, allergic rhinitis, and some types of asthma, are triggered by
bioaerosols. Symptoms related to bioaerosols include sneezing, coughing, shortness of breath,
fever, and dizziness. Infections such as influenza, measles, and chicken pox are also
transmitted through the air. Overall, poor air quality may be responsible for a decrease in
work performance, general feeling of poor health, reduced ability to concentrate, or illness
(WHO, 2002).
The present study aims to know indoor air pollution may generates by using household
products and activities at residential buildings and health symptoms by door to door
questionnaire survey.
2. MATERIALS AND METHODS
2. 1. Study Area
The study areas were selected as per use of household products and activities in
modernized house. The survey was carried out at 3 areas as per lifestyle as well as urban,
semi urban and rural area viz (i) Semi Modern lifestyle and Urban area, Bhowanipur (latitude
= 22°31´ N and longitude = 88°21´ E), (ii) Semi Modern lifestyle and Semi Urban area,
Sonarpur (latitude = 22°26´ N and longitude = 88°25´ E), (iii) Normal lifestyle and Rural
area, Jhargram as control area (latitude = 22° 27´ N and longitude = 87°05´ E). Total 10
houses were surveyed in each area.
2. 2. Questionnaire
On the basis of following questionnaire the survey was done:
1. Name of the Person:
2. Age:
3. Sex:
4. Health Hazards Symptoms:
No symptoms Dizziness Eye irritation Respiratory problems
Nasal congestion Running nose Headache
Others with description ……………………………………………………………
5. Symptoms usually occurs in which room?……………………
6. These symptoms occur at what time? Day………… or Night…………..
7. Mention the season when do symptoms occur?
Summer…………., Monsoon…………. or Winter…………….
8. After leaving the room do symptoms persist?
Yes…………. or No………….
9. When were symptoms first noticed?
………………. (Month and Year)
10. Check any new events, changes or hobbies in your home environment that began within a
month of the date given in question number 9. If you identify changes in the indoor
environment, put the mark () in the appropriate place of the following sections -
International Letters of Natural Sciences Vol. 13 19
New home yes No
New construction yes No
New smoker yes No
New weatherization yes No
New carpeting yes No
Old carpeting yes No
Addition of gas heating, cooking / cloths drier yes No
New hobby using varnishes, paints, stains etc. yes No
Use of pet or plant pesticides yes No
Use of insect repellant yes No
Persistent odour yes No
Does your family daily use any aerosol sprays in the home yes No
Which one you use frequently from the following cleaning products?
Oven cleaners Furniture polishes Household cleaners
Carpet shampoos Home cleaners Tiles cleaner
Air freshener Spot remover
Scouring powder that contain bleach
Which one you use frequently from the following product as hobby
Paint stripper Paint thinner Wood stains Artist's paint Mineral spirits
Turpentine oil Lubricating greases and oils Kerosene
Do you have an attached garage? yes No
Do you use a gas stove or oven? yes No
Would you describe your home as unusually dusty? yes No
Do you ever use an air conditioner in the room? yes No
Mention that your home has following water problems. Leaky roof Wet
basement Leaky pipes.
Do any furry pets live indoor? yes No
Proper ventilation yes No
Lamp based fuel yes No
On the basis of above mentioned different questionnaire the survey was done by the
usage of household products and activities that generates indoor air pollutants and the health
symptoms in individual house was recorded in above mentioned areas.
3. RESULTS
The result obtained for IAPs generation is based on the survey performed in the three
areas considering the lifestyle of the residents of urban, semi urban and rural area.
20 Volume 13
Ta
ble
1.
Det
ail
surv
ey i
n t
he
indiv
idual
fam
ily m
ember
of
indoor
air
poll
uta
nts
gen
erat
ion t
hro
ug
h
dif
fere
nt
sourc
es (
Sem
i M
oder
n l
ifes
tyle
and U
rban
are
a, B
ho
wan
ipu
r).
NC
= N
ew c
on
stru
ctio
n;
NH
= N
ew h
om
e; D
y =
Du
sty
; N
W =
New
wea
ther
izat
ion
; A
C =
Air
co
nd
itio
ner
; A
G =
Att
ach
ed g
arag
e;
PO
= P
ersi
sten
t o
do
ur;
HC
= H
ou
seh
old
/hom
e cl
ean
ers;
FP
= F
urn
itu
re p
oli
shes
; S
P =
Sco
uri
ng
po
wd
er;
PV
= P
ain
ts &
var
nis
hes
;
AS
= A
ero
sol
spra
y;
AF
= A
ir f
resh
ener
; IR
= I
nse
ct r
epel
len
t; G
O =
Gas
ov
en;
GH
= G
as h
eati
ng
; L
R =
Lea
ky r
oo
f, L
P =
Lea
ky
pip
es;
SR
= S
po
t re
mo
ver
; A
P =
Art
ist’
s p
ain
t; K
e =
Ker
ose
ne;
TO
= T
urp
enti
ne
oil
; M
S =
Min
eral
sp
irit
;
NS
= N
ew s
mo
ker
; F
r =
Fu
rry p
ets;
PP
= P
lan
t &
pet
s p
esti
cid
es;
Cg
= C
arp
etin
g.,
OL
D C
g =
old
car
pet
LP
= l
eak
y p
ipes
, V
n =
pro
per
ly v
enti
lati
on
LF
= l
amp
bas
ed f
uel
International Letters of Natural Sciences Vol. 13 21
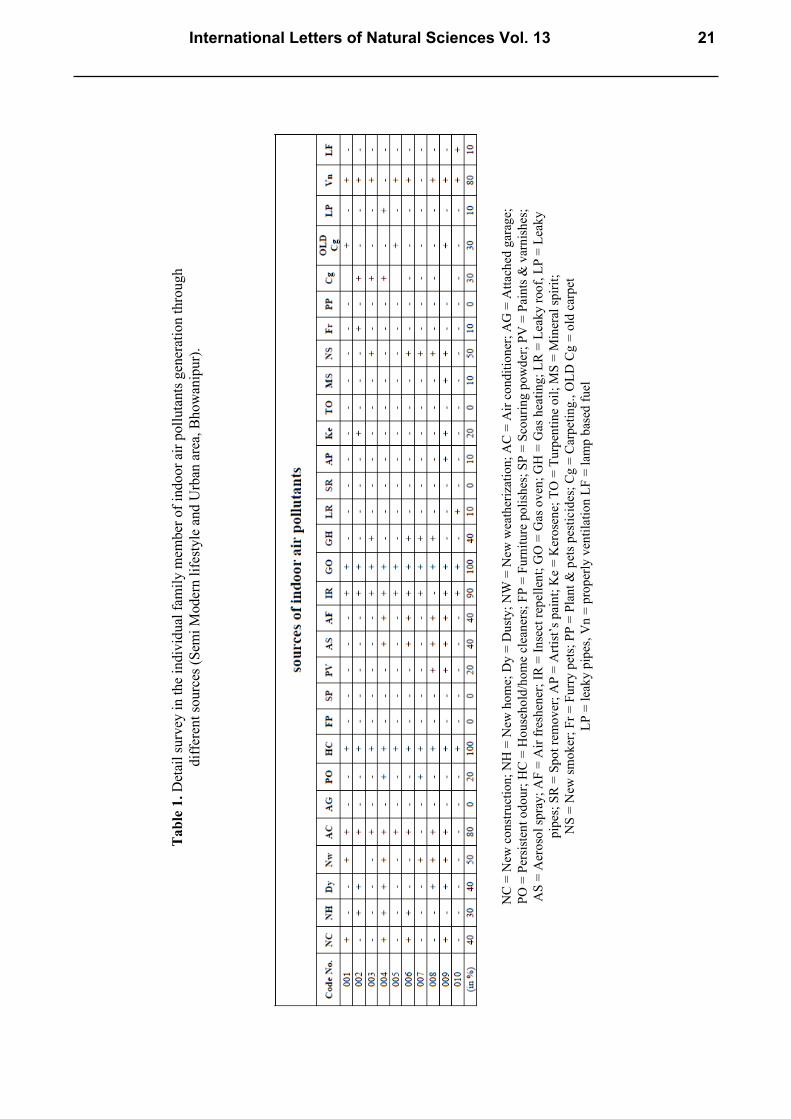
Table 1 indicates the general indoor air pollutants (IAPs) present in the houses of
Bhawanipore area selected as urban area. The percentages indicate that the maximum sources
of indoor air pollutants of about 100 % come from home cleaners (HC) and gas oven (GO)
followed by insect repellent (IR) of about 90 % and to some extent less than before as air
conditioners (80 %). The indoor air pollutants are nullified as there is proper ventilation (80
%) in most of the houses. It was observed that IAPs circulated by new weatherization (NW)
of about 50 % followed by new construction (NC), dusts (Dy), aerosol spray (AS) and air
freshener (AF) of about 40 % and the pollutants are unable to persist for long as persistent
odour (PO) was observed in 20 % of the houses only. IAPs from, paints and varnishes (PV),
turpentine oil (TO), kerosene (ke), mineral spirit (MS), lamp based fuel (LF), leaky pipes
(LP) and leaky roofs (LF) ranged from 20-10 %. Main biological contaminant sources were
old carpet and furry pets which scored 30 % and 10 % respectively.
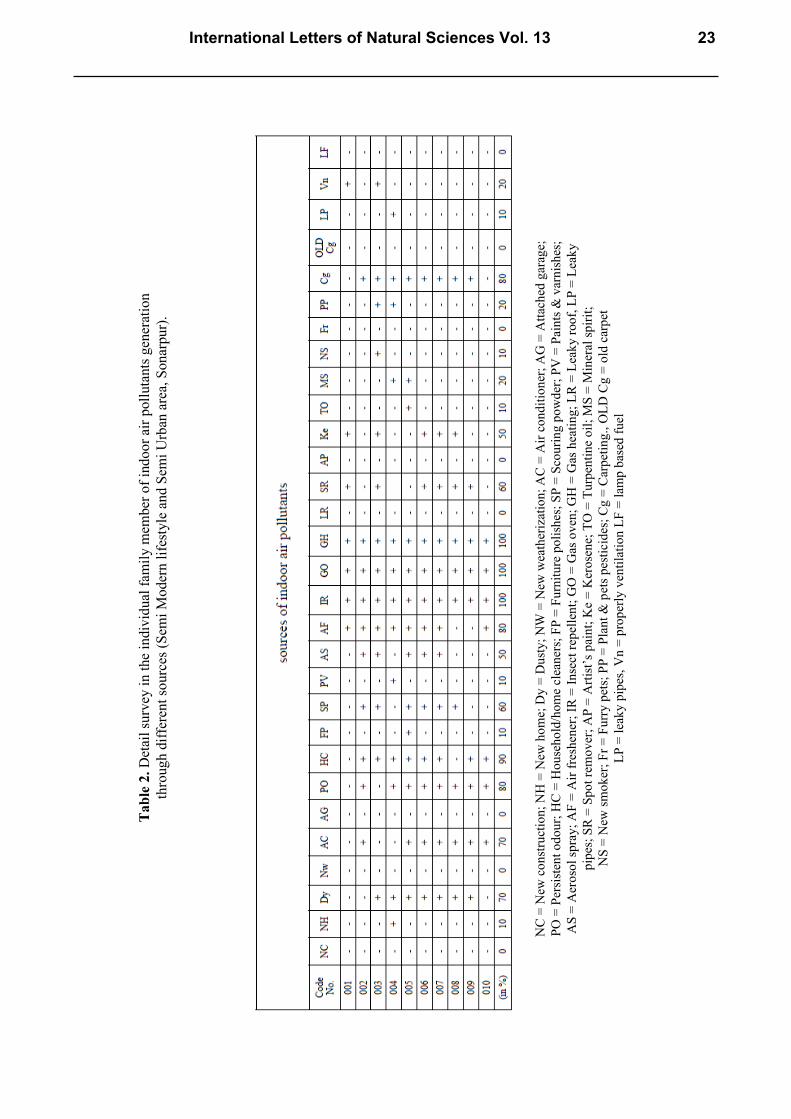
The survey findings on semi urban Sonarpur area indicate in Table 2. The percentages
indicate that the maximum sources of IAPs of about 100 % come from IR, GO and GH
followed by HC of about 90 % and PO, AF and Cg of about 80 % and about 70 % from AC
and Dy. It was observed that the moderate amount of about 60 % and 50 % IAPs were
circulated in houses through SP and SR and AS and Ke respectively. The IAPs generated
from MS, PP and Vn were of about 20% and very less of about 10 % in case of NH, FP, PV,
TO, NS and LP. The physical, chemical and biological IAPs have already been established
and are shown in Table 4.
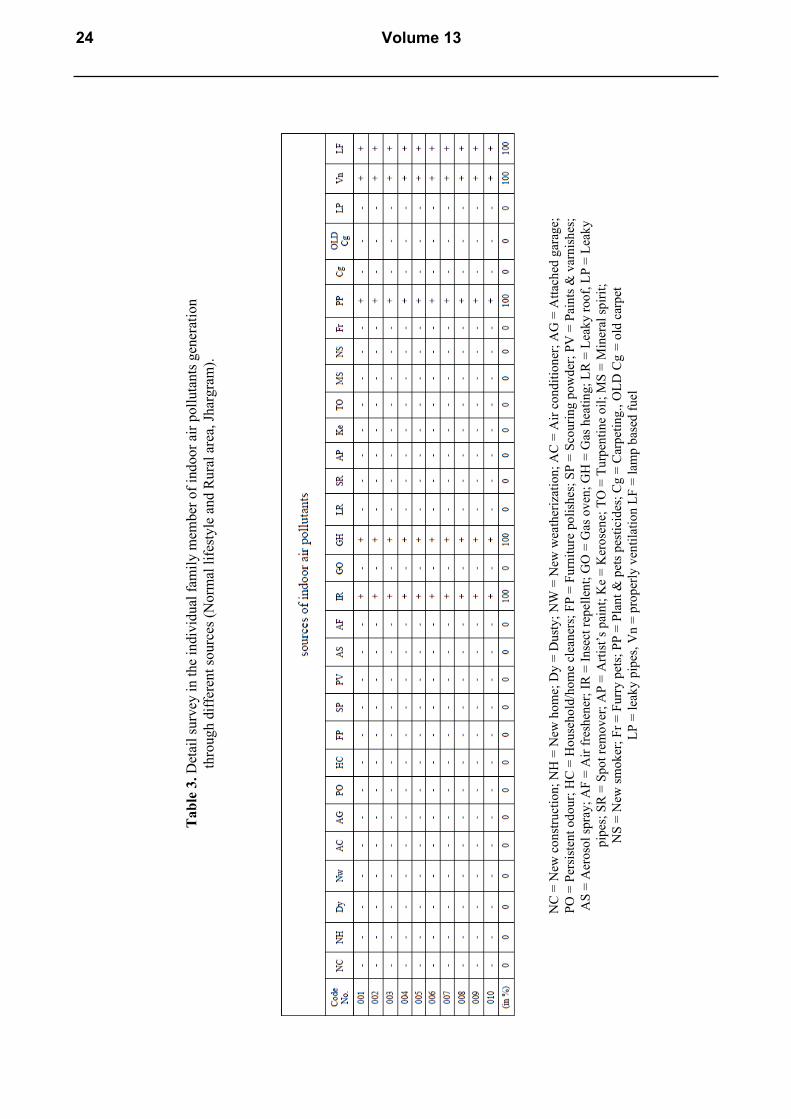
The control area is a rural area mainly village and is far from the city Jhargram were
surveyed. There was no new construction, weatherization, paints and varnishes and use of
electronic gadgets. Sometimes they use natural insect repellent like “dhunu”. they use chullah
for cooking purpose and there is ample cross ventilation. They do have furry pets but most of
all reside outside their houses. The usage of plants and pets pesticide is prevalent but since
there is lot of ventilation and pets largely remain outside the effect of pesticides on human
becomes negligible (Table 3). The percentages indicate that the maximum sources of IAPs of
about 100 % come from IR, GH, PP, Vn, LF but as per survey these indoor air pollutants did
not persist inside the room.
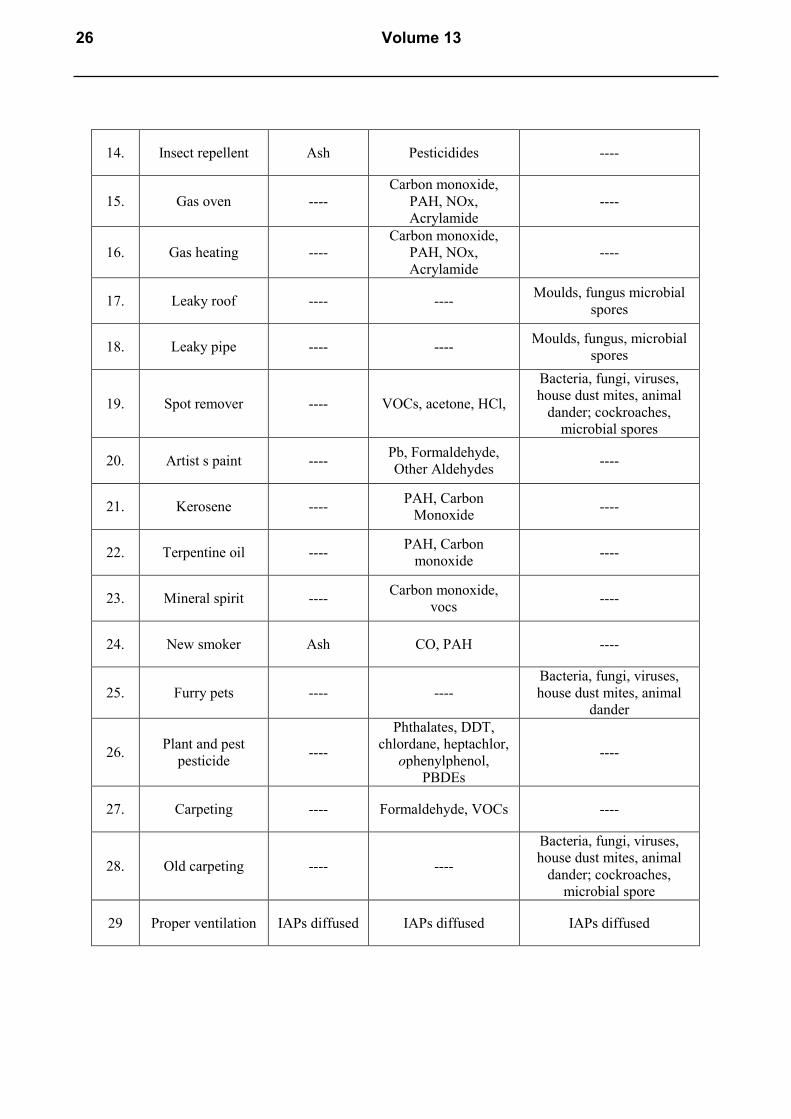
The physical, chemical and biological IAPs have already been established and are listed
in Table 4 (Source: Draft report for Board, California, 2005). These pollutants are asbestos,
fine particulate matters and ash as physical pollutants. The chemical pollutants are carbon
mono and di oxide gases, phthalates; DDT, chlordane, heptachlor, o-phenylphenol; PBDEs,
Formaldehyde, Other Aldehydes, lead, benzene, chloroform, para-dichlorobenzene,
methylene chloride, perchloroethylene, styrene, Benzene, formaldehyde, terpenes, styrene,
phthalate esters, toluene, Propellant, pesticides, PAH, NOx, acrylamide, VOCs, acetone,
HCL gas and biological pollutants are bacteria, fungi, viruses, house dust mites, animal
dander; cockroaches, microbial spore.
In Table 5 the results indicate the presence of physical, chemical and biological IAPs
and their sources in the indoor environment that cause several health impacts established
international organization through Draft report for Board, California, 2005. In respect to
established health impact data, the health symptoms were recorded after survey in two areas
viz. urban and semi urban area compared with control (rural) area. The health symptoms were
recorded in two areas (urban and semi urban) as eye, nose, and throat irritation, allergic
reactions, respiratory irritation, aggravated asthma, influenza and other infectious diseases
while no symptoms were recorded in control area.
22 Volume 13
Ta
ble
2.
Det
ail
surv
ey i
n t
he
indiv
idual
fam
ily m
ember
of
indoor
air
poll
uta
nts
gen
erat
ion
thro
ugh d
iffe
rent
sourc
es (
Sem
i M
oder
n l
ifes
tyle
and S
emi
Urb
an a
rea,
Son
arpu
r).
NC
= N
ew c
on
stru
ctio
n;
NH
= N
ew h
om
e; D
y =
Du
sty
; N
W =
New
wea
ther
izat
ion
; A
C =
Air
co
nd
itio
ner
; A
G =
Att
ach
ed g
arag
e;
PO
= P
ersi
sten
t o
do
ur;
HC
= H
ou
seh
old
/hom
e cl
ean
ers;
FP
= F
urn
itu
re p
oli
shes
; S
P =
Sco
uri
ng
po
wd
er;
PV
= P
ain
ts &
var
nis
hes
;
AS
= A
ero
sol
spra
y;
AF
= A
ir f
resh
ener
; IR
= I
nse
ct r
epel
len
t; G
O =
Gas
ov
en;
GH
= G
as h
eati
ng
; L
R =
Lea
ky r
oo
f, L
P =
Lea
ky
pip
es;
SR
= S
po
t re
mo
ver
; A
P =
Art
ist’
s p
ain
t; K
e =
Ker
ose
ne;
TO
= T
urp
enti
ne
oil
; M
S =
Min
eral
sp
irit
;
NS
= N
ew s
mo
ker
; F
r =
Fu
rry p
ets;
PP
= P
lan
t &
pet
s p
esti
cid
es;
Cg
= C
arp
etin
g.,
OL
D C
g =
old
car
pet
LP
= l
eak
y p
ipes
, V
n =
pro
per
ly v
enti
lati
on
LF
= l
amp
bas
ed f
uel
International Letters of Natural Sciences Vol. 13 23
NC
= N
ew c
on
stru
ctio
n;
NH
= N
ew h
om
e; D
y =
Du
sty
; N
W =
New
wea
ther
izat
ion
; A
C =
Air
co
nd
itio
ner
; A
G =
Att
ach
ed g
arag
e;
PO
= P
ersi
sten
t o
do
ur;
HC
= H
ou
seh
old
/hom
e cl
ean
ers;
FP
= F
urn
itu
re p
oli
shes
; S
P =
Sco
uri
ng
po
wd
er;
PV
= P
ain
ts &
var
nis
hes
;
AS
= A
ero
sol
spra
y;
AF
= A
ir f
resh
ener
; IR
= I
nse
ct r
epel
len
t; G
O =
Gas
ov
en;
GH
= G
as h
eati
ng
; L
R =
Lea
ky r
oo
f, L
P =
Lea
ky
pip
es;
SR
= S
po
t re
mo
ver
; A
P =
Art
ist’
s p
ain
t; K
e =
Ker
ose
ne;
TO
= T
urp
enti
ne
oil
; M
S =
Min
eral
sp
irit
;
NS
= N
ew s
mo
ker
; F
r =
Fu
rry p
ets;
PP
= P
lan
t &
pet
s p
esti
cid
es;
Cg
= C
arp
etin
g.,
OL
D C
g =
old
car
pet
LP
= l
eak
y p
ipes
, V
n =
pro
per
ly v
enti
lati
on
LF
= l
amp
bas
ed f
uel
Ta
ble
3.
Det
ail
surv
ey i
n t
he
indiv
idual
fam
ily m
ember
of
indoor
air
poll
uta
nts
gen
erat
ion
thro
ugh d
iffe
rent
sourc
es (
Norm
al l
ifes
tyle
and R
ura
l ar
ea, Jh
arg
ram
).
24 Volume 13
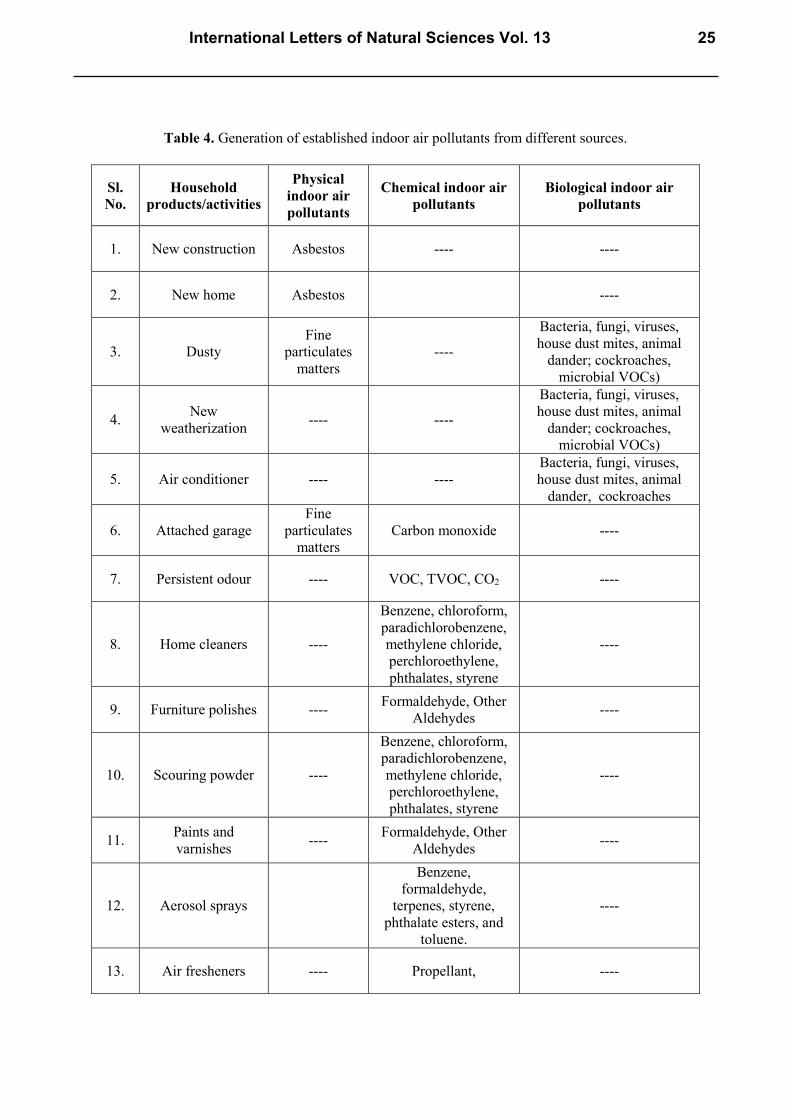
Table 4. Generation of established indoor air pollutants from different sources.
Sl.
No.
Household
products/activities
Physical
indoor air
pollutants
Chemical indoor air
pollutants
Biological indoor air
pollutants
1. New construction Asbestos ---- ----
2. New home Asbestos ----
3. Dusty
Fine
particulates
matters
----
Bacteria, fungi, viruses,
house dust mites, animal
dander; cockroaches,
microbial VOCs)
4. New
weatherization ---- ----
Bacteria, fungi, viruses,
house dust mites, animal
dander; cockroaches,
microbial VOCs)
5. Air conditioner ---- ----
Bacteria, fungi, viruses,
house dust mites, animal
dander, cockroaches
6. Attached garage
Fine
particulates
matters
Carbon monoxide ----
7. Persistent odour ---- VOC, TVOC, CO2 ----
8. Home cleaners ----
Benzene, chloroform,
paradichlorobenzene,
methylene chloride,
perchloroethylene,
phthalates, styrene
----
9. Furniture polishes ---- Formaldehyde, Other
Aldehydes ----
10. Scouring powder ----
Benzene, chloroform,
paradichlorobenzene,
methylene chloride,
perchloroethylene,
phthalates, styrene
----
11. Paints and
varnishes ----
Formaldehyde, Other
Aldehydes ----
12. Aerosol sprays
Benzene,
formaldehyde,
terpenes, styrene,
phthalate esters, and
toluene.
----
13. Air fresheners ---- Propellant, ----
International Letters of Natural Sciences Vol. 13 25
14. Insect repellent Ash Pesticidides ----
15. Gas oven ----
Carbon monoxide,
PAH, NOx,
Acrylamide
----
16. Gas heating ----
Carbon monoxide,
PAH, NOx,
Acrylamide
----
17. Leaky roof ---- ---- Moulds, fungus microbial
spores
18. Leaky pipe ---- ---- Moulds, fungus, microbial
spores
19. Spot remover ---- VOCs, acetone, HCl,
Bacteria, fungi, viruses,
house dust mites, animal
dander; cockroaches,
microbial spores
20. Artist s paint ---- Pb, Formaldehyde,
Other Aldehydes ----
21. Kerosene ---- PAH, Carbon
Monoxide ----
22. Terpentine oil ---- PAH, Carbon
monoxide ----
23. Mineral spirit ---- Carbon monoxide,
vocs ----
24. New smoker Ash CO, PAH ----
25. Furry pets ---- ----
Bacteria, fungi, viruses,
house dust mites, animal
dander
26. Plant and pest
pesticide ----
Phthalates, DDT,
chlordane, heptachlor,
ophenylphenol,
PBDEs
----
27. Carpeting ---- Formaldehyde, VOCs ----
28. Old carpeting ---- ----
Bacteria, fungi, viruses,
house dust mites, animal
dander; cockroaches,
microbial spore
29 Proper ventilation IAPs diffused IAPs diffused IAPs diffused
26 Volume 13
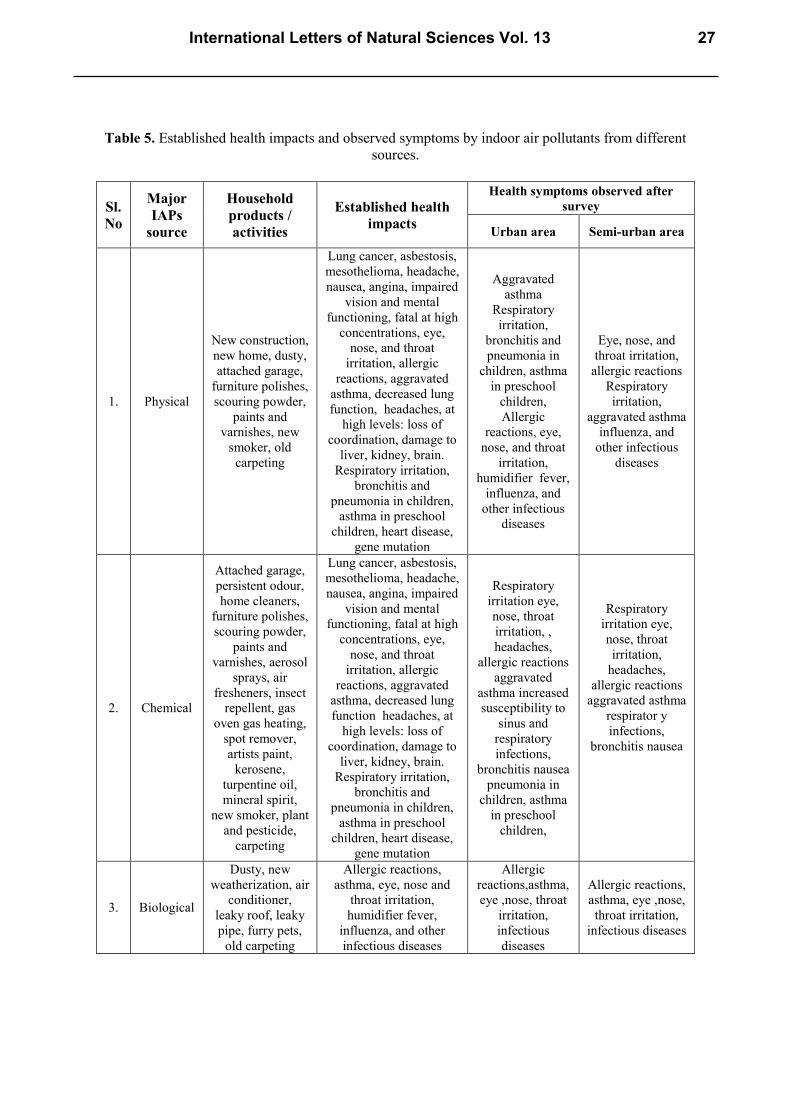
Table 5. Established health impacts and observed symptoms by indoor air pollutants from different
sources.
Sl.
No
Major
IAPs
source
Household
products /
activities
Established health
impacts
Health symptoms observed after
survey
Urban area Semi-urban area
1. Physical
New construction,
new home, dusty,
attached garage,
furniture polishes,
scouring powder,
paints and
varnishes, new
smoker, old
carpeting
Lung cancer, asbestosis,
mesothelioma, headache,
nausea, angina, impaired
vision and mental
functioning, fatal at high
concentrations, eye,
nose, and throat
irritation, allergic
reactions, aggravated
asthma, decreased lung
function, headaches, at
high levels: loss of
coordination, damage to
liver, kidney, brain.
Respiratory irritation,
bronchitis and
pneumonia in children,
asthma in preschool
children, heart disease,
gene mutation
Aggravated
asthma
Respiratory
irritation,
bronchitis and
pneumonia in
children, asthma
in preschool
children,
Allergic
reactions, eye,
nose, and throat
irritation,
humidifier fever,
influenza, and
other infectious
diseases
Eye, nose, and
throat irritation,
allergic reactions
Respiratory
irritation,
aggravated asthma
influenza, and
other infectious
diseases
2. Chemical
Attached garage,
persistent odour,
home cleaners,
furniture polishes,
scouring powder,
paints and
varnishes, aerosol
sprays, air
fresheners, insect
repellent, gas
oven gas heating,
spot remover,
artists paint,
kerosene,
turpentine oil,
mineral spirit,
new smoker, plant
and pesticide,
carpeting
Lung cancer, asbestosis,
mesothelioma, headache,
nausea, angina, impaired
vision and mental
functioning, fatal at high
concentrations, eye,
nose, and throat
irritation, allergic
reactions, aggravated
asthma, decreased lung
function headaches, at
high levels: loss of
coordination, damage to
liver, kidney, brain.
Respiratory irritation,
bronchitis and
pneumonia in children,
asthma in preschool
children, heart disease,
gene mutation
Respiratory
irritation eye,
nose, throat
irritation, ,
headaches,
allergic reactions
aggravated
asthma increased
susceptibility to
sinus and
respiratory
infections,
bronchitis nausea
pneumonia in
children, asthma
in preschool
children,
Respiratory
irritation eye,
nose, throat
irritation,
headaches,
allergic reactions
aggravated asthma
respirator y
infections,
bronchitis nausea
3. Biological
Dusty, new
weatherization, air
conditioner,
leaky roof, leaky
pipe, furry pets,
old carpeting
Allergic reactions,
asthma, eye, nose and
throat irritation,
humidifier fever,
influenza, and other
infectious diseases
Allergic
reactions,asthma,
eye ,nose, throat
irritation,
infectious
diseases
Allergic reactions,
asthma, eye ,nose,
throat irritation,
infectious diseases
International Letters of Natural Sciences Vol. 13 27
4. DISCUSSION AND CONCLUSION
The present IAP survey was done in the residential buildings on the basis of urban and
semi urban area where the residents used several household products containing synthetic
chemicals and activities in which different physical, chemical and biological pollutants are
generated, when compared with control (rural) area, indicate that these indoor air pollutants
may cause chronic health impacts to the human.
The generation of indoor air pollution by household products and activities in the
residential as well as office buildings have already been studied internationally by many
researchers. Major research works have been conducted on the products and health impacts
(Molhave, 1986; Molhave, 1991; Rivers, Pleil and Wiener, 1992; Bluyssen et al., 1996;
Seifert, 1999; Pitten, Bremer and Kramer, 2000; Chan, 2003) by physical, chemical and
biological indoor air pollutants (IAPs) but few works have been done in context to India
(Kirk, 2000), but many researchers have been documented on rural and/or urban slum area,
no one has tried to establish generation of IAPs by household products and activities in
residential buildings in relation to health hazards symptoms on modern lifestyle in urban and
semi urban area compared to normal lifestyle in rural (control) area.
It was observed in the present results that people of modern lifestyle in an urban and
semi urban area shows the major usage of household products and activities that generated
IAPs in the indoor environment with some health hazards symptoms. On contrary, people of
normal lifestyle in rural area possesd no symptoms because the houses have proper
ventilation and very rarely they use household products and activities that generate IAPs in
relation to urban and semi urban area (Table, 1, 2, 3 and 5). It was previously known that raw
fuels like coal, wood, dung etc. are generated indoor air pollution in rural area (Kirk, 2000;
ICMR Bulletin, 2001) but the IAPs may decrease with proper ventilation and lesser the health
impacts, which are observed in the present survey.
The present survey refers with other research works in relation to the physical,
chemical, and biological characteristics of air in the indoor environment within a home,
building, or an institution or commercial facility. IAP is a concern in the developed countries,
where energy efficiency improvements sometimes make houses relatively airtight, reducing
ventilation and raising pollutant levels. Different conditions are responsible for indoor air
pollution in the rural areas and the urban areas. In the urban area, the concentration of volatile
organic compounds (VOCs) measured in indoor air are often significantly higher than
outdoors. The data have already been established on various potential origins such as human
activities, infiltration from outdoor air, heating ventilation and air conditioning (HVAC)
systems (Wolkoff, 1995; Fanger, Lauridsen, Bluyssen, et al. 1988), bacterial and fungal
activities (Rivers, Pleil and Wiener, 1992; Batterman, Bartoletta and Burge, 1991) and
product emissions (Wallace, Pellizzari, Leaderer, et al. 1987; Wolkoff 1995; Wolkoff,
Jensen, Kjaer, et al. 1996; Hodgson, Rudd, Beal, et al. 2000; WHO, 2000).
The concentrations are usually orders of magnitude below the occupational threshold
limit values (TLVs). However, some VOCs may be present above their human odour
thresholds (OTs). Beside odour annoyance, VOCs at sub-TLV level may cause non-specific
health effects such as eye and upper respiratory airway irritation, headache and increased
weariness (Molhave, 1986; Molhave, 1991; Seifert, 1999 and Pitten, Bremer and Kramer,
2000; Chan, 2003). The health hazards symptoms found in the present survey after relevant
questionnaire may have generated from the usage of household products and activities in the
closed chamber and unknowingly lesser ventilation facilities. In case of rural area, the present
survey emphasized that people after using few of the household products like IR, LF and GH
28 Volume 13
(fuel like wood, coal, dung and crop parts) mainly and activities in the homes due to proper
ventilation and awareness, which may not be shown health symptoms by IAPs but previously
it was reported that severe health impacts found in women, children and old age people by
IAPs especially fuel burning in their home (Kirk, 2000; ICMR Bulletin, 2001).
In the present study it was concluded that the generation of IAPs is mainly from
household products and activities in the urban and semi urban area due to less ventilation
facilities when compared to rural (control) area. As we know from the previous research
work in Indian cities, the concentrations of IAPs often exceed the toxic limits (Kirk, 2000;
ICMR Bulletin, 2001). This survey is a preliminary assessment of IAPs generation by using
various household products and activities in a closed room of residential buildings but further
researches are needed in relation to measurement of physical, chemical and biological
pollutants in closed room of residential buildings and also health hazards study of residents
by haematological, biochemical, enzymological and genotoxicological parameters. The
observed health symptoms after survey through questionnaire may be the generation of IAPs
and lesser ventilation facilities in the survey buildings when compared to control (rural) area.
ACKNOWLEDGEMENT
The authors convey their gratitude to the Department of Environmental Science, University of Calcutta, for
providing the necessary infrastructure for doing this survey work.
References
[1] Batterman, S., Bartoletta, N., Burge, H., Proceedings of the 84th Annual Meeting and
Exhibition of the air and waste management association (1991) 91-62.9 Vancouver.
[2] Bluyssen, P. M. Commission of the European Communities, Directorate-General XI1 for
Science, Research and Development (1991).
[3] Bluyssen, P. M., de Oliveira Fernandes, E., Fanger, P. O., Groes, L., Clausen, G.,
Roulet, C. A, Bernhard, C. A. Valbjerrn, O., European Audit Project to Optimize Indoor
Air Quality and Energy Consumption in Ofice Buildig, 1995a.
[4] Bluyssen, P. M., de Oliveira Fernandes, E., Groes, L., Clausen, G., Fanger, P. O.
Albjorn, V., Bernhard, C. A., Roulet, A., Indoor Air 6 (1996) 221-238.
[5] Bluyssen P, Cochet C, Fischer M, et al., European Comission Report No.18 (1997).
[6] Chan, W, R et al., LBNL Report #53367 (2003).
[7] Clausen, G., Pejtersen, J., Bluyssen, P. M., Copenhaven, Technical University of
Denmark and Delft, TNO-Building and Construction Research, 1993.
[8] Fanger P. O., Lauridsen, J., Bluyssen, P. et al. Energy Build 12 (1988) 7-19.
[9] Health Canada. Exposure guidelines for residential. Indoor Air quality; A report of the
Federal-Provincial Advisory Committee on Environmental and Occupational health,
Ottawa: health Canada. Publication_Communications, Ottawa, K1A0K9 (1995).
[10] Hodgson, A. T., Rudd, A. F., Beal, D. et al., Indoor Air 10 (2000) 178-192.
[11] ICMR Bulletin. Indoor air pollution in india – A major environmental and public health
concern 31(5) (2001).
International Letters of Natural Sciences Vol. 13 29
[12] Kirk, R. S., PNAS 97 24 (2000) 13286-13293.
[13] Molhave, L., Indoor Air 1 (1991) 357-376.
[14] Molhave L, Bach B, Pedersen O. F., Environ International 12 (1986) 167-165.
[15] Pitten, F. A., Bremer, J., Kramer, A., Dtsch med Wschr 125 (2000) 545-550.
[16] Rivers, J. C., Pleil, J. D., Wiener, R. W., J Exp Anal Env Epidem 1 (1992) 177-188.
[17] Seifert, B., Bundesgesundheitsbl-Gesundheitsforsch-Gesundheitsschutz 42 (1999)
270-278.
[18] Wallace, L. A., Pellizzari, E, Leaderer, B. et al., Atmospheric Environment 21(2)
(1987) 385-393.
[19] Wolkoff, P., Indoor Air 3 (1995) 1-73.
[20] Wolkoff P., Proceedings of the 7th International Conference on Indoor Air Quality and
Climate. Indoor Air 96(1) (1996) 579-584 Nagaya.
[21] Wolkoff, P., Clausen, P. A., Nielsen, P. A., Indoor Air 5 (1995) 196-203.
[22] Wolkoff, P., Jensen, P., Kjaer, U., et al., Indoor Air 96(4) (1996) 331-336.
[23] World Health Organization (WHO), Air quality guidelines for Europe, 2nd Edition,
WHO regional Pubs, European series, No. 91 (2000).
[24] World Health Organization (WHO), Based on the WHO-USAID Global Consultation
on the Health Impact of Indoor Air Pollution and Household Energy in Developing
Countries (Meeting report), Washington, DC, 2002.
( Received 17 March 2014; accepted 24 March 2014 )
30 Volume 13
![Indoor Air Pollution - WordPress.com · Chapter 1 Indoor Air Pollution “Indoor air pollutant levels are 25-62% greater [in our homes] ... poor indoor air quality is to install a](https://img.pdfslide.us/doc/110x75/5b511fb87f8b9a7b648b9e83/indoor-air-pollution-chapter-1-indoor-air-pollution-indoor-air-pollutant.jpg)