Embed Size (px)
Citation preview

Survey of Distance Education Use in Rural Schools
Wallace HannumAssociate Director for Technology
National Research Center on Rural Education Support

DE Project Overview
SurveyLit ReviewPlanning
StudyDesign
Preparation ConductStudies
EvaluateDisseminate
Project Years
ConductStudies
Year 1
Year 2Year 3
Year 4
Year 5

Survey of Distance Education Use
• Who uses DE?
• What courses?
• What technology?
• How successful?
• Additional needs?
• Barriers?
Survey Timeline
QuestionnaireQuestionnaireDesignDesign
QuestionnaireQuestionnaireDesignDesign InterviewingInterviewingInterviewingInterviewing Data AnalysisData AnalysisData AnalysisData Analysis
January - MarchJanuary - March April - JuneApril - June July - SeptemberJuly - September

Questionnaire Design
Factors
DE Use& NeedsDE Use& Needs
TechnologyDE Type
TechnologyDE Type
ContentAreas
ContentAreas
BarriersBarriers

Sample
• REAP– Rural low income– Small rural
• Random sample 10% – 415 school districts– 394 participated
• 294 SRSA• 100 RLIS Interviewed 94.5%
Not Interviewed 5.5%

Participating Districts by State
AL-4
AR-14
AZ-8
CA-10CO-12
CT-2
MD
FL-3
GA-8
IA-13
ID-5
IL-20 IN-2
KS-16KY-7
LA-2
ME-4
MI-11
MN-9
MO-19
MS-11
MT-14
NC-4
ND-17
NE-19
NH-2
NJ
NM-6
NV-2
NY-9
OH-9
OK-31
OR-9
PA
SC-4
SD-11
TN-6
TX-45
UT-1
VA-1
WA-10
WI-4
WV-1
WY-2
HIAK-5
DE
RI
MA
VT-2
GA-8
FL-3

Key Findings
DE Use Content Areas
Technology Barriers
68% use DEForeign
LanguageWeb-based
SchedulingTwo-way video
Trained Instructional
Personnel
DE as Priority
Difficult toImplement
English
Science
Math
70% report need for DE

Types of Courses Offered
12%
21%
18%20%
11%
7%
11% ScienceMathEnglishForeign LanguageHistoryPsychology orSociologyOther

Types of Technology Used
14%
12%
4%
7%
11%2%
25%
21%
4%Correspondence by mail
Correspondence by email
Cable TV
Satellite TV
Self-instructional computer-based tutorials
One-way videoconferencing
Two-way video conferencing
Web-based or onlinecourses
Other

Districts Offering DE by Region
0%
10%20%
30%
40%50%
60%
70%80%
90%
100%
North East Midwest South West

Districts Offering DE by Majority Ethnicity
0%10%20%30%40%50%60%70%80%90%
100%
White Black Hispanic AmericanIndian
Mixed

Providers of DE
0%
5%
10%
15%
20%
25% Local District
RegionalConsortium
State
Private
Out of StatePublic VHS
Out of StatePrivate VHS

Prepared Academically for DE
0% 4%
45%
51%Not Well at AllNot Very WellSomewhat WellVery Well
Prepared in Study Skills for DE
1% 11%
60%
28% Not Well at All
Not Very Well
Somewhat Well
Very Well

Prepared in Computer Skills for DE
1%23%
76%
Not Very Well
Somewhat Well
Very Well

Satisfaction with DE Courses
2% 6%
45%
47%
Very Dissatisfied
Somewhat Dissatisfied
Somewhat Satisfied
Very Satisfied
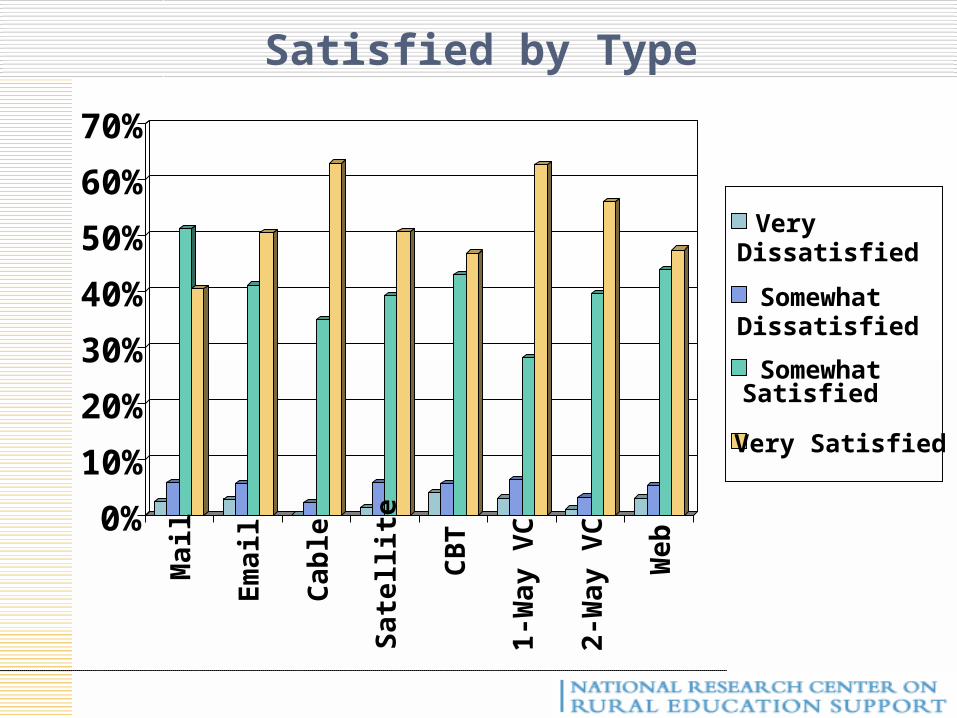
Satisfied by Type
0%
10%
20%
30%
40%
50%
60%
70%
Mai
l
Em
ail
Cab
le
Sat
elli
te
CB
T
1-W
ay V
C
2-W
ay V
C
Web
VeryDissatisfied
SomewhatDissatisfied
SomewhatSatisfied
Very Satisfied

Satisfaction by Region
ANOVA
Sum of Squares df Mean Square F Sig.
Between Groups .349 3 .116 1.606 .188
Within Groups 23.603 326 .072
Total 23.952 329
0
0.10.2
0.30.4
0.50.6
0.7
0.80.9
1
Northeast
Midwest
South
West

Satisfaction by Ethnicity
ANOVA
Sum of
Squares df Mean Square F Sig.
Between Groups .786 4 .196 2.757 .028
Within Groups 23.166 325 .071
Total 23.952 329
00.10.20.30.40.50.60.70.80.9
1
White
African Amer
Latino
Am Indian
Other

Who Pays Tuition Costs
49%
38%
3%10%
District
Students
State
Other
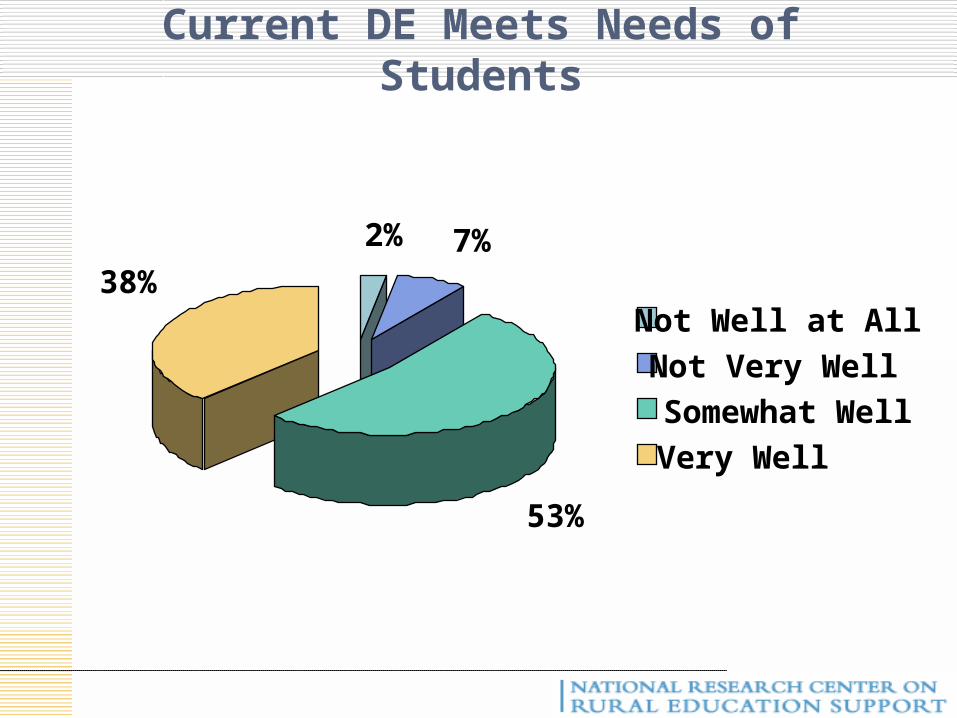
Current DE Meets Needs of Students
2% 7%
53%
38%Not Well at All
Not Very Well
Somewhat Well
Very Well

Need Access to Additional DE Courses
65%
35%
Yes
No

Courses Needed
0%5%
10%15%20%25%30%35%40%45%50%
Math Science History ForeignLanguage
English

Who Decides What Courses for DE
0
10
20
30
40
50
60
70Superintendent/Assoc SupSchool Board
Principal
GuidanceCounselor
Teacher
Other

Selection of DE Providers
62%23%
15%
District Selects
District Selectsfrom Approved List
Externally Selected

Barriers
59%
53%47%
45%
34%31%
0%
10%
20%
30%
40%
50%
60%
70%
80%
90%
100%
Scheduling DE Priority Trained InstPersonnel
DE DifficultImplem
Have InstPersonnel
CourseAvailability

Barriers
31%28%
17%15%
10% 7%0%
10%
20%
30%
40%
50%
60%
70%
80%
90%
100%
Funding Strategic Plan Tech Expertise TechClassrooms
Tech Maintain Connectivity