Embed Size (px)
Citation preview
SURVEY OF CURRENT BUSINESS WEEKLY SUPPLEMENT
UNITED STATES DEPARTMENT OF COMMERCE B U R E A U O F F O R E I G N A N D D O M E S T I C C O M M E R C E
AVAILABLE ONLY WITH SUBSCRIPTION TO SURVEY OF CURRENT BUSINESS OCTOBER 17, 1947
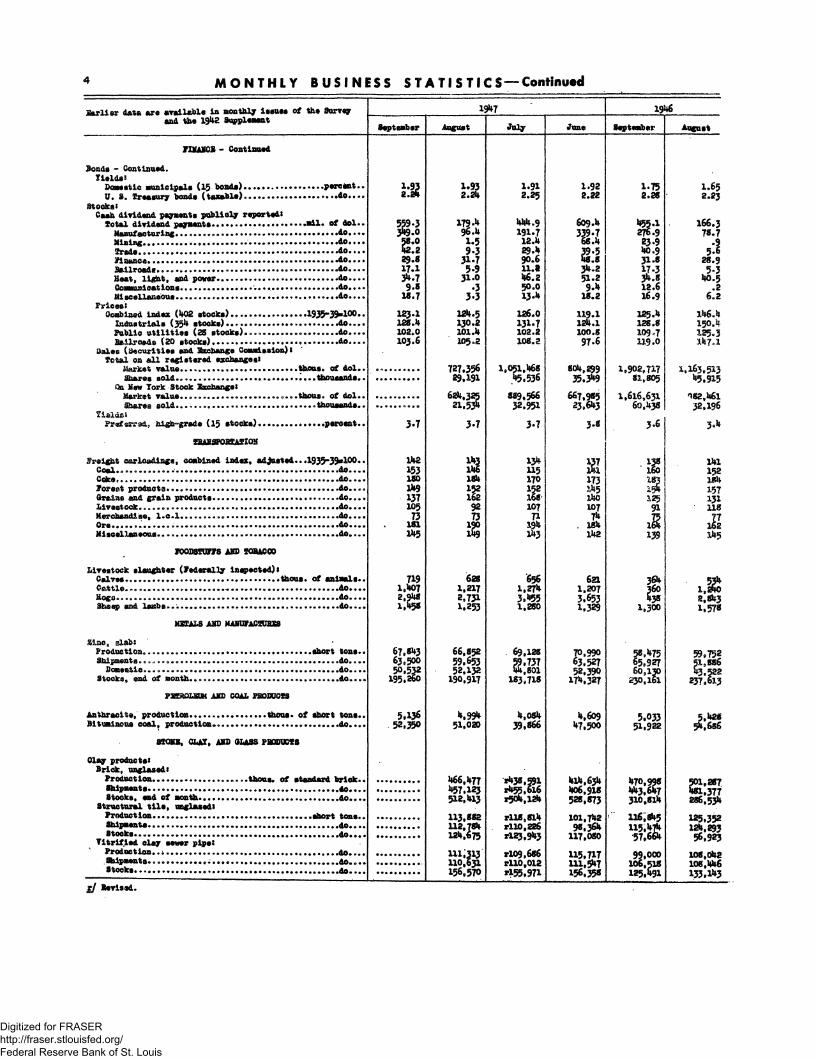
M O N T H L Y BUSINESS STAT IST ICS STEEL INGOT PRODUCTION
(1935-39-100) ELECTRIC POWER PRODUCTION 3Y UTILITIES
(BILLIONS OF KILOWATT HOURS)
U..i.JL..L_i.J.-L_l_ijLJ_JULJ_l-J„LJL^^
5 0 0
a so
2 0 0
ISO
._... .. aatr Sn^* 8 ^
. L 1 1 l*Tl '
DEPARTMENT STORE SALES AND STOCKS (SEASONALLY ADJUSTED, 1935-39-100)
J 1 ! i
SALES ^ ! / /
. .y%A/\ysy\ J^ **** \ * ^ > > a j J^" STOCKS j
1 TT?*V*?"TTi i ! 1 j T T i i ! 1 1 i i J. i_J_.l_ J_ J—l_i_l 1 ! 1 1 ' 1 1 i i
MANUFACTURING EMPLOYMENT AND * W ROLLS (UNADJUSTED. ! 9 3 S - ' 0 0 )
1946 1947
WEEKLY BUSINESS S T A T I S T I C S 1 1944 1945 1946
ITEM 19U7
Oct. XI Oct. 4 I Sgpfe. 2? I Sept. 801 Sept. 13
1946
Oct. 12 Oct. 5
Commodity prices, wholesales All commodities 2/ 1926*100..
Sarm products <> d o . . . . tfood d o . . . . All other 2/ d o . . . .
28 commodities 2 / . August 1939*100 •* Cotton, middling, 15/lfi", 1C markets 4/ dol. per l b . . tinea*, So. 2, Hard Winter (Kansas City) £ / . . • . .dol. per bu..
Stopartment store s a l e s . . . . . 1935""39»100,. Insured unemployment, total 6/ thous..
State; programs., . d o . . . • Veterans' program® d o . . . .
finance* Currsaey In sirsulation 4 / . . . . a i l . of dol . , Vedoral iiteserv© bank credit, total d o . . . . Member bank reserve balances d o . . . .
$g»ess reserves, estimated d o . . . . federal. Reserve reporting member banks in leading cities? jj
Bank debits, total rail, of dol . . Sew lork City d o . . . .
Deposits, deaand, adjusted ...do.... Loans and. investments, total do....
0. 9. Government obligations do.... Commercial, Industrial and agricultural loans do....
failures, commercial <• number.. Bond yields, domestic corporate (Moody1 s) percent.. Stock prices, 402 stocks (Standard and Poor*s).1935-39-100..
Industrials, 354 stocks do.... Production!
Bituminous coal 4/ thous. of short tons.. Klectrlc power, by utilities ail. of kw-hr.. Motor vehicles (Wards) 8/ auaber.. Petroleum 4/ ....thous. of bbl.. Steel 2 / 1935-39-100..
freight carloadlnge, total thous. of cars . . Miscellaneous d o . . . .
33^-7 .312 2.87
22,853 17 .1k 1.138
2.93 123.2 128.9
97,372
157.1 187-5 17603 138,6 334.5
O07 2.86
28,525 22,931 17.0-J4 1,041
22,139 9,119
47,05f 64,796 38,400 13,116
2.92 122.9 128.3
2,032 »+,935
101,608 5,208 IS5.0
?43 429
156.2 1S4»7 177-6 13s.2 326.9
-310 2.6? 317
:>,307 769 480
23,563 22*573 16,831
953
3:3 38,680 12,935
77 2.89
121.9
127.*
2,050 4,956
106,894 5,196 184., 5
933 421
15s. I 189.8 182-3 13s.0 324.8
.321 2c 72 301
1,425 •35 551
2* 631 22^94 17.128 1,145
20,383 7.710
47,498 64,714 39,022 12,858
73 2.85
124.0 129.6
2„040 4,97?
109,73^ 5,200 175.2
931 413
157*4 187 o 180,9 2„3go! 324.6
.316 2o6s
291 *«536
874
28,728 22,472 16,932
1,103
!7,4r*3 6,803
47,350 64B2$2 38,699 12,719
75 2.82
122.0 127..1
2,100 5.053
106.095 5,217 I65.2
922 404
126.0 3.60,2 137.7 112.6 243.8
.388 2.02 281
8.039 922
1.061
?fft609 24,048 16,019
766
18,010 6,923
66,607 4U,504 10f412
25 2.82
117-S 121.1
2,086 M 9 5
86,330 4,737 178.5
899 3«9
125.I 158.0 135.5 112.6 243. %
,386 2.0.1 27?
2,082 918
1,110 2? ^4£ 24i140 16.166
934
20,597 8.213
45,621 66,450 44,281 10,180
28 2.82
125a 128.9
2,092 4,478
91,925 U.737 178-1
90? 395
1/ Data do not always cover calendar weeke^ 2/ See note in January 1, 1947 issue, j / Ihursday prieaa. 4/ Daily average. 5 / Data for 1947 Include dark hard winter not included previously. 6/ For description see note in July 13, 1946 issue, jj Shown on a revised tanla beginning in Supplement for July 18, 1947. 8/ Data are for U. S. and Canada and include passenger coirs, commercial ears, and trucks. 2 / tfsek ending October 18, I89.8.
Digitized for FRASER http://fraser.stlouisfed.org/ Federal Reserve Bank of St. Louis
SELECTED BUSINESS I N D I C A T O R S
teller data are available la monthly U I U M of the Surrey and the 1948 Supplement
W7 ' September August Ju ly June
19*6
September
COBSTBJXTXOB ABB BBAL BSTATB
Construction c o s t s * JkaarJLppr.Go. t a v g . , 3 0 c i t i e s . . - 1 9 1 > 1 Q 0 . At lan ta d o . . . Hay York d o . . . San Francisco d o . . . S t . Louis d o . . .
.1935-39-100. d o . . .
DOMESTIC TBABB
Department e tore e a l o o , United S t a t e * t o t a l s * Unadjusted index Adjusted index
MPLOIIUK COHDZf ICH8 AMD VA0B3
Production workers, all manufacturing, unadjusted.*1939»100. Durable goods industries do...
Iron and steel and their products do... Blast furnaces, steel vorks, and rolling Bills...do...
Bleetrical aechinery do... Machinery, except e l e c t r i c a l d o . . .
Machinery and •achlns-shop products d o . . . Machins t o o l s d o . . .
Autoaobi les d o . . . Transportation equipment, except a u t o a o b i l e s d o . . .
A ircraf t and p a r t s (exc luding engines) d o . . . Aircraf t engines d o . . . Shipbui lding and boatbui ld ing d o . . .
l onf srrous a e t a l s and products d o . . . Luabsr and timber bas ic products d o . . .
Sawsdlls 1/ do... furniture and finished luaber products do...
furniturs l/ • do... Stone, clay, and glass products do...
Nondurable goods industries do... Textile-Bill products,and other fiber aanufactures.do... Cotton manufactures, except email wares do... Silk and rayon goods do... Woolen and worsted asnufactures do...
Apparel and other finished textile products do... Msn's clothing 1/ do... Women's clothing 1/ do...
Leather and leather products do... Boots and shoes 1/ do...
food and kindred products do... Baking do... Canning and preeerrlng do... Slaughtering and seat jpaoking do...
Tobacco manufactures do... Paper and allied producte do... Paper and pulp do...
Printing, publishing, and allied industries do... Bevspapero and periodicals 1/ do... Printing, book and Job 1/ do...
Chemicals and allied products do... Cheaicals do...
Products of pstrolouB and c o a l <• d o . . . Petroleum r e f i n i n g d o • . .
Bubber producte d o . . . Bubber t i r e s and inner tubes 1 / d o . . .
Bonaanufactaring employment, unadjusted: Mining:
Anthracite d o . . . Bituminous coal do... Metalliferous do...
-quarrying and nonmetallic do... Crude petroleum and natural gas do... Public utilities*
Blectric light and power do... Street railways and busses do... Telegraph do... Telephone do...
Serriceei Dyeing and cleaning do... Power laundries do... Tear-round hotels do. •.
Botail trade do... Wholesale trade do...
Production-worker pay rolls,all manufsuturing,unadj....do... Durable goods lndustrlee do...
Iron and steel and their producte do... Blast furnaces, stsel works, and rolling mills.. .do...
Blectrical machinery do... Machinsry, except electrical do... Machinery and machine shop products do...
452 475 424 446
P297 p»9
446 470 448 417 44l
235 281
rl53-« rl77-l rl58.5
129.5 ra5.6 222.2 185.9 141.6
r l9L3 r247.2 329-3 299.9 121.3
rlTO.0 r l6 l .5 rl75.« rl31.?
129.4 rl44.0 rl35-4 r102.5
112.6 75.3 98.2
142.5 128*3 154.0
91 rl52.0 109.3 153.7 125.1 r91.6 11*3.0 142.6 129.8 120.8
Autoaobiles do..
l/ fierised. 2I frellainary. 1/ Bate for the indicated industries have 1
23 ti2 409
a9 2«7
149.0 174.7 156.1 126.2 215.0 217.9 184.5 136.8 195.0 248.9 326.0 301.1
r!26.1 168.2
rib?!* 127.8 125-9 140.2 130.3 101.2 112.3 r74.2
95.4 13L7 121.1 140. U 100.6
93.9 140.8 108.7 108.2
A24.9 89.6
140.7 140.9 128.8 119*8
rl38.2 189.8 180.8 153.7 141.4 175-2 212.3
78.7 81.8 89.1
106.0 97.2
AO9.3 130.9 IOI.5 193.3
123.4 112.8 118*3 110.2 111.1 313.9
r35p.4 304 .4
*235-3 4 2 2 . 3 420 .7 356 .1 239.9
r348.8
427 448 *2
421
265 2«9
151.4 179.7 157.5 128.0 221.5 224.2 188.7 145.9 196.2 291.8 337.4 302-5
r202.7 175.1 158.2 170.5 129.8 127.6 144.0 129.I 10J.1 114.5 r75.b
98.3 131-7 123.9 135.9
99.8 92.9
130.3 107.2
67.9 121.1
90.2 143.4 141.3 129.I " 9 . 7 137.8 I88.5 182.1 150.8 139.2 I8O.7 217.0
8O.3 88.7 90.4
105.7 95-5
107.5 130.4 102.3 190.4
127.7 112.2 119*4 111.4 110.5 319.6 365.9 316.1 247.0 432.6 434.6
£:l 357.0
342 367 3*7 317 332
82.2 90.5 83.5
102.5 93-9
101.9 129.9 112.0 181.0
125.6 109.9 U9.5 IO9.8 109.4 290.3 323.3
206.3 397.2 376.2 322-3 2*5-5 330-3
* l
323
242 290
147.7 170.6 150.2 123.6 210*5 206.6 176.2 167.5 187.8 294.7 338.3 309.3 228.6 177.3 139.0 150.7
.123-4 122.2 141.6 129.7 104.0 114.2
77.2 104.4 130.5 115.7 140.5 102.7
94.1 138.6 102.7 153.5 114.8
91.7 139.2 135.5 121.6 110.4 132.1 I8O.5 I68.5 147.4 137.4 184.0 217.5
82.0 90.8 82.5
103.2 95.5
101.9 130.2 111.9 181.1
124.5 111.6
106.6 109.1 284.4 316.1 265-9 204.0 378.9 362.2 314.2 281.4 319.0
1 adjusted to 1945 data from the Federal Security Agency.
Digitized for FRASER http://fraser.stlouisfed.org/ Federal Reserve Bank of St. Louis
M O N T H L Y B U S I N E S S ST A T IS T IC S —Continued
Barlior data are available la Monthly lesues of the Survey and the 13*12 3uppl<BHvent
1947
September | August July June
1946
Sept amber | August
mpuHMBir COHDXTIQMS ASD WAGES - Continued
Productioa-vorkar pay rol l s - Continued. Parable goods Industries - Continued.
Transportation equipaeatt except automobiles...193^1°0' Aircraft and partis (excluding engines) . d o . . . Alr«raf t engines d o . . . Shipbuilding and boatbuilding d o . . .
Moaf errous metals and products d o . . . Lumber and timber basic products do.
Sawmills 1 / . . . . do. Jurnituro and finished lumber products do. furniture 1/ do.
Stone, clay, and glass products do. Koadurable goods industries do.
!T*xtlle~mill products and other fiber manufactures.do. Cotton manufactures, except small wares »...do. Silk and rayon goods do. Woolen and worsted manufactures do.
Apparel and other finished textile products do. Men3 B clothing 1/ do. Women1 s clothing %j do.
Leather and leather products do. Boots and shoes 1/ do.
food and kindred products do. Baking•.* do. Cannl»,;; w.-.L preserving. do. Slaughtering and meat packing. do.
Tobacco manufactures do. Paper and allied products do.
Paper and pulp - do. Printing, publishing, and allied products do.
Hewspapsrs and periodicals 1/ do. Printing, book and job if do.
Chemicals and allied products do. Chemicale do.
Products of petroleum and coal do. Petroleum refining. do.
Bubber products - do. Bubbor tiree and inner tubes 1/ do.
Pay rolls, ncnmanufacturing, unadjusted: Mining: Anthracite do. Bituminous coal do. Metalliferous do. Quarrying and nonmetallic do.
Crude petroleum and natural gas do. Public utilities:
Electric light and power .do. Street railways and busses do. Telegraph do. Telephone do.
Services: Dyeing and cleaning do. Power laundries do. Tear-round hotels do.
Eetail trade do. Wholesale trade do.
raises Bank debits, total (l4l centers) mil. of dol..
Bev York City do..., Out«id* Sew York City do...,
Public finance (Pederal): 8$$$, gross, end of month do....
Interest bearing: Public issues do.... Special Issues do...,
Bonlnterest bearing do... < Obligations guaranteed by U. S.r amount outstanding..do....
Bonds: Prices:
Industrials, utilities,and rails (Stan.and Poor's Corp.): High grade (15 bonds) dol. per $100 bond.. Medium and lower grade, composite (50 bonds). do....
Industrials (10 bonds) do.... Public utilities (20 bonds).. do fiailroade (20 bonds) .do....
Domestic municipals (15 bonds) do.... U. S. Troaeury bonds (taxable) » do....
Sales (Securities and Exchange Commission): Total on all registered exchanges:
Market value thous. of dol.. Pace value do....
On Sew York Stock Exchange: Mark* t value d o . . . . Pace value d o . . . .
91.889
49!962
259.145 226,587 29.520 2,926
70
121.5 115.8 121.9 114.1
$£ 104.0
482. 637-518, 237. 332.
•430! 293. 284, 299. 288, 239. 291. 195 221,
264! 324, 220, 209, 313 208, 4?4, 249, 203 300, 3U 235 214. 254, 383. 336. §7' 262,
357. 397.
209. 267, 179. 259. 173'
182, 225-
208, 203, 220, 197. 198,
75.048 28,331 46,717
64,886 81.063
56,618 70,705
r483.0 r622.4 485.1 241.8 326.6
r359.8 397-4 281.4 274.4
r285-9 r278.1 237.5 288.7
rl90.8 231.1 278.9 260.0 284.6
r2l4.2 r204.8 290.8 208.2 265.2 260.2 200.0 298.7 309.6 233-6 208.9
r258.9 378.7 341.8 295-6 265.4 352.7 393.8
56O.3 621.5 481.5
%-\ 374.9
r412.2 290.4
' 284.7 298.2 274.2 242.5 293-5
rl93-8 240.2 274.9
r248.3 264.1 211.5 201.7 267.8 203.9 I63.8 241.2
' 194.8 298.0 302.1 235.9 210.0 258.1 373.3 33?.9 286.2 253.8 361.9 396.1
171.8 194.9 171.9 251.2 173-9
178.4 222.1 215.2 302.2
r228.2 210.3 222.0 198.6 196.5
260,097 227.890 29,220
2.987 73
122.3 116.1 123.9 113.9 110.4 134.3 103.9
259.448 227,805 28.516 3.327
74
122.5 115.7 122.8 113.8 110.5 134.7 IO3.8
85.253 109,385
76,972 99,723
194.6 252.3 131.8 251.3 175.3
177.5 222.1 218.8 292.5
241.9 211.1 226.4
r201.6 198.0
84,897 35.632 49,265
258,286 227.747
27.366 3.173
83
122.8 114.3 122.6 113.0
SK 104.1
67,490 88,531
58,246 78.115
524.1 663.9 507.8 346.6 331.8 285.2 309.8 254.4 249.9 267.0 258.1 235-5 281.7 180.9 242.7 283-0 242.7 320.1 204.7 195.2 246.5 187.5 .466.3 118.2 196.0 259.8 2530 203.1 175.6 227.9 329-1 289.6 257.3 232.7 363.9 400.2
194.0 234.9 147.0 227.9 149.5
553.1 640.8 498.3 421.5 324.2 285.6 313.1 250.O 246.7 260.1 253.4 229.4 275.5 181.4 234.1 272.5 236.4 306.3 199.° 188.1 254.3 184.1 387.4 202.3 186.2 256.5 252.7 198.1 168.8 222.4 320.0 288.0 253-1 228.7 33f.? 356.4
193.3 241.0 145.2 225.1 152.6
153-3 207.9 177.3 265.0
152.4 211.2
r/ Bevised. 1/ Data for the indicated industries have been adjusted to 1945 data from the Pederal Security Agency
225.6 188.7 209.5 180.8 182.8
74,552 3L397 43.155
265,369 240,364 23.854
1.151 391
122.8 117.4 123.3 114.7 114.3 137.8 IO3.3
104,881 167.352
99.647 160,265
216.9 188.4 208.9 174.6 177.3
73.9PO 30.216 43,684
' 267.^46 242,916 23.443 1.187
370
123.8 119.1 124.0 115.4 117.7 140.0 104.1
72.691 94,121
69.346 90,244
Digitized for FRASER http://fraser.stlouisfed.org/ Federal Reserve Bank of St. Louis
4 M O N T H L Y BUSINESS S T A T I S TICS—Continued
Earlier data are available In monthly Issues of the Survey and the 1942 Supplement
September
19*7
August July •Tune
1946
September
.percent.
...•do...
mil. of dol. . do...
..do.
VZKaHCS - Continued
Bonds - Continued. Tields:
Domestic municipals (15 sonde) U. 8. Treasury bonds (taxable)
Stocksi Cash dividend payments publicly reported*
Total dividend payments Manufacturing Mining Trade Usance uo.. Sfeilroade*..» do*. Beat, light, and power do.. Communications .... do.. Mlscsllaneoue do..
Prices: Combined index (402 stocks) 1935-39»100
Industrials (354 stocks).., do.. Public utilities (28 stocks)...0 do*. Bailroade (20 etocks) do..
Sales (Securities and Exchange Commiesion)i $ctal on all registered exchanges:
Market value thous. of dol Sharee sold I.. .thousands,
On New York Stock Exchange* Market value... thous. of dol Sharee sold..., thousands,
Yields* P r e f e r ? ^ high-grade (15 stocke) percent
SBAVSPOBXAZXOS
freight c&rloadings, combined index, adjusted. Coal.
.1935-39-100. do...
Coke. ..do. Porsat products...... do. Oralae and grain products do. livestock do. Merchandise, I . e . I do. Ore do. Miscellaneous do.
JOOJJSTuWS AND TOBACCO
Livestock slaughter (Federally inspected): Calves thous. of animals. Cattle d o . . . Hogs. Sheep and lambs.
.do.
.do.
METALS AHD M A H U F A C T O H S S
JSinc, slab: Production short tons. Shipments. do... Somee&ic do...
Stocks, end of month do...
PSSaOLEUH AKD COAL PfiOSUCSS
Anthracite, production thous. of short tons-Bituminous coal, production* do...
STOHB, CLAY, AVB OLASS PBQDUC5S
•thous. of standard brick.
do.
Clay products: Brick, unglased:
Production Shipment s Stocke, end of month
Structural t i l e , unglased: Production Shipments Stocks
Vitrified clay sewer pipe: Production.. • do. Shipments do. Stocks do,
short tons. d o . . .
. . . . . . d o . . .
I'M 559.3 3*9.0 58.0 1(2.2 29.8 17.1 3*-7 9.8
I8.7
123.1 126.4 102.0 IO3.6
3.7
142 153 180 1*9 137 105
73 181 1*5
719 1.407 2.9*8 l .*5*
67.8*3 ft.500 50.532
195.2&
5.136 52.350
\%
17? -4 96.4
1.5 9.3
31.7 5.9
31.0 •3
3.3 124.5 130.2 101 .4 105.2
727.356 29.191
624.325 21.53*
3-7
tig 184
x§ 92
73
149
628 1.217 2,731 1.253
66,852 59.653 52.132
190,917
*,99* 51.020
*66,477 457.123 512.413
113.882 112,784 124,675
Hi; J13 110,631 156,570
1.91 2.25
444.9 191-7
12.4 29.4 90.6 11.8 46.2 50.0 13.4
126.0 131-7 102.2 108.2
x ' « 889.566 32.951
3-7
134 115 170 152
107 71 194 143
1.274 3.*55 1,280
69.128 59.737 44,601 183.718
4,084 39.«66
r455.6l6 r504,i24
rll8,Sl4 rllO.226 A?3.9*3
r!09,686 rll0,012 rl55.971
1.92 2.22
609-4 3H:J m
34.2 51.2
9-* 18.2
119.1 124.1 100,6 97.6
804,299 35.349
667.985 23.643
3.8
141 173 5,45 140 107 7? 184 142
621 1.207 3.653 1.329
63. 0.99O 63.527 52.390 174,327
*.609 47.500
414,634 406,918 528.873
101,742 98.364 117.080
115.717 111.5*7 156.35«
1.75 2.28
276-9 23.9 40.9 31.8 17.3 3*-* 12.6
16.9
125.4 128.8 109=7 119.0
1,902,717 81,805
l,6l69631 60,438
3.6
s 125 91
xE 13s
364
438 1.300
56**75 65.927 60,130
230,161
5.033 51.922
310,814
Il6;s45
$ « 99.000
106.518 125.*91
rj Bevised.
Digitized for FRASER http://fraser.stlouisfed.org/ Federal Reserve Bank of St. Louis


![PengantarE-Business dan E-Commerce - Ifa's · S1 Teknik Informatika -Unijoyo 1 PengantarE-Business dan E-Commerce Pertemuan Ke-2 (Business-to-Business [B2B] E-Commerce ) NoorNoorIfadaIfada](https://img.pdfslide.us/doc/110x75/5d5d79d888c993d6228b5b47/pengantare-business-dan-e-commerce-ifas-s1-teknik-informatika-unijoyo-1.jpg)