Embed Size (px)
Citation preview

SURVEY OF
MAY 1942
UNITED STATES DEPARTl\IENT OF COl\IMERCE
BUREAU OF FOREIGN AND DOMESTIC COMMERCE

SURVEY OF CURRENT BUSINESS
Volume 22
MAY 1942
ECONOMIC HIGH LIGHTS......................................... 2
THE BUSINESS SITUATION........................................ 3
General maximum price regulation.. . . . . . . . . . . . . . . . . . . . . . . . . . . . . . . . . . . . . . . . 3
Fiscal policy. . . . . . . . . . . . . . . . . . . . . . . . . . . . . . . . . . . . . . . . . . . . . . . . . . . . . . . . . . . . . . . . 3
Consumer credit control. . . . . . . . . . . . . . . . . . . . . . . . . . . . . . . . . . . . . . . . . . . . . . . . . . . . 7
Cotton textile program. . . . . . . . . . . . . . . . . . . . . . . . . . . . . . . . . . . . . . . . . . . . . . . . . . . . . 8
Conservation of essential consumer-goods stocks indicated.................. 8
PRELIMINARY ESTIMATES OF GROSS NATIONAL PRODUCT.. 9
MANUFACTURING CAPITAL EXPENDITURES, PART II.. . .. .. . 14
QUARTERLY ESTIMATES OF CONSTRUCTION.................. 24
STATISTICAL DATA:
Monthly business statistics................................................... S-1
General index..................................................... Inside back cover
Published by the Department of Commerce, JEssE H. JoNEs, Secretary, and issued through the Bureau of Foreign and Domestic Commerce, CARRor.L L. WILSON, Director
Number 5
Subscription price of the monthly and weekly issues of the SuRVEY OF CuRRENT BuSINESS, $2 a year. Single-copy price: Monthly, 15 cents; weekly, 5 cents.
456781-42--1
Foreign subscriptions, $3.50. Price of the 1940 Supplement is 40 cents. Make remittances only to Superintendent of Documents, Washington, D. C.
2 SURVEY OF CURRENT BUSINESS :\iay 1942
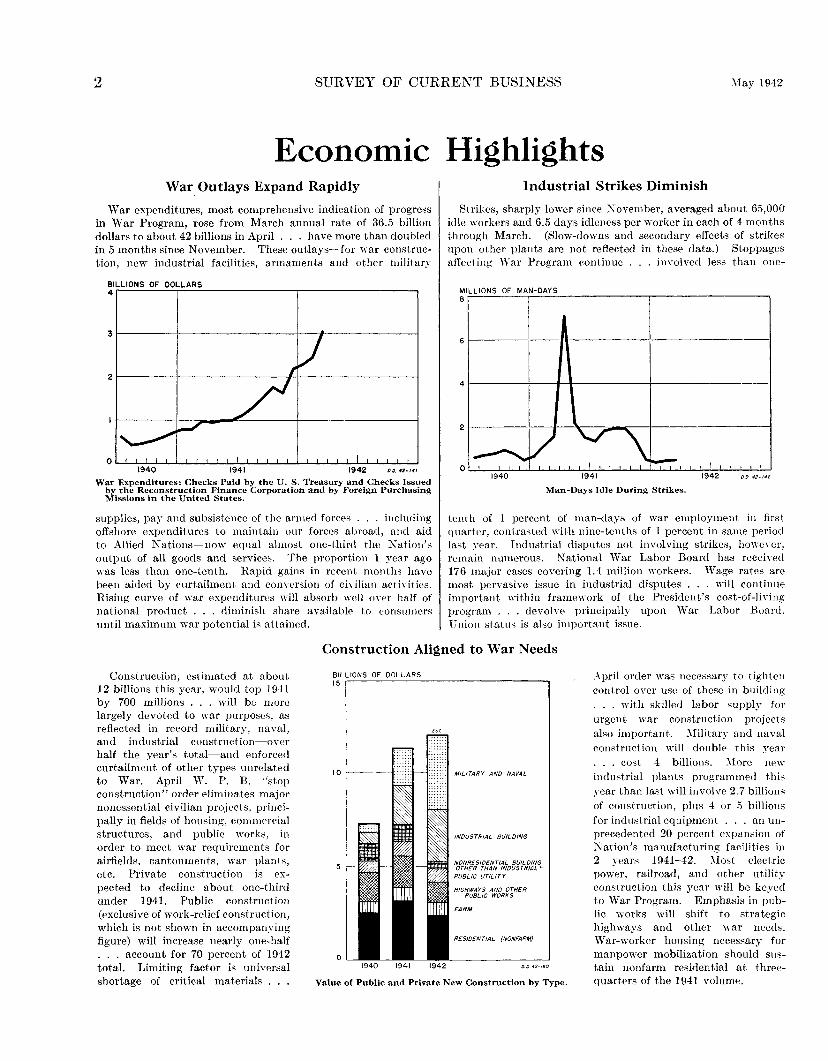
Economic Highlights War Outlays Expand Rapidly
War expenditures, most comprehensive indication of progress in War Program, rose from March annual rate of 36.5 billion dollars to about 42 billions in April ... have more than doubled in 5 months since November. These outlays- for war construction, new industrial facilities, armaments and other military
BILLIONS OF DOLLARS 4
War Expenditures: Checks Paid by the U. S. Treasury and Checks Issued by the Reconstruction Finance Corporation and by Foreign Purchasing Missions in the United States.
supplies, pay and subsiste11ce of the armed forces ... including offshore expenditures to maintain our forces abroad, alld aid to Allied Nations-now equal almost one-third the 1\ation's output of all goods and services. The proportion 1 year ago was less than one-tenth. Rapid gains in recent months have been aided by curtailment and conversion of civilian actiYities. Rising curve of war expenditures will absorb well o\·er half of national product ... diminish share availablP to eonsmuprs until maximum war potential is attained.
Industrial Strikes Diminish
Strikes, sharply lower since November, averaged about 65,000 idle workers and 6.5 days idleness per worker in each of 4 months through March. (Slow-downs and secondary effects of strikes upon other plants are not reflected in thesE' data.) Stoppages aff<>eting \Var Program continue ... im·olved less than one-
-MILLIONS OF MAN DAYS 8
6
4
I~ v '7\ I 1--.- I
2
0 1940 1941 1942
Man-Days Idle During Strikes.
tenth of 1 percent of man-days of war employment in first quarter, contrasted with nine-tenths of 1 percent in same period last ~·ear. Industrial disputes not involving strikes, ho\YeYer, remain numerous. !\ ational \Var Labor Board has receh·ecl 176 major cases coYering 1.4 million \Yorkers. \Vage rates are most pervasive issue in industrial disputes . . will continue important within framework of the President's cost-of-liYing program ... devolve principally upon War Labor Board. rnion status is also important issue.
Construction Aligned to War Needs
Construction, estimated at about 12 billions this year, would top 1941 by 700 millions ... will be more largely devoted to war purposes, as reflected in record military, naval, and industrial construction-over half the year's total-and enforced curtailment of other types unrelated to War. April W. P. B. "stop construction" order eliminates major nonessential civilian projects, principally in fields of housing, commercial structures, and public worh, in order to meet war requirements for airfields, cantonments, war plants, etc. Private construction is expected to decline about one-third under 1941. Public construction (exclusive of work-relief construction, which is not shown in accompanying figure) will increase nearly one-half ... account for 70 percent of 1942 total. Limiting factor is universal shortage of critical materials ...
BILLIONS OF DOLLARS l5
lO
5
0 }940 l941 l942
MILITARY AND NAVAL
INDUSTRIAL BUILDING
NONRESIDENTIAL BUILDING OTHER THAN INDUSTRIAL~·
PUBLIC UTILITY
HIGHWAYS AND OTHER PUBLIC WORKS
FARM
RESIDENTIAL {NONFARM)
DO 42-160
Value of Public and Private New Construction by Type.
.-\pril order wa/3 necessary to tighten control over use of these in building . . . with skilled labor supply for urgent war construction projects also important. :\iilitary and naval construction will double this year . . . cost 4 billions. :\fore new industrial plants programmed thb year than last will involve 2. 7 billions of construction, plus 4 or ;} billions for industrial equipment ... an unprecedented 20 percent expansion of Nation's manufacturing facilities in 2 years 1941-42. :\Iost electric power, railroad, and other utility construction this year will be keyed to War Program. Emphasis in public works will shift to strategic highways and other war needs. \Var-worker housing necessary for manpower mobilization should sustain nonfarm residential at threequarters of the 1941 volume.
May 1942 SURVEY OF CURRENT BUSINESS 3
The Business Situation APRIL will be an important date in United States ~ economic history because of the issuance of the General Maximum Price Regulation. This is a landmark in Government wartime control over the Nation's economy.\ It seems worth while to set this regulation in its proper perspective.
For the first 18 months of the present war, the price level and the cost of living showed little change. Indeed after the first speculative uprush in September 1939, prices actually fell for nearly a year. The reason for this behavior has often been pointed out: This country's productive facilities then had enough surplus capacity so that production could be expanded rapidly enough to keep in step with defense spending. A fundamental change occurred after Dunkerque when appropriations at that time unprecedentedly heavy, were voted for the Nation's defense and the volume of defense spending began the spectacular climb depicted in the figure on the opposite page. Industrial output, however, also staged a remarkable spurt. · Thus until March a year ago the idea of goods shortages remained merely an intriguing possibility in the minds of most people.
Shortages first became serious in commodities basic to the rearmament effort. Hence most of the price control schedules issued by the Price Administrator were aimed at stabilizing the prices of such materials as steel scrap, steel and other metals and metal products, textiles and textile raw materials and other basic commodities. By the end of March 1942, 112 such formal price schedules had been issued. Informal controls had also been attempted, consisting of volunta.ry agreements made with individual companies or entire industries to hold prices down, fair-price and price-freezing requests, suggestions and warnings. In spite of these measures, the Bureau of Labor Statistics' general index of wholesale prices rose 20 percent in the year ending March 1942 and the cost of living rose 12 percent.
As long as shortages were confined to specific commodities and in particular confined largely to nonconsumer items, selective price control was reasonably adequate. The country's abrupt plunge into war caused immediate and heavy pressure to convert all possible productive facilities from producing goods for civilian use to production of war goods. This widespread conversion, now actively in progress, is having the obvious result of creating shortages of many goods of civilian consumption at the very time that swiftly climbing war expenditures are forcing the national income to levels so high as recently to be considered unattainable. It. is this combination of circumstances
which rendered inadequate price control by the selective process of tagging specific items and leaving the others free to rise without limit. Hence the time was ripe for general, comprehensive and deliberate measures designed to stop inflation.
The framework for these is the broad program, inaugurated by the President last month, to:
Stabilize the cost of living through freezing virtually all prices and rents;
Ration all essential commodities for which civilian demand exceeds supplies, effecting their orderly and equitable distribution;
Limit increases in wage rates to the relief of wage inequalities and of substandard incomes, as one means of curbing excess consumer purchasing powerand as additional ways of achieving the latter purpose to:
Re~trict further the use of consumer credit; Step up consumer savings through greatly increased
purchases of War Bonds out of current income; and Tax more heavily-this last having the result also of
retarding the growth of the Federal debt.
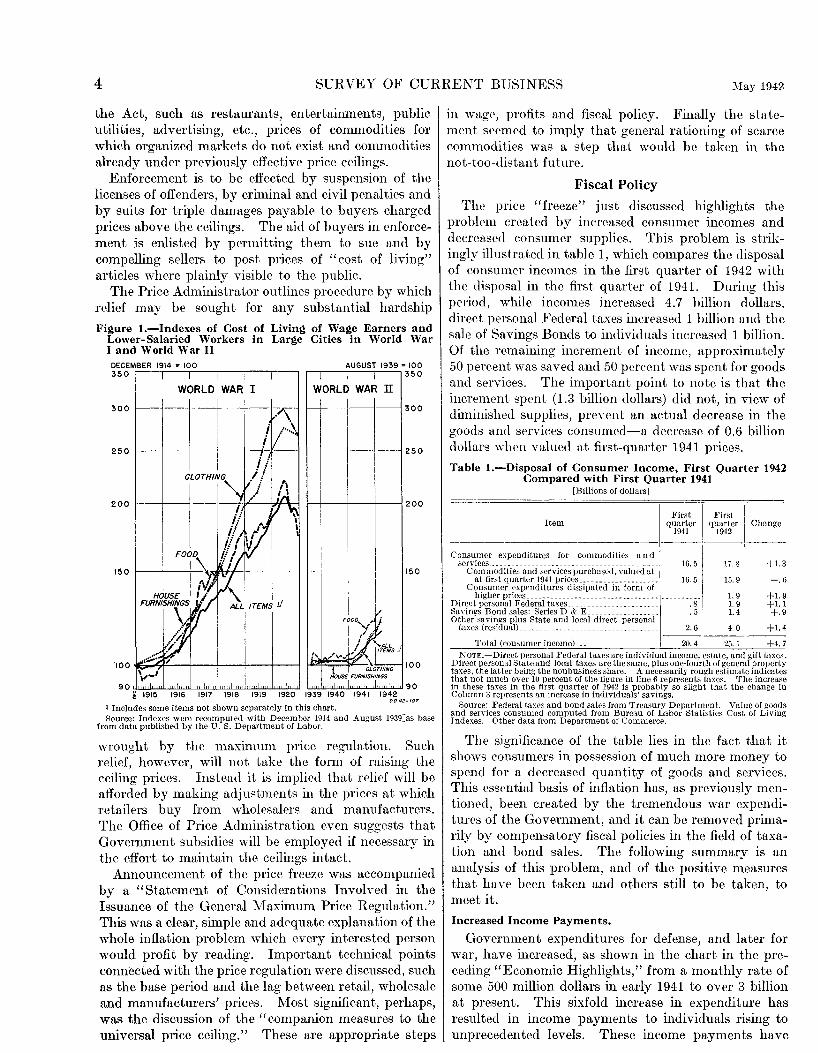
The first point on the President's program was immediately implemented. Sweeping control over the general price level was effectuated for the first time in American history on April28. The General Maximum Price Regulation, announced then by Price Administrator Henderson, set price ceilings for all goods and service's equal to the highest prices of March 1942. Sellers are forbidden to receive and buyers to pay prices higher than these. These ceilings are, in general, not low. The ::\Iarch wholesale price average (Bureau of Labor Statistics' index) was 97.6-just a fraction under the average of the 9 years 1921-29. Only by the annual average prices of 1923, 1924, 1925, 1926 and'by the inflation peaks of the War of 1812, Civil w·ar and World vVar I has the March average ceiling price bt>en exceeded in the century and more since 1812. If general prices and especially the cost of living are effectively frozen at this level, then, as may be seen by reference to figure 1, the country ~ill be spared the major part of the cost-of-living rise that so scourged it in the last war. If this happy result can be achieved, it will set up still another landmark in our economic history: it will mark the first major war fought by the United States without there being drastic inflation whose pPaks stand high above the price lcVf•ls of previous and succeeding decades.
There arc notable exceptions in the coverage of the general freeze order. These are, in general: prices of raw agricultural products when below other ceilings stated in the Emergency Price Control Act of 1942, prices of personal services, professional services, and certain items not deemed to be "commodities" under
4 SURVEY OF CURRENT BUSINESS l\fay 1942
the Act, such as restaurants, entertainments, public utilities, advertising, etc., prices of commodities for which organized markets do not exist and commodities already under previously effective price ceilings.
Enforcement is to be effected by suspension of the licenses of offenders, by criminal and civil penalties and by suits for triple damages payable to buyers charged prices above the ceilings. The aid of buyers in enforcement is enlisted by permitting them to sue and by compelling sellers to post prices of "cost of living" articles where plainly visible to the public.
The Price Administrator outlines procedure by which relief may be sought for any substantial hardship
Figure 1.-Indexes of Cost of Living of Wage Earners and Lower-Salaried Workers in Large Cities in World War I and World War II
DECEMBER 1914 s 100 AUGUST 1939 = 100 350 I I I I I I I I 350
WORLD WAR I WORLD WAR II
300 -"\
300
i ;·.:~ i/ j! • !
250 250
CLOTHING li
"' ll! /t .~/ rA
!, v " !j~ \ !tl,r
I I! I "
i FOOD li (j I~ iii -I
I I r.Q ~. HOUSE ~ I I FURNISHINGS t ALLI ITEMS !) ,
)tJ FOOD~/ j ,, ;t',t
if / t!~ ... . . , /·~ITEMS!}
l,.i:,;::;;:; ,/'v•.., ~·
\,-' j., CLOTHING I HOU~[ 1FURNIS~tGS
200
150
100
90
200
50
00
90 l'l 1915 1916 1917 1918 1919 1920 1939 1940 1941 1942
00 42-107
t Includes some items not shown separately in this chart. Source: Indexes were recomput.ed with December 1914 aud August 1939:as base
from data published by the U. S. Department of Labor.
wrought by the maximum price regulation. Such relief, however, will not take the form of raising the ceiling prices. Instead it is implied that n•lid will be afforded by making adjustments in the prices at which retailers buy from wholesalers and manufacturers. The Office of Price Administration even suggests that Government subsidies will be employed if necessary in the effort to maintain the ceilings intact.
Announcement of the price freeze was accompanied by a "Statement of Considerations Involved in the Issuance of the General Maximum Price Regulation." This was a clear, simple and adequate explanation of the whole inflation problem which every interested person would profit by reading. Important technical points connected with the price regulation were discussed, such as the base period and the lag between retail, wholesale and manufacturers' prices. Most significant, perhaps, was the discussion of the "companion measures to the universal price ceiling." These are appropriate steps
in wage, profits and fiscal policy. Finally the statement sPemed to imply that general rationing of scarce commodities was a step that would be taken in the not-too-distant future.
Fiscal Policy
ThP price "freeze" just discussed highlights the problt•m created by increased consumer incomes and decreased consumer supplies. This problem is strikingly illustrated in table 1, which compares the disposal of consumer incomes in the first quarter of 1942 with the disposal in the first quarter of 1941. During this period, ·while incomes increased 4. 7 billion dollars, direct personal Federal taxes increased 1 billion and the sale of Savings Bonds to individuals increased 1 billion. Of the remaining increment of income, approximately 50 percent was saved and 50 percent was spent for goods and services. The important point to note is that the increment spent (1.3 billion dollars) did not, in view of diminished supplies, prevent an actual decrease in the goods and services consumed-a decrease of 0.6 billion dollars wlwn valued at first-quarter 1941 prices.
Table 1.-Disposal of Consumer Income, First Quarter 1942 Compared with First Quarter 1941
[Billions of dollars]
I
Item
+1.3
First First I quarter quarter 1
1
Change 1941 1942
-~-- ---,,,---Consumer expenditures for commodities and
services, _________________________________________ _ 17.8 i 16. ,5 Commodities and services purchased, valued at
at first quarter 1941 prices____________________ 16.51 15.91 -. 6
C~~~~~;e~rfc'fs~~?_i~~-r~~-~i~~~~~:~~-!~.:~~~-~:- ---------- 1.9 I +1.9 Dir~ctpersonalFederal~axes_______________________ .8 1.91· +1.1 Savmgs Bond sales: Senes D & E__________________ .5 1.4 +.9 0~~~~;(;~~a~fls~~-~~~~~-~~~- =~~~= -~~r_e_c_t __ ~~~~~~~: _ 2. 61 4. o I +t 4
Total (consumer income)_ __________________ .t----zo:41----z5.lf--:;:4.7 1\0TE.-Direct personal Federal taxes are individual income, estate, and gift taxes .
Direct personal State and local taxes are the same, plus one-fourth of general property taxes, the latter being the nonbusiness share. A necessarily rough estimate indicates that not much over 10 percent of the figure in line 6 represents taxes. The increase in these taxes in the first quarter of 1942 is probably so slight that the change in Column 3 represents an increase in individuals' savings.
Source: Federal taxes and bond sales from Treasury Department. Value of goods and services consumed computed from Bureau of Labor Statistics Cost of Living Indexes. Other data from Department of Commerce.
The significance of the table lies in the fact that it shows consumers in possession of much more money to spend for a decreased quantity of goods and services. This essential basis of inflation has, as previously mentioned, been created by the tremendous war expenditun•s of the Government, and it can be removed primarily by compensatory fiscal policies in the field of taxation and bond sales. The following summary is an analysis of this problem, and of the positive measures that have been taken and others still to be taken, to meet it.
Increased Income Payments.
Government expenditures for defense, and later for war, have increased, as shown in the chart in the preceding "Economic Highlights," from a monthly rate of some 500 million dollars in early 1941 to over 3 billion at present. This sixfold increase in expenditure has resulted in income payments to individuals rising to unprecedented levels. These income payments have
May 1942 SURVEY OF CURRENT BUSINESS 5
increased (on a seasonally adjusted basis) from 6.9 million dollars in January 1941 to 8.8 million in March 1942. Despite the increase in direct personal taxes in the last year, individuals' disposable income (income payments minus personal direct taxes) has increased about 2 percent each month for the past year. 1
For the first year after the start of the armament program in mid-1940, the increase in income of inclividuals called forth a greater production of goods and services on which the increased income could be spent. Demand and supply rc•maincd in practical equilibrium, and the gPneral price levd was not subjectrd to much upward pressurP. This state of affairs, however, became increasingly untenable during 1941 as a larger and larger portion of theN ation's production was channPled into war lines at the expense of consumer production. The wartime program of conversion of consumer industries intowarindustrieshasaccelerated this development.·
The result has, of course, hem that the latter part of 1941 saw production of consumer goods failing to keep up with tht> growing demand while in early 1942 an actual diminution in production became apparPnt. SincP portions of this output were absorbed by increases in inwntories, the rpsult is that the quantity sold failed by a decisive margin to keep up with the ever-increasing consumer demand. Hence, tlw incrcasl', some 13 percPnt, in rPtail prices from a yt•ar ago March.
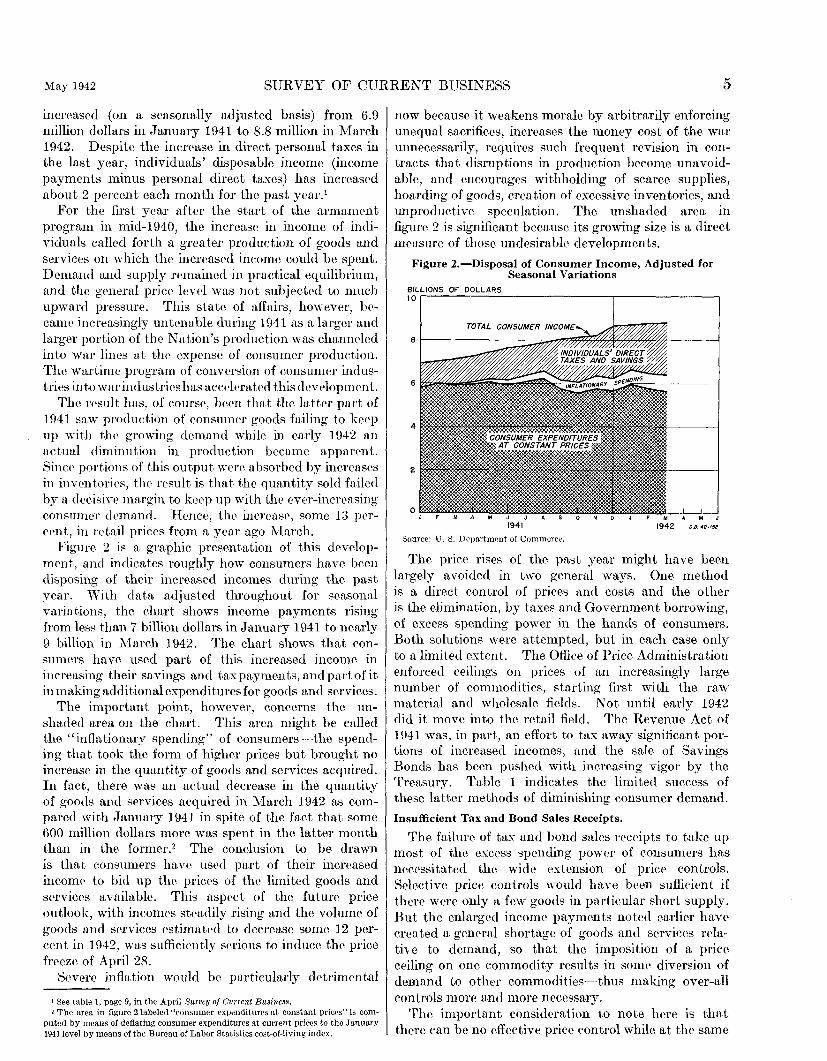
Figure 2 is a graphic presentation of this development, and indicates roughly how consumers have been disposing of their increased incomes during the past year. With data adjusted throughout for seasonal variations, the chart shows income payments rising from less than 7 billion dollars in January 1941 to nearly 9 billion in March 1942. The chart shows that consumers have used part of this increased income in inereasing their savings and tax payments, and part of it in making additional expenditures for goods and services.
The important point, however, concerns the unshaded area on the chart. This area might be called the "inflationary spending" of consumers-the spending that took the form of higher prices but brought no increase in the quantity of goods and services acquired. In fact, there was an actual decrease in the quantity of goods and services acquired in March 1942 as compared with January 1941 in spite of the fact that some 600 million dollars more was spent in the latter month than in the former. 2 The conclusion to be drawn is that consuml'rs have used part of their incn•ased income to bid up the prices of the limited goods and services available. This aspect of the future price outlook, with incomps stt>adily rising and the volume of goods and services estimatP(l to decrease some 12 percent in 1942, was sufficiPnt.ly st>rious to induce the price freeze of April 28.
Severe inflation would be particularly detrimental
r See table I, page 9, in tbe April Survey of Current Business. 2 The area in figure 2 labeled "consumer expenditures at constant prices" is com
puted by means of deflating consumer expenditures at current prices to the January 194llevel by means of the Bureau of Labor Statistics cost-of-living index.
now because it weakens morale by arbitrarily enforcing unequal sacrifices, increases the money cost of the war unnecessarily, requires such frequent revision in contracts that disruptions in production become unavoidable, and encourages withholding of scarce supplies, hoarding of goods, creation of excessive inventories, and unproductive speculation. The unshaded area in figure 2 is significant because its growing size is a direct measure of those undesirable developments.
Figure 2.-Disposal of Consumer Income, Adjusted for Seasonal Variations
BILLIONS OF DOLLARS 10
6
4
2
Source: U.S. Department of Commerce.
o.o. 42-152
The priee rises of the past year might have been largely avoided in two general ways. One method is a direct control of prices and costs and the other is the elimination, by taxes and Government borrowing, of excess spending power in the hands of consumers. Both solutions were attempted, but in each case only to a limited extent. The Office of Priee Administration enforced ceilings on prices of an increasingly large number of commodities, starting first with the raw material and wholesale fields. Not until early 1942 did it move into the retail field. The Revenue Act of 1941 was, in part, an effort to tax away significant portions of increttsed incomes, a,nd the sale of Savings Bonds has been pushed with increasing vigor by the Treasury. Table 1 indicates the limited success of these latter methods of diminishing consumer demand.
Insufficient Tax and Bond Sales Receipts.
The failure of tax and bond sales receipts to take up most of the excess spending powPr of consumers has nec~:ssitated the wide extension of price controls. Selective price controls would have hPen sufficient if there were only a few goods in particular short supply. But the enlarged income payments noted earlier have created a general shortage of goods and services rela·· tiv e to demand, so that the imposition of a price ceiling on one commodity results in some divereion of demand to other commodities-thus making over-all controls more and more necessary.
The important eonsidcration to note here is that there can be no effective price control while at the same
6 SURVEY OF CURRENT BUSINESS :\lay 1942
time there is a large amount of excess spending power. The Office of Price Administration emphasized this fact at the time of the issuance of the General Maximum Price Regulation. Over-all price controls and rationing would be difficult enough to administer in the absence of excess demand; the existence of excess demand "would insure the disregard of law."
In short, the universal price ceiling serves only as the framework for other policies which will reduce consumer demand. The urgency of these other policies is not diminished by the price "freeze."
For this reason, the possibility of increasing both bond sales to individuals and anti-inflationary taxes receives increasing attention despite the broadening scope of direct price controls. Notwithstanding this cognizance of the problem, the measures so far taken in both these areas have fallen short of what was necessary.
The program of encouraging bond purchases by individuals was inaugurated in May 1941 when the old series Savings Bonds were renamed "Defense Bonds" (later, "War Bonds"), and two new series (F and G) were introduced. Since Series F and G War Bonds are, in practice, available only to very large purchasers of bonds and to savings institutions other than commercial banks, it is most unlikely that their purchase represents any diminution in buying power exchangeable for consumer goods.3
Series E Bonds, however, are sold only to individuals and presumably cause a reduction in the consumption expenditures of those individuals. The money used for the purchase of the bonds, however, cannot be presumed to come entirely from living expenses. It can represent normal savings that otherwise would accumulate in some other form, it can represent a usc of funds that would otherwise be idle, or it can represent an expansion of credit.
That some of these factors are operative is indicated by the denominations of the bonds sold. In the 10-month period-May 1941 to February 1942-39 percent of the Series E Bonds sold were in $1,000 denomination, and a further 20 percent were $500 bonds (redemption value). The purchaser of such a large bond can normally be presumed to be a large saver, and hence it is unlikely that his bond purchase will result in any appreciable diminution in his consumer expenditures. That many Series E Bond purchasers are large savers is further indicated by the fact that approximately one-third of the Series F and G Bonds have been sold to individuals-individuals who have presumably purchased their legal maximum of Series E Bonds first. On balance then, it is not likely that much over half the sale of Series E Bonds represents a withdrawal of money from the consumer market.
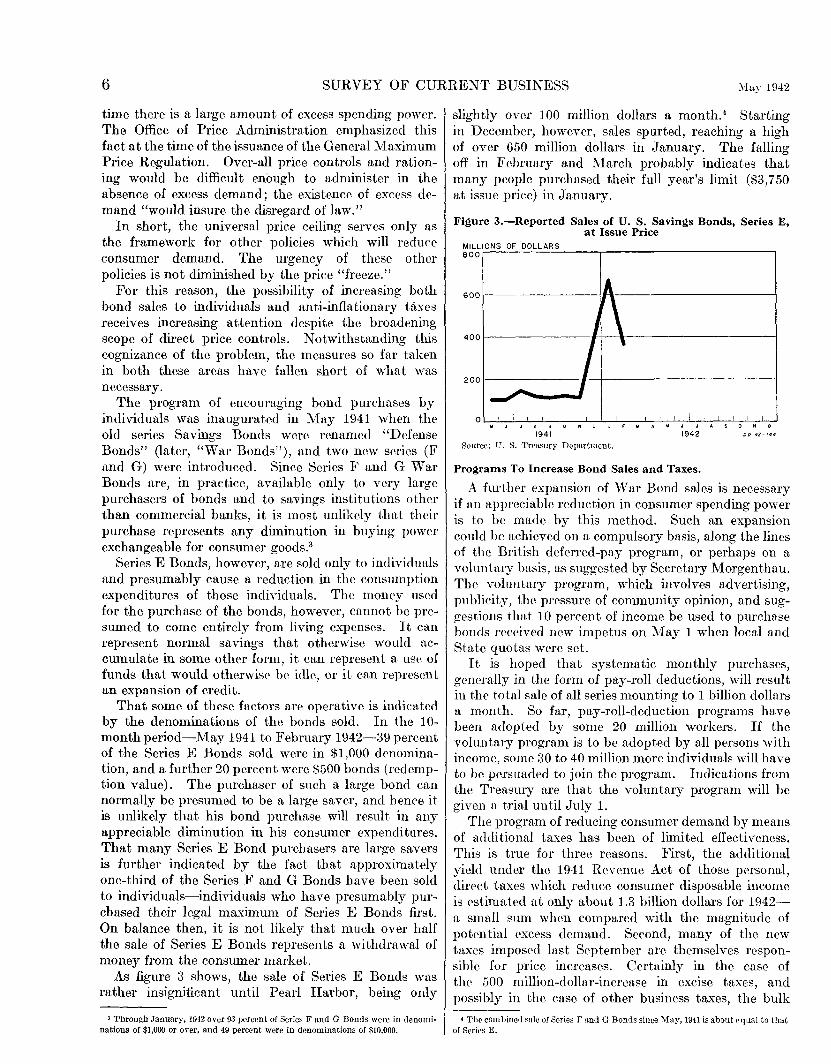
As figure 3 shows, the sale of Series E Bonds was rather insignificant until Pearl Harbor, being only
'Through January, 1942 over 93 percent of Series F and G Bonds were in denominations of $1,000 or over, and 49 percent were in denominations of $10,000.
slightly over 100 million dollars a month. 4 Starting in December, however, sales spurted, reaching a high of over 650 million dollars in January. The falling off in February and March probably indicates that many people purchased their full year's limit ($3,750 at issue priee) in January.
Figure 3.-Reported Sales of U. S. Savings Bonds, Series E, at Issue Price
MILLIONS OF 'DOLLARS 800
0 I I M J J A S 0
1941
I I
N 0 J F M A M J J A S 0 N 0
1942 DO 42~ 144
Source: l'. S. 'l'reasury Department.
Programs To Increase Bond Sales and Taxes.
A further expansion of vV ar Bond sales is neeessary if an apprceiable reduetion in eonsumer spending power is to be made by this method. Such an expansion eould be aehieved on a eompulsory basis, along the lines of the British deferred-pay program, or perhaps on a voluntary basis, as suggested by Seeretary Morgenthau. The voluntary program, whieh involves advertising, publicity, the pressure of eommunity opinion, and suggestions that 10 percent of income be used to purehase bonds received new impetus on May 1 when loeal and State quotas were set.
It is hoped that systematic. monthly purchases, generally in the form of pay-roll deduetions, will result in the total sale of all series mounting to 1 billion dollars a month. So far, pay-roll-deduetion programs have been adopted by some 20 million workers. If the voluntary program is to be adopted by all persons with income, some 30 to 40 million more individuals will have to be persuaded to join the program. Indieations from the Treasury are that the voluntary program will be given a trial until July 1.
The program of reducing consumer demand by means of additional taxes has been of limited effeetiveness. This is true for three reasons. First, the additional yield under the 1941 Revenue Act of those personal, clireet taxes whieh reduee consumer disposable ineome is estimated at only about 1.3 billion dollars for 1942-a small sum when eompared with the magnitude of potential exeess demand. Second, many of the new taxes imposed la.st September are themselves responsible for priee inereases. Certainly in the case of the 500 million-dollar-inerease in exeise taxes, and possibly in the ease of other business taxes, the bulk
• The combined sale of Series F and G Bonds since May, 1941 is about equal to that of Series E.
May 1942 SURVEY OF CURRENT BUSINESS 7
of the burden is shifted to consumers in the form of higher prices. Such higher prices are ordinarily not inflationary, however, for they do not beget higher incomes and so start an upward price spiral.
The third reason why the new taxes have been less effective in averting price advances than they might have been, is that taxes imposed on individuals' incomes are generally not paid until 13 months after the income is received. While some people will anticipate their necessary income tax payments by means of setting aside savings during the prior year for the purpose, it is probable that most people pay this year's taxes out of next year's income. Thus, additional taxes imposed by the Revenue Act of 1941 will not all be paid until December 1942.
In order to encourage tax anticipation savings, the Treasury offered, starting in August 1941, Tax Anticipation Notes which could be used for the payment of taxes due in 1942. The aggregate sale of these Notes through March 1942 was 3,080 million dollars, but over 90 percent of sales were made to corporations. During the 8-month period, individuals anticipated their taxes by setting aside funds through this means only to the extent of 300 millions dollars.
The obvious solution to this problem of delay in tax payments is to change the tax collection system so that taxes will be collected at the source and at the time of income payment. This change of procedure is beset with numerous administrative difficulties, but in offering his 1942 Revenue proposals to Congress, Secretary Morgenthau indicated it might be necessary. That these difficultie~ are not insurmountable is indicated both by British and Canadian experience and by the practice of collecting Social Security levies at the source.
Additional taxes to be incorporated in the 1942 Revenue Bill are an integral part of the anti-inflation drive, a point emphasized by President Roosevelt in his message to Congress on April 27. In addition to the President's proposals of higher excess profits and individual income taxes, the Treasury has proposed higher taxes on normal profits, on selected commodities, on estates, on gifts, and on pay rolls, as well as the removal of certain ~ax privileges, such as tax exemption of State and municipal bonds and married persons' privilege of making separate returns. These proposals were augmented in parly May when the Treasury suggested a further lowering, by 20 percent, of tax exemptions on individual incomes. Of the other recommendations which have come before the Ways and lVIeans Committee in its hearings on the Revenue Bill, the most insistent has been for a general sales tax.
The attack on inflation by bond sales and taxes is complicated by the fact that total receipts are by no means analagous to total withdrawal of purchasing power. This was indicated earlier, in the discussion of Series F and G War Bonds. It is similarly true in the case of taxes. A tax on income, for example, will
reduce consumption expenditures in the case of some people in some income brackets, while in other cases it may simply reduce savings without curtailing expenditures for consumption.
Individual Savings Have Increased.
The potential danger of the price situation is high lighted in figure 2 by the area labeled "individuals' direct taxes and savings." With some 180,000 State and local government subdivisions in the country with varying fiscal periods, it is impossible to know the amounts and dates of payment of the various tax levies. But estimates of the Department of Commerce indicate that direct personal taxes amounted to about 4 billion dollars in 1941, or an average of only some 333 million a month. Savings of individuals account for the remainder of the area in the figure. They have obviously increased considerably in recent months. Had individuals attempted to spend all their increased income on goods and services, prices would have risen very much more than they actually did.
Factors which have stimulated increased savinginability to purchase durable goods, tax anticipation, War Bond purchases, consumer resistance to rising prices, uncertainty about the future-might at any time be overbalanced by factors that will promote more spending-fear of shortages and lack of the habit of saving on the part of many people who now receive increased incomes. There is, moreover, the possibility that the people who are saving so much now will, after accumulating a considerable sum, tend to decrease the volume of their saving. In any event, it is important to note that potentially the base of inflation is much broader than appears on the surface. The task of fiscal policy in stabilizing the price level and reenforcing the new price regulations might therefore be considerably enhanced by a decline in the rate of saving.
Consumer Credit Control.
The Federal Reserve program of curtailment of consumer cn,dit is another anti-inflationary measure. The restrictions on consumer installment credit, which were introduced in SPptember 1941 and later expanded in March and in May, achieve curtailment by means of requiring larger down payments and shorter repayment periods. Accommodation loans which might be used to avoid the limitations are forbidden. These restrictions have undoubtedly eliminated some marginal demand from the market, but of equal importance has been the diminishing supplies of consumer durable goods for the purchase of which most installment credit is granted. From a peak of over 6 billion dollars in August, installment credit outstanding was rC'duced some 8 percent by the end of the year, and it is not unlikely that a further 50-percent reduction will be achieved in 1942.
Additional consumer credit controls were announced in early May. These aim at reducing the volume of outstanding charge accounts by requiring payment of
8 SURVEY OF CURRENT BUSINESS May 1942
charge accounts by the tenth day of the second month after incurrment. If payment is not completed by then, the account must be transferred to an instalment basis, and liquidated in six months; during this period no further charge account purchases will be permissible. Due to the fact that charge accounts for food and some other purchases are not restricted, it is unlikely that a reduction much greater than 25 percent of outstanding charge accounts will be achieved. Since the total volume outstanding is not very large to begin with, this reduction will probably not materially affect consumer demand. Industrial Gains Persist.
The production pattern during April continued to be that characteristic of rapid industrial mobilization for War. Declines on the civilian-goods front contributNl to larger armaments fabrication. Despit<' thc•se diverse' trends (evidenced also by the slow progress of mnmtfacturing employment and miscellaneous cnrlondings) the basic gains made in industrial capacity nrc worth emphasis. Although steel ingot production of 7,122,000 tons declined slightly from the March r0corcl rak, steady progress in aircraft and other wur production, moreover, consumes increasing quantities not only of diverted materials, but also the f'Vr'r-largl'r outflow from new raw matNial plants. Electric powr•r production declined seasonally but exceeded Aprill941 by 13 percent. Machinery and transportation c•quipment were notable for their extension of March gains, as industrial activity advanced 2 points to 17 4 (pn,liminary) in terms of the FedNal ResNvc Board adjusted index.
Miscellaneous rail shipments (classification for loadings of most industrial materials and manufactured products) rose only moderately to a new 1942 high. They still reflect the inroads upon traffic made by stop-production orders and shut-downs for plant conversion. Coal production and loadings, however, were better maintained than usual for April-should be continued in maximum volume throughout the summer to build up users' coal stocks in advance of the heavy burden of other rail traffic expected lat0r this year. With the Great Lakes ore movement in full upswing, total carloadings passed 860,000 on their way toward the one-million mark. Cotton Textile Program.
Important in appraising the outlook for diminished consumption is the fact that some consumer nondurable goods must be diverted in large part to military usescotton textil0s, for exampl0. This industry's production program exemplifies the thorough-going mobilization of resources necessary to meet combined military and minimum civilian needs.
Consumer demand for cotton products, stimulated by advanced levels of income and reinforced by som0 unsatisfied uses of wool, silk, and rayon textiles transferred to cotton, is far above minimum needs. Besides heavy military requirements for a wide variety of cotton
textiles, the shortage of burlap, normally imported from India has created extraordinary needs for cotton fabrics for bagging, baling, and wrapping purposes.
Raw cotton is available in large quantity. The limiting factor in production is manufacturing capacity. Increased output is being achieved, however, through better utilization. By such practices as the substitution of full-loom widths for narrower widths, output of all types of cotton fabrics may possibly be increased from 11 billion square yards in 1941 to perhaps 14 or 15 billions this year and also next. w· ooll'n, carpet, and upholstery mills are also being converted to the mamJfnctun• of cotton fabrics for bugging, c!lmoufluge, etc. 'Voolen machinery will be used in some instances to spin cotton yarn-which has been a bottleneck as well as cotton WPaving capacity.
Action taken in April (shifting certain looms to bag osnaburgs and bag sheetings) will transfer another 13 percpnt of cotton weaving capacity to military and other extraordinary needs, raising the facilities so employed to about .50 percent. Additional steps are planned to effect a virtually complete (88 percent) allocation of cotton manufacturing capacity to military and essential civilian fabrics.
Figure 4.-Sales of Retail Stores, Adjusted for the Number of Working Days in the Month
~~IL~L~IO~NS~O~F~D~O~L~LA~R~S~--------------,-------------,
0 ~~~; 1940 1941 1942 DO 4Z-145
Source: U. S. Department of Commerce.
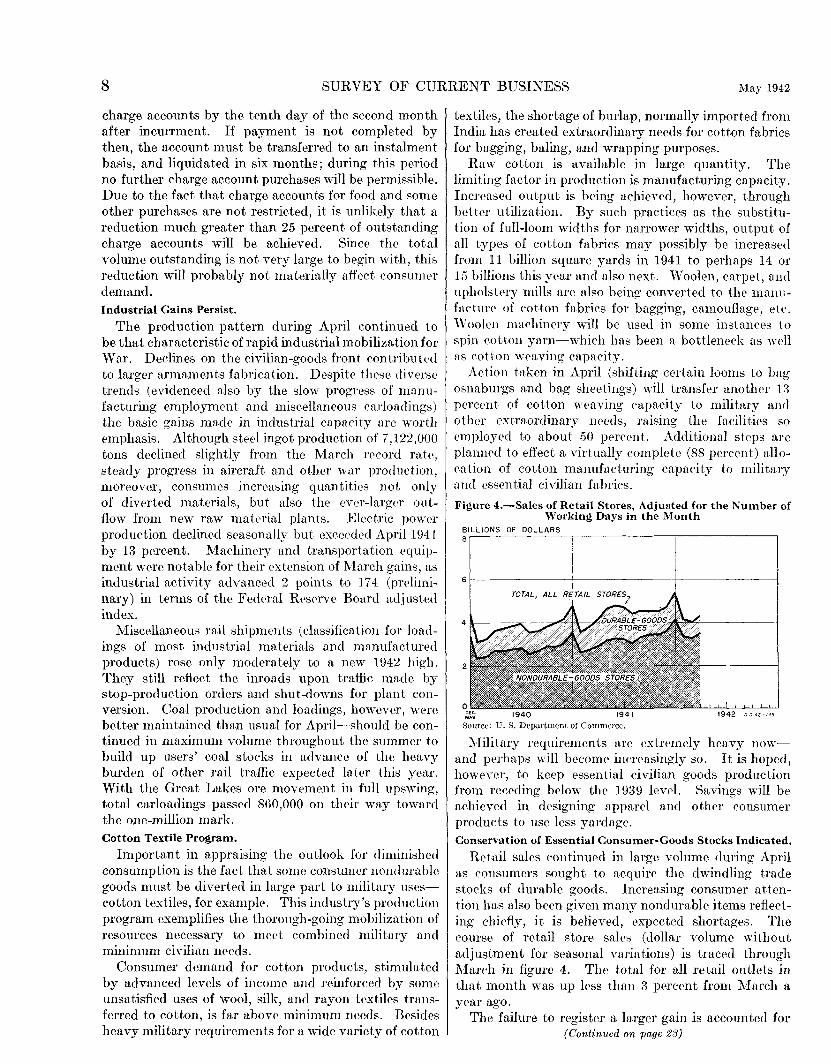
::\lilitary requirements arc extremely heavy nowand prrhaps will become inereasingly so. It is hoped, however, to keep essential civilian goods production from receding b0low tl}(' 1939 lev0l. Savings will be achieved in designing npparrl and otht•r consumer produets to usc less yardage. Conservation of Essential Consumer-Goods Stocks Indicated.
Retail sales continued in large volume during April as consumers sought to acquire the dwindling trade stoeks of durable goods. Increasing consumer attention has also been given many nondurable items reflecting chiefly, it is believed, 0xpected shortages. The course of retail store sales (dollar volume without adjustment for seasonal variations) is traced through March in figure 4. The total for all retail outlets in that month was up less than 3 percent from March a year ago.
The failure to register a larger gain is accounted for (Continued on page 23)
May 1942 SURVEY OF CURRENT BUSINESS 9
Preliminary Estimates of Gross National Product, 1929-41
By Milton Gilbert and R. B. Ban!ls I
In several recent articles/ the Bureau of Foreign and Domestic Commerce has issued preliminary estimates of various components of the gross national product which were thought to be of value in the analysis of pressing economic problems created by the war. Since then many requests have been received from both public and private agencies for more complete information concerning these estimates. The requests indicate a need for estimates covering a longer span of years and for a series of tables showing the interrelations of the various segments of gross national produet or expenditure. Aceordingly, preliminary estimates of these aggregates, distributed in ways partieularly relevant for problems of war produetion and war finance, are being presented here. This presentation, furthermore, provides an opportunity for ineorporating the results of additional work whieh have sinee beeome available, leading to conceptual and statistical improvement of the data previously issued.
Beeause of the misuse sometimes made of estimates of this eharacter, it must be emphasized that the data are being offered as an analytical tool, ratlwr than as precise measurements of every component series. There is every reason to believe that the over-all picture of the economy is represented in its true perspective. Consequently, the vital policy decisions required from day to day in the present emergency can better be made with the aid of this statistical framework than with the cruder relationships that otherwise would be used either explicitly or implicitly. However, several of the component series are still some distance from their finished form. The work of rPfinement is going forward so that series obtained by direct measurement may be substituted for those now obtained as residuals and so that certain well-known limitations of series now directly mPasured may be removed.3
The Two Methods of Measuring National Income
The national income is the most familiar comprehensive m0asure of the output of the economic system.
I The writers would like to acknowledge the contributions of the following mem· hers of the National Income Unit to this work: William Shaw, Wendell Hance, Burton Klein, and Orris Herfindahl. Particular mention is due a former member of the staff, John Lindeman, who made a major contribution during the earlier stages of the work.
' See Survey of Current Business, March and April 1942. ' So far as the three significant residuals in the tables are concerned, savings of
individuals, consumer expenditures for nondurable goods and services, and corporate savings, the first two have been checked against whatever independent direct measures are available and found to be reasonably consistent. The third is known to be significantly understated because of the present underestimation of corporate net income, due largely to the fact that the latter estimate i~ based upon tabulations of unaudited tax returns.
456781-42--2
As is well known, the national income measures the net value of goods and services produced during a given period. In practice this net value of product is now obtained by adding together all the incomes paid or accruing to factors of production during the given period, i.e., by aggregating all wages, salaries, dividends, net rents, net interest, entrepreneurial incomE', and retained earnings of business corporations.
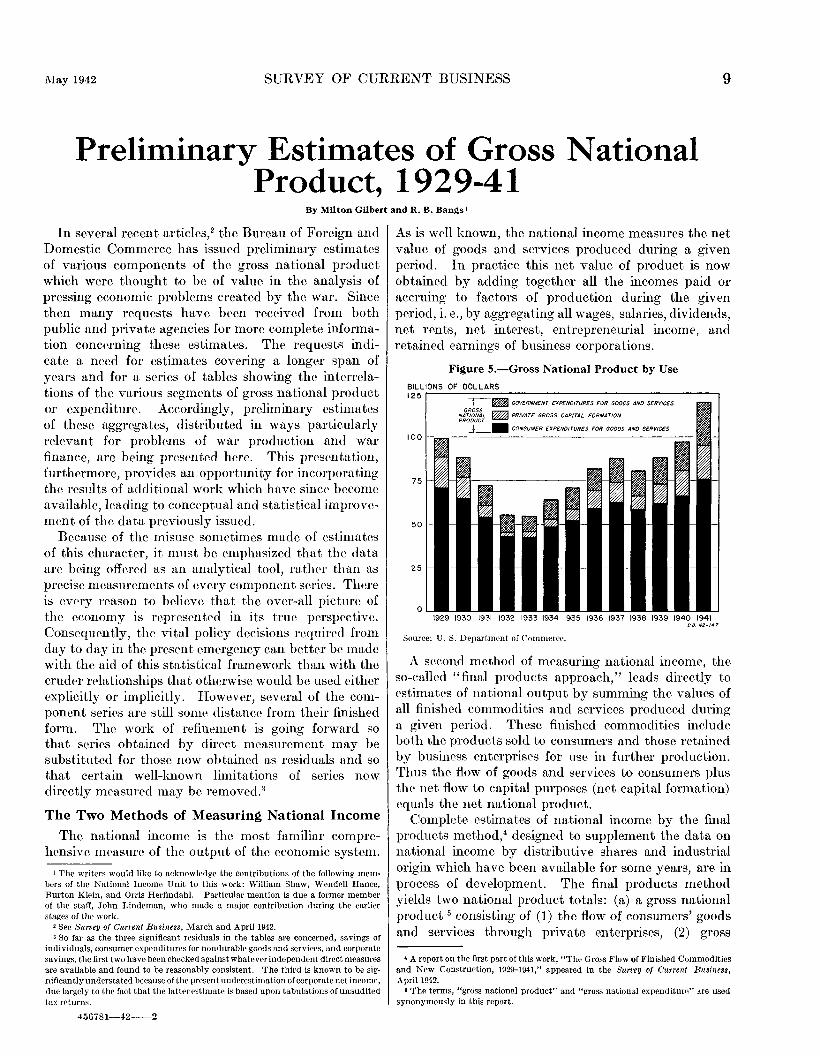
Figure 5.-Gross National Product by Use
BILLIONS OF DOLLARS 125
100
75
50
25
0
-r-m~ GOVERNMENT EXPENDITURES FOR GOOCS AND SERVICES
%!~§3# ~ PRIVATE GROSS CAPITAL FORMATION
j __ CONSUMER EXPENDITURES FOR GOODS AND SERVICES
1929 1930 1931 1932 1933 1934 1935 1936 1937 1938 1939 1940 1941 OD 42-147
Source: 1J. S. Department of Commerce.
A second method of measuring national income, the so-called "final products approach," leads directly to E'stimates of national output by summing the values of all finished commodities and services produced during a given pt~riod. These finished commoditiE's include both the products sold to eonsumers and those retained by business enterprises for use in further production. Thus the flow of goods and services to consumers plus the net flow to capital purposes (net capital formation) equals the net national product.
Complete estimates of national ineome by the final products method/ designed to supplement the data on national income by distributive shares and industrial origin which have been available for some yE'ars, are in process of development. The final products method yields two national produet totals: (a) a gross national product 5 consisting of (I) the flow of consumers' goods and services through private enterprises, (2) gross
' A report on the first part of this work, "The Gross Flow of Finished Commodities and New Construction, 1929-1941," appeared in the Survey of Current Business, April1942.
n 'rhe terms, "gross national product" and "gross national ~xpenditurr." .:tre used synonymously in this report.
10 SURVEY OF CURRENT BUSINESS :\lay 1942
capital formation by private enterprises, and (3) the product of government activities; and (b) a net national product found by subtractirg an allowance for the consumption of capital equipment from the gross national product. Net national product bears a definite reconcilable relationship to net national income us estimated by the distributive shares method.
For certain purposes national income by thr final products method provides more useful breakdowns than estimates by the method of distributive shares. Thus if we wish to know how the national product is being used and the manner in which this use is changing ovrr time, final products data are essential. Similarly all questions relating to the commodity composition of the national product can be handled only in tNms of the final products approach.
The Construction of Gross National Product Estimates
Upon completion of the final products study, estimates of the gross and net national product, broken down in detail by type of commodity and service, will he issued. These estimates will not, in their entirety, be completed for some months. Pending completion of this study, however, it hns been feasible to prt>pare approximate aggregates of gross national product, together with certain breakdowns by type and use of product, using the regular national income series and such parts of the final products material ns have bet>n completed.
The concept of gross national product used lwre is designed to count all final products and services produced by the economy at the prices these products command in the market. So far as the output of private enterprise is concerned, the task is one of estimating the consolidated gross income from operations of all business firms. This total for all business firms must of necessity equal the market value of goods produced and sold during a given period plus the cUITC'llt value of the change in inventories. In the case of government, the total of payments to factors of production is included as the measure of the value of government output.6
The relationship between the national income, as estimated by the distributive shares method, and tlw gross national product, with private enterprise output valued at market prices and government output valued at cost, is shown in table 1. As may readily be seen, thr sum of the component series added to the national income in order to obtain gross national product is in most years relatively constant. Thus, the year-to-year movements of the gross total are not normally much different from the changes in the net national income serres. But in years when the national income is
6 Thus, the concept of gross national product used here is inclusive of govern. ment operations financed by business taxes. This is one of the important respects in which it differs from the concept made familiar by the notable work of Professor Kuznets. See Simon Kuznets, National Income and Capital Formation, National Bureau of Economic Research, 1937.
chnnging sharply or in years which correspond roughly to the turning points of business cycles, sufficient differences between the movements of the two series to be analytically important may be observed. In 1941, for example, while the increase in national income amounted to 17 billion dollars, the increase in gross nntional product was substantially larger, namely 22 billion dollnrs. Another significant difference betwePn the movPments of the two series occurred in 1933 when national income increased by more than 2 billion dollnrs while gross national product declined slightly.
Particular mention may be made of the adjustment for the revaluation of business inventories. a corn•ction introduced in the concept of gross national product but not implicit in the present Department of Commerce estimates of national income. The pricPs n t which business firms charge goods out of inventory to cost of sales and also the method of pricing invcntoriPs at the close of accounting periods may ext•rcise an important effect upon the results yielded by accounting calculations of business net incomP. As is well known, in a period when prices are ebn.nging a business firm may by figuring inventory on an original cost basis, calculate a very diffPrent nrt profit or loss than its accounts would reflect had they Pmployrd, for rxample, a replacement cost procedure. Furthrrmore thr nwthod of inventory pricing follom'cl by business firms varies from firm to firm and from industry to industry, depending on such factors as the flexibility of pricPs of goods carried in invPntory, tax considrrations, and administrative convenience.
As a result the invPntory figures obtained by combining the accounting records of business firms are not homogenPous and have no clPar meaning. Not only do the methods of treating inventories differ, but the dollar-inventory figures obtained from accounting records are basPd on a broad range of pricPs for goods and servicPs prevailing in the near or perhaps more distant past. To correct this difficulty and to produce meaningful aggrPgates of inventory changes for the rntire business system it is necessary that the divPrse invrntory figures from accounting records be rendrred as nearly consistent as possible.
The simplest, and from some standpoints tlH•oretically most desirable, method of obtaining this consistency is by revaluing all inventoriPs into avera.ge prices for the current year. After invrntory changes a.re converted into such relatively homogeneous magnitudes, the amount of revaluation may be determined as the difference between the revalued series and the original series derived from accounting records. This procedure, which has been followed in the estimates of gross national product, yields, ideally, an estimate of the current dollar value of the physieal quantity change in business inventories.7
1 The actual results can only approximate this ideal with an unknown degree of error, since it is impossible in practice to make proper allowance for all different methods of inventory pricing practiced and since it is difficult to ohtain and select the most appropriate deflatmg index in every case.
May 1942 SURVEY OF CURRENT BUSINESS 11
The revaluati)n of inventories thus involves, in essence, adjustment of the net income of business Pnterprises as calculated by prevailing accounting methods. It is, therefore, a.s appropriate an adjustment to national income as to gross national product. This correction may, in fact, be introducPd in the national income estimates in the near future, when the reliability of the statistirnJ }wocPdur<' has bPen more carefully tested.
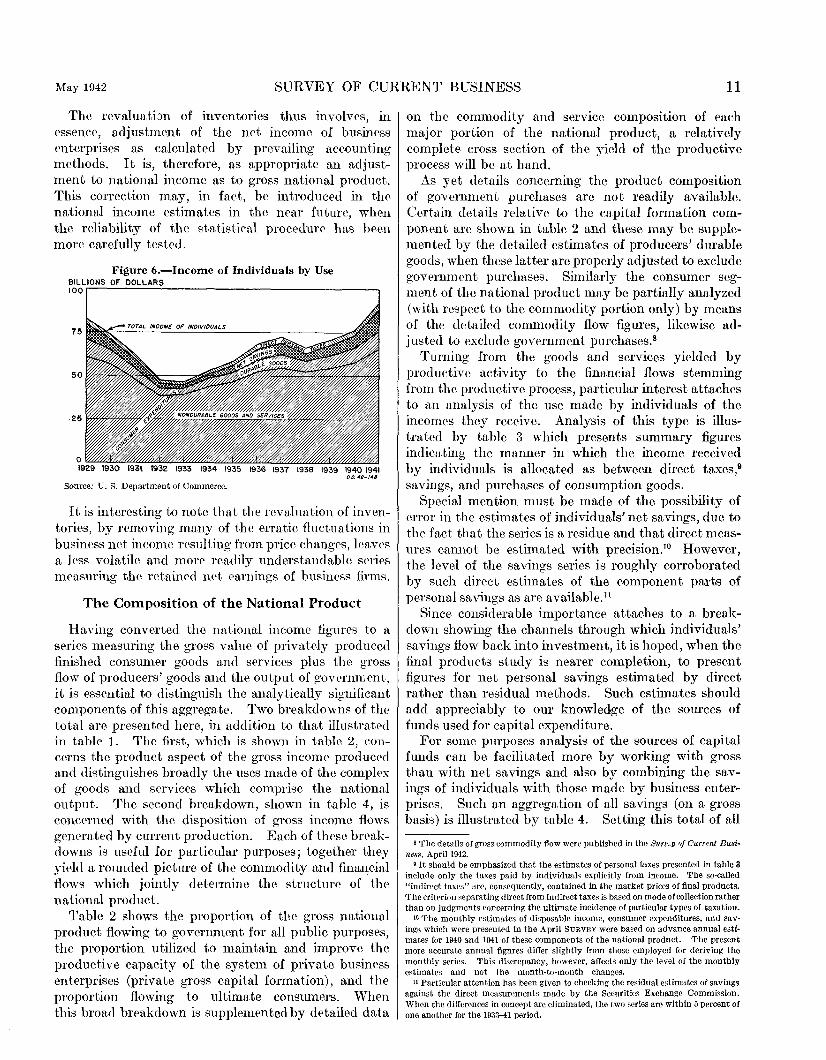
Figure 6.-lncome of Individuals by Use BILLIONS OF DOLLARS 100
75 TOTAL INCOME OF INDIVIDUALS
50
Source: U. 8. Department of Commerce. D.O. 42-148
It is interesting to note that thP revaluation of inventories, by removing many of the erratic fluctuations in business net, income resulting from price changes, leav('S a kss volatile and mor·0 readily understandable series measuring the retained 110t t'arnings of busim•ss firms.
The Composition of the National Product
Having converted the national income figures to a series measuring the gross value of privately produced finished consum<'r goods and services plus the gross flow of producers' goods and the output of governrr.ent, it is essential to distinguish the analytically significant components of this aggregatP. Two breakdowns of the total are presented here, in addition to that illustrat<'d in table 1. The first, which is shown in table 2, concerns the product aspect of the gross income produced and distinguishes broadly thE' uses made of the compl<>x of goods and services which comprise the national output. The second breakdown, shown in table 4, is conc<>rned with the disposition of gross income flows gem•rated by current production. Each of thPse br<>akdowns is useful for particular purposes; together they yield a rounded picture of the commodity and financial flows which jointly determine the structure of the national product.
Table 2 shows the proportion of the gross national product flowing to government for all public purposes, the proportion utilized to maintain and improve the productive capacity of the system of private business enterprises (private gross capital formation), and the proportion flowing to ultimate consumers. When this broad breakdown is supplemented by detailed data
on the commodity and service composition of each major portion of the national product, a relatively complete cross section of the yield of the productive process will be at hand.
As yet details concerning the product composition of government purchases arc not readily available. Ccrta.in details relative to the capital formation component arc shown in table 2 and these may be supplemented by the detailed estimates of producers' durable goods, when these latter are properly adjusted to exclude govE'rnment purchases. Similarly the consumer segment of the national product may be partially analyzed (with respect to the commodity portion only) by means of the detailed commodity flow figures, likewise adjusted to exclude government purchases.8
Turning from the goods and services yielded by productive activity to the financial flows stemming from the productive process, particular interest attaches to an analysis of the use made by individuals of the incomes they receive. Analysis of this type is illustrated by table 3 which presents summary figures indicating the manner in which the income received by individuals is allocated as between direct taxes,9
savings, and purchases of consumption goods. Special mention must be made of the possibility of
error in the estimates of individuals' net savings, due to the fact that the series is a residue and that direct measures cannot be estimated with precision.10 However, the level of the savings series is roughly corroborated by such direct estimates of the component parts of personal savings as are available.U
Since considerable importance attaches to a breakdown showing the channels through which individuals' savings flow back into investment, it is hoped, when the final products study is nearer completion, to present figures for net personal savings estimated by direct rather than residual methods. Such estimates should add appreciably to our knowledge of the sources of funds used for capital expenditure.
For some purposes analysis of the sources of capital funds can be facilitated more by working with gross than with net savings and also by combining the savings of individuals with those made by business enterprises. Such an aggregation of all savings (on a gross basis) is illustrated by table 4. Setting this total of all
s The details of gross commodity flow were published in the Surz;_y of Current Busines.•, April 1942.
9 It should be ~mphasized that the estimates of personal taxes presented in table 3 include only the taxes paid by individuals explicitly from income. The so-called "indirect taxes" are, consequently, contained in the market prices of final products. The criterion sep~rating direct from indirect taxes is based on mode of collection rather than on judgments concerning the ultimate incidence of particular types of taxation.
to 'fhe monthly estimates of disposable income, consumer expenditures, and savings which were presented in the April SURVEY were based on advance annual estimates for 1940 and 1941 of these components of the national product. The present more accurate annual figures differ slightly from those employed for deriving the monthly series. This discrepancy, however, affects only the level of the monthly estimates aud not the month·to-month changes.
11 Particular attention has been given to checking the residual estimates of savings against the direct measurements made by the Securities Exchange Commission. When the differences in concept are eliminated, the two series are within 5 percent of one another for the 1933-41 period.
12 SURVEY OF CURRENT BUSINESS l\Iay 1942
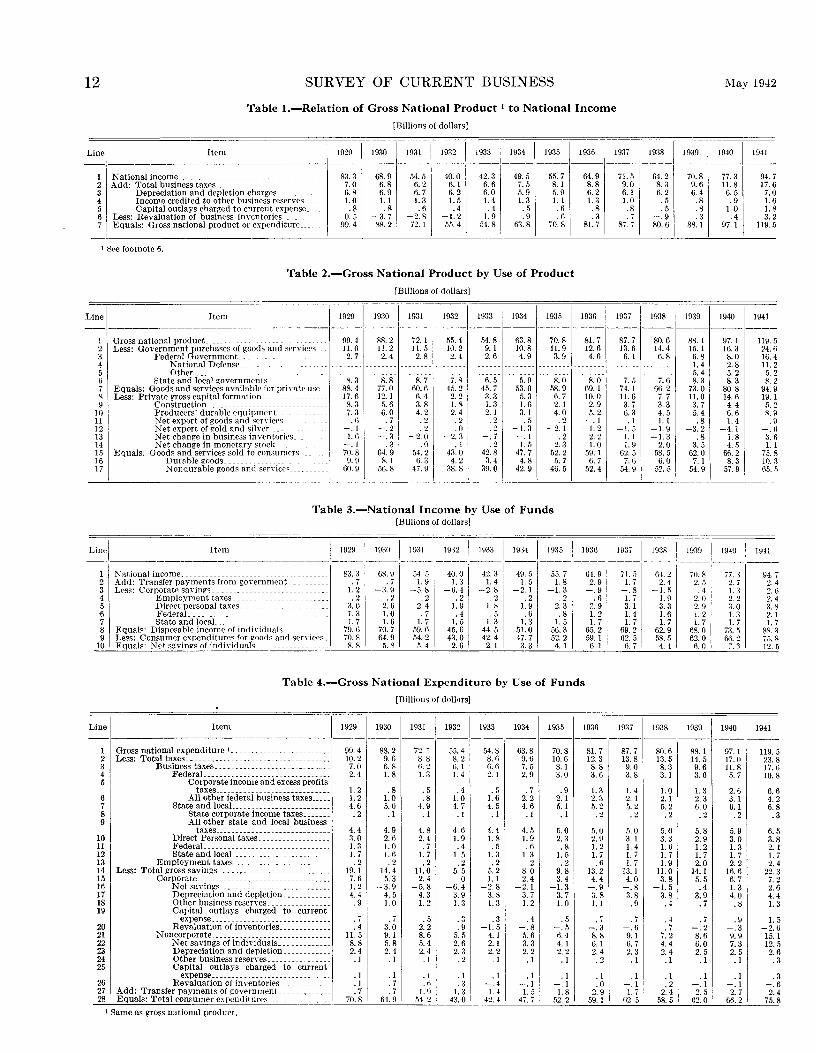
Table 1.-Relation of Gross National Product 1 to National Income
[Billions of dollars]
1 National income ___________________________________ __ 2 Add: Total business taxes ___________________________ _ 3 Depreciation and depletion charges __________ __ 4 Income credited to other business reserves _____ _ 5 Capital outlays charved to current expense ____ _ 6 Less: Revaluation of business inventories ____ _ 7 Equals: Gross national product or expenditure ____ _
t 8l. .. e footnote 6.
83.3 7.0 6. 8 1.0 .8
-0.5 99.4
68.9 6. 8 6.9 1.1 .8
-3.7 88.2
54.5 6. 2 6. 7 1.3 .6
-2.8 72.1
40.0 6.1 6. 2 1.5
. 4 -1.2 55.4
42.3 6. 6 6.0 1.4 .4
1.9 54.8
49.5 7. 5 5. 9 1.3 .5 . 9
63.8
5.1.7 8.1 5.9 1.1 .6 .6
70.8
Table 2.-Gross National Product by Use of Product
[Billions of dollars]
64.9 8.8 6. 2 1.3 .8 . 3
81.7
71.5 64.2 9.0 8.3 6.1 6. 2 1.0 . 5
. 8 . 5
.7 -.9 87.7 80.6
70.8 9. 6 6 4 .8 .8 . 3
88.1
77.3 11.8 6. 5 .9
1.0 . 4
97.1
94.7 17.6 7.0 1.6 1.8 3. 2
119.5
Line I Item I 1929 I 1930 I 1931 I 1932 I 1933 I 1934 1935 1936 1937 1 1938 1939 1940 1941 ----------------------------·--·---.-----1---- ---- ------
I Gross national product_ ___________________ 99.4 SR. 2 72.1 55.4 54.8 63.8 70.8 81.7 87.7 80.6 88.1 97.1 119.5 2 Less: Government purchases of goods and serYiccs 11.0 11.2 II. 5 10.2 9.1 10.8 11.9 12.6 13. 6 14.4 !.5. I 16.3 24.6 3 Federal Government_ _________ 2. 7 2. 4 2. 8 2.4 2. 6 4.9 3.9 4. 6 6.1 6. 8 6. 8 8.0 16.4 4 N' ational Defense ________ . -------- -------- -------- -------- -------- -------- -------- -------- 1.4 2.8 11.2 5 Other ______________________
---- -------- -------- -------- --- -------- 5. 4 5. 2 5. 2 6 State and local governmenls_ 8. 3 8. 8 8. 7 7. R 6. 5 ,), 9 8.0 8.0 7. 5 7. 6 8. 3 8. 3 8. 2 7 Equals: Goods and services available for priYate use 88.4 77.0 60.6 45.2 45. 7 53.0 58.9 69.1 74.1 61l. 2 73.0 80.8 94. g ~ Less: Private gross capital formation .... __ 17.6 12. 1 f\.4 2. 2 3. 3 5.3 6. 7 10.0 11.6 7. 7 11.0 14.1l 19.1 9 Construction _________________ 8. 3 5.6 3.8 1.8 1.3 l.fi 2. I 2. 9 3. 7 3. 3 3. 7 4. 4 5. 2
10 Producers' dumble equipment. 7. 3 6.0 4. 2 2. 4 2.1 3.1 4. 0 5. 2 6. 3 4. 5 5.4 6. 6 ~- 9 11 Net export of goods and ~ervicf's _ .6 . 7 . 2 . 2
I .2 I . 5 .2 -.1 .1 1.1 .8 1.4 .9
12 Net export of gold and silver.. __ . -.1 -.2 .2 .0 .2 -1.3 -2.1 -1.2 -1.5 -1.9 -3.2 -4.1 -.n 13 Net change in business inventories ____ 1.~ -.3 -2.0 -2.3
I
-.7 -.I .2 2. 2 1.1 -1.3 .8 1.8 3. r, 14 Net chan~e in monetary stock ____ -.1 . 3 .0 .1 .2 l.fi 2. 3 1.0 1.9 2.0 3. 5 4 .. 5 1.1 15 Equals: Goods and services sold to consumers -- 70.8 64.9 54.2 43.0 42.8 47.7 52.2 59.1 62.5 58.5 62.0 66.2 75.8 16 Durable goods ---------------- 9.9 S.1 6. 3 4. 2 3. 4 4. 8 5. 7 6. 7 7. 6 6.0 7.1 8. 3 10.3 17 Non durable goods and serYicc, __________ 60.9 56.8 47.9 38.8 39.0 42.9 46.5 52.4 54.9 52.5 54.9 57.9 65.5
' _ ___, ________________ __,_ __ .:___-'----'-----~ ---'-----'-----'---'----'-----'---- ·- ------
Table 3.-National Income by Use of Funds [Billions of dollars]
Linel Item I 1929 I 1930 I l!l:H I 1932 I 1933 i 19:34 I 19:l5 I 193() I ;937 I 1938 1939- 1940 i 19ll -- -----------------------------.----~----.----~-----.------ ---------------- ------------
L
1 National income__ 83. 3 68. 9 54. 5 ' 40. 0 42. 3 49. 5 55. 7 61. 9 71. 5 6·1. 2 70. 8 77. 3 94. 7 2 Add: Transfer payments from gowrnmcnt . 7 . 7 1. 9 l. 3 1. 4 1. 5 I. 8 2. 9 1. 7 2.1 2. 5 2. 7 2. 4 3 Less: Corporate saYing,_ I. 2 -3.9 -5.8 -6.4 -2.8 -2.1 -I. 3 -. 9 -. 8 -I. 5 . 4 I. 3 2. 6 4 Employmenttaxes_ .2 .2 .2 .2 .2 .2 .2 .6 1.7 1.9 2.0 2.2 2.4 5 Direct personal taxes. 3. 0 2. 6 2. 4 I. 9 1. ~ I. 9 2. 3 2. 9 3. 1 I 3. 3 2. 9 3. 0 3. 8 u FederaL ____ .. I. 3 1. 0 . 7 . 4 . 5 . 6 • 8 I. 2 I. 4 I. 6 l. 2 1. 3 2. 1 7 State and local __ _ I. 7 1. 6 I. 7 I. 5 I. 3 I. 3 I. 5 I. 7 I. 7 I. 7 I. 7 1. 7 1. 7 8 Equals: Disposable income of indil·iduals . 79.6 70. 7 59. fi 45.6 44.5 51.0 56.3 65. 2 69.2 62.9 68. 0 73. 5 8R 3 9 Less: Consumer expenditures for goods and serYicrs _ 70.8 64.9 54. 2 43.0 42.4 {7. 7 52.2 59. 1 62. 5 58 .• 1 62.0 66.2 ;.1. 8
10 Ef]uals: NetsavingsofindiYirluals ______________ 8.R .1.~ ·'.4 2.6 2.1 3.3 4.1 6.1 6.7 4.4' fi.O 7.3 12.5
Table 4.-Gross National Expenditure by Use of Funds
[Billions of dollars]
ine Item 1929 1930 1931 1932 1933 1934 1935 1936
1 Gross national expenditure'-_----------------------- 99.4 88.2 72. 1 55.4 54.8 63.8 70.8 81.7 2 Less: Total taxes. ___________________________________ 10.2 9.6 8.8 8. 2 8. 6 9.6 10.6 12.3 3 Business taxes_------------------------ ___ . 7.0 6.8 6. 2 6. I 6. 6 7. 5 8. 1 8.8 4 FederaL ____________________ ----------_ 2. 4 1.8 1.3 1.4 2.1 2. 9 3.0 3. 6 5 Corporate income and excess profits
taxes _____________________________ 1.2 .8 . 5 . 4 .fi . 7 .9 1.3 6 All other federal business taxes _____ 1.2 1.0 .8 1.0 1.6 2. 2 2.1 2.3 7 State and locaL.---------------------- 4.6 5.0 4. 9 4. 7 4. 5 4. 6 5.1 5. 2 8 State corporate income taxes _______ .2 .I . 1 .I . 1 .1 .1 .2 9 All other state and local business
taxes ____________________ --------- 4.4 4.9 4. 8 4. 6 4. 4 4. 5 5.0 5.0 10 Direct Personal taxes_----------------- 3.0 2.6 2.4 1.9 1.8 1.9 2. 3 2. 9 11 FederaL _______________________________ 1.3 1.0 .7 . 4 . 5 . 6 .8 1.2 12 State and locaL ___ 1.7 1.6 1.7 1.5 1.3 1.3 1.5 1.7 13 Employment taxes__ _____ :::::::::::::::::: . 2 . 2 . 2 .2 .2 .2 . 2 .6 14 Less: Total gross savings ____ -· ______________________ 19.1 14.4 11.0 5. 5 5. 2 8.0 9. 8 13.2 15 Corporate __________________________________ 7. 6 5. 3 2. 4 .0 1.1 2. 4 3. 4 4.4 16 Net savings ______________ -------------- 1.2 -3.9 -5.8 -6.4 -2.8 -2.1 -1.3 -.9 17 Depreciation and depletion ____________ 4. 4 4. 5 4. 3 3. 9 3. 8 3. 7 3. 7 3. 8 18 Other business reserves ________________ .9 1.0 1.2 1.3 1.3 1.2 1.0 1.1 19 Capital outlays charged to current
I expense _______________ ------------- __ . 7 . 7 . 5 .3 .3 . 4 . 5 .7 20 Revaluation of inventories _____________ . 4 3.0 2. 2 . 9 -1.5 -.8 I -.5 -.3 21 Noncorporate ______________________________ II. 5 9.1 8. 6 5. 5 4.1 5. 6 6. 4 8. 8 22 Net savings of individuals ____ --------- 8. 8 5. 8 5. 4 2. 6 2.1 3. 3 4.1 6.1 ~ Depreciation and depletion ____________ 2.4 2. 4 2. 4 2. 3 2. 2 2. 2 2. 2 2. 4 24 Other business reserves_--------------- .I .1 .1 .2 .1 .I .1 .2 25 Capital outlays charged to current
expense ______________________________ .I .1 .I .I .1
I
.I .1 .I 26 Revaluation of im·entories _____________ .1 . 7 . 6 .:; -.4 -.I -.1 .0 27 Add: Transfer payments of government. ____ -·------ . 7 . 7 1.9 1.3 1.4 1.5 1.8 2.9 28 Equals: Total consumer expenditures_. ____ ---- ---- 70.8 64.9 54.2 43.0 42. 4 47.7 52.2 59.1
'Same as gross national product.
~~~~ 1939
87.7 80.6 88.1 13.8 13.5 14.5 9.0 8. 3 9.6 3. 8 3.1 3. 6
1.4 1.0 1.3 2. 4 2.1 2. 3 5. 2 5. 2 6.0
. 2 .2 .2
5.0 5. 0 5.8 3. 1 3. 3 2.9 1.4 1.6 1.2 1.7 1.7 1.7 1.7 1.9 2.0
13.1 11.0 14.1 4.0 3. 8 5. 5
-.8 -1.5 . 4 3. 8 3. 8 3. 9 .9 . 4 .7
·' . 4 . 7 -.6 . 7 -.2 9.1 7. 2 8. 6 6. 7 4. 4 6.0 2. 3 2. 4 2. 5 . 1 .I .I
.1 . 1 . 1
I -.I
I .2 -.I
1.7 2. 4 2. 5 62.5 58.5 62.0
~~11941_ 97. I 17.0 11.8
5. 7
2. 6 3.1 6.1
. 2
I 5. 9 3. 0 1.3 1.7 2. 2
16.6 6. 7 1.3 4.0 .8
.9 -.3 9.9 7. 3 2. 5 .1
.I -.1 2. 7 I 66.2
119. 5 23.8 17.6 10.8
6. 6 4. 2 6. 8 .3
6. 5 3. 8 2. 1 1.7 2. 4
22.3 7. 2 2.6 4. 4 1.3
I. -2.6 15.1 12.
2.
-2.
75.
5 6 3
3 6 4 8
May 1942 SURVEY OF CURRENT BUSINESS 13
savings against gross national expenditure suggC'sts the desirability of similarly grouping all taxes, whethC'r paid by individuals or by business firms. It should be noted that the tax total includes no overlap since only direct personal taxes have been added to total business taxes. Thus excise or sales taxes, despite the fact that they may ultimately be paid in whole or part by consumers, have been included in the total of taxes collected from business firms.
Possible Uses of the Estimates
In recent months particular interest has centered in the calculation of impact ratios measuring the intensity of the war effort. It is believed that rough impact ratios of the sort which may be calculated from table 2 give in practice a somewhat truer perspective of the magnitude of the war effort than the impact ratios which employ net national income as a denominator. Furthermore, other comparisons such as those seeking to derive the proportion of national product consumed or the part taken by taxes arc more easily carried out on the basis of gross rather than net product.
In principle, however, aU these and other comparisons might equally well run in terms of the net national product or national income. To construct such comparisons, numerous adjustments not shown herC' to government expenditures, taxes, and capital formation would be required. These will be discussC'd at a later date when the progress of the work permits.
Other uses to which the presC'nt estimates may be put have already been found in connection with the formulation of fiscal policies for the coming war years and in connection with the studies of probabk postwar economic problems now being undertaken by public and private agencies. The estimates should also prove useful in other capacities, both to businessmrn and to private economists seeking a summary picture of the economic process as background for spl'cinl studies and policiPs. '
Notes on Sources and Methods.
The following notes are arranged by tables and are keyed to the line numbE'rs appearing in these tablE's.
TABLE I
Line 1-Estimatl's of the DPpartnwnt of Con1mercc. Line 2-Includes all taxes collectPd from business entPrprises regardless of ultimatr
incidence. The mPthort of estimate employed involves allocating all tax collPctions to the year in which the tax liability was incurred. Separate allocations were made for Federal and for State and local taxes. It was also nPcessary to detprminc the proportion of property taxes paid by business enterprises. On the basis of available evidence this was placed at 75 percent. This figure was larRely deriVL'd from Stndies in Current Tax Problems (Twentieth Century Fund) adjusted for tBxes on rented residences.
Line ~~Basic data for this estimate were derived from Statistics of Incomr, raisrd to cover estimated depreciation charged by unincorporated enterprises. Also in· eluded are depreciation on nonprofit institutions such as churches and hospitals, and on rented residences owned by individuals. These latter two components are based on estimates of Solomon Fabricant, published in Capital Consnmption and Adjustment. Figures on agricultural depreciation are from the Bnreau of Agricultural Economics.
Line 4-Includes special emergency and contingency reserves plus allowances for bad debts. Based on Statistics of Income data raised to cover noncorporate enterprises.
Line 5-Represents an estimated portion of the outlay for producers' durable equip· ment not covered by depreciation allowances. The estimate was based on the de· tailed tabulations of Output of l<fannfadured Commodities prepared in the National Income Unit, and on the final estimates of expenditures for producers' durable equipment.
Line 6--This series represents the difference between inventory changes as recorded by business accounts and the physical quantity change in business inventories translated into current prices. The estimate was made in the National Income Unit, and is a byproduct of the estimates of the net change in business inventories in current prices.
Line 7-Sum of it.Pms I through 5, minus item 6.
TABLE 2
Line !-From line 7, table I. Line 2-Includes all government expenditures for goods and services. Sum of line>"·
3 and 6. Public service enterprises arc not included, except for contributions to them by government units.
Line 3-To obtain this series, Federal expenditures as reported in the Daily Treasnry Statement were adjusted to eliminate all transactions not involving purchases of goods or services. 'rhese transactions include loans, purchases of existing assets such as land, capital stock transactions, veterans' pensions, etc. 'rhe figures include grants to State and local gowrnments but refunds of taxes and duties have been eliminated.
Line 4-This series is based on the Daily 'l'reasury Statement figures on national defense expenditures plus changes in the noncash assets and liabilities of national defense corporations other than transfers. For 1941 an adjustment of 2.3 billion dollars has been made to the Treasury series to take acconnt of (a) offshore expendi· tun•s, (h) prepaymc>nts on contmcts for war materials, and (c) purchases of existing assrts.
Line 5-Lin<:' 3 minus line 4. Line 6-Exprnditurcs were mPasnred by receipts plus net changes in debt. Duplica·
tion because of local shares of Stat<'·collected tax<'S has been eliminated. The rstirnates wi."rP hast'd on Census publications for various years such as Financial l:itatistics of States and Cities and State Tax Collections. The publication, Tax Yields, 1940, issued by the Tax Institntc was also uS<•fnl.
Line 7-Line 1 rninus lin(_' 2. Linr 8-Smn of lin<•s 9 through 14. Line 9-lncludl's all new private construction of factory and public utility propPrty,
n•sidences, and oth('f propPrty (including nonprofit institutions and farn1 construction). Data an• taken from the eonstruct.ion studies of the l\ationallncomc Unit.
Line 10-Tak<•n from l'Stimates puhlislwd in the April 1942 SURVEY OF CURRENT BUSINESS. Adjustments were made to eliminate j?ovrrnmcnt purchases from th(' published data. Tlwse adjustnwnts W<'re made only for 1940 and 1941; for prior yrnrs tlw amount of govl'rnrnrnt purchases included in the comnwdity flow fignn's is rPlath-rly small. Further progress of the government sep:mrnt of the final products study is npedcd to impron the adjustments.
Une 11-Estimates supplied by Mr. Hal Lary of the International Economic:o Unit, Bun•au of Foreign and Domestic Commrrre.
Linr 12-Samc source as Jinc 11. Line 13-lncludes all business invcntorh•s in current priers as well as fann inventories.
Accounting figun•s for inventories were taken from Statistic8 of Income and raisrd to cover noncorporatc enterprise;;:. 'I'hese figures were deflated by price indexes representing the lower of cost or market aud the deflated series were multiplird by current price indexes to obtain the final result. Farm inventories are from the Bureau of Agricultnral Economies and represent changes in physical quantities at curn'nt prices.
Line 14-Thc series n•prespnts the net change in monetary stocks of gold and silver in current pric(;'s. Seigniorage on si1n'r coin has bt~rn eliminated. The series is based on data publislwd in thr Annual Heports of the Director of the Mint.
Line 15--Line 7 minuf: line 8. Lhw 16-From tht' artidr on "Gross .Flow of Comnwdities and New Construction"
in the April 1942 SURVEY OF CURRENT BUSINESS after dednction of govl'rn· nwnt purchases.
Line 17-Lin(' 15 minu.s line HL TABLE 3
Une !-From line 1, table I. Lines 2, 3, and 4-'I'hpse thr('e lines contain the adjustments normally made in passing
from national income to income payments. Employment taxes include both em· ploycr and employee contributions to Soria! Security.
Line 5-Snm of lint's 6 and 7. Line 6-Includes all taxes paid by individuals explicitly from income such as income,
estate, inheritanee and gift taxes. Based on Daily Treasury Statement data, tb<• series is on a collections rathC'r than accrual basis.
Line 7-Includcs poll, license, income, and an estimated portion of property tax<>s. Based largely on census data plus numerous studies of private agencies and indi· victuals.
Line 8-Line I plus line 2 minus lines 3, 4, and 5. Line 9-From line 15, table 2. Line HI-Line 8 minus line 9. Includes savings held in cash balances or invested in
insurance, new residences or securities. Reductions in consumer indebtedness are counted as 'positive savings.
14 SURVEY OF CURRENT BUSINESS .\lay 1942
Capital Expenditures in Selected Manufacturing Industries, Part Ill
By Lowell J. Chawner
A rapid enlargement of industrial facilities for military purposes in the United States bPgan in the last few months of 1940. This expansion proceeded through the entire year 1941 and has continued up to the present time. We are probably now entering a new phase in which the urgent need for raw materials, machines, and labor skills for producing finished military supplies will take increasing precedence over the uses of these resources for further additions to productive facilities.
The principal part of the specialized materiel which will be used by American ground and air forcps during the first year of our participation in the war, thus, will be fabricated either in new plants construckd during the two-year period from the middle of 1940 to the middle of 1942, or in existing plants converted to this purpose during the past 6 to 12 months. The industrial mobilization of Germany prior to its active participation in large scale combat was spread over a period of approximately 5 years.
During the years 1941 and 1942 a total of possibly 10 billion dollars will have been spent upon total outlays for manufacturing facilities of all kinds, both public and private. This figure may be compared with a rough measure of the replacement cost of all existing manufacturing facilities at the beginning of this 1wriod of 50 to 60 billion dollars. ThPse outlays arP much larger than in any similar pNiod but an' even more marked by their predominantly military character and by their being financed extensively directly by the FedPral government.
Preliminary Summary for 1941
A summary of the capital expenditures during 1941 as well as for the year 1939 in separate manufacturing groups is presented in table 1. It was possible to include in this table estimates for several industries for which similar data are not available for other years.
The 1939 figures which form the bench mark for all of our estimates of manufacturing capital expenditures are derived primarily from the Census of Manufactures returns on plant and equipment expenditures for that year. To these data corrections were made for undercoverage, principally to allow for construction at new manufacturing plants not in operation in 1939 and consequently not reporting to the Census of Manufactures. Allowances were also made for the production of new machinery for leasing account, particularly in the leather and leather products group of industries and for expenditures for plant and equipment by the
1 The first section of this article was published in the December 1941 Surv'y of Current Business.
Fe:lera: gover:nment in the printing, publishing, and alhe(~ mdustnes; in shipbuilding and ship repairing; and m the ordnance industry groups.
Table 1.-Capital Outlays for Productive Facilities for Manufacturing Purposes, Public and Private, 1939 and 1941
[Millions of dollars]
Industry 1939 ---------------------~---·---·1---
Food and kindred products.~.~~~ Textiles, apparel, and related products~,:::::::·~-:~:~:::~:: Lumber and lumber products'~~~~ ~~~~~~~~~~~~~~~~~~ Pulp, paper, and allied products.~~~~~~~~-~~~~~-~~~ Printing, publishing, and allied industries~~-~.~~-~::~~~~~~·~~~~~~~ ('hcmiea]s and allied products (includes expJosiYeS but~ not~ ammu~ ~
mtwn) ~ ~ ~ ~~~ ~~ ~~~~ ~~ ~~ ~~ ~~ ~~ ~~ ~~~~~ ~. ~~~ ~~~~~~~ Products of petroleum and coaJ3~~~~~~-~- ~~~~~ ~~:~~~~~~~~~~~~~~~
r~1~~~:~ ~~~dk~\ter~products:~ ~ ~ ~~-~--~~~ :: ~ ::::::::::::::: StonP, elay, and glr.s.s products_____ __ -----------------
~~~f~~;~1~~P~!e~~~.their products 4_____ . _________ _ Ordnance and acceSSOfi0S:---------------- ------------------------
Ammunition, shells, and bombs ____________ _ Guns and srnall arms______________ _ l\!Jhtar) combat \ehtcles ~- ~ ~~~ ~ ~~~
Machinery'-~~ ~-~~~~~~~~~~~~~~~~ ~~~~~~~~~~~-~-Antomohikt~ and automobile eqniprncnt________ _ ____________ _ Transportation Pquipmcnt excl'pt automobiles:
Airplanes, airplane ~n~ines, and parts ________________________ _ Shipbuilding and shin n:pair_ ____ .. __ . _________ . _____________ _ Otlwr transportation equipment-~~ ~~ ~~-~-~~~~~-~~~~~
!\lisc<..'llaneons 11 _________________________ _
240 130 60 86 58
160 140 33 15 68
190 45
54 6 6
140 135
30 '35
5 40
1941*
330 170
75 85 70
660 190 60 20
110 580 220
670 200 60
3HO 120
550 400
10 70
----Total capital outlays all manufacturing purposes (public I
and pnYatc•) . ~~~~~~~~-~~~ ~~~~ ~~~~ ~~~~~~~~~~~~ 1,620 ~ 5,010
:nata for 1941 comparable to those for earher years were not available at the time thts arttele was wntten. . The figures shown for 1941 are, in most cases, projections from the 1939 and 1940 esttmates. They are based upGU building construction activ~ Ity, floor space, and net increases in capacity, together with data upon the completion ~r~~~~c[~g~~H~i.r\r.ubltc and pnvatc) through December 1941 reported by the War
' Include's textilt•~mill products, apparel, and similar products. ' Includes lumbt•r and timber basic products, furniture, and finished lumber
products. le~~n~~uJi~~,fl''trokum refining, coke and byproducts, and other products of petro~
• Includes blast furnace, steel works, rolling mill, foundry, hardware, plumbing and other Iron and steel products, but excludes guns and small arms. Blast furnaces stPel works, and rolling mills (including cold rolled) establishments accounted fo; approximately $110,000,000 in 1939, and $390,000,000 in !941.
' Includes outlays of approximately $1,000,000 by private concerns and $3,000,000 at Army and Navy arsenals.
6 Includes outlays of approximately $2,000,000 by private concerns and $4,000,000 at Army and Navy arsenals.
7 Includes electrical and other machinery. ' Includes outlays of approximately $11,000,000 by private concerns and $24 000 000
at Government shipyards. ' ' 'Includes tobacco.
The additions to manufacturing facilities in 1939, although somewhat less than the average during the 1920 decade, were neither unusually large nor small when compared with recent years.
The first three quarters of 1940 experienced moderate expenditures for industrial facilities in nearly all branches of manufacturing. In the aggregate these outlays wPre at a rate approximately equal to that in 1937 but less than that in several other years during the period covered by these estimates. As indicated above a sharp advance occurred in the last quarter of 1940.
At the beginning of 1941, capital expenditures were considerable in nearly all branches of manufacturing. As the year progressed, inability to obtain necessary
May 1942 SURVEY OF CURRENT BUSINESS 15
equipment and materials, particularly metals, sharply curbed all building of new plant that was not essential to the war effort. For 1941 as a whole, about two-thirds of the total manufacturing outlay was in industries engaged primarily in the production of military supplies or of commodities required in their fabrication.
During the present year, 1942, the construction of manufacturing facilities will be wholly determined by military requirements. Projected expenditures for this purpose are somewhat larger than the outlays in 1941. However, in view of the increasing emphasis upon the immediate production of large quantities of finished war supplies it is possible that labor and other resources may be used increasingly for this purpose rather than for the construction of all of the new plants now projected for 1942.
Annual Estimates.
Previous articles in the SuRVEY have presented estimates of the annual capital expenditures in all manufacturing from 1915 through 1940, and estimates of such expenditures in selected manufacturing industries over the period from 1919 to 1940. 2 The individual industry groups heretofore covered, along with some analysis of the factors which appear to have influenced their capital outlays, are food and kindred products; textiles and related products; lumber and lumber products; pulp, paper, and allied products; printing, publishing, and allied industries; and stone, clay, and glass products.
Estimates also have been compiled on the capital expenditures in certain other industrial groups, some of which are of special interest at the present time. In this issue annual outlays during the past 2 decades are considered for each of six industries: blast furnaces, steel works, and rolling mills; automobiles and automobile equipment; airplanes, airplane engines, and parts; petroleum refining; rubber products; and leather and leather products.
Blast Furnaces, Steel Works, and Rolling Mills
Large orders for steel and steel products from the British and French governments early in 1915 together
' See the Sun•ey of Current Business, March 1941, p. 9, and December 1941, p. 19.
with an increasing domestic demand and a very considerable shift from Bessemer to open-hearth methods resulted in the greatest expansion in steel-making facilities in 1915 and 1916 thus far experienced in the United States. The net addition to annual capacity for making steel ingots and castings in this country was approximately 5 million net tons in 1915 and 4.3 million net tons in 1916. The corresponding increment in 1941 was slightly more than the latter figure.
Since the first World War, steel-making facilities have been expanded gradually and altogether have been increased by nearly one-half. At the beginning of 1919 the rated capacity for the production of steel ingots and castings reported by the American Iron and Steel Institute was 61 million net tons. At the beginning of the present year, 1942, the corresponding figure for ingots and castings was 88.6 million net tons.
The largest increases in iron-making capacity prior to 1941 occurred in 1917 and 1918. In 1917, 2.3 million net tons were added to the annual capacity of blast furnaces to produce pig iron and related ferro-alloys. In the following year the corresponding figure was 1.5 million net tons. During the period since the first World War appreciable net increases in total ironmaking capacity have occurred in only a few isolated years such as 1920, 1926, and 1940. Rated blast furnace capacity at the end of 1918 was 55.2 million net tons and at the end of 1940 it was 57.6 million net tons.3
Important expenditures were made, however, in some years for the remodeling of old and obsolete blast furnaces or for replacing them with much larger and more efficient units.
In 1941 blast furnace construction resulted in a net gain of approximately 2.8 million net tons in annual capacity, more than that of any other year on record. An even larger increase is in prospect for 1942.
In effecting the developments mentioned above, capital expenditures aggregating approximately 340 million dollars were made in the blast furnace and steel works industry in 1917. Outlays in this industry had not equaled those of 1917 until the past year.
3 The 1918 figure includes some but an indeterminate tonnage of "long idle" furnaces not included in 1940.
Table 2.-Capital Expenditures for Plant and Equipment in Selected Manufacturing Industries,' 1919-41 [Millions of dollars]
Industry group
etroleum relining ________________________ p R L B
ubber products _________________________ eather and leather products _____________ last furnances, steel works, and rolling mills'----------------------------------
A utomobiles and automobile equipment: Depreciable capital expenditures ______ Total capital expenditures'-----------
irplanes, airplane engines, and parts _____ A
1919
--75 70 29
160
59 72
1920 1921 1922
--100 55 105 25 23
23 14 18
190 100 100
171 52 44 187 64 59
I
1923 1924 1925 1926 1927 1928 1929
------Average 65 85 80 120 125
22 21 29 32 41 38 54 17 15 16 20 17 17 17
120 180 200 230 160 200 150
87 98 88 111 131 113 150 105 118 116 140 160 149 186
I
1 Includes establishments engaged m manufacturmg only as defined by the Census of Manufactures.
1930 1931 1932 1933 1934 1935 1936 1937 1938 1939 --------------------
85 65 55 65 70 55 90 144 132 130 22 17 11 13 16 15 22 32 27 33 12 11 10 10 11 13 15 15 14 15
300 120 40 50 40 122 200 316 132 110
94 49 37 25 48 99 109 119 112 83 118 77 69 48 78 130 153 159 155 135
----- ---- ----- ----- ----- 5 10 16 12 30 I I I
' The rough estimates shown for 1941 are based upon incomplete data and may be substantially changed when more adequate information becomes available.
1940 19412
----132 150
34 60 14 20
156 390
124 80 197 120 110 550
I I
' The blast furnaces, steel works, and rolling mills group, as shown above, includes only those specific industries; thus, it does not include foundries and finished wire, tin plate, cutlery, hard" are, stamping, structural fabrication, and other iron and steel products establishments. The total capital expenditures in all of the iron and steel industries in 1939 were approximately $190,000,000 as compared with $110.000,000 for the blast furnace, steel works and rolling mill industry. Estimates for earlier years corresponding to those shown above for the blast furnace, steel works and rolling mill industry are as follows: 1915-$170,000,000; 1916-$280,000,000; 1917-$340,000,000; 1918-$240,000,000.
• Total capital expenditures in the automobile manufacturing industry, in addition to the depreciable capital expenditures, include nondepreciable tools, jigs, and dies which are considered by many concerns in this industry as capital expenditures but which are subsequently charged off as current manufacturing expense rather than as depreciation on capital assets.
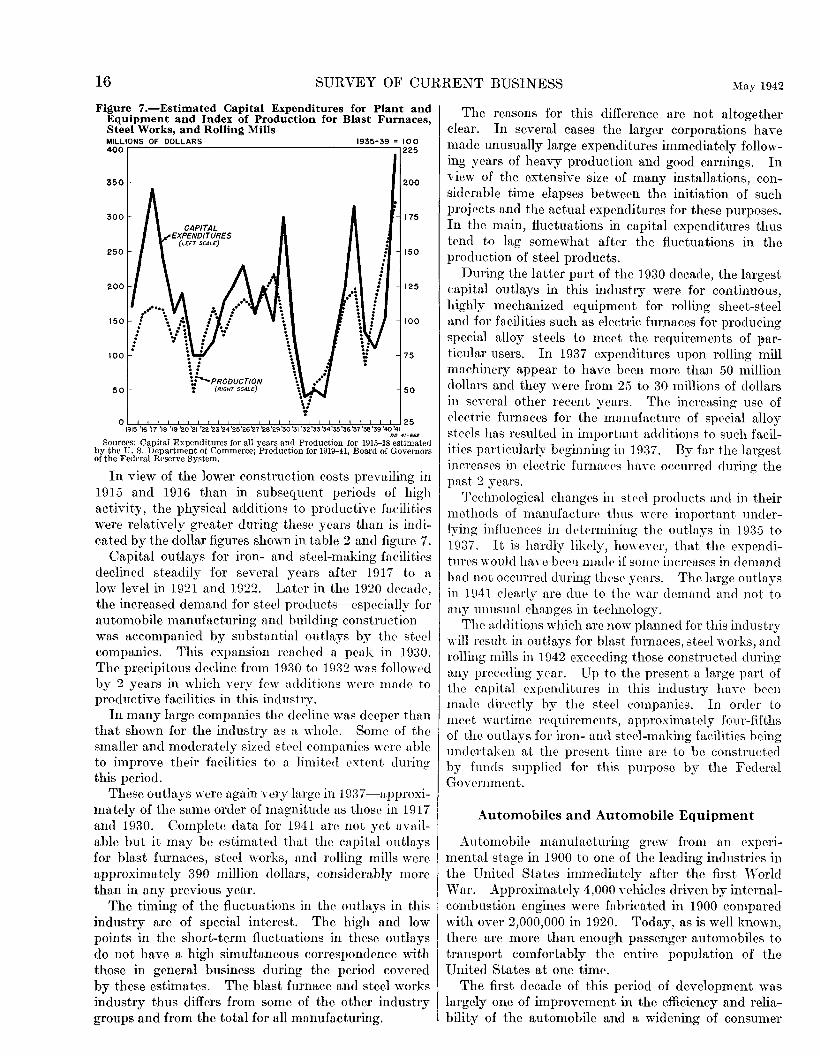
16 SURVEY OF CURRENT BUSINESS May 1942
Figure 7.-Estimated Capital Expenditures for Plant and Equipment and Index of Production for Blast Furnaces, Steel Works, and Rolling Mills MILLIONS OF DOLLARS 400
350
300
250
150
100
50
...... .. . ! \ .-: ; v: : . \ . .
. \ i 'i,l-. PRODUCTION : (RIGHT SCALE)
1935-39 = I 0 0 225
. .
. : .:1 .· \:. ! . . : : .. y :
200
175
150
125
100
75
50
01915 '16 '17 '18 '19 '20 '21 '22 '23'24'25'26'27 '28'29'30 '31 '32'33'34'35'36'37 '38'39 '40 '41
25 no 41-662
Sources: Capital Expenditures for all years and Production for 1915-18 estimated by the U. S. Department of Commerce; Production for 1919-41, Board of Governors of the Federal Reserve System.
In Yiew of the lower construction costs prevailing in 1915 and 1916 than in subsequent periods of high activity, the physical additions to productive facilitil's were relatively greater during these years than is indicated by the dollar figures shown in table 2 and figure 7.
Capital outlays for iron- and steel-making facilities declined steadily for several years after 1917 to a low level in 1921 and 1922. Later in the 1920 dccud,•, the increased demand for steel products--especially for automobile manufacturing and building constructionwas accompanied by substantial outlays by tlw steel companies. This expansion reached a peak in 1930. The precipitous decline from 1930 to 1932 was followPd by 2 years in which Yery few additions WNC made to productive facilities in this industry.
In many large companies the dt•cline was deeper than that shown for the industry as a whole. Some of the smaller and moderately sized strd companies were able to improve their facilities to a limitrd t•xtent during this period.
These outlays were again Yery large in 1 937-approximately of the same order of magnitude as those in 1917 and 1930. Complete data for 1941 are not yet available but it may be estimated that the capita.l outlays for blast furnaces, steel works, and rolling mills were approximately 390 million dollars, considerably more than in any previous year.
The timing of the fluctuations in the outlays in this industry are of special interest. The high and low points in the short-term fluctuations in these outlays do not have a high simultaneous correspondence with those in general business during the period covered by these estimates. The blast furnace and steel works industry thus differs from some of the other industry groups and from the total for all manufacturing.
The reasons for this difference are not altogether clear. In several cases the larger corporations have made unusually large expenditures immediately following years of heavy production and good earnings. In view of the extensive size of many installations, considerable time elapses between the initiation of such projects and the actual expenditures for these purposes. In the main, fluctuations in capital expenditures thus tend to lag somewhat after the fluctuations in the production of steel products .
During the latter part of the 1930 decade, the largest capital outlays in this industry were for continuous, highly mechanized equipment for rolling sheet-steel and for facilities such as electric furnaces for producing special alloy steels to meet the requirements of !'articular users. In 1937 expenditures upon rolling mill machinery appear to have been more than 50 million dollars and they 'vere from 25 to 30 millions of dollars in several other recent years. The increasing use of electric furnaces for the manufacture of sprcial alloy sterls has resulted in important additions to such facilities particularly beginning in 1937. By far the largest increasrs in c'lectric furnn,ces have occurred during the past 2 years.
Tedmological changes in sted products and in their methods of manufacture thus were important underlying inftuenC'es in ddermining the outlays in 1935 to 1937. It is hardly likely, however, thn,t the expencliturps would han1 ber'l made if some increases in demand hncl not occurred during these years. The large outlays in 1\H 1 clenrly are due to the war demand and not to any um1sua.l C'hanges in technology.
The additions which arc now planned for this industry will result in outlays for blast furnaces, :;;teel works, and rolling mills in 1942 excrecling those constructed during any preceding year. Up to the present a large part of the capital rxpcnditures in this industry have been madn dirt>ctly by the strrl eompanit's. In order to meet wartime requirements, approximately four-fifths of the outlnys for iron- and steel-making facilities being unckrtal.::cn at the present timr are to be constructed by funds supplied for this purpose by the Federal Gov<"rnment.
Automobiles and Automobile Equipment
Automobile manufacturing grew from an experimental stage in 1900 to one of the leading industries in the United States immediately after the first World War. Approximately 4,000 vehicles driven by internalcombustion engines were fabricated in 1900 compared with oyer 2,000,000 in 1920. Today, as is well known, there are more than enough passenger automobiles to transport comfortably the entire population of the United States at one time.
The first decade of this period of development was largely one of improvement in the efficiency and reliability of the automobile and a widening of consumer
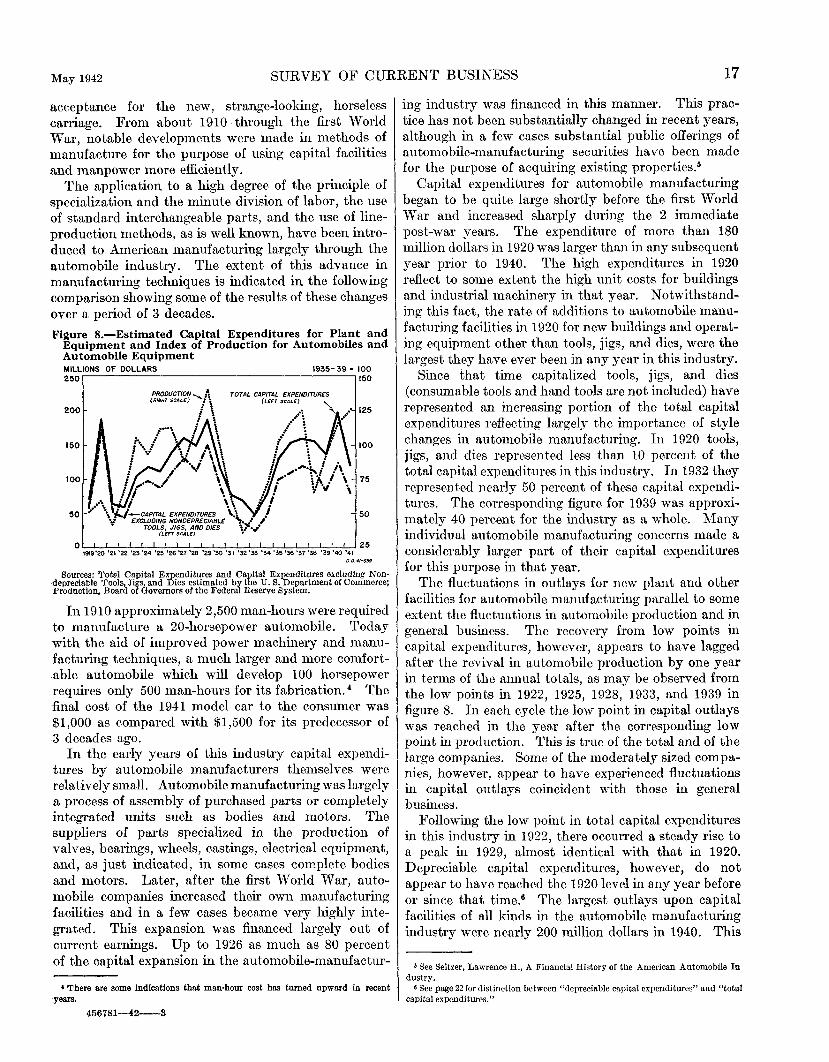
May 1942 SURVEY OF CURRENT BUSINESS 17
acceptance for the new, strange-looking, horseless carriage. From about 1910 through the first World War, notable developments were made in methods of manufacture for the purpose of using capital facilities and manpower more efficiently.
The application to a high degree of the principle of specialization and the minute division of labor, the use of standard interchangeable parts, and the use of lineproduction methods, as is well known, have been introduced to American manufacturing largely through the automobile industry. The extent of this advance in manufacturing techniques is indicated in the following comparison showing some of the results of these changes over a period of 3 decades.
Figure 8.-Estimated Capital Expenditures for Plant and Equipment and Index of Production for Automobiles and Automobile Equipment MILLIONS OF DOLLARS 250
1935-39 • 100 150
TOTAL CAPITAL EXPENDITURES (LEFT SCALE)
200 125
0 25 1919'20 '21 '22 '23 '24 '25 '26 '27 '28 '29 '30 '31 '32 '33 '34 '35 '36 '37 '38 '39 '40 '41
0.0.41-659
Sources: Total Capital Expenditures and Capital Expenditures excluding Non·depreciable Tools, Jigs, and Dies estimated by the U. S. Department of Commerce; Production, Board of Governors of the Federal Reserve System.
In 1910 approximately 2,500 man-hours were required to manufacture a 20-horsepower automobile. Today with the aid of improved power machinery and manufacturing techniques, a much larger and more comfortable automobile which will develop 100 horsepower requires only 500 man-hours for its fabrication. 4 The final cost of the 1941 model car to the consumer was $1,000 as compared with $1,500 for its predecessor of 3 decades ago.
In the early years of this industry capital expenditures by automobile manufacturers themselves were relatively small. Automobile manufacturing was largely a process of assembly of purchased parts or completely integrated units such as bodies and motors. The suppliers of parts specialized in the production of valves, bearings, wheels, castings, electrical equipment, and, as just indicated, in some cases complete bodies and motors. Later, after the first World War, automobile companies increased their own manufacturing facilities and in a few cases became very highly integrated. This expansion was financed largely out of current earnings. Up to 1926 as much as 80 percent of the capital expansion in the automobile-manufactur-
' There are some Indications that man-hour cost bas turned upward iu recent ;years.
456781-42--3
ing industry was financed in this manner. This practice has not been substantially changed in recent years, although in a few cases substantial public offerings of automobile-manufacturing securities have been made for the purpose of acquiring existing properties.5
Capital expenditures for automobile manufacturing began to be quite large shortly before the first World War and increased sharply during the 2 immediate post-war years. The expenditure of more than 180 million dollars in 1920 was larger than in any subsequent year prior to 1940. The high expenditures in 1920 reflect to some extent the high unit costs for buildings and industrial machinery in that year. Notwithstanding this fact, the rn.te of additions to automobile manufacturing facilities in 1920 for new buildings and operating equipment other than tools, jigs, and dies, were the largest they have ever been in any year in this industry.
Since that time capitalized tools, jigs, and dies (consumable tools and hand tools are not included) have represented an increasing portion of the total capital expenditures reflecting largely the importance of style changes in automobile manufacturing. In 1920 tools, jigs, and dies represented less than 10 percent of the total capital expenditures in this industry. In 1932 they represented nearly 50 percent of these capital expenditures. The corresponding figure for 1939 was approximately 40 percent for the industry as a whole. Many individual automobile manufacturing concerns made a considerably larger part of their capital expenditures for this purpose in that year.
The fluctuations in outlays for new plant and other facilities for automobile manufacturing parallel to some extent the fluctuations in automobile production and in general business. The recovery from low points in capital expenditures, however, appears to have lagged after the revival in automobile production by one year in terms of the annual totals, as may be observed from the low points in 1922, 1925, 1928, 1933, and 1939 in figure 8. In each cycle the low point in capital outlays was reached in the year after the corresponding low point in production. This is true of the total and of the large companies. Some of the moderately sized companies, however, appear to have experienced fluctuations in capital outlays coincident with those in general business.
Following the low point in total capital expenditures in this industry in 1922, there occurred a steady rise to a peak in 1929, almost identical with that in 1920. Depreciable capital expenditures, however, do not appear to have reached the 1920 level in any year before or since that time.6 The largest outlays upon capital facilities of all kinds in the automobile manufacturing industry were nearly 200 million dollars in 1940. This
I See Seltzer, Lawrence H., A Financial History of the American Automobile In dustry.
G See page 22 for distinction between "depreciable capital expenditures" and "total capital expenditures."
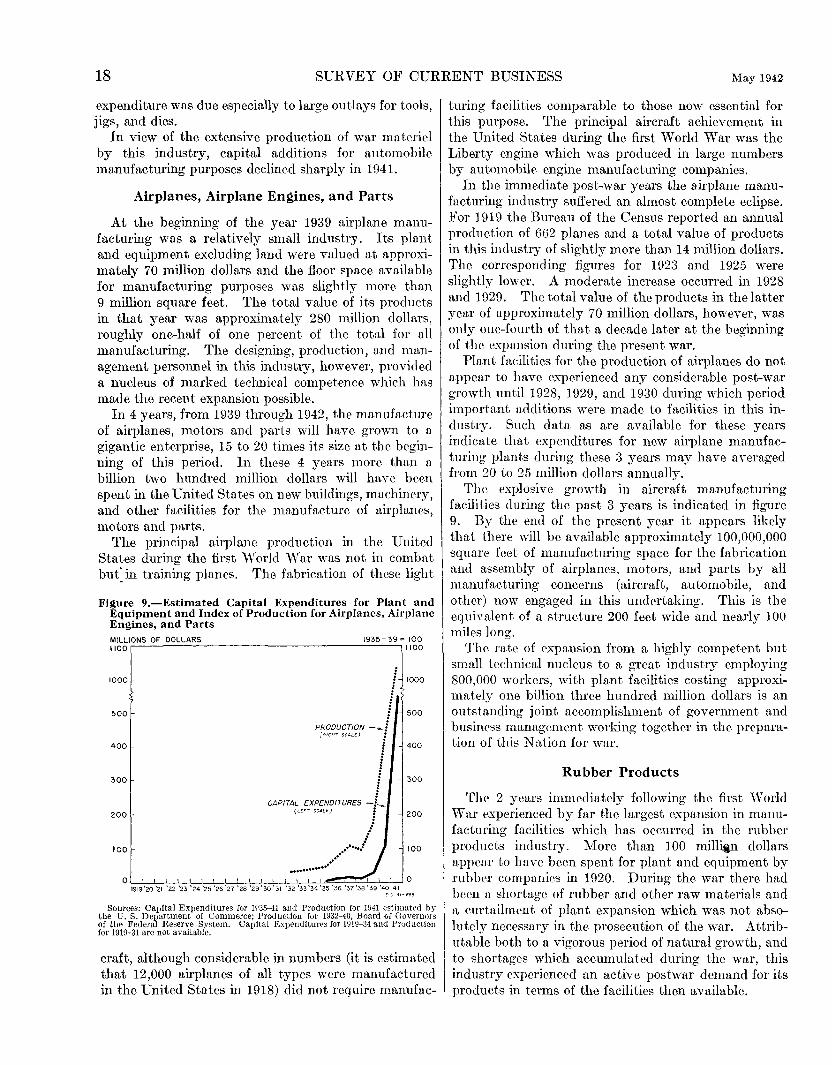
18 SURVEY OF CURRENT BUSINESS May 1942
expenditure was due especially to large outlays for tools, jigs, and dies.
In view of the extensive production of war materiel by this industry, ca.pital additions for automobile manufacturing purposes declined sharply in 1941.
Airplanes, Airplane Engines, and Parts
At the beginning of the year 1939 airplane manufacturing was a relatively small industry. Its plnnt and equipment excluding land were valued at approximately 70 million dollars and the floor space available for manufacturing purposes was slightly more than 9 million square feet. The total value of its products in that year was approximately 280 million dollars, roughly one-half of one percent of the total for all manufacturing. The designing, production, and management personnel in this industry, howeve1·, provided a nucleus of marked technical competence which has made the recent expansion possible.
In 4 years, from 1939 through 1942, the manufacture of airplanes, motors and parts will have grown to a gigantic enterprise, 15 to 20 times its size at the beginning of this period. In these 4 years more than u billion two hundred million dollars will have been spent in the United States on new buildings, machinery, and other facilities for thP manufacture of airplanes, motors and parts.
The principal airplane production in the United States during the first \Yorld \Var was not in combat bu( in training planes. The fabrication of these light
Figure 9.-Estimated Capital Expenditures for Plant and Equipment and Index of Production for Airplanes, Airplane Engines, and Parts MILLIONS OF DOLLARS 1100
1000
500
400
300
200
100
1935- 39 = 100 1100
:f. woo
500
PRODUCTION -._j \'RIGHT SCALE) i
: : ! : : :
CAPITAL EXPENDITURES -f-(Lur SCaLf) j , ...
I ....... _: .. .. ·· ············
400
300
200
100
0 0 1919 'zo '21 '22 '23 '24 'zs '26 '27 'zs '29 '3o '3t '3z '33 '.34 '35 '35 '37 '3e '39 '40 '41
Sources: Capital Expenditures for 1?35-41 and Production for 1941 estimated hy the U. S. Department of Commerce; Production for 1932-40, Board of Governors of the Federal Reserve System. Capital Expenditures for 1919-34 and Production for 1919-31 are not available.
craft, although considerable in numbers (it is estimated that 12,000 airplanes of all types were manufactured in the United States in 1918) did not require manufac-
turing facilities comparable to those now essential for this purpose. The principal aircraft achievement in the United States during the first World War was the Liberty engine which was produced in large numbers by automobile engine manufacturing companies.
In the immediate post-war years the airplane manufacturing industry suffered an almost complete eclipse. For 1919 the Bureau of the Census reported an annual production of 662 planes and a total value of products in this industry of slightly more than 14 million dollars. The corresponding figures for 1923 and 1925 were slightly lower. A moderate increase occurred in 1928 and 1929. The total value of the products in the latter year of approximately 70 million dollars, however, was only one-fourth of that a decade later at the beginning of the expansion during the present war.
Plant facilities for the production of airplanes do not appear to have experienced any considerable post-war growth until 1928, 1929, and 1930 during which period important additions were made to facilities in this industry. Such data as are available for these years indicate that expenditures for new airplane manufacturing plants during these 3 years may have averaged from 20 to 25 million dollars annually.
The explosive growth in aircraft manufacturing facilities during the past 3 years is indicated in figure 9. By the end of the present year it appears likely that there will be available approximately 100,000,000 square feet of manufacturing space for the fabrication and assembly of airplanes, motors, and parts by all manufacturing concerns (aircraft, automobile, and other) now engaged in this undertaking. This is the equivalent of a structure 200 feet wide and nearly 100 miles long.
The rate of expansion from a highly competent but small technical nucleus to a great industry employing 800,000 workers, with plant facilities costing approximately one billion three hundred million dollars is an outstanding joint accomplishment of government and business management working together in the preparation of this Nation for war.
Rubber Products
The 2 years immediately following the first World War experienced by far the largest expansion in manufacturing facilities which has occurred in the rubber products industry. More than 100 milli.in dollars appear to have been spent for plant and equipment by rubber companies in 1920. During the war there had been a shortage of rubber and other raw materials and a curtailment of plant expansion which was not absolutely necessary in the prosecution of the war. Attributable both to a vigorous period of natural growth, and to shortages which accumulated during the war, this industry experienced an active postwar demand for its products in terms of the facilities then available.
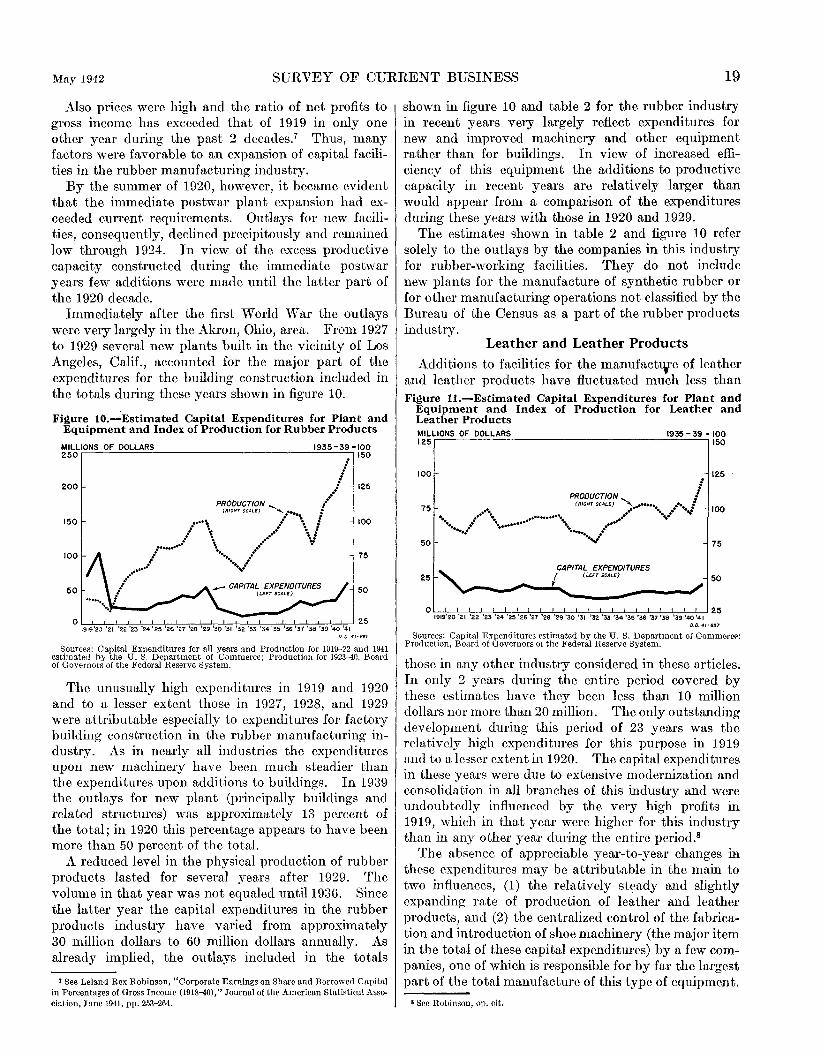
May 1942 SURVEY OF CURRENT BUSINESS 19
Also prices were high and the ratio of net profits to gross income has exceeded that of 1919 in only one other year during the past 2 decades.7 Thus, many factors were favorable to an expansion of capital facilities in the rubber manufacturing industry.
By the summer of 1920, however, it became evident that the immediate postwar plant expansion had exceeded current requirements. Outlays for new facilities, consequently, declined precipitously and remained low through 1924. In view of the excess productive capacity constructed during the immediate postwar years few additions were made until the latter part of the 1920 decade.
Immediately after the first World War the outlays were very largely in the Akron, Ohio, area. From 1927 to 1929 several new plants built in the vicinity of Los Angeles, Calif., accounted for the major part of the expenditures for the building construction included in the totals during these years shown in figure 10.
Figure 10.-Estimated Capital Expenditures for Plant and Equipment and Index of Production for Rubber Products
MILLIONS OF DOLLARS 1935-39 •100 150 250
200
150
100
50
0 25 1919'20 '21 '22 '23 '24 '25 '26 '27 '28 '29 '30 '31 '32 '33 '34 '35 '36 '37 '38 '39 '40 '41
D.O. 41-661
Sources: Capital Expenditures for all years and Production for !019-22 and 1941 estimated by the U. S. Department of Commerce; Production for 1923-40, Board of Governors of the Federal Reserve System.
The unusually high expenditures in 1919 and 1920 and to a lesser extent those in 1927, 1928, and 1929 were attributable especially to expenditures for factory building construction in the rubber manufacturing industry. As in nearly all industries the expenditures upon new machinery have been much steadier than the expenditures upon additions to buildings. In 1939 the outlays for new plant (prinf'ipally buildings and related structures) was approximately 13 percent of the total; in 1920 this percentage appears to have been more than 50 percent of the total.
A reduced level in the physical production of rubber products lasted for several years after 1929. The volume in that year was not equaled until1936. Since the latter year the capital expenditures in the rubber products industry have varied from approximately 30 million dollars to 60 million dollars annually. As already implied, the outlays included in the totals
7 See Leland Rex Robinson, "Corporate Earnings on Share and Borrowed Capital in Percentages of Gross Income (1918-40)," Journal of the American Statistical Association, June 1941, pp. 253-264.
shown in figure 10 and table 2 for the rubber industry in recent years very largely reflect expenditures for new and improved machinery and other equipment rather than for buildings. In view of increased efficiency of this equipment the additions to productive capacity in recent years are relatively larger than would appear from a comparison of the expenditures during these years with those in 1920 and 1929.
The estimates shown in table 2 and figure 10 refer solely to the outlays by the companies in this industry for rubber-working facilities. They do not include new plants for the manufacture of synthetic rubber or for other manufacturing operations not classified by the Bureau of the Census as a part of the rubber products industry.
Leather and Leather Products
Additions to facilities for the manufactwe of leather and leather products have fluctuated much less than Figure H.-Estimated Capital Expenditures for Plant and
Equipment and Index of Production for Leather and Leather Products MILLIONS OF DOLLARS 125
100
1935- 39 • 100 150
125
I PRODUCTION ' f
75 (RIGHT SCALE) ......... .... e IOQ
75
... . ... ···•.• .............. ... ... .... ·· ·.; •..• .·· ............ .... . .... ·· •...• ...... ..·· .. ..., 50
50
0 u 1919'20 '21 '22 '23 '2.4 '25 '26 '27 '28 '29 '30 '31 '32 '33 '34 '35 '36 '37 '38 139 '40 '41
0.0. 41·6~7
Sources: Capital Expenditures estimated by the U. S. Department of Commerce: Production, Board of Governors of the Federal Reserve System.
those in any other industry considered in these articles. In only 2 years during the entire period covered by these estimates have they been less than 10 million dollars nor more than 20 million. The only outstanding development during this period of 23 years was the relatively high expenditures for this purpose in 1919 and to a lesser extent in 1920. The capital expenditures in these years were due to extensive modernization and consolidation in all branches of this industry and were undoubtedly influenced by the very high profits in 1919, which in that year were higher for this industry than in any other yea.r during the entire period.8
The absence of appreciable year-to-year changes iB these expenditures may be attributable in the main to two influences, (1) the relatively steady and slightly expanding rate of production of leather and leather products, and (2) the centralized control of the fabrication and introduction of shoe machinery (the major item in the total of these capital expenditures) by a few companies, one of which is responsible for by far the largest part of the total manufacture of this type of equipment.
• See Robinson, op. cit.
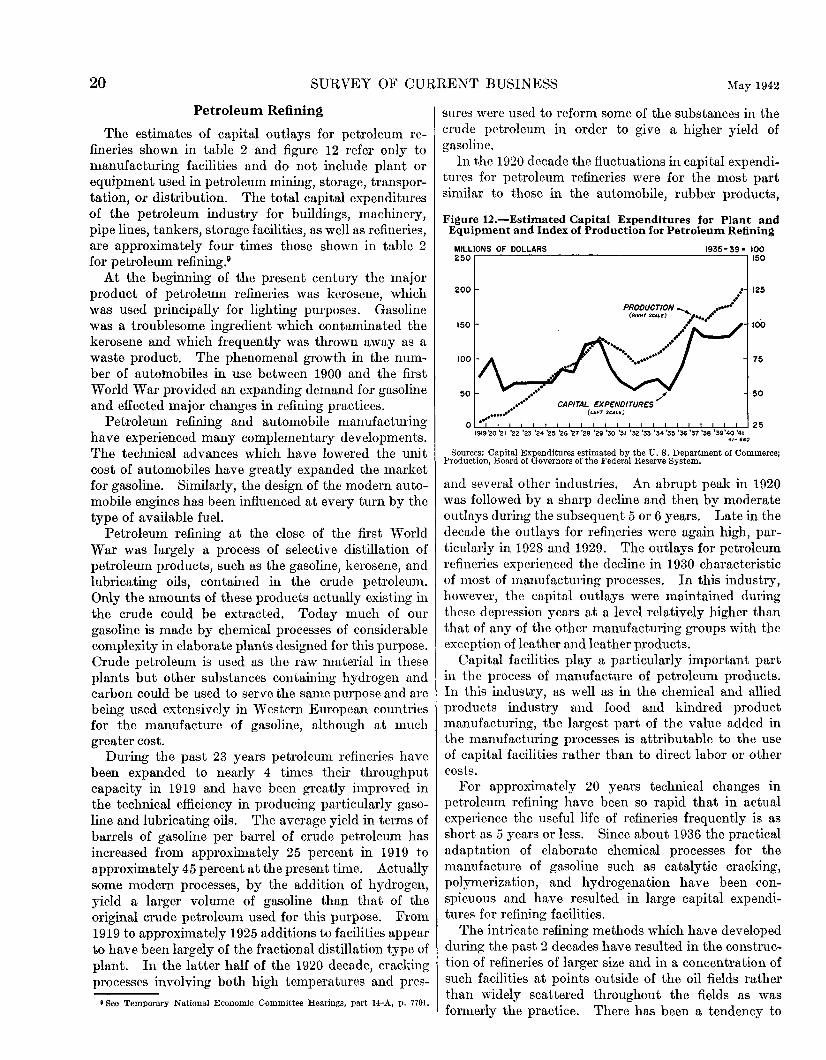
20 SURVEY OF CURRENT BUSINESS l\Iay 1942
Petroleum Refining
The estimates of capital outlays for petroleum refineries shown in table 2 and figure 12 refer only to manufacturing facilities and do not include plant or equipment used in petroleum mining, storage, transportation, or distribution. The total capital expenditures of the petroleum industry for buildings, machinery, pipe lines, tankers, storage facilities, as well as refineries, are approximately four times those shown in table 2 for petroleum refining.9
At the beginning of the present century the major product of petroleum refineries was kerosene, which was used principally for lighting purposes. Gasoline was a troublesome ingredient which contaminated the kerosene and which frequently was thrown away as a waste product. The phenomenal growth in the number of automobiles in use between 1900 and the first World War provided an expanding demand for gasoline and effected major changes in refining practices.
Petroleum refining and automobile manufacturing have experienced many complementary developments. The technical advances which have lowered the unit cost of automobiles have greatly expanded the market for gasoline. Similarly, the design of the modern automobile engines has been influenced at every turn by the type of available fuel.
Petroleum refining at the close of the first World War was largely a process of selective distillation of petroleum products, such as the gasoline, kerosene, and lubricating oils, contained in the crude petroleum. Only the amounts of these products actually existing in the crude could be extracted. Today much of our gasoline is made by chemical processes of considerable complexity in elaborate plants designed for this purpose. Crude petroleum is used as the raw material in these plants but other substances containing hydrogen and carbon could be used to serve the same purpose and are being used extensively in Western European countries for the manufacture of gasoline, although at much greater cost.
During the past 23 years petroleum refineries have been expanded to nearly 4 times their throughput capacity in 1919 and have been greatly improved in the technical efficiency in producing particularly gasoline and lubricating oils. The average yield in terms of barrels of gasoline per barrel of crude petroleum has increased from approximately 25 percent in 1919 to approximately 45 percent at the present time. Actually some modern processes, by the addition of hydrogen, yield a larger volume of gasoline than that of the original crude petroleum used for this purpose. From 1919 to approximately 1925 additions to facilities appear to have been largely of the fractional distillation type of plant. In the latter half of the 1920 decade, cracking processes involving both high temperatures and pres-
t See Temporary National Economic Committee Hearings, part 14-A, p. 7701.
surcs were used to reform some of the substances in the crude petroleum in order to give a higher yield of gasoline.
In the 1920 decade the fluctuations in capital expenditures for petroleum refineries were for the most part similar to those in the automobile, rubber products,
Figure 12.-Estimated Capital Expenditures for Plant and Equipment and Index of Production for Petroleum Refining
MILLIONS OF DOLLARS 250
200
150
100
50
1935-39• 100 150
125
100
75
50
4/• 660
Sources: Capital Expenditures estimated by the U.S. Department of Commerce; Production, Board of Governors of the Federal Reserve System.
and several other industries. An abrupt peak in 1920 was followed by a sharp decline and then by moderate outlays during the subsequent 5 or 6 years. Late in the decade the outlays for refineries were again high, particularly in 1928 and 1929. The outlays for petroleum refineries experienced the decline in 1930 characteristic of most of manufacturing processes. In this industry, however, the capital outlays were maintained during these depression years at a level relatively higher than that of any of the other manufacturing groups with the exception of leather and leather products.
Capital facilities play a particularly important part in the process of manufacture of petroleum products. In this industry, as well as in the chemical and allied products industry and food and kindred product manufacturing, the largest part of the value added in the manufacturing processes is attributable to the use of capital facilities rather than to direct labor or other costs.
For approximately 20 years technical changes in petroleum refining have been so rapid that in actual experience the useful life of refineries frequently is as short as 5 years or less. Since about 1936 the practical adaptation of elaborate chemical processes for the manufacture of gasoline such as catalytic cracking, polymerization, and hydrogenation have been conspicuous and have resulted in large capital expenditures for refining facilities.
The intricate refining methods which have developed during the past 2 decades have resulted in the construction of refineries of larger size and in a concentration of such facilities at points outside of the oil fields rather than widely scattered throughout the fields as was formerly the practice. There has been a tendency to
May 1942 SURVEY OF CURRENT BUSINESS 21
build new refineries, either at collection points on the seacoast near one or more oil fields or to build them close to centers of consumption of petroleum products.
In the year 1941, military requirements have affected the petroleum industry in a number of ways, such as the extraction of toluol from refinery gases, the development of higher octane gasoline for military aviation, and the use of petroleum as a base for synthetic rubber.
Economic and Other Influences
An examination of the capital outlays in the 12 industries discussed in these articles throws considerable light upon the economic and other influences which appear to have been most closely related to the capital expenditures for manufacturing plant and equipment in the United States over the past 25 years. All of the following factors seldom operate at the same time. However, nearly all manufacturing capital outlays in a given industry appear to be determined in varying degrees by one or more of these influences.
1. The relative importance of capital facilities in a particular manufacturing process (compared with direct labor and other factors of production). For example, in petroleum refining, the chemical industries, and flour milling, the contribution of fixed capital to value added by manufacture is relatively high. In the apparel industries, the leather and leather products industries, and the lumber and timber basic products industries, wages and salaries rather than capital costs are the predominant elements in the value added by manufacture.
2. Technological changes in products and methods of manufacture. Capital expenditures for new facilities are not necessarily made immediately following the practical adaptation of new technological methods but such developments do exert a very strong influence upon the rate of capital expenditures. The replacement of facilities which are essentially identical with those in place is relatively small. Machinery and structures seldom wear out to the extent that they are unable to perform the functions for which they were originally purchased and losses due to fire and other catastrophes in time of peace are not appreciable. Effective demand for nearly all types of durable goods thus is established not as the result of complete wearing out of such facilities, but as the result of a process of obsolescence and the development of improved units which are more efficient than the units previously in place.
3. The rate of physical production of a given commodity relative to previous levels and to the availability of facilities for this purpose at any given time. Extreme urgencies in the requirements for public purposes, such as for military supplies in 1917 and 1918, and at the present time, also may result in unusually large direct public expenditures for industrial facilities.
4. The profitability of some of the enterprises in a given industry. The concern in an industry which is
most profitable is not always the one which expands its facilities or adds new equipment. Such expenditures, however, are much more likely to be made if it is known or believed that one or more concerns in that industry have found profitable the introduction of a particular type of equipment. Thus, capital expenditures frequently are made by a given concern to enable it to compete more effectively with one of its more venturesome competitors.
5. Industrial migration from one region of the country to another clue to local differences in power resources, labor costs, industrial relations, State and local taxes, availability of materials and skilled workmen, and similar factors.
6. The availability of labor, materials, and equipment, and their relation to construction costs generally throughout the country. Changes in machinery costs and construction costs appear to have relatively less effect upon expenditures for manufacturing capital purposes than they do upon outlays for office buildings and residential structures.
7. The attitude of individual enterprisers with regard to the outlook for the future.
8. Government policies relating to taxation (tax rates, depreciation, amortization, and the reinvestment of net income) and to the public ownership of production facilities, and similar problems. For example, in the calculation of net income, the Revenue Act of 1918 made possible complete and rapid depreciation charges for the replacement of all machinery and other plant facilities which had been required in the prosecution of the war. This provision was one of the factors stimulating capital expenditures for new plant and equipment in 1919 and 1920.
Special Significance of Technological and Other Changes.
Change and differences in the rate of growth of particular industries are marked characteristics of the economic history of all modern industrial societies. In the United States changes in products and methods of fabrication have been extensive not only in manufact11ring but also in mining, transportation, and other industries, and have greatly influenced many professional services and the modes of domestic living. Even over short periods of little more than a decade, changes of this character have frequently been very far reaching. The following paragraphs illustrate technical changes of this character.
The practical development of the internal combustion en!',ine about the turn of the present century and its revolutionizing effect upon land transportation is well known. Important improvements in this type of engine continue to be made. For example, the highcompression Diesel engines now being sold commercially and the most advanced carburetor engines for airplanes have approximately twice the thermal efficiency of standard automobile engines; also the most
22 SURVEY OF CURRENT BUSINESS :'\1ay 1942
advanced airplane engines weigh less than 1 pound per horsepower compared with 10 pounds per horsepower for most automobile engines.
Recent improvements in metal-cutting tools using tungsten carbide have greatly advanced the progress which has been taking place for several decades in the cutting speeds of lathes and other machine tools. These new tools require heavier machines and greater power, and, thus, increase the rate of obsolescence on existing metal-cutting machines
The reciprocating steam engine which was perfected in substantially its present form by Watt and Bolton at the beginning of the 19th century, might appear to be an exception to this rule. Actually, however, this prime mover has been largely replaced by steam turbines for power generation and by electric motors for direct application of energy. The steam locomotiveone of the last stands of this type of engine-is rapidly giving way to electric and Diesel-electric locomotives, particularly the latter.
Electricity, first used as a means of developing mechanical power in manufacturing shortly after 1880, is now the energy source of approximately 85 percent of the horsepower capacity of the units from which mechanical power is derived in manufacturing plants in the United States.
Steel at the close of the Civil War was an expensive metal having limited uses for industrial purposes. The production of 83,000,000 net tons in the United States in 1941 is 4,000 times that of 75 years ago.
Aluminum was a rare substance of the scientific laboratory 60 years ago. In the next few years it appears likely that considerable more than one billion pounds of this metal "'ill be produced annually in the United States.
Changes such as these are not the exception but are characteristic of industrial history during the past two centuries. Although difficult to measure, such changes have influenced greatly the rate of expenditures by manufacturing concerns upon capital facilities
Methods of Deriving Estimates The estimates of capital expenditures shown in table 2 and figures 7 to 12 of this issue
and similar estimates in the March and December 19H issues of the SURVEY have been compiled with considerable care and all known statistical data relating to manufacturing capital outlays have been examined. In every case the data which appear to measure such expenditures most accurately have been used. It is necessary, however, to emphasize again, as was done in the earlier articles, that these estimates are not precise additions of reported dollar-expenditures by all manufacturing establishments in a given industry. See SurYey of Current Business, March 1941, page 15, and December 1941, page 20, for discussion of methods of deriving estimates of manufacturing capital expenditures.
The methods used in deriving the estimates for each of the industries shown in table 2 are indicated briefly below. The rough preliminary estimates for 1941 appear reasonable in the light of information aYailahle at the time this article was written but may be subject to change as more adequate data become available.
Blast Furnaces, Steel Works, and Rolling Mills Two entirely independent methods were used in compiling estimates of the capital
expenditures in this industry. The first series was secured from direct reports of such expenditures by a number of steel companies in the United States. Over the period from 1935 to 1940 the additions to capital at cost for tne principal companies are available in their reports to the Securities and Exchange Commission. The corporations reporting in this manner accounted for 85 percent of the capital outlays by all iron and steel companies in 1939, as estimated from the Census of Manufactures in that
year. Detailed corrections were made for each company for the additions to capital attributable to the acquisition of existing properties from other concerns. The annual totals for all of these companies thus dcriyed were used to measure tbe year-to-year changes in capital expenditures by all iron and steel establishments in the United States.
Over the period from 1915 to 1931, data upon capital expenditures were secured from five of the larger companies (four prior to 1930), including the two largest in this industry. These reports show tbe expenditures for manufacturing facilities separately from those used for transportation, mining, and other operations. These fiye companies accounted for approximately 55 percent of the capital expenditures of the blast furnace, steel works, and rolling mills industry iu 1939.
In view of the consolidations which ha\'e taken place in this industry over the past 25 years, continuous series based upon capital expenditures of a given corporation represent a much smaller part of the total industry in the earlier years than they do at the present time. Consequently, an attempt was made to trace the subsidiaries and other acquired units of present existing corporations back to the beginning of the period. The only data available for this purpose are the total assets of parent corporations and acquired subsidiaries. Consequently, for this purpose it was assumed that the outlays for new facilities by acquired subsidiaries in earlier years bore the same proportion to those of the parent company as their total assets did to those of the parent company. The simple addition of the reported dollar-expenditures of corporations bearing a given name throughout the entire period would have resulted in serious underestimation of capital expenditures iu the earlier years.
A second, entirely independent, estimate of capital expenditures in the blast furnace, steel works, and rolling-mill industry was based upon the annual gross increments in blast furnace capacity (new furnaces and rebuilt furnaces were treated separately) and in the various types of steel-making capacity as reported by the American Iron and Steel Institute. 'l'o each of these increments were applied rclath·e weights which were intended to measure the relative unit costs of additions to these various facilities.
The series of annual relatives thus derived, measuring the physical additions to iron and steel-making capacity, was multiplied by an index of construction costs to giYe an index of dollar expenditures for iron and steel-making facilities. This index was calculated from several separate indexes of actual construction costs compiled by the Interstate Commerce Commission for >arious types of industrial machinery and structures. To this product of additions in facilities times construction costs were added year-to-year measures of expenditures for rolling· mill machinery derived from the production of such machinery reported in each biennial census year beginning in 1925. In the earlier years the expenditures upon rolling mills were assumed to be proportional to expenditures upon all other additions to capacity iu this industry. The series derived iu the above manner were used to calculate the year-to-year changes in cavital outlays for iron and steel-making facilities.
As in the estimates for other industries, the capital expenditure reported to the Bureau of the Census in 1939, plus allowances for undercovcrage in the census returns (13 percent for this industry), was used as the base for the estimates throughout the entire period.
In general, the estimates derived from reported expenditures (the first method) tend to fluctuate more widely than the series based upon annual gross additions to productive facilities (the St'cond method). The movements of the two series, how· ever. were closely parallel and the turning points, with one or two exceptions, occurred in the same years. The long-time trends in the two series also were closely parallel. In nearly all cases discrepancies between the two series appear to have been accounted for by cxpeucliturcs of companies which were not reflected in the first series but were co\'ered by the second.
In view of the fairly satisfactory coverage of the estimates based upon reported expenditures from 1929 to 1940, the estimates based upon this method were used oYer this period. For the years prior to 1929 the second method, which reflects additions to facilities by all companies both large and small, appeared to be preferable to the first method. The estimates shown in table 2 over the period from 19115 to 1929 are consrqupntJy based upon the second method.
Automobiles and Automobile Equipment The year-to-year changes in this senes arc based upon the fluctuations in the total
capital expenditures, including buildings, n1achinery, tools, jigs, dies, and other productive facilities by seven automobile manufacturing companies including the three largest corporations in this industry. These seven corporations accounted for approximately 85 percent of the estimated total depreciable capital expenditures r)f all automobile and automobile equipment manufacturers in 1939.
Two ocrics are shown for this industry, (a) total capital expenditures and (b) depreciable capital expenditures. The total capital expenditures in this industry for the ba'e year 1939 included allowances for tools, jigs, and dies in addition to the depreciable capital expenditures reported to the Bureau of the Census. This special distinction is necessary because of the aceounting treatment of tools, jigs, and dies by many concerns in this industry. The usual practice in most manufacturing is to depreciate all items charged to capital plant and equipment accounts. The frequent style-changes in the automobile industry have resulted in a practice followed by many companies of charging tools, jigs, and dies to capital accounts but of subsequently writing them off as current manufacturing expense month-by-month during the period in which they are used. Although included in the Census reports of capital expenditures in most other manufacturing industries, the expenditures for tools, jigs, and dies were not reported by the automobile manufacturing companies to the Census of Manufactures in 1939 unless charged to depreciable capital accounts which, as just noted, is not the practice usually followed in this industry.
The Census total for new depreciable plant and equipment expenditures in this industry in 1939 was approximately $75,089,000. Data received from six of the seYen
May 1942 SURVEY OF CURRENT BUSINESS 23
corporations showed capitalized tools, jigs, and dies separately from the depreciable capital outlays. After a careful examination of the data for the seven corporations representing 85 percent of the capital expenditures in this industry, it has been estimated that the total capital outlays for the automobile and automobile equipment industry in 1939 were approximately 136 million dollars, and the depreciable capital outlays 83 million.
Airplanes, Airplane Engines and Parts The most satisfactory measure of the capital outlays in this industry appear to be
the additions to capital at cost reported annually to the Securities and Exchange Commission by nearly all of the principal airplane manufacturing companies in the United States. A detailed examination was made of the reports of each of these companies in each year. Based upon this examination a series was compiled showing the additions to capital at cost for new manufacturing facilities by these companies excluding land and transportation facilities. Adjustments were also made to exclude any capital additions due to changes in corporation accounts other than those due to additions to new facilities at cost.
These reports are available only for the period 1935 to 1940, inclusive. The estimate for the year 1941 was derived from (a) statistics upon capital expenditures for industrial facilities compiled by the War Production Board, (b) statistics of building contracts awarded, and (c) floor space in airplane manufacturing plants compiled by the Aeronautical Chamber of Commerce (plus allowances for airplane manufacturing plants operated by corporations whose business formerly had been in other industries).
Rubber Products The year-to-year changes in the capital expenditures in this industry were estimated
by adding a series measuring building construction activity to a series measuring specialized general purpose machinery (see above references to earlier articles for more detailed description of this general method).
The machinery estimates for bienniel census years were derived from the production of special purpose rubber-working machinery reported in the Census of Manufactures plus appropriate allowances to the rubber-products industry of general purpose machinery such as engines and motors. 'rhe estimates of machinery expenditures in the intercensal years were interpolated using the gross sales of three concerns (five in earlier years) specializing in the fabrication of rubber-working machinery. Although these companies were responsible for only about 20 percent of the total of such machinery produced in 1939, the fluctuations in their gross sales were in good agreement with the total production of rubber-working machinery reported to the Census of Manufactures in the odd-numbered years throughout the entire period with the exception of the intercensal period from 1919 to 1921 for which special calculations were made. The strikingly high estimate for the year 1920 is attributable to unusually high building construction activity, rather than to unusually high machinery expenditures, although both reached their peak in that year.
The estimates of plant and equipment expenditures derived in the above manner were used to calculate the year-to-year changes in such expenditures in the rubber products industry. The estimate for the base year 1939 was derived from the reports to the bureau of the Census in that year plus allowances for undercoverage and under· reporting in these reports (17 percent estimated for this industry).
Leather and Leather Products The year-to-year changes in the capital outlays shown in table 2 for leather and
leather-working industries were derived by adding estimates of building construotion activity to estimates of production of specialized and general-purpose machinery as previously described for other industries.
The 1939 estimate which was used as the base for the estimates in all years was the capital expenditures (excluding land but including used equipment) reported by all leather and leather products establishments to the Bureau of the Census plus an allowance of 8pcr cent for underreporting and undercoverage plus 4 million dollars for
new shoe working machinery which moved into the leasing stock of the principal shoe manufacturing machinery companies. In view of the widespread practice of leasing shoe machinery, the latter adjustment was essential. This figure was derived after a detailed examination of the corporation records of the principal manufacturers engaging in this business ~nd an examination of the Census of Manufactures returns for the leather and leather products industry.
Petroleum Refining For the years 1935 to 1940, measures of the additions to capital at cost for the manu
facturing or refining divisions of 18 of the principal petroleum companies are available in the reports by these companies to the Securities and Exchange Commission. These statistics were supplemented by similar data from two large corporations for which this detail was not reported directly to that Commission. These 20 companies operated approximately 77 percent of the refining facilities in 1938 and are estimated to have been responsible for about 85 percent of the capital outlays for refineries in 1939. The estimates shown in table 2 for petroleum refineries over the period from 1935 to 1940 are based upon the reports from these 20 companies plus an allowance for the smaller companies for which such data were not available.
Estimates derived in. the indirect manner indicated below resembled very closely those based upon reported outlays for refineries by petroleum companies over the period from 1935 to 1940.
Over the period from 1919 to 1934 the year-to-year changes in the capital expend]. tures for petroletJm refineries were derived from the gross annual increments in refining and cracking capacity multiplied by an index of construction costs and by a rough measure of the effect of technological changes upon the costs of new refining facilities. The year-to-year additions to refining and cracking capacity were derived by a year-to-year comparison of the capacity of eacll petroleum refinery in the United States reported by the Bureau of Mines. These reports upon the total capacity of rach refinery arc available for January 1 of each year from 1918 to 1941 with the exception of the 2 years 1923, and 1924. Consequently, it has not been possible to calculate the year-to-year fluctuations from 1922 to 1925. An annual average for these years, however, has been compiled.
Annual reports of cracking capacity are available for January 1 of each year from 1928 to 1941. In January 1928, 40 percent of the refining facilities in terms of throughput capacity had cracking as well as refining units. In 1919 cracking was used only at a very few refineries. It was assumed that the ratio of total refining capacity which had cracking units increased in a straight line relation from zero in 1915 to 40 percent in 1928.10
In view of tho increasingly complicated character of the new units constructed in recent years it was necessary to make an adjustment in order that the estimated capital outlays wot1ld reflect such changes. The most satisfactory measure which in a eough general way corresponds to these technical changes is the average octane rating of gasoline produced in the United States.
The final series measuring year-to-year changes in capital outlays for refineries from 1919 to 1934, consequently, reflects gross annual increases in refining plus cracking capacity (2.5 times refining plus 1.0 times cracking) multiplied by an index of construction costs, multiplied by an index of octane rating referred to above. The index of construction costs was derived by consolidating several indexes ("elevated structures", ~'fuel stations", "shops and engine houses", "gas-producing plants", and "powerplant machinery") of actual costs compiled by the Interstate Commerce Commission, those most closely resembling types of construction in petroleum refineries.
The author will greatly appreciate any suggestions for improvements in these estimates or in the analysis of related influences by persons having special knowledge upon capital outlays in any of the manufacturin~ industries treated in these articles.
10 See page 7802, Part 14-A, Temporary National Economic Committee Hearings, total quantity of gasoline :produced by straight run and by cracking by years 1920
to 1938.
(Continued from page 8)
by the recession in sales of durable goods-stores, now nondurable lines upon which consumers concentrated fully two-fifths b0low their volume 12 months ago. their buying in anticipation of shortages. The heavy buying which resulted in unseasonably Serious problems of wartime consumption take form large sales by nondurable-goods stores in January in the retail field. As civilian goods output is progresappeared to have moderated only slightly in February sively reduced, the retail sales volume of numerous and March. Nondurable-goods store volume for the latter consumer products evidently can be maintained only month was almost one-fifth above the preceding March. by depleting drastically or exhausting dealer stocks.
Advancing retail prices in recent months, however, Retail stocks, however, ought in many instances to be have absorbed an ever-larger proportion of consumer regarded in the light of reserves against even more expenditures. Thus, the actual volume of retail trade serious shortages later. Success in curbing the aggrein March, after allowance for increased prices, was off gate expenditures of consumers, moreover, does not bar about 15 percent from the comparable 1941 level- their hoarding of specific products, such as shoes, reflecting principally reduced sales of durable goods. clothing or household necessities. Hoarding often The quantity of merchandise sold by nondurable-goods results in the inequitable distribution of scarce articlesstores, on the contrary, exceeded moderately that of an outcome which might largely be avoided by prompt the year before. It was up even more sharply in certain rationing.
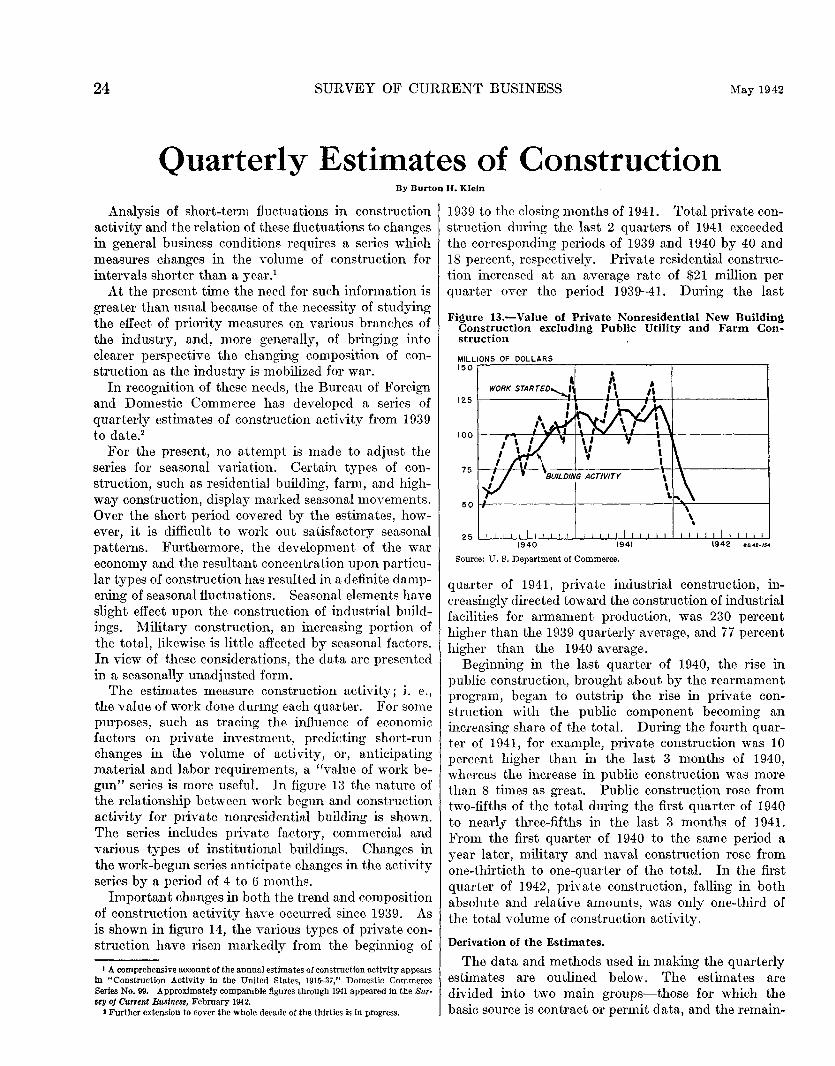
24 SURVEY OF CURRENT BUSINESS May 1942
Quarterly Estimates of Construction By Burton H. Klein
Analysis of short-term fluctuations in construction activity and the relation of these fluctuations to changes in general business conditions requires a series which measures changes in the volume of construction for intervals shorter than a year.1
At the present time the need for such information is greater than usual because of the necessity of studying the effect of priority measures on various branches of the industry, and, more generally, of bringing into clearer perspective the changing composition of construction as the industry is mobilized for war.
In recognition of these needs, the Bureau of Foreign and Domestic Commerce has developed a series of quarterly estimates of construction activity from 1939 to date.2
For the present, no attempt is made to adjust the series for seasonal variation. Certain types of construction, such as residential building, farm, and highway construction, display marked seasonal movements. Over the short period covered by the estimates, however, it is difficult to work out satisfactory seasonal patterns. Furthermore, the development of the war economy and the resultant concentration upon particular types of construction has resulted in a definite dampening of seasonal fluctuations. Seasonal elements have slight effect upon the construction of industrial buildings. Military construction, an increasing portion of the total, likewise is little affected by seasonal factors. In view of these considerations, the data are presented in a seasonally unadjusted form.
The estimates measure construction activity; i. e., the value of work done durmg each quarter. For some purposes, such as tracing the influence of economic factors on private investment, predicting short-run changes in the volume of activity, or, anticipating material and labor requirements, a "value of work begun" series is more useful. In figure 13 the nature of the relationship between work begun and construction activity for private nonresidential building is shown. The series includes private factory, commercial and various types of institutional buildings. Changes in the work-begun series anticipa.te changes in the a.ctivity series by a period of 4 to 6 months.
Important changes in both the trend and composition of construction activity have occurred since 1939. As is shown in figure 14, the various types of private construction have risen markedly from the beginning of
• A comprehensive account of the annual estimates of construction activity appears in "Construction Activity in the United States, 1915-37," Domestic Commerce Series No. 99. Approximately comparable figures through 1941 appeared in the Sur· oeu of Current Business, February 1942.
t Further extension to cover the whole decade of the thirties is in progress.
1939 to the closing months of 1941. Total private construction during the last 2 quarters of 1941 exceeded the corresponding periods of 1939 and 1940 by 40 and 18 percent, respectively. Private residential construction increased at an average rate of $21 million per quarter over the period 1939-41. During the last
Figure 13.-Value of Private Nonresidential New Building Construction excluding Public Utility and Farm Construction
MILLIONS OF DOLLARS 150
Source: U.S. Department of Commerce.
quarter of 1941, private industrial construction, increasingly directed toward the construction of industrial facilities for armament production, was 230 percent higher than the 1939 quarterly average, and 77 percent higher than the 1940 average.
Beginning in the last quarter of 1940, the rise in public construction, brought about by the rearmament program, began to outstrip the rise in private construction with the public component becoming an increasing share of the total. During the fourth quarter of 1941, for example, private construction was 10 percent higher than in the last 3 months of 1940, whereas the increase in public construction was more than 8 times as great. Public construction rose from two-fifths of the total during the first quarter of 1940 to nearlj three-fifths in the last 3 months of 1941. From the first quarter of 1940 to the same period a year later, military and naval construction rose from one-thirtieth to one-quarter of the total. In the first quarter of 1942, private construction, falling in both absolute and relative amounts, was only one-third of the total volume of construction activity.
Derivation of the Estimates.
The data and methods used in making the quarterly estimates are outlined below. The estimates are divided into two main groups-those for which the basic source is contract or permit data, and the remain-
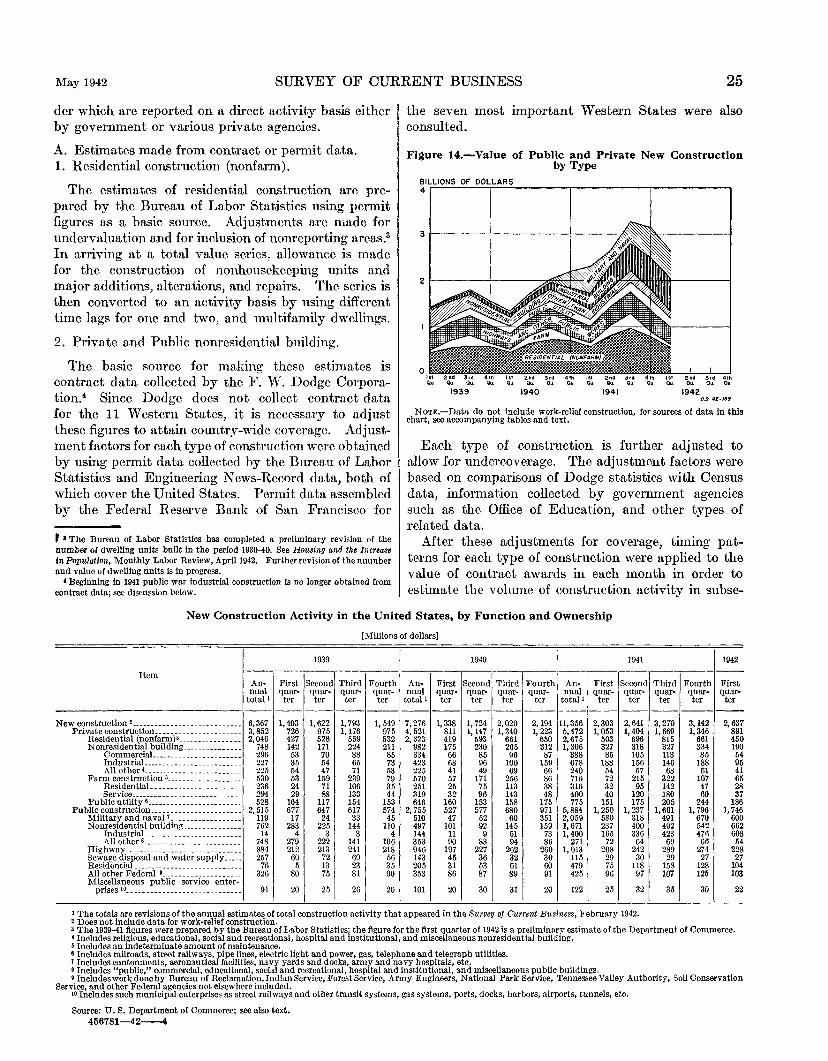
May 1942 SURVEY OF CURRENT BUSINESS 25
der which are reported on a direct activity basis either by government or various private agencies.
A. Estimates made from contract or permit data. 1. Residential construction (nonfarm).
The estimates of residential construction are prepared by the Bureau of Labor Statistics using permit figures as a basic source. Adjustments are made for undervaluation and for inclusion of nonreporting areas.3
In arriving at a total value series, allowance is made for the construction of nonhousekeeping units and major additions, alterations, and repairs. The series is then converted to an activity basis by using different time lags for one and two, and multifamily dwellings.
2. Private and Public nonresidential building.
The basic source for making these estimates is contract data collected by the F. W. Dodge Corporation.4 Since Dodge does not collect contract data for the 11 Western States, it is necessary to adjust these figures to attain country-wide coverage. Adjustment factors for each type of construction were obtained by using permit data collected by the Bureau of Labor Statistics and Engineering News-Record data, both of which cover the United States. Permit data assembled by the Federal Reserve Bank of San Francisco for
r a The Bureau of Labor Statistics has completed a preliminary revision of the number of dwelling units built in the period 1931)-40. See Housing and the Increase in Population, Monthly Labor Review, April1942. Further revision of the nuunber and value of dwelling units is in progress.
4 Beginning in 1941 public war Industrial construction is no longer obtained from contract data; see discussion below.
the seven most important Western States were also consulted.
Figure 14.-Value of Public and Private New Construction by Type
BILLIONS OF DOLLARS 4
1939 1940 1941 1942 D.O. 42-159
NOTE.-Data do not include work-relief construction, for sources of data in this chart, see accompanying tables and text.
Each type of construction is further adjusted to allow for undercoverage. The adjustment factors were based on comparisons of Dodge statistics with Census data, information collected by government agencies such as the Office of Education, and other types of related data.
After these adjustments for coverage, timing patterns for each type of construction were applied to the value of contract awards in each month in order to estimate the volume of construction activity in subse-
New Construction Activity in the United States, by Function and Ownership
Item Annual
total'
[Millions of dollars]
1939
First Second Third Fourth Anquar· quar- quar- quar- nual ter ter ter ter total'
1940
First Second Third Fourth An-quar- quar- quar- quar- nual ter ter ter ter total'
1941 1942
First Second Third Fourth First quar- quar- quar- quar- quar·
ter ter ter ter ter ----------------------------------------------New construction'···························· Private construction _____________________ _
Residential (nonfarm)' ...........•.•.. Nonresidential building .........••....
Commercial. .•.................... IndustriaL ...................... . All other'······· ................. .
Farm construction'················· .. Residential. •.••••................ Service ___________________________ _
Public utility'························ Public construction ...................... .
Military and naval'·················· Nonresidential building .............. .
Industrial. ........................ . All other'·························
Highway ............................. . Sewage disposal and water supply .... . Residential ...........•................ All other Federal ' ................... . Miscellaneous public service enter-
prises 10 _____ ------------------------
6,367 3,852 2,046
748 296 227 225 530 236 294 528
2, 515 119 762
14 748 884 257
76 326
91
1,403 726 427 142 53 35 54 53 24 29
104 677 17
283 4
279 212
6U 5
80
20
1,622 975 528 171 70 54 47
159 71 88
117 647
24 225
3 222 213
72 13 75
25
1, 793 1,176
559 224 88 65 71
239 106 133 154 617 33
144 3
141 241 69 23 81
26
1, 549 975 532 211 85 73 53 79 35 44
153 574
45 110
4 106 218 56 35 90
20
7,276 4, 521 2, 323
982 334 423 225 570 251 319 646
2, 755 510 497 144 353 946 143 205 353
101
1, 338 811 419 175 66 68 41 57 25 32
160 527 47
101 11 90
197 45 31 86
20
1, 724 1,147
593 230 85 96 49
171 75 96
153 577
52 92 9
83 227 36 53 87
30
2,020 1, 340
661 265 96
100 69
256 113 143 158 680
60 145
51 94
262 32 61 89
31
2,194 1, 223
650 312 87
159 66 86 38 48
175 971 351 159
73 86
260 30 60 91
20
11,356 5,472 2,675 1,306
388 678 240 716 316 400 775
5,884 2,059 1, 671 1,400
271 1, 013
115 479 425
122
2,303 1, 053
503 327 85
188 54 72 32 40
151 1,250
580 237 165
72 208 29 75 96
25
2,641 1,404
696 318 105 156 57
215 95
120 175
1,237 318 400 336
64 242 30
118 97
32
' The totals are revisions of the annual estimates of total construction activity that appeared in the Survey o} Current Business, February 1942. 2 Does not include data for work-relief construction.
3,270 1, 669
815 327 113 146 68
322 142 180 205
1,601 491 492 423
69 289
29 158 107
35
3,142 1,346
661 334 85
188 61
107 47 60
244 1, 796
670 542 476
66 274 27
128 125
30
2,637 891 450 190 54 95 41 65 28 37
186 1, 746
600 662 608 54
228 27
104 103
22
3 The 1939-41 figures were prepared by the Bureau of Labor Statistics; the figure for the first quarter of 1942 is a preliminary estimate of the Department of Commerce. 'Includes religious, educational, social and recreational, hospital and institutional, and miscellaneous nonresidential building. I Includes an indeterminate amount of maintenance. a Includes railroads, street railways, pipe Jines, electric light and power, gas, telephone and telegraph utilities. 7 Includes cantonments, aeronautical facilities, navy yards and docks, army and navy hospitals, etc. 8 Includes "public,'' commercial, educational, social and recreational, hospital and institutional, and miscellaneous public buildings. • Includes work done by Bureau of Reclamation, Indian Service, Forest Service, Army Engineers, National Park Service, Tennessee Valley Authority, Soil Conservation
Service, and other Federal agencies not elsewhere included. to Includes such municipal enterprises as street railways and other transit systems, gas systems, ports, docks, harbors, airports, tunnels, etc.
Source: U. S. Department of Commerce; see also text. 456781-42---4
26 SURVEY OF CURRENT BUSINESS May 1942
quent months.5 In developing these timing patterns, account is taken of both the time that elapses between the inclusion of the data in the Dodge "contract award" series and the begi1ming of work, and the time required to complete certain types of buildings. The building period varies for each type of construction. For example, a period averaging slightly more than 4 months is used for factory building, while a period of 7 months is used for hospital and institutional buildings. It is not assumed that activity arising from a particular nwnth's contract awards is spread evenly over the whole period; different percentages are used in each of the successive months.
B. Estimates Reported on a Direct Activity Basis.
1. Farm Construction. Estimates of Farm construction are made by the
Bureau of Agricultural Economics. In contrast to the other estimates, these include maintenance because no satisfactory method has been developed to separate new farm construction from maintenance. Since it was impossible to obtain the data on a quarterly basis, "normal" quarterly factors were derived in consultations with the Bureau of Agricultural Economics and applied to the annual estimates.
2. Public Utility Construction. Estimates of construction work by public utilities are,
for the most part, based on reports from organizations such as The Bureau of Railway Economics and the Bell Telephone Company. When it was not possible to secure the data on a less than annual basis, contract data for the specific type of utility were converted to a quarterly activity series and applied as an index to the annual reported figure.
3. Military and Naval Construction. For the period prior to July 1941, military and naval
construction figures were secured from the War and Navy Departments. Subsequent to that date, the figures were obtained from the Vl ar Production Board and adjusted to exclude strategic highways which are included in the highway estimates.
4. Public Factory Construction. Beginning in 1941, monthly estimates of war in
dustrial facilities were secured from the War Production Board. Publicly financed but privately owned
6 In deriving these time patterns use has been made of the data collected by the Public Works Administration, some of which appears in "The Economic Effects of the Federal Public Works Expenditure,, 1933-38," November 1940, National Re· sources Planning Board; studies made by Mr. Ray R. Foster, formerly of the Federal Reserve Board and other related data.
facilities were excluded since these are included in the estimates of private industrial construction.
5. Highway Construction. The Public Roads Administration prepares annual
estimates of total highway construction based on annual reports from State Highway Commissions, and surveys of municipal and county outlays for highways. A quarterly index of highway construction was used to distribute the annual totals by quarters and to extrapolate the 1941 figure.
6. Sewage Disposal and Wa.ter Supply. Estimates for these types of construction are based
on data from Financial Statistics ot Cities, last appearing May 1938. The annual figure derived from these sources was apportioned and extended quarterly by an index of Sewage Disposal and Water Supply construction, obtained by converting contra.ct data for these types of construction to an activity series.
7. Public Residential Housing. Data for Public Residential Housing were secured
from the public housing agencies and the vY ar Production Board and adjusted to exclude duplication.
8. All Other Federal Construction. This category includes construction done by the
following agencies: Bureau of Reclamation, Indian Service, Forest Service, Army Engineers, National Park Servicc, Tennessee Valley Authority, Soil Conservation Service, and miscellaneous work of other agpncies not elsewhere included.
Most of the annual estimates and some of the quarterly are secured by reports from these agencies. In some of the cases in which it was not possible to secure quarterly data, the Bureau of Labor Statistics' revised monthly figures on man-hours, pay rolls and material orders of government agencies engaging in construction were used to apportion the totals. For some of the smaller agencies where the Bureau of Labor Statistics indexes were not found to be appropriate, and it "ras not possible to secure quarterly figures from the agency, indexes of construction activity for agencies engaging in similar types of work were used.
9. Miscellaneous Public Service Enterprises. This heading includes expenditures for street rail
ways, and other transit systems, gas systems, ports, docks, harbors, ferries, airports, and other municipal enterprises. The main source for these data is Financial Statistics of Cities. Various types of indexes similar to those described above were used to apportion and extrapolate the annual totals.
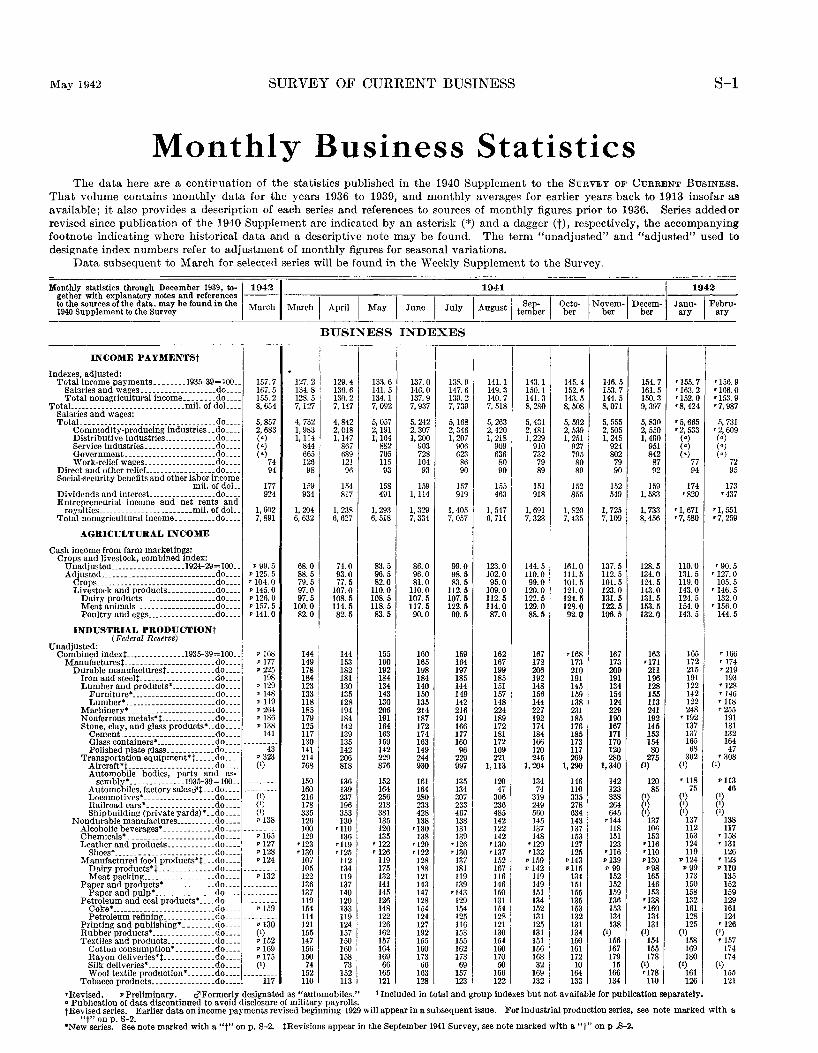
May 1942 SURVEY OF CURRENT BUSINESS S-1
Monthly Business Statistics The data here are a continuation of the statistics published in the 1940 Supplement to the SuRVEY OF CuRRENT BusiNESS.
That volume contains monthly data for the years 1936 to 1939, and monthly averages for earlier years back to 1913 insofar as available; it also provides a description of each series and references to sources of monthly figures prior to 1936. Series addedor revised since publication of the 1940 Supplement are indicated by an asterisk (*) and a dagger (t), respectively, the accompanying footnote indicating where historical data and a descriptive note may be found. The term "unadjusted" and "adjusted" used to designate index numbers refer to adjustment of monthly figures for seasonal variations.
Data subsequent to March for selected series will be found in the Weekly Supplement to the Survey.
Monthly statistics through December 1939, to-~19421 1941 i' 1942 gether with explanatory notes and references --- ---..,----,---.,.-----,-----,----,----....,...---.----..--- -----,----tothesourcesofthedata,maybefoundinthe March Marnh I A .1 I M I J I J 1 lA tl Sep- I Octo-1Novem-1Decem- Jauu-~Febru-1940 Supplement to the Survey ' pn ay nne 0 Y ugus tember ber ber ber ary ary
INCOME PAYMENTS!
Indexes, adjusted: Total income payments ________ l935--39=100 ..
Salaries and wages. ------------------do ___ _ Total nonagricultural income ........ do ___ _
TotaL ___________________________ mil. of doL .. Salaries and wages: TotaL ... ___ --------- ___ ------ _________ do ... .
Commodity-producing industries .. do ... . Distributive industries _____________ do ... . Service industries ..... _____________ do ___ _ Governmcnt_ ______________________ do ___ _ Work-relief wa!(es ______ ------ ...... do ___ _
Direct and other relief.. _________________ do ___ _ Social-security benefits and other labor income
mil. of doL Dividends and interest. ________________ do ___ _ Entrepreneurial income and net rents and
royalties ________________________ mil. of doL Total nonagricultural income __________ do ....
AGRICULTURAL INCOME
Cash income from farm marketings: Crops and livestock, combined index:
Unadjustea ___________________ 1924-29= 100. _
A~~;~~d:~:::::::::::::::::::::::::::~~:::: J,ivestock and products ____________ do ___ _
Dairy products ___________________ do ___ _ Meat animals ____________________ do ___ _ Poultry and eggs _________________ do ___ _
INDUSTRIAL PRODUCTION! (Federal Reserve)
157.7 167.5 !55. 2 8, 654
5, 857 2, 683 (•) (•) (•)
74 94
177 924
1, 602 7, 891
p 99.5 p 125. 5 '104.0 p 145.0 p 126. 0 • 157. 5 p 141.0
Unadjusted: Combined indext---------------1935-39=100.. • 168
Manufacturest-----------------------do____ v 177 Durable mannfacturest ............ do____ • 225
Iron and steelt.------------------do____ 198 Lumber and products* ___________ do____ • !29
Furnitnre*---------------------do____ • 148 Lumber*-----------------------do____ • 119
Machinery* ______________________ do____ • 264 Nonferrous meta!s•t--------------do____ • 186 Stone, clay, and glass products* .. do____ • 138
Cement. ... ____________________ do____ 141 Glass containers* _______________ do ____ ---------Polished plate glass ____________ do____ 43
Transportation equipment•t ..... do____ • 323 Aircraft•t- _____________________ do.... (1)
Automobile bodies, parts and as-sembly* _____________ .1935-39= 100 .. ---------
Automobiles, factory salesd't ... do ..... --------Locomotives• __________________ do.... (') Railroad cars• _________________ do.... (1)
Shipbuildin!( (private yards)* .. do.... (I) Nondurable manufactnres __________ do.... • 138
Alcoholic beverages• _____________ do .... -------Chemicals* ______________________ do.... • 165 Leather and products ____________ do.... • 127
Shoes• _________________________ do.... • 128 Manufactured food products•t ... do.... •124
Dairy products•t. _____________ do .... Meat packing __________________ do.... • 132
Paper and products* _____________ do ___ _ Paper and pulp* _______________ do ... .
Petroleum and coal products• .... do ... . Coke* __________________________ do.... • !59 Petroleum refining _____________ do ____ ---------
Printing and publishing• ________ do.... • 130 Rubber products* ________________ do.... (') Textiles and products ____________ do.... • 152
Cotton consumption• __________ do.... • 169 Rayon deliveries•t-------------do.... • 175 Silk deliveries• _________________ do.... (') Wool textile production• _______ do .... ---------
Tobacco products ________________ do..... 117
127.2 13!.8 128.5 7,127
4, 732 1, 983 1, 114
844 665 126 98
!R9 934
1, 204 6, 632
68.0 88.5 79.5 97.0 97.5
100.0 82.0
144 149 178 184 123 133 118 185 179 125 117 130 141 214 768
!50 160 216 178 335 126 100 129
'123 '130
107 105 122 136 137 119 !54 114 121 155 147 !56 150
74 152 110
BUSINESS INDEXES
129.4 136.6 130.2 7,147
4, 842 2, 018 1, 147
867 689 121 96
!54 817
1, 238 6, 627
74.0 93.0 77.5
107.0 108.5 114.5 82.5
144 153 182 181 130 135 128 194 184 142 139 135 142 206 818
136 139 237 196 353 130
'110 136
•119 •125 112 134 119 137 140 120 133 119 124 157 !50 160 158 73
152 113
133.6 141.5 134. 1 7, 092
5, 057 2, 191 1,164
882 705 115 93
!58 491
1, 293 6, 518
83.5 96.5 82.0
110.0 108.5 118.5 83.5
155 160 192 184 134 143 130 206 191 164 163 159 142 229 876
!52 164 256 218 381 135 120 135
'122 '126
119 175 132 141 145 126 148 122 126 162 157 164 169
66 165 121
I
137.0 I 146.0 137.9 7, 937
5, 242 2, 307 1, 200
903 728 104 93
159 1,114
1, 329 7, 334
86.0 96.0 81.0
110.0 107.5 117.5 90.0
160 165 1Y8 184 140 150 135 214 187 172 174 163 149 244 930
161 164 230 233 428 138
'130 138
•120 •122
128 188 121 143 147 128 !54 124 127 192 !55 160 173 66
163 128
13~. 9 147.6 139.2 7, 739
5,168 2, 346 1, 207
906 623 86 90
157 919
1,105 7, 057
99.0 Y8.5 83.5
112.5 107.5 122.5 90.5
159 164 197 185 144 119 142 216 191 166 177 160 96
229 997
135 134 307 233 467 138 131 139
•126 '130
137 181 119 139
'143 129 !54 125 116 !53 !55 162 173 69
157 123
141.1 149. a 140.7 7, 518
5, 263 2,420 I, 218
909 636 80 90
155 463
1, 547 6, 714
123.0 102.0 95.0
109.0 112.5 114.0
87.0
162 167 199 185 151 157 148 224 189 172 181 172 109 221
1,113
120 47
306 236 485 142 122 142
'130 '137
152 167 116 146 150 131 154 128 121 130 154 160 170 50
166 122
143.1 150.1 141.3 8, 280
5,431 2.481 1, 229
910 732 79 89
151 918
1, 691 7, 328
144.5 110.0 99.0
120.0 122.5 129.0 88.5
167 172 206 192 148 156 144 227 192 174 184 166 120 245
1,204
134 74
319 249 560 145 137 148
'129 •132
• 159 P 142 I
119 149 151 134 !52 131 125 131 151 156 168
321 169 132
145.4 152.6 143 .• 5 8, 508
5, 592 2, 539 1, 2.51
927 795 80 89
152 855
l, 820 7, 435
161.0 111.5 101.5 121.0 124.5 128.0 92.(1
•168 173 210 191 145 159 138 231 185 176 185 173 117 269
1, 290
146 110 335 278 634 143 137 !53 127 125
•143 •115
134 !51 155 135 153 132 131 134
~~~ I 10 164 133
146.5 153.7 144.5 8,071
5, 555 2, 505 1, 245
924 802 79 90
152 549
1, 725 7,109
137.5 112.5 101.5 123.0 131.5 122.5 106.5
167 173 209 191 134 154 124 229 190 167 171 170 120 280
1,340
142 123 338 264 645
•144 118 151 123
•116 •139 • 99 152 152 !59 136 !53 134 138
(') !56 167 179 15
166 134
154.7 161.5 150.3 9,397
5,830 2, 550 1,400
951 842
87 92
!59 1, 583
1, 733 8,456
128.5 134.0 124.5 143.0 131.5 153. 5 132.0
163 •171 211 196 128 155 113 241 192 145 153 154 80
275 (I)
120 85
(1) (1) (1)
137 10'> 153
•116 •110 •130 •98 165 146 !53
'138 •160 134 131
(1) 154 !55 178
(1) •178
110
'155. 7 '163. 2 •152.0 •8,424
•5, 665 •2,533
(•) (•) (•)
77 94
174 •820
'!, 671 '7, 580
110.0 131.5 119.0 143.0 124.5 154.0 143.5
165 172 215 191 122 142 122 248
'192 137 137 165 68
302 (')
'118 75
(1) (1) (')
137 112 !53 124 119
•124 • 99 173 150 !58 132 161 128 125
(1) 158 169 180
(1) 161 126
I Included In total and group indexes but not available for publication separately.
•156. 9 '166. 0 •153. 9 •7, 987
5, 731 •2, 609 (•) (•) (•)
72 95
173 •437
'1, 551 •7, 259
r 90.5 '127.0
105.5 '146. 5
132.0 '156. 0
144.5
'166 '174 •219
193 '128 '146 '118 '255
191 131 132 164 47
'308 (')
•113 46
(1) (1)) ('
138 117
'158 '131
126 '123 •110
135 152 159 129 161 124
'126 (') '157
174 174
(1) !55 121
•Revised. • Preliminary. d'Formerly designated as "automobiles." • Publication of data discontinued to avoid disclosure of military payrolls. t Revised series. Earlier data on income payments revised beginning 1929 will appear in a subsequent issue. For Industrial production series, see note marked with a
"t" on p. 8-2. •New series. See note marked with a "t" on p. S-2. tRevis!ons appear in the September 1941 Survey, see note marked with a"!" on p .S-2.
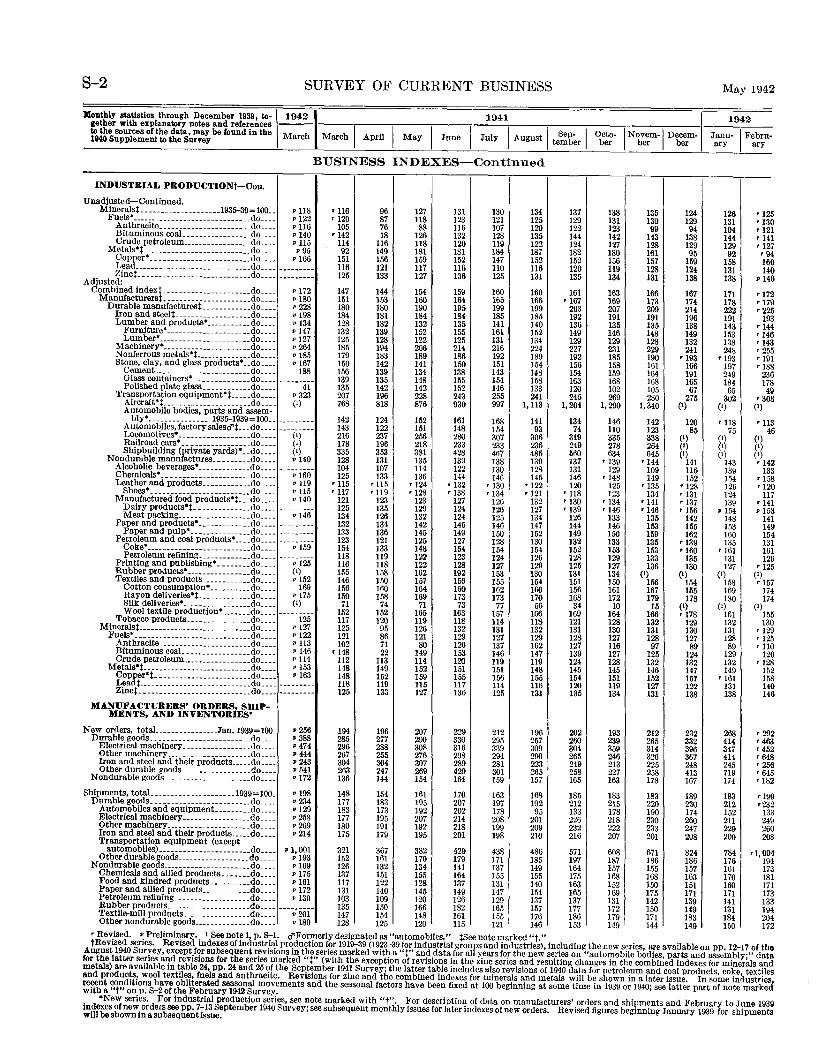
S-2 SURVEY OF CURRENT BUSINESS May 1942
Monthly statistics through December 1939, to-~19421 1941 I 1942 gether with explanatory notes and references ---l----,----,---...,---.-_;.----,----,-----.
1
-----,-----,
1
,-- ----,---
tothesourcesofthedata,maybefoundinthe March March I April I May I June I July I August I Sep- Octo-~Nobveerm- Debceerm- Janu-~Febru-1940 Supplement to the Surve;r tember ber ary ary
BUSINESS INDEXES-Continued
INDUSTRIAL PRODUCTIONt-Con.
Unadjusted-Continued. Mineralst. ___________________ 1935-39= 100 .. p 118 r 116 96 127 131 130 134 Fuels*------------------ ____________ do ____ p 122 r 120 87 118 123 121 125 Anthracite _______________________ do. ___
p 116 105 76 88 116 107 120 Bituminous coaL ________________ do ____ p 140 •142 18 126 132 128 135 Crude petroleum _________________ do ____ p 115 114 116 118 120 119 122 Metals*t-- ___________ ------ ________ do. ___ p 95 92 149 181 181 184 187
£~fJ'_~~~--~ ~:::: :::::::::::::: ::::~g:: :: p 166 151 156 159 152 147 152 116 121 117 116 110 116 Zinct. ___________________________ do ____ ·-------- 125 133 127 136 125 131
Adjusted: Combined indext_ _____________________ do ____
p 172 147 144 154 159 160 160 Mannfactnrerst. ____________________ _do ____ p 180 151 153 160 164 165 166 Durable manufacturest ____________ do ____ p 228 180 180 190 195 199 199 Iron and steelt ___________________ do ____ p 198 184 181 184 184 185 185 Lumber and products• ___________ do ____ p 134 128 132 132 135 141 140 Furniture• _____________________ do ____ p 147 132 139 152 155 161 152 Lumber• _______________________ do ____ p 127 125 128 122 125 131 134 Machinery• ______________________ do ____ p 264 185 194 206 214 216 224 Nonferrous metals*t ______________ do ____ p 185 179 183 189 186 192 189
Stone, clay, and glass products* .. do ____ p 167 150 142 141 150 151 154 Cement _______________________ .do. ___ 188 156 139 134 138 143 148 Glass containers* ______________ do ____ --------- 139 135 148 155 154 158 Polished plate glass ____________ do ____ 41 135 142 142 152 146 133 Transportation equipment*t _____ do ____ p 323 207 196 228 243 255 241
Aircraft*t------------ .. _________ do ____ (') 768 818 876 930 997 1, 113 Automobile bodies, parts and assem-
bly* _______________ 1935-1939=100 __ --------- 142 124 152 161 168 141 Automobiles, factorysalesd't ... do ____ ----ci5 ___ 143 122 151 148 154 93 Locomotives• -------------- ____ do ____ 216 237 256 280 307 306 Railroad cars• _________________ do ____ (!) 178 196 218 233 233 236 Shipbuilding (private yards)* __ do ____ (1) 335 353 381 428 4ti7 485 Nondurable manufactures .• _______ do ____ p 140 128 131 135 139 138 139
Alcoholic beverages*-------- _____ do ____ 104 107 114 122 130 128 Chemicals* ______________________ do ____ • 160 125 133 136 144 146 145 Leather and products ___________ _do ____ p 119 •115 •115 '124 '132 • 130 '122 Shoes• ___ --------------- _______ do ____ • 115 • 117 •119 '128 • 138 •134 '121 Manufactured food products•t .•. do ____ • 140 121 123 123 127 126 132
Dairy products•t--------------do ____ --------- 125 135 129 124 126 127 Meat packing __________________ do ____ p 146 134 126 132 124 125 134 Paper and products• _____________ do ____ --------- 132 134 142 145 146 147 Paper and pulp* _______________ do ____ --------- 133 136 145 149 150 152 Petroleum and coal products• ____ do ____ ----,-159" 123 121 125 127 128 130 Coke* __________________________ do ____ 154 133 148 154 154 154 Petroleum refining _____________ do ____ --------- 118 119 122 123 124 126 Printing and publishing* ________ do ____ • 125 116 118 122 128 127 129 Rubber products• ________________ do ____ (') 155 158 162 192 153 130 Textiles and products ____________ do ____ • 152 146 150 157 156 155 154 Cotton consumption• __________ do ____ 169 156 160 164 160 162 160 Rayon deliveries•t- ____________ do ____ • 175 150 158 169 173 173 170 Silk deliveries• _________________ do ____ (1) 71 74 71 73 77 56 Wool textile production• _______ do ____ 152 152 165 163 157 166 Tobacco products _________________ do ____ 125 117 120 119 118 114 118
Mlneralst----------------------------do ____ • 127 125 95 126 132 131 132 Fuels*_------------------- _________ do ____ • 122 121 86 121 129 127 129 Anthracite _______________________ do ____ •113 102 71 80 126 137 162 Bituminous coaL ________________ do ____ • 146 '148 22 149 153 146 147 Crude petroleum _________________ do ____ • 114 112 113 114 120 119 119 Metals*t-- ------------ _____________ do ____ • 153 148 149 152 151 151 148 Copper•t- _______________________ do ____ p 163 148 152 159 155 156 155 Leadt--- ____ --- __ - ______________ .do. ___ 118 119 115 117 114 116 Zinct. ___________________________ do ____
125 133 127 136 125 131
MANUFACTURERS' ORDERS, SIIIP· MENTS, AND INVENTORIES*
New orders, totaL ______________ Jan. 1939=100. p 256 194 196 207 229 212 196 Durable goods. ________________________ do ____ p 388 285 277 290 330 295 257 Electrical machinery ____ ----- _______ _do ____ • 474 296 288 308 316 339 309 Other machinery _____________________ do ____ p 444 267 255 276 298 294 290 Iron and steel and their products _____ do ____ • 243 304 304 307 289 281 223 Other durable goods __________________ do ____ p 541 263 247 269 429 301 265 Nondurable goods _____________________ _do ____ p 172 136 144 154 164 159 157 Shipments, totaL ___________ - ______ .. 1939=100. p 198 148 154 161 170 163 168 Durable goods. _______________________ _do ____ p 234 177 183 195 207 197 192 Automobiles and equipment _________ do ____ p 129 183 173 192 202 178 95 Electrical machinery--------- ________ do ____ • 258 177 195 207 214 208 201 Other machinery _____________________ do ____ p 269 180 191 192 218 199 209 Iron and steel and their products ____ _do ____ p 214 175 179 195 201 198 210
Transportation equipment (except automobiles) _______________________ do ____ • 1, 001 321 367 382 429 438 486 Other durable goods __________________ do ____ •193 152 161 170 179 171 185 Nondurable goods ______________________ do. ___ p 169 126 132 134 141 137 149 Chemicals and allied products _______ do ____ • 175 137 151 155 164 155 155 Food and kindred products _________ _do ____ • 161 117 122 128 137 131 140 Paper and allied products ____________ do ____ • 172 131 140 145 149 147 154 Petroleum refining ___________________ do____ • 130 103 109 120 126 129 137 Rubber products _____________________ do ____ --------- 135 150 166 182 165 157 Textile-mill products _________________ do____ • 201 147 154 148 161 155 176 Other nondurable oods ______________ do____ • 180 128 125 120 115 121 146 g
137 138 135 124 129 131 130 129 122 123 99 94 144 142 143 138 124 127 128 129 182 180 161 95 152 156 157 159 120 119 128 124 135 134 131 138
161 163 166 167 '167 169 173 174
203 207 209 214 192 191 191 196 136 135 135 138 149 146 148 149 129 129 128 132 227 231 229 241 192 185 190 '193 156 158 161 166 154 159 164 191 163 168 168 165 120 102 105 67 245 269 280 275
1,204 1,290 1,340 (1)
134 146 142 120 74 110 123 85
319 335 338 (1) 249 278 264 (') 560 634 645 (1) 137 '139 '144 141 131 129 109 116 146 '148 149 152 120 125 • 135 '128
•118 123 134 rt31 '130 '134 rJ41 rl37 '139 '146 '146 rJ56
126 133 135 142 144 146 153 155 149 150 159 162 132 133 135 •139 152 153 153 '160 128 129 133 135 125 127 136 130 131 134 (1) (1) 151 150 156 154 156 161 167 155 168 172 179 178 34 10 15 (1)
169 164 166 • 178 121 128 132 129 131 130 131 130 128 127 128 127 127 116 97 89 139 127 125 124 124 128 132 132 145 145 146 147 154 151 152 157 120 119 127 122 135 134 131 138
202 193 212 232 260 239 265 332 304 359 314 396 265 246 326 367 249 213 225 248 258 227 258 413 165 163 178 167
185 183 183 189 212 215 220 230 133 178 190 174 226 218 230 260 232 222 233 247 216 207 201 208
571 608 671 824 197 187 186 186 164 157 155 157 175 168 168 163 163 152 150 151 165 169 175 171 137 131 142 139 177 172 150 149 186 179 171 183 153 149 144 149
126 131 104 144 129 92
158 131 138
171 178 222 191 143 153 138 248
'193 197 249 184 65
302 (')
•118 75
(') (!) (')
143 139 154 126 124 139
• 154 148 153 160 135
• 161 131 127
(') 158 169 180
(1) 161 132 131 128 89
129 132 149
rJ61 131 138
268 414 347 414 245 719 174
183 212 152 211 229 200
784 176 161 170 160 171 141 131 184 150
'12 5 0 1 1 7 4 0 0 6
'13 •12 '14 '12 '9 16 14
•14
•17 2 9
25 3
'17 •2
19 •14 4
6 3 5 1 8 6 8 9 8
•14 '14 '25 • 19 rt8
23 17 4
'30 (')
•11 3 46
(!) (!) (') '1 42
3 58 20 17 41 53 41 49 54 31 61 26 25
13 • 1 '1
1 ri • 1
1 1 1 1 1 1
'1 (1) '1 57
74 74
1 1
(1) 1 1
• 1
55 30 29 25 10 20 28 52 58 40 46
• 1 '1
1 '1
1 1 1 1
' 292 63 52
•4 •4 ' 648 •2 56
645 82
' rJ
•1 •2
99 32 33 49 60 08
1 2 2 2
rl,O 04 94 73 81 71 73 33 94 04 72
1 1 1 1 1 1 1 2 1
• Revised. • Preliminary. t See note 1, p. S-1. a' Formerly designated as "automobiles." tSee note marked "f." tRevised series. Revised indexes of Industrial production for 1919-39 (1923-39 for industrial groups and industries), including the new series, are available on pp. 12-17 of the
August 1940 Survey, except for subsequent revisions in the series marked with a 'T' and data for all years for the new series on "automobile bodies, parts and assembly;" data for the latter series and revisions for the series marked "t" (with the exception of revisions in the zinc series and resulting changes in the combined indexes for minerals and metals) are available in table 24, pp. 24 and 25 of the September 1941 Survey; the latter table includes also revisions of 1940 data for petroleum and coal products, coke, textiles and products, wool textiles, fuels and anthracite. Revisions for zinc and the combined indexes for minerals and metals will be shown in a later issue. In some industries, recent conditions have obliterated seasonal movements and the seasonal factors have been fixed at 100 beginning at some time in 1939 or 1940; see latter part of note marked with a "t" on p. S-2 of the February 1942 Survey.
*New series. For industrial production series, see note marked with "f". For description of data on manufacturers' orders and shipments and February to June 1939 Indexes of new orders see pp. 7-13 September 1940 Survey; see subsequent monthly issues for later indexes of new orders. Revised figures beginning January 1939 for shipments will be shown in a subsequent Issue.
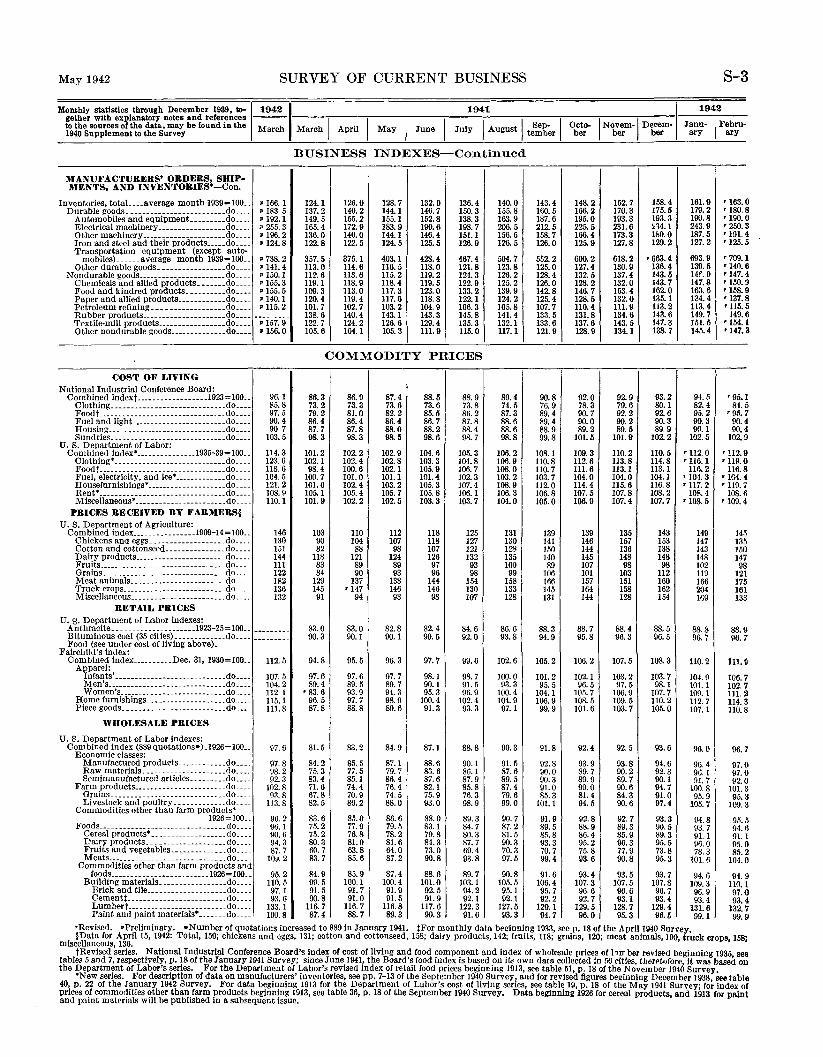
May 1942 SURVEY OF CURRENT BUSINESS
Monthly statistics through December 1939, to-~19421 1941 I gether with explanatory notes and references --- '----;-~---,~-----,,----...,.------,.---.----.---.
1---,,---
tothesourcesofthedata,maybefoundinthe March March April May I June I July I August I Sep- I Octo- N'!_v.erm- Debceerm-1940 Supplement to the Survey tember ber ""
BUSINESS INDEXES-Continued
MANUFACTURERS' ORDERS, SHIP• MENTS, AND INVENTORIES*-Con.
Inventories, totaL ... average month 1939=100 .. • 166. 1 124.1 126.0 128.7 132.0 136.4 140.0 143.4 148.2 152.7 158.4 Durable goods. ------------------------do.--- • 183. 5 137.2 140.2 144.1 146.7 150.3 155.8 160.5 166.2 170.3 175.5
Automobiles and equipment. ........ do .... • 192.1 149.5 155.2 155.1 152.8 138.3 163.9 187.6 195.0 193.3 193.3 Electrical machinery _________ ---- ____ do.--. • 255.3 165.4 172.9 183.9 190.6 198.7 206.5 212.5 225.5 231.6 :.•14.1 Other machinery _____________________ do ____ • 196.2 136.0 140.0 144.1 146.4 151.1 156.5 158.7 166.4 173.3 lbO.O Iron and steel and their products _____ do ____ • 124.8 122.8 122.5 124.5 125.5 126.9 126.5 126.0 125.9 127.8 129.2 Transportation equipment (except auto-
•663.4 mobiles)_ _____ average month 1939=100 .. • 738.2 357.5 375.1 403.1 428.4 467.4 504.7 552.2 600.2 618.2 Other durable goods _________________ do ____ •141. 4 113.0 114.6 116.5 118.0 121.8 123.8 125.0 127.4 130.9 136.4
Nondurable goods ______________________ do ____ • 150.1 112.6 113.6 115.2 119.2 124.3 126.2 128.4 132.5 137.4 143.5 Chemicals and allied products _______ do ____ • 155.3 119.1 118.9 118.4 119.5 122.9 125.2 126.0 128.2 132.0 143.7 Food and kindred products __________ do ____ •155. 5 109.3 113.0 117.3 123.0 133.2 139.9 142.8 146.7 153.4 162.0 Paper and allied products ____________ do .••. >140.1 120.4 119.4 117.6 118.8 122.1 124.2 125.4 128.5 132.0 135.1 Petroleum refining __________________ do ____ • 115.2 101.7 102.7 103.2 104.9 106.3 105.8 107.7 110.4 111.9 113.2 Rubber products .. ___________ --- _____ do ____ 138.6 140.4 143.1 143.3 145.8 141.4 133.5 131.8 134.6 143.6 Textile-mill products _________________ do ____ • 157.9 122.7 124.2 126.6 129.4 135.3 132.1 133.6 137.6 143.5 147.3 Other nondurable goods ______________ do ____ • 156.0 105.6 104.1 105.3 111.9 115.0 117.1 121.9 128.9 134.1 138.7
COMMODITY PRICES
' COST OF LIVING National Industrial Conference Board:
Combined indext _________ ------- _ .1923= 100. _ 96.1 86.3 86.9 87.4 88.5 88.9 89.4 90.8 92.0 92.9 93.2 Clotbing _____________________________ do ____ 85.8 73.2 73.3 73.6 73.6 73.8 74.5 76.9 78.3 79.6 80.1 Food t ________________ ----------.----.do.- .. 97.5 79.2 81.0 82.2 85.5 86.2 87.3 89.4 90.7 92.2 92.6 Fuel and light__ ______________________ do ____ 90.4 86.4 86.4 86.4 86.7 87.8 88.6 89.4 90.0 90.2 90.3 Housing __________ ------- _____________ do .. __ 90 7 87.7 87.8 88.0 88.2 88.4 88.6 88.9 89.2 89.5 89.9 Sundries. ____________________________ do .. __ 103.5 98.3 98.3 98.5 98.6 98.7 98.8 99.8 101.5 101.9 102.2
U. S. Department of Labor: Combined index*---------------1935-39=100 .. 114.3 101.2 102.2 102.9 104.6 105.3 106.2 108.1 109.3 110.2 110.5
Clothing• ____________ ---- ___ ---- ___ . .do._-- 123.6 102.1 102.4 102.8 103.3 104.8 106.9 110.8 112.6 113.8 114.8 Food t ____________ ----- ___ -__ -- --_-- . .do.--_ 118.6 98.4 100.6 102.1 105.9 106.7 108.0 110.7 111.6 113.1 113.1 Fuel, electricity, and ice• _____________ do ____ 104.5 100.7 101.0 101.1 101.4 102.3 103.2 103.7 104.0 104.0 104.1 Housefurnishings• ___________ ----_-_ . .do._-_ 121.2 101.6 102.4 103.2 105.3 107.4 108.9 112.0 114.4 115.6 116.8 Rent• ________________ - ____ ------- ____ do.--_ 108.9 105.1 105.4 105.7 105.8 106.1 106.3 106.8 107.5 107.8 108.2 Miscellaneous• _______ - ___ . ------ ___ . .do. ___ 110.1 101.9 102.2 102.5 103.3 103.7 104.0 105.0 106.9 107.4 107.7
PRICES RECEIVED BY FARMERS§ U.S. Department of Agriculture:
Combined index _______________ .IQ09-14= 100. _ 146 103 110 112 118 125 131 139 139 135 143 Chickens and eggs ___________________ do ____ 130 90 104 107 118 127 130 141 146 157 153 Cotton and cottonseed _______________ do ____ 1.51 82 88 98 107 121 128 150 144 136 138 Dairy products _______________________ do ____ 144 118 121 124 126 132 135 140 145 148 148 Fruits ______ .. _______________________ _cto ____ 111 83 89 89 97 93 100 89 107 98 98 Grains. _______________ -------------- .do. ___ 122 84 90 93 96 98 99 106 101 103 112 Meat animals ___________ ------ ______ .do. ___ 182 129 137 138 144 154 158 166 157 151 160 Truck crops _________________________ .do. __ . 136 145 '147 146 146 130 133 145 164 158 162 Miscellaneous ________________________ do ____ 132 91 94 93 98 107 128 131 144 128 154
RETAIL PRICES U. s. Department of Labor indexes:
Anthracite. ____________________ 1923-25=100 .. --------- 83.0 83.0 82.8 82.4 84.6 86.6 88.3 88.7 88.4 88.5 Bituminous coal (35 cities) _____________ do ____ Food (see under cost of living above).
Fairchild's index:
90.3 90.1 90.1 90.5 92.0 93.8 94.9 95.8 96.3 96.5
Combined index __________ Dec. 31, 1930=100 .. 112 . .'5 94.8 95.5 96.3 97.7 99.6 102.6 105.2 106.2 107.5 108.3 AYEr:~~~· ____________________________ do ____ 107.5 97.6 97.6 97.7 98.1 98.7 100.0 101.2 102.1 103.2 103.7 Men's ______________________________ do ____ 104.2 89.4 89.5 89.7 90.1 91.5 93.3 95.5 96.5 97.5 98.1 Women's. ________________________ . .do .. __ 112.1 '83. 6 93.9 94.3 95.3 96.9 100.4 104.1 105.7 106.9 107.7 Home furnishings. _________________ .. do. ___ 115. 1 96.5 97.7 98.9 100.4 102.4 104.9 106.9 108.5 109.5 110.2 Piece goods. ________ ---------------_ .do.--- 111.8 87.8 88.8 89.6 91.3 93.3 97.1 99.9 101.6 103.7 105.0
WHOLESALE PRICES
U. S. Department of Labor indexes: Combined index (889quotations•).1926=100 .. £7.6 81.5 83.2 84.9 87.1 88.8 90.3 91.8 92.4 92.5 93.6
Economic classes: Manufactured products ____________ do ____ 97.8 84.2 85.5 87.1 88.6 90.1 91.5 92.8 93.9 93.8 94.6 Raw materials. _________ ------- ____ do ____ 98.2 75.3 77.5 79.7 83.6 86.1 87.6 90.0 89.7 90.2 92.3 Semimanufactured articles .. ----- .. do ___ . 92.3 83.4 85.1 86.4 87.6 87.9 89.5 90.3 89.9 89.7 90.1 Farm products ••• ___________________ .do. ___ 102.8 71.6 74.4 76.4 82.1 85.8 87.4 91.0 90.0 90.6 94.7 Grains ____________________________ .do. __ . 93.8 67.8 70.9 74.5 75.9 76.3 79.6 85.3 81.4 84.3 91.0 Livestock and poultry _____________ do ____ 113.8 82.5 86.2 88.0 93.0 98.9 99.0 101.1 94.5 90.6 97.4
Commodities other than farm products• 1926=100 .. 96.2 83.6 85.0 86.6 88.0 89.3 90.7 91.9 92.8 92.7 93.3 Foods ______________________ • ________ .do. ___ 96.1 75.2 77.9 79.5 83.1 84.7 87.2 89.5 88.9 89.3 90.5
Cereal products• _________ ---------.do ____ 90.6 75.2 76.8 78.2 79.8 80.3 81.5 85.8 86.4 85.9 89.3 Dairy products. ___________________ do ____ ~4. 3 80.3 81.0 81.6 84.3 87.7 90.3 93.3 95.2 96.3 95.5
Fruits and vegetables ______________ do .... 87.7 60.7 63.8 64.0 73.0 69.4 70.3 70.7 75.8 77.9 73.8 Meats _______________ ----------- __ .. do .. __ 10;. 2 83.7 85.6 87.2 90.8
Commodities other than farm products and 93.8 97.5 99.4 93.6 90.8 95.3
foods ________ • __ ------------- .1926= 100. _ 95.2 84.9 85.9 87.4 88.6 89.7 90.8 91.6 93.4 93.5 93.7 Building materials.----------- _____ do ____ 110.5 99.5 100.1 100.4 101.0 103.1 105.5 106.4 107.3 107.5 107.8 Brick and tile ____________________ do ____ 97.1 91.5 91.7 91.9 92.5 94.2 95.1 95.7 96.6 96.6 96.7
Cementt-------------------------do ____ 93.6 90.8 91.0 91.5 91.9 92.1 92.1 92.2 92.7 93.1 93.4 Lumbert------ __ --------- ______ .. do ____ 133. 1 116.7 116.7 116.8 117.6 122.3 127.5 129.1 129.5 128.7 129.4 Paint and paint materials* _______ do ____ 100.8 87.4 88.7 89.3 90.3 91.6 93.3 94.7 96.0 95.3 96.5
S-3
1942
Janu- I Febru-ary ary
161.9 179.2 190.8 243.9 187.5 127.2
693.9 139.5 14f. 9 147.8 163.6 134.4 113.4 149.7 151.5 145.4
94.5 82.4 95.2 90.3 90.1
102.5
'112. 0 '116. 1
116.2 • 104.3 '117. 2
108.4 '108.5
149 147 143 148 102 119 166 204 IC9
88.8 96.7
110.2
104.9 101.1 10~.1 112.7 107.1
96.0
96.4 96. 1 91.7
100.8 95.9
105.7
94.8 93.7 91.1 96.0 78.3
101.6
94.6 109.3 96.9 93.4
131.6 99.1
'163.0 '180.8 '190.0 '250. 3 '191.4 '125.5
'709.1 '140.6 '147.4 '150. 9 '158.9 '137.8 '115. 5
149.6 '154.1 '147. 3
'95.1 84.
•95. 5 7
90.4 90.4
102.9
'112.9 '119. 0
116.8 '104.4 '119. 7
108.6 ' 109.4
145 135 150 147 98
121 175 161 133
88.9 96.7
111.9
106.7 102.7 Ill. 2 114.3 110.8
96.7
97. 97.
0 0
92.0 101. 95.
109.
95. 94.
3 3 3
5 6
91. 1 95. 85.
104.
94.
0 2 0
110.1 9
0 4 7 9
97. 93.
132. 99.
•Revised. •Preliminary. •Number of quotations increased to 889 in January 1941. tFor monthly data beginning 1933, seep. 18 of the April1940 Survey. §Data for April 15, 1942: Total, 150; chickens and eggs, 131; cotton and cottonseed, 158; dairy products, 142; fruits, 118; grains, 120; meat animals, 190; truck crops 158'
miscellaneous, 136. ' ' tRevised series. National Industrial Conference Board's index of cost of living and food component and index of wholesale prices of lnr ber re•lsed beginning 1935 see
tables 5 and 7, respectively, p. 18 ofthe January 1941 Survey; since June 1941, the Board's food index is based on its own data collected Jn 56 cities, theretofore it was based on the Department of Labor's ~er!es. For the Department of Labor's revised index of retail food prices beginring 1913, see table 51, p. 18 of the November 1940 Survey.
*New series. For descrrptiOn of data on manufacturers' inventories, see pp. 7-13 of the September 1940 Survey, and for re-rlsed figures be~innlng December 1938 see table 40, p. 22 of the January 1942 Survey. For data beginning 1913 for the Department of Labor's cost of living series, see table 19, p. 18 of the May !941 Survey· for index of prices of commodities other than farm products beginning 1913, see table 36, p. 18 of the September 1940 Survey. Data beginning 1926 for cereal products and tina for paint and paint materials will be published in a subsequent issue. '
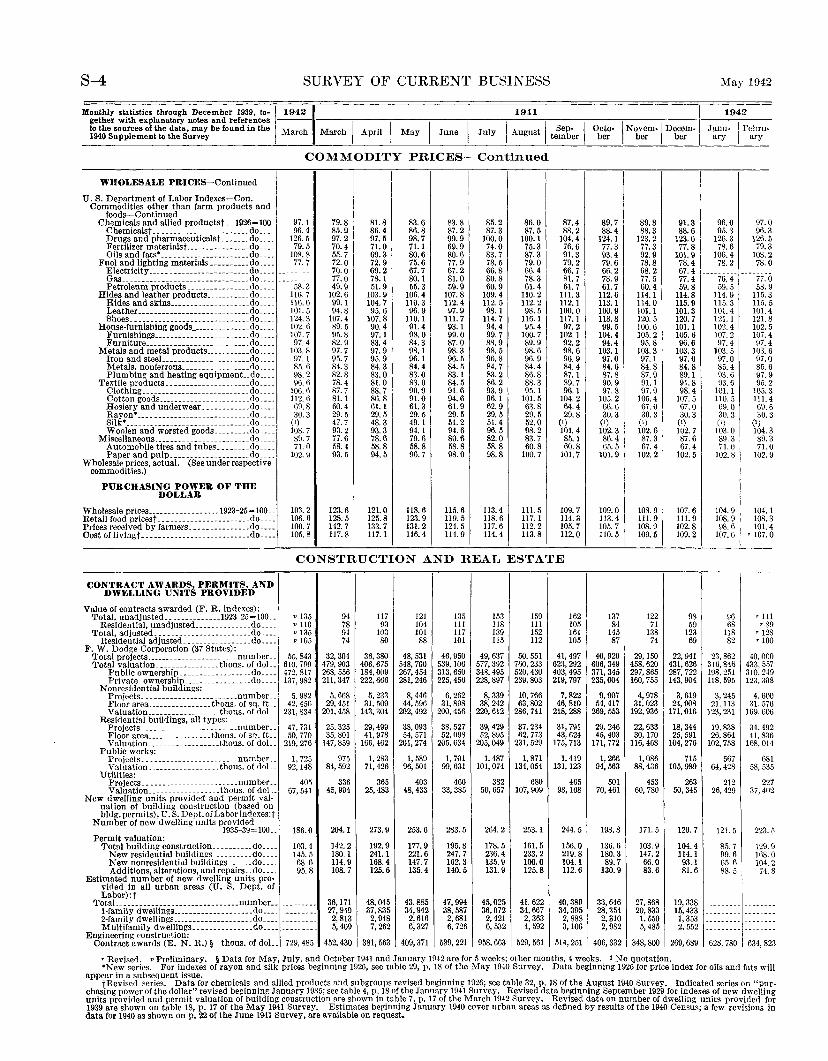
S-4 SURVEY OF CURRENT BUSINESS May 1942
Monthly statistics through December 1939, to-1 19421 1941 I 1942 gether with explanatory notes and references --- ---,,---.,-------cc----,---,----,-----,-----.---...,---------,---to the sources of the data, may be found in the I March March I April I May I June I July I August I Sep- I Octo- I Novem-1 Decem- Janu- I Febru-1940 Supplement to the Survey tember ber ber ber ary J ary
COMMODITY PRICES-Continued
WHOLESALE PRICES-Continued
I I U.S. Department of Labor Indexes-Con. Commodities other than farm products and
foods-Continued Chemicals and allied productst •. 1926= 100 97.1 79.8 81.8 83.6 83.8 85.2 86.0 87.4
Chemicalst. __ ------------------- .. do .... 96.4 85.9 86.4 86.8 87.2 87.3 87.5 88.2 Drugs and pharmaceuticalst ..•..•. do .... 126.5 97.2 97.5 98.7 99.9 100.0 100.1 104.4 Fertilizer materialst ----------------do .... 79.5 70.4 71.0 71.1 69.9 74.0 75.3 76.6 Oils and fats• _____ -----------------do .... 108.8 5ii. 7 69.3 80.6 80.6 83.7 87.3 91.3
Fuel and lighting materials .......... do .... 77.7 72.0 72.9 75.6 77.9 78.5 79.0 79.2 Electricity ____ . ______ --------------do .... -- ----- 70.0 69.2 67.7 67.2 66.8 66.4 66.7 Gas. _______________ ------------- __ _do ____ 77.0 78.1 80.1 81.0 80.8 78.3 81.7 Petroleum products_.---------- .... do .. __ 58.3 49.9 51.9 55.3 59.9 60.9 61.4 61.7
Hides and leather products ........... do .... 116. 7 102.6 103.9 106.4 107.8 109.4 110.2 111.3 Hides and skins ____________________ do .... 116.6 99.1 104.7 110.3 112.4 112.5 112.2 112.1 Leather ____ . __ • _______ ... _ ..... _ ... do .... 101.5 94.8 95.6 96.9 97.9 98.1 98.5 100.0 Shoes .. __________ ------------------do .... 124.3 107.4 107.8 110.1 111.7 114.7 116.1 117.1
House-furnishing goods_ .............. do .... 102. 6 89.5 90.4 91.4 93.1 94.4 95.4 97.2 Furnishings .... ___ . ____ .... __ ...... do .... 107.7 95.8 97.1 98.0 99.0 99.7 100.7 102. 1 Furniture .. ___ . _______ ... __ ......•. do .... 97.4 82.9 83.4 84.3 87.0 88.9 89.9 92.2
Metals and metal products •........•. do .... 103.8 97.7 97.9 98.1 98.3 98.5 98.6 98.6 Iron and steeL _____________________ do .... 97.1 95.7 95.9 96.1 96.5 96.8 96.9 96.9 Metals. nonferrous. ________ .. ______ do .... 85.6 84.3 84.3 84.4 84.5 84.7 84.4 84.4 Plumbing and heating equipment..do .... 98.2 82.8 83.0 83.0 83.1 83.2 86.8 87. 1
Textile products._-------- _______ .... do. ___ 96.6 78.4 81.0 83.0 84.5 86.2 88.3 89.7 Clothing_._. __ ._. _________ . _____ ... do ____ 106.6 87.7 88.7 90.9 91.6 93.9 95. 1 96.1 Cotton goods ____________________ ... do .... 112.6 81. 1 86.8 91.0 94.6 96.1 101.5 104.2 Hosiery and uuderwear ........... .do .... 69.8 60.4 61. 1 61.3 61.9 62.9 63.8 64.4 Rayon• ___ . ------------ ___________ .do .... 30.3 29.5 29.5 29.5 29.5 29.5 29.5 29.8 Silk* ____ . __ ------------- ___________ do ____ (!) 47.7 48.3 49. 1 51.2 51.4 52.0 (1) Woolen and worsted goods ........ .do .... 108.7 93.2 93.3 94. 1 94.6 96.5 98.2 101. 4
Miscellaneous. ______ ._. ____ . _____ . ___ do. ___ 89.7 77.6 78.6 79.6 80.6 82.0 83.7 85.1 Automobile tires and tubes ________ do .... 71.0 58.4 58.8 58.8 58.8 58.8 60.8 60.8 Paper and pulp ____________________ do .... 102.9 93.5 94.5 96.7 98.0 98.8 100.7 101.7
Wholesale prices, actual. (See under respective commodities.)
PURCHASING POWER OF THE DOLLAR
Wholesale prices ___________ ----- .. 1923-25= 100 .. 103.2 123.6 121.0 118.6 115.6 113.4 111.5 109.7 Retail food pricest .. ___ .. -------------- .. do .... 106.6 128.5 125.8 123.9 119.5 118.6 117. 1 114.3 Prices received by farmers _______________ do .... 100.7 142.7 133.7 131.2 124.5 117.6 112.2 105.7 Cost of livingt ... _______________________ .do .... 105.8 117.8 117.1 116.4 114.9 114.4 113.8 112.0
CONSTRUCTION AND REAT-' ESTATE
CONTRACT AWARDS, PERMITS, AND DWELLING UNITS PROVIDED
Value of contracts awarded (F. R. indexes): Total, unadjusted .... __________ 1923-25= 100 .. p 135 94 117 121 135 153 159 162
Residential, unadjusted ...... _______ .do .... p 110 78 93 104 111 118 111 105 Total, adjusted. __ . ______ .. ---- ........ do .... p 135 94 103 101 117 139 152 161
Residential adjusted. ________________ do .... p 105 74 80 88 101 115 112 105 F. W. Dodge Corporation (37 States):
32,304 36,380 46,950 49,637 50. 551 41,497 Total projects ______________________ .number __ 55,843 48,531 Total valuation ________________ thous. of doL. 610,799 479,903 406,675 548,700 539, 106 577,392 760,233 623,292
Public ownership ________ --------- .do. ___ 472, 817 268, 556 184,009 267,454 313,650 34~. 495 520, 430 403,495 Private ownership ________________ .do .. __ 137, 982 211,347 222,666 281,246 225,456 228,897 239,803 219,797
Nonresidential buildings: 7,822 Projects._-------- ________ ...... number __ 5. 982 5, 668 5, 233 8, 446 6, 262 8, 339 10,766
Floor area ________________ thous. of sq. ft._ 42. 456 29,451 31,509 44.596 31,898 38,242 63,802 46,810 Valuation __________________ thous. of dol.. 231,834 201,458 143,304 202,492 200,456 220,612 286,741 218,288
Residential buildings, all types: 38,093 38,527 39,429 37,234 31, 791 Projects ... ---------- __________ .number_. 47,731 25,325 29,499
Floor area ________________ thous. of sq. ft.. 50,770 35,801 41,978 54, 571 52,098 52,895 62, 773 43,624 Valuation __________________ thous. of doL. 219,276 147,859 166, 462 201,274 205,634 205,049 231,529 175,713
Public works: Projects ... _________________ .... number __ 1, 725 975 1, 283 1, 589 1, 701 1, 487 1,871 1, 419 Valuation. ________ . _______ .thous. of doL. 92, 148 84,592 71,426 96,501 99,631 101, 074 134,054 131, 123
Utilities: Projects._.----- ____________ .... number __ 40.5 336 365 403 460 382 680 465 Valuation __________________ thous. of dol... 67,541 45,994 25,483 48,433 33,385 50,657 107,909 98,168
New dwelling units provided and permit val-uation of building construction (based on bldg. permits), U.S. Dept.ofLaborindexes:t
Number of new dwelling units provided 1935-39 = 100-- 186.0 204.1 273.9 253.6 283.5 264.2 253.1 244.5
Permit valuation: Total building construction __________ do .... 103.4 142.2 192.9 177.9 195.8 178.5 161.5 156.0
New residential buildings __________ do ____ 145 .. 5 180.1 241.1 221.6 247.7 236.4 233.2 219.8 New nonresidential buildings __ ._ .. do .. _. 68.6 114.9 168.4 147.7 162.3 135.9 100.0 104.1 Additions, alterations, and repairs .. do ____
Estimated number of new dwelling units pro-95.8 108.7 125.6 135.4 140.5 131.9 125.8 112.6
vitled in all urban areas (U. S. Dept. of Labor):t
36, 171 48,045 43.885 47,994 45,025 41.622 40,389 TotaL ______ . _____ .. ___ . _____ ._._. __ number __ ---------!-family dwellings .. __________________ do ____ --------- 27,949 37,835 34,942 38,587 36,072 34,667 34,395 2-family dwellings .... ________________ do .... 2,813 2, 948 2,616 2,681 2,421 2, 363 2, 888 Multifamily dwellings .. _____________ do ...• 5,409 7,262 6, 327 6, 726 6, 532 4, 592 3,106
Engineering construction: Contract awards (E. N. R.) § thous. of doL 729,485 452,430 381, 563 409,371 589,221 958,663 529,561 514,251
89.7 89.8 91.3 88:4 88.3 88.6
124. 1 123.2 123.0 77.3 77.3 77.8 93.4 92.9 101.9 79.6 78.8 78.4 66.2 68.2 67.4 78.9 77.5 77.4 61.7 60.4 59.8
112.6 114.1 114.8 113.1 114.0 115.9 100.9 101.1 101.3 118.8 120.5 120.7 99.5 100.6 101.1
104.4 105.2 105.6 94.4 95.8 96.6
103.1 103.3 103.3 97.0 97. 1 97.0 84.6 84.8 84.8 87.8 87.9 89.1 90.9 91. 1 91.8 97.8 97.9 98.4
105. 2 105.4 107.5 66.6 67.0 67.0 30.3 30.3 30.3
(1) (1) (1) 102.3 102.6 102.7 86.4 87.3 87.6 65.5 67.4 67.4
101.9 102. 2 102.5
109.0 108.9 107.6 113.4 111.9 111.9 105.7 108.9 102.8 110.5 109.5 109.2
I
137 122 98 84 71 59
145 138 123 87 74 69
40,920 29,150 22,941 606,349 458,620 431,626 371,345 297,865 287, 722 235,004 160,755 143,904
9, 907 4, 978 3, 619 54,417 31,023 24,908
269,553 192,936 171,016
29, 246 22,633 18,344 45,403 30,170 25,591
171,772 116,468 104,276
1, 266 1, 086 715 94,563 88,436 105,989
501 453 263 70, 461 60, 780 50,345
198.8 171. 5 120.7
136.6 103.9 104.4 180.3 147.2 114.1 89.7 66.0 93.1
130.9 83.6 81.6
33,646 27,868 19,338 28,354 20,833 15, 433 2,310 I. 550 1, 353 2, 982 5, 485 2, 552
406,332 348,800 269,689
96.0 95.3
126.3 78.6
106.4 78.2
---------76.4 59.5
114.9 115.3 101.4 121. I 102.4 107.2 97.4
103.5 97.0 85.4 93.6 93.6
101. 1 110. 5 69.0 30.3 (1)
103.0 89.3 71.0
102.8
104.9 108.9 98.6
107.6
96 68
118 82
23,862 316,846 198, 251 118, 595
3, 245 21, 113
123, 231
19,838 26,864
102,758
567 64,428
212 26,429
121.5
85.7 99.6 6.5.6 88.5
------------------------------------628, 780
97.0 96.3
126.5 79.3
108.2 78.0
--------7i.O 58.9
115.3 115.5 101.4 121.8 102.5 107.4 97.4
103.6 97.0 85.6 97.9 95.2
105.3 111.4 69.6 30.3
(1) 104.3 89.3 71.0
102.9
104.1 108.3 101.4
'107. 0
' Ill '89
'128 '100
40,000 433, 557 310.249 123,308
4, 600 31.576
169, 606
34,492 41,836
168,014
681 58, 535
22 37,40
223.
129. 168. 104.
74.
9 0 2 8
----------------------------634, 82
• Revised. • Preliminary. §Data for May, July, and October 1941 and January 1942 are for 5 weeks; other months, 4 weeks. I No quotation. *New series. For indexes of rayon and silk prices beginning 1926, sec table 29, p. 18 of the May 1940 Survey. Data beginning 1926 for price index for oils and fats will
appear in a subsequent issue. tRevised series. Data for chemicals and allied products and subgroups revised beginning 1926; see table 32, p. 18 of the August 1940 Survey. Indicated series on "pur
chasing power of the dollar" revised beginning January 19%; see table 4, p. 18 of the January 1941 Survey. Revised data beginning September 1929 for indexes of new dwelling units provided and permit valuation of building construction are shown in table 7, p. 17 of the March 1942 Survey. Revised data on number of dwelling units provided for 1939 are shown on table 18, p. 17 of the May 1941 Survey. Estimates beginning January 1940 cover urban areas as defined by results o! the 1940 Census; a few revisions in data for 1940 as shown on p. 22 of the June 1941 Survey, are available on request,
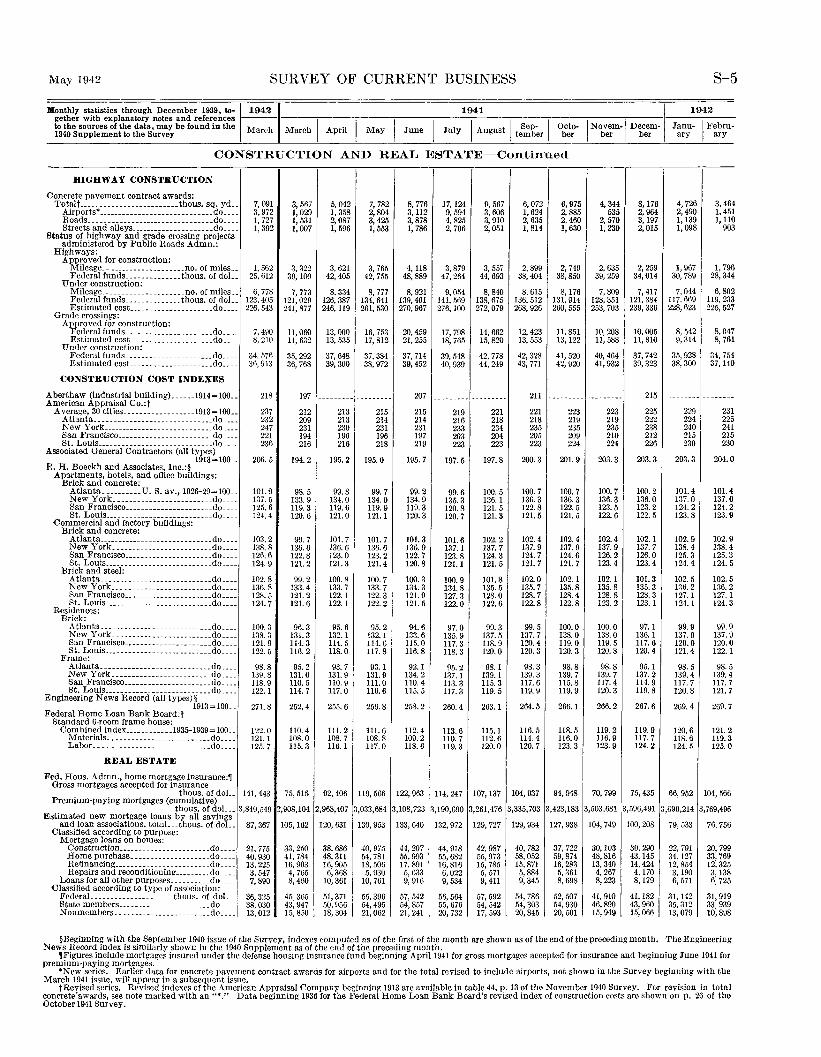
May 1942 SURVEY OF CURRENT BUSINESS S-5
gether with explanatory notes and references ---1-----,----,----,----.,----,-----,----,----.,------,--- ---.,---Monthly statistics through December 1939, to-~19421 1941 I 1942
~~~~~~~~~:~:~ t~~t~~~"!r be found in the March March I April I May I June I July I August I te~~~r I o£it I Nbe~m-1 D'bc:rm- J~~t I F~~~u-CONSTRUCTION AND REAL ESTATE-Continued
HIGHWAY CONSTRUCTION
Concrete pavement contract awards: Totalt-------------------------thous. sq. yd __
Airports*------- _____________________ .do. ___ Roads. ____ • ______ ------- ____________ .do. ___ Streets and alleys _____________________ do ____
Status of highway and grade crossing projects administered by Public Roads Admn.:
Highways: Approved for construction:
Mileage _____________________ no. of miles .. Federal funds ______________ thous. of doL.
Under construction: Mileage _____________________ no. of miles .. Federal funds ______________ thous. of doL. Estimated cost. .. -------·----------do ....
Grade crossings: Approved for construction:
Federal funds. _____ ------------- __ .do .. __ Estimated cost_ ________ .--------- .. do. ___
Under construction: Federal funds ______________________ do ... _ Estimated cost_ ____________________ do ....
CONSTRUCTION COST INDEXES
A berthaw (industrial building) ______ 1914=100 .. American Appraisal Co.:t
Average, 30 cities __________________ 1913= 100 .. Atlanta .. _ ---------------------------do ____ New York ____________________________ do .... San Francisco ________________________ do ____ St. Louis ____________________________ .do ....
A ssociated General Contractors (all types) 1913=100 ..
E. H. Boeckh and Associates, Inc.:§
E
F
Apartments, hotels, and office buildings: Brick and concrete:
Atlanta.---------U.S. av., 1926-29=100 .. New York _________________________ do ____ San Francisco .... _________________ .do. ___ St. Louis ___________________________ do .. __
Commercial aud factory buildings: Brick and concrete: Atlanta _____________________________ do ____
New York _________________________ do ____ San Francisco ______________________ do ... _ St. Louis ___________________________ do·---
Brick and steel: Atlanta. _________ . _______________ .. do ____ New York _________________________ do ____ San Francisco ______________________ do ____ St. Louis _________ ---------- ____ .... do ....
'Residences: Brick:
Atlanta.-------------- _____________ do. ___ New York _________________________ do ____ San Francisco ______________________ do. ___ St. Louis ___________________________ do .. __
Frame: Atlanta ___________________________ .do ____ New York _________________________ do ____ San Francisco ______________________ do .. __ St. Louis ____________ -----------_ ... do ____
ngineering News Record (all types)§ 1913=100 ..
ederal Home Loan Bank Board:t Standard 6-room frame house:
Combined index __________ .. 193iH939=100. _ Materials .• _______________ • _______ .do. ___ Labor ___________ ---- ____________ .• do ____
REAL ESTATE
F ed. Hous. Admn., home mortgage insurance:, Gross mortgages accepted for insurance
thous. of doL Premium-paying mortgages (cumulative)
thous. of doL .. E stimatcd new mortgage loans by all savings
and Joan associations. totaL_ thous. of doL_ Classified according to purpose:
Mortgage loans on homes: Construction .••. ________________ ._ .do. ___ Home purchase. ___________________ do ____ Refinancing ____________ . __________ .do ____ Repairs and reconditioning ________ _cto ____
Loans for all other purposes __________ do ____ Classified according to type of association:
FederaL-------------··------thous. of doL. State members .... __________________ .do .. __ Nonmembers ________________________ do ....
7, 091 3, 972 1, 727 1, 392
1, 562 25,612
6, 778 123,405 226,543
7,490 8, 210
34. 576 36,913
218
237 232 247 221 236
206.5
101.9 137.5 125.6 124.4
103.2 138.8 126.6 124.9
102.8 136.8 128.5 124.7
100.3 138.3 121.9 122.5
98.8 139. 8 118.9 122.1
271.8
122.0 121. 1 125.7
141,443
3,849,549
87,367
21, 775 40,930 13, 225 3, 547 7,890
36,325 38,030 13,012
3, 567 5,042 I, 029 I, 358 1, 531 2,087 1,007 I, 596
3, 322 3, 621 39, 100 42,405
7, 773 8, 334 121, 029 126,387 241,877 246, 119
11,060 13,000 11, 632 13, 535
35,292 37,648 36,768 39,300
197 ---------
212 213 209 213 231 230 194 196 216 216
194.2 195.2
98.5 99.8 133.9 134.0 119.3 119.6 120.6 121.0
99.7 101.7 136.6 136.6 122.8 123.0 121.2 121.3
99.2 100.8 133.4 133.7 121.2 122.1 121.6 122.1
96.3 95.6 131.3 132.1 114.3 114.5 116. 2 118.0
95.2 93.7 131.0 131.9 110.5 110.9 114.7 117.0
252.4 255.6
110.4 111.2 108.0 108.7 115.3 Jl6.1
75,516 92,406
2,908,104 2,968,407
105, 162 120, 631
33,250 38,686 41,784 48, 311 16,903 16,905 4, 765 6, 368 8,450 10,361
45,365 51,371 43,947 50,956 15, 850 18,304
7, 782 8, 776 I7, I24 9, 567 6,072 6,975 2,804 3,112 9, 594 3, 606 I, 624 2, 885 3, 425 3,878 4, 825 3, 910 2, 635 2, 460 1, 553 1, 786 2, 706 2, 051 1, 814 1,630
3, 765 4,118 3,879 3, 557 2,899 2, 749 42,755 48,889 47,264 44,693 38,404 38,850
8, 777 8, 921 9,054 8, 840 8, 615 8,176 134, 641 139,401 141,569 138,675 136, 512 131,914 261,530 270,967 276, 100 272,079 268,926 260,555
16,753 20,459 17,798 14,662 12, 423 11,8.51 17,812 21,255 18, 765 15,820 13, 553 13, 122
37,384 37,714 39,548 42,778 42,328 41, 520 38,972 39,452 40,939 44,249 43, 771 42, 920
-- ·----- 207 --------- --------- 211 ---------215 215 219 221 221 223 214 214 216 218 218 219 231 231 233 234 235 235 196 197 203 204 20.5 209 218 219 223 223 223 224
195.0 195.7 197.5 197.8 200.3 201.9
99.7 99.2 99.6 100.5 100.7 100.7 134.0 134.9 135.3 136.1 136.3 136.3 119.9 119.3 120.8 121.5 122.8 122.5 121.1 120.3 120.7 121.3 121.5 121.5
101.7 101.3 101.6 102.2 102.4 102.4 136.6 136.9 137. 1 137. 7 137.9 I37. 9 123.2 122.7 123.8 124.3 124.7 124.6 121.4 120.8 121.1 121.5 121.7 121.7
100.7 100.3 100.9 101.8 102.0 102.1 133.7 134.3 134.8 135.5 13.5. 7 135.8 122.3 121.9 127.3 128.0 128.7 128.4 122.2 121.5 122.0 122.6 122.8 122.8
95.2 94.6 97.0 99.3 99.5 100.0 132.1 133.6 135.9 137.5 137.7 138.0 114.6 115.0 117.3 118.9 120.4 119.0 117.8 116.8 118.3 120.0 120.3 120.3
93. I 92.1 95.2 98. 1 98.3 98.8 131.9 134. 2 137. 1 139. I 139.3 139.7 111.0 110.4 113.3 1J.5. 3 117.6 115.8 116.6 115.5 117.3 119.5 119.9 119.9
256.8 258.2 260.4 263.1 264.5 266.1
111.6 ll2. 4 113.6 115.1 116.5 118.5 108.8 109.2 110.7 112.6 Jl4.4 116.0 117.0 us. 6 119.3 120.0 120.7 123.3
ll9, 566 122,963 114,247 107, 137 104,937 94,948
3,033,684 3,108,723 3,190,690 3,261,476 3,335,703 3,423,183
130,953 133, 640 132,972 129,727 129,934 127, 938
40, 975 44,207 44,918 42,987 40, 782 37, 722 54,781 55,993 55,682 55,973 58,052 59,874 18,506 17,891 16, R16 15, 785 15,871 16, 283
5, 930 5, 633 6,022 5, 571 5,884 5, 361 10,761 9, 916 9, 534 9,411 9, 345 8,698
55,396 57,542 56,564 57,592 54,786 52,507 54,495 54,857 55,676 54,542 54,303 54,930 21,062 21,241 20,732 17,593 20,845 20,501
4, 344 8,176 4, 726 3,464 535 2, 964 2,490 1, 451
2, 570 3, 197 1, 139 1,110 1, 239 2,015 1,098 903
2, 635 2, 259 1, 967 1, 796 39, 259 34,014 30, 789 28,344
7,809 7, 417 7, 044 6,802 128,351 121, 384 117,669 119, 233 253, 703 239,336 228,623 225,527
10,208 10,005 8, 542 8,047 11,588 11,810 9,314 8, 761
40,464 37,742 35,928 34,754 41,932 39,323 38,300 37,140
--------- 215 --------- --------223 225 229 231 219 222 224 225 235 238 240 241 210 212 215 215 224 226 230 230
203.3 203.3 203.3 204.0
100.7 100.2 101.4 101.4 136.3 136.0 137.0 137.0 123.5 123.2 124.2 124.2 122.6 122.5 123.8 123.9
102.4 102.1 102.9 102.9 137.9 137.7 138.4 138.4 126.2 126.0 125.3 125.3 123.4 123.4 124.4 124.5
102. 1 101.3 102.5 102.5 135.8 135.3 136.2 136.2 128.8 128.3 127. 1 127.1 123.2 123.1 124.1 124.3
100.0 97.1 99.9 99.9 138.0 136.1 137.9 137.9 119.5 117.6 120.0 120.0 120.8 120.4 121.4 122.1
98.8 95.1 98.5 98.5 139.7 137.2 139.4 139.4 117.4 114.9 117.7 117.7 120.3 119.8 120.8 121.7
266.2 267.6 269.4 269.7
119.2 ll9. 9 120.6 121.2 Jl6. 9 117.7 118.6 119.3 123.9 124.2 124.5 125.0
70,799 75, 435 66,952 104,566
3,503,681 3,596,491 3,690,214 3,769,496
104,749 100,208 79, 533 76,756
30.103 30,290 22, 791 20,799 48,816 43,145 34, 127 33,769 13,340 14.424 12,854 12, 325
4, 267 4, 170 3,190 3,138 8,223 8,179 6, 571 6, 725
41,910 41,182 31,142 31,919 46,890 43,960 35,312 33,939 15,949 15,066 13,079 10,898
§Beginning with the September 1940 issue of the Survey, indexes computed as of the first of the month are shown as of the end of the preceding month. The Engineering News Record index is similarly shown in the 1940 Supplement as of the end of the preceding month.
,Figures include mortgages insured under the defense housing insurance fund beginning April1941 for gross mortgages accepted for insurance and beginning June 1941 for premium-paying mortgages.
*New series. Earlier data for concrete pavement contract awards for airports and for the total revised to include airports, not shown in the Survey beginning with the March 1941 issue, will appear in a subsequent issue.
tRevised series. Revised indexes of the American Appraisal Company beginning 1913 are available in table 44, p. 13 of the November 1940 Survey. For revision in total concrete-awards, see note marked with an"*." Data beginning 1936 for the Federal Home Loan Bank Board's revised index of construction costs are shown on p. 26 of the October 1941 Survey.
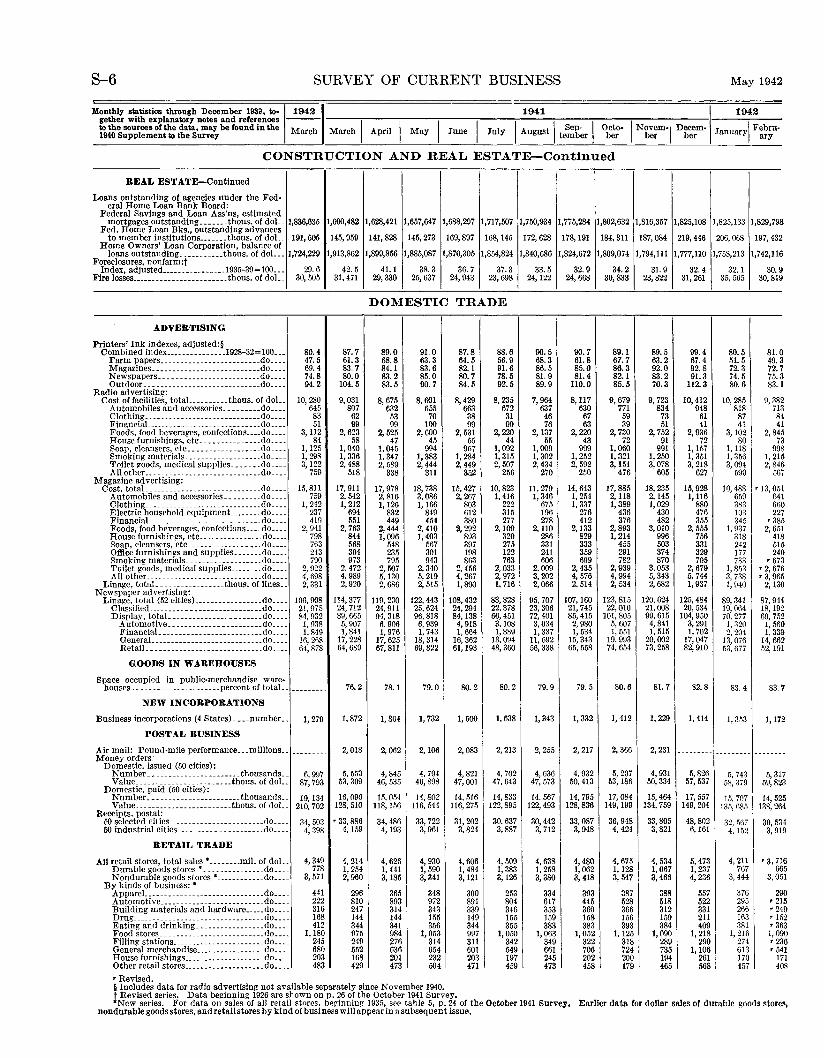
S-6 SURVEY OF CURRENT BUSINESS May 1942
Monthly statistics through December 193a, to-~19421 1941 I 1942 gether with explanatory notes and references --- ----,------,----,-----,----,----;----;----.----,---,----,----to the aources of the data, may be found in the March March I Apri'l I May I June I J ly I A ust I Sep- I Octo- I Novem-1 Decem- Januaryl Febru· 1940 Supplement to the Survey u ug tember ber ber ber ary
CONSTRUCTION AND REAL ESTATE-Continued
REAL ESTATE-Continued
Loans outstanding of agencies under the Fed· era! Home Loan Bank Board:
Federal Savings and Loan Ass'ns, estimated mortgages outstanding ....... thous. of doL. 1,836,635 1,600,482 1,628,421 1,657,647 1,688,297 1,717,507 1,750,934 1,775,284 1,802,632
Fed. Home Loan Bks., outstanding advances to member institutions .•• __ •. thous. of doL. 191,505 145,959 141,828 145,273 169,897 168, 145 172,628 178, 191 184,311
Home Owners' Loan Corporation, balance of loans outstanding ........•.. thous. of doL .. 1,724,229 1,913,862 1,899,856 1,885,087 1,870,305 1,854,824 1,840,686 1,824,672 1,809,074
Foreclosures, nonfarm:t Index, adjusted ...•......••.... 1935-39=100 ... 29.6 42.5 41.1 38.3 36.7 37.3 33.5 32.9 34.2
Fire losses ........................ thous. of doL 30, 505 31,471 29,330 25,637 24,943 23,698 24, 122 24,668 30,833
DOMESTIC TRADE
ADVERTISING
Printers' Ink indexes, adjusted:§ Combined lndex ..•............ 1928-32=100 ... 80.4 87.7 89.0 91.0 87.8 88.6 90.5 90.7 89.1
Farm papers .............•.•......... do .... 47.5 61.3 68.8 63.3 64.5 56.9 68.3 61.8 67.7 Magazines ___________________________ do ____ 69.4 83.7 84.1 83.6 82.1 91.6 86.5 85.0 86.3 Newspapers .•... _ •...... __ ....•..... do .... 74.8 80.0 83.2 85.0 80.7 78.5 81.9 81.4 82.1 Outdoor __ .......................•... do .... 94.2 104.5 83.5 90.7 84.5 92.5 89.9 110.0 85.5
Radio advertising: Cost of facilities, total.. ........ thous. of doL. 10,280 9,031 8,675 8,601 8,429 8, 235 7,964 8,117 9,679
Automobiles and accessories .••....•. do .... 645 807 632 655 663 672 637 630 771 Clothing .............. __ .....•....... do ..•. 83 62 53 70 38 31 46 67 59 Financial.. ....•...................... do .... 51 99 99 100 99 99 76 63 39 Foods, food beverages, confections .••. do .... 3, 112 2,623 2, 525 2, 600 2, 531 2,220 2,137 2,220 2, 730 House furnishings, etc ............... do .... 84 58 47 45 55 44 55 43 72 Soap, cleansers, etc ...•..........•... do .... 1,125 1,040 1,045 994 9fi7 1,092 1,009 999 1,060 Smoking materials .. _. ______ ......... do .... 1, 298 1, 336 1. 347 I, 383 1, 284 1, 315 1, 302 1,252 1, 321 Toilet goods, medical supplies ....... do .... 3,122 2,488 2, 589 2,444 2, 449 2, 507 2,434 2, 592 3,151 All other ...........................•. do .... 759 518 338 311 352 256 270 250 476
Magazine advertising: 15,811 Cost, totaL_ ---------------------------do .... 17,911 17,978 18,738 15.427 10, 823 11,279 14,643 17,885
Automobiles and accessories ......... do .... 759 2. 542 2,816 3,086 2. 267 1, 416 1, 346 1, 254 2,118 Clothing_ ... _________ ..... _ .......... do .... 1, 242 1, 212 1, 126 1, 166 803 222 675 l, 337 1,389 Electric household equipment ..•..... do .... 237 694 832 849 612 315 196 276 436 FinanciaL_ ....... _______ ............ do .... 419 551 449 454 380 277 278 412 376 Foods, food beverages, confections .... do .... 2, 941 2, 763 2,444 2,410 ll, 292 2.109 2,110 2,133 2, 893 House furnishings, etc ................ do .... 798 844 1,096 1,403 8~3 320 286 829 1, 214 Soap, cleansers, etc ...............•.. do .... 763 568 548 567 397 275 331 333 455 Office furnishings and supp!ies ....... do .... 243 304 235 301 198 122 241 359 291 Smoking materials ................... do .... 790 973 795 943 863 763 606 699 782 Toilet goods, medical supplies ....... do .... 2, 922 2. 472 2,507 2. 340 2,456 2,033 2.009 2, 435 2, 939 All other ............................. do .... 4, 698 4. 989 5,130 5, 219 4, 267 2, 972 3, 202 4, 576 4, 994
Linage, totaL ____ ._ .......... thous. of lines .. 2, 331 2, 920 2,686 2, 515 1,890 1, 716 2,066 2.514 2, 534 Newspaper advertising:
Linage. total (52 cities) ................. do .... 106,908 114, 377 119,230 122,443 108,432 88,828 95.707 107,160 123,815 Classified ... _ .......•..............•. do. __ . 21,975 24,712 24,911 25,624 24,294 22.378 23,306 21, 745 22,010 Display. total. ........•.•.•....•.... do .... 84, 932 89,665 94,318 96,818 84,138 66, 451 72,401 85,415 101,805
Automotive ........•.............. do .... 1, 938 5, 907 6. 906 6, 939 4, 918 3.108 3,034 2, 980 5,607 FinanciaL .... ___ .................. do .... 1, 849 1,841 1,976 1, 743 1, 664 1,889 1, 337 1, 534 I, 551 GeneraL_----------····--···-····· .do .... 16,268 17,228 17,625 18,314 16,362 13,094 11, 692 15,343 19,993 RetaiL_ ...... -----------·- ........ do .... 64,878 64,689 67,811 69,822 61, 193 48,360 56,338 65,558 74,654
GOODS IN WAREHOUSES
Space occupied in public-merchandise ware-houses ...................... percent of totaL. --------- 76.2 78.1 79.0 so. 2 80.2 79.9 79.5 80.6
NEW INCORPORATIONS
Business incorporations (4 States) .... number .. 1,279 1,872 1, 804 1, 732 1, 500 1. 638 1, 343 1, 332 1,412
POSTAL BUSINESS
Airmail: Pound-mile performance ... millions .. --------- 2,018 2,062 2,106 2,083 2, 213 2, 255 2, 217 2,366 Money orders:
Domestic, issued (50 cities): Number_ •. ______ . __ .......... _ thousands .. 6, 997 5, 553 4, 845 4. 794 4,821 4, 702 4, 636 4, 932 5, 207 Value. ---------·-·-----------thous. of doL. 87,793 53,309 46, 535 46,898 47,001 47,643 47,573 50,413 53,186
Domestic, paid (50 cities): Number ... ·---·-·-············ thousands .. 19,134 16,096 15,054 14,802 14,516 14,833 14.567 14,795 17,084 Value ........................ thous. of doL 210, 702 128,510 118, 156 116,544 116, 275 122.895 122,493 128,836 149, 199
lteceipts, postal: 50 selected cities ........................ do .... 34, 503 '33, 886 34,486 33,722 31,202 30.637 30,442 33,087 36, 948 50 industrial cities .................•... do .... 4, 398 4, 159 4,193 3, 961 3,824 3,887 3, 712 3, 948 4, 424
RETAIL TRADE I I
All retail stores, total sales • .....•.. mil. of doL. 4, 349 4, 214 4,626 4, 930 4,606 4,509 4,638 4,480 4, 675 Durable goods stores • ............... do .... 778 1, 254 1, 441 1,590 1, 484 1, 383 1, 258 1, 062 1,128 Nondurable goods stores • .......•.... do .... 3,571 2, 960 3,185 3,341 3,121 3,126 3, 380 3, 418 3, 547
By kinds of business: •
!~r:;;~t.ive~~::::::::::::::::::::::::~g:::: 441 296 365 348 300 253 334 393 387 222 810 893 972 891 804 617 445 528
Building materials and hardware ..... do .•.. 316 247 314 343 339 346 353 360 366 Drug. ____ .. ____ ..... _ ......... ___ .... do ••.. 168 144 144 155 149 155 159 158 156 Eating and drinking ................. do .... 412 344 341 356 344 355 383 383 393 Food stores. __ ....................... do ••.. 1, 180 975 984 1,053 997 1,050 1,063 1, 052 1, 125 Filling stations ......•................ do .... 245 249 276 314 311 342 349 322 318 General merchandise ................ _ do .•. _ 680 552 636 654 601 549 661 706 724 House furnishings .................... do .•.. 203 168 201 232 203 197 245 202 200 Other retail stores ....•...••.•.•••..•. do •... 483 429 473 504 471 459 473 458 i79
'Revised. §Includes data for radio advertising not available separately since November 1940.
1,816,357 1,825,108
187,084 219,446
1,794,111 1,777,110
31.9 32.4 23,822 31, 261
I
89.5 99.4 63.2 67.4 92.0 92.8 83.2 91.3 70.3 112.3
9, 723 10,412 834 948
73 61 51 41
2, 752 2, 936 91 72
991 1,157 1, 250 1, 351 3,078 3, 218
605 627
18, 235 15,928 2,145 1,116 1,029 880
430 476 482 355
3,010 2, 555 996 756 503 331 374 329 870 705
3.053 2, 679 5, 343 5. 744 2, 682 1, 937
120,624 125,484 21,008 20,534 99,615 104,950
4, 841 3, 291 1, 515 1, 702
20,002 17,047 73,258 82,910
81.7 S2. 8
1, 229 1, 414
2,231 ---------
4, 931 5, 826 50,334 57,537
15,464 17, 557 134,759 149,204
33,805 48,802 3,821 6, 161
4, 534 5, 473 1,067 1, 237 3,466 4, 236
388 557 518 522 312 331 159 211 384 409
1,090 1, 218 289 290 735 1,106 194 261 465 568
1,825,133
206,068
1,758,213
32.1 35, 565
so. 5 51.5 72.3 74.5 80.6
10,285 818
87 41
3,102 80
I, 118 1, 356 3, 094
590
10,488 659 383 103 345
1, 937 318 242 177 733
1, 853 3, 738 1, 940
89,341 19,064 70,277
1, 320 2, 2Q.1
13, 076 53,677
83.4
1, 3.13
---------
5, 743 58,379
15,707 135, 685
32, 567 4, 152
4, 211 767
3, 444
376 295 266 163 381
1, 216 274 613 170 457
1,829,798
197,432
1,742,116
30.9 30,819
81.0 49.3 72.7 75.3 83.1
9, 38 713
2
4
5 3 8 5 6
8 41
2,84. 7
99 1, 21 2, 84
56t
'13, 051 641 66 0
7 5
22 '38
2, 651 4L R
5 0 3 6 5 0
51 24
'67 '2, 67 '3, 96
2, 13
87,94 18,19 69,75
I, li6
4 2 2 0 9 2
1, 33 14,66 52,191
83. 7
1, 17 2
-------
5, 31 59,82
14,52 138,26
30,53 3, 91
5 4
• 3, 71 6 5 1
66 3, 05
29 '21 '24
0 5 9 2 3 0 6 1 1 8
'15 '36
1, 09 '23 '54
17 40
t Revised series. Data beginning 1926 are shown on p. 26 of the October 1941 Survey. *New series. For data on sales of all retail stores. beginnin!! 193fi, sec table 5, p. 24 of the October 1941 Survey. Earlier data for dollar sales of durable goods store~,
nondurable goods stores, andre tail stores by kind of business will appear in a subsequent issue.
May 1942 SURVEY OF CURRENT BUSINESS 8-7
Monthly statistics through December 1939, to-~19421 1941 I 1942 gether with explanatory notes and references --- ----,----;-----,---,----,-----,---...,.---...----.---, ---..,----tothesourcesofthedata,maybefoundinlhe March March I Apri'l I May I J ne I July I Au ust I Sep- I Octo- INovem-1 Decem- Janu- I Febru· 1940 Supplement to the Survey u g tember ber ber ber ary ary
DOMESTIC TRADE-Continued
RETAIL TRADE-Continued
All retail stores, indexes of sales:• Unadjusted, combined index .•. 1935-39=100 .. 133.1 128.1 143.0 148.6 146.0 136.6 141.0
Durable goods stores ....•...•••...... do .... 96.9 155.1 182.9 196.7 190.3 172.1 155.6 Nondurable goods stores ............. do .... 144.8 119.4 130.1 133.0 131.7 I25.1 136.3
Adjusted, combined index. ____________ do .... 139.3 135.5 137. I 142.5 139.0 144.7 150.5 Durable goods stores _________________ do .... 108.4 167.6 166.2 174.8 163.9 169.5 163.5 Nondurable goods stores. ____________ do .... 149.3 125.1 127.7 132.0 130.9 137.0 146.3
By kinds of business, adjusted:• Apparel. ---------------··------------do .... 171.7 122.6 128.2 133.6 125.7 136.8 165.6 Automotive __________________________ do .... 50.6 191.2 181.3 197.6 172.9 173.4 154.8 Building materials and hardware .... do .... 174.5 134.4 147.4 142.7 152.7 I6I. 4 I64. 9 Drug ................................. do .... I42. 8 122.5 124.3 128.9 I27.6 132.3 137 5 Eating and drinking ................. do .... I58. 0 131.8 134.1 138.5 136.7 141.4 146.6 Food stores .......................... do .... 151.9 I25.5 123.3 127.7 129.7 130.2 139.0 FiJJing stations .. ---------------------do .... I26. 2 I28.2 I35. 7 141.2 I35.5 I52. 5 144.1 General merchandise ................. do .... I38.4 115. I 119.5 I22. 9 I22. 7 I30.8 147.0 House furnishings .................... do .... I75. 6 I44.0 I45. 9 I51.5 149.9 I65. 9 I81. 2 Other retail stores .................... do .... I57. 7 I38.4 145.7 I50.0 149.1 I53. 6 156.6
Automobiles, value of new passenger-car sales:t Unadjusted ......... _ ... _. ____ .. 1935-39= 100. _ --------- 215 235 246 214 169 91 Adjusted ............................... do .... --------- 185 189 210 182 196 104
Chain-store sales, indexes: Chain-store Age, combined index (20 chains)
average same month 1929-31=100 .. 169.0 '128. 0 132.0 I32.0 133.0 141.0 151.0 Apparel chains ....................... do ....
Drug chain-store sales:• 208.0 I44. 0 148.0 145.0 136.3 159.0 I84.0
Unadjusted ............ _ ...... 1935-39 = IOO .. •125. 0 '109. 7 107.7 112.2 109.7 109.9 113.9 Adjusted ___________ .................. do .... •I26. 0 '110. 3 111.4 116.0 116.I 115.3 119.9
Grocery chain-store sales:t Unadjusted ...... ___ .......... 1935-39= 100 .. • 169. 1 134.0 136.9 137.6 142.6 140.6 143.9 Adjusted _____________________________ do ____
Variety-store sales, combined sales, 7 chains:t • I67. 5 I32. 6 132.9 135.6 140.4 143.4 149.9
Unadjusted ........ _ .......... 1935-39= 100. _ • 116.3 94.8 116.1 JIO. 2 111.3 Ill. 9 113.1 Adjusted ............................. do .... • 133. 8 '113.I 116.4 114.0 116.8 I22. 2 128.9
Chain-store sales and stores operated: Variety chains:
S. S. Kresge Co.: Sales ....................... thous. of doL I3, I74 11,507 I3, 314 I3, 443 I2, I27 I2,0I6 I3, 366 Stores operated ................. number .. 671 675 673 673 672 672 671
S. H. Kress & Co.: Sales ....................... thous. of doL 8, 503 7, !56 8. 062 7,958 7, 724 7, 582 8,022 Stores operated ................. number __ 243 242 242 242 242 242 242
McCrory Stores Corp.: Sales _______________________ thous. of doL 4, 373 3, 691 4,241 4,101 3, 923 3, 948 4,320 Stores operated ................. number .. 203 199 199 200 200 201 20I
G. C. Murphy Co.: Sales _______________________ thous. of doL 5, 091 4,021 4, 949 5,302 4, 931 4, 971 5,379 Stores operated _________________ number .. 206 204 204 204 204 204 204
F. W. Woolworth Co.: Sales _______________________ thous. of doL 30,266 26,436 29,494 29,778 27,653 28,398 30,713 Stores operated ................. number __ 2, 017 2,020 2,015 2,020 2, OIS 2,018 2,019
Other chains: W. T. Grant Co.:
Sales ....................... thous. of doL. 10,470 '8,440 9,805 'IO, 603 9, 537 '8, 730 IO, 070 Stores operated ................. number .. 495 492 493 493 493 493 493
J. C. Penney Co.: Sales ....................... thous. of doL 32,348 '22, 773 27,555 29,383 28,390 26,143 32,385 Stores operated ................. number._ I, 608 1, 589 I, 59 I I, 59I I,593 1, 593 I, 596
Department stores: Collections and accounts receivable:
Installment accounts: Index of receivables*.Dec. 3I, 1939=100 __ I03. 5 99.4 101.7 I03. 3 102.6 IOI. 2 I07. 6 Collection ratio .................. percent __ 21.7 I9. 2 18.8 I9.0 17.7 I7.6 I8.8
Open accounts: Index of receivables* .Dec. 3I, I939= 100 .. 89.I 74.5 80.1 St. I 79.4 71.0 78.0 Collection ratio ................. percent._ 46.1 46.3 46. I 47.7 46.2 46.1 45.0
Sales, total U.S., unadjusted ... I923-25=100 __ • 118 93 106 I05 100 79 106 Atlanta t. ____ ..... _ ... _ ....... I935-39= 100 __ I 52 I25 I37 I36 114 I02 144 Boston ....................... l923-25=100 .. 93 74 86 89 82 63 82 Chicagot ..................... I935-39=100 .. I35 I09 I20 I25 119 92 I22 Cleveland .................... I923-25= 100 .. I26 95 115 Ill 105 85 I20 Dallas ......................... ______ do ___ I29 112 117 I24 110 93 I28 Kansas City _____________________ 1925=IOO .. 110 '96 93 IOO 85 79 I06 Minneapolist ___ .............. 1935-39= IOO .. I25 I08 I22 I22 114 93 127 New York .................... I923-25=100 .. 107 '85 IOO 95 98 81 IOO Philadelphiat ................ I935-39=!00 .. • I40 106 I26 I24 116 89 115 Richmond* __________________________ do ____ 161 125 I43 148 I26 I09 140 St. Louis_ .................... I923-25=100 .. I25 97 Ill I05 92 82 I06 San Franciscot ............... l935-39=100._ 148 116 I28 I29 I26 I20 154
Sales, total U.S., adjustedt .... I923-25=100 .. I24 I03 104 I05 104 115 134 Atlantat _____________________ I935-39=IOO .. I 52 125 14I I38 134 148 I63 Chicagot ....................... __ .. __ do .... I39 116 118 I24 I23 I31 I 54 Cleveland .................. _ .I923-25= 100 .. I40 108 I05 103 107 117 145 Dallas ....... _._ ............... _._ .... do .... I33 118 118 124 123 I32 166 Minneapolist ......... _ ....... 1935-39= 100 .. I23 109 119 I24 115 131 145 New York .................... I923-25=!00 __ I21 98 103 99 102 114 I34 Philadelphiat ...... ____ ...... I935-39=100 .. • I49 118 I33 I26 I2I I35 155 Richmond*--------------------------do ____ I66 I35 I37 142 I3R 154 I85 St. Louis ..................... I923-25=IOO .. I30 107 105 105 100 119 14I San Franciscot _______________ I935-39=100 __ I6I 130 I32 I34 I36 I44 I68
Installment sales, New England dept. stores percent of total sales .. 9.2 II. 7 IO. 7 10.8 9.5 11.8 I7.4
• Revised. • Preliminary.
140.9 139.3 145.8 137.2 137.7 139.6 142.1 139.8 147.8 136.4 132.3 140.1 137.8 128.4 134.1 135.9 133.6 142.0
140.8 123.3 145.9 116.3 112.4 116.4 161.0 155.3 156.6 134.0 I31.0 I39. 2 147.5 145.6 148.7 132.3 136.2 143.4 143.4 144.7 142.5 I3I. 0 I20. 2 I32. 9 I49.0 I35.2 149.7 145.4 142.6 148.8
57 IOO 114 57 93 I28
147.0 146.0 151.0 164.0 I53. 0 162.0
113.5 111.6 116.9 118.2 110.0 116.4
145.0 153.4 155.6 147.9 152.6 155.6
120.4 122.0 I30. 7 I25. 3 I23. 9 I27.0
I2, 809 14, I02 14,832 671 67I 674
8,483 8, 427 8,4.18 242 242 242
4, I64 4,422 4,655 20I 20I 20I
4,870 5, 575 5, 608 204 204 205
30,097 32,6I4 33,776 2, OI8 2,025 2,024
IO, 063 '11, 864 '12, 174 493 493 494
33,645 38,718 40,416 I, 598 I, 603 I, 605
110.5 110.4 110.4 18.9 19.3 I9. 2
90.6 92.5 93.5 45.I 46.9 48.6
I25 112 I33 I 58 I38 169 IOO 98 I03 I 51 I23 146 130 I09 I36 151 I27 150 114 106 I06 142 140 I23 125 112 I30 134 136 168 I 54 165 I68 I28 119 I33 I 56 145 !58 116 I05 116 146 I25 154 137 117 133 I24 105 I27 I36 113 I34 I24 117 I23 I20 98 I09 125 119 I32 15I I34 I60 I20 I06 114 149 I38 I5I
I2.0 I0.8 8.9
166.0 126.8 153.9 94.7 169.9 137.2 136.3 146.7 135.4 116.5 136.6 156.5
132.1 176.9 119.2 67.4 164.0 I78.1 135.8 I4I. 7 147.8 I52. 8 140.8 I 55.3 I41. 0 I58. 7 I23. 5 148.5 I38.6 I68.2 14I. 7 I65. 0
104 ---------162 ---------
157.0 164.0 178.0 188.0
164.9 120.7 121.3 I26.0
164.7 170.5 I59. 9 I75. 8
249.6 97.0 113.9 I32. 3
27,515 11,854 675 673
I7, 376 7, 274 242 242
9,398 3, 819 202 202
I0,898 4, 804 207 206
62,498 28,345 2,024 2,02I
'23, 5I8 8, 983 495 496
59,513 30,589 I, 605 I, 606
116.4 IOS. 8 20.I 20.2
' 117.7 I00.3 46.3 50.3
197 I08 245 I23 165 99 213 121 197 112 222 122 I83 IOO I98 I22 194 I04 238 115 265 I28 I90 1!0 235 I29 111 138 140 I 59 I26 154 115 149 I28 I61 I27 152 107 I32 I27 161 142 182 115 138 I38 I67
6. 3 IO. 5
'124. '91.
'134.
0 0 7
140.2 '110. 2 '149. 9
157.9 '54.
'I79. 'I38. 'I56.
I 50. '151. 'I39.
4 8 7 9 4 0 8
I67.0 'I61. 3
----------------
I65. 178.
'110. '118.
169. I68.
0 0
8 5
6 8
108.1 I36. I
11,75 0 671
7, 20 3 42 2
3, 73 20
9 3
4,46 9 6 20
27,46 6 9 2,01
8, 4I 7 96 4
25,40 1,60
104. 19.
88. 45.
9
8 7
I2
0 2 9 2 4 4 3 8 5 5 4 7 4 1 2 6 1 5 0 7 4 6 7 5 7 6
7 •11
10 10 8 9 9
11 11 10 I3 12 14 13 I3 12 I3 11 I5 16 11
'16
11, 4
tRevised series. For revised data on value of new passenger-car sales beginning 1929,see p. 20 of the August 1941 Survey, and for an explanation of the revision, pp. IS and 19 of that issue. Seasonal factors have been revised beginning August 1941 to take into account the effect of restricted production. Revised data ou grocery chain-store sales indexes will appear in a subsequent issue. Revised indexes oi variety store sales beginning 1929 appear in table 30. p. 10 of the August 1940 Survey. Indexes of depart· ment-store sales in Atlanta, Minneapolis, and Ban Francisco districts revised beginning 1919, and C"hitago and Philadelphia be~innin~ 1923; for A t:anta, see table 53, p. 16, of the December I940 Survey; for Minneapolis, table 20, p. IS of the May 1941 Survey; revised Chicago, Philadelphia. and San Francisco data will apj;ear in a subsquent issue. For revisions in adjusted index of United States department-store sales for 1935-39, see note marked with a "t" on p. 2-' of the January I941 Survey.
•New series. For earlier data beginning I935 for indexes of sales of retail stores, see table 5, p. 24 of the October I941 Survey. For data ou drug-store sales beginning July 1934, see table 1, p. II of the November 1940 Survey. Indexes of department store receivables beginning January I940 are available on p. S-7 of the September 1941 Survey. Data beginning 1923 for the new indexes of department-store sales for the Richmond district will appear in a subsequent issue.
8-8 SURVEY OF CURRENT BUSINESS May 1942
Monthly statistics through December 1939, to-~19421 1941 I 1942 gether with explanatory notes and references ---1----,------,-------,-----,----,-----,---~----,----------,--- ----,---to the sources of the data, may be found in the M'lrch March I April I May I June I July I August I Sep- I Octo- I Novem-1 Decem- Janu- I Febru-1940 Supplement to the Survey tember ber ber ber ary ary
DOMESTIC TRADE-Continued I I I
RETAIL TRADE-Continued
Department stores-Continued. I Stocks, total U. S., end of month:
Unadjusted._ .... ______ ...... 1923-25= 100 .. i • 106 75 76 76 73 73 84 95 Adjusted .... ________ ........... ___ ... do .... p 104 74 74 74 77 82 87 92
Other stores, installment accounts and collec-tions:*
Installment accounts outstanding, end of mo: Furniture stores ....... Dec. 31, 1939=100 .. 100.6 101.3 104.0 107.4 108.6 108.5 112.5 111.2 Household appliance stores ........... do .... 96.5 100.7 106.5 11~. 5 116.2 118.2 121.7 120.4 Jewelry stores .. _ ..... _. ______ . ___ .... do .... 97.6 92.5 92.0 93.4 94.2 93.3 94.2 98.3
Ratio of collections to accounts at beginning of month:
Furniture stores .............. __ .. percent_. 12. 4 11.0 10.7 11.4 10.8 11.0 11.7 11.2 Household appliance stores .......... _ do_ ... 12.6 10.2 10.3 10.7 10.4 10.2 10.4 10.8 Jewelry stores ........................ do .... 18.5 16.3 15.5 16.8 16.7 16.3 17.4 17.8
Mail-order and store sales: Total sales, 2 companies ........ thous. of doL. 131.894 110,866 133, 787 145,359 131, 439 121,175 145,519 145,495
Montgomery Ward & Co ............ do .... 55, 85R 44,485 58,068 60,520 52,872 48,305 57,803 59,780 Sears Roebuck & Co ................. do .... 76,038 66, 381 75, 719 84,839 78,568 72,870 87,716 85,714
Rural sales of general merchandise: Total U.S., unadjusted ....... 1929-31=100 .. 185.6 '130. 8 151.7 148.5 148.7 129.7 170.7 183.8
~1w~~~ ~s~t~-~~~~: ~ ~~ ~~~ ~ ~~ ~ ~ ~ ~~ ~ ~~~=~~~~~~I 204.9 138.5 163.4 158.2
:~ll 151. 1 186.0 181.9
224.0 '164. 9 176.6 167.0 134.1 183.9 239.8 165.2 '116. 4 139.7 144.3 143.4 120.9 153. 3 158.8 194.5 '138. 2 146.7 132.9 143.6 131.6 194.7 22\.2
T~~K;:nm: : - 11=-~ 211.4 , 149.9 165.1 161.8 163.2 177.7 208.7 173.9 228.2 154.2 171.4 1i2.0 177.7 212.2 233.3 185.1 248. 1 '182. 6 200.5 196.9 1 203. 1 I 197.5 255.0 217.2 186.4 '131. 41 149.6 152.4 I 151.9 163.9 185.8 154.9 I 236.3 '168. 0 164.3 150.7 160.5 211.4 147.9 I 189. 1 I
EMPLOYMENT CONDITIONS AND WAGES
EMPLOYMENT
I Employment estimates, unadjusted (U.S. De-partment of Labor):•
Civil nonagricultural employment, total thousands._ 40,298
Employees in nonagricultural establish-37,761 38,228 38,902 39,475 39,908 40,292 40,710 I
ments, totaL .......•...•... thousands .. 34, 155 31,618 32,085 32,759 33,332 33,765 34,149 34,567 Manufacturing .........•......•.... do .... 12,784 11,457 11,684 11,886 12,154 12,391 12, 595 12,777 Mining ...............•............ do .... 839 864 5R4 869 876 888 900 906 Construction .................. __ ... do .... 1, 747 I, 631 1, 775 1, 782 1, 816 1, 895 1, 921 1, 936 Transportation and public utilities. do .... 3, 274 3,056 3,113 3,185 3, 239 3, 290 3,326 3, 367 Trade .........................•.... do .... 6, 707 6,578 6, 792 6, 753 6,861 6,837 6,897 7.008 Financial, service, and misc ________ do ____ 4, Hi5 4, 097 4,174 4, 235 4, 260 4, 300 4,300 4,325 Government ....................... do .... 4, 589 3, 935 3, 983 4,049 4,126 4,164 4,210 4, 218
Military and naval forces .............. do .... (1) 1, 343 1,546 1, 662 1, 740 1,857 1, 944 1. 992 Employment estimates, adjusted (Fed. Res.) :•
Civil nonagricultural employment, total thousands .. 40,782 38,263 38,329 38,824 39,296 39,903 40,100 40.013
Employees in nonagricultural establish-ments, totaL ...••..•.•...•. thousands .. 34,639 32,120 32.186 32,681 33,153 33,760 33,957 33,870
Manufacturing ___ ......... _ ...•.••. do .... 12,758 11,413 11,636 11,886 12, 221 12,605 12,614 12,545 Mining ____ .....•.............•... cdo .... 850 855 572 R77 889 914 923 908 Construction ..... _ .............. _ .. do .... 2,0f>9 1, 933 1, 859 1, 698 1,644 1,668 1, 666 1, 683 Transportation and public utilities.do .... 3, 322 3,105 3,133 3,192 3, 220 3, 261 3, 302 3,303 Trade .. -------------------·-·--····do .... 6, 808 6, 677 6, 803 6, 781 6, 865 6, 944 7,027 6, 968
Manufacturing, unadjusted (U. S. Department of Labor)t .................... 1923-25=100 .. 13'1. 5 119.9 122.6 124.9 127.9 130.6 133.1 135.2
Durable goodst ......................... do ...• 147.0 123.7 127.7 131.3 135.1 137.6 138.7 142.1 Iron and steel and their products, not in-
eluding machinery ....... 1923-25=100 .. 13'l. 1 127.2 129.4 132.9 136.1 137.7 139.9 140.5 Blast furnaces, steel works, and rolling
mills .............•....... 1923-25=100 .. !.>0. 3 135.0 137.4 140.6 144.0 147.2 149.1 148.9 Hardware ..................•....... do .... 95.1 117.1 !16. 6 116.7 !18. 3 103.8 113.2 116.0 Structural and ornamental metal work
1923-25=100 .. 10.J.9 97.2 99.1 102.3 105.5 107.4 110.0 109.5 Tin cans and other tinware ......... do .... 121.7 107. 1 109.5 120.5 132.0 138.8 145.3 145.0
Lumber and allied products .......... do .... 73.7 72.6 73.8 74.7 76.8 79.5 81.0 80.4 Furniture .. __ .. _._. __ .•.... _._ ..... do .... 100.7 9fi. 7 97.6 100.1 103.8 105.6 108.4 107.6 Lumber, sawmills .................. do .... 63.7 63.7 65.2 65.7 67.1 70.0 70. 7 70.4
Machinery, excl. transp. equipment .. do .... 193.3 147.7 156.2 162.5 167.7 172.3 176.5 178.6 Agricultural implements (including trac·
tors) ...... ___ ............. 1923-25= 100 .. 167.9 132. 6 168.5 170.7 171.8 171.4 172.0 170.7 Electrical machinery, apparatus, and
supplies .................. 1923-25=100 .. (1) 141.5 147.3 154.0 158.8 163.8 167.4 168.7 Engines, turbines, water wheels, and
windmills .. ___ ........... 1923-25=100 .. (1) 247.6 257.2 271.5 285.5 298.3 314.7 325.0 Foundry and machine-shop products.do •.•• 1.07. 3 123.6 130.0 134.9 139. 1 142.6 145.6 147.0 Machine tools*. ______ .............. do .... (1) 307.1 316.7 327.4 338.5 346.0 351. 5 356.8 Radios and phonographs ........... do .... 210. 5 149.1 158. 5 173.7 180.7 188.7 202.4 212.5
Metals, nonferrous, and products ..... do .... 146.6 137.0 !38. 7 139.9 141.9 143. 1 145. 5 146.4 Brass, bronze, and copper products.do .... (1) 180.5 182.6 184.3 189.3 189.7 192.9 193.5
Stone, clay, and glass products ....... do .... 94.1 89.7 93.0 95.6 97.1 99.6 101.3 101.8 Brick, tile, and terra cotta .......... do .... 68.7 65.4 69.2 72.7 74.7 77.6 79.4 79.1 Glass .... -------------------·------do .... 125.0 119. 5 121.8 124.0 125.5 127.9 130.0 130.3
Transportation equipmentt .......... do ..•. 223.0 161.2 166.3 171.7 177.8 179.0 172.0 190.9 Aircraft* .......................•... do .... (1) 5, 5f\3. 7 5, 929.2 6, 305. 1 6, 718.1 7, 231.3 7, 897.3 8, 515.7 Automobiles. ____ .................. do .... S6. 4 131.5 132.4 134.1 131.8 126.9 110.9 121.1 Shipbuilding• ........ _ ...•......... do .... (1) 272.4 295.8 310.7 I 338.6 375.3 388.3 442.5
! I I I
108 110 86 97 95 92
110.0 108.9 110.0 117. 1 112.5 110. 1 95.7 98.4 122.9
11.8 11. 5 11.4 11.2 10.8 11.7 17.7 18.4 23.2
164,394 152,308 204,339 68, 138 63, 345 85,269 96,256 88,963 119,069
216.4 243.2 287.9 221.8 2fi9. 1 320.3 299.9 330.3 341.1 187. 7 209.6 254.9
i~~:g I 235.7 319.9 186.9 180. 1
172. 3 I 208.8 192.4 202.4 1 240.6 227.1 147.8 159.9 I 163.4 185.1 I 196.0 !
I 194.3 I
I 40,783 40,756 41,036
34,640 34,613 34.893 12,805 12,763 12,739
915 911 908 1, 960 1, 961 1, 874 3,365 3,322 3, 296 7,070 7,146 7, 511 4,256 4, 229 4, 227 4, 269 4, 281 4,&87 2,014 2,071 (1)
40,191 40,604 40,904
34,048 34,461 34,761 12, 59S 12,736 12,788
892 892 892 1, 77'3 1, 924 2,156 3, 292 3,310 3, 322 6, 989 7, 043 7, 017
135 4 134.8 134.3 144.0 144.6 •144. 2
139.4 138.8 '138. 0
147.9 147.8 148.6 115.2 '112. 9 '105. 7
109.3 107. 5 106.0 130.1 135.0 134.4 79.8 77.9 76.6
107.4 108.4 106.81 69.5 66.4 65. 3 180.1 181. 4 '183. 4
169.9 167. 5 167. 2
168.8 169.4 (')
339.5 352.5 {l) 147.8 148.8 150.4 361.5 366.9 (1) 217.9 217.6 r 218.5 147.4 145. 1 '145. 3 193.4 191.3 (l) 102.0 101. 5 99.7 77.7 76.2 '74. 2
132.4 133.1 132.0 203.2 210.4 '208. 9
9, 174.8 9, 701.5 (1) 12~. 9 129.7 116.2 494.6 532. 2 (1)
83 a3
104.9 103.3 110.9
12.0 11.4 18.9
ll!, 481 •ll, 8541 69,627
151. 5 162.8 173. t 136. 6 166.6 199.0 214.2 21~. 3 ' 17S. 51 220. 7
I
I
39,871
33,728 12,5:8
876 1, 658 3. 2fi5 6, 757 4. 180 4,404 (1)
40,896
34,753 12,854
873 2, Of>! 3, 320 ~. 907
'132. 3 '143. 2
'13fl. 3
148.7 '98. 6
105. 7 136. 6 74.0
101.8 63. 6
'185. 0
164.1
(') i
(I) I
152.1 (1)
'2U9. 4 144.3 (1)
'95. 2 '68. 8 127. 7
• 210.2 (1) 100.2 (1)
,g 7 2 >10
'1()1. '100. '102.
11. 11.
'17.
8 3 4
4 4 5
99. 6~ 0 9 1
37,96 61.67
'151. 161. 19q. 129. 1%.
'186. 1~5. 218. 163. 183.
1 0 3 6 9 8 9 5 0 6
'39, 99
, 33,85 2 0 0 5 0 6 1 0
'12. 71 '86
'1, 64 r 3. 25 '6,68 '4, 18 r 4, 52
(1)
'40, 84 9
6 1 2
'34, 70 '12.81
rS5 '2,091 '3, 314
2 '6, 86
' 133. • 145. I
'136. 0
3 3
149 .. '94.
'107. 2 '131. 3
r 74.2 '102. 3 '63. 8
'189. 7
'1~5. 3
(I)
(1) '154. 8
(I) '2r6. 5 '145.
(1) '93. '67.
'126. '215 .
(1) '88. (I)
7
7 5 0 6
r Revised. • Preliminary. I Included in total and group indexes, but not available for publication separately. tRevised series. For revised indexes, beginning in 1937 for all industries and January 1938 for durable goods, see table 12, p, 18 of the March 1941 Survey. Index for
transportation equipment revised beginning January 1939: see table 57, p. 17 of the December 1940 Survey. *New series. Indexes of installment accounts and collection ratios for furniture, household appliance, and jewelry stores beginning January 1940 will be shown in a sub
sequent issue. Data for mining, construction, transportation and public utilities, Government, and military and naval forces are correct as published in table 11 on pp. 17 and 18 of the March 1941 Survey. Estimates of total civil nonagricultural employment, employees in nonagricultural establishments, manufacturin~:, and service'industries (included in the miscellaneous group) have been revised beginning January 1929 and trade beginning January 1935, to adjust monthly estimates to the 1939 Census levels of employ~es in manufacturing concerns engaged in clerical, distribution, or construction activities, and retail trade employment, and to figures shown by the 1930 Census of Occupations; the revised data will be published later. Adjusted estimates of employment beginning January 1929 will be shown in a subsequent issue. For indexes beginning 1923 for machine tools and shipbuilding, and index for 1931 through 1938 for aircraft, see tables 39 and 40, pp. 15 aud 16 of tbe October 1940 Survey; for aircraft indexes (revised) {or 1939, see table 57, p. 17 of the December 1940 Survey.
May 1942
Monthly statistics through December 1939, to-~ gether with explanatory notes and references to the sources of the data, may be found in the 1940 Supplement to the Survey
SURVEY OF CURRENT BUSINESS
1942 1941
Octo- I Novem-j Decem-! March March I April I May I June I July I August I te~~~r I ber ber ber
EMPLOYMENT CONDITIONS AND WAGES-Continued
EMPLOYMENT-Continued
Mfg., unadj. (U. S. Dept. of Labor)-Cont. t I
127. 7 Nondurable goodst _. ·--·--·· ... 1923-2.5=100 .. 122.6 116.3 117.8 118.8 121.1 123.9 128.7 127.3 125.4 124.8 Chemical, petroleum, and coal products
153.7 131.6 136.8 142.0 146.6 148.6 148.4 148.5 1923-25= 100 .. 135. 7 135.4 139.0 Chemicals._ ................. ------ ..... ·-- .do ....... 185.9 159.3 162.4 166.8 172.2 175.9 180.1 182.4 183.6 184.8 185.8 Paints and varnishes _______________ do .... 140. 8 132.9 137.4 141.4 144.8 145.5 144.8 143.9 143.9 142.6 142.2 Petroleum refining .. ---------------do .... 1~0. () 119.5 120.5 122.0 125.2 127.4 127.9 128.5 129.2 129.1 129.2 Rayon and allied products ......... do .... 312.5 312.2 317.9 323.5 327.0 324.4 329.3 327.0 325.0 322.9 321.1
Food and kindred prodncts __________ do .... 131. 7 120.3 123.6 127.4 135.2 144.8 159.3 '163.2 '152. 5 '145. 9 '141. 0 Baking _____________________________ do .... 150.4 145.0 146.5 149.0 152.2 150.2 152.7 153.5 154.5 153.7 151.5 Slaughtering and meat packing ____ do .... 133.8 110.7 110.2 116.8 120.3 123.1 122.4 123.6 125.9 129.9 138.1
Leather and its manufactures ... - .... do .... 100.9 98.7 98.0 95.5 98.1 101.0 101.1 98.9 98.5 96.7 99.2 Boots and shoes .................... do .... 97.5 97.0 95.8 93.0 94.9 98.1 98.3 95.2 94.7 92.3 95.2
Paper and printing ................... do .... 121.7 118.1 119.4 120.8 121.6 123.0 123.9 124.9 126.5 126.7 128.3 Paper and pnlp ____________________ do .... 129.3 118.5 120.3 122.7 124.6 126.0 127.8 128.4 128.2 128.7 129.1
Rubber products ............................ do ..... ()9. 3 102.8 105.0 106.4 110.7 111.4 111.8 111.5 111.6 111.2 110.3 Rubber tires and inner tubes _______ do .... 74.6 80.0 82.3 83.3 86.3 87.4 86.7 86.5 86.0 86.1 84.9
Textiles and their productst- .......... do .... 113.3 111.6 112.1 112.5 112.6 113.2 115.4 115.5 114.9 113.4 113.0 Fabricst .......................... ------·-- .... do ..... 10·1. 9 102.7 103.7 105.1 106.2 107.0 106.9 106.3 106.4 106.1 106.2 Wearing apparel. ------------------do .... 127.3 '127. 0 126.2 124.2 121.9 122.2 129.6 131.3 129.0 124.9 '123. 2
'fobacco manufactures.------------ .. do .... 65.5 63.3 63.5 64.9 65.5 65.4 65.8 63.9 67.3 68.4 '67. 5 Manufacturing, adjusted (Fed. Res.)t .... do .... 134.2 119.4 122.0 124.9 128.7 133.3 133.3 132.3 132.8 134.4 134.9
Durable goodst .... ----------------------do .... 146. 5 123.0 126.3 129.5 134.0 140.2 141.5 141.3 142.3 143.7 144.4 Iron and steel and their products, not in·
135.1 eluding machinery ____ ...... 1923-25=100~- 126.2 128.3 132.0 136.0 139.1 140.2 139.7 138.2 138.3 139.5 Blast furnaces, steel works, and rolling
148 mills .. ~---- .................. _ ...... _ .... 1923-25 = 100 .... 133 136 140 145 149 150 149 148 148 149 Hardware .......................... do .... 94 116 U5 116 118 105 116 117 115 113 114 Structural and ornamental metal work
1923-25= 100 ... 113 100 101 103 104 105 107 106 107 107 107 Tin cans and other tiuware _________ do .... 128 113 113 122 129 131 132 132 127 138 141
Lumber and allied products __________ do .... 75.0 74.0 74.2 74.6 75.9 78.9 78.4 77.3 76.4 76.9 78.1 Furniture ........ _ ............................ ______ do .... 102 98 101 104 106 108 107 103 101 104 105 Lumber, sawmills ................... do .... 65 65 65 64 65 68 68 68 67 67 68
Machinery, excl. transp. equipment .do .... 193.8 148.1 155.8 161.6 167.3 173.0 177.7 177.8 179.3 181.2 '183.5 Agricultural implements (including trac·
tors) _____ ............................. 1923-25= 100 ... 15~ 126 158 166 170 175 182 181 180 172 167 Electrical machinery, apparatus, and sup-
(1) 153 159 168 168 169 (1) plies ____ .................................... 1923-25=100 .... 142 147 164 168 Engines, turbines, water wheels, and
(1) 243 259 275 315 371 windmills .............................. 1923-25=100 ... 245 293 323 348 (!) Foundry and machine-shop products
1923-25= 100 ... 1.17 124 129 134 139 143 146 147 148 149 150 Machine tools*-----------·----- ...... do ....... (1) 304. 315 326 337 349 366 355 360 365 (1) Radios and phonographs ........... do .... 251 178 189 197 184 191 187 183 179 194 207
Metals, nonferrous, and products ..... do .... 1!5. 7 136.2 138.9 140.7 144.·1 147.8 147.9 144.8 143.1 '142.2 '143.9 Brass, bronze, and copper products_do .... (1) 179 181 183 191 193 195 194 191 191 (1)
Stone, clay, and glass products. ______ do .... 96.7 92.3 92.3 92.1 93.7 98.6 98.4 98.7 98.9 100.9 101.6 Brick, tile, and terra cotta _____ ..... do .... 75 71 70 69 69 73 74 74 73 76 77 Glass ...................................................... do ...... 123 118 121 122 124 131 130 130 131 133 132
Transportation equipmentt ----- ....... do ....... 216.8 154.1 158.7 164.6 174.2 196.1 193.1 195.2 204.5 208.9 205.1 Aircraft* .................................... do ...... (1) 5, 509 5,813 6, 121 6, 522 7,160 7,897 8, 779 9, 459 9, 799 (1) Automobiles~ ____ .................................. do .... 81 123 125 128 132 149 139 128 129 127 111 Shipbuilding• __ .................. _ ................... do ....... (1) 26S 285 301 341 387 398 440 487 532 (1)
Nondurable goodst ........................ __ do ...... 122.5 115.9 1118.0 120.5 123.7 t126.3 125.5 123.8 123.8 125.6 125.9 Chemical, petroleum, and coaljJrod .. do .... 150.9 129.0 133.6 136.9 140.7 143.0 145.2 144.7 145.9 147.0 148.0
Chemicals. ____ .. _ .................................... _do ........ 188 161 163 168 172 173 179 180 181 184 187 Paints and varnishes _______________ do .... 112 134 135 136 140 145 148 145 144 144 144 Petroleum refining ................... do .... 131 121 121 123 125 127 127 127 129 '128 129 Rayon and allied products ......... ilo .... 308 308 324 330 337 326 328 324 323 320 320
Food and kindred products .......... do .... 144.5 131.3 132.5 135.0 137.3 138.4 140.9 138.6 140.7 '146. 9 '147. 3 Baking _____ ........................................ __ ... do~ ...... 11\2 146 148 149 151 149 152 151 152 152 152 Slaughtering and meat packing ....... do~--- 137 113 114 119 121 123 124 125 126 127 133
Leather and its manufactures ....... ~do~.-- 96.4 94.3 95.5 96.8 101.0 100.2 97.9 98.0 99.6 104.2 103.1 Boots and shoes .................... do .... 92 92 93 94 98 97 94 94 96 101 100
Paper and printing ___________________ do .... 122. 1 118.5 119.8 121.2 122.9 124.8 125.1 124.4 124.9 124.8 '125. 9 Paper and pnlp ____________________ do ...... 129 119 120 123 125 126 128 128 128 129 129 Rubber products ........................ ~do .... 98.5 !02.0 103.9 106.1 111.7 113.0 113.3 111.6 110.1 '110. 1 '109. 6
Rubber tires and inner tubes ....... do .... 7.o 80 82 83 86 87 87 87 86 86 85 Textiles and their productst ...... ~~ .. ~.do ....... 109.3 107.6 109.8 112.9 116.1 120.0 ll7.1 114. 7 112.9 113.3 '113. 3
Fabricst .. __ --------------· __ ........... do .... 102. ·' 100.4 103.3 105.9 109.0 111.1 109.6 107.2 105.4 105.1 104.4 Wearing appareL ..................... do .... 119.7 119.3 119.8 124.0 127.0 135.0 128.8 126.6 124.7 '126. 9 '128. 3
Tobacco manufactures ............. ~~ ..... do .... 66.2 64.0 65.0 65.8 65.8 65.7 64.4 62.0 64.1 65.0 66.3 Mannfactnring, unadj., by States and cities:
State: Delaware ......................................... 1923-25= 100 ... 138.7 116.7 124.1 129.7 129.4 134.7 142.5 147.5 137.8 136. 1 137. 1 Illinoist .................................... ____ 1935-39= 100~ _ 136.9 120.1 126.1 129.6 133. 1 136.6 140.3 139. 7 139. 1 139.0 139.1 Iowa ... ___________ .............. 1923-25=100 .. 154.5 146.7 149.6 152.3 154.9 156.6 159. 1 160. 1 161.5 161.7 162.8 Maryland ...................................... 1929-31= 100 .... 157.3 122.8 127.4 131.9 135.0 138.9 142.8 144.3 145.4 146.4 147.0 Massachusetts .............................. 1925-27 = 100 ... -------- ~ 92.9 94.9 96.1 97.6 99.1 99. 1 99.5 100.2 100. 1 100.4 New Jersey ................. ~ ___ 1923-25=100 .... 149.8 126.5 129.2 132.3 136.0 138.4 136.9 145.3 144.4 145.3 145.7 New Yorkt .............. ----------- .. 1935-39= 100 ... 145.4 125. 1 126.8 128.0 129.2 131.1 138.0 142.5 142.5 141.1 141.2 Ohiot ...... --------------------- .......... ~ .. do ....... 12~.0 125.9 129.0 131.8 134.6 136.6 •158. 6 137.5 137.2 136.9 Pennsylvania .................... _ ........ 1923-25= 100~ .. 112.5 '100. 2 102.6 104.4 106.7 108.7 110.3 110.6 110.9 111.0 •111.5 Wisconsint ................................... 1925-27= 100 ... 127.4 109.4 116.3 118.7 121.7 122.4 124.7 126.4 126.7 126.5 126.6
City or industrial area: Baltimore. ___ .... _______ .......... 1929-31= 100~ .. 157. G 121.1 125.1 129.9 132.9 137.3 141.7 143. 7 144.8 146.2 146.9 Chicagot ...... ________ .................... 1935-39= 100 .... 137.9 116. 8 124.5 128. 1 130.8 135.8 138. 1 138.4 139.4 140.2 140. 6 Cleveland ........................ ______ 1923-25= 100 .... 139.6 117.4 121.7 12.1. 3 128.5 130. 1 132.7 134. 1 134.2 134.3 130.3 Detroit. ................ _______________ ...... ~ .do.~ .... 111.0 122.5 120.3 123.8 119.6 96.0 116.0 115.0 117.3 119.0 97.4 Milwaukee ... _ .... _____ ...... _ .......... 1925-27 = 100 .... 137.6 120.9 125.3 128.3 131.3 130.2 135.4 136.9 135.9 134.9 135.8 New York ___________________________ do~---
-----·-· 112.8 114.1 113.5 112.8 114.3 121.5 125. 7 126.7 124.7 125.1 Philadelphia ....... ·-·-···-- ___ .. 1923-25= 100 ... 122.0 101.3 103.6 106.7 109.1 110.5 111.8 114.3 116. 3 118.1 118.7 Pittsburgh .............. __ .... _ ............................ _ do ...... 11~.1 104.9 108.3 109.9 112.9 11.o. 6 117. 1 117.1 118.0 118.4 119.3 Wilmington __________________________ do .... 127.8 107. 1 113. 5 116.5 117.1 120.0 120.9 122.4 122.4 125.5 125.7
S-9
1942
J anu- I Febru· ary ary
121. s 149.4 185.9 140.9 129.1 31.o. 9
'1~5. 3 149.5 143.8 '98. 9 '95. 4 124. 7 129. 5 '99. 6 '75. 2 110.8 104.8 119.5 6~. 4
135.6 146. 8
139.8
150 110
108 147
79.1 105 70
1S7. 4
161
(1)
(1)
153 (1)
222 146.8 (1) 104.5
80 134
209.8 (1)
96 (1) 124.9 150.0
189 145 1~0 31:>
148.1 153 139
98.7 95
125.2 130
99.9 76
111.7 103. 7 124.9 69.2
137.8 137.2 158.2 149.5 99.2
"145. 8 138. 9
'l:J5. a llO. 3 124.9
149. s 13~.1 133. 4 J02. 7 13~. 3 (2)
'117. 6 '118. 5 '127. 7
122.
'153. '188. '141. '129. '312. '133. '150. '137. '100. '96.
'123. r 129. '99. '73.
'112. '104. '126. '65.
'134. '146.
0 1 1 6 6 4 0 8 2 6 2 5 0 6 7 6 2 5 9 8
'136 ..
14 9 4 •9
•11 2 1 8 4 8 8
'14 '77. •10
6 '190.
16
(1)
(!)
'15 (1)
r 23 '146.
(1) '99.
5 2
'7 9 8 6 6
12 '214.
(1) '8
(1) '123. !r 152.
19
5 7 1 3 1 8 5 2 8 3 2 4 0 7 4 6 9
14 r ]~
30 r 147.
15 '13
'96. '9
'123. 13
98. '7
'109. '101. '122. '66.
13~. 137. 153. 153. 100 .
•148. 143. 135.
•111. 125.
154. 139. 137. 104. 135.
-------'120. '118. 127.
1 7 3 4 . 5 3 4 4 7 7
1 0 7 6 1
3 8 5
'Revised. 1 Included in total and group indexes, but not available for publication separately. 2 In process of revision . . t Revised series. For revisions for all industries, durable goods and nondurable P?Ods, see p. 18 of _the March 1941 Survey. Index for transp?rtation equipment revised
begmmng January 1938; see table 57. p. 17 of the December 1940 Snrvey. Slight rev1s10ns were made m data for textlles and products and fabncs beginning 1933· revisions prior to March 1939 wbich have n~t bee'!' published are ~vailable up?n request. For revisions in Illinois and Chicago indexes, see note marked with a "t" on p: 29 of the January 1941 Survey. Index for W1sconsm rev1sed begmnmg 1925; rev1scd data not shown on p. 72 of the February 1941 Survey wlll appear in an early issue. Earlier monthly data on indexes be~inning 1923 for Ohio f2ctory employment revised to 1935-39 base are shown on p. 17 of the March 1942 Survey. Earlier data for the revised New York State index will appear in a subsequent issue.
• New series. For indicated series see note marked with an"*" on p. S-8 of this issue.
S-10
Monthly statistics through December 1939, to-~ gether with explanatory notes and references to the sources of the data, may be found in the 1940 Supplement to the Survey
SURVEY OF CURRENT BUSINESS
ber ber ber
1942 1941
Octo- j Novem-1 Decem- I March I April I May I June I July I August I te~~~r I March
EMPLOYMENT CONDITIONS AND WAGES-Continued
EMPLOYMENT -Continued
Nonmfg., unadj. (U.S. De pt. of Labor): Mining:
Anthracite.----------- ---------.1929= 100 .. Bituminous coaL _____ _ _______________ do ____ Metalliferous ... _____ _ _______________ do ....
cing __________ do ... _ Crude petroleum prodn Quarrying and nonmet alii c •......... do ... _
Public utilities: rt ............ do ____ Electric light and powe
Street railways and bu Telephone and telegrap
sest ______ ..... do .... hf ____________ do ____
Services: _______________ do ____ _______________ do ____ Dyeing and cleaning __
Laundries. _________ __ Year-round hotels ____ _ _______________ do ____
Trade: _______________ do ____ ngt ___________ do ....
Retail, totalf _________ _ General merchandisi
Wholesale ____________ _ _______________ do ____ data:
_______ 1935-39= 100 .. ays, totalt.number ..
Miscellaneous employment Construction, Ohiot----Federal and State highw
Construction (Federal Maintenance (State) __
Federal civilian employe
and State) .•.. do ____ _______________ do ____ es:
United States ________ _ _______________ do ____ _______________ do. ___ District of Columbia
Railway employees (class TotaL_--------------Indexes: Unadjusted __
I steam railways): _________ thousands __ ....... 1923-25= 100.-
Adjusted ____ _ ______________ do ____
LABOR COND ITIONS
·orker in factories: industries)_ .hours ..
Average weekly hours per " Nat!. Ind. Con. Bd. (25 U. S. Dept. of Labor (90 Industries) ___ .do .. __
Industrial disputes (strikes and lockouts): Beginning in month ____ _ ___________ number __ In progress during month Workers involved in strik
_____________ .do ____ es:
Beginning in month __ _ _________ thousands .. th ____________ do ____ In progress during mon
Man-days idle during mo Employment security opera
Placement activities:
nth ___________ do ____ tions (Soc. Sec. Bd.):
Applications: Active file __________ _ ______ - __ thousands __ New and renewed __ _ _______________ do ____
Placements, total t ___ _ _______________ do ____ Unemployment com pens ation activities:
Continued claims ____ _ _______ .. thousands __ Benefit payments:
payments§ __ do ____ ----- __ thous. of doL ablishments: per 100 employees ..
Individuals receiving Amount of payments
Labor turn-over in mfg. est Accession rate __ mo. rate Separation rate, totaL .. _______________ do .....
Discharges ___________ _ _______________ do ____ Lay-offs__ ____________ _ _______________ do ____ Quits and miscellaneou s ___________ ... do. ___
PAYRO LLS
(U. S. Department Manufacturing, unadjusted of Labor) t ------------ _______ 1923-25= 100 ..
Durable goods t _______ _ _______________ do ____ ir products, not in-
------- .1923-25= 100_ Iron and steel and the
eluding machinery Blast furnaces, steel works, and rolling mills _____________ _ ------ .1923-25= 100.-Hardware __________ _ ______________ _do ____ Structural and ornam ental metal work
1923-25=100 __ Tin cans and other t inware ________ do ____
ducts __________ do ____ _______________ do ____ Lumber and allied pro
Furniture _____ . ____ _ Lumber, sawmills ... _______________ do ____
Machinery, excl. trans Agricultural implem
p. equip _______ do ____ ents (including trac-
tors) ______________ _ ------ .1923-25= 100.-Electrical machiner y, apparatus, and
supplies __________ _ ------ .1923-25= 100.-Engines, turbines, water wheels, and
windmills ________ _ ------ .1923-25= 100 .. Foundry and machin e-shop products
1923-25=100 .. Machine tools* ____ _ _______________ do ____ Radios and phonogra phs ___________ do ____
d products ____ do ____ Metals, nonferrous, an Brass, bronze, and co
Stone, clay, and glass p Brick, tile, and terra
pper products. do ____ roducts _______ do ____ cotta .. _______ do ____
Glass .• -------------_______________ do ____
48.5 50.2 48.7 48.6 93.6 91.1 23.5 87.9 81.4 74.3 77.2 77. 1 59.5 60.2 60.1 60.4 47.5 44.2 48.2 51.0
89.6 90.3 91.3 92.2 71.3 68.2 68.3 68.9 90.2 81.8 83.2 84.6
114.0 104.4 117.2 120.6 107.9 102.5 104.9 108.3 93.6 94.2 95.2 96.3
94.2 92.5 97.8 96. 1 104.8 96.6 108.7 102.5 94.0 91.8 92.4 92.2
--------- 116.8 139.8 150.8 --------- 193,898 235,876 285,397
92,363 87,038 127,634 ------ -· 101, 535 110,912 118,945
----- ... 1,202,348 1,251,283 1,306,333 --------· 167, 081 172, 876 177, 328
--- ----- 1,074 1,104 !, 148 66.6 58.8 60.5 63.0 68.5 60.5 61.0 62.3
--------- 41.2 40.7 41.3 --------- 40.4 40.0 40.8
p 240 '348 '403 '463 p 320 '499 '592 '669
p 65 '118 512 '322 p 80 '179 '567 '420
p 450 1, 558 '7, 113 '2, 172
P4, 552 5,170 5,097 5, !56 p 1, 570 1, 606 1,825 I, 539
P510 429 489 622
•3, 977 3, 738 4, 270 3, 914
P803 762 590 659 •43, 035 33,608 26,998 31,574
--------- 5. 62 6.04 5. 91i --------- 3. 40 3. 89 3. 86 --------- . 21 . 25 . 24 --------- 1.06 I. 19 I. 08 --------- 2.13 2.45 2.54
181.9 131.2 134.7 144.1 216.3 144.6 149.9 163.1
181.6 141.2 150.9 160.9
194.2 149.0 164.1 172.7 137.0 138.1 135.7 141.5
139.9 97. 1 103.4 113.8 152. 7 121.8 127.3 146.4 86.2 72.8 7.). 7 78.0
115.4 93.9 95.2 102.7 72.4 62.7 66.4 66.0
304.9 186. 2 197.4 217.2
246.5 162.0 229.6 229.0
(1) 185.9 192.3 215.3
(1) 378.6 372.4 444.1
227.5 143.6 152.2 166.2 (1) 471.5 472.2 507.2 290.2 157.2 163.9 191. 5 206.6 '155. 5 157.2 166.7 (1) 236.7 234.8 246.6 105.5 85.2 91.1 97.8 68.7 56. 1 62.4 69.1
172.7 140.5 143. 5 150.3
49.2 49.3 50.0 50.0 50.3 50.2 49.1 88.1 90.3 92.6 94.2 95.3 95.1 95.5 78.9 79.0 79.9 79.4 79.7 79.5 80.2 61.5 62. 1 62.2 61.8 61.6 60.9 61.1 51.9 52.7 53.9 54.2 54.1 52.6 50.9
93.5 94.6 95.2 94.9 94.1 93.4 93.1 69.1 69.5 69.7 70.3 70.3 70.2 70.6 86.3 88.3 89.6 90.3 90.6 90.1 90.0
122.7 121.7 118.9 121.5 121.2 117.2 113.3 112.0 115.8 114.6 113.0 111.2 108.9 108.4 95.0 94.5 94.5 95.7 96.2 96.1 95.3
97.8 96.7 96.9 100.0 101.0 103.0 113.0 105. 1 100.9 103.0 111.7 116.4 125.9 161.5 93.8 94.2 95.8 95.6 96.3 96.3 96.3
163.0 166.5 167.7 164.7 H\2.3 157.2 146.4 318,436 331,438 340, 146 320,301 300,381 270,202 224,762 142,185 152,691 158,744 149.800 135, 622 Ill, 755 75, 131 134,896 136, 651 138,631 128,415 124, 523 118,559 110,311
1,370,110 1,391,689 1,444,985 1,487,925 1,511,682 1,545,131 1,670,922 184,236 185, 182 186,931 191,588 194, 265 199,283 207,214
1, 179 1, 211 1, 231 1, 235 1, 243 1, 227 I, 211 64.7 66.5 67.6 67.8 68.2 67.3 66.3 63.3 64.8 66.0 66.5 66.3 66.8 68.0
41.7 41.0 41.2 41.6 41.7 41.5 41.6 41.3 40.3 41.0 40.9 41.1 40.3 41.2
'357 '439 '465 '470 '432 '271 '143 , 571 '635 '698 '687 '664 '464 '287
143 '143 '212 '295 '198 '228 '30 '227 '226 '305 '3.18 '348 '339 '59
1, 504 '1, 326. '1,825 t" 1, 953 'I, 925 '1,397 '476
5,126 4, 982 4, 699 4, 356 4, 229 4, 234 4, 413 1, 623 1, 597 1, 446 I, 396 1, 488 1, 327 I, 603
624 630 6il 1,108 935 583 493
3, 5i6 3, 623 3, 045 2,650 2, 548 2, 597 3, 618
684 611 572 493 430 '471 523 30, 561 29, 307 26,494 22,942 21,430 2!,066 27,8·17
6. 31 6.00 5. 43 5.16 4.87 3. 91 4. 76 3. 71 4. 24 4.14 4. 53 4.13 '3. 51 4. 71 . 26 • 29 • 30 • 31 .28 . 24 . 29
1.03 I. 40 1.13 1.16 1. 41 'I. 44 2.15 2.42 2.55 2. 71 3.06 2.44 1. 85 2. 27
152.2 152.7 158.1 162.6 167.0 165.4 , 169.9 173.9 172.2 177.6 183.3 191.4 190.3 '195. 4
168.6 166.6 172.0 170.6 173.4 171.9 '174. 2
179.9 181.6 183.3 178.4 181.1 183.2 185.0 150.2 123.8 145.7 148.7 151.5 '147. 4 '137. 7
120.1 112. 5 125.2 123.6 127.2 116.0 121.2 163.2 171.3 184.7 187.6 171.7 !65.8 173.6 83.9 85.5 92.3 90.8 92.3 86.4 85.8
110.0 110.1 116. 1 118.0 120.6 118.8 120.9 71.1 73.5 80.3 77.5 78.2 70.2 68.0
229.9 233.0 243.4 248.2 255.7 255.3 '269.6
233.3 228.4 227.5 230.7 231.6 223.9 219.0
224.0 232.0 240.0 241.3 244.7 242.1 (1)
484.7 506.9 545.1 572.9 615. 5 676.3 (1)
177.8 176.5 186.0 187.8 194.7 191.4 202.8 529.3 534. 7 553.4 578.2 596.3 599.1 (1) 200.4 218.7 234.0 254.4 261.7 '267. 0 '286. 3 174.6 173.7 182.6 185.6 185.9 182.0 '192. 3 262.2 263.8 273.6 270.8 267.6 260.6 (1) 100.2 98.9 104.2 105.4 109.5 105.8 106.6 71.8 73.4 77.0 76.2 75.8 72.9 72.6
153.5 147.1 155.4 160.5 173.7 168. 2 171.1
May 1942
1942
Janu-1 Febru-ary ary
'49.0 '95. 1 , 80.7
61.3 '46. 8
92.0 '70. 4 '90.4
109.8 '108. 8
94.2
'95. 5 '105. 5
94.9
'125. 6 194,092 49, 113
105,920
1,703,099 223,483
1,192 65.4 68.2
42.4 41.5
'131 '214
'25 '41
'329
'4, 899 1, 956
439
4, 584
797 41,056
6. 87 5.10 . 30
1.61 3. 21
'173.4 '204.4
'173. 7
'184. 5 '133. 4
125.0 180.9 81.8
110.9 67.5
'284. 2
228.8
(1)
(1}
211.2 (1)
'276. 6 '198. 0
(1) '99.4 '65. 2 166.1
48. 94. 80. 60. 46.
90. 70. 89.
109. 107. 94.
94. 105. 94.
8 4 7 5 3
6 5 7
6 4 2
3 4 3
125. 1 59 52 87
183,5 44,8
101,0
1,805,1 233,4
86 03
1, 1 93 4 0
65. 68.
42. 42.
p 1
4 2
90 5 p 27
p
p 57 80
p 42 5
'4, 88 8 2
27 r 1, 53
'4
4, 10 3
8 83 39,8 84
6.0 0 8 9 5 4
4. 7 . 2
1.3 3.1
'178. '210.
'178.
'190. '132.
'133. '164. '86.
'115, f' 72. 294.
'240.
(1)
(1)
'219. (1)
'279. '201.
(1) '103. '66.
'171.
2 7
4
5 0
5 6 0 6 1 8
9
0 6
7 8 2
• Preliminary. 'Revised. 1 Included in total and group indexes, but not available for publication separately, §Data are a weekly average of the number receiving benefits, based on an average of the weeks of unemployment compensated during weeks ended within the month. tTotal includes State engineering, supervisory, and administrative employees not shown separately; see note on p. 27 or the May 1941 Survey. tRevised series. Telephone and telegraph indexes revised beginning 1932, other indicated nonmanuracturing employment series beginning 1929; seep, 17 of the April
1940 Survey, except for indexes for street railways and busses beginning 1932, which were subsequently re,·ised as shown in table 27. p. 17 or the May 1940 issue. Indexes beginning 1923 for Ohio construction employment are shown in table 8, p. 18 of the March 1942 Survey, Total placements revised to include placements formerly classified as "supplementary" because of the omission of one or more of the steps necessary for a complete placement. Most of these placements were so classified because of lack of registration and were largely placements in agricultural jobs. Only complete placements were formerly shown in the Survey. Data comparable with the series here shown will be published in a subsequent issue. For revisions in pay-roll index for all manufacturin~t and durable ~toods for 1938 and 1939, see table 12, p, 18 of the March 1941 Survey.
*New series. For pay-roll indexes beginning 1923 for machine tools,see table 40, p. 16 of the October 1940 Survey.

May 1942
Monthly statistics through December 1939, to-~ gether with explanatory notes and references to the sources of the data, may be found in the 1940 Supplement to the Survey
SURVEY OF CURRENT BUSINESS
ber ber ber Octo· I Novem-1 Decem- I
1942 1941
March I April I May I June I July I August I te~~~r I March
EMPLOYMENT CONDITIONS AND WAGES-Continued
PAY ROLLS-Continued
Mfg., unadj. (U.S. Dept. of Labor)-Con. Durable goods-continued
Transportation equipmentt _ .1923-25=100 •• 347.9 197.2 191.6 217.0 240.0 228.8 224.4 252.6 282.0 287.8 r 290.6 Aircraft• _ •.• --------- .............. do .... (1) 6, 678.3 7, 134.4 7,697.3 8, 193.5 9, 045.7 10,303.0 11,145.8 12,301.6 13,204.6 (1) Automoblles .................... -.. do ..•• 130.9 163.1 147.3 170.6 188.3 158.0 139.2 159.3 176.6 175.8 147.9 Shipbuilding• .. __ ....... __ ......... do .... (1) 365.0 395.4 433.9 505.9 582.0 614.6 703.8 803.4 827.1 (1)
Nondurable goorlst .................... do ____ 143.4 116.3 117.7 122.9 127.9 130.7 136.3 139.5 139.6 137.4 r 141.3 Chemical, petroleum, and coal products
1923-1925= 100 .. 211.0 149.1 158.3 164.9 172.4 176.3 180.0 187.0 194.3 195.6 200.9 Chemicals ........ --------- ..... __ .do .... 275.8 201.7 208.3 221.8 232.7 239.7 247.2 250.9 260.9 264.6 271.6 Paints and varnishes ............... do .... 179.2 147.4 157.9 170.4 177.8 172.7 171.5 169.9 173.8 172.2 175.9 Petroleum refining _________________ do .... 179. 2 133.4 142.4 146.3 156.7 157.2 159.1 166.4 168.0 167.9 173.9 Rayon and allied products ......... do .... 393.9 332.9 342.3 356.2 362.4 368.6 368.2 374.3 386.4 385.2 391.2
Food and kindred products .......... do .... 150.2 122.4 125.2 134.7 144.4 152.8 165.5 r 170.5 163.0 157.7 157.2 Baking ____ ... _ ........ ___ .......... do .... 160.5 140.0 140.9 148.4 154.4 153.1 155.2 157.4 157.6 159.7 157.5 Slaughtering and meat packing ____ do .... 159.4 114.2 115.1 133.1 137.8 139.4 142.9 145.8 151.1 153.7 168.9
Leather and its manufactures ........ do .... 115.5 96.1 92.3 91.0 97.2 103.2 104.7 101.6 100.5 97.0 106.7 Boots and shoes ____________________ do ____ 110.1 94.2 89.1 86.7 91.9 98.8 100.7 95.3 93.3 88.4 99.5 Paper and printing ___________________ do .... 134.9 120.3 121.2 124.9 128.6 128.6 130.9 133.3 135.9 137.5 •144.1
Paper and pulp .................... do .... 175.2 136.4 139.1 145.6 157.7 156.9 162.7 163.0 165.4 166.9 •169.8 Rubber products ____ . __ ... _. __ .. ____ .do __ .. 134.7 119.5 122.3 128.7 141.1 135.6 138.8 134.8 138.0 140.6 136.9
Rubber tires and inner tubes _______ do ____ 107.1 •102.8 106.3 111.1 122.4 118.4 116.4 107.3 111.8 117.6 108.6 Textiles and their productsf __________ do ____ 129.2 107.0 107.0 110.4 111.4 113.6 119.3 123.4 122.4 118.3 • 122.1 Fabricst ... ________________________ do ____ 124.7 101.1 104.1 109.3 111.6 113.3 114.4 118.0 120.2 118.9 123.7
Wearing appareL .................. do ____ 130.1 112.2 106.2 105.9 104.1 107.1 121.7 126.3 119.2 109.8 •111.6 Tobacco manufactures. _____________ _cto ____ 70.2 62.7 58.9 67.1 70.2 69.8 70.0 70.4 75.6 77.1 • 76.8
Manufacturing, unadj., by States and cities: State:
Delaware _____________________ 1923-25=100 __ 193.8 128.1 137.3 150.1 156.0 159.9 169.5 173.7 169.5 171.9 182.4 IJlinoist _. --------------------1935-39=100 __ 194.3 140.8 151.6 161.6 170.5 170.2 178.7 180.5 183.7 181.7 188.4 Maryland ___ . ____ ........ __ .. 1929-31 =100_. 259.6 161.2 174.3 189.2 196.2 202.5 207.9 215.2 224.5 221.4 234.0 Massachusetts _____ ... __ ----- .1925-27 =100 __ --------- 101.0 104.0 110.2 114.5 117.2 116.9 121.3 120.7 119.5 125.7 New Jersey -------------------1923-25=100 __ 219.0 145.6 147.5 161.1 169.0 173.9 173.0 189.3 188.5 190.0 198.5 New Yorkt ------- ____________ 1935-39=100 __ 216.4 151.5 153.8 161.3 166.2 170.4 184.3 194.5 190.0 186.7 194.2 Ohio• ______ ------------------ ________ do ____ 159.8 167.0 176.6 186.3 188.3 190.4 190.9 195.7 194.9 202.8 Pennsylvania _________________ 1923-25=100_. --i47:6 109.0 114./i 121.7 127.2 126.3 131.1 131.2 136.2 135.2 •139.6 Wisconsin t ____ . ____ ... _. _. _. _1925-27 = 100_.
City or industrial area: 188.1 134.8 142.5 150.9 159.5 154.6 163.8 164.6 173.2 170.5 172.9
Baltimore ____________________ 1929-31=100 __ 263.7 164.2 178.4 194.5 200.6 207.4 212.8 220.9 229.6 226.9 240.4 Chicagot _____________________ 1935-39=100 __ 191.0 135.1 148.7 158.2 166.1 168.9 174.8 177.8 180.3 179.9 186.9 Milwaukee ... _. ___ . _____ ..... 1925-27= 100. _ 195.0 144.5 151.7 157.8 163.9 159.3 169.7 168.2 175.0 173.8 180.2 New York_. _____ ------------------- _do ____ --------- 115.2 115.9 118.0 119.1 123.3 134.3 142.4 135.4 133.6 141.2 Philadelphia. __ --------- _____ 1923-25= 100 __ 173.3 114.0 114.7 126.4 134.0 136.8 139.1 144.0 149.9 151.8 159.0 Pittsburgh __ ._._ .. ___ . ____ . _______ . __ do ___ . 159.8 118.7 131.6 138.4 143.9 140.5 146.3 143.6 150.6 149.8 r 153. 1 Wilmington __________________________ do ____ 173.9 115.9 124.1 134.9 138.8 141.3 146.0 145.9 149.7 153.8 163.2
Nonmfg .. unadj. (U.S. Dept. of Labor): Mining:
Anthracite. __ . _______ ------ _____ 1929=100 __ 51.0 42.4 24.3 33.4 51.2 34.8 51.1 49.6 49.2 41.8 35.9 Bituminous coaL .. __ ---------- _____ .do ____ 116.6 93.8 15.8 107.2 107.2 105.4 117.3 115.5 122.6 116.3 119.9 Metalliferous ___________ ... ___ . __ . ____ do __ ._ 98.8 72.7 78.9 81.5 85.3 79.3 85.4 85.9 88.3 89.8 93.7 Crude petroleum producing __________ do ____ 63.3 56.1 57.8 58.8 59.9 61.4 61.5 64.4 64.4 64.2 64.6 Quarrying and nonmetallic ________ ... do ____ 54.3 40.3 47.0 53.2 55.7 55.5 59.3 60.5 61.5 57.5 55.8
Public utilities: Electric light and powert ___________ .do ____ 114.2 106.1 107.6 109.6 111.4 113.5 115.1 115.0 115.7 115.2 115.2 Street railways and busest __________ .do ____ 85.1 72.5 72.0 72.7 76.2 75.8 78.6 78.1 78.4 78.2 80.0 Telephone and telegrapht ____________ do ____ 122.4 106.4 107.1 110.5 113.0 115.7 116.4 117.3 117.0 118.3 122.9
Services: Dyeing and cleaning _________________ do ____ 92.9 77.2 97.8 96.1 98.4 96.4 92.1 99.5 98.5 93.0 88.6 Laundries ________ .. __ .... _________ .. -do ____ 104.2 90.9 95.8 98.7 102.5 106.7 104.7 105.2 103.4 101.9 102.6 Year-round hotels ________ --------- __ _cto ____ 92.0 85.7 87.1 87.9 87.4 87.6 88.2 90.0 91.9 93.2 93.3
Trade: Retail, totaJt ___________ ---------- ____ do ____ 93.9 86.2 91.7 91.5 95.2 94.0 94.0 95.8 97.3 98.5 107.8
General merchandisingt------- _____ do ____ 105.1 88.3 98.6 96.0 100.1 97.5 99.3 106.6 110.9 117.8 151.1 Wholesale __________________________ .. do ____ 93.9 82.0 83.4 84.6 88.2 88.0 89.8 90.9 92.0 91.6 92.8
WAGES
Factory average weekly earnings: Nat!. Ind. Con. Bd. (25 industries) __ dollars __ --------- 31.80 31.89 33.12 34.26 33.70 34.10 35.10 35.65 35.74 36.08 U.S. Dept. of Labor (90 industries) ____ do ____ --------- 29.11 29.17 30.78 31.88 31.22 31.66 32.06 32.89 32.79 '33. 70
Durable goods_ .. ------------ ________ do ____ --------- 33.49 33.54 35.57 36.91 35.84 36.55 36.82 37.92 37.63 '38. 62 Iron and steel and their products, not in-
eluding machinery ___________ dollars __ --------- 32.65 34.40 35.71 36.40 35.53 36.07 35.60 36.49 36.41 • 36.99 Blast furnaces, steel works, and rolling
mills ___ .... ------ .•...•••••.. dollars._ --------- 34.94 37.87 38.98 39.46 38.90 38.81 37.81 38.63 39.06 39.26 Hardware ________________________ do ____ --------- 28.95 28.64 29.89 31.26 29.20 31.42 31.35 32.29 '32.07 • 31.90 Structural and ornamental metal work
dollars __ --------- 32.35 33.71 36.13 36.98 34.04 36.92 36.51 37.59 34.89 36.89 Tin cans and other tinware ______ do .... --------- 25.53 26.17 27.27 27.70 27.59 28.42 28.92 29.56 27.39 28.89
Lumber and allied products ________ do ____ --------- 21.68 22.16 22.57 23.57 23.21 24.68 24.47 25.12 24.12 '24.30 Furniture_. ___ .. _ ................ do_ ... 23.03 23.22 24.35 25.12 24.68 25.49 26.03 26.71 26.07 26.81 Lumber, sawmills ________________ do ____ --------- 20.32 '21.02 20.74 21.89 21.60 23.49 22.72 23.22 21.79 '21.48
Machinery, excl. transp. equip .... Ao .... 35.02 35.20 37.17 38.00 37.53 38.19 38.47 39.23 38.96 '40.67 Agricultural implements (Including
tractors). __ .... __ ............ dollars __ 33.54 37.52 36.88 37.32 36.62 36.31 37.12 37.46 36.72 35.96 Electrical machinery, apparatus, and
supplies _____________ . ______ ._ dollars __ 34.46 34.41 36.68 37.01 37.06 37.41 37.24 37.78 37.16 '38. 90 Engine~. turbines, water wheels, and
windmills ____ .. __ ... __ .... __ .dollars_. 40.43 38.30 43.39 45.03 45.02 45.94 46.62 47.81 50.64 '50.64 Foundry and machine-shop products
dollars .. --------- 34.39 34.75 36.51 37.78 36.61 37.72 37. 77 38.84 38.00 39.86 Machine tools• _______ . __________ .do .... --------- 41.49 41.10 42.79 43.22 42.80 43.53 44.74 45.54 45.17 48.82 Radios and phonographs ________ .do ____ --------- 25.79 25.31 27.02 27.09 28.30 28.32 29.25 29.42 • 30.03 '32.01
S-11 1942
Janu- I Febru-ary ary
r 329.3 (1) 153.6 (1) 138.7
202.0 275.7 172.5 171.1 392.4 154.6 158.2
r 182.3 r 107. 3 '101. 0
136.5 171.9
• 127.4 •103.1
119.8 122.0
• 108.1 '72. 6
187.9 188.4 241.0 129.3
• 205.3 197.8
• 203.6 '139. 4
175.2
247.5 189.1 182.0 (I)
'160.6 '153. 3 '169. 2
•39.4 '117.1 • 94.3 r 64.8 •48.9
•114. 6 • 80.5
'120. 9
'86. 5 '103.8 • 91.5
• 94.7 '106. 5
r 91.8
• 37.47 '35.15 •41.00
'37.36
'39.13 '33.02
38.07 29.62
'23.86 25.72 21.89
'42. 55
38.25
'40. 68
'55.04
41.09 50.81
'32.17
r 337. (1)
r 135. (!)
'141.
'208. '278. '176. '178. '391. '150.
159. '162. '113. r 107. '135. '174. '127. •101.
127. '123. • 125. '72.
188. 192. 251. 132.
r 210. 210. 210.
r 145. 182.
256. 189. 187.
0
0
8
8 3 4 3 3 6 6 6 4 8 1 0 4 8 1 8 7 3
7 4 5 6 2 0 9 2 2
0 1 0
--------• 168. • 157.
169.
49. 118. 98. 63. 51.
113. 83.
120.
85. 102. 92.
93. 105. 93.
6 5 4
7 2 5 9 7
0 5 8
8 2 1
5 0 2
37.4 35.7 41.6
9 6 0
38.3
40.2 34.0
39.9 28.0 24.9 26.5 23.3 43.0
6
0 8
6 6 8 4 1 5
39.7 7
0
9
41.1
52.8
41.98 50.8 7
84 32.
• Revised. • Included in total and group indexes, but not available for publication separately. ' In process of revision. tRevised series. For revisions in indexes for nondurable goods, for 1938 and 1939, see table 12, p. 18 of the March 1941 Survey. Index for transportation equipment re
vised beginning January 1939, see table 57, p. 17 of the December 1940 Survey. Slight revisions were made in data for textiles and their products and fabrics beginning 1933; revisions not shown on p. 27 of the May 1940 Survey are available upon request. For revisions in Illinois and Chicago indexes, see note marked with a "t" on p. 29 of the Jan· uary 1941 Survey. Earlier data for the revised New York State index will appear in a subsequent issue. Index for Wisconsin revised beginning 1925; revised data not shown on p. 74 of the February 1941 Survey will appear in an early issue. Telephone and telegraph pay-roll indexes revised beginning 1932, other indicated nonmanufac· turing pay-roll indexes revised beginning 1929; see table 19, p. 17 ot the April 1940 Survey.
•New series. Data beginning April1931 on Ohio pay rolls are shown on p. 17 of the March 1942 issue; for other indicated pay-roll series, see last sentence of note marked with an "*"on p. S-8 of this issue. Earlier monthly data for wage series on machine tools not shown on p. 29 of the March 1941 Survey are available upon request.
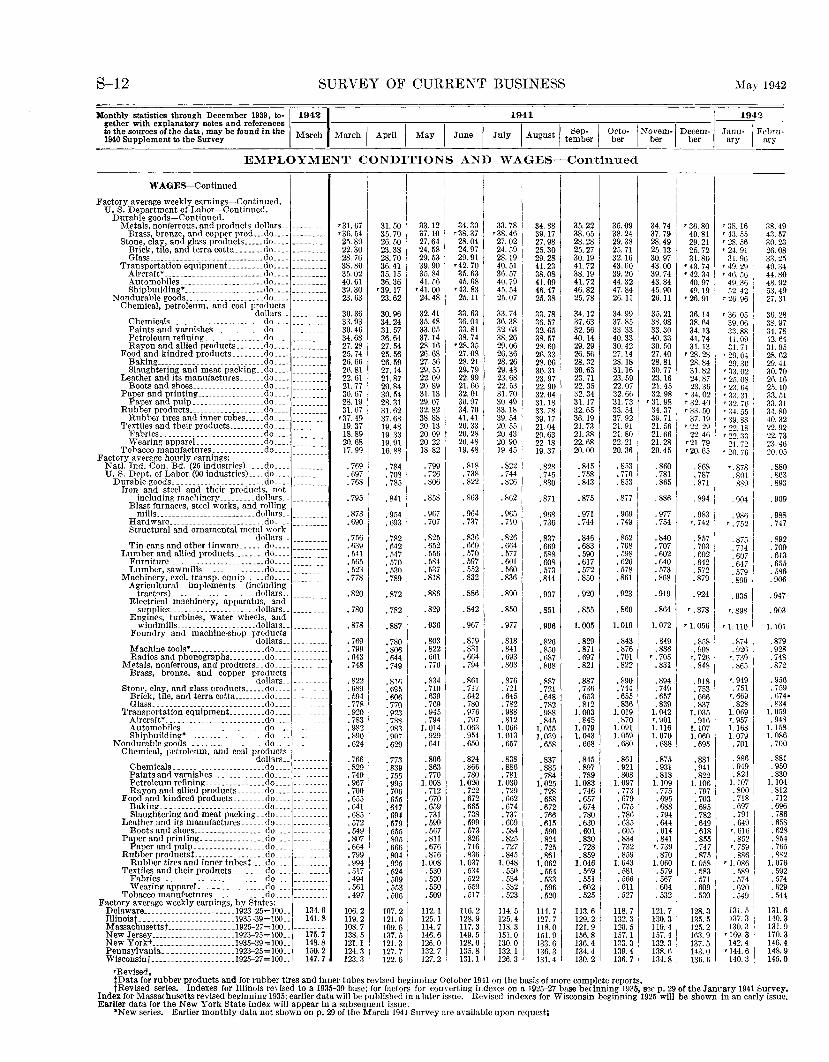
S-12 SURVEY OF CURRENT BUSINESS May 1942
Monthly statistics through December 1939, to-~19421 1941 I 1942 gether with explanatory notes and references ---
1 to the sources of the data, may be found in the March March I April I May I June I July August I Sep- I Octo- I Novem-1 Decem- Janu- I Fehru-1940 Supplement to the Survey tember ber ber ber ary ary ---------------~--~--~--~--~--~--~--~--~--~---~----~-----
EMPLOYMENT CONDITIONS AND WAGES-Continued
WAGES-Continued
Factory average weekly earnings-Continued. U.S. Department of Labor-Continued.
Durable goods-Continued. Metals, nonferrous, and products.dollars .. ____ _
Brass, bronze, and copper prod ... do ____________ _ Stone, clay, and glass products ..... do ___ _
Brick, tile, and terra cotta _______ do ____________ _ Glass _______________ . __ .. _________ do ____ . _______ _
Transportation equipment _________ do ___ _ Aircraft* ___________ . _____________ do ___ _ Automobiles _____________________ do ____ . ______ __ Shipbuilding*---------- __________ do .... ________ _
N endurable goods ____________________ do ___ _ Chemical, petroleum, and coal products
dollars .. _______ __ Chemicals _______________________ do ___ _ Paints and varnishes _____________ do ____________ _ Petroleum refining _______________ do ___ _ Rayon and allied products _______ do ..•. ________ _
Food and kindred products ________ do ____________ _ Baking __________________________ .do .. __________ _ Slaught-ering and meat packing __ do ___ _
Leather and its manufactuces ______ do ___ _ Boots and shoes __________________ do ____________ _
Paper and printing _________________ do ___________ _ Paper and pulp __________________ do ___________ __
Rubber products _________ ----- ____ .do ___ _ Rubber tires and inner tubes ..... do ___ _
Textiles and their products _________ do ___ _ Fabrics __________________________ do ___ _ Wearing appareL ________________ do ___ _
Tobacco manufactures _____________ do ___ _ Factory average hourly earnings:
Nat!. Ind. Con. Bd. (25 industries)_ ___ do ___ _ U.S. Dept. of Labor (90 industries) ____ do _____________ _
Durable goods. ______________________ do ___________ _ Iron and steel and their products, not
including machinery ________ .dollars .. Blast furmices, steel works, and rolling
mills ________________________ .dollars __ Hardware _______________________ .do. __ _ Structural and ornamental metal work
dollars .. ________ _ Tin cans and other tinware ______ do ____________ _
Lumber and allied products ........ do ___ _ Furniture ______ ------ _________ .•. do ___ _ Lumber, sawmills ________________ do ___ _
Machinery, excl. transp. equip _____ do __ __ Agricultural implements (including
tractors) __________ ... _______ .dollars._ Electrical machinery, apparatus, and ------
supplies ___________ ------ ___ .. dollars .. ________ . Engines, turbines, water wheels, and
windmills ____________________ dollais .. Foundry and machine-shop products
dollars .. __ _ Machine tools• ____________________ do. _____ . _ Radios and phonographs _________ do .... __
Metals, nonferrous, and products .. do ___ _ Brass, bronze, and copper products
dollars .. --Stone, clay, and glass products ..... do ____ ---- --
Brick, tile, and terra cotta ________ do ___ _ Glass ____________________________ do ______ _
Transportation equipment_ ________ do _______ _ Aircraft* ___ -------- ________ . ____ .do ___ _ Automobiles.--------------- ____ .do ________ _ Shipbuilding• ____________________ do. _____ _
Nondurable goods ___________________ do ______ _ Chemical, petroleum, and coal prorlucts
dollars .. ---Chemicals. ______________________ do ____ ----. Paints and varnishes. ____________ do ____ -----Petroleum refining _______________ do ____ -----Rayon and allied products ....... do ____ -----
Fooil and kindred products ________ do ___ _ Baking __________________________ do ____ ------- __ Slaughterin~t and meat packing_ .do ___ _
Leather and its manufactures ...... do ___ _ Boots and shoes __________________ do ___________ _
Paper and printing ________________ do _______ _ Paper and pulp __________________ do ___ _
Rubber productst------------ ______ do .. __ Rubber tires and inner tubest .... do ___ _
Textiles and their products ________ do ____________ _ Fabrics. ______ ------------ _____ .. do. _______ . __ _ Wearing appareL _______________ do ___________ _
Tobacco manuhctures. ____________ do ___ _ Factory average weekly earnings, by States:
Delaware _________ -------- ______ 1923-25= IOO.. 134. 6 Illinoist ___ -------------------- .1935-39= 100.. 141. 8 Massachusettst----- __________ .. 1925-27= IOO .. New Jersey--------- _________ ... 1923-25= 100 .. New Yorkt ---------------------1935-39=100 .. Pennsylvania __________________ I923-25 = 100 .. Wisconsin t ---- _________________ I925-27 = 100 .•
rRevised.
175.7 148.8 150.2 147.7
'31. 67 '36. 54 25.89 22.30 28.76 38.80 35.02 40.61 39.30 23.63
30.36 33.93 30.46 34.68 27.28 25.74 26.66 26.81 22.61 21.77 30.67 28.19 31.67
'37. 49 19.37 18.89 20.68 17.99
• 7f>9 . 697 . 768
'795
.873
. 690
• 756 • 639 .54! .565 '523 • 778
• 820
• 780
.878
'769 • 799 , 643 • 748
. 822
.689 • 594 .77g • 920 • 783 • 982 • 890 • 624
• 766 .829 . 749 • 967 • 700 • 655 • 641 • 685 . 572 .549 .M7 • 664 • 799 . 994 • 517 • 494 • 56I • 497
106.2 Il9. 2 108.7 I38. 5 121. I 124. 3 123.3
31.50 35.70 26.50 23.38 28.70 36.41 35. 15 36.36
'39.17 23.62
30.96 34.24 31.57 36.64 27.54 25.56 26.59 27.14 21.87 20.84 30.54 28.31 31.62 37.68 19.48 19.33 19.91 16.88
. 784
. 708
. 785
. 841
.9M
.693
• 782 . 642 .517 • 570 •• o30 • 789
,872
• 782
.887
• 780 .806 .644 '749
.816 • 695 .fl06 • 770 . 923 . 788 . 983 • 907 .629
• 773 .839 • 755 • 995 • 706 • 655 ,647 ,694 • 579 . 555 . 805 • 666 ,804 • 995 .524 • 509 • 553 '506
107.2 121.0 IOU. 6 137.5 I21. 3 127.7 I22.6
33. I2 37.10 27.64 24.58 29.53 39.90 35.84 41.56
'41. 00 24.48
32.41 35.48 33.05 37.14 23.16 26.6~ 27.56 29.55 22.09 20.89 31.13 29.07 32.82 38.88 20.13 20.09 20.22 18.82
• 799 . 726 • 806
• 858
• 967 . 707
. 825
. 652
. 556
. 584 • 537 • 818
.886
. 829
• 936
.803
.822
.661
. 770
.834 • 710 • 639 . 769 • 945 . 794
1.014 . 929 • 641
.806
. 863
. 770 I. 008 . 712 .670 • 659 • 731 .590 • 567 • 811 .676 .816
I.OOS . 530 . 520 . 550 .509
112.1 125. I 114.7 146.6 126.0 132.7 127.2
34.30 '38. 37 28.04 24.97 29.91
'42. 70 35.63 45.68
'43. 83 25. 11
33.63 36.04 33.81 3~. 74
'28.35 27.08 28.21 29.79 22.99 21.66 32.01 30.97 34.70 41.41 20.33 20.28 20.48 19.481
:m1 . 822 i
. 863
. 964
. 737
. 836 • 660 . 570 . 597 . 552 . 832
.886
.842
'967
.819 • 831 • 664 • 794
. 861 • 717 • 642 • 780 . 976 . 797
I. 063 . 954 .650
. 824
.866 • 780
1.020 • 722 • 672 • 665 • 738 • 599 .573 .826 . 716 . 836
1.037 .534 .522 . 559 .517
116.2 128.9 117.3 149.5 I28.6 135.8 131. I
I
I 33.78 I
'38.46 1
27. o2 1
24.59 I 28.19 40. 51 36.57 40.79 45.54 25.07
33.74 36.38 32.63 38.26 29.06 26.36 28.26 29.43 23.68 22.53 31.70 30.49 33.18 39.54 20.55 20.43 20.90 19.45
. 822 • 744 .826
. S62
• 965 .710
.826
. 664
. 577
.601
. 560
.836
. 890
. 850
• 977
.818
. 841
. 693
.803
.876
. 721
. 645 • 782 . 988 .812
I. 066 I. 013 .657
. 838
.886 • 781
1.030 • 729 . 662 .674 .737 .609 • 584 .825 • 727 .845
1.048 . 550 . 534 i . 5821 . 523
114.5 125. 4 118. 3 151.0 130.0 132. 1 126.3
34.88 39.17 27.98 25.30 29.28 41.23 38.08 41.09 46.47 25.38 I
33.78 3G. 57 32.65 38. 57 28.60 21\.33 28.06 30.31 23.97 22.90 32.04 31.18 33. 78 39. 17 21.04 20.63 22 18 19.37
. 828
. 745
. 830
.871
. 968
.736
. 837
. 669
. 588
. 608
. 573
.8<14
• 907
• 851
• 996
.826
.850
.687
.808
.887 • 721 .648 '782 • 988 • 845
1.055 I. 039 • 658
.837
. 885
. 784 1.025 .728 • 658 . 672 • 766 .615 . 590 . 824 . 725 '861
I. 062 • 554 • 533 • 596 . 520
114.7 127. 7 118.0 151.9 133.6 136.3 131.4
35.22 38.65 28.28 25.27 30.19 41.72 38.19 41.72 46.82 25.78
34.12 37.63 32.56 40. l4 29.29 26.56 28.32 30.63 23.71 22.35 32.34 31.17 32.65 36. 19 21.73 21.38 22.68 20.00
• 845 • 758 • 843
.875
• 971 • 744
• 846 .683 . 590 . 617 .572 .850
• 920
.855
I. 005
.829 • 87I .697 .82I
.887
.736 • 653 .812
1.003 .845
1.079 I. 043 • 668
.845 • 897 . 789
1.083 • 746 • 657 .674 • 780 • 630 . 601 . 830 • 728 .859
I. 046 . 569 . 551 .602 . 525
113. 6 129.2 121.9 156.8 136.4 I34. 4 130.2
I I
35.o9 I 38 24 I 29.381 25.71 32.16 43.6o I 39.20
!~:~; I' 26.11
34.99 37.85 33.33 1
~g: ~~ I 27.14 28.18 31.16 23.59
~~: ~ll "31. 73 I 33. 54 1
37.92 21.91 21.80 22.21 20.36
• 853 • 770 . 853
.877
. 969 '749
• 852 • 708 • 598 . 626 .578 • 861
.923
• 860
I. 019
• 843 .876 • 701 .822
.890 • 744 • 655 .836
1.019 . 870
1.091 I. 059 . 680
.861
. 921
. 808 1.097
. 773
. 679
. 675
. 786 • 635 . 605 .834 . 732 .859
I. 043 . 58! . 566 . 611 . 527
118. 7 132.3 120.5 157.1 1?3.3 139. 4 136.7
34.74 37.79 28.49 25. 13 30.97 43.00 39.74 43.84 45.90 26.11
35.21 38.08 33.30 40.33 30.50 27.40 28.81 30.77 23.16 21.45 32.98
'31. 98 34.37 39. 71 21.56 21.66 21.28 20.45
. 860 • 781 . 865
. 886
. 977
. 754
. 840 • 707 . 602 • 640 . 573 .868
• 919
. 864
1. 072
. 849
.886 , . 705
. 831
.894 • 749 • 657 . 839
I. 042 '· 901 1.116 1. 070 .688
.875 • 931 . 818
1.109 . 775 . 695 . 688 . 794 • 644 . 614 .841
'· 739 . 870
I. 060 . 579 . 567 . 604 . 532
121.7 130.3 119.4 157.4 132.3 138.6 134.8
'36. 80 40.81 29.21 25. i2 31.80
'43. 74 '42. 34
40.97 49.19
'26. 91
36. 14 38.64 34. !3 41.74 31.13
'28. 28 28.84 31.82 24.87 23.36
'34. 02 '32. 40 '33. 50
37. 19 '22. 29
22.46 '21. 79 '20. 65
.868
. 787
. 871
. 894
. 983 '· 742
. 857
. 703
. 602 • 642 • 572 .879
• 924
'. 878
'1.056
.858
. 908 '· 726 . 848
. 918
. 753 • 666 . 837
1.035 • 916
1.107 1. 060
• 695
. 881 • 941 .822
1.106 . 797 • 703 • 695 • 782 .649 . 618 .855 . 747 . 875
I. 058 . -583 . 571 . 609 . 530
128.3 135.5 I25. 2 163.9 137.5 143.0 136.6
'38.16 '43. 55 '28. 56 '24. 91
31.96 '49. 29 '46. 56
49.36 52.42
'26. 96
'36. 05 39.06 33.88 41.09 31.71
'29. 04 29.30
'33. 02 '2.5. 08 'Z:l. 64 '~~- 31 T 32. 76 '34. 55 '39. 88 '22.18 '22. 3~
21.72 r 20. 713
'. 878 . 801 889
. 904
. 986 r. 752
.875
. 714
. 607
. 647
. 579
. 899
. 935
'.898
'1.110
. 874
. 926 r. 739 . 865
'· 949 . 751
'· 669 . 828
I. 069 '· 957 1.168 ). 079 . 701
. 886
. 949
. 824 I. 107 .800 . 718 . 697 . 791 . 649
'· 616 .852
r. 759 . 886
'1.086 . 589 . 574 . 620 . 549
131. 5 137.3 130. 3
'169. 3 142.4
'144. 6 140.3
38.49 43. 57 30.23 26.08 33.25 49.34 44.80 4B. 92 53.49 27.31
36.28 38.97 34.78 42.64 31.95 28.62 29.41 30.70 26.16 25.10 33.51 33.31 34.80 40.32 22.92 22.73 23.46 20.05
. 880
. 803
. 893
. 909
. 988
. 747
. 892
. 709
.613
. 655
. 586
.906
. 947
. 903
1.101
. 879
. 928
. 748
. 872
. 956
. 759
. 674•
. 834 ). 059 . 948
I. 158 I. 086 . 700
. 881
. 950
.830 1.104 . 812 .712 . 696 . 786 . 658 . 628 .854 . 765 . 882
). 076 . 592 • 574 . 629 . 544
131.6 140.3 131.9 170.3 146. 1 148.9 I45. 0
tData for rubber products and for rubber tires and inner tubes revised beginning October 1941 on the basis of more complete reports. tRevised series. Indexes for Illinois revised to a 1935-39 base; for factors for converting indexes on a 1925-27 base be~ inning 1925, seep. 29 of the Janeary 1941 Survey.
Index for Massachusetts revised beginning 1935: earlier data will be published in a later issue. Revised indexes for Wisconsin beginning 1925 will be shown in an early issue. Earlier data for the New York State index will appear in a subsequent issue.
*New series. Earlier monthly data not shown on p, 29 of the March 1941 Survey are aYailable upon request;
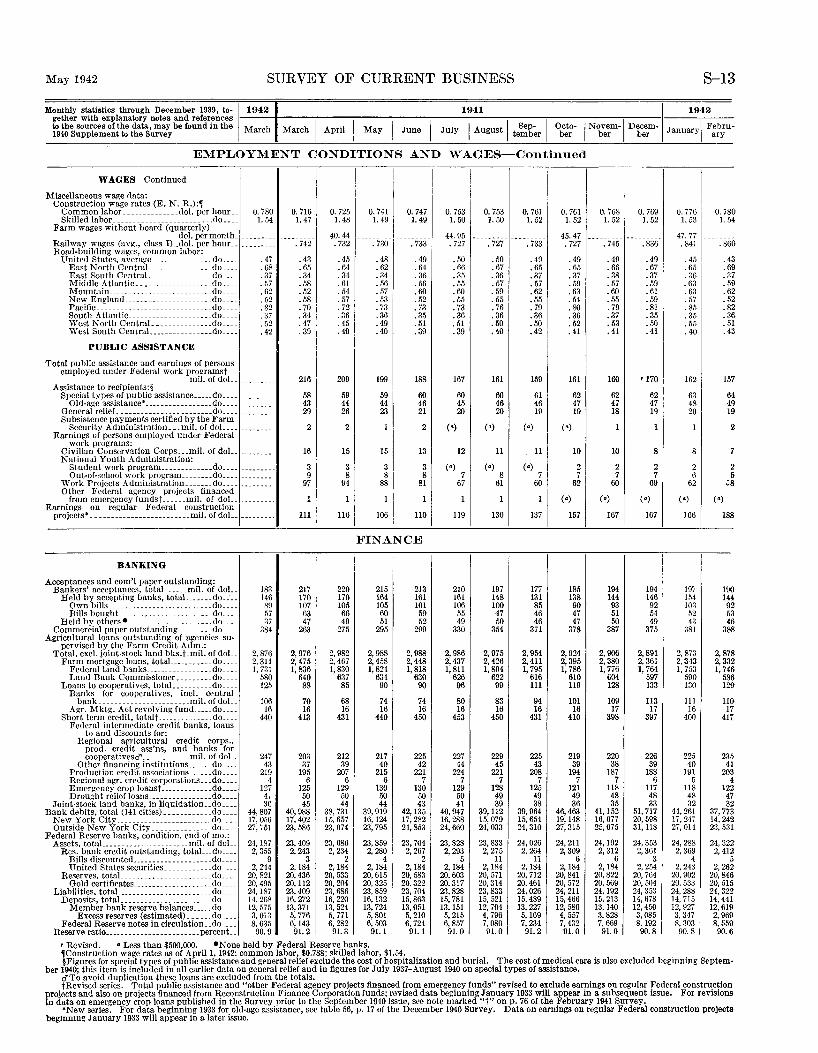
May 1942 SURVEY OF CURRENT BUSINESS S-13
Monthly statistics through December 1939, to-~ 1942 1941 I 1942 gether with explanatory notes and references
I I I I I August I te~~~r I to the sources of the data, may be found in the March March April May June July Octo- I Novem-1 Decem- Ja uar 'I Febru· 1940 Supplement to the Survey I ber ber ber n 3 ary
EMPLOYMENT CONDITIONS AND WAGES-Continued
WAGES-Continued
Miscellaneous wage data: Construction wage rates (E. N. R.) :,
Common Iabor ______________ dol. per hour .... 0. 780 0. 716 0. 725 0. 741 0. 747 0. 753 Skilled labor .. ________________________ do ........ 1. 54 1. 47 1. 48 1. 49 I. 49 1. 50
Farm wages without board (quarterly) dol. per month .. --------- 40.44 ----- --------- 44.95
Railway wages (avg., class I) .... dol. per hour .... . 742 . 732 . 730 . 733 . 727 Road-building wages, common labor:
United States, average _______________ do ........ .47 . 43 .45 .48 . 49 . 50 East North CentraL _______________ do ........ .68 . 65 .64 . 62 . 64 • 66 East South CentraL _______________ do ........ . 37 . 34 . 34 .34 . 36 .35 Middle Atlantic .. __________________ do ........ . 57 . 58 . 61 .56 . 56 . 55 Mountain __________________________ do ....... . 62 . 52 .54 . 57 .60 .60 New England ____________________ .... do ....... . 52 .58 . 57 . 53 . 52 . 55 Pacific .. ____________________________ do ....... . 82 . 70 . 72 . 73 • 73 . 73 South Atlantic _____________________ do ____ . 37 . 34 . 36 . 36 . 35 . 36 West North CentraL ______________ do ....... . 52 . 47 . 45 .49 . 51 . 51 West South CeniraL _______________ do ........ . 42 . 39 .40 . 40 .39 . 39
PUBLIC ASSISTANCE
Total public assistance and earnings of persons employed under Federal work programst
mil. of doL --------- 216 209 199 188 167 Assistance to recipients:§
Special types of public assistance ......... do ........ --------- 58 59 59 60 60 Old-age assistance• _____________ ........ do .. ___ 43 44 44 46 45
General relief .... ------------ __________ do ....... --------- 29 26 23 21 20 Subsistence payments certified by the Farm
Security Administration ...... mil. of doL ...... Earnings of persons employed under Federal
--------- 2 2 2 (•)
work programs: Civilian Conservation Corps ...... mil. of doL 16 15 15 13 12 National Youth Administration:
Student work program .......................... do ........ --------- 3 3 3 3 (•) Out-of-school work program ............. do ..... --------- 9 8 8 8 7
Work Projects Administration ........... do .... 97 94 88 81 67 Other Federal agency projects financed
11:1
from emergency fundst ........... mil. of dol. .. ---------Earnings on regular Federal construction
projects• _________ ................... mil. of doL. --------· 111 106 110 119 I
FINANCE
BANKING I Acceptances and com'! paper outstanding:
Bankers' acceptances, totaL _____ mil. of dol.. 183 217 220 215 213 210 Held by accepting banks, totaL ........ do ...... 146 170 170 164 161 161
Own bills ____ ................. - ....... do ____ 89 107 105 105 101 106 Bills bought.. ................... ______ do .. __ 57 63 66 60 59 55
Held by others• .............................. do ...... 37 47 49 51 52 49 Commercial paper outstanding ................ do ____ 384 263 275 295 299 330
Agricultural loans outstanding of ag~ncies su-pervised by the Form Credit Adm.:
Total. excl. joint-stock land bks. t .. mil. of doL. 2, 876 2, 976 2, 982 2,988 2, 988 2,986 Farm mortgage loans, totaL __________ do ..... 2, 311 2,475 2,467 2,458 2,448 2,437
Federal land banks ............................. do ....... 1, 731 1, 836 1,830 1,824 1,818 1, 811 Land Bank Commissioner ............... do ____ 580 640 637 634 630 626
Loans to cooperatives, totaL ................. do ____ Banks for cooperatives, incl. c~ntral
125 88 85 90 90 96
bank _______________________ mil. of doL. 106 70 68 74 74 80 Agr. Mktg. Act revolving fund ....... do .... 16 16 16 16 16 16
Short term credit, totaJt ______________ do ........ 440 413 431 440 450 453 Federal intermediate credit banks, loans
to and discounts for: Regional agricultural credit corps.,
prod. credit ass'ns, and banks for cooperativesd" ........................ mil. of doL 247 203 212 217 225 227
Other financing institutions ......... do ... _ 43 37 39 40 42 44 Production credit associations ......... do ____ 219 195 207 215 221 224 Re~ional agr. credit corporations ...... do ____ 4 6 6 6 7 7 Emergency crop loanst ......................... do ...... 127 125 129 130 130 129 Drought relief loans _________ , ___ ... do .... 4, 50 50 50 50 50
Joint-stock land banks, in liquidation .. do ....... 30 45 44 44 43 41 Bank debits, total (141 cities) ................ do ____ 44,807 40, 9F8 38,731 39,919 42, 135 40,947
New York City ________________________ do ____ 17, 056 17.402 15.657 16,124 17,282 16,288 Outside New York City _______________ do ____ 27,751 23,586 23,074 23,795 24,853 24,660
Federal Reserve banks, condition, end of mo.: Assets. totaL. .. __________________ mil. of doL. 24,187 23,409 23,686 23,859 2:3,704 23,828
Res. hank credit outstanding, totaL. .. do ..... 2, 355 2,243 2, 234 2,280 2,267 2, 293 Bills discounted ....................... do ____ 9 3 2 4 2 5 United States securities ____________ do ____ 2, 244 2,184 2,184 2,184 2,184 2,184
Reserves. totaL ................ ____________ do .... 20,821 20,436 20,533 20,615 20, 583 20,603 Gold certificates ________ ·-·- ........... do ___ .. 20,495 20,112 20,204 20,325 20.322 20,317
Liabilities, totaL. ........................... do ....... 24,187 23,409 23,686 23,859 23,704 23,828 Deposits, total .. ____ ... ________________ do ____ 14,268 16,272 16,220 16,132 15,863 1.5, 781
Member bank reserve balances _____ do ....... 12,575 13, 371 13,524 13,724 13,051 13,151 Excess reserves (estimated) .......... do ..... 3, 013 5, 776 5, 771 5,801 5, 210 5, 215
Federal Reserve notes in circulation .... do ....... 8,635 6,143 6, 282 6, 503 6, 724 6,857 Reserve ratio ... -............... ______ percent.. .. 90.9 91.2 91.3 91.1 91.1 91.0
• Revised. • Less than $500.000. •None held by Federal Reserve banks.
I I !
I 0. 753 0. 761 0. 761 0. 768 1. 50
........ ;~:: .. , 1. 52 1. 52
45.47 ---------• 727 . 727 • 745
.50 .49 . 49 .49
. 67 .65 . 65 . 66
.36 . 37 . 37 . 38
.57 .57 .59 . 57
.59 . 62 . 63 . 60
. 55 . 55 .54 . 55
. 76 . 79 . 80 . 79
. 36 . 36 .36 . 37
.50 . 50 .52 . 53 • 40 .42 .41 • 41
161 159 161 160
60 61 I
62 62 46 46 47 47 20 19 19 18
(•) (•) (•)
11 11 10 10
(•) (•) 2 2 8 7 7 7
61 60 62 60
13~ 1
(•) (•)
130 !57 167
I 197 177 185 194 148 131 138 144 100 85 90 93 47 46 47 51 50 46 47 50
354 371 378 387
2, 975 2, 954 2, 924 2,906 2,426 2,411 2,395 2, 380 1,804 1, 795 1, 786 I, 776
622 616 610 604 99 111 119 128
83 94 101 109 16 16 16 17
450 431 410 398
229 225 219 220 45 43 39 38
221 208 194 187 7 7 7 7
128 125 121 118 49 49 49 48 39 38 36 35
39,112 39,964 46,463 41, 152 15,079 15,654 19,148 16,077 24,033 24,310 27,315 25,075
23,833 24,026 24, 211 24,192 2, 275 2, 264 2, 309 2, 312
11 11 6 6 2,184 2,184 2,184 2,184
20,571 20,712 20,841 20,822 20,314 20,461 20,572 20,569 23,833 24,026 24,211 24, 192 !5, 521 15,489 15,466 15,213 12,794 13, 227 12,580 13,140 4, 796 5,169 4, 557 3,828 7, 080 7, 234 7,432 7, 669 91.0 91.2 91.0 91.0
0. 769 0. 776 1. 52 1.53
--------- 47.77 . 836 . 841
.49 . 45
. 67 . 65
.37 . 36
. 59 . 63
. 61 . 63
.59 . 57
.81 . 85
. 35 . 35
. 50 .55
. 41 .40
'170 162
62 63 47 48 19 20
8 8
2 2 7 6
69 62
(•) (•)
167 166
194 197 146 154 92 103 54 52 49 43
375 381
2,891 2, 873 2, 361 2, 343 1, 764 1, 753
597 590 133 130
113 111 17 16
397 400
226 225 39 40
188 191 6 5
117 118 48 48 33 32
51, 717 44,261 20,598 17. 247 31,118 27,014
24,353 24,288 2, 361 2, 369
3 4 2, 254 2, 243
20,764 20,902 20,504 20,533 24, 3.53 24,288 14,678 14,715 12,450 12,927 3, 085 3, 347 8. 192 8. 303 90.8 90.8
0.180 1.54
. 860
.43
. 69
.37
. 59
.62
. 52
.82
.36
. 51
.43
157
64 49 19
2
2 0
~8
(•)
188
19 0 4 2 3 6 8
14 9 5 4
38
2, 87 8 2 6 6
2,33 1, 74
58 I 29
11 0 7 1
411
23 41 5
3 4 2 7 2 3 2
20
12 4 3
37,77 14,24 23, 531
24,32 2,41
2, 26
2 2 5 2
20,846 20,515 24,32 2 14,441 12,619 2, 969 8, 559 90.6
,Construction wage rates as of April!, 1942: common labor, $0.788; ~killed labor, $1.54. §Figures for special types of public assistance and general relief exclude the cost of hospitalization and burial. The cost of medical care is also excluded beginning Septem·
ber 1940; this item is included in all earlier data on general relief and in figures for July 1937-August 1940 on special types of assistance. d"To avoid duplication these loans are excluded from the totals. tRevised series. Total public assistance and "other Federal agency projects financed from emergency funds" revised to exclude earnings on regular Federal construction
projects and also on projects financed from Reconstruction Finance Corporation funds; revised data beginning January 1933 will appear in a subsequent issue. For revisions in data on emergency crop loans published in the Survey prior to the September 1940 issue, see note marked "t" on p. 76 of the February 1941 Survey.
*New series. For data beginning 1933 for old-age assistance, see table 56, p. 17 of the December 1940 Survey. Data on earnings on regular Federal construction projects beginning January 1933 will appear in a later issue.
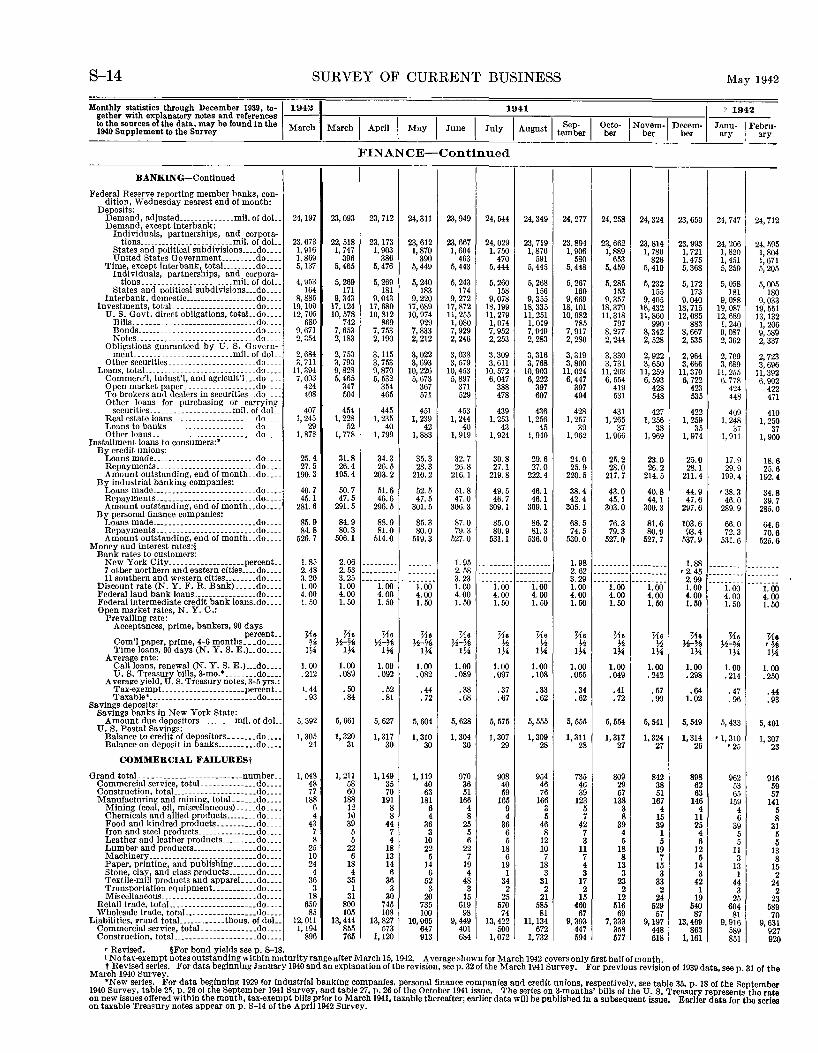
8-14 SURVEY OF CURRENT BUSINESS
Monthly statistics through December 1939, to-~19421 19U gether with explanatory notes and references ---
1 1 to the sources of the data, may be found in the March March I April I May June I July August I Sep- I 1940 Supplement to the Survey tember
FINANCE-Continued
BANKING-Continued
Federal Reserve reporting member banks, con-dition, Wednesday nearest end of month:
Deposits: Demand, adjusted ______________ miJ. of doL. 24,197 23,093 23,712 24,311 23,949 24,544 24,349 24,277 Demand, except interbank:
Individuals, partnerships, and corpora-tions ________________________ miJ. of doL 23,673 22,518 23, 173 23, 612 23, 667 24, 029 23,719 23,894
States and political subdivisions .... do ____ 1, 916 I, 747 I, 903 1,870 I, 604 1, 750 I, 876 1,906 United States Oovernment. ________ do ____ I, 869 396 386 390 463 470 591 580
Time, except interbank, totaL ________ do ____ 5, 137 5,465 5,476 5,449 5,443 5,444 5,445 5,448 Individuals, partnerships, and corpora-
tions. ----------------- .... mil. of doL. 4, 953 5,269 5, 269 5,240 5, 243 5,260 5, 268 5, 267 States and political subdivisions ... do .... 164 171 181 183 174 158 !56 160 Interbank, domestic __________________ do ... _ 8,885 9, 343 9,043 9,220 9, 272 9,078 9,355 9,669
Investments, totaL. ___________________ do ____ 19, 100 17, 124 17,680 17,689 17,872 18, 199 18,335 18, 101 U.S. Oovt. direct obligations, totaLdo ____ 12,705 10,578 10,812 10,974 11,255 1!, 279 11,251 10,982 Bills _______________________________ do ____ 680 742 869 929 1, 080 I, 074 1,019 785 Bonds _________ . ___________ ._ .... _ .. do .. __ 9,671 7, 653 7, 753 7,833 7, 929 7, 952 7, 949 7, 917
Notes _________________ -----_-----_ .do. __ . 2, 354 2,183 2,190 2, 212 2, 246 2, 253 2, 283 2,280 Obligations guaranteed by U. S. Govern-
ment _________________________ mil. of doL 2, 684 2, 753 3,115 3,022 3, 038 3,309 3,316 3,319 Other securities _______ . ___________ . __ do_. __ 3, 711 3, 793 3, 753 3, 693 3, 579 3, 611 3, 768 3, 800 Loans, totaL _________ -------·------ ____ do ____ 11,394 9,828 9,870 10,226 10,453 10,572 10,903 ll, 024
Commerc'l, indust'l, and agricult'L .. do ___ . 7, 003 5,465 5, 532 5, 673 5, 897 6, 047 6, 222 6,447 Open market paper_ ----·-----·--- ... do ____ 424 347 354 367 371 388 397 397 To brokers and dealers in securities .. do ____ 408 504 465 571 529 478 607 494 Other loans for purchasing or carrying
407 securities _____________________ mil. of doL. 454 445 451 453 439 436 428 Real estate Ioans _____________________ do ____ 1, 245 I, 228 I, 235 1, 239 I, 244 1, 253 1, 256 1, 257 Loans to banks _______________________ do ____ 29 52 40 42 40 43 45 39 Other loans .. ________________________ do ____ 1, 878 Installment loans to consumers:•
I, 778 I, 799 1,883 I, 919 1, 924 1, 940 1, 962
By credit unions: Loans made ........•..• _ .....••.•.... do .... 25.4 31.8 34.3 35.3 32.7 30.8 29.6 24.0 Repayments _________________________ do ____ 27.5 26.4 26.5 28.3 26.8 27.1 27.0 25.9 Amount outstanding, end of month .. do .... 190.3 195.4 203.2 210.2 216.1 219.8 222.4 220.5
By industrial banking companies: 40.7 50.7 51.6 52.5 51.8 49.5 46.1 38.4 Loans made .......................... do ..•.
Repayments ......................... do .... 45.1 47.5 46.6 47.5 47.0 46.7 46.1 42.4 Amount outstanding, end of month .. do .•.. 281.6 291.5 296.5 301.5 306.3 309.1 309.1 305.1
BU:~~o::,~d~n~~=~-~~~~~~~~~--------do ____ 85.9 84.9 88.9 85.3 87.0 85.0 86.2 68.5 Repayments ....... ------------------do .... 84.8 80.3 81.0 80.0 79.3 80.9 81.3 74.5 Amount outstanding, end of month .. do ____ 526.7 506.1 514.0 519.3 527.0 531.1 536.0 530.0
Money and interest rates:§ Bank rates to customers:
New York City ................... percent.. 1. 85 2.06 --------- --------- I. 95 --------- --------- 1. 98 7 other northern and eastern cities .... do .... 2. 48 2. 53 --------- --------- 2. 58 --------- --------- 2.62 11 southern and western cities ........ do .•.. 3. 20 3.25
·---i~iiii- --------- 3.23 --------- --------- 3.29 Discount rate (N.Y. F. R. Bank) _____ do ____ 1.00 I. 00 1.00 1.00 1.00 1.00 I. 00 Federal land bank loans" _______________ do .... 4.00 4.00 4.00 4.00 4.00 4.00 4.00 4.00 Federal intermediate credit bank loans.do .... 1. 50 I. 50 1. 50 1.50 1. 50 I. 50 1.50 1.50 Open market rates, N.Y. C.:
Prevailing rate: Acceptances, prime, bankers, 90 days
~1· l'-1• l'-1• l'-1• l'-1• l'-1• l'-1• l'-1• percent .. Com') paper, prime, 4-6 months ..• do ••.. §1\ l-2-% l-2-% l-2-% J-2-% l-2 l-2 l-2 Time loans, 90 days (N.Y. S. E.) .. do •••. IH Hi !M 1H Hi IH 1M 1~
Average rate: 1.00 1.00 Call loans, renewal (N.Y. S. E.) ... do .... 1.00 1. 00 1.00 1.00 1.00 1.00
U.S. Treasury bills, 3-mo.• ........ do .•.. .212 .089 .092 .082 .089 .097 .108 .055 Average yield, U. S. Treasury notes, 3-5 yrs.:
.50 .37 .33 .34 Tax-e)tempt __ .. __ -------- .. -----percent .. '· 44 . 52 .44 .38 Taxable• __ ......................... do .••• . 93 .84 . 81 • 72 .68 .67 .62 .62
Savings deposits: Savings banks in New York State:
Amount due depositors ....•.... mil. of doL U. S. Postal Savings:
5, 392 5, 661 5,627 5, 604 5,628 5,575 5,555 5,555
Balance to credit of depositors ...•.•. do .••• 1, 305 1,320 1, 317 1, 3!0 I, 304 !, 307 1,309 1, 311 Balance on deposit in banks .......... do .••• 24 3! 30 30 30 29 28 28
COMMERCIAL FAILURESt
Orand totaL ----------------------- .. number __ 1,048 I, 211 I, 149 1,119 970 908 954 735 Commercial service, totaL _____________ do .... 48 58 35 40 36 40 46 46 Construction, totaL ________ ---------- .. do .... 77 60 70 63 51 59 76 39 Manufacturing and mining, totaL _____ do .... 188 188 191 181 166 165 166 123
Mining (coal, oil, miscellaneous) ..... do ..•• 6 12 8 6 4 9 3 5 Chemicals and allied products ........ do ____ 4 10 8 4 8 4 5 7 Food and kindred products .......... do ____ 43 39 44 36 25 36 46 42 Iron and steel products _______________ do .... 7 5 7 3 5 6 8 7 Leather and leather products ......... do .... 8 5 4 !0 6 5 12 3 Lumber and products ................ do .... 25 22 18 22 22 IS 10 11 Machinery ___________________________ do .... 10 6 13 5 7 6 7 7 Paper, printing, and publishing ______ do .... 24 18 14 14 19 19 18 4 Stone, clay, and ~lass products ....... do ____ 4 4 6 6 4 I 3 3 Textile-mill products and appareL ... do .... 36 35 36 52 48 34 31 17 Transportation equipment ........... do .... 3 1 3 3 3 2 2 2 Miscellaneous ...... _. __ .......... -- .. do ... _ 18 31 30 20 15 25 21 15
Retail trade, totaL .................... do .... 650 800 745 735 619 570 585 460 Wholesale trade, totaL ................ do .... 85 105 108 !00 98 74 81 67
Liabilities, vrand totaL .....•.... thous. of doL. 12, 011 13,444 13,827 10,065 9,449 13,422 11, 134 9,393 Commercial service, totaL -------------do .... I, 194 855 573 647 401 500 672 447 Construction, totaL ...... -- .... ------ .. do .... 896 765 1, 120 913 684 1,072 1, 732 594
r Revised. §For bond yields seep. S-18.
October
24,258
23, 662 1, 889
653 5,459
5,285 153
9,357 18,379 11,318
797 8, 277 2,244
3, 330 3, 731
11,203 6, 554
419 531
431 1,265
37 1, 966
25.2 28.0
217.7
43.0 45.1
303.0
76.3 79.3
527.0
---------------------------
1.00 4.00 I. 50
l'-1• l-2 1~
1.00 .049
.41 • 72
5,554
I, 317 27
809 29 57
138 3 8
39 4 5
18 8
13 3
23 2
12 516
69 7,333
358 577
I N ovem-1 Decem-1 her ber
24,324 23,650
23,814 23,993 I, 780 I, 721
826 I, 475 5,410 5,368
5,232 5, 172 !55 173
9,405 9,040 18,432 18,715 11,860 12,085
990 883 8,342 8,667 2, 528 2, 535
2,922 2,964 3,650 3,666
11,259 11,370 6, 593 6, 722
428 423 548 535
427 422 1, 256 1, 259
38 35 1, 969 1, 974
23.0 25.0 26.2 28.1
214.5 211.4
40.8 44.9 44.1 47.6
300.3 297.6
81.6 103.6 80.9 93.4
527.7 537.9
--------- 1.88 --------- r 2.45 --------- 2.99
1.00 1.00 4.00 4.00 1.50 !.50
l'-1• J'-ie l-2 l-2-%
1M 1M
1.00 1. 00 .242 .298
.57 .64
.90 1.02
5,541 5,549
1,324 1, 3!4 27 26
842 898 38 62 51 63
167 146 4 4
15 11 39 25 1 4 5 6
19 12 7 5
15 14 3 3
33 42 2 1
24 19 529 540
57 87 9,197 13,469
448 863 618 1,161
May 1942
~ 1942
Jann- I Febru-ary ary
24,747
24, 206 I, 820 1,451 5, 259
5, 058 181
9, 088 19, 087 12,689
1, 240 9, 087 2, 362
2, 709 3, 689
11, 255 6, 778
424 448
409 1, 248
37 1, 911
17.9 29.9
199.4
r 38.3 46.0
289.9
66.0 72.3
531.6
---------------------------
1.00 4.00 1.50
l'-1• ~Hi!
IH
1.00 .214
.47
.96
5, 433
r I, 310 r 25
962 53 65
!59 4 6
39 5 5
11 3
13 1
44 3
25 604
81 9,916
589 851
24,71 2
24,59 5 1, 8 04
1 5
I, 67 5,20
5,00 5 0 3 1 2 6 9 7
18 9,03
19,55 13, 13 I, 20 9, 58 2, 33
2, 72 3 6 2 2
22
3, 69 11,39 6, 90
4 47 I
41 I, 25
3
0 0 7 0 1, 90
18. 6 6 4
25. 192.
34. 8 7 0
39. 285.
64. 6 6 6
70. 525.
---------------------
1. 4.
00 00 0 1.5
J'-1 6 1!
H r ~ 1
I. 00 0 .25
.4
.9 4 3
5,40
I, 30 7 3 2
91 5 5
14
3
I
1
2
2 58 7
9,6 9 9
6 9 7 1 5 8 1 5 5 3 8 5 2 4 2 3 9 0
31 27 20
1 No tax-exempt notes outstanding within maturity range after March 15, 1942. Average shown forM arch 1942 covers only first half of month. t Revised series. For data beginning January 1940 and an explanation of the revision, seep. 32 of the March 1941 Survey. For previous revision of 1939 data, seep. 31 of the
March 1940 Survey. •New series. For data beginning 1929 for industrial banking companies. personal finance companies and credit unions, respectively, see table 35, p. 18 of the September
1940 Survey, table 2/i, p. 26 of the September 1941 Survey, and table 27, p. 26 of the October 1941 issue. The series on 3-months' bills of the U.S. Treasury represents the rate on new issues offered within the month, tax-exempt bills prior to March 1941, taxable thereafter; earlier data will be published In a subsequent issue. Earlier data for the series on taxable Treasury notes appear on p. S-14 of the Aprill942 Survey.
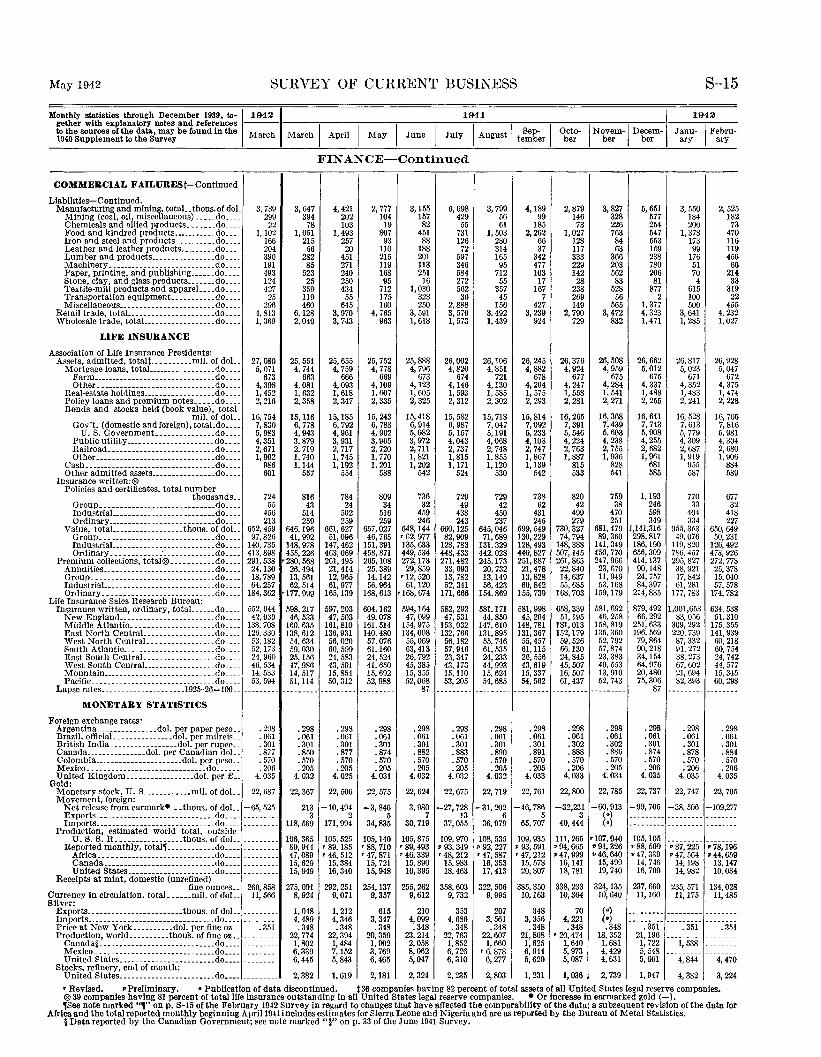
May 1942 SURVEY OF CURRENT BUSINESS S-15
Monthly statistics through December 1939, to-~19421 1941 I 1942 gether with explanatory notes and references --- ----,------,,----,----,..----,----..----,.---.,-----,---~---.,.---
tothesourcesofthedata,maybefoundinthe March Marchi April I May I June I July IAugustlteSmepb.erl Octo-INovem-IDecem- Janu-~Febru· \940 Supplement to the Survey ber ber ber ary ary
COMMERCIAL F AILURESt-Continued
Liabilities-Continued. Manufacturing and mining, totaL.thous.of doL
Mining (coal, oil, miscellaneous) .•... do .... Chemicals and allied products ....... do .... Food and kindred products ........... do .... Iron and steel and products .......... do .... Leather and leather products ......... do .... Lumber and products ................ do .... Machinery._ ......................... do .... Paper, printing, and publishing ...... do .... Stone, clay, and glass products ....... do .... Textile-mill products and appareL ... do .... Transportation equipment. ....... _ .. do .... Miscellaneous ... _ .................... do ... _
Retail trade, totaL ..................... do .... Wholesale trade, totaL ................ do ... _
LIFE INSURANCE
Association of Life Insurance Presidents: Assets, admitted, totait .•........ mil. of doL
Mortgage loans, totaL ............... do .... Farm ..•.•.......................... do .... Other ...•...............•.......... do ....
Real-estate holdings .•••.............. do .... Policy loans and premium notes ..... do .... Bonds and stocks held (book value), total
mil. of doL Gov't. (domestic and foreign), totaLdo ....
U.S. Government ............... do .... Public utility ............... _ ..... _do .... Railroad ........................... do .•.. Other .............................. do ....
Cash .............•...•............... do .... Other admitted assets .•.............. do ....
Insurance written:® Policies and certificates, total number
thousands._ Group .....................•....... do ____ IndustriaL ................•....... do .... Ordinary ...•.............•......... do ....
Value, totaL ................ thous. of doL. Group._ ........................... do .... IndustriaL_ ....................... do .... Ordinary ... _ ........ : ............. do ....
Premium collections, total@ ........... do .... Annuities ............................ do ... _ Group ............................... do .... IndustriaL •.•....•...........•....... do_ ... Ordinary ............ _ ............... do ..•.
Life-Insurance Sales Research Bureau: Insurance written, ordinary, totaL .... do .. __
New England ................. ___ .... do .... Middle Atlantic .. _ .................. do .... East North CentraL ................. do .... West North CentraL ................ do .... South Atlantic ... _ ................... do .... East South CentraL ................. do .... West Sonth CentraL ................ do .... Mountain ........... _ ............... _ do._._ Pacific ............................ __ .do ....
Lapse rates ..................... 1925-26= 100 ..
MONETARY STATISTICS
Foreign exchange rates: Argentina ............... dol. per paper peso .. Brazil, ofliriaL .............. dol. per milreis .. British India ................. dol. per rupee .. Canada .......•.•..... dol. per Canadian doL. Colombla ...................... dol. per peso .. Mexico._ ..................•......... do ...... United Kingdom ................. dol. per£ ..
Gold: Monetary stock, U. S ............ mil. of doL_ Movement, foreign:
Net release from earmark• .. thous. of doL. Exports ..........................•.•. do .... Imports ....................•..... _ ... do. __ .
Production, estimated world total, outside U.S. S. R ................. thous. of doL
Reported monthly, total, ......•...•. do .... Africa .•.••••................•..... do .... Canada ..•.•.............•......... do .... United States ...................... do ....
Receipts at mint, domestic (unrefined) fine ounces ..
c s
urrency In circulation, totaL ...•. mil. of doL. il\'er: Exports ........................ thous. of doL. Imports ....••............•.•........... do .... Price at New York .......... dol. per fine oz .. Production, world ..•.•...•. thou8. of fine oz ..
Canada§ ..••.•...............•.•..... do .•.. Mexico ...................•..•..•.... do .... United States .••............•....•.•. do •••.
Stocks, refine.ry, end of month: United States •......••.......•...•.•• do •••.
3, 739 3, 647 299 394
22 78 1,102 1, 051
166 215 204 56 390 282 191 85 493 523 124 25 427 359 25 119
296 460 4, 813 6,128 1, 369 2,049
27,080 25,551 5,071 4, 744
673 663 4, 398 4,081 1,452 1, 632 2,216 2,358
16, 754 15, 116 7,830 6, 778 5,983 4, 943 4, 351 3,879 2,671 2, 719 1,902 1, 740
P86 1,144 601 557
724 816 55 43
456 514 213 259
652,459 646, 196 97,826 41,992
140, 735 148,978 413,898 455,226 291,538 •280, 568 24,130 26,494 18,789 13, 561 64,257 62,514
184,362 •177,999
552,044 598,217 42,030 46,533
138,708 160,635 126, 330 138,612
53, 182 54,634 52,17:) 59,030 24,960 25,156 46, 534 47,986 14, .133 14,517 53, 594 51,114
--------· ---------
. 298 .298
. 061 .061
. 301 • 301
. 877 .850
. 570 .570
. 206 . 205 4. 035 4. 032
22,687 22,367
-65,525 213 --------- 3 --------- 118,569
--------- 106,365 --------- 89,944 --------- 47,089 --------- 15,629 --------- 15,949
260,858 275,091 11,566 8,924
--------- 1,048 4,489
. 351 .348 --------- 22,774 --------- 1,802 --------- 6,339 --------- 6,445
--------- 2,382
FINANCE-Continued
4,421 2, 777 3,155 6, 698 3, 799 202 104 !57 429 56 103 19 82 55 61
1, 493 807 451 731 1, 503 257 93 88 126 280 20 110 188 72 314
451 215 201 597 165 271 119 113 346 95 240 168 251 584 712 250 95 16 272 55 434 712 1,030 562 357
55 175 328 36 45 645 160 250 2,888 156
3,970 4, 765 3, 591 3, 579 3, 492 3, 743 963 1, 618 1, 573 1,439
25,655 25,752 25,888 26,002 26,106 4, 759 4, 778 4, 796 4,820 4,851
666 669 673 674 721 4,093 4,109 4,123 4,146 4,130 1,618 !, 607 1, 605 1, 593 !, 585 2, 347 2, 335 2,325 2, 312 2,302
15, 185 15,243 15,418 15, 582 15,718 6, 792 6, 788 6,914 6, 987 7,047 4, 961 4, 962 5,082 5,157 5,191 3, 931 3, 965 3, 972 4,043 4,068 2, 717 2, 720 2, 711 2, 737 2, 748 !, 745 1, 770 1,821 1, 815 1, 855 1,192 1, 201 1,202 1,171 1,120
554 588 542 524 530
784 809 736 729 729 24 34 32 49 42
502 516 459 438 450 259 259 246 243 237
661, 627 6.57,027 648, 144 660,125 645,046 51,096 46,765 '62, 977 82,909 71,689
147,462 151, 391 135, 633 128, 783 131, 329 463,069 458,871 449,534 448,433 442,028 261,495 265, 108 272,173 271,482 245,173 21,414 25.389 29,859 33,693 20,732 12, 965 14,142 '12,520 13, 782 13, 149 61,977 56,964 61,120 52,341 56,423
165, 139 168, 613 •168, 674 171,666 154,869
597,203 604,162 594,164 582,292 581,171 47,503 49,078 47,099 47, 531 44,850
161,810 161,514 !54, 975 153,032 147,610 136, 931 140,480 !34, 008 132,766 131,895 56,020 57,076 55,069 56,182 55, 746 60,599 61,160 63,413 57,946 61,535 24,583 24,524 26,792 23,347 24,233 43,591 41,650 45,385 43,173 44,993 15,854 15,692 15,355 15, 110 15, 624 50,312 52,988 .12,068 53,205 54,685
--------- --------- 87 --------- ---------
. 298 .298 • 298 . 298 • 298
.061 .061 .061 . 061 . 061
. 301 .301 . 301 .301 .301 • 877 .874 .882 .883 .890 • 570 . 570 . 570 . 570 . 570 .205 . 205 . 205 . 205 .205
4.025 4.031 4.032 4. 032 4. 032
22,506 22,575 22,624 22,675 22,719
-10,494 -3,846 3, 980 -27,728 -31,202 2 5 7 13 6
171,994 34,835 30,719 37,05.5 36,979
105,525 105,140 105,875 109,970 108,535 '89, 185 '88, 710 '89, 493 • 93,349 • 92,227 '46, 512 '47, 871 '46, 339 •48,212 '47, 587
15,384 15,721 15,890 15,983 16,353 16,340 15,948 16,395 18,463 17,413
292,251 254,137 255,262 358,603 322,506 9,071 9,357 9,612 9, 732 9, 995
1, 212 615 210 353 207 4,346 3,347 4,099 4, 686 3, 561 . 348 .348 . 348 . 348 .348
22,394 20,359 23,214 22,763 22,607 1, 484 1, 902 2,058 1,852 1, 660 7,152 3, 769 8,062 6, 726 '6, 878 5,843 6,465 5,047 6,310 6, 277
1, 619 2,181 2,324 2,235 2,803
'
4,189 2,879 3, 827 5, 651 3, 550 2, 525 99 146 328 577 184 182
185 73 226 254 200 73 2,262 1,027 763 547 1, 378 470
66 128 84 553 173 116 37 117 63 159 99 119
342 333 366 238 176 456 477 229 203 780 51 66 103 142 562 206 70 214 17 28 83 81 4 33
167 238 528 877 615 319 7 269 56 2 100 22
427 149 565 1, 377 500 455 3,239 2, 790 3,472 4, 323 3,641 4, 232
924 729 832 1,471 !, 285 1,027
26,245 26,376 26,508 26,662 26,817 26,928 4,882 4, 924 4, 9.19 5,012 5, 023 5, 047
678 677 675 675 671 672 4,204 4, 247 4,284 4,337 4, 352 4, 375 !, 575 1, 558 !, 541 1,488 !, 483 1,474 2, 293 2,281 2, 271 2, 255 2, 241 2,228
15,814 16,265 16,368 !6, 641 16, 528 16,706 7,092 7,391 7,439 7, 743 7, 613 7,816 5,233 5, 546 5, 603 5, 908 5, 779 5, 981 4,108 4,224 4, 238 4,255 4, 309 4, 304 2, 747 2, 763 2, 755 2, 682 2, 687 2,680 !, 867 1,887 1, 936 1, 961 1, 919 1, 906 1,139 815 828 681 955 884
fi42 533 54! 585 587 589
738 820 759 1, 193 770 677 62 42 38 246 33 32
431 499 470 598 404 418 245 279 251 349 334 227
699,549 730,327 681,479 1,141,316 955,353 650, 649 130,229 74,794 89,360 298,817 49,076 50,231 128,493 148,388 141,349 186, 190 119,820 126,492 440,827 507,145 450, 770 656,309 786,457 473,926 251,887 261,865 247,966 414, 137 295,827 272,778 21,478 22,840 23,670 90, 148 38,921 25,378 13,828 14,637 11,949 24, 757 17,842 15,040 60,842 55,685 53,168 84,397 61, 281 57,578
155,739 168,703 159,179 214,835 177,783 174,782
581,998 658,339 581,692 879,492 1,001,653 634,538 45,204 51,195 46,258 66,292 83,056 51,310
148, 781 181,013 158,819 251,633 309,292 175,35.5 131, 367 152, 179 135,360 196,569 220,739 141,939 55,457 59,526 52, 792 79,864 87,332 60,218 61, 115 66, 130 57,874 90,218 91.272 60,754 26,556 24,845 23,383 34, !54 38,273 24,742 43,619 45,507 40,553 64,976 67,602 44, 577 15,337 16, 507 13,910 20,480 21,694 15, 345 54,562 61,437 52,743 75,306 82,393 60,298
--------- --------- --------- 87 --------- --------
. 298 . 298 .298 .298 . 298 .298
.061 . 061 . 061 . 061 . 061 . 061
. 301 .302 .302 . 301 . 301 .301
.891 .888 .886 .874 .878 .884
. 570 .570 .570 .570 . 570 . 570
.205 . 206 .205 .206 . 206 . 206 4.033 4.033 4.034 4.035 4.035 4. 035
22,761 22,800 22,78.5 22,737 22,747 22,705
-46,786 -32,231 -60,913 -99,705 -38,506 -109,277 5 3 (•) --------- --------- --------
65,707 40,444 (•) --------- --------- ----- --109,935 111,265 •107, 940 105,105 --------- --------
• 93, 591 •94, 665 • 91,326 •88, 509 • 87,225 • 78,196 '47, 212 •47, 999 • 46,640 •47,339 • 47,564 • 44,659
15, 578 16,141 15,499 14, 746 14, 198 13, 147 20,807 18,781 19,740 16, 700 14,982 10,034
338,233 324,135 237,660 385,350 235, 571 134,028 10,163 10,364 10,640 11, 160 11,175 11,485
348 70 (•) --------- --------- --------3,356 4, 221 (•) --------- --------- --------.348 .348 .348 . 351 . 351 . 351
21,808 , 20, 474 18, 352 21, 196 --------- --------1, 625 1,640 !, 681 1, 722 1, 538 --------6, 944 5, 973 4,429 5, 548 --------- --------5,620 5,087 4,631 5,661 4, 844 4,470
1, 231 1,036 2, 739 1, 947 4, 382 3, 224
• Revised. •Preliminary. • Publication of data discontinued. t36 companies having 82 percent of total assets of all United States legal reserve companies. 0 39 companies having 81 percent of total life Insurance outstanding in all United States legal reserve companies. • Or Increase in earmark~d gold (- ). ,See note marked .. , .. on p. S-15 of the February 1942 Survey in regard to changes that have affected the comparability of the data; a subsequent revision of the data for
Africa and the total reported monthly beginning April1941 includes estimates for Sierra Leone and Nigeria and are as reported by the Bureau of Metal Statistics. §Data reported by the Canadian Government; see note marked"§" on p. 33 of the June 194! Survey.
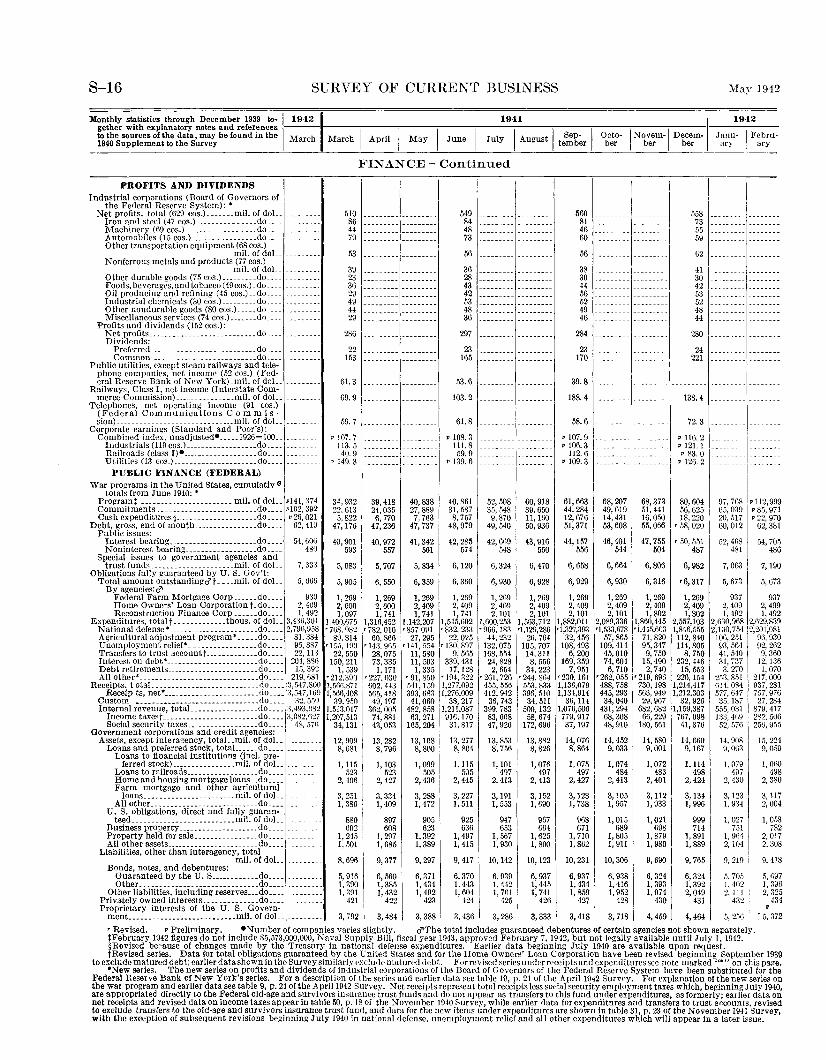
S-16 SURVEY OF CURRENT BUSINESS l\Iay 1942
Monthly statistics through December 1939 to-~19421 1941 I 1942 gether with explanatory notes and references ---- ----,-------,----,-----:-----.,-----,,.----,-----,-~ N_o_v_e_m __ .,,-D-ec_e_m ___ -------to the sources of the data, may be found in the March March I April I May I June I July I August I Sep- Octo- Janu- I Febru· 1940 Supplement to the Survey tember ber ber ber ary
1 ary
PROFITS AND DIVIDENDS I Industrial corporations (Board of Governors of
the Federal Reserve System): * Net profits, total (629 cos.) ....... mil. of doL _ ..........
Iron and steel (47 cos.) _______________ do ....... ·--------Machinery (69 cos.) _________________ do ........ -·-------Automobiles (15 cos.) ________________ do ____ ......... Other transportation equipment (68 cos.)
mil. of doL .......... Nonferrous metals and products (77 cos.)
mil. of doL ........ .. Other durable goods (75 cos.) .......... do ............ .. Foods, beverages, and tobacco ( 49cos.) .. do ..... ___ .... . Oil producing and refining (45 cos.) __ do ____________ _ Industrial chemicals (30 cos.) .......... do ............ .. Other nondurable goods (80 cos.) ...... do .. .. Miscellaneous services (74 cos.) ........ do .... ..
Profits and dividends (152 cos.): Net profits ................................ do .... .. Dividends:
Preferred ...................... __ ...... _ .............. do ...... .. Common ...... __ ............ ___ .......... __ ........ do ...... ..
Public utilities, except steam railways and telephone companies, net income (52 cos.) (Fed-eral Reserve Bank of New York)_mil. of doL .......... ..
Railways, Class I, net income (Interstate Com-merce Commission) .......... _ .. __ .. mil. of doL .. _ .........
Telephones. net operating income (91 cos.) (Federal Communications Com m is· sion) ______________________________ mil. of doL ________ _
Corporate earnings (Standard and Poor's): Combined index, unadjusted• ...... 1926= 100 ... ___ ..
Industrials (119 cos.) ________________ .. do ..... .. Railroads (class I)• .................... do .. .. Utilities (13 cos.) ........................ do .. ..
PUBLIC FINANCE (FEDERAL) War programs in the United States, cumulativ 6
totals from June !940: • Programt -----------------------mil. of doL .. •141, :174 Commitments .......................... do ...... •102, 392 Cash expenditures§ .. __ --------- ........ do .... • 26, 021
Debt, gross, end of month .................. do.... 62,419 Public issues:
Interest bearing ______________________ do.... 54,606 Noninterest bearing .................... do____ 480
Special issues to government agencies and trust funds ....................... mil. of doL_ 7, 333
Obligations fully guaranteed by U. S. Gov't: Total amount outstandingd"t ...... mil. of doL. 5, 666
By agencies:d" Federal Farm Mortgage Corp ______ do____ 930 Home Owners' Loan Corporation t .. do...... 2, 409 Reconstruction Finance Corp ....... do____ 1, 492
Expenditures, total t ..... ______ .... thous, of doL .. 3,436,301 National defense • _______ ...... __ .. _____ ..... do ____ 2,79fl,9,58 Agricultural adjustment program• ...... do____ 81,384 Unemployment relief• _____ ... ________ .. do...... 95, 887 Transfers to trust accountt ____________ .. do____ 22, ll3 Interest on debt• --------------- ____ ..... do.___ 204, 8.86 Debt retirements _______________________ do____ 15,392 All other* ______________________________ do ____ l219, 681
Receipts. totaL _________________ ------ .... do ____ 3,.047,800 Receipts, net• ________________________ do .... 3,547,169
Custom .................................. ..do...... 32,509 Internal revenue, totaL ................... do ..... :3,493,082
Income taxest -------------- _______ ... do ..... 3,082,627 Social security taxes .. _______________ do.... 48,576
Government corporations and credit agencies: Assets, except interagency, totaL .. mil. of doL.. _____ . __
Loans and preferred stock, totaL ...... do ____________ _ Loans to financial institutions (incl. pre-
ferred stock) ________________ mil. of doL. Loans to railroads __________________ do __ __ Horne and housing mortgage Joans ... do ... __ Farm mortgage and other agricultural
loans _______________________ mil. of doL. All other .. _________________ . _______ .. do .....
U. S. obligations, direct and fully guaran-teed .. ___________ ---------- .... mil. of doL_
Business property--------------- ....... do_ .. __ Property held for sale ......... ______ .. do .. ... All other assets _______________________ do .... ,
Liabilities, other than interagency, total mil. of doL
Bonds, notes, and debentures: Guaranteed by the U. S .............. do __ __ Other ___ ... ____ .. _______ .. _____ ......... do ... _
Other liabilities, including reserves .... do .. ... Privately owned interests .. ________ ..... do____ .... __ .. _
Pr~~~::~~:.: _ ~~ ~~~':_t~- -~f--t~~ _ ~ . __ ~il~gf~~J: _[ ________ _
510 86 44 79
FINANCE-Continued
549 84 48 73
53 --------- --------- 56 --------- ---------
3~ --------- --------- 36 --------- ---------23 36 29 49 44 29
286
22 153
61.3
69.9
59. 7
p 107.7 113. 5 40.9
p 149.3
34, 932 22.613
5,822 47,176
40,901 593
5,683
5, 905
1, 269 2,600 1, 097
1,400,675 '768. 982
89,814 rlf,5, Hm
22,550 150,211
!, 539 •212,390 1,566,871 1,566,408
39,950 1,513,017 1,207,513
34,131
12,909 8,681
1, 115 523
2, 406
3, 251 1, 386
880 602
1, 245 1, 501
8,696
5, 916 1, 390 1, 391
421
39,418 24,035 6, 770
47,236
40,972 557
5, 707
6, 550
1, 269 2,600 !, 741
1,316,452 '782, 010
60,866 '14:1, 91),)
28,075 73,335 1,171
•227, 030 602. 443 565,418
49, 197 362,005 74,881 43,053
13,282 8, 796
1, !O:J 523
2,427
3, 334 1, 409
897 608
!, 297 1, 685
9, 377
6, 560 1, 385 1, 432
422
40,838 27,889 7, 763
47,737
41,342 561
5,834
6,359
28 43 42 53 48 36
297
23 165
53.6
103.2
61.8
• 108.3 111.8 59.9
"139. 6
40, R61 31,587 8, 757
48,979
42,285 574
6,120
6, 360
l, 269 !, 269 2, 409 2, 409 1, 741 1, 741
1,142,207 1,545,602 '857 091 '832, 23:l
27. 295 22, 025 '141, 5.14 1
1
,130, S97 11, 580 9, 565 11, 503 339, 431 1, 335117, 128
'91, 850 '194, 322 511, 159 1,277,092 393, 683 '1,276,009 41,060 I 38, 217
482,858 I 1,211,087 63,271 I 916,170
165,204 31, 817
13. 10s I 13, 277 8, 800 8, 804
1,099 505
2,436
3,288 1,472
905 62.3
1, 392 1,389
9, 297
I, 115 505
2, 445
3, 227 1.511
925 636
1,497 1, 415
9, 417
6, 371 6, 370 1, 434 !, 443 1, 492 I, 604
52,508 35, 548 9,870
49,540
60,918 39,650 11, 160 50,936
42,669 43,916 548 550
I
6, 3241 6, 470
6, 930 6, 928
1, 2f.91 1, 269 2, 409 2, 409 2. 101 2, 101
1,600,253 1,563,712 '966. 1~3 •1,129,286
44, 232 26, 764 132, 075 105, 707 168, 554 14, 311 24, 828 8, 556
2, 654 34, 223 '261, 726 '244, 864
455, 556 55:J, 833 412, 942 396, 510
36, 743 34, 51! 399, 783 500, 132 83, 668 58, 674 47,926 172,696
13,853 13,882 8. 756 8,826
1,101 1, 076 497 497
2, 413 2,413
3,191 3,152 1, 553 !, 690
947 967 653 664
1, 567 1,625 1, 930 1, 800
10,142 10, 123
6, 939 6, 937 1, 442 1,445 !, 761 1, 741
423 424 I 425 426
560 81 46 60
I _______ __
I
--------1 --------- --------- i 558 73 55 59
56 --------- --------- 62
H 30 42 53 52 48 44
38 --------- --------30 44 56 52 49 46
284
23 170
39.8
188.4
58.6
p 107.9 p 106.3
112.6 p 109.3
61,663 44,284 12, 676 51,371
44,157 556
6, 658
6, 929
1, 269 2, 409 2,101
1,882,011 •1,327,393
32,456 108,493
6,200 169,359
7, 951 •230.161 1,136,079 '!,131,914
36, 114 1,076,506 779,917 37,197
14,076 8, 864
1, 075 497
2,427
3,128 1, 738
91l8 671
1, 710 1,862
10,231
6, 937 1, 434 !, 859
427
········1·········1 I
68,207 68,373 49,619 51,441 14,431 16, o.so 53,608 55,066
46,401 47,755 544 504
6,664 6,806
6, 930 6, 316
280
24 221
138.4
72.3
p 116. 2 ' p 121. 1
p 83. 0 p 126.2
80,6041
f~: ~~g I '58, 020
r 50, 551 487
6,982
•6,317
1, 269 1, 269 1, 269 2, 409 2, 409 2, 409 2, 101 I 1, 802 I 1, 802
2,089,336 1,860,445 .2,557,103 rJ,.5a3,678 rl,445,003 1,846,55.5
57,865 71, 820 112, 840 109,414 9,5, 347 114, R05 45,010 9, 750 8, 750 74, 604 15,490 232, 446 6, 710 2, 740 15, 553
'262, 055 '219, 696 226, !54 488,758 730,198 1,214,417 445,293 563, 949 1,212,303 34, 040 29, 967 32, 926
431, 294 682, 682 1,159,387 68, 308 66, 229 767, 098 48,910 180, 561 41,376
14, 452 14,580 14,660 9,033 9,001 9,167
1,074 I, 072 1,114 484 483 498
2, 413 2,401 2, 424
3,105 3,112 3,134 1, 957 1, 933 !, 996
1, 015 1, 021 999 689 698 714
1, 805 !, 879 1, 891 1, 911 1, 980 !, 889
10,306 9, 690 9, 765
6, 938 6, 324 6, 324 1. 416 1, 393 !, 392 1, 952 1, 974 2,049
428 430 431
I
------ 1-
i
I I
97,7GS IP!I2,999 65. 039
1
. 85. 971 20, 517 p 22,970 60, 012 62, 381
52, 468 54, 705 481 486
7, 063 7,190
5, 673 5, ()73
937 937 2, 409 2, 409 1, 492 1, 402
2,630,968 2,629,83~ 2,100,754 12,201,081
106, 2-51 96, 930 93, 564 92, 262 41, 540 9, 360 31, i37 12, 136
3, 270 I, 070 253, 8.)! 217, 000 614, 0~4 937, 281 577, 647 757, 976 35, 187 27, 284
555, 031 879, 417 1:n, 469 2s2, 506 52, -576 256, 955
1~. 908 15,224 9, 0(;3 9,059
1, 079 1,0f>O 407 498
2, 430 2, 380
3,123 3. 117 I. 934 2, 004
1, 027 !, 058 751 782
1, 91)1 2, 017 2,104 2, 308
a, 219 9,118
5. 705 5, 697 I, 402 !, 396 2. 1ll 2, 325
432 434 •
3, 792 3, 484 3, 388 · 3, 436 I 3, 286 3, 333 3, 418 3, 718 4, 459 4, 464 5, 251J - 5, 372
'Revised. P Preliminary. •Number of companies varies slightly. d"The total includes guaranteed debentures of certain agencies not shown separately. tFebruary 1942 figures do not include $5,573,000,000, Naval Supply Bill, fiscal year 1943, approved February 7, 1942, but not legally available until July 1, 1942. §Revised bec·ause of changes made by the Treasury in national defense expenditures. Earlier data beginning July 1940 are available upon request. tRevised series. Data for total obligations guaranteed by the United States and for the Home Owners' Loan Corporation have been revised beginning September 1939
to exclude matured debt: earlier data shown in the Survey similarly exclude matured debt. For revised series under receipts and expenditures see note marked "*" on this pa~e. •New series. The new series on profits and dividends of industrial corporations of the Board of Governors of the Federal Reserve System have been substituted for the
Federal Reserve Bank of New York's series. For a description of the series and earlier data see table 10, p. 21 of the Apri11942 Survey. For explanation of the new series on the war pro~ram and earlier data see table 9, p. 21 of the April1942 Survey. Net receipts represent total receipts less social security employment taxes which, beginning July 1940, are appropriated directly to the Federal old-age and survivors insurance trust funds and do not appear as transfers to this fund under expenditures, as formerly; earlier data on net receipts and revised data on income taxes appear in table 50, p. 18 of the November 1940 Survey, while earlier data for expenditures and transfers to trust secoums, revised to exclude transfers to the old-age and survivors insurance trust fund, and data for the new items under expenditures are shown in table 31, p. 23 of the November 1941 Survey, with the exception of subsequent revisions beginning July 1940 in national defense, unemployment relief and all other expenditures which will appear in a later issue.
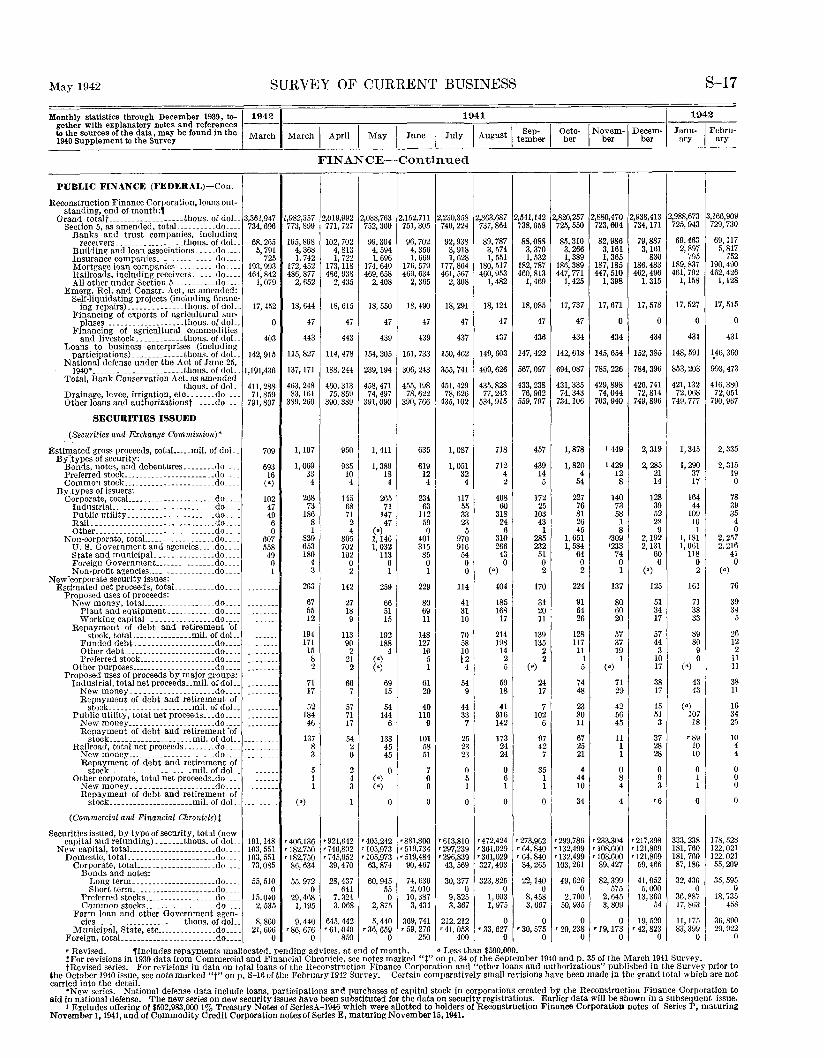
May 1942 SURVEY OF CURRENT BUSINESS S-17
I Novem-1 Decem- I
ber ber
1942 Monthly statistics through December 1939, to-~19421 1941 gether with explanatory notes and references ---
1
to the sources of the data, may be found in the March M h I A ·1 I M ~- J I J 1 I A t I Sep- Octo-1940 Supplement to the Survey arc pn ay nne u Y ugus tember ber Janu- I Febru·
ary ary
FINANCE--Continued
PUBLIC FINANCE (FEDERAL)-Con. i
Reconstruction Finance Corporation, loans out-standing, end of month:,
Grand totalt -------------------thous. of doL 3,36!,947 1,982,357 2,019,992 2,088,763 2,152,711 2,230,358 2,363,687 2,541,142 2,820,257 2,880,470 2,938,413 2,988,673 :l,l66,909 Section 5, as amended, totaL ........ do .... 734,696 773,899 771, 727 752,300 751,305 740,224 737,864 738,058 725,550 723,604 734, 171 725,943 729,730
Banks and trust companies, including receivers ................. thous. of doL. 68,265 105,808 102,702 99,304 96,702 92,938 89,787 88,088 85,310 82,986 79,887 69,463 69, 117
Building and loan associations ..... do .... 5, 791 4, 368 4, 813 4, 594 4,356 3, 918 3, 571 3, 370 3, 266 3, 161 3, 161 2,897 5, 817 Insurance companies ............... do .... 725 !, 742 !, 722 1,696 !, 669 1, 628 !, 551 !, 532 1,389 1, 365 830 795 752 Mortga~e loan companies .......... do .... 193,993 172,452 173,118 174,640 176,579 177,864 180, 517 182,787 186,389 187, 185 186.483 189,837 190,490 Railroads, including receivers ...... do .... 464,842 486,877 486, 938 469,658 469,634 461,567 460,953 460,813 447,771 447,510 462,496 461,792 462,426 All other under Section 5 ........... do .... !, 079 2, 652 2, 435 2,408 2, 365 2, 308 1, 482 1, 469 !, 425 1, 398 1, 315 1,158 1,128
Emerg. Rel. and Constr. Act, as amended: Self-liquidating projects (including financ-
ing repairs) .............. tho us. of doL. 17, 452 18, 644 18,615 18,550 18,490 18, 291 18, 124 18,085 17, 737 17,671 17,578 17,527 17, 5!5 Financing of exports of agricultural sur-
pluses .................... thous. of doL 0 47 47 47 47 47 47 47 47 0 0 0 0 Financing of agricultural commodities
and livestock ............ thous. of doL. 403 443 443 439 439 437 437 436 434 434 434 431 431 Loans to business enterprises (including
participations) ............. thous. of doL 142,915 115, 827 114,478 154,305 151, 733 150,462 149, 603 147,422 142,618 145,654 152,385 148, 591 ~46, 360 National defense under the Act of June 25,
1940* ....................... thous. of doL 1,191,436 137, 171 188, 244 239, 194 306,243 355, 741 409,626 567,097 694,087 785,226 784,396 853,203 993,473 Total, Bank Conservation Act, as amended
thous. of doL 411,288 463,248 460,313 458,471 455, 198 451,429 435,828 433,238 431, 335 429,898 426,741 421, 132 416, 380 Drainage, levee, irrigation, etc ....... do .... 71,859 83, 161 75,859 74, 497 78,622 78,626 77,243 76,962 74,343 74,044 72,814 72,068 72,051 Other loans and authorizationst ...... do .... 791,897 389,260 390,389 391,090 390, 766 435, 102 534,915 559,797 734, 106 703,940 749,896 749, 777 790,967
SECURITIES ISSUED
(Securities and Exchange Commission)*
Estimated gross proceeds, totaL •.. mil. of doL. 709 1, 107 950 1, 411 635 1,087 718 457 1,878 1 449 2, 319 1, 345 2,335 By',typcs of security:
Bonds, notes, and debentures ........ do .... 693 1,069 935 1, 389 619 1, 051 712 439 1, 820 1429 2, 285 1,290 2,315 Preferred stock ...•................... do .... 16 33 10 18 12 32 4 14 4 12 21 37 19 Common stock ..•.................... do .... (•) 4 4 4 4 4 2 5 54 8 14 17 0
By types of issuers: Corporate, totaL ••............•..... do .... 102 268 145 265 234 !17 408 172 227 140 128 164 78
IndnstriaL ................•....... do .... 47 73 68 71 63 55 60 25 76 73 39 44 39 Public utility ................•..... do .... 49 186 71 147 112 33 318 103 81 58 52 109 35 Rail.-··················--- .•.•.... do .... 6 8 2 47 59 23 24 43 26 1 28 10 4 Other .............................. do .... 0 1 4 (•) 0 5 6 1 45 8 9 1 0
Non-corporate, totaL ................ do .... 607 839 805 1, 146 401 970 310 285 1, 651 1309 2,192 1,181 2,257 U. S. Government an<i agencies .... do .... .158 653 702 1, 032 315 916 266 232 1, 584 '233 2, !31 1, 061 2,216 State and municipaL --············do .... 49 180 102 113 85 54 43 51 64 74 60 118 41 Foreign Government. .............. do .... 0 4 0 0 0 0 0 0 0 0 0 0 0 Non-profit agencies ................. do .. 1 3 2 1 1 0 (•) 2 2 1 (•) 2 (•)
N ew·corporate security issues: Estimated net proceeds, totaL ......... do .... --------- 263 142 259 229 114 404 170 224 137 125 161 76
Proposed uses of proceeds: New money, totaL ................ do .... --------- 67 27 66 80 41 185 31 91 80 51 71 39
Plant and equipment.-······ .... do .... -------- 55 18 51 69 31 168 20 64 60 34 38 :l4 Working capitaL ................ do .... -------· 12 9 15 11 10 17 11 26 20 17 33 5
Repayment of debt and retirement 'of stock, totaL .•.....•...•.. mil. of doL. -------- 194 113 192 148 70 214 139 128 57 57 89 26
Funded debt .......•............ do .... ·-------- 171 90 188 127 58 198 135 117 37 44 80 12 Other debt ..................•.... do .... --------- 15 2 4 16 10 14 2 11 19 3 9 2 Preferred stock .••................ do .... --------- 8 21 (•) 5 12 2 2 1 1 10 0 11
Other purposes ..................... do .... --------- 2 2 (•) 1 4 5 (•) 5 (•) 17 (•) 11 Proposed uses of proceeds by major groups:
Industrial, total net proceeds .. mil. of doL --------- 71 66 69 61 54 59 24 74 71 38 43 38 New money._ ................... do .... ----- ... 17 7 15 20 9 18 17 48 29 17 43 11 Repayment of debt and retirement of
stock ..................... mil. of doL ----- ... 52 57 54 40 44 41 7 23 42 15 (•) 16 Public utility, total net proceeds ... do .... --------- 184 71 144 110 33 316 102 80 56 51 107 34
New money ...................... do .... -------- 46 17 6 9 7 142 6 11 45 3 18 25 Repayment of debt and retirement 'of
stock ..................... mil. of doL. --------- 137 54 138 101 25 173 97 67 11 37 •89 10 Railroad, total net proceeds ........ do ... _ --------- 8 2 45 58 23 24 42 25 1 28 10 4
New money ...................... do .... -------- 3 0 45 51 23 24 7 21 1 28 10 4 Repayment of debt and retirement of
stock ..................... mil. of doL --------- 5 2 0 7 0 0 35 4 0 0 0 0 Other corporate, total net proceeds. do .... -------- 1 4 (•) 0 5 6 1 44 8 9 1 0
New Inoney _ --------------- .... do .... --------- 1 3 (•) 0 1 1 1 10 4 3 1 0 Repayment of debt and retirement of
stock ..........•.•........ mil. of doL -------- (•) 1 0 0 0 0 0 34 4 •6 0 0
(Commercial and Financial Chronicle)t
ecurities issued, by type of security, total (new capital and refunding) ___ .... thous. of doL. 191,148 •406,136 , 921,642 I , 405.242 •881,800 •613,810 •472,424 '273,962 •299,786 •233,304 '217,398 333,238 178,528
New capital, totaL .................... do .... 103. 551 '182,750 '746,802 '105,973 '519,734 '297,239 '361,029 '64, 840 '132,499 r 10R,600 '121,809 181,760 122,021 Domrstic, totaL ..................... do ... _ 103, 551 '182,750 '745,952 '105,973 '519,484 •296,839 •361,029 '64, 840 '132,499 r IOS,600 •121,809 181,760 122,021
Corporate, totaL ................... do .... 73,085 86,634 39,470 63, 874 90,467 43,569 327,403 34,265 103, 261 89,427 59,466 87,186 55,209 Bonds and notes:
s
Long term ..•.................. do .... 55,510 55, 972 28,437 60,945 74, 636 30,377 323,825 22,140 49, 626 82,399 41,052 32,436 35,595 Short term ............•........ do .... 0 0 6H 55 2,010 0 0 0 0 575 5. 000 0 0
Preferred stocks .................. do .... 15,040 29,468 7,324 0 10,387 9,825 1,603 8,458 2, 700 2,645 13,360 36,887 18,735 Common stocks .................. do .... 2, 535 1, 195 3,068 2,875 3, 434 3, 367 1, 975 3, 667 50,935 3,809 54 17, 8(i3 458
Farm loan and other Government agrn-cics _ ..................... thous. of doL. 8, 860 9,440 645,442 5,440 369, 741 212,212 0 0 0 0 19,520 11, 175 36,890
Municipal, St11te, etc .•............. do .... 21,606 r 86, 676 •61, 040 '36, 659 '59, 276 '41, 058 '33, 627 '30, 575 '29, 238 '19, 173 '42, 823 83,399 29,922 Foreign, totaL ....................... do .... 0 0 850 0 250 400 0 0 0 0 0 0 0
'Revised. 'Includes repayments unallocated, pending ad vices, at end of month. • Less than $500,000. tFor revisions in 1939 data from Commercial and Financial Chronicle, see notes marked "t" on p. 34 of the September 1940 and p. 35 of the March 1941 Survey. tRevised series. For revisions in data on total loans of the Reconstruction Finance Corporation and "other loans and authorizations" published in the Survey prior to
the October 1940 issue, see note marked "t" on p. S-16 of the February !942 Survey. Certain comparatively small revisions have been made in the grand total which are not carried into the detail.
*New series. National defense data include loans, participations and purchases of capital stock In corporations created by the Reconstruction Finance Corporation to aid in national defense. The new series on new security issues have been substituted for the data on security registrations. Earlier data will be shown in a subsequent issue.
1 Excludes offering of $502,983,000 1% Treasury Notes of SeriesA-1946 which were allotted to holders of Reconstruction Finance Corporation notes of Series P, maturing November 1, 1941, and of Commodity Credit Corporation notes of Series E, maturing November 15,1941.
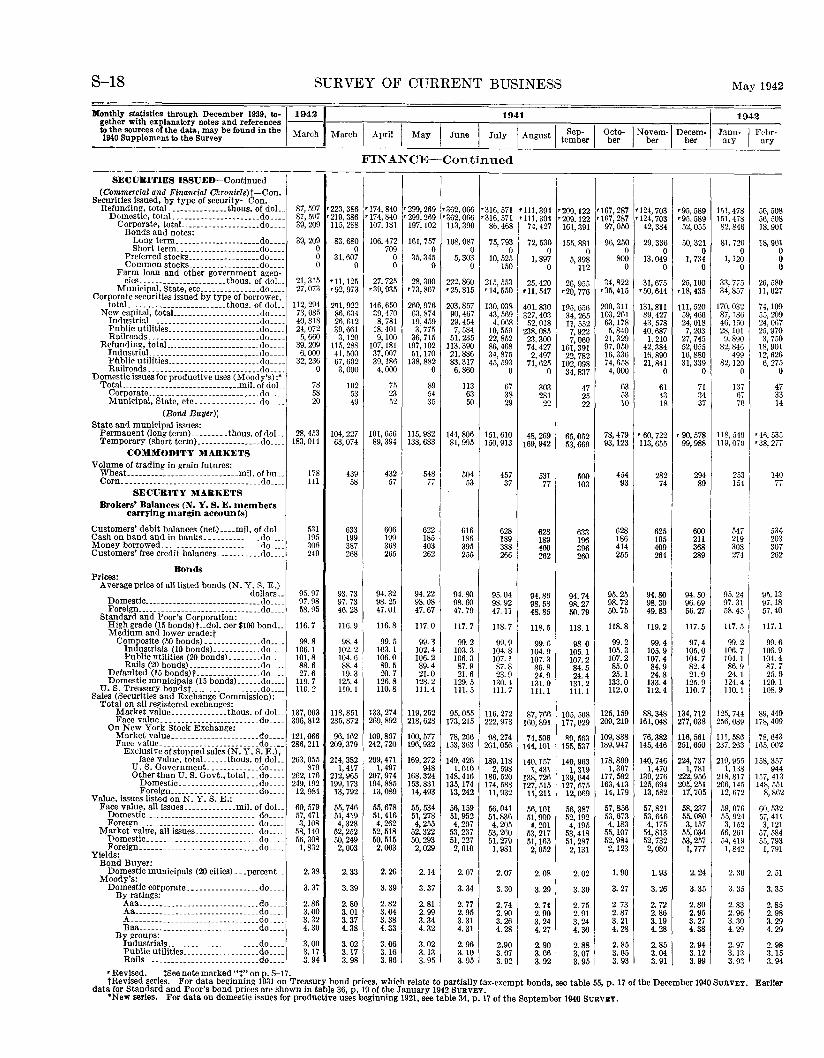
S-18 SURVEY OF CURRENT BUSINESS May 1942
Monthly statistics through December 1939, to-~1942 1941 I 1942 gether with explanatory notes and references ---1-----.---.--------.---....------;-----,----,-----,----..---- ---....::..,.----tothesourcesofthedata,maybefoundinthe March M hI A .1 I M I J I I I Sep- I Octo-~Novem-1 Decem- Janu- I Febr-1940 Supplement to the Survey arc pn ay une July August tember her her her ary ary --------------------~---~~--~--~--~--~--~--~----~--~--~--~---
FINANCE-Continued
SECURITIES ISSUED-Continued
•223, 3861.174, 840
(Commercial and Financial Chronicle)t-Con. Securities issued, by type of security-Con.
Refunding, totaL .•.•...••••.•. thous. of doL 87,597 •299, 269 •362, 066 •3!6, 571 Domestic, totaL. --------------------do ..•. 87,597 •2!9,3S6 •174,840 •299, 269 •362. 066 •3!6, 571
Corporate, totaL ...............•.• do •.. _ 39, 209 115, 288 107,181 197, 102 113,390 86,468 Bonds and notes:
Long term ........•.••....••••. do. ___ 39, 209 83, 680 106, 472 161, 757 108,087 75, 793 Short term ...................•• do .... 0 0 709 0 0 0
Preferred stocks .........•........ do .... 0 31,607 0 35,345 5,303 10, 525 Common stocks .....•............ do .... 0 0 0 0 0 150
Farm loan and other government agen· cies ..............•....... thous. of doL. 21,315 '11, 125 27, 725 28,300 222,860 215, 553
Municipal, State, etc ............... do .... 27,073 •92, 973 •39, 935 •73,81\7 •25, 815 '14, 550 Corporate securities issued by type of borrower,
totaL ..••..•.........•....... thous. of doL 112, 294 2~1. 922 146,650 260,976 203,857 130,038 New capital, totaL ..................... do .... 73,085 86,634 39, 470 63,874 90,467 43,569
IndustriaL ........................•.. do .... 40,818 26,612 8, 781 19,459 29,454 4, 068 Public utilities .•.....•............... do .... 24.072 39,661 18,401 3, 775 7, 584 10,559 Railroads .. --------------------------do .... 5, 660 3,120 9, 100 36,715 51, 235 22,852
Refunding, totaL_ ---------------------do .... 39,209 115, 288 107,181 197, 102 113,390 86,468 Industrial .. __ ...•. _ •...........•••... do. ___ 6, 000 41, 500 37,007 51,170 21,886 34,875 P!Iblic utilities ... -------------- ..•... do .... 32, 236 67,602 39,186 138,882 83,317 45, 593 Railroads .. ------------------ ___ ..•.. do .... 0 3, 000 4, 000 0 6,860 0
Domestic issues for productive uses (Moody's) :* 78 89 TotaL .........•••••.•.•.....•.••. mil. of doL 102 75 113 67
Corporate .......••. ____ •.•..... __ •... do .... 58 53 23 54 63 38 Municipal, State, etc .......•....•... do .... 20 49 52 35 50 29
(Bond Buver>: State and municipal issues:
28, 453 Permanent (long term). ........ thous. of doL. 104,227 101,656 115,982 144,806 151,610 Temporary (short term) ................ do .... 183,014 63,074 89,394 138,683 81,995 150, 913
COMMODITY MARKETS Volume of trading in grain futures:
Wheat. ---------------------------mil. of bu .. 178 439 432 548 I 504 457 Corn ........ ------- .. ---- .. ____________ do .... Ill 58 57 77 53 37
SECURITY MARKETS Brokers' Balances (N. Y. S. E. members
carrying mar~~;in accounts)
Customers' debit balances (net) .... mil. of doL 531 633 606 622 616 628 Cash on hand and in banks .............. do .... 195 199 199 185 186 189 Money borrowed ......................... do .... 306 387 36S 403 39.5 388 Customers' free credit balances ........... do .... 249 268 265 262 255 266
Bonds Prices:
Averagepriceofalllisted bonds (N.Y. S. E.) dollars .. 95.97 93.73 94.32 94.22 94.80 95.04
Domestic ............................. do .... 97.98 97.73 98.25 98.08 98.60 98.92 Foreign ...... _. __ .... _ .... __ .... _ ..... do .... 58.95 46.28 47.01 47.67 47.79 47. 11
Standard and Poor's Corporation: High grade (15 bonds)t .. dol. per $100 bond .. 116.7 116.9 116. s 117.0 117.7 118.7 Medium and lower grade:t
Composite (50 bonds) ..•........... do .... 98.8 98.4 99.5 99.3 99.2 99.9 Industrials (10 bonds) ............ do .... 106.1 102. 2 103.1 102.4 103.3 104.8 Public utilities (20 bonds). ....... do .... 101.8 104.6 106.0 106.2 106.3 107.1 Rails (20 bonds) .................. do .... 88.6 88.4 89.5 89.4 S7. 9 87.8
Defaulted (15 bonds)t ................ do .... 27.6 19.3 20.7 21.0 21.6 23.9 Domestic municipals (15 bonds) ...... do .... 119.7 125.4 126.8 128.2 129.5 130.4
U.S. Treasury bondsf .................. do .... l!O. 2 110.1 110.8 111.4 Ill. 5 111.7 Sales (Securities and Exchange Commission):
Total on all re~istered exchanges: Market value ............•. thous. of doL 137,003 118,851 133, 274 119,252 95,0.>5 116,272 Face value ......................... do .... 306,812 235,872 269,892 218,628 173.215 222,973
On New York Stock Exchange: Market value .. _____ ------------ ... do .... 121,066 96,162 109,867 100,577 78,266 9S, 274 Face value ......................... do. ___ 2S6, 211 209,379 242,720 196,932 !53, 363 201,056
Exclusive of stopped sales (N.Y. S. E.), face value, totaL ..... thous. of doL. 263,055 214,382 209,471 169,272 !49, 426 189, 118
U.S. Government. ............ do .... 879 I, 417 1,497 94S 1, 010 2, 598 Other than U.S. Govt., totaL .. do .... 262, 176 212,965 207,974 168,324 148,416 186, 520
Domestic .................... do .... 249, 192 199, 173 194,885 153, S31 !35, 174 174, 588 Foreign ....... _ .. ________ .... do .... 12,984 13,792 13,089 14,493 13,242 11,932
Value, Issues listed on N.Y. S. E.: Face value, alllssnes ............. mil. of doL flO, 579 55,746 55,678 55,534 56, 159 56,041
Domestic -------------------------- .. do .... 57, 471 51,419 51, 416 51,278 51,952 51,S36 Foreign ............................... do .... 3,108 4,328 4, 262 4,255 4.207 4, 205
Market value, all issues ................ do .... 58,140 52,252 52,518 52,322 53,237 53,260 Domestic .• _----------------- ____ .... do ..•. 56,308 50,249 50,515 50,293 51, 227 51, 279 Foreign ...... _. __ .. _._ ............... do. __ . 1,832 2,003 2,003 2,029 2,010 1, 981
Yields: Bond Buyer:
Domestic municipals (20 cities) ... percent.. 2. 38 2. 33 2.26 2.14 2. 07 2.07 Moodv's·
Domestic corporate .• ------------ .... do ... _ 3. 37 3.39 3.39 3. 37 3. 34 3. 30 By ratings:
Aaa ..•. ________ .............. __ .• do. ___ 2.86 2.80 2.82 2. Sl 2. 77 2. 74 Aa ............................... do .... 3.00 3. 01 3.04 2.99 2. 95 2. 90 A--------------------------------do .... 3. 32 3.37 3. 38 3. 34 3. 31 3. 26 Baa .............................. do .... 4.30 4.38 4.33 4.32 4.31 4. 28
By groups: Industrials .. __ .... __ .... _____ .. _. do ... _ 3. 00 3. 02 3.06 3.02 2.96 2.90 Public utilities ....... -------- .... do .•.. 3.17 3. 17 3. 16 3.13 ~. 10 I 3. 07 Rails _____________________________ do .... 3. 94 3. 98 3. 96 3. 95 3. 95 3. 92
i i
•111,394 •209, 122 '167, 287 •124, 703 '111, 394 •209, 122 '167, 287 '124, 703
74,427 161, 391 97,050 42,384
72,530 155, 881 96, 250 29,336 0 0 0 0
1,897 5, 39S 800 13,049 0 112 0 0
25,420 26,955 34,822 31,675 •11, 547 •20, 776 •31i, 415 •50, 644
401, 830 l?ii,656 200,311 131,811 327,403 34,265 103, 261 89,427 52,018 11,552 63, 17S 4~. 578
23R, 085 7, 922 5,S40 40, 6S7 ?3,300 7,060 21, ~29 I, 210 74,427 161,391 97.050 42,384 2,497 22,782 16,336 16,890
71,625 102,098 74,658 21,841 0 34,837 4,000 0
303 47 63 61 281 25 53 43 22 22 10 18
48,269 65,052 7S, 479 '60, 722 !69, 942 53,669 93, 123 113,655
531 500 454 282 77 103 93 74
628 633 628 625 189 196 186 195 460 396 414 409 262 260 255 264
94.86 94.74 95.25 94.80 98.58 98.27 98.72 9S. 30 48.85 50.79 50.75 49.S3
118.5 118. 1 118. s 119.2
99.6 98 0 99.2 99.4 104.9 105. 1 105.3 105.9 107.3 107.2 107.2 107.4 86.8 84.5 85.0 84.9 24.9 24.4 25.1 24.8
131.0 131.2 133.0 133.4 111.1 111.1 112.0 112.4
87,766 105. 508 125, 159 8S, 348 160,891 177,029 209,219 161,048
74,506 R9, 563 109, 8SS 76,382 !44, 101 155,537 189,947 145,446
140,157 140,963 178,899 140,746 1. 431 1, 319 I, 307 1,470
138, 726 139,644 177,592 139, 276 127,515 127, 575 163,413 125,694 11,211 12,069 14, 179 13, 582
56, 101 56,387 57,856 57, 821 51,900 52, 192 53,673 53,646 4, 201 4, 195 4,183 4,175
53,217 53,418 55, 107 54,813 51, 165 51,287 52,984 52,732
2, 052 2,131 2,123 2,080
2.08 2.02 1. 90 1. 93
3. 29 3. 30 3. 27 3. 26
2. 74 2. 75 2. 73 2. 72 2.90 2. 91 2. S7 2.86 3. 24 3. 24 3. 21 3.19 4. 27 4. 30 4. 28 4.2S
2.90 2.8S 2. 85 2. 85 3.06 3.07 3. 05 3.04 3.92 3. 95 I 3. 93 3. 91
•95, 589 151,478 •95, 589 151,478
52,055 82,846
50,321 81,726 0 0
1, 734 1,120 0 0
25, 100 33, 775 r!S, 435 34,857
!11, 520 170,032 59,466 87,186 24,018 46,150 7,203 28,101
27, 74.5 9, 890 52,055 82,846 16,880 499 31,339 82,120
0 0
71 137 I 34 67 37 70
'90, 578 118, 540 99,988 119,070
294 253 89 !54
I
600 547 211 219 368 308 289 274
94.50 95.24 96.69 97.31 56.27 58. 45
117.5 117. 5
97.4 99.2 105.0 106.7 104.7 104. I 82.4 86.9 21.9 2·!.1
125.9 124.4 110.7 llO. 1
134,712 125,744 277,038 256,089
116, 561 Ill, 586 251,650 237, 263
224,737 219,955 1, 781 1, 138
222,956 218.817 205,251 206, 145 17,705 12,672
58,237 59,076 55,080 55, 924 3, !57 3, !52
55,034 56,261 53,257 54,419
1, 777 1, 812
2. 24 2. 36
3. 35 3. 35
2.80 2.83 2. 95 2. 96 3. 27 3. 30 4.38 4. 29
2.94 2. 97 3. 12 3.13 3. 99 3. 93
56, 50S 56, 508 18,901
18, 901 0 0 0
26,580 11,027
74, 109 55, 209 24,067 25,970
3, 750 18,901 12,62 6, 27
()
5 0
4 7 3 4
3 1
r4f), 53" •38, 271
14 7,
53 20 30 26
4 3 7 z
95.1 97.1
3 8 0 57.4
117.1
99. 106. 104. 87. 25.
120. 108.
6 9 4 7 6 I 9
89,44 9 9 178,40
78,64 165,00
3 2
!58, 35 7 4 3 I 2
94 !57, 41 148, 55
8, 86
60, 53' 2 I 1 4 3 I
57, 41 3,12
57, 58 55,79
I, 79
2. 5
3. 3 5
2.8 5 8
29 2. 9 3. 4. 2
2.9 3.1 3. 9
9
8 5 4
• Revised. tSeenote marked "t" on p. S-17. tRevised series. For data beginning 1931 on Treasury bond prices. which relate to partially tax-exempt bonds, see table 55, p. 17 of the December 1940 SuRVEY. Earlier
data for Standard and Poor's bond prices are shown in table 36, p. 19 of the January 1942 SURVEY. •New series. For data on domestic issues for productive uses beginning 1921, see table 34, p. 17 of the September 1940 SURVEY.
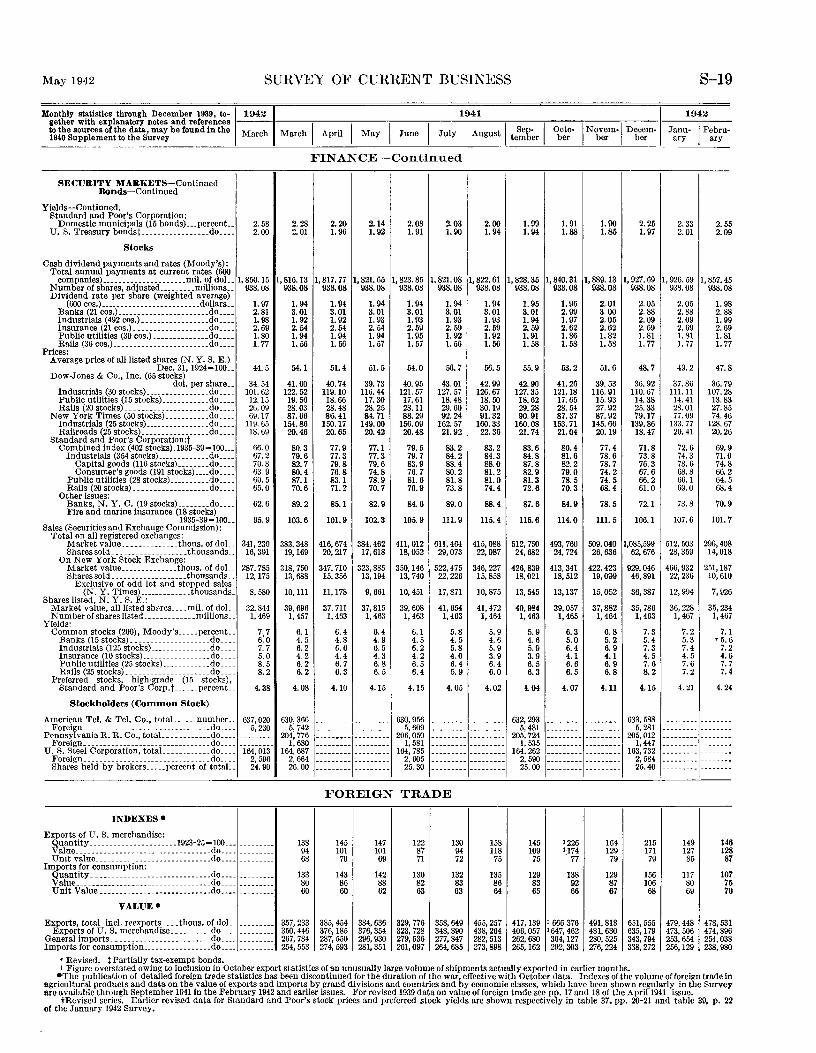
May 1942 SURVEY OF CURRENT BUSINESS S-19
Monthly statistics through December 1939, to-~19421 1941 I 1942 gether with explanatory notes and references ---1-----,-----,------,----.,------,-----,-------,----,----,,----- -----,-----tothesourcesofthedata,maybefoundinthe March Marchi April I May I June I July IAugustlteSmepb.erl Octo-~Novem-jDecem- Janu·IFebru· 1940 Supplement to the Survey ber ber 1 ber ary ary
FINANCE-Continued
SECURITY MARKETS-Continued I Bonds-Continued
Yields-Continued. Standard and Poor's Corporation:
Domestic municipals (15 bonds) ... percent .. 2. 58 2.28 2.20 2.14 2.08 2.03 2.00 1. 99 1. 91 1.90 2.25 2.33 2. 55 U. S. Treasury bondst ..••.....••••..•. do •••. 2.00 2.01 1. 96 1. 92 1. 91 1. 90 1. 94 1. 94 1.88 1.85 1. 97 2.01 2.09
Stocks
Cash dividend payments and rates (Moody's): Total annual payments at current rates (600
companies) .•................... mil. of doL. 1,850.15 1, 816. 13 1, 817.77 1, 821.65 1,823. 85 1,821.08 1,822. 61 1, 828.35 1, 840.31 1, 889.13 1, 927.69 1, 926.59 1, 857.45 Number of shares, adjusted ......... millions .. Dividend rate per share (weighted average)
938.08 938.08 938.08 938.08 938.08 938.08 938.08 938.08 938.08 938.08 938.08 938.08 938.08
(600 cos.) ......................... dollars .. 1. 97 1. 94 1.94 1. 94 1.94 1. 94 1. 94 1. 95 1. 96 2.01 2.05 2.05 1. 98 Banks (21 cos.) ......•..••.•..••...... do •... 2.81 3.01 3.01 3.01 3.01 3.01 3.01 3.01 2.99 3.00 2.88 2.88 2.88 Industrials (492 cos.) ..•••..••••....•. do .••• 1. 98 1. 92 1. 92 1.93 1.93 1. 93 1. 93 1. 94 1. 97 2.05 2.09 2.09 1. 99 Insurance (21 cos.)_ ......•.......•... do ..•. 2.69 2.54 2.54 2.54 2.59 2.59 2.59 2.59 2.62 2.62 2.69 2.69 2.69 Public utilities (30 cos.) .•.•........•. do .••• 1.80 1.94 1.94 1. 94 1. 95 1. 92 1. 92 1. 91 1.86 1. 82 1. 81 1. 81 1. 81 Rails (36 cos.) ......•.....•••..•...•.. do •••• 1. 77 1.56 1.56 1. 57 1. 57 1. 56 1. 56 1.58 1.58 1.58 1. 77 1.77 1. 77
Prices: Average price of all listed shares (N. Y. S. E.)
Dec. 31, 1924=100 .. 44.5 54.1 51.4 51.5 54.0 56.7 56.5 55.9 53.2 51.6 48.7 49.2 47.8 Dow-Jones & Co., Inc. (65 stocks)
dol. per share .. 34.54 41.60 40.74 39.73 40.95 43.01 42.99 42.90 41.26 39.53 36.92 37.86 36.79 Industrials (30 stocks) .....•.......... do .... 101.62 122.52 119.10 116.44 121.57 127.57 126.67 127.35 121.18 116.91 110.67 111.11 107.28 Public utilities (15 stocks) ............ do .... 12.15 19.56 18.66 17.30 17.61 18.48 18.50 18.62 17.65 15.93 14.38 14.41 13.83 Rails (20 stocks) ..................... do .... 26.09 28.03 28.48 28.25 28.11 29.60 30.19 29.28 28.54 27.92 25.33 28.01 27.85
New York Times (50 stocks) ........... do .... 69.17 87.66 8'5.41 84.71 88.29 92.24 91.32 90.91 87.37 87.92 79.17 77.09 74.46 Industrials (25 stocks) ................ do .... 119.65 154.86 150.17 149.00 156.09 162.57 160.33 160.08 153.71 145.66 139.86 133. 77 128.67 Railroads (25 stocks) ...............•. do ...• 18.69 20.46 20.65 20.42 20.48 21.92 22.36 21.74 21.04 20.19 18.47 20.41 20.26
Standard and Poor's Corporation:t Combined index (402 stocks).1935-39=100 ..• 66.0 80.3 77.9 77.1 79.5 83.2 83.2 83.6 80.4 77.4 71.8 72.6 69.9
Industrials (354 stocks) ......•...... do .•.. 67.2 79.6 77.3 77.3 79.7 84.2 84.3 84.8 81.6 78.6 73.8 74.3 71.0 Capital goods (116 stocks) ........ do ..•. 70.8 82.7 79.8 79.6 83.9 88.4 88.0 87.8 82.2 78.7 76.3 78.6 74.8 Consumer's goods (191 stocks) .... do .... 63.9 80.4 76.8 74.8 76.7 80.2 81.2 82.9 79.0 74.2 67.6 68.8 66.2
Public utilities (28 stocks) .......... do .... 60.5 87.1 83.1 78.9 81.6 81.8 81.0 81.3 78.5 74.5 66.2 66.1 64.5 Rails (20 stocks) ................... do .... 65.0 70.6 71.2 70.7 70.9 73.8 74.4 72.6 70.3 68.4 61.0 69.0 68.4
Other issues: Banks, N.Y. C. (19 stocks) ........ do .... 62.6 89.2 85.1 82.9 84.6 89.0 88.4 87.6 84.9 78.5 72.1 73.8 70.9 Fire and marine insurance (18 stocks)
1935-39 = 100 .. 95.9 103.6 101.9 102.3 105.9 111.9 115.4 115.6 114.0 111. 5 106.1 107.6 101.7 Sales (Securities and Exchange Commission):
Total on all registered exchanges: Market value .•..•......... thous. of doL. 341,230 383,348 416,674 384,462 411, 012 611,464 415,088 512,750 493,760 509,040 1,085,599 512,503 296,408 Shares sold .. _ ................ thousands .. 16, 391 19,169 20,217 17, 618 18,052 29,073 22,087 24,682 24,724 26,636 62,676 28,359 14,018
On New York Stock Exchange: Market value .............. thous. of doL. 287,785 318,750 347,710 323,885 350, 146 522,475 346,227 426,839 413, 341 422,423 929,046 466,932 251, 187 Shares sold __ . ____ ..... _ ...... thousands .. 12, 175 13,688 15,356 13, 194 13, 740 22,226 15,858 18,021 18,512 19,099 46,891 22,236 10,610
Exclusive of odd lot and stopped sales (N.Y. Times) ..•••........ thousands. 8, 580 10, 111 11,178 9, 661 10,451 17,871 10,875 13,545 13,137 15,052 36,387 12,994 7, 926
Shares listed, N.Y. S. E.: Market value, alllist~d shores ____ mil. of doL_ 32,844 39,696 37, 711 37,815 39,608 41,654 41,472 40,984 39,057 37,882 35,786 36,228 35,234 Number of shares listed ............. millions._
Yields: 1, 469 1, 457 1, 463 1, 463 1, 463 1, 463 1,464 1,463 1,465 1,464 1, 463 1,467 1, 467
Common stocks (200), Moody's ..... percent .. 7. 7 6.1 6.4 6.4 6.1 5.8 5.9 5.9 6. 3 6.8 7. 3 7.2 7.1 Banks (15 stocks) .................... do .... 6:o 4. 5 4.8 4.9 4.5 4.5 4.6 4. 6 5.0 5. 2 5.4 5.3 '5.6 Industrials (125 stocks) ......... _._ ... do ... _ 7. 7 6. 2 6. 6 6. 5 6.2 5.8 5.9 5.9 6.4 6. 9 7.3 7.4 7.2 Insurance (10 stocks) ................. do .... 5.0 4.2 4.4 4.3 4.2 4.0 3.9 3.9 4.1 4.1 4. 5 4.5 4.6 Public utilities (25 stocks) ..•......... do .... 8.5 6.2 6. 7 6.8 6.5 6.4 6.4 6.5 6. 6 6. 9 7.6 7.6 7. 7 R"ils (25 stocks) .... ___________ ...... do ... _ 8.2 6.2 6.3 6.5 6.4 5.9 6.0 6.3 6.5 6.8 8.2 7.2 7.4
Preferred stocks, high-grade (15 stocks), Standard and Poor's Corp.t ...... percent.. 4.38 4.08 4.10 4.15 4.15 4.05 4.02 !.04 4.07 4.11 4.15 4. 21 4.24
Stockholders (Common Stock)
American Tel. & Tel. Co., totaL .... number.. 637,020 630,366 --------- --------- 630,956 --------- --------- 632,293 --------- --------- 633,588 --------- --------Foreign_ -----------················-···do .... 5,230 5, 742 --------- --------- 5,609 --------- --------- 5, 481 --------- --------- 5,281 --------- --------
Pennsy1 vania R. R. Co., totaL ... ___ ..... do_ ... 204,776 -----·--- --------- 206,050 --------- --------- 205,724 --------- --------- 205,012 --------- --------Foreign ................................ do .... 1, 680 -----·--- --------- 1, 581 --------- --------- 1, 535 --------- --------- 1,447 --------- --------
U.S. Steel Corporation, totaL ........... do .... 164,013 164,687 --------- --------- 164, 785 --------- --------- 164,262 -········ --------- 163,732 --------- --------Foreign.--·-···-···-·-·-··-·- _____ ...... do .... 2, 596 2. 664 --------- --------- 2, 605 --------- --------- 2,590 I········· 2, 584 --------- --------Shares held by brokers ....• percent of totaL. 24.90 26.00 --------- --------- 25.30 --------- --------- 25.00 ......... 25.40 --------- --------
FOREIGN TRADE
INDEXES•
Exports of U. S. merchandise: Quantity_ ... _____ . ____ -·-·-· .. 1923-25= 100 ... --------- 138 145 147 122 130 158 145 1226 16i 215 149 146 Value .................. _ ............... do .... 94 101 101 87 94 118 109 1)74 129 171 127 128 Unit value .. ·--------··········-·······do .... --------- 68 70 69 71 72 75 75 77 79 79 85 87
Imports for consumption: Quantity._ ... _ ... _ .................... do .... --------- 133 143 142 130 132 135 129 138 129 156 117 107 Value_ ...............................•. do .... 80 86 88 82 83 86 83 92 87 106 80 75 Unit Value ..............•.••••••.••.•• do •.•. --------- 60 60 62 63 63 64 65 66 67 68 69 70
VALUE•
Exports, total incl. reexports .... thous. of doL_ --------- 357,233 385,454 384,636 329,776 358,649 455,257 417,139 I 666 376 491,818 651,555 479,448 478,531 Exports of U. S. merchandise .......... do .... 350,446 376, 185 376,354 323,728 348,890 438,264 406,057 1647,462 481,630 635, 179 473,506 474,896
General imports ......................... do .... 267,784 287,550 296,930 279,536 277,847 282,513 262,680 304, 127 280,525 343,794 253,654 254,038 Imports for consumption ................. do .... 254,553 274,593 281,351 261,097 264,685 273,898 265, 162 292,303 276,224 338,272 256,129 288,980
' Revised. t Partially tax-exempt bonds. t Figure overstated owing to Inclusion in October export statistics of an unusually large volume of shipments actually exported in earlier months.
•The publication of detailed foreign trede statistics has been discontinued for the duration of the war, effective with October data. Indexes of the volume of foreign trade In agricultural products and data on the value of exports and imports by grand divisions and countries and by economic classes, which have been shown regularly in the Survey are available through September 1941 in the February 1942 and earlier issues. For revised 1939 data on value of foreign trade see pp. 17 and 18 of the April1941 issue.
tRevised series. Earlier revised data for Standard and Poor's stock prices and preferred stock yields are shown respectively in table 37, pp. 20-21 and table 39, p. 22 of the January 1942 Survey.
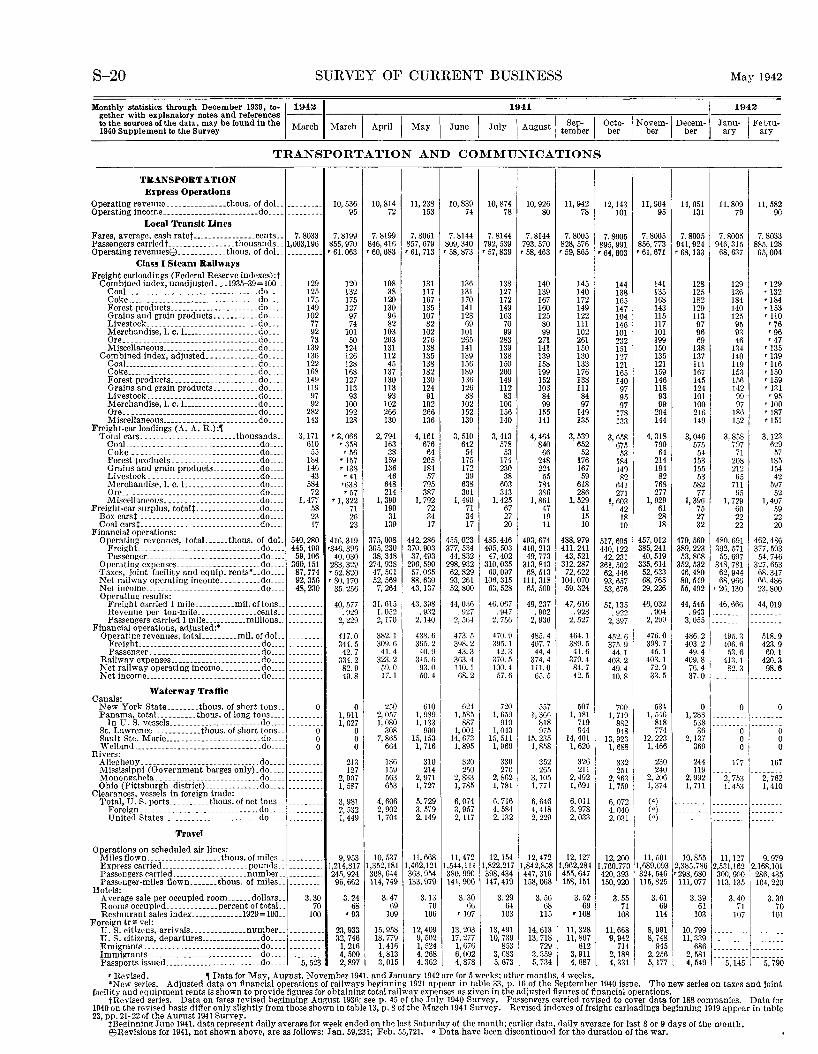
S-20 SURVEY OF CURRENT BUSINESS
Monthly statistics through December 1939, to-~19421 1941 gether with explanatory notes and references ---tothesourcesofthedata,maybefoundinthe March March I April I May I June I July I August I Sep- I 1940 Supplement to the Survey tember
October
May 1942
I Novem-1 Decem- I ber ber
1942
Janu- I Febru-ary ary
TRANSPORTATION AND COMMUNICATIONS
0 0
F p 0
F
TRANSPORTATION Express Operations
perating revenue _______________ thous. of dol.. perating income ________________________ do ____
Local Transit Unes ares, average, eash ratet----------------cents .. assengers carriedt -----------------thousands __ perating revenuesEf) ____________ thous. of dol._
Class I Steam Railways reight car loadings (Federal Reserve indexes):t Combined index, unadjusted .•. 1935-39=100 __
CoaL ______ -------------------- _____ .do. ___ Coke ... __ . ____ .. _._ .•. _. __ ... _ .•... __ do_. __ Forest products ___________ ------ _____ do ____ Grains and grain products ••• ________ do ____ Livestock ____________________________ do ... -Merchandise, 1. c. J. __________________ do ____ Ore. ___________ -------------------- __ do ____ Miscellaneous ______ ._._ .. _._._. _____ .do ____
Combined index, adjusted _____________ do ____ CoaL _______________________________ .do. ___ Coke _____ ._._. ___ . _________ . ___ . ___ ._ do_ Forest products __________ ------ ____ .. do __ :: Grains and grain products ___________ do ____ Livestock ____________________________ do ____ Merchandise,!. c. ]. __________________ do ____ Ore. ___ ------------------------------do ____ Miscellaneous .••. _ .• _._. _____ . _____ .. do. ___
F reigh t-ear loadings (A. A. R.) :, Total cars .. _________ . ___ . ___ . ____ thousands __
CoaL __ ----------------- _____________ do ____ Coke ________________________________ do ____ Forest products_. ____________________ do ____ Grains and grain products ____________ do ____ Livestock ____________________________ do ____ Merchandise,!. c. ]_ __________________ do ____ Ore .. _________ -------- ________________ do ____ Miscellaneous ________ ----------- _____ do ____
F reight-car surplus, totalt----------------do ____ Box carst--------- ---------------------.do ____ Coal carst .. ______ ---------------- ____ .. do ____
F inancial operations: Operating revenues, totaL __ . __ tho us. of doL
Freight ____ ._. ______ ._._. _____________ do ____ Passenger ___________ ..... _____ .. ______ do ____
Operating expenses ___________ ---- ______ do ____ Taxes, joint facility and equip. rents* .. do ____ Net railway operating income __________ do ____ Net income _____________________________ do ____ Operating results:
Freight carried I mile __________ mil.oftons __ Revenue per ton-mile _______________ cents __ Passengers carried I mile ___________ millions __
F inancial operations, adjusted:* Operating revenues, totaL ________ mil. of doL_
Freight_ _________________ . ___ ._._. __ .. do ____ Passenger ___ ------------- ____________ do ____
Railway expenses __________ ------- ______ do ____ Net railway operating income __________ do ____ Net income _____________________________ do ____
Waterway Traffic c anals:
New York State ________ thous. of short tons __ Panama, totaL _________ thous. of long tons ____
In U.S. vessels _______________________ do ____ St. Lawrence ____________ thous. of short tons __ Sault Ste. Marie ________________________ do ____ Welland ________________________________ do ____
R ivers: Alle~theny ----------------------------·_do ____ Mississippi (Government barges only)_do ____ Monon~ahela. _________________________ do ____ Ohio (Pittsburgh district) ___________ . __ do __ ._
c learances, vessels in foreign trade: Total, U.S. ports __________ thous. of net tons __
Foreign ______________________________ do ____ United States _______________ - ___ ---- .do ____
Travel
0 perations on scheduled air lines: Milrs flown ___________________ thous. of miles __ Express carried _______ . ________ ._._._ pounds __ Passengers rarried ___________________ numher __ Passenger-miles flown _______ thous. of miles __
H otels: Average sale per occupied room ______ dollars __ Rooms occupird ____________ percent of totaL Restaurant sales index_ ____________ 1929=100 __
orei!!n tr~ vel: U.S. citizens, arrivals ______________ number __ U.S. citizens, departures _______________ do ____ Emigrants.----------------- ___________ do ____ Immigrants. _________ . _____ .. ____ .. ____ do_. __
F
Passports issued _________ -------------- .do __ --
--------- 10, 536 --------- 95
7. 8033 7.8199 1,003,196 855, 970
' 61, 063
129 120 125 132 175 175 149 127 102 97 77 74 92 101 73 50
139 124 136 126 122 128 !68 168 149 127 119 113 97 93 92 100
282 192 143 128
3,171 '3, 066 610 '658
55 '56 !84 '157 146 '138
43 '41 584 •638 72 '57
1,477 '!, 322 58 71 23 26 17 23
540,280 416,319 445,490 '346. 396
59, 106 40.030 360,!51 283,329
87,774 '52. 820 92,356 '80, 170 43,230 35. 256
--------- 40,577 --------- . 929 --------- 2, 229
417.0 344.5
--------- 42.7 334. 2
--------- 82.9 40.8
0 0 --------- I, 911 --------- I, 027
0 0 0 0 0 0
--------- 213 127
--------· 2, 907 --------- I, 587
--------- 3, 981 -------- 2, 532 --------· I, 449
--------· 9, 953 -------- 1,214,817
24.,, 924 96,662
3.30 3. 24 70 68
100 '93
--------- 23,933 32,746
1,216 4, 500
5, 523 2,897
10,814 11, 238 10, 839 10,874 72 !53 74 78
7.8199 7.8061 7.8144 7. 8144 846,416 857, 679 809,340 792.539 '60, 683 ' 61, 713 '58, 873 '57, 839
108 131 !36 138 38 117 131 127
120 167 170 172 130 135 141 149 96 107 !23 163 82 82 69 70
103 102 101 99 203 276 265 283 131 138 141 139 112 135 139 138 45 138 156 150
137 182 189 200 130 130 136 149 113 124 126 112 93 91 88 83
102 102 102 100 266 266 152 156 130 136 139 140
2, 794 4,161 3, 510 3, 413 163 676 642 578 38 64 54 53
159 205 175 174 136 184 172 230 46 57 39 38
648 795 638 603 214 387 301 313
1, 390 I, 792 I, 490 I, 425 190 72 71 67
31 34 34 27 139 17 17 20
375,008 442,286 455,023 485, 446 305, 230 370,903 377, 534 405,503 38, 348 37,493 44,832 47, 402
274, 938 296,590 298,932 310,035 47,501 57, 065 62,829 69,097 52.569 88, 630 93, 261 106, 315
7, 264 43, 137 52,800 63,528
31.615 43, 398 44, 0~6 46,067 1.052 . 932 . 927 . 947 2,170 2,140 2, 564 2, 756
382.1 438.6 473. 5 470.9 309.6 365.2 398.2 3ll5. I 41.4 40.9 43.3 42. 3
323. 2 315.6 363. 4 370. 5 59.0 93.0 110. I 100.4 17. I 50.4 68.2 57.6
I 250 610 62! 720
2, 057 I, 989 I, 585 I, 659 1,080 I, 133 887 910
308 900 I, 001 1, 043 7, 865 15,153 14. 673 15, 511
664 I, 716 !, 895 I, 960
186 310 320 330 !59 214 250 270 563 2, 971 2,833 2, 862 653 I, 727 I, 785 I, 781
4, 606 5, 729 6, 074 G, 716 2, 902 3, 579 3, 957 4, 58·! I, 704 2,149 2,117 2, 132
10.5:37 11,668 11,472 12, 154 1,352,181 1,462,121 1,544,111 1,822,217 308,644 363,954 380.990 398,434 114,749 133,979 141,906 147,419
3. 47 3.13 3. 30 3. 29 69 70 66 64
109 106 '107 103
15,958 12,409 1~. 203 13,491 18, 779 9, 502 17,277 10, 739
1,416 I, 524 1, 676 853 4,813 4, 268 6,002 3, 083 3, 015 4, 362 4, 878 5, 673
10,926 11,942 12,143 11,904 14, 051 11,809 11, 582 80 78 101 95 131 79 90
7.8144 7. 8005 7. 8005 7. 8005 7. 8005 7. 8005 7. 8033 793,570 828, 576 895,991 856, 773 941,924 946,315 885, 128 '58, 463 '59, 865 '64, 603 '61, 671 ' 68, 133 68,637 65,004
140 145 144 141 128 129 '!29 139 140 138 135 125 136 '132 167 172 165 168 182 184 '!84 160 149 147 143 129 140 '153 125 122 104 115 113 125 '110 80 111 146 117 97 95 '76 99 102 101 101 96 93 '96
271 261 232 199 69 46 '47 141 !50 !51 !50 138 134 '135 139 130 127 135 137 140 '139 158 133 121 121 Ill 119 '116 199 176 165 !59 167 !53 '150 152 138 140 146 145 !56 '!59 103 111 97 118 124 142 '131 84 84 95 93 101 99 '95 99 97 97 99 100 97 '100
!55 149 178 204 246 !86 '187 141 135 133 144 149 !52 '151
4,464 3, 539 3, 658 4, 318 3,046 3. 858 3, !23 840 652 675 790 575 797 629
66 52 53 64 54 71 57 248 176 184 214 153 208 185 224 167 149 194 155 I 212 154
55 59 82 82 53 65 42 784 618 641 768 582 711 597 386 286 271 277 77 65 52
I, 861 1, 529 1, 603 I, 929 1, 396 1, 729 I, 407 47 41 42 61 75 60 59 19 15 18 28 27 22 22 11 10 10 18 32 22 20
493,674 488,979 517, 605 457,012 479,560 480.691 462,486 410,213 411,241 440, 122 385,241 389,223 392,571 377, 593
49,773 43,521 42,231 40,519 53,868 55, 697 54, 746 313,843 312,287 361,502 335,614 352, .532 348, 781 327. 653 68.513 72,622 62, 446 52,633 46,480 62,944 68,347
Ill, 318 104,070 93, 657 68, 765 80,549 68,966 6fl. 486 65,500 59,324 53, 676 29, 226 55,492 '26, 130 23,800
49, 237 47, 616 51, 135 46,032 44,545 46,666 44,019 . 902 . 928 . 922 . 904 . 943 --------- --------
2, 936 2, 527 2, 397 2, 299 3,055 -------- --------485.4 464.1 452.6 476.0 486.2 495.3 518.9 407.7 389.5 375. g 39S. 7 403.2 406.6 423.9
44.4 41.6 44. I 45. 1 49.4 .53. 6 60.1 374.4 379.4 403.2 403. 1 409.8 41:3.1 I 420.3 111.0 84.7 49.4 72.9 76.4 82.3 98.6 65.5 42.5 10.8 33.5 37.0 -- I -------
557 507 700 534 0 0 0 I, 36G I, 481 I, 719 1, 546 I, 283 ----- --- --------
818 719 882 818 538 --- --- ---------975 944 948 774 36 0 0
15, 235 14,401 13,923 12,223 2, 137 0 0 I, 858 I, 620 I, 688 I, 466 369 0 0
352 326 332 230 2441 177 167 26., 211 251 240 119 --------
3,105 2, 492 2. 863 2, 206 2,992 ---2;753 2, 762 I, 771 I, 691 1, 759 I, 374 . , ... I . '" I, 410
6. 646 6, 011 6, 072 (•) --------4, 418 3, 978 4, 040 (a) ------------------ --------2, 229 2, 033 2, 031 (•) ------------------ ----- --
I
I 12,472 12, 127 12.200 11, 501 10, 855 11, 127 I 9. 979
1,842,858 1,962,284 1,760,770 1,689,093 2,385,786 2,53!,162 2,168,101 447,316 455,647 420,393 324,546 '298, 680 300.900 286, 435 158,068 158, !51 150,920 115,825 111,077 113, 135 104, 220
3. 56 3. 52 3. 55 3. 61 3. 39 3.40 3. 39 68 69 71 69 61 "I 70
115 '108 108 114 103 J(l71 101
14,613 11,328 11,668 1 8, 991 10,799 ________ l _______ 13, 718 11,807 9·n~ 1
8, 748 11,339 --------- --------729 612 I 945 686 ,--------- --------
3,359 3, 911 I 2,1881 2, 256[ ~:~~~ [---5;i45T""5;79ii I 5, 734 4, 687 4, 331 5, 177
'Revised. , Data for May, August. November 1941, and January 1942 are for 5 weeks; other months, 4 weeks. *New series. Adjusted data on financial operations of railways be!(inning 1921 appear in table 33, p. !6 of the September 1940 issue. The new series on taxes and joint
facility and equipment rents is shown to provide figures for obtaining total railway expense~ as given in the adjusted fi!'ures of financial operations. tRevised series. Data on fares revised beginning August 193fi: seep. 45 of the July 1940 Survey. Passengers carried revised to cover data for 188 companies. Data for
1940 on the revised basis differ only slightly from those shown iu table 13, p. 8 of the March 1941 Survey. Revised indexes of freight car loadings beginning 1919 appear in table 23, pp. 21-22of the Au~nst 1941 Survey.
!Be~inning Jnnc 1941. data represent daily average for week ended on the last Saturday of the month; earlier data, daily average for last 8 or 9 days of the month. Ef)Revisions for 1941, not shown above, are as follows: Jan. 59,231; Feb. 55,721. • Data have been discontinued for the duration of the war.
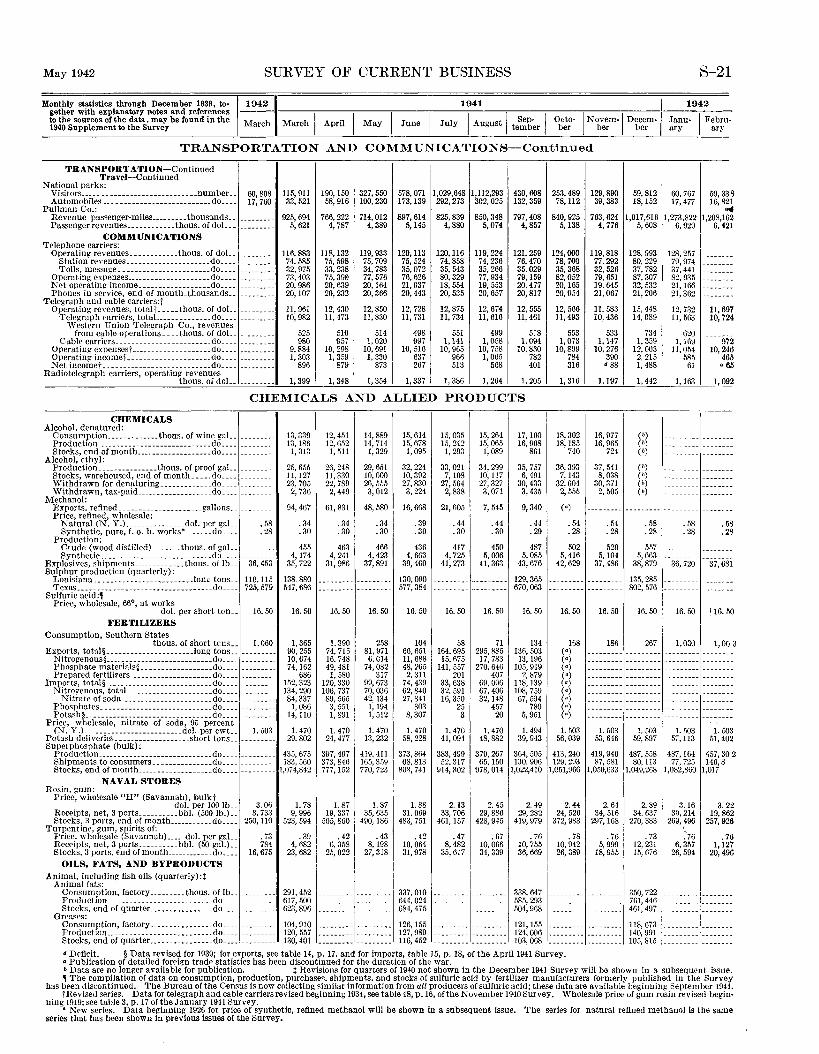
May 1942 SURVEY OF CURRENT BUSINESS S-21
Monthly statistics through December 1939, to· gether with explanatory notes and references to the sources of the data, may be found in the 1940 Supplement to the Survey
1
1942
March
1941
March I April I May I June I July I August I te~b~r I Octo- I Novem-1 Decem-/ ber ber ber
1942
Janu- I Febru-ary ary
TRANSPOR'rATION AND COMMUNICATIONS-Continued
TRANSPORTATION-Continued Travel-Continued
National parks: Visitors _____ ---------------------- .. number __ 00,808 115,911 190, !50 327,550 578,071 1,029,648 1,112,293 430,008 253,489 129,890 59,812 60,767 59,338 Automobiles ________________ ----------- do. ___ 17,760 33,521 58,916 100,230 173, 139 292,273 302,025 132, 359 78,112 39,383 18,152 17,477 16,821
Pullman Co.: ... Revenue pas•enger-miles .•••. ____ thousands._ --------- 925,694 766,222 714,012 897,614 825,839 850,348 797,408 840,925 763,624 1,017,616 1,273,822 1,208,162 Passenger revenues ____________ thous. of doL._ 5, 621 4, 787 4, 389 5,145 4, 880 5,074 4,857 5, 138 4, 776 5, 608 6,929 6. 421
COMMUNICATIONS Telephone carriers:
Operating revenues ____________ thous. of doL_ --------- 116,883 118,132 119, 933 120, 113 120,116 119,224 121,259 124,000 119,818 128,993 128,257 --------Station revenues _____________________ do ____ 74,585 75,598 75,709 75,524 74,858 74,236 76,470 78,700 77,292 80, 229 79,974 --------Tolls, message.------------------ ____ do ____ --------- 32,975 33,238 34,783 35,072 35, 543 35,266 35,029 35,368 32,526 37, 782 37,441 --------Operating expenses __________________ ... do ____ --------- 73,403 75,390 77,576 76,626 80,329 77,934 79,159 82,052 79,6.01 87,307 82,935 --------Net operating income __________________ do ____ 20,986 20,639 20, 164 21,037 18,554 19, 553 20,477 20,165 19, 645 32,532 21,166 --------
Phones in service, end of month. thousands .. 20,107 20,232 20,366 20,443 20,535 20,657 20,817 20,954 21,067 21, 206 21,362 --------Telegraph and cable carriers:t
Operating revenues, totalt _____ tho us. of doL 11, 961 12,430 12,850 12,728 12, 875 12,674 12, 555 12,566 11, 583 15, 448 12,732 11,697 Telegraph carriers, totaL ____________ do ____
Western Union Telegraph Co., revenues 10,982 11,473 11,830 11,731 11,734 11,616 11, 461 ll, 493 10,436 14,089 11,563 10,724
from cable operations._ .. thous. of doL_ --------- 525 510 514 498 551 499 518 553 533 734 620 --------Cable carriers. ______________________ .do ____ --------- 980 957 1,020 997 1,141 1,058 1, 094 1,073 1,147 1, 359 1,169 972 Operating expensest ----- ____________ ... do ____ --------- 9,884 10,298 10,691 10, 516 10,965 10, 758 10,830 10,809 10,276 12,003 11,054 10,246 Operating- incomet _____________________ do ____ 1, 303 I, 359 1, 330 637 966 !, 065 782 784 390 2, 215 585 465 Net incomet ___________________________ do ____ 896 879 873 267 513 568 401 316 d 88 1, 488 61 • 65
Radiotelegraph carriers, operating revenues thous. of doL_ --------- 1, 399 1, 348 I, 354 I, 337 1, 386 I, 264 1,205 1, 316 1,197 1, 442 1, 163 1,092
CHEMICALS AND ALLIED PRODUCTS
CHEMICALS Alcohol, denatured:
Consumption _____________ thous. of wine gaL. ________ _ Production ___________ . __ ... ------ _____ .do. __ _ Stocks, end of month __________________ _do ____________ _
Alcohol, ethyl: Production _______________ thous. of proof gaL. ________ _ Stocks, warehoused, end of month ..... do __ __ Withdrawn for denaturing _____________ do ..... ________ _ Withdrawn, tax-paid ___________________ do ___ _
Methanol: Exports. refined _____________________ gallons __________ _ Price, refined, wholesale:
Natural (N. Y.) _______________ dol. per gaL . 58 Synthetic, pure, f. o. b. works* _______ do____ . 28
Production: Crude (wood distilled) _______ thous. of gaL. ________ _ Synthetic __ . _____ . __________________ .do ___ _
Explosives, shipments _____________ tbous. of lb__ 36,453 Sulphur production (quarterly):
J,ouisiana __ -------------------···-long tons .. 110,115 Texas _____ ----------- __________________ do .. __ 725,579
Sulfuric arid:, Price, wholesale, 66°, at works
dol. per short ton__ 16. 50
FERTILIZERS Consumption, Southern States
thous. of short tens.. 1,060 Exports, totnl§ ______________________ long tons .. _______ __
Nitrogenous§ ___________________________ do ___ _ Phosphate materials§ ____ --------------do __ __ Prepared fertilizers _____________________ do .... ________ _
Imports, total§ --------------------------do .... ---------Nitro:renous, totaL _____________________ do ____________ _ Nitrate of soda _______________________ do ____ ---------
Phosphates __ ---------------------- .... do ____________ _ Potash§ __ ------------------------------do ___________ __
Price, wholesale, nitrate of soda, 95 percent
13,339 13,186 1, 313
25,655 11, 127 23, 705
2, 736
94,467
.34
.30
455 4,174
35,722
138 880 547,686
16.50
1, 365 90,2.15 10,674 74,162
686 152,323 134,290 84,337
I, 086 14, 110
(N. Y.) _________________________ dol. percwt__ 1.503 1.470 Potash deliveries .. _________________ short tons__ 29.802 Superphosphate (bulk): I
Production _____________________________ do ___ -~--------- 435, 675 Shipments to consumers _______________ do _____________ 183,560 Stocks, end of month ___________________ do ____ --------- 1,074,842
NAVAL STORES Rosin, gum:
l'rice, wholesale "H" (Savannah), bulkt dol. per 100 lb ..
Receipts, net, 3 ports __________ bbl. (500 lb.) __ Stocks, 3 ports, end of month ___________ do __ __
Turpentine, gum, spirits of: Price. wholesale (Savannah) ____ dol. per gaL_ Receipts, net, 3 ports __________ bbl. (50 gal.) __ Stocks, 3 ports. end ofmouth ____________ do __ __
OILS, FATS, AND BYPRODUCTS
Animal, including fish oils (quarterly):~ Animal fats:
3.06 3, 733
250, IIO
.73 784
16,675
Consumption, factory _________ thous. of lb .. _______ __ Production _______ -------------- ______ do ___________ __ Stocks, end of quarter ________________ do ____ ---------
Greases: Consumption, factory ________________ do ____________ _ Production ______________ ... ____ •. ___ .do. __ _ Stocks, end of quarter ................ do ___________ __
I. 78 9, 996
523, 594
. 39 4, 682
23,682
291,452 617,500 623,896
104,910 120, 557 130,401
12,451 12,652
1, 511
26, 248 11, 330 22, 789 2,449
61,831
. 34
.30
463 4, 241
31,986
14,889 14,714
1, 329
29, 651 10,000 26, 555 3, 012
48,580
.34
.30
466 4,423
37,891
16.50 16.50
1, 390 74, 715 16,748 49,481
I, 580 120,330 106,737 89, 565
3, 551 1, 891
1.470 24,477
2.58 81,971 6,CH
74,082 317
99, 673 70,036 42. 134
1, 194 I, 512
I. 470 13,232
397, 497 419, 411 373, 846 165, 3:\9 777, 152 770, 723
1.87 19,337
505,860
.42 6, 358
25,022
I. 87 35,635
490, 186
. 43 8, 198
27,318
15,614 15,678 I, 095
32,224 10,392 27,830 3, 224
16, 6G8
. 39
. 30
436 4, 663
39,460
130,090 577,384
16. 50
104 66,651 11,688 48, 265 2, 3II
74, 439 62,840 27,341
303 8,307
I. 470 58,228
373,864 68,813
808, 741
I. 88 31.069
483, 751
.42 10,064 31,978
--------- _________ 1337,010 644,024 684,475
126,155 127,989 116,452
15,035 15, 242
I, 293
33,021 7,108
27,564 2, 838
21, fi05
. 44
.30
417 4, 725
41,273
15,264 15,065
1, 089
34,299 10,117 27, 327 3, 071
7, 545
.44
.30
450 5,006
41,363
16. 50 16. 50
58 164, 695 15,675
141, 557 201
33,638 32,591 16, 350
25 3
71 295, R85 17,783
270,646 407
69,096 67,406 32, 148
457 20
17, 100 16,908
861
35,757 6, 491
30,433 3,435
9,340
.44
. 29
487 5,085
43,676
129, 365 670,063
16.50
134 136, 503 13,196
105,919 2,879
118, 139 108, 759 67, 594
780 5, 951
18,302 18,185
740
36,393 7,143
32,604 2, 555
(•)
. 54
. 28
502 5,416
42,629
16.50
16,977 16, 965
724
37,541 8, 038
30,371 2, 505
. 54
. 28
529 5,104
37,486
16.50
186
1. 470 1. 470 I. 494 I. 503 I. 503 41,094 48, 882 39,943 56,039 53,646
383, 499 379, 267 364, 505 413, 240 419,946 52,317 65, 150 130,906 129, 293 87, 581
914, 302 978, 014 1,022,410 1,051,966 1,050,633
2.13 33, 706
461,157
. 47 8,482
35,617
2. 45 29,886
428,945
. 67 10,066 34,339
2. 49 29,282
419,979
• 76 10,755 36,669
2.44 24, 526
372, 983
. 78 10,942 26,389
2. 64 34,516
297, 168
. 76 5, 999
18,955
I
(b) (b) (b)
(b) (') (b) (b)
. 58
. 28
5-07 5, 663
38,879
135, 285 802,576
16.50
267
36, 720 37, 681
16. 5o r 16. 50
1,030 1,00 3
1.5031 1.503 59,897 57, II3
487,558 487, 164 80, II3 77, 725
1.049,268 I ,082,860
I. 503 51,402
457,30 2 146,8
1,017
2. 89 34, 637
270, 383
. 73 12, 231 15,676
3.16 3. 22 30,214 19, 862
269, 496 257, 926
.'7G 6, 357
26,594
. 76 1,127
20,496
338.647 585,293 504,968
---- -- -- - ---- --- ..1350, 722
121,155 124,006 103,068
--------- --------- 761, 446 --------- --------- 461,497
118, 673 140,991 105, 815
d Deficit. §Data revised for 1939; for exports, see table 14, p. 17. and for imports, table 15, p. 18, of the April1941 Survey. • Publication of detailed forei!m trade statistics bas been discontinued tor the duration of the war. b Data are no longer available for publication. ~ Revisions for quarters of 1940 not shown in the December !941 Survey will be shown in a subsequent issue. , The compilation or data on consumption, production, purchase,, shipments, and stocks of sulfuric acid by fertilizer manufacturers formerly published in the Survey
has been discontinued. The Bureau of the Census is now collecting similar information from all producers of sulfuric acid; these data are available beginning Beptember 1941. t Revised series. Data for telegraph and cable carriers revised beginning 1934, see table 48, p, 16, of the November 1940 Survey, Wholesale price of gum rosin revised begin
ning 1919; see table 3, p, 17 of the January 1941 Surwy, • New series. Data beginning 1926 for price of synthetic, refined methanol will be shown in a subsequent issue. The series for natural refined methanol is the same
series that has been shown in previous issues of the Survey.
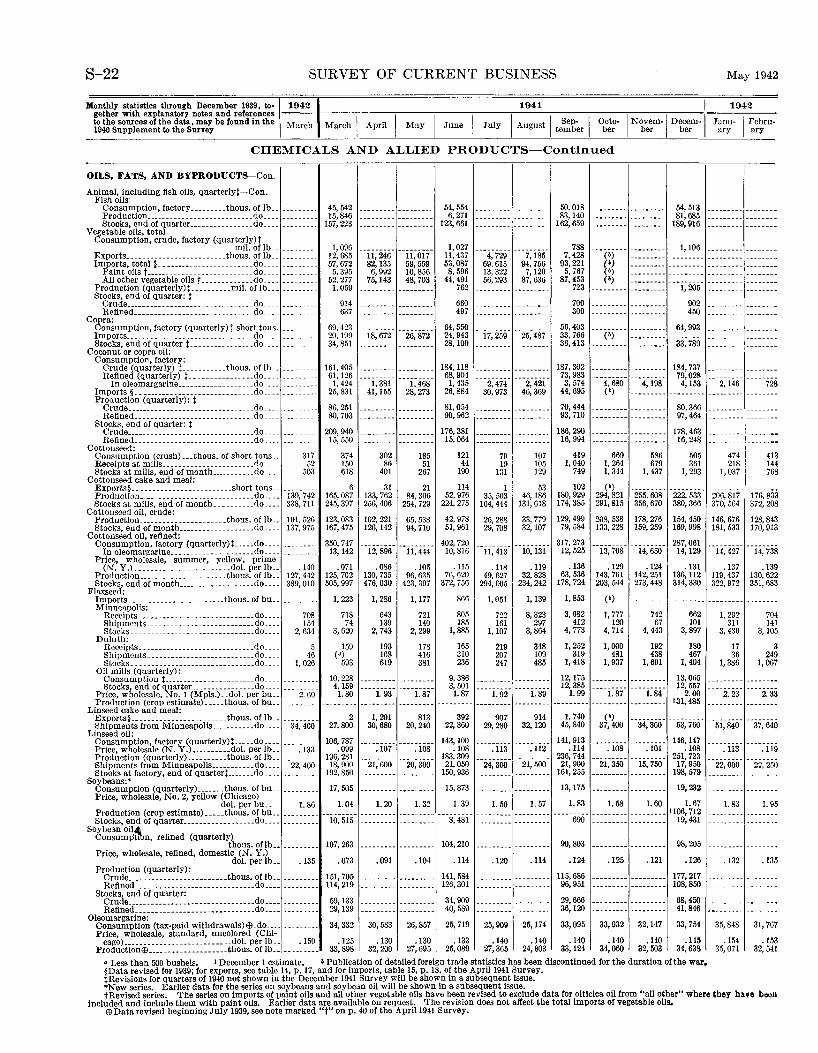
S-22 SURVEY OF CURRENT BUSINESS
Monthly statistics through December 1939, to-~19421 1941 gether with explanatory notes and references ---to the sources of the data, may be found in the March March I April I May I June I July I August I Sep- I 1940 Supplement to the Survey tember
CHEMICALS AND ALLIED PRODUCTS-Continued
OILS, FATS, AND BYPRODUCTS-Con.
Animal, including fish oils, quarterlyi-Con. Fish oils:
Consumption, factory .••...... thous. of lb .. ________ _ Production __________________________ .do .... ________ _ Stocks, end of quarter ________________ do. ___________ _
Vegetable oils, total:
45,542 15,846
157,223
54,554 6, 271
123,661
50,018 83, 140
162,659
54,513 81,685
189,916
May 1942
1942
Janu- I Febru-ary ary
Consumption, crude, factory (quarterly)! mil. oflb .. ________ _
Exports _________________________ thous. of lb .. ________ _ 1, 096
12,685 57,672
11,246 82,135
6, 992 75,143
11,017 59,559 10,856 48,703
1,027 11,437 53,087 8,596
44,491
4, 729 69,615 13, 322 56,293
7,185 94,756
7, 120 87,636
788 7, 428
93,221 5, 767
87,453 723
---<•5--- ::::::::: ---~~~~~- ::::::::: :::::::: Imports, total § ________________________ do ____________ _ ('j --------- --------- --------- --------
Paint oils t---------------------------do .... --------- 5,395 52,277 1,059
(b) --------- ---·----- --------- --------AU other vegetable oils t-------------do ____________ _ (') --------- --------- --------- --------Production (quarterly)t __________ mil. of lb ..• ________ _
Stocks, end of quarter: I Crude ••••..... __ ---------- _______ .... do. ____ .•• ____ _ Refined ______________________________ do .... ________ _
Copra:
914 637
762
660 497
700 300
I, 205
902 450
Consumption, factory ( quarterly)t.short tons. __ . _____ _ Imports ...... _____ ------------------- .. do. ___________ _
69,423 20,199 34, 851
18,672 26,872 64,550 24,943 28,109
17,259 25,487 ~~:~~~ ---<•5·-- ::::::::: --~~~~~- ::::::::: :::::::: Stocks, end of quarter 1----------------do ...• ________ _ 36,413 --------- --------- 33,789 --------- --------
Coconut or copra oil: Consumption, factory:
Crude (quarterly) 1-----------thous. of lb .. ________ _ Refined (quarterly) 1----------------do .... ________ _
In oleomargarine ___________________ do .... ________ _ Imports§._ ----------------------------do ____________ _
161, 405 61,126
1, 424 25,831
1, 381 41, 155
1. 468 28,273
184, 118 68,904
1, 435 26,884
2,474 30,973
2,421 46,369
187,302 73,983 3, 574
44,695 4, 680 (b)
4,198
184,737 79,028 4,153
Production (quarterly): I Crude ________________________________ do _____________ 86,251 --------- --------- 81,054 --------- --------- 70,444 --------- --------- 80,366 Refined ______________________________ do.... SO, 703 --------- _________ 90,962 --------- _________ 93,710 --------- --------- 97,464
Stocks, end of quarter: I Crude ..... __ ........... _____ ._ ....... do __ ._ Refined. __ • _____ ._. ________ ._ .• ___ ... do._ ..
Cottonseed: Consumption (crush) ... thous. of short tons .. Receipts at mills _______________________ do ___ _ Stocks at mills, end of month ___________ do ___ _
Cottonseed cake and meal: Exports§. __ -------------- ________ short tons ..
317 52
503
Production ...•.. ---------- ______________ do .... 139,742 Stocks at mills, end ofmonth __________ do .... 338,711
209,940 15,550
374 150 618
6 165,087 245,397
302 86
401
31 133,762 256,406
185 51
267
176, 381 15,064
121 44
190
21 114 84, 306 52, 976
254, 729 224, 275
79 19
131
1 35, 503
164,444
107 105 129
53 46,186
131, 618
186,290 16,994
419 1,040
749
102 180,929 174,385
669 1, 264 1, 344
(b) 294,821 291,815
586 679
1,437
255,608 356, 670
178,463 16,248
505 361
1, 293
222, 533 380,366
Cottonseed oil, crude: Production ______________________ thous.oflb .. 101,526 123,083 102,221 65,538 42,978 26,288 33,779 129,499 208,538 178,276 154,450 Stocks, end of month ___________________ do .... 137,975 167,475 126,142 94,710 51,961 29,708 32,107 79,584 133,228 159,259 169,998
Cottonseed oil, refined: Consumption, factory (quarterly)l ..... do .... --------- 350,747 --------- --------- 402,720 _________ --------- 317,273 _________ --------- 287,061
Inoleomargariue _____________________ do____ 13,142 12,896 11,444 10,816 11,413 10,131 12,525 13,708 14,650 14,129 Price, wholesale, summer, yellow, prime
(N. Y.). _______________________ dol. per lb .. Production ______________________ thous. of lb .. Stocks, end of month _______________ .... do ....
Flaxseed:
.140 127,442 389,010
.071 125, 702 505,997
.086 130, 735 476,030
'105 96, 635
423,397
Imports .. ----------------------thous. of bu .. --------- 1, 223 I, 286 1, 177 Minneapolis:
Receipts .• ----------------- ________ .. do ... _ Shipments. __ .. _._._ ..... _._. _____ ._ .do_._. Stocks. ______ ------------ ___________ .do ....
Duluth: Receipts. ____________________________ do ___ _ Shipments. _______________________ ... do .. __ Stocks. __________ ---------- _________ .do .. __
Oil mills (quarterly):
708 154
2, 631
5 46
I, 026
Consumption 1-----------------------do .... ________ _ Stocks, end of quarter ________________ do ____________ _
Price, wholesale, No. I (Mpls.) .. dol. per bu.. 2. 60
718 74
3, 620
159 (•)
593
643 139
2, 743
193 168 619
721 140
2, 299
178 416 381
10,223 --------- ---------
\~~ ----i~93" ----i~87"
.115 76,620
372,756
866
805 185
1,885
165 310 236
9, 3~6 3, 501
1. 87
'118 49,627
294,005
1, 051
722 161
1, 107
219 207 247
1. 92
.119 32,828
234,242
1, 139
8,323 297
3,864
348 109 485
1. 89
.136 63,536
178, 724
1, 853
3, 682 412
4, 773
1, 252 319
I, 418
12, 175 12,385
1. 99
'129 143, 761 203,544
(b)
1, 777 120
4, 714
1,000 481
1, 937
1.87
.124 142, 2.51 273,448
742 67
4, 443
192 438
1,691
1.84 Production (crop estimate) ..... thous. of bu .. _________ --------- --------- --------- --------- --------- --------- --------- --------- ---------
Linseed cake and meal:
.131 136, 112 314, 330
662 101
3, 897
180 467
1, 404
13,065 12,557
2.00 131,485
2,146
474 218
1, 037
206,817 370,564
146,676 181, 533
14,427
'137 119,437 322,972
I, 292 311
3, 430
17 36
1, 386
2, 23
728
413 144 768
176, 833 372,208
128,843 170,913
14,738
'139 130, 622 351,683
704 141
3,105
3 249
1, 067
2. 33
Exports§ ________________________ thous. of lb .. _________ 2 1,201 813 392 907 914 1,740 (b) --------- _________ -----------------Shipments from Minneapolis ........... do____ 34,400 27, BOO 30,680 20,240 22,360 29,280 32, 120 45,840 37,400 34,360 53,760 37,640
Linseed oil: Consumption, factory (quarterly)l _____ do ___________ _ Price, wholesale (N. Y.) •......... dol. per lb.. .133 Production (quarter!y) __________ thous. of lb .. _______ _ Shipments from Minneapolis ___________ do.... 22,400 Stocks at factory, end of quarterl ....... do .... ________ _
106,787 .099
196,281 18,900
192,850
.107 .108
21,600 20,300
143, 100 .108
183,309 21,050
150,936
.113 .112
24,300 21,500
141,913 .114
236,744 21,900
161, 255
.108
21,350
.101
15, 750
146,147 .108
251,723 17,950
198,579 Soybeans:•
Consumption (quarterly) _______ thous. of bu .. --------- 17,505 --------- --------- 15,873 --------- --------- 13, 175 --------- --------- 19,232 Price, wholesale, No.2, yellow (Chicago)
dol. per bu.. 1. 86 1. 04 1. 20 1. 32 1. 39 1. 50 1. 57 1. 83 1. 58 1. 60 1. 67 Production (crop estimate) .•... thous. of bu .. _________ --------- --------- --------- --------- --------- --------- --------- --------- --------- 1106,712 Stocks, end ofquarter .•...........•.... do____ _________ 10,515 --------- --------- 8,481 --------- --------- 690 --------- --------- 19,431
Soybean oilll, Consumpfibn, refined (quarterly)
thous. ollb .• --------- 107,263 ------------------ 104,210 ------------------ 90,803 --------- --------- 98,205 Price, wholesale, refined, domestic (N.Y.)
dol. per lb .. .135 .073 .091 .104 .114 '120 .114 .124 .125 '121 .126 Production (quarterly):
Crude ... ----------------------thous. ollb .. _________ 151,705 _________ --------- 141,584 --------- --------- 115,686 --------- --------- 177,217 Refined ______________________________ do .... _________ 114,219 --------- --------- 126,301 --------- --------- 96,951 --------- --------- 108,850
Stocks, end of quarter: Crude ...•• ---------------------------do____ _ __ _ _ _ _ __ 59, 133 --------- --------- 34,909 --------- --------- 29,666 --------- --------- 68,450 Refined ______________________________ do____ _________ 29,139 --------- --------- 40,589 --------- --------- 36,120 --------- ---·----- 41,846
Oleomargarine: Consumption(tax-paidwithdrawals)EJ)_do ____ --------- 34,332 30,583 26,857 25,719 25,909 25,174 33,095 33,932 32,147 33,754 Price, wholesale, standard, uncolored (Chi-
cago) ___________________________ dol.perlb ... 150 .125 .130 .130 .133 .140 .140 .140 .140 .140 .145 ProductionEJ) ....••••.......•.... thous. ollb .... ___ ---- 33,898 32,200 27,695 25,089 27,365 24,803 33, 124 34,060 32,503 34,638
• Less than 500 bushels. 1 December 1 estimate. • Publication of detailed foreign trade statistics has been discontinued for the duration of the war• §Data revised for 1939; for exports, see table 14, p, 17, and for imports, table 15, p. 18, of the April1941 Survey. tRevisions for quarters of 1940 not shown in the December 1941 Survey will be shown in a subsequent Issue.
51,840
.113
22,000
1.83
.132
35, 848
.154 35,071
.119
22, 250
1. 95
'135
31,767
'153 32,541
•N ew series. Earlier data for the series on soybeans and soybean oil wiU be shown in a subsequent issue. tRevlsed series. The series on imports of paint oils and all other vegetable oils have been revised to exclude data for olticlca oil from "all other" where they have been
included and include them with paint oils. Earlier data are available on request. The revision does not affect the total imports of vegetable oils. Ell Data revised beginning July 1939, see note marked "t" on p. 40 of the April1941 Survey.
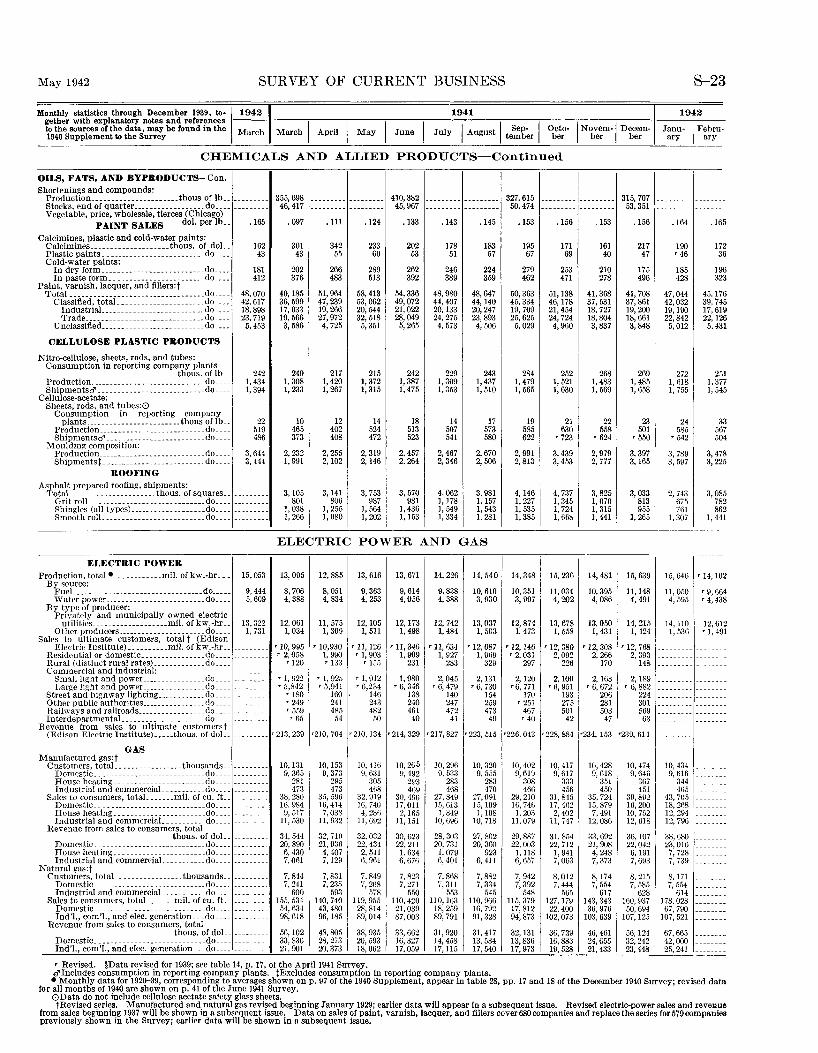
May 1942 SURVEY OF CURRENT BUSINESS S-23
Monthly statistics through December 1939, to-~19421 1941 1942 gether with explanatory notes and references ---
I I I I I August I te~~~r I to the sources of the data, may be found in the March March April May June July Octo- I Novem-1 Decem- I Janu- I Febru· 1940 Supplement to the Survey ber ber ber ary ary
CHEMICALS AND ALI,IED PRODUCTS-Continued
OILS, FATS, AND BYPRODUCTS-Con.
315, 707[ ______ Shortenings and compounds:
Production ______________________ thous of lb .. --------- 355,698 --------- --------- 410,382 --------- --------- 327,615 --------- ---------Stocks, end of quarter __________________ do ____ -------- 46,417 --------- --------- 45,967 --------- --------- 50,474 --- --------- 53,351 ------Vegetable, price, wholesale, tierces (Chicago)
PAINT SALES dol. per lb .. .165 .097 . lll .124 .133 .143 .145 .153 .156 .153 .156 .164 .165
Calcimines, plastic and cold-water paints: Calcimines ____________________ thous. of doL. 162 301 342 233 202 178 183 195 171 161 217 190 172 Plastic paints. _________________ -------- do .... 43 43 55 60 53 51 57 67 69 40 47 '46 36 Cold-water paints:
In dry form __________________________ do .... 181 202 266 289 262 246 224 279 253 210 175 185 196 In paste form. _______________________ do ____ 412 376 483 513 392 389 359 462 471 278 496 428 323
Paint, varnish. lacquer, and fillers:t Total ___ ------------------------- ...... do. ___ 48,070 40, 185 51,964 58,413 54,336 48,980 48,647 50,363 51,138 41,368 41,708 47,044 45,176
Classified. totaL __ . __________________ do ____ 42,617 36,599 47,239 53,062 49,072 44,407 44, 140 45,334 46,178 37,531 37,861 42,032 39,745 IndustriaL .. ________ . _________ ._ ... do_ ... 18,898 17,033 19,266 20,544 21,022 20,133 20,247 19,709 21,454 18,727 19,200 19,190 17,619 Trade _____ ...... _ ... ___ .. _. _____ ._. do ... _ 23,719 19,566 27,972 32,518 28,049 24,275 23,893 25,625 24,724 18,804 18,661 22,842 22,126
Unclassified .... __ .... _. __ .. __ ... ___ ._ do .. -- 5, 453 3, 586 4, 725 5,351 5, 265 4, 573 4, 506 5, 029 4, 960 3,837 3, 848 5,012 5, 431
CELLULOSE PLASTIC PRODUCTS
Nitro-cellulose, sheets, rods, and tubes: Consumption in reporting company plants
thous. of lb __ 242 249 217 215 242 229 243 284 252 268 269 272 251 Production ________ ------------ ______ .. do ____ 1, 434 1, 308 1, 420 1, 372 1,387 1,309 I, 437 1,479 1, 521 1,483 1, 485 1, 618 1,377 Shipmentsd' ________ . ____ . ___________ .. do. ___ I, 394 1, 233 1, 267 1, 315 1,475 1, 353 1, 510 1, 565 1, 630 1, 569 1, 658 1, 755 1,545
Cellulose-acetate: Sheets, rods, and tubes:0
Consumption in reporting company
pfJ~~~~ioii_-_-_~::::~~~ ~~ ~: ~~~~ ~~ ~~~~~-~~ ~~:: 22 10 12 14 18 14 17 19 21 22 23 24 33 519 465 402 524 513 507 573 585 630 558 501 585 567
Shipmentsd' ------------- __________ .. do .. _. 486 373 408 472 523 541 580 622 '723 '624 '550 '542 504 Moulding composition:
Production _______ . __ ....... __________ do __ ._ 3, 644 2, 232 2, 255 2, 319 2,457 2,467 2, 670 2,991 3,439 2, 979 ' 3, 397 3, 789 3,478 Shipmentst. ------------------ _______ do ____ 3, 444 1, 991 2,102 2,146 2, 264 2,346 2, 506 2,813 3, 453 2, 777 3,165 3, 597 3, 225
ROOFING Asphalt prepared roofing, shipments:
TotaL _____________________ thous. of squares .. 3, 105 3, 141 3, 753 3, 570 4. 062 3, 981 4,146 4, 737 3, 825 3, 033 2, 743 3,085 Grit rolL _____________________________ do ____ 801 806 987 981 1, 178 1.157 1,227 I, 345 1,070 813 675 782 Shingles (all typcs) ___________________ do ____ I, 038 I, 255 I, 564 1,436 I, 549 I, 543 1, 535 1, 724 1, 315 955 761 862 Rmooth roll __________________________ do ____ 1, 266 I, 080 I, 202 I 1, 153 I, 334 I, 281 1.385 1, 66~ 1, 441 1, 265 1,307 1, 441
ELECTRIC POWER AND GAS
ELECTRIC POWER I
14, 540 I I
15,2361 Production, total • ____________ mil. of kw.-hr _ .. 15,053 13, 095 12, 885 13, 6161 13, 671 14,226 14, 3481 14, 481 15, 639 15,646 '14, 102 By source:
FueL __ .. ___ .. __ ... _ .... ______ . ______ do ..... 9, 444 8, 706 8,051 9, 363 9, 614 9,838 10,610 10,351 u. 034 10,395 ll,l48 11,050 r 9,664 Water power ... __ .. __________________ do .. __ 5, 609 4, 388 4, 834 4, 253 4,056 4, 388 3, 930 3, 997 4,202 4,086 4, 491 4, 595 '4,438
By type of producer: Privately and municipally owned electric
utilitics ___________________ mil. of kw.-hr __ 13,322 12,061 11, 575 12, 105 12, 173 12,742 13,037 12,874 13,678 13.050 14, 215 14,110 12,612 Other producers _____________________ .do .. __ 1, 731 I, 034 1, 309 I, 5ll 1, 498 1, 484 1, 503 1, 473 1, 558 I, 431 1, 424 1, 536 'I, 491
SaJes to ultimate customers, total t (Edison Electric Institute) __________ mil. of kw.-hr .. __ -- --- '10, 995 '10,930 '11, 126 '11, 346 '11, ll3~ '12, 087 '12, 146 ' 12, 380 '12, 308 r 12, 768 --------- --------
Residential or domestic ________________ do .... _ ·--- --- '2,058 I, 990 '1, 903 I, 909 1, 927 1, 9fi9 '2,031 2, 092 2, 266 2, 393 ------ ---------Rural (distinct rural rates) _____________ do .... '120 '133 r 155 231 283 329 297 226 170 148 ---------- ------Commercial and industrial: -----
Small light and power ________________ do _____ ----- 'I, 922 'I, 92.5 '1, 912 1, 980 2, 045 2,131 2,120 2,100 2,163 2, IR9 ---------- -- ~ --Large light and power .. ______________ do _____ ------- T 5,842 T 5,941 '6,234 '6, 346 r 6, 479 '6, 730 •6, 771 ,. 6, 951 r 6, 672 '6, 882 ---------- ------Street and highway lighting ____________ do ____ ------ '180 160 146 138 140 154 170 193 206 224 --------- --------Other public authorities ________________ do .... ~ ----- '249 241 243 240 247 259 '251 275 281 301 --------- --------Railways and railroads _________________ do ____ -- - ~ '559 485 4R2 461 472 473 467 501 503 569 --------- ---- ---InterdepartmentaL. ___ .. ____ ........ _. do_._.
Revenue from sales to ultimate customers t --------- '65 54 .50 40 41 40 '40 42 47 63 -- ~ - - --------
(Edison Electric Imtitute) .•.•. thous. of doL. --------- '213, 239 •210, 704 •210, 134 •214, 329 r2J7,827 •223, 515 •226, 043 •228, 884 •234, 153 •239, 611 -- --- ---------
GAS I Manufactured gas:t
Customers, total _________________ thousands.~ -------- 10,r:n 10,153 10,416 10.265 10,296 10,320 10,402 10,417 10,428 10,474 10,434 --------Domestic ___________________________ .do. ___ ------ 9, 365 9, 373 9, ()31 9, 492 9, 533 9, 555 9, 619 9,017 9,618 9,646 9,616 --------House heating __________ ------------~do ____ . ------ 281 29.5 305 293 283 283 308 333 351 3(i7 344 --- ----Industrial and commerciaL ____ . ____ ~ do ____ --------- 473 473 4(i8 4fi9 468 470 466 456 450 451 4(i5
~ - ----Sales to consumers, totaL ______ mil. of cu. ft._ ----- -- 38,280 35,596 32,919 30, 491) 27,849 27,091 29,210 31,845 35,724 39,892 43,705
~ - ----Domestic_ -------------------------do .... -------- 16.984 16,414 Hl, 740 17,011 15,613 15, 109 16, 74fi 17,462 15,879 16,200 18, 2fl8 House heating _______________________ do .... ------ 9, 517 7,038 4, 28fi 2,165 1, 349 1, 108 1,203 2, 402 7,491 10, 752 12,294 --------Industrial and commerciaL _______ ._~ do __ ._ --------- 11, 530
Revenue from sales to consumers, total 11. 932 ll,tiV2 11, 151 10, 69G 10,718 ll, 079 11, 747 12,080 12,018 12,796 -- ---
tho us. of doL. --------- 34,544 32, 719 32.032 30,623 28,303 27,802 29,887 31.854 33,692 36,107 38,680 ------Domestic. __ -------------------------do .... -------- 20,890 21,03(; 22,434 22.211 20,731 20,360 22,003 22,712 21,908 22,042 23,016 --------House heating _______________________ do .... --------- 6, 430 4, 407 2, 511 1.634 1, 079 923 1, 118 1, 941 4, 248 6, 191 7, 728 -------Industrial and commereiaL __________ do .... ------ 7,061 7,129 6, 961 6, ()7() 6, 401 6, 4ll 6, 657 7,063 7, 373 7,693 7, 739 --- ----
Natural gas:t Customers, totaL ______ . _________ thousands._ --------- 7,844 7,831 7,849 7, 823 7,868 7, 882 7, 942 8, 012 8,174 8, 215 8.171 ------Domestic. _____________ . _____________ do. ___ --------- 7, 241 7, 235 7, 268 7, 271 7, 311 7, 334 7,392 7, 444 7, 554 7, 585 7, 554 --------
Industrial and commerciaL .......... do ____ --- ----- 600 593 578 .550 M3 545 548 565 617 628 614 ---- - - ~
Sales to consumers, totaL ______ mil. of cu. ft.. --- ----- 155, 534 140,740 119,955 no. 420 110, 163 llO, 966 l15, 379 127, 179 143,343 160, 937 178.028 --- ----Domestic. _________ ----------------- .do .... ---- ---- 54,634 43,480 28,814 21,039 18,259 16,792 17,812 22,400 36, 976 50,694 67,790 ----lnd'l., com'!., and elec. generation ... do .... ---- ---- 98,618 96,185 89,014 87,003 89,791 91,328 94,873 102,073 103,639 107,125 107,521 --- ----
Revenue from sales to consumers, total thous. of doL --------- 56, 102 48,805 38,935 33,662 31,920 31,417 32,131 36,739 46,461 56,124 67,665 --------Domestic ___________________________ .do. ___ ---- ---- 33,836 28,273 20,593 16,327 14,458 13, 534 13,836 16,883 24,655 32,242 42,000 --------
Ind'l., com'!., and elec. generation __ .do ________ ---- 21,901 20,373 18,062 17,059 17,115 17,540 17,973 19,528 21,433 23,448 25,241 --------
• Revised. §Data revised for 1939; see table 14, p. 17, ol the April 1941 Survey. 0" Includes consumption in reporting company plants. tExcludes consumption in reporting company plants. • Monthly data for 1920-39, corresponding to averages shown on p. 97 of the 1940 Supplement, appear in table 28, pp. 17 and 18 of the December 1940 Survey; revised data
for all months of 1940 are shown on p. 41 of the June 1941 Survey. 0Data do not include cellulose acetate safety glass sheets. tRevised series. Manufactured and natural gas revised beginning January 1929; earlier data will appear in a subsequent issue. Revised electric-power sales and revenue
from sales beginning 1937 will be shown in a subsequent issue. Data on sales of paint, varnish, lacquer, and fillers cover 680 companies and replace the series for 579companies previously shown in the Snrvey; earlier data will be shown in a subsequent issue.
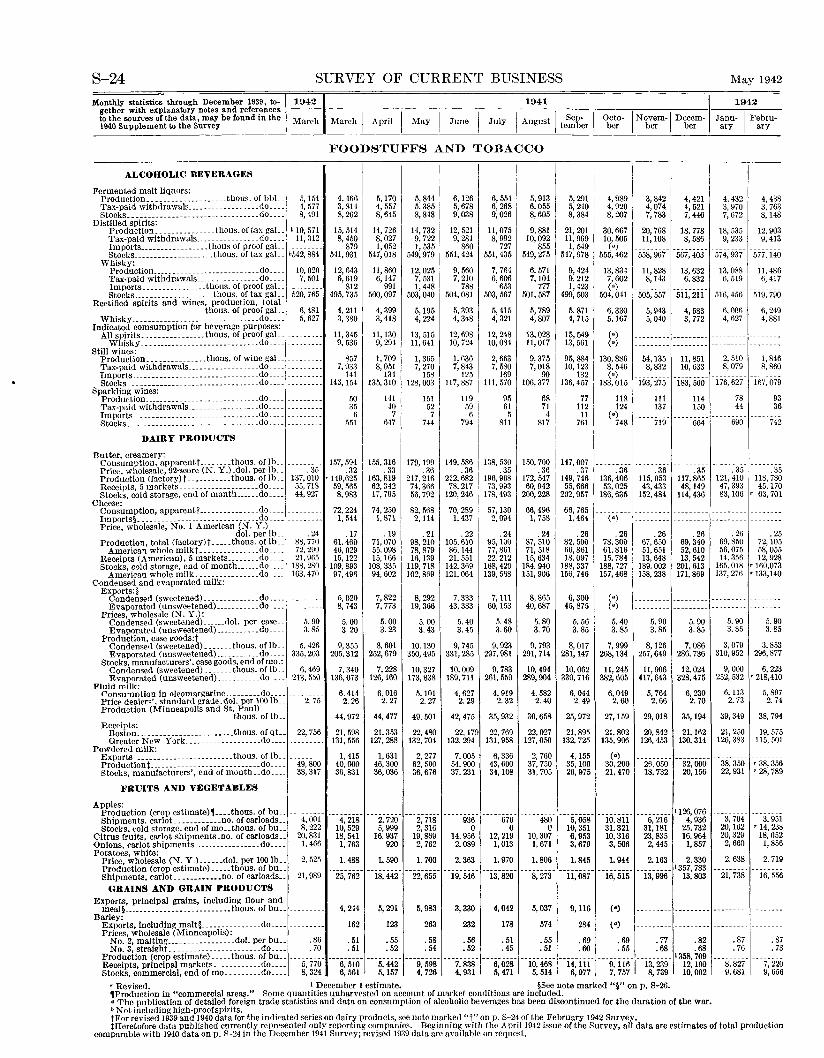
S-24 SURVEY OF CURRENT BUSINESS May 1942
Monthly statistics through December 1939, to-~19421 1941 I 1942 gether with explanatory notes and references ---tothesourcesofthedata,maybefoundinthe March March I April I May I June I July I Au st I Sep- I Octo-~Novem-1 Decem- Janu-1 Febru· 1940 Supplement to the Survey 1 gu tember ber ber ber ary ar·r
~--~----~--~----~--~----~--~--~-----
FOODSTUFFS AND TOBACCO
ALCOHOLIC BEVERAGES I Fermented malt liquors:
Production_.--------------- ... thous. of bbL. Tax-paid withdrawals ____ --------------do ___ _ Stocks ....•.•.... ------------------ .... do ___ .
5,154 4, 577 8, 491
DistiJJed spirits: Production __ . __ .... ______ thous. of tax gaL. • 10, 571 Tax-paid withdrawals ________________ do.... 11,312 Imports _________________ thous of proof gaL_ Stocks ____________________ thous. of tax gaL '542, 884
Whisky: Production ___________________________ do____ 10,020 Tax-paid withdrawals ________________ do____ 7, 501 Imports ________________ thous. of proof gaL_
4,4661 3,814 8, 262
15,514 8,450
879 541,931
5,170 4, 557 8,645
14,726 8,027 1,052
547,018
12, 643 11, 860 6, 619 6,147
812 991
5,844 5.385 8,848
14, 732 9, 722 1, 535
549,979
12, 025 7, 531 1,448
Stocks ____________________ thous. of tax gaL_ 520, 765 495, 735 500, 097 503,040 Rectified spirits and wines, production, total
tho us. of proof gaL_ 6, 481 WhiskY--------------------------------do.... 5, 627
Indicated comsumption for beverage purposes: All spirits ________________ thous. of proof gaL. ________ _
Whisky ___ ---------------------------do ______ ---Still wines:
Production _______________ thons. of wine gaL ____ _ Tax-paid withdrawals __________________ do _______ _
§'f.fc~~ts~::::::::::::: ::::::::::::::::: :~~:::: ----Sparkling wines:
Production _____________________________ do_. __ Tax-paid withdrawals __________________ do ___ _
§Ta~~~t~::::::::::::::::::::::::::::·:::~~:::: :-DAIRY PRODUCTS
Butter, creamery:
4, 211 3, 380
11,345 9, 536
857 7, 933
141 143, 154
50 35
6 551
Consumption, apparentt .. _____ thous. oflh ___ Price, wholesale, 92-score (N. Y.).dol. per lb __
------- 157,594
Production (factorylt ___________ thous. of lb __ Receipts, 5 markets ____________________ do ___ _ Stocks, cold storage, end of month ______ do ___ _
Cheese: Consumption, apparentt ------------ ... do.---Imports§. __________ --------.-- __ . __ -- __ do. __ _ Price, wholesale, No.1 American (N.Y.)
dol. per lb __ Production, total (factory)t _____ thous. oflb __
American whole milkt _______________ do ___ _ Receipts (American), 5 markets ________ do ___ _ Stocks, cold storage, end of month ______ do ___ _
American whole milk ________________ do ___ _ Condensed and evaporated milk:
Exports:§ Condensed (sweetened) ____ .------. __ do .. -. Evaporated (unsweetened) ___________ do ___ _
Prices, wholesale (N.Y.): Condensed (sweetened)_ _____ dol. per case __ Evaporated (unsweetened) _______ -- .. do .. __
.35 . 32 137, 010 ' 149,625 55, 718 59, 565 44, 927 8, 983
. 24 88,770 72,290 21,965
188, 280 163,470
5. 90 3.85
72.224 1, 544
. 17 61.460 46,029 15,122
109,893 97,496
5, 020 8, 743
5. 00 3. 20
4,399 3, 418
11, 130 9, 294
1. 709 8, 051
131 135,310
141 40
7 647
5,195 4, 224
13, 515 11, 641
1, 365 7, 270
158 128,003
151 52
7 744
155,316 179, 199 . 33 . 36
163,8191217,216 62,342 74, 3fi6 17' 795 56, 792
74, 250 82, 568 1, 871 2, 114
. 19 71,070 55,098 15, 166
108,335 94,602
7,822 7, 773
5. 00 3. 23
. 21 98,210 78,879 lfi, 139
119, 718 102,869
8, 292 19,366
5.00 3.43
Production, case ~oods:t Condensed (sweetened) _______ thous. oflb__ 5, 426 9, 355 8, 601 10, 130 Evaporated (unsweetened) ___________ do ____ 335,203
Stocks, manufacturers', case goods, end of mo.: Condensed (sweetened) _____ .. thous. oflb__ 6, 469 Evaporated (unsweetened) ___________ do ____ 213,550
Fluid milk: Consumption in oleomargarine ......... do ____ _ Price dealers'. standard grade.dol. per 100 lb__ 2. 75 Production (Minneapolis and St. Paul)
thous. of lb .. _ Receipts:
Boston _________________________ thous. of qt.. 22,756 Greater New York ___________________ do ....
Powdered milk:
~:gg~~~ia11C:::::::::::::::::::~~~-~sJ~~~:: --49;8oo Stocks, manufacturers', end of month .. do____ 38,317
FRUITS AND VEGETABLES
205, 312 252, 679
7,340 136,073
6.414 2.26
44.972
21,598 131, 556
1, 415 40,000 36, 831
7,228 126,160
6, 016 2. 27
44,477
21.353 127,288
1,631 46,300 36,036
350,495
10, 327 173,838
5, 101 2. 27
49.501
22,480 132, 704
2, 277 62,500 36,676
6,126 5,678 9,038
12,521 9, 281
860 551,424
9, 560 7, 210
788 504,081
5,393 4,348
12,698 10, 724
1, (\36 7, 843
125 117,887
119 59
79~ 1
149,586 .36
212,682 78,217
120,246
70,289
1,~:: I 105, 610 86,144 21.551
142. 3fl9 121,064
7, 333 43,383
5. 40 3. 45
9, 745 331,285
10.009 189,711
4,627 2. 29
42,475
22,179 132, 294
7,005 54,900 37,231
6, 554 6, 268 9,026
11,075 8, 992
727 551, 435
7, 764 6, 606
653 503, 567
5,415 4, 321
12, 248 10,084
2,663 7, 580
169 111, 570
95 61 5
811
138, 530 . 35
196,968 73,993
178,493
57, 130 2, 094
. 24 95, 100 77,861 22,212
168,420 139,568
7, 111 60,153
5. 48 3.60
9, 923 297,981
9, 783 261,559
4, 919 2. 32
35,932
22,769 131,958
6,336 43,600 34, 108
5, 913 6,055 8,605
9,881 10,092
855 549,275
6. 571 7,104
777 501,587
5, 789 4, 807
13,028 11,017
9,375 7,018
90 106,377
68 71
4 817
150,700 .36
172,547 60,942
200,228
66,496 1, 758
. 24 87, 510 71,518 15,634
184,940 151,906
8,865 40,687
5.80 3. 70
9, 793 291,714
10,494 289,904
4, 582 2.40
30,658
22,027 127,050
2, 760 37,750 31,705
5, 291 5, 240 8,384
21,201 11,969
1, 549 547,678
9,424 9,212 1, 423
499,503
5. 871 4, 715
15,549 13, 561
95,884 10,123
132 136,457
77 112
11 761
147,007 . 37
149,746 55,666
202,957
66,765 1, 464
. 26 82, 500 66,861 18,097
188,337 156, 746
6,300 45,875
5. 56 3. 85
8, 017 281, 147
10,062 339,716
6, 044 2. 49
25,972
21,895 132, 725
4,155 35, 100 26,975
4, 989 4, 920 8,207
30.667 10,505
(•) 555,462
13,834 7, 602 (•)
504,041
6,330 5,167
(•) (•)
130,886 8. 546 (•)
183,015
118 124
(•) 748
.36 136, 406 53,025
186,635
(•)
. 26 78,300 61,816 15, 784
188,727 157,468
I 3,842 4,074 7, 783
20,768 11,108
4,421 4,521 7,446
18.778 8,586
4,432 3, 970 7, 672
18,535 9, 233
4, 438 3, 763 8,148
12, 903 9, 413
558,967 567,403 574,937 577, 140
11, 828 13, 632 13, 088 11, 486 8, 143 6, 832 6, 519 6, 417
------------------ ------------505, 557 511,211 516,456 519, 790
5,943 5,040
4, 583 3, 772
54, 135 11, 851 8, 832 10, 633
6,006 4, 627
2, 510 8, 079
6, 249 4, 881
1,846 8, 860
193,275 183,560 176,627 167.079
111 114 78 93 137 150 44 36
719
.36 115, 053 43,433
152,484
.26 67,650 51,651 13,648
189,002 158,238
664
. 35 117,865 48, 149
114,436
. 26 69,340 52,610 13,542
201,613 171,869
690 742
. 35 . 35 121, 410 118, 780 47,393 45,170 83, 106 ' 63, 701
. 26 69,850 56,075 14,356
165,018 137, 276
. 25 72,105 58,055 12,928
'160,073 '133,140
~~ ~00 ~00 ~00 ~00 ~% ~% ~% ~% ~%
7, 999 8, 126 7, 086 3, 079 3, 853 268, 134 257, 649 286, 736 310, 952 296, 877
11, 245 11, 906 12, 024 9, 000 6, 223 382, 605 417,643 328,475 252, 532 ' 218,410
6, 049 5, 764 6, 230 6, 113 5, 897 260 260 2m 273 2M
27, 159 29, 018 35, 194 39, 349 38, 794
21, 802 20,842 21, 162 21, 250 19, 575 135,906 126, 453 130,314 126, 383 115, 501
3~~ko ··2ii:o.so· -·s2:ooo- --33;3.so· ,38,356 21, 470 18, 732 20, 156 22,931 ' 28, 789
Apples: Production (crop estimate), ____ thous. of bu .. --------- --------- --------- ___ ------ --------- --------- --------- --------- --------- --------- 1126,076 Shipments.carlot_ ___________ no.ofcarloads .. 4,001 4,218 2,720 2,718 936 676 480 5,058 10,811 6,216 4,936 3, 704 3, 951 Stocks. cold storage, end of mo .. thous. of bu__ 8, 222 10,529 5, 999 2, 316 0 0 0 10,351 31,321 31, 181 25.732
Citrus fruits, carlot shipments.no. of carloads.. 20,831 18,541 16,937 19,869 14,956 12,219 10,307 6, 953 10,316 23,835 16,964 Onions, carlot shipments _________________ do.... 1, 466 1, 763 920 2. 762 2, 089 1, 013 1, 671 3, 679 3, 506 2, 445 1, 857 Potatoes, white:
Price, wholesale (N. Y.) .....• dol. per 100 lb .. Production (crop estimate) ...•• thous. of bu .. Shipments, carlot ____________ no. of carloads ••
GRAINS AND GRAIN PRODUCTS
2.525
21,989
Exports, principal grains, including flour and meal§ ___________________________ thous. of bu .. ---
Barley: Exports, including malt§ _______________ do .... _
1.• 1.• 1.~ 2• 1.m 1.0 1.00 1.~ 2~ 2~ -------- --------- --------- --------- --------- --------- --------- --------- --------- 1357,783 ~m ~~ ~w ~~ ~~ ~m ~~ ~m ~- ~~
4, 244 5, 291 5, 983 3, 330 4,042 5,037 9,116 (•)
162 123 263 232 178 574 284 Prices, wholesale (Minneapolis):
No.2, malting _________________ dol. per bu.. .86 .51 .55 .58 .56 .51 .55 .69 .69 .77 .82 No.3,straight _______________________ do ____ .70 .51 .52 .54 .52 .45 .51 .60 .55 .68 .68
Production (cropestimate) _____ thous. of bu .. --------------------------------------------------------------------------------- ---------'358,709 Receipts,principslmarkets ____________ do____ 5,770 6,510 5,442 9,598 7,838 6,028 10,468 14,111 9,116 13,239 12,190 Stocks,commercial,endofmo ......... do.... 8,324 6,561 5,157 4,726 4,931 5,471 5,514 6,977 7,757 8,739 10,002
'Revised. 'December 1 estimate. §See note marked"§" on p. S-26. ,Production in "commercial areas." Some quantities unharvested on account of market conditions are included. • The publication of detailed foreign trade statistics and data on consumption of alcoholic beverages hss been discontinued for the duration of the war. • Not including high-proofspirits. tFor revised 1939and 1940 data for the indicated series on dairy products, see note marked "t" on p. S-24 of the February 1942 Survey.
20, 162 ' 14, 238 20, 329 18, 052
2, 660 1, 856
2. 638 2. 719
21, 738 16, 556
.87
. 76
8,827 9,681
.87
.73
7, 220 9, 656
tHeretofore data published currently represented only reporting companies. Beginning with the Apri!1942 issue of the Survey, all data are estimates of total production comparable with 1940 data on p. S-24 in the December 1941 Survey; revised 1939 data are available on request.
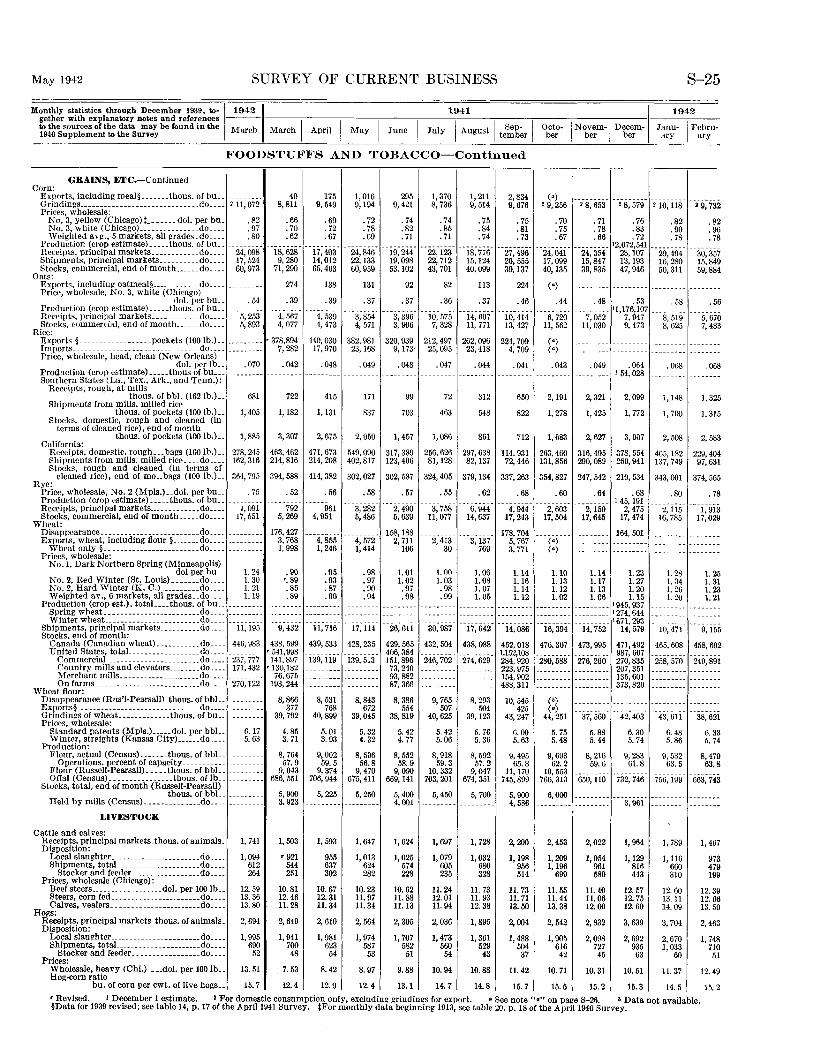
May 1942 SURVEY OF CURRENT BUSINESS S-25
Monthly statistics through December 1939, to-~19421 1941 I 1942 gether with explanatory notes and references --- -----,-------,,--------,----,--------,------,-----,----,-------,-------~--tothesourcesofthedata maybefoundinthe March March I April I May I June I July I August I teSmepb-er I Octo· INobveerm-1 Debceerm- Janu- I Febru-1940 Supplement to the Survey ber ary ary
FOODSTUFFS AND TOBACCO-Continued
Corn: GRAINS, ETC.-Continued
Exports, including meal§ _______ thous. of bu .. ________ _ 40 8,811
175 9, 549
1, 016 9,194
295 9,421
1,370 8, 736
1, 211 9,514
2,834 9,676 Grinding•------------------------------do .... 2 11,072
Prices, wholesale: No.3,yellow(Chicago)t _______ dol.perbn .. 82 .66 .69 .72 .74 .74 .75 .75 .70 .71 .76 .82 .82 No.3, white (Chicago) _______________ do.... .97 .70 .72 .78 .82 .85 .84 .81 .75 .78 .83 .90 .96 Weightedavg.,5markets,allgrades.do ..... 80 .62 .67 .69 .71 .71 .74 .73 .67 .66 .72 .78 .78
Production (crop estimate) ..... thous. of bu .. ____________________________________ --------- --------- --------- --------- __________________ '2,672,541 -·--·---- _______ _ Receipts, principal markets. ___________ do.... 24,098 18,628 17,403 24,846 19,244 22,123 18,776 27,496 24,041 24,354 28,107 29,494 30,357 Shipments, principal markets ________ .. do.... 17, 524 9, 280 14,012 22, 133 19,098 22, 712 15, 124 20, 555 17,099 15,847 13, 193 16,280 15,849 Stocks, commercial, end of month ...... do.... 60,973 71, 290 65,463 60,959 53. 102 43,701 40,099 39, 137 40, 135 39, 835 47, 946 50, 311 59,884
Oats: Exports, including oatmeal§ ____________ do .... ________ _ 274 138 131 92 82 113 224 Price, wholesale, No.3, white (Chicago)
dol. per bu.. . 54 . 39 . 39 . 37 . 37 . 36 . 37 . 46 . 44 . 48 . 53 . 58 . 56 Production (crop cstimate) ..... thous. of bu .. _________________________________________________________________________________________ '1,176,107 ________________ _ Receipts, principal markets .. __________ do .. __ 5, 253 4, 567 4, 539 3, 854 3, 396 10, 575 14, 607 10,414 6, 720 7, 052 7, 947 8, 519 5, 670 Stocks, commercial, end of month .... __ do.... 5, 893 4, 077 4, 473 4, 571 3, 906 7, 328 11, 771 13, 427 11, 562 11, 030 9, 473 8, 625 7, 483
Rice: Exports § __________________ pockets (100 lb.) ___________ '378,894 440, 030 382,981 320,939
9, 173•' 212.497 262,096 224,709
4, 709 (•) (•) Imports ______________________________ do .... --------- 7,282 17,970 23,168
Price, wholesale, head, clean (New Orleans) 25, 095 23, 418
dol. per lb .. Production (crop estimate) ..... thous of bu ... _ Southern States (I,a., Tex., Ark., and Tenn.):
Receipts, rough, at mills thous. of bbl. (162 lb.) __
Shipments from mills. milled rice thous. of pockets (100 lb.) __
Stocks, domestic, rough and cleaned (in terms of cleaned rice), end of month
thous. of pockets (100 lb.) __ California:
.070
681
1,405
1,885
.042 .048
722 415
1, 182 1, 131
3, 307 2,675
.049
171
837
2,050
.048
99
703
.047
72
463
.044
312
548
. 041
650
822
.043
2,191
1, 278
1,683
.049
2,321
1,425
2, 627
. 064 I 54,028
2,099
1, 772
3, 007
Receipts, domestic. rough ___ bags (100 lb.) __ 278,245 463,462 471,673 549,090 Shipments from mills. milled rice .... do.... 162,316 214,816 214,208 402,817 Stocks, rough and cleaned (in terms of
1, 457
317,389 123,406
1,086
256,626 81, 128
861
297,638 82, 137
712
114,931 72,446
263. 460 316, 495 378, 554 131; 856 290, 089 260, 941
cleaned rice), end of mo .. bags (100 lb.) __ 364,795 394,588 414,382 302,027 302,587 324, 405 379, 134 337,263
.68
354,827 247, 542 210, 534 Rye:
Price, wholesale, No.2 (Mpls.) .. dol. per bu.. . 75 Production (crop estimate) ..... thous. of bu .. ________ _ Receipts, principal markets__ ___________ do.... 1, 091 Stocks, commercial, end of month ..... do.... 17,551
Wheat: Disappearance. _______________________ ,do _____ ------·-Exports, wheat, including flour§ ______ do .... _______ __
Wheat only § ________________________ do .... ________ _ Prices, wholesale:
No.1, Dark Northern Spring (Minneapolis) dol per bu.. 1. 24
No.2, Red Winter (St. Louis) _______ do.... 1. 30 No.2, Hard Winter (K. C.) __________ do.... 1. 21 Weighted av., 6 markets, all grades __ do____ 1.19
Production (crop est.). totaL ... thous. of bu .. ________ _
~f~~:r ~J{e",;t_~ ~:::::::::::::::::::::~g:::: ::::::::: Shipments, principal markets __________ do.... 11,195 Stocks. end of month:
. 52
792 5, 269
176,427 3, 768 1, 998
.90 •.89 .85 .89
9,432
Canada (Canadian wheat) ___________ do ____ 446,983 438,599 United States, totaL ________________ do.... _ '541,998
Commercial _______________________ do .... 237,777 141,897 Country mills and elevators ________ do.... 171,432 • 130,182 Merchant mills ____________________ do____ __ _ __ __ _ _ 76, 675 On farms __________________________ .do.... 270,122 193,244
Wheat flour: Disappearance (Rus'l-Pearsall).thous. of bbL. ________ _ Exports§ _______________________________ do ... _________ _ Grindings of wheat. ____________ thous. of bu __ Prices, wholesale:
Standard patents (Mpls.) _____ dol. per bbL Winter, stroights (Kansas City) ______ do ....
Production:
6.17 5. 63
Flour, actual (Census) ....... thous. of bbL. _______ _ Operations. percent of capacity __________________ __
Flour (Russeli-Pearsall) ..... thous. of bbL ________ _ Offal (Census) ________________ thous. oflb __________ _
Stocks, total, end of month (Russell-Pearsall)
8, 866 377
39,792
4. 85 3. 71
8, 764 57.9
9,043 686, 551
thous. of bbL _________ 5, 900
. 56
961 4, 951
4,855 1,246
.58
3, 282 5,486
4, 572 1,414
. 57
2, 490 5, 639
158, 188 2, 711
106
. 55
3, 758 11,077
2,413 30
.62
6, 944 14,637
3,137 769
4, 944 17,243
178,704 5, 767 3, 771
.60
2,603 17,504
.64
2,150 17,645
.68 145,191
2, 475 17,474
164, 501
. 95 . 98 1. 01 1. 00 1. 06 1. 14 1. 10 1. 14 1. 23
.93 .97 1.02 1.03 1.08 1.16 1.13 1.17 1.27
.87 .90 .97 .98 1.07 1.14 1.12 1.13 1.20
. 90 . 94 . 98 . 99 1. 05 1. 12 1. 02 1. 06 1. 15 --------- --------- --------- --------- --------- --------- --------- ---------1945,937 --------- --------- --------- --------- --------- --------- '274, 644
---------- --------- --------- --------- --------- - '671,293 11,716 17, 114 26,611 30,987 17,642 14,086 16,394 14,752 14,579
439,533
139,119
8, 531 768
40,899
5.01 3. 93
9,002 59.5
9, 374 706,944
5, 225
428,235
139,513
8,843 672
39,045
5.32 4.32
8, 596 56.8
9,470 675,411
5,250
429,565 406,384 151,896 73,240 93,882 87,366
8, 386 554
38,819
5. 42 4. 77
8,552 58.9
9,090 669, 141
432, 504 438, 088 -- . ------ ~ --
246,702
9, 765 507
40,625
5.42 5.06
8, 918 59.3
10,332 703,201
5, 450
274,629
8, 293 504
39, 123
5. 76 5. 36
8, 592 57.2
9,047 674,351
5, 700
452,018 1,152,108 284,920 223,975 154,902 488,311
10, 545 425
43,247
6.00 5. 63
9,495 65.8
11, 170 745,899
476.307 473,995
280, 588 276, 260
(') (•)
44,251
5. 75 5.48
9,693 62.2
10,553 766,313
6,000
37,560
5. 88 5.44
8, 216 59.6
650,110
471,492 987, 607 270,835 207,351 135,601 373,820
42.403
6. 30 5. 74
9,283 61.8
732,746
.068
1, 148
1, 700
2,508
. 068
1, 325
1. 315
2, 583
465, 182 229, 404 137, 749 97,631
343,001
.80
2,115 16, 785
1. 28 1. 34 1. 26 1.20
10,471
465,608
258,570
43, 611
6. 48 5.86
9,532 63.5
756, 199
374,565
. 78
I, 913 17,029
1. 25 1. 31 1. 23 1. 21
9, 155
458,692
249,891
38,621
6. 33 5. 74
8,479 63.8
663,743
Held by mills (Census) ______________ do.... 3.923 --------- _______ __ 5,400 4,001
5, 900 4, 586 3, 961 --------- -------·
LIVESTOCK
Cattle and calves: Receipts, principal markets_thous. of animals. Disposition:
Local slaughter .. -------- _____________ do .. .. Shipments, totaL ___ . ________________ do .. ..
Stocker and feeder __________________ do .. .. Prices, wholesale (Chicago):
Beef steers __________________ dol. per 100 lb .. Steers, corn fed _______________________ do .. .. Calves, vealers. _. ____________________ do .. ..
Hogs: Receipts, principal markets thous. of animals. Disposition:
Local slau~hter _______________________ do .... Shipments, totaL .. __________________ do .. __
Stocker and feeder _________________ do .... Prices:
Wholesale, heavy (Chi.) •.. dol. per 100 lb .. Hog-corn ratio
bu. of corn per cwt. of live hogs __
1, 741
1,094 612 264
12.59 13.36 13.80
2,694
1, 995 690
52
13.51
15.7
1,503
'921 544 251
10.81 12.46 11.28
2, 649
1, 941 700 48
7. 53
12.4
1, 593
955 637 302
10.67 12.31 11.34
2, 610
1,981 623 54
8.42
12.9
1. 647
1, 013 624 282
10.23 11.97 11.34
2,564
1, 974 587
53
8. 97
12.4
1, 624
1,025 574 228
10.62 11.88 11.13
2, 305
1, 707 582 51
9.88
13.1
1, 697
1,079 605 235
11.24 12.01 11.94
2,036
1,473 560 54
10.94
14.7
1, 728
1,032 680 328
11.73 11.93 12.38
1,895
1, 361 529 43
10.88
14.8
2,200
1,198 956 514
11.73 11.71 13.50
2,004
1,488 504 37
11.42
15.7
2, 453
1,209 1,196
699
11.55 11.44 13.38
2,542
1, 905 616 42
10.71
15.5
2,022
1,054 961 580
11.40 11.06 12.00
2,832
2,098 727 45
10.31
15.2
l, 964
1,129 816 443
12.57 12.75 12.60
3, 639
2,692 935 63
10.51
15.3
1, 789
1,116 660 310
12.60 13. 11 14.09
3, 704
2,670 1, 033
60
11.37
14.5
• Revised. ' December 1 estimate. ' For domestic consumption only, excluding grindings for export. • See note "•" on page S-26. • Data not available. §Data for 1939 revised; see table 14, p. 17 of the April1941 Survey. tFor monthly data beginning 1913, see table 20, p. 18 of the April1940 Survey.
1, 467
973 479 199
12.39 12.66 13.50
2,463
1, 748 710 51
12.49
15.2
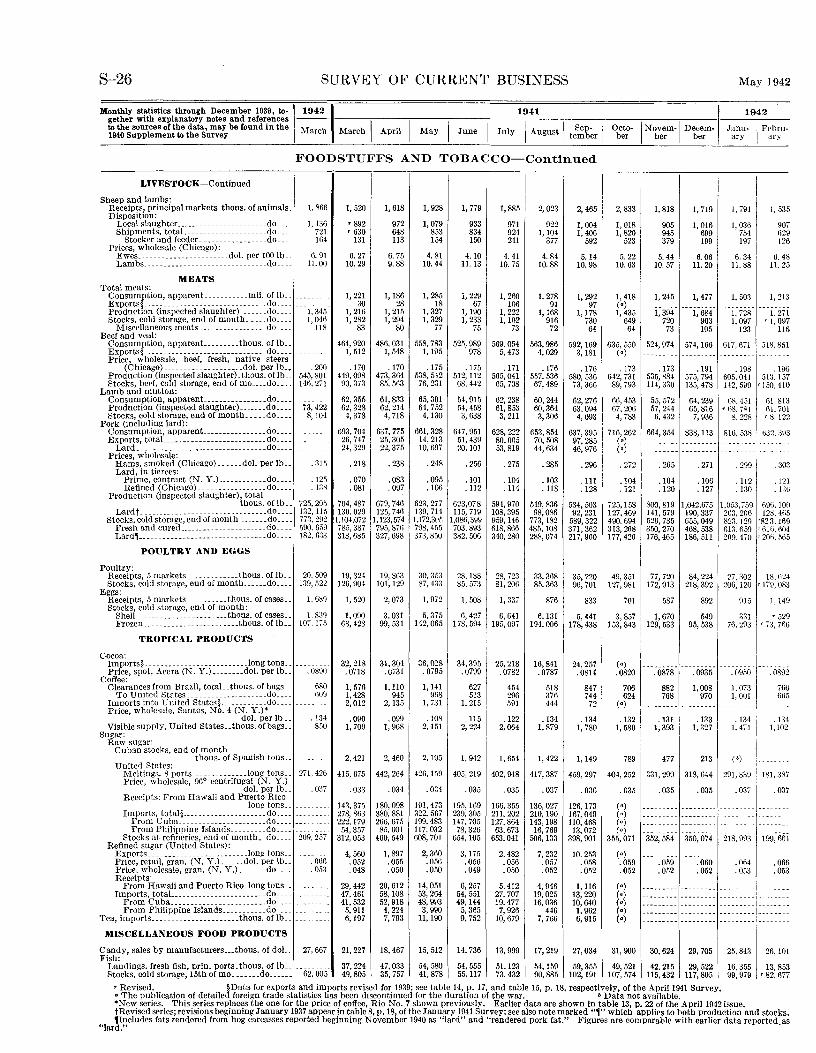
S-26 SURVEY OF CURRENT BUSINESS May 1942
Monthly statistics through December 1939, to-~19421 1941 I 1942 gether with explanatory notes and references --- ---,------,-----;----;------;----;---,-----,-------,--- ---..,----tothesourcesofthedata,maybefoundinthe March March I April I May I June I July I A t I Sep- I Octo- INovem-1 Decem- Janu- I Frhru-1940 Supplement to the Survey ugus tember ber ber ber ary ary
FOODSTUFFS AND TOBACCO-Continued
LIVESTOCK-Continued I I Sheep and lambs:
Receipts, principal markets.thous. of animals. 1. 866 1, 520 I, 6!8 I, 928 I, 7i9 1,885 2, 023 2, 465 2, 833 I, 818 Disposition:
Local slaughter _________ .............. do ... _ 1, 136 '892 972 I, 079 933 971 922 1,004 1.018 905 Shipments, totaL ....... _ ..... _ ... _ .. do ... _ 721 '630 648 853 834 924 I, 104 I, 406 1;820 945
Stocker and feeder ................. do ____ !G4 131 113 !54 !50 241 37i 592 523 379 Prices, wholesale (Chicago):
Ewes ....................... dol. per 100 lb .. 6. 91 6. 27 6. 75 4. 81 4.10 4. 41 4. 84 5.14 5. 22 5. 44 Lambs .. --------- ......... _._._._._ .. do .. _. 11.00 10. 29 9. 88 10.44 11. 13 10.75 10.88 10.98 10.63 10.57
MEATS Total meats:
Consumption, apparent ........... mil. of lb .. ------ 1, 221 1, 186 I, 285 1, 229 1, 260 1, 278 I, 292 1.418 1, 245 Exports§ __ .... _______ .. ____________ ... do ... _
--0 30 28 18 67 106 91 97 (•) ---- --Production (inspected slaughter) _______ do .... 1, 345 1, 216 1, 215 1. 327 1, 190 1, 222 1,168 1,178 1, 435 I, 394 Stocks, cold storage, end of month ..... do .... 1,04ti 1, 282 1, 294 1, 329 1, 233 1,102 916 730 649 720
Miscellaneous meats. __________ ...... do .... 118 83 80 77 75 73 72 64 64 73 Beef and veal:
Consumption, apparcnt. ........ thous. of lb .. ---- 464,920 486,031 558,783 525,989 569. OM 563,986 592, 169 635,550 524,974 Exports§ ----------------------------- do ____ ---- --- 1, 512 1,548 1, 195 978 5, 473 4,029 3,181 (•) ---------Price, wholesale, beef, fresh, native steers
(Chicago) ____________________ dol. per lb __ -200 .170 .170 0 175 0 175 .171 0 176 .176 . 173 .173 Production (inspected slaughter)_ thous. ollb __ 545,801 449,098 473,364 538, 542 512, 112 565,0ll 557. 536 580,536 6!2, 731 535,884 Stocks, beef, cold storage, end of mo .... do. _. _ 146,271 90,373 85.563 76,231 68. 442 65, 708 67,489 73, 366 89,793 114, 330
Lamb and mutton: Consumption, apparent .... ____ . ______ .do._._ 62,355 61,833 65,301 54,915 62,238 60,244 62,276 66,453 55,572 Production (inspected slaughter) _______ do ____ 73,422 62,328 62,214 64,752 54, 458 61, 853 60,364 63,094 67,206 57, 244 Stocks, cold storage, end of month _____ do ____ 8,104 4, 378 4, 718 4,130 3, 638 3, 211 3,306 4,093 4, 783 6, 432
Pork (including lard): Consumption, apparent ____________ . ___ do ____ ---- --- 693,704 637,775 661,328 647, 951 628,222 653, 854 637,395 716,262 664,354
E~aor~~·- ~~~~~------------~--~::::::::::: ::::::~~:::~ . --- 26,747 25.305 14,213 51,439 80,005 70,508 97,285 (•) ----------- -- 24,329 22,375 10,697 20,101 53,819 44,634 46,976 (') ---------Prices, wholesale:
Hams, smoked (Chicago) ______ dol. per lb .. 0 315 .218 0 238 0 248 0 256 0 275 .285 0 296 0 272 0 265 Lard, in tierces:
Prime, contract (N. Y.) ____________ do ____ .125 .070 .083 .095 .101 .104 0103 .Ill .104 ,104 Refined (Chicago) .. _____ . _______ .. do __ .. 0 138 .081 0 097 0 106 .112 - 114 .118 .128 . 121 .120
Production (inspected slaughter), total thous. oflb __ 725,295 704,487 679,746 623,277 623,078 594, 970 549,836 534,503 725, !58 800,819 Lard t .. _____________ .... _ .. __________ do. ___ 132, 115 130.029 125,746 139,714 115, 719 108, 395 98,086 92, 231 127,469 141, 579
Stocks, cold storage, end of month _______ do ____ 773. 292 1.104,072 1.123,574 1,172,305 1,086,399 959,146 773, 182 589,322 490.694 526,735 Fresh and cured ______________________ do ____ 5\10. ()59 785, 387 795,876 798,455 703,893 618,866 485,108 371' 3621313, 268 350,270 Lard, _____ . ____________________ .. ____ do ____ !82, 6:!3 318,685 327,698 373,850 382, 506 340,280 288,074 217, 960 177, 426 176,465
POULTRY AND EGGS , I Poultry:
Receipts, 5 markets .. _________ .. thous. of lb .. 20, 509 19,324 19,863 30, 353 28,188 28,723 33, 368 35,220 49, 351 77, 720 Stocks, cold storage, end of month ______ do ____ 139, 522 126,904 101, 129 87, 433 85, 573 81, 20() 85,363 96,701 127, 981 172,913
Eggs: Receipts, 5 markets __________ thous. of cases .. 1. 689 1, 520 2, 073 1, 972 1, 508 I, 337 876 833 701 587 Stocks, cold storage, end of month:
3, 857 1 1, 67o Shell ___________________ . ___ thous. of cases._ 1. 839 I, 090 3. 031 5,375 6, 427 6, 641 6, 131 5, 441 Frozen ____________________ . ___ thous. of lb __ 107. 175 63,428 99, 531 142,065 178,594 195,097 194,006 178,438 !53, 843 1 129, 533 I
TROPICAL PRODUCTS ~
Cocoa: i Imports§._ ... ____________ . ___ .... _long tons._ 32,218 31,304 36,028 34,395 25,218 16,841 24,257 (•) ---------Price, spot, Accra (N. Y.) ________ dol. per lb .. .08UO .0718 .0731 0 0795 .0799 .0782 .0787 .0814 .0820 .0878
Coffee: Clearances from Brazil, totaL .thous. of bags __ 680 1, 576 I, 110 I, 141 627 454 518 847 706 882
To United States ___________________ do ____ 609 1,428 945 968 513 296 376 744 624 768 Imports into United States§ ____________ do ____ ----- 2,012 2,135 1, 731
1: ::~ I 591 444 72 (•) ---------Price, wholesale, Santos, No.4 (N.Y.)*
dol. per lb __ . 134 .090 .099 .108 .122 .134 .134 I -1321 .131 Visible supply, United States .. thous. of bags .. 850 1, 709 I, 968 2,151 2, 224 2,064 1,879 1, 780 I 1, 580 1,393
Sugar: I Raw sugar:
Cuban stocks, end of month thous. of Spanish tons .. ----- -- 2, 421 2, 460 2.195 I, 942 I, 654 1, 422 1, 149 789 477
United States: Meltings, 8 ports _____________ long tons __ 271.426 415, 675 442,264 426, !59 405, 219 402,948 417,387 459,297 404,252 331,299 Price, wholesale, 96° centrifugal (N. Y.)
dol. per lb .. . o:l7 .033 .034 0 034 0 035 .035 .037 0 036 . 035 .035 Receipts: From Hawaii and Puerto Rico
long tons ___ ---- 143, 375 180,098 191,473 195,169 166, 355 136,027 126, 173 (•) ---------Imports, total§ ____ . ____ .. __________ do .... --- ---- 278, 863 380, 881 322, 567 239, 305 211, 202 210, 190 167,040 (•) ---------From Cuba .. ___________________ .do .... -- 222, 179 266,675 199,483 147. 705 127,864 143, 198 110,468 (•) ---------From Philippine Islands _________ do ____ 54,357 85, 001 117, 032 78,326 63,673 16,769 13,072 (•) ---------Stocks at refineries, end of month_ do __ .. 209, 257 312,053 460,549 608,701 654, 105 653,041 506, 133 398,901 355, 071 352, 584
Refined sugar (United States): Exports. ________________________ long tons .. ---- 4, 560 I, 897 2,360 3, 17fi 2, 482 7, 232 10, 253 (•) ---------Pncc, retail, gran. (N. Y.) ______ dol. per lb •. . Otl6 .052 .055 0 056 .056 .056 .057 .058 0 059 .059 Price. wholesale, gran. (N. Y.) _______ do ____ 0 053 .048 .050 .050 .049 .050 .052 .052 .052 .052 Receipts:
From Hawaii and Puerto Rico.long tons .. 29,442 20,612 14,051 6,257 5, 412 4, 946 I, 116 (•) ---------Im/r~i~'\~~t~::::::::::::::::::::::::~~:::: --------- 47,461 58,108 53,264 54,551 27,707 19,025 13,220 (•) ---------
41, 532 52, 918 48,993 49,144 19,477 16,036 10,640 (•) ---------From Philippine Islands ___________ do .... ---- ---- 5, 911 4, 224 3, 990 5,365 7, 926 446 I, 962 (•) ---------Tea, imports ______________________ thous. of lb .. 6,197 7, 793 11, 190 9. 752 10, 679 7, 766 6, 915 (•) ---------MISCELLANEOUS FOOD PRODUCTS
Candy, sales by manufacturers ___ thous. of doL_ 27,667 21, 227 18,467 15,512 Fish:
14,736 13,999 17,219 27,034 31,900 30,624
Landings, fresh fish, prin. ports.thous. oflb .. --- 37,224 47, 033 54,580 54,555 51,123 54, !59 59,355 49,521 42,215 Stocks, cold storage, 15th of roo _______ do ______ 62,005 49,805 35,757 41,878 55, 117 73,432 90,885 102,191 107,574 115,432
I, 719
I, 016 699 199
6. 06 11. 20
1, 47i ---------
1, 684 903 105
574, 166 ---------
.191 575,794 135,478
64,239 65,816
7, 936
838, 113 ------------------
- 271
.106
.127
1,042,675 190,337 655,049 468,538 186,511
84,224 218,392
892
549 95, 538
---------0 0935
I, 008 970
---------.133
1, 327
213
318, 644
.035
------------------------------------350,074
I 1, 791 1, 535
1, 036 907 754 629 197 126
6. 34 6. 48 11.88 11.25
1, 503 1, 213 --- ----- ---
1, 728 1. 271 1. 097 'I. 097
123 116
617,671 518.851 -------- -------
.198 -196 605,041 5t:l, 157 142,599 '150, 410
6S, 4.)J 61.813 'f 63,781 61.701
8, 228 's: 12 2
816, 538 tl:32. :l9 ----
1--- ---. 299 -30
.112 .121
.130 0 13('
1,053,759 696,10 203, 206 128, 4nc ) 823, 129 •823.16 9
4 613.6591•611).60 209,470 r2Qfl,5()•
I
i
27, 302 206, 120
915
331 76.293
----.0950
1, 073 1,001
18,()2 '179. 083
1. 14
r 52 9 r /:), 766
---- ----0 0892
76 66
6 5
-- ----- ---:
0 134 0 134 1. 471 1,102
(b) --------
291, 839 181,387
.037 0 03
--- --- --- -------- ---- ----------- -------- --------218,993 199,66
--------- - ----- ------.060 0 052
---------------------------------------------
29, 705
29,522 117,805
.064 0 053
0 06 0 05
6 3
---- ------ -------------- -- ------------ ----------------- ----------------- --------
25, 843 26,10
16, 355 13,85 99, 979 '82,671
'Revised. §Data for exports and imports revised for 1939; see table 14, p, 17, and table 15, p. 18, respectively, of the April1941 Survey, a The publication of detailed foreign trade statistics has been discontinued for the duration of the war. 'Data not available. •New series. This series replaces the one for the price of coffee, Rio No.7 shown previously. Earlier data are shown in table 13, p. 22 of the April1942 issue, tRevised series; revisions beginning January 1937 appear in table 8, p. 18, of the January 1941 Survey; see also note marked .. ,, which applies to both production and stocks. ,Includes fats rendered from hog carcasses reported beginning November 1940 as "lard" and "rendered pork fat." Figures are comparable with earlier data reported: as
"lard."
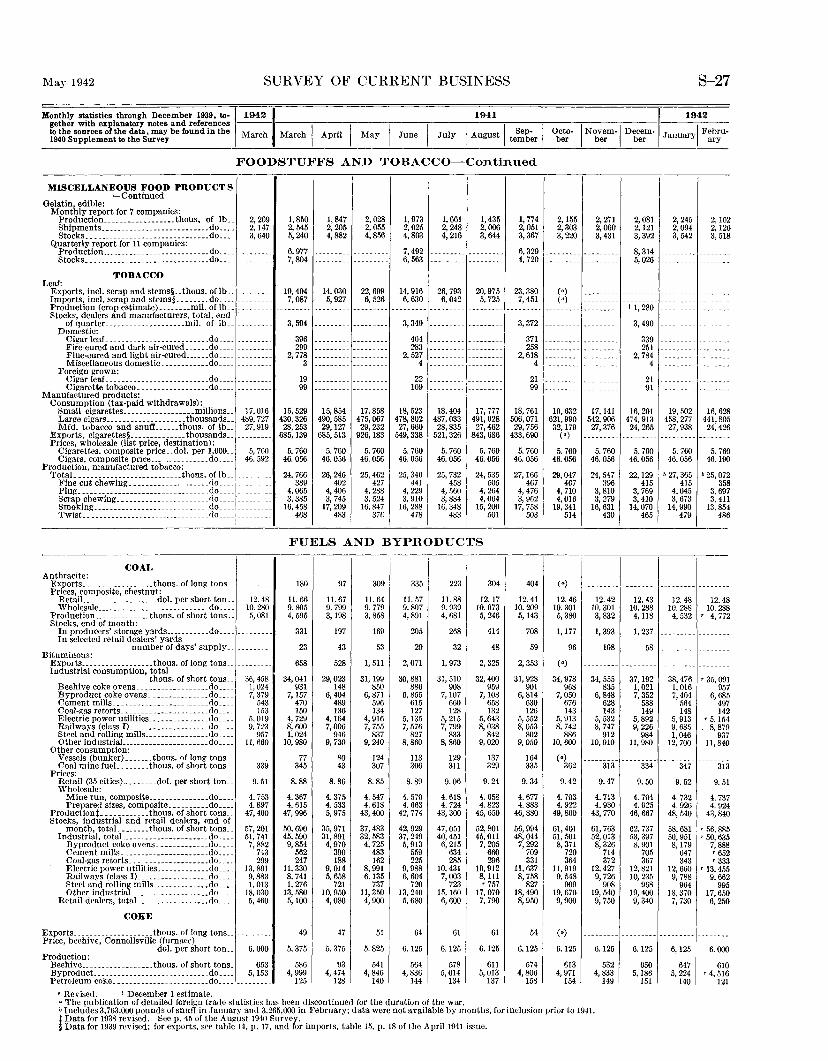
May 1942 SURVEY OF CURRENT BUSINESS S-27
Monthly statistics through December 1939, to-~19421 1941 I 1942 gether with explanatory notes and references ---,----,----,,-----,---.,----;----.----.-----,----,---to the sources of the data, may be found in the March March I April I May I June I July I August I Sep- I Octo- I Novem-1 Decem- January/ Febru-1940 Supplement to the Survey tember ber ber ber ary
FOODSTUFFS AND TOBACCO-Continued
MISCELLANEOUS FOOD PRODUCTS -Continued
Gelatin, edible: Monthly report for 7 companies:
Production __________________ thous, of lb __
~r~~~=~~~~:::: :::: :::::::::::::=====~~:=~-Quarterly report for 11 compani~s:
Production _________________________ ·-do. __ _ Stocks __ ---------------·---------- .•. do __ _
TOBACCO Leaf:
Exports, incl. scrap and stems§_. thous. of lb_. Imports, incl. scrap and stems§ ________ do ___ _ Production (crop estimate) ________ mil. of lb __ 8tocks, dealers and manufacturers, total, end ·
of quarter ____________________ mil. of lb __ _ Domestic:
2, 269 2,147 3,640
Cigar leaf_ ------------------------··do .... _______ __ Fire-cured and dark air-cured ______ do ___ _ Flue-0ured and light air-cured ______ do ____ _ Miscellaneous domestic ............ do ____ _
Foreign grown: Cigar leaf. ... -------·--------------do ____________ _ Cigarette tobacco __________________ do ____ ---------
Manufactured products: Consumption (tax-paid withdrawals):
Small cigarettes .••. ----------·---millions __ Large cigars ____________________ thousands __ Mfd. tobacco and snufi ______ thous. of lb..
Exports, cigarettes§ ______________ thousands __ Prices, wholesale (list price, destination):
17,016 489,727 27,919
Cigarettes. composite price .. dol. per 1,000.. 5, 760 Cigars, composite price ___ .. _________ do____ 46.592
Production. manufactured tob<icco: TotaL __________________________ thous. of lb ..
Fine cut chewing ___________________ do ________ __ Plug ________________________________ .do _________ _ Scrap chewing _______________________ do _________ _
~~?~i-~~---_-_-_-_-_-_-_-_-_-_-_-_-_-_-_-_-_~~::::::::_~~::::1
COAL Anthracite:
Exports _______ _ __________ thous. of long tons ___ -------e, chestnut: ___________ dol. per short ton __ 12.48
Prices, composit RetaiL _____ _ Wholesale ___ _ ________________________ do ____ 10. 2go
Production ____ _ _________ thous. of short tons .. 5, 081 onth: Stocks, end of m
In producers' In selected ret
stora~e yards ___________ do _____ -------ail dealers' yards
number of days' supply __ Bituminous:
Exports _______ - __________ tho us. of long tons __ mption, total
thous. of short tons._ Industrial consu
ovens. _________________ do ____ Beehive coke Byproduct co Cement mills Coal-gas retor Electric powe Railways (cia Steel and rolli Other industr
ke ovens. ______________ do ____ -·-----·----------------do ____ ts ______________________ do ____ r utilities _______________ do ____ ss l) ____________________ do ____ ng mills ________________ do. ___ iaL ____________________ do ____ ion: er) _______ thous. of long tons ..
Other consumpt Vessels (bunk Coal mine fue
Prices: L _. _____ tho us. of short tons._
Retail (35 citi Wholesale:
es). _______ dol. per short ton __
omposite .. _. _. _. ___ .... do. ___ Minerun, c Prepared siz
Production t-.Stocks, industr
month, tota
es, composite __________ do .... _________ thous. of short tons~ ial and retail dealers, ~nd of L ....... thous. of short tons __ aL _____________________ do ____ coke ovens _____________ do ____
Industrial, tot Byproduct Cement mil Coal-gas ret Electric pow Railways (c Steel and ro Other indus
Is ______________________ do ____
orts __ --------------·-·-do. ___ ·er utilities _____________ do ____ lass I) __________________ do ____ lling mills ______________ do ____ triaL_----------- ....•• do. ___
Retail dealers , totaL _________________ do ____
COKE
__________ thous. of long tons .. nnellsville (furnace)
Exports _________ _ Pnce, beehive, Co
Production: dol. per short ton ..
Beehive _______ _ __________ thous. of short tons. Byproduct. ___ _ ________________________ do ____
------ -·
------ --
36, 458 I, 024 7, 379
543 153
5, 019 9,723
957 11,660
339
9. 51
4. 753 4.897
47,400
57,201 51,741 7,882
743 299
13,891 9,883 1, 013
18,030 5, 460
--- -----
6.000
653 5,153
Petroleum coke ________ ----------------do _____________
' Revised. I December 1 estimate.
1,850 1,847 2,028 1, 973 1, 661 1, 435 2, 545 2, 205 2,055 2,025 2, 248 2,006 5,240 4,882 4,856 4,803 4, 216 3,644
6,977 --------- --------- 7,492 --------- ---------7,804 --------- --------- 6, 563 --------- ---------
19,404 14,030 22,699 14,916 26,793 20,975 7,087 5, 927 6,526 6, 630 6, 042 5, 725
--------- --------- --------- --------- --------- ---------
3, 594 --------- --------- 3,349 --------- ---------
396 --------- --------- 404 --------- ---------299 --------- --------- 283
2, 778 --------- --------- 2, 527 --------- ---------3 --------- --------- 4 --------- ---
19 --------- 22 --------- ---99 --------- --------- 109 --------- ---------
15,529 15,854 17,858 18,523 18,404 17,777 430,326 490,585 475,067 478,802 487,033 491,028 28,253 29,127 29,232 27,660 28,835 27,462
685, 139 685,513 926,183 549,338 521,326 843,686
5. 760 5. 760 5. 760 5. 760 5. 760 5. 760 46.056 46.056 46.056 46.056 46.056 46.056
24,766 26,246 25,462 25,346 25, 732 24,535 389 402 427 441 458 505
4, 065 4,406 4, 288 4, 229 4,1\60 4, 264 3, 385 3, 745 3, 524 3. 910 3, 884 4,064
16,458 17,209 16, R47 16,288 16,348 15,200 468 483 37F. 478 483 501
FUELS AND BYPRODUCTS
180 97 309 335 223 304
11.66 11.67 11.64 11.57 11.88 12. 17 9.805 9. 799 9. 779 9.807 9. 939 10.073 4, 595 3,198 3,858 4,891 4, 681 5, 246
331 197 169 205 268 414
23 43 53 29 32 48
658 528 1, 511 2,071 1, 973 2, 325
34,041 29,023 31, 199 30,881 31,.510 32,400 931 148 850 886 908 959
7,157 6, 404 6, 871 6, 855 7,107 7,108 470 489 596 615 660 658 150 136 134 127 128 132
4, 729 4,164 4, 916 5,135 5, 215 5, 643 8,600 7,006 7, 755 7, 576 7, 799 8,038 1,024 946 837 827 833 842
10,980 9, 730 9, 240 8, 860 8,860 9,020
77 80 124 113 129 137 345 43 307 306 311 329
8.88 8. 86 8. 85 8.89 9. 06 9. 24
4. 367 4. 375 4. 547 4. 570 4. 618 4. 658 4. 615 4. 533 4. 618 4. 663 4. 724 4.823
47,996 5, 975 43,400 42,774 43,300 45,650
50,690 35,971 37,483 42,929 47,051 52,801 45,590 31,891 32,583 37,249 40,451 45,011
9, 854 4, 970 4, 725 5, 913 6, 215 7, 205 562 390 483 559 634 660 247 188 162 225 285 296
11,330 9, 014 8, 991 9, 988 10,431 10,912 8, 741 5, 658 6,135 6, 604 7,003 8,111 1, 276 721 737 720 723 '757
13,580 10,950 11,350 13. 240 15,160 17,070 5,100 4,080 4, 900 5,680 6,600 7, 790
49 47 51 64 61 61
5. 375 5. 375 5. 825 6.125 6.125 6.125
586 93 541 564 578 611 4, 999 4,474 4, 846 4, 836 5,014 5, 013
125 128 140 144 134 137
• The publication of detailed foreign trade statistics has been discontinued for the duration of the war.
1, 774 2,051 3,367
6,329 4, 720
23,380 7, 451
---------3, 372
371 258
2,618 4
21 99
18, 761 506,071 29,756
433,690
5. 760 46.056
27, 166 467
4, 476 3, 962
17, 758 503
404
12.41 10.209 5,143
708
59
2, 353
31,928 901
6, 814 630 126
5, 552 8, 053
802 9, 050
164 335
9. 34
4. 677 4.883
46,880
56,994 48,044
7, 292 709 331
11, 637 8, 758
827 18, 490 8,950
54
6.125
574 4,806
158
2,155 2, 2il 2, 303 2,060 3, 220 3,431
--------- ------------------ ---------
(•) ---------(•) ---------
--------- ------------------ ---------
--------- ------------------ ---------
--------- ---
19,632 17,141 621,990 542,906 32, 179 27,376
(•) ---------5. 760 5. 760
46.056 46.056
29,047 24,547 467 396
4, 710 3,810 4,016 3, 279
19,341 16,631 514 430
(•) ---------12.46 12.42
10.301 10.301 5, 380 3, 832
1,177 1, 393
96 108
(•) ---------34,978 34,555
968 835 7,050 6, 848
676 628 143 143
5, 913 5, 532 8, 742 8, 747
886 912 10,600 10,910
(•) ---------362 313
9.42 9.47
4. 703 4. 713 4. 922 4. 930
49,800 43,770
61,401 61, 763 51, 501 52,013 8,371 8, 326
720 714 364 372
11,919 12,427 9, 548 9, 726
909 908 19,670 19,540 9,900 9, 750
(•) ---------
6.125 6.125
613 532 4, 971 4,833
154 149
• Includes3,763,000 pounds ofsnufi in January and 3,265,000 in February; data were not available by months, for inclusion prior to 1941. t Data for 1938 revised. 8ee p. 45 of the August 1940 Survey. §Data for 1939 revised; for exports, see table 14, p. 17, and for imports, table 15, p. 18 of the April 1941 issue.
2,081 2,121 3,392
8,314 5.026
------------------
I 1, 280
3,490
339 251
2, 784 4
21 91
16,201 474,913 24,265
---------5. 760
46.056
22,129 415
3, 769 3,410
14,070 465
--------
12.43 10.288 4, 118
1, 237
58
2, 245 2,102 2, 094 2,126 3,542 3, 518
-------------------- --
--------- ----------------- --------
---- --------
-------------------- --------
--------- --------
19,502 16,628 458,277 441,805 27,938 24,426
--------- --------
5. 760 5. 760 46.056 46.190
b 27,365 b 25,072 415 358
4,045 3, 697 3, 673 3, 411
14,990 13,854 479 486
----------
12.48 10.288 4,532
12.48 10.288
' 4, 772
----------
--- ----
---------- -- -----37, 192
1, 021 7, 352
588 149
5, 892 9,226
984 11,980
-----------334
9. 50
4. 704 4. 925
46,667
62,737 53, 397 8, 901
705 367
12,821 10,235
968 19,400 9,340
38,476 1,016 7,404
564 148
5, 913 9, 68-5 1,046
12,700
'35, 091 957
6,685 497 142
'5,154 8, 879
937 11,840
-------347
9. 52
4. 732 4.926
48,540
58, 681 50,951 8,179
647 343
12,660 9, 788
964 18,370
7, 730
313
9. 51
4. 737 4. 924
43,840
'56, 885 '50, 635
7,888 '652 '333
'13,455 9, 662
995 17,650 6, 250
--------- ----------
6.125
650 5, 1~6
151
6,125
647 5, 224
140
6.000
610 '4, 516
121
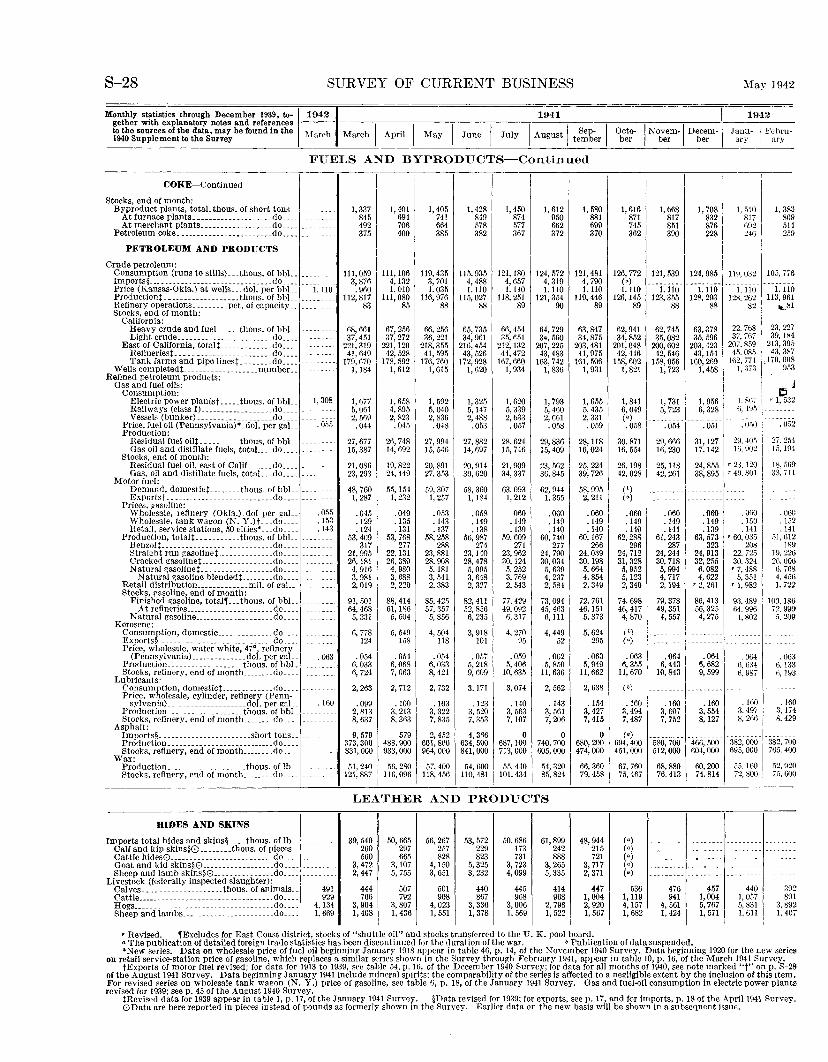
S-28 SURVEY OF CURRENT BUSINESS May 1942
Monthly statistics through December 1939, to-~19421 1941 I 1942 gether with explanatory notes and references --- ---,------,---~---,.-----,---.,-----,-----,-----,---- ----c----lothe sources of the data, may be found in the 1\Iarch March I April I May I June I July I August I Sep- I Octo- I Novem-1 Decem- Janu- I Fehru-1940 Supplement to the Survey - tember ber ber ber ary ary ------------------------~--~~--~----~---~----~--~----~--~----~---~----~
FUELS AND BYPRODUCTS-Continued
COKE-Continued
Stocks, end of month: Byproduct plants, totaL thous. of short tons. ________ _
At furnace p\ants ____________________ do __________ _ At merchant plants. _________________ do____ _ __
Petroleum coke ________________________ do __________ _
PETROLEUM AND PRODUCTS
Crude petroleum: Consumption (runs to stills) ___ thous. of bbL. ________ _ Imports§ _______________________________ do _______ _ Price (Kansas-Okla.) at wells ... dol. per bbL. L 110 Productiont-------------------thous. of bbL _____ _ Refinery operations _________ pet. of capacity __ Stocks, end of month:
California: Heavy crude and fueL .... thous. of bbL. -------Light crude ________________________ do ____ - ---
East of California, totaJt _____________ do ____ - ------Refineriest ________________________ do ____ . -- ---Tank farms and pipe linest ________ do ____ -- ---
Wells completedt_ __________________ number.. --Refined petroleum products:
Gas and fuel oils: Consumption:
Electric power p\antst _____ thous. of bbL I, 308 Railways (class I) __________________ do _______ ----Vessels (bunker) ___________________ do _________ _
Price, fuel oil (Pennsylvania)• _dol. per gaL. . 055 Production:
Residual fuel oiJt __________ thous. of bbL.---· --· Gas oil and distillate fuels, totaL .. do _______ _
Stocks, end of month: Residual fuel oil, east of Calif. _____ do ________ --Gas, oil and distillate fuels, totaL .. do ____ .... _ --
Motor fuel: Demand, domosticf ________ thous. of bbL --- ---Exportst. _----- ____________________ do ____ --- -- -·-.
Prices, ~n=tso1ine: Wholesale, refinery (Okla.).dol per gaL_ . 055 Wholesale, tank wagon (N. Y .)t ___ do____ . !53 Retail, service stations, 50 cities• ___ do____ . 143
Production, totalt ___________ thous. of bbL _____ ---Benzolt---------- _________________ do ___________ _ Strai~ht run gasolinet ____________ .do ___________ _ Cracked gasolinet __________________ do ________ _ Natural gasolinet------------------do __________ _
Natural gasoline blendedt ________ do ___________ _ Retail distribution _____________ mil. of gaL Stocks, gasoline, end of month:
Finisheil ~asoline, total1 ... thous. of bbL. _____ _ At refinerios ______________________ dc_ ________ _
Natural gasoliue ____________________ do __________ _ Kerosene:
Consumption, domestic ______________ do __________ _ Exports~--- __ ------------- ___________ do __________ _ Price, wholesale, water white, 47°, refinery
(Pcnnsylvania) ______________ dol. per ?RL. -063 ProrhiCtiou ___________________ thous. of bbl.__ _ __ Stocks, refinery, end ofmonth ________ do __________ _
Lubricants: Consumption, domestict _____________ do ____ - --Price, wholesale, cylinder, refinery (Penu-
. 160 sylvania) ____________________ dol. per gaL_ Production ___________________ thous. of bhl -· -- ---· Stocks, refinery, end ofmonth ________ do ________ ---
Asphalt: Imports§ _______________________ short tons. __ Production ___________________________ do ____ ... -Stocks, refinery, end of month ________ do ____ .
Wax: Proiluctiou ____________________ thous. oflh _______ _ Stocks, refinery, end ofmonth ________ do _____ _
HIDES AND SKINS
Imports total hides and skins§ .... thous. oflh __ _ Calf and kip skins§0 ________ thous. of pieces __ Cattle hides0----- --------- ____________ do ___ . Goat and kid skins§0 __________________ do _________ _ Sheep and Jamb skins§0 _______________ do ___________ _
Livestock (fede.rally inspected slaughter): Calves. ___________________ thous. of animals __ Cattle __________________________________ do __ .. Hogs _________________________________ .. do. __ . Sheep and lambs _______________________ do
491 929
4, 13! 1, 669
1, 337 845 492 375
Ill, 059 3,876 . 960
112,817 83
68,661 37,451
221.319 41,649
179,670 I, 184
1, 677 5,061 2, 569 .044
27,677 15,387
21,086 23,293
48, 760 I, 287
.045
.129
. 124 53,409
317 21,995 26,181
4, 916 3, 981 2, 019
91,.101 64, 4fl8 5, 331
fl, 778 124
. 054 6, 033 6, 724
2, 263
. 099 2,813 8, 637
1, 401 694 706 400
111, 106 4,132 1.010
Ill, 080 85
67,256 37,272
221, 120 42,528
178.592 1,612
1,658 4. 895 2,823
. 045
26,748 14,692
19, 822 24.449
55, !54 1,232
.049
.135
.131 53,768
277 22.131 26.380 4, 980 3, 688 2, 220
88,414 61,186 5, 504
5, 549 !58
. 054 6,068 7, 063
2, 712
.100 3, 213 8, 363
9, 579 579 373, 300 488. 900 831,000 933,000
51, 240 .56, 280 121, 887 116, 096
I
1,405 741 664 385
119,435 3, 701 I. 035
116, 976 88
66,256 36,221
218,3.55 41,595
176,760 1,615
1, 592 5. 040 2, 836 .048
27,994 15, 546
20,891 27.353
59, 307 I, 257
.053
.143
.137 58,258
288 23, 881 28,908 5.181 3, 541 2, 383
85, 42.1 57,357
5, 856
4, 504 118
.054 6,033 8, 421
2, 732
.103 3, 322 7, 835
2, 452 601,800 964,000
1,428 849 578 382
115,935 4,488 I. 110
115,027 88
65,735 34, 961
216,454 43, 526
172,928 I, 620
1,325 5,147 2, 488 .053
27,882 14,697
20,914 30,620
58, 3f>O I, 184
. 058
.149
. 138 56, 987
274 23, 140 28,478 5. 095 3, 648 2, 327
82,411 52,856 6, 235
3, 918 101
. 057 .5, 218 9, 609
3, 171
.123 3, 520 7, 353
4, 366 634,500 841,000
1,450 874 577 367
121, 180 4, 657 1.110
118, 251 89
66, 454 35, e5I
212,132 44.472
167, 660 1, 934
1, 620 5, 339 2,633 .057
28.624 15,746
21,909 34, 337
63, 093 I, 212
.060 . 149 .139
59, 609 271
23,962 30,124
5, 252 3, 769 2, 543
77, 429 49.092 6, 317
4, 270 95
. 059 .5, 406
!CJ, 635
3,074
. 140 3, 563 7, 107
0 687, 100 713,000
57, 400 54, 600 55, 440 118, 456 1110, 481 I 101, 434 I
1,612 950 662 372
124,572 4,319 1.110
121,354 90
64,729 34,560
207,225 43,483
163,742 I, 836
1, 580 881 699 370
121,481 4, 790 1.110
119,446 89
63,847 34,875
203,481 H,975
161,506 1, 931
1,616 871 745 362
126,772 (•) 1.110
126, 145 89
62,941 34,852
201,048 42,446
158,602 1, 821
I 1,668
817 851 390
I, 708 832 876 228
121, 539 124, 985
1.110 123,355
88
62,745 35,082
200,602 42,546
158,056 1, 723
1.110 128,293
88
63,378 35,596
203,423 43,154
160,269 I, 458
1, 510 817 fi92 2W
119,032
I. 110 128, 2fi2
82
22, 768 37,707
207,859 45,085
1()2, 774 I.:li:>
I. 383 869 514 259
105, 776
1.110 113, 961
... ~!
23. 227 39,184
213,395 43, 387
_170, 008 953.
I, 793 5, 460 2, 661
1, 655 5, 435 2, 331
i
1, 841 I 1, 731 1, 9561 I. ~Iii i ' 1~3~ ~~~49 ~---~:~~~- ---~·~~~-~- fi,4V5: :::::
. 058 . 059 .~1 -~ -~ -~: -~
30. 871 1 29. 666 31, 1271
29. 4051
29,836 15,409
23, 562 36,845
62,944 I, 355
.060
. 149
. 140 60, 740
277 24, 790 30.034
5, 639 4, 237 2, 584
73,094 45,463 6, Ill
4, 449 52
.062 .5. 850
11, 636
2, 562
.143 3, 561 7, 206
28,118 16,024
25, 224 39,726
58,995 2, 211
.060
. 149
. 140 60,167
266 24,039 30, 198 5, 664 4, 854 2, 349
72,761 46, !51
5, 373
5, 624 295
.063 5, 949
11,662
2, 638
.154 3, 427 7, 415
16,554 16,230 17.142 If). 902
26, 1981 25,118 24,855 I '23. 120 I 42,028 42, 261 38, 895 I '40. SOl 1
?:l 1::::::::1:::::::::! j .060' .060 .060 --_or.o \' . 149 . 149 . 149 . !50 .140 . 141 .139 . 141 !
62, 288 61, 243 63, 573 '60, 03.j 296 287 323 208
24, 712 24, 244 24, 913 22, 725 31, 328 30, 718 32, 255 30. 324 5, 952 5, 994 6, 082 ' 7, 488 5, 123 4, 717 4, 622 5, 351 2, 340 2, 194 ' 2, 261 ' I, 982
74.698 46,417 4, 870
79,378 49,351 4, 557
86,413 56,325
4, 275
(b) ~--------- ---------(•) --------- ---------
. 063 . 064 . 064 6, 355 I 6, 443 6, 682
11, 670 I 10, 843 9, 599
(') '--------- ----------. 160
3, 494 7, 487
.160 3, 607 7, 752
.160 3, 554 8, 127
93, 489 64, 996 4,802
. Ofi4 f\, 634 6. 987
0 0 (•) --------- ---------7 40, 700 680, 200 694, 400 580, 700 466, 500 605,000 474,000 451,000 512,000 604,000
54, 320 I 6R, ~60 67, 760 68, 880 60, 200 85, 824 79, 458
1
75, 467 I 76, 413 74. 814
382,000 695.000
55, 160 72,800
27. 254 !.\, 194
18,.169 3:l. 711
- Of\0 . 15 - 141
.11, fH2 189
19,226 2fl, 00() ti. 708 4, 456 I. 722
100. 186 72. 99()
!i, 209
.1)6: 6.133 ti. 193
.160 :), li4 s. 429
382. 700 765,400
52.920 75, 600
LEA'rHER AND PRODUCTS
39,540 260 560
3,472 2, 447
444 766
3, 9041 1,408
50, 665 297 665
3,107 5, 755
507 792
~. 807 I, 436
56,267 257 828
4, !50 3, 651
50! 908
4,023 I, 551
53, 572 229 823
5,325 3, 232
440 867
3,336 1,378
50,686 173 731
3, 723 4,099
445 968
3,006 I, 569
61,899 242 888
3, 265 5, 335
414 968
2, 796 1, 522
48,944 215 721
3, 717 2, 371
447 1,004 2, 920 I, 567
(•) (•) (•) (•) (•)
536 1, 119 4, !57 I, 682
476 941
4, 561 1, 424
457 1,004 5, 767 1, 571
440 I, 0571 5, 831 I, 611
I
392 891
3, 892 I, 40<
'Revised. ,Excludes for East Coast district, stocks of "shuttle oil" and stocks transferred to the U.K. pool hoard. a The publication of detailed foreign trade statistics has been discontinued for the duration of the war. 'Publication of data suspended. *New series. Data on wholesale price of fuel oil beginning January 1918 appear in table 46, p. 14, of the November 1940 Survey. Data beginning 1920 for the new series
on retail service-station price of gasoline, which replaces a similar series shown in the Survey through February 1941, appear in table 10, p. 16, of the March 1941 Survey. tExports of motor fuel revised; for data for 1913 to 1939, see table 54, p. 16, of the December 1940 Survey; for data for all mouths of 1940, see note marked "t" on p. S-28
of the August 1941 Survey. Data beginning January 1941 include mineral spirits; the comparability of the series is affected to a negligible extent by the inclusion of this item. For revised series on wholesale tank wagon (N. Y.) price of gasoline, see table 6, p. 18, of the January 1941 Survey. Gas and fuel-oil consumption in electric power plants revised for 1939; seep. 45 of the August 1940 Survey.
!Revised data for 1939 appear in table I, p. 17, of the January 1941 Survey. §Data revised for 1939: for exports, seep. 17, and for imports, p. 18 of the Aprill941 Survey. 0Data are here reported in pieces instead of pounds as formerly shown in the Survey. Earlier data on the new basis will be shown in a subsequent issue.
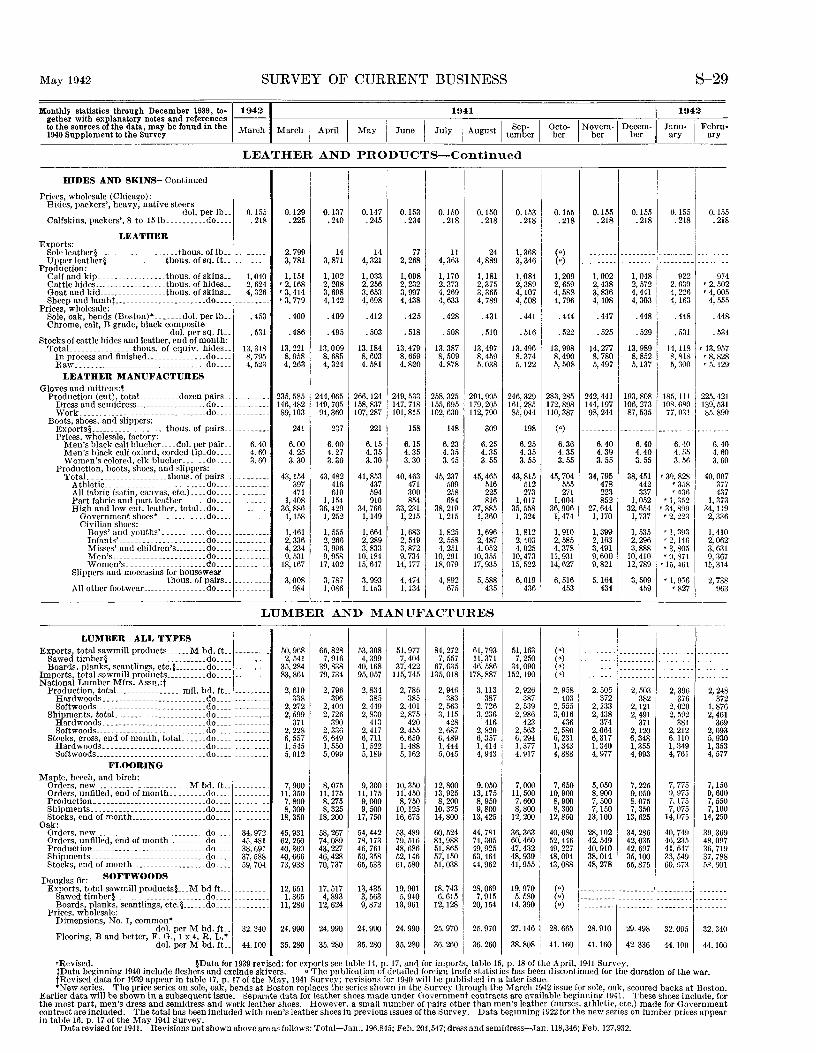
May 1942 SURVEY OF CURRENT BUSINESS S-29
1942 gether with explanatory notes and references --- -----,---------,-------,-----,--------;----c------.------,------c---- ----,---
Monthly statistics through December 1939, to-~19421 1941 I to the sources of the data, may be found in the March March I A .1 I M I J I J 1 I A t I Sep- I Octo- I Novem-1 Decem-1940 Supplement to the Survey pn ay une u Y ugus tember ber ber ber
LEATHER AND PRODUCTS-Continued
I I
I IIIDES AND SKINS-Continued
Prices, wholesale (Chicago): Hides, packers', heavy, native steers
dol. per lb .. 0. !55 0.129 0.137 0.147 0.153 0.150 0.150 Calfskins, packers', 8 to 15lb .......... do .... .218 .225 .240 .245 . 234 .218 .218
LEATHER Exports:
Sole leather§ ..................... thous. of lb .. --------- 2, 799 14 14 77 11 24 Upper leather§ ............... tho us. of sq. ft.. 3, 781 3, 871 4,321 2, 268 4,363 4,889
Production: Calf and kip ................. tho us. of skins .. 1,040 1,151 1,102 1,033 1,098 1,170 1,181 Cattle hides .................. tho us. of hides .. 2, 624 '2,168 2, 208 2,256 2, 232 2, 373 2,375 Goat and kid ................. thous. of skins .. 4, 326 '3, 414 3,698 3, 653 3, 997 4, 269 3,365 Sheep and lambt ....................... do .... '3, 779 4,142 4,698 4,438 4, 633 4, 789
Prices, wholesale: Sole, oak, bends (Boston)• ....... dol. per lb .. . 453 .400 .409 . 412 .425 .428 .431 Chrome, calf, B grade, black composite
dol. per sq. ft.. . 531 .486 .495 .503 . 518 . 508 .510 Stocks of cattle hides and leather, end of month:
TotaL ............... thous. of equiv. hides .. 13, 318 13,221 13,009 13,184 13,479 13,387 13,497 In process and finished ............... do .... 8, 795 8, 958 8, 685 8, 603 8, 659 8, 509 8, 459 Raw ................................. do .... 4, 523 4, 263 4, 324 4, 581 4,8QO 4,878 5,038
LEATHER MANUFACTURES Gloves and mittens:,
Production (cut), totaL ......... dozen pairs .. --------- 235,585 244,065 266, 124 249,533 258,325 291,995 Dress and semidress .................. do .... --------- 146,482 149,705 158,837 147,718 155,695 179, 205 Work ................................. do .... --------- 89, 103 94,360 107, 287 101,815 102,630 112, 790
Boots, shoes, and slippers: Exports§ ................... thous. of pairs .. ·--------- 241 237 221 158 148 309 Prices, whole~ale, factory;
Men's !:>lack calf blucher .... dol. per pair .. 6.40 6.00 6.00 6.15 6.15 6. 23 6. 25 Men's black calf oxford. corded tip.do .... 4. 60 4. 25 4. 27 4.35 4. 35 4.35 4.35 Women's colored, elk blucher ...... do ____ 3. 60 3.30 3. 30 3.30 3.30 3. 45 3. 55
Production, boots, shoes, and slippers: TotaL ................... thous. of pairs .. ····------- 43,154 43,482 41,853 40,463 45,237 45,465
Athletic ... __ .................... do .... --------- 397 416 437 471 509 516 All fabric (satin, canvas, etc.) .... do ..... ·------- 471 610 594 300 258 225 Part fabric and part leather ...... do .... ------ 1,408 I, 154 910 854 684 816 High and low cut. leather, totaL.do .... -------- 36,886 36,429 34,766 33,231 38,219 37,885
Government shoes* _______ .... do ...... -------- I, 158 1, 252 1,149 1, 215 1, 215 1, 360 Civilian shoes:
Boys' and youths' ....... ____ do .... --------- 1,461 1, 555 1, 664 1,683 I, 825 1, 696 Infants' ...................... do .... 2,336 2, 266 2, 289 2, 549 2,558 2,487 Misses' and children's ........ do .... --------- 4, 234 3, 996 3, 833 3,872 4, 251 4,052 Men'R .. ______________________ do ____ --------- 9, 531 9, 958 10,184 9, 734 10,291 10, 355 Women's. __________________ .do ____ .... .. .. 18, 167 17,402 1.5, 647 14, 177 18,079 17,935
Slippers and moccasins for housewear thous. of pairs .. --------- 3,008 3, 787 3, 993 4,474 4, 892 5, 588
All other footwear ................ do .... _ ------ 984 1,086 1,153 I I, 134 675 435
LUMBER AND MANUFACTURES
LUMBER-ALL TYPES I Exports, total sawmill products ...... M bd. ft..---------
Sawed timber§ ......................... do ........... .. Boards. planks, scantlings, etc.s ........ do ............ ..
Imports, total sawmill products .......... do ........... .. National Lumber Mfrs. Assn.:t
Production, totaL ............... mil. bd. ft ......... .. Hardwoods .......................... do ............ . Softwoods ............................ do ............. .
Shipments, totaL ....................... do .. .. Hardwoods .......................... do ........... .. Softwoods ............................ do ........... ..
Stocks, gross, end of month, totaL_ .... do ........... .. Bardwoods .......................... do ........ . 8oftwoods...................... .. do ........... ..
FLOORING Maple, beech, and birch:
Orders, new ....................... M bd. ft.. .......... . Orders, unfilled, end of month ......... do ............ . Production ............................ do .......... .. Shipments._ ........................... do ............. . Stocks, end of month ................... do.... .. ..
Oak: Orders, new ____________________________ do ___ _ Orders, unfilled, end of month ......... do .. .. Production ............................. do ... . Shipments ........ _ .................... do .. .. Stocks, end of month .................... do .... .
Douglas fir: SOFTWOODS
34,972 45, 481 38,691 37, 588 59, 704
Exports. total sawmill products§ ... M bd ft ......... .. Sawed timber§ ...................... do .. .. Boards, planks, scantlings, etc.§ ____ .. do ... ..
Prices. wholesale: Dimensions, No. 1, common*
50,968 2, 541
35, 2S4 83,861
2,610 338
2, 272 2,599
371 2, 228 6, 557 I, 545 5,012
7, 900 11,350 7, 800 8, 300
18,350
45,931 62,250 40,369 40,666 73,938
12,651 I. 365
11,286
65,828 7, 916
39,838 79,734
2, 796 396
2, 400 2, 726
390 2,336 6,649 I, 550 5,099
8,075 11,175 8, 275 8, 325
18,200
58,267 74,089 43,227 46,428 70,737
17,517 4,893
12,624
53,308 4,399
40,168 95,057
2,834 385
2, 449 2,830
413 2,417 6, 711 1, 522 5,189
9, 300 11, 175 9,000 9, 500
17,750
54,442 78,173 46,761 50,358 65,533
13,435 3, 563 9,872
51,977 7,404
37,422 115,745
2, 786 385
2, 401 2,875
420 2, 455 6,650 1,488 5, W2
10,350 11,450 8, 750
10,125 16,675
53,489 79,516 48,686 52,146 61,580
19, 901 5, 940
13,961
84,272 7, 557
67,635 135,018
2, 946 383
2, 563 3, 115
428 2,687 6,489 I, 444 5,045
12,800 13,925 8, 200
10,325 14,800
60,524 81,988 51,865 57,150 51,038
18, 743 6, 615
12,128
61,793 11,371 46, 586
178,887
3, 113 387
2, 726 3, 236
416 2, 820 6,357 1, 414 4, 943
9,050 13,175 8, 950 9,800
13,425
44,781 74,305 49,925 53,464 44,962
28,069 7, 915
20, !54
' I
0.153 . 218
1,368 3, 346
1,084 2,389 4,107 4, 508
. 441
. 516
13,496 8,374 5,122
246,329 161, 285 85,044
198
6. 25 4. 35 3. 55
43,815 512 273
1, 017 35,558
1, 324
I, 812 2, 403 4, 025
10,473 15, 522
6,019 436 !
51,163 7, 250
34,090 152, 190
2, 926 387
2, 539 2, 986
423 2, 563 6, 294 I, 377 4, 917
7,000 11,500
7, 600 8,800
12,200
36,363 60,460 47,432 48,939 41,955
19,970 5. 580
14,390
0.155 .218
(•) (•)
1, 209 2,659 4, 588 4, 796
.444
.522
13,998 8,490 5, 508
283,285 172, 898 110,387
(•)
6. 36 4. 35 3 . .15
45,704 555 271
1,004 36,906
1, 474
1, 910 2, 585 4. 378
11, 931 14, 627
6, 516 4531
(•) (•) (•) (•)
2,9.58 403
2, 555 3,016
436 2,580 6, 231 1,343 4,888
7, 650 10,900 8, 900 8, 300
12,850
40,080 52,446 49,227 48,094 43,088
0.155 .218
------------------
1, 002 2,438 3,836 4, 408
. 447
.525
14,277 8, 780 5,497
242,441 144, 197 98,244
---------6.40 4.39 3. 55
34,795 478 223 852
27,644 I, 170
I, 399 2,163 3, 491 9,600 9, 821
5,164 434
2,505 372
2,133 2,438
374 2,064 6,317 1, 340 4, 977
5,050 8, 900 7,500 7,150
13,100
28, 102 42.549 40,910 38,014 48,278
0.155 .218
------------------
I, 048 2, 572 4,441 4, 303
.448
.529
13,989 8, 852 5,137
193,808 106,273 87,535
---------
6.40 4. 40 3. 55
38,451 442 337
1,052 32,654
I, 737
I, 535 2, 296 3,888
10,410 12,789
3, 509 459
2, 503 382
2,121 2, 491
371 2,120 6, 348 I, 355 4, 993
7,225 9,050 8.075 7, 350
13, 625
34,286 42,035 42.697 35, 100 55,875
I I
J anu- Febru· ary ary
i I
0.1551 . 218
i ··--··----· ---------
922 2. 630 4, 226 4, 163
.H8
. 531
14, 118 8,818 5, 3oo I
I
0.1.> . 21
-·· ... -------
97 '2, 50 r 4, 00
4 2 5 5 4, 55.
. 44 8
. 531
'13, 95 '8, 82 '5.12
7 8 9
185,111 I 22.>, 42 I 1 0
10~. 0~0 77: 031
-- ... --
6. c\(1
4. 55 3. 56
r 39, 82S r 3.58 '436
r 1, 3fi2 '31, 899 '2. 223
'!, ~93 r 2, 14fi r 3, 805 , ~. 8i!
'15, 461
'I, 936 I , 827 I
2, 396 376
2, 020 2, 592
381 2, 212 6.110 I, 349 4. 761
7, 775 3, 975 7.175 7, 075
14,075
40, 749 46,235 41, 647 25,549 60. f>/:l
139,53 8.'\, 89
--------6. 4 0
0 0
4. 6 3. 6
40,00 7 7 7 3 9 6
37 43
I, 37 34, 11 2, 33
1,41 0 2 2,06
3, f>31 9, :!67
15,314
2, 73 8 l 96:
2,248 372
1, 876 2, 461
369 2,093 5. 930 I, 3.53 4, 577
7, !50 9, 600 7,550 7,100
14,250
39,369 4R, OP7 36, 719 37,788 ,'\.0, 501
dol. per M bd. fL I 32. 340 Flooring, Band better, F. G., 1 x 4, R. L.*
24.990
35.280
24.990
35.280
24.990
35.280
24.990
35.280
25.970
36. 260
25.970 27.146
38.808
28.665
41.160
28. 910 29. 498 32. 095 32. 340
44. 100 dol. per M bd. fL 44. 100 36.260 41. 160 42. 336 44. 100
'Revised. §Data for 1939 revised: for exports see table 14, p. 17, and for imports, table 15, p. 18 of the April, 1941 Survey. tData beginning 1940 include fieshers and exclude skivers. a The publication of detailed foreign trade Rtatistics has been discontinued for the duration of the war. tRevised data for 1939 appear iu table 17, p. 17 of the May, 1941 Survey; revisions for 1940 will be published in a later issue. *New series. Tbe price series on sole, oak, bends at Boston replaces the series shown in the Survey through the March 1942 issue for sole, oak, scoured backs at Boston.
Earlier data will be shown in a subsequent issue. Separate data for leather shoes made under Government. contracts are available beginning 1941. These shoes include, for the most part, men's dress and semidress and work leather shoes. However, a small number of pairs other than men's leather (nurses, athletic·, etc.) made for Government contract are included. The total has been included with men's leather shoes in previous issues of the Survey. Data beginning 1922 for the new series on lumber prices appear in table 16, p. 17 of the May 1941 Survey.
Data revised for 1941. Revisions not shown above are as follows: Total-Jan., 196,845; Feb. 204,547; dress and semidress-Jan. 118,346; Feb. 127,932.
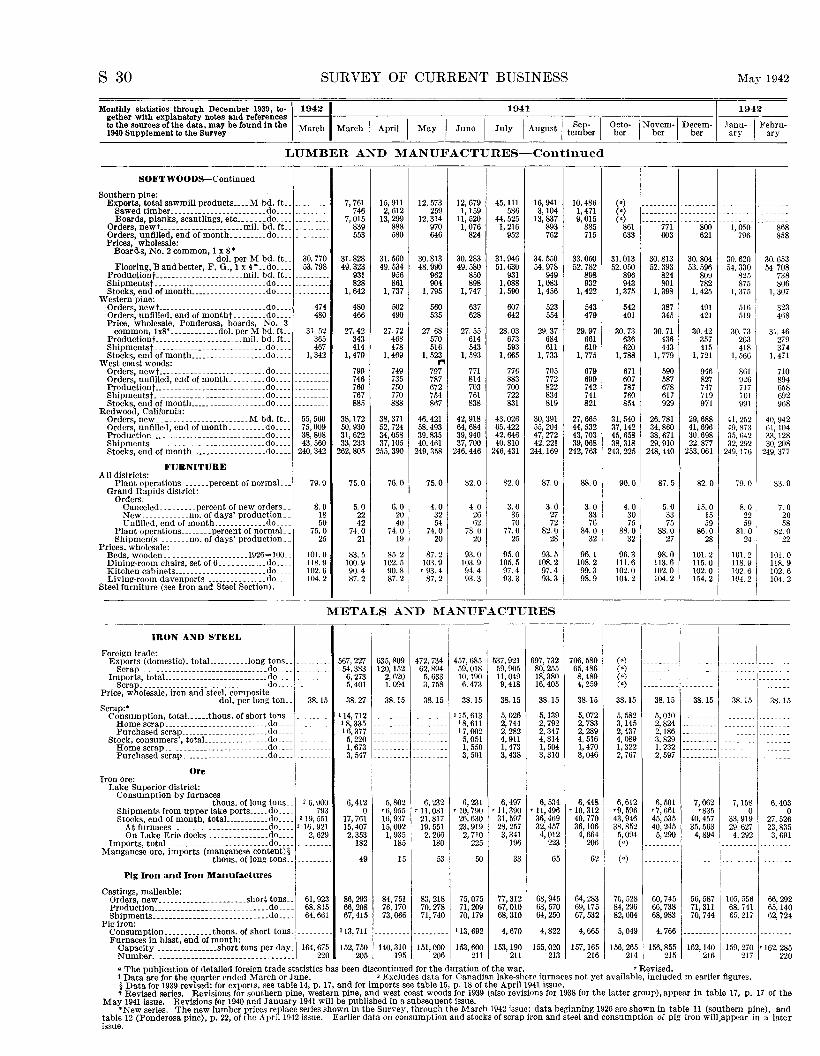
S-30 SURVEY OF CURRENT BUSINESS May 1942
Monthly statistics through December 1939, to-~19421 1941 I 1942 gether with explanatory notes and references --- -----,---------,------;----.--------,----,----,----,--- ------,-----tothesourcesofthedata,maybefoundinthe March March I April I May I June I July I August I Sep- I Octo- INobveerm-1 Debceerm- .Tanu- I Febru· 1940 Supplement to the Survey · tember ber ary ary
LUMBER AND MANUFACTURES-Continued
SOFTWOODS-Continued
I outhern pine: Exports, total sawmill products .•.. M bd. ft .. --------- 7, 761 15, 911 12,573 12,679 45, 111 16, 941 10,486 (•) --------- --· ----- -- ---- --------Sawed timber ............ ____________ do ____ 746 2, 612 259 1, I59 586 3,104 I, 471 (•) --------- --- ----- ----- --- --------
Boards, planks, scantlings, etc .... __ .do ____ --------- 7, OI5 I3, 299 I2, 3I4 11, 520 44,525 13,837 9,0I5 (•) --------- -- ----- --------- --------Orders, newt---------------------mil. bd. ft __ 839 888 970 I,076 1, 2I6 893 885 86I 771 800 1, 050 868 Orders, unfilled, end ofmonth _________ do ____ 553 580 646 824 952 762 715 633 603 621 796 858 Prices, wholesale:
Boarns, No.2 common, 1 x 8* dol. per M bd. ft._ 30.770 31.828 31.560 30. 8I3 30.283 31.946 34. 550 33.050 31.013 30.8I3 30.804 30. 620 30.653
s
Flooring, Band better, F. 0., 1 x 4 • __ do ____ 53.798 49.323 49.534 48.990 49.580 51.630 54.978 52.782 52.050 52.393 53.596 54. 330 54 708 Productiont ______________________ mil. bd. ft._ --------- 931 956 962 850 93I 949 898 896 824 809 825 738 Shipmentst ____________________________ do ____ --------- 828 86I 904 898 I,088 1,083 932 943 801 782 875 806
w Stocks, end of month ___________ .. _____ .do ____ -------- 1, 642 1, 737 1, 795 I, 747 I, 590 I, 456 1,422 1, 375 I, 398 I, 425 I, 375 1, 307 estern pine: Orders, newt ..... _______ .. _ .. ______ ... _do ____ 474 480 502 560 637 607 523 543 542 387 49I 516 323 Orders, unfilled, end of montht ________ do ____ 480 466 490 535 628 642 554 479 401 345 42I 519 468 Price, wholesale, Ponderosa, boards, No. 3
common, lx8* .•.•.....•.. dol. perM bd. ft_ 31. 52 27.42 27.72 27.68 27.55 28.03 29.37 29.97 30.73 30.71 30.42 30.73 31.46 Productiont----------------------mil. bd. ft._ 365 343 468 570 614 673 684 66I 636 436 357 263 279 Shipmentst ____ . ______________ . _____ ... do ____ 467 414 478 5I6 543 593 611 6I9 620 443 415 418 374 Stocks, end ofmonth ___________________ do ____ I,342 1, 479 I, 469 I, 523 1, 593 est coast woods: ,.. w
1, 665 I, 733 1, 775 1, 788 1, 779 1, 721 1, 566 1, 471
Orders, newt ...... ______ ....... __ .. ___ .do_. __ ----- 799 749 797 771 776 705 679 671 590 946 861 710 Orders, unfilled, end ofmonth _________ do ____ -- ------ 746 735 787 814 883 772 699 607 587 827 926 894 Production 1--- ________ .. ______________ .do ____ --- ---- 760 750 672 703 700 822 742 787 678 747 717 658 Shipmentst _______ ----------. _________ .do ___ . --- ----- 767 770 754 761 722 834 741 760 617 719 iOl 692 Stocks, end of month ..... ____________ .. do ____ ------ 885 888 867 838 831 819 821 854 929 971 991 968 edwood, California: Orders, new _______________________ M bd. ft __ 55,560 38, 172 38, 371 46,421 42,918 43,026 30,391 27,665 31,540 26,781 29,688 41,252 40,942 Orders, unfilled, end of month .. _______ do ____ 75,009 50,930 52,724 58,493 64,684 65,422 55,204 44,532 37,142 34,860 41,696 49,873 61,104 Production ________________ . ___________ .do. ___ 38,808 31,622 34,058 39.835 39,940 42,646 47,272 43,703 45,658 38,671 30.698 35,642 33,128 Shipments __ . _____________________ . ____ do ____ 43,560 33.233 37, 105 40,461 37,700 40,810 42,221 39,068 38,318 29,910 22,877 32,292 30, 208 Stocks, end of month ___________________ <]o ____ 240,342 262,805 255,390 249,358 246,446 246, 431 244, 169 242,763 243,225 248,440 253,061 249, 176 249, 377
R
FURNITURE A II districts:
Plant operations ______ percent or normaL .. Grand Rapids district:
79.0 75.0 76.0 75.0 82.0 82.0 87.0 88.0 90.0 87.5 82.0 79.0 83.0
Orders: Canceled ...... ___ percent of new orders __ 8. 0 5. 0 6.0 4. 0 4. 0 3. 0 3. 0 3.0 4. 0 5. 0 15.0 8.0 7. 0 New ____________ no. of days' production._ 18 22 20 32 26 35 27 33 30 33 15 22 20 Unfilled, end or month .. ___________ do ____ 50 42 40 54 62 70 72 76 75 75 59 59 58
Plant operations ________ percent of normaL. 75.0 74.0 74.0 74.0 78.0 77.0 82.0 84.0 88.0 88.0 86.0 81.0 82.0 Shipments ________ no. of days' production .. 25 21 19 20 20 25 28 32 32 27 28 24 22
p rices, wholesale: Beds, wooden. __________________ .. 1926= 100 .. 101.0 83.5 85 2 87.2 93.0 95.0 93.5 96.1 96.3 98.0 101.2 101.2 101.0 Dining-room chairs, set of 6 .. _______ ... do .. __ 118.9 100.9 102 .. 5 103.9 103.9 105.5 108.2 108.2 111.6 113.6 115.0 118.9 118. 9 Kitchen cabinets _____________ . _________ do ____ 102.6 90.4 90.8 '93. 4 94.4 97.4 97.4 99.3 102.0 102.0 102.0 102.6 102.6 Living-room davenports ________ .. _____ do -- 104.2 87.2 87.2 87.2 ' 93.3 93.3 93.3 98.9 104.2 104.2 154.2 104.2 104. 2
teel furniture (see Iron and Steel Section). I I
s
METALS AND MANUFACTURES
IRON AND STEEL
I Forei!(n trade: Exports (domestic), totaJ.. ________ long tons __ --- 567,227 635,809 472, 734 457,685 537,921 697,732 706, 58o 1 (•)
Scrap _. __________________ -------- __ .do. ___ 54,383 120, 152 62, R94 59,018 59,905 80,255 65,486 (•)
I~~~~~: _t~_t_a:l~::::::: :::::::::::::::: ::g~:::: 6, 273 2,620 5, 633 10,190 11,049 18,380 8,489 (•) .5, 401 1, 094 3, 758 6,473 9,418 16,405 4, 259 (•)
Price, wholesale, iron and steel, composite 38.15 38.15 38.15 dol. per long ton .. 38.15 38.27 38.15 38.15 38.15 38.15 38.15 38.15 38.15 38. 15
Scrap:• 5,026 5, 139 5, 072 5, 582 Consumption, totaL .... thous. ofsbort tons .. 114,712 115,613 5,010
~.~~~:s"e"~~crai:>-·-·:::::::::::::::::::g~:::: 18,335 18,611 2, 744 2, 792 2, 783 3,145 2, 824 16,377 ----- --------- 17,002 2, 282 2, 347 2, 289 2,437 2,186
Stock, consumers', totaL _______________ do ___ 5,220 5, 051 4, 911 4, 814 4, 516 4, 089 3, 829
~~~~;;:~~cra\)_--_:::::::::::::::::::g~:::: 1,673 I, 550 1, 473 1, 504 1, 470 1, 322 I, 232 --------- ----·--3, 547 3, 501 3,438 3,310 3,046 2, 767 2, 597
Ore Iron ore:
Lake Superior district: Consumption by furnaces
6,412 6,497 6, 534 6,448 6,612 thous. of long tons __ 2 6, 900 5,802 6, 232 6, 231 6,501 7,062 7,158 6, 403 Shipments from upper lake ports ..... do ____ 793 0 •6, 955 '11, 081 '10, 790 '11, 390 '11,496 '10,312 •9, 596 •7, 661 •835 0 0 Stocks, end of month, totaL __________ do ____ 2 19,551 17,761 16,937 21,817 26,630 31,597 36,469 40,770 43,946 45,535 40,457 33,919 27, 526
At furnaces. _______________________ do ____ 2 16, 921 15,407 15,002 19,551 23,919 28,257 32,457 36,106 38,852 40,245 35,563 29.627 23,835 On Lake Erie docks ................ do ____ 2,629 2,353 1, 935 2, 266 2, 710 3, 341 4,012 4,664 5,094 5,290 4,894 4, 292 3, 691
Imports, totaL ________________________ do _____ 182 185 180 225 196 223 206 (•) 1----Manganese ore, imports (manganese content)§
thous. of long tons __ 49 15 53 50 33 65 62 (•)
Pig Iron and Iron Manufactures
Castings, malleable: 75,075 77,312 68,945 64,283 70,528 60,745 56,587 Orders, new ....................... short tons __ 61,923 86,293 84,751 83,218 105, 556 66,292
Production ______ ........ _. _________ •. __ do __ ._ 68,815 66,208 76,170 70,278 71,209 67,010 68,570 69,175 84,296 66,738 71, 311 68.741 65,140 Shipments ......•... -···········- __ .... do. ___ 64,661 67,415 73,066 71,740 70,179 68,310 64,250 67,532 82,004 68,983 70,744 65, 217 62, 724
Pig iron: 113,692 4, 670 4,822 4,665 5,049 Consumption ____________ thous. of short tons. _ 113,711 --------- --------- 4, 766
Furnaces in blast, end of month: Capacity ............... short tons per day_ 164,675 152,750 140,310 151,000 153,600 153,190 155,020 157, 165 156,265 156,855 162, 140 159,270 '162. 285 Number ...... __ .....••.....•... ------------ 220 205 195 206 211 211 213 216 214 215 ~16 217 220
• The publication of detailed foreign trade statistics has been discontinued for the duration of the war. 'Revised. 1 Data are for the quarter ended March or June. 2 Excludes data for Canadian lake-shoro furnaces not yet available, included in earlier figures. §Data for 1939 revised; for exports, see table 14, p. 17, and for imports see table 15, p. 18 of the April1941 issue. t Revised series. Revisions for southern pine, western pine, and west coast woods for 1939 (also revisions for 1938 for the latter group), appear in table 17, p, 17 of the
May 1941 issue. Revisions for 1940 and January 1941 will be published in a subsequent issue. *New series. The new lumber prices replace series shown in the Survey, throu!(h the March 1942 issue; data beginning 1926 are shown in table 11 (southern pine), and
table 12 (Ponderosa pine), p. 22, of the April1942 issue. Earlier data on consumption and stocks of scrap iron and steel and consumption of pig iron will.appear in a later issue.
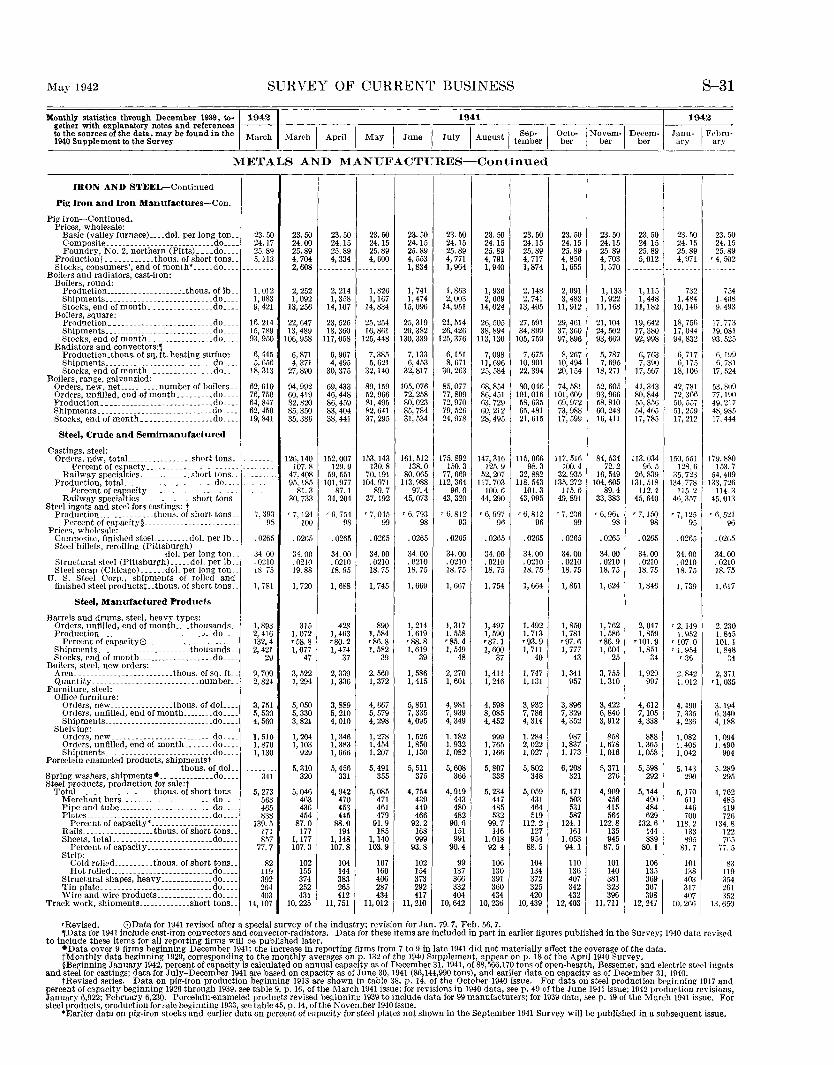
May 1942 SURVEY OF CURRENT BUSINESS S-31
Monthly statistics through December 1939, to-~19421 1941 1942 gether with explanatory notes and references ---1-----,----.------.----.,-----,-----,----,-----,------,----l----.---to the sources of the data, may be found in the March March I April I May I June I July I August I Sep- I Octo- I Novem-1 Decem- Janu- I Febru-1940 Supplement to the Survey tember ber ber ber ary ary
ME'l'ALS AND MANUFACTURES-Continued
IRON AND STEEL-Continued
Pig Iron and Iron Manufactures-Con.
Pig iron-Continued. Prices, wholesale:
Basic (valley furnace) .•.. dol. per long ton .. 23.50 23.50 23.50 23.50 23.50 23.50 23.50 23.50 Composite. __________________________ do .... 24.17 24.00 24.15 24.15 24.15 24.15 24.15 24.15 Foundry, No.2, northern (Pitts) ...• do ____ 25.89 25.89 25.89 25.89 25.89 25.89 25.89 25.89
Productiont ____ ........ thous. of short tons .. 5,113 4, 704 4, 334 4, 600 4, 553 4, 771 4, 791 4, 717 Stocks, consumers', end ofmonth* _____ do ______
Boilers and radiators, cast-iron: ----- 2, 608 --- -~---- --------- I, 834 1, 964 1, 940 1, 874
Boilers, round: Production ...•.. ______ ...... c.thous. of lb._ I, 012 2, 252 2, 214 1,826 I, 741 1, 863 I, 936 2,148 Shipments. ____ .. _ .... ____________ ... do .... 1,083 I, 092 1, 358 1, 167 1,474 2, 003 2, 669 2, 741 Stocks, end ofmonth ________________ do .... 9,421 13, 256 14,107 14, 834 15,096 14,951 14,024 13,405
Boilers, square: Production._ .. ____________________ .• do. ___ 16,214 22,647 23,525 25,254 25,319 21,514 26,505 27,591 Shipments. __ . ______________________ .do. __ . 15,789 13,489 13,360 16,861 20,382 26,426 38,894 34,899 Stocks, end of month. _______________ do .... 93,950 106,958 117,058 125,448 130,339 125,376 113, 130 105,759
Radiators and convectors:, Production.thous. of sq. ft. heating surface._ 6, 445 6, 871 6, 967 7, 385 7,133 6,151 7,098 7, 675 Shipments. _____ ._._.---------- __ .... do. ___ 5, 656 4, 371 4, 49S 5, 621 6, 453 8, 671 II, 696 10,901 Stocks, end of mouth .. ______________ dn .... 18,313 27,890 30,375 32, 140 32,817 30,263 25,584 22,394
Boilers, range, galvanzied: Orders, new, net .......... number of boilers .. 62,010 94,992 69,433 89,159 105,076 85,077 68,854 80,046 Orders, unfilled, end of month ........• do ____ 76,750 60,419 46,448 52,966 72, 258 77,809 86,451 101,016 Production ..... _________ -------- ____ .. do .... 64,847 82,820 86,459 81,495 80,023 72,970 63, 729 58,635 Shipments. __________________________ .. do_ ... 62,450 85,350 83,404 82,641 85,784 79, 526 60,212 65,481 Stocks, end of month ..•..............• do .... 19,841 35,386 38,441 37, 295 31,534 24,978 28,495 21,615
Steel, Crude and Semimanufactured
Castings, steel: Orders. now, totaL _______________ short tons .. ·-- ---- 126, 140 152,007 153, 143 161,512 175,892 147,316 115,066
Percent of capacty ____________ --- ---- 107.8 129.9 130.8 138.0 150.3 125.9 98.3 Railway specialties ..... ------·· short-tons:: ----- -- 47,408 59, 55! 70,191 80,065 77,669 52,207 32,882
Production, totaL ... _··------------ .. do .... _ ·--- 95,185 101,977 104,971 ll3, 988 112, 364 ll7, 703 ll8. 543 Percent of capacity------------ __________ ---- 81. 3 87.1 89.7 97.4 96.0 100.6 101.3
Railway specialties. ____________ short tons __ 30, 733 34,204 37,192 45,073 43,320 44,290 43,995 Steel ingots and steel fors castings: t
Production ... _____ ..... thous. of short tons __ 7, 393 '7, !24 r fi, 7.54 '7, 04.1 '6. 793 '6. 812 '6, 997 '6, 8!2 Percent of capacity§ _______________ ---------
Prices, wholesale: 98 100 98 99 98 93 96 96
Composite, finished steeL ........ dol. per lb .. . 0265 . 0265 . 0265 .0265 . 0265 .0265 .0265 .0265 Steel billets, rerolling (Pittsburgh)
dol. per long ton_ 34.00 34.00 34.00 34.00 34.00 34.00 34.00 34.00 Structural steel (Pittsburgh) _____ dol. per lb .. . 0210 . 0210 . 0210 . 0210 . 0210 .0210 . 0210 .0210 Steel scrap (Chicago) ...... dol. per long ton. 18. 75 19.88 18.95 18. 75 18. 75 18.75 18.75 18. 75
U. S. Steel Corp., shipments of rolled and finished steel productst .. thous. of short tons. I, 781 I, 720 I, 688 1, 745 I, 669 I, 667 I, 754 I, 664
Steel, Manufactured Products
Barrels and drums, steel, heavy types: Orders, unfilled, end of month .... thousands. _ 1,893 315 428 890 1, 214 I, 317 I, 497 I, 492 Production _________________________ _. __ do .... 2, 416 I, 072 1,463 1, 584 1, 619 I, 558 I, 590 1, 713
Percent of capacity0~----------- ----------- 132,4 '58. 8 •so. 2 •86.8 •88.8 •85. 4 '87.1 •93.9 Shipments. _______ . ______________ thousands .. 2, 421 1,077 1, 474 I, 582 1, 619 I, 549 I, 600 I, 711 Stocks, end of month ... ________________ do .... 29 47 37 39 39 48 37 40
Boilers, steel, new orders: Area. _________________ ------- thous. of sq. ft._ 9, 709 3, 522 2, 339 2. 560 I, 586 2, 270 I, 411 I, 747 Quantity ________ .. ___ ----------- ... number .. 2,824 1, 294 1, 336 I, 372 1, 415 1, 601 1, 246 I, 131
Furniture, steel: Office furniture:
Orders, new ________________ thous. of doL ___ 3, 751 5,050 3, 889 4, 667 5, 851 4, 981 4, 598 3, 932 Orders, unfilled, end ofmonth ........ do .... 5, 530 5, 330 5, 210 5, 579 7, 335 7, 939 8,085 7, 786 Shipments ________ ------------_·----- .do ... _ 4, 560 3, 821 4,010 4, 298 4,095 4, 349 4,452 4, 314
Shelving: Orders, new __ --------------- _________ do ____ 1, 510 1, 204 1, 346 1, 278 1, 525 1, 182 999 I, 284 Orders, untilled, end of month ....... do .... 1,870 1,103 1. 383 I, 454 1, 850 I, 932 I, 765 2, 022 Shipments. ________________________ .. do ... _ 1,130 929 I, 066 I, 207 I, 130 1, 082 1, 166 1, 027
Porcelain enameled products, shipmentst thous. of doL. --------· 5, 310 5,456 5,491 5, 511 5,608 5, 807 5,802
Spring washers, shlpments•--------------do .... 341 320 331 355 375 366 338 348 Steel products, production for sale:t
TotaL __ ..... ____________ thous. of short tons .. 5, 273 5, 046 4, 942 5, 085 4, 754 4, 919 5, 234 5,059 Merchant bars ...... _______________ . .do .. __ 563 463 470 471 439 443 447 431 Pipe and tube ________________________ do .... 465 436 453 461 449 480 485 464 Plates __ .. _________________________ ... do. ___ 838 454 445 479 466 482 532 519
Percent of capacity* ______________________ 139. 5 87.0 88.0 91.9 92.2 90.6 99.7 112.2 Rails .. ________________ thous. of short tons .. 171 177 194 185 168 151 146 127 Sheets, totaL._ ----------------------do .... 857 1,177 1,148 I, 140 999 991 1,018 954
Percent of capacity _______________________ 77.7 107.3 107.8 103.9 93.8 90.4 92.4 88.5 Strip:
Cold rolled .......... thous. of short tons .. 82 102 104 107 102 99 106 104 Hot rolled .. ________ ----------- ..•. do ____ 119 155 144 160 154 137 130 134
Structural shapes, heavy _____________ do .... 392 374 383 406 373 366 391 372 Tin plate. ___________________________ do .... 264 252 265 287 292 332 360 325 Wire and wire products ______________ do .... 403 431 412 434 417 404 434 420
Track work, shipments _____________ short tons .. 14, 107 10,225 11, 751 11,012 11,210 10,642 10,236 10, 439
•Revised. ()Data for 1941 revised after a special survey of the industry; revision for Jan. 79. 7, Feb. 56, 7.
23.50 23.50 23.50 24.15 24.15 24.15 25.89 25.89 25.89 4, 856 4, 703 5,012 1, 655 1, 570 -------
2, 091 I, 133 1,115 3,483 I, 922 1,448
11,912 11,168 11, 182
29,461 21,104 19, 642 37,360 24,502 17, 380 97,896 93,669 92,998
8, 267 5, 787 6, 763 10,494 7, 695 7, 390 20, 154 18, 271 17, 567
74,581 52,605 41,343 101,609 93,966 80,844 69,972 58,810 55,856 73,988 60,248 54, 465 17, 5g9 16, 41I 17, 785
117, 516 84,534 ll3, 034 100.4 72.2 96.5
32.935 16,549 26,839 135, 272 104,605 131,518
ll5. 6 89.4 ll2. 4 49,891 33,383 45,640
r 7, 230 '6, 961 '7, 150 99 98 98
.0265 .0265 .0265
34.00 34.00 34.00 . 0210 . 0210 . 0210 18.75 18.75 18.75
I, 851 1, 624 1, 846
1, 850 I, 762 2, 047 1, 781 I, 586 1,859 •97. 6 '86.9 •101.9 1, 777 I, 604 I, 851
43 25 34
I, 341 3, 755 1, 929 957 I, 310 997
3, 896 3,422 4,612 7, 329 6, 840 7,105 4, 352 3, 912 4, 338
987 858 858 I, 837 1, 678 I, 365 I, 173 I, 016 1,058
6,208 5, 371 5,598 321 276 292
5, 471 4, 909 5,144 503 456 490 531 415 484 587 564 629
124. I 122.8 132.6 161 135 144
1.053 945 889 94.1 87.5 80.1
110 101 106 136 140 13.1 407 381 369 342 323 367 432 396 398
12,403 11, 711 12,247
I
23.50 24.15 25.89 4, 971
----- ---
732 1,484
10,146
18,756 17,044 94,832
6, 717 6,175
18,106
42,781 72,366 50,557 51,259 17, 212
!50. 55! 128.6
35. 723 134. 778
115.2 46, 357
'7, 125 95
.0265
34.00 .0210 18.75
I, 739
'2, 149 I. 952
'!07. 0 •1,954
'36
2, 842 I, 012
4,490 7. 335 4, 236
1,082 I, 405 I, 042
5,143 290
5,170 511 446 700
118.2 133 895
81.7
101 138 403 317 407
10,266
23. 24. 25.
'4, 5
50 15 89 02
--. --
7 1.4 9.4
54 08 9:l
17,7 73 81 25
19,0 93,5
6.1 99 81 24
6 -,I
17,5
53.8 09 90 17 85 44
77, I 49.2 48. 9 17,4
179,8 80 153. 7
09 26 3
13
54,4 133,7
114. 4.1, o '6, 5' 21
96
. 02 65
00 10 i5
34. . 02 18.
1,6 17
2. 2' 30 45
I 48 34
I. 8 101. 1,8
2, 3 71 35 >1,0
3.1 6. 3 4, I
94 40 88
1,0 1.4
94 90
994
5. 2 2
4, 7 4 4 i
89 95
62 85 19 26 8 134.
I 7 22 65
77.
I 3,
83 19 54 61 52 50
2 3,
1a. 6.
,Data for 1941 include cast-iron convectors and convector-radiators. Data for these items are included in part in earlier figures published in the Survey; 1940 data revised to include these items for all reporting firms will be published later.
•Data cover 9 firms beginning December 1941; the increase in reporting firms from 7 to 9 in late 1941 did not materially affect the coverage of the data. tMonthly data beginning 1929, corresponding to the monthly averages on p. 132 of the 1940 Supplement, appear on p. 18 of the April1940 Survey. §Be~inning January 1942, percent of capacity is calculated on annual capacity as of December 31, 1941, of 88,566.170 tons of open-hearth, Bessemer, and electric steel ingots
and steel for castings; data for July-December 1941 are based on capacity as of June 30, 1941 (86, 144,990 tons), and earlier data on capacity as of December 31, 1940. tRevised series. Data on pig-iron production beginning 1913 are shown iu table 38, p. 14, of the October 1940 issue. For data ou steel production beginning 1917 and
percent of capacity beginning 1926 through 1939, see table 9, p. 16, of the March 1941 issue; for revisions in 1940 data, seep. 49 of the June 1941 issue; 1942 production re,·isions, January 6,922; February 6,230. Porcelain-enameled products revised beginning 1939 to include data for 99 manufacturers; for 1939 data, seep. 49 of the March 1941 issue. For steel products, production for sale beginning 1933, see table 45, p. 14, of the November 1940 issue.
*Earlier data on pig-iron stocks and earlier data on percent of capacity for steel plates not shown in the September 1941 Survey will be published in a subsequent issue.
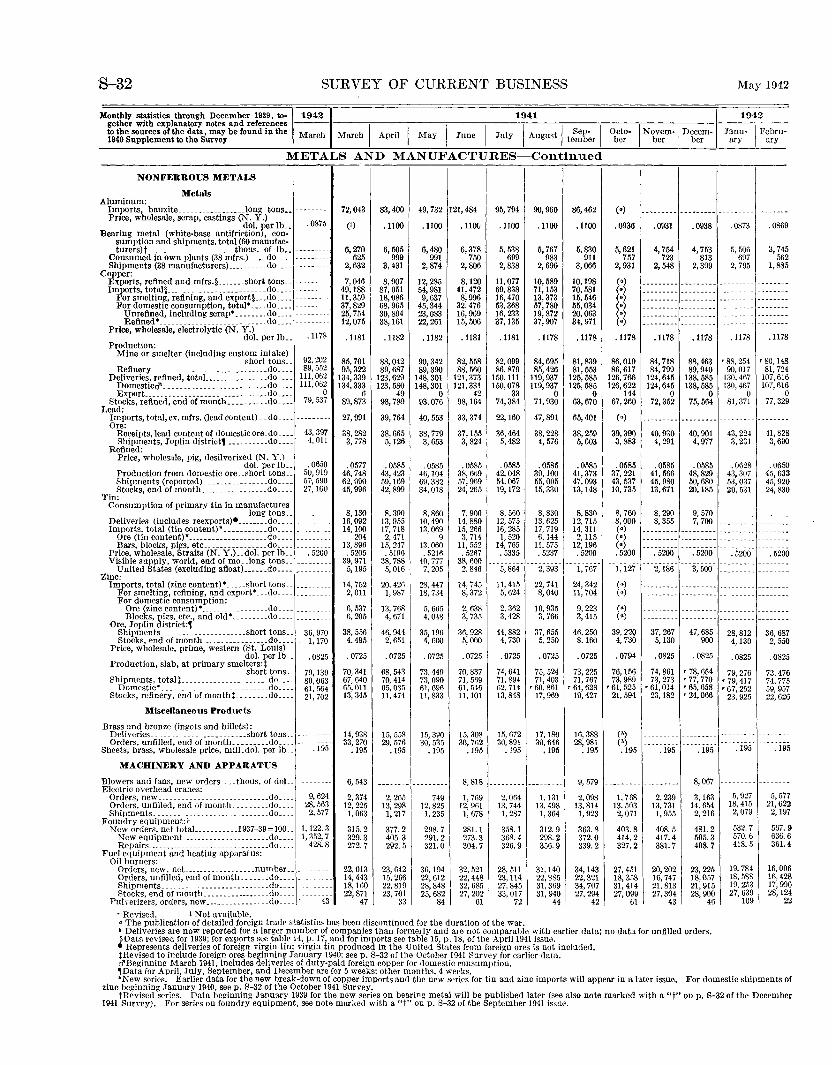
S-32 SURVEY OF CURRENT BUSINESS May 1942
Monthly statistics through December 1939, to-~19421 1941 I 1942 gether with explanatory notes and references --- ----,-----,-----,-------,,-------,----,.-----,-----.---------.--- -to the sources of the data, may be found in the March March I April I May I June I July I August I Sep- I Octo- I Novem-1 Decem- Janu- I Febru-1940 Supplement to the Survey tember ber ber ber ary ary
NONFERROUS METALS
Metals Aluminum:
METALS AND MANUFACTURES-Continued
I
Imports, bauxite _________________ long tons •• --------- 72,043
(')
83,400 49,732 121,484 95,794 90,960 86,462 (•) --~------
___ ,. __ .,. __ - -------Price, wholesale, scrap, castings (N. Y .) .
0875 dol. per lb .. Bearing metal (white-base antifriction), con
sumption and shipments, total (60 manufac-turers)t ______________________ thous. of lb .. ---------
Consumed in own plants (38 mfrs.). __ .do ____ ---------Shipments (38 manufacturers) __________ do ___ _
.Copper: Exports, refined and mfrs.§ ....... short tons .. -------Imports, total§ _______________________ .. do .. __ --------
For smelting, refining, and export§ ... do ____ --------For domestic consumption, total• ____ do ____ ---
Unrefined, Including scrap* ________ do ____ --Refined* ___________________________ do ____ --
Price, wholesale, electrolytic (N.Y.) dol. per lb.. .1178
Production: Mine or smelter (including custom intake)
short tons._ Refinery _________________________ .... do ....
Deliveries, refined, totaL _______________ do ___ _ Domesticd' .. ------------------_ ..... do ___ . Export.._ .. _ .. __ .. _____ .. __ .••. _ •. _ •. do .•..
Stocks, refined, end of month .......... do .... Lead:
92,202 89,552
111,062 Ill, 062
0 79, 537
Imports, total, ex. mfrs. (lead content)_ .do ____ --------Ore:
Receipts, lead content of domestic ore. do ___ . 43, 397 Shipments, Joplin district1-----------do.... 4, 011
Refined: Price, wholesale, pig, desilverized (N.Y.)
dol. per lb .. Production from domestic ore .. short tons .. Shipments (reported) ________________ do ___ _ Stocks, end of month _________________ do ___ _
rrin: Consumption of primary tin in manufactures
long tons. __ Deliveries (includes reexports)• ________ do .... _ Imports, total (tin content)* ___________ do _____ _
.0650 50,919 57-,590 27,160
Ore (tin content)• ____________________ do .... ________ _ Bars, blocks, pigs, etc ________________ do ... .
Price, wholesale, Straits (N. Y.) .. dol. per lb_. . 5200 Visible supply, world, end of mo .. long tons. _________ _
United States (excluding atloat) ...... do .... ________ _ Zinc:
Imports, total (zinc content)• _____ short tons ____ _ For smelting, refining, and export• ... do. _______ _ For domestic consumption:
Ore (zinc content)• _________________ do ____________ _ Blocks, pigs, et~ .• and o!d•. _______ .do ___________ _
Ore, Joplin district:, Shipments ______________________ short tons.. 36,970 Stocks, end ofmonth _________________ do____ I, liO
Price, wholesale, prime, western (St. Louis) dol. per lb.- . 0825
Production, slab, at primary smelters:t short tons._
Shipments, totaH. ___________________ .. do .... Domestic* ___________________________ do ___ _
Stocks, refinery, end of montht .. _____ .do ....
Miscellaneous P.-oducts
Brass and bronze (ingots and billets):
79,139 80,063 61,564 21,702
6,270 625
2,632
7,046 49,188 11,359 37,829 25,754 12,075
.1181
85,701 95,322
134,339 134,333
6 89,873
1
2
27,99
38,28 3, 778
7
6
.057 46,748 62,090 45,99
2 8,130
16,09 14,100
20 !3,89 . 520
39,97
4 6 5 I
5,19 5
2 14,75 2, 01
6, 53 6,20
38,55 4.49
I
7 5
6 5
.072 5
70,34 67,64 65,01 13,34
I 0 I 5
Deliveries _______________________ short tons __ - 14,93 8 Orders. unfilled, end of month ......... do____ 33,27
Sheets, brass, wholesale price, milL dol. per lb._ .195 .19 0
MACHINERY AND APPARATUS
Blowers and fans, new orders .... tbous. of doL. Electric overhead cranes:
Orders, new _______________ . ____________ do ... _ Orders, unfilled, end of mmlth. ______ .. do __ ._ Shipments. _______ -------------------- _do ___ _
Foundry equipment:t New orders, net totaL _________ 1937-39=!00 ..
New equipment. ....... ______________ do ___ _ Repairs ____________________________ ..• do ... _
Fuel equipment and heating apparatus: Oil burners:
9,624 28, 563 2, 577
1, 122.3 I, 352, 7
428.8
Orders, new. net_ _________________ number •. __ Orders, unfilled, end ofmonth ....... do .... _ Shipments. ________ -------------- __ .. do ... -Stocks, end ofmonth _________________ do ___ _
Pulverizers, orders, new ________________ Qo ____ ,- 43
' Revised. I Not available.
5
6, 54 3
4 2, 37 12,22 I, 06
5 3
315. 329. 272.
2 3
22,01 14,44 18, 16 22,87
4
7
3 3 0 I 7
.1100 .1100 .1100 .1100
6,505 6,480 6,378 5,538 999 991 750 699
3, 431 2,874 2,806 2,8.38
8,907 12,285 8,120 11,077 87, 051 54,981 41,472 69,838 18,086 9,637 8,996 16,470 68,965 45,344 32.476 53,368 30,804 23,083 16,969 !6, 233 38,161 22,261 15,506 37,135
.1182 .1182 .1181 .1181
88,042 90,342 82,558 82,099 89,687 89,390 88,560 86,879
123,629 148,301 121,373 150, Ill 123,580 148,301 121,331 !50, 078
49 0 42 33 98,789 93.076 98,164 74,384
39,764 40,553 33,374 22,160
38,605 38,779 37,155 36,464 5,126 3,653 3, 824 5,482
.0585 .0585 .0585 . 0585 43,423 46, 104 38, 6o9 42,048 59, !69 69,382 57,969 54,067 42,899 34,018 24,265 19, 172
8,390 8.860 7, 900 8, 560 13,955 10,490 14,880 12,575 17, 718 13,069 15,266 16,285 2, 471 9 3, 714 1, 520
15,247 !3, 060 11,.552 14, 765 . 5196 . 5216 . 5267 . 5335
38,788 40, 777 38,600 --5,016 7, 205 2. 846 5,864
20,426 28,447 14, 745 11,415 !, 987 18,734 8, 372 5,624
13, 768 5, 665 2, 638 2, 362 4, 671 4,048 3, 735 3,428
46,944 3.5, 196 36,928 44,882 2.651 4, 600 5,000 4, 730
. 0725 . 0725 .0725 .0725
68,543 73,449 70,837 74,641 70, 4!4 73,090 71,569 71,894 65,035 61,696 61.546 62,714 11,474 11, 833 11, 101 13,848
15, 558 !.5, 390 15. 308 15,672 29, 576 30,535 30,762 30,891
.195 .195 .195 .195
-------- --------- 8,818 ---------2,265 749 1, 769 2. 064
13, 29R 12,825 12,961 13.741 I, 217 1, 235 I, 678 1, 287
377.2 298.7 281.1 358.1 405.3 291.2 273.3 368.4 292.5 321.0 304.7 326.9
23,642 36,194 32,521 28, 511 15,266 22,612 22,448 23,114 22,819 28,848 32,685 27,845 23,701 25,682 27,202 33,017
33 84 61 72
• The publication of detailed foreign trade statistics has been discontinued for the duration of the war.
.1100 .1100 .0936 .0931 .0938
5, 767 5. 830 5,621 4, 754 4, 753 983 911 757 723 813
2,696 3,066 2,931 2,548 2,399
10,589 10,198 (•) --------- ---------71, !53 70,581 (•) --------- ---------13,373 15,546 (•) --------- ---------57,780 55,034 (•) --------- ---------19,872 20,063 (•)
~-------- ---------37,907 34,971 (•) --------- ---------
.1178 .1178 .1178 .1178 .1178
84,695 81,839 86,019 84,718 88,463 85,426 81,553 86,617 84,799 89,940
119,937 125,585 126,766 124,645 138,585 119,937 125,585 126,622 124,645 138,585
0 0 144 0 0 71,930 63,670 67,260 72,352 75,564
47,891 65,401 (•) --------- ---------38,228 38,259 39,390 40,93() 40,901 4, 576 5,603 3, 883 4,291 4, 977
. 0585 .0585 .0585 .0585 .0585 39,100 41,373 37,221 41, 566 48,829 55,005 47,093 43,537 45,980 50,680 15, 330 13,148 10,735 13.671 20.185
8, 830 8,830 8, 760 8, 290 9,570 13,625 12,715 8,000 8, 355 7, 700 17, 719 14, 311 (•) --------- ---------6,144 2,115 (•) --------- ---------
11. 575 12, 196 (•) --------- ---------. 5237 . 5200 . 5200 . 5200 . 5200
--------- ---- ---- ---2;iii6-2, 393 I, 767 1, 127 3,500
22,741 24,342 (•) --------- ---------8,040 11,704 (•) --------- ---------
10,935 9, 223 (•) --------- ---------3, 766 3, 415 (•) --------- ---------
37.655 46,250 39, 22& 37,267 47,685 5, 250 8.160 4, 73 5, !30 900
.0725 . 0725 .0794 .0825 .0825
75,524 73,225 76,156 74,861 '78, 654 71,403 71,767 73,989 73,273 '77, 770
•60, 861 '64, 623 '61, 525 '61,014 • 65,658 17,969 19,427 21,594 23,182 '24,066
17,180 16,388 (b) --------- ---------30,646 28,981 (b) --------- ---------
.195 .195 .195 .195 .!9!i
--------- 9, 579 --------- --------- 8,067
1, 131 2,098 1, 768 2. 239 3,163 13.498 13,814 13,503 13,731 14,654 I, 364 1, 923 2,071 I, 955 2, 216
312.9 363.8 403.8 408.5 481.2 298.2 372.0 414.2 417.4 505.3 356.9 339.2 327.2 381.7 408.7
31,140 34, 143 27,451 20,202 23,225 22,885 22,321 18,358 16,747 18,057 31.369 34,707 31,414 21,813 21,915 31,940 27,294 27,099 27,304 28,900
44 42 61 43 46
• Deliveries are now reported for a larger number of companies than formerly and are not comparable with earlier data; no data for unfilled orders. ~Data revised for 1939; for exports see table 14, p. 17, and for imports see table 15, p. 18, of the April1941 issue. • Represents deliveries of foreign virgin tin; virgin tin produced in the United States from foreign ores is not included. tRevised to include foreign ores beginning January 1940: seep. S-32 of the October 1941 Rurvey for earlier data. d'Beginning March 1941, includes deliveries of duty-paid foreign copper for domestic consumption. ,Data for April, July, September, and December are for 5 weeks; other months, 4 weeks.
.0873
5, 506 697
2, 795
------------------------------------------------------
.1178
'88, 254 90.017
130.467 130,467
0 81,371
---------43,224 3,231
.0628 43,307 53,037 20, 53!
---------------------------------------------
. 5200 ------------------------------------
------------------
28,812 4,130
.0825
79,276 '79,417 '67, 252
23,925
----------------
.195
-------
5, 927 18,415 2,079
532.7 570.6 418.5
19,784 18,588 19,253 27,639
109
--------.0869
3, 745 562
1,885
------------------------------------------------
.1178
'80, 148 81,724
107,616 107,616
0 77,329
--------
41,82 3,690
.065 0 3 0 0
45,63 45,92 24,83
-----------------------· ----------------
. 520 0 ----------------
----------------
----------------
36,68 2, 55
7 0
.082
73,47 74,77 59,95 22,62
--------------
6 5 7 6
.19
-------
5,57 21,62 2,19
567. 636. 361.
7 2 7
9 6 4
16,00 6 8 6 4 2
16,42 17,99 28,12
2
•New series. Earlier data for the new break-down of copper imports and the new series for tin and zinc imports will appear in a later issue.. For domestic shipments or zinc beginning January 1940. seep. S-32 of the October 1941 Survey.
tRevised series. Data beginning January 1939 for the new series on bearing metal will be published later (see also note marked with a "t" on p. S-32 of the December 1941 Survey). For series on foundry equipment, see note marked with a "t" on p. S-32 of the September 1941 issue.
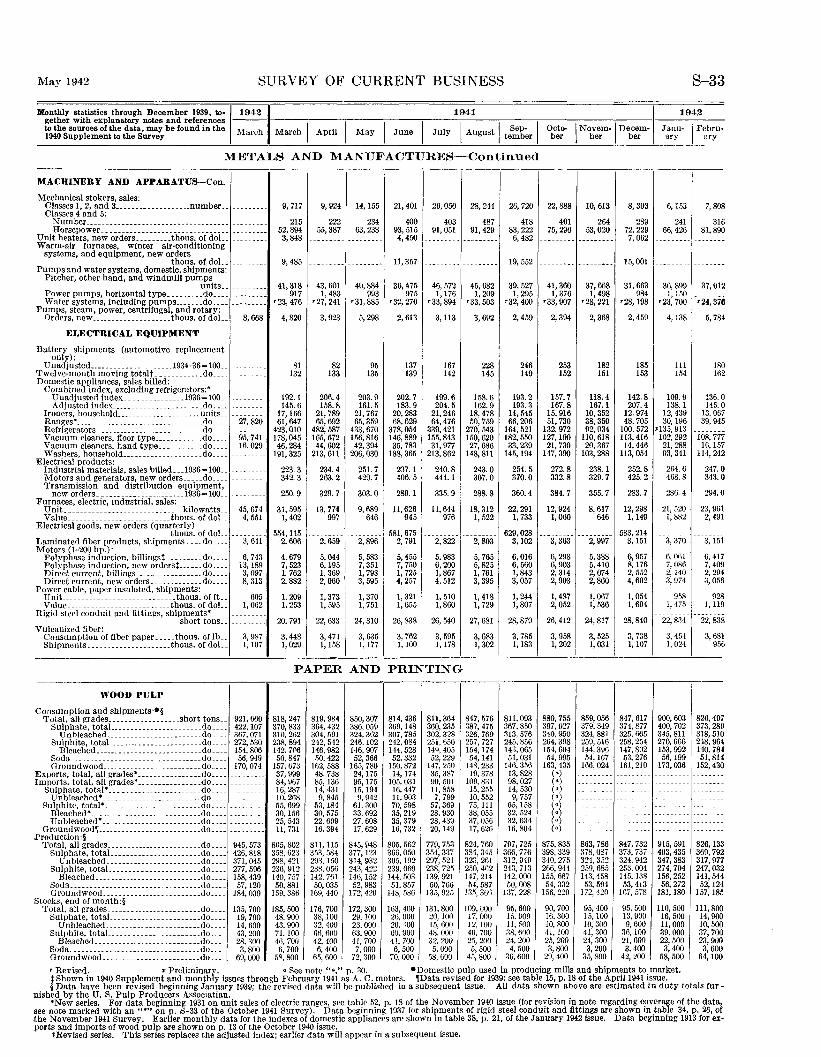
May 1942 SURVEY OF CURRENT BUSINESS S-33
Monthly statistics through December 1939, to-,19421 1941 I 1942 gether with explanatory notes and references ---1----,----,----,----,-----=----~--~---~--~---l----,----to the sources ofthe data, may be found in the March March I Apri"l I May I June I July I A t I Sep- I Octo- I Novem-1 Decem- Janu- I Febrn-1940 Supplement to the Survey ugus tember ber ber ber ary ary
METALS AND MANUFACTURES-Continued
MACHINERY AND APPARATUS-Con.
Mechanical stokers, sales: Classes 1, 2, aud 3-------------------number .. ________ _ Classes 4 and 5: Number ____________________________________ -----·---
Horsepower __ ------------------------------ ________ _ Unit heaters, new orders _________ thous. of doL. _______ _ Warm-air furnaces, winter air-conditioning
systems, and equipment, new orders thous. of doL _______ _
Pumps and water systems, domestic, shipments: Pitcher, other hand, and windmill pumps
units .. ---------Power pumps, horizontal type _________ do ____ ---------Water systems, including pumps _______ do ____ ---------
Pumps, steam, power, centrifugal, and rotary: Orders, new ____________________ thous. of doL. 8,668
ELECTRICAL EQUIPMENT
Battery shipments (automotive replacement only):
Unadjusted _____________________ 1934-36=100 ________ _ Twelve-month moving totalt ____________ do____ _ _____ _ Domestic appliances, sales billed:
Combined index, excluding refrigerators:* Unadjuste<l index. ______________ 1936=100 _________ _ Adjusted index _______________________ do ____ . _______ _
Ironers, household ___________________ .. units. _________ _ Ranges* _______________________________ .do____ 27,820 Refrigerators ____ -------------- ________ .do ___________ _ Vacuum cleaners, floor type ____________ do____ 95,741 Vacuum cleaners, hand type ___________ do____ 16.029 Washers, household _____________________ do ____ ---------
Electrical products: Industrial materials, sales billed __ .1936= 100. __ - . ___ _ Motors and generators, new orders _____ do ___ _ Transmission and distribution equipment,
new orders ______________________ 1936=100 .. ---- ___ _ Furnaces, electric, industrial, sales:
Unit ______________________________ kilowatts__ 45,674 Vahw __________________________ thous. of dol_ 4,551
Electrical goods, new orders (quarterly) thous. of doL _____ _
Laminated fiber products. shipments. ___ do____ 3, 641 Motors (1-200 hp.):
Polyphase induction. billingst.------- do ___ _ Polyphase induction, new orderst ______ do ___ _ Direct current, billings _________________ do ___ _ Direct current, new orders _____________ do ___ _
Power cable, paper insulated, shipments:
6, 743 13,189 3,097 8, 313
Unit _____________________________ thous. offt._ 605 Value .. ________________________ thous. of doL 1,062
Rigid steel conduit and fittings, shipments• short tons ____ _
Vulcanized fiber: Consumption of fiber paper. ____ tho us. oflb__ 3, 9R7 Shipments _____________________ thous. of doL. 1, 107
WOOD PULP
ion and shipments••§ Consumpt Total, all
Sulpha Unhl
Sulphit Bleac
Soda __ Ground
Exports, to Imports, to
Sulphate
grades _________________ .short tons .. te, totaL ____________________ .do .. __ eached _______________________ .do .. __ e, total _______________________ do ____ hed ___________________________ do ____
_______________________________ do_. __ wood ________________________ do ___
tal, all grades* ________________ do ____ tal, all grades• ________________ do ____ , total* ___________________ ... .do ____ ched* _________________________ do ____ Unblea
Sulphite, Bleache Unblea
Groundw .Production
Total, all Sulpha
Unbl Sulphit
Bleac
total* ______________________ .. do ____ d* ____________________________ do ____
ched* ________________________ .do. ___ ood, __________________________ do. ___ :§ grades. ______ ------ __________ .do. ___
te, totaL ______________________ do ____ eached. _______________________ do. ___ e, totaL ______________________ do .. __ hed. __ . ________ -------- ______ .do ____
Soda __ _ --------------------· _________ do ____ !wood _________________________ do ____ Grounc
Stocks, end Total, all
Sulphat Unbl
Sulphit Bleac
of month:§ grades. ______________________ .do ____ e, totaL ______________________ do ____
eached ____________ . _________ .. do. ___ e, totaL ______________________ do. ___ bed. ________________________ .. do. ___
Soda __ _ ------------------------------do ____ Ground wood ________________________ .do. ___
921,660 422,107 367,071 272,530 154,806 56,949
170,074 ---------- -- --·
-- -----------
-- --------- -------- -------- -- --
945,573 426,818 371, 045 277,596 158,439 57,120
184, 039
135, 700 19,700 14,600 43,200 28,300 3,800
69,000
9, 717
215 52,894 3,848
9,485
41,318 917
•23, 476
4,820
81 132
192.1 145.6
17,166 61,647
423,010 178,045 46,284
191,325
223.3 342.3
250.9
31, 595 1,402
554,115 2,606
4,679 7, 523 1, 762 2, 882
1, 209 1, 253
20,791
3, 448 1, 029
9, 924 14, 155
222 234 55, 387 63, 238
43,601 1,483
•27, 241
3, 923
82 133
206.4 158.8
21,789 65,692
482,587 165, 672 44,602
213,611
234.4 263.2
329.7
13, 774 997
40,884 993
•31, 885
5, 298
95 135
203.9 161.5
21,767 65,359
433,670 156,816 42,394
206,030
251.7 429.7
303.0
9,689 646
21,401
400 93,515 4,450
11, 357
36,475 975
•32, 270
2,613
137 139
202.7 183.9
20,283 68,629
378,054 146,889 35,783
188,365
237.1 406.5
289.1
11,626 945
26, 050 28, 244
403 487 91,051 91, 429
46,572 1,176
'33, 894
3, 113
167 142
199.6 204.5
21,246 64,476
339,421 155,843 31,977
213,862
240.8 444.1
335.9
11,644 976
45,682 1, 209
'33, 503
3, 692
228 145
158.6 162.9
18,478 50,759
270,543 150,620 27,686
148, 811
243.0 307.0
288.8
18,312 1, 522
·- 581,675 -- ---- ---------2,659
5,044 6, 195 1, 369 2, 060
1,373 1, 595
22,633
3. 471 I 1,158
2, 896 2, 791 2, 822
5, 583 7, 351 1, 793 3, 595
1,370 1, 751
24.310 I 3, 635 1,177
5, 455 7,7-'0 1, 725 4, 257
1,321 1,655
26,838
3, 762 1,100
5, 983 6, 200 1,867 4, 512
1, 510 1,860
26,540
3, 595 1, 178
2,803
5, 765 5,825 1, 761 3,395
1, 418 1, 729
27,681
3, 683 1, 302
PAPER AND PRINTING
818,247 819,984 850,307 814.436 811,364 847,576 370,833 364,432 386,059 369,148 360,235 387,475 310,262 304,591 324,362 307,785 302,328 326,769 238,894 242,542 246, 102 242,084 251, 650 257,727 142.706 146,982 146,907 144,528 149,405 154,174 50,847 f>O, 422 52,366 52,332 52,229 54,141
157, 673 162,588 165, 780 150,872 147, 250 148,233 37,999 48.738 24,175 14,174 35,387 19,378 84,967 85,136 95,175 105, 031 90,501 109,831 16,287 14,431 15,194 16,447 11, 8.58 15, 255 10,268 9,845 9, 942 11,903 7, 799 10,552 55,699 53,184 61,300 70,598 57,369 75, 111 30, 156 30,575 33,692 35,219 28,930 38,055 25, 543 22,609 27,608 35,379 28,439 37,056 11,731 16,394 17,629 16,732 20, 149 17,626
805,802 811,115 845,948 805,562 779,753 824,760 358, 62:l 3,>3, 584 377, 123 366,050 354, 337 384,345 298, 421 29~. 150 314,932 305, 192 297, 521 328, 261 236, 912 238,056 243, 422 239,069 238, 725 2.)0, 462 140, 757 142, 76! 146, 152 144, 503 139,921 147,214 50,881 50,035 52,983 51,857 50,766 54,587
159,386 169, 440 172, 420 148, 586 135, 925 135,366
185,500 176,700 172,300 163,400 131,800 109,000 48,900 38,100 29,100 2t\, 000 20, 100 17,000 43,900 32, 400 23,000 20, 100 15,600 12,100 71,100 fi6, 600 63,900 GO, 900 48, 000 40, 700 4G, 700 42, 400 41,700 41,700 32, 200 25, 200 6, 700 6, 400 7, 000 6, 500 5, 000 5, 500
58,800 65, 600 72, :Joo 70,000 58, 600 45,800
26, 720 22, 888 10, 613
418 83,222 6,482
19,552
401 264 75, 296 53, 020
39, 527 41,360 37, 668 1, 295 1, 376 1, 498
'32, 400 '33, 907 '28, 221
2,459
246 149
193.2 193.3
14,545 66,206
164, 521 182,550 33,239
145,194
254.5 370.0
360.4
22,291 1, 733
629,028 3,102
6,016 6, 560 1,843 3, 057
1, 244 1,807
28,879
3, 785 1,183
811.093 367,850 313,576 245,856 143,065 51,031
146,356 13,828 98,027 14, 530 9, 757
65,158 32, 524 32,634 16,804
797,725 366,776 312,949 243, 713 142,000 50,008
137, 228
95,600 15.900 11, 500 38,600 24,200 4, 500 I
36,600
2, 394
253 152
157.7 167.8
15,916 51,730
132,972 127,190 21,730
147,390
272.8 332.8
384.7
12,924 1,060
3,363
6, 298 6, 903 2,314 2, 903
1, 487 2,052
26,412
3, 958 1, 202
880,755 397,927 340,950 264,398 154,604 54,995
163, 435 (a) (a) (a) (a) (a) (a) (a) (a)
875,835 398,339 340,275 266,944 155, 667 54, 332
156, 220
90,700 Hl, 300 10,800 41,100 25, 200 3, 800
29, 400
2,368
182 151
118.4 167.1
10,352 38,350 92,034
110,618 20,367
103,288
238.1 329.7
355.7
8,617 646
2, 997
5,388 5,410 2, 074 2,860
1,067 1, 536
24,817
3, 525 1, 031
859,056 379,349 324.881 259,516 144,396 54,167
166,024 --- -----
--------
----
--- ------------
----
863,786 378, 087 324, 352 259, 685 143, 458 53,594
172, 420
95,400 15,100 10,300 11,300 24, 300 3,200
35,800
8, 303
289 72,229 7, 062
15,001
31,663 984
'28,198
2,459
185 153
142.8 207.4
12.974 48,705
100,572 113,416 14,446
113,054
252.8 425.2
283.7
12,298 1,149
583,214 3,151
6, 957 8, 176 2,M2 4, 602
1,054 1,694
28,840
3, 738 1, 107
847, 617 374,877 325.665 258.254 147,802 53, 276
161,210 -----
-- --
6, 153 7, 808
241 316 66, 426 81, 890
36,899 37,012
'2~: ~~~ -; 24; 37o 4, 138 5, 78
111 154
109.9 138.1
12,439 30,196
>135, 91:l 102, 292 21,288 93, 341
264,6 468.8
286.4
21,520 1, 882
180 162
136.0 145.0
13,067 39,945
108,777 1G, 157
114,242
247,0 343.0
294.0
23,961 2, 491
3, 370 3, 151
6,061 6,417 7, 086 7, 409 2, 140 2, 294 3, 974 3, 056
958 928 1, 475 1, 119
22, 8:-!4 22, 838
3, 454 3, 681 1, 024 956
900,603 400,702 345, 811 270,666 153,992 56,199
173,036
-----------
826,497 373,289 318,510 248,964 140.784 51,814
152,430
·- --- ··-
---
847,732 373, 737 324,942 253,004 145,138 53,413
1f)7, 578
95,500 13,900 9, 600
36, 100 21, GOO 3, 400
42, 200
-------
915,591 403,435 347,383 274,704 156,252 56,272
181,180
110,500 16, 500 11,000 39,000 22,500 3, 400
58,500
826,133 36~. 792 317, 977 247,032 1 41,544 52,124 57,1811 1
1 11,800 14,900 10,500 37, 700 23,900
3, 600 64,100
'Revised. • Preliminary. a See note "a," p. 30. •Domestic pulp used in producing mills aud shipments to market. t Shown in 1940 Supplement and monthly issues through February 1941 as A. 0. motors. ,Data revised for 1939; see table 15, p. 18 of the April1941 issue. §Data have been revised beginning January 1939; the revised data will be published in a subsequent issue. All data shown above are estimated in dnty totals fur
nished by the U. S. Pulp Producers Associatian. •New series. For data beginning 1931 on unit sales of electric ranges, see table 52, p. 18 of the November 1940 issue (for revision iu note regarding coverage of the data,
see note marked with an "*"on p. S-33 of the October 1941 Survey). Data beginning 1937 for shipments of rigid steel conduit and fittings are shown in table 34, p. 26, of the November 1941 Survey. Earlier monthly data for the indexes or domestic appliances are shown in table 38, p. 21, of the January 1942 issue. Data beginning 1913 for exports and imports of wood pulp are shown on p. 13 of the October 1940 issue.
tRevised series. This series replaces the adjusted index; earlier data will appear in a subsequent issue.
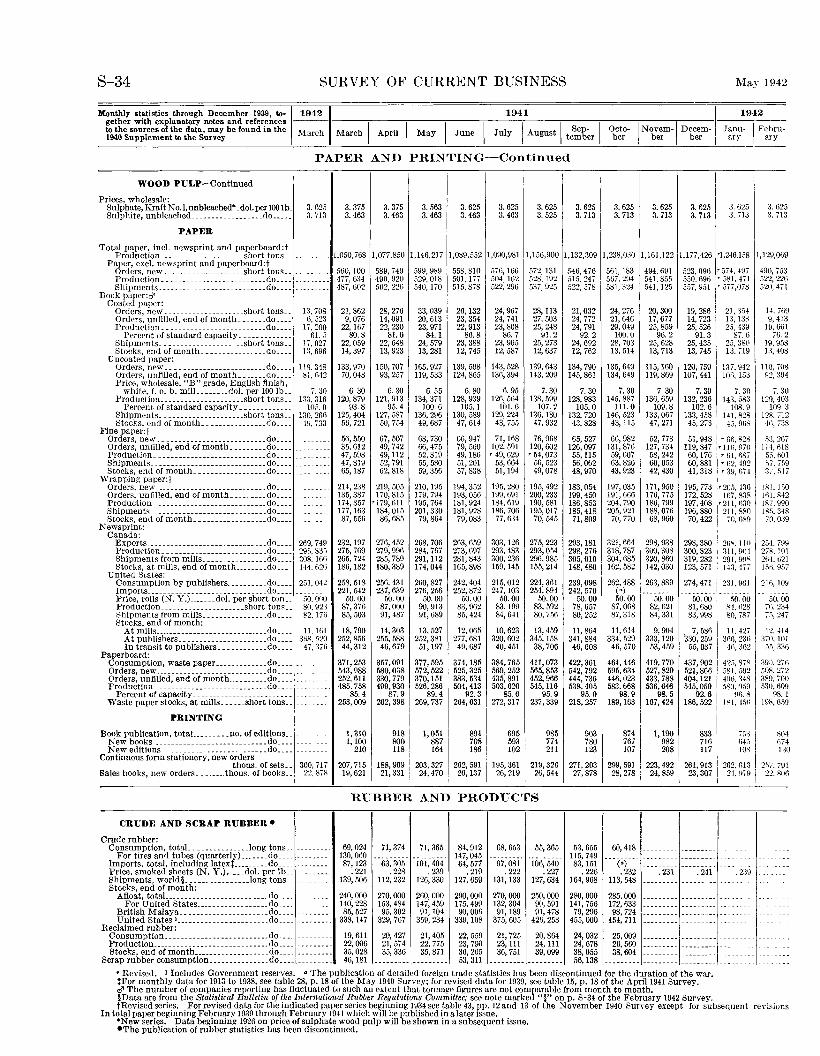
S-34 SURVEY OF CURRENT BUSINESS May 1942
Monthly statistics through December 1939, to-~19421 1941 I 1942 gether with explanatory notes and references ---
1 1 1 to the sources of the data, may be found in the March March I April May I June I July I August I teSmepb-er I Obcto- I Nobvem- Debcem- Janu- Febru-1940 Supplement to the Survey er er er ary ary ------------------------~----~--~----~--~----~--~----~--~----~--~----~---
PAPER AND PRINTING-Continued
WOOD PULP-Continued
Prices, wholesale: Sulphate, Kraft N o.l, unbleached• .dol. per 100 lb. 3. C~5 Snlphite, unbleached .................. do..... 3. 713
PAPER
3. 375 3. 463
3. 375 3.463
3. 563 3. 463
3. 625 3.463
3. 625 3. 463
3. 625 3. 525
3. 625 3. 713
3. 625 3. 713
3. 625 3. 713
3. 625 3. 713
3. ti:25 3. 713
3. 625 3. 713
Total paper, incl. newsprint and paperboard:t 1
Production _____________________ short tons _________ 1,050,768 1,077,S50 1,146,217 1,089,552 1,090,981 1,156,900 1,132,309 1,238,030 1,161,122 1,177,426 'i,246.lfi8 1,129,069 Paper, excl. newsprint and paperhoard:t
Orders, new ____________________ short tons .. _____ _ Production. _________________________ do ___________ _ Shipments __________________________ do .... ________ _
Book paper:ci' Coated paper:
Orders, new ____________________ short tons __ Orders, unfilled, end of month ....... do ... . Production .. ________________________ do ... .
Percent of standard capacity. ____ --------Shipments. ___________________ .short tnns .. Stocks, end of month.-----------· ___ do ___ _
Uncoated paper:
13,708 G, 523
17. 200 61. .\
17,027 13, 696
560, 100 477, 6:{4 487, 602
21,862 9,076
22,167 80.8
22,059 14, 397
589, 749 490,920 502, 226
28,276 14,091 22, 230
81.0 22,648 13,923
599,989 529,018 540, 170
33,039 20,613 23,971
84.1 24,579 13, 281
558, 810 501, 177 515,878
26, 132 23,354 22,913
86.8 23, 388 12, 745
576, 166 572, 131 504, 162 528, 192 522, 296 5:l7, 925
24,967 24,741 23,808
86.7 23,905 12,587
2R, 113 27,503 25, 248
91.2 25,273 12, 637
546,476 51.1. 247 522, 578
21,032 21,772 24,791
92.2 24, 692 12, 762
561,183 567. 294 581, 324
24, 276 21,646 29,049 100.0
28,703 13,514
494,691 541.8.55 541, 125
20,300 17,677 25,859
96.2 25,628 13,713
523, 09() '574, 497 550. G91l '581. 471 557,951 r 57/,0/8
19,286 14,723 25, 526
91.3 25, 435 13, 745
21' 3.54 13, J:l~ 25, -!39
87.6 25, 3x0 13. 719
490, 753 522, 226 520,471
14, 769 9, 413
w,6m 7fl. 2
19,958 n, 408
Orders,new _________________________ do ____ 119,348 133,970 150,707 165,927 !39,598 143,528 139,643 134,790 135,649 115,160 120,759 137,942 110.708 Orders, unfilled, end of month _______ do__ _ _ ~ 1,1..12 70, 048 93, 257 119, 533 124, 865 136, 394 143, 209 !45, 861 134, 649 119, 869 107, 441 lOG, 15:3 92, 394 Price, wholesale, "B" grade, English finish,
white, f. o. b. mi!L ........ dol. per 100 lb __ Production _____________________ short tons __
Percent of standard capacity ___________ _ Shipments. ____________________ short tons __ Stocks, end of month .. ______________ do ___ _
Fine paper:t
7. :JO 113.316
10:\.0 130, 26fl
49, 733
Orders, new _____________________ ...... do __________ _ Orders, unfilled, end of month. ________ do ___ _ Production ___ -------------------------do____ _ ____ _ Shipments_ ----------------------------do____ _ ____ _ Stocks, end of month __________________ do ___ _
Wrapping paper:t Orders, new ____________________________ do ___ _ Orders,unfi!led,endofmontb ________ do ________ _ Production __ --------------------------do____ . _ Shipments_--------------------- _______ do .... _ Stocks, end ofmontb __________________ do ______ _
Newsprint: CanadB:
Exports. ______ .. ------- ___ ......... _. _do .. __ Production._----------------- _______ do .... Shipments from mills ................ do ___ _ Storks, at mills, end ofmonth ........ do .. .
United Scates:
269,749 295, 83'> 308, IGfl 144, 62G
Consumption by publisbers .......... do ____ 251,042 Imports _______ ----- _____ ._. ________ .. do. ___ . __ Price, rolls (N. Y.) ....... dol. per short ton__ fiO. or.o Production _____________________ short tons__ 80.923 Shipments from mills ................ do____ 82, 176 Stocks, end of month:
At mills ....... ------ ________________ do ... . At publishers .. ____ .... ________ .... do ... _ In transit to publishers ............. do .. ..
Paperboard:
II, 161 3flR. .120
41,:176
Consumption, waste paper ............. do ____ .. __ . _ Orders, new_. __________________________ do ___ _ Orders, unfilled, end ofmonth .......... do .... _____ _ Production ___________________________ do .... _____ _
Percent or capacity ___ ... _________________ .. _ Waste paper stocks, at mills ....... sbort tons ..
PRINTING I
B~~J'~~~i~~t~~~:-~~~~~-~~--:~.----~~~:~.f-~~~~~~~::
1::: : _
New editions_. ________________________ do .... __ . ____ _ Continuous form stationery, new orders
thous. of sets .. 300,717 Sales books, new orders ........ thous. of books ..
1 22, 87R
CRUDE AND SCRAP RUBBER •
Crude rnbher: Consumption, totaL .............. Iong tons ......... ..
For tires and tubes (quarterly) ....... do .. .. Imports, total, including latex~-----_ ... do_._. Price, smoked sheets (N.Y.) .... dol. per lb .. Shipments, world§ ...... __________ long tons .. ---------Stocks, end of month:
Afloat, totaL ________________________ do ____ ---------For United States .................. do ___ _
British Malaya .. ____________________ do .... ---------Unit.ed States l _______________________ do .... ---------
Reclaimed rubber: Consumption. _____ --------------- ..... do ....... ___ .. . Production .. ____ . ___ ... _. _______ ._ ..... do. __ . Stocks, end of month ___________________ do .... ---------
Scrap rubber consumption ............... do ........... ..
6. 30 120,879
93.8 125, 404 56, 721
56,550 35,612 47,598 47,819 65, 187
214,238 135,387 174,357 177, H\3 87,556
232.197 275,769 265.724 186,182
2.18, 518 221, 542
50.00 87,376 85,503
18, 790 252,856 44,312
371,253 543,988 252,611 485,758
85.4 253,009
1, 310 I, 100
210
207,715 I 19,621 1
6. 30 121,913
95.4 127, 587 50, 754
67,507 49,742 49, 112 52,791 62,818
219, 505 170,815
'179, 6ll 184,015 86,685
276,452 279,996 285,789 180,389
256,431 237,639
50-00 87,000 91,487
14,303 255, 588 46,679
6. 55 134, 371
100-6 136, 296 49,687
68,730 66,475 52,819 55,580 59,356
210, 195 179, 794 195,764 201,330 79,864
268,706 284,767 291, 112 174,044
260,827 275,256
50.00 90,913 91,689
13, 527 252,381 51,197
357,091 377, 595 580, 038 572, ~22 330, 779 370, 151 499, 930 526, 286
87.9 ' 89.4 262, 398 1 269, 737
I
I
918 I 8001 118 '
I
1, 051 887 164
188, 909 : 203, 327 21,331 : 24,470
6. 80 128,939
105. I 130, 589 47,614
66,947 79, 560 49,186 51,201 57,838
194,352 193,056 181,924 181,928 79,083
263,659 273,697 281,843 165,898
242.404 252,872
50.00 83,962 85,424
12,065 277,681 49,687
374,185 525,325 383,534 504,413
92.3 264,631
894 708 186
6. 95 126, 564
101.6 129, 224 43,75.5
71,168 102. 591 '49, 629
53,664 51,194
195,280 199,591 184,619 186,706 77,634
303, 126 293,483 300,236 159,145
215,012 247, 103
50.00 83.199 84, 641
10,623 320,602 40,451
384,765 569,252 435,891 503,620
85.6 272,317
695 593 102
7. 30 138, 599
107.2 136, ISO 47,932
76,968 120,602 r 54,073
56, 523 49,078
195,492 200,233 190,581 195,017 70, 545
275,223 293,054 296,985 155,214
224, 361 254,894
50.00 83. 592 80,756
13,459 345, 158 38,706
411,073 565,853 452,966 545,116
95.9 237,339
985 774 211
262,591 [195, 361 I 219,326 26, 137 26, 219 \ 26, 544
RUBBER AND PRODUCTS
69,024 130,060 87,123
. 221 139,506
240,000 140,228 85,527
338, 147
19,611 22,006 35,028 46, 181
71, 374 71, 365
63, 30.\ . 228
112,232
270,000 153,484 95, 302
329, 767
20,427 21,574 35, 336
101, 404 . 239
126,330
260,000 147,459 91,104
359, 234
21,405 22,775 35,871
84,912 147,045 64,577
.219 127,659
290,000 175,499 90, OOR
339, 108
22,559 23, 790 36,265 53, 311
68, 653 55, 365
97,081 . 222
131, 133
270,000 132,304 91,189
375, 605
21,725 23, 111 36, 751
106, 540 .227
127,634
2.10,000 90,591 91,478
42U, 253
20,864 24, 111 39,099
7. 30 128,983
105.0 132, 720 43,828
65,527 126,097 55, 115 56,062 48,970
183,054 199,450 186, 853 185,418 71,809
293,181 29R, 276 305,010 148,480
239,098 242,570
50.00 78,657 80,252
11,864 341, 884 46,608
422,361 542,792 444,736 538.405
95.0 218,257
903 780 123
271,203 27,878
53, 655 115, 749 83,151
. 226 164, 968
280,000 !41, 756 79,296
455,000
24,032 24,678 38,055 .15,138
7. 30 145,887
111.0 146, 523 43, 115
66,982 131,876 59,607 63, 8Z6 43,923
197,035 191, 666 204,790 205, 921
70,770
321,664 318,787 304,685 162,582
262,488 (•) 50-00
87,068 87,318
11,614 334,529 46,570
464,446 595,634 446,023 583.668
98.9 189,163
7. 30 136, 659
109.8 133, 067
47, 271
52,773 127, 734 58,242 60,053 42,430
171,950 176, 775 186,799 188,076 68,960
298,938 300,308 320,860 142,030
263,889
50.00 82, 621 84,331
9, 904 333, 120 53,459
419,770 527,829 433,788 536,646
98.5 167, 424
7. 30 132,236
102.6 I 133, 458
45, 273
51,948 119,847 60,176 60,881 41,318
7. 30 143, 5S3
108.9 141.828
45. 968
r 6t), 828 "llli. 970 r 61, fiS7 ,. fi2. 492 r 39,674
195, 773 I', 20.1, 4313 172, 528 lfl7, 838 197,4081'2li, fi30 196, 880 211, 880 10, 422 I 7o. os9
I
' 298,380 I 300,823 319, 2s2 1
123, 57! 1
i
2fi:O.., 110 :lll, 904 291, ~~" 143.417
274,47! 1 231.Vul
50. 00 : 50. 00 81, 680 j SJ. 1128 83, 998 ! 80, 7S7
7, 586 1 11. 427 '330, 259 i 3M, 23G
55, 037 \ 4n, 362
437,902 I 425. 87R 521, 8661.581. 502 404, 121 -lOti. 348 545, 050 .580. 1);39
92_6\ YI\R 186,522 i I';J, j51i
I 874 1, 100 833 1 753
;g~ ~g~ m 1 ·;0~ 299, 591 1. 223, 492!261, 913 1 262. Iii 3 28,278 i 24,859 23,307 i 21, \179
60,418 --------
(•) . 232
113, 548
285,000 172,633 98,724
454, 711
. 231 . 241
25,009 --------- ---------26,560 --------- --------- ---
38,604 :::::::::1:::::::::.::::-'Revised. 1 Includes Government reserves. • The publication of detailed foreign trade statistics has been disrontinued for the duration of the war. ~For monthly data for 1913 to 1938, see table 28, p. 18 of the May 1940 Survey; for reviseu data for 1939, see table 15, p. 18 of the April1941 Survey. d' The number of companies reporting bas fluctuated to such an extent that tonnage figures are not comparable from month to month.
i. 30 129,403
109. 3 128, 712
4.11, 738
.):3, 267 I14,1H8 55, nO! .17, 7.19 37, .517
!SJ. 1 GO !Ill. 842 187,990 IS'i. 348 70,039
2ii4. 799 278.101 :?H4. 621 J.)H, n.17
:?IIi, 109
50.00 ';'!), 234 /.\ 247
I:?, ·±14 :!70, 101
.-)5, 331)
~g:), 27fi .)08. 272 :l:-<9. 700 5:l0, 609
us_ 1 19". 659
ll04 G74 13
2-~i. 791 22. k06
§Data are from the Statistiral Bulletin of the International Rubber Regulqtions Committee; see note marked"§" on p. S-34 of the February 1942 Survey. tRevised series. For revised data for the indicated paper series beginning 1934 see table 43, pp. 12 and 13 of the November 1940 Survey except for subsequent rnisions
In total paper beginning February 1939 through February 1941 which will be published in a later issue. *New series. Data beginning 1926 on price of sulphate wood pulp will be shown in a subsequent issue. •The publication of rubber statistics bas been discontinued.
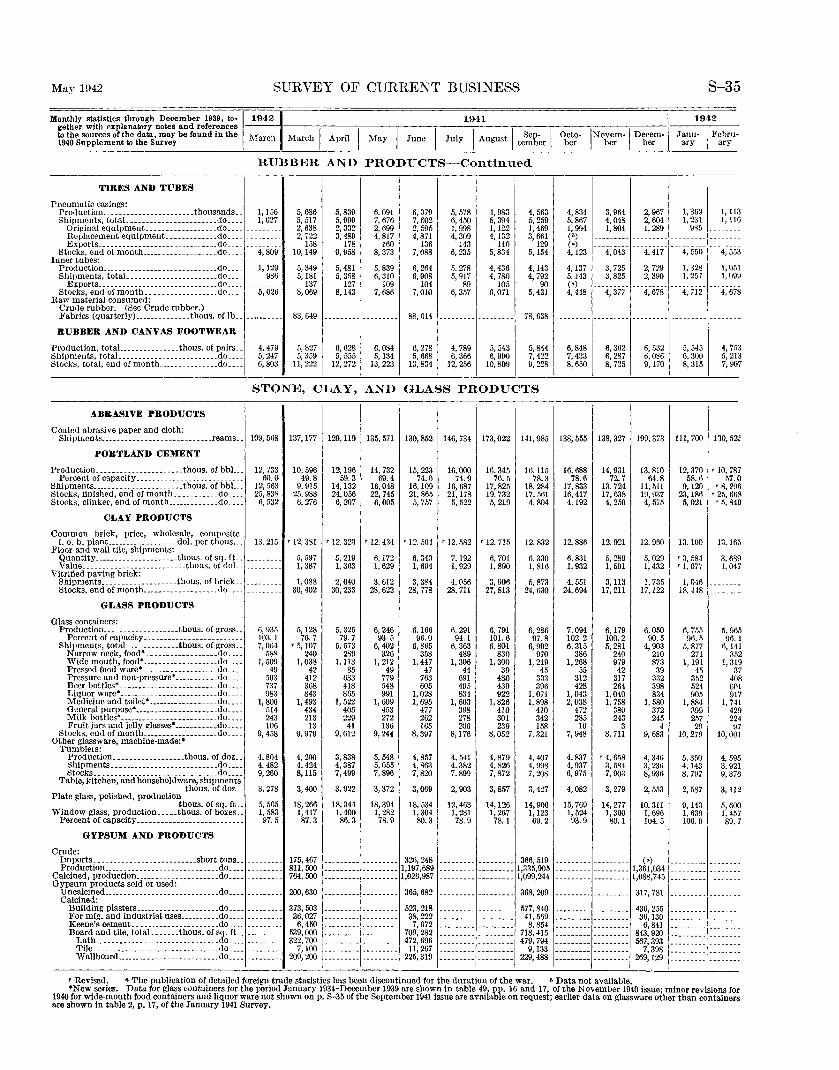
May 1942 SURVEY OF CURRENT BUSINESS
Monthly statistics through December 1939, to-~ gether with explanatory notes and references to the sources of the data, may be found in the 1940 Supplement to the Survey
1942
March March I April I May I June I
1941
I I Sep- I July August tember
RUBBER AND PRODUCTS-Continued
TIRES AND TUBES
Pneumatic casings: Production _______________________ thousands.. 1,!56 Shipments, totaL ______________________ do.... 1,027
Original equipment. ____ ---------- __ .do ... . Replacement equipment_ ____________ do ... . Exports ______________________________ do ____________ _
Stocks, end ot month ___________________ do____ 4,809 Inner tubes: Production _____________________________ do____ 1,129
Shipments, totaL ______________________ do.... 986 Exports ______________________________ do ___ _
Stocks, end of month. _________________ do.... 5, 026 Raw material consumed:
Crude rubber. (See Crude rubber.) Fabrics (quarterly) ______________ thous. of lb .. --··-----
RUBBER AND CANVAS FOOTWEAR
Production, totaL _____________ thous. of pairs .. Shipments, totaL ________________________ do ___ _ Stocks, total, end of month ....•..•....... do ....
4, 479 5, 247 6,803
5,686 5, 517 2, 638 2, 722
!58 10,149
5, 349 5, 181
137 8,069
83, 649
5, 827 5, 359
11, 222
5, 839 6. 091 5, 999 7, 676 2, 332 2, 699 3, 489 4, 817
178 160 9, 958 8, 373
5, 481 5, 839 5, 358 6, 310
127 109 8, 143 7, 686
6, 628 5, 555
12,272
6,084 5,134
!3, 223
6, 379 7,602 2,595 4,871
136 7,088
6, 264 6, 908
104 7,010
88,614
6, 278 5, 668
13. 834
5, 578 4, 983 6, 450 5, 394 I, 998 I, 122 4, 309 4, 132
143 140 6, 235 5, 834
.5, 278 4, 436 5, 917 4, 780
89 105 6, 357 6, 071
4, 789 6, 366
12, 256 5, 5431 6,990
10,809
4, 563 5, 259 1,469 3, 661
129 5,154
4,143 4, 792
90 5, 431
7R, 638
5,844 7,422 9, 228
STONE, CLAY, AND GLASS PRODUCTS
ABRASIVE PRODUCTS
Coated abrasive paper and cloth:
October
4, 834 5,867 1, 994 (b) (•) 4,123
4, 137 5,143 (•) 4, 448
6,848 7, 433 8, 650
INovem-1 Decem-\ ber ber
3. 964 2, 967 4, 048 2, 604 I, 804 I, 289
4, 043 4. 417
3, 725 3,825
4, 377
6,362 6, 287 8, 725
2, 729 2, 390
4, 678
6, .532 6,086 9, 170
S-35
1942
Janu- I Febru-ary ary
I, 369 1, 113 I, 231 I, 116
9%
4, 550 4, 553
I, 328 I, 257
4, 712
5, 545 6. 300 8, 315
1, 051 1,099
4, 678
4, 7.53 5, 213 7, 907
Shipments ____________________________ reams .. !09,5R8 137,177 129,119 135,571 130,852 146,734 173,022 141,985 138,555 138,327 199,373 111,700 130,525
PORTLAND CEMENT
Production ______________________ thous. of bbL. Percent of capacitY------------------- _______ _
Shipments _______________________ thous. of bbL. Stocks, finished, end of month. __________ do .... Stocks, clinker, end of month _____________ do ___ _
CLAY PRODUCTS
12, '133 60.0
12,563 25, 83~ 6, 532
10,596 49.8
9, 915 25.988 6, 276
12, 196 59.3
14, 132 24,056 6, 207
14,732 69.4
16,048 22,745 6,005
15, 223 74.0
16,109 21, 865 5, 757
16,000 74.9
16,687 21,178 5, 522
16, 345 76.5
17,825 19,732 5, 219
16, 115 78.3
18,284 17,561 4, 804
16,688 78.6
17,833 16,417 4.192
14,931 72.7
13,724 17,638 4, 250
13,810 64.8
11, 511 19, 937 4, 575
12,370 58.6
9,120 23,186 5,021
'10, 787 57.0
'8,296 '25, 668 '5, 840
Common brick, price, wholesale, composite f.o.b.plant__ ________________ dol.perthous. 13.215 '12.3S! '12.320 '12.434 '12.504 '12 .. 582 '12.715 12.832 12.886 12.921 12.960 13.100 13.165
Floor and wall tile, shipments: QuantitY---------------------thous.ofsq.ft.. ---····--- 5,597 5,219 6,172 6,340 7,192 6,701 6,330 6,831 5,289 5,029 '3,584 3,6~9 Value __________________________ thous.ofdoL 1,387 1,363 1,629 1,694 1,929 1,890 1,816 1,932 1,501 1,432 '1.077 1,047
Vitrified paving brick: Shipments ___________________ thous.ofbrick.. 1,088 2,640 3,612 3,384 4,056 3,906 5,873 4,551 3,113 1,735 1,046 Stocks,endofmonth ___________________ do____ 30,402 30,233 28,622 28,778 28,711 27,813 24,630 24,694 17,211 17,122 18,448
GI,ASS PRODUCTS
Glass containers: Production ________________ .... thous. of gross ..
Percent of capacitY-------------------------Shipments, totaL ____________ thous. of gross ..
Narrow neck, food*. -----------------do ..... Wide mouth, food*-------------------do ..•. Pressed food ware• ___________________ do .... Pressure and non-pressure• ___________ do ___ _ Beer bottles•. -------------- __________ do ..• _ Liquor ware• ------. ___ ---------------do ___ _ Medicine and toilet• ------------------do ___ _ General purpose• ---------------------do .••. Milk bottles• -------- __ --------------.do .... Fruit jars and jelly e;lasses• ___________ do ..•.
Stocks, end of month ___________________ do ___ _ Other glassware, machine-made:•
Tumblers: Production_ -----------------thous. of doz .. Shipments .•. _ ..•• ____ . ___________ .. _do_. __ Stocks _______________________________ do ___ _
Table, kitchen, and household ware, shipments thous. of doz ..
Plate glass, polished, production thous. of sq. ft ..
Window glass, production .. _ .. thous. of boxes .. Percent of capacitY---------------------------
GYPSUM AND PRODUCTS
Crude:
"· 935 103. I 7, 064
58R I, 509
49 503 737 983
1, 806 .514 243 106
9, 458
4,804 4, 482 9, 260
3, 278
5, 565 1, 583 97.5
Imports __________________________ short tons .. ________ _ Production ______ ---------------------- .do ____________ _
Calcined, production _____________________ do ____________ _ Gypsum products sold or used: Uncalcined _____________________________ do ____________ _
Calcined: Building plasters _____________________ do ____ ---------For mfg. and industrial nses __________ do ____ ------- .. Keene's cement. _____________________ do ____ ------ ... Board and tile, totaL .. ____ thous. of sq. ft .• ___ -------
Lath .. -----------------------------do ____ ----------Tile ________________________________ do .... ---------Wallboard __________________________ do ...• ---------
5,128 76.7
r 5, 107 240
1,038 42
412 368 843
1, 493 434 213 13
9, 979
4, 200 4,424 8,115
3, 400
18,266 I, 417 87.3
5, 325 79.7
5, 573 289
1, 113 35
633 418 865
I, 522 405 229 41
9, 612
3,838 4,387 7,499
3, 922
18,344 1,400 86.3
6, 246 93.5
6. 402 326
I, 212 49
779 548 991
I, 609 453 272 136
9,244
5, 548 5,055 7,896
3,372
18,394 1,282 78.9
6,166 96.0
6, 865 358
I, 447 47
763 605
1,028 1, 695
477 262 165
8, 397
4, 857 4,863 7,820
3,069
18, 534 1,304 80.3
6, 291 94.1
6, 363 489
1, 306 44
691 495 834
I, 603 398 278 200
8,176
4, 541 4.382 7,899
2, 903
12,463 I, 281 78.9
6, 791 101.6 6, 801
830 I, 300
39 480 430 922
I, 826 410 301 239
8,052
4,879 4,826 7,872
3,857
14,126 1, 267
78. I
6, 286 97.8
6, 902 970
1, 249 45
333 396
I, 071 1, 898
410 342 !58
7, 321
4,407 4, 998 7, 208
3,427
14,906 1, 123 69.2
7,094 102.2 6, 315
386 1,268
55 312 428
1,043 2,038
472 285 10
7, 948
4,837 4, 937 6, 975
4,082
15,769 1, 524 93.9
6,179 100.2 5, 281
240 979
42 317 264
1,040 1, 758
380 243
3 8, 711
'4, 658 3, 584 7, 903
3,279
14, 277 1,300 80.1
6,050 90.5
4, 903 210 873
39 332 398 834
1, 580 372 245
4 9, 683
4,346 3, 236 8, 936
2, 553
10, 311 1, 696 IU4. 5
175,467 --------- --------- 326,248 --------- --------- 366,519 --------- --------- (•) 811,500 1,197,689 1,335,905 --------- --------- 1,361,034 764,500 --------- --------- 1,026,987 --------- --------- 1,099,244 --------- --------- 1,088,745
200,630
373,503 36,027 6,450
539,000 322,700
7,100 209,200
365,682
523,218 38,222
7, 672 709,282 472,696 11,267
225,319
368,209
577,840 41,569 8, 854
718,415 479,794
9,133 229,488
317,781
436,255 36,130
6, 841 843,920 567,393
7,398 269,129
' Revised. • The publication of detailed foreign trade statistics has been discontinued for the duration of the war. • Data not available.
6, 755 96.5
5, 877 271
I, 191 45
352 524 905
1,884 399 257 29
10, 279
5, 3,50 4,143 8, 797
2, 587
9,143 1. 639 100.9
5. 965 96.1
6,141 352
I, 319 37
408 601 917
1, 741 429 224 97
10,001
4, 595 3, 921 9,376
3, 112
5, 600 1.457 89.7
*New series. Data for glass containers for the period January 1934-December 1939 are shown in table 49, pp. 16 and 17, of the November 1940 issue; minor revisions for 1940 for wide-mouth food containers and liquor ware not shown on p. S-35 of the September 1941 issue are available on request; earlier data on glassware other than containers are shown In table 2, p. 17, of the January 1941 Survey.
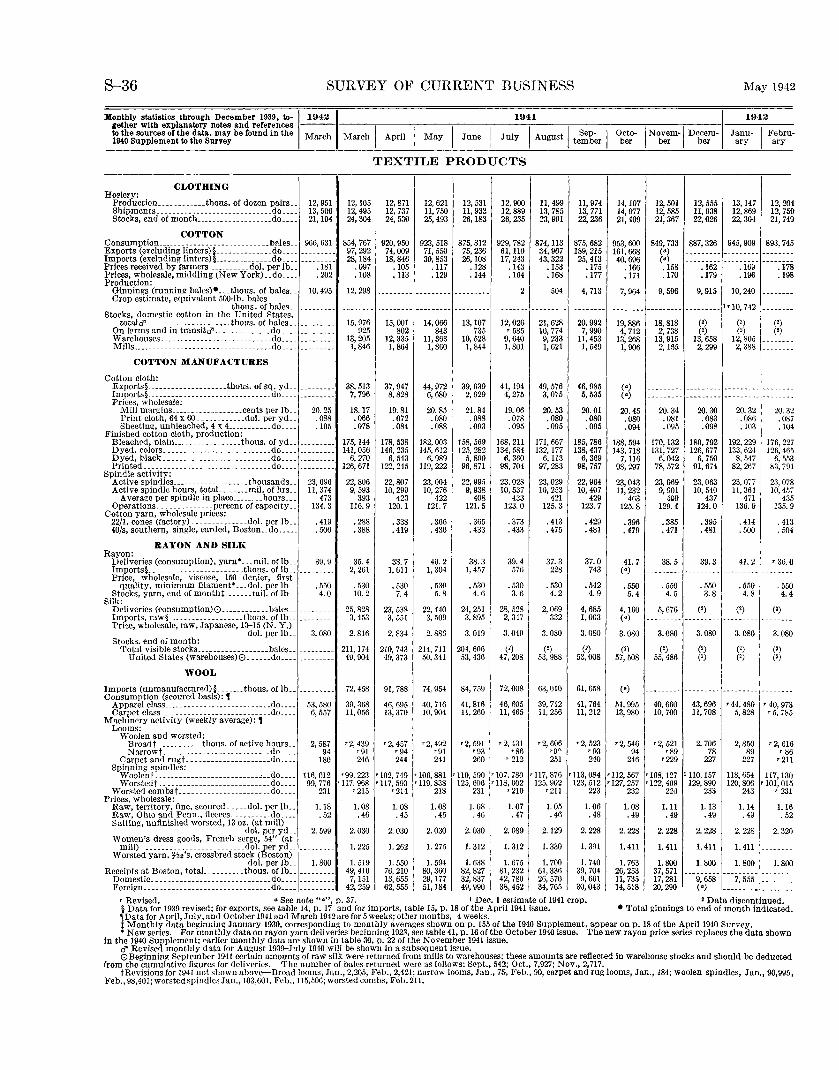
S-36 SURVEY OF CURRENT BUSINESS May 1942
Monthly statistics through December 1939, to-~19421 1941 I 1942 gether with explanatory notes and references --- -----,---------,-----,-----,------,-----,----~----,-----,--- ----,---to the sources of the data, may be found in the March March I AprJ'l I May I June I July I August I Sep- I Octo- I Novem-1 Decem- Janu- I Febru-1940 Supplement to the Survey tember her ber her ary ary
CLOTHING Hosiery:
Production ____________ thous. of dozen pairs .. Shipments. ___ --------------------- ____ do ___ _ Stocks, end of month ___________________ do ___ _
COTTON
12, 951 13, 506 21, 194
Consumption __________________________ .. bnles._ 966,631 Exports (excluding linters)§ ______________ do .... ---------Imports (excluding linters)§ ______________ do .... ________ _ Prices received by farmers __________ dol. per lb.. .181 Prices, wholesale, middling (New York) .. do.... . 202 Production:
12, 105 12,495 24,304
854, 767 97,292 28, 184
.097
.108
TEXTILE PRODUCTS
I2, 871 I2, 737 24,530
920,950 74,009 IS, 846
.105
.113
I2, 62I 11,750 25,493
923,518 71,550 30,853
.117
.129
12,531 11,933 26, 183
875,812 75,236 26, 108
.I28
.144
12,900 12,889 26,235
929, 782 61, 110 17,243
.143
.164
Ginnings (running bales)• ... thous. of bales.. 10,495 12,298 ---------------------------Crop estimate, equivalent 500-lb. bales
11, 499 13,785 23,991
874,113 34,967 43,322
.153
.168
504
thous. of bales .. _________ --------- --------- --------- --------- --------- ---------Stocks, domestic cotton in the United States,
totalcl'. ____________________ thous. of bales __ ---------On frrms and in transitcl'--------------do ____ ---------Warehouses.--------------- __________ .. do ____________ _ Mills _____________ ------ ______________ .. do. ___________ _
COTTON MANUFACTURES
Cotton cloth: Exports§ ____________________ thous. of sq. yd _________ __ Imports§ ___ ------- ___ -- ___ ------- ______ do ___________ __ Prices, wholesale:
Mill margins __________________ cents per lb .. Print cloth, 64 x 60 ____________ dol. per yd __ Sheeting, unbleached, 4 x 4 ___________ do __ __
Finished cotton cloth, production:
20.25 .088 .105
Bleached, plain _________________ thous. of yd __________ _ Dyed. colors ___________________________ do ____ ---------Dyed, black. _____ ------------- ________ do .. __________ _ Printed .... -------------------- ______ .. do ____________ _
Spindle activity: Active spindles __________________ thousands .. Active spindle hours, totaL _______ mil. of Ius ..
Avera!!e per spindle in place ______ .. hours __ _ Operations .... __________ percent of capacity __
Cotton yarn, wholesale prices: 22/1. cones (factory) .. ____________ dol. per lb .. 40/s, southern, single, carded, Boston .. do ___ __
RAYON AND SILK
23,096 1!, 374
473 134.3
.419
.506
Rayon: Deliveries (consumption), yarn• ... mil. oflb.. 39.9 Imports§ _______________________ thous. of lb .. ---------Price, wholesale, viscose, 150 denier, first
quality, minimum filament* ___ dol. per lb .. Stocks, yarn, end of montbt _______ mi!. of lb ..
Silk:
. 550 4. 0
Deliveries (consumption)0.--------- __ bales __________ _ Imports, raw§ __________________ thous. oflb _________ __ Price, wholesale, raw, Japanese, 13-15 (N.Y.)
Stocks. end of month: dol. per lb.. 3. 080
15,976 925
13,205 1,846
38.513 7, 796
18. 17 .066 .078
17.1, 144 141,056
6, 270 126, 671
22,806 9, 593
393 116.9
.288
.388
35.4 2, 261
. 530 10.2
25,828 3, 453
2.816
Total visible storks __________________ bales __ --------- 211,174 United States (warehouses)0. _____ do____ 49,904
WOOL
Imports (unmanufactured)§ _______ thous. of lb .. ---------Consumption (scoured basis): f
Apparel class _____________ --------· _____ do____ 53,580 Carpet class .. ~ ______ -------------- ___ .. do____ 6, 557
Machin~ry activity (weekly average): , Looms:
Woolen and worsted: Broadt __________ thons. of active hours __ Narrowt ___ ------------------------do. __ _
Carpet and rugt ___ -------- _________ _cto ___ _
2, 587 94
180
72,458
39,368 11,056
•2,439 •91 246
I5, OOI 802
12,335 I,864
37,947 8,828
I9. 81 .072 .084
178, 538 146,235
6, 543 122,245
22,807 10,299
423 120.1
. 338
. 419
38.7 1, 611
•. i30 7. 4
23,538 3, 55I
2. 834
210, 743 49,373
91,788
46,695 13,370
T 2, 457 •94 244
14,066 843
11, 363 I, 860
44,972 6, 680
20.85 .080 .088
182,003 145, 612
6, 989 119,222
23,004 10,276
422 121.7
.366
.430
40.2 I, 304
. 530 5. 8
22,440 3, 509
2. 886
214, 711 50, 341
74,954
40, 716 10,904
•2,492 •91 241
13, 107 735
10,528 1,844
39,039 2, 929
21.84 .088 .093
158, 569 125,282
5, 890 96,871
22,995 9, 938
408 121. 5
. 365
.433
38.3 1,457
. 530 4. 6
24,251 3, 895
3. 019
204, 6()()
53,436
84, 759
41,816 11,260
•2, 59! •93 260
12,026 '585
9,640 I, 801
4I, 194 4,275
I9. 06 .078 .095
168, 211 134, 584
6, 360 98,704
23.028 10,537
433 I23.0
.373
.433
39.4 576
.530 3. 6
28,528 2, 347
3.04P
(') 47,208
72,008
46,605 11,465
"2, 431 •86
'212
21,628 10,774 9, 233 1, 621
49,576 3,075
20.53 .080 .095
171,667 132,177
6,113 97,283
23,029 10,253
421 125.3
. 413
. 475
37.3 228
.530 4. 2
2, 069 332
3.080
(2) 53,988
63,010
39,712 11, 256
•2, 606 ,go 251
11,974 I3, 771 22,236
875,682 I89, 215 25,413
.175
.177
4, 713
14,107 14,977 21, 409
953,600 161,668 40,696
.166
.171
7, 964
12, 501 12,585 21,367
849,733 (•) (•) .158 .170
9,596
12,555 11,938 22,026
I3, 147 12,869 22,304
12,204 12,759 21,749
887, 326 945, 909 893, 745
.162
.179 .169 .196
9, 915 10, 240
.178
.198
-------- --------- --------- --------- 1')0, 742
20,992 7, 990
11,453 1, 549
46,985 5, 535
20.01 .080 .095
185,786 138,437
6, 369 98,757
22,964 10,407
429 123.7
.429
.481
37.0 743
.542 4. 9
4, 685 1.003
3.080
(2) 53,008
61,658
41,764 11,212
•2, 523 •93 240
19,886 4, 712
13,268 1, 906
(•) (•)
20.45 .080 .094
188,594 143,718
7,116 98,297
23,043 11,232
463 125.8
.396
.479
41.7 (•)
.550 5. 4
4,160 (•)
3.080
(2)
57, 508
(•)
51, 995 13, 980
•2, 546 94
246
18,818 2, 738
13,915 2,155
(2) (2)
13,658 2, 299
(') (')
12,805 2,388
(') (')
--------- --------- _________ ! _______ _
20.34 .081 .og5
170, 132 131, 727
6,042 78,572
23,069 9, 901
409 I29. 4
.385
.471
38.5
. 550 4. 5
5,676
3.080
(2) 55,486
40,660 10,700
•2, 521 •89
•229
20.30 .088 .og8
I80, 792 126,677
6, 750 91,674
23,063 10,540
437 124.0
. 395
.481
39.3
.550 3.8
(')
3.080
(') (2)
43,696 11, 708
2, 706 78
227
20.32 .086 . 103
192, 229 133, 624
8, 547 82,267
23, 077 11, 364
471 136. 9
. 414
. 500
41.2
.550 4. 8
(2)
3. 080
(2) (2)
20.32 .087 .104
176,227 126,465
6, 553 b3, 791
23,078 10,457
435 135.9
.413
. 504
. 550 4.4
(2)
3. 080
(2) (2)
T 44, 480 ' 40, 973 5, 828 r 5, 785
2,850 89
227
•2,616 '86
•211 Spinning spindles:
Woolent __ ----------------- _______ , _ _cto __ __ Worstedt. ___________________________ do ___ _ 116, 012 •99, 223 '102, 749 '106, 881 '110, 590 '107, 780 '117, 876 '113, 084 '112, 567 '108, 127 '110, 157
99,776 •117.968 •117,593 •119,838 125,606 •118,002 125,902 123,512 •127,257 •122,409 129,890 118,654 117,130 120, 806 '101, 015
Wot'ted combst _______________________ do .. __ 231 '215 '214 218 231 • 210 '211 223 232 22v 233 Prices, wholesale:
Raw, territory, fine. scoured. ____ dol. per lb .. Raw, OhiO and Penn., fleeces. _________ do ___ _ Suiting, unfinished worsted, 13 oz. (at mill)
1.18 . 52
dol. per yd__ 2. 599 Women's dress goods, French serge, 54" (at
mill) ________________________ dol. per yd __________ _ Worsted yarn, %o's, crossbred stock (Boston)
dol. per lb.. 1. 800 Receipts at Boston, totaL ________ thous. of lb .. ________ _
Domestic. _____ ---------- _____________ _cto ____________ _ Foreign._------------------ ____________ do ____ -------- _
1.08 .46
2.030
1. 225
1. 519 49,410 7,151
42,259
1.08 . 45
2. 030
1.262
1. 550 76,210 13,655 62,555
1.08 .45
2.030
1. 275
1.594 80,360 29,177 51,184
1. OR . 46
2.030
1. 312
I. 638 82,827 32,837 49,990
1.07 .47
2.089
1. 312
I.675 8I, 232 42,780 38,452
1.05 . 46
2.129
1.330
1. 700 61, 336 26,570 34,765
1.06 .48
2.228
1. 3q1
1. 740 39,704
g, 661 30,043
1.08 .49
2. 228
1.411
1. 763 26,253 11,735 14,518
1.11 .49
2.228
1.411
1.800 37,571 17,281 20. 2go
1. 13 .49
2.228
1.411
1.800
9, 658 (•)
243 '231
1.14 . 49
2. 228
1. 411
1. 800
1.16 . 52
2. 320
1.800
7, 555 --------
'Revised. • See note "•", p. 37. 1 Dec. I estimate of 1941 crop. 'Data discontinued. §Data for 1939 revised; for exports, see table 14, p. 17 and for imports, table 15, p. 18 of the April1941 issue. • Total ginnings to end of month indicated. ,Data for April, July, and October 1941 and March 1942are for 5 weeks; other mouths, 4 weeks. t Monthly data beginnin~ January 1930, corresponding to monthly averages shown on p. 155 of the 1940 Supplement, appear on p. 18 of the April1940 Survey. • New series. For monthly data on rayon yarn deliveries beginning 1923, see table 41, p. 16 of the October 1940 issue. The new rayon price series replaces the data shown
in the 1940 Suppl~ment; earlier monthly data are shown in table 30, p. 22 of the November 1941 issue. cl' Revised monthly data for August 1939-July 1940 will be shown in a subsequent issue. 0Beginning Rept.ember 1941 certain amounts of raw silk were returned from mills to warehouses: these amounts are reflected in warehouse stocks and shonld be deducted
from the cumul~tive figures for deliverie<. The number of bales returned were as follows: Sept., 542; Oct., 7.927; Nov., 2,717. tRevisions for 1941 not shown above-Broad looms, Jan., 2,205, Feb., 2,421; narrow looms, Jan., 76, Feb., 90, carpet and rug looms, Jan., 184; woolen spindles, Jan., 90,995,
Feb., 98,401; worstedspiudlesJan.,103,601, Feb., 115,506; worsted combs, Feb. 211.
May 1942 SURVEY OF CURRENT BUSINESS S-37
Monthly statistics through December 1939, to-~19421 1941 I 1942 gether with explanatory notes and references ---1-----,---,-------,----7"""---,----,--------.----,----,--- ---,----tothesourcesofthedata,maybefoundinthe March March I April I May I June I July I August[ Sep- I Octo-~Novem-~Decem- Janu-~Febru-1940 Supplement to the Survey tember ber ber ber ary ary
TEXTILE PRODUCTS-Continued
WOOL-Continued
Stocks, scoured basis, end of quarter, total, thous. of lb .. ________ _
Woolen wools, totaJ ____________________ do .... ________ _ Domestic _____________________________ do ___ _ Foreign _______ ------------------------do ....
Worsted wools, totaL .................. do ____________ _ Domestic .. ________ .. ---------- ..•... do .... ________ _ Foreign __________ . ____ ....•.••..•. __ .. do. __ _
MISCELLANEOUS PRODUCTS
Fur, sales by dealers .............. thous.ofdoL_ ---------Pyroxylin-coated textiles (cotton fabrics):
Orders, unfilled, end ofmo .. thous.linear yd .. Pyroxylin spread ............... thous. of lb .. Shipments, billed ......... thous. linear yd ..
7,115 5, 252 6,519
164,331 50,886 26,333 24,553
113,445 17,933 95,512
4, 666
5,520 6, 759 7,100
6, 142
5, 588 7,165 7,550
5, 966
6,137 7,351 7, 950
208,345 62,213 31,790 30, 423
145,970 53,930 92,040
5,323
9, 558 7,464 7,479
4, 779
8,070 6,473 7, 543
5,349
10,038 7,142 7, 703
TRANSPORTATION EQUIPMENT
AIRPLANES Exports§_ ... ___ ---------- ____________ number ..
AUTOMOBILES Exports:
Canada: Assembled, totaL _________________ number .. _______ _
Passenger cars ...... _______________ .do .... _______ _ United States:
Assembled, total§ ... _________________ do .... ________ . Passenger cars§ _____________________ do .... __ __ Trucks§ ________________________ .... do. _______ _
Financing: Retail purchasers, totaL _______ thons. of doL_
New Cltrs _____________________________ do .... ____ __ Used cars. ___________________________ do .... _______ __ Unclassified. ____________ ------------- do .... ________ _
Wholesale (mfrs. to dealors) ____________ do .... __ __ Retail automobile receivables outstanding.
end of month* -----------------mil. of doL .• _ Production:
Automobiles: Canada, totaL _________________ .. number _________ __
Passenger cars. ____________________ do .... ________ . United States (factory sales), totaL .. do .. ..
Passenger cars .. ____________________ do .... _______ __ Trucks.---------- ______________ .... do .... _______ __
Automobile rims ............ thous. of rims .. ____ _ Registrations:t
New passenger cars. ________________ number _________ __ New commercial cars .................. do .. ..
Sales (General Motors Corporation): World sales:
By U.S. and Canadian plants ....... do .... _ United States sales:
To dealers .. _________________________ do .... _______ __ To consumers ________________________ do .... _
Accessories and parts, shipments: Combined index ______________ Jan.1925=100 ..
Original equipment to vehicle manufac· turers ......... ____ ........ Jan. 1925= 100 ..
Accessories to wholesalers ............ do .. .. Service parts to wholesalers ........... do .. .. Service equipment to wholesalers .... do .. ..
RAILWAY EQUIPMENT
Association of American Railroads: Freight cars, end of month:
Number owned .. _____________ thousands .. Undergoing or awaiting classified repairs
thousands .. Percent of total on line ________________ _
Orders, unfilled _____ --------- ________ cars .. Equipment manufacturers ......... do .. .. Railroad shops _____________ ........ do .. ..
Locomotives, steam, end of month: Undergoing or awaiting classified repairs
number .. Percent of total on line _________________ __
Orders, unfilled .. _________ . ____ .. number __ Equipment manufacturers ......... do .... Railroad shops .•. ____________ ...... do. __ _
U.S. Bureau of the Census: LocomotivPs, railroad:
Orders, unfilled, end of mo., totaL .•. do .. .. Steam t __ .. _ -----. ____ ... --------- .. do ... . Othert _____________________________ do ... .
Shipments, totalt ---------- .......... do .. .. Steamt .... ________________________ do .. .. Othert .. __ ...• ----- .. -------- ...... do .. ..
1, 718
60 3. 5
68,316 47, 985 20,331
3, 228 8. 2 426 372
54
1, 332 589 743 125 57 68
481
11, 177 797
21,064 8,834
12,230
202,793 118,369 83,815
608 270,487
1, 255
26,044 12,093
507,834 410, 196 97,638
2, 666
420,058 67, 798
247,683
226,592 253,282
210
232 128 168 214
1,644
101 6. 3
41,091 27,756 13, 335
5, 704 14.4 166 148
18
645 219 426 82 17 65
571
9,405 312
18,536 8, 574 9, 962
236,800 136,464 99,582
754 243, 103
1, 341
27,584 12,091
462.272 374,979 87,293 2,682
489,074 70,269
2.55,887
233,735 272.853
240
278 132 218 199
1, 647
96 5. 9
55,404 42,162 13,242
5, 535 14.0 211 189
22
622 203 419
74 18 56
511
14, 457 496
21,969 9,012
12,957
248,314 141,024 106,502
787 251,490
1,433
26,585 9,840
518,770 417,698 101,072
2,408
515,034 72, 170
235,679
217,120 265, 750
252
282 136 215 208
1, 656
94 5.8
64,027 49,108 14,919
5,181 13.1 231 201 30
734 205 529 87 22 65
352
13,000 378
13,481 4,056 9,425
238,040 129,877 107,445
718 231,323
1,500
25,753 8,538
520,525 418,983 101,542
2, 309
443,470 62,265
360
22,486 2,099
12,975 6, 958 6, 017
210,628 110,625 99,362
642 202,022
I, 543
24,654 3, 849
444,243 343,748 100,495
2,061
391, 795 67,412
240,748 224,517
224, 119 204, 695 235,817 195, 475
258 242
279 248 140 154 231 253 229 221
1, 661
85 5.2
91,416 69,140 22,276
4, 862 12.3 265 234
31
876 255 621
79 9
70
1, 666
79 4.8
88,266 66,641 21,625
4, 607 11.7 300 266 34
942 297 645 87 11 76
533
16,932 3,263
20,616 6, 706
13,910
172,801 83,518 88,724
558 91,773
1,560
17,192 3,160
147,601 78,529 69,072
1, !l32
246,595 56,191
29,268
19,690 84, 969
246
2.i8 160 242 216
1, 671
78 4. 7
89,917 65,814 24,103
4, 208 10.7 317 269 48
964 297 667 87 8
79
191,556 65,508 35,304 30,204
125,652 57,334 68,318
4, 297
8, 747 7, 097 8,017
8,849 619
15,678 2, 279
13, 399
104,079 43,427 60,370
281 89,333
1, 494
14,496 2, 548
234,255 167, 790 66,465
1, 811
125, 293 43,892
89, 300
81, 169 52,829
282
271 170 298 290
1, 676
73 4.4
86,943 63,607 23,336
4,022 10.2 309 263
46
917 285 632 79 12 67
1,441
9,009 7,488 7, 841
11,144 1,052
(•) (•) (•)
106,680 50,074 56,303
303 198,874
1, 435
19, 360 5, 635
382,009 295.568 86,441 2,024
165,485 4\, 352
!7g, 120
162,543 103,854
286
280 174 302 287
1, 682
68 4.1
78,974 57,584 21,390
3, 778 9. 6 284 240 44
921 268 663 102
27 75
790
8,206 6,698 7,097
190,780 71,971 35,862 36,109
118,539 41,680 76,859
552
7,825 6, 637 7, 398
p 2, 138
'7. 112 r 6, 181 '6, 745
•6,594 '5, 659 '6,464
11,798 997
5, 981 11, 002 11, 599 658 246 1, 146
94,902 44,426 50,140
336 194,258
104,243 47,981 55,836
426 198,295
1, 379 I, 309
21, 545 7,003
352,347 256, 101 96, 246
1, 864
163,126 35,985
20.313 6,651
282, 205 174,962 107,243
1,677
174, 188 41,006
171,412 (b)
153,904 (b) 126,281 (b)
270 281
271 286 173 174 267 297 288 255
1, 689
68 4.1
75,559 52,563 22,996
3, 634 9.2 281 256
25
1,022 364 658 89 15 74
1, 694
62 3. 7
73,697 50,661 23,036
3, 370 8. 6 2.i8 237
21
1, 210 526 684 96 22 74
21, 751 4, 249
238,261 147, 858 90,403
1, 271
64,603 23, 356
1, 701
61 3. 6
66.870 45, 798 21,072
3, 378 8. 6 249 229 20
'1, 197 522
•675 89 19 70
20,181 3, 989
134, 134 52,200 81,934
669
19,177 10,311
1, 709
61 3.6
69,402 49,939 19,463
3, 231 8. 2 300 282 18
'1, 273 551
•722 100 28 72
•Revised. • Preliminary. • The publication of detailed foreign trade statistics has been discontinued for the duration of the war. b Discontinued. 1Does not include Australian wool held by the Defense Supplies Corporation. The total includes for June, September and December 1941 a comparatively small amount
of certificated wool in licensed warehouses not included in the detailed figures. §Data revised for 1939. See table 14, p. 17, of the April1941 Survey. Data on exports of airplanes have also been revised, beginning January 1940, to include exports
of "land planes minus engines." Prior to 1940, these were not reported separately. For revisions for all months of 1940 see note marked "§"on page S-37 of the November 1941 Survey. Beginning September 1941 data on exports of airplanes are not available.
*New series. Data beginning 1936 are shown in table 33, p. 26, of the November 1941 Survey. tSince publication of foreign trade statistics has been suspended for the duration of the war, the Bureau of the Census has ceased publishing foreign and domestic data
separately. The series, therefore, ha'l'e been revised to include both forei!'n and domestic data. Comparable earlier figures are available on request. tData beginning June 1941 exclude Federal Government deliveries and are therefore not comparable with earlier data. See note "t", p. S-37, of December 1941 Survey.
S-38 SURVEY OF CURRENT BUSINESS May 1942
Monthly statistics through December 1939, to-~19421 1941 I 1942 gether with explanatory notes and references --- -----,-----,-----,------,-------,----,----,----.,------,---- ---.,---to the sources of the data, may be found in the March March I April I May I June I July I August I Sep- I Octo- I Novem-1 Decem- Janu- I Febru-1940 Supplement to the Survey tember ber ber ber ary ary
TRANSPORTATION EQUIPMENT-Continued
RAILWAY EQUIPMENT-Continued
U. S. Bureau of the Census-Continued. Locomotives, mining and industrial:
Shipments (quarterly), total* _____ number__ 17i Electric, total§ _____________________ do____ 84
For mining u•e ___________________ do____ 71 Other* _____________________________ do ___ 93
American Railway Car Institute: Shipments:
Freight cars, totaL __________________ do____ 7, 781 Domestic __________________________ do.... 7, 781
Passenger cars, totaL ________________ do____ 28 Domestic. _________________________ do____ 28
Exports of locomotives, totaL ____________ do ____________ _ Electric ________ ---------- ______________ do ____________ _ Steam ________ ----------- _______________ do. ______ _
INDUSTRIAL ELECTRIC TRUCKS AND TRACTORSt
Shipments, totaL ____ ----------- _____ .number __ Domestic ___________________ . _____ ..... do ___ _ Exports. _______________________________ do ___ _
Physical volume of business, adjusted:t Combined index __ . _____________ 1935-39=100 __
Industrial production:
371 336 35
---------
Combined index ___________________ do _____ -------Construction ____________________ .do ____ ---------Electric power. __________________ do ____ -- -------Manufacturing __________________ .do ____ -- ------Forestry_. ____________________ .do ____ -- ------Mining __________________________ do ____ --------
Distribution: Combined index. _______________ .... do .... ---------Carloadings ____________ . _______ .. do ____ ---------Exports (volume) ________________ do ____ ---------Imports (volume) ________________ do ____
'l'rade employment. .. ___________ do. ___ ---------Agricultural marketings, adjusted:t
Combined index ____ . __________________ do ____ Grain ________ ---------- ______________ do ____ ---------Livestock ______ .. _________ . __________ do __ .. ---------
Commodity prices: Cost of livingt _________________________ do ____ J15. 9 Wholesale prices ___________________ 1926=100 .. 95.1
Employment (first of month, unadjusted): Combined index. ______________________ do. ___
Construction and maintenance _______ do ____ --------Manufacturing _______________________ do ____ ---------
~~~~~~---~ ~ ~ ~::::::::::::: ~:::::::::: =~~=::: ------
'l'rade ____________ .. __________ . _______ do ____ ---------Transportation ....... ____ .... ___ .. -- do.--_ ---------
Finance: Bank debits _______________________ mil. of doL ----Commercial failures ... _____________ number __ 56 Life-insurance sales, new paid for ordinaryt
tho us. of doL_ 35,876 Security issues and prices:
New bonds issues, totalt-------------do ____ 1,024,217 Bond yieldst .. ----------- ____ 1935-39= 100. _ 99.6 Common stock pricest----------------do ____ 62.3
Foreign trade: Exports, totaL _________________ thous. of doL_ 176,950
Wheat ________________________ thous. of bu __ 9, 765 Wheat fiour __________________ thous. of bbL. 899
Imports ________________________ thous. of doL_ 144,886 Railways:
Carloadings ___________________ thous. of cars .. ---------Financial results:
Operating revenues ___________ tlJ'ous. of doL_ Operating expenses _______________ .. __ do .. __
---------
Operating income ___________________ .do ____ ---------Operating results:
Revenue freight carried 1 mile_mil. of tons._ ---------Passengers carried 1 mile ...... mil. of pass __ ---------
Production: Electric power, central stations
mil. of kw-hr.. ---------Pig iron _________________ .thous. of long tons __ Steel ingots and castings ______________ .do ____
---------
Wheat flour. ___________________ thous. of bbL. 1, 807
ISO 58 57 92
5, 022 4, 987
21 21 11 6 5
266 214 52
------------------------------------
5, 449 5, 301
18 18 24 17 7
263 255
8
------------------------------------
5, 225 4, 681
47 47 42 19 23
217 180 37
242 97 9t
145
5,136 5,130
12 12 25 10 15
266 238 28
------------------------------------
5, 537 5, 467
37 37 28 21 7
232 225
7
------------------------------------
3, 936 3, 856
32 32 22 15 7
247 236
11
CANADIAN STATISTICS
125.5 130.7 134.2 137.1 138.0 141.5
135.2 141.5 144.7 150.4 149.2 156. 1 1:!6. 4 177.9 178.5 286.8 130.7 145.0 115.8 126. 1 129. I 123.3 130.8 126. 1 139. 7 143.3 143.4 143.5 153.6 163.7 125.6 11R.4 114.0 117.0 131.0 129.8 122.8 121.8 140.8 125.6 146.3 140.9
107.8 110.9 114.9 112.9 117.6 114.9 125.3 129.3 138.6 133.9 139. 6 128.0 147.4 169.2 196.3 182.1 212.7 189. 7 153.6 150.0 14.5. 0 143.9 167.3 184.1 117.9 120.5 121.6 121.8 121.2 122.0
143.6 275.5 323.3 217.0 268.9 95.3 155.2 314.7 376. I 242.7 302.7 93.7 93.4 105.4 94.3 105.3 122.0 102.2
108.2 108.6 109.4 110.5 111.9 113.7 85.9 86.6 88.5 90.0 91.1 91.8
135.3 141.3 145.5 152.9 157.4 160.6 83.0 100.2 1200 139.5 149.9 160.7
150.8 158.2 162.3 168.0 172.5 176.9 168.7 174. 1 174.8 177.2 176.8 178.1 150.2 158.3 165.6 170.9 179.8 184.0 145.7 149. 1 154.5 156.8 158.5 156.8 90.5 94.3 99.2 99.2 103.7 105.0
2, 838 2, 984 3, 266 4,241 3, 242 3,150 90 67 84 72 58 67
33,700 35,398 36, 172 33,670 32, 681 29,597
42,524 78,830 115, 119 876,920 111, 290 83,497 100.5 100.6 101.1 101.9 101. 5 101.2 66.8 65.8 63.9 64.0 67.5 67.8
'102, 958 118,425 162, 663 146,822 170,901 150,496 11, 623 20,322 29,623 23, 114 19,346 14,721
559 850 1, 341 1, 751 1, 922 1,437 107,982 106,268 128,096 114,924 127, 707 137, 913
250 252 276 271 277 279
40, 613 41,887 46,595 44,817 45,442 46,524 30,941 30,180 32,257 32,122 35,248 35,988
7, 313 9,123 11,068 9, 976 7, 262 7,393
4,001 3,818 4, 387 4, 381 4, 257 4, 323 218 225 230 248 318 354
2, 632 2, 693 2, 805 •2, 560 2,661 2,640 102 103 114 112 102 106 195 201 206 187 197 203
1, 477 1, 661 2,121 2,118 2,117 1,852
173 79 73 94
5.168 5, 044
38 3Q 25 14 11
260 253
7
148.9
1~9.0 166.4 136.2 182.3 145.6 126.0
112.4 119.1 169.2 185.6 123.2
55.2 40.1
120.8
114.7 93.2
162.7 153.9 181.5 181.6 183.9 157.5 105.9
3, 301 45
33,975
62, 521 100.3
71.0
142,897 11, 341
661 136,991
294
47,215 35,861 8,973
4,447 286
2,867 112 201
1, 648
' Revised. • The publication of detailed foreign trade statistics has been discontinued for the duration of the war.
------------------------------------
7. 617 6, 626
28 2~
(•) (•) (•)
323 306
17
139.1
154.9 145.9 137.4 164. 7 132.6 123.6
110.2 120.6 139.5 170.3 123.9
113.3 116.0 101.3
115.5 93.8
165.8 155.4 185.0 182.3 175. 7 160.9 104. 2
3, 627 57
41,740
341,680 100.2 69.1
139, 678 11,841
441 140, 819
313
51,239 37,304 11,483
4, 796 262
3,140 137 223
1, 596
------------------------------------
6, 378 6,073
42 42
------------------
298 280
18
132.0
143.3 129.6 137.5 149.4 123.2 125.6
111.4 124.4 163.2 159.3 123.4
81.3 75.6
!Ofl.l
116.3 94.0
167.6 147.7 187.5 185.0 173.7 163.4 102.8
3,427 80
44,984
94,851 99.1 68.8
164,079 22, 105
587 134, 191
286
48.219 35.496 9, 927
4, 711 227
3,184 134 221
1, 665
207 102 99
105
7,18~ 7, 181
3.> 29
---------------------------
271 261
10
141.3
154.1 184.4 138.9 158.9 127. 5 124.4
118. I 138.8 163.9 194.9 122.9
129.4 129.3 129.8
115.R 93.6
168.8 143.4 188.4 183.5 170.4 167.1 104.1
3, 687 78
47, 172
91,985 99.3 67.2
152,091 18,271
930 125,886
294
50,050 36,134 10,818
4,356 387
3, 221 148 219
1, 577
------------------------------------
'6. 240 '6, 240
42 42
------------------
330 327
3
'140. 6
'148. 4 125.8 142.9
'158. 3 126.9 120.2
125.3 149.6 199.7 229.0 125.2
136.3 110.4 112.3
115.4 94.3
165.8 124.7 187. 1 li7. 8 168.0 172.4 101.1
3, 231 77
43,081
90,326 99.4 66.8
152,307 11,145
750 142,127
272
---------------------------------------------
3, 226 146
'231 1, 556
--------------------------------
7, 752 7,652
24 20
309 303
6
134.3
141.3 103.6 136.6 152.4 134.2 113. 7
121.9 140.4 223.7 187.6
--------
93.9 70.6
100.9
115.7 94.6
165.4 118. 1 197.2 176.8 167.0 156.8 98.2
2, 893 64
39,357
'90, 092 99.3 64.7
168, 197 5,424 1,056
119,556
--------------------------------
----------------
2,842 129 217
1, 585
tData on life-insurance sales revised beginning September 1936; for revisions see p. 56 of the September 1940 Survey. For revisions of new bond issues for 1939 seep. 56 of the March 1941 Survey. All Canadian index numbers to which this note is attached have been revised to a 1935-39 base; earlier cost of living data appear in table 35, p. 19 of the January 1942 issue. Common stock price indexes have been converted to the new base by multiplying the old series by a constant. The index of bond yields has been completely revised and is now based upon yields of a 15-year 3)4 percent Dominion issue. The production and distribution indexes and indexes of agricultural marketings have also been completely revised; revised data will be published in a subsequent issue. The index of grain marketings is based on receipts at country elevators instead of receipts at head of Lake and Pacific ports, as formerly.
tBeginning with July 1940, data are reported by the Industrial Truck Statistical Association and co>er reports of 8 companies. They are approximately comparable with previous data which were compiled by the Bureau of the Census.
§Includes straight electric types only (trolley or third-rail and storage battery); data for 1939 and earlier years, published in the Survey, include some units of only partial United States manufacture and are not comparable with data here shown.
*New series. Comparable data on total shipments are available only beginning January 1940. "Other" includes Diesel-electric, Diesel-mechanical, and gasoline or steam locomotives; these are largely industrial; for data beginning with tbe first quarter of 1939, seep. 55 of the May 1941 Survey.
U.S. GOVERNMENT PRINTING OFFICE: 1942
INDEX TO MONTHLY BUSINESS STATISTICS, Pages S1-S38
CLASSIFICATION. BY SECTIONS
Monthly business statistics: Business indexes _______________ ,.. Commodity prices __ ------------Construction and real estate ____ _ Domestic trade ________________ _ Employment conditions and
wages ... ----- ___ ----- _____ ----Finance ________ ------- ____ ----_ Foreign trade _________________ _ Transportation and communica-
tions _______________________ _ Statistics on individual industries:
Chemicals and allied products __ Electric power and gas _______ _ Foodstuffs and tobacco _______ _ Fuels and byproducts ________ _ Leather and products ________ _ Lumber and manufactures ____ _ Metals and manufactures:
Iron and steeL ____________ _ Nonferrous metals and prod·
ucts ...... ____________ -------Machinery and apparatus ___ _
Paper and printing _____________ _ Rubber and products ___________ _ Stone, clay, and glass products_._ Textile products __ . ___ .---------Transportation equipment ______ _
Canadian statistics _______________ _
Page S-1 S-3 S--4 S-6
5-7 S-12 5-19
5-20
S-21 5-23 5-24 5-27 S-29 S-29
S-30
5-32 S·-32 S-33 5-34 S-35 S-35 S-37 S-38
CLASSIFICATION, BY INDIVIDUAL SERIES
Pages marked S Abrasive paper and cloth (coated)_________ 35 Acceptances, bankers'-------------------- 13 Advertising ____ .. __ . __ . __________ ------- 6 Agricultural cash income_________________ 1 Agricultural wages, loans.---------------- 13 Air mall and air-line operations___________ 6, 20 Aircraft_ ________ -.--------·-- __ 1, 2, 9,11,12,37 Alcohol, denatured, ethyl, methanoL______ 21 Aluminumc ______ ------- ____ ------------ 32 Animal fats, grease•--------------------- 21 Anthracite ____________ ---------. 2, 3, 10, 11, 27 Apparel, wearing ________________ 3,4,6,9,11,36 Asphalt_ ____ ------------ __ ------- __ ---- 28 Automobiles _____________ 1, 2, 3, 6, 8, 9,11,12,37 Automobile accessories and parts__________ 37
~=~1~~~~-~:~~=====~===================== 13, ~: Bearing metaL-------------------------- 32 Beef and veaL__________________________ 26 Beverages, alcoholic_____________________ 24 ~i~rminous coal _______________ 2, 3,10,11, 27,28
oJ ers--------------------------------- 31 Bonds, issues,.prices, sales, yields __________ 17,18 Book publicat10n------------------------ 34 Brass and bronze________________________ 32 Brick---------------------------------- 35 Br?kers' loans-------------------------- 14,18 Butldtng contracts awarded_______________ 4 Butldin;;: costs _________ ------------------ 5 Building expenditures (indexes)___________ 4 Building-material prices__________________ 3 Butter ___________ ----- _________ -------_ 24 Canadian statistics ___________________ 15,37,$8 Canal traffic____________________________ 20 CandY----·---------------------------- 26 Capital flotations ________________________ 17,18
For productive uses___________________ 18 Carloadings ____ ___________________ ------ 20 Cattle and calves________________________ 25 Cellulose plastic products ____ ------------ 23
g~~~~!tO"r~-~;~~;:::: :::::::::::::::==-~~ 2, 3, 3~ Cheese ___ -------_------- _______ -----___ 24 Chemicals ___________ 1, 2, 3, 4, 9, 11, 12, 14, 16, 21 Cigars and c-igarettes____________________ 27 Civil-service employees___________________ 10 Clay products__________ 1, 2, 8, 9, 10, 12, 14, 15,35 Clothing (see also hosiery) ______ 3,4,6,8-,9,11,12
g~~~-,;---~~====== ========= ======== -~~~~ ~~· 11, ~~ Coffee ___ -----_________________________ 26 Coke__________________________________ 28 Commercial failures_____________________ 14 Commercial paper_______________________ 13 Construction:
Contracts awarded____________________ 4 Costs __ ------ ___________ ---------____ 5 Highways and grade crossings___________ 5 Wage rates----·---------------------- 13 Copper. ________________________ -----___ 32
Copra and coconut oiL__________________ 22 Com ___ . __ . __ . ________ ·---_____________ 25 Cost-of-living index ___ • __ . ________ -----._ 3 Cotton, :raw, and manufactures ________ 2,3,4,36 Cottonseed, cake and meal, oiL___________ 22 Crops _____ --·. _________ -------_ 1, 22, 25,27,36 Currency in circulation___________________ 15 Dairy product•-----------------------·-- 24 Debits. bank____________________________ 13 Debt, United States Government__________ 16 Delaware, employment, pay rolls, wa~es __ 9, 11,12 D>!partment stores: Sales, stocks, collections_ 7, 8 Deposits, bank __________________________ 13,14
Pages marked S Disputes, industriaL--------------------- 10 Dividend declaration payments and rates___ 1, 19 Earnings, factory, average weekly and
hourlY---------------------------- 11,12,13 Eggs and chickens______________________ 1, 3, 26 Electrical equipment _______ 2, 3, 8, 9,10,11,12, 33 Electric power production, sales. revenues__ 23 Employment, estimated nona~:riculturaL___ 8 Employment indexes:
Factory, by cities and States____________ 9 Factory, by industries ___ -------------- 8, 9 Nonmanufacturing __ ----- ____ --------- 10
Employtpent, se9uritr opc:rations ----------- 10 Em grat10n and tmmtgration______________ 20 Engineering construction_________________ 4 Exchange rates, foreign__________________ 15 Expenditures, United States Government___ 16 Explosives ___________ ---------- __ ------- 21 Exports _______________ ------ __ --------- 19 Factory employment, pay rolls, wage•------ 8,
9,10,11,12,13 Fairchild's retail price index______________ 3 Farm wages ___ ----------------------___ 13 Farm prices, index----------------------- .. ·-- 3 Federal Government, finances _____________ 16,17 Federal-aid highways and grade crossings___ 5 Federal Reserve banks. condition oL______ 13 Federal Reserve reporting member banko___ 14 Fertilizers __________ ------------------__ 21 Fire losses------------------------------ 5 Fish olls and fish ________________________ 22,26
Flaxseed __ ------ ___ -------------------- 22 Flooring _________________ --------------- 29 Flour, wh~aL--------------------------- 25 Food products__________________________ 1,
2,3,4,6,9,11,12,14,15,16,24,25,26,27 Footwear_ ______________ ---- 1, 2, 4, 9, 11, 12, 29 Foreclosures, real estate__________________ 5 Foundry equipment_ __ ------------------ 32 Freight cars (equipment) _________________ 37,38 Freight carloadinga, cars, indexes__________ 24 Freight-car surplus_--------------------- 20 Fruits and vegetables ____________________ 3, 24 Fuel equipment and heating apparatus _____ 32,33
~~;:,i;;~.;---:~=======================-~~~· ~~; ~~ a~s, customers, sales, revenues____________ 23 G>s and fuel o•ls------------------------ 3, 28 Gasoline_. _____ ---------------------___ 28 Gelatin, edible__________________________ 27 General Motors sale•-------------------- 37 G!ass and glassware.---- 1, 2, 8, 9, 10,12,14,15, 35 Gloves and mitten•------------------~--- 29 Gold ____ ------ ____ --------------------- 15 Goods in warehouse•--------------------- 6
8;~~,;,::_~~==.======================-~~~~· 24, ~~ Htdes and skm•------------------------- 28,29 Hog•---------------------------------- 25 Home-loan banks, loans outstanding_______ 6 Home mortgage•------------------------ 5 Hosiery __ ---------------------- ____ ---- 36 Hotels._-------- ______ ----- _____ ------- 20 Housing _________ ------ ______ ----------- 3, 4 Illinois, employment, pay rolls, wages ____ 9, 11,12 Immigration and emigration______________ 20 Imports ______ --- __________ ------------- 19 Income payments __ ------------------___ 1 Income-tax receipts______________________ 16 Incorporations, business. new_____________ 6 Industrial production, indexes_____________ 1, 2 Installment loans________________________ 14 Installment sales, department stores_______ 7 Insurance, life _____________ ------------- 15 Interest and money rates_________________ 14 Inventories, manufacturers'--------------- 3 Iron and steel, crude. manufactures________ 1,
2, 3, 4, 8, 9, 10, 11, 12, 14, 15, 30,31 Ironers, household_______________________ 33 Kerosene __________________ ------------_ 28 Labor, turn·over, disputes________________ 10 Lamb and mutton_______________________ 26 Lard----------------------------------- 26 Lead___________________________________ 2,32 Leather_ _______________ 1, 2,4, 9,11,12,14,15, 29 Linseed oil, cake, and meaL______________ 22 Livestock ____ ----- ________________ ----- 25, 26 Loans, real-estate, agricultural, brokers'-- 5, 6, 13 Locomotives _____________ --------------- 37,38 Looms, woolen. activitY------------------ 36 Lubricants ___ ----------- ____ ----_------ 28 Lumber_ ____________ 1, 2, 3, 8, 9, 10,11, 12, 29,30 Machine activity, cotton, wooL___________ 36 Machine tools ____________________ 8, 9,10,11,12 Machinery-· 1, 2. 3, 8, 9,10, 11, 12,14, 15, 16,32, 33 Magazine advertising____________________ 6 Manufacturers' orders, shipments, inven-
tories ________________ ----_-----------Manufacturing indexes ________ -----------Maryland, employment, pay rolls ________ _ Massachusetts, employment, pay rolls,
2,3 1,2
9,11
wages ______________________________ 9,11,12
Meats and meat packing·-·--··-·-·-·---·-·- 1, 2,3,9,11,12,2o
Metals _________________ 1, 2,4, 8, 9,10,11,12,30 Methanol------------------------------ 21 Mexico, silver production_________________ 15 Milk___________________________________ 24 Minerals_---------------------------- 2,10,11 Navalstore•---------------------------- 21 New Jersey, employment, pay rolls, wages_ 9, 11, 12 Newsprint __________ ------ ______ --------- 34
Pages marked S New York, employment, pay rolla, wages_ 9, 11, 12 New York canal traffic___________________ 20 New York Stock Exchange _______________ 18, 19 Oat•----------------------------------- 25 Ohio, employment, pay roll•-------------- 9, 11 Oils and fats---------------------------- 21,22 Oleomargarine ______ ----- __ ----- ___ ----- 23 Orders and shipments, manufacturers'------ 2 Paint sales______________________________ 23 Paper and pulp ___ -------- 1, 2, 3, 9,11, 12, 33,34 Passenger-car sales index_________________ 7 Passports issued __________ ------ __ ------- 20 Pay rolls:
Factory, by cities and States------------ 11 Factory, by industries __________________ 10,11 Nonmanufacturing industries __ --------- 11
Pennsylvania, employment, pay rolls, wages_ 9, 11,1l
P~tt:oleum and products_ 1, 2,3, 9,10,11,12,16, 28 P1g1ron ________________________________ 30,31
Porcelain enameled products-------------- 31 Pork----------------------------------- 26 Postal busines•--------------------- --· __ 6 Postalsavings--------------------------- 14 Poultry and eggs _______________________ 1,3,26 Prices (see also indivtdual commodities):
Retail indexes------------------------- 3 Wholesale indexes--------------------- 3,4
Printing _____________ ------------- 1, 2, 9,11, 12 Profits, corporation______________________ 16 Pubhc rebeL--------------------------- 13 Pubhc utilities ________________ 4,10,11,16,18,19 Pullman Co.·--------------------------- 21 Pumps--------------------------------- 33,34 Purchasing power of the dollar____________ 4 Radiators ______ -----------------_______ 31 Radio, advertising_______________________ 6 Railways, operations, equipment, financial
statistics, employment, wages___________ 1, 2,10,11, 13,16,17,18,19, 20,37,38
Railways, street (see street railways, etc.). Ranges, electric_________________________ 33 Rayon ______________________________ 1,2,4,36
Reconstruction Finance Corporation, loans_ 17 Refrigerators, electric, household__________ 33 Registrations, automobiles________________ 37 Rents (housing), index___________________ 3 Retail trade:
Automobiles, new passenger____________ 6 Chain stores, variety (5-and-10), grocery,
and other--------------------------- 7 Department store•--------------------- 7 Mail orde<---------------------------- 8 Rural &eneral merchandise______________ 8
Rice ____ ------------------------------- 25 River traffic____________________________ 20 Roofing asphalt------------------------- 23 Rubber, crude, scrap, footwear, tires and
tube•---------------- 1,2,3,4,9,11,12,34,35 Savings deposits------------------------- 14 Sheep and lamb•------------------------ 26 Shipbuilding _______________ ----- 1, 2, 8, 9, 11, 12 Shoes----------------------- 1,2,4,9,11,12,29
~ll~e;::======~ ============= ======= ==-~~ 2, 4, ~~ Skins---------------------------------- 28,29 Slaught~ring and meat packing ___ 1, 2, 9, 11, 12,26 Spindle activity, cotton, wooL____________ 36 Steel and iron (see iron and steel). Steel, scrap, exports and imports__________ 30 Stockholders _________ --------------_____ 19 Stocks, department store (see also manu·
facturers' inventories)__________________ 8 Stocks, issues, pdces, sales, yields ______ 17, 18,19 Stone, clay, and glass products____________ 1,
2,8,9,10,12,14,15,35 Street railways and busses ________________ 10, 11 Sugar---------------------------------- 26 Sulphur-------------------------------- 21 Sulphuric acid__________________________ 21 Superphosphate_________________________ 21 Tea _____ ----- _______ ---- ____ ---------__ 26 Telephone, telegraph, cable, and radio-
telegraph carriers ________________ 10, 11, 16,21 Textiles ____________ 1, 2,4,9,11,12,14,15,36,37 Tile ______ ----------------------------- 35 Tin _______ -------_---------------______ 32 Tobacco _______________________ 1,2,9,11,12,27 Tools, machine ___________________ 8, 9,10,11,12 Travel _________________________________ 20,21
Trucks and tractors, industrial, electric____ 38 United States Government bonds__________ 18 United States Government, finances ____ 15,16,17 United States Steel Corporation ___________ 19,31 Utilities __________________ 4,10,11,15,16,18,19 Vacuum cleaners________________________ 33 Var ety-store sales index_________________ 7 Vegetable oils--------------------------- 22 Vegetables and fruits _______________________ 3, 24 Wages, factory, and miscellaneous ___ 10,11, 12,13 War program and expenditures____________ 16 Warehouses, space occupied______________ 6 Washers, household______________________ 33 Waterway traffic------------------------ 20 Wheat and wheat flou<------------------- 25 Wholesale price indexes__________________ 3,4 Wire cloth______________________________ 32 Wisconsin, factory employment, pay rolls, and wages __________________________ 9,11,12 Wood pulp ____________ ----- __ ---- ______ 33,34 Wool ____________________________ 1,2,4,36,37
ZinC----------------------------------- 32