Embed Size (px)
Citation preview

SURVEY OF ADDED COLOURS IN FOODS AVAILABLE IN
AUSTRALIA
STUDY OF CONCENTRATIONS IN FOODS INCLUDING DIETARY EXPOSURE ASSESSMENT AND RISK CHARACTERISATION

EXECUTIVE SUMMARY Synthetic and natural colours are routinely added to food and beverages as a visual cue for quality, to induce the perception of flavour and to meet consumer expectations. In 2006, FSANZ commissioned an analytical survey to quantify actual levels of all permitted synthetic colours and two natural colours in foods and beverages in Australia. This was necessary to accurately estimate dietary exposure and assess the potential risk to human health for Australians. This survey was undertaken as part of the surveillance program in 2006. The survey targeted a wide range of foods and beverages that contained added colours in accordance with Standard 1.3.1 of the Australia New Zealand Food Standards Code (the Code). The foods and beverages included were: confectionery, ice cream, cheese, yoghurt, margarine, flavoured milk, flavoured soy beverages, soft drink, cordial, fruit drink, alcoholic drinks, biscuits, cakes, pastries, savoury snacks, breakfast cereal, pre-prepared meals, processed meats, sauces, toppings, jams/conserves and jelly. A small number of products that claimed to contain ‘no added colours’ or ‘no artificial colour,’ was also sampled.
A total of 396 individual samples of processed foods and beverages were sampled over a three month period between June and August 2006. Samples were tested for the following colours - Allura Red (food additives number 129), Amaranth (123), Azorubine (122), Brilliant Black (151), Brilliant Blue (133), Brown HT (155), Erythrosine (127), Fast Green (143), Green S (142), Indigotine (132), Ponceau 4R (124), Quinoline Yellow (104), Sunset Yellow (110), Tartrazine (102) and two natural colours, Annatto (160b) and Cochineal/Carmine (120). These results were combined with results from a similar survey of synthetic colours in foods, carried out by the South Australia Department of Health and sampled in 2004 (Fast Green and Quinoline Yellow were not included in the SA survey), to give a total of 651 samples.
The concentrations of all colours tested in foods and beverages were below the respective Maximum Permitted Level (MPL) for all samples except six. In the FSANZ survey, only one sample (powdered instant chocolate custard) out of 396 exceeded the MPL and in the SA survey five samples (2 x liqueurs, flavoured milk, ice cream and an extruded snack food) out of 255 exceeded the MPL. In addition, an assessment of label consistency in both the FSANZ and SA surveys revealed a small proportion (<5%) of foods sampled contained one or more added colours that were not declared on the label. These results were referred to the relevant agency for follow-up of the non-compliant products. While this was reported, labelling deficiency was more frequently associated with colours being listed on food labels but not detected by the analysis.
Dietary exposure assessments to added colours were undertaken for: the Australian population aged 2 years and above, children aged 2-5 years, children aged 6-12 years, adolescents aged 13-18 years, adults aged 19-24 years, adults aged 25 years and above. The estimated dietary exposure to each individual colour was compared to the relevant internationally accepted Acceptable Daily Intake (ADI) to determine whether dietary exposure on a daily basis was likely to cause an appreciable health concern. For the Australian population and all population sub-groups assessed, dietary exposure to individual added colours was below the ADI even for high (90th percentile) consumers. This survey provides significant reassurance that there is no public health and safety risk from the consumption of foods containing added colours as part of a balanced diet.

ii
ACKNOWLEDGEMENTS FSANZ would like to thank the following organisations or people:
South Australia Department of Health for the provision of analytical data of colours in processed foods and beverages, for inclusion in this report.
The staff of the National Measurement Institute for sample acquisition, analyses and
technical advice.

iii
TABLE OF CONTENTS EXECUTIVE SUMMARY ....................................................................................................................................... i
ACKNOWLEDGEMENTS ..................................................................................................................................... ii
TABLE OF CONTENTS .......................................................................................................................................iii
LIST OF TABLES ................................................................................................................................................ iv
LIST OF FIGURES .............................................................................................................................................. iv
ABBREVIATIONS ................................................................................................................................................ v
1. BACKGROUND .......................................................................................................................................... 1
1.1 Food Colours ....................................................................................................................................... 1 1.2 Permissions for added colours in the Australia New Zealand Food Standards Code .......................... 1 1.3 The survey .......................................................................................................................................... 3
2. SURVEY OF ADDED COLOURS IN FOOD ................................................................................................ 4
2.1 Colours surveyed ................................................................................................................................ 4 2.2 Survey Design ..................................................................................................................................... 4 2.3 Sampling ............................................................................................................................................. 4 2.4 Analysis ............................................................................................................................................... 5 2.5 Assumptions relating to the analytical results reported as < LOQ ....................................................... 6
3. DIETARY EXPOSURE ASSESSMENT APPROACH .................................................................................. 7
3.1 What is a dietary exposure assessment? ................................................................................................... 7 3.2 Population groups assessed ...................................................................................................................... 7 3.3 Dietary exposure assessment approach .................................................................................................... 8 3.4 Dietary survey data .................................................................................................................................. 10 3.5 Mapping ................................................................................................................................................... 10 3.6 Scenarios examined ................................................................................................................................. 11
3.6.1 Mean Colours Scenario .................................................................................................................... 11 3.6.2 Maximum Colours Scenario .............................................................................................................. 11
3.7 Use of hydration factors ........................................................................................................................... 11 3.8 Assumptions made in the dietary exposure assessments ........................................................................ 11 3.9 Limitations of the dietary exposure assessments ..................................................................................... 12
4. FOOD SURVEY ANALYTICAL RESULTS ................................................................................................. 13
4.1 Detections of added colours in foods and beverages ........................................................................ 13 4.2 Mean, maximum and minimum concentrations of each added colour in foods and beverages ........ 16
4.2.1 Cakes, Muffins, Pastries ........................................................................................................... 17 4.2.2 Soft Drink ................................................................................................................................. 18 4.2.3 Ice Cream/Ice Confection ......................................................................................................... 19 4.2.4 Cordial ...................................................................................................................................... 20 4.2.5 Flavoured Milk and Flavoured Soy Beverages .......................................................................... 21 4.2.6 Confectionery............................................................................................................................ 21
4.3 Comparison of colour labelling on products with analytical results ........................................................... 23
5. DIETARY EXPOSURE .............................................................................................................................. 24
5.1 Results ..................................................................................................................................................... 24 5.1.1 Estimated dietary exposures to added colours for the Australian population aged 2 years and above (Mean Colours Scenario) ........................................................................................................................... 25 5.1.2 Estimated dietary exposures to added colours for children aged 2-5 years (Mean Colours Scenario) 26

iv
5.1.3 Estimated dietary exposures to added colours for children aged 6-12 years (Mean Colours Scenario) 27
5.2 Major contributors to dietary exposure to individual added colours .......................................................... 28 5.2.1 Major contributors to dietary exposures for the population aged 2 years and above (Mean Colours Scenario) 28 5.2.2 Major contributors to dietary exposures for children aged 2-5 years (Mean Colours Scenario) ......... 29 5.2.3 Major contributors to dietary exposures for children aged 6-12 years (Mean Colours Scenario) ....... 30
5.3 Maximum Colours Scenario ..................................................................................................................... 31 5.3.1 Estimated dietary exposures to individual added colours at the 90th percentile (consumers only) ..... 31
6. RISK CHARACTERISATION ..................................................................................................................... 32
6.1 Approach to Risk Characterisation ........................................................................................................... 32 6.2 Mean Colours Scenario ............................................................................................................................ 33
6.2.1 Australian population aged 2 years and above ................................................................................. 33 6.2.2 Australian population aged 2-5 years ................................................................................................ 35 6.2.3 Australian population aged 6-12 years .............................................................................................. 36
6.3 Maximum Colours Scenario ..................................................................................................................... 37 6.3.1 Australian population aged 2 years and above (Maximum Colours Scenario) .................................. 38 6.3.2 Australian population aged 2-5 years (Maximum Colours Scenario) ................................................. 39 6.3.3 Australian population aged 6-12 years .............................................................................................. 40
6.4 Summary .................................................................................................................................................. 41
7. CONCLUSION ........................................................................................................................................... 41
8. REFERENCE LIST ......................................................................................................................................... 43
LIST OF TABLES
Table 1: Colour permissions in the Code ............................................................................................................. 2 Table 2: ADIs for individual colours ................................................................................................................... 32
LIST OF FIGURES
Figure 1: Approach to dietary exposure assessment and risk characterisation for added colours ........................ 9 Figure 2: Approach to mapping survey foods to NNS foods ............................................................................... 10 Figure 3: Concentrations of total added colours in surveyed foods and beverages as a percentage of the MPL 14 Figure 4: The mean and range of total synthetic colour concentrations in food .................................................. 15 Figure 5: The mean and range of total synthetic colour concentrations in beverages ........................................ 15 Figure 6: The mean and range of concentrations for colours detected in cakes, muffins, pastries .................... 17 Figure 7: The mean and range of concentrations for colours detected in soft drink ............................................ 18 Figure 8: The mean and range of concentrations for colours detected in ice cream/ice confection .................... 19 Figure 9: The mean and range of concentrations for colours detected in cordial ................................................ 20 Figure 10: The mean and range of concentrations for colours detected in flavoured milk and flavoured soy beverages .......................................................................................................................................................... 21 Figure 11: The mean and range of concentrations for colours detected in confectionery ................................... 22 Figure 12: The consistency of labelling and analytical results obtained in the FSANZ and South Australian surveys ............................................................................................................................................................... 23 Figure 13: Estimated mean and 90th percentile dietary exposures for 2 years and above (consumers only) ..... 25 Figure 14: Estimated mean and 90th percentile dietary exposures for 2-5 years (consumers only) ................... 26 Figure 15: Estimated mean and 90th percentile dietary exposures for 6-12 years (consumers only) ................. 27 Figure 16: Major contributors to dietary exposures for the population aged 2 years and above* ........................ 28 Figure 17: Major contributors to dietary exposures for children aged 2-5 years* ................................................ 29 Figure 18: Major contributors to dietary exposures for children aged 6-12 years* .............................................. 30 Figure 19: Dietary exposure to added colours for the Australian population 2 years and above as a percentage of the ADI (consumers only) ............................................................................................................................... 34 Figure 20: Dietary exposure to added colours for the children 2-5 years as a percentage of the ADI (consumers only) ................................................................................................................................................................... 35 Figure 21: Dietary exposure to added colours for children aged 6-12 years as percentage of the ADI (consumers only) ................................................................................................................................................................... 36 Figure 22: Dietary exposure at 90th percentile for consumers (2 years and above) to added colours, as a percentage of the ADI, under the Maximum Colours Scenario ........................................................................... 38

v
Figure 23: Dietary exposure at 90th percentile for consumers (children aged 2-5 years) to added colours, as a percentage of the ADI, under the Maximum Colours Scenario ........................................................................... 39 Figure 24: Dietary exposure at 90th percentile for consumers (children aged 6-12 years) to added colours, as a percentage of the ADI, under the Maximum Colours Scenario ........................................................................... 40
ABBREVIATIONS ADI Acceptable Daily Intake
CE Capillary Electrophoresis
DIAMOND Dietary Modelling of Nutritional Data (FSANZ computer software program), based on food consumption data from the 1995 NNS
FAO Food and Agriculture Organization
FSANZ Food Standard Australia New Zealand
HPLC High Performance Liquid Chromatography
JECFA Joint FAO/WHO Expert Committee on Food Additives
LC-MS Liquid Chromatography – Mass Spectrometry
LOD Limit of Detection
LOQ Limit of Quantification
LOR Limit of Reporting
MECC Micellar Electrokinetic Capillary Chromatography
mg/kg Milligrams per kilogram
mg/kg bw Milligrams per kilogram of body weight
MPL Maximum Permitted Level
NMI National Measurement Institute
NNS National Nutrition Survey
PQL Practical Quantitation Limit
Total Synthetic Colour
The total concentration of colours listed in Schedule 4 of the Code
TLC Thin Layer Chromatography
WHO World Health Organization
Note: Definitions for some of these abbreviations can be found in Appendix 1.

1
1. BACKGROUND 1.1 Food Colours The addition of colours to food and beverages has been common practice for many centuries. Colours were generally added to serve as a visual cue for quality, to induce the perception of flavour and to meet consumer expectations (Ghorpade et al., 1995). The addition of colours to food and beverages has continued and still occurs today in the manufacture of products such as biscuits, pastry products, cakes, processed meats, cheese, margarine, confectionery, ice cream, cordials and soft drink. The addition of colours to foods and beverages also serves a number of technological purposes. These include: the offset of colour loss caused by processing conditions such as temperature, time and heat; enhancement of colours already present in the food; provision of batch to batch uniformity thereby preserving the food’s identification; and to protect flavours and vitamins that may be sensitive to sunlight during storage (Ghorpade et al., 1995). In 1906 the U.S Food and Drug Act permitted the addition of seven colours, including Amaranth, Ponceau 4R, Erythrosine and Indigotine to foods. In 1938 this was superseded by the Federal Food, Drug & Cosmetic (FD&C) Act where mandatory certification of food colours followed (U.S Food and Drug Administration, 1993; Ghorpade et al., 1995). In Australia, 14 synthetic food colours are permitted to be added to foods and beverages (Table 1). These permitted colours are manufactured for use as ‘dyes’ or ‘lakes’ which differ in their physical and chemical properties. Dyes are water soluble and are commonly used in dairy products, beverages and dry mixes (U.S Food and Drug Administration 1993). Conversely, lakes are water insoluble and are typically used in products such as cake mixes, chewing gum and boiled lollies due to the fat or oil content or limited moisture in the food matrix (U.S Food and Drug Administration 1993). 1.2 Permissions for added colours in the Australia New Zealand Food Standards Code The Australia New Zealand Food Standards Code (the Code) sets out the colours that are permitted to be added to food, the maximum levels at which colours may be added and the type of foods that may contain permitted colours. The Code also requires that all colours added to foods be declared on the ingredient list of food labels. In the Code, Standard 1.3.1 Food Additives, sets out the permissions for the use of food colours in Schedules 1, 3 and 4. Schedule 1 outlines the permitted use of added colours by food type and the Maximum
Permitted Levels (MPLs) for added colours that are not included in Schedule 3 or Schedule 4.
Schedule 3 outlines the added colours permitted to be used in accordance with Good Manufacturing Practice (GMP) in processed foods specified in Schedule 1.
Schedule 4 outlines the MPLs for added colours in processed foods specified in Schedule 1.
Clause 6 of Standard 1.3.1 of the Code deals with additives that perform the same function. That clause provides:
2
(1) Where two or more additives may be added to a food for the purpose of achieving the same technological function, those additives may be used singly or in combination.
(2) Where two or more additives are used in combination to achieve the same
technological function, the sum of the quantities obtained by dividing the amount of each food additive used by the maximum permitted level for that food additive must not exceed 1.
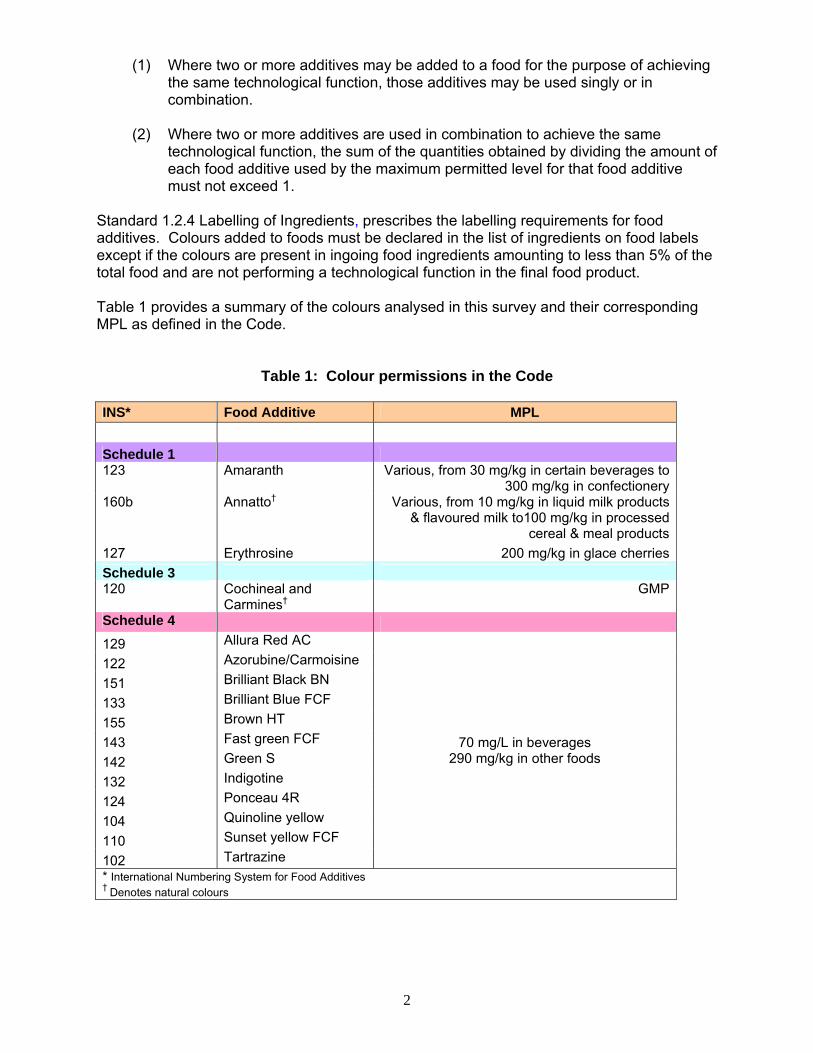
Standard 1.2.4 Labelling of Ingredients, prescribes the labelling requirements for food additives. Colours added to foods must be declared in the list of ingredients on food labels except if the colours are present in ingoing food ingredients amounting to less than 5% of the total food and are not performing a technological function in the final food product. Table 1 provides a summary of the colours analysed in this survey and their corresponding MPL as defined in the Code.
Table 1: Colour permissions in the Code INS* Food Additive MPL
Schedule 1 123 Amaranth Various, from 30 mg/kg in certain beverages to
300 mg/kg in confectionery160b Annatto† Various, from 10 mg/kg in liquid milk products
& flavoured milk to100 mg/kg in processed cereal & meal products
127 Erythrosine 200 mg/kg in glace cherries
Schedule 3 120 Cochineal and
Carmines† GMP
Schedule 4
129 Allura Red AC
70 mg/L in beverages 290 mg/kg in other foods
122 Azorubine/Carmoisine
151 Brilliant Black BN
133 Brilliant Blue FCF
155 Brown HT
143 Fast green FCF
142 Green S
132 Indigotine
124 Ponceau 4R
104 Quinoline yellow
110 Sunset yellow FCF
102 Tartrazine * International Numbering System for Food Additives †
Denotes natural colours
3
1.3 The survey A review of all permitted food additives was undertaken as part of the overarching review of the then Australian Food Standards Code, which was completed in 2000. During this review, FSANZ identified data gaps for some colours and potential concerns for specific colours if added to food at the MPL. Consequently, it was recommended that actual levels of added colours in food be determined to allow a more refined estimate of dietary exposure. Following this recommendation, FSANZ commissioned an analytical survey to investigate the actual levels of added colours in processed foods and beverages. Analytical results were also compared to ingredients declared on product labels to assess the consistency with the labelling requirements in the Code. In 2006, 396 samples were collected and analysed for added colours. The results of the FSANZ survey were combined with results of a South Australian survey of synthetic colours in foods (SA Department of Health, 2005), sampled in 2004, to give information from a total 651 samples.

4
2. SURVEY OF ADDED COLOURS IN FOOD 2.1 Colours surveyed The colours investigated in this survey are listed in Table 1. They were selected based on the following criteria. These criteria are not listed in any particular order and colours surveyed were required to meet some, or all, of the criteria.
the colour has an Acceptable Daily Intake (ADI) set by the FAO/WHO Joint Expert Committee on Food Additives (JECFA)
the colour is permitted for use in Australia there is general use of the colour, or extensive use within specific food categories estimated dietary exposure might be expected to exceed the ADI for some or all
population groups if the colour is added to all permitted foods at the MPL under the Code
the colour has previously been identified as a cause for concern for public health and safety either in Australia or elsewhere
the colour has been raised as an issue of community concern there is a gap in the available Australian data that needs to be addressed the colour is technically suitable for analysis the costs associated with analysis of the colour meet the budget constraints.
2.2 Survey Design In designing the survey, FSANZ undertook thorough desk-based investigation of food label information recorded in the FSANZ Food Labels Database and provided by food companies’ websites, and field-based research of products for sale at various retail outlets (supermarkets, bakeries and convenience stores) in order to identify the products which contained the colours of interest in the survey. Products which claimed to contain ‘no added colours’ or ‘no artificial colour’ were also targeted if, based on their appearance and food type, they might contain colours not declared on the label. Market share data were used to guide the brands and varieties of foods to target when sampling. The categories of foods selected for sampling were based on the food categories in Standard 1.3.1, that have permissions for added colours. The number of samples collected for each food category was determined according to the extent of use of colours in that category. More samples were collected for food categories with widespread use, e.g. confectionery, and fewer samples collected for categories with limited use, e.g. breakfast cereal. The specific foods to sample in each category were selected to represent the foods reported to be consumed in the 1995 National Nutrition Survey (NNS). This was done to enable precise and accurate matching (or ‘mapping’) of surveyed foods to consumed foods in order to achieve a highly refined dietary exposure estimate. 2.3 Sampling FSANZ developed and provided comprehensive sampling instructions to the National Measurement Institute (the NMI), which was the successful tenderer, to purchase, prepare and analyse food samples for the survey. Samples were collected from various retail outlets and locations in Melbourne. The majority of foods and beverages selected for sampling were nationally available and, accordingly, not expected to show regional variation. The samples were collected over a 3 month period from June to August 2006.

5
In a small number of cases, foods and beverages were sampled which claimed to contain ‘no added colour’ or ‘no artificial colour’ but from appearance may have contained undeclared colours. Since colours are specifically added to foods at the time of manufacture, a variety of processed foods were sampled in the survey. A total of 396 samples were collected of foods and beverages, including: confectionery, ice cream, cheese, yoghurt, margarine, flavoured milk, flavoured soy beverages, soft drink, cordial, fruit drink, alcoholic drinks, biscuits, cakes, pastries, savoury snacks, coloured breakfast cereal, pre-prepared meals, processed meats, sauces, toppings, jams/conserves and jelly. Each sample was analysed individually as purchased, with the exception of pick-and-mix confectionery (soft-type and jelly-type), wheat biscuit type breakfast cereal and extruded type breakfast cereal, where multiple products were composited prior to analysis. The purchasing instructions provided to the NMI are included at Appendix 2 and the full list of foods sampled for the FSANZ and South Australian surveys is at Appendix 3. The analytical results of 255 samples of processed food and beverages provided by the South Australian Department of Health, were collected in South Australia in 2004 and were prepared and analysed by the NMI using the same analytical method. 2.4 Analysis The analysis of 14 synthetic colours in the FSANZ survey was performed by the NMI in August/September 2006. The method of analysis employed was Micellar Electrokinetic Capillary Chromatography (MECC) and confirmatory analysis was performed by Thin Layer Chromatography (TLC). The limit of detection (LOD) by this method was 2 mg/kg and the limit of reporting was set at 5 mg/kg. However, for the purposes of this report, a limit of quantification (LOQ), an LOR equivalent, was chosen for each colour (refer to definitions in Appendix 1). The LOQ refers to the lowest concentration of a chemical that can be detected and quantified, with an acceptable degree of certainty, using the specified laboratory method and equipment. Advanced Analytical Australia was subcontracted by the NMI to undertake the method development and analysis for Annatto and Cochineal/Carmine. The method of analysis used for the determination of Annatto was an extraction followed by High Performance Liquid Chromatography (HPLC). Since Annatto is determined as Bixin and Norbixin, the practical quantitation limit (PQL) was set at 0.5 mg/kg for each of these compounds. The method of analysis used for the determination of Cochineal/Carmine was an extraction followed by Liquid Chromatography – Mass Spectrometry (LC-MS). Cochineal/Carmine is determined as Carminic Acid and the PQL was set at 0.5 mg/kg. The PQL is equivalent to the LOQ and is used by some laboratories instead of the LOQ. For the analysis of foods and beverages collected for the 2004 South Australian survey, the MECC and TLC were also the techniques employed for this analysis by the NMI. See Appendix 4 for complete information on the analytical methods.
6
2.5 Assumptions relating to the analytical results reported as < LOQ A number of assumptions were made about the concentration of added colours in the food samples where the analytical results were below the LOQ. The analytical methods used in this survey set the LOQ for synthetic colours at 5 mg/kg and at 0.5 mg/kg for Cochineal/Carmine and Annatto. For the synthetic colour analyses, results were also provided for detections at trace amounts by the Thin Layer Chromatography (TLC) and at concentrations between zero and the LOQ by Capillary Electrophoresis (CE). For the synthetic colour results reported at < LOQ from this survey, it was assumed that, if the colours were not detected by TLC or CE, then their concentrations were zero. For results reported at <LOQ that were detected at trace amounts or levels between zero and the LOQ, a concentration level of ½ LOQ (2.5 mg/kg) was assumed. For the Annatto and Cochineal/Carmine results and the South Australian survey results, no information was available on detections < LOQ. Since the colours investigated in the survey would generally be present in foods only due to intentional addition and not natural occurrence, it was assumed for these results that concentrations were zero for colours < LOQ and not declared on the food label. For colours reported as <LOQ and included on the food label in the list of ingredients, it was assumed that the concentrations would be between zero and the LOQ, assuming that the colour had been added as reported on the food label. In these cases, concentrations of ½ LOQ were assumed as assigning concentrations of zero could underestimate levels of these colours. Conversely, assigning concentrations equal to the LOQ could significantly overestimate levels. The results for Annatto were based on the sum of the analytical results for Bixin and Norbixin. Since Annatto is added to foods in the form of either Bixin or Norbixin and not a combination of the two, concentrations of ½ LOQ were assigned to Annatto where it was declared on the label and both Bixin and Norbixin were reported as <LOQ. This approach was taken as to sum ½ LOQ for Bixin and Norbixin would overestimate the actual level of Annatto.

7
3. DIETARY EXPOSURE ASSESSMENT APPROACH
3.1 What is a dietary exposure assessment? Dietary modelling is a tool used to estimate exposure to food chemicals from the diet as part of the risk assessment process. Dietary modelling uses food chemical concentration data in combination with food consumption data to calculate estimates of dietary exposure. These can then be compared to established reference health standards. Food regulators have used dietary modelling techniques internationally for many years as part of the risk assessment process to determine if dietary exposure to specific food chemicals represents an unacceptable risk to public health and safety. The accuracy of dietary exposure estimates relies on the quality of both the food concentration and consumption data used in the dietary modelling. At times, the availability of accurate data may be limited, therefore assumptions are made, either about the foods eaten or about chemical levels, based on previous knowledge and experience. The models are designed in accordance with international conventions for food chemical exposure estimates, however, each dietary exposure assessment process is different and requires individual decisions and assumptions to be made. Therefore, FSANZ clearly documents all decisions and model assumptions so results can be understood in the context of the available data. This assists FSANZ in considering the outputs of a risk assessment. 3.2 Population groups assessed Dietary exposure assessments were conducted for the Australian population aged 2 years and above as a proxy for lifetime exposure. Assessments were also conducted for the Australian population sub-groups aged: 2-5 years 6-12 years 13-18 years 19-24 years 25 years and above. The Australian population was divided into these sub-groups because each group represents a different stage of life and therefore aims to capture the associated differences in food consumption. For example, school children aged 6-12 years are likely to exhibit different food preferences and consume different quantities of food compared to adults aged 19-24 years. Separate dietary exposure estimates were calculated for males and females in each population group. However, the results are not included in the risk assessment or presented in the report as there did not appear to be a difference between estimated exposures to colours for males and females on a body weight basis and there is little difference between the genders in terms of the toxicological effects of colours. Dietary exposure assessments were conducted for children because children generally have higher exposures due to their smaller body weight, and they consume more food per kilogram of body weight compared to adults. Additionally, food colours are often added to foods that may appeal to children and concerns have been raised about the potential effects of colours on children. It is important to note that, while children aged 2-5 years, 6-12 years and adolescents 13-18 years have been assessed as separate groups, these groups have also been assessed in the whole population’s dietary exposure assessment.

8
This report presents the dietary exposure assessments for the population aged 2 years and above and the population sub-groups aged 2-5 years and 6-12 years. The dietary exposure estimates for the other population sub-groups can be found in Appendix 7, Tables A7.1-7.14. 3.3 Dietary exposure assessment approach The dietary exposure assessment was conducted using dietary modelling techniques that combined food consumption data with food colour concentration data, to estimate dietary exposure to added colours from food. The dietary exposure assessment was conducted using FSANZ’s dietary modelling computer program, DIAMOND.
Dietary exposure = food colour concentration x food consumption Dietary exposures to colours were estimated by combining usual patterns of food consumption, as derived from the 1995 National Nutrition Survey (NNS) data, with current concentrations of colours in foods, as determined from the analytical food surveys. The approach used for the dietary exposure assessment of colours is shown in Figure 1.

9
Food survey
Dietary exposure assessment
Risk characterisation
Figure 1: Approach to dietary exposure assessment and risk characterisation for added colours
1. Select optimum foods to assess Foods best representing the overall diet containing added colours to be assessed
5. Determine scenarios to model
5a. Mean Colours Scenario Mean concentration of each colour from the foods analysed
6. Estimate dietary exposure to added colours for Mean Colours Scenario and Maximum Colours Scenariofor population sub groups specified Dietary Exposure = food colour concentration x food consumption amount from National Nutrition Survey
7. Compare estimated dietary exposure to added colours for ‘Mean Colours’ Scenario and ‘Maximum Colours’ Scenario with ADI for each population sub group
4. Select population groups to assess Australian population 2-5 years, 6-12 years, 13-18 years, 19-24 years, 25 years and above and 2 years and above
2. Determine colour concentrations in analysed foods Laboratory analysis of survey foods
3. Determine NNS foods that contain added coloursMap the survey foods to the foods consumed in the NNS
5b. Maximum Colours Scenario Maximum concentration of each colour from the foods analysed

10
3.4 Dietary survey data DIAMOND contains dietary survey data for the 1995 Australian NNS that surveyed 13,858 people aged 2 years and above. The NNS used a 24-hour food recall methodology. It is recognised that these survey data have some limitations. For a complete list of limitations see Section 3.9. 3.5 Mapping A major step in the dietary exposure assessment process is matching (or mapping) the 651 survey foods to the foods reported as consumed in the NNS. This process entailed compiling the sampled foods into sub-groups of similar foods and assigning colour concentrations from the sampled foods to each sub-group of foods surveyed. For example, the twelve samples of chocolate flavoured milk were grouped into the sub-group ‘Flavoured milk, chocolate’, the one sample of iced coffee flavoured milk was assigned to its own sub-group ‘Flavoured milk, coffee’ and the six samples of strawberry flavoured milk were compiled into the sub-group ‘Flavoured milk, other’. For each food sub-group, the mean and maximum analytical concentrations of each colour were calculated and the food sub-group concentrations were then mapped to NNS food classification codes to estimate dietary exposure to colours. For example, the sub-group ‘Flavoured milk, chocolate’ was mapped to the NNS food ‘Drinking chocolate made from powder and chocolate milk’. For complete information on mapping, refer to Appendix 5.
Figure 2: Approach to mapping survey foods to NNS foods
SAMPLED FOODS – FLAVOURED MILK
Chocolate (11); Mocha (1); Iced coffee (1); Strawberry (4); Honeycomb (1); Strawberry thickshake (1)
Flavoured milk, Chocolate Flavoured milk, CoffeeFlavoured milk, Other flavours Thickshake, Strawberry
Drinking Chocolate made from powder & chocolate
milk
Coffee flavoured milk Flavoured milks, not chocolate or coffee
Thickshakes, not chocolate
FOOD SUBGROUPS
NNS FOODS

11
3.6 Scenarios examined For the purpose of this assessment, dietary exposures to added colours were calculated for two scenarios – the Mean Colours Scenario and Maximum Colours Scenario. 3.6.1 Mean Colours Scenario For the dietary modelling of the mean colours scenario, mean analytical concentrations of survey foods were assigned to their respective food sub-groups, as described in section 3.5 above. Both detect and ‘non–detect’ results were used to derive the mean analytical concentrations. Mean food colour concentrations were modelled as this represents the most realistic exposure for consumers of a range of brands and varieties of particular foods over a period of time. However, in some cases, exposures will be overestimated as the survey specifically targeted the products which contain the colours under investigation and excluded those which did not. Had food samples been collected randomly, it is likely that for many foods, the mean concentration of colours determined for those foods and related food sub-groups would be lower. The mean colour concentrations assigned to food sub-groups are provided in Appendix 5. 3.6.2 Maximum Colours Scenario In order to investigate the situation where products with the highest levels of colours detected may be consumed, dietary modelling was also conducted based on assigning the maximum analytical concentrations of the survey foods to their respective food sub-groups. The use of maximum food colour concentrations assumes that every processed food consumed contains the highest concentration of each colour detected in the survey. In general, this model will significantly overestimate exposure to added colours, except where products containing food colours at the highest levels of use are consumed every day. The maximum colour concentrations assigned to food sub-groups are provided in Appendix 5. 3.7 Use of hydration factors The foods sampled in the FSANZ survey were analysed as purchased and were not prepared to a ready-to-eat state prior to analysis. Therefore, for some food samples it was necessary to apply hydration factors to the food colour concentrations to account for dilutions that would occur due to food preparation, such as the addition of other ingredients, e.g. water to jelly crystals, and absorption of fluid during cooking, e.g. dried noodles. The foods requiring adjustments for preparation and the hydration factors applied are listed in Table 4.2 in Appendix 4. 3.8 Assumptions made in the dietary exposure assessments The aim of the dietary exposure assessment was to make as realistic an estimation of dietary exposure to colours from foods as possible. However, where significant uncertainties existed in the data, conservative assumptions were generally used to ensure that the dietary exposure assessment did not underestimate exposure. The assumptions made in the dietary exposure assessment are listed below, broken down into several categories.

12
Concentration data All the foods within the group contain the specified colour at the levels set out in
Appendix 4.
Where the concentration of a synthetic colour was detected at trace amounts (between zero and LOQ), the concentration of the colour in the food is equivalent to ½ LOQ.
For Annatto, concentrations of ½ LOQ were assigned where it was declared on the label and both Bixin and Norbixin were reported as <LOQ.
For Cochineal/Carmine and the South Australian survey samples where the colour concentration was less than the LOQ and labelled as being present, it was assumed that the colour concentration in the sample was ½ LOQ. Where the colour concentration was less than the LOQ and not labelled, it was assumed that the colour concentration in the sample was zero.
Where a food was not included in the exposure assessment, it was assumed to contain a zero concentration of added colour.
Where a food has a specified colour concentration, this concentration was carried over to mixed foods where the food had been used as an ingredient e.g. cheese used in a sandwich, bacon in a hamburger etc.
Consumption data
Consumption of foods as recorded in the 1995 NNS represents current food consumption patterns.
Consumer behaviour
Consumers always select the products containing the specified colours. This is an unrealistic situation which is likely to overestimate dietary exposure to added colours.
General
For the purpose of this assessment, it is assumed that 1 millilitre is equal to 1 gram for all liquid and semi-liquid foods (e.g. milk, yoghurt).
The contribution of complementary medicines and other medicines to colours exposure has not been taken into account.
These assumptions provide a conservative estimate for dietary exposure to colours. 3.9 Limitations of the dietary exposure assessments Dietary exposure assessments based on the 1995 NNS food consumption data provide the best estimate of actual consumption of a food and the resulting estimated dietary exposure to added colours for the population. However, it should be noted that the NNS data do have their limitations. These limitations relate to the age of the data and the changes in eating patterns that may have occurred since the data were collected. Generally, consumption of staple foods such as fruit, vegetables, meat, dairy products and cereal products, which make up the majority of most people’s diet, is unlikely to have changed markedly since 1995. However, there is uncertainty associated with the consumption of foods that may have changed in consumption since 1995, or that have been introduced to the market since (e.g. ready-to-drink pre-mixed vodka beverages).

13
Daily food consumption amounts for occasionally consumed foods, based on 24-hour food consumption data, tend to be higher than daily food consumption amounts for those foods based on a longer period of time. The 90th percentile dietary exposures have been reported to represent the potential exposures for high consumers on a daily basis over a lifetime of exposure. Over time, there may be changes to the ways in which manufacturers and retailers make and present foods for sale. Since the data were collected for the Australian NNS, there have been significant changes to the Code to allow more innovation in the food industry. As a consequence, another limitation of the dietary exposure assessment is that some of the foods that are currently available in the food supply were either not available or were not as commonly available in 1995. While the results of NNS can be used to describe the usual intake of groups of people, they cannot be used to describe the usual intake of an individual (Rutishauser, 2000). In particular, they cannot be used to predict how consumers will change their eating patterns as a result of an external influence such as the availability of a new type of food.
4. FOOD SURVEY ANALYTICAL RESULTS 4.1 Detections of added colours in foods and beverages The Schedule 1 colours Erythrosine, Annatto and Amaranth have specific permissions that vary for different food categories in the Code. In the survey, Erythrosine was not detected in any of the foods and beverages analysed. Erythrosine is only permitted in glace cherries to a maximum level of 200 mg/kg, however, it could be present in other foods such as fruit cake, that include glace cherries as an ingredient.
Annatto was detected in a wide range of foods and beverages, although at very low levels (mostly less than 1 mg/kg). The highest levels were found in ice cream (16 mg/kg) and margarine/table spread (8.4 mg/kg).
Amaranth was detected in confectionery (5 samples), cordial (5 samples), ice cream (15 samples), jelly (2 samples), alcoholic beverages (3 samples), soft drink (2 samples), sweet biscuits (1 sample), cakes, muffins, pastries (3 samples) and topping (2 samples). There are no permissions in the Code for Amaranth in biscuits, cakes, muffins, pastries or topping, however it could be present in these foods due to the use of Amaranth containing ingredients, for example strawberry jam used in a cake.
Cochineal/Carmine is listed under Schedule 3 of the Code and is permitted to be added to specified foods according to GMP. In the survey, Cochineal/Carmine was detected in a limited number of foods and beverages including: savoury sauce, flavoured milk, confectionery, cake, dip, dairy dessert, ice cream and yoghurt, mostly at levels less than 1 mg/kg. The highest concentrations of Cochineal/Carmine were found in savoury sauce (77 mg/kg) and confectionery (11 mg/kg).
The synthetic colours listed in Schedule 4 of the Code were detected in a wide range of foods with permissions under Schedule 1. The highest concentrations of Schedule 4 colours were found in cakes, muffins and pastries, soft drinks, ice cream/ice confection, confectionery, cordial, flavoured milk and flavoured soy beverages, confectionary and alcoholic drinks.

14
0
100
200
300
400
500
600
700
Less than 25% Between 25% and50%
Between 50% and75%
Between 75% and100%
More than 100%
Concentration of added colour as a % of the MPL
Nu
mb
er o
f sa
mp
les
The concentrations of Schedule 1 and Schedule 4 colours reported in the survey showed excellent compliance with the MPLs set out in the Code. Only 5 of the 651 samples analysed (<1%) contained added colours at levels that exceeded the MPLs in the Code (1 powdered instant custard, 2 alcoholic beverages, 1 flavoured milk and 1 extruded snack food)1. A further, 2 samples contained added colours at, or around, the MPLs (1 ice cream and 1 soft drink). However, most foods and beverages sampled contained added colours at levels well below the MPL, with >95% of samples containing levels below 50% of the MPL. The number of samples with added colours at various percentages of the MPL is shown in Figure 3.
Figure 3: Concentrations of total added colours in surveyed foods and beverages as a percentage of the MPL
The concentration range (mean, minimum and maximum) of total synthetic colour, for the samples in each food and beverage category is illustrated in Figures 4 and 5. The mean concentrations across all food categories were highest for ice cream/ice confection, topping and savoury snack foods (Figure 4). The mean concentrations across all beverage categories were highest for liqueur, pre-mixed alcoholic drinks and soft drink (Figure 5). The result for a sample of powdered instant chocolate custard analysed in the FSANZ survey was not included in Figure 4 as it was considered to be an anomaly in relation to all other results for dairy dessert, and its inclusion would grossly overestimate the mean. Summary results are provided in Appendix 4.
1 All non-compliant products were referred to the relevant jurisdiction for follow-up action.
Note to graph: Concentration as a % of the MPL was calculated based on the specific permissions for each colour detected in each food and beverage as set out in Schedule 1 and Schedule 4, and in line with the unity provision in Clause 6 (2) of Standard 1.3.1 as described in section 1of this report. For example, for a sample of confectionery containing 5 mg/kg Annatto (MPL = 25 mg/kg), 20 mg/kg Amaranth (MPL = 300 mg/kg)and 15 mg/kg Tartrazine (MPL = 290 mg/kg), the concentration of total added colour as a % of the MPL = (5/25+20/300+15/290) x 100 = 32%

15
0
50
100
150
200
250
300
350
400
Biscuit
s, sa
vour
y
Biscuit
s, sw
eet
Break
fast
cere
al
Cakes
, muf
fins,
pastr
ies
Chees
e
Confe
ction
ery
Dairy d
esse
rtDip
Ice cr
eam
/Ice
conf
ectio
n
Jam
/cons
erve
Jelly
Pasta
/noo
dles
Pastry
pro
ducts
, sav
oury
Pickles
/relis
hes
Pre-p
repa
red
mea
ls
Proce
ssed
mea
t
Sauce
s, sa
vour
y
Snack
bar
s
Snack
food
s, sa
vour
y
Toppin
g
Yoghu
rt
Food
Co
nce
ntr
atio
n o
f T
ota
l S
ynth
etic
Co
lou
rs (
mg
/kg
)
Mean
Figure 4: The mean and range of total synthetic colour concentrations in food
Figure 5: The mean and range of total synthetic colour concentrations in beverages
0
20
40
60
80
100
120
140
160
180
Cordia
l
Flavou
red
milk
and
flavo
ured
soy b
ever
ages
Fruit j
uice/
drink
Lique
ur
Pre-m
ixed
alcoh
olic d
rink
Soft d
rink
Beverage
Co
nce
ntr
atio
n o
f T
ota
l S
ynth
etic
Co
lou
rs (
mg
/kg
)
Mean
0
20
40
60
80
100
120
140
160
180
Cordia
l
Flavou
red
milk
and
flavo
ured
soy b
ever
ages
Fruit j
uice/
drink
Lique
ur
Pre-m
ixed
alcoh
olic d
rink
Soft d
rink
Beverage
Co
nce
ntr
atio
n o
f T
ota
l S
ynth
etic
Co
lou
rs (
mg
/kg
)
Mean

16
4.2 Mean, maximum and minimum concentrations of each added colour in foods and beverages The mean, maximum and minimum concentrations of each added colour were also investigated in food categories that contained the most added colours. These included:
Cakes, muffins and pastries Soft drinks Ice cream/ice confection Cordial Flavoured milk and flavoured soy beverages Confectionary
The range of concentrations for colours detected in these food categories is summarised in Figures 4-10. No food categories were reported to contain all 16 colours. Summary concentration data for all foods categories are provided in Appendix 4.

17
0
20
40
60
80
100
120
Allura
Red
Amar
anth
Annat
to
Azoru
bine
Brillian
t Blac
k
Brillian
t Blue
Brown
HT
Cochin
eal/C
arm
ine
Ponce
au 4
R
Quinoli
ne ye
llow
Sunse
t Yell
ow F
Tartra
zine
Co
nce
ntr
atio
n o
f ad
ded
co
lou
rs (
mg
/kg
)
Mean
4.2.1 Cakes, Muffins, Pastries The mean, maximum and minimum concentration of each detected colour in cakes, muffins and pastries are reported in Figure 6. All colours were detected in this food category, except for Fast Green, Green S, Indigotine and Erythrosine (Appendix 4). The maximum concentration of each colour was <50 mg/kg except for Brown HT and Sunset Yellow which had the highest maximum concentrations of 100 mg/kg and 89 mg/kg respectively. The highest mean concentrations were reported for Brown HT and Tartrazine (10.1 mg/kg and 3.8 mg/kg respectively). In contrast, Annatto and Brilliant Black had the lowest maximum and mean concentrations in the food category of cakes, muffins and pastries.
Figure 6: The mean and range of concentrations for colours detected in cakes, muffins, pastries
Colour

18
0
10
20
30
40
50
60
70
Allura
Red
Amar
anth
Azoru
bine
Brillian
t Blue
Cochin
eal/C
arm
ine
Ponce
au 4
R
Sunse
t Yell
ow
Tartra
zine
Co
nce
ntr
atio
n o
f ad
ded
co
lou
rs (
mg
/L)
Mean
4.2.2 Soft Drink The mean, maximum and minimum concentrations of each colour in soft drink are reported in Figure 7. Eight colours were detected in this category, including Allura Red, Amaranth, Azorubine, Brilliant Blue, Cochineal/Carmine, Ponceau 4R, Sunset Yellow and Tartrazine (Appendix 4). The highest maximum concentrations in soft drink were reported for Allura Red (58 mg/L), Sunset Yellow (54 mg/L) and Tartrazine (48 mg/kg). At the mean, Sunset Yellow and Tartrazine had the highest concentrations of 8.2 mg/L and 3.7 mg/L respectively. The lowest maximum and mean concentrations in soft drink were for Cochineal/Carmine and Ponceau 4R.
Figure 7: The mean and range of concentrations for colours detected in soft drink
Colour

19
0
20
40
60
80
100
120
140
160
180
Allura
Red
Amar
anth
Annat
to
Azoru
bine
Brillian
t Blue
Brown
HT
Cochin
eal/C
arm
ine
Green
S
Indig
otine
Ponce
au 4
R
Sunse
t Yell
ow
Tartra
zine
Co
nce
ntr
atio
n o
f ad
ded
co
lou
rs (
mg
/kg
)
Mean
4.2.3 Ice Cream/Ice Confection The mean, maximum and minimum concentrations of each colour in ice cream/ice confection are reported in Figure 8. Twelve colours were detected in this category. Colours not detected included Erythrosine, Brilliant Black, Fast Green and Quinoline Yellow (Appendix 4). The highest maximum and mean concentrations in ice cream/ice confection were reported for Brilliant Blue (160 mg/kg and 8.2 mg/kg respectively), Tartrazine (110 mg/kg and 10.1 mg/kg respectively) and Brown HT (99 mg/kg and 3.8 mg/kg respectively). The lowest maximum and mean concentrations found in ice cream/ice confection were for Cochineal/Carmine and Allura Red. Figure 8: The mean and range of concentrations for colours detected in ice cream/ice
confection
Colour
20
0
5
10
15
20
25
30
Amar
anth
Azoru
bine
Brillian
t Blue
Cochin
eal/C
arm
ine
Sunse
t Yell
ow
Tartra
zine
Co
nce
ntr
atio
n o
f ad
ded
co
lou
rs (
mg
/L)
Mean
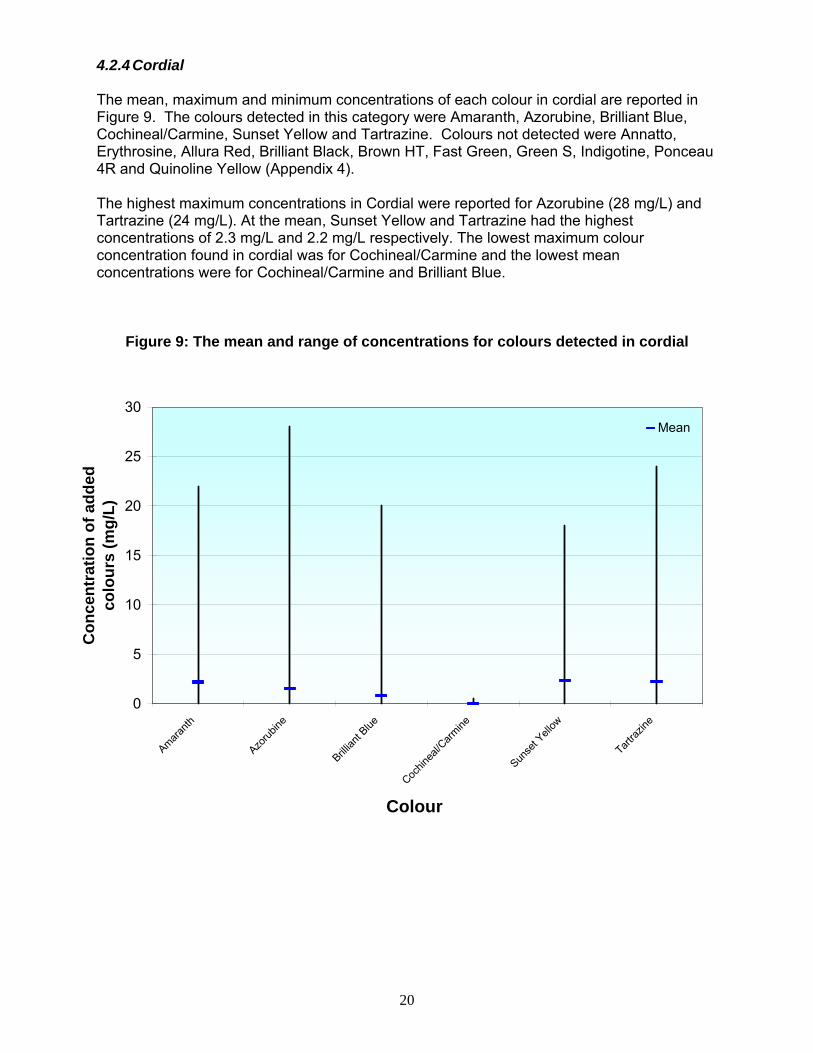
4.2.4 Cordial The mean, maximum and minimum concentrations of each colour in cordial are reported in Figure 9. The colours detected in this category were Amaranth, Azorubine, Brilliant Blue, Cochineal/Carmine, Sunset Yellow and Tartrazine. Colours not detected were Annatto, Erythrosine, Allura Red, Brilliant Black, Brown HT, Fast Green, Green S, Indigotine, Ponceau 4R and Quinoline Yellow (Appendix 4). The highest maximum concentrations in Cordial were reported for Azorubine (28 mg/L) and Tartrazine (24 mg/L). At the mean, Sunset Yellow and Tartrazine had the highest concentrations of 2.3 mg/L and 2.2 mg/L respectively. The lowest maximum colour concentration found in cordial was for Cochineal/Carmine and the lowest mean concentrations were for Cochineal/Carmine and Brilliant Blue.
Figure 9: The mean and range of concentrations for colours detected in cordial
Colour

21
0
10
20
30
40
50
60
70
Allura
Red
Azoru
bine
Brillian
t Blue
Brown
HT
Cochin
eal/C
arm
ine
Ponce
au 4
R
Sunse
t Yell
ow
Tartra
zine
Co
nce
ntr
atio
n o
f ad
ded
co
lou
rs (
mg
/L)
Mean
4.2.5 Flavoured Milk and Flavoured Soy Beverages The mean, maximum and minimum concentrations of each colour in flavoured milk and flavoured soy beverages are reported in Figure 10. Eight colours were detected in this category, including Allura Red, Azorubine, Brilliant Blue, Brown HT, Cochineal/Carmine, Ponceau 4R, Sunset Yellow and Tartrazine. Colours not detected were Amaranth, Annatto, Erythrosine, Brilliant Black, Fast Green, Green S, Indigotine and Quinoline Yellow (Appendix 4). The highest maximum and mean concentrations in flavoured milk and flavoured soy beverages were reported for Tartrazine (65 mg/L and 4.6 mg/L respectively) and Sunset Yellow (49 mg/L and 2.6 mg/L respectively). The lowest maximum concentrations were reported for Azorubine and Brown HT and the lowest mean concentrations in flavoured milk and flavoured soy beverages were for Cochineal/Carmine, Azorubine and Ponceau 4R.
Figure 10: The mean and range of concentrations for colours detected in flavoured
milk and flavoured soy beverages
4.2.6 Confectionery
Colour

22
0
20
40
60
80
100
120
140
160
180
Allura
Red
Amar
anth
Annat
to
Azoru
bine
Brillian
t Blac
k
Brillian
t Blue
Brown
HT
Cochin
eal/C
arm
ine
Indig
otine
Ponce
au 4
R
Quinoli
ne ye
llow
Sunse
t Yell
ow
Tartra
zine
Co
nce
ntr
atio
n o
f a
dd
ed
colo
urs
(m
g/k
g)
Mean
The mean, maximum and minimum concentrations of each colour in confectionery are reported in Figure 11. All colours, except for Erythrosine, Fast Green and Green S, were detected in this category (Appendix 4). The highest maximum and mean concentrations in confectionery were reported for Allura Red (160 mg/kg and 8.3 mg/kg respectively) and Azorubine (160 mg/kg and 6.8 mg/kg respectively). In contrast, the lowest maximum and mean concentrations in confectionery were reported for Annatto and Brown HT. Figure 11: The mean and range of concentrations for colours detected in confectionery
Colour

23
4.3 Comparison of colour labelling on products with analytical results To assess the level of consistency between product ingredients and product labelling, a comparison was made between the analytical results and the colours listed on food and beverage labels. Assessment of label consistency showed that, in most cases, the colours detected in foods by the analysis were correctly labelled on the food products with only 12 (3%) of the 396 FSANZ samples and 10 (4%) of the 255 SA samples found to contain quantifiable levels of one or more added colours that were not declared on the label (Figure 13). Interestingly the more common labelling deficiency was the listing of colours on food labels that were not quantified or detected by the analysis. A total of 88 FSANZ samples (22%) out of 396 had one or more colours declared on the label that were not detected by the analysis. This indicates that manufacturers may take a conservative approach to labelling added food colours.
Figure 12: The consistency of labelling and analytical results obtained in the FSANZ and South Australian surveys
FSANZ Analytical Survey†
Detected and not labelled
3 %
Detected and labelled
97 %
SA Analytical Survey‡
Detected and not labelled 4 %
Detected and labelled
96 %
† Number of FSANZ samples= 396 ‡ Number of SA samples = 255

24
5. DIETARY EXPOSURE 5.1 Results Estimates of dietary exposure can be calculated for ‘all respondents’ and/or ‘consumers only’. ‘Respondents’ refers to all people included in the population group being assessed regardless of whether they were exposed to the food chemical or not. ‘Consumers only’ refers to those people who reported consuming food containing the food chemical being assessed. Not all respondents in each population group were consumers of foods containing the colours being assessed. Therefore, results have been reported for consumers only, as this provides the most conservative estimate of dietary exposure, and estimates the risk for those people who are likely to be exposed to the colours of interest. Dietary exposure results are presented for the Mean Colours Scenario (mean analytical concentrations) in detail in this section, as this is a more realistic estimate of exposure to added colours from consumption of a range of food and beverages, compared to the Maximum Colours Scenario. For the Maximum Colours Scenario (maximum analytical values), dietary exposures were also estimated at the 90th percentile for each of the colours surveyed to assess the level of dietary exposure for high consumers if they were to eat foods and drink beverages containing the highest concentration of added colours (refer to Section 5.3). This scenario is unrealistic and represents the ‘worst case.’ The Maximum Colours Scenario was also considered as part of the risk assessment (refer to Section 6.3).

25
0.0
0.5
1.0
1.5
2.0
2.5
3.0
3.5
4.0
Allura
Red
Amar
anth
Annat
to
Azoru
bine
Brillian
t Blac
k
Brillian
t Blue
Brown
HT
Cochin
eal/C
arm
ine
Green
S
Indig
otine
Ponce
au 4
R
Quinoli
ne Y
ellow
Sunse
t Yell
ow
Tartra
zine
Colour
Est
imat
ed
mea
n a
nd
90t
h p
erce
nti
le
die
tary
exp
osu
res
(mg
/day
)
Mean consumers90th percentile consumers
5.1.1 Estimated dietary exposures to added colours for the Australian population aged 2 years and above (Mean Colours Scenario) The estimated mean and 90th percentile dietary exposures for consumers of foods containing colours in the population aged 2 years and above are shown in Figure 14 (full results, including the percentage of total consumers for each colour, can be found in Appendix 7, Tables A7.1– A7.14). Mean and 90th percentile dietary exposures to individual added colours for consumers aged 2 years and above were estimated to be in the range of 0.04 – 1.14 mg/day and 0.08 – 3.46 mg/day, respectively. The highest mean dietary exposure was from Tartrazine and at the 90th percentile was from Sunset Yellow. The lowest mean and 90th percentile estimated dietary exposures were from Brilliant Black.
Figure 13: Estimated mean and 90th percentile dietary exposures for 2 years and above (consumers only)
*Note: Only those colours with reported dietary exposures have been graphed.

26
0.0
0.5
1.0
1.5
2.0
2.5
Allura
Red
Amar
anth
Annat
to
Azoru
bine
Brillian
t Blac
k
Brillian
t Blue
Brown
HT
Cochin
eal/C
arm
ine
Green
S
Indigo
tine
Ponce
au 4
R
Quinoli
ne Y
ellow
Sunse
t Yell
ow
Tartra
zine
Colour
Est
imat
ed m
ean
an
d 9
0th
per
cen
tile
d
ieta
ry e
xpo
sure
s (m
g/d
ay) Mean consumers
90th percentile consumers
5.1.2 Estimated dietary exposures to added colours for children aged 2-5 years (Mean Colours Scenario) The estimated mean and 90th percentile dietary exposures to added colours for children aged 2-5 years consuming foods containing colours are shown in Figure 15 (full results, including the percentage of total consumers for each colour, can be found in Appendix 7, Tables A7.1– A7.14). Mean and 90th percentile dietary exposures to individual added colours for children aged 2-5 years (consumers only) were estimated to be in the range of 0.01– 0.89 mg/day and 0.01 – 2.31 mg/day respectively. The highest mean and 90th percentile estimated dietary exposures for children aged 2-5 years were from Azorubine and the lowest were from Green S. Figure 14: Estimated mean and 90th percentile dietary exposures for 2-5 years (consumers only)
*Note: Only those colours with reported dietary exposures have been graphed.

27
0.0
0.5
1.0
1.5
2.0
2.5
3.0
3.5
4.0
Allura
Red
Amar
anth
Annat
to
Azoru
bine
Brillian
t Blac
k
Brillian
t Blue
Brown
HT
Cochin
eal/C
arm
ine
Green
S
Indig
otine
Ponce
au 4
R
Quinoli
ne Y
ellow
Sunse
t Yell
ow
Tartra
zine
Colour
Est
imat
ed m
ean
an
d 9
0th
per
cen
tile
d
ieta
ry e
xpo
sure
s (m
g/d
ay)
Mean consumers90th percentile consumers
5.1.3 Estimated dietary exposures to added colours for children aged 6-12 years (Mean Colours Scenario) The estimated mean and 90th percentile dietary exposures to added colours for children aged 6-12 years consuming foods containing colours are shown in Figure 16 (full results, including the percentage of total consumers for each colour, can be found in Appendix 7, Tables A7.1– A7.14). Mean and 90th percentile dietary exposures to individual added colours for children aged 6-12 years (consumers only) were estimated to be in the range of 0.09 – 1.31 mg/day and 0.05 – 3.79 mg/day, respectively. The highest mean dietary exposure for children aged 6-12 years was from Tartrazine and at the 90th percentile was from Sunset Yellow. The lowest mean and 90th percentile estimated dietary exposures were from Brilliant Black.
Figure 15: Estimated mean and 90th percentile dietary exposures for 6-12 years (consumers only)
*Note: Only those colours with reported dietary exposures have been graphed.

28
0%
10%
20%
30%
40%
50%
60%
70%
80%
90%
100%
Allura
Red
Amar
anth
Annat
to
Azoru
bine
Brillian
t Blue
Brown
HT
Cochin
eal/C
arm
ine
Ponce
au 4
R
Sunse
t Yell
ow
Tartra
zine
Colour
Pe
rce
nta
ge
Co
ntr
ibu
tio
n (
%)
All other foods
Topping
Cakes, muffins, pastries
Savoury snack foods
Yoghurt
Pre-prepared meals
Savoury sauces
Processed meat
Fruit drink/juice
Margarine/table spread
Cheese
Chocolate confectionery
Cordial
Coloured breakfast cereal
Jelly
Ice cream/ice confection
Soft drink
Flavoured milk and flavouredsoy beveragesSweet biscuits
Sugar confectionery
5.2 Major contributors to dietary exposure to individual added colours 5.2.1 Major contributors to dietary exposures for the population aged 2 years and above (Mean Colours Scenario) The major contributors (≥5%) to estimated dietary exposures to individual added colours from food and beverages for the population aged 2 years and above are shown in Figure 17. A full list of all the food groups and their contributions can be found in Appendix 8, Tables A8.1– A8.14.
Figure 16: Major contributors to dietary exposures for the population aged 2 years and above*
*Note: Percent contribution of each food group is based on total dietary exposure for all consumers in the 2 years and above age group. Only those colours that were found in three or more food groups have been graphed. If the food is not a major contributor for the population sub-group it is not shown in the graph.

29
0%
10%
20%
30%
40%
50%
60%
70%
80%
90%
100%
Allura
Red
Amar
anth
Annat
to
Azoru
bine
Brillian
t Blue
Brown
HT
Cochin
eal/C
arm
ine
Ponce
au 4
R
Sunse
t Yell
ow
Tartra
zine
Colour
Per
cen
tag
e C
on
trib
uti
on
(%
)
All other foods
Topping
Cakes, muffins, pastries
Savoury snack foods
Yoghurt
Savoury sauces
Processed meat
Fruit drink/juice
Dairy dessert (excluding icecream and yoghurt)Margarine/table spread
Cordial
Coloured breakfast cereal
Jelly
Ice cream/ice confection
Soft drink
Flavoured milk andflavoured soy beveragesSweet biscuits
Sugar confectionery
For each colour consumed, foods and beverages that made the greatest contribution to dietary exposure in the population aged 2 years and above were:
Allura Red – Sugar confectionery and soft drink Amaranth – Soft drink and cordial Annatto – Ice cream/ice confection and margarine/table spread Azorubine – Cordial and soft drink Brilliant Blue – Ice cream/ice confection and soft drink Brown HT – Cakes, muffins, pastries and ice cream/ice confection Cochineal/Carmine – Savoury sauces and yoghurt Ponceau 4R – Ice cream/ice confection and cakes, muffins, pastries Sunset Yellow – Soft drink and ice cream/ice confection Tartrazine – Ice cream/ice confection and soft drink.
5.2.2 Major contributors to dietary exposures for children aged 2-5 years (Mean Colours Scenario) The major contributors (≥5%) to estimated dietary exposures to individual added colours from food and beverages for children aged 2-5 years are shown in Figure 18. A full list of all the food groups and their contributions can be found in Appendix 8, Tables A8.1-A8.14.
Figure 17: Major contributors to dietary exposures for children aged 2-5 years*
*Note: Percent contribution of each food group is based on total dietary exposure for all consumers in the 2-5 years age group. Only those colours that were found in three or more food groups have been graphed. If the food is not a major contributor for the population sub-group it is not shown in the graph.

30
0%
10%
20%
30%
40%
50%
60%
70%
80%
90%
100%
Allura
Red
Amar
anth
Annat
to
Azoru
bine
Brillian
t Blue
Brown
HT
Cochin
eal/C
arm
ine
Ponce
au 4
R
Sunse
t Yell
ow
Tartra
zine
Colour
Per
cen
tag
e C
on
trib
uti
on
(%
)
All other foods
Topping
Cakes, muffins, pastries
Savoury snack foods
Yoghurt
Savoury sauces
Fruit drink/juice
Dairy dessert (excluding icecream and yoghurt)Margarine/table spread
Chocolate confectionery
Cordial
Coloured breakfast cereal
Jelly
Ice cream/ice confection
Soft drink
Flavoured milk and flavouredsoy beveragesSweet biscuits
Sugar confectionery
For each colour consumed, foods and beverages that made the greatest contribution to dietary exposure in children aged 2-5 years were:
Allura Red – Sugar confectionery and sweet biscuits Amaranth – Cordial and soft drink Annatto – Ice cream/ice confection and margarine/table spread Azorubine – Cordial and ice cream/ice confection Brilliant Blue – Ice cream/ice confection and soft drink Brown HT – Cakes, muffins, pastries and ice cream/ice confection Cochineal/Carmine – Savoury sauces and yoghurt Ponceau 4R – Ice cream/ice confection and jelly Sunset Yellow – Soft drink and savoury snack foods Tartrazine – Cordial and ice cream/ice confection.
5.2.3 Major contributors to dietary exposures for children aged 6-12 years (Mean Colours Scenario) The major contributors (≥5%) to estimated dietary exposures to individual added colours from food and beverages for children aged 6-12 years are shown in Figure 19. A full list of all the food groups and their contributions can be found in Appendix 8, Tables A8.1-A8.14.
Figure 18: Major contributors to dietary exposures for children aged 6-12 years*
*Note: Percent contribution of each food group is based on total dietary exposure for all consumers in the 6-12 years age group. Only those colours that were found in three or more food groups have been graphed. If the food is not a major contributor for the population sub-group it is not shown in the graph.

31
For each colour consumed, foods and beverages that made the greatest contribution to dietary exposure in the children aged 6-12 years were:
Allura Red – Sugar confectionery and flavoured milk including flavoured soy beverages
Amaranth – Cordial and soft drink Annatto – Ice cream/ice confection and margarine/table spread Azorubine – Cordial and soft drink Brilliant Blue – Ice cream/ice confection and soft drink Brown HT – Cakes, muffins, pastries and ice cream/ice confection Cochineal/Carmine – Savoury Sauces and yoghurt Ponceau 4R – Ice cream/ice confection and cakes, muffins, pastries Sunset Yellow – Soft drink and ice cream/ice confection Tartrazine – Ice cream/ice confection and soft drink.
5.3 Maximum Colours Scenario 5.3.1 Estimated dietary exposures to individual added colours at the 90th percentile (consumers only)
Population aged 2 years and above – dietary exposures to individual added colours for this sub-group of consumers at the 90th percentile were estimated to be in the range of 0.37 – 16.99 mg/day. The highest mean dietary exposure for this population sub-group was from Tartrazine and the lowest was from Brilliant Black.
Children aged 2-5 years – dietary exposures to individual added colours for this sub-
group of consumers at the 90th percentile were estimated to be in the range of 0.19 – 15.62 mg/day. The highest mean dietary exposure for children aged 2-5 years was from Azorubine and the lowest was from Green S.
Children aged 6-12 years – dietary exposures to individual added colours for this sub-
group of consumers at the 90th percentile were estimated to be in the range of 0.23 – 18.97 mg/day. The highest mean dietary exposure for children aged 6-12 years was from Tartrazine and the lowest was from Brilliant Black.
See Appendix 7, Tables A7.1-A7.14, for complete information on the dietary exposure assessment results for this scenario.
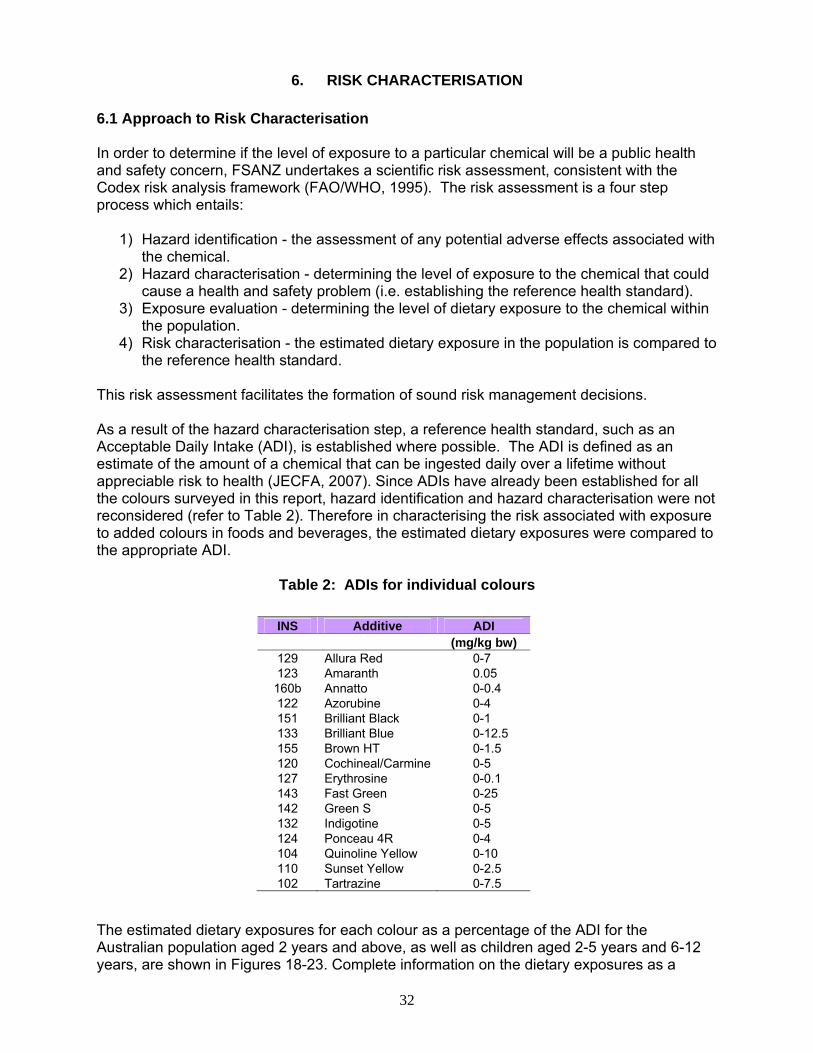
32
6. RISK CHARACTERISATION 6.1 Approach to Risk Characterisation In order to determine if the level of exposure to a particular chemical will be a public health and safety concern, FSANZ undertakes a scientific risk assessment, consistent with the Codex risk analysis framework (FAO/WHO, 1995). The risk assessment is a four step process which entails:
1) Hazard identification - the assessment of any potential adverse effects associated with the chemical.
2) Hazard characterisation - determining the level of exposure to the chemical that could cause a health and safety problem (i.e. establishing the reference health standard).
3) Exposure evaluation - determining the level of dietary exposure to the chemical within the population.
4) Risk characterisation - the estimated dietary exposure in the population is compared to the reference health standard.
This risk assessment facilitates the formation of sound risk management decisions. As a result of the hazard characterisation step, a reference health standard, such as an Acceptable Daily Intake (ADI), is established where possible. The ADI is defined as an estimate of the amount of a chemical that can be ingested daily over a lifetime without appreciable risk to health (JECFA, 2007). Since ADIs have already been established for all the colours surveyed in this report, hazard identification and hazard characterisation were not reconsidered (refer to Table 2). Therefore in characterising the risk associated with exposure to added colours in foods and beverages, the estimated dietary exposures were compared to the appropriate ADI.
Table 2: ADIs for individual colours The estimated dietary exposures for each colour as a percentage of the ADI for the Australian population aged 2 years and above, as well as children aged 2-5 years and 6-12 years, are shown in Figures 18-23. Complete information on the dietary exposures as a
INS Additive ADI (mg/kg bw)
129 Allura Red 0-7 123 Amaranth 0.05
160b Annatto 0-0.4 122 Azorubine 0-4 151 Brilliant Black 0-1 133 Brilliant Blue 0-12.5 155 Brown HT 0-1.5 120 Cochineal/Carmine 0-5 127 Erythrosine 0-0.1 143 Fast Green 0-25 142 Green S 0-5 132 Indigotine 0-5 124 Ponceau 4R 0-4 104 Quinoline Yellow 0-10 110 Sunset Yellow 0-2.5 102 Tartrazine 0-7.5

33
percentage of the ADI for all population sub-groups including adolescents aged 13-18 years, adults 19-24 years and 25 years and above is shown in Appendix 9. The estimated dietary exposures as a percentage of the ADI are presented for both the Mean Colours Scenario and the Maximum Colours Scenario. The results for the Mean Colours Scenario are considered a more realistic representation of dietary exposure to added colours. The results for the Maximum Colours Scenario are included as an assessment of the ‘worst case’ scenario. 6.2 Mean Colours Scenario The Mean Colours Scenario models the mean analytical concentrations for each colour for each of the foods sampled. This scenario accounts for consumers of a range of brands and varieties of particular foods containing the colours surveyed. 6.2.1 Australian population aged 2 years and above The estimated dietary exposures for the Australian population aged 2 years and above (consumers only) compared to the ADI for each colour is shown in Figure 20 (for further information see Appendix 9, Tables 1-14).

34
Figure 19: Dietary exposure to added colours for the Australian population 2 years and above as a percentage of the ADI (consumers only)
*Please note: the vertical axis is broken as dietary exposures were well below the ADIs
The mean estimated dietary exposures to added colours for the population aged 2 years and above (consumers only) were all below 1% of the respective ADIs. For the 90th percentile, the estimated exposure was also very low ranging between ≤1 – 4% of ADI.
Colour
0
1
2
3
4
5
6
7
8
9
10
Allura
Red
Amar
anth
Annat
to
Azoru
bine
Brillian
t Blac
k
Brillian
t Blue
Brown
HT
Cochin
eal/C
arm
ine
Green
S
Indig
otine
Ponce
au4R
Quinoli
neYell
ow
Sunse
t Yell
ow
Tartra
zine
% A
DI
Mean consumers90th Percentile consumers
100
0
1
2
3
4
5
6
7
8
9
10
Allura
Red
Amar
anth
Annat
to
Azoru
bine
Brillian
t Blac
k
Brillian
t Blue
Brown
HT
Cochin
eal/C
arm
ine
Green
S
Indig
otine
Ponce
au4R
Quinoli
neYell
ow
Sunse
t Yell
ow
Tartra
zine
% A
DI
Mean consumers90th Percentile consumersMean consumersMean consumers90th Percentile consumers90th Percentile consumers
100

35
6.2.2 Australian population aged 2-5 years The estimated dietary exposures for children aged 2-5 years (consumers only) in comparison to the ADI for each colour are shown in Figure 21 (for complete information see Appendix 9, Tables 1-14). Figure 20: Dietary exposure to added colours for the children 2-5 years as a percentage of the ADI (consumers only)
*Please note: the vertical axis is broken as dietary exposures were well below the ADIs The mean estimated dietary exposures to added colours for the population aged 2 -5 years (consumers only) were ≤ 3% of the respective ADIs, The 90th percentile exposure was estimated to be <1% – 8% of the ADI.
Colour
0
1
2
3
4
5
6
7
8
9
10
Allura
Red
Amar
anth
Annat
to
Azoru
bine
Brillian
t Blac
k
Brillian
t Blue
Brown
HT
Cochin
eal/C
arm
ine
Green
S
Indig
otine
Ponce
au4R
Quinoli
neYell
ow
Sunse
t Yell
ow
Tartra
zine
% A
DI
Mean consumers90th Percentile consumers
100
0
1
2
3
4
5
6
7
8
9
10
Allura
Red
Amar
anth
Annat
to
Azoru
bine
Brillian
t Blac
k
Brillian
t Blue
Brown
HT
Cochin
eal/C
arm
ine
Green
S
Indig
otine
Ponce
au4R
Quinoli
neYell
ow
Sunse
t Yell
ow
Tartra
zine
% A
DI
Mean consumers90th Percentile consumersMean consumersMean consumers90th Percentile consumers90th Percentile consumers
100

36
6.2.3 Australian population aged 6-12 years The estimated dietary exposures for children aged 6-12 years (consumers only) in comparison to the ADI for each colour are shown in Figure 22 (for complete information see Appendix 9, Tables 1-14).
Figure 21: Dietary exposure to added colours for children aged 6-12 years as percentage of the ADI (consumers only)
The mean estimated dietary exposures to added colours for the population aged 6-12 years (consumers only) were well below the ADIs, ranging between <1% – 2%. The 90th percentile exposure was estimated to fall between <1% – 5% of ADI.
Colour
*Please note: the vertical axis is broken as dietary exposures were well below the ADIs
0
1
2
3
4
5
6
7
8
9
10
Allura
Red
Amar
anth
Annat
to
Azoru
bine
Brillian
t Blac
k
Brillian
t Blue
Brown
HT
Cochin
eal/C
arm
ine
Green
S
Indig
otine
Ponce
au4R
Quinoli
neYell
ow
Sunse
t Yell
ow
Tartra
zine
% A
DI
Mean consumers90th Percentile consumers
100
0
1
2
3
4
5
6
7
8
9
10
Allura
Red
Amar
anth
Annat
to
Azoru
bine
Brillian
t Blac
k
Brillian
t Blue
Brown
HT
Cochin
eal/C
arm
ine
Green
S
Indig
otine
Ponce
au4R
Quinoli
neYell
ow
Sunse
t Yell
ow
Tartra
zine
% A
DI
Mean consumers90th Percentile consumersMean consumersMean consumers90th Percentile consumers90th Percentile consumers
100

37
6.3 Maximum Colours Scenario The Maximum Colours Scenario models the maximum analytical concentration reported for each colour in each of the foods sampled. The 90th percentile dietary exposure estimate for each of the colours surveyed based on the maximum analytical concentration is presented in this section to represent regular high consumers. This scenario assumes that, where a colour is detected in a food, it is always present and consumed in that food at the highest concentration quantified across all the samples of that food tested. The Maximum Colours Scenario is considered to be improbable, because consumers are unlikely to consume foods containing the maximum analytical concentration of all colours on a daily basis over prolonged periods of time (months to years). Furthermore, manufacturers do alter food and beverage formulations, therefore consumers who consistently purchase the same products may not always be exposed to the maximum or same concentration of all added colours in foods and beverages. While the Maximum Colours Scenario contains a number of assumptions and is considered to be an overestimate, it provides an opportunity to assess the level of dietary exposure for high consumers (90th percentile) if they were to eat foods and drink beverages containing the highest concentration of added colours (See Appendix 7 for complete information on dietary exposures for the Maximum Colours Scenario).

38
6.3.1 Australian population aged 2 years and above (Maximum Colours Scenario) The estimated dietary exposure of high consumers (90th percentile) for the population aged 2 years and above was below 10% of the relevant ADI for each colour other than Amaranth (Figure 23). Exposure for 90th percentile consumers to Amaranth was approximately 45% of the ADI (for further details refer to Appendix 9).
Figure 22: Dietary exposure at 90th percentile for consumers (2 years and above) to added colours, as a percentage of the ADI, under the Maximum Colours Scenario
% A
DI
Colour
0
10
20
30
40
50
60
70
80
90
100
Allura
Red
Amar
anth
Annat
to
Azoru
bine
Brillian
t Blac
k
Brillian
t Blue
Brown
HT
Cochin
eal/C
arm
ine
Green
S
Indig
otin
e
Ponce
au4R
Quinoli
neYell
ow
Sunse
t Yell
ow
Tartra
zine
0
10
20
30
40
50
60
70
80
90
100
Allura
Red
Amar
anth
Annat
to
Azoru
bine
Brillian
t Blac
k
Brillian
t Blue
Brown
HT
Cochin
eal/C
arm
ine
Green
S
Indig
otin
e
Ponce
au4R
Quinoli
neYell
ow
Sunse
t Yell
ow
Tartra
zine

39
6.3.2 Australian population aged 2-5 years (Maximum Colours Scenario) The dietary exposure of high consumers (90th percentile) aged 2-5 years was below 30% of the relevant ADI for each colour other than Amaranth (Figure 24). For example, the dietary exposures of high consumers to Azorubine and Sunset Yellow high consumers were 25% and 20% of the ADI respectively. Estimated exposures to the other colours were between <1-15% of the ADI. Exposure for high consumers of Amaranth was approximately 85% of the ADI (for further details refer to Appendix 9).
Figure 23: Dietary exposure at 90th percentile for consumers (children aged 2-5 years) to added colours, as a percentage of the ADI, under the Maximum Colours Scenario
% A
DI
0
10
20
30
40
50
60
70
80
90
100
Allura
Red
Amar
anth
Annat
to
Azoru
bine
Brillian
t Blac
k
Brillian
t Blue
Brown
HT
Cochin
eal/C
arm
ine
Green
S
Indig
otin
e
Ponce
au4R
Quinoli
neYell
ow
Sunse
t Yell
ow
Tartra
zine
0
10
20
30
40
50
60
70
80
90
100
Allura
Red
Amar
anth
Annat
to
Azoru
bine
Brillian
t Blac
k
Brillian
t Blue
Brown
HT
Cochin
eal/C
arm
ine
Green
S
Indig
otin
e
Ponce
au4R
Quinoli
neYell
ow
Sunse
t Yell
ow
Tartra
zine

40
6.3.3 Australian population aged 6-12 years The dietary exposure of high consumers (90th percentile) aged 6-12 years was below 10% of the relevant ADI for most colours (Figure 25). For three colours, Azorubine, Brown HT and Sunset Yellow, exposure of high consumers was between 15% and 20% of the ADI. Exposure of high consumers to Amaranth was estimated to be 65% of the ADI (for further details refer to Appendix 9).
Figure 24: Dietary exposure at 90th percentile for consumers (children aged 6-12 years) to added colours, as a percentage of the ADI, under the Maximum Colours Scenario
% A
DI
Colour
Allura
red
Amar
anth
Annat
to
Azoru
bine
Brillian
t blac
k
Brillian
t blue
Brown
HT
Cochin
eal/C
arm
ine
Green
S
Indig
otin
e
Ponce
au4R
Quinoli
neye
llow
Sunse
t Yell
ow
Tartra
zine
0
10
20
30
40
50
60
70
80
90
100
Allura
red
Amar
anth
Annat
to
Azoru
bine
Brillian
t blac
k
Brillian
t blue
Brown
HT
Cochin
eal/C
arm
ine
Green
S
Indig
otin
e
Ponce
au4R
Quinoli
neye
llow
Sunse
t Yell
ow
Tartra
zine
0
10
20
30
40
50
60
70
80
90
100

41
6.4 Summary Based on mean analytical concentrations for colours (Mean Colours Scenario), the estimated mean and 90th percentile dietary exposures were all well below the relevant ADI for each food colour investigated. Even when the dietary exposure was overestimated, as depicted in the Maximum Colours Scenario, high consumers (90th percentile) were within the respective ADI values for all added colours. These results indicate that current dietary exposure to added colours in foods and beverages within all population sub-groups in Australia, even at the 90th percentile, and even when exposure is overestimated, were within the established reference health standards.
7. CONCLUSION
The data presented in this report represent the most comprehensive and accurate analysis yet undertaken of the level of added colours in nationally available foods and beverages in Australia, and the estimated dietary exposure of the Australian population to these chemicals. The levels of added colour in the majority of the 651 foods and beverages analysed were significantly below the MPLs set out in the Code. These findings suggest that the MPLs for various food colours and food categories in the Code may be higher than is needed to achieve a technological function and further discussion with the food industry may be warranted to investigate the technological need for existing MPLs. The survey found a good level of accuracy in the labelling of colours that were detected in the food products by the analysis. These results provide assurance to consumers who may wish to avoid products containing certain added colours by checking the ingredients list. FSANZ has produced a guide to food labels ‘Choose the Right Stuff,’ to assist consumers in making informed product choices and a full additive list by name and number is available on the website http://www.foodstandards.gov.au/foodmatters/foodadditives.cfm. The dietary exposure assessment results based on mean and maximum analytical concentrations show that dietary exposure to all synthetic and natural colours analysed for all population sub-groups were below the respective ADIs at both the mean and 90th percentile of exposure. Therefore, current exposure levels to added colours in food and beverages do not pose a public health and safety concern for Australians. In addition, with the current trend for manufacturers to reduce the level of synthetic colours added to food and beverages, dietary exposures to synthetic colours are likely to decline accordingly. The survey was very successful in providing robust and useful data on concentrations of added colours in the Australian food supply as well as a highly refined dietary exposure estimate and risk assessment. The sampling and analysis of the foods to best represent consumption was achieved through careful research and survey design in the initial stages. Selection of a suitably qualified analytical laboratory and comprehensive instructions was also important to the successful outcome. Had funds been available, it would have been useful to have retained the samples for longer to allow for additional analysis of the stored food samples, or to have included analysis for levels of aluminium and calcium, to provide additional information around the use of lake colours. International interest in estimating dietary exposure to aluminium has recently increased, although this occurred after this survey was designed.
42
Given the sound execution of the survey and reassuring findings, it is not recommended that a similar survey be repeated by FSANZ in the foreseeable future. However, should there be significant changes to the relevant reference health standards in the future, dietary exposures as a percentage of the respective ADIs for individual colours could be recalculated using the analytical concentrations from this survey.

43
8. REFERENCE LIST
FAO/WHO (1995) Application of Risk Analysis to Food Standards Issues. pp1-43. ftp://ftp.fao.org/es/esn/food/Risk_Analysis.pdf.
Ghorpade, V.M., Desphande, S.S. and Salunkhe, D.K. (1995) Food Colours. In: Maga, J.A. and Tu, A.T. eds. Food Additive Toxicology. Chapter 4. Marcel Dekker, Inc., New York, pp. 179-233.
JECFA (2007) JECFA Glossary of terms. pp1-3. http://www.who.int/ipcs/food/jecfa/glossary.pdf.
Rutishauser, I. (2000) Getting it right:- how to use the data from the 1995 National Nutrition Survey. Commonwealth of Australia, Canberra.
SA Department of Health (2005) Food Colours - A survey of artificial colours in foods and beverages. pp1-12. http://www.health.sa.gov.au/pehs/Food/report-food-colours-nov05.pdf.
U.S Food and Drug Administration (1993) Food Color Facts. http://www.cfsan.fda.gov/~lrd/colorfac.html.