Embed Size (px)
Citation preview

Spring 2015
JiJi El Masri
Jasleen Sethi
Metro United Way
Survey of Academic and Youth Outcomes (SAYO-Y) Data Report

2 SAYO-Y Data Report, Spring 2015 9/9/2015
TABLE OF CONTENTS
PART 1: Introduction ..................................................................................................................................................... 3
1-1 Background .......................................................................................................................................................... 3
1-2 SAYO Agency and Program Overview .................................................................................................................. 4
1-3 Explanation of Sample ...................................................................................................................................... 5
PART 2: SAYO-Youth Summary Data.............................................................................................................................. 8
2-1 Youth’s Program Experiences .............................................................................................................................. 8
2-2 Youth’s Sense of Competence ............................................................................................................................. 9
2-3 Youth’s Future Planning and Expectations ........................................................................................................ 10
PART 3: Moving Forward with SAYO ........................................................................................................................... 12
3-1 Expanding Data Analysis .................................................................................................................................... 12
3-2 Increasing Capacity for SAYO-Y ......................................................................................................................... 13
3-3 Considering SAYO-S ........................................................................................................................................... 13
PART 4: Conclusions .................................................................................................................................................... 14
PART 5: Appendix ........................................................................................................................................................ 15
5-1 Participating Agencies and Programs ................................................................................................................ 15
5-2 SAYO Youth Responses by Sub-Group ............................................................................................................... 16
5-3 BLOCS Common Youth Outcomes ..................................................................................................................... 22
Works Cited ................................................................................................................................................................. 23
3 SAYO-Y Data Report, Spring 2015 9/9/2015
PART 1: INTRODUCTION
1-1 BACKGROUND
In today’s ever changing social structure, out-of-school time (OST) programs are increasingly becoming
key community partners for parents and schools in supporting youth in their development. Different
OST program designs lend themselves to developing different personal and social skill sets, however, all
programs aim to change the odds for youth by making a certain impact in their lives.
In Summer of 2014, the BLOCS Data and Research Committee translated this desired OST program
impact into four distinct youth outcomes, referred to as the BLOCS Common Youth Outcomes: Social-
Emotional Development, Community Engagement, Health and Wellness, and Academic Achievement1.
The SAYO-Y was then selected to begin measuring outcomes at the OST program level, specifically
outcomes related to the Social-Emotional Development domain. “Social and emotional learning, or SEL,
has become the recognized term to refer to the foundational skills, attitudes, and behaviors that
facilitate the development of key intrapersonal and interpersonal skills that help promote school
engagement and set the stage for later success (Stavsky, 2015)”.
The SAYO-Y is a research based and nationally used survey tool developed by the National Institute of
Out of School Time (NIOST) in Massachusetts to measure OST program impact. The instrument is
designed to learn more about how youth are experiencing their programs, and gage their attitudes and
beliefs in key areas related to their future success. The SAYO-Y is designed for youth in Grades 4-12, with
two versions; Grades 4-8 and Grades 9-12.
After piloting the survey in the Summer and Fall of 2014, BLOCS began working on making the SAYO-Y a
requirement for OST agencies funded by the partnership. To align with the school calendar, the
committee decided on a yearly administration of SAYO-Y during the Spring, and baseline data collection
was carried out in the months of April and May of 2015. The data presented in this report represents 12
Metro United Way funded agencies, and is considered baseline BLOCS SAYO-Y data.
1 For the full BLOCS Common Youth Outcomes and Indicators framework, please refer to Part 4-3
4 SAYO-Y Data Report, Spring 2015 9/9/2015
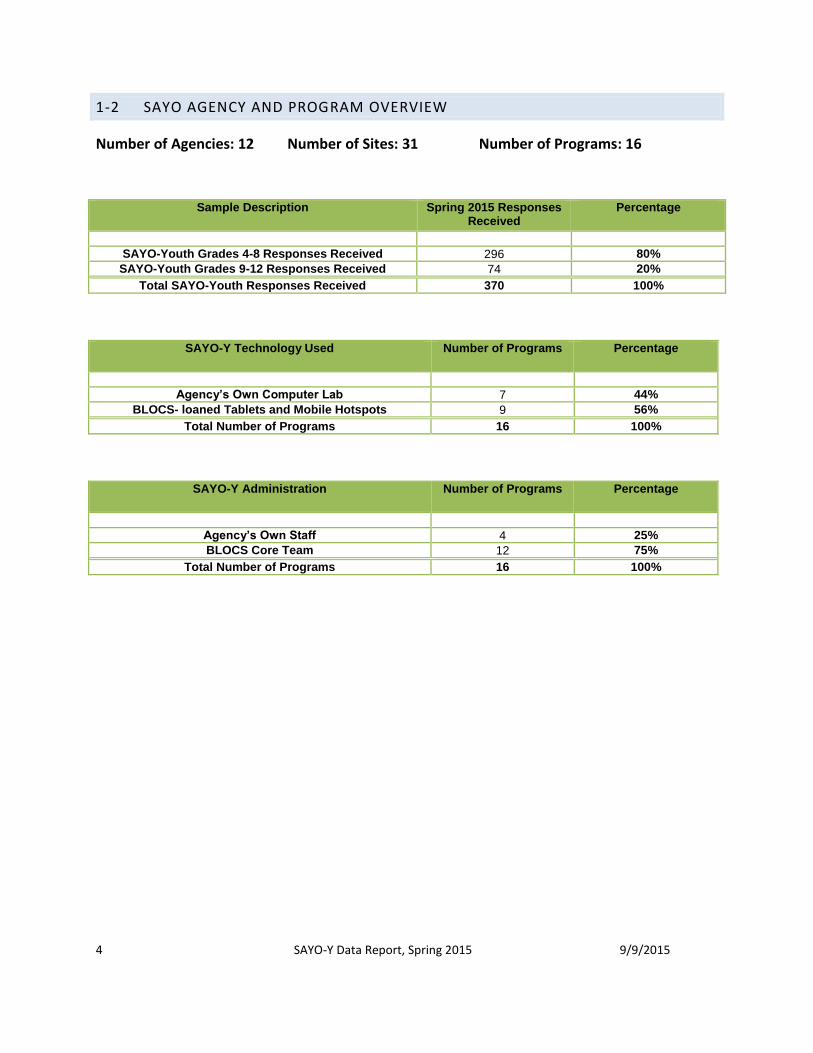
1-2 SAYO AGENCY AND PROGRAM OVERVIEW
Number of Agencies: 12 Number of Sites: 31 Number of Programs: 16
Sample Description Spring 2015 Responses Received
Percentage
SAYO-Youth Grades 4-8 Responses Received 296 80%
SAYO-Youth Grades 9-12 Responses Received 74 20%
Total SAYO-Youth Responses Received 370 100%
SAYO-Y Technology Used Number of Programs Percentage
Agency’s Own Computer Lab 7 44%
BLOCS- loaned Tablets and Mobile Hotspots 9 56%
Total Number of Programs 16 100%
SAYO-Y Administration Number of Programs Percentage
Agency’s Own Staff 4 25%
BLOCS Core Team 12 75%
Total Number of Programs 16 100%
5 SAYO-Y Data Report, Spring 2015 9/9/2015
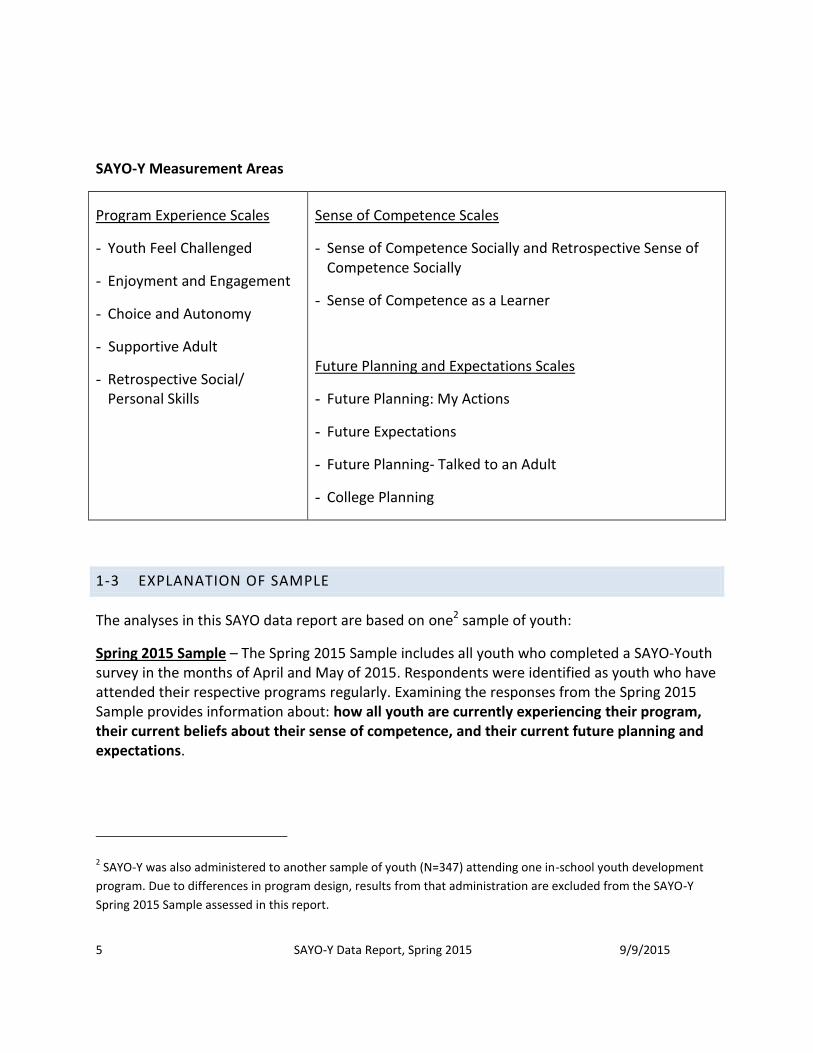
SAYO-Y Measurement Areas
Program Experience Scales
- Youth Feel Challenged
- Enjoyment and Engagement
- Choice and Autonomy
- Supportive Adult
- Retrospective Social/ Personal Skills
Sense of Competence Scales
- Sense of Competence Socially and Retrospective Sense of Competence Socially
- Sense of Competence as a Learner
Future Planning and Expectations Scales
- Future Planning: My Actions
- Future Expectations
- Future Planning- Talked to an Adult
- College Planning
1-3 EXPLANATION OF SAMPLE
The analyses in this SAYO data report are based on one2 sample of youth:
Spring 2015 Sample – The Spring 2015 Sample includes all youth who completed a SAYO-Youth survey in the months of April and May of 2015. Respondents were identified as youth who have attended their respective programs regularly. Examining the responses from the Spring 2015 Sample provides information about: how all youth are currently experiencing their program, their current beliefs about their sense of competence, and their current future planning and expectations.
2 SAYO-Y was also administered to another sample of youth (N=347) attending one in-school youth development
program. Due to differences in program design, results from that administration are excluded from the SAYO-Y
Spring 2015 Sample assessed in this report.
6 SAYO-Y Data Report, Spring 2015 9/9/2015
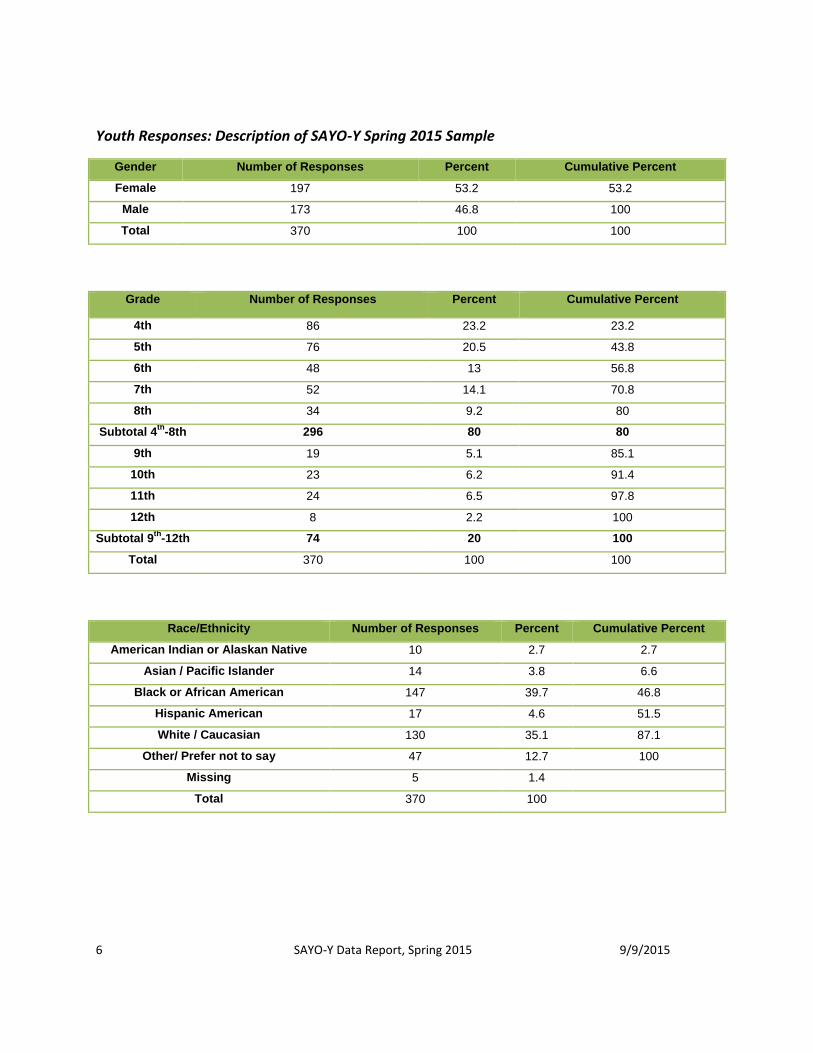
Youth Responses: Description of SAYO-Y Spring 2015 Sample
Gender Number of Responses Percent Cumulative Percent
Female 197 53.2 53.2
Male 173 46.8 100
Total 370 100 100
Grade Number of Responses Percent Cumulative Percent
4th 86 23.2 23.2
5th 76 20.5 43.8
6th 48 13 56.8
7th 52 14.1 70.8
8th 34 9.2 80
Subtotal 4th
-8th 296 80 80
9th 19 5.1 85.1
10th 23 6.2 91.4
11th 24 6.5 97.8
12th 8 2.2 100
Subtotal 9th
-12th 74 20 100
Total 370 100 100
Race/Ethnicity Number of Responses Percent Cumulative Percent
American Indian or Alaskan Native 10 2.7 2.7
Asian / Pacific Islander 14 3.8 6.6
Black or African American 147 39.7 46.8
Hispanic American 17 4.6 51.5
White / Caucasian 130 35.1 87.1
Other/ Prefer not to say 47 12.7 100
Missing 5 1.4
Total 370 100

7 SAYO-Y Data Report, Spring 2015 9/9/2015
Home Zip code Number of Responses Percent Cumulative percent
40014 11 2.97 2.97
40029 11 2.97 5.95
40203 12 3.24 9.19
40299 13 3.51 12.70
47112 14 3.78 16.49
40216 18 4.86 21.35
40291 18 4.86 26.22
40214 26 7.03 33.24
47130 28 7.57 40.81
Don’t Know 98 26.49 67.30
Other Zip Codes 121 32.70 100.00
Total 370 100

8 SAYO-Y Data Report, Spring 2015 9/9/2015
PART 2: SAYO-YOUTH SUMMARY DATA
2-1 YOUTH’S PROGRAM EXPERIENCES
Research suggests that when youth are engaged, challenged, have choice & voice and experience supportive relationships within an afterschool or teen program, they are more likely to benefit from their participation. Findings from an analysis of Massachusetts SAYO-Y data strongly suggest that youth’s program experiences are linked to youth’s sense of competence socially, as a learner, as well as with behaviors likely to prepare them for a bright future (NIOST, 2015).
Youth responding to the SAYO-Y Program Experiences questions were asked to respond
on a four point scale, where:
1 = No, 2 = Mostly no, 3 = Mostly yes, and 4 = Y es
Here is how youth report experiencing the programs in key areas.
* Retrospective scales asked youth to reflect on whether participating in the program helped them with their social/personal skills and academic skills. Ratings for these two scales are: 1=”Don’t Agree,” 2=”Agree a Little, 3=”Mostly Agree,” and 4=”Agree a lot.”
3.16
2.85 3.00
3.42
3.02
1
1.5
2
2.5
3
3.5
4
Engagement &Enjoyment
(N=370)
Choice &Autonomy
(N=370)
Youth FeelChallenged
(N=370)
SupportiveAdult
(N=370)
RetrospectiveSocial/PersonalSkills (N=370)
Me
an
Program Experiences : Average Youth Ratings Spring Sample

9 SAYO-Y Data Report, Spring 2015 9/9/2015
2-2 YOUTH’S SENSE OF COMPETENCE
Decades of research point to a strong and positive link between high levels of perceived competence and youth’s ability to change behavior, master tasks, learn new skills, and perform academically. Findings from an analysis of Massachusetts SAYO-Y data strongly suggest that youth’s sense of competence as a learner and socially are highly linked to their sense of competence in academic areas (NIOST, 2015).
Youth responding to questions asking about their Sense of Competence were asked to
rate their level of agreement with a series of statements, on a four point scale, where :
1=Don’t agree, 2=Agree a little, 3=Mostly agree, and 4=Agree a lot.
Here is how youth responded to questions about their sense of competence in reading,
writing, math, socially, and generally as a learner .
* Retrospective questions asked youth to reflect on whether participating in the program helped them to get along better with friends. Ratings for these two scales are: 1=”No,” 2=” Mostly No,” 3=”Mostly Yes,” and 4=”Yes.”
3.24 3.03
1
1.5
2
2.5
3
3.5
4
Sense of Competence: As a Learner(N= 370)
Sense of Competence: Socially(N=370)
Me
an
Sense Of Competence: Average Youth Ratings Spring Sample
10 SAYO-Y Data Report, Spring 2015 9/9/2015
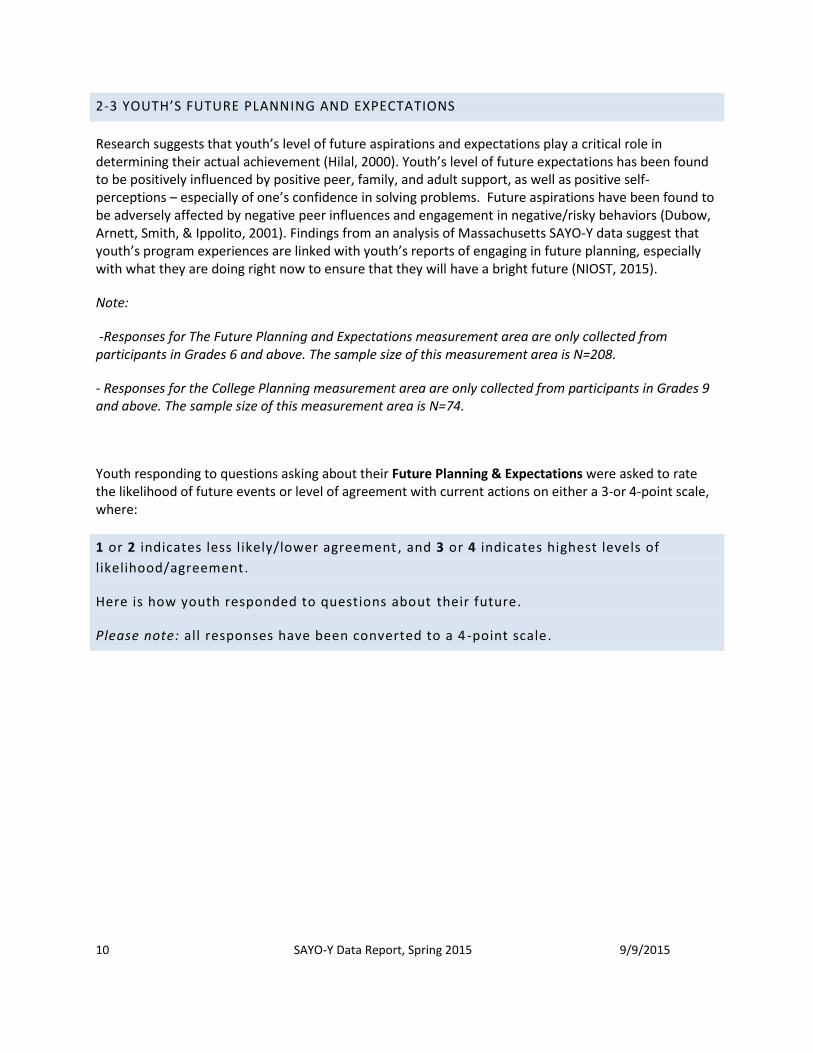
2-3 YOUTH’S FUTURE PLANN ING AND EXPECTATIONS
Research suggests that youth’s level of future aspirations and expectations play a critical role in determining their actual achievement (Hilal, 2000). Youth’s level of future expectations has been found to be positively influenced by positive peer, family, and adult support, as well as positive self-perceptions – especially of one’s confidence in solving problems. Future aspirations have been found to be adversely affected by negative peer influences and engagement in negative/risky behaviors (Dubow, Arnett, Smith, & Ippolito, 2001). Findings from an analysis of Massachusetts SAYO-Y data suggest that youth’s program experiences are linked with youth’s reports of engaging in future planning, especially with what they are doing right now to ensure that they will have a bright future (NIOST, 2015).
Note:
-Responses for The Future Planning and Expectations measurement area are only collected from participants in Grades 6 and above. The sample size of this measurement area is N=208.
- Responses for the College Planning measurement area are only collected from participants in Grades 9 and above. The sample size of this measurement area is N=74.
Youth responding to questions asking about their Future Planning & Expectations were asked to rate the likelihood of future events or level of agreement with current actions on either a 3-or 4-point scale, where:
1 or 2 indicates less likely/lower agreement , and 3 or 4 indicates highest levels of
likelihood/agreement.
Here is how youth responded to questions about their future.
Please note: all responses have been converted to a 4 -point scale.
11 SAYO-Y Data Report, Spring 2015 9/9/2015
3.45 3.61 3.53
3.39
1
1.5
2
2.5
3
3.5
4
Future Planning:Talk to an Adult
(N=208)
Future Expectations(N=208)
College Planning(N=74)
Future Planning:My Actions
(N=208)
Me
an
Future Planning & Expectations : Average Youth Ratings Spring Sample
92.80%
67.80% 69.20%
0.00%
20.00%
40.00%
60.00%
80.00%
100.00%
Parent/Guardian Staff Member School Teacher/GuidanceCounselor
Future Planning & Expectations- Who Have You Talked to About Your Future?
(N=208)

12 SAYO-Y Data Report, Spring 2015 9/9/2015
PART 3: MOVING FORWARD WITH SAYO
3-1 EXPANDING DATA ANALYSIS
3-1-1 Jefferson County Public Schools (JCPS) CASCADE Data: The SAYO-Y is a research-based, tested, and widely used survey tool to measure youth outcomes, specifically around youth’s social-emotional development. However, SAYO-Y data alone is not enough to provide a full picture of youth’s wellbeing when it comes to other desired youth outcomes, such as Academic Success3. To measure out-of-school time (OST) programs’ full impact on participants, school data is crucial as an indicator of academic performance, to be analyzed in conjunction with social-emotional wellbeing data obtained from SAYO, as well as any other outcome data obtained from potential new tools.
The first step in making this cross-analysis possible is at the OST program level, by using students’ JCPS Student ID numbers to log into the survey. This would lay the foundation for connecting students’ school and program attendance, reading levels, and test scores with their perceptions of program experiences, sense of competence, and future planning. This data will not be matched at the individual student level, but rather at the aggregate group level, to ensure that the reporting for both Social Emotional Wellbeing and Academic Success outcomes uses data on the same group of youth. This multidimensional analysis also allows for longitudinal tracking of SAYO data over time.
Thus, the next steps in analyzing SAYO data as part of the BLOCS Data System will involve working closely with JCPS to promote the use of the JCPS data management platform, CASCADE. CASCADE allows OST programs to record participants’ attendance, as well as gain access to their participants’ school data, including student ID numbers. This work will be done on two levels simultaneously; 1) expanding community OST programs access to CASCADE, and 2) working with program directors and staff to ensure full utilization of CASCADE to record and use data.
Expanding CASCADE access and use at the OST program level will provide BLOCS with several cornerstone data points that will allow for more in-depth data analysis that explores the relationship between OST program attendance (dosage), and the program impact on academic and social-emotional youth outcomes.
3-1-2 Quality Data: Program quality data is another cornerstone data point for the BLOCS Data System, serving to measure the OST program features that promote positive youth development. BLOCS has selected the Youth Program Quality Assessment (YPQA) tools, developed by the David P. Weikart Center for Youth Program Quality, to carry out these quality measurements at the OST program level. The YPQA is a research-based and validated instrument designed to assess youth’s access to key developmental experiences at their programs, as well as identify any staff training needs that may arise as a result of that process.
To a large degree, there exists a correlation between the SAYO “Program Experiences” measurement area and the quality constructs assessed using YPQA, and next steps will include cross-analyzing data from both sources to give a more complete picture of how youth are experiencing their programs. This
3 For the full BLOCS Youth Outcomes and Indicators Framework, please refer to Appendix, part 4-3
13 SAYO-Y Data Report, Spring 2015 9/9/2015
robust analysis also serves to explore the relationship between high quality programs and positive youth impact in our community, and examine whether programs of higher quality are better positioned to move the needle on the BLOCS Youth Outcomes.
3-2 INCREASING CAPACITY FOR SAYO-Y
3-2-1 Staff Training: For the SAYO-Y Summer 2014 Pilot, BLOCS used a Core Team of four trained individuals to administer the survey at all participating OST programs. The Core Team model was necessary to address the lack of program staff capacity, as well as alleviate the burden placed on programs to assign staff and complete trainings in a short time frame. During this Spring 2015 SAYO-Y data collection, 25% of participating agencies were able to rely on internal staff to administer the survey. While this is an improvement on capacity, more trained individuals are needed at BLOCS-funded programs, with the goal of all agencies being able to complete the SAYO-Y without external assistance.
Increasing capacity inside OST programs will allow more programs and sites overall to participate in SAYO-Y data collection, increasing the sample size and strengthening the data set. More importantly, empowering agencies to take control of their SAYO-Y administration increases director and staff buy-in and involvement in the process, and paves the way for programs to view this data collection as an opportunity for learning and improvement, instead of a cumbersome task or funding requirement.
3-2-2 Technology: As more agencies and programs participate in SAYO-Y, more support is needed for sites that do not have the necessary technology to administer the survey. As of Spring 2015, BLOCS owns 30 tablets and 3 hotspots that can be loaned out to programs as needed to administer, however, increasing the number of participating sites will also require increasing the number of tablets and hotspots available, enabling multiple sites to administer the survey at the same time.
3-3-3 Support: Increasing SAYO-Y capacity may require hiring a temporary staff member to support agency staff and coordinate logistics during the SAYO data collection period(s). The SAYO Coordinator would support programs in setting up their online surveys, provide links, assist with administration, and troubleshoot any problems staff may face while preparing for the survey. They would also set up tablets and hotspots and coordinate the logistics of loaning out BLOCS technology to OST programs that do not have the necessary equipment to administer the survey.
3-3 CONSIDERING SAYO-S
The SAYO-Y is designed for students in Grades 4-12, and thus is not an ideal fit for programs that serve primarily younger youth, as it does not allow programs to capture input from a sample representative of their primary populations. For those programs, another version of SAYO exists, the SAYO-Staff (SAYO-S), which requires staff to fill out the survey on behalf of the attending participants. As BLOCS builds more administration capacity, The SAYO-S is recommended for consideration as an additional tool to be utilized by OST programs to measure youth outcomes.

14 SAYO-Y Data Report, Spring 2015 9/9/2015
PART 4: CONCLUSIONS
The Spring 2015 SAYO-Y Baseline data collection was carried out in the months of April and May, and
included 12 agencies and 31 out-of-school time (OST) programs. In general, there were no major
discrepancies in scores between programs, and the data was encouraging, with all but one
measurement scale falling at a 3 or above out of 4.
The highest reported scale item was Future Expectations, at 3.61, indicating that our youth have high
hopes for their futures in terms of graduating high school, going to college, and being successful in life.
This hope is echoed by the relatively high score on College Planning, at 3.53. However, Future Planning:
My Actions scored a 3.39, indicating somewhat of an inconsistency between youth’s hopes and the
intentional actions they are taking at the moment to ensure their future success.
The data also revealed a positive attitude around adult relationships; the Supportive Adult and Future
Planning: Talk to an Adult scales measured 3.42 and 3.45 respectively, pointing out youth’s satisfaction
with the interactions they have with the adults at their OST programs. This conclusion is in line with the
findings from the baseline Youth Program Quality Assessments (YPQA) conducted by the Weikart Center
in Fall of 2014, in which ‘Adult Partners’ and ‘Adult Interactions’ scored relatively high in their respective
domains, and higher than the national reference sample for those scale items. This baseline data from
both the SAYO-Y and the YPQA suggests that BLOCS OST programs are generally strong in forging
positive relationships with youth they serve, and are well positioned to leverage these strong
relationships to make an impact in the lives of youth in the community.
The lowest reported scale item was Choice and Autonomy, measuring 2.85, which is also in line with
programs’ relatively low scores on the YPQA ‘Choice’ scale item. This data seemingly indicates that
BLOCS programs would benefit from improvement plans that emphasize youth choice in program
content and flow, giving youth more opportunities to make meaningful decisions around their own
learning.
It is imperative to bear in mind that the SAYO-Y Spring 2015 data is baseline data, and must be treated
as such. The goal of collecting SAYO-Y data is not to penalize programs that do not score well, but rather
to work with programs to discover how youth feel about themselves and the time they spend at the
program, and find trends in the data that reveal opportunities for improvement. Moving forward, efforts
must be centered on increasing the use of SAYO-Y in the community; as more programs become familiar
with the tool and utilize it, larger sample sizes will begin allowing for more in-depth analysis that also
takes into account other sources of data such as program quality and academic performance. With
stronger and more robust data, BLOCS can make better connections and conclusions about the quality
and impact of OST programs on the lives of the youth they serve.
15 SAYO-Y Data Report, Spring 2015 9/9/2015
PART 5: APPENDIX
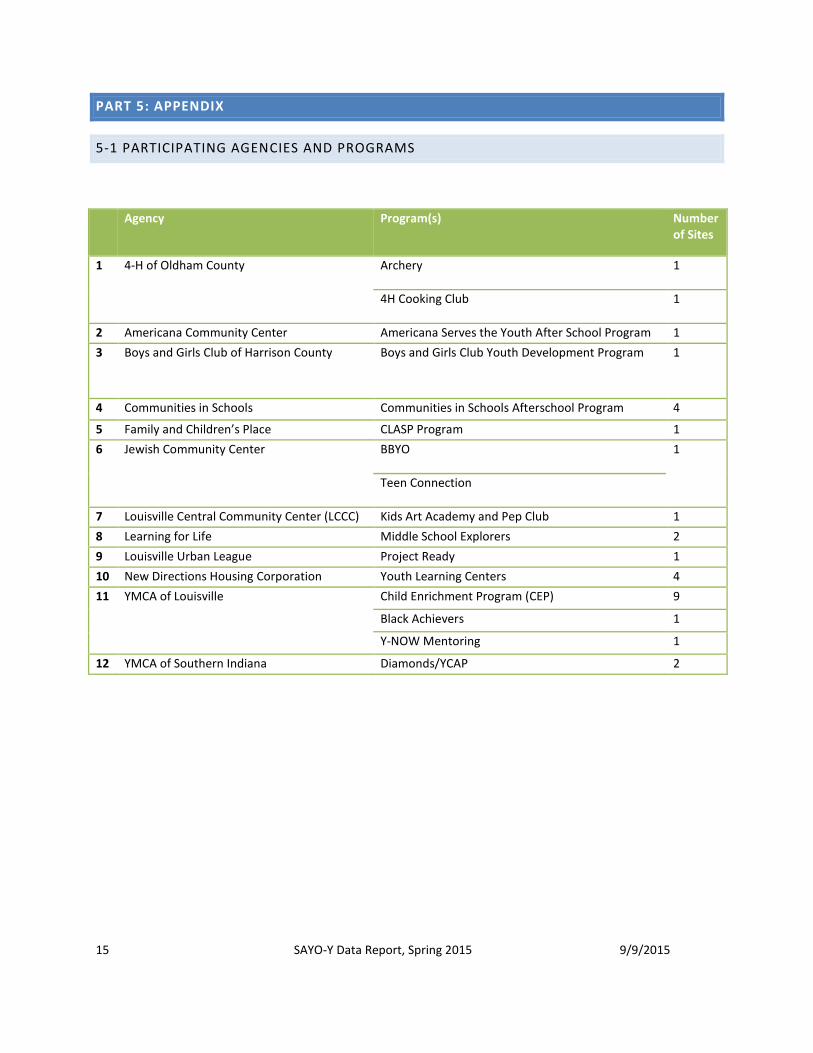
5-1 PARTICIPATING AGENCIES AND PROGRAMS
Agency Program(s) Number of Sites
1 4-H of Oldham County Archery 1
4H Cooking Club 1
2 Americana Community Center Americana Serves the Youth After School Program 1
3 Boys and Girls Club of Harrison County Boys and Girls Club Youth Development Program 1
4 Communities in Schools Communities in Schools Afterschool Program 4
5 Family and Children’s Place CLASP Program 1
6 Jewish Community Center BBYO 1
Teen Connection
7 Louisville Central Community Center (LCCC) Kids Art Academy and Pep Club 1
8 Learning for Life Middle School Explorers 2
9 Louisville Urban League Project Ready 1
10 New Directions Housing Corporation Youth Learning Centers 4
11 YMCA of Louisville Child Enrichment Program (CEP) 9
Black Achievers 1
Y-NOW Mentoring 1
12 YMCA of Southern Indiana Diamonds/YCAP 2
16 SAYO-Y Data Report, Spring 2015 9/9/2015
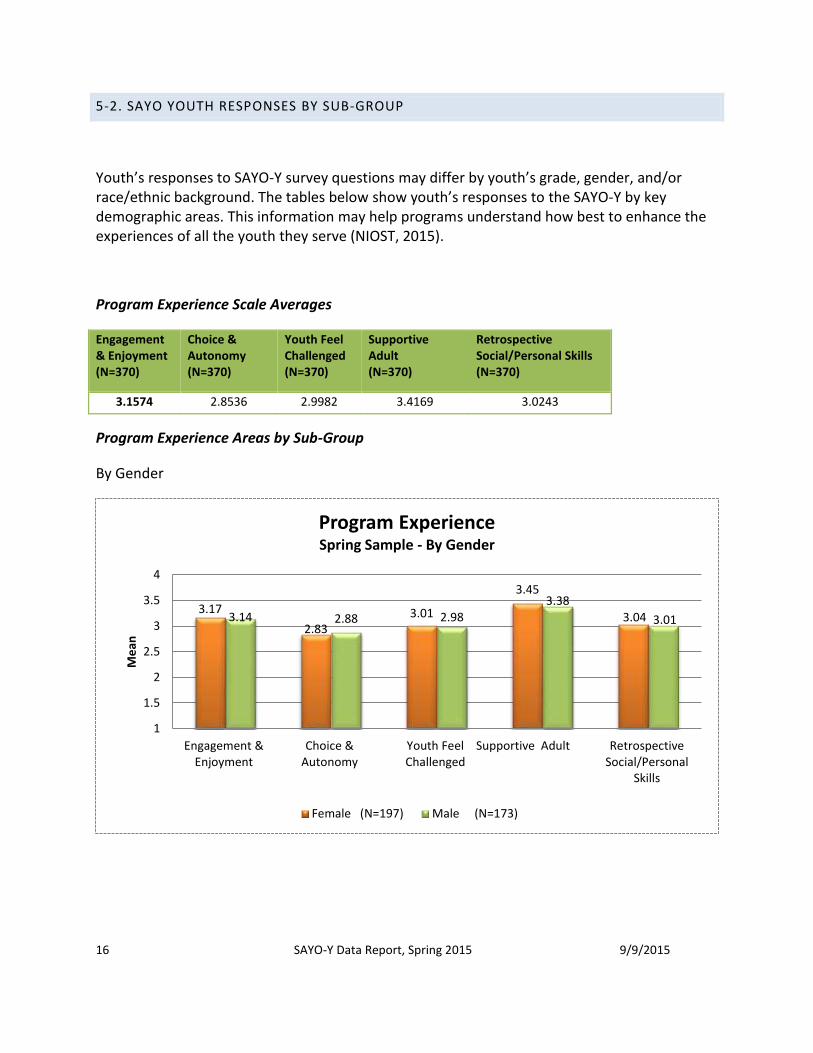
5-2. SAYO YOUTH RESPONSES BY SUB-GROUP
Youth’s responses to SAYO-Y survey questions may differ by youth’s grade, gender, and/or race/ethnic background. The tables below show youth’s responses to the SAYO-Y by key demographic areas. This information may help programs understand how best to enhance the experiences of all the youth they serve (NIOST, 2015).
Program Experience Scale Averages
Engagement & Enjoyment (N=370)
Choice & Autonomy (N=370)
Youth Feel Challenged (N=370)
Supportive Adult (N=370)
Retrospective Social/Personal Skills (N=370)
3.1574 2.8536 2.9982 3.4169 3.0243
Program Experience Areas by Sub-Group
By Gender
3.17
2.83 3.01
3.45
3.04 3.14 2.88 2.98 3.38
3.01
1
1.5
2
2.5
3
3.5
4
Engagement &Enjoyment
Choice &Autonomy
Youth FeelChallenged
Supportive Adult RetrospectiveSocial/Personal
Skills
Me
an
Program Experience Spring Sample - By Gender
Female (N=197) Male (N=173)
17 SAYO-Y Data Report, Spring 2015 9/9/2015
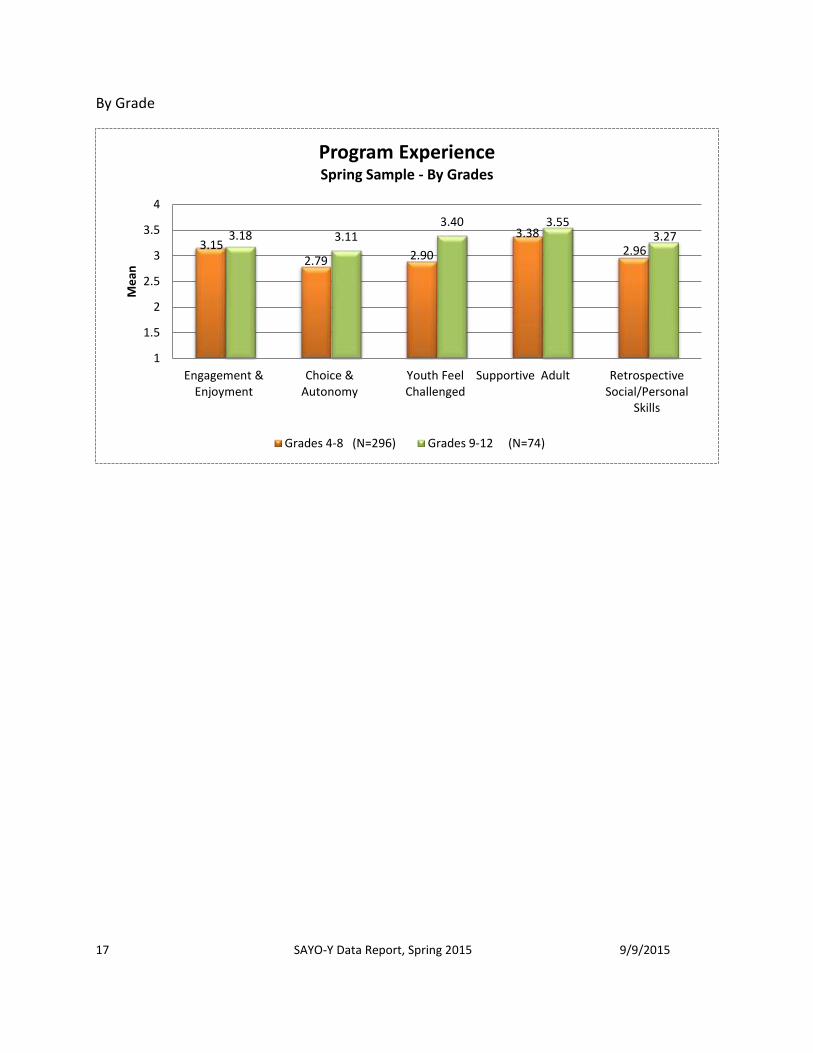
By Grade
3.15 2.79 2.90
3.38
2.96 3.18 3.11
3.40 3.55 3.27
1
1.5
2
2.5
3
3.5
4
Engagement &Enjoyment
Choice &Autonomy
Youth FeelChallenged
Supportive Adult RetrospectiveSocial/Personal
Skills
Me
an
Program Experience Spring Sample - By Grades
Grades 4-8 (N=296) Grades 9-12 (N=74)
18 SAYO-Y Data Report- Spring 2015 9/9/2015
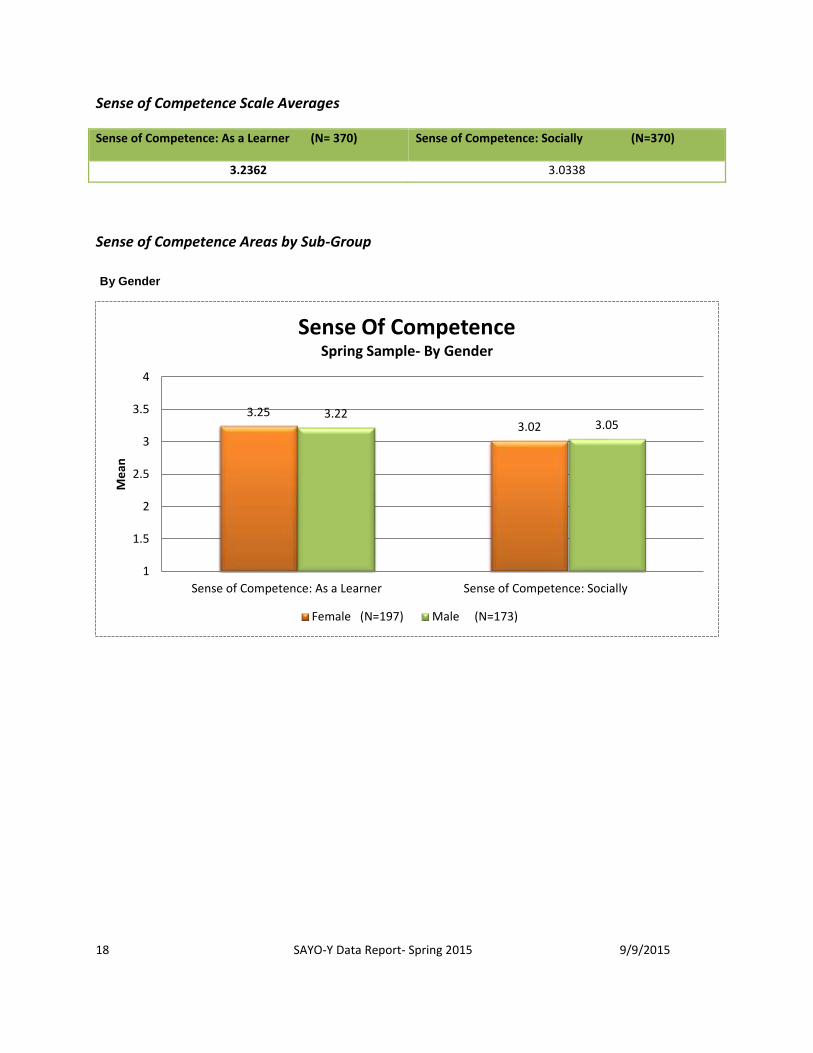
Sense of Competence Scale Averages
Sense of Competence: As a Learner (N= 370) Sense of Competence: Socially (N=370)
3.2362 3.0338
Sense of Competence Areas by Sub-Group
By Gender
3.25 3.02
3.22 3.05
1
1.5
2
2.5
3
3.5
4
Sense of Competence: As a Learner Sense of Competence: Socially
Me
an
Sense Of Competence Spring Sample- By Gender
Female (N=197) Male (N=173)
19 SAYO-Y Data Report- Spring 2015 9/9/2015
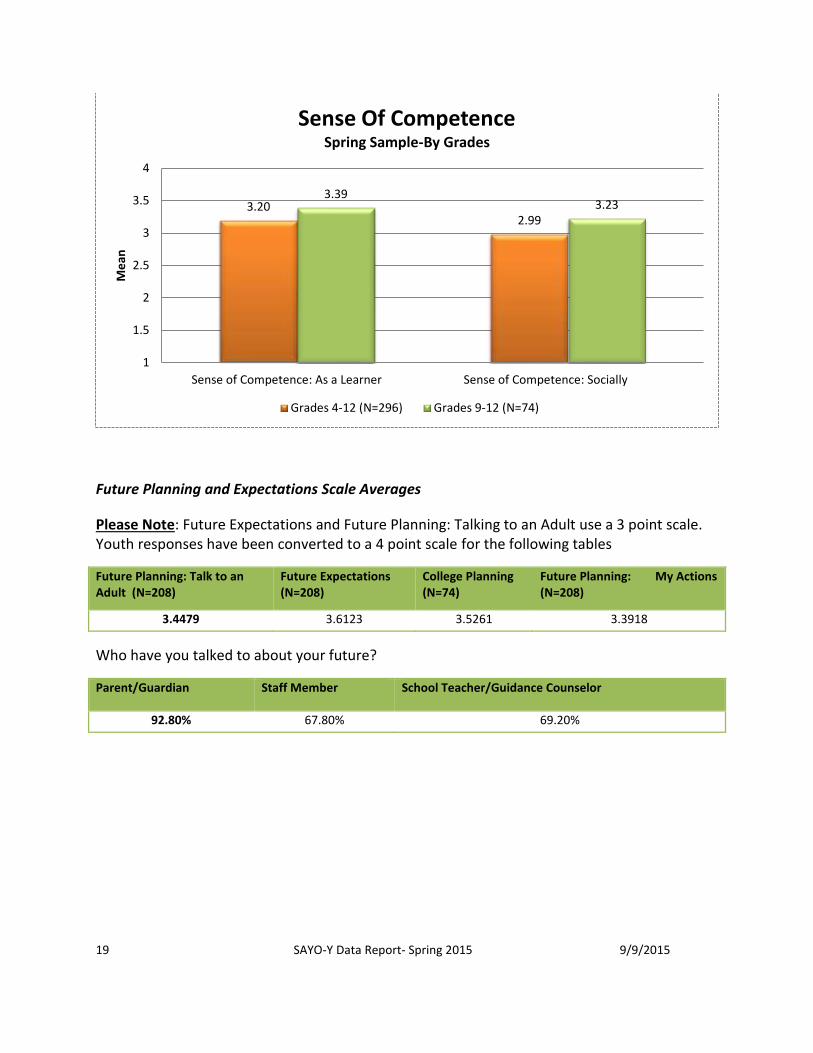
Future Planning and Expectations Scale Averages
Please Note: Future Expectations and Future Planning: Talking to an Adult use a 3 point scale. Youth responses have been converted to a 4 point scale for the following tables
Future Planning: Talk to an Adult (N=208)
Future Expectations (N=208)
College Planning (N=74)
Future Planning: My Actions (N=208)
3.4479 3.6123 3.5261 3.3918
Who have you talked to about your future?
Parent/Guardian Staff Member School Teacher/Guidance Counselor
92.80% 67.80% 69.20%
3.20 2.99
3.39 3.23
1
1.5
2
2.5
3
3.5
4
Sense of Competence: As a Learner Sense of Competence: Socially
Me
an
Sense Of Competence Spring Sample-By Grades
Grades 4-12 (N=296) Grades 9-12 (N=74)
20 SAYO-Y Data Report- Spring 2015 9/9/2015
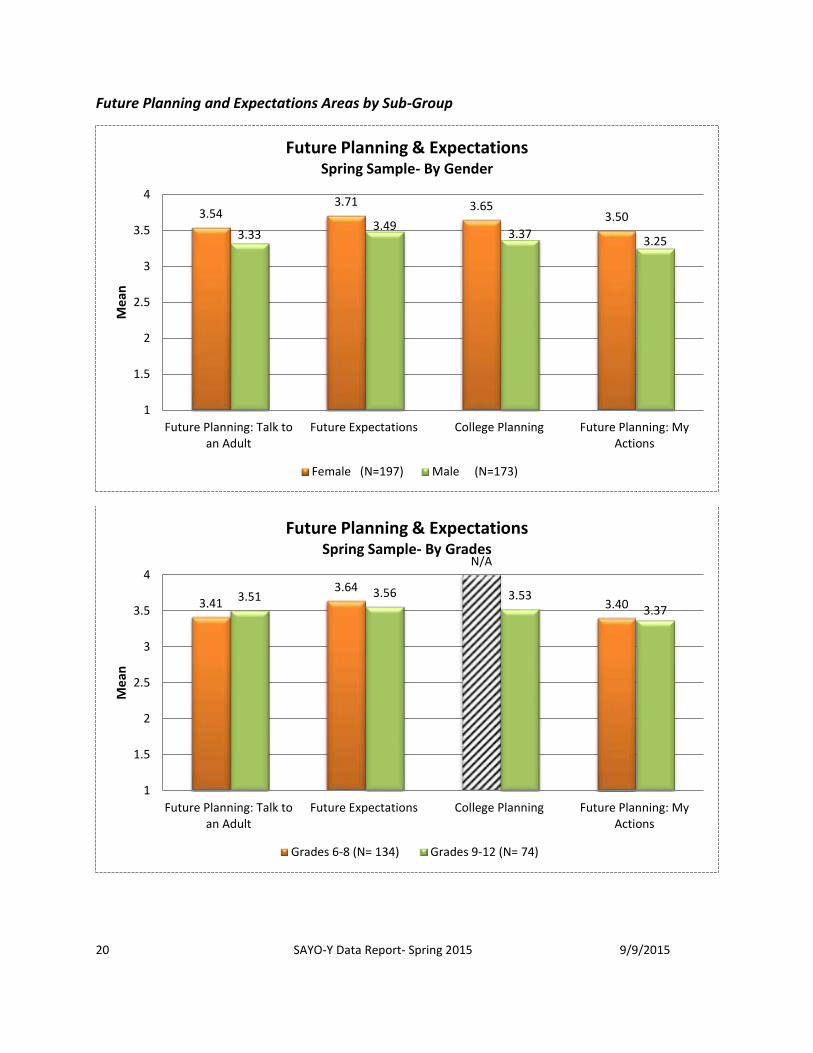
Future Planning and Expectations Areas by Sub-Group
3.54 3.71 3.65
3.50
3.33 3.49
3.37 3.25
1
1.5
2
2.5
3
3.5
4
Future Planning: Talk toan Adult
Future Expectations College Planning Future Planning: MyActions
Me
an
Future Planning & Expectations Spring Sample- By Gender
Female (N=197) Male (N=173)
3.41 3.64
N/A
3.40 3.51 3.56 3.53
3.37
1
1.5
2
2.5
3
3.5
4
Future Planning: Talk toan Adult
Future Expectations College Planning Future Planning: MyActions
Me
an
Future Planning & Expectations Spring Sample- By Grades
Grades 6-8 (N= 134) Grades 9-12 (N= 74)
21 SAYO-Y Data Report- Spring 2015 9/9/2015
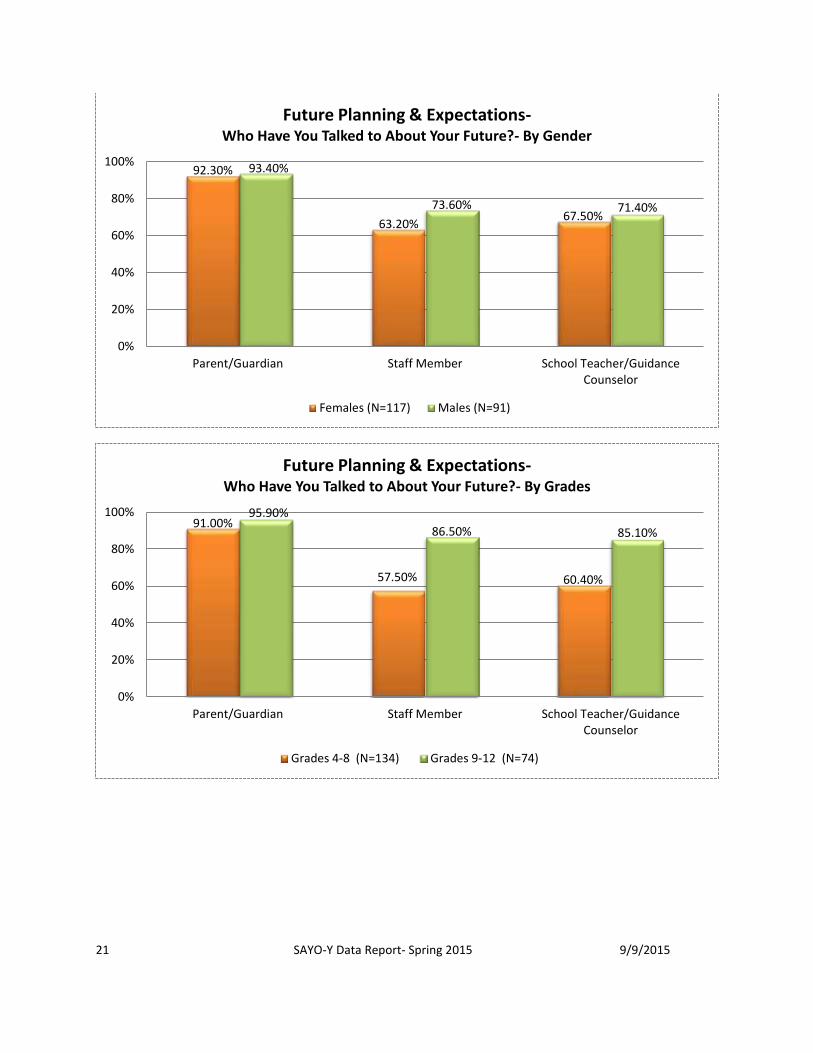
92.30%
63.20% 67.50%
93.40%
73.60% 71.40%
0%
20%
40%
60%
80%
100%
Parent/Guardian Staff Member School Teacher/GuidanceCounselor
Future Planning & Expectations- Who Have You Talked to About Your Future?- By Gender
Females (N=117) Males (N=91)
91.00%
57.50% 60.40%
95.90%
86.50% 85.10%
0%
20%
40%
60%
80%
100%
Parent/Guardian Staff Member School Teacher/GuidanceCounselor
Future Planning & Expectations- Who Have You Talked to About Your Future?- By Grades
Grades 4-8 (N=134) Grades 9-12 (N=74)

22 SAYO-Y Data Report- Spring 2015 9/9/2015
5-3: BLOCS COMMON YOUTH OUTCOMES
BL
OC
S Co
mm
on
Yo
uth
Ou
tcom
es
last revised
July 2015
DO
MA
IN 1: So
cial-Emo
tion
al De
velo
pm
en
t
Yo
uth
have
a po
sitive se
lf-ide
ntity an
d fe
el in
con
trol o
f the
ir lives, h
ave th
e ab
ility to b
e
resilie
nt an
d co
pe
with
adve
rsity, and
assum
e re
spo
nsib
ility for th
eir o
wn
de
cision
s.
1a. Au
ton
om
y/Re
spo
nsib
ilityYo
uth
fee
l in ch
arge o
f the
ir lives, an
d take
resp
on
sibility fo
r the
ir de
cision
s and
action
s
1b. P
ositive
Self- Id
en
tity
You
th fe
el go
od
abo
ut th
em
selve
s, and
have
a glob
al un
de
rstand
ing o
f the
ir pe
rson
ality,
characte
r, role
s, value
s, and
/or p
hysical ap
pe
arance
1c. Re
silien
cy
You
th are
em
po
we
red
to o
verco
me
adve
rsity and
succe
ed
in sp
ite o
f un
favorab
le
circum
stance
s or n
egative
influ
en
ces
1d. H
op
eYo
uth
are o
ptim
istic that th
ey w
ill succe
ed
in th
eir fu
ture
.
DO
MA
IN 2: C
om
mu
nity En
gagem
en
t
Yo
uth
have
sen
se o
f be
lon
ging to
the
ir institu
tion
s, fee
l value
d as active
particip
ants in
the
ir com
mu
nity, an
d are
able
to n
avigate m
ultip
le re
lation
ship
s.
2a. Particip
ation
in C
om
mu
nity
You
th h
ave m
ean
ingfu
l role
s with
in th
eir co
mm
un
ity and
spe
nd
time
on
the
issue
s that
matte
r to th
em
. (com
mu
nity re
fers to
the
geo
graph
ic bo
un
darie
s …)
2b. R
elatio
nsh
ip Skills
You
th h
ave ab
ility to liste
n, re
spe
ct, and
wo
rk collab
orative
ly with
oth
ers to
sustain
me
anin
gful re
lation
ship
s
2c. Sen
se o
f Be
lon
ging
You
th fe
el valu
ed
by o
the
rs in th
eir fam
ily, pro
gram, sch
oo
l, or co
mm
un
ity.
DO
MA
IN 3: H
ealth
and
We
llne
ss
Yo
uth
lead
he
althy live
s and
make
de
cision
s that b
est e
nsu
re cu
rren
t and
futu
re p
hysical
we
llbe
ing.
3a. Engage
me
nt in
Ph
ysical Activity
You
th p
articipate
in re
gular p
hysical activity o
n th
eir o
wn
or w
ith a gro
up
3b. A
lcoh
ol/To
bacco
/ Oth
er D
rug U
seYo
uth
abstain
from
alcoh
ol, to
bacco
, and
oth
er h
armfu
l dru
gs
DO
MA
IN 4: A
cade
mic A
chie
vem
en
t
Yo
uth
have
the
ability to
learn
and
thin
k critically and
are m
otivate
d to
gradu
ate an
d gain
fun
ction
al and
organ
ization
al skills ne
cessary fo
r colle
ge an
d e
mp
loym
en
t.
4a. Acad
em
ic Succe
ss
You
th p
ose
ss the
core
acade
mic skills an
d co
nte
nt kn
ow
led
ge re
qu
ired
to tran
sition
into
the
ne
xt stage o
f learn
ing
4b. C
olle
ge/ C
aree
r Re
adin
ess (o
lde
r you
th)
You
th h
ave th
e fu
nctio
nal skills, kn
ow
led
ge, an
d ab
ilities to
pre
pare
the
m fo
r po
st-
seco
nd
ary ed
ucatio
n
23 SAYO-Y Data Report- Spring 2015 9/9/2015
WORKS CITED
Dubow, E. F., Arnett, M., Smith, K., & Ippolito, M. F. (2001, Feb). Predictors of Future Expectations of Inner-City
Children: A 9-Month Prospective Study. Journal of Early Adolescence, 21(1), 5-28.
Hilal, M. M. (2000). A Structural Model of Attitudes Towards School Subjects, Academic Aspiration and
Achievement. Educational Psychology, 20(1), 75-84.
NIOST. (2015). Sample Pre-Post SAYO Data Summary Report. Wellesley: National Institute of Out of School Time.
Stavsky, S. (2015). Measuring Social and Emotional Learning with the Survey of Academic and Youth Outcomes
(SAYO). Wellesley: National Institute of Out of School Time.