Embed Size (px)
Citation preview
Survey Methods & Design in Psychology
Lecture 12 (2007)
Review
Lecturer: James Neill
Overview
• Review– Research process– Survey design– MLR, ANOVA, Power– What type of analysis?
• Lab report
• Final exam
• Evaluation & feedback
Aims & Outcomes
• Knowledge and skills for conducting ethical, well-designed, survey-based research in psychology.
• Theory and practice of survey-based research:– How to ask a research question– Survey design– Sampling– Interpreting and communicating results.
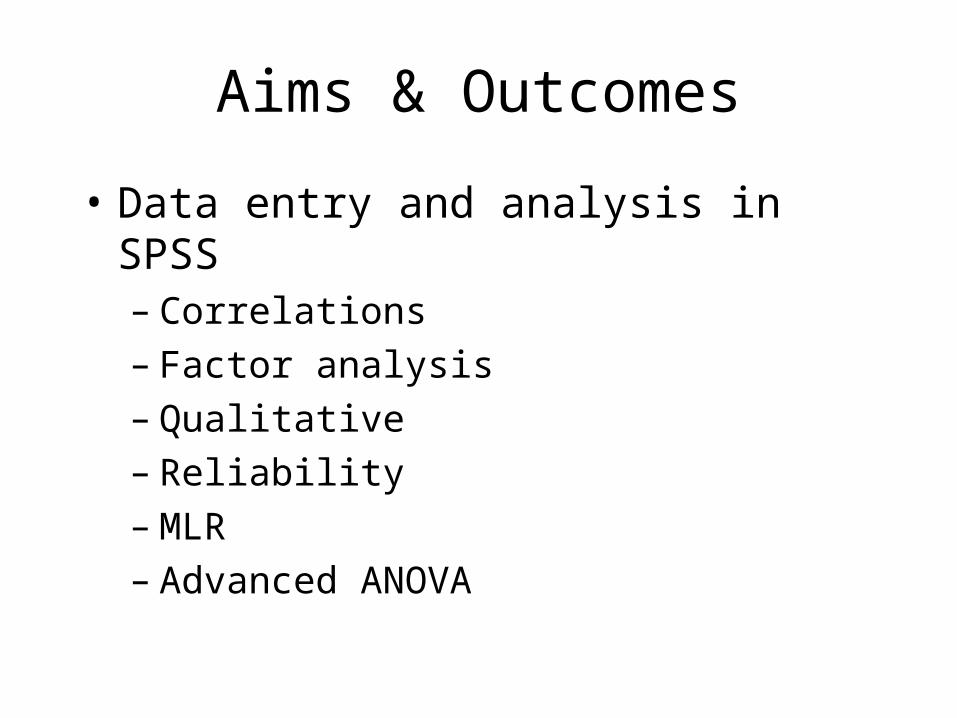
Aims & Outcomes
• Data entry and analysis in SPSS– Correlations– Factor analysis– Qualitative– Reliability– MLR– Advanced ANOVA
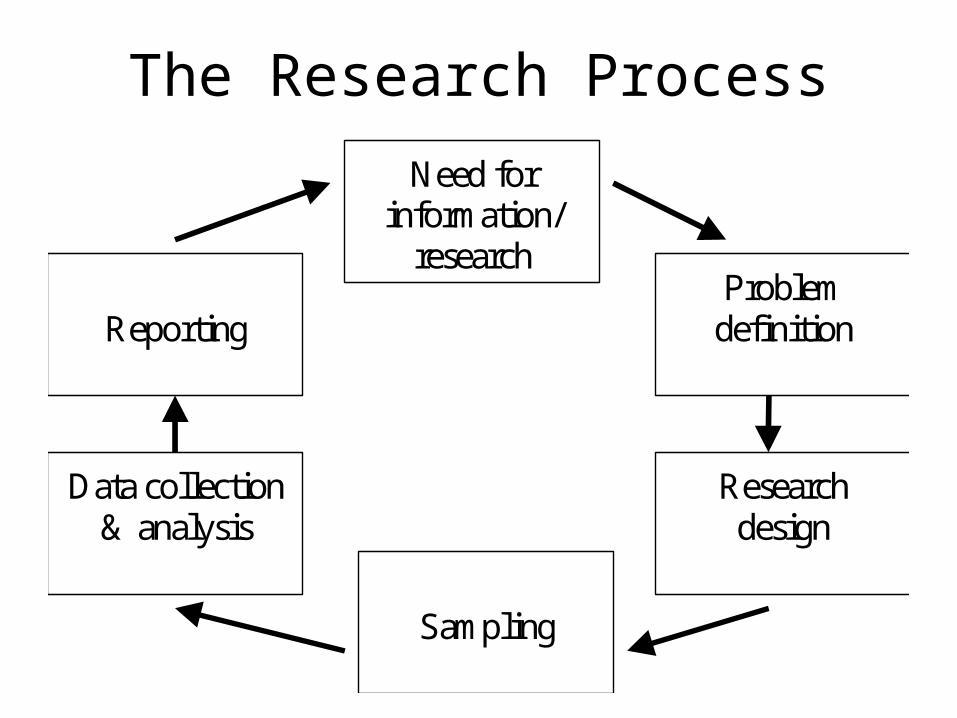
The Research Process
Need forinformation/
research
Reporting
Data collection& analysis
Problemdefinition
Researchdesign
Sampling
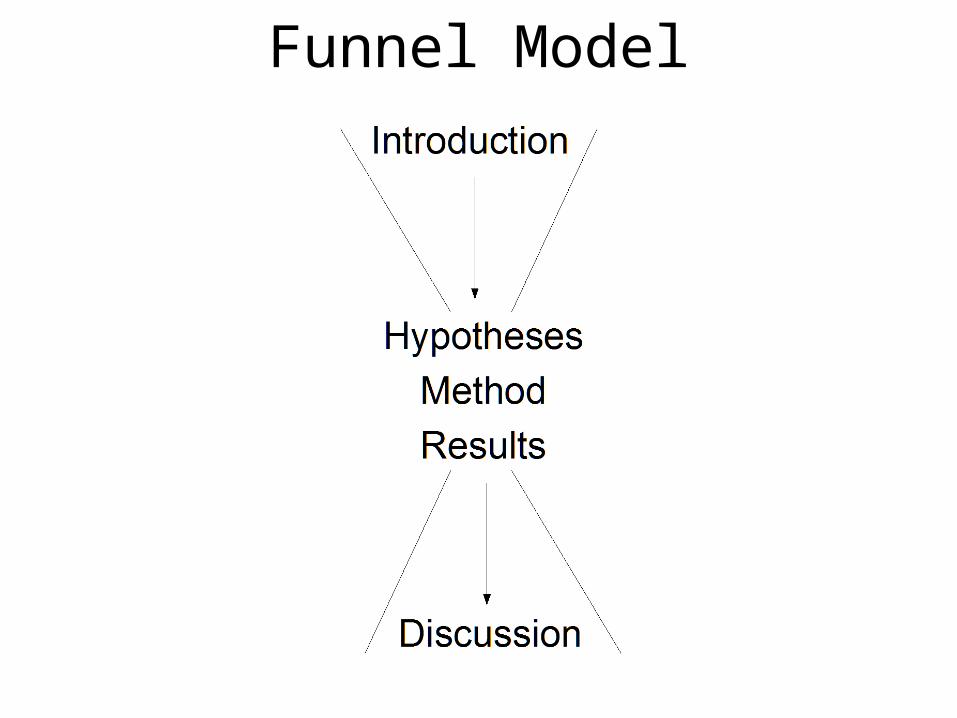
Funnel Model
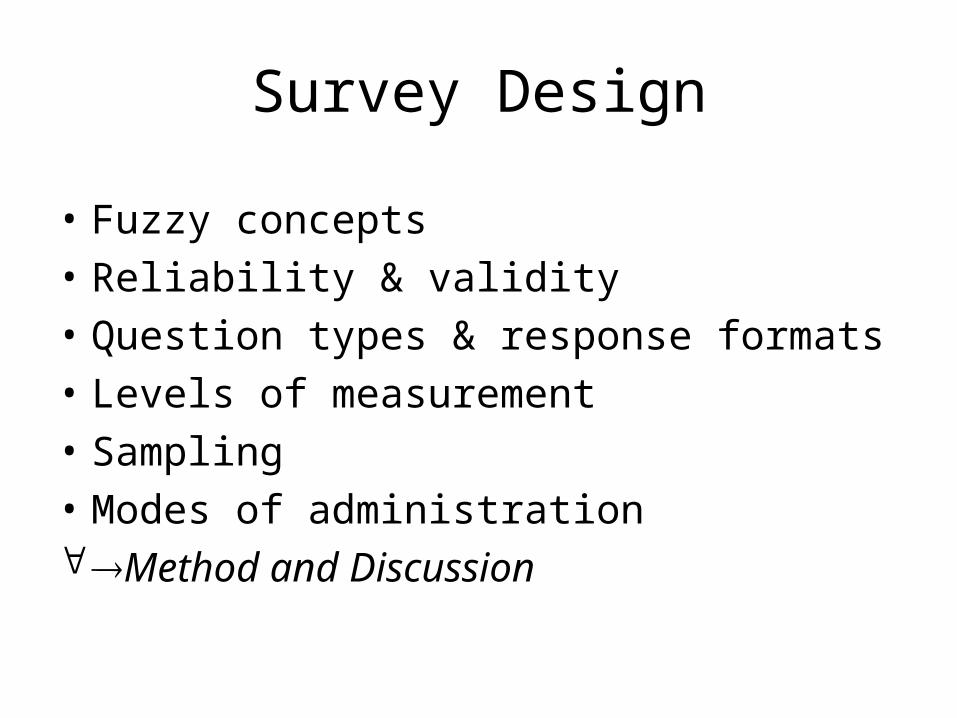
Survey Design
• Fuzzy concepts
• Reliability & validity
• Question types & response formats
• Levels of measurement
• Sampling
• Modes of administrationMethod and Discussion
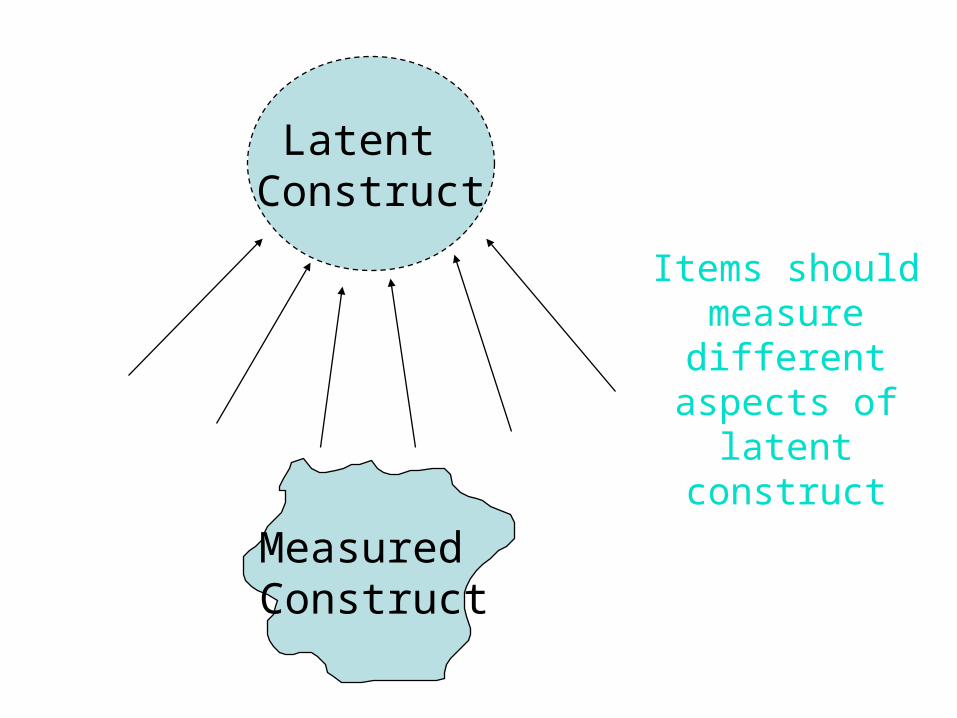
Items should measure different aspects of latent
construct
Latent Construct
MeasuredConstruct
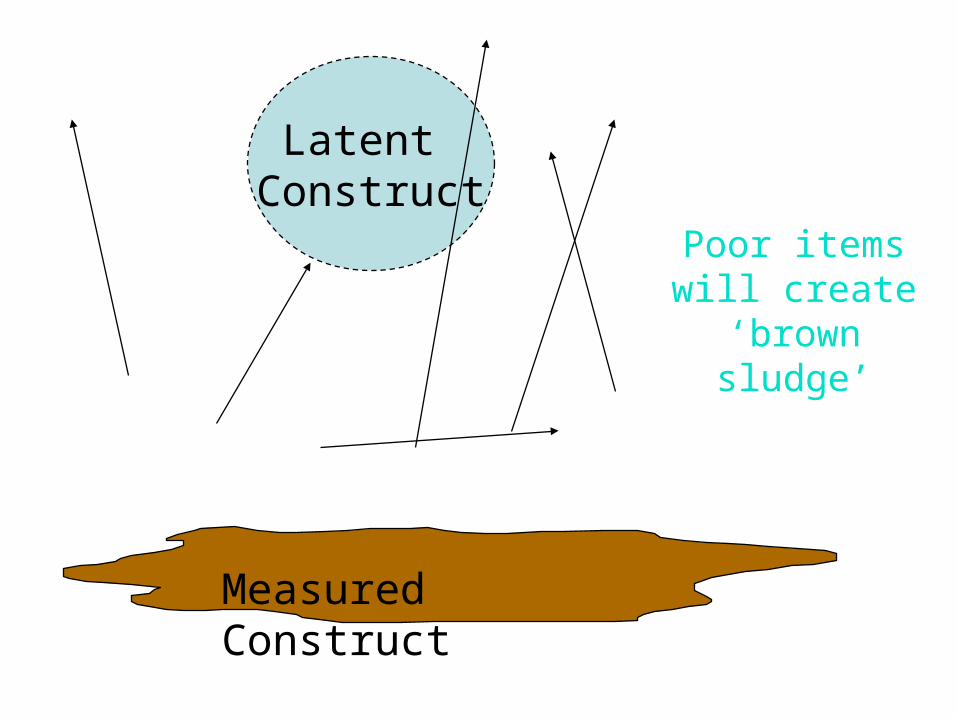
Poor items will create ‘brown
sludge’
Latent Construct
Measured Construct
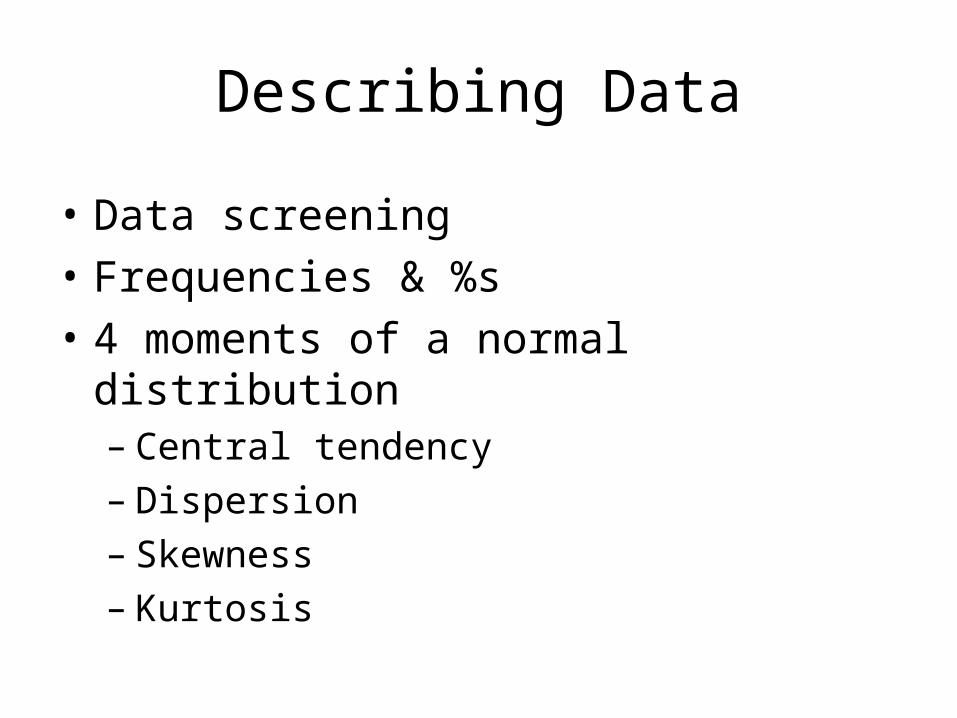
Describing Data
• Data screening
• Frequencies & %s
• 4 moments of a normal distribution– Central tendency– Dispersion– Skewness– Kurtosis
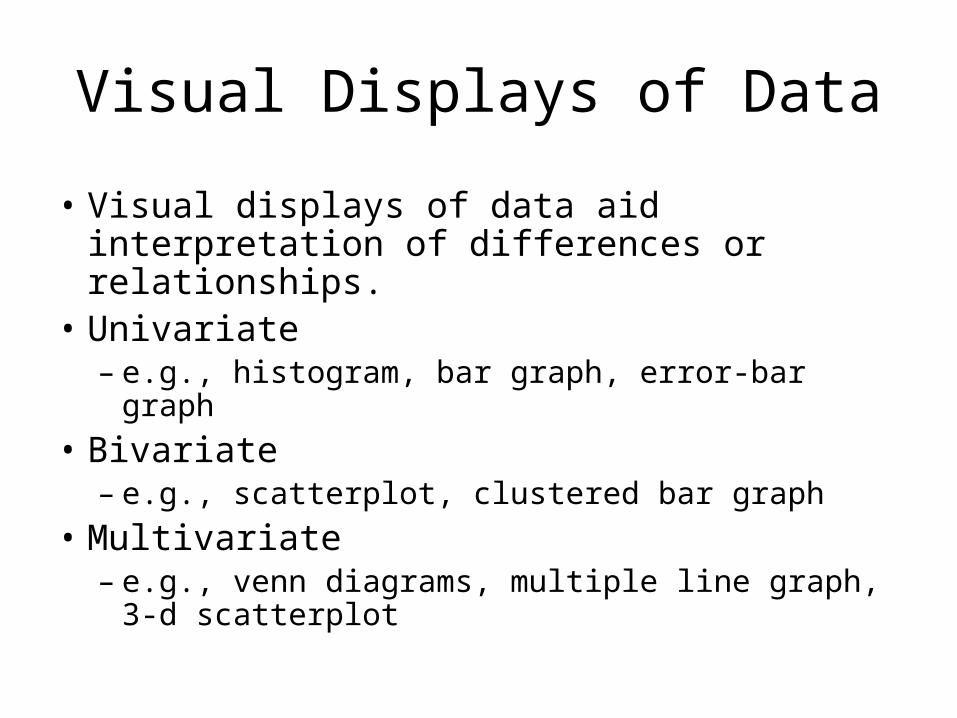
Visual Displays of Data
• Visual displays of data aid interpretation of differences or relationships.
• Univariate– e.g., histogram, bar graph, error-bar graph
• Bivariate– e.g., scatterplot, clustered bar graph
• Multivariate– e.g., venn diagrams, multiple line graph, 3-d
scatterplot
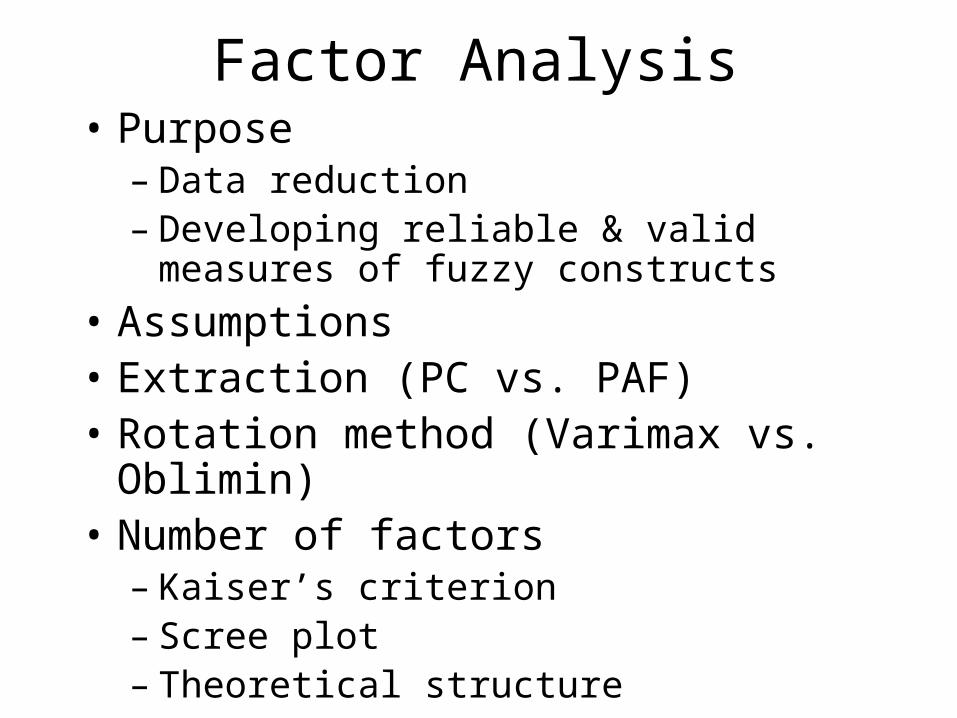
Factor Analysis• Purpose
– Data reduction– Developing reliable & valid measures of
fuzzy constructs
• Assumptions• Extraction (PC vs. PAF)• Rotation method (Varimax vs. Oblimin)• Number of factors
– Kaiser’s criterion– Scree plot– Theoretical structure
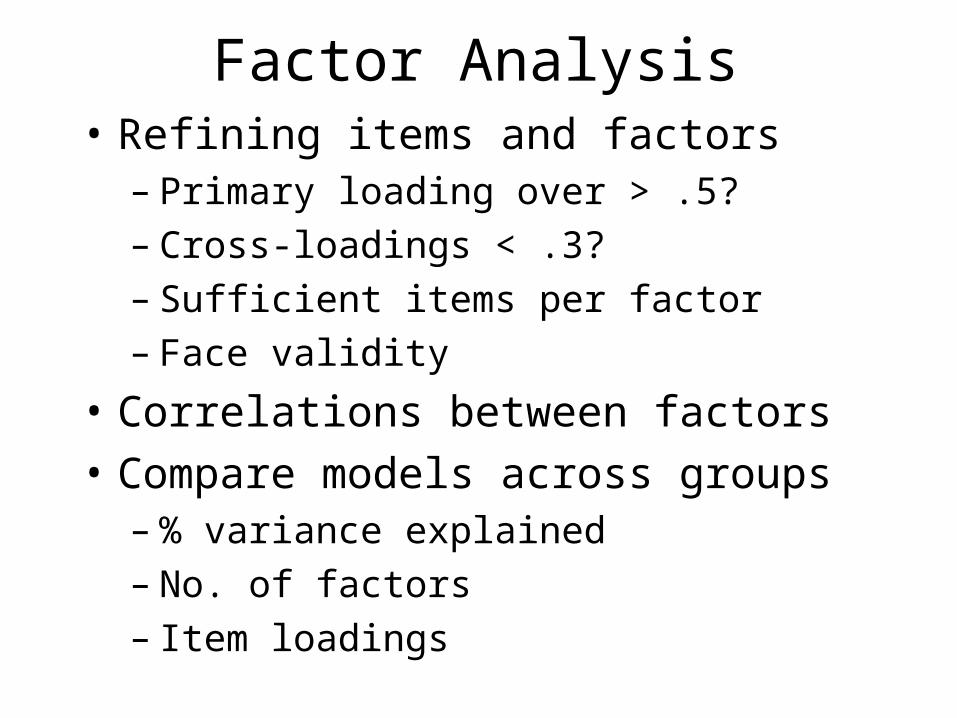
Factor Analysis• Refining items and factors
– Primary loading over > .5?– Cross-loadings < .3?– Sufficient items per factor– Face validity
• Correlations between factors
• Compare models across groups– % variance explained– No. of factors– Item loadings
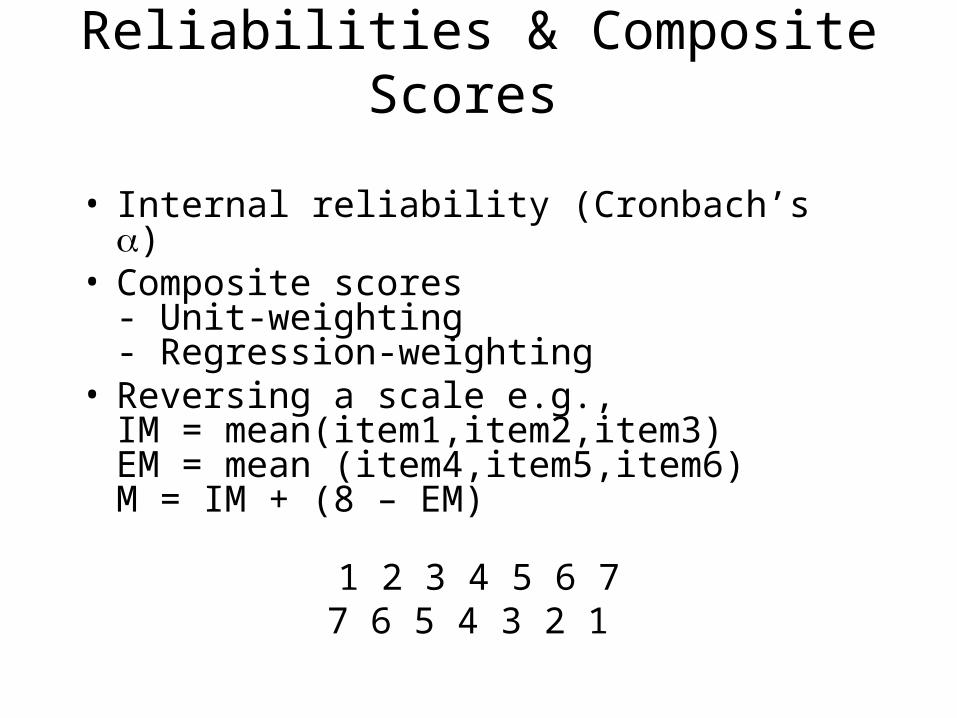
Reliabilities & Composite Scores
• Internal reliability (Cronbach’s )• Composite scores
- Unit-weighting- Regression-weighting
• Reversing a scale e.g.,IM = mean(item1,item2,item3)EM = mean (item4,item5,item6)M = IM + (8 – EM)
1 2 3 4 5 6 77 6 5 4 3 2 1
Qualitative
• Do I need a hypothesis?
• Multiple Response Analysis with SPSS
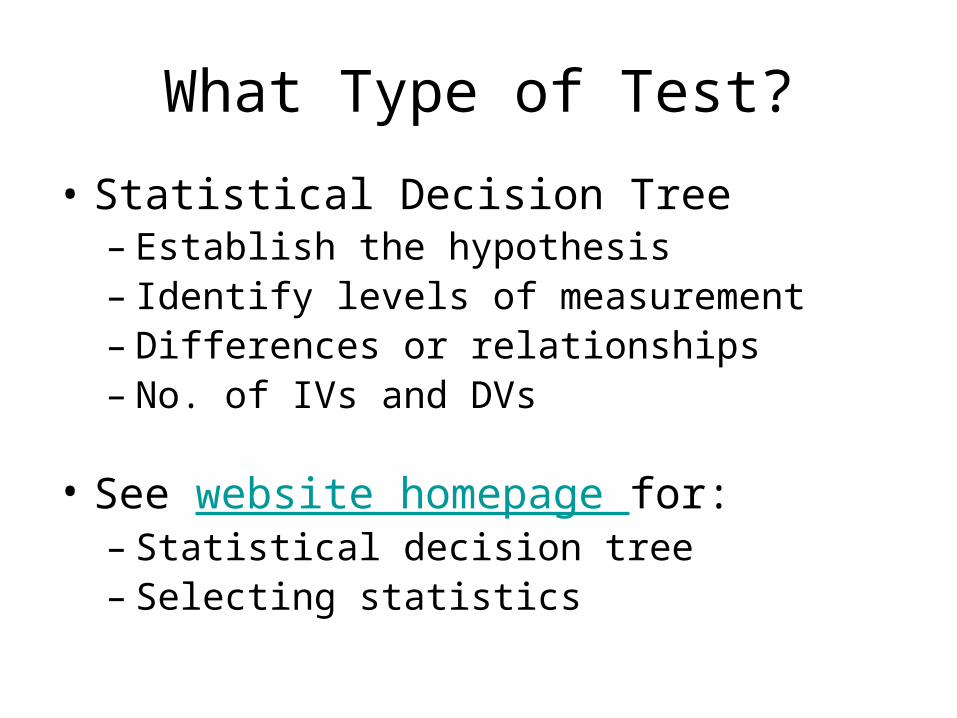
What Type of Test?
• Statistical Decision Tree– Establish the hypothesis– Identify levels of measurement– Differences or relationships– No. of IVs and DVs
• See website homepage for:– Statistical decision tree– Selecting statistics
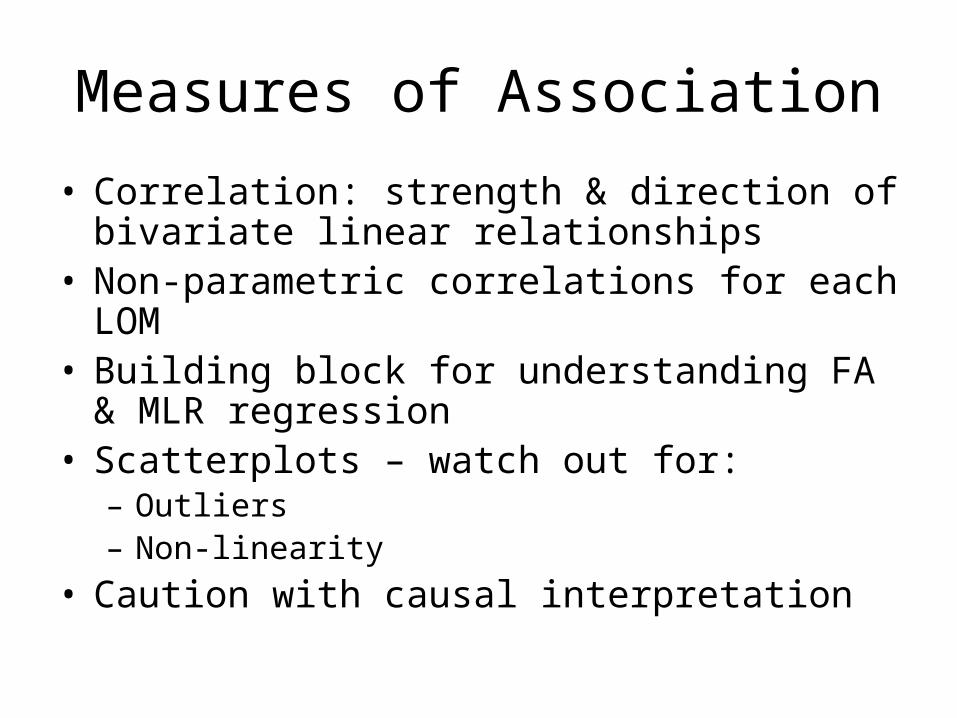
Measures of Association
• Correlation: strength & direction of bivariate linear relationships
• Non-parametric correlations for each LOM• Building block for understanding FA & MLR
regression• Scatterplots – watch out for:
– Outliers– Non-linearity
• Caution with causal interpretation
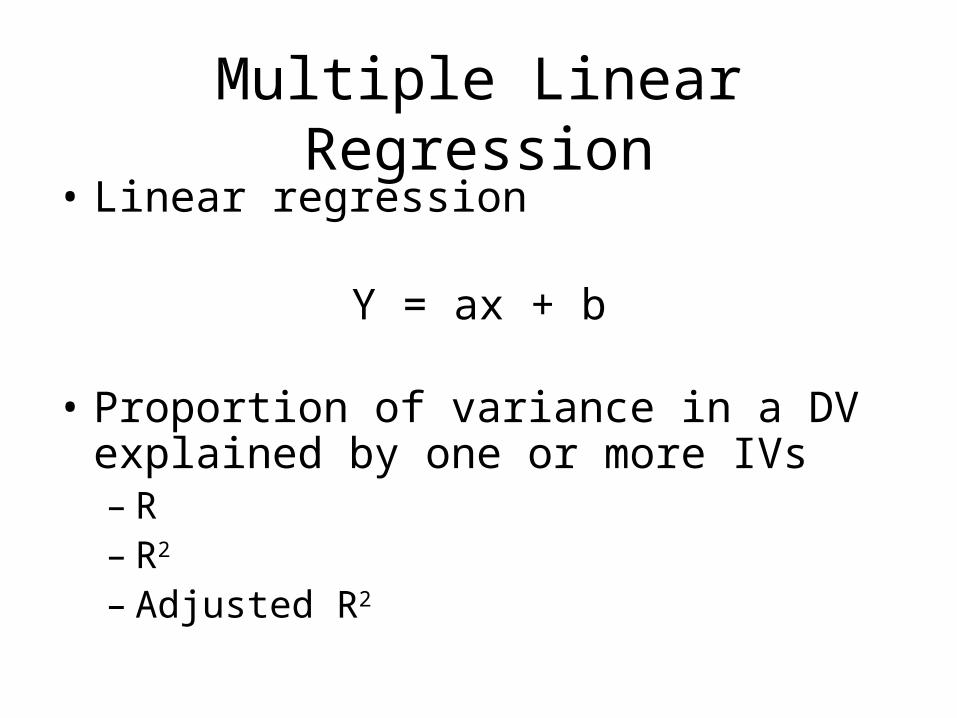
Multiple Linear Regression• Linear regression
Y = ax + b
• Proportion of variance in a DV explained by one or more IVs– R– R2
– Adjusted R2
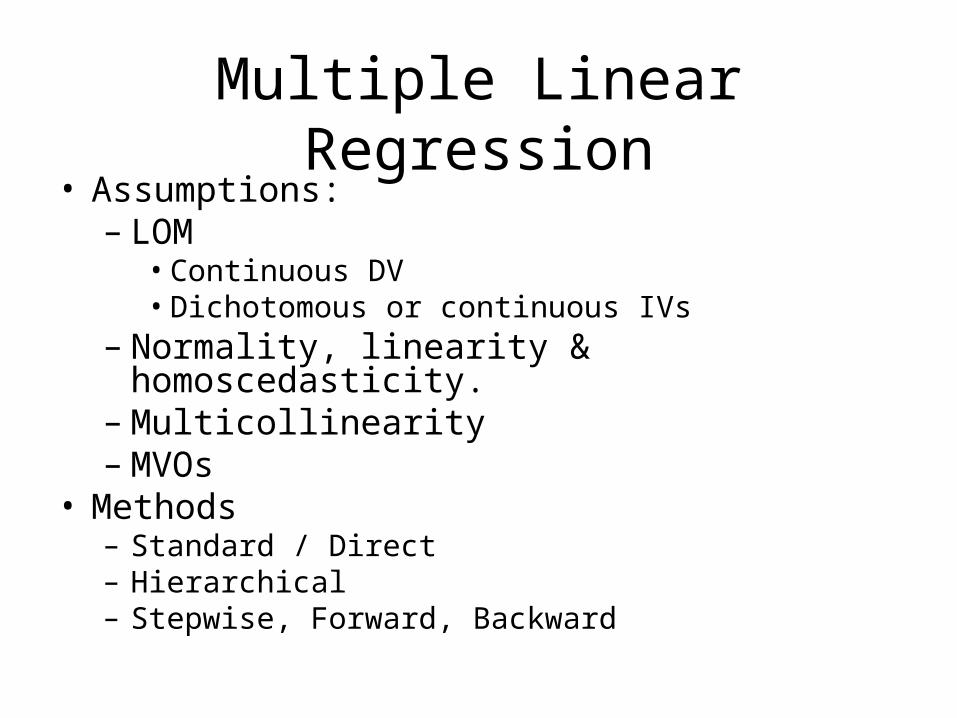
Multiple Linear Regression• Assumptions:
– LOM• Continuous DV• Dichotomous or continuous IVs
– Normality, linearity & homoscedasticity.– Multicollinearity– MVOs
• Methods– Standard / Direct– Hierarchical– Stepwise, Forward, Backward
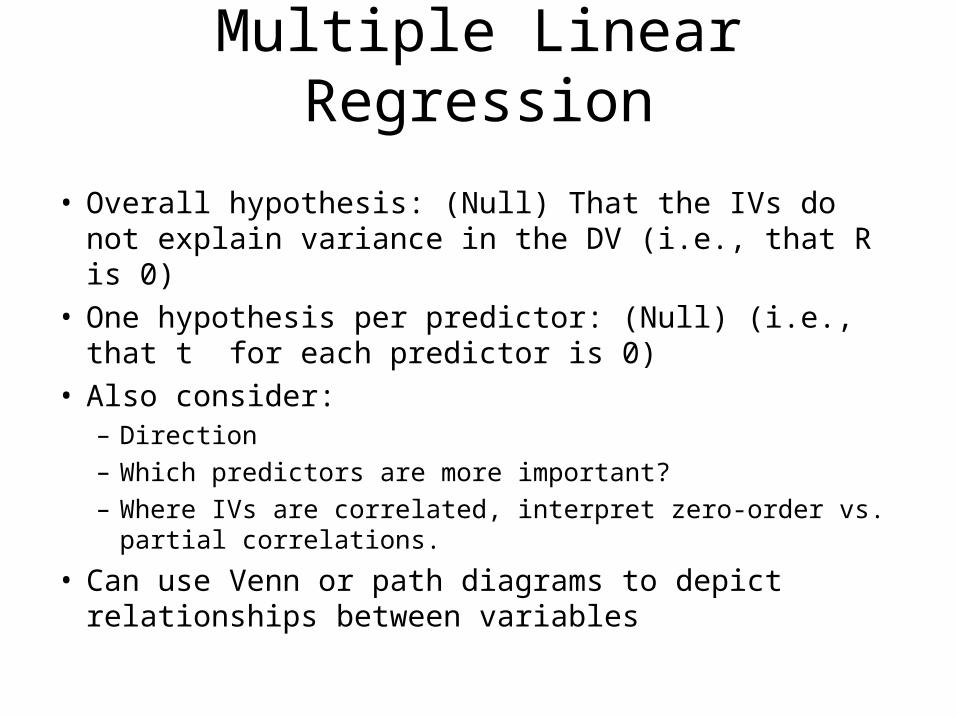
• Overall hypothesis: (Null) That the IVs do not explain variance in the DV (i.e., that R is 0)
• One hypothesis per predictor: (Null) (i.e., that t for each predictor is 0)
• Also consider:– Direction
– Which predictors are more important?
– Where IVs are correlated, interpret zero-order vs. partial correlations.
• Can use Venn or path diagrams to depict relationships between variables
Multiple Linear Regression
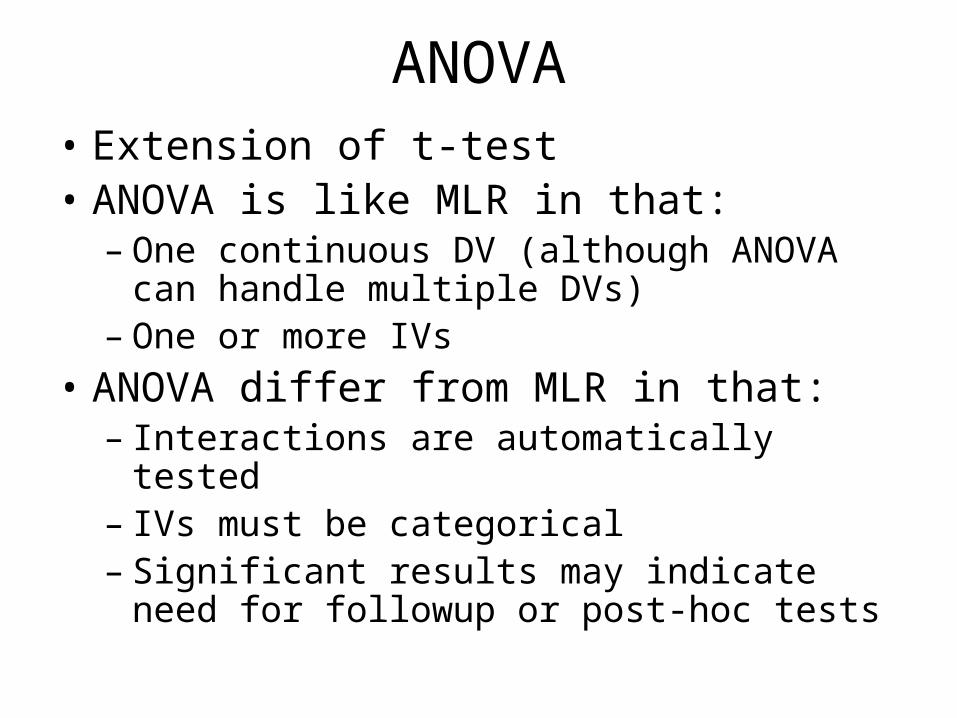
ANOVA• Extension of t-test• ANOVA is like MLR in that:
– One continuous DV (although ANOVA can handle multiple DVs)
– One or more IVs
• ANOVA differ from MLR in that:– Interactions are automatically tested– IVs must be categorical– Significant results may indicate need for
followup or post-hoc tests
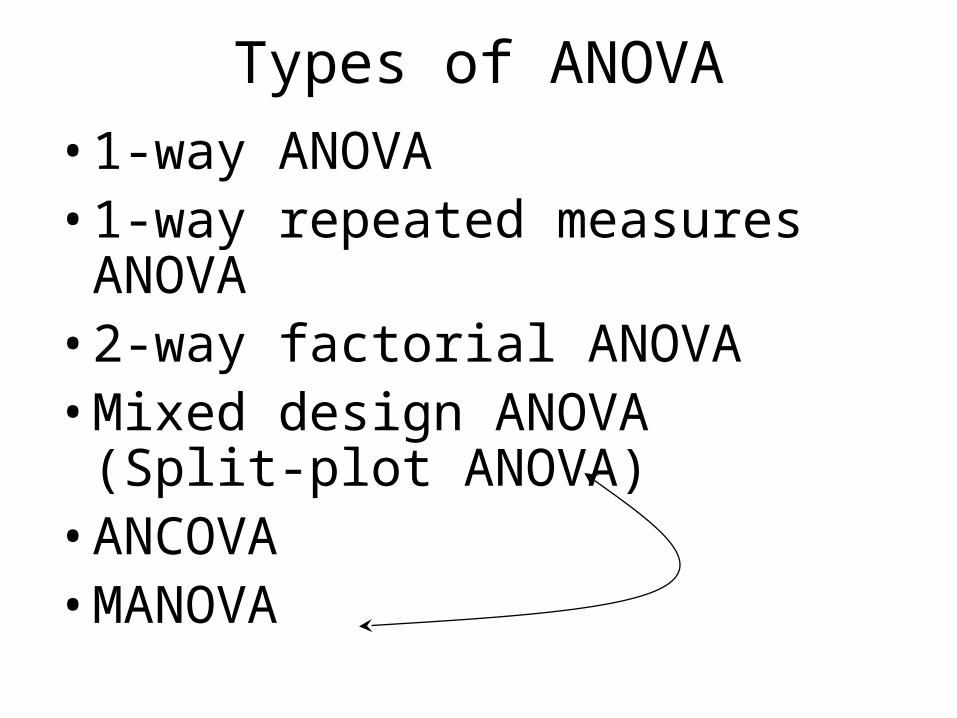
Types of ANOVA
• 1-way ANOVA• 1-way repeated measures
ANOVA• 2-way factorial ANOVA• Mixed design ANOVA
(Split-plot ANOVA)• ANCOVA• MANOVA
ANOVA
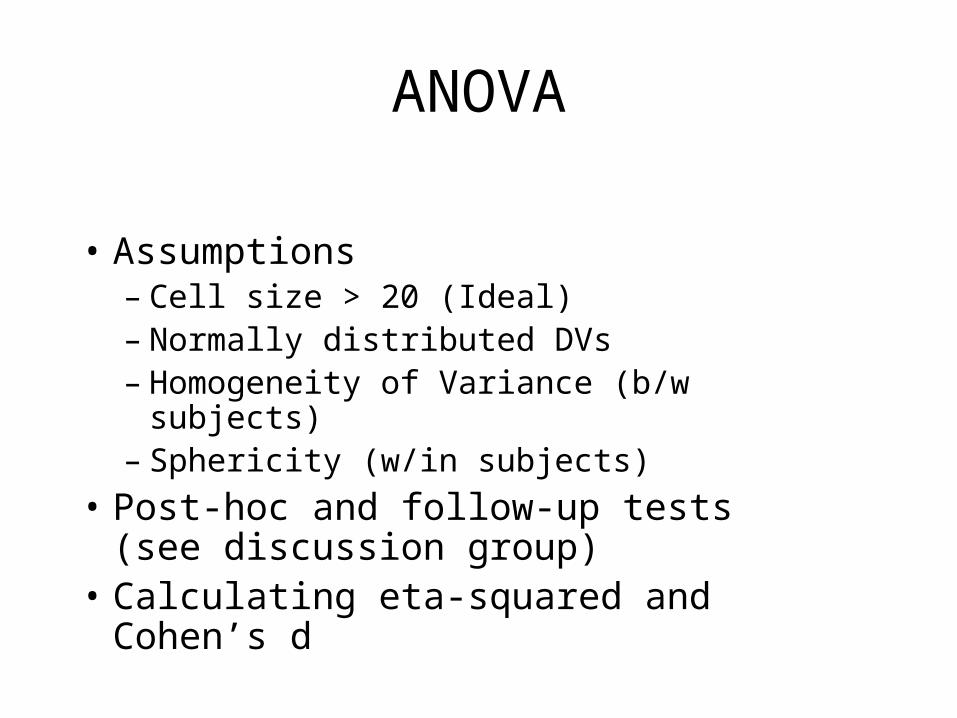
• Assumptions– Cell size > 20 (Ideal)– Normally distributed DVs– Homogeneity of Variance (b/w subjects)– Sphericity (w/in subjects)
• Post-hoc and follow-up tests(see discussion group)
• Calculating eta-squared and Cohen’s d
Power, Effect Sizes, Significance Testing
• Power and effect sizes have been neglected topics
• Calculate the power of studies (prospectively & retrospectively)
• Report ESs and CIs to complement inferential statistics
• Research ethics and publication bias(low power; favouritism of sig. findings)
Lab Report - Tips
• Check Marking criteria
• Use model articles & write-ups
• Demonstrate capability and independent thinking
• Include appendices only where relevant and referred in the text. Appendices may not be consulted by a reader, so if its important/relevant make sure its covered in the text.
Lab Report - Introduction
• Tell a story; set up a question(s)
• No room for waffle – cut to the chase
• Develop clear hypotheses– One per test of significance
Lab Report - Method
• Efficient and well-organised (like a recipe)
• A naïve reader must be able to replicate the study
• Balance between informative, relevant details and efficiency (i.e., avoid getting bogged down in extraneous detail)
• Relevant details will help to set up critical discussion

Lab Report - Results• Data screening
• LOM
• Caution in use of overall scores
1
3
2
1 3
2
Overall Score not validOverall Score valid
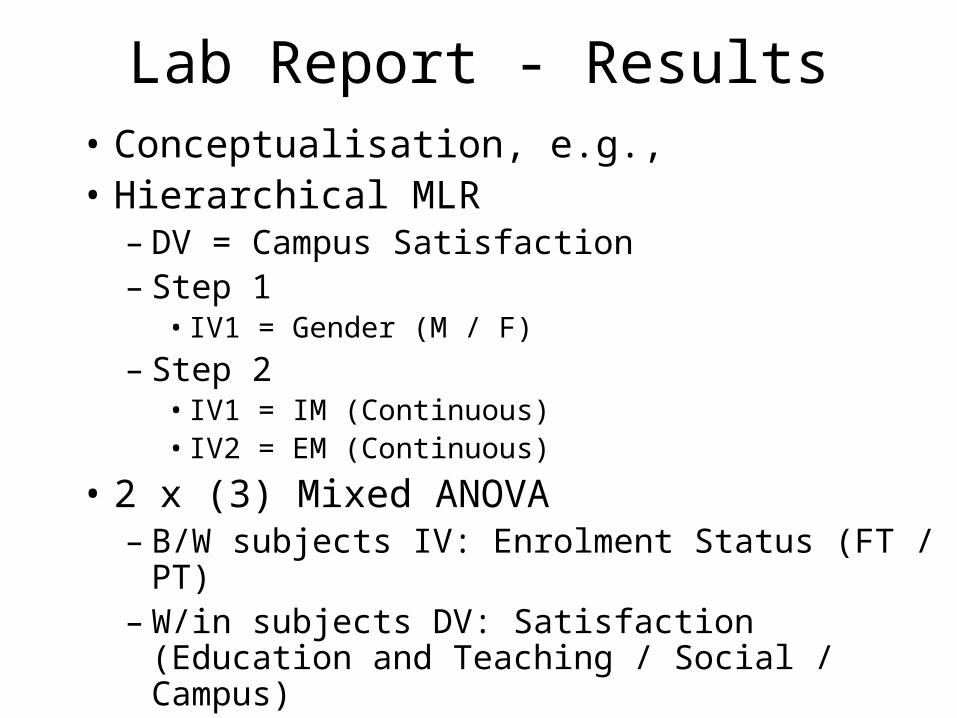
Lab Report - Results• Conceptualisation, e.g.,• Hierarchical MLR
– DV = Campus Satisfaction– Step 1
• IV1 = Gender (M / F)
– Step 2• IV1 = IM (Continuous)• IV2 = EM (Continuous)
• 2 x (3) Mixed ANOVA– B/W subjects IV: Enrolment Status (FT / PT)– W/in subjects DV: Satisfaction (Education and
Teaching / Social / Campus)
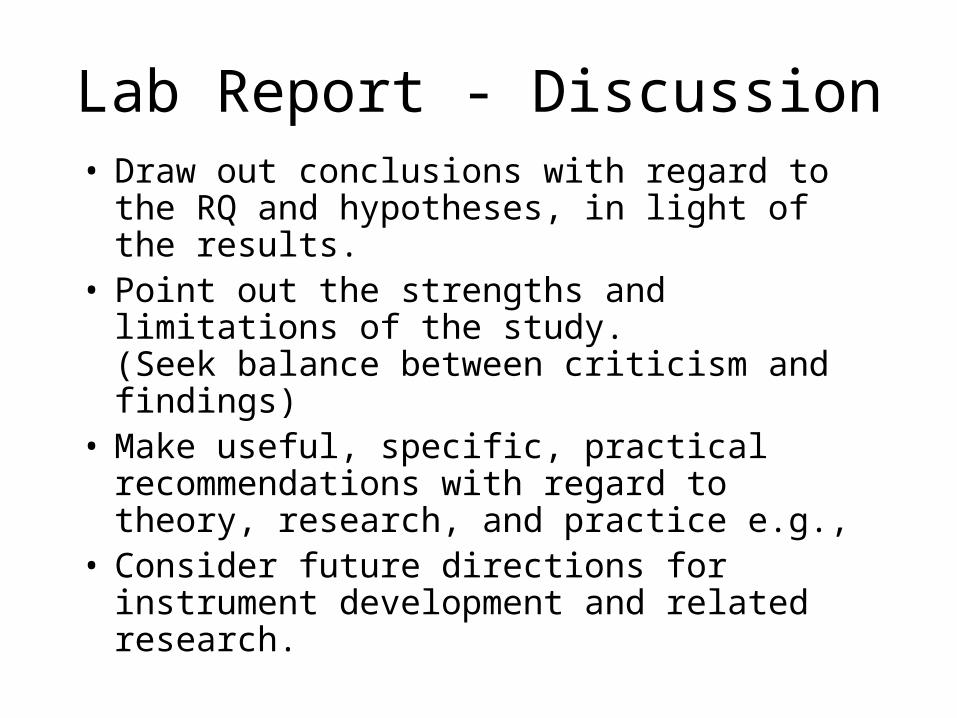
Lab Report - Discussion• Draw out conclusions with regard to the RQ
and hypotheses, in light of the results.• Point out the strengths and limitations of the
study.(Seek balance between criticism and findings)
• Make useful, specific, practical recommendations with regard to theory, research, and practice e.g.,
• Consider future directions for instrument development and related research.
Lab Report - Submission
• Email the convener one electronic attachment containing:– Coversheet– Lab report (with Appendices)
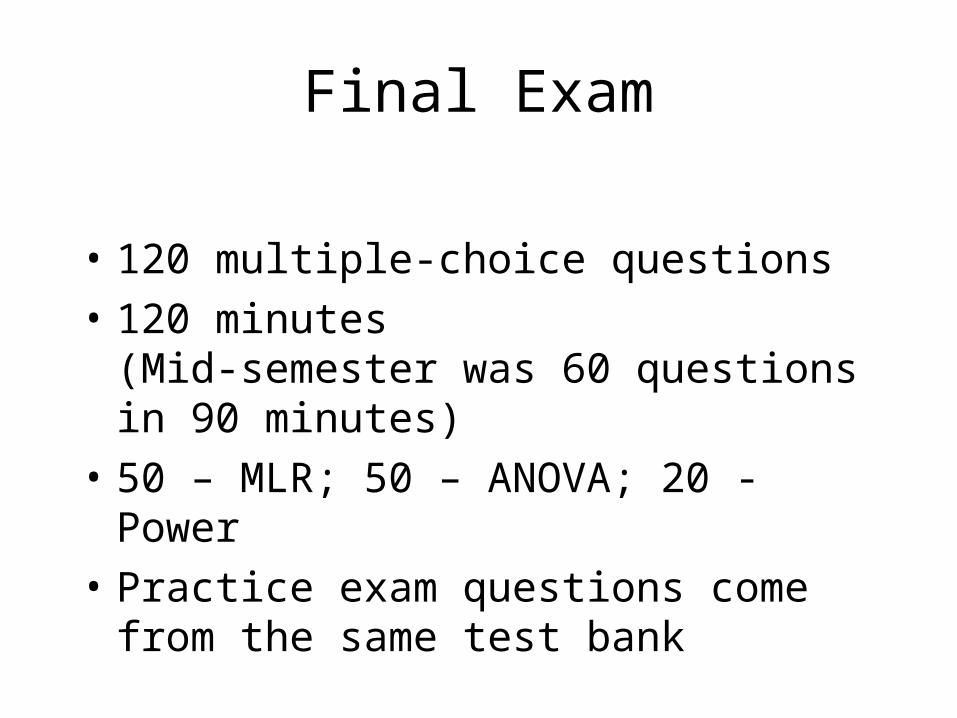
Final Exam
• 120 multiple-choice questions
• 120 minutes(Mid-semester was 60 questions in 90 minutes)
• 50 – MLR; 50 – ANOVA; 20 - Power
• Practice exam questions come from the same test bank
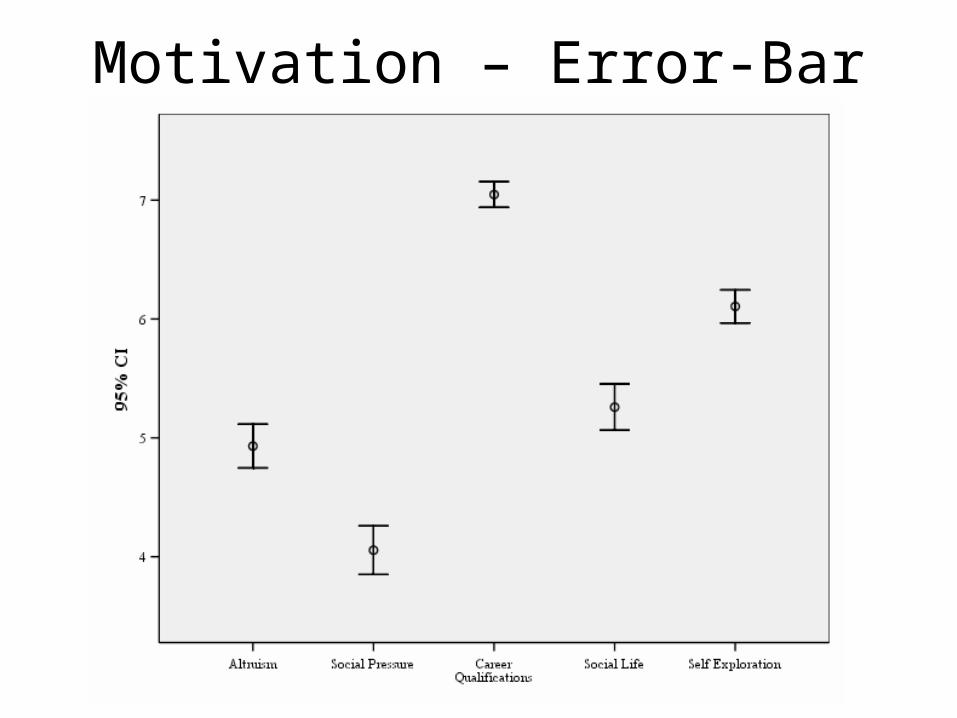
Motivation – Error-Bar
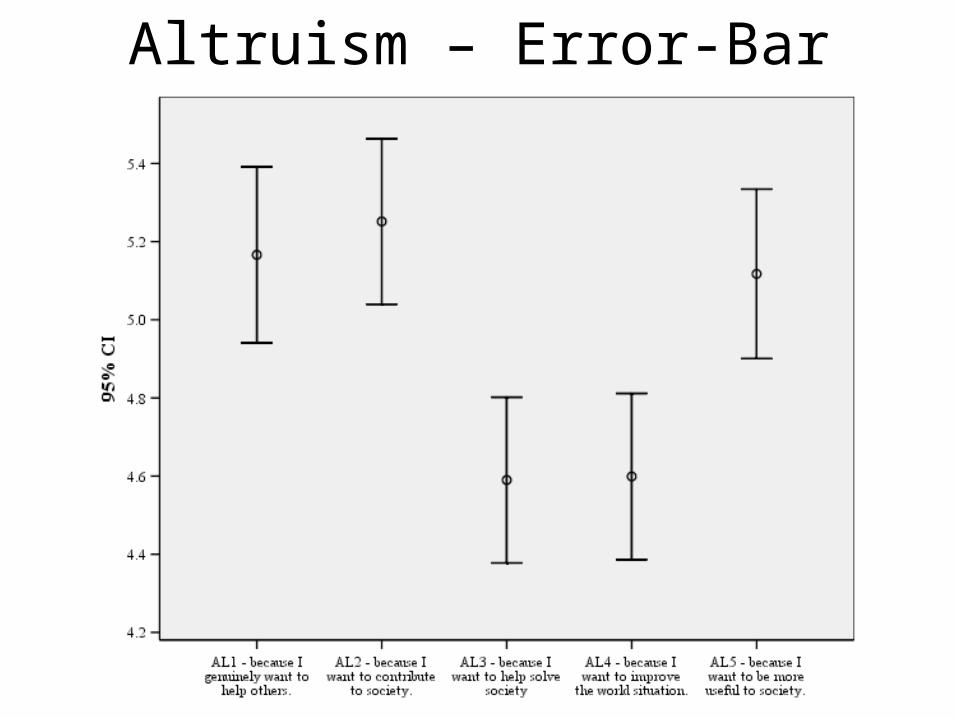
Altruism – Error-Bar
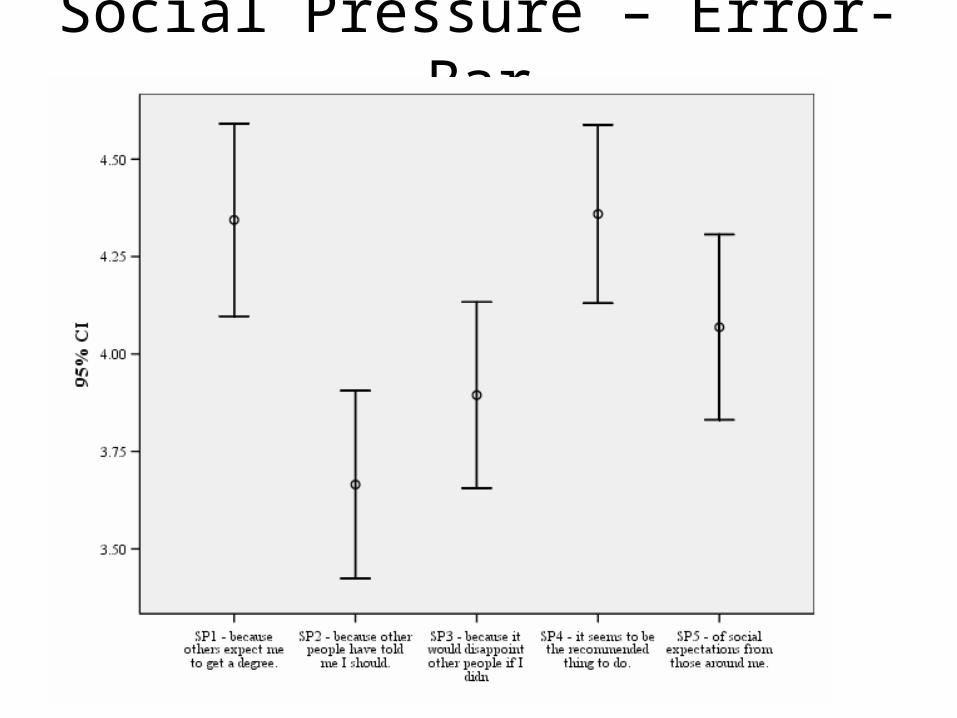
Social Pressure – Error-Bar
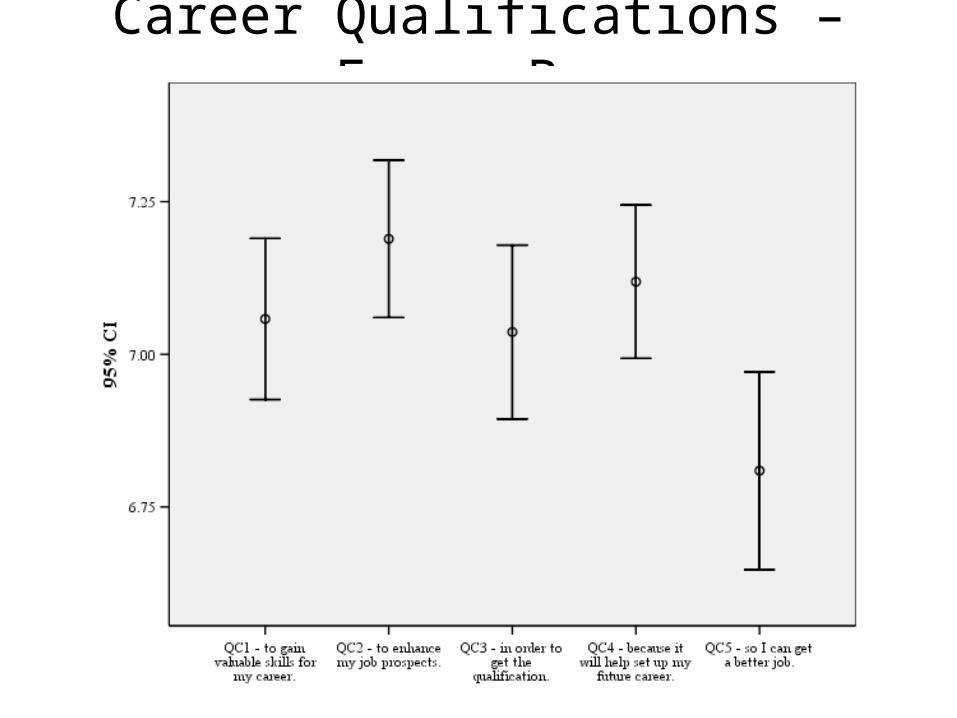
Career Qualifications – Error-Bar
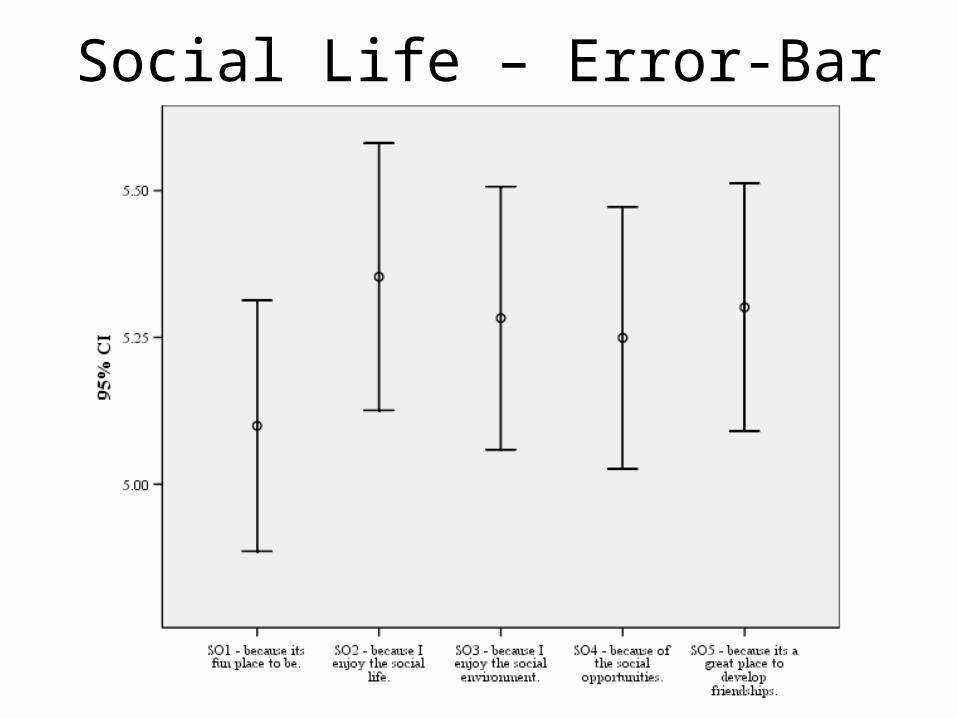
Social Life – Error-Bar
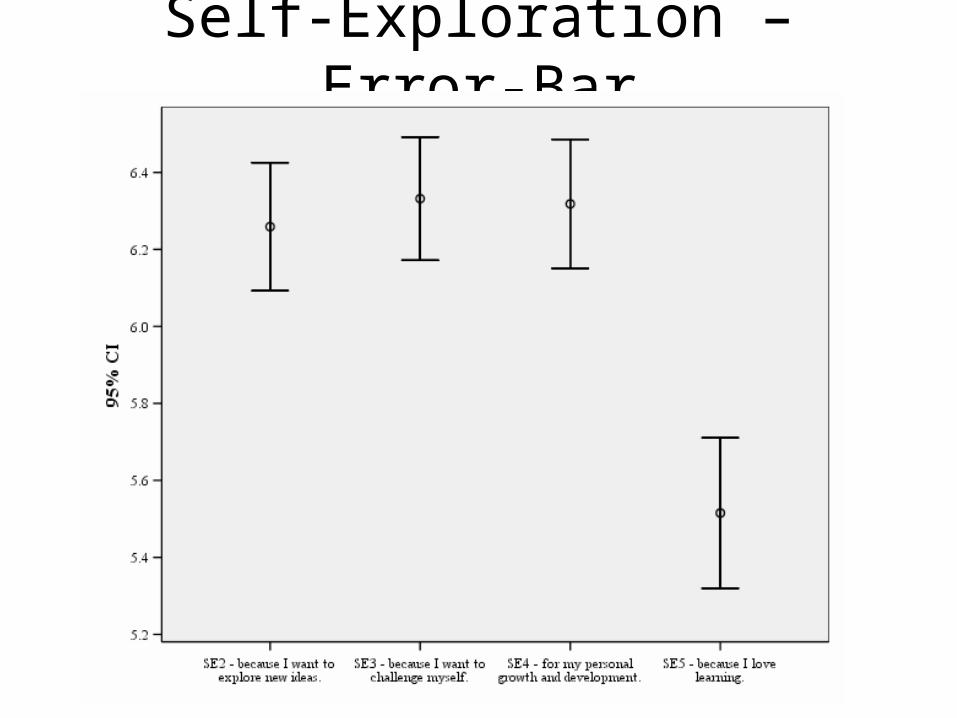
Self-Exploration – Error-Bar
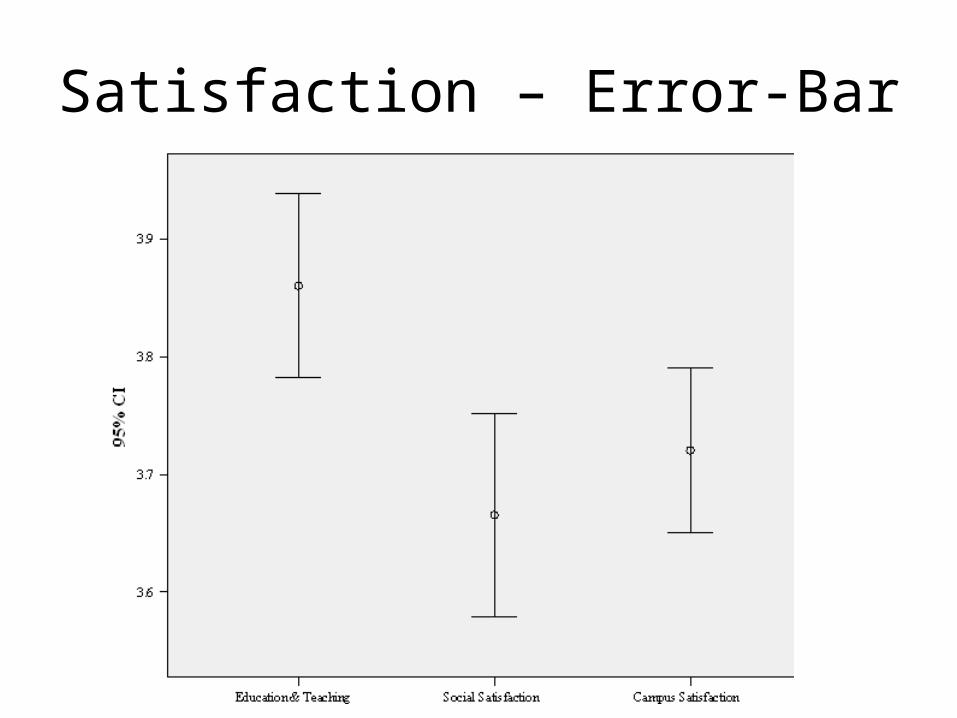
Satisfaction – Error-Bar
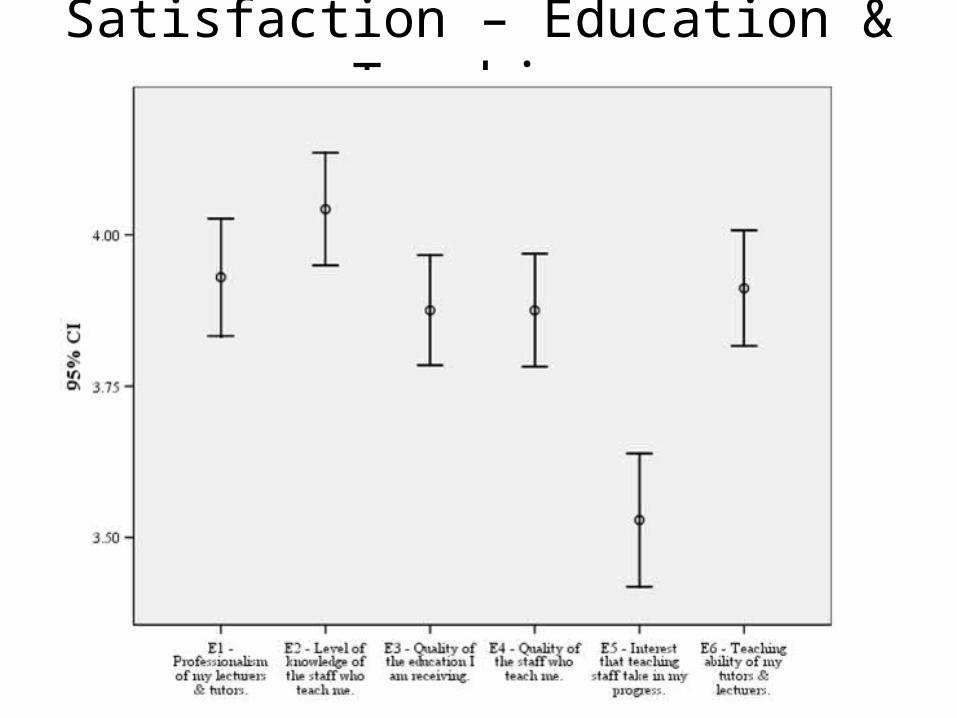
Satisfaction – Education & Teaching
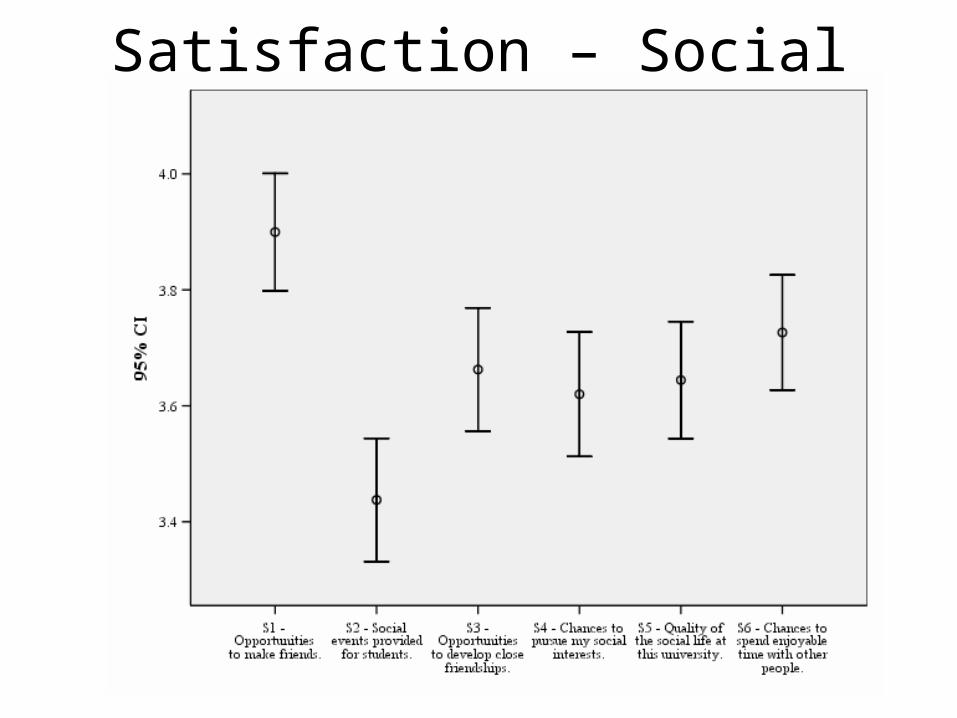
Satisfaction – Social
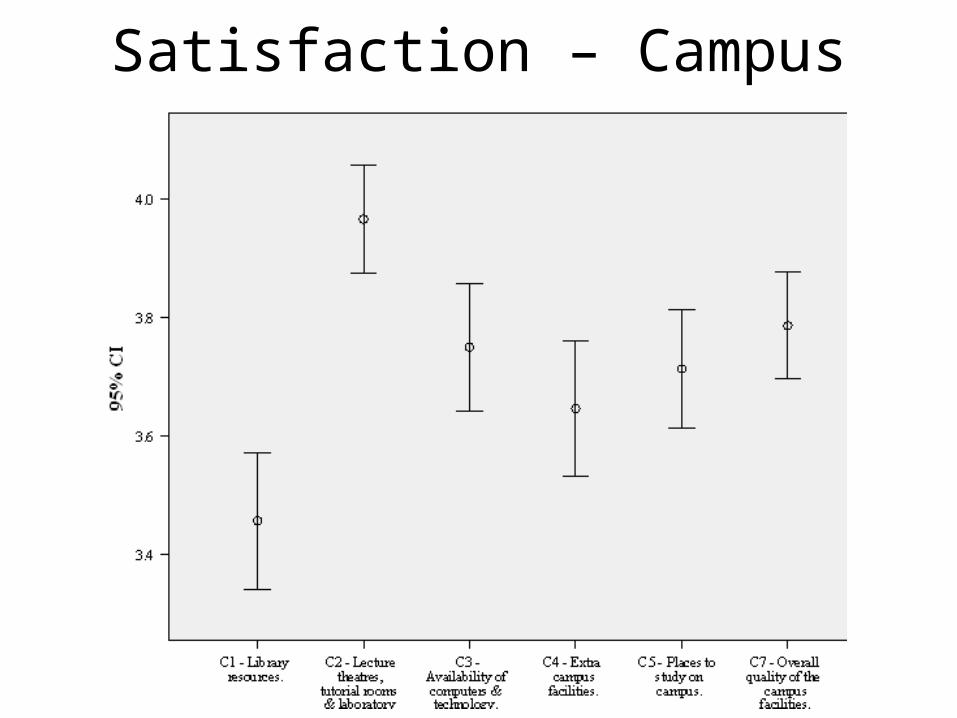
Satisfaction – Campus
Evaluation & Feedback – Issues & Topics
– Lectures– Tutorials– Texts– Assessment– Website– Software - SPSS– Workload
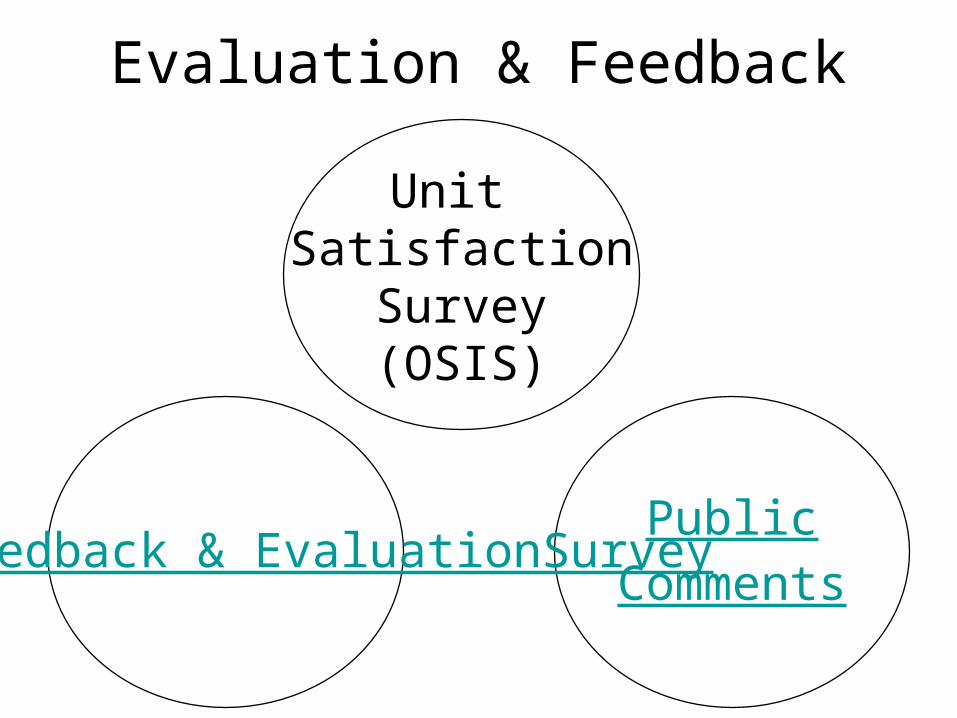
Evaluation & Feedback
Unit Satisfaction
Survey(OSIS)
PublicComments
Online Feedback & EvaluationSurvey