Embed Size (px)
Citation preview

Survey for developing the traffic
management solution for Tallinn ring
road on highway No. 11
2017

Survey for developing the traffic management solution
for Tallinn ring road on highway No. 11
Contracting entity Maanteeamet [Estonian Road Administration]
Representative and contact details of the contracting entity
Siim Vaikmaa [email protected] Tel 611 9380 Teelise 4 10916 Tallinn
Contract No. Contract for Services No. 17-00121/013
Date of report 18 December 2017
Report No. ERC/30/2017
Keywords Traffic surveillance, traffic management, traffic safety, ITS, variable-message signs, traffic modelling
Keywords Traffic surveillance, traffic management, traffic safety, ITS, variable-message signs, traffic modelling
Participants in the work:
Luule Kaal ERC Konsultatsiooni OÜ Tiit Kaal ERC Konsultatsiooni OÜ
Tarmo Sulger Stratum OÜ
Dago Antov Stratum OÜ
Margus Nigol Stratum OÜ
ERC Konsultatsiooni OÜ Väike-Ameerika 15–9 10129 Tallinn, Estonia email: [email protected]
tel: +372 526 984 www.ercc.ee
Stratum OÜ Kadaka tee 86a
12618 Tallinn, Estonia email: [email protected]
tel: +372 665 9460 www.stratum.ee

Traffic management on Tallinn ring road 1

Traffic management on Tallinn ring road 2
TABLE OF CONTENTS
1. Introduction ....................................................................................................................... 4
2. Current Situation in the Management of Traffic Obstructions ......................................... 5
2.1. Continuous Operation Plans ...................................................................................... 5
2.2. Tallinn Ring Road ....................................................................................................... 6
2.3. Entrance Roads to the City of Tallinn ........................................................................ 9
2.4. Proposals for Future Development of Traffic Management ................................... 11
3. Road Network Development Plans .................................................................................. 13
3.1. Current Situation on Tallinn Ring Road and Development Plans ............................ 13
3.2. Entrance Roads to the City of Tallinn ...................................................................... 16
4. Traffic Volume on the Ring Road and Analysis of Traffic Flows ...................................... 17
4.1. Change in the Traffic Volume of Tallinn Ring Road ................................................. 17
4.2. Nature of Traffic on Tallinn Ring Road .................................................................... 19
5. Effects of the Development of Tallinn Ring Road ............................................................ 22
5.1. The Effect of Tallinn Ring Road on the Establishment of Traffic Flows in Tallinn and
Nearby Areas ....................................................................................................................... 22
6. Modelling of Incidents ..................................................................................................... 23
6.1. Accident Scenarios................................................................................................... 23
7. Traffic Model of Tallinn and Its Nearby Area ................................................................... 26
7.1. Traffic Modelling...................................................................................................... 26
7.2. Traffic Model 2019 .................................................................................................. 27
7.3. Traffic Model 2034 .................................................................................................. 28
7.4. Aggregated Data on Traffic Modelling .................................................................... 28
8. Bypass Routes .................................................................................................................. 32
8.1. Homogeneous Road Sections .................................................................................. 32
8.2. Problem Areas of Bypass Routes in 2019 and 2034 ................................................ 32
8.3. Bypass Schemes ....................................................................................................... 33
9. Surveillance and Traffic Management Systems ............................................................... 34
9.1. Existing Equipment on Tallinn Ring Road ................................................................ 34
9.2. Description of ITS Equipment .................................................................................. 35
9.2.1. Surveillance Systems ....................................................................................... 35
9.2.2. Warning Systems ............................................................................................. 36

Traffic management on Tallinn ring road 3
9.2.3. Systems That Affect Traffic Flow ..................................................................... 36
9.3. Locations of ITS Equipment ..................................................................................... 37
9.4. Stepwise Realisation Plan for ITS Solutions ............................................................. 43
10. Cost-effectiveness Analysis .............................................................................................. 44
10.1. Description of the Methodology of the Cost-effectiveness Analysis .................. 44
10.2. Analysed Options ................................................................................................. 46
10.3. Primary Data of the Cost-effectiveness Analysis ................................................. 47
10.3.1. Traffic Accidents .............................................................................................. 47
10.3.2. Impact of Variable-message Signs on Traffic Accidents .................................. 49
10.3.3. Cost of Traffic Accidents .................................................................................. 51
10.3.4. Traffic Accident Scenarios ............................................................................... 51
10.4. Time expenditure ................................................................................................ 53
10.4.1. Travel Time and Costs of Vehicles ................................................................... 53
10.4.2. Increased Time Expenditure due to an Accident............................................. 54
10.5. Travel Speed ........................................................................................................ 55
10.6. Exhaust Gases ...................................................................................................... 56
10.7. Cost of ITS Equipment ......................................................................................... 59
10.8. Results of the Cost-effectiveness Analysis .......................................................... 60
11. Summary .......................................................................................................................... 64
Annex 1. Technical Specifications
Annex 2. Problem Areas of Bypass Routes in 2019 and 2034
Annex 3. Bypass Schemes for Homogeneous Road Sections
Annex 4. HDM-4 Reports of the Cost-effectiveness Analysis
Annex 5. AADT of Tallinn Ring Road in 2019 and 2034

Traffic management on Tallinn ring road 4
1. INTRODUCTION
The objective of this survey is the development of the traffic management solution for
national main road No. 11 (E265) Tallinn ring road. Extensive reconstruction works shall
transform Tallinn ring road into a two-carriageway highway in the upcoming years and the
survey forms a basis for planning and developing various ITS solutions which make traffic on
the ring road smoother and safer and enable to better manage various incidents that cause
traffic obstructions.
This survey is also one of the work packages that is part of the international FinEst Smart
Mobility (FESM) project. FESM is a project funded to the extent of 85% by the European
Union regional development project Central Baltic, intended for improving mobility between
Helsinki West Harbour and Tallinn Old City Harbour via smart solutions.
The survey has been divided into three stages, which will result in one collective report.
Topics addressed in the survey are:
• Stage I – analysis of current situation and proposals;
o overview and assessment of continuous operation plans;
o development plans for the ring road and entrance roads to the city;
o effects in the perspective of 15 years;
• Stage II – modelling incidents and bypass routes;
o modelling probable accident scenarios;
o possibility and locations of possible traffic jams;
o preparing bypass routes;
• Stage III – feasibility of dynamic traffic management;
o description and typical cost of ITS solutions;
o cost-effectiveness analysis for three scenarios;
o selection of optimal ITS solutions and equipment;
o optimal stepwise realisation plan for ITS solutions.

Traffic management on Tallinn ring road 5
2. CURRENT SITUATION IN THE MANAGEMENT OF TRAFFIC
OBSTRUCTIONS
This chapter provides an overview of the management of traffic obstructions on Tallinn ring
road as well as entrance roads belonging to the area of government of the city of Tallinn.
The overview was assembled by conducting interviews with the representatives of the Road
Administration (Siim Vaikmaa, Andres Urm, Maria Ossadtšaja) and representatives of the
Tallinn Transport Department (Andres Harjo, Talvo Rüütelmaa).
2.1. Continuous Operation Plans
The guidelines for preparing a continuous operation plan1 were established by Regulation of
21 June 2010 of the Ministry of the Interior, which was based on subsection 37 (5) of the
Emergency Act (currently invalid, new version of the act entered into force on 1 July 2017).
According to subsection 37 (2) of the Emergency Act, which entered into force on 1 July
2017, authorities that provide vital services shall establish under the regulation the
description of vital services included in their area of government and requirements for
continuous operation thereof.2 Continuous operation is the capability of consistent
functioning of the service provider and the ability to restore the consistent functioning after
an interruption in the vital service.3 Regulation No. 29 of 21 June 2017 “Requirements and
procedure for a continuity risk assessment and plan of a vital service, for the preparation
thereof and the implementation of a plan” has been established under subsection 39 (5) of
the Emergency Act (RT I, 28.06.2017, 6).
Road Administration had prepared Continuous Operation Plans of the Vital Service in regard
to the continuous maintenance of national main and basic roads across different counties
and areas of roadmasters. The objective of the continuous operation plan is to ensure an
immediate response to interruptions regarding the functioning of road maintenance and
ensure the taking of appropriate measures for quick elimination of interruptions and
restoration of the continuous operation of the service.4
A situation during which traffic is estimated to be interrupted for more than 12 hours on a
main road or for more than 24 hours on a basic road is considered an imminent threat for
causing a serious interruption of the functioning of road maintenance. Corresponding
1 Guidelines for preparing a continuous operation plan. Regulation No. 17 of 8 June 2010 of the Minister of the Interior. RT I 2010, 33, 180. In force until 30 June 2017 2 Guidelines for establishing the description and requirements for continuous operation of the vital service for authorities organising the operation of the vital service. Ministry of the Interior 3 Guidelines for preparing the continuity risk assessment and plan of a vital service for providers of the vital service. Ministry of the Interior 4 Ensuring maintenance of national main and basic roads. Continuous operation plan of the vital service. Road Administration 20 July 2016 Decree No. 0146

Traffic management on Tallinn ring road 6
measures shall be taken under the continuous operation plan of road maintenance in the
event that the interruption of traffic is estimated to be at the relevant level as a result of an
accident or extraordinary weather conditions. 5
According to the risk analysis carried out by the Road Administration, critical events that
may cause a serious interruption in the provision of a vital service are:
• collapse of a road infrastructure (erosion of a road embankment, collapse of a
culvert/bridge/overpass due to heavy rain or human activity);
• continuous snowing or blizzard.
Recovery plans have been prepared in regard to both events. The interruption of the vital
service was presumed to be short-term in the case of severe traffic accidents or occurrence
of extensive environmental pollution on the road. In the event that either of the
aforementioned events cause a long-term traffic obstruction, the recovery scenario
“Collapse of a Road Infrastructure” described in the continuous operation plan shall be
applied.
High-risk areas concerning functioning of the vital service have been listed in the continuous
development plan:
• sections of main and basic roads that pose a traffic hazard;
• critical objects of the infrastructure of main and basic roads (bridges, overpasses,
large culverts).
2.2. Tallinn Ring Road
Bypass routes have been prepared for critical objects of the infrastructure in case that
critical events occur. By analysing the continuous operation plans of three roadmaster areas
(Keila, Kose and Kuusalu) prepared for consultants by the contracting entity, it can be
concluded that even though these plans fundamentally overlap, the traffic management side
of the plans (bypass routes) have, however, been prepared at an individual level for each
area:
• option 1 – the critical object is displayed on the map and possible bypass routes
have been schematically displayed;
• option 2 – furthermore, the part of temporary traffic management along with
necessary signs has been prepared as well.
A questionnaire was prepared and sent to enterprises engaged in traffic maintenance in
Estonia in order to obtain an assessment of the continuous operation plans. 11 responses
5 Ensuring maintenance of national main and basic roads. Continuous operation plan of the vital service. Road Administration 20 July 2016 Decree No. 0146

Traffic management on Tallinn ring road 7
were received. Nearly half of the respondents have experienced a need to use this
document, however, 2/3 have managed to cope without it (presumably thanks to prior
experiences). The recovery plan for the collapse of a road infrastructure has been used the
most (5 respondents), whereas the recovery plan for continuous snowing has only been used
by 2 respondents (this is certainly partly due to the last couple of winters with relatively little
snow). A couple of respondents have also utilised a recovery plan for a traffic accident.
Bypass route schemes were deemed to be in need of improvement, however, it was also
pointed out that the schemes are prepared on a rolling basis and in accordance with the
situation, while also taking into account the stocks of road signs that the maintainer is
obligated to have under the contract.
Figure 2.1. Overall evaluation of continuous operation plans by road maintenance providers
who responded to the questionnaire
33,3%
33,3%
33,3%
Dokument on hõlpsasti kasutatav
Dokument on kasutatav teoorias
Dokument vajab uuendamist vähesel määral
Dokument vajab uuendamist terves mahus
Ei ole dokumendiga tutvunud
16,7%
33,3%33,3%
16,7%
Ei ole olnud vajadust ja ei ole dokumentikasutanud
Ei ole olnud vajadust, aga olen dokumendigatutvunud
On olnud vajadus, aga olen saanud ilmahakkama
On olnud vajadus ja olen dokumentikasutanud

Traffic management on Tallinn ring road 8
Figure 2.2. The need for and use of the continuous operation plan
Figure 2.3. Evaluation of bypass routes set out in continuous operation plans provided by
road maintenance providers
Continuous operation plans have been prepared in accordance with the requirements set
out in the regulation, which makes this document a relatively extensive one (currently 70–
100 pages). This is also most likely the reason that several road maintenance providers
mentioned that a summary version should be prepared in addition to the primary document,
which would briefly and clearly set out a specific code of conduct.
Some of the comments provided by respondents:
“I personally believe that the continuous operation plan in its current form is a useless
document. If a situation calls for quick actions and decision-making within 15 minutes, no
one is capable of finding anything from a 100-page document. The continuous operation
plan must fit onto a maximum of two A4-sheets and include a specific code of conduct.”
“Simplify (create a summary version in addition to the main document, if necessary);
attempt to describe in theory, what could actually be achieved in practice.“
“The document is too long (nearly 100 pages). The document includes too much specific
data regarding persons responsible and technical resources, amendments are rarely made.”
Representative of the Road Administration (Maria Ossadtšaja) mentioned that trainings are
organised every year, during which various bypass routes are established and maximum
amount of signs are taken into account. The overall objective is to ensure that recovery
plans have a common format, which could be used to determine the bypass route. All
situations cannot necessarily be addressed in the recovery plan, current description includes
the most important objects (bridges, overpasses or other critical sections), for which specific
bypass routes have been prepared.
9,1%
27,3%
54,5%
9,1% Sobib
Piisavalt ülevaatlik
Vajab täiendamist
Ümbersõiduskeem koostatakse jooksvaltvastavalt olukorrale

Traffic management on Tallinn ring road 9
It is certainly not practical to prepare bypass routes for the whole of Estonia, however,
important criteria which needs to be taken into account must be set out. The areas/roads
where traffic is not recommended to be directed to must definitely be recognised as well.
The number of road signs, along with their stands, that can be loaded onto the trailer of a
vehicle must be taken into account as well. In regard to Tallinn ring road, bypass routes must
be prepared in detail.
Proposals regarding continuous operation plans and recovery plans:
• it is recommended to prepare a short specific code of conduct for resolving a crisis
situation;
• road maintenance providers should have more opportunities for using temporary
VMSs (e.g. transported on a trailer); if something were to happen on a road with
high traffic volume, it is necessary that the information is visible to road users from
as far as possible, distributed as operatively as possible and could be changed or
supplemented (VMSs have these functions unlike regular road signs).
• prepare a detailed temporary traffic management solution for critical objects of the
infrastructure.
2.3. Entrance Roads to the City of Tallinn
This project is also very important in regard to the principles and strategies of the traffic
management of Tallinn. Accordingly, one of the objectives of the project is to conduct an
interview with experts who are responsible for the traffic management of the city of Tallinn
in order to get their opinion on the links and objectives of this project and whether these
coincide with the traffic management strategies of the city of Tallinn. Explanations of A.
Harjo, Head of the Transport Department of Tallinn, and T. Rüütelmaa, Head of the Traffic
Management Department, are set out below.
One of the main objectives of the project is to find a modern ITS-based solution for bypass
options in case that some section/part of the Tallinn ring road is closed for traffic.
Does the city have any proposals that are linked / not linked with his objective?
The vision of the city regarding the capacity to use the city’s street network for rerouting
traffic flows in case of possible traffic problems or obstructions on Tallinn ring road is that
such opportunities are virtually non-existent, as most possible bypass routes are already
overburdened and could not take on increased traffic volume or burden. Moreover, the city
is strategically focussed on utilising traffic management methods (e.g. regulation of the
traffic light system) to limit the capacity of major roads coming into the city from nearby
areas in order to avoid traffic jams in the city centre and influence people to use other
transport means aside from driving cars.
If the option set out in the question is to be discussed at all, it would require the
establishment of a major strategic traffic management system (that would include nearby

Traffic management on Tallinn ring road 10
areas of the city, incl. Tallinn ring road), which would direct entire traffic flows to routes
suitable at a certain point in time, and that means in regular as well as emergency situations.
In case that there is an unforeseen obstruction on Tallinn ring road in one direction, the
Transport Department of Tallinn considers the first possible measure/option to direct traffic
flow to the oncoming lane. This would require temporary openings in the median barrier,
the opening of which could be used to rearrange traffic. This should be done as operatively
as possible (NB: capacity of the police), however, such options could virtually be prepared
beforehand and used, if necessary.
Another option and necessity would be to establish car parks for heavy vehicles alongside
the ring road, which could be used for parking by vehicles in case of traffic obstructions and
from where further transportation of people could be organised (a sort of car park + ring
road solution). In this case, parked vehicles would not hinder the elimination of the traffic
obstruction.
Instead of explicit rerouting of traffic, the Transport Department of Tallinn considers it much
more important to provide road users with information on an upcoming traffic obstruction,
which would enable drivers to independently select a suitable alternative route beforehand.
An example of this is, for instance, variable-message boards that display the travel time to a
certain interchange in normal circumstances and currently. Experiences of the city of Tallinn
have shown that instead of prescribing a specific (one) bypass route, solutions where road
users are warned about the upcoming obstruction, but are given the opportunity to find a
suitable alternative route themselves, have proved to work far better.
The Transport Department of Tallinn also found that the use of such variable-message road
signs is also extremely necessary in places where the permissible speed limit is operatively
changed in advance in order to avoid vehicles from entering the danger zone at a high
speed. It is important to keep in mind that restricted speed limits also increase traffic
capacity in streets.
Does the city have certain views on where the traffic SHOULD NOT be rerouted to under any
circumstances? According to the city, what could be the impact elsewhere if something were
to happen on Tallinn ring road? What could be the effects in the future?
Virtually, Tallinn currently lacks the opportunities to redirect traffic flow from Tallinn ring
road through the street network of Tallinn in normal circumstances, except for Väo
interchange and possibly small Tallinn ring road (cf. first question).
Should the ITS solution planned for Tallinn ring road also be compatible with the traffic
management solutions in Tallinn? In what way? In which perspective?
Essentially, yes, however, the city’s vision in regard to the creation of such a uniform
management centre would be that the volume of regular management of the city street
network would be significantly larger than the volume of highway management. It would
therefore entail that the ITS solution in question could be one of the functions of the
possible traffic management centre of Tallinn (and nearby areas), not vice versa. Traffic
problems in the city are much more specific and greater than the management solutions of

Traffic management on Tallinn ring road 11
highways. However, this solution could be beneficial in the long-term and the city of Tallinn
is interested in developing such cooperation.
2.4. Proposals for Future Development of Traffic Management
As became clear from the topics addressed in the previous chapter, this project, the main
objective of which is the development of a traffic management solution for the national
main road No. 11 (E265) Tallinn ring road, is also very important in regard to developments
regarding the area of influence of other road network developments and traffic
management solutions. The following parts of this survey address the search for optimal
solutions for possible incidents that could occur on specific sections of the Tallinn ring road
in more detail. The first tactical solutions brought out here include solutions regarding
bypass routes and redirecting traffic onto those routes.
However, if solutions are analysed in more detail, as they have been in the following
chapters of this survey, it becomes clear that direct solutions for redirecting traffic flow to a
specific bypass route in case of traffic obstructions is relatively limited due to the lack of
suitable routes as well as their traffic capacity.
Therefore, one of the strategic results is also the fact that one of the main objectives
regarding the occurrence of any incidents, aside from rerouting the traffic flow that has
already entered the road section, is to also simultaneously provide timely information on the
obstruction on the selected route of vehicles that have not yet entered said road section,
including vehicles that are travelling in the horizontal direction, so that drivers would be able
to choose another route before arriving at the place of obstruction. Since Tallinn ring road is
essentially located in the area of influence of the traffic system of Tallinn, possible solutions
are also significantly associated with opportunities to redirect traffic flows before drivers exit
the traffic network of Tallinn. The feasibility and efficiency of such a solution is, of course,
also largely dependent on the time and location of the incident. These opportunities may be
rather limited during rush hour traffic, yet significantly greater at other times.
Therefore, one of the long-term objectives should also be to coordinate traffic management
strategies and applicable technical solutions between the Road Administration and the city
of Tallinn. One of the objectives of the long-term strategy could be the establishment of a
uniform traffic management centre, which could be created on the basis of the Tallinn
Traffic Management Centre and the relevant unit of the Road Administration. It is clear that
the physical connection of these units is difficult in the short-term, however, the objective of
the first stage could be to establish the development of data exchange, which would make
the traffic information collected by the city of Tallinn and traffic information collected by the
Road Administration quickly accessible to both parties.
The next step should be to find opportunities to extend the functions of the automatic traffic
information collection system (which collects time-specific data regarding the characteristics
of traffic flows, e.g. traffic volume, composition of the traffic flow, average speed, etc.).
Since the coverage of the automatic traffic counting system includes mostly the city centre,

Traffic management on Tallinn ring road 12
it would be crucial, especially in the context of the traffic management system of Tallinn ring
road, to extend the system to the city’s peripheral areas as well, in particular to this project,
to those major roads that are headed towards Tallinn ring road. Currently, such information
regarding the traffic situation in nearby areas of the Tallinn ring road as well as on major
roads in Tallinn is lacking, which is why the options for utilising an optimal bypass route in
regard to incidents that may occur on Tallinn ring road, in case such a bypass route were to
include the street network of Tallinn, are limited as well.
The same issue can also be addressed from the opposite viewpoint, i.e. what are the options
for rerouting traffic flow to Tallinn ring road in case that a serious incident were to occur on
a major route in Tallinn? At later stages, this issue could also be resolved by uniform traffic
surveillance and the existence of a uniform traffic management system, which would
centralise all national roads as well as the roads and streets of the city of Tallinn.

Traffic management on Tallinn ring road 13
3. ROAD NETWORK DEVELOPMENT PLANS
3.1. Current Situation on Tallinn Ring Road and Development Plans
Currently, several sections of Tallinn ring road have been constructed into a two-carriageway
highway, some sections are still under construction, projects have been designed for others
and the section between Saue–Keila will most likely remain a one-carriageway highway for
the upcoming years.
An overview of the current situation of the Tallinn ring road and projects planned is set out
below. Tallinn ring road has been divided into four sectors on the basis of intersections with
main and basic roads.
Figure 3.1. Sector 1 – Väo interchange ... Jüri circular intersection
Sectio
n 1
Sectio
n 2
Sectio
n 3
Sectio
n 4
Sectio
n 5

Traffic management on Tallinn ring road 14
Section No.
Beginning, km
End, km
Name Current situation Year of
construction/ completion
1 0.0 0.3 Väo interchange
Design stage Unknown
2 0.3 3.0 Väo–Lagedi road section
Project completed (Selektor Projekt OÜ)
Under construction (Nordecon AS)
2017–2018
3 2.8 6.0 Lagedi
interchange and road section
Project completed (Selektor Projekt OÜ)
Under construction (Lemminkäinen AS)
2016–2018
4 6.0 9.7 Lagedi–Karla road section
Project completed (Škepast&Puhkim AS)
Under construction (TREV-2 Grupp)
2016 2017–?
5 9.7 11.6
Põrguvälja interchange and
Jüri circular intersection
Completed (2+2) 2017
Figure 3.2. Sector 2 – Jüri circular intersection ... Luige interchange

Traffic management on Tallinn ring road 15
Section No.
Beginning, km
End, km
Name Current situation Year of construction/
completion
6 11.6 20.2 Jüri–Luige Completed (2+2)
2015 (Kurna interchange) 2013 (Luige
interchange)
Figure 3.3. Sector 3 – Luige interchange ... Kanama interchange
Section No.
Beginning, km
End, km
Name Current situation Year of
construction/ completion
7 20.2 24.3 Luige–Saku
Project completed (Škepast&Puhkim AS)
Project expertise underway (Reaalprojekt OÜ)
2017 2018
8 24.1 29.6 Juuliku
interchange
Project completed (Škepast&Puhkim AS)
Construction practically finished (Tallinna Teede AS, Merko Ehitus
Eesti AS, Merko Infra AS)
Autumn 2017
Figure 3.4. Sector 4 – Kanama interchange ... Keila
Section No.
Beginning, km
End, km
Name Current situation Year of
construction/ completion
Sectio
n 7
Sectio
n 8
Traffic management on Tallinn ring road 16
Section No.
Beginning, km
End, km
Name Current situation Year of
construction/ completion
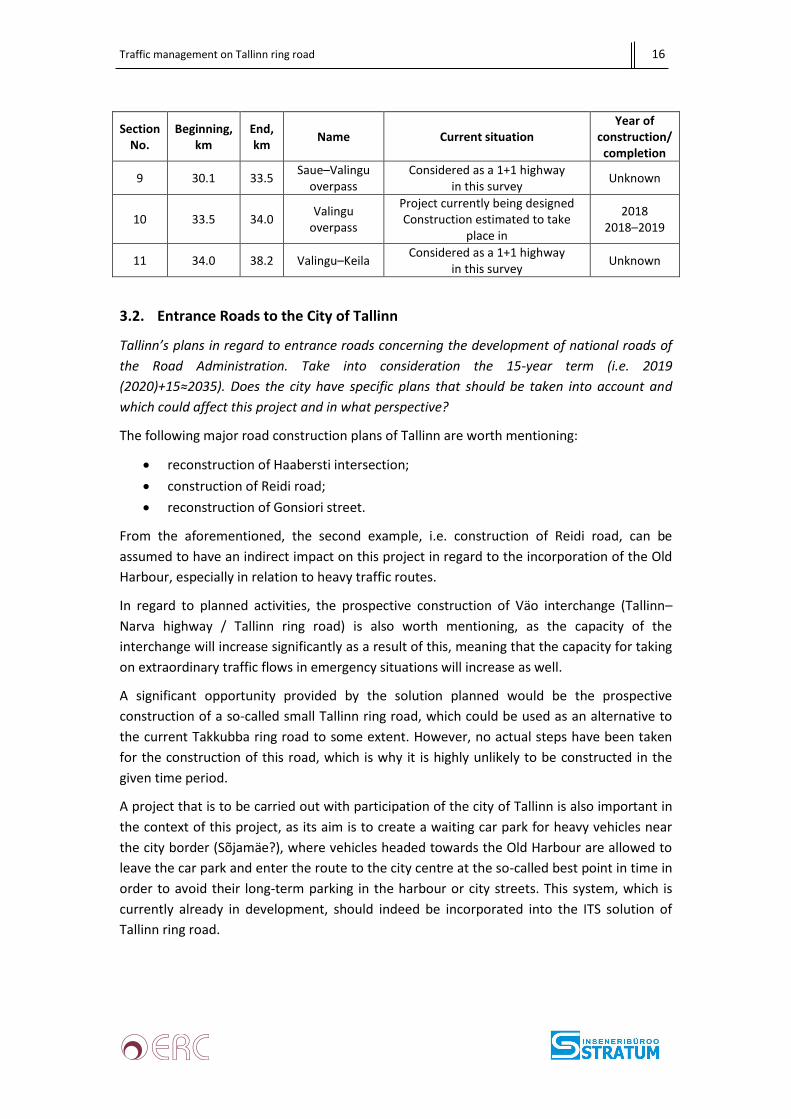
9 30.1 33.5 Saue–Valingu
overpass Considered as a 1+1 highway
in this survey Unknown
10 33.5 34.0 Valingu
overpass
Project currently being designed Construction estimated to take
place in
2018 2018–2019
11 34.0 38.2 Valingu–Keila Considered as a 1+1 highway
in this survey Unknown
3.2. Entrance Roads to the City of Tallinn
Tallinn’s plans in regard to entrance roads concerning the development of national roads of
the Road Administration. Take into consideration the 15-year term (i.e. 2019
(2020)+15≈2035). Does the city have specific plans that should be taken into account and
which could affect this project and in what perspective?
The following major road construction plans of Tallinn are worth mentioning:
• reconstruction of Haabersti intersection;
• construction of Reidi road;
• reconstruction of Gonsiori street.
From the aforementioned, the second example, i.e. construction of Reidi road, can be
assumed to have an indirect impact on this project in regard to the incorporation of the Old
Harbour, especially in relation to heavy traffic routes.
In regard to planned activities, the prospective construction of Väo interchange (Tallinn–
Narva highway / Tallinn ring road) is also worth mentioning, as the capacity of the
interchange will increase significantly as a result of this, meaning that the capacity for taking
on extraordinary traffic flows in emergency situations will increase as well.
A significant opportunity provided by the solution planned would be the prospective
construction of a so-called small Tallinn ring road, which could be used as an alternative to
the current Takkubba ring road to some extent. However, no actual steps have been taken
for the construction of this road, which is why it is highly unlikely to be constructed in the
given time period.
A project that is to be carried out with participation of the city of Tallinn is also important in
the context of this project, as its aim is to create a waiting car park for heavy vehicles near
the city border (Sõjamäe?), where vehicles headed towards the Old Harbour are allowed to
leave the car park and enter the route to the city centre at the so-called best point in time in
order to avoid their long-term parking in the harbour or city streets. This system, which is
currently already in development, should indeed be incorporated into the ITS solution of
Tallinn ring road.

Traffic management on Tallinn ring road 17
4. TRAFFIC VOLUME ON THE RING ROAD AND ANALYSIS OF TRAFFIC
FLOWS
4.1. Change in the Traffic Volume of Tallinn Ring Road
The weighted average traffic volume has increased by 36% in the last ten years on Tallinn
ring road (2016 vs 2006), whereas the number of road trains has increased an average of
two times.
Figure 4.1. Traffic volume on sections of the Tallinn ring road from 2006–2016
Sections with the highest traffic volume values (AADT >12,000 vpd) on Tallinn ring road are
km
0–8.4 (Väo–Karla) and km 10.3–15.3 (Jüri–Kurna).
In regard to road trains, the highest traffic volume values (RT > 2,000 vpd) have been
recorded on km 11.0–15.3 (Jüri–Kurna) and km 18.7–28.0 (Luige–Jälgimäe). The number of
road train decreases onwards from Kanama interchange, the amount of road trains from
there up to Keila is 750 vpd on average.
0
4000
8000
12000
16000
200
6
200
7
200
8
200
9
201
0
201
1
201
2
201
3
201
4
201
5
201
6
0-4.8 4.8-8.4 8.4-10.3
0
4000
8000
12000
16000
200
6
200
7
200
8
200
9
201
0
201
1
201
2
201
3
201
4
201
5
201
6
10.3-11.0 11.0-15.3
0
4000
8000
12000
16000
200
6
200
7
200
8
200
9
201
0
201
1
201
2
201
3
201
4
201
5
201
6
15.3-18.7 18.7-24.2 24.2-28.0 28.0-29.9
0
4000
8000
12000
16000
200
6
200
7
200
8
200
9
201
0
201
1
201
2
201
3
201
4
201
5
201
6
29.9-32.3 32.3-36.0 36.0-38.1

Traffic management on Tallinn ring road 18
Figure 4.2. Traffic volume of vehicles belonging to the road train class on sections of the
Tallinn ring road from 2006–2016
The largest increase in the traffic volume of vehicles belonging to the road train class has
been demonstrated on road sections between Jüri ring road and Kanama interchange (100–
200%), whereas the increase remains within 40–60% elsewhere.
Figure 4.3. Change in the traffic volume of vehicles belonging to class RT on sections of the
Tallinn ring road
0
500
1000
1500
2000
25002
00
6
20
07
20
08
20
09
20
10
20
11
20
12
20
13
20
14
20
15
20
16
0-4.8 4.8-8.4 8.4-10.3
0
500
1000
1500
2000
2500
20
06
20
07
20
08
20
09
20
10
20
11
20
12
20
13
20
14
20
15
20
16
10.3-11.0 11.0-15.3
0
500
1000
1500
2000
2500
200
6
200
7
200
8
200
9
201
0
201
1
201
2
201
3
201
4
201
5
201
6
15.3-18.7 18.7-24.2 24.2-28.0 28.0-29.9
0
500
1000
1500
2000
2500
200
6
200
7
200
8
200
9
201
0
201
1
201
2
201
3
201
4
201
5
201
6
29.9-32.3 32.3-36.0 36.0-38.1
-20%
0%
20%
40%
60%
80%
200
6
200
7
200
8
200
9
201
0
201
1
201
2
201
3
201
4
201
5
201
6
0-4.8 4.8-8.4 8.4-10.3
0%
50%
100%
150%
200
6
200
7
200
8
200
9
201
0
201
1
201
2
201
3
201
4
201
5
201
6
10.3-11.0 11.0-15.3
-50%
0%
50%
100%
150%
200%
250%
200
6
200
7
200
8
200
9
201
0
201
1
201
2
201
3
201
4
201
5
201
6
15.3-18.7 18.7-24.224.2-28.0 28.0-29.9
-40%
-20%
0%
20%
40%
60%
80%
20
06
20
07
20
08
20
09
20
10
20
11
20
12
20
13
20
14
20
15
20
16
29.9-32.3 32.3-36.0 36.0-38.1
Traffic management on Tallinn ring road 19
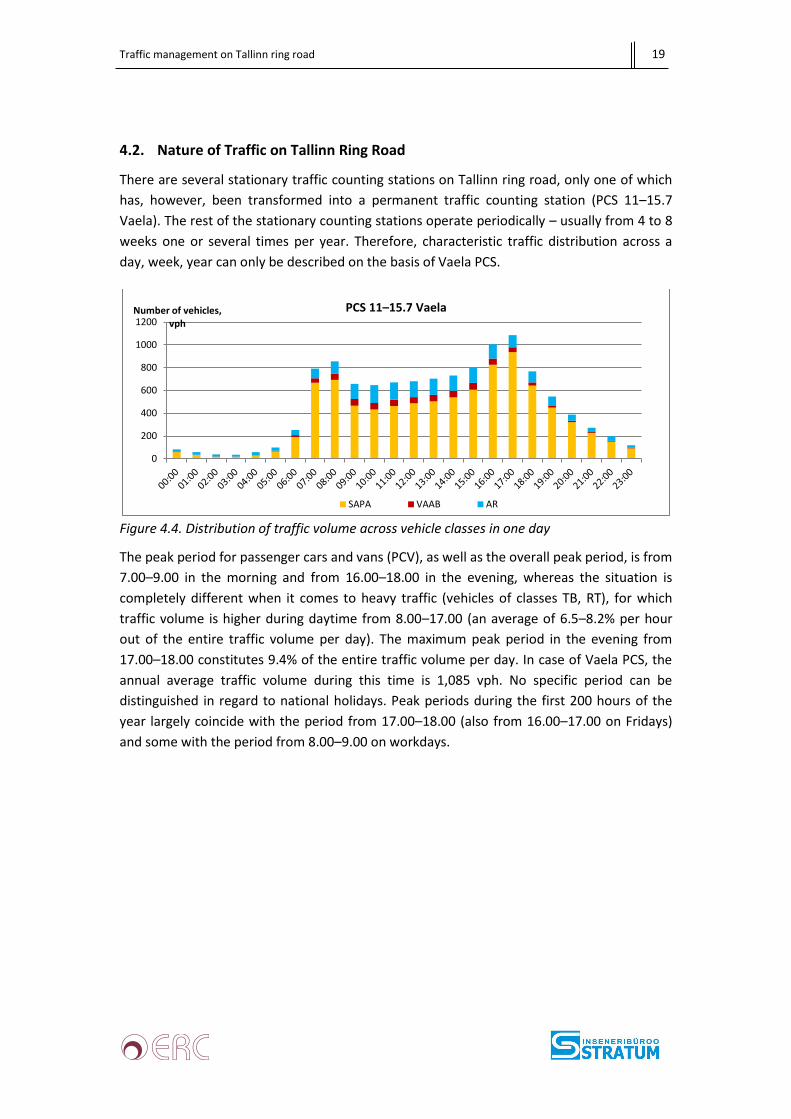
4.2. Nature of Traffic on Tallinn Ring Road
There are several stationary traffic counting stations on Tallinn ring road, only one of which
has, however, been transformed into a permanent traffic counting station (PCS 11–15.7
Vaela). The rest of the stationary counting stations operate periodically – usually from 4 to 8
weeks one or several times per year. Therefore, characteristic traffic distribution across a
day, week, year can only be described on the basis of Vaela PCS.
Figure 4.4. Distribution of traffic volume across vehicle classes in one day
The peak period for passenger cars and vans (PCV), as well as the overall peak period, is from
7.00–9.00 in the morning and from 16.00–18.00 in the evening, whereas the situation is
completely different when it comes to heavy traffic (vehicles of classes TB, RT), for which
traffic volume is higher during daytime from 8.00–17.00 (an average of 6.5–8.2% per hour
out of the entire traffic volume per day). The maximum peak period in the evening from
17.00–18.00 constitutes 9.4% of the entire traffic volume per day. In case of Vaela PCS, the
annual average traffic volume during this time is 1,085 vph. No specific period can be
distinguished in regard to national holidays. Peak periods during the first 200 hours of the
year largely coincide with the period from 17.00–18.00 (also from 16.00–17.00 on Fridays)
and some with the period from 8.00–9.00 on workdays.
0
200
400
600
800
1000
1200Number of vehicles,
vph
PCS 11–15.7 Vaela
SAPA VAAB AR

Traffic management on Tallinn ring road 20
Figure 4.5. The first 200 hours of the year on the basis of data from Vaela PCS
Figure 4.6. Seasonal distribution of traffic volume
No remarkable seasonal differences can be distinguished in traffic volume. Traffic volume is
lower during wintertime, while daytime and evening traffic volume is somewhat higher
during summertime than during other seasons. However, the evening peak period remains
of the same magnitude as in spring and autumn.
14421294
0
200
400
600
800
1000
1200
1400
1600
1800
1 7
13
19
25
31
37
43
49
55
61
67
73
79
85
91
97
10
3
10
9
11
5
12
1
12
7
13
3
13
9
14
5
15
1
15
7
16
3
16
9
17
5
18
1
18
7
19
3
19
9
Traf
fic
volu
me
, vp
h
PCS 11–15.7 Vaela in 2016AADT=11,564 vpd
0
200
400
600
800
1000
1200
1400
0 1 2 3 4 5 6 7 8 9 10 11 12 13 14 15 16 17 18 19 20 21 22 23
talv kevad suvi sügis
0
200
400
600
800
1000
1200
1400
0 1 2 3 4 5 6 7 8 9 10 11 12 13 14 15 16 17 18 19 20 21 22 23
E
T
K
N
R
L
P

Traffic management on Tallinn ring road 21
Figure 4.7. Distribution of traffic volume in the course of the day across different weekdays
The bulk of the traffic volume on Tallinn ring road is distributed on workdays, during which
there is ca 28% more vehicles on the road than on weekends. Maximum peak time in the
evening on workdays was from 17.00–18.00 and it was 1,268 vph according to Vaela PCS.
The proportion of peak period traffic volume constitutes 10.0% of the entire traffic volume
of the day on workdays.
Figure 4.8. Distribution of traffic volume on the basis of vehicle classes across days of the
week
If one were to look at the distribution of traffic volume across vehicle classes, it can be seen
that vehicles of the car/van class constitute a relatively even flow from Monday to Thursday,
whereas traffic volume is the highest on Fridays and decreases somewhat during the
weekend. However, in case of heavy traffic, the volume of traffic remains similar across all
workdays but there are ca 79% less trucks/buses and ca 65% less road trains on the roads
during weekends than there are on workdays.
0
2000
4000
6000
8000
10000
12000
E T K N R L P
AD
T, v
pd
SAPA
VAAB
AR

Traffic management on Tallinn ring road 22
5. EFFECTS OF THE DEVELOPMENT OF TALLINN RING ROAD
5.1. The Effect of Tallinn Ring Road on the Establishment of Traffic Flows in
Tallinn and Nearby Areas
It can already be said that Tallinn ring road is used by inhabitants of nearby local
municipalities as well as the citizens of the city of Tallinn for travelling from one place in
Tallinn (or nearby areas) to another, since it is not necessarily a shorter route in some cases,
but is still a faster alternative in comparison with routes going through the city. It can
therefore be assumed that when the Tallinn ring road is completed to its entire extent as a
2+2 highway, its usage by vehicle drivers of nearby areas will increase even more.
However, traffic volume on Tallinn ring road is still most affected by development activities
(construction of industrial areas, shopping centres, etc.) in nearby areas. The sustainable
urban mobility plan for the area of Tallinn is in development (estimated completion in spring
2019) and it can result in different changes on the basis of how actively development
activities/functions are directed. In regard to developments, the most important estimation
is the time of completion of a certain object. Some planning projects, which should have
been completed by today, have only been partly realised by now, at best (e.g. shopping
centre Gate Tallinn should have been completed to the extent of 60% by now, however, this
is not the case in reality). The same goes for the development of Ameerikanurga by the
Tallinn ring road.
The most important change in regard to Tallinn ring road is definitely the construction of the
small Tallinn ring road, but the time of realisation is unknown for this as well. A draft(?)
project has been prepared for the interchange of highway No. 2 Tallinn–Tartu–Võru–
Luhamaa, in which a multi-level solution has been used for the crossing of highway No. 2 and
small Tallinn ring road and the allocation of land for the construction of the interchange has
been confirmed. However, the extension of small Tallinn ring road to basic road 15 Tallinn–
Rapla–Türi constitutes an even more important impact on the traffic of the city of Tallinn.

Traffic management on Tallinn ring road 23
6. MODELLING OF INCIDENTS
6.1. Accident Scenarios
Traffic obstruction is a situation during which regular traffic flow is disrupted. There can be
various reasons. The most common reason for this is the occurrence of a traffic accident or
slower than average travel speed due to bad weather conditions (slipperiness, visibility/fog).
It can, of course, also be a combination of several different factors.
Since the 2+2 road sections of Tallinn ring road are relatively new, there is not much reason
to analyse traffic accidents that have occurred on the ring road as of now. On the basis of
data received from the information system of the Traffic Information Center6, the average
time for eliminating the traffic obstruction (generally a traffic accident) or the restoration of
regular traffic flow is 2.5–3 h.
Table 5.1. Number of events related to traffic obstructions in 2017 as shown in the database
of the Traffic Information Centre
Description in the information system of the Traffic Information
Centre
Number of TAs
Time spent on eliminating the traffic obstruction, h
Medium Min. Max.
Traffic flow disrupted 39 2.8 0.1 12
Road partly closed 4 1.8 0.7 4
Road closed 3 3.0 0.5 11
There have been 4 incidents on two-carriageway roads in 2017, as a result of which traffic
flow has been disrupted7:
• accident – short-term rerouting of traffic in one direction; road closed for 44 min;
• traffic accident – both directions of road closed; road closed for 1h 29 min;
• fire in a vehicle – one direction closed for traffic for a short-term period, one lane
reopened within ca 1 hour; road closed for 1 h 17 min;
• truck loaded with rubble turned sideways on the road, one lane – one lane closed
for 3 h 26 min.
Traffic accidents, resulting in closing traffic in one direction, have also occurred before8, but
these have been unique incidents:
6 Email, 27 November 2017, Kristjan Duubas, Road Administration 7 Email, 27 November 2017, Siim Jaksi, Road Administration 8 Email, 20 November 2017, Jaan Saia, Road Administration

Traffic management on Tallinn ring road 24
• highway No. 1 km 21.95 Jõelähtme – vehicle which was performing a U-turn collided
with a truck, rear-end collisions with vehicles that had stopped before the site of the
accident and roadway departures; road closed for ~5 h;
• highway No. 2 km 33 – tanker truck turned sideways on the road, road closed for
cleaning for a couple of hours;
• highway No. 4 km 16.3 – motor vehicle drifted over the dividing strip to the
oncoming lane and collided with another vehicle, road closed for ~4 h;
• highway No. 4 km 18.8 – collision with a vehicle that was performing a U-turn, road
closed for ~3 h;
• highway No. 11 km 12.8 – control lost over vehicle on slippery road, vehicle collided
with the road barrier, causing several other vehicles to collide with it, road closed for
~4 h;
• highway No. 11 km 15.1 – driving into the formwork of a road formation by vehicle
with high-rise cargo, road closed for ~12 h, rerouting of vehicles via other roads;
• highway No. 11 km 6–8 – traffic accidents involving vehicles drifting to the oncoming
lane have occurred on a long gentle curve on a 1+1 road section, during which the
road has been closed and traffic rerouted via other roads for 2–4 hours.
Since no specific traffic obstructions can be used as a basis in this survey, we can draw on
the following in estimating the likelihood of such incidents:
• the most likely traffic obstruction to occur on roads is apparently one where traffic is
disrupted or closed on only one lane. The likelihood of the occurrence of such an
event can be related to the occurrence of a minor traffic accident (or other similar
incident) without human damages;
• the occurrence of an incident where both lanes in one direction are closed for traffic
is less likely. From a traffic safety point of view, such an event could be regarded as a
more serious traffic accident or similar situation that involves human damages (e.g.
injuries).
• the least likely event to occur is one where traffic is disrupted on both lanes in both
directions as a result of the incident. If such events are connected to the occurrence
of a traffic accident, such events can provisionally be regarded as a very serious
accident involving several injured persons or fatalities.
Table 5.2. Description of accident scenarios
Type of TA Injured persons Disruption of traffic flow Time for eliminating
the disruption, h
Minor No No significant disruption 0
Medium No or minor injuries On one lane 1.5
Serious Yes, minor or serious injury * On both lanes 3.0
Very serious
Yes, serious injury or death * On both lanes 8.0
* Remark – in the context of disruption of traffic flow, an accident could be considered serious or very serious even if it does not involve human injuries (e.g. road train transporting fuel is overturned in the middle of the road, the driver is going around the vehicle and extinguishing the petrol tank until emergency rescue arrives).

Traffic management on Tallinn ring road 25

Traffic management on Tallinn ring road 26
7. TRAFFIC MODEL OF TALLINN AND ITS NEARBY AREA
7.1. Traffic Modelling
Traffic modelling has been conducted on the basis of the traffic model of Tallinn during
evening peak period (hereinafter referred to as “EPP”). The transport planning package of
the common traffic modelling software Citilabs Cube Voyager has been used during the
process. The traffic model of Tallinn includes the entire Tallinn and its nearby areas, incl.
Tallinn ring road. The development of the traffic model of Tallinn began in 1996 and the base
model has been annually updated and calibrated in accordance with information received
from surveys and traffic counting results. In 2008, the traffic models of the city of Tallinn and
Tallinn ring road were merged.
Figure 7.1. Road network in the traffic model of Tallinn and its nearby area.
The traffic model comprises two parts: road network and correspondence matrix. In regard
to the road network, the model includes data on each road section and intersection:
• road section (length, travel speed, capacity, etc.);
• intersection (type, number of lanes, traffic light programme, etc.).
Correspondence matrix is a matrix that characterises the connections between places of
departure and arrival and constitutes the so-called connections between unit and transport
zones. Transport zone is the generalised unit of the area modelled and the amount of units is
selected on the basis of the task at hand, however, it must be enough to enable to distribute
traffic flows on the network at an appropriate level of accuracy. There are 400 transport
zones that are either places of departure or arrival in the traffic model of Tallinn and its
nearby area. Transport zones are related to land use and they include a description of what

Traffic management on Tallinn ring road 27
type of a zone it is and its background. During the preparation of the forecast model, it is
also necessary to consider future changes in land use, therefore also taking into account
possible new or changing correspondences arising from new plans. Thus, transport zones
that are related to land use also involve notes on plans. During the preparation of the
forecast model, the intention has been to consider all known datasets of plans related to the
land use of Tallinn and nearby areas, including small designs with little traffic impact.
Since changes and impacts of land use are in constant development, the correspondence
matrix does require corrections from time to time. The last more serious correction of the
correspondence matrix was conducted in 2016 via the use of the data of the Tax and
Customs Board regarding the home and workplace of citizens.
A forecast matrix has been prepared in the context of this survey, showing that the overall
growth of the correspondence matrix (i.e. comprehensive traffic demand) of Tallinn is 19.5%
in the period of 2019–2034. Therefore, the model of 2019 shows 79,492 travels in the course
of the evening peak period and the model of 2034 shows 94,990 travels. It is important to
point out that the growth is calculated in accordance with changes in land use and by
incorporating traffic-political objectives of Tallinn. For instance, traffic growth in the city
centre of Tallinn is not foreseen and some places where there is currently no traffic will be
open for traffic then (e.g. realisation of Veskimöldre or Koru zoning plans).
7.2. Traffic Model 2019
7.2.1. Road Network
The street network of the 2017 base model has been adjusted with objects that have been
completed or will most likely be completed by 2019:
• highway No. 11 Tallinn ring road sections km 0–20 and 24–30 have 2+2 lanes, incl.
completed reconstruction of Väo interchange.
P.S. The section of km 20–24 has 1+1 lanes in the 2019 traffic model, however, it
does not change the traffic volume of Tallinn ring road as there are no intersections
on this section and the capacity of the road section is adequate.
Objects in the city of Tallinn:
• Reidi road (Russalka–Ahtri tn);
• Traffic solution for Gonsiori tn, involving public transport lanes and reversible lanes
(reversible lane leading out of the city in the evening);
• Haabersti interchange (construction of an overpass, reconstruction of Rannamõisa
road);
• Tallinn main street project has been realised (sections of Narva and Pärnu highway
have been limited to facilitate alternative types of travel and restrict car traffic).

Traffic management on Tallinn ring road 28
7.2.2. Land Use
It has been assumed in regard to land use that constructions that are still ongoing in 2016–
2017 shall be finished by 2019.
7.3. Traffic Model 2034
7.3.1. Road Network
The following objects that are likely to be completed by 2034 have been included in traffic
model 2034:
• highway No. 11 section km 0–30 (from Väo interchange to Kanama interchange) has
2+2 lanes and multi-level interchanges.
• Objects in the city of Tallinn:
• breakthrough of Tervise tn (connects Viljandi highway to Rahumäe road);
• Rannamõisa road has 2+2 lanes up until the ring road of Vahepere road;
• reconstruction of Paldiski highway into a major road with 2+2 lanes (from Haabersti
up to the Harku–Rannamõisa intersection of road 11191).
7.3.2. Land Use
• Zoning plans regarding Tallinn and nearby areas have been realised to the extent of
around 90%.
• In the context of major plans nearby the Tallinn ring road, it is assumed that
Ameerikanurga and Kanadanurga (both located near the interchange of highway No.
2 and highway No. 11) have not been realised or have been realised to a small
extent, i.e. so that the intended network of distributor roads has not yet been
completed.
7.4. Aggregated Data on Traffic Modelling
In the context of this survey, traffic modelling has been conducted for two primary purposes:
• provide an input for profitability calculations concerning time expenditure;
• assess the capacity and bottlenecks of bypass roads.
The analysis of bypass routes along with recommendations for alleviating problems has been
set out in Annex 2 (Problem areas of Bypass Routes in 2019 and 2034).
Aggregated data on traffic modelling are set out in tables 7.1 and 7.2. The model includes
two scenarios: one where the relevant road section of highway No. 11 is open (regular
traffic) and one where the relevant road section is closed and traffic is rerouted via
alternative routes. The only road section on highway No. 11 that does not have any
alternative routes is road section 5 (highway No. 2 – Vaela), for which the model displays a
situation where all traffic on highway No. 11 is distributed onto the street network of Tallinn
(the main alternative is Järvevana road).

Traffic management on Tallinn ring road 29
If only one direction (one thread) is closed, the calculation of time expenditure takes the
decrease of travel speed (connections) into consideration and distribution of traffic to other
routes is not taken into account.
Data on traffic volume of Tallinn ring road (AADT) for 2019 and 2034 are set out in Annex 5.

Traffic management on Tallinn ring road 30
Table 7.1. Aggregated data on traffic modelling (2019)
0,5 1. alterntiiv (väljaspool T11 Tallinna ringteed) 2. alterntiiv (üldjuhul seespool T11 Tallinna ringteed)
summaarne
läbisõit
summaarne
ajakuluteedevõrgu pikkus*
summaarne
läbisõit
summaarne
ajakuluteedevõrgu pikkus*
summaarne
läbisõit
summaarne
ajakuluteedevõrgu pikkus*
summaarne
läbisõit
summaarne
ajakuluJoonise nr
lõik a-km ajakulu km a-km tundi km a-km tundi km a-km tundi
2019 1 669346 19665 7,8 6059 73 18,7 6834 108 STR-011 niit kinni 6059 202
T11 kinni 668679 20051 7,8 0 869,5 18,7 11185 248 STR-02
2019 2 669346 19665 3,3 2777 31 33 4327 69 STR-031 niit kinni 2777 93
T11 kinni 671006 20447 3,3 0 806,5 33 8002 117 STR-04
2019 3 669346 19665 7,4 6050 68 31,3 4163 66 10,8 188 4 STR-051 niit kinni 6050 202
T11 kinni 669172 19936 7,4 0 882 31,3 4803 74 10,8 6174 169 STR-06
2019 4 669346 19665 4,4 3389 44 30,9 13223 191 14 2783 56 STR-071 niit kinni 3389 113
T11 kinni 669608 20414 4,4 0 754,5 30,9 15409 285 14 4821 191 STR-08
2019 5 669346 19665 8,1 7330 86 STR-091 niit kinni 7330 244
T11 kinni 675324 21620 8,1 0 936 STR-10
2019 6 669346 19665 8,9 6986 78 17,4 1275 20 16 4820 75 STR-111 niit kinni 6986 233
T11 kinni 671056 20078 8,9 0 806 17,4 5356 94 16 10298 197 STR-12
2019 7 669346 19665 10,4 6617 74 35 9285 130 30,8 15068 256 STR-131 niit kinni 6617 221
T11 kinni 670466 20259 10,4 0 636 35 15102 219 30,8 18481 342 STR-14
2019 8 669346 19665 4,3 3079 34 15,1 4817 91 STR-151 niit kinni 3079 103
T11 kinni 669634 20092 4,3 0 744 15,1 9418 233 STR-16
2019 9 669346 19665 7,1 5153 60 10,9 1649 25 14,3 9760 123 STR-171 niit kinni 5153 172
T11 kinni 670096 19847 7,1 0 726 10,9 4160 101 14,3 12801 198 STR-18
2019 10 669346 19665 11,7 6177 77 19,9 4042 60 STR-191 niit kinni 6177 206
T11 kinni 672032 20092 11,7 0 532 19,9 12271 257 STR-20
*) mudel arvestab teedevõrgu pikkust suuna kaupa ehk 2 km pikkune kahesuunaline teelõik on selles tulbas 4 km.
ÜMBERSÕIDUDT11 TALLINNA RINGTEETALLINN KOKKU
ei ole
ei ole
ei ole
ei ole
ei ole
ei ole
ei ole
ei ole
ei ole
ei ole
ei ole
ei ole

Traffic management on Tallinn ring road 31
Table 7.2. Aggregated data on traffic modelling (2034)
0,5 1. alterntiiv (väljaspool T11 Tallinna ringteed) 2. alterntiiv (üldjuhul seespool T11 Tallinna ringteed)
summaarne
läbisõit
summaarne
ajakuluteedevõrgu pikkus*
summaarne
läbisõit
summaarne
ajakuluteedevõrgu pikkus*
summaarne
läbisõit
summaarne
ajakuluteedevõrgu pikkus*
summaarne
läbisõit
summaarne
ajakuluJoonise nr
lõik a-km ajakulu km a-km tundi km a-km tundi km a-km tundi
2034 1 859883 33312 7,8 9677 120 18,7 8480 136 STR-211 niit kinni 9677 323
T11 kinni 861129 34955 7,8 0 1411,5 18,7 14161 501 STR-22
2034 2 859883 33312 2,1 2819 32 32,8 6724 110 STR-231 niit kinni 2819 94
T11 kinni 868706 35378 2,1 0 1321,5 32,8 16758 285 STR-24
2034 3 859883 33312 6,1 8721 99 31,3 6333 102 10,8 678 14 STR-251 niit kinni 8721 291
T11 kinni 863100 34803 6,1 0 1423,5 31,3 10468 159 10,8 7991 391 STR-26
2034 4 859883 33312 4,4 5549 132 30,9 17660 258 14 4550 116 STR-271 niit kinni 5549 185
T11 kinni 867849 35383 4,4 0 1427,5 30,9 21789 419 14 9157 320 STR-28
2034 5 859883 33312 8,1 13348 231 STR-291 niit kinni 13348 445
T11 kinni 871587 42354 8,1 0 1715,5 STR-30
2034 6 859883 33312 8,9 12450 143 17,4 2240 37 16 6976 112 STR-311 niit kinni 12450 415
T11 kinni 862387 36179 8,9 0 1447 17,4 10865 338 16 13147 621 STR-32
2034 7 859883 33312 10,4 12006 146 35 13731 199 30,8 20037 364 STR-331 niit kinni 12006 400
T11 kinni 865064 35713 10,4 0 1154,5 35 24043 454 30,8 27812 665 STR-34
2034 8 859883 33312 4,3 5942 69 15,1 6333 123 STR-351 niit kinni 5942 198
T11 kinni 863841 36741 4,3 0 1462,5 15,1 12517 713 STR-36
2034 9 859883 33312 7,1 8677 118 10,9 2159 36 14,3 12311 171 STR-371 niit kinni 8677 289
T11 kinni 862062 34882 7,1 0 1222 10,9 5411 192 14,3 18197 518 STR-38
2034 10 859883 33312 11,7 8823 113 19,9 5677 98 STR-391 niit kinni 8823 294
T11 kinni 867241 34605 11,7 0 765 19,9 14123 385 STR-40
*) mudel arvestab teedevõrgu pikkust suuna kaupa ehk 2 km pikkune kahesuunaline teelõik on selles tulbas 4 km.
ÜMBERSÕIDUDT11 TALLINNA RINGTEETALLINN KOKKU
ei ole
ei ole
ei ole
ei ole
ei ole
ei ole
ei ole
ei ole
ei ole
ei ole
ei ole
ei ole

Traffic management on Tallinn ring road 32
8. BYPASS ROUTES
8.1. Homogeneous Road Sections
Tallinn ring road has been divided into homogeneous road sections by separate driving
directions. Homogeneous section is a road section between two points, from where it is
possible to redirect traffic; it usually includes ramps, intersections, places where the dividing
strip is interrupted.
Locations of existing ramps, intersections and maintenance gates in the median barrier are
mapped out during appointment of homogeneous road sections. Development projects
regarding Tallinn ring road have also been reviewed and additional locations, which will be
realised in the upcoming years, have been added.
Figure 8.1. Map of homogeneous road sections
Google Maps provides a better overview of the road sections set out in the map (relevant
link shared with the contracting entity).
8.2. Problem Areas of Bypass Routes in 2019 and 2034
Modelling has been carried out for evening peak period situations for 2019 and 2034.
The modelling has resulted in determining the intersections (interchanges) where
implementation of additional measures is necessary in case of complete rerouting of traffic –
temporary traffic management, authorised official, etc.
Capacity coefficients of performance (i.e. ratio of traffic volume and capacity) are set out in
extract schemes of intersections by traffic directions. For instance, coefficient 1.123 means

Traffic management on Tallinn ring road 33
that capacity is implemented to the extent of 112.3%, i.e. all that exceeds 1.0 (over 100%)
signifies complete exhaustion of capacity. In case of unchannellised (lanes with shared
manoeuvres) intersections, coefficients of performance shall be added together. For
instance, if coefficients displayed by traffic directions 0.543 and 0.345 actually originate from
one lane, the capacity coefficient of performance is 0.543 + 0.345 = 0.888, i.e. 88.8% of
capacity has been used.
NB: Circles marking the capacity coefficient of performance in figures STR-01–STR-40 also
consider the existence/absence of turning lanes and have therefore already been added up.
Some schemes also display demand, which stands for the amount of cars that would like to
perform the relevant manoeuvre (cph). This provides the executor of rerouting with
information regarding the traffic volume which should be taken into account during
rerouting.
It has been estimated that the ITS solution is applicable in case of closure, i.e. part of the
traffic volume has already chosen a better route and the place of rerouting will serve less
than the regular traffic flow.
Overview of problem areas of bypass routes is set out in Annex 2.
8.3. Bypass Schemes
Bypass schemes have been prepared separately for each homogeneous road section. Three
different scenarios have been taken into account:
• traffic direction 1, i.e. STEE 1, (both lanes of the carriageway) is closed;
• traffic direction 2, i.e. STEE 2, (both lanes of the carriageway) is closed;
• traffic direction 1 and 2 (all lanes of carriageways) are closed.
If the traffic obstruction only occurs on one lane in one direction, traffic shall be redirected
to the other lane in the same direction and time expenditure of road users will be slightly
higher (intertwining one direction onto one lane and temporary speed restriction).
If the traffic obstruction only occurs on both lanes in one direction, traffic shall be redirected
to the other direction (1+1) and time expenditure of road users will be slightly higher
(intertwining two directions onto one lane and temporary speed restriction).
Road conditions and effects of additional traffic volume on bypass roads have been taken
into account during the preparation of bypass routes.
Bypass routes are presented to their full extent in Annex 3.

Traffic management on Tallinn ring road 34
9. SURVEILLANCE AND TRAFFIC MANAGEMENT SYSTEMS
9.1. Existing Equipment on Tallinn Ring Road
In 2009, 7 stationary traffic counting stations were installed at Tallinn ring road, which began
operating as periodic counting stations. As of now, one of these stations (Vaela) has been
converted into a permanent traffic counting station, whereas several other periodic traffic
counting stations are currently out of order, since reconstruction work is being carried out
on the highway.
Table 9.1. Locations of various existing equipment on Tallinn ring road
Road address Name of location
Type of equipment Year of instalment Highway No.
STEE TO Distance Km
11 1 2 134 3.0 Väo
Periodic traffic counting station
2009
11 1 4 2,997 12.7 Kurna
Periodic traffic counting station
2009/renov. 2015
11 1 5 1,332 16.3 Vaela
Permanent traffic counting station
2009/2016
11 1 5 1,332 16.3 Vaela
Road weather information station and camera
11 1 5 4,332 19.3 Luige Road camera 2013
11 1 6 1,767 22.0 Tammemäe
Periodic traffic counting station
2009
11 1 7 1,974 26.3 Juuliku
Periodic traffic counting station
2009
11 1 7 4,574 28.9 Jälgimäe
Periodic traffic counting station
2009
11 1 9 2,225 35.6 Valingu
Periodic traffic counting station
2009

Traffic management on Tallinn ring road 35
Figure 9.1. Locations of existing equipment
Legend:
Permanent traffic counting station (Vaela)
Periodic traffic counting station
Road weather information station
Road camera
9.2. Description of ITS Equipment
One of the objectives of ITS equipment is to provide road users with up-to-date information
on what is happening on the road, whether notifying of various traffic disruptions (e.g.
closing of a lane or slowing of traffic flow due to road construction or traffic accidents) or
changes in road conditions due to weather (e.g. sudden slipperiness, decreased visibility
(fog), etc.).
The world of ITS equipment is in constant development and since the objective of this survey
was not to describe all existing equipment9, but rather to point out appropriate surveillance
and traffic management systems for managing the Tallinn ring road, the following only
includes descriptions of equipment that consultants deemed practical to apply in regard to
the Tallinn ring road.
9.2.1. Surveillance Systems
The condition of the road surface (dry/wet/slippery, etc.) and visibility (fog, heavy rain, etc.)
are important parameters that affect the behaviour of road users and the likelihood of
accidents. In Finland, road weather information systems are recommended to be installed
after every 40–50 km on main and basic roads. Road sections where variable-message signs
are used should be equipped with road weather information stations more frequently (after
every 5–10 km)10. 16 road weather information systems have been installed on Helsinki Kehä
III ring road, which is 45 km long. In order to get up-to-date information on road conditions
and notify road users as quickly as possible, it would be reasonable to install additional road
weather information stations (and/or road cameras) in addition to the existing one on
Tallinn ring road as well as other sectors of the ring road (cf. Figure 9.4).
There are several different traffic cameras for monitoring traffic. Starting with simpler
cameras that enable to monitor traffic conditions and ending with cameras that
automatically identify various traffic events.
9 The topic of VMS has been addressed in a previous survey ordered by the Road Administration – “Muutuvteabega liikluskorraldusvahendite kasutamine” Ramboll Eesti AS, 2013 10 Lähesmaa, J.; Levo, J. Tiesääseurannan tavoitetila. Tiehallinnon selvityksiä 6/2003.

Traffic management on Tallinn ring road 36
AID, automatic incident detection, is appropriate for detecting disruptions in traffic flow.
Traffic events that the system is capable of detecting11:
• stopped vehicle;
• car driving in the wrong direction;
• pedestrian on the road;
• unauthorised items on road;
• significantly decreased visibility;
• fire (does not, however, replace a fire alarm system);
• decrease in the average speed of car flow (does not apply to an individual car).
9.2.2. Warning Systems
If there is information about a disruption of traffic flow on the road, said information can
also be provided to road users. There are several different options for this:
• VWS, i.e. variable warning sign, enables to display various warning signs;
• VSL, i.e. variable speed limit sign, enables to display various speed limits;
• combination of the aforementioned signs (VWS+VSL).
Figure 9.2. Example of various variable-message warning signs
9.2.3. Systems That Affect Traffic Flow
Systems that affect traffic flow enable to provide information on upcoming traffic
disruptions and offer possible bypass options for rerouting traffic.
Variable-message sign, i.e. VMS, enables to display various messages.
11 Homepage of IB Foor OÜ www.foor.ee

Traffic management on Tallinn ring road 37
Figure 9.3. Example of different various-message signs
9.3. Locations of ITS Equipment
There is currently only one road weather information station and one road camera on
Tallinn ring road. In order to gain a better overview of weather conditions, it would be
reasonable to install road weather information stations in other sectors of the ring road as
well; plans for 4 additional road weather information stations have currently been made.
Provided that existing stationary traffic counting stations remain at their current location,
consultants have proposed 2 additional traffic counting stations, which would enable to
display, in addition traffic counting data, also traffic volume and speed over a selected
period of time, which would provide information regarding possible traffic disruptions
(traffic volume, average speed and percentage of heavy traffic over the last 15 minutes is
currently displayed in the Tarktee application). Locations of possible new road weather
information stations and traffic counting stations are brought out in Figure 9.4 and Table 9.2.
Figure 9.4. Locations of new road weather information stations and traffic counting stations
Legend:
New traffic counting station
New road weather information station

Traffic management on Tallinn ring road 38
Table 9.2. Address data of the locations of new road weather information stations and traffic
counting stations
Order No.
Name
Road address*
LAT LON Highway No.
STEE TO Distance Km
New traffic counting station
1 New LP-1 11 1 3 2,261 8.339 59.37274 24.91011
2 New LP-2 11 1 8 2,088 31.656 59.31186 24.54723
New road weather information station
1 New TIJ-1 11 1 2 1,864 4.730 59.40394 24.91604
2 New TIJ-2 11 1 4 3,265 12.968 59.34465 24.85467
3 New TIJ-3 11 1 7 1,145 25.471 59.31628 24.65383
4 New TIJ-4 11 1 9 1,355 34.730 59.31654 24.49487 * - road address has hereinafter been determined on the basis of the status set out in the Road Register as at 1 December 2017. Road addresses are about to undergo significant changes in the upcoming years due to ongoing reconstruction works on objects on Tallinn ring road.

Traffic management on Tallinn ring road 39
Locations of traffic cameras to be installed in the context of getting a better overview of
traffic conditions are set out in Figure 9.5 and Table 9.3. As a rule, such cameras are installed
onto overpasses or portals located at an interchange.
Figure 9.5. Locations of traffic cameras
Table 9.3. Address data of the locations of new traffic cameras
Order No.
Name Road address
LAT LON Highway No.
STEE TO Distance Km
1 ITS1 - LK-1 11 1 1 1,818 1.818 59.42980 24.91973
2 ITS1 - LK-2 11 1 2 2,208 5.074 59.40086 24.91626
3 ITS1 - LK-3 11 1 3 2,337 8.415 59.37212 24.90956
4 ITS1 - LK-4 11 1 4 611 10.314 59.35813 24.89098
5 ITS1 - LK-5 11 1 4 5,230 14.933 59.33642 24.82429
6 ITS1 - LK-6 11 1 5 3,733 18.701 59.32198 24.76524
7 ITS1 - LK-7 11 1 6 4,012 24.245 59.31556 24.67512
8 ITS1 - LK-8 11 1 7 1,856 26.182 59.31549 24.64147
9 ITS1 - LK-9 11 1 8 431 29.999 59.31322 24.57521
10 ITS1 - LK-10 11 1 9 10 33.385 59.31615 24.51813
11 ITS1 - LK-11 11 1 9 2,288 35.663 59.31449 24.47899
Locations of boards that combine variable-message warning signs and variable speed limit
signs (VWS+VSL) are set out in Figure 9.6 and Table 9.4.

Traffic management on Tallinn ring road 40
Figure 9.6. Locations of VWS+VSL
Table 9.4. Address data regarding locations of new VWS+VSL signs
Order No.
Name
Road address
LAT LON Highway No.
STEE TO Distance Km
1 ITS1-2LM-1_1 11 1 1 679 0.679 59.4391 24.9116
2 ITS1-2LM-1_2 11 1 1 637 0.637 59.4395 24.9117
3 ITS1-2LM-2_2 11 1 2 414 3.280 59.4168 24.9201
4 ITS1-2LM-3_1 11 1 2 2,282 5.148 59.4001 24.9158
5 ITS1-2LM-3_2 11 1 2 2,301 5.167 59.4001 24.9170
6 ITS1-2LM-4_1 11 1 3 2,129 8.207 59.3738 24.9110
7 ITS1-2LM-4_2 11 1 3 2,126 8.204 59.3737 24.9116
8 ITS1-2LM-5_1 11 1 3 2,552 8.630 59.3705 24.9074
9 ITS1-2LM-6_2 11 2 4 244 9.947 59.3604 24.8958
10 ITS1-2LM-7_1 11 1 4 1,899 11.602 59.3514 24.8748
11 ITS1-2LM-8_2 11 2 4 3,556 13.259 59.3435 24.8530
12 ITS1-2LM-9_1 11 1 5 437 15.405 59.3359 24.8161
13 ITS1-2LM-9_2 11 2 4 5,229 14.932 59.3365 24.8270
14 ITS1-2LM-10_1 11 1 5 3,551 18.519 59.3231 24.7676
15 ITS1-2LM-10_2 11 2 5 4,017 18.985 59.3208 24.7638
16 ITS1-2LM-11_1 11 1 6 1,089 21.322 59.3120 24.7254
17 ITS1-2LM-11_2 11 1 6 1,117 21.350 59.3118 24.7249
18 ITS1-2LM-12_1 11 1 7 168 24.494 59.3164 24.6710
19 ITS1-2LM-12_2 11 1 6 3,685 23.918 59.3143 24.6803
20 ITS1-2LM-13_1 11 1 7 2,345 26.671 59.3152 24.6329
21 ITS1-2LM-13_2 11 1 7 1,560 25.886 59.3155 24.6467
22 ITS1-2LM-14_2 11 1 7 4,996 29.322 59.3120 24.5869
23 ITS1-2LM-15_1 11 1 8 1,514 31.082 59.3118 24.5569
24 ITS1-2LM-16_2 11 1 8 2,191 31.759 59.3118 24.5453
25 ITS1-2LM-17_1 11 1 9 958 34.333 59.3174 24.5017
26 ITS1-2LM-17_2 11 1 9 1,225 34.600 59.3164 24.4972
27 ITS1-2LM-18_1 11 1 9 3,289 36.664 59.3124 24.4619
28 ITS1-2LM-18_2 11 1 9 3,902 37.277 59.3104 24.4518

Traffic management on Tallinn ring road 41
Since automatic incident detection systems (AIDs) are relatively expensive, the first
approach is to install these in each sector of Tallinn ring road (in accordance with the
completion of road sections). It would be reasonable to monitor the situation on the ring
road for a few years in advance (if and where the risk for traffic accidents is highest) and only
then make a decision on the necessity of installation.
Figure 9.7. Locations of AIDs
Table 9.5. Address data regarding locations of new AIDs
Order No.
Name
Road address
LAT LON Highway No.
STEE TO Distance Km
1 ITS2-AID-1 11 1 3 3,418 9.496 59.3636 24.9005
2 ITS2-AID-2 11 1 4 2,718 12.421 59.3472 24.8629
3 ITS2-AID-3 11 1 7 3,630 27.956 59.3132 24.6107
4 ITS2-AID-4 11 1 8 3,538 33.106 59.3156 24.5229
In order to inform of events (traffic disruption) and improving traffic flow, it is reasonable to
install VMSs (cf. Figure 9.3 and Table 9.6) on the ring road as well as intersecting radial roads
(i.e. highway No. 1, highway No. 2, highway No. 15, highway No. 4 and highway No. 8),
which would enable drivers who are travelling on these roads to choose an alternative route
instead of Tallinn ring road in advance in case that an incident has occurred there.

Traffic management on Tallinn ring road 42
Figure 9.8. Locations of large boards (VMS)
Table 9.6. Address data of the locations of large boards (VMS)
Order No.
Name
Road address
LAT LON Highway No.
STEE TO Distance Km
1 ITS2-ST-1 1 1 1 8,339 8.339 59.4376 24.8819
2 ITS2-ST-2 1 2 2 3,028 12.268 59.4488 24.9477
3 ITS2-ST-3 11 1 3 353 6.431 59.3888 24.9185
4 ITS2-ST-4 11 1 3 414 6.492 59.3883 24.9214
5 ITS2-ST-5 2 1 2 4,745 10.250 59.3670 24.8597
6 ITS2-ST-6 2 2 3 2,258 14.321 59.3387 24.9050
7 ITS2-ST-7 15 1 1 4,410 4.410 59.3608 24.7658
8 ITS2-ST-8 15 1 4 2,505 11.508 59.3031 24.7440
9 ITS2-ST-9 11 1 7 383 24.709 59.3171 24.6673
10 ITS2-ST-10 11 1 7 4,107 28.433 59.3119 24.6025
11 ITS2-ST-11 4 1 2 3,384 16.424 59.3271 24.5944
12 ITS2-ST-12 4 2 3 2,335 20.653 59.2960 24.5522
13 ITS2-ST-13 11 1 8 3,748 33.316 59.3155 24.5190
14 ITS2-ST-14 8 1 3 4,577 23.022 59.3243 24.4626
15 ITS2-ST-15 8 1 4 1,320 26.445 59.3157 24.4165
Locations of ITS solutions can be viewed in more detail via the Google Maps application (link
sent to the contracting entity).

Traffic management on Tallinn ring road 43
9.4. Stepwise Realisation Plan for ITS Solutions
In the context of the first approach, it would be practical to install ITS equipment on road
sections where traffic volume is the highest and there are no bypass options.
Stepwise establishment of the ITS system can be carried out in two ways:
• by sections of Tallinn ring road;
• by the level (notification level) of ITS equipment.
Traffic volume and risk level must, first and foremost, be considered when establishing the
ITS system by sections of highway No. 11 Tallinn ring road. According to consultants, it would
be reasonable to begin with 2+2 lanes and multi-level road sections that have already been
completed, whereas the recommendation for other sections is to include the establishment
of the ITS system into the technical specifications of the plan.
Priority sections of Tallinn ring road (ranking prepared by consultants) are:
1. Karla interchange – Luige interchange (incl. an especially important section of
highway No. 2 – Vaela interchange where weather conditions can change very fast);
2. Väo interchange–Karla interchange;
3. Juuliku interchange – Saue;
4. Luige interchange – Juuliku interchange (included in the ITS project);
5. Saue–Keila (included in the ITS project).
There are two principal stages for realising the system by the level (notification level) of ITS
equipment:
• Stage I – informing of possible risks and reducing situations where one accident
causes another on Tallinn ring road – road weather information stations, AID and
VWS+VSL. Primarily affects traffic flow and reduces accident costs.
• Stage II – stage I + rerouting notifications on Tallinn ring road and radial roads
(highway No. 1, highway No. 2, highway No. 15, highway No.4, highway No. 8) –
option to reroute traffic further from the place of the accident, making it possible to
lose less time.
The two methods of establishing the ITS system may also be combined (section and ITS
level).

Traffic management on Tallinn ring road 44
10. COST-EFFECTIVENESS ANALYSIS
The objective of the cost-effectiveness analysis is to calculate the ratio of costs and benefits
regarding investments made and find the economically best and cheapest solution from the
society’s point of view for implementing ITS solutions on Tallinn ring road. The start year of
all scenarios addressed in the context of the cost-effectiveness analysis is 2019 and the end
year is 2034. Therefore, the period of analysis is 15 years which can also be regarded as the
life span of ITS equipment. The residual value of the investment by the end of the analysis
period is set at 10%. The discount rate used in the cost-effectiveness analysis12 is 4.0%.
Due to the terms of reference, the need for changing technical conditions of highways (e.g.
2+2 cross-section instead 1+1 cross-section of SEC_10) and the need for implementing road
surface repair methods have not been addressed in the cost-effectiveness analysis.
Compliance with efficiency criteria is evaluated by comparing the amount of savings accrued
by the society as a result of the realisation of investments with the expenditure. Therefore,
the cost-effectiveness analysis criteria includes the following requirements:
• net present value, NPV > 0
• benefit/cost ratio, B/C ratio > 1.0;
• economic internal rate of return, EIRR > 4.0%.
A rating scale for the benefit/cost ratio has been proposed in the ROSEBUD WP5 (2005)13
analysis for evaluating the results of the cost-effectiveness analysis. This benefit/cost ratio
rating scale has been developed with the intention of simplifying the evaluation of economic
efficiency of traffic safety improvement measures. Limit values and corresponding grades of
the benefit/cost ratio have been set out in Table 10.1.
Table 10.1. Grades of benefit/cost ratio and corresponding limit values (ROSEBUD WP5,
2005)
Grade Benefit/cost ratio (B/C ratio)
Poor < 1.0
Acceptable 1.0…3.0
Very good > 3.0
10.1. Description of the Methodology of the Cost-effectiveness Analysis
The methodology for the cost-effectiveness analysis carried out in this survey has been
coordinated with the contracting entity and similar methodology has also been previously
12Commission delegated Regulation (EU) No 480/2014, Article 19 Discounting of cash flows http://eur-lex.europa.eu/legal-content/ET/TXT/HTML/?uri=CELEX:32014R0480&from=ET 13 ROSEBUD, Deliverable WP5, Recommendations, Road Safety and Environmental Benefit-Cost and Cost-Effectiveness Analysis for Use in Decision-Making. 2005

Traffic management on Tallinn ring road 45
used in other projects and surveys carried out by the Road Administration in regard to
evaluating traffic safety and traffic flow.14 15
Different cost-effectiveness analyses on maximum speed permitted are based on the
possibilities of HDM-4 (Highway Development and Management Tool) software. This
software is used in various countries in regard to making decisions and plans concerning
road and street management and evaluating investment alternatives. The concept of the
analytical framework of HDM-4 is based on analysing the lifecycle of various highways and
various related assets. The concept is implemented by modelling the deterioration of road
surfaces, effects of repair works, fees of road users, effects of the society and environment
throughout the lifecycle of a highway, which is generally estimated at 15–40 years in similar
analyses.
The analytical concept of HDM-4 has been developed in order to compare the cost and
benefits of various investment opportunities and conducting an economic analysis. It helps
to assess the cost and benefits of various investment alternatives across the analysed years
over the analysis period determined by the user of the software. All costs incurred over the
reference period shall be discounted to the determined start year. To compare different
alternatives, it is necessary to be familiar with detailed descriptions of investment
programmes, design norms and various maintenance opportunities and solutions, as well as
with the cost of investments and various costs (maintenance, repair works, etc.) related to
the activities concerning these investments, estimated traffic capacity and environmental
conditions during the exploitation period.
Economic benefits received by society from the investments is determined by comparing the
costs and benefits regarding the realisation of these investments with the costs and benefits
of the so-called baseline option (option 0). A baseline option (option 0) is a situation where
the project is not carried out or carried out as little as possible in order to maintain the
current situation. As a rule, the situation referred to only involves the implementation of
necessary works and costs.
The efficiency of road-related investments is significantly affected by the overall condition of
the surface of roads as well as the number and composition of vehicles travelling on those
roads. In the long-term, the condition of road surface and its changing is, in turn, directly
dependent on maintenance and repair methods. The impact of the condition of road
surfaces and level of road planning on road users is measured by the costs incurred by the
road user and other external effects on the society and environment. Costs incurred by road
users include maintenance costs of a vehicle (fuel, tyres, lubricants, spare parts,
amortisation, etc.), travel time of passengers as well as goods, and cost of traffic accidents to
the society (incl. loss of life, human injuries, damages to vehicles and roadside objects, etc.).
14 Differentiation of maximum speed allowed on Estonian roads outside built-up areas, stage II; ERC Konsultatsiooni OÜ, 2014 15 Survey on measuring the use of automatic traffic supervision , which is based on measuring average speed; ERC Konsultatsiooni OÜ, 2013

Traffic management on Tallinn ring road 46
Effects on the society and environment can be expressed through exhaust gases emitted by
vehicles, energy consumption, traffic noise and benefits that society receives by use of
roads. Even though effects on society and environment are at times difficult to express,
HDM-4 enables to implement them as so-called external factors.
10.2. Analysed Options
The cost-effectiveness analysis is carried out by comparing various options with the baseline
option, i.e. with a situation where investments are not made (do nothing). It is, in some
sense, theoretical, because something is generally always done in the event of problems,
however, this is a globally used methodology and it must be followed.
Baseline alternative (OPT_0)
In the context of this survey, the baseline alternative represents a situation where the
Tallinn ring road has been completed up until Kanama overpass as a 2+2 cross-section
highway, while remaining a 1+1 cross-section highway from there on to Keila (intersection
with national main road No. 8 Tallinn–Keila–Paldiski). During summertime (ca 6 months per
year), permitted travel speed on the road sections of the ring road with 2+2 cross-section is
generally 110 km/h and 90 km/h during wintertime. The same 90 km/h limit is also
applicable all-year round on the road sections with 1+1 cross-section. There are no traffic
schemes or traffic management solutions to be applied in the event of a traffic or other
accident, in case of more serious accidents, traffic will basically stop at the location of the
accident on Tallinn ring road until the consequences of the accident have been eliminated
and the road is reopened for traffic. There is no notification system for informing road users.
Alternative option 1 (OPT_1)
Basically entails the continuation of the current situation, i.e. traffic schemes are
implemented and traffic is managed in case of a traffic or other accident, but ITS solutions
and dynamic traffic management solutions are nonexistent. This means that traffic will stop
for a certain period after a traffic or other accident, as it will take some time for traffic
schemes to be implemented, road users to be notified of possible bypass routes and for
traffic to move smoothly again. General travel speed regime (summertime/wintertime) and
frequency and number of traffic accident is similar to the baseline alternative.
Alternative option 2 (OPT_2)
Traffic schemes have been set in place for resolving traffic or other accidents in the event
that they occur and in addition to this, traffic flow is managed and road users are warned via
variable-message warning and speed limit signs (VWS+VSL), which have been installed on
Tallinn ring road. Additional road weather information stations have been installed on
Tallinn ring road for receiving operational information on the condition of the road surface
and traffic counting stations have been installed on road sections in order to receive
information on traffic flow. This means that in case of an accident, information regarding the
accident and its possible location will reach road supervisors, maintenance providers as well
as road users quicker than in OPT_1. Road users can therefore avoid the situation and will

Traffic management on Tallinn ring road 47
not necessarily drive to the traffic jam at the location of the accident, rerouting of traffic will
be initiated quicker and operatively, because information regarding the accident will reach
road managers and maintenance providers quicker. Arising from the use of variable-message
speed limit signs, permitted speed limit can be changed according to actual road conditions,
therefore the overall average travel speed is higher than in OPT_0 and OPT_1 (cf. Point
10.5). Due to the use of ITS equipment, the frequency and number of traffic accidents is also
lower in this option than in OPT_0 and OPT_1 (cf. Table 10.6).
Alternative option 3 (OPT_3)
Conditions are similar to option 2 with the difference that in addition to variable-message
warning and speed limit signs, Tallinn ring road and intersecting major roads have also been
equipped with (VMS+VWS) variable-message traffic control devices. Road users are also
additionally informed via other existing applications and information sources. In the event of
an accident on Tallinn ring road, notification and behaviour of road users is similar to OPT_2,
however, traffic accidents are somewhat less frequent, since various information on the
condition of road surface, changing of weather conditions, traffic situation, etc. is shared
with road users in a more operative manner and to a larger extent. General travel speed
regime (summertime/wintertime) is similar to OPT_2.
10.3. Primary Data of the Cost-effectiveness Analysis
Conduct of the cost-effectiveness analysis requires the determination and collection of
necessary primary data. The following includes descriptions on various primary data,
calculation principles and primary sources of the data that has been used in the cost-
effectiveness analysis conducted in the context of this survey. In case it is impossible to find
a value in regard to certain data, an expert evaluation has been used as an alternative.
10.3.1. Traffic Accidents
Occurrence of traffic accidents on highways is, as a rule, random, yet there are a number of
factors that increase the likelihood of accidents, i.e. certain measures can be taken to
manage the occurrence of traffic accidents. On the basis of the prerequisite set out in the
starting task of this survey, the analysis will consider the Tallinn ring road up to Kanama
overpass as a completed highway with a 2+2 cross-section and as a main road with a 1+1
cross-section up to Keila thereafter.
Key figures on various types of traffic accidents that have occurred on Estonian roads have
been set out in Table 10.2. This data is based on the data of the Road Register (1 September
2017) and is therefore, as a rule, characteristic of traffic accidents that involved human
injuries.
Table 10.2. Key figures of traffic accidents on main roads with various cross-sections
Road Network
Key figures of traffic accidents per mileage of 100 million car kilometres
fatalities injured persons Number of TAs

Traffic management on Tallinn ring road 48
Main roads 2+2 roads 1.06 9.41 20.4
Main roads 1+1 roads 2.37 21.34 28.6
Tallinn Ring Road 0.88 11.87 17.0
According to international surveys16, around 7–11 traffic accidents, which involve human
injuries, occur on highways with divided carriageways (2+2 cross-section) per mileage of 100
million car kilometres per year. The ratio of traffic accidents is lower on roads that have
been constructed to a further extent.
Estonia has a relatively high (practically twice as high) frequency and number of traffic
accidents on highways with a 2+2 cross-section, which is partly due to the relatively low level
of construction of such highways (especially regarding older road sections). Same level
intersections, U-turns, exits are allowed, traffic of pedestrians and vulnerable road users is
not divided from the main road, etc.
Tallinn ring road will be constructed as a class I highway and the level of construction is
significantly different from other highways with 2+2 cross-section that have been in
exploitation for some time. According to consultants, it is not right or justified to utilise the
traffic accident data of other older highways with 2+2 cross-section to describe the traffic
accident level of the newly constructed Tallinn ring road. A clear downward trend can be
seen on national roads in regard to the occurrence of traffic accidents.
Therefore, in this cost-effectiveness analysis, the traffic accident level of the newly
constructed Tallinn ring road with a 2+2 cross-section is regarded at 9.0 traffic accidents per
100 million car kilometres per year on the basis of the value set out in international surveys.
The Tallinn ring road that is to be constructed does not directly comply with the
requirements of a motorway (TA level 7.0), however, its construction level is clearly of a
higher level than a regular 2+2 highway (TA level 11.0).
Table 10.3. Road sections analysed and values of traffic accident levels in baseline alternative
(OPT_0)
Order No.
Road section Length,
km Annual mileage,
million km
Number of traffic accidents and human damages per year
Accidents Injured persons
Fatalities
1 Highway No. 11_SEC_1 3.700 17.15 1.54 0.15 0.02
2 Highway No. 11_SEC_2 1.143 5.30 0.48 0.05 0.01
3 Highway No. 11_SEC_3 3.574 17.35 1.56 0.16 0.02
4 Highway No. 11_SEC_4 2.983 13.27 1.19 0.12 0.02
16 Elvik, R., Hoye, A., Vaa, T., Sorensen, M. The Handbook of road safety measures, second edition 2009

Traffic management on Tallinn ring road 49
5 Highway No. 11_SEC_5 3.930 21.57 1.94 0.19 0.03
6 Highway No. 11_SEC_6 3.380 14.27 1.28 0.13 0.02
7 Highway No. 11_SEC_7 5.540 20.16 1.81 0.18 0.03
8 Highway No. 11_SEC_8 1.950 7.46 0.67 0.07 0.01
9 Highway No. 11_SEC_9 6.190 22.81 2.05 0.21 0.03
10 Highway No. 11_SEC_10 5.770 20.13 3.62 0.36 0.05
TOTAL: 38.160 159.460 16.16 1.62 0.24
10.3.2. Impact of Variable-message Signs on Traffic Accidents
The primary objective of VMSs is to warn road users of various exceptional situations, as well
as provide feedback to road users on their behaviour.
The impact of variable-message signs (VMSs) has been addressed in various international
surveys. A research published in 200917 includes an in-depth overview of various surveys and
Table 10.4 includes a summary of this survey.
Table 10.4. Impact of variable-message signs (VMSs) on traffic accidents
Type of VMS Type of TA affected Type of traffic
accident affected
Percentage of change in the number of TAs
Estimated impact
Limits of 95% probability
Warning regarding a traffic accident
TAs involving human damages
Traffic accidents on motorways
-44% -59%...-22%
Warning about fog Undetermined TAs Accidents in the fog -84% -93%...-63%
Changeable speed limits
TAs involving human damages
TAs in summer TAs in winter
-13% -2%
– –
Warning regarding a traffic jam
TAs involving human damages TAs involving property damages
Rear-end collision Rear-end collision
-16% +16
-26%...-4% +1%...+34%
Travel speed boards Undetermined TAs All TAs -46% -62%...-24%
At the same time, it must be acknowledged that these surveys are quite old and the
development that technology has undergone in the mean time has decreased the cost of
variable-message signs on the one hand and expanded the uses of such signs on the other
hand. The operability and speed of information exchange has significantly changed as well in
the last 10 years.
17 Elvik, R., Hoye, A., Vaa, T., Sorensen, M. The Handbook of road safety measures, second edition 2009

Traffic management on Tallinn ring road 50
Arising from the aforementioned data and estimates of consultants, the impact of variable-
message signs on traffic accidents in comparison with OPT_0 is regarded as follows in this
survey:
• no changes in the number of traffic accidents in regard to option 1 (OPT_1)
• implementation of option 2 (OPT_2) decreases the number of traffic accidents by
40%
• implementation of option 3 (OPT_3) decreases the number of traffic accidents by
60%
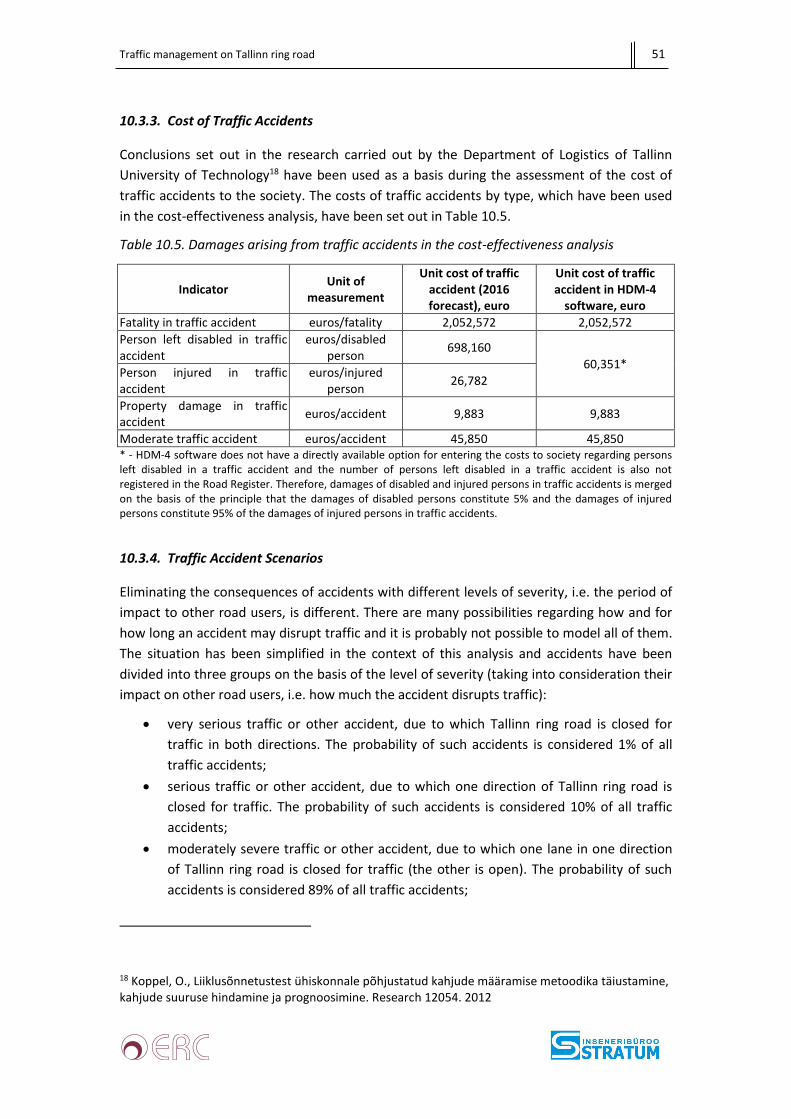
Traffic management on Tallinn ring road 51
10.3.3. Cost of Traffic Accidents
Conclusions set out in the research carried out by the Department of Logistics of Tallinn
University of Technology18 have been used as a basis during the assessment of the cost of
traffic accidents to the society. The costs of traffic accidents by type, which have been used
in the cost-effectiveness analysis, have been set out in Table 10.5.
Table 10.5. Damages arising from traffic accidents in the cost-effectiveness analysis
Indicator Unit of
measurement
Unit cost of traffic accident (2016 forecast), euro
Unit cost of traffic accident in HDM-4
software, euro
Fatality in traffic accident euros/fatality 2,052,572 2,052,572
Person left disabled in traffic accident
euros/disabled person
698,160
60,351* Person injured in traffic accident
euros/injured person
26,782
Property damage in traffic accident
euros/accident 9,883 9,883
Moderate traffic accident euros/accident 45,850 45,850 * - HDM-4 software does not have a directly available option for entering the costs to society regarding persons left disabled in a traffic accident and the number of persons left disabled in a traffic accident is also not registered in the Road Register. Therefore, damages of disabled and injured persons in traffic accidents is merged on the basis of the principle that the damages of disabled persons constitute 5% and the damages of injured persons constitute 95% of the damages of injured persons in traffic accidents.
10.3.4. Traffic Accident Scenarios
Eliminating the consequences of accidents with different levels of severity, i.e. the period of
impact to other road users, is different. There are many possibilities regarding how and for
how long an accident may disrupt traffic and it is probably not possible to model all of them.
The situation has been simplified in the context of this analysis and accidents have been
divided into three groups on the basis of the level of severity (taking into consideration their
impact on other road users, i.e. how much the accident disrupts traffic):
• very serious traffic or other accident, due to which Tallinn ring road is closed for
traffic in both directions. The probability of such accidents is considered 1% of all
traffic accidents;
• serious traffic or other accident, due to which one direction of Tallinn ring road is
closed for traffic. The probability of such accidents is considered 10% of all traffic
accidents;
• moderately severe traffic or other accident, due to which one lane in one direction
of Tallinn ring road is closed for traffic (the other is open). The probability of such
accidents is considered 89% of all traffic accidents;
18 Koppel, O., Liiklusõnnetustest ühiskonnale põhjustatud kahjude määramise metoodika täiustamine, kahjude suuruse hindamine ja prognoosimine. Research 12054. 2012

Traffic management on Tallinn ring road 52
The impact of other types of traffic accidents has not been considered in the cost-
effectiveness analysis, as it has relatively no impact on time expenditure of other road users.
Table 10.6 sets out the estimated number of accidents across analysed sections of Tallinn
ring road on the basis of their level of severity.
Table 10.6. Number of traffic and other accidents for alternatives analysed on the basis of
their level of severity
Order No.
Road section Length,
km Analysis
alternative
Estimated number of accidents per year, qty
Very serious Serious Moderate
1 Highway No. 11_SEC_1
3.700
OPT_1 0.015 0.154 1.374
OPT_2 0.009 0.086 0.769
OPT_3 0.006 0.062 0.549
2 Highway No. 11_SEC_2
1.143
OPT_1 0.005 0.048 0.424
OPT_2 0.003 0.027 0.238
OPT_3 0.002 0.019 0.170
3 Highway No. 11_SEC_3
3.574
OPT_1 0.016 0.156 1.390
OPT_2 0.009 0.087 0.778
OPT_3 0.006 0.062 0.556
4 Highway No. 11_SEC_4
2.983
OPT_1 0.012 0.119 1.063
OPT_2 0.007 0.067 0.595
OPT_3 0.005 0.048 0.425
5 Highway No. 11_SEC_5
3.930
OPT_1 0.019 0.194 1.728
OPT_2 0.011 0.109 0.967
OPT_3 0.008 0.078 0.691
6 Highway No. 11_SEC_6
3.380
OPT_1 0.013 0.128 1.143
OPT_2 0.007 0.072 0.640
OPT_3 0.005 0.051 0.457
7 Highway No. 11_SEC_7
5.540
OPT_1 0.018 0.181 1.615
OPT_2 0.010 0.102 0.904
OPT_3 0.007 0.073 0.646
8 Highway No. 11_SEC_8
1.950
OPT_1 0.007 0.067 0.598
OPT_2 0.004 0.038 0.335
OPT_3 0.003 0.027 0.239
9 Highway No. 11_SEC_9
6.190
OPT_1 0.021 0.205 1.827
OPT_2 0.011 0.115 1.023
OPT_3 0.008 0.082 0.731
10 Highway No. 11_SEC_10
5.770
OPT_1 0.036 0.362 3.225
OPT_2 0.020 0.203 1.806
OPT_3 0.014 0.145 1.290
TOTAL: 38.160
OPT_1 0.16 1.62 14.39
OPT_2 0.09 0.91 8.06
OPT_3 0.06 0.65 5.75

Traffic management on Tallinn ring road 53
10.4. Time expenditure
10.4.1. Travel Time and Costs of Vehicles
Baseline data on vehicles and travel time included in the cost-effectiveness analysis are
based on the dataset brought out in the research by the Department of Roads of the Tallinn
University of Technology19. This data has been updated in subsequent years in accordance
with economic changes. The latest correction and updating of baseline data was carried out
in 2011 in regard to the conduct of the strategic analysis of Estonian national roads20. Costs
related to vehicles have a relatively small impact on the results of the cost-effectiveness
analysis, since alternatives compared affect vehicle-related costs in a rather similar manner.
However, costs related to travel time differ in alternatives analysed, because the average
travel speed is different.
Calculations concerning time expenditure of road users is based on the average gross wage
in Estonia. According to the data of Statistics Estonia21, the average gross wage in Estonia in
2016 was 1,146 euros per month. Provided that there are 160 working hours in one month,
the hourly rate is 7.16 euros.
The time expenditure methodology (used in Europe)22 provides that time expenditure in
case of work-related travels is the sum of 1.3 times the salary rate and the cost of the
employer (33.5%). In case of commutes to work and back (estimated at a third of all travels),
the cost of time is considered 35% of an average gross wage and 20% of an average gross
wage in the case of travels during leisure time. On the basis of a research completed by the
Department of Roads of the Tallinn University of Technology in 200323, 45.8% of travels on
highways (incl. all vehicle types) are related to work, whereas leisure time travels constitute
54.2%. On the basis of the calculation method described, the primary parameters of time
expenditure used in this analysis are as follows:
• average cost of working time (with time expenditure of the commute) 5.02 euros/h;
• average cost of non-working time 1.43 euros/h;
• delay of goods and cargo 0.26 euros/h.
The data on the number of passengers in a vehicle and the objective of the travel used in the
analysis are based on the data set out in the research completed by the Department of
19 Koppel, M., HDM-4 evitamiseks vajalike liikluskulude arvutamise lähteandmete panga koostamine. Lõpparuanne. Department of Roads at Tallinn University of Technology 2003 20 Kaal, T., Truu, M., Jentson, M., Kaal, L., Jusi, P., Riigimaanteede strateegiline analüüs 2011 aastal. Lõpparuanne. AS Teede Tehnokeskus, 2011 21 www.stat.ee 22 „Tieliikenteen ajokustannusten yksikköarvot 2010“, Liikennevirasto, Helsinki 2010 23 “HDM-4 evitamiseks vajalike liikluskulude arvutamise lähteandmete panga koostamine. Lõpparuanne”, Department of Roads of Tallinn University of Technology, Tallinn 2003

Traffic management on Tallinn ring road 54
Roads of Tallinn University of technology in 200324. This data has been updated in
subsequent years in accordance with economic changes.
Table 10.7. Division of the number of passengers in a vehicle and the objective of travels
Type of data Type of vehicle*
PCV TB RT
Passengers per vehicle in the city of Tallinn
1.4 20.0 1.2
Passengers per vehicle on Tallinn ring road
1.5 4.0 1.2
Proportion of travels regarding the commute to work
25% 80% 100%
Proportion of leisure time travels 75% 20% 0% * - type of vehicle in accordance with the types set out in the Road Register
10.4.2. Increased Time Expenditure due to an Accident
Traffic obstructions arising from an accident create an additional time expenditure for other
road users, the size of which is largely dependent on the severity level of the accident, how
fast alternative traffic schemes are implemented and how operatively additional notification
of road users is carried out. In order to analyse accidents that occur on Tallinn ring road, an
additional time expenditure depending on the severity of the accident has been calculated
for each alternative and it has been compared with the additional time expenditure of the
baseline alternative. Since traffic volume, i.e. number of road users, changes annually, the
additional time expenditure arising from an accident also differs every year.
Table 10.8. Additional time expenditure arising from an accident and its decline compared to
the baseline alternative
Order No.
Road section
Length, km
Analysis alternative
Cost of additional time arising from an accident,
euro
The decline of additional time expenditure arising from an accident compared to the
baseline alternative, euro
In 2019 In 2034 In 2019 In 2034
1 Highway No. 11 SEC_1
3.700
OPT_0 2,947 9,131 – –
OPT_1 2,573 8,572 374 560
OPT_2 1,224 4,458 1,724 4,674
OPT_3 776 3,027 2,172 6,105
2 Highway No. 11 SEC_2
1.143
OPT_0 1,362 3,208 – –
OPT_1 1,239 3,031 122 177
OPT_2 652 1,648 710 1,561
OPT_3 450 1,161 912 2,047
3 Highway 3.574 OPT_0 2,694 8,862 – –
24 Koppel, M., HDM-4 evitamiseks vajalike liikluskulude arvutamise lähteandmete panga koostamine. Lõpparuanne. Department of Roads at Tallinn University of Technology 2003

Traffic management on Tallinn ring road 55
Order No.
Road section
Length, km
Analysis alternative
Cost of additional time arising from an accident,
euro
The decline of additional time expenditure arising from an accident compared to the
baseline alternative, euro
In 2019 In 2034 In 2019 In 2034
No. 11 SEC_3
OPT_1 2,282 8,293 412 570
OPT_2 1,043 4,308 1,651 4,554
OPT_3 639 2,925 2,055 5,938
4 Highway No. 11 SEC_4
2.983
OPT_0 3,235 8,212 – –
OPT_1 3,083 7,847 152 365
OPT_2 1,663 4,187 1,572 4,026
OPT_3 1,157 2,928 2,078 5,285
5 Highway No. 11 SEC_5
3.930
OPT_0 12,999 53,611 – –
OPT_1 12,850 53,340 149 272
OPT_2 6,885 29,278 6,114 24,333
OPT_3 4,748 20,723 8,251 32,888
6 Highway No. 11 SEC_6
3.380
OPT_0 2,959 13,013 – –
OPT_1 2,629 12,619 330 394
OPT_2 1,239 6,677 1,720 6,336
OPT_3 774 4,572 2,185 8,441
7 Highway No. 11 SEC_7
5.540
OPT_0 4,963 15,490 – –
OPT_1 4,780 15,224 183 266
OPT_2 2,391 8,017 2,572 7,473
OPT_3 1,555 5,450 3,408 10,040
8 Highway No. 11 SEC_8
1.950
OPT_0 1,295 7,464 – –
OPT_1 1,144 7,232 151 232
OPT_2 575 3,931 720 3,533
OPT_3 384 2,756 911 4,708
9 Highway No. 11 SEC_9
6.190
OPT_0 2,684 11,386 – –
OPT_1 2,290 10,863 394 523
OPT_2 1,023 5,665 1,661 5,722
OPT_3 667 3,940 2,017 7,447
10 Highway No. 11 SEC_10
5.770
OPT_0 6,685 16,479 – –
OPT_1 6,212 15,816 473 663
OPT_2 3,039 8,231 3,647 8,248
OPT_3 2,055 5,715 4,630 10,764
TOTAL: 38.160
OPT_0 41,823 146,858 – –
OPT_1 39,083 142,837 2,740 4,021
OPT_2 19,734 76,399 22,089 70,459
OPT_3 13,206 53,196 28,617 93,662
10.5. Travel Speed
Changes in travel speed have a direct impact on the costs of road users. With the increase in
speed, operational costs of vehicles increase, whereas time expenditure decreases. The
permitted speed limit regimes on Tallinn ring road concerning the options analysed are set
out in Table 10.9.
It has been estimated that the current situation will be maintained in alternative options
OPT_0 and OPT_1, under which the permitted speed limit is generally at 90 km/h for one
half of the year and 110 km/h for the other half. In case of alternative options OPT_2 and
OPT_3, the overall permitted speed limit is somewhat higher, since variable-message speed
limit signs have been implemented, allowing to also permit a higher speed limit during

Traffic management on Tallinn ring road 56
wintertime if the weather conditions are favourable and do not impact the level of traffic
safety. The exception is the road section from Saue entrance up to Keila where the
differences in speed limits in regard to various alternatives are less significant on the road
section with a 1+1 cross-section.
Table 10.9. Average annual permitted speed limit on Tallinn ring road for alternatives
analysed
Road section
Average annual permitted speed limit for alternative analysed, km/h
OPT_0 OPT_1 OPT_2 OPT_3 Highway No. 11 SEC_1 – Highway No. 11 SEC_9
95 95 105 105
Highway No. 11 SEC_10 85 85 90 90
Actual travel speed, which HDM-4 takes into account in the analysis, is different from these
numbers and dependent on the type of vehicle, width of the carriageway, traffic density on a
certain road section, etc. Figure 10.1 includes an example of travel speeds of various types of
vehicles on road section SEC_1 in the case of alternative options OPT_0 and OPT_2.
Figure 10.1. Travel speeds of different types of vehicles on road section SEC_1 in case of
alternative options OPT_0 and OPT_2
10.6. Exhaust Gases
The movement of vehicles generates exhaust gas which, in turn, gives rise to various
expenditure and health damages to the society, damages to building materials, damages to
agriculture and the natural environment in general. Health-related costs are considered as
the largest expenditure category.
Changes in the travel speed of vehicles affect the amount of exhaust gases emitted into the
air by vehicles. Increase in the average travel speed also increases the amount of exhaust
gases and vice versa. The vehicle description module of HDM-4 software also includes
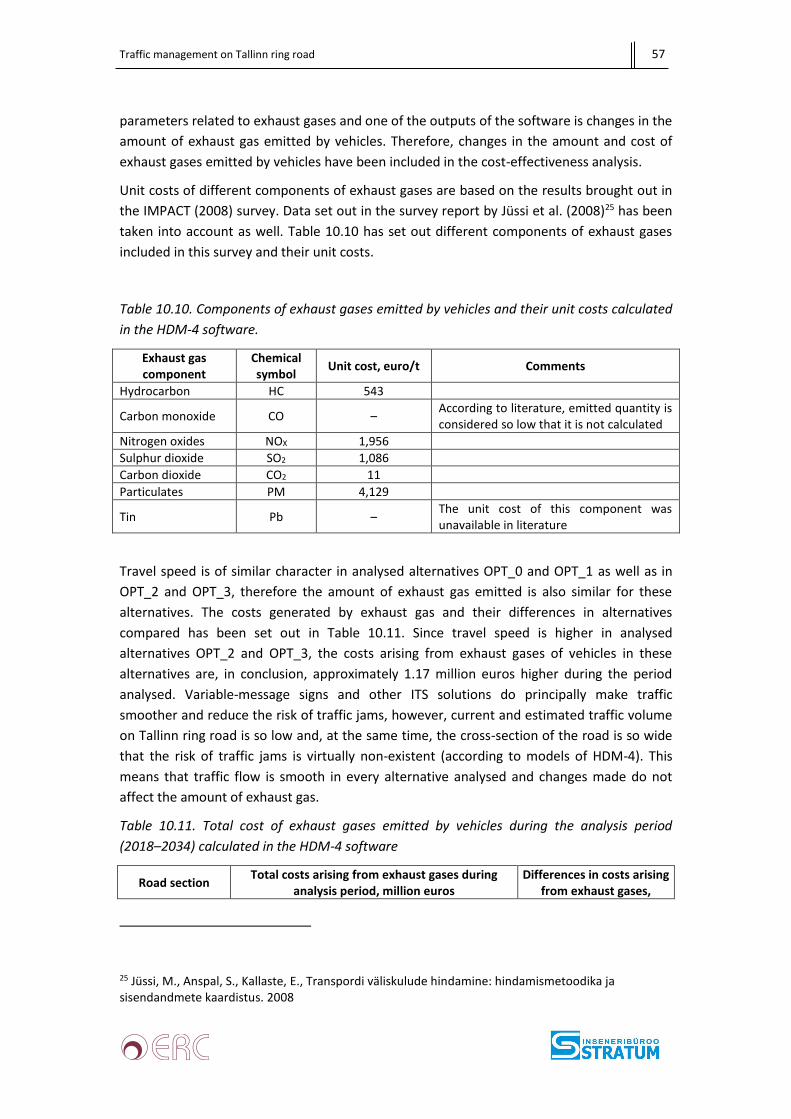
Traffic management on Tallinn ring road 57
parameters related to exhaust gases and one of the outputs of the software is changes in the
amount of exhaust gas emitted by vehicles. Therefore, changes in the amount and cost of
exhaust gases emitted by vehicles have been included in the cost-effectiveness analysis.
Unit costs of different components of exhaust gases are based on the results brought out in
the IMPACT (2008) survey. Data set out in the survey report by Jüssi et al. (2008)25 has been
taken into account as well. Table 10.10 has set out different components of exhaust gases
included in this survey and their unit costs.
Table 10.10. Components of exhaust gases emitted by vehicles and their unit costs calculated
in the HDM-4 software.
Exhaust gas component
Chemical symbol
Unit cost, euro/t Comments
Hydrocarbon HC 543
Carbon monoxide CO – According to literature, emitted quantity is considered so low that it is not calculated
Nitrogen oxides NOX 1,956
Sulphur dioxide SO2 1,086
Carbon dioxide CO2 11
Particulates PM 4,129
Tin Pb – The unit cost of this component was unavailable in literature
Travel speed is of similar character in analysed alternatives OPT_0 and OPT_1 as well as in
OPT_2 and OPT_3, therefore the amount of exhaust gas emitted is also similar for these
alternatives. The costs generated by exhaust gas and their differences in alternatives
compared has been set out in Table 10.11. Since travel speed is higher in analysed
alternatives OPT_2 and OPT_3, the costs arising from exhaust gases of vehicles in these
alternatives are, in conclusion, approximately 1.17 million euros higher during the period
analysed. Variable-message signs and other ITS solutions do principally make traffic
smoother and reduce the risk of traffic jams, however, current and estimated traffic volume
on Tallinn ring road is so low and, at the same time, the cross-section of the road is so wide
that the risk of traffic jams is virtually non-existent (according to models of HDM-4). This
means that traffic flow is smooth in every alternative analysed and changes made do not
affect the amount of exhaust gas.
Table 10.11. Total cost of exhaust gases emitted by vehicles during the analysis period
(2018–2034) calculated in the HDM-4 software
Road section Total costs arising from exhaust gases during
analysis period, million euros Differences in costs arising
from exhaust gases,
25 Jüssi, M., Anspal, S., Kallaste, E., Transpordi väliskulude hindamine: hindamismetoodika ja sisendandmete kaardistus. 2008

Traffic management on Tallinn ring road 58
OPT_0 and OPT_1 OPT_2 and OPT_3 thousand euros
Highway No. 11 SEC_1
7.05 7.18 130.1
Highway No. 11 SEC_2
2.18 2.22 40.1
Highway No. 11 SEC_3
6.93 7.06 133.6
Highway No. 11 SEC_4
5.64 5.74 99.4
Highway No. 11 SEC_5
9.25 9.41 160.1
Highway No. 11 SEC_6
6.53 6.63 102.7
Highway No. 11 SEC_7
10.10 10.24 138.5
Highway No. 11 SEC_8
3.77 3.82 50.7
Highway No. 11 SEC_9
9.61 9.78 171.7
Highway No. 11 SEC_10
5.83 5.97 142.5
TOTAL 66.88 68.05 1,169.4

Traffic management on Tallinn ring road 59
10.7. Cost of ITS Equipment
A substantial component of the cost of the cost-effectiveness analysis is the cost of ITS
equipment as well as the cost of its instalment, maintenance and operation. The data used
in the analysis regarding said costs is based on information received from the Road
Administration and suppliers of such equipment. The cost of equipment has been
generalised in this survey, since specific cost of equipment as well as the cost of
maintenance shall be determined during public procurements.
Unit costs of ITS equipment and its maintenance used in the cost-effectiveness analysis have
been set out in Table 10.12.
Table 10.12. Unit cost of ITS equipment and its cost in the cost-effectiveness analysis
Type of ITS equipment
Cost of equipment* along with instalment costs, euro
Annual maintenance
and operation cost of the
equipment**, euros per year
Need for ITS equipment, qty
Cost of ITS equipment, euro
OPT_2 OPT_3 OPT_2 OPT_3
Traffic camera, surveillance
6,000 300 11 11 66,000 66,000
Traffic camera, automatic incident detection station (AID)
60,000 3,000 – 4 – 240,000
Variable-message warning and speed limit sign (VWS+VSL)
12,000 600 56 56 672,000 672,000
Variable-message sign (VMS)
45,000 2,250 – 15 – 675,000
Road traffic information station, full set
25,000 1,250 4 4 100,000 100,000
Traffic counting station 7,000 350 2 2 14,000 14,000
TOTAL COST OF ITS EQUIPMENT: 852,000 1,767,000
OTHER COSTS (design, unexpected, etc.) 20%: 170,400 353,400
TOTAL INVESTMENT: 1,022,400 2,120,400
INVESTMENT WITH VAT: 1,226,880 2,544,480
ANNUAL MAINTENANCE COST OF ITS EQUIPMENT (along with other costs) without VAT:
53,250 110,438
ANNUAL MAINTENANCE COST OF ITS EQUIPMENT (along with other costs) with VAT:
63,900 132,525
* the cost displayed is without VAT and is an estimate, the exact price of the equipment will be determined as a result of a public procurement and can therefore differ from figures cited herein ** the annual maintenance cost is regarded at 5.0% of the cost of the equipment

Traffic management on Tallinn ring road 60
10.8. Results of the Cost-effectiveness Analysis
The objective of the cost-effectiveness analysis is to compare alternatives analysed with the
current situation and determine the economic impact of investments to be made on society
in order to find the most cost-effective option. Compliance with efficiency criteria is
evaluated by comparing the impact of ITS solutions on the traffic safety and traffic flow on
Tallinn ring road and the amount of savings accrued by society as a result of this with the
expenditure. This cost-effectiveness analysis consists of the comparison of three alternative
scenarios with the baseline alternative. HDM-4 output reports of cost-effectiveness analyses
have been set out in Annex 4.
The analysed options have undergone sensitivity analysis with the aim of monitoring the
impact of input variables on the socio-economic profitability of the alternatives. The
selection of variables for the analysis was based on the results of the specific cost-
effectiveness analysis and the experience of consultants and the analysis includes the
following scenarios:
• Scenario 1 – changes in investment costs are relatively normal and therefore it is
important to analyse its impact on the results of the cost-effectiveness analysis. This
analysis has addressed a possibility where the investment made becomes 50% more
expensive;
• Scenario 2 – the forecast of the change in traffic volume is an important input
parameter in the cost-effectiveness analysis, however, it is difficult to predict. This
analysis has addressed a possibility where the increase of traffic volume is 40%
lower than expected;
• Scenario 3 – changes in traffic safety have a significant impact on the end-results of
the cost-effectiveness analysis, however, it is difficult to predict since there is not
enough statistics on the topic and relevant models have not yet been developed.
This analysis has addressed a possibility where the benefit from the decrease of
traffic accidents is 30% lower than expected.
The summary of the results of analysed alternatives in the cost-effectiveness and sensitivity
analyses are set out in Table 10.13. The following can be concluded from the results of the
analyses conducted:
• implementation of both analysed alternatives OPT_2 and OPT_3 on Tallinn ring road
is economically beneficial. OPT_2 displays a better cost/benefit ratio (2.8) of the
alternatives analysed, difference with OPT_3 is remarkable (cost/benefit ratio 2.0);
• the number of traffic accidents and its change in the period analysed has the
greatest, i.e. the most significant, impact on the results of different alternatives in
the cost-effectiveness analysis. The result of analysed alternative OPT_2 will turn
negative in case the benefit from the decrease of traffic accidents decreases over
55%. The result of analysed alternative OPT_3 will turn negative in case the benefit
from the decrease of traffic accidents decreases over 47%;
• appreciation of investments has a far less significant (moderate) impact on the
results of the analysis, in the case that investment costs increase by 2.5 times (HDM-
Traffic management on Tallinn ring road 61
4 software does not permit to analyse a greater increase), the result of both
analysed alternatives OPT_2 and OPT_3 will still remain positive, i.e. benefit/cost
ratio will remain over 1.0;
• change in traffic volume has little impact on the results of the analysis. It would have virtually no impact on the results if the estimated change in traffic volume were to be smaller than predicted, even in case there is no growth in traffic (growth is 0% over analysis period), the benefit/cost ratio of both analysed alternatives OPT_2 and OPT_3 would still remain over 1.0.

Traffic management on Tallinn ring road 62
Table 10.13. Results of alternatives analysed in cost-effectiveness and sensitivity analyses
Alternative analysed and its description
Analysis period, years
present value, million euros
Total net present value of costs (NPV
of costs), million euros
Total net present value of benefits
(NPV of benefits), million
euros
Total net present value (NPV), million
euros
Economic internal rate of return
(EIRR), %
Benefit/cost ratio
Benefit/cost grade
(ROSEBUD WP5, 2005)
ITS equipment Benefit/cost of vehicles and road
users
Investment Maintenance
costs Road user
Travel time
Traffic accidents
Time of TA and exhaust gases*
BASELINE SCENARIO
OPT_1 – only traffic schemes are used
15 0.04 0.00 0.00 0.00 0.00 0.04 0.04 0.04 0.00 3.7% 1.00
Acceptable OPT_2 – use of ITS equipment on a smaller scale
15 0.97 0.62 -3.88 3.35 5.35 -0.30 1.59 4.52 2.93 26.0% 2.84
OPT_3 – full use of ITS equipment
15 2.01 1.29 -3.88 3.35 7.45 -0.12 3.30 6.80 3.50 18.2% 2.06
SCENARIO 1 IN SENSITIVITY ANALYSIS – appreciation of investment costs by 50%
OPT_1 – only traffic schemes are used
15 0.06 0.00 0.00 0.00 0.00 0.04 0.06 0.04 -0.02 -0.6% 0.67 Poor
OPT_2 – use of ITS equipment on a smaller scale
15 1.45 0.62 -3.88 3.35 5.35 -0.30 2.07 4.52 2.45 17.7% 2.18
Acceptable
OPT_3 – full use of ITS equipment
15 3.01 1.29 -3.88 3.35 7.45 -0.12 4.30 6.80 2.50 11.6% 1.58
SCENARIO 2 IN SENSITIVITY ANALYSIS – growth after traffic forecast is 40% lower than expected
OPT_1 – only traffic schemes are used
15 0.04 0.00 0.00 0.00 0.00 0.04 0.04 0.04 0.00 3.7% 1.00
Acceptable OPT_2 – use of ITS equipment on a smaller scale
15 0.97 0.62 -3.50 3.00 4.83 -0.30 1.59 4.03 2.44 23.8% 2.53
OPT_3 – full use of ITS equipment
15 2.01 1.29 -3.50 3.00 6.73 -0.12 3.30 6.11 2.81 16.3% 1.85
SCENARIO 3 IN SENSITIVITY ANALYSIS – benefit arising from the decline in traffic accidents decreases by 30%
OPT_1 – only traffic schemes are used
15 0.04 0.00 0.00 0.00 0.00 0.04 0.04 0.04 0.00 3.7% 1.00
Acceptable OPT_2 – use of ITS equipment on a smaller scale
15 0.97 0.62 -3.88 3.35 3.74 -0.30 1.59 2.91 1.32 14.9% 1.83
OPT_3 – full use of ITS 15 2.01 1.29 -3.88 3.35 5.21 -0.12 3.30 4.56 1.26 9.7% 1.38

Traffic management on Tallinn ring road 63
equipment
* – the value displayed includes the additional time expenditure due to traffic accidents as well as the cost of exhaust gas emitted by vehicles (values have been used in the analysis as other
external benefits/costs)

Traffic management on Tallinn ring road 64
11. SUMMARY
The objective of this survey is the development of the traffic management solution for
Tallinn ring road on national main road No. 11 (E265).
The survey provided an overview and assessment on continuous operation plans, described
possible accident scenarios and utilised the traffic model to determine the probability of
traffic jams and its possible locations. The content of continuous operation plans must
comply with the requirements set out in the regulation, however, it is recommended to also
prepare a short specific code of conduct for resolving crisis situations.
As of now, several sections of Tallinn ring road have been constructed into a two-
carriageway highway, whereas other road sections are still being designed or are under
construction. This survey has considered a situation where the ring road has been
constructed into a two-carriageway highway by 2019, starting from Väo interchange and
ending with Kanama interchange (Valingu overpass is likely to be added). The section from
Kanama interchange to Keila is regarded to have 1+1 lanes.
Traffic volume on Tallinn ring road has grown 36% in the last 10 years, whereas the number
of road trains has doubled on average (there is a similar situation on highway No. 4 Tallinn–
Pärnu–Ikla). The most critical period in the sense of traffic volume is on working days
between 16.00 and 18.00.
Traffic volume on Tallinn ring road is most affected by possible development activities in
nearby areas. It is clear that such developments are mostly affected by the economic
situation and various plans will be put to work/continued as the economic environment
improves. The construction of the so-called small Tallinn ring road is sure to have a
significant impact on the traffic volume on Tallinn ring road, however, its time of realisation
is still unknown.
Possible bypass routes were prepared for the possible occurrence of traffic obstructions,
involving three different levels (one lane closed, one direction closed, both directions
closed). In case of several bypass routes, it must be taken into consideration that they have
to be suitable for heavy traffic as well, which entails prior reconstruction. Bypass schemes
form a basis for preparing detailed traffic management projects for temporary rerouting of
traffic in the future.
Probability of possible traffic jams and impact on the traffic flow of other highways in case of
rerouting has been analysed via modelling software Citilabs Cube Voyager and the traffic
modelling has been conducted on the basis of the traffic model of an evening peak period.
The model has been used to create maps that show the capacity and bottlenecks of bypass
routes.
The part of surveillance and traffic management systems has mainly addressed equipment
that is essential in regard to the traffic management of Tallinn ring road (and nearby areas in
the future). It is firstly recommended to install surveillance and warning systems and
Traffic management on Tallinn ring road 65
thereafter also variable-message information boards for dynamic management of traffic
flows.
Three different scenarios have been prepared for the cost-effectiveness analysis regarding
feasibility of dynamic traffic management, which are compared with the baseline alternative
(continuation of current situation where investments are not made):
• alternative option 1 (OPT_1) – traffic schemes and management is implemented in
case of a traffic or other accident, but ITS solutions and dynamic traffic management
solutions are nonexistent;
• alternative option 2 (OPT_2) – traffic schemes have been set in place for resolving
traffic or other accidents in the event that they occur and in addition to this, traffic
flow is managed and road users are warned via variable-message warning and speed
limit signs (VWS+VSL), which have been installed on Tallinn ring road;
• alternative option 3 (OPT_3) – in addition to variable-message warning and speed
limit signs, Tallinn ring road and intersecting major roads have also been equipped
with (VMS+VWS) variable-message traffic control devices.
The objective of the cost-effectiveness analysis is to compare alternatives analysed with the
current situation and determine the economic impact of investments to be made on society
in order to find the most cost-effective option. The summary of the results of the analysis
conducted is brought out in chapter 10.8.
During preparation of a dynamic traffic management system, it is recommended to, first and
foremost, consider traffic volume and risk level, which enables to receive the greatest
benefits form implementing ITS equipment. In the context of the first approach, it is
reasonable to install necessary ITS equipment on the two-carriageway road sections that are
already completed and continue this in stages in accordance with the completion of
reconstruction works on road sections of Tallinn ring road.
Other recommendations
In regard to road sections that have yet to be designed (from Kanama interchange to Keila),
the contracting entity is recommended to include the requirement regarding readiness for
installing ITS equipment into the terms and conditions of the design procurement (i.e. the
plan has to include the possibility of installing necessary ITS equipment in the future).