Embed Size (px)
Citation preview
DISCUSSION PAPER PI-0412
Employee Saving and Investment Decisions in Defined Contribution Pension Plans: Survey Evidence from the UK Alistair Byrne September 2004 ISSN 1367-580X The Pensions Institute Cass Business School City University 106 Bunhill Row London EC1Y 8TZ UNITED KINGDOM http://www.pensions-institute.org/

Employee Saving and Investment Decisions in Defined Contribution Pension Plans: Survey Evidence from the UK Alistair Byrne*
Abstract:
In recent years there has been a significant shift in retirement income provision in the UK
from the situation where employers offer defined benefit pensions, to one where defined
contribution schemes are more common. This follows similar trends in the US. In a DC
scheme the individual employee bears the risk the pension contributions – and the
investment returns they earn – are sufficient to fund their retirement. The growing
literature of ‘behavioural economics’ raises important questions about the ability of most
employees to make the strategic investment decisions required by DC schemes. This
paper uses data from a survey of the members of a mid-sized UK DC pension scheme to
explore the attitudes and knowledge of individual employees faced with saving and
investment choices in their pension plan. The results are broadly consistent with previous
US findings in that many employees show limited knowledge and interest in their
pension arrangements. The key difference is that the UK scheme members do not appear
to have the enthusiasm for own-company stock often found in the US. The UK scheme
members also display a high level of conviction that owning property is a better means of
providing for retirement than investing in financial assets.
Keywords: Pensions; Defined contribution; Behavioural Economics; Survey data. * Department of Accounting and Finance University of Strathclyde 100 Cathedral Street Glasgow G4 0LN United Kingdom E-mail: [email protected] The author is grateful to the trustees and members of the pension scheme that participated in the survey, Michelle Cracknell and colleagues at Advisory and Brokerage Services Ltd, Stephen Greenstreet, Stewart Ritchie, and Keith Robinson for help in arranging the survey, and to colleagues at the University of Strathclyde for helpful suggestions on the paper. Stephen Titterington provided excellent research assistance. Funding from Strathclyde Business School Faculty Research Fund and the UK Actuarial Profession is gratefully acknowledged.
Employee Saving and Investment Decisions in Defined Contribution Pension Plans:
Survey Evidence from the UK
1. Introduction
Most occupational pension plans operate on either a defined benefit (“DB”) or a defined
contribution (“DC”) basis.1 In recent years there has been a significant shift in retirement
income provision in the UK from the situation where employers offer DB schemes, to a
situation where DC schemes are more common (e.g. NAPF 2003). This follows a similar
trend in the US (e.g. Friedberg and Owyang 2002).
Saving for retirement is a complex task and the stakes – ensuring an adequate income in
retirement - are high. The move from DB to DC pensions puts much more responsibility
into the hands of the individual participants, principally in terms of how much to save and
how to invest the resulting funds. There is evidence that many people struggle to deal
with this greater responsibility. For example, the US Retirement Confidence Survey
(EBRI 2003) reports only 37% of respondents had tried to calculate how much money
they should save for retirement. A survey of US DC pension plan participants conducted
by the John Hancock insurance company (2003) found 42% of the respondents said they
had little or no investment knowledge.
Survey evidence that many people struggle to understand and deal with the choices they
face when saving for retirement is consistent with the principles of behavioural
economics, which suggest individuals often do not make decisions in the rational, well-
informed and unbiased manner assumed by standard economic theory. Mullainathan and
Thaler (2000) argue the notion that economic agents are calculating, unemotional
maximisers (“homo economicus”) is incorrect and that more accurate descriptions of
actual behaviour can yield better predictions of economic systems. They claim there are
‘bounds’ to human rationality, self-control and self-interest.
1

Simon (1955) coined the term ‘bounded rationality’ to describe human problem solving
abilities. Limits on intelligence and time mean economic agents cannot be expected to
solve problems optimally. Experimental evidence suggests most people use rules of
thumb (or “heuristics”) to cope with the limits of their abilities and these heuristics can –
in certain contexts – lead to systematic errors in decision-making (Kahneman & Tversky
1974). Mullainathan and Thaler (op. cit.) also argue many individuals have “bounded self
control”. Standard theory assumes once someone has worked out the optimal choice they
will follow through with that course of action. Behavioural economics suggests even
when the ‘right thing to do’ is apparent, people may fail to do it for reasons of self-
control - “Most of us at some point have eaten, drank or spent too much, and exercised,
saved and worked too little.” Finally, most individuals are “boundedly selfish” – and fail
to pursue their own self-interest to the extent normally assumed of homo economicus.
These behavioural limitations have implications for the study of economic decision-
making and are relevant to the question of saving for retirement. Mitchell and Utkus
(2003) note “being good at retirement saving” requires accurate estimates of uncertain
quantities such as lifetime earnings, asset returns, tax rates, health status and longevity.
Casual inspection of models designed to help with this problem such as those proposed
by Blake et al (2001) and Hibbert and Mowbray (2002) show the calculations are far
from trivial and many of the parameters highly uncertain.
Motivated by the existing behavioural economics literature, this paper uses data from a
survey of the members of a mid-sized UK DC pension scheme to explore the attitudes
and knowledge of individual employees faced with saving and investment choices in their
pension plan. The main contribution of the paper is to compare and contrast UK case
study evidence with existing US findings, including analysis of areas where there are
differences between the UK and the US in the structure of DC pensions.
The remainder of the paper is organised as follows. Section 2 reviews the previous
literature on employee decision making in DC pension schemes. Section 3 describes the
2
survey method, while Section 4 provides the survey results and analysis. Section 5
concludes.
2. Previous Literature on DC Pensions
DC pension schemes typically offer members some degree of investment choice and
many offer an extensive range of funds for members to invest in. Bernartzi and Thaler
(2002) question whether this expanded investment choice does, in fact, provide benefits.
Their study found that when investors were shown the likely retirement income
consequences of their chosen fund portfolio and those of the median investor’s portfolio,
most expressed a preference for the median portfolio. They argue the results suggest
investor autonomy is “not worth much” and that most investors do not have well-defined
preferences.
Samuelson and Zeckhauser (1988) discuss what they call the “status quo bias” in
decision-making. They note the standard rational choice model holds that only
preference-relevant features should affect decisions, but in the ‘real world’ choices often
have influential labels attached to them, such as the notion of the status quo - i.e. the
option to do nothing, or to endorse a previous choice. They find that despite an average
tenure of 12 years, only 28% of participants in the 850,000-member TIAA/CREF
retirement scheme had ever changed the asset allocation of their pension fund and that
new entrants to the plan tend to choose a somewhat different asset allocation to similar-
aged incumbents who have ‘grown up’ within the scheme. They attribute the status quo
bias to a number of well-documented behavioural traits including framing, loss aversion,
anchoring, and regret avoidance.
There is also significant evidence that investors with DC pension plans display attitudes
to risk and portfolio construction that are at odds with accepted investment principles. For
example, Bernartzi and Thaler (1999) document that DC pension plan investors seem to
suffer from myopic loss aversion, seeking to avoid short-term losses, despite the long
time horizon usually involved in planning for retirement. There is also evidence that the
3
balance of funds on offer unduly influences employees’ choice of asset allocation in DC
plans. Bernartzi and Thaler (2001) find that where there is a high ratio of equity funds
relative to bond funds, plan participants tend to have higher than average allocations to
equities. In an experimental setting they also find support for the existence of a “1/n
diversification heuristic” which leads participants to split their contributions equally
amongst the ‘n’ funds on offer, with little regard to the underlying asset composition of
the funds.
Perhaps one of the most worrying aspects of the US DC pension market is the high level
of investment in own company stock amongst employees in larger plans. Portfolio theory
teaches the benefits of diversification, but a significant number of members’ plans have
high concentrations in a single stock – that of the member’s employer. Bernartzi (2001)
finds about a third of assets in large DC retirement savings plans are invested in company
stock and about a quarter of employees’ discretionary contributions are invested that way.
He describes the strategy as “dubious”, particularly as the stock is correlated with the
employees’ labour income and future employment prospects. The tendency to invest in
own company stock is found to be strongest where the past returns on that stock are high,
but there is no evidence the future returns of these “winner” stocks are strong enough to
justify the high level of investment. VanDerhei (2002) notes that the percentages invested
in company stock are partly explained by the requirement in some schemes for employer
contributions to be invested in company stock. On the other hand, Bernartzi (op. cit.),
Liang and Weisbenner (2002), and Mitchell and Utkus (2002) all find significant
numbers of employees voluntarily holding high proportions of company stock in their
401(k) accounts.
John Hancock (2003) and Bernartzi (op. cit.) both find that employees do not view their
employer’s stock as being particularly risky. Bernartzi finds that only 16% of plan
participants realise that company stock is riskier than the overall stock market, while the
respondents in the John Hancock survey rate own company stock at 3.1 on a scale of 1-5,
where 5 is “very high risk”, compared with 3.6 for diversified stock funds. Huberman
(2001) argues that the pension scheme members prefer to “invest in the familiar”.
4
Bernartzi (op. cit.) also argues that high voluntary allocations to company stock where
the employer makes matching contributions in stock are consistent with an “endorsement
effect” whereby the employees take the form of the matching contributions as implicit
investment advice.
The studies discussed above provide significant evidence that the investment strategies
employed in self-directed retirement plans are often at odds with standard investment
theory and suggest this can be explained, at least in part, by well-documented behavioural
biases. While much of the evidence is based on experimental work, survey data, or
relatively small samples, the consistency of the findings creates a convincing overall
picture. The following sections add to the picture by considering evidence from the UK.
3. Survey Outline
Data on the attitudes and knowledge of UK DC pension scheme members was collected
by sending a questionnaire to the members of a mid-sized occupational pension scheme.
The pension scheme that participated in the survey (hereafter “the scheme”) is sponsored
by a long-established professional services company based in the South-East of England,
which is now a subsidiary of a US listed company.
The scheme is set up on an occupational money purchase basis, with a board of trustees
overseeing the affairs on behalf of members. As at 31/12/03 it had a total of 1118
members, of which 484 were “active” members still employed by the company and the
remaining 634 were “deferred” members no longer employed by the company, but with
preserved pension rights. The total assets of the scheme at 31/03/03 amounted to £17.5m.
Membership of the pension scheme is open to all permanent employees working more
than 15 hours a week and to all temporary employees with contracts of 6 months or
longer. The minimum employee contribution is 4.5% of salary, with the employer
contributing an additional 6.0%. The scheme is not contracted out of the second state
pension.
5
Employees have a choice of three main investment options, graded according to risk. The
“Aggressive” option (Fund A) is approximately 90% equity and 10% fixed interest, while
the “Balanced” option (Fund B) is 80% equity and 20% fixed interest, and the
“Conservative” option (Fund C) is 65% equity and 35% fixed interest. Fund B is the
default option, which is adopted if the employee does not make a choice. The same fund
manager manages all three funds. Additionally, members over the age of 50 have the
option of investing all or part of their assets in a fund that is 100% fixed interest.
However, there is no automatic ‘lifestyle’ option that will switch assets as the member
approaches retirement.
All members have the option to make additional voluntary contributions up to applicable
legislative limits. These may be contributed to the main scheme investment options, to a
chosen range of externally managed funds, or to a freestanding AVC arrangement of the
member’s choice.
The distribution of scheme assets at 31/03/03 is shown in Table 1.
[Table 1 here]
The survey questionnaire was sent out at the end of 2003 along with each member’s
statutory money purchase illustration – a mandatory projection of likely retirement
income sent to all DC pension scheme members each year by their scheme. A covering
letter from the scheme’s senior trustee asked for the member’s help in completing the
questionnaire, but no inducement was offered and no deadline set for return. The
questionnaire asked about retirement income expectations and savings rates in the context
of existing evidence that many people struggle to save enough for retirement (Laibson et
al 1998, Thaler and Bernartzi 2004). It also asked a number of questions about
investment preferences and knowledge, similar in nature to those used by John Hancock
(2003) in the US. Finally, the questionnaire also collected basic portfolio, pension
contribution and demographic information.2
6
A total of 161 useable responses were received, representing a response rate of 14.4%.
The response rate for active members was higher at 19.0%. In the context of a consumer
survey using a lengthy questionnaire (5 pages) on what many people regard as a ‘dry’
subject, this can be argued to be a reasonable response rate.
A breakdown of the characteristics of the membership of the scheme and the
corresponding figures for the respondents are shown in Table 2. The nature of the firm
means the membership of the pension scheme has certain biases relative to the general
working population. In particular, it is predominantly male (78%), older (average age
43.5 years) and more highly paid (average salary of active members of £35,000) than the
UK working population at large.3
[Table 2 here]
In turn, the respondent group has certain biases relative to the overall membership of the
scheme. The respondents are mainly males (89%) who on average are 2.2 years older and
earn £4,300 per annum more than the typical scheme member. The potential implications
of the demographic profile of the scheme and the respondents for the interpretation of the
results are discussed later in the paper.
4. Survey Results
4.1 Retirement Expectations:
Most respondents expect to retire at either 60 or 65 and to rely mainly on their
occupational pension(s) to provide a retirement income of between 50% and 74% of their
current income. (Data not reported) However, there are also a significant number of
respondents who expect a retirement income of less than half the amount they currently
earn. Few respondents expect to defer retirement beyond age 65, despite media
commentary about the effects of longevity and the need for many employees to work
7
later in life to ensure an adequate retirement income. (e.g. ‘Bin it; Retirement’ The
Economist, 14 December 2002) The respondents’ retirement expectations should be
viewed in the context of the savings rate data discussed in section 4.3 below.
4.2 Advice:
One way in which employees may be able to avoid making inappropriate choices in their
DC pension schemes is to take advice. However, only 59% of respondents report having
received advice about their pension. It is more common for older and higher earning
respondents to report having had advice. The proportion of respondents over age 50 who
have had advice is 69%, compared to 52% of those under 50. The chi-square statistic for
the difference is 4.90, which is significant at the 5% level. (df = 1; p-value = 0.027)
Similarly, the proportion of respondents earning over £40,000 who report having had
advice at 72% significantly exceeds the proportion (45%) of those earning less than
£40,000 (chi-square = 11.15; df = 1; p = 0.001).
Of those who have received advice, the most common source relied on was an
independent financial adviser – 73% had relied on advice from an IFA at least
“moderately”. (Table 3) The next most common source of advice was the member’s
employer, with 55% of those having received advice relying on this source at least
moderately. It is perhaps unsurprising that so many people report relying on their
employer in this way, but also worth noting that the employer will not have been
authorised to provide advice as defined by the Financial Services and Markets Act 2000.
It is more likely that the employer provided generic information, rather than advice
tailored to the specific circumstances of the member.
[Table 3 here]
Relatively few respondents report having relied on other sources of advice. For example,
only one third of respondents report relying at least moderately on advice from friends
and family members or from TV and newspaper articles, while even fewer relied on
8
financial services companies. Again, the point must be made that some of these sources
will have provided generic information rather than specific advice. While the UK
Government has recently announced intentions to develop an online pensions planning
tool (DWP 2004), few respondents have made much use of what is already available on
the Internet. Of the respondents who had received advice, 79% had not relied on an
online source at all and only 16% had relied on an online source at least moderately.
There is some evidence that advice influences members’ opinions about retirement
saving.4 In a number of cases responses differ significantly between the group that has
received advice and the group that has not. Those who have had advice are more likely to
have calculated the amount they need to save for retirement and to report the
corresponding figure as being above 10% of salary. There are fewer significant
differences in terms of responses to the investment questions. The differences – and chi-
square tests where relevant - are reported in more detail in the corresponding sections
below.
4.3 Saving Levels:
The move from DB to DC raises important questions about whether employees are
saving enough for retirement – in contrast to DB where the likely pension in relation to
final salary is often quite clear. However, more than half report they have never tried to
work out how much they need to save for retirement or that they have tried to do this, but
were unable to work it out (45% and 8% respectively). (Table 4) This is consistent with a
relatively high proportion of respondents not having received advice about their pension.
The balance of responses varies significantly between those who have received advice
and those who have not: only 26% of the former group have not tried to calculate how
much they need to save, but the corresponding figure for the latter group is 78% (chi-
square = 30.39; df = 1; p-value = 0.000).
[Table 4 here]
9
Most respondents appear to have a realistic view of the amount they will need to save for
retirement, although given the response to the previous question it is not clear what many
of them base their view on. Three quarters of respondents state they should be saving
10% or more of income, with 38% opting for a savings rate in excess of 15%. On the
other hand, 16% of respondents think a savings rate below 9% will be adequate, while
8% say they do not know what the correct savings rate is. Again, there is significant
variation between those who have received advice and those who have not. A required
savings rate in excess of 10% is cited by 88% of respondents who have had advice, but
this drops to 57% for those who have not had advice (Chi-square = 20.34; df = 1; p-value
= 0.000). It appears that many of the respondents who have not had advice underestimate
the amount they need to save.
By way of comparison, DB schemes designed to produce pensions of between half and
two-thirds of final salary after 40 years service, tend to have average total (i.e. employee
and employer) contribution rates of 15-18% of salary. (Blake 2003) It is worth bearing in
mind the standard terms of the scheme provide a savings rate at the lower end of the
range chosen by most respondents, with the employee contribution of 4.5% matched with
an employer contribution of 6.0%. The employees do, though, have the option of making
additional voluntary contributions, paying into stakeholder pensions where eligible, and
building up savings outside their pension arrangements.5 The survey did not gather any
information on the extent to which they are doing this.
Most respondents note they are currently saving too little for retirement – an answer
chosen by 57% of respondents. A further 18% state they “don’t know” if they are
currently saving enough for retirement, while 25% of respondents think they are saving
the correct amount. Reporting having received advice makes little difference to the
proportion of respondents saying they are saving too little. However, the proportion of
those who have had advice who say they are saving the correct amount (31%) is more
than twice as high as the proportion of those who haven’t had advice (15%). Respondents
who haven’t had advice are more likely to state they are unsure if they are saving enough
(29% vs. 11%).
10
Of those who say they are not saving enough, over 64% state this is either because they
don’t earn enough or because they have other financial priorities. A distrust of pensions
or lack of interest in financial matters is the reason for not saving enough cited by 17% of
respondents, while 11% say they are not saving enough now because they plan to save
more in future.
Over half (56%) of those who state they are not saving enough say they plan to keep their
pension contributions unchanged over the next year, while 32% plan to increase their
contributions and 12% are unsure what they will do. For the one third of respondents who
plan to take action to raise their savings rate, it is worth bearing in mind research done in
the US, e.g. Choi et al (2002), which casts doubt on the extent to which employees follow
through with stated intentions to change their retirement savings behaviour.
Thaler and Bernartzi (2004) propose a prescriptive savings plan called “Save More
Tomorrow” - or “SMartT” – where employees with low saving rates commit in advance
to allocate a portion of future salary increases towards retirement saving.6 This approach
plays to the common desire to avoid reductions in nominal take home pay – driven by
loss aversion and money illusion – and the systematic conflict between long-term and
short-term preferences, whereby individuals often assume they will be willing to do
something in future they are reluctant to do today. (Laibson et al 1998) Furthermore, the
status quo bias identified by Samuelson and Zeckhauser (1988) means once the initial
commitment is made, few people make the effort to change it.
Implementation of the SMarT plan at a mid-sized manufacturing firm in the US showed
considerable success in raising savings rates amongst employees who rejected immediate
action to raise their pension contributions. The survey results also suggests the approach
could be effective, with almost 60% of the respondents who say they are not saving
enough saying they would be prepared to make a commitment to allocate a proportion of
future salary rises to increasing their saving rate. This includes 43% of those who state
they plan to make no change in their contributions in the next year and 60% of those who
11
are unsure whether they will change their contributions in the next year. In this context, it
is notable that the UK Department for Work and Pensions (DWP 2004) has highlighted
the idea of employees committing to ‘save more tomorrow’ as part of their agenda for
improving retirement provision by promoting “informed choice”.
4.4 Investment Issues:
In terms of investment matters, the most common response is for members to state they
are “moderately knowledgeable” (42%). For the remainder, slightly more respondents
(33%) say they are “not very” or “not at all” knowledgeable than say they are “fairly” or
“very knowledgeable” (25%). (Table 5) The profile of self-reported knowledge is broadly
similar to the John Hancock (2003) survey results for the US.
Questions designed to test understanding of basic features of investment present a mixed
picture. Nearly 70% of respondents were able to answer correctly a question relating to
the effects of compound interest – an important aspect of long-term saving. However, far
fewer (29%) were able to identify that the value of fixed income securities would be
likely to fall if long-term interest rates rise. A key part of the investment choice available
to members is to choose between funds that differ in terms of their asset allocation
between equities and bonds – a choice that may be difficult for members who are
unfamiliar with the basic characteristics of these types of investments. Those who have
had advice perform slightly better than those who have not, but still only 33% of them
identify the correct answer to the fixed interest question. (Chi-square = 2.28; df = 1; p-
value = 0.131) These results are consistent with previous US and UK studies (e.g. John
Hancock 2003, Watson Wyatt 2004).
[Table 5 here]
Choi et al (op. cit.) discuss how members of US retirement plans tend to take the “path of
least resistance” – adopting default options and making few active choices. In this
scheme 54% of respondents note they prefer to make the decisions about which funds to
12
invest in themselves, whereas 46% would prefer someone else to make the decisions for
them. Furthermore, 48% of respondents describe the investment funds in their pension as
being an active choice they made, while 52% of respondents say they accepted the
scheme default option. (Table 6) This indicates that a significantly higher proportion of
respondents are prepared to make an active choice than is typically the case in UK
pension schemes. For example, consultancy Hewitt Bacon and Woodrow reports that
about 80% of members of group personal pension schemes in the UK tend to accept the
default option. (Bridgeland 2002) However, it is also the case that about 80% of the
assets of the scheme are in the default ‘Balanced’ fund, meaning many of those who
exercised active choice still decided this fund was the most appropriate for them. It is
worth noting that the structure of the scheme – with three funds labelled “A -
Aggressive”, “B - Balanced”, and “C - Conservative” - may lead investors to choose the
balanced fund – i.e. the middle option - on the basis of the “extremeness aversion”
discussed by Bernartzi and Thaler (2002).
Most respondents (65%) state that the range of options available in the scheme – three
core options, a gilt fund for employees over 50, and external AVC arrangements – is
about right. Just fewer than 10% of respondents state the range is too narrow, with only
2% stating it is too broad. It is notable that many schemes in the US and significant
numbers in the UK offer a considerably wider investment choice to members (e.g.
Myners 2001 p100). It appears the majority of members in this scheme see little need for
this.
[Table 6 here]
A relatively large number of respondents (23%) state they do not know what the
investment options are. In light of this it is also notable that only about half of the
respondents provided information about which of the fund options they were invested in.
It may be that they were reluctant to provide this information because they regarded it as
sensitive. However, other sensitive information such as age and income was provided by
99% of respondents, casting doubt on this explanation. An alternative explanation is that
13

the information was not provided because the respondents found it difficult to recall or
locate. If this is the case, the lack of this information may be a handicap to these members
in assessing the ongoing suitability of their fund allocation.
In terms of managing the investment choices they have made, two thirds of respondents
state they review the investments in their pension scheme at least every three years, with
48% doing so at least annually. However, at the other end of the scale, the remaining
third review their choices less than once every five years, or not at all. Those who do
review their choice regularly make few changes as a result – 36% make changes less than
once every five years and a further 43% never make any changes, consistent with the
status quo bias noted by Samuelson and Zeckhauser (1988).
Respondents were asked to state the extent to which they thought particular asset classes
were appropriate for saving for their retirement. The results of the question – reflecting
the average score on a 1-to-5 scale where 1 is “Not at all appropriate” and 5 is “Very
Appropriate” are shown in Table 7. The table also shows the percentage of respondents
who state each asset class is either “fairly” or “very” appropriate. Investment in property
attracts the highest scores, with 83% of respondents saying they think owning their own
home is either a fairly or very appropriate way of saving for retirement and 77% saying
the same about other investments in property. This compares to 52% for UK equity funds
and 50% for UK Gilts. This is consistent with figures quoted in PPI (2004) which show
significant numbers of people using property as a retirement saving vehicle and 13%
expecting property to be their main source of retirement income.
[Table 7 here]
The preference for investment in residential and other property can to be viewed in the
context of the criteria the respondents note as influencing their choice of investments.
While 29% note their choice is influenced most by the recommendation of their adviser,
and 9% by the level of charges, 50% state that the most influential factor is the
performance record of the investment. (Table 8) The strong performance of property over
14
the past few years when the stock market has had poor returns may explain why many
respondents view property as the most appropriate long-term investment. However, there
is no statistically significant relationship between the criteria regarded as most important
and the respondent’s scoring of the various asset classes.
[Table 8 here]
Several aspects of the respondents’ investment preferences appear quite rational. An
understanding of the benefits of diversification is evident in the relatively low scores
assigned to individual shares and particularly own-company stock. Equally, cash is given
one of the lowest scores, contrary to the view that individual pension fund investors often
show ‘myopic loss aversion’ by favouring stable, but low return, assets. (Bernartzi and
Thaler 1999) For most asset classes there is relatively little difference between the views
of the respondents who have had advice and views of those who have not. The group that
has had advice is, however, more disposed towards equity investment: 60% state UK
equity funds are a fairly or very appropriate way of saving for retirement, compared to
38% of the group who haven’t had advice (chi-square = 7.08; df = 1; p-value = 0.008).
For overseas equities the corresponding figures are 37.3% and 20.4% (chi-square = 3.31;
df = 1; p-value = 0.069).
There is an argument that DC pension fund asset allocation should vary with age, with
higher weightings in risky assets (i.e. equities) at younger ages, and lower risk strategies
(bonds) as retirement approaches. This is often known as the “lifecycle” approach and
has the objective of reducing the risk of losses close to retirement when there is little
scope to recover from them.7 (Bodie 2003) The scheme offers a fixed income fund for the
use of members over the age of 50 years to enable them to adopt this approach. The older
scheme members do appear to have a more favourable view of bond investment with
61% of respondents over the age of 50 saying gilts are either a fairly or very appropriate
way of saving for their retirement, compared to 42% of respondents under 50 years of age
(chi-square = 5.33; df = 1; p-value = 0.021). However, there are no other significant
differences in asset class preferences between those aged under 50 and those aged over
15
50. Notably, the higher score assigned to gilts by older respondents is not mirrored in a
lower score being assigned to equities.
In the US many DC pension plans have high levels of investment in the shares of the
sponsoring employer. The 1990 Social Security Act limits self-investment by UK pension
funds to 5% of assets, meaning the issue has not become significant here. The survey
results show that relatively few respondents view the idea of investing their pension
assets in the stock of the scheme sponsor as attractive. (Table 9) Only 12% stated it was
either fairly or very attractive, while 30% stated it was not very attractive and a further
34% stated it was not at all attractive. (Active members were only marginally more
enthusiastic about this prospect than deferred members.) If the option to invest in the
employer’s stock were available, 51% of respondents indicated they would not put any
part of their fund into it. A further 23% would allocate 5% or less. However, it is still
notable that 18% of respondents would be prepared to put more than 10% of their
pension fund assets into their employer’s stock. For these investors, limited
diversification appears to be outweighed by the attraction of investing in the familiar.
[Table 9 here]
4.5 Discussion of Results
Overall, the survey depicts a situation where most of the employees are relying on their
DC occupational pension for a retirement income that they expect to be comparable with
what the best quality DB schemes have achieved. Most of them have realistic
expectations about how much they will need to save to achieve this, but also note that
their current saving level falls short of this. While many have received advice about their
pension, a significant minority have not and this has to be viewed against the fact that the
respondents do not regard themselves as particularly knowledgeable about investment
matters and that many struggle to answer questions on basic aspects of investment.
16
The respondents’ investment preferences look quite rational in the context of retirement
planning, albeit with the support for property possibly reflecting a tendency to favour
asset classes that have gone up in the recent past. It is also interesting to note that the
employees are mostly satisfied with what – by the standards of many US schemes and
some UK schemes – is quite a narrow range of investment options.
The important question is what conclusions can be drawn from the survey for improving
the support provided to employees with occupational pensions in general and DC
pensions in particular? That many employees have not sought advice on their own
suggests increased provision of advice in, or via, the workplace could be helpful. The
downside – of course – is that the cost to the employer of making this provision is likely
to be substantial, particularly where advice must come from regulated investment
advisers. Against this background, it is encouraging that the DWP (2004) has recently
pledged to investigate the extent to which current legislation prevents employers from
playing a greater role in encouraging and helping employees to save for retirement.
Consistent with the US evidence, the survey shows many members lack the knowledge or
interest to make active choices in their pension plan. For them, the important thing is that
the default options – the path of least resistance – are well chosen and appropriate,
particularly in the absence of more general provision of advice. This puts pressure on
trustees and pensions managers to consider carefully the needs of the members as they
decide on these options. 8
It is interesting that the respondents lack interest in investing in their employer’s stock,
given that self-investment is a significant characteristic of many US DC plans. Bernartzi
(2001) has argued that payment of employer contributions in the form of stock creates an
endorsement effect and it may be that the absence of this endorsement – i.e. stock is not
even offered as an option – has an influence on the employees’ preferences.
In contrast, the strong views expressed about the attractiveness of property may be of
more concern. Most employees will already have significant exposure to property
17

through home ownership and additions to this are likely to result in poor diversification.
It is also possible that the preference for (residential) property will encourage members to
save for retirement outside of formal pension arrangements, which has disadvantages in
terms of tax treatment, with no tax relief on the funds that are invested and – other than in
the case of the member’s main residence - taxation of the returns on the investment.
Furthermore, someone using their own home as a means of saving for retirement will
require either to move house on retirement to downsize or undertake some form of equity
release. Both of these mechanisms may appear more attractive in prospect than when the
time finally comes to put them into effect. PPI (2004) discusses some of the practical
difficulties of drawing an income from property investment, including the limited
proportion of value that can be taken via equity release.
While the survey provides evidence to consider in relation to existing US findings, there
are – of course – limitations to the conclusions that can be drawn. The response is
relatively small and drawn from only one scheme where the members have particular
characteristics and face particular choices and circumstances. Furthermore, like any
survey it relies on self-reported information, with no way of knowing how accurate it is.9
The survey must also be interpreted without knowing about the broader financial
circumstances and investment holdings of the respondents.
As noted earlier, the membership of the scheme has certain biases relative to the working
population at large and the self-selection of the respondents exacerbates these biases. It
could be argued that older and more highly-paid (and more highly-educated) employees
are more likely to be interested in, and knowledgeable about, their pension arrangements
than the average employee. To the extent that this is true, the results of the survey should
be taken as an upwardly biased view of the level of knowledge and interest in investment
matters amongst employees with DC pensions.
18
5. Conclusions
This paper provides a case study view of the attitudes and beliefs of investors within a
UK DC pension plan, which can be contrasted with existing US evidence. The results are
broadly consistent with the US findings in that many employees show limited knowledge
and interest in their pension arrangements. They make the case for broader provision of
investment advice in the workplace and for ongoing care in choosing pension scheme
default options in the knowledge that many employees will accept them. There is also
some support for the effectiveness of ‘paternalistic’ programs with behavioural
underpinnings – such as ‘Save More Tomorrow’. Interesting differences appear with US
results, principally in terms of the attractiveness of investing retirement assets in the
employer’s stock and in the choice between property and financial assets. But these
results are drawn from one set of employees in one particular scheme. There is clear
scope to extend the work to other schemes in the UK and beyond. As DC pensions
become more common it will be important we know how to structure them and how to
support the scheme members in order to maximise their chances of enjoying comfortable
retirement incomes.
19
References
Bernartzi S. (2001) ‘Excessive Extrapolation and the Allocation of 401(k) Accounts to Company Stock’ Journal of Finance 56:5, pp1747-1764. Bernartzi S. & R. Thaler (1999) ‘Risk Aversion or Myopia? Choices in Repeated Gambles and Retirement Investments’ Management Science 45:3 pp364-381. Bernartzi S. & R. Thaler (2001) ‘Naïve Diversification Strategies in Defined Contribution Saving Plans’ American Economic Review 91, pp7-98. . Bernartzi S. & R. Thaler (2002) ‘How Much is Investor Autonomy Worth?’ Journal of Finance 57:4, pp 1593-1616 Blake D. (2003) ‘The UK Pension System: Key Issues’ Pensions 8:4, pp330-375. Blake D., A. Cairns & K. Dowd (2001) ‘Pensionmetrics: Stochastic Pension Plan Design and Value at Risk During the Accumulation Phase.’ Insurance, Mathematics and Economics 29, pp187-215. Bodie Z. (2003) ‘Thoughts on the Future: Lifecycle Investing in Theory and Practice’ Financial Analysts Journal Jan/Feb, pp24-29. Bridgeland (2002) ‘Choices, Choices…’ PMI Trustee Group News, December 2002. Choi J., D. Laibson, B. Madrian, A. Metrick (2002) ‘Defined Contribution Pensions: Plan Rules, Participant Decisions, and the Path of Least Resistance’ in J. Poterba ed Tax Policy and the Economy Vol 16 MIT Press Cambridge MA. DWP (2004) ‘Simplicity, Security and Choice: Informed Choices for Working and Saving’ Cm 6111, Department for Work and Pensions, London. EBRI (2003) ‘2003 Retirement Confidence Survey Summary of Findings’ Employee Benefit Research Institute, Washington DC, September 2003. Friedberg L. & M. Owyang (2002) ‘Not Your Father’s Pension: The Rise of 401(k) and Other Defined Contribution Plans’ Federal Reserve Bank of St Louis Review 84, pp23-34. Hibbert J. & P. Mowbray (2002) ‘Understanding Investment Policy Choices for Individual Pension Plans’ Pensions 8:1, pp41-62. Huberman G. (2001) ‘Familiarity Breeds Investment’ Review of Financial Studies 14:3, pp659-680.
20
John Hancock (2003) ‘Eighth Defined Contribution Plan Survey’ John Hancock Financial Services, Boston MA. Kahneman D. & A. Tversky (1974) ‘Judgement Under Uncertainty: Heuristics and Biases’ Science 185, pp1124-31. Laibson D, A. Repetto & J. Tobacman (1998) ‘Self-Control and Saving for Retirement’ Brookings Papers on Economic Activity 1998:1. Liang N. & S. Weisbenner (2002) ‘Investor Behaviour and the Purchase of Company Stock in 401(k) Plans – The Importance of Plan Design’ Working Paper – University of Illinois Mitchell O. & S. Utkus (2002) ‘Company Stock and Retirement Plan Diversification’ Pensions Research Council Working Paper 2002-4, University of Pennsylvania. Mitchell O. & S. Utkus (2003) ‘Lessons from Behavioural Finance for Retirement Plan Design’ Pensions Research Council Working Paper 2003-6, University of Pennsylvania. Mullainathan S. & R. Thaler (2000) ‘Behavioural Economics’ NBER Working Paper 7948, National Bureau of Economic Research, Cambridge MA. Myners P. (2001) ‘Institutional Investment in the United Kingdom: A Review’ HM Treasury, London.. NAPF (2003) ‘Pension Scheme Changes – A Snapshot’ National Association of Pension Funds, London. PPI (2004) ‘Property or Pensions?’ Pensions Policy Institute Discussion Paper, PPI London. Samuelson W. & R. Zeckhauser (1988) ‘Status Quo Bias in Decision Making’ Journal of Risk and Uncertainty 1, pp7-59. Simon H. (1955) ‘A Behavioural Model of Rational Choice’ Quarterly Journal of Economics 69, pp99-118. Thaler R. & C. Sunstein (2003) ‘Libertarian Paternalism’ American Economic Review 93:2, pp175-179. Thaler R. & S. Bernartzi (2004) ‘ Save More Tomorrow: Using Behavioural Economics to Increase Employee Saving’ Journal of Political Economy 112:1, pp164-186. VanDerhei J. (2002) ‘Company Stock in 401(k) Plans: Results of a Survey of ISCEBS Members’ EBRI Special Report, Employee Benefits Research Institute, Washington DC. Watson Wyatt (2004) ‘DC Forum 2004’ Watson Wyatt, London.
21
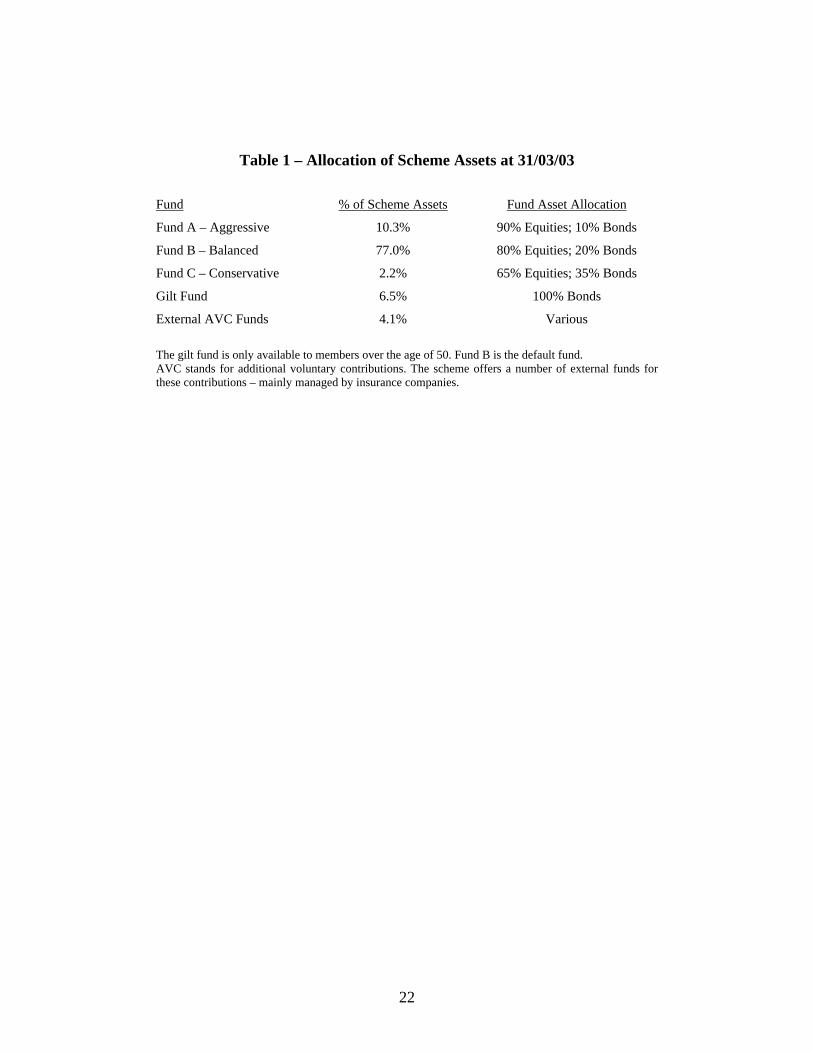
Table 1 – Allocation of Scheme Assets at 31/03/03
Fund % of Scheme Assets Fund Asset Allocation
Fund A – Aggressive 10.3% 90% Equities; 10% Bonds
Fund B – Balanced 77.0% 80% Equities; 20% Bonds
Fund C – Conservative 2.2% 65% Equities; 35% Bonds
Gilt Fund 6.5% 100% Bonds
External AVC Funds 4.1% Various The gilt fund is only available to members over the age of 50. Fund B is the default fund. AVC stands for additional voluntary contributions. The scheme offers a number of external funds for these contributions – mainly managed by insurance companies.
22
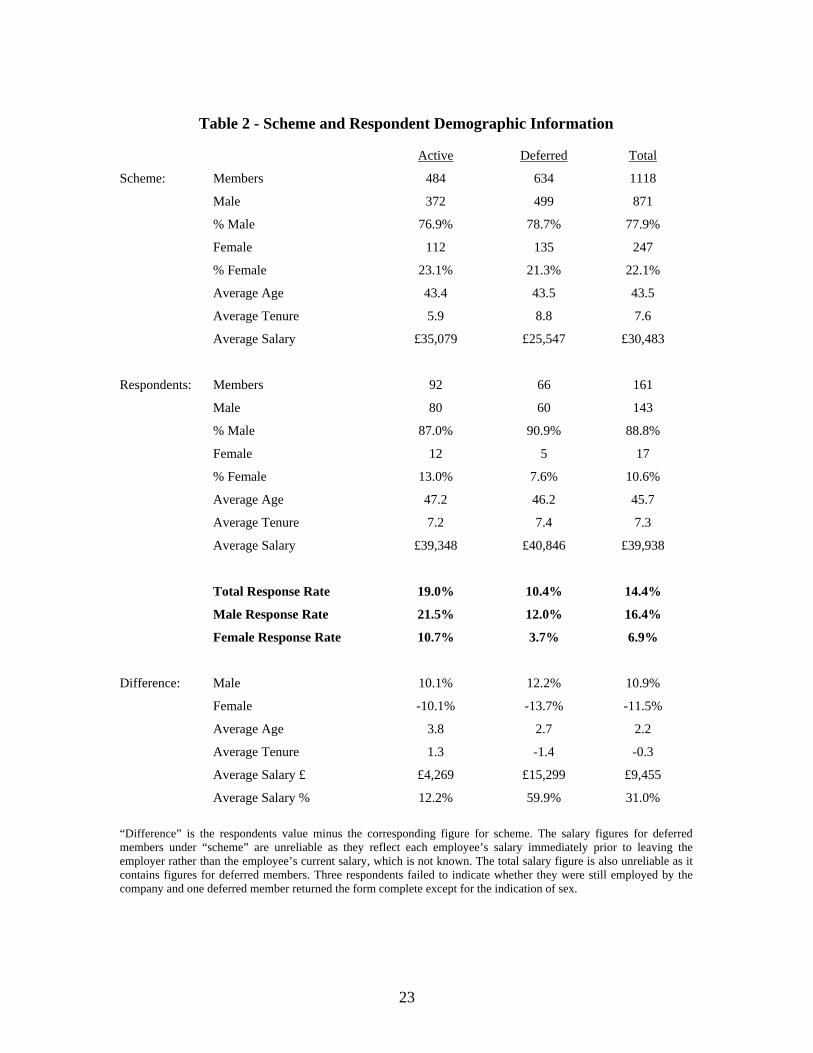
Table 2 - Scheme and Respondent Demographic Information
Active Deferred Total
Scheme: Members 484 634 1118
Male 372 499 871
% Male 76.9% 78.7% 77.9%
Female 112 135 247
% Female 23.1% 21.3% 22.1%
Average Age 43.4 43.5 43.5
Average Tenure 5.9 8.8 7.6
Average Salary £35,079 £25,547 £30,483
Respondents: Members 92 66 161
Male 80 60 143
% Male 87.0% 90.9% 88.8%
Female 12 5 17
% Female 13.0% 7.6% 10.6%
Average Age 47.2 46.2 45.7
Average Tenure 7.2 7.4 7.3
Average Salary £39,348 £40,846 £39,938
Total Response Rate 19.0% 10.4% 14.4%
Male Response Rate 21.5% 12.0% 16.4%
Female Response Rate 10.7% 3.7% 6.9%
Difference: Male 10.1% 12.2% 10.9%
Female -10.1% -13.7% -11.5%
Average Age 3.8 2.7 2.2
Average Tenure 1.3 -1.4 -0.3
Average Salary £ £4,269 £15,299 £9,455
Average Salary % 12.2% 59.9% 31.0% “Difference” is the respondents value minus the corresponding figure for scheme. The salary figures for deferred members under “scheme” are unreliable as they reflect each employee’s salary immediately prior to leaving the employer rather than the employee’s current salary, which is not known. The total salary figure is also unreliable as it contains figures for deferred members. Three respondents failed to indicate whether they were still employed by the company and one deferred member returned the form complete except for the indication of sex.
23
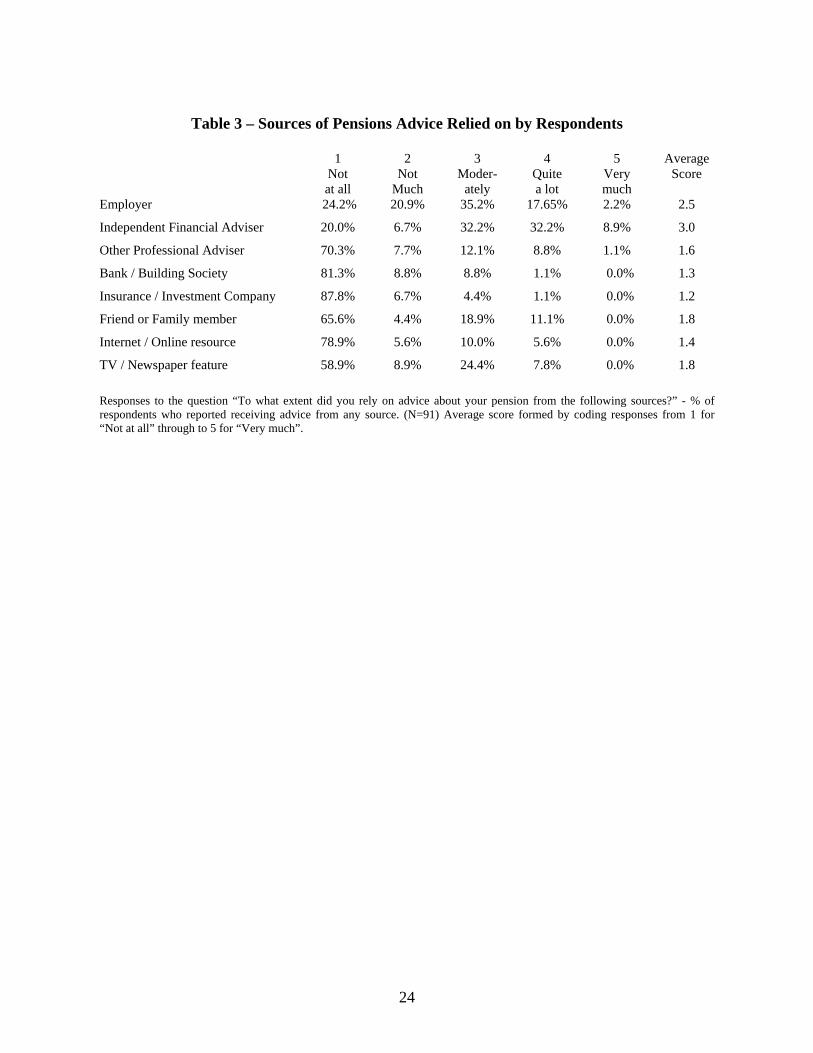
Table 3 – Sources of Pensions Advice Relied on by Respondents
1
Not at all
2 Not
Much
3 Moder-
ately
4 Quite a lot
5 Very much
Average Score
Employer 24.2% 20.9% 35.2% 17.65% 2.2% 2.5
Independent Financial Adviser 20.0% 6.7% 32.2% 32.2% 8.9% 3.0
Other Professional Adviser 70.3% 7.7% 12.1% 8.8% 1.1% 1.6
Bank / Building Society 81.3% 8.8% 8.8% 1.1% 0.0% 1.3
Insurance / Investment Company 87.8% 6.7% 4.4% 1.1% 0.0% 1.2
Friend or Family member 65.6% 4.4% 18.9% 11.1% 0.0% 1.8
Internet / Online resource 78.9% 5.6% 10.0% 5.6% 0.0% 1.4
TV / Newspaper feature 58.9% 8.9% 24.4% 7.8% 0.0% 1.8 Responses to the question “To what extent did you rely on advice about your pension from the following sources?” - % of respondents who reported receiving advice from any source. (N=91) Average score formed by coding responses from 1 for “Not at all” through to 5 for “Very much”.
24
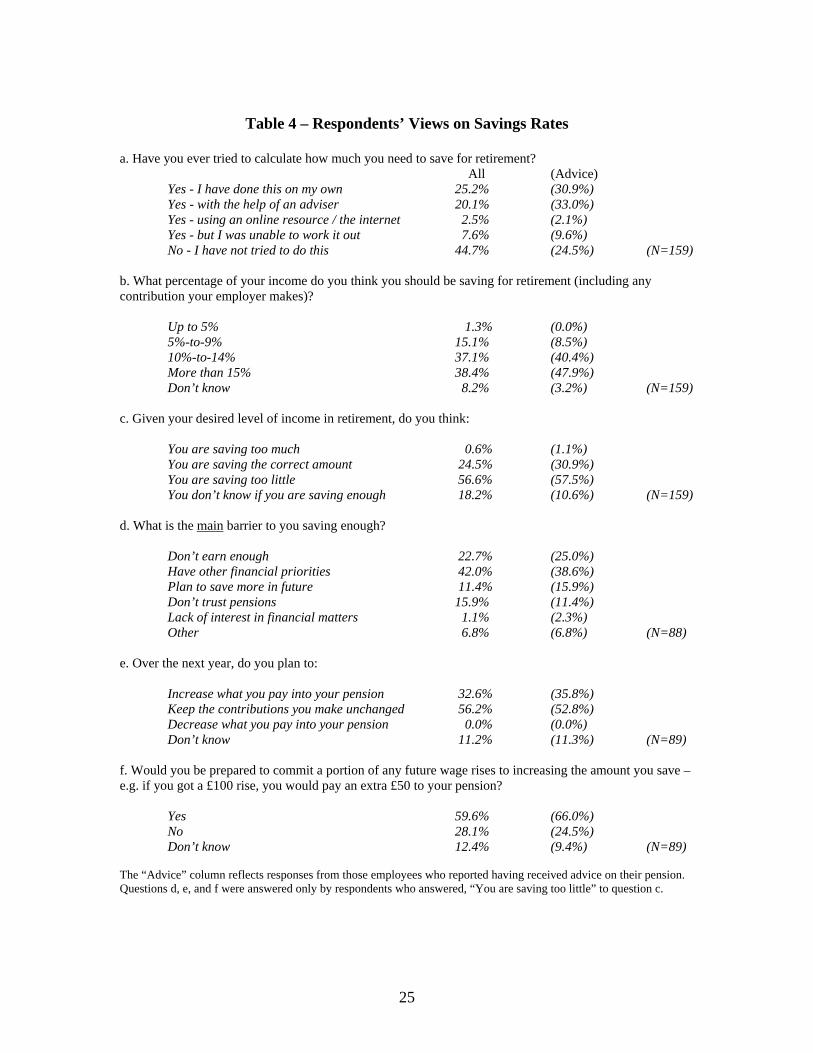
Table 4 – Respondents’ Views on Savings Rates
a. Have you ever tried to calculate how much you need to save for retirement? All (Advice) Yes - I have done this on my own 25.2% (30.9%) Yes - with the help of an adviser 20.1% (33.0%) Yes - using an online resource / the internet 2.5% (2.1%) Yes - but I was unable to work it out 7.6% (9.6%) No - I have not tried to do this 44.7% (24.5%) (N=159) b. What percentage of your income do you think you should be saving for retirement (including any contribution your employer makes)? Up to 5% 1.3% (0.0%) 5%-to-9% 15.1% (8.5%) 10%-to-14% 37.1% (40.4%) More than 15% 38.4% (47.9%) Don’t know 8.2% (3.2%) (N=159) c. Given your desired level of income in retirement, do you think: You are saving too much 0.6% (1.1%) You are saving the correct amount 24.5% (30.9%) You are saving too little 56.6% (57.5%) You don’t know if you are saving enough 18.2% (10.6%) (N=159) d. What is the main barrier to you saving enough? Don’t earn enough 22.7% (25.0%) Have other financial priorities 42.0% (38.6%) Plan to save more in future 11.4% (15.9%) Don’t trust pensions 15.9% (11.4%) Lack of interest in financial matters 1.1% (2.3%) Other 6.8% (6.8%) (N=88) e. Over the next year, do you plan to: Increase what you pay into your pension 32.6% (35.8%) Keep the contributions you make unchanged 56.2% (52.8%) Decrease what you pay into your pension 0.0% (0.0%) Don’t know 11.2% (11.3%) (N=89) f. Would you be prepared to commit a portion of any future wage rises to increasing the amount you save – e.g. if you got a £100 rise, you would pay an extra £50 to your pension? Yes 59.6% (66.0%) No 28.1% (24.5%) Don’t know 12.4% (9.4%) (N=89) The “Advice” column reflects responses from those employees who reported having received advice on their pension. Questions d, e, and f were answered only by respondents who answered, “You are saving too little” to question c.
25
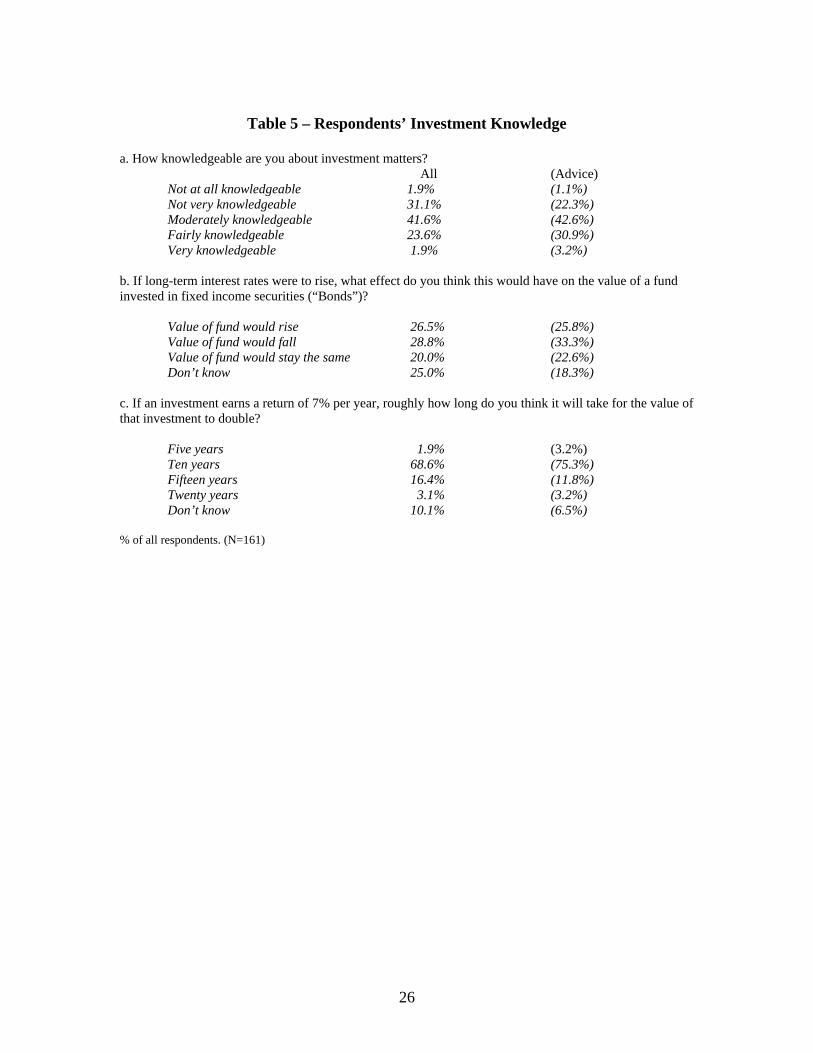
Table 5 – Respondents’ Investment Knowledge
a. How knowledgeable are you about investment matters? All (Advice) Not at all knowledgeable 1.9% (1.1%) Not very knowledgeable 31.1% (22.3%) Moderately knowledgeable 41.6% (42.6%) Fairly knowledgeable 23.6% (30.9%) Very knowledgeable 1.9% (3.2%) b. If long-term interest rates were to rise, what effect do you think this would have on the value of a fund invested in fixed income securities (“Bonds”)? Value of fund would rise 26.5% (25.8%) Value of fund would fall 28.8% (33.3%) Value of fund would stay the same 20.0% (22.6%) Don’t know 25.0% (18.3%) c. If an investment earns a return of 7% per year, roughly how long do you think it will take for the value of that investment to double? Five years 1.9% (3.2%) Ten years 68.6% (75.3%) Fifteen years 16.4% (11.8%) Twenty years 3.1% (3.2%) Don’t know 10.1% (6.5%) % of all respondents. (N=161)
26
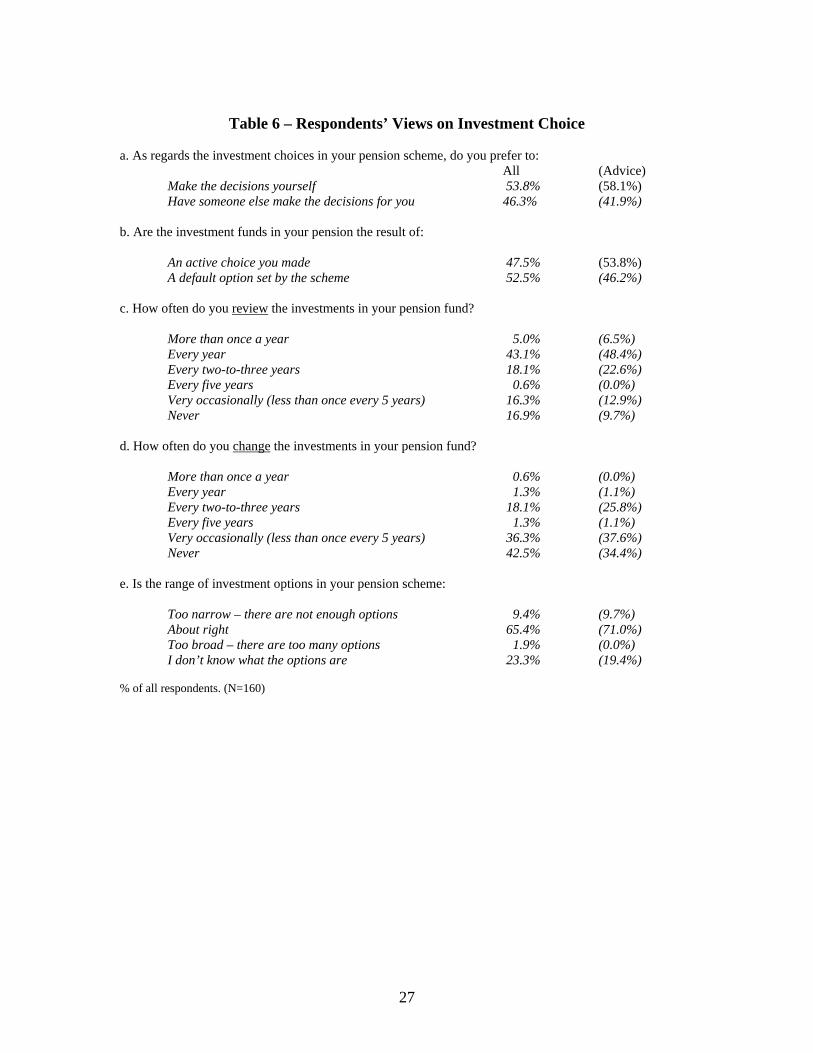
Table 6 – Respondents’ Views on Investment Choice
a. As regards the investment choices in your pension scheme, do you prefer to: All (Advice) Make the decisions yourself 53.8% (58.1%) Have someone else make the decisions for you 46.3% (41.9%) b. Are the investment funds in your pension the result of: An active choice you made 47.5% (53.8%) A default option set by the scheme 52.5% (46.2%) c. How often do you review the investments in your pension fund? More than once a year 5.0% (6.5%) Every year 43.1% (48.4%) Every two-to-three years 18.1% (22.6%) Every five years 0.6% (0.0%) Very occasionally (less than once every 5 years) 16.3% (12.9%) Never 16.9% (9.7%) d. How often do you change the investments in your pension fund? More than once a year 0.6% (0.0%) Every year 1.3% (1.1%) Every two-to-three years 18.1% (25.8%) Every five years 1.3% (1.1%) Very occasionally (less than once every 5 years) 36.3% (37.6%) Never 42.5% (34.4%) e. Is the range of investment options in your pension scheme: Too narrow – there are not enough options 9.4% (9.7%) About right 65.4% (71.0%) Too broad – there are too many options 1.9% (0.0%) I don’t know what the options are 23.3% (19.4%) % of all respondents. (N=160)
27
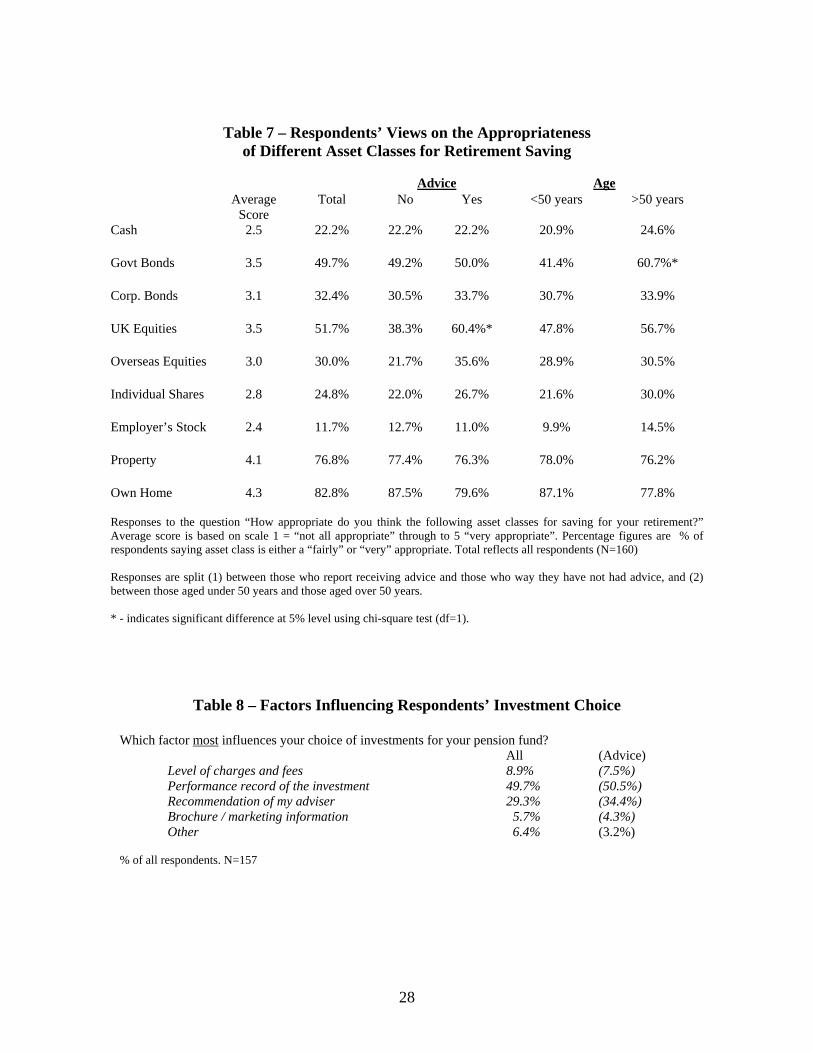
Table 7 – Respondents’ Views on the Appropriateness of Different Asset Classes for Retirement Saving
Advice Age Average
Score Total No Yes <50 years >50 years
Cash 2.5 22.2% 22.2% 22.2% 20.9% 24.6% Govt Bonds 3.5 49.7% 49.2% 50.0% 41.4% 60.7%* Corp. Bonds 3.1 32.4% 30.5% 33.7% 30.7% 33.9% UK Equities 3.5 51.7% 38.3% 60.4%* 47.8% 56.7% Overseas Equities 3.0 30.0% 21.7% 35.6% 28.9% 30.5% Individual Shares 2.8 24.8% 22.0% 26.7% 21.6% 30.0% Employer’s Stock 2.4 11.7% 12.7% 11.0% 9.9% 14.5% Property 4.1 76.8% 77.4% 76.3% 78.0% 76.2% Own Home 4.3 82.8% 87.5% 79.6% 87.1% 77.8% Responses to the question “How appropriate do you think the following asset classes for saving for your retirement?” Average score is based on scale 1 = “not all appropriate” through to 5 “very appropriate”. Percentage figures are % of respondents saying asset class is either a “fairly” or “very” appropriate. Total reflects all respondents (N=160) Responses are split (1) between those who report receiving advice and those who way they have not had advice, and (2) between those aged under 50 years and those aged over 50 years. * - indicates significant difference at 5% level using chi-square test (df=1).
Table 8 – Factors Influencing Respondents’ Investment Choice
Which factor most influences your choice of investments for your pension fund? All (Advice) Level of charges and fees 8.9% (7.5%) Performance record of the investment 49.7% (50.5%) Recommendation of my adviser 29.3% (34.4%) Brochure / marketing information 5.7% (4.3%) Other 6.4% (3.2%) % of all respondents. N=157
28
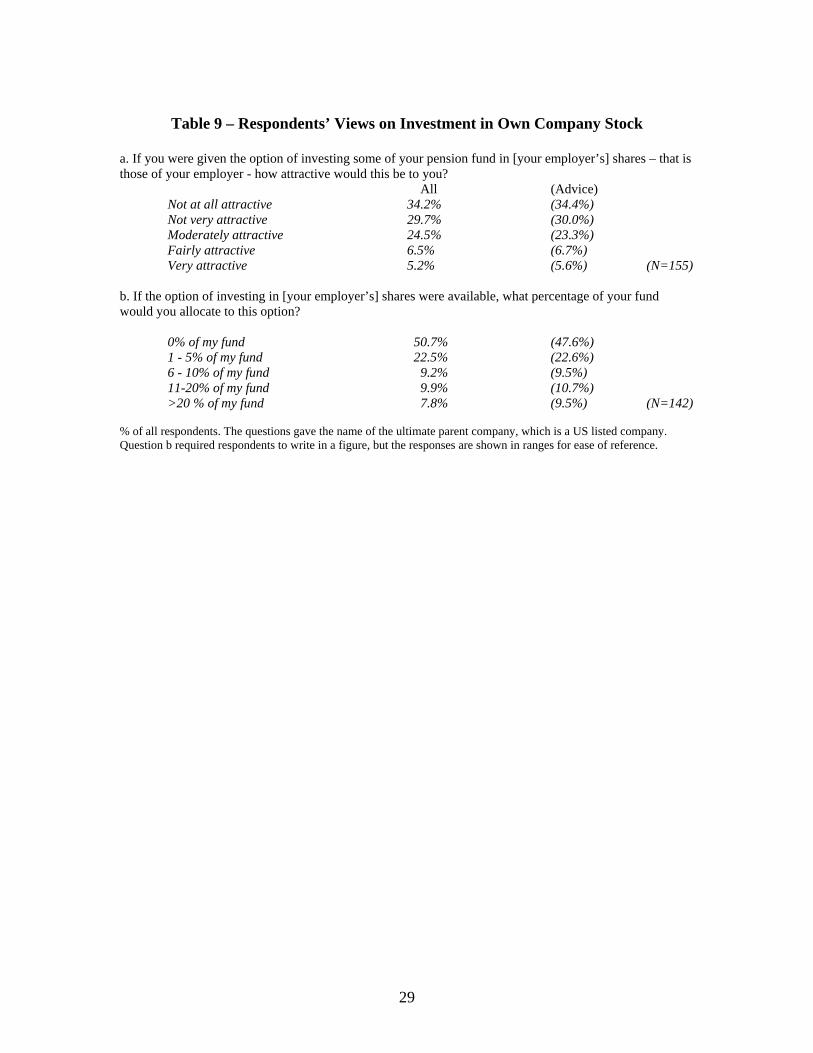
Table 9 – Respondents’ Views on Investment in Own Company Stock
a. If you were given the option of investing some of your pension fund in [your employer’s] shares – that is those of your employer - how attractive would this be to you? All (Advice) Not at all attractive 34.2% (34.4%) Not very attractive 29.7% (30.0%) Moderately attractive 24.5% (23.3%) Fairly attractive 6.5% (6.7%) Very attractive 5.2% (5.6%) (N=155) b. If the option of investing in [your employer’s] shares were available, what percentage of your fund would you allocate to this option? 0% of my fund 50.7% (47.6%) 1 - 5% of my fund 22.5% (22.6%) 6 - 10% of my fund 9.2% (9.5%) 11-20% of my fund 9.9% (10.7%) >20 % of my fund 7.8% (9.5%) (N=142) % of all respondents. The questions gave the name of the ultimate parent company, which is a US listed company. Question b required respondents to write in a figure, but the responses are shown in ranges for ease of reference.
29

1 In a DB plan, an employee who qualifies for a pension will receive an income flow from the employer-sponsored pension scheme from retirement until death. The annual benefit is typically a proportion of the employee’s final, or average, salary, with the proportion depending on length of tenure in the pension scheme. In contrast, in a DC scheme contributions are paid into the plan and the employee can usually choose from a range of investment options. The contributions, with accumulated investment returns, are then available to provide a retirement income, either directly or by purchasing an annuity. 2 A copy of the survey is available from the author on request.
3 Data from the Office of National Statistics show that in Q4 2003 56% of people in employment were male, that the mean age in the labour force in 2001 was 39, and that average gross annual pay for full time employees in the 2002/03 tax year was £25,170. (www.statistics.gov.uk) 4 Alternatively, it may be that respondents with these particular characteristics are more likely to have sought advice. It is not possible to determine the direction of causality. 5 Employees can pay AVCs provided these contributions together with their regular contributions do not exceed the legislative limit of 15% of earnings, with earnings capped at £102,000 (2004/05). Employees with an occupational pension scheme can also pay into a private ‘stakeholder’ pension scheme provided they do not earn more than £30,000 a year – an arrangement known as concurrency.
6 “Save More Tomorrow” is a registered trade mark.
7 Bodie (2003) argues that higher risk strategies are appropriate at younger ages 1) because young people have more of their wealth in ‘bond-like’ human capital and can afford to take more financial risk, and 2) because younger people have more flexibility to work more to make up for any shortfall created by losses in financial assets. 8 For a discussion of the role of paternalism in retirement provision see Thaler R. & C. Sunstein (2003).
9 UK data protection laws pose a significant barrier to studies comparing self-reported with administrative data at the level of individual employees.
30