Embed Size (px)
Citation preview
ural Pennsylvania�THE CENTER FOR
A Legislative Agency of the Pennsylvania General Assembly
Survey and Analysisof Alternative Education Programs

Survey and Analysis of Alternative Education Programs
A report byNathaniel S. Hosley
Lock Haven University of Pennsylvania
Team members: Blake Bergey, Jessica Bowman, Dr. Nicole Chartas, Nichole Eisenhart,
Dr. Edward Jensen, Beth Lawless, and Laura Oakes
July 2003
This project was sponsored by a grant from the Center for Rural Pennsylvania, a legislative agency of thePennsylvania General Assembly.
The Center for Rural Pennsylvania is a bipartisan, bicameral legislative agency that serves as a resource forrural policy within the Pennsylvania General Assembly. It was created in 1987 under Act 16, the Rural Revital-ization Act, to promote and sustain the vitality of Pennsylvania’s rural and small communities.
For a copy of the full report, contact the Center for Rural Pennsylvania, 200 North Third St., Suite 600,Harrisburg, PA 17101, telephone (717) 787-9555, fax (717) 772-3587, email: [email protected].

Center for Rural Pennsylvania
Introduction ...................................................................................................................3
Literature Review ..............................................................................................................4
Methodology ................................................................................................................... 5The survey instruments ........................................................................................ 5
Results ................................................................................................................... 6Section 1. Administration and Structure of Alternative Education Programs ........ 6
Program structure and service provision .................................................. 6Location and quality of facilities ................................................................. 7Financial issues .........................................................................................7
Section 2. Students Served in Alternative Education Programs ........................... 7Number of students served .......................................................................7Student demographics ............................................................................... 8Reason for placement in alternative education ......................................... 9Program participation time frames ............................................................. 9Disposition of students ............................................................................ 10
Section 3. Personnel in Alternative Education .................................................... 11Number of full-time equivalent (FTE) personnel ...................................... 11Teacher education, training, and professional preparation...................... 11
Section 4. Alternative Education Curriculum ....................................................... 12Focus and content ................................................................................... 12Comparisons with regular classroom ...................................................... 13Family involvement .................................................................................. 13Assessment ............................................................................................. 13
Section 5. Importance of Program Elements and Effectiveness of Programs .... 14
Conclusions ................................................................................................................. 15Programs and Administration .............................................................................. 15Students .............................................................................................................. 16Personnel ............................................................................................................ 17Curriculum ........................................................................................................... 17Effectiveness ...................................................................................................... 18
Recommendations .......................................................................................................... 18
References ................................................................................................................. 20
Table of Contents
3
INTRODUCTION
Survey and Analysis of Alternative Education Programs
Alternative education (AE) programs are experi-encing tremendous growth in Pennsylvania andnationwide. Research regarding the practices in AEsettings remains limited, and no research on Pennsyl-vania programs is readily available. In the researchpresented here, two surveys (one of teachers and oneof administrators) and the resulting analysis providesome baseline data and opinions regarding Pennsylva-nia programs.
The research was conducted to investigate thecurrent status of AE in Pennsylvania. The focus ofthe administrative survey was to collect demographicdata and the perceptions of administrators on issuessuch as the mission, focus, and strengths of currentalternative education programs. The focus of theteacher survey was to collect information aboutprogram and curriculum issues, information regardingteacher preparation and professional development,and perceptions of teachers on the mission, focus, andstrengths of programs.
The purpose of collecting this data was to:1) establish a baseline of information for Pennsyl-vania alternative education programs;2) assess differences between rural and urbanprograms;3) assess differences between teachers andadministrators; and4) determine the common elements acrossalternative programs.
There are many variations of alternative educationprogramming across the nation, and most models arerepresented in Pennsylvania. Charter schools, specialvocational schools, magnet schools, gifted alterna-tives, boot camps, and alternative schools for disrup-tive youth are some of those variations. Clearly,legislation and budgetary allocations dictate how AEis defined and much of what will happen in any state.For example, in 2001–2002 Pennsylvania allocated$26 million for alternative programs serving disruptiveyouth. This represents a dramatic jump from $11 millionin 2000–2001. The state Department of Educationstates the purpose of this funding as follows:
“. . . removes disruptive students from regularschool programs in order to provide those studentswith a sound educational course of study andcounseling designed to modify disruptive behaviorand return the students to a regular schoolcurriculum…alternative programs may operateoutside the normal school day of the applicantdistrict, including Saturdays. . . (schools) shall adopta policy for periodic review of students placed inthe alternative education program . . . and,programs may include services for studentsreturning from placements or who are on proba-tion resulting from being adjudicated delinquent…orwho have been judged to have committed a crimeunder an adult criminal proceeding . . .”
The type of programs, staffing, and other consid-erations are shaped to a significant extent by thepurposes outlined in this funding. Nonetheless, abaseline of data is not currently available, and there ismerit to establishing a knowledge base related to AEactivities in the commonwealth.
Questions for consideration in this analysis included:• How are alternative education programsorganized and structured?• Who are the students?• What are the educational, pre-service training,professional development, and preparednesscharacteristics of teachers? What needs might berelated to these issues?• What is the focus of curriculum and whatdifferences are there in alternative educationcurriculum from regular education?• How do teachers and administrators evaluatethe effectiveness of their alternative educationprograms?• How do teachers and administrators evaluatethe importance of the various processes and goalsof alternative education programs?• Are there differences in perceptions betweenrural and urban teachers and administrators?

Center for Rural Pennsylvania
4
LITERATURE REVIEWJay McGee (2001), an alternative school adminis-
trator, asserts there is a demand for AE schools thataddresses the needs of students not succeeding. Thisdemand pertains to all age groups, including elemen-tary, middle, and high school students. He asks who isserved by alternative education schools by age, race,gender, frequency, and length and he wants to knowthe benefit of such programs and how one knows
what results are being achieved. All of thesequestions are addressed in the administratorsurvey.
Cox and Davidson (1995), using a meta-analysis to determine the overall effect of AE pro-grams, concluded that AE programs can have a smallpositive effect on school performance, school attitude,and self esteem and that alternative education schoolswith specific target populations have more impactthan do undefined schools.
Guerin and Denti (1999) suggest that successfulprograms have certain characteristics or featuresincluding: curricula that is responsive to the needs ofthe students; assessment; teaching of social skills,social responsibility, and restorative justice; focus oncore academic subjects; and a presence of supple-mentary subjects (e.g. career awareness).
This survey and analysis of AE practices directlyor indirectly reviews most of these and several otherresearch-based AE strategies. The researchersanticipated finding that program curricula would havethe primary focus of changing behavior of studentsand/or increasing academic performance of students.Assessment and transition programs are likely to beinconsistent due to the realities of the need forimmediate referrals, staffing patterns, and limitedfunding. Assessment refers to the evaluation ofstudents in one or more of the following areas:academic performance, academic ability, behavior,social skills, and cognitive skills. Transition programsin school district AE programs are generally designedto assist students in making a smooth transition fromalternative education back into the regular classroom,
the workplace, and/or post-secondary training.Gregg (1999) suggests that programs with a
punitive purpose may cause schools to adopt ineffec-tive models for improving learning or behavior. Shecites Raywid’s (2001) research and the resultingdescription of three distinct types of schools. TheseAE school types provide an interesting frameworkwithin which the findings of this study can be viewed.Gregg outlines implementation issues and characteris-tics for each of the three types as follows:
Type I programs - Academic-Full-time, multiyear education for students of allkinds, including those needing more individualiza-tion and those seeking more innovative or chal-lenging curriculum.-An emphasis on student responsibility forlearning, meaning that students choose to partici-pate in the alternative program and work is self-paced.-Full instructional program, often includingvocational and community service components, sostudents can earn credits to graduate.-Deregulation, flexibility, autonomy, teacher andstudent empowerment.
Type II programs - Discipline-Aim to segregate, contain, and reform disruptivestudents who typically do not choose to attendand are placed in the program for specificperiods; short-term participation.-Curriculum is limited and/or students work onassignments provided by home schools.-Highly structured and punitive.
Type III programs - Therapeutic-Short-term therapeutic settings for students withsocial and emotional problems that create barriersto learning.-Focus on attitude and behavior remediation andrehabilitation.-Students may choose not to participate.
5
The Center-sponsored researchers anticipatedfinding an overlap of the three program types but withan emphasis on Type 2-Disciplinary because of theDepartment of Education regulations (to servedisruptive youth) for many alternative educationprograms receiving state funding.
The need for alternative education programs iswell documented. As Raywid (2001) notes, “Unsuc-cessful students need a good education a lot morethan do the youngsters who manage to succeed undervirtually any circumstances.” Quality of education isdirectly impacted by the quality of teaching. Rigorousand supportive professional development practices forprofessionals who choose to work with these studentsare of paramount importance.
METHODOLOGYTo define rural and urban, this study used the 1990
U.S. Census Bureau definition and the Center forRural Pennsylvania classification system. For the1990 Census, urban was comprised of urbanizedareas and places of 2,500 or more people outside ofurbanized areas. Everything else was consideredrural. The Center for Rural Pennsylvania used thisdefinition to create a list of rural and urban schooldistricts based on the rural/urban status of the major-ity of the population in each district. The resulting listwas used for this study.
This project involved the development and distribu-tion of two survey instruments. The first was de-signed for school district administrators, specificallysuperintendents or their designees (Survey A). Thesecond instrument was designed for teachers inalternative education settings (Survey T). Bothsurveys were sent to all 501 school districts in Penn-sylvania.
For the analysis, 454 surveys were used, repre-senting 234 teachers and 220 administrators: 186were rural participants and 286 were urban partici-pants. To break this down further, there were 95 ruralteachers, 139 urban teachers, 91 rural administrators,and 129 urban administrators.
The return rate for administrators was 45 percent(220 of 501) or 50 percent for rural and 40 percentfor urban respondents.
The rural return rate for the teacher survey(unduplicated, by district) was 29 percent (53 of 182school districts) and the urban return rate was also 29percent (93 of 319 school districts). The lowerteacher return rate may be due to the fact that noalternative education teacher mailing list was avail-able. The teacher surveys were mailed to adminis-trative offices with a request to distribute themdirectly to AE teachers. Returns within respondingdistricts ranged from one to six surveys with anaverage of 1.6. It is important to note that among thereturns were surveys from guidance counselors andother professionals with direct, daily program contact.A decision was made to include the survey input fromthese professionals. There were 40 returns among the234 fitting this description.
The survey instrumentsSurvey A: The survey allowed administrators toprovide their perceptions and opinions regardingthe “effectiveness” and “importance” of numer-ous variables. Other questions were asked toassess any bias or emphasis across the fivetraditional program areas of academic, therapeu-tic, behavior change, discipline and career prepa-ration; to assess the importance of general goalareas in AE programming; to assess opinionsrelated to the preparation and professionaldevelopment of teachers and others working inAE; to collect information about how programswere organized, whom the programs served, andadditional information about program processes;to collect information about students includingnumbers of participants in AE, race, gender,special education involvement, reason for place-ment, and disposition after AE involvement; andto identify the number of professionals working inthe AE program. Finally, two items invited therespondents to provide opinions regarding the
Survey and Analysis of Alternative Education Programs
Center for Rural Pennsylvania
6
greatest needs in the AE program and anyadditional comments they may have had.
Survey T: The survey of teachers is particularlyimportant for the assessment of programmaticconcerns. Of particular interest was assessing thesimilarities and differences of opinion that mayexist between the classroom teachers and theadministrators on issues such as the importanceof various program components, goals, and otherorganizational/programmatic structure issues.
Survey T differs from A in several respects:• Some items were removed so as not to re-collect demographic data collected on Survey A.• There is a more complete effort to assess thestatus of curricula in AE settings.• Whereas Survey A was sent directly to thepotential respondent, Survey T was sent to thesuperintendent for distribution to the teachers, asno AE teacher address list exists.• Survey T more completely addresses the issuesof teacher training, pre-service preparation, andeducation.
RESULTSSurvey results yielded background information on
the structure and administration, students, personnel,and curriculum of alternative education programs aswell as insight into teacher and administrator views onthe importance of certain program elements andoverall effectiveness of the programs.
Section 1. Administration and Structureof Alternative Education Programs
Program structure and service provisionThe primary responsibility for the administration of
38 percent of rural alternative education programs lieswith a principal with combined duties. One otherarrangement was also prominent - an administrator,who is not a principal, with combined duties at 23percent. Nine percent of rural programs are adminis-tered by someone whose time is dedicated 100percent to the AE program. In urban areas, this istrue nearly twice as often.
Fewer rural programs, 2 percent compared to theurban 10, had a full-time principal for AE. However,more rural programs, 26 percent compared to theurban 17, had some other arrangement not describedin the survey.
The great majority (82 percent) of respondentsindicated that services are provided throughout the180-day school year. Figures were not much differentfor rural and urban responses though rural serviceswere provided for slightly less of the calendar year.About 5 percent of rural programs run shorter thanthe school year while 9 percent run longer.
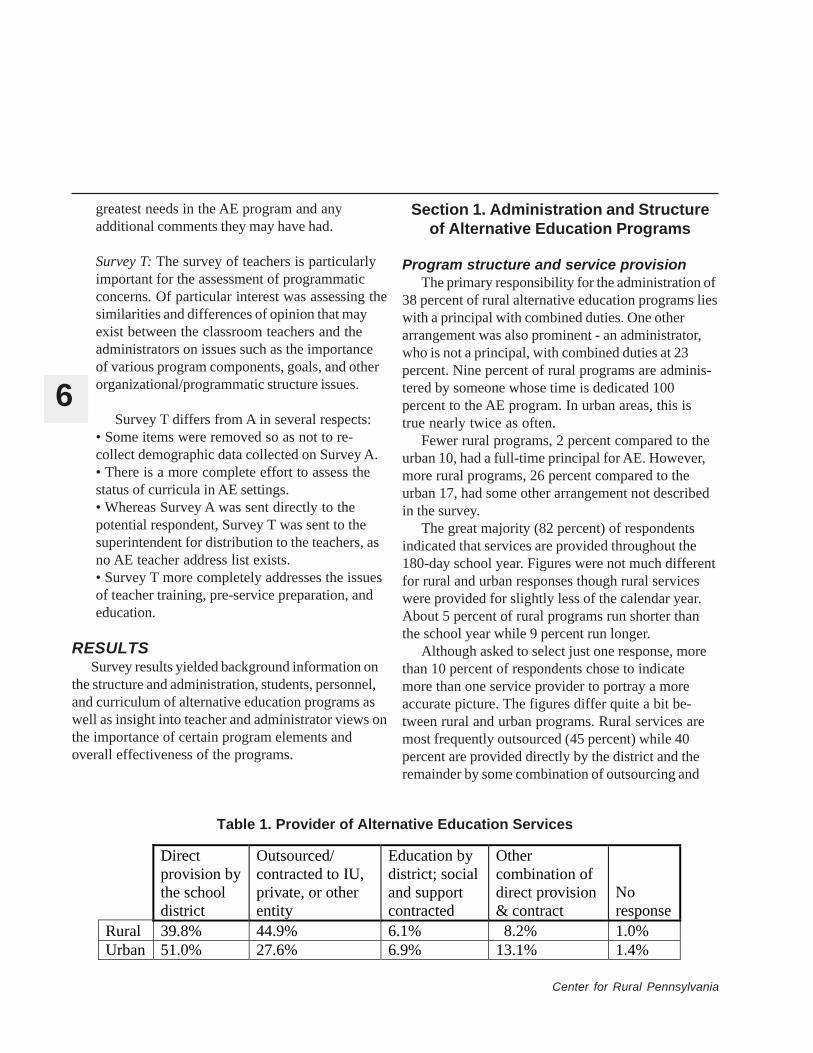
Although asked to select just one response, morethan 10 percent of respondents chose to indicatemore than one service provider to portray a moreaccurate picture. The figures differ quite a bit be-tween rural and urban programs. Rural services aremost frequently outsourced (45 percent) while 40percent are provided directly by the district and theremainder by some combination of outsourcing and
Table 1. Provider of Alternative Education Services
Direct provision by the school district
Outsourced/ contracted to IU, private, or other entity
Education by district; social and support contracted
Other combination of direct provision & contract
No response
Rural 39.8% 44.9% 6.1% 8.2% 1.0% Urban 51.0% 27.6% 6.9% 13.1% 1.4%
7
direct provision. On the other hand, in 51 percent ofurban programs, services are provided by the districtand 28 percent are outsourced.
In addition, 38 percent of respondents involved thelocal IU in service provision while 61 percent indi-cated that the IU did not participate.
More than one-third (36 percent) of rural AEprograms had a teacher for every six students. Lessthan 7 percent had more than 12 students per teacher.Rural classrooms tended to have fewer students perteacher than urban classrooms with 57 percent ofteachers having eight or fewer students compared to 49percent in urban areas.
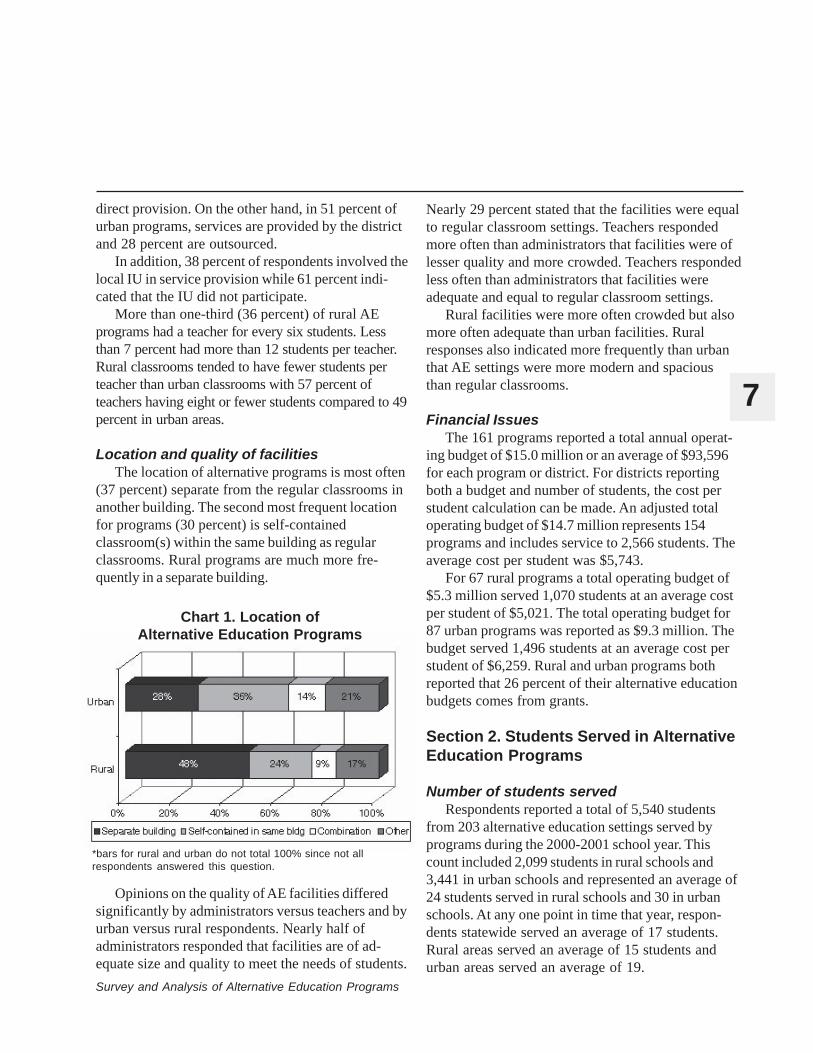
Location and quality of facilitiesThe location of alternative programs is most often
(37 percent) separate from the regular classrooms inanother building. The second most frequent locationfor programs (30 percent) is self-containedclassroom(s) within the same building as regularclassrooms. Rural programs are much more fre-quently in a separate building.
Opinions on the quality of AE facilities differedsignificantly by administrators versus teachers and byurban versus rural respondents. Nearly half ofadministrators responded that facilities are of ad-equate size and quality to meet the needs of students.
Nearly 29 percent stated that the facilities were equalto regular classroom settings. Teachers respondedmore often than administrators that facilities were oflesser quality and more crowded. Teachers respondedless often than administrators that facilities wereadequate and equal to regular classroom settings.
Rural facilities were more often crowded but alsomore often adequate than urban facilities. Ruralresponses also indicated more frequently than urbanthat AE settings were more modern and spaciousthan regular classrooms.
Financial IssuesThe 161 programs reported a total annual operat-
ing budget of $15.0 million or an average of $93,596for each program or district. For districts reportingboth a budget and number of students, the cost perstudent calculation can be made. An adjusted totaloperating budget of $14.7 million represents 154programs and includes service to 2,566 students. Theaverage cost per student was $5,743.
For 67 rural programs a total operating budget of$5.3 million served 1,070 students at an average costper student of $5,021. The total operating budget for87 urban programs was reported as $9.3 million. Thebudget served 1,496 students at an average cost perstudent of $6,259. Rural and urban programs bothreported that 26 percent of their alternative educationbudgets comes from grants.
Section 2. Students Served in AlternativeEducation Programs
Number of students servedRespondents reported a total of 5,540 students
from 203 alternative education settings served byprograms during the 2000-2001 school year. Thiscount included 2,099 students in rural schools and3,441 in urban schools and represented an average of24 students served in rural schools and 30 in urbanschools. At any one point in time that year, respon-dents statewide served an average of 17 students.Rural areas served an average of 15 students andurban areas served an average of 19.
Survey and Analysis of Alternative Education Programs
Chart 1. Location ofAlternative Education Programs
*bars for rural and urban do not total 100% since not allrespondents answered this question.
Center for Rural Pennsylvania
8
Thirty-seven percent of programs experiencedgrowth of 1 to 10 percent during the past five years.An additional 21 percent experienced a growth rateof 11 to 25 percent, while 15 percent of programsexperienced less than 1 percent growth or a decreaseduring the same period. These percentages should beviewed with caution as 26 percent of total responsesand 40 percent of rural responses fell in the “norecord or not applicable category.” Among thoseresponses, many were first-year programs.
Student demographics Gender was tracked and reported by 172 pro-
grams including 73 rural and 99 urban. Among the4,720 students served by those programs, 70 percentwere male and 30 percent were female.
Rural respondents reported the race of students asfollows: 93 percent white, 3 percent black, 1 percentHispanic or Latino, less than 1 percent both AmericanIndian or Alaskan Native and Asian, and 2 percentunknown. Urban respondents reported 83 percentwhite, 13 percent black, 2 percent Hispanic or Latino,and less than 1 percent each of Asian, more than onerace, American Indian or Alaskan Native, and un-known.
Administrators were asked to identify the percent-age of students served in their alternative educationsetting that had an Individualized Education Plan. Thisidentifies students with disabilities. Among rural
students, the average was 18 percent while the urbanaverage was 7 percent.
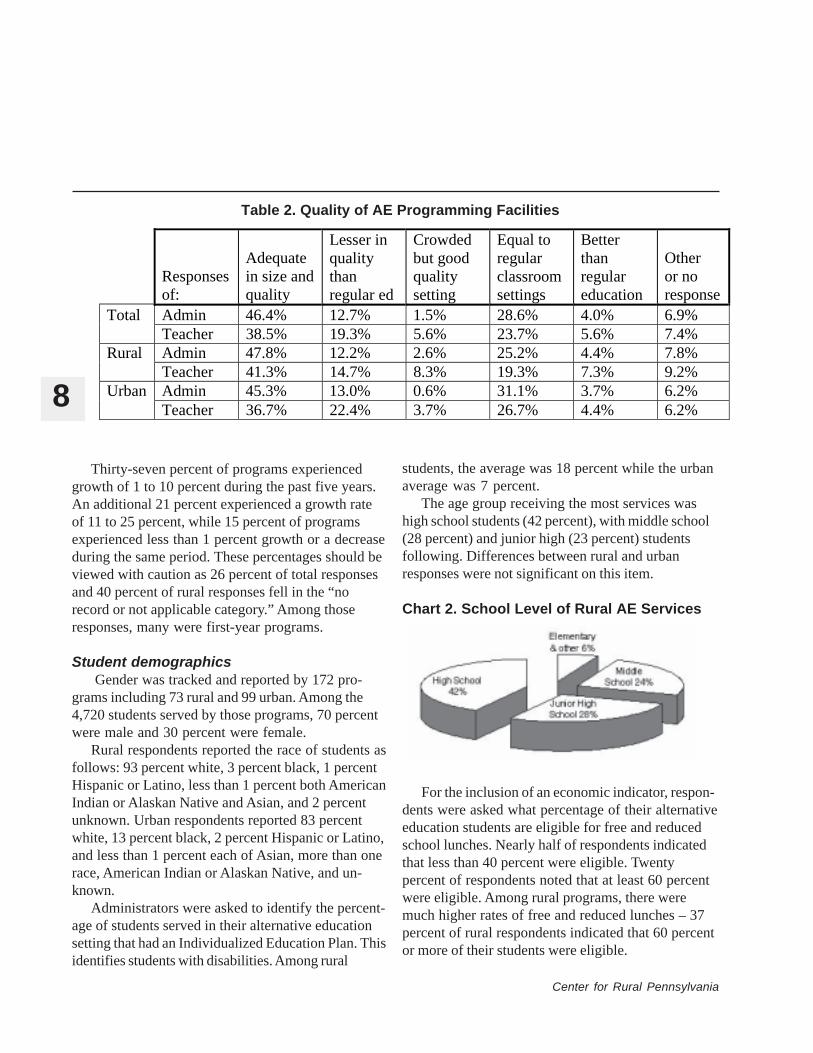
The age group receiving the most services washigh school students (42 percent), with middle school(28 percent) and junior high (23 percent) studentsfollowing. Differences between rural and urbanresponses were not significant on this item.
Responses of:
Adequate in size and quality
Lesser in quality than regular ed
Crowded but good quality setting
Equal to regular classroom settings
Better than regular education
Other or no response
Admin 46.4% 12.7% 1.5% 28.6% 4.0% 6.9% Total Teacher 38.5% 19.3% 5.6% 23.7% 5.6% 7.4% Admin 47.8% 12.2% 2.6% 25.2% 4.4% 7.8% Rural Teacher 41.3% 14.7% 8.3% 19.3% 7.3% 9.2% Admin 45.3% 13.0% 0.6% 31.1% 3.7% 6.2% Urban Teacher 36.7% 22.4% 3.7% 26.7% 4.4% 6.2%
Table 2. Quality of AE Programming Facilities
Chart 2. School Level of Rural AE Services
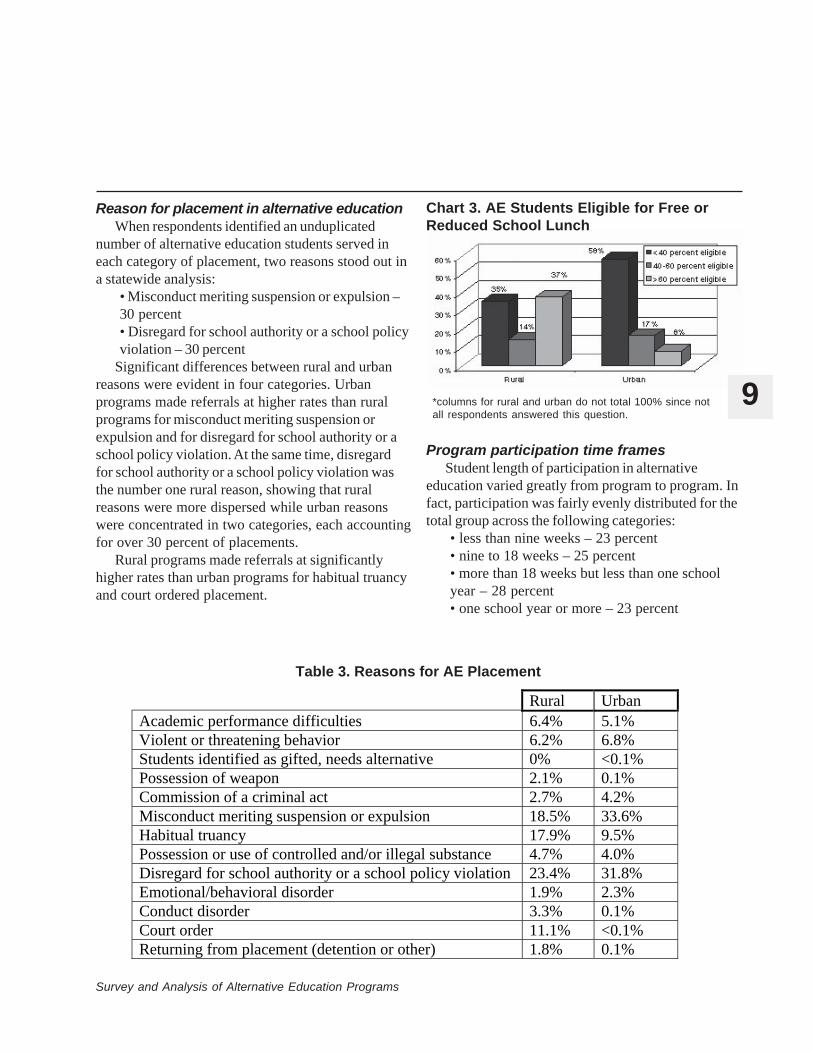
For the inclusion of an economic indicator, respon-dents were asked what percentage of their alternativeeducation students are eligible for free and reducedschool lunches. Nearly half of respondents indicatedthat less than 40 percent were eligible. Twentypercent of respondents noted that at least 60 percentwere eligible. Among rural programs, there weremuch higher rates of free and reduced lunches – 37percent of rural respondents indicated that 60 percentor more of their students were eligible.
9
Reason for placement in alternative educationWhen respondents identified an unduplicated
number of alternative education students served ineach category of placement, two reasons stood out ina statewide analysis:
• Misconduct meriting suspension or expulsion –30 percent• Disregard for school authority or a school policyviolation – 30 percent
Significant differences between rural and urbanreasons were evident in four categories. Urbanprograms made referrals at higher rates than ruralprograms for misconduct meriting suspension orexpulsion and for disregard for school authority or aschool policy violation. At the same time, disregardfor school authority or a school policy violation wasthe number one rural reason, showing that ruralreasons were more dispersed while urban reasonswere concentrated in two categories, each accountingfor over 30 percent of placements.
Rural programs made referrals at significantlyhigher rates than urban programs for habitual truancyand court ordered placement.
Program participation time framesStudent length of participation in alternative
education varied greatly from program to program. Infact, participation was fairly evenly distributed for thetotal group across the following categories:
• less than nine weeks – 23 percent• nine to 18 weeks – 25 percent• more than 18 weeks but less than one schoolyear – 28 percent• one school year or more – 23 percent
*columns for rural and urban do not total 100% since notall respondents answered this question.
Rural Urban Academic performance difficulties 6.4% 5.1% Violent or threatening behavior 6.2% 6.8% Students identified as gifted, needs alternative 0% <0.1% Possession of weapon 2.1% 0.1% Commission of a criminal act 2.7% 4.2% Misconduct meriting suspension or expulsion 18.5% 33.6% Habitual truancy 17.9% 9.5% Possession or use of controlled and/or illegal substance 4.7% 4.0% Disregard for school authority or a school policy violation 23.4% 31.8% Emotional/behavioral disorder 1.9% 2.3% Conduct disorder 3.3% 0.1% Court order 11.1% <0.1% Returning from placement (detention or other) 1.8% 0.1%
Table 3. Reasons for AE Placement
Chart 3. AE Students Eligible for Free orReduced School Lunch
Survey and Analysis of Alternative Education Programs

Center for Rural Pennsylvania
10
The length of participation in both rural and urbanprograms was most often more than nine weeks.Only 25.3 percent of rural and 18.0 percent of urbanstudents participated in programming for a period ofless than one nine-week term. Participation in alterna-tive programming for one year or more was morecommon among urban students. Among urbandistricts, 24.8 percent reported average participationof students as one school year or more. Among rural
districts, 19 percent reported average participa-tion of students for one school year or more.
Rural AE students tend to spend more timeper day in the AE classroom. More than half ofall respondents described the length of time
students spend each day in the alternative educationsetting as 3.5 to six hours per day. More than 20percent of students spent more than 6 hours per dayin alternative education. Rural and urban differenceswere significant in two areas: more urban districtsreported that students spent one to 3.5 hours per dayin an alternative setting, and more rural districtsreported 3.5 hours to six hours per day. These longerrural days may in part explain the shorter ruralparticipation terms.
There were also differences between the adminis-trators and teachers in reporting of the number ofhours per day that alternative students spend in thealternative setting. Most notably, more administratorsindicated that students were in the alternative class-room 3.5 to six hours per day. The number of re-sponses exceeds the number of respondents on thisitem, which suggests that some districts had program
components that varied the amount of time thatstudents are involved each day in the alternativesetting. This often is a function of student need forprograms and/or the type of programs provided tostudents.
Disposition of studentsWhat happens to students when they leave
alternative education at the end of the school year?The survey asked for an unduplicated number ofstudents who: returned to the regular classroom orhome school; returned to the home school but werereadmitted to the alternative education programduring the same year; did not return to the homeschool and left the program; and remained in theprogram. This snapshot report for the year 2000-2001demonstrated that 44 percent of students servedreturned to the regular classroom or home school. Asignificant number (37 percent) remained in alterna-tive education placement for the following year. Eightpercent of students returned to the home school butwere readmitted to the alternative program during thesame year. This was an impressively low number andreflected low recidivism given the population ofstudents served in alternative education. Twelvepercent of students did not return to the home schooland left the alternative program. This number in-cluded those who graduated as well as those whomay have dropped out of school. Future researchshould discriminate between the types of leaving thatmay occur.
Responses of:
Less than 1 hour per day
1 - 3.5 hrs per day
3.5 - 6 hrs per day
More than 6 hours per day
Varies by classroom
No response
Administrator 0% 8.4% 64.2% 21.1% 3.2% 3.2% Rural Teacher 3.0% 10.0% 53.0% 27.0% 7.0% 0% Administrator 0% 16.8% 55.0% 22.1% 3.8% 2.3% Urban Teacher 1.4% 28.2% 45.8% 20.4% 3.6% 0.7%
Table 4. Hours Students Spend Each Day in AE Setting
11
Section 3. Personnel in AlternativeEducation
Number of full-time equivalent (FTE) personnelFor this study, personnel are made up of adminis-
trators, teachers, psychologists, and social workers.The average number of FTE administrators in all AEprograms was less than one – the rural average was0.71 compared to 0.59 for urban. One rural respon-dent reported six FTE administrators. However, themost frequent response for both urban and rural waszero and the second most frequent was one FTEadministrator. Meanwhile, urban respondents reportedan average of 2.56 FTE teachers compared to therural 2.26. One rural respondent reported 14 FTEteachers and one urban reported 13.
Special education certified teachers averaged 0.70FTE in rural programs and 0.53 in urban. Thesenumbers reflect the disparity that also occurs underthe earlier item describing the number of studentswith an Individualized Education Plan (a requirementfor all special education students). Rural specialneeds students are served at considerably higherpercentages than are urban special needs students inalternative education programs.
An average of 0.32 FTE psychologists serve ruralprograms. The average for urban areas is 0.19 orabout one day in every five-day workweek. Thepresence of social workers inalternative education settings isalso more prevalent in ruralprograms, which report an aver-age of 0.88 FTE compared to theurban 0.64.
Teacher education, training,and professional preparation
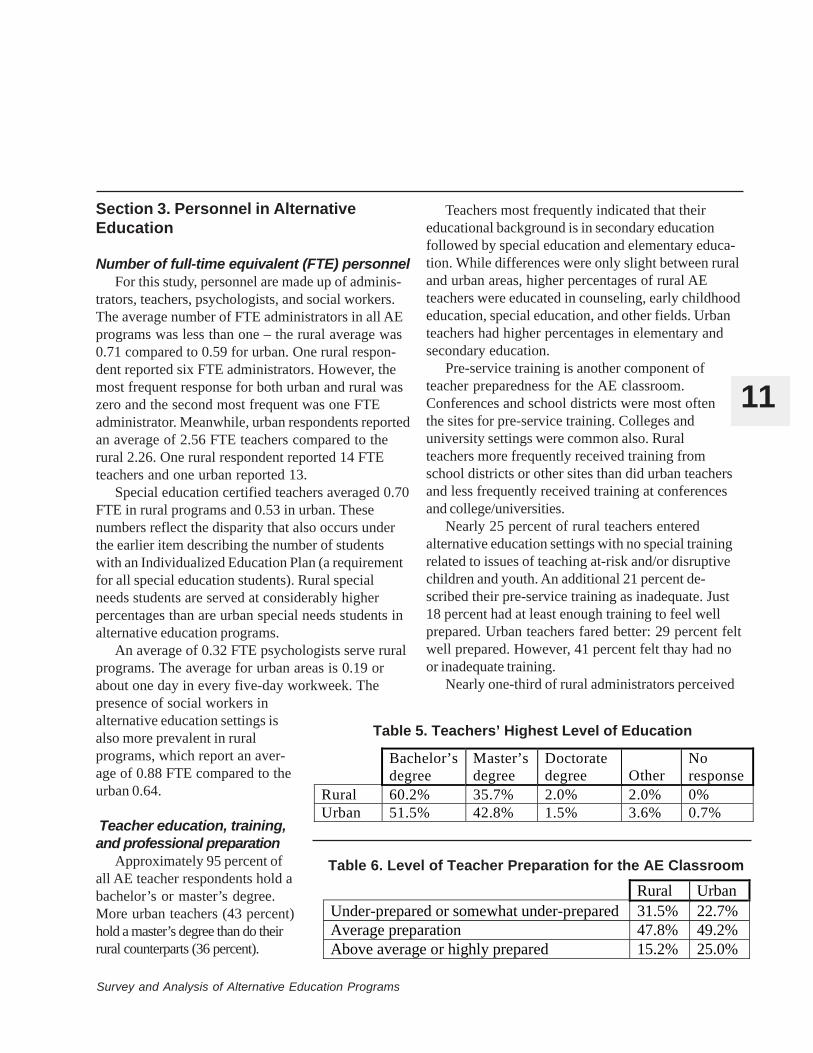
Approximately 95 percent ofall AE teacher respondents hold abachelor’s or master’s degree.More urban teachers (43 percent)hold a master’s degree than do theirrural counterparts (36 percent).
Teachers most frequently indicated that theireducational background is in secondary educationfollowed by special education and elementary educa-tion. While differences were only slight between ruraland urban areas, higher percentages of rural AEteachers were educated in counseling, early childhoodeducation, special education, and other fields. Urbanteachers had higher percentages in elementary andsecondary education.
Pre-service training is another component ofteacher preparedness for the AE classroom.Conferences and school districts were most oftenthe sites for pre-service training. Colleges anduniversity settings were common also. Ruralteachers more frequently received training fromschool districts or other sites than did urban teachersand less frequently received training at conferencesand college/universities.
Nearly 25 percent of rural teachers enteredalternative education settings with no special trainingrelated to issues of teaching at-risk and/or disruptivechildren and youth. An additional 21 percent de-scribed their pre-service training as inadequate. Just18 percent had at least enough training to feel wellprepared. Urban teachers fared better: 29 percent feltwell prepared. However, 41 percent felt thay had noor inadequate training.
Nearly one-third of rural administrators perceived
Table 5. Teachers’ Highest Level of Education
Bachelor’s degree
Master’s degree
Doctorate degree Other
No response
Rural 60.2% 35.7% 2.0% 2.0% 0% Urban 51.5% 42.8% 1.5% 3.6% 0.7%
Table 6. Level of Teacher Preparation for the AE Classroom
Rural Urban Under-prepared or somewhat under-prepared 31.5% 22.7% Average preparation 47.8% 49.2% Above average or highly prepared 15.2% 25.0%
Survey and Analysis of Alternative Education Programs
Center for Rural Pennsylvania
12
their AE teachers to be under-prepared to teach inthe alternative setting while 15 percent indicatedabove average preparation. Urban teachers wereseen as more prepared with 25 percent being aboveaverage and 23 percent below.
When administrators were asked about the needfor certain types of teacher preparation and develop-ment programs, 81 percent indicated a definite to highneed for professional development activities for
teachers, administrators, and other professionalsworking in alternative education settings. Anadditional 15 percent indicated some need. Therewas no significant variation between rural and
urban schools. Also, 82 percent of respondentsindicated some degree of need for a master’s degreeprogram in alternative education. Total urban respon-dents saw a slightly higher need than total rural. Butrural teachers and urban administrators rated theneed for a master’s program higher than did urbanteachers and rural administrators.
Among some professional development items,particular correlations are significant. To begin,respondents who rated teachers as being betterprepared tended to report that there was not a needfor professional development activities and alsogenerally indicated that a master’s program was notnecessary. Interestingly though, rural administratorsrated teacher preparation lower than did urbanadministrators but also rated the need for professionalactivities and a master’s program lower than did theirurban counterparts.
Section 4. Alternative Education Curriculum
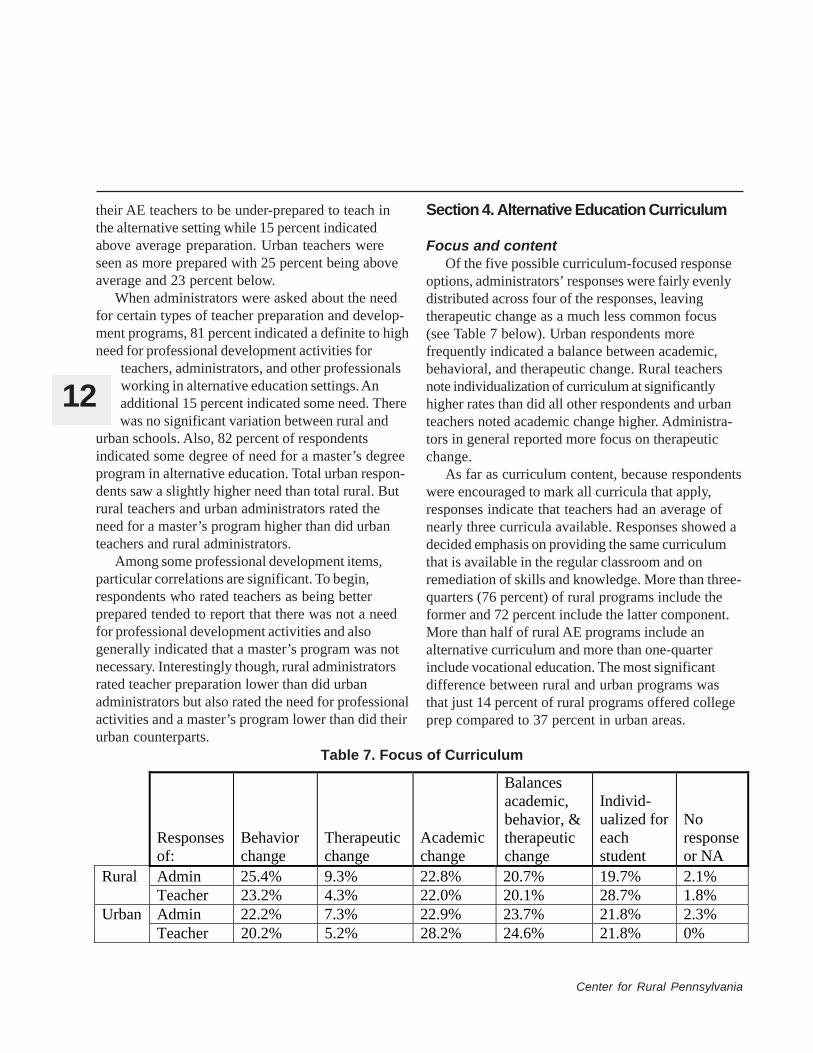
Focus and contentOf the five possible curriculum-focused response
options, administrators’ responses were fairly evenlydistributed across four of the responses, leavingtherapeutic change as a much less common focus(see Table 7 below). Urban respondents morefrequently indicated a balance between academic,behavioral, and therapeutic change. Rural teachersnote individualization of curriculum at significantlyhigher rates than did all other respondents and urbanteachers noted academic change higher. Administra-tors in general reported more focus on therapeuticchange.
As far as curriculum content, because respondentswere encouraged to mark all curricula that apply,responses indicate that teachers had an average ofnearly three curricula available. Responses showed adecided emphasis on providing the same curriculumthat is available in the regular classroom and onremediation of skills and knowledge. More than three-quarters (76 percent) of rural programs include theformer and 72 percent include the latter component.More than half of rural AE programs include analternative curriculum and more than one-quarterinclude vocational education. The most significantdifference between rural and urban programs wasthat just 14 percent of rural programs offered collegeprep compared to 37 percent in urban areas.
Table 7. Focus of Curriculum
Responses of:
Behavior change
Therapeutic change
Academic change
Balances academic, behavior, & therapeutic change
Individ-ualized for each student
No response or NA
Admin 25.4% 9.3% 22.8% 20.7% 19.7% 2.1% Rural Teacher 23.2% 4.3% 22.0% 20.1% 28.7% 1.8% Admin 22.2% 7.3% 22.9% 23.7% 21.8% 2.3% Urban Teacher 20.2% 5.2% 28.2% 24.6% 21.8% 0%

13
Comparisons with regular classroomTeachers generally indicated the following about
alternative education classrooms:• teacher to student ratio is smaller;• there is more latitude to change, adapt, or createcurricula;• age and grade differences make it necessary toimplement varied curricula within the sameclassroom;• there is more emphasis on social skills training;• in general, students seem to maintain currentacademic levels or make gains after alternativeeducation participation;• there is more emphasis on discussing or workingon personal issues; and• there is more emphasis on discipline.
Urban and rural differences on these items arenominal except on the academic gain and disciplineitems. Urban teachers indicate that students seem tomaintain current academic levels or make gains afteralternative education participation at a rate of about10 percentage points higher than rural teachers. Ruralteachers indicate that more emphasis is placed ondiscipline at a rate that is 14 percentage points higherthan urban teachers.
Other differences are that more rural teachers, 58percent versus 52 percent of urban, reported that AEstudents are excluded from some parts of the curricu-lum available to regular education students; morerural (43 percent) than urban (37 percent) respon-dents have fewer curriculum resources available than
the regular education classroom; and fewer ruralrespondents, 24 percent compared to the urban 33,indicated that transition planning occurs for all students.
Family involvementMore than 40 percent of responses on both
surveys cited that programs work with families on anas needed basis, and approximately 20 percent hold aminimum of one meeting that includes family mem-bers each academic year. According to teachers,just below 9 percent of urban programs and justover 9 percent of rural programs do not includefamily involvement as a program component.There were small differences between rural andurban respondents where fewer rural programsprovide counseling support to family members.Interestingly, teachers and administrators in rural andurban areas followed no pattern of higher or lowerresponses.
AssessmentAbout one-third of respondents indicated that
assessment occurs prior to program entry and isincluded in referral documents. Approximately one-quarter indicated that assessment is the responsibilityof a professional team, and an additional one-fifthattributed assessment responsibility to the alternativeeducation teacher.
Again there is no clear pattern of rural, urban,teacher, and administrator responses although itseems that true responsibility may be hard to place -
Responses of:
On as needed basis
Meetings monthly or more
Minimum of one meeting per year
Provide counseling support to family members
Not a program component Other
No response or not applicable
Admin 43.8% 9.7% 23.6% 11.1% 6.9% 2.1% 2.8% Rural Teacher 47.9% 4.3% 18.6% 8.6% 9.3% 10.7% 0.7% Admin 44.3% 8.5% 19.4% 12.4% 9.5% 3.0% 3.0% Urban Teacher 40.7% 8.6% 23.1% 9.9% 8.6% 0% 0.4%
Table 8. Family Involvement in AE Program
Survey and Analysis of Alternative Education Programs
Center for Rural Pennsylvania
14
fewer administrators saw assessment as the responsi-bility of a lead administrator, and fewer rural teacherssaw it as the teacher’s role. Fewer teachers thanadministrators viewed assessment as the responsibil-ity of a guidance office.
Section 5. Importance of ProgramElements and Effectiveness of Programs
Using a scale of one to five, respondents indicatedtheir opinions and perceptions on the effective-ness or importance of certain AE programvariables. The scale represented “ineffective toeffective” and “unimportant to important,” but
respondents were not given specific guidelines fordefining effectiveness, so each respondent might haveunderstood terms somewhat differently. Averageratings of 3.5 to 5.0 indicated an opinion of higheffectiveness or importance while ratings of one to2.4 indicated an opinion in the opposite direction.
Respondents rated the importance of the followingprogramming elements/processes and AE goals:
Program Elements/ProcessesAcademic programmingTherapeutic programmingBehavior change programmingDisciplinary programmingCareer interest programming
AE GoalsImproved academic performanceImproved self-esteemImproved change in behaviorImproved social skillsDevelopment of leadership skillsPro-social attitudeDevelopment of external interestsCareer selection skillsDevelopment of a positive attitudeImproved attendance
On the above processes and goals, teachers’ andadministrators’ ratings were similar, however, disci-
plinary programming was statistically more importantto teachers (rating of 4.28 vs. 4.08). With someexceptions, urban respondents tended to rate itemsslightly higher in importance than did rural respon-dents. Urban and rural respondents rated the develop-ment of a positive attitude and the enhancement ofself-esteem identically (4.27), and rural respondentsrated the development of pro-social attitudes some-what higher than did urban respondents (rating of4.26 vs. 4.20).
Improved change in behavior, which received arating of more than 4.5 by all four groups, was seenas the most important goal for AE programs whilebehavior change programming was the most impor-tant process. Improved attendance was the secondmost important goal. All goals and processes exceptdevelopment of leadership skills received scores ofgreater than 3.5 by all groups indicating that they areall seen as important. Leadership was not far behindwith an average rating of 3.45.
Teachers and administrators were also asked toevaluate the effectiveness of their alternative educa-tion programs according to the following expectedoutcomes:
Improved: Academic performance, attendance,interest in school, target behaviors, and careerinterestReduced: Suspension, tardiness, disruptivebehavior, failure, dropout rate
Teachers’ ratings were slightly higher for all issuesexcept reduced tardiness. Statistically, teachers ratedprogram effectiveness significantly higher than didadministrators in improving academic performance,interest in school, and career interests, and in reduc-ing failure. Teacher respondents rated programs asmost effective in reducing suspension, academicfailure, and disruptive behavior and in improvedschool attendance, while administrators rated pro-grams as most effective in reducing suspension,disruptive behavior, tardiness, and dropout rates.
Though average rates were again very similar,urban respondents rated program effectivenessslightly higher than did their rural counterparts.
15
Despite this trend, the difference was only significantfor academic performance and the dropout rate. Bothrural and urban respondents rated programs as mosteffective in reducing suspension, disruptive behavior,and academic failure and in improving attendance.
Only for reducing suspension did all four groupsrate AE effectiveness as at least four on the scale ofone to five. Although all groups rated improvedinterest in school at less than three, for no issue wasAE perceived by respondents to be ineffective.
CONCLUSIONS
Programs and AdministrationClearly the number of alternative education
programs in Pennsylvania is quite large: 463 alterna-tive education programs were funded in 2001–2002by the Pennsylvania Department of Education under“Disruptive Youth” programming legislation. Manyadditional programs are funded through local schooldistricts, grant programs and other sources. Bysending the survey to school district superintendentsfor distribution, the researchers intended to focus onschool district supported programs, whether thedistrict provided services directly or contractedservices.
Regarding the Type I- Academic, Type II- Disci-pline, and Type III- Therapeutic classification dis-cussed in the literature review, Gregg (1999, p 108)notes that the distinction between types is not rigid.This statement is consistent with the findings inPennsylvania programs. It is clear that Type II-Discipline program components are common to mostprograms. However, it is equally clear from thesurvey that components of the academic and thera-peutic approaches are included in programs. Surveyresults of teachers and administrators help to identifysome overriding characteristics of programs inPennsylvania. The list of characteristics crosses allthree program types:
• The programs are generally more than one-halfday and often full-day programs.
• Services are provided throughout the 180-dayschool year (82 percent of respondents).• More than 50 percent of students spend at leastone-half year in the alternative program, with 23percent spending a full school year or more.• Teacher to student ratios are most often 1-to-6and the large majority of programs have ratios ofone teacher to 12 or fewer students.• Curricula are geared most highly towardacademic change and/or behavior change andindividualization.• A significant number of programs indicateworking on balanced multiple foci that includeacademic, therapeutic, and behavior change.• More than 60 percent of respondents to theteacher survey note that curricula are individuallyadapted in the alternative setting.• In general, career counseling and career curriculaappear to be of only modest priority.• Discipline and behavior change are cited mostoften as important processes for these programsthough more than two-thirds of respondents alsoindicated the importance of therapeutic program-ming.• 67 percent of respondents name their locationas separate from the regular classroom in anotherbuilding or a self-contained classroom in the samebuilding as regular education.
Alternative education programs in Pennsylvaniaare typically administered or managed by personnelwith combined duties. The lead person is a principalwith combined duties 37 percent of the time and anadministrator, not a principal, with combined duties anadditional 25 percent of the time. Full-time assignmentof an administrator for a program is rare and may berelated to the relatively small size of most programs.Nevertheless, the student population, special curricu-lum concerns, need for personnel professional devel-opment, and numerous administrative and organiza-tional structural design concerns make the assignmentof a full-time administrator an important issue fordecision-maker consideration.
Survey and Analysis of Alternative Education Programs
Center for Rural Pennsylvania
16
StudentsThe population of students in alternative programs
has steadily increased. Over the past five years, 37percent of programs experienced increases in stu-dents of up to 10 percent, and an additional 21percent of programs experienced between 11 and 25percent growth. Students in the surveyed programswere predominantly white (87 percent) and male (70percent). Urban students were more racially diverse
with 83 percent being white compared to 93percent of rural AE students. But rural programshad proportionately more students with disabilitiesthan did urban programs, perhaps excessively so.
Where 18 percent of rural AE students had disabili-ties, the figure was 7 percent in urban programs.
According to respondents, 93 percent of alterna-tive education efforts target students in grades 7through 12. Only 4 percent of respondents indicatethat programs are reaching into the elementarygrades to provide services. Targeting a specificpopulation of youth seems to be an important piece ofresolving the issues of disruptive youth in our schoolsystems. This supports the Cox and Davidson (1995)contention that programs targeting specific popula-tions seem to have more impact with students.However, the following three statements may also betrue: high-risk students are identifiable early in theirschool careers, perhaps as early as 3rd grade; parentinvolvement is integral to success and may be easierto obtain with younger children; and early interventioninto failure experiences by providing support mayprevent or more quickly replace faulty thinkingpatterns, negative self-concept difficulties, andbehavioral problems. The risks for earlier programsare inappropriate labeling and focusing upon riskrather than resilience. A longitudinal study that tracksthe intervention methods, successes, and failures ofour current elementary alternative education pro-grams may be key to our knowing whether or notcontinued and expanded investment in these programsis worthwhile.
Legislation appears to have a significant impact onthe reasons students are placed in alternative educa-
tion settings. The combination of the Act 30 guide-lines, wording in Act 48, and school district responsesto the survey make it clear that Pennsylvania’semphasis for alternative education is Type II-Disci-pline programming. Act 48 specifically states thatalternative education programs are “designed tomodify disruptive behavior.” Act 30 guidelines forreferral outline specific criteria that help to furtherdefine the types of disruptive behavior that qualifystudents for receiving services. The survey resultsconfirm that programs are using these criteria toadmit students into AE settings. This finding is notsurprising since most alternative education providersin the commonwealth are receiving some portion offunding through the act. The finding does mask thefact that there are other legitimate reasons forproviding alternative education services in ourschools.
Somewhat surprising to investigators was the lowpercentage of students in alternative education (0.3percent) who were returning from a detention orother juvenile delinquency placement. This lowpercentage exists despite the fact that state programguidelines specifically include this as one population ofstudents that may be served. Related to this issue, thePhiladelphia Inquirer (S. Snyder, May 25, 2002)reports that during a seven-month period, 837 delin-quent youth were returned to Philadelphia schoolsfrom detention placements. Only 64 percent of thereturning students actually attended school and 14percent of the attending students were suspended forunacceptable behavior. Higher use of alternativeeducation as a bridge back into the school systemmay serve as a valuable transition support to youthleaving those settings. The reasons for not using AEas a transition to regular school for previously de-tained students are unclear. The issue requires furtherstudy in which the following questions might be asked:Are options other than alternative education used?Are teaching and administrative professionals indetention and other placement settings sufficientlyaware of AE school presence in communities?
One additional finding related to the referral/
placement process was that students are not typicallyreferred to alternative education because of issuesrelated to giftedness (adjustment, marginal perfor-mance, etc.) Only 0.05 percent of students in oursample were identified as “gifted” and in need of analternative classroom. So, while there are AE programsdesigned to address the needs of gifted students, theyare not well represented in this survey sample.
Returning students to the regular classroom is astated goal for AE under state guidelines. Studentsgenerally did return to the regular classroom or homeschool, but more than one-half remained in AEplacement for the following year. The length ofparticipation in the alternative education setting variedbut was usually more than a few months. Emergency,or in-and-out types of placement, lasting 30 days orless are not used to a great extent. This bodes wellfor students who may benefit from the consistency,stability, security, and individual attention afforded byalternative education.
Importantly, less than one-third of programs use aformal transition program to support students forregular education re-entry. Further study may help todetermine whether or not transition programmingwould enhance return rates to the regular classroom.A significant component of that study would be tolook at whether students returning to the regularclassroom later return to AE. Additional study shouldalso include tracking the progress of all studentsparticipating in alternative education for a specifiedperiod after leaving the program.
PersonnelRural and urban programs appear to maintain
student teacher ratios that foster individual attentionand important instructional considerations, such asdifferentiating instruction when working with multipleability and age levels. Rural schools appear to usespecial education professionals at higher rates thanurban schools. This is aligned with the fact that theyalso serve a higher percentage of special educationstudents. Psychologists and social workers are bothrepresented as less than one full-time equivalent
across all programs. Comments stressed the need formore counseling assistance.
Fifty-five percent of teachers hold a bachelor’sdegree. Approximately 40 percent hold master’sdegrees. Teachers are most commonly trained insecondary education (34 percent), special education(19 percent), and elementary education (19 percent).Teachers had no pre-service training or pre-servicetraining that was inadequate 43 percent of the time.
Training, education, and professional develop-ment issues are crucial to AE. Teachers often findthemselves under-prepared or totally unprepared forwork in these settings. Knowledge of a wide rangeof curricula, specialized pedagogical techniques, class-room management, helping skills, and other skills andknowledge related to working with high-risk children andyouth are required, yet there are no AE undergraduatedegree programs in Pennsylvania with the lone excep-tion of a minor at Lock Haven University of Pennsylva-nia. There are few graduate degree programs in thisarea nationwide with only one in Pennsylvania atLock Haven University. This leaves thousands ofteachers without training for the specialized duties ofan AE teacher.
As many teachers have noted in this survey and inconversation, teacher preparation programs gearedtoward working in the regular education classroom donot prepare one for the realities of the AE classroom.Furthermore, many teachers end up in AE as a place-ment rather than a choice. Perhaps we must worktoward the day when alternative education is the settingof choice for both the student and the faculty member.
CurriculumThe curriculum responses generated many issues
for further investigation and discussion. In exploringresponses to the question “In what ways is thecurriculum the same or different from the regularclassroom?” there were a number of positive indica-tors in AE including:
• Curriculum is adapted individually – age andgrade differences make it necessary to implementvaried curricula within the same classroom.
Survey and Analysis of Alternative Education Programs
17
Center for Rural Pennsylvania
• There is more emphasis on social skills trainingand on personal issues.• The teacher to student ratio is appropriatelyincreased to facilitate programming.• In general, students seem to maintain currentacademic levels or make gains after alternativeeducation participation.
One concern, particularly given the placementnature of a large majority of Pennsylvania programs,
was that more than one-third of AE teachers hadfewer curriculum resources than did regularclassroom teachers. Furthermore, nearly 55percent indicated that students in AE are excluded
from some parts of the curriculum that are availableto regular education students. This fact brings intoquestion “separate but equal” rights to education.While there may be administrative mechanisms toassist programs in avoiding the hammer of this law, it isthe spirit of the law that is of concern here. AE studentsneed the best curriculum and best teachers to becomesuccessful.
Of lesser yet important concern is the issue offamily involvement. The most frequent responseregarding family involvement was that it is involvedon an as-needed basis. Family involvement in pro-gramming is critical to success for many students.Making family involvement an integral part of thesystem for delivering AE services is more likely toyield success than an “as-needed” approach.
EffectivenessAdministrators and teachers view alternative
education programs as effective in reducing disruptivebehavior, reducing suspension/expulsion, improvingschool attendance, reducing tardiness or truancy, andchanging target behaviors. To a somewhat lesserextent they also indicate effectiveness in reducingacademic failure, reducing dropout rates, and improv-ing academic performance. Programs, in the opinionof respondents, are less effective in developing careerinterests and improving interest in school activities.These respondent perceptions are comparable towhat others have stated in the literature.
Interestingly, urban respondents viewed their
programs as significantly more effective in improvingacademic performance and reducing academicfailure than their rural counterparts. This differencemay be related to the fact that urban teachersindicated that AE has the “same or more curriculumresources available as the regular classroom” at ahigher rate than did rural teachers. Teachers in ruralsettings also indicated that “more emphasis is placedon discipline in the alternative education classroom”at much higher rates than urban teachers. Perhapsthe answer lies in program emphasis. Resources andprogram emphasis are two areas for further explora-tion since it is not possible to be conclusive basedupon results of the current study.
RECOMMENDATIONS
1. Continued funding for alternative educa-tion projects. The legislature, Department ofEducation, and local school districts should continueto provide funding, at increased levels, for alternativeeducation. The survey provides support for the ideathat alternative education is an appropriate educa-tional service for meeting the needs of many stu-dents who have not made it in the traditional, regularclassroom. Qualitatively, the projects appear to beeffective in areas including but not limited to reduc-ing disruptive behavior, dropout rates, suspension,habitual truancy, tardiness, and academic failure andin improving attendance. The survey results alsoshowed a low recidivism rate (only 8 percent ofstudents returned to alternative education afterreturning to the home school from an initial alterna-tive education placement) for students served withinthe 2000-2001 year. Multiple years of data collectionon each student served by alternative educationprograms will be important to provide quantitativesupport for the perceptions of teachers and adminis-trators in this survey data. The state Department ofEducation has begun a data collection processthrough their annual reporting system.
Editor’s note: In the 2003-2004 state budget,the General Assembly approved $7.2 million forAlternative Education Demonstration Grants.
18
2. Further evaluation of the efficacy of apredominantly disciplinary approach. The fundingregulations that intended to keep disruptive andmarginal high-risk students in school may lead to aseparate and unequal education experience foralternative education students and teachers. Forexample, separate facilities and/or separate adminis-tration and staffing sometimes include inadequateadministrative structures, inadequate curriculum,inadequate facilities and/or equipment and supplies,and student and teacher disengagement from thehome school. Often, for these high-risk students tosucceed in the long run, they will require the best thatcan be offered in each area of service. Can theseproblems be avoided by additional funding and/oreducation models that offer innovative curriculumapproaches and keep students engaged?
3. A reevaluation of the funding allocationformula to provide a higher per child funding inrural areas. In the survey sample, rural programswere spending fewer dollars per child than theircounterparts in urban settings. This result is basedupon the total unduplicated number of students servedby responding districts divided into the alternativeeducation program’s operating budget for the year. Atthe same time, urban teachers report the “same ormore curriculum resources available as the regularclassroom” at a higher rate than rural teachers, andrural teachers report that alternative education has“fewer curriculum resources available” at a muchhigher rate than their urban counterparts. The surveyalso demonstrated that urban administrators andteachers perceived their programs to be more effec-tive on key variables in the survey. Are these issuesrelated to funding available to the projects? TheDepartment of Education provides awards allocatedon a per child basis, however a clear disparity be-tween rural and urban expenditures per child existsaccording to our survey results. Are rural districtsunable to adequately supplement the allocation withadditional funds due to a limited tax base or is thereanother reason for the disparity?
4. Development of pilot projects that focusexclusively on providing services designed toengage families of high-risk children in theeducational process. Survey analysis indicatessome breakdown in programming at the level offamily involvement. Nowhere is family involvement ineducation more important than with the at-risk child.According to survey results, families are most oftenincluded in alternative education efforts on an as-needed basis. Because current funding allocationsdo not appear to be adequate for extensive familyprogramming and/or counseling efforts, the statusof family involvement in alternative educationprogramming is unlikely to change without aspecific legislative mandate. Therefore, the research-ers encourage legislators to look seriously at the issueof expending significant pilot project dollars forprograms that focus exclusively on providing servicesdesigned to engage families of high risk children in theeducational process. Professionals in education, childwelfare, mental health, and juvenile justice agree thatin many cases it is quite easy to identify children at avery early age who will end up in their servicesystems. Furthermore, all agree that meaningfulfamily involvement is key to long-term success forthese children.
5. Adequate training and professional devel-opment support for teachers working with high-risk children and youth in alternative educationsettings. The survey indicated that both administra-tors and teachers see the need for ongoing profes-sional development activities, including appropriategraduate coursework, to be effective in working withdisruptive youth in the classroom. State and schooldistrict funding must account for the different needsof these teachers and administrators in allocatingfunds for professional development.
Survey and Analysis of Alternative Education Programs
19
20
Center for Rural Pennsylvania
References
Cox, S. and Davidson, W. 1995. A Meta-Analytic Assessment of Delinquency-Related Outcomes ofAlternative Education Programs. Crime & Delinquency. [electronic version] 41: 219-235
Gregg, S. 1999, Nov/Dec. Creating Effective Alternatives for Disruptive Students. The Clearing House73, 2, 107-114. Retrieved June 2, 2002 from EBSCO host database.
Guerin, G. and Denti L. 1999, Nov/Dec. Alternative Education Support for Youth At-Risk. The ClearingHouse 73, 2, 76-79. Retrieved June 2, 2002 from EBSCO host database.
Katsiyannis, A. and Williams, B. 1998. A National Survey of State Initiatives on Alternative Education.Remedial & Special Education 19, 5, 276-285. Retrieved June 2, 2002 from EBSCO host database.
McGee, J. 2001. Reflections of an Alternative School Administrator. Phi Delta Kappan [electronicversion] 82, 8, 588-592. Retrieved June 2, 2002 from EBSCO host database.
Raywid, M. A. 2001. What to Do with Students Who Are Not Succeeding. Phi Delta Kappan [elec-tronic version] 82,8, 582-585. Retrieved June 2, 2002 from EBSCO host database.
Tobin, T. and Sprague, J. 2000. Alternative Education Strategies: Reducing Violence in School and theCommunity. Journal of Emotional and Behavioral Disorders 8, 3, 177-187. Retrieved June 2, 2002from EBSCO host database.

Center for Rural Pennsylvania200 North Third St., Suite 600Harrisburg, PA 17101Phone (717) 787-9555Fax (717) 772-3587www.ruralpa.org1P0703-500
Representative Sheila MillerChairman
Senator Mary Jo WhiteVice Chairman
Representative Mike HannaTreasurer
Dr. C. Shannon StokesPennsylvania State UniversitySecretary
Dr. Nancy FalvoClarion University
Dr. Stephan J. GoetzNortheast Regional Center for Rural Development
Dr. Robert F. PackUniversity of Pittsburgh
Dr. Craig D. WillisLock Haven University
Senator John Wozniak
The Center for Rural PennsylvaniaBoard of Directors