Embed Size (px)
Citation preview
i
SURVEY ANALYSIS OF WINE LABEL PREFERENCES
Presented to the
Faculty of the Agribusiness Department
California Polytechnic State University
In Partial Fulfillment
Of the Requirements for the Degree
Bachelor of Science
By
Holly McGinty
December 2010
ii
APPROVAL PAGE
TITLE: A Survey Analysis of Wine Label Preferences in San Luis Obispo County
AUTHOR: Holly McGinty DATE SUBMITTED: December 2010
__________________________ ___________________________
Senior Project Advisor Signature
iii
ABSTRACT
This study was undertaken to determine what preferences San Luis Obispo County wine
consumers have for wine labels. This will help wineries and wine marketers provide wines with
labels that attract and stand out to consumers in San Luis Obispo County. As the face of a wine
bottle, the label will attract consumers who consider it an important part of their purchase.
This report determines these preferences through two steps. The first step is a survey
distribution was used to collect primary data from 50 consumers at various grocery stores
throughout the county. Frequency, crosstabs chi-square, and independent sample t-tests have
been run using the survey data, which will aid in determining which characteristics are most
desired and important.
It is concluded that wineries and wine marketers should design labels that are interesting,
eye-catching, colorful, creative, unique, feature an animal and a themed color scheme. These
attributes will attract consumers in San Luis Obispo County who consider wine labels very
important and therefore increase sales.
iv
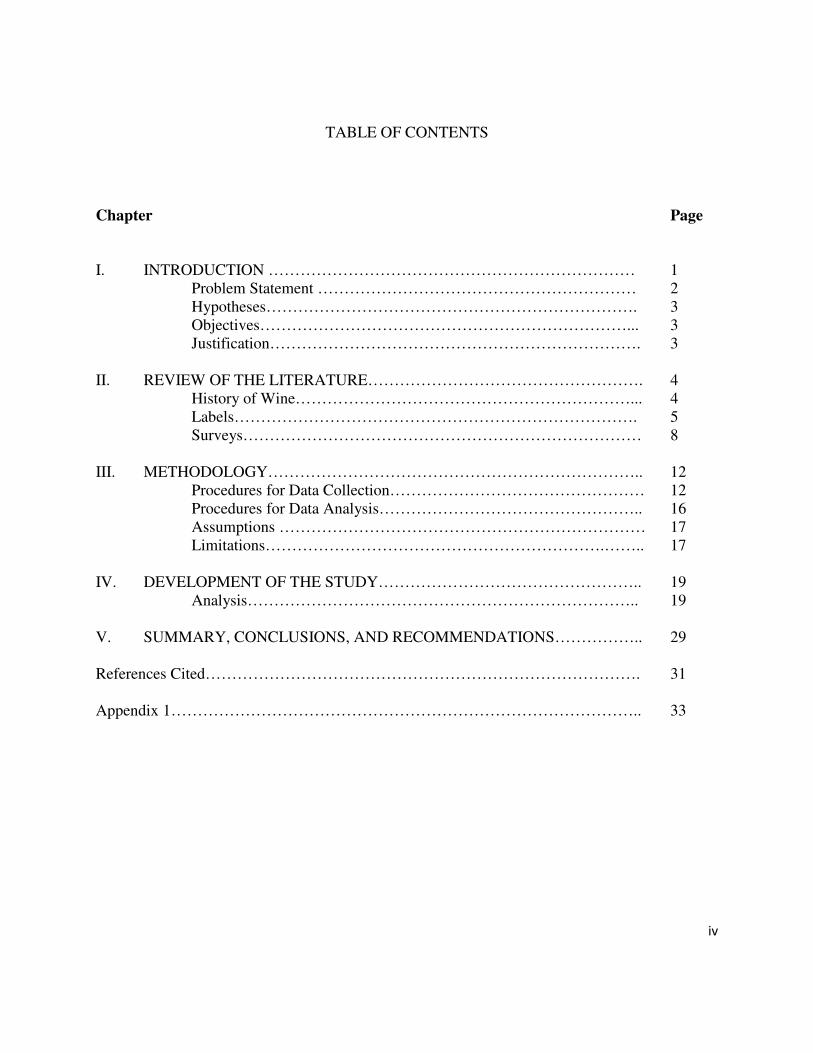
TABLE OF CONTENTS
Chapter Page
I. INTRODUCTION …………………………………………………………… 1 Problem Statement …………………………………………………… 2 Hypotheses……………………………………………………………. 3 Objectives……………………………………………………………... 3 Justification……………………………………………………………. 3
II. REVIEW OF THE LITERATURE……………………………………………. 4
History of Wine………………………………………………………... 4 Labels…………………………………………………………………. 5 Surveys………………………………………………………………… 8
III. METHODOLOGY…………………………………………………………….. 12 Procedures for Data Collection………………………………………… 12 Procedures for Data Analysis………………………………………….. 16 Assumptions …………………………………………………………… 17
Limitations……………………………………………………….…….. 17 IV. DEVELOPMENT OF THE STUDY………………………………………….. 19
Analysis……………………………………………………………….. 19 V. SUMMARY, CONCLUSIONS, AND RECOMMENDATIONS…………….. 29 References Cited………………………………………………………………………. 31
Appendix 1…………………………………………………………………………….. 33
v
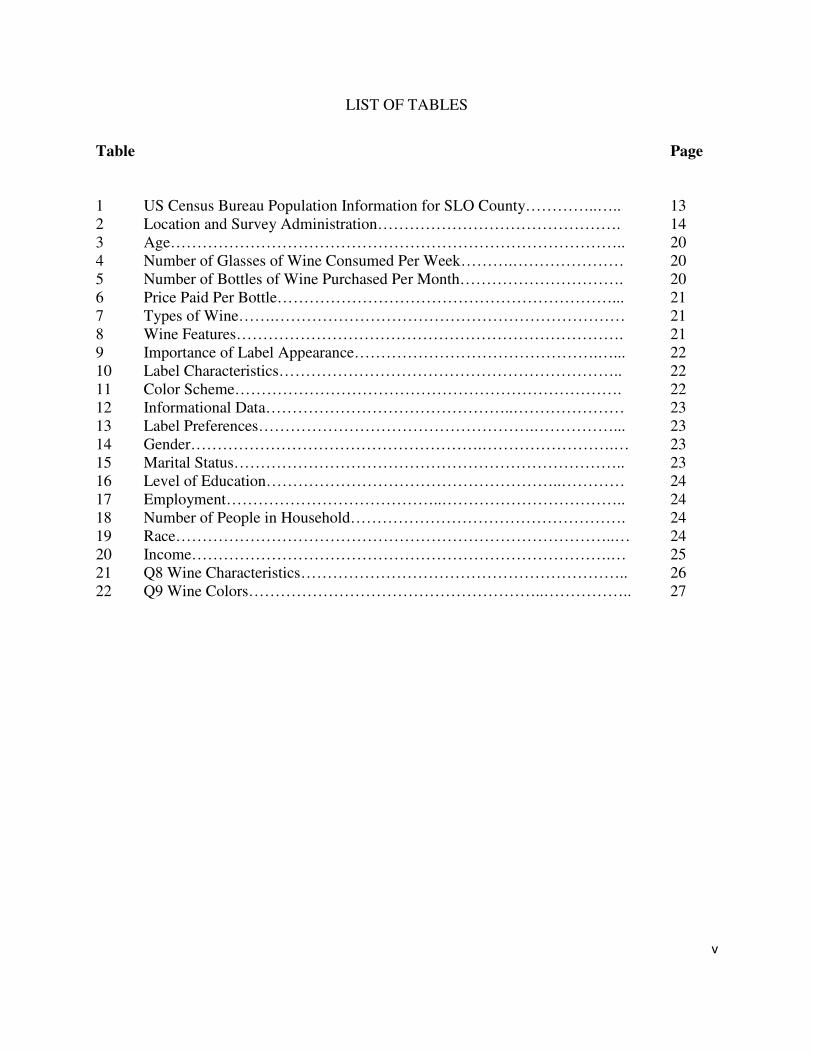
LIST OF TABLES
Table Page
1 US Census Bureau Population Information for SLO County…………..….. 13 2 Location and Survey Administration………………………………………. 14 3 Age………………………………………………………………………….. 20 4 Number of Glasses of Wine Consumed Per Week……….………………… 20 5 Number of Bottles of Wine Purchased Per Month…………………………. 20 6 Price Paid Per Bottle………………………………………………………... 21 7 Types of Wine…….………………………………………………………… 21 8 Wine Features………………………………………………………………. 21 9 Importance of Label Appearance……………………………………….…... 22 10 Label Characteristics……………………………………………………….. 22 11 Color Scheme………………………………………………………………. 22 12 Informational Data………………………………………..………………… 23 13 Label Preferences…………………………………………….……………... 23 14 Gender……………………………………………….…………………….… 23 15 Marital Status……………………………………………………………….. 23 16 Level of Education………………………………………………..………… 24 17 Employment…………………………………..…………………………….. 24 18 Number of People in Household……………………………………………. 24 19 Race………………………………………………………………………..… 24 20 Income…………………………………………………………………….… 25 21 Q8 Wine Characteristics…………………………………………………….. 26 22 Q9 Wine Colors………………………………………………..…………….. 27

1
CHAPTER 1
INTRODUCTION
The popularity of wine drinking and wine making in the U.S. dates all the way back to
the first settlers in America. Although already popular overseas, Americans made wine
consumption a ritual to their culture. The enjoyment that wine has brought to America over the
years has grown and transformed into a multibillion-dollar industry. With California being the
home to the very first vineyard in America, it is the number one wine producing state (Tasting
Wine). California’s 3,000 wineries and $17.9 billion in sales make it difficult for a winery to
create a wine that stands out among this vastly growing industry (Wine Institute 2009).
As the number or wineries increase across the country and state, it is becoming harder
and harder for each winery to stand out among the rest. Wine makers strive to meet the challenge
of attracting consumers to their wine, as shoppers are now faced with hundreds of selections on
the shelves of grocery stores. Many wineries use informational pamphlets, good reputations, or
brand loyalty for marketing, but these techniques lack a way to appeal to those who have no
previous knowledge or information of the industry. This type of consumer, among others,
completely relies on the packaging of a wine bottle to sway them toward a purchase. The label of
a wine bottle is the face of the brand and a company’s chance to pull in consumers. With
thousands of different possible attributes contributing to the aesthetic appeal of a wine label,
finding what consumers prefer to see will help wineries stand out among the rest.
2
Various combinations of features define a wine bottle label. Whether it’s design, colors,
or informational data, packaging has proven to be a very powerful marketing technique. Also, as
industrialization evolves and technology improves, specialists have the access and opportunity to
use resources to maximize the industry’s potential. Through new technologies, producers can
customize bottle and label attributes, in more ways than one, to match consumer preferences.
Experts have used these resources to discover new informational data that could be helpful in
wine marketing. Colors, themes, and designs are also components that attract or deter potential
buyers. Including new trends, like health benefits or alcohol content, on the front of the label,
may influence buyers to a purchase. Knowing the consumer’s preferences for packaging design
and for the desire of this kind of informational content, will help a winery’s label design become
more appealing.
Depending on geography, demographics and behaviors differ across the world. It is
important to specify a certain location before determining which label characteristics are
preferable. The more specific the location, the more accurate the results will be. San Luis Obispo
(SLO) County’s population of 265,297 is a perfect area to identify which wine characteristics are
most preferable (US Census Bureau 2010). The size of the population will offer enough diversity
to provide varietal results, but has an average common interest in wine to provide enough useful
information.
Problem Statement
How can wineries make their wine stand out to consumers in SLO County?
3
Hypothesis
Consumers in SLO County prefer eye catching and unique wine labels.
Objectives
1.) Conduct a survey that identifies consumer preferences for wine labels.
2.) Define the preferable characteristics of wine labels for consumers in SLO County.
Justification
With the vastly increasing wine and viticulture industry, insight on consumer preferences
will give wineries an upper-hand in this saturated business. Knowing which attributes of a wine
label appeal most to consumers, will ultimately increase a winery’s sales. This will also be
extremely helpful to wineries because it will give them a chance to save money by eliminating
characteristics that are not appealing to SLO County wine buyers; and put their marketing funds
toward certain features that catch the eye of the consumers. The information gathered from the
surveys will also help local wineries stand out from global wineries because the labels will be
catering specifically to locals. Not only will this research give wineries an idea of which colors,
shapes, and designs consumers prefer to see, but it will also determine which information is
important to have on the front of a label.
4
CHAPTER 2
LITERATURE REVIEW
As one of the biggest industries in California, wine plays a vital role for the state’s
survival in this feeble economy. California wine’s status has gained credibility over time because
of its constant demand, increasing popularity, and worldwide marketing. As one of wine’s profit
drivers, marketing has evolved immensely over the years. With the label as the face of a wine
bottle, marketers use these techniques to draw consumers toward their product. This method has
come a long way throughout history in the United States (Sartor 2008). To fully understand the
importance of label marketing in the wine industry, it is important to know the history of this
expanding product.
History of Wine
The Spanish conquistadors were the first to bring wine to Central and South America.
After Hernandez Cortez defeated the Aztecs in Mexico, in 1521, he soon became the governor of
Mexico (Stajda 2010). In his newly appointed position, he instructed his people to plant grape
vines on their land. As Mexico’s wine industry flourished, the king of Spain forbid new plantings
of grapes or vineyard replacements in Mexico after 1595, fearing his colony would become self-
5
sufficient of wine (Lamar 2009). During this time, religious groups were exempt from this law
and were able to form vineyards under the support of the church.
The very first winery to produce commercially grown wine in America was the “Santa
Maria de las Parras,” meaning Holy Mary of the Vines (Stajda 2010). As a current winery today,
now called Casa Madero, they’ve been producing wine for the last 414 years. Although this
winery continued to grow grapes over the years, America’s Atlantic coast did not have prestige
grape growing weather. The eastern coast was challenged with weather conditions but soon
settled down comfortably in the eastern states along the Great Lakes (Stajda 2010). This was the
birth of the wine industry in America. Later, in the 1700’s, Franciscan Monks established
missions on the west coast, which were the new homes of many wineries. San Diego, California
was the site of the first vineyard in America. This was the birth of one of California’s most
famous commodity.
Labels
Marketing has proven to be a prominent selling technique for wine over the years. A late
wine critic, Jerry Mead, once said “60 percent of wine sales are based on that ever-elusive air
around the bottle.” Mead was referring to the way wines are packaged and the power that the
packaging has over a consumer’s purchase (Sawyer 2006). Wine labels have been used as a tool
to deliver information about the wine and also stimulate a lasting impression about the brand on
the potential buyer. The surface of a label has also been known to project a sense of credibility to
consumers. The goal of the winery should be to create a wine label that is capable of narrating or
telling a story about the wine on a 3.5”x5” palate (Sawyer 2006).
6
Many people in the United States are convinced that consumers buy the label and not the
wine (Sartor 2008). Although not all wine buyers pay attention to the label, it is crucial to use
these marketing strategies and make the label striking enough to gain the individual’s attention.
Through the extensive process of designing a wine label, a winery can give them a desired
identity and ultimately appeal to consumers. It is important to outline the “do’s” and “don’ts”
that wine makers should abide by when making wine labels. If a wine label is too intrinsic, the
consumer might shy away, but if the label doesn’t stand out at all, the consumer might over-look
it (Sorter 2008). There is a strong line that should be drawn between too bold and too bland.
From many previous studies, extreme results were found. The presentation of informative
data on the front of a wine label has been discussed. It was found in a study that consumers are
drawn to labels that outline the risks of consuming their product (Bettman 1986). Not only are
consumers drawn in by the bottle shape, color, or label design, but they are also swayed by a
brief background of the product. The study defines three main benefits of providing potential
risks on the front of a product label. The first benefit is improved decision making. Since the
consumer is equipped with more information, they will be able to make a more educated
decision. The second benefit is improved product quality; for it has been proven that honesty
from a company will always win a consumer over. The third benefit is reduced prices because of
competition (Bettman 1986). Lower prices occur when the new information facilitates product
comparison, encouraging competition (Bettman 1986). Although label makers should caution
how they present the hazardous information, it will definitely be beneficial for them to include it.
Gaining consumer’s trust is more important than possibly turning them away with the truth.
Although consumers still prefer to trust their product’s honesty, health risk knowledge changed
since the development of this study in 1986.
7
The region of a winery’s origin has also been very vital to a consumer’s choice of
purchase. Presenting this on the front of a label will help promote local wineries in this saturated
industry (Gil 1997). It will also provide the consumer with a sense of background to the bottle
without even opening it. If the wine is from a prominent area, it will give the bottle more
credibility among the competition. In a more aware society, consumers have become
increasingly interested in the roots of the products they purchase. Including this information has
proven to be important with a significant increase in sales of 20% over a six-year period (Gil
1997).
When consumer preferences have been analyzed for wine label color, designs, and
shapes, different results have surfaced all around the world. In one study, it was found that
consumers shy away from unique, new, and risky wine labels (Orth 2003). They are more
hesitant to venture out and try new products, brands, or companies. Researchers have found that
“one-hit-wonder” trends are outdated, in other words, respondents don’t look for a wine that is
yelling for attention (Orth 2003). Consumers are searching for reliable wines that have acquired
a reputable following. As an advantage, marketers can use this information to successfully
market to this type of consumer.
On the other hand, it has been found that vibrant labels will catch the eye of the
consumer. Mike Hess, VP of operations for WS Packaging Group, asserts that technology has
provided producers with ways to utilize unique strategies and designs to differentiate their
product from the competition (Sartor 2010). Whether this is through vibrant colors, distinctive
designs, inimitable bottle/label shapes, or modern bottle closures, these attributes have been
proven to draw consumers in (Sartor 2010). It makes the customer believe their bottle is unique
and one-of-a-kind.
8
Surveys
It is vital to determine which characteristics are desirable to consumers knowing that
each demographic prefers different features. There have been studies all over the world that have
determined the importance of specifying demographics before collecting consumer data. It was
argued that each product has a certain demographic. This is the first step to any marketing plan.
A team must know who they are marketing to before they can attempt to market a product
(Barber 2006). In each country, state and county, demographics are sure to differ. Each
demographic requires a different method for advertising. These demographics can be determined
by surveying the consumers. Through various questions like age, gender, marital status, race,
educational level, and income level, the researcher can get a better idea of who the main
consumer of their product is (Barber 2006).
With many different methods, preferred results come from certain types of surveys.
Surveys can be administered in person, over telephone interviews, touch-tone telephone, mail,
electronic mail, self-administered, etc. Some methods have been found to be more useful than
others. Researchers have panned all the way back to the era of when there were no personal
computers and surveys were conducted over the phone by an interviewer reading from a
computer in a monotone. The answers that were received were usually not representative to the
population (Dillman 1998). Although surveys conducted through telephone have improved over
the years, it has been found that the best method of the future is self-administered surveys
(Dillman 1998). The self-administered tests are distributed to the consumers with the opportunity
for them to take their time, reading each question to themselves, and answer honestly. Leaving
9
the interviewer out of the data collection process completely can prove to be beneficial (Dillman
1998). Self-administered surveys ensure that there are no biases or attitudes from the interviewer
that could skew the answers of the interviewees. This also gives the interviewee complete
privacy while taking the survey, encouraging honesty.
To add onto the notion of a prevailing survey-gathering method, Herschel Knapp has
found that there is no significant difference between answers that are collected by different types
of self-administered surveys. Three different self-administered methods were used in this study
and the results from the respondents did not differentiate depending on which type of survey they
took (Knapp 2003). The three survey tests included mail-in, touch-tone telephone, and pencil-
and-paper methods. All being self-administered surveys, each resulted in usable answers to the
researcher.
An important focus of the survey gathering method is the actual generation of questions
that make up a survey. It is crucial to create questions that force the reader to provide impromptu
answers. If an interviewee had any previous time to think about a certain answer, it will be less
honest, throwing off the results (Simmons 1993). Another recommendation to survey creators is
to not generate questions that have preferred answers. It is vital to make certain that each
question is extremely neutral or else the answer will be biased (Simmons 2003). These kinds of
“swayed questions” may give you the answers that you are looking for but they will not be
accurate or helpful in the analysis portion.
It is important to identify certain methods that have proved to be successful and those that
have failed to provide efficient results. As noted before, a primary concern for the survey method
is the influence of the interviewer. The interviewer must be aware of the influence that they
might have on the interviewee during the questionnaire process (Simmons 1993). With any
10
special tone or certain looks, the interviewee may not perform accurately. The variation of the
interviewees also plays a major role in the survey method. The importance of capturing a wide
and diverse audience in order to receive accurate results is stressed (Simmons 1993). Conducting
a survey to respondents in a certain place for a long period of time will result in a common
demographic. A constant change in location and time periods will be an easier way to get
opinions from various demographics (Simmons 1993). Randomization is the key to success for
the survey method. Also, to ensure a wide variety of results there must be a large sample size.
This will make sure that the consumers surveyed are an efficient representation of the
population.
With all the different methods of distributing surveys, the next thought is to whom they
are being distributed. As explained later, the researcher collected data in front of various grocery
stores. According to Bill Cross, the demographics for grocery store shopping is changing. Before
a change in the past 2 decades, shoppers were predominately female (Cross 2009). Within these
recent years, studies have shown that males are becoming more common in the grocery store
(Cross 2009). This is for a number of reasons. The first is due to the variation in family structure
over time, including more single-parent homes (Cross 2009). The second reason for this male-
shopper increase is because Americans are postponing marriage (Cross 2009). According to the
U.S. Census Bureau, in 1988 the median age for marriage was 25.9 for males and 23.6 for
females. In the last 17 years, age for marriage has increased. In 2005, the median age for
marriage was 27.1 for males and 25.3 for females (U.S. Census Bureau 2009). Another reason
for the increase in male-shoppers is Americans are living longer and a large amount of baby-
boomers are retiring which means that more men are out shopping rather than their fathers and
grandfathers (Cross 2009). Men are also more likely to buy groceries in the store because, as
11
Cross puts it, “Men buy, women shop: the sexes have different priorities when walking down the
aisles”. All of these contributing factors will be helpful to the interviewer when distributing
surveys outside the grocery stores.
12
CHAPTER 3
METHOLOGY
Procedure for Data Collection
This study determined San Luis Obispo’s consumer preferences for wine bottle labels.
These preferences were evaluated by passing out surveys to wine consumers in SLO County. For
a sample of the survey please see Appendix 1. The survey is a tool that will obtain data such as
specific consumer demographics, buyer’s tastes and preferences, and their response to various
wine label features. There were very diverse questions throughout the survey to ensure honest,
direct, and helpful answers.
After appropriate advisors finalized the survey questions, they were distributed in
October of 2010. During this time, three full weeks were devoted to administering the surveys
and collecting data. With a total of 50 surveys, an average of 16 surveys a week were distributed.
There was also flexibility to throw out incomplete surveys or surveys with insufficient data. It is
important that the surveys were administered and collected during this time frame to ensure
enough time to complete additional analysis and to draw final conclusions before the due date.
All of the surveys were conducted in SLO County, specifically in front of grocery stores
where wine can be purchased. This location was chosen because this is where consumers, that
are likely to make wine purchases, can be found. Based on the U.S. Census Bureau, different
13
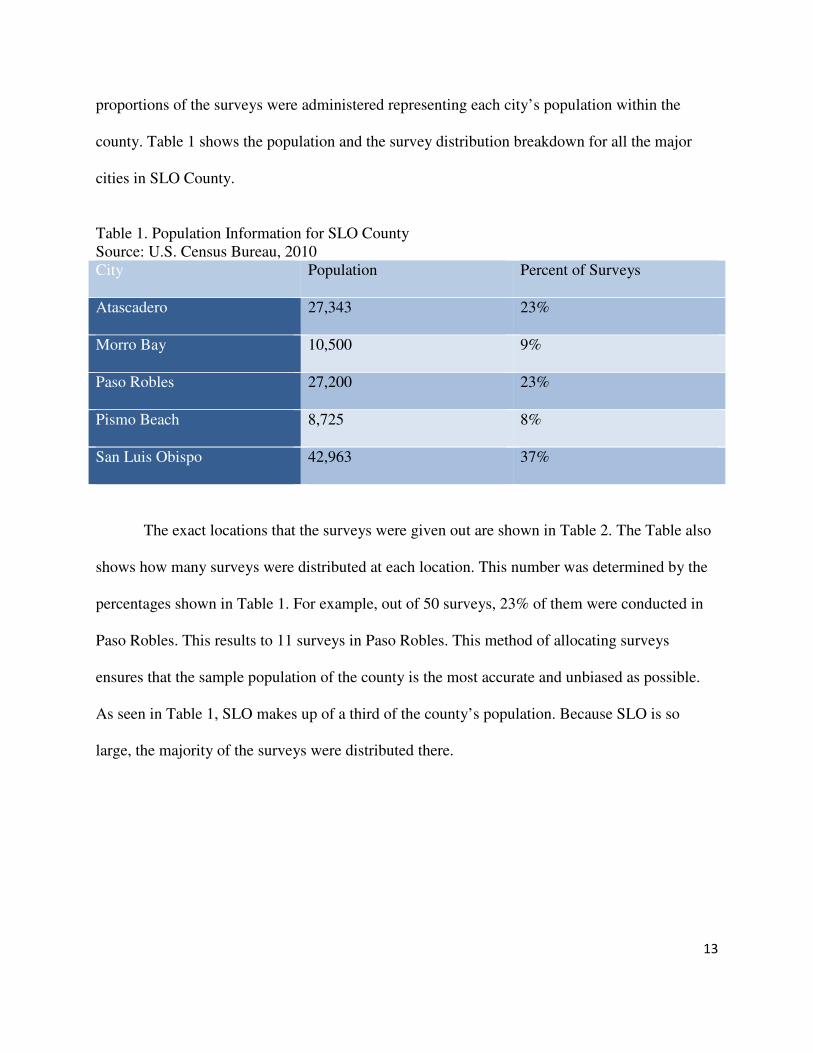
proportions of the surveys were administered representing each city’s population within the
county. Table 1 shows the population and the survey distribution breakdown for all the major
cities in SLO County.
Table 1. Population Information for SLO County Source: U.S. Census Bureau, 2010 City Population Percent of Surveys
Atascadero 27,343 23%
Morro Bay 10,500 9%
Paso Robles 27,200 23%
Pismo Beach 8,725 8%
San Luis Obispo 42,963 37%
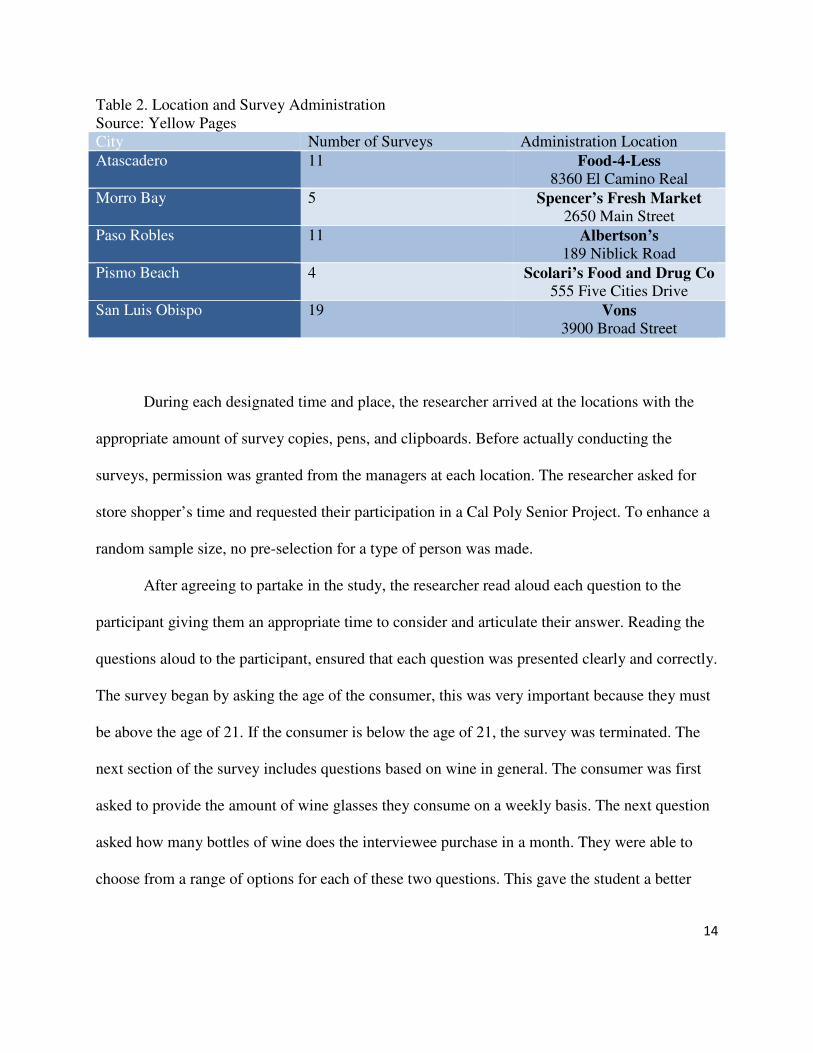
The exact locations that the surveys were given out are shown in Table 2. The Table also
shows how many surveys were distributed at each location. This number was determined by the
percentages shown in Table 1. For example, out of 50 surveys, 23% of them were conducted in
Paso Robles. This results to 11 surveys in Paso Robles. This method of allocating surveys
ensures that the sample population of the county is the most accurate and unbiased as possible.
As seen in Table 1, SLO makes up of a third of the county’s population. Because SLO is so
large, the majority of the surveys were distributed there.
14
Table 2. Location and Survey Administration Source: Yellow Pages City Number of Surveys Administration Location
Atascadero 11 Food-4-Less
8360 El Camino Real
Morro Bay 5 Spencer’s Fresh Market
2650 Main Street
Paso Robles 11 Albertson’s
189 Niblick Road
Pismo Beach 4 Scolari’s Food and Drug Co
555 Five Cities Drive
San Luis Obispo 19 Vons
3900 Broad Street
During each designated time and place, the researcher arrived at the locations with the
appropriate amount of survey copies, pens, and clipboards. Before actually conducting the
surveys, permission was granted from the managers at each location. The researcher asked for
store shopper’s time and requested their participation in a Cal Poly Senior Project. To enhance a
random sample size, no pre-selection for a type of person was made.
After agreeing to partake in the study, the researcher read aloud each question to the
participant giving them an appropriate time to consider and articulate their answer. Reading the
questions aloud to the participant, ensured that each question was presented clearly and correctly.
The survey began by asking the age of the consumer, this was very important because they must
be above the age of 21. If the consumer is below the age of 21, the survey was terminated. The
next section of the survey includes questions based on wine in general. The consumer was first
asked to provide the amount of wine glasses they consume on a weekly basis. The next question
asked how many bottles of wine does the interviewee purchase in a month. They were able to
choose from a range of options for each of these two questions. This gave the student a better
15
understanding of the consumer’s behavior, knowledge, and consumption of the wine industry
before asking them specific questions dealing with wine labels. The next question asked the
consumer to identify the average price of their wine bottle purchase. Another question asked the
consumer to identify the type of wine they drink most often. They chose between red, white or
other. The last question about wine consumption asked the respondent to rate wine
characteristics on a desirability scale. They were provided with 12 wine characteristics and were
instructed to rate each one on a scale of 1-5; 1 being not at all desirable and 5 being extremely
desirable.
The next section of the survey included a set of questions relating specifically to wine
labels. This is the section that will be most helpful for the researcher. The first question identified
the importance of a wine label. The question asked the consumer to indicate how imperative the
appearance of the label is in their purchase. They ranked this on an importance scale of 1-5, 1
being not at all important and 5 being extremely important. The next question provided the
consumer with nine characteristics of a wine label that they were asked to rank on the desirability
scale explained before. The next question deals with wine label color schemes. They were asked
to determine how desirable they found certain colors on a wine label on the same scale of 1-5.
The last question asked which informational data should be included on the front label. The
consumer then indicated how desirable they thought it was to include this information on the
front label.
The last section of the survey was all about demographics. This is a very important
portion of the survey because it provides the researcher with an idea of a target market for SLO
County wine consumers. This section of questions asked for the consumer’s gender, marital
status, education level, employment status, household size, ethnicity, and income. These certain
16
questions are also asked to help the researcher evaluate how diverse the sample size is. The
consumer was able to leave any question blank for privacy reasons, but was encouraged to
complete the survey. They were guaranteed that their information would remain private and used
solely for research purposes.
Procedure for Data Analysis
All of these survey questions required proper analysis in order for them to be helpful to
the researcher. The answers for each participant were entered into a program called Survey
Monkey. This program transformed the answers to each question into a statistical output used to
determine which answers were most commonly chosen. These statistical numbers were then
entered into SPSS where they were tested to properly evaluate and compare the participant’s
responses.
Each individual question had specific testing done in order to be able to efficiently
analyze the raw data provided. The tests run were based on whether the data was ordinal,
nominal, interval or ratio. Questions 5, 14, 15, 17, and 18 were all nominal data. This means that
frequency tests were run on each of them to determine which answer to each question was most
commonly chosen. Then they each needed a crosstabs chi-square test to compare the target group
and the non-target group. Questions 1, 2, 3, 4, 16, and 20 were all ordinal data. In order to
analyze these questions, frequencies and crosstab chi-square tests were also necessary. Questions
6, 7, 8, 9, 10, 12 were all interval data. They all had rating scales of importance and desirability
and needed to be analyzed through an independent t-test. This test checks for differences in
means between more than two groups.
17
Question 7 of the survey is the key question that separates the target market from the non-
target market. This question asked the respondents to rate the importance of wine label
appearance. Those that ranked 5 for extremely important or 4 for very important were considered
the target market. These are the people that the researcher is more interested in because they pay
the most attention to the label. Those that answered 3 for somewhat important, 2 for slightly
important, or 1 for not at all important, made up the non-target market. It was important to
separate these consumers from the target market consumers because they are far more interested
in what is inside the bottle and not the label. The market groups were physically separated on
SPSS to further run tests so that the computer would focus solely on the group that the researcher
was more interested in. After the appropriate tests were run, p-values were provided for further
interpretation. Significance for each participant’s answer was provided based on the p-value=.05
as extremely significant and p-value=.10 as somewhat significant. These varying values told the
researcher how significant the difference is between what the target market preferred and what
the non-target market preferred.
Demographic questions also helped identify a different target market for wine consumers
in SLO County because they investigate into the respondent’s background. The demographic
questions that were particularly helpful were age, gender, marital status, education level,
employment status, household size, ethnicity, and income. This provided the researcher with a
brief description of a typical SLO wine consumer.
Assumptions
18
All of the concluded results are based on assuming that each consumer provided honest
and accurate answers. This type of research relies completely on the respondents. This is a
completely risky method but if accurate answers were given, the method can prove to be
extremely useful. This type of study also assumes that the researcher properly delivered the
questions to the interviewee. If not, there may be a bias to their answers, which would
completely skew the results. There also is the risk of generalizing an entire population from 50
respondents.
Limitations
The limitations to this method of research are the areas in which the surveys are
distributed and collected. The results will be limited to SLO County residents. In comparison to
California, or to the U.S., these residents are not extremely diverse. There is a risk that limited
demographics will inhibit the results. The survey also can only involve those who are over the
age of 21, which limits the population to wine consumers. It is also important to keep in mind
that all county regulations, including signage use, will be followed and may limit the study
results. For example, certain store managers prohibit the distribution of surveys outside their
facility. This limits consumer participation in that specific area.
19
CHAPTER 4
DEVEOLPMENT OF THE STUDY
As 50 surveys were handed out in 5 different towns within SLO County, the collection of
research was difficult and time consuming, but eventually completed. A majority of the surveys
were handed out in the college town of San Luis Obispo causing a large proportion of college
students to participate. Most of the shoppers were female, but the amount of males was very
close behind. This coincides with the increasing number of male grocery shoppers over the past
two decades analyzed by Cross and explained by the researcher earlier in this study (2009).
Research was difficult and time-consuming to collect because most customers responded that
they did not have time to participate. Another challenge that was faced dealt with some
consumer’s preference to read the questions themselves instead of the researcher reading them
aloud. This confirms Dillman’s research in 2003 that self-administered tests are preferred by
participants and the results are usable by the researcher.
Analysis
After discarding unusable surveys, 50 surveys qualified for data analysis. Ensuring each
qualified survey was complete, all answers that each participant supplied were entered into
Survey Monkey. This program then determined which answers were chosen most for each
question asked. This provided the researcher with an idea of what the participants’ demographics
are and what they prefer when looking at all consumers as one group.
20
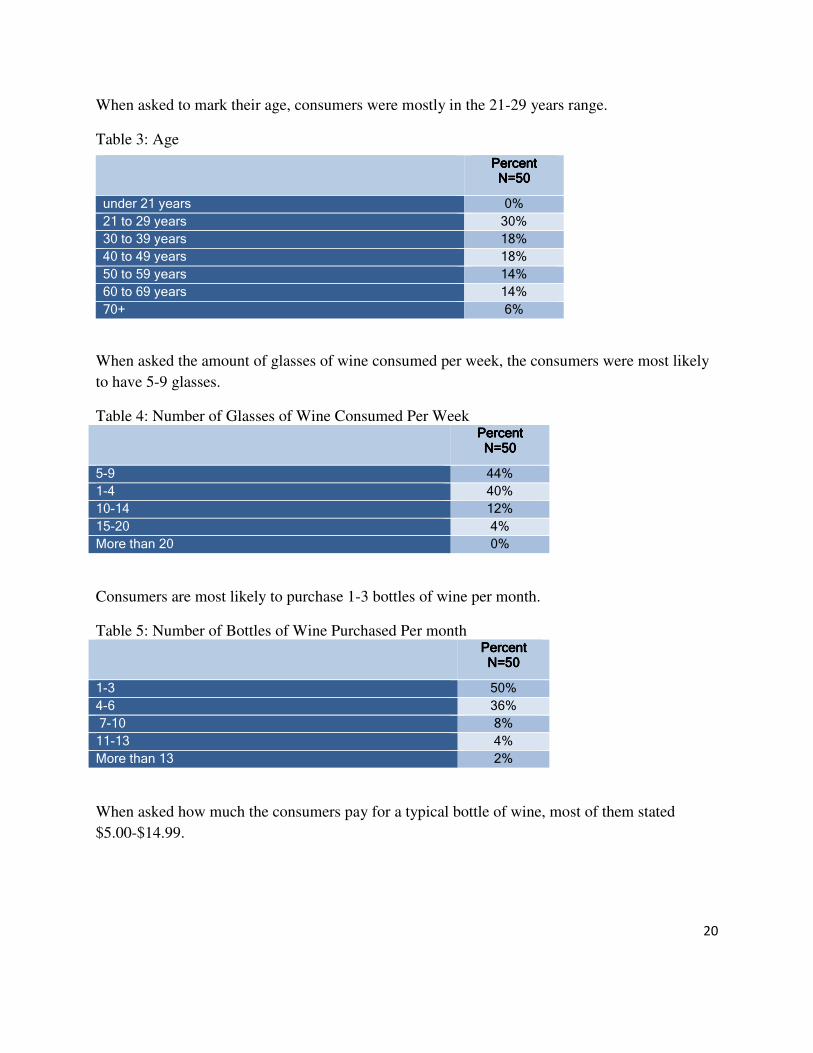
When asked to mark their age, consumers were mostly in the 21-29 years range.
Table 3: Age
When asked the amount of glasses of wine consumed per week, the consumers were most likely
to have 5-9 glasses.
Table 4: Number of Glasses of Wine Consumed Per Week PercentPercentPercentPercent
N=50N=50N=50N=50
5-9 44%
1-4 40%
10-14 12%
15-20 4%
More than 20 0%
Consumers are most likely to purchase 1-3 bottles of wine per month.
Table 5: Number of Bottles of Wine Purchased Per month PercentPercentPercentPercent
N=50N=50N=50N=50
1-3 50%
4-6 36%
7-10 8%
11-13 4%
More than 13 2%
When asked how much the consumers pay for a typical bottle of wine, most of them stated
$5.00-$14.99.
PercentPercentPercentPercent N=50N=50N=50N=50
under 21 years 0%
21 to 29 years 30%
30 to 39 years 18%
40 to 49 years 18%
50 to 59 years 14%
60 to 69 years 14%
70+ 6%
21
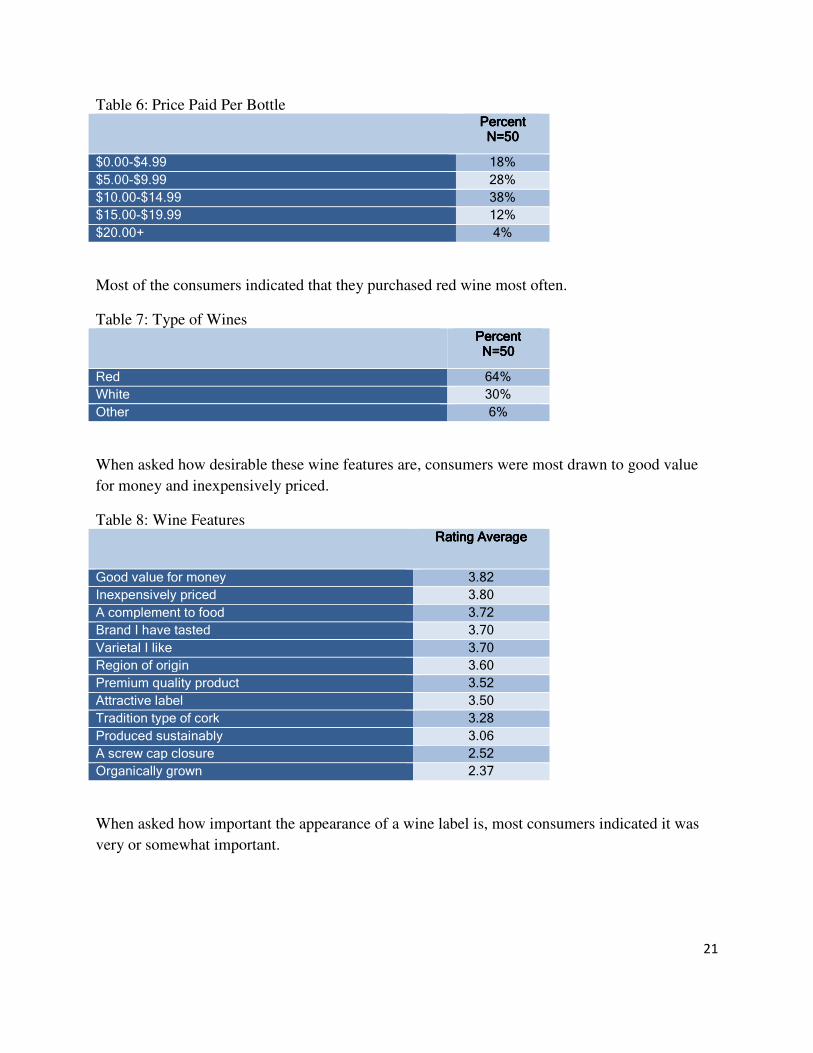
Table 6: Price Paid Per Bottle PercentPercentPercentPercent
N=50N=50N=50N=50
$0.00-$4.99 18%
$5.00-$9.99 28%
$10.00-$14.99 38%
$15.00-$19.99 12%
$20.00+ 4%
Most of the consumers indicated that they purchased red wine most often.
Table 7: Type of Wines PercentPercentPercentPercent
N=50N=50N=50N=50
Red 64%
White 30%
Other 6%
When asked how desirable these wine features are, consumers were most drawn to good value
for money and inexpensively priced.
Table 8: Wine Features Rating AverageRating AverageRating AverageRating Average
Good value for money 3.82
Inexpensively priced 3.80
A complement to food 3.72
Brand I have tasted 3.70
Varietal I like 3.70
Region of origin 3.60
Premium quality product 3.52
Attractive label 3.50
Tradition type of cork 3.28
Produced sustainably 3.06
A screw cap closure 2.52
Organically grown 2.37
When asked how important the appearance of a wine label is, most consumers indicated it was
very or somewhat important.
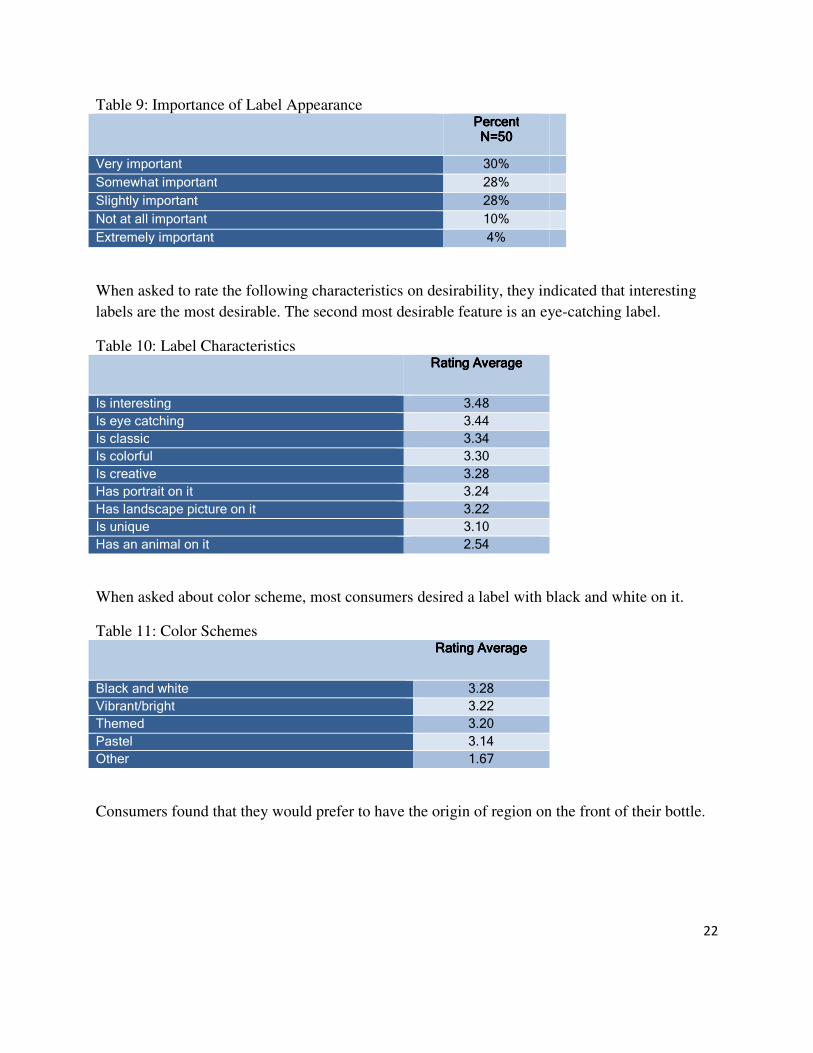
22
Table 9: Importance of Label Appearance PercentPercentPercentPercent
N=50N=50N=50N=50
Very important 30%
Somewhat important 28%
Slightly important 28%
Not at all important 10%
Extremely important 4%
When asked to rate the following characteristics on desirability, they indicated that interesting
labels are the most desirable. The second most desirable feature is an eye-catching label.
Table 10: Label Characteristics Rating AverageRating AverageRating AverageRating Average
Is interesting 3.48
Is eye catching 3.44
Is classic 3.34
Is colorful 3.30
Is creative 3.28
Has portrait on it 3.24
Has landscape picture on it 3.22
Is unique 3.10
Has an animal on it 2.54
When asked about color scheme, most consumers desired a label with black and white on it.
Table 11: Color Schemes Rating AverageRating AverageRating AverageRating Average
Black and white 3.28
Vibrant/bright 3.22
Themed 3.20
Pastel 3.14
Other 1.67
Consumers found that they would prefer to have the origin of region on the front of their bottle.
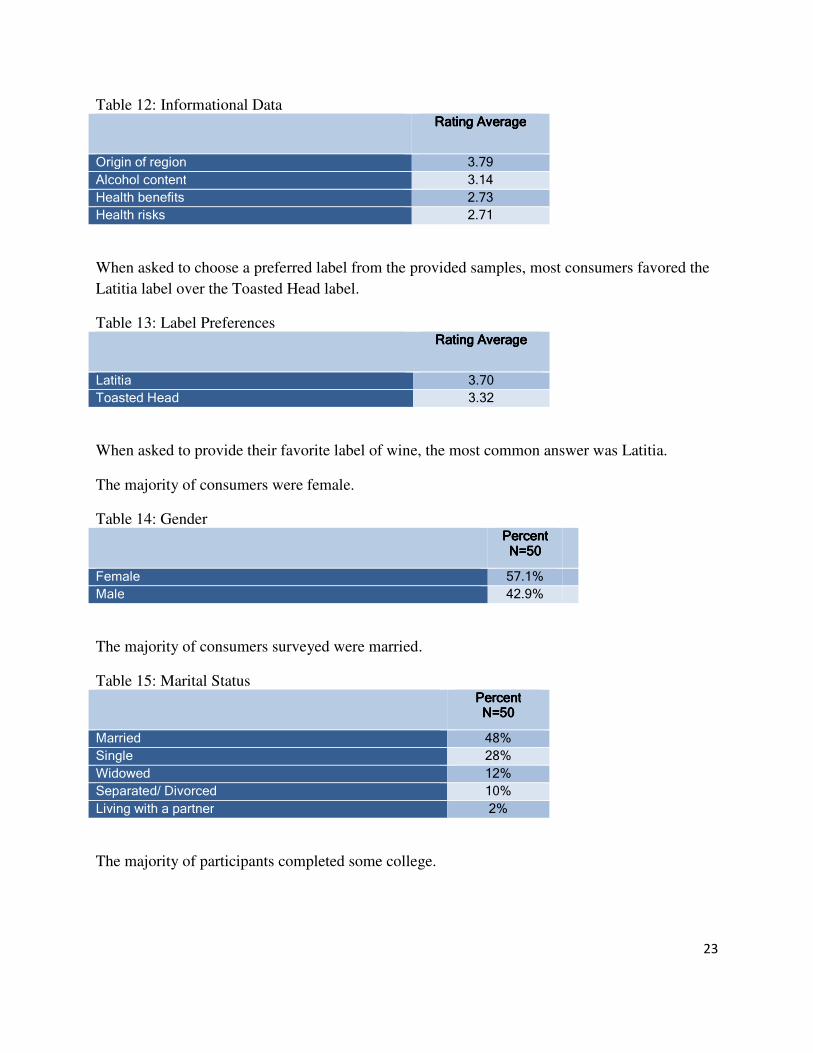
23
Table 12: Informational Data Rating AverageRating AverageRating AverageRating Average
Origin of region 3.79
Alcohol content 3.14
Health benefits 2.73
Health risks 2.71
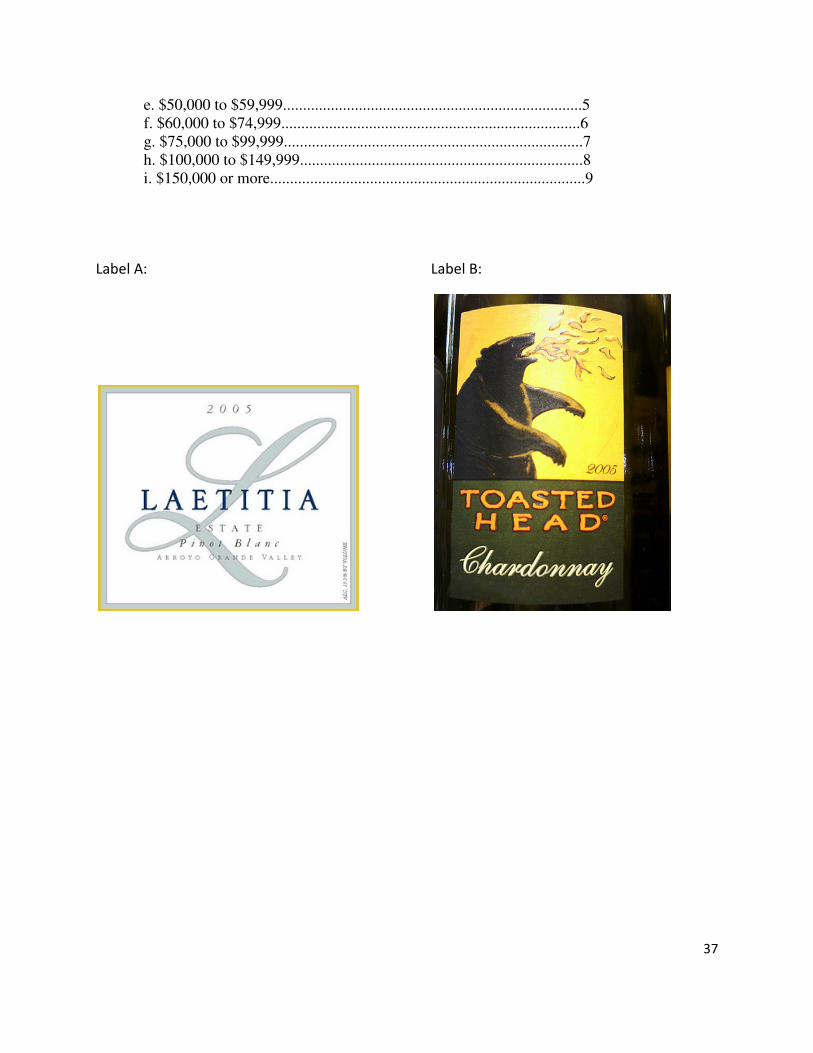
When asked to choose a preferred label from the provided samples, most consumers favored the
Latitia label over the Toasted Head label.
Table 13: Label Preferences Rating AverageRating AverageRating AverageRating Average
Latitia 3.70
Toasted Head 3.32
When asked to provide their favorite label of wine, the most common answer was Latitia.
The majority of consumers were female.
Table 14: Gender PercentPercentPercentPercent
N=50N=50N=50N=50
Female 57.1%
Male 42.9%
The majority of consumers surveyed were married.
Table 15: Marital Status PercentPercentPercentPercent
N=50N=50N=50N=50
Married 48%
Single 28%
Widowed 12%
Separated/ Divorced 10%
Living with a partner 2%
The majority of participants completed some college.
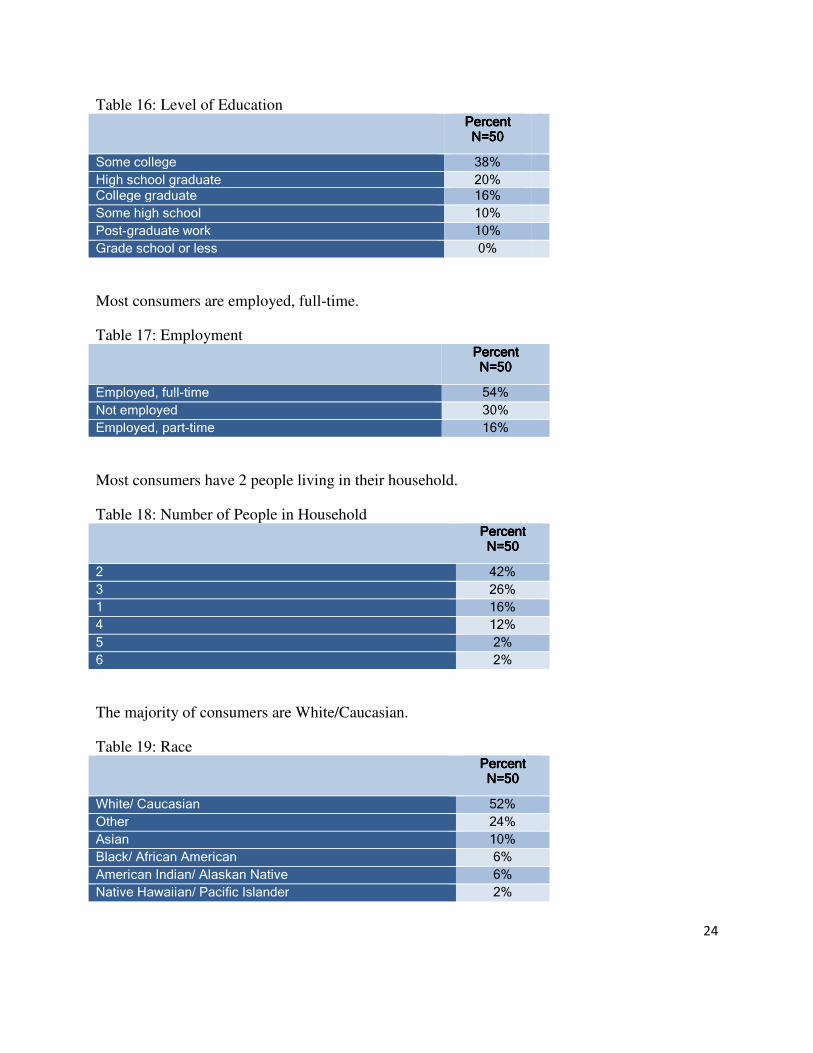
24
Table 16: Level of Education PercentPercentPercentPercent
N=50N=50N=50N=50
Some college 38%
High school graduate 20% College graduate 16%
Some high school 10%
Post-graduate work 10%
Grade school or less 0%
Most consumers are employed, full-time.
Table 17: Employment PercentPercentPercentPercent
N=50N=50N=50N=50
Employed, full-time 54%
Not employed 30%
Employed, part-time 16%
Most consumers have 2 people living in their household.
Table 18: Number of People in Household PercentPercentPercentPercent
N=50N=50N=50N=50
2 42%
3 26%
1 16%
4 12%
5 2%
6 2%
The majority of consumers are White/Caucasian.
Table 19: Race PercentPercentPercentPercent
N=50N=50N=50N=50
White/ Caucasian 52%
Other 24%
Asian 10%
Black/ African American 6%
American Indian/ Alaskan Native 6%
Native Hawaiian/ Pacific Islander 2%
25
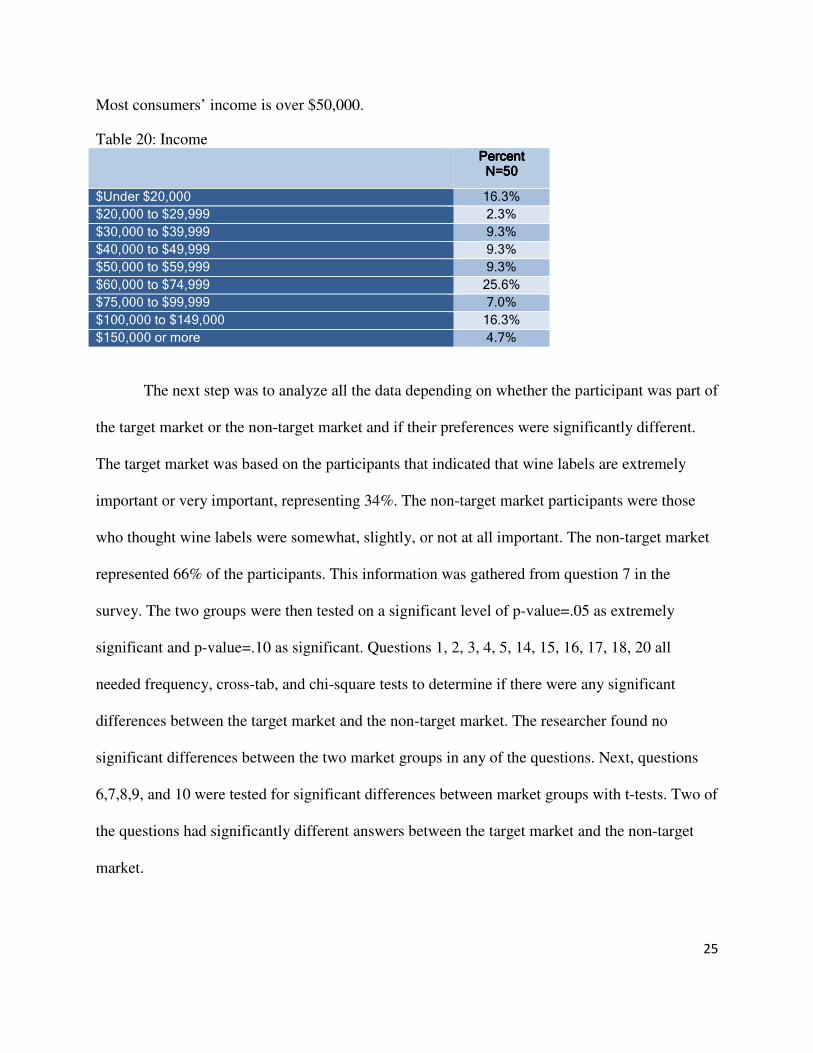
Most consumers’ income is over $50,000.
Table 20: Income PercentPercentPercentPercent
N=50N=50N=50N=50
$Under $20,000 16.3%
$20,000 to $29,999 2.3%
$30,000 to $39,999 9.3%
$40,000 to $49,999 9.3%
$50,000 to $59,999 9.3%
$60,000 to $74,999 25.6%
$75,000 to $99,999 7.0%
$100,000 to $149,000 16.3%
$150,000 or more 4.7%
The next step was to analyze all the data depending on whether the participant was part of
the target market or the non-target market and if their preferences were significantly different.
The target market was based on the participants that indicated that wine labels are extremely
important or very important, representing 34%. The non-target market participants were those
who thought wine labels were somewhat, slightly, or not at all important. The non-target market
represented 66% of the participants. This information was gathered from question 7 in the
survey. The two groups were then tested on a significant level of p-value=.05 as extremely
significant and p-value=.10 as significant. Questions 1, 2, 3, 4, 5, 14, 15, 16, 17, 18, 20 all
needed frequency, cross-tab, and chi-square tests to determine if there were any significant
differences between the target market and the non-target market. The researcher found no
significant differences between the two market groups in any of the questions. Next, questions
6,7,8,9, and 10 were tested for significant differences between market groups with t-tests. Two of
the questions had significantly different answers between the target market and the non-target
market.
26
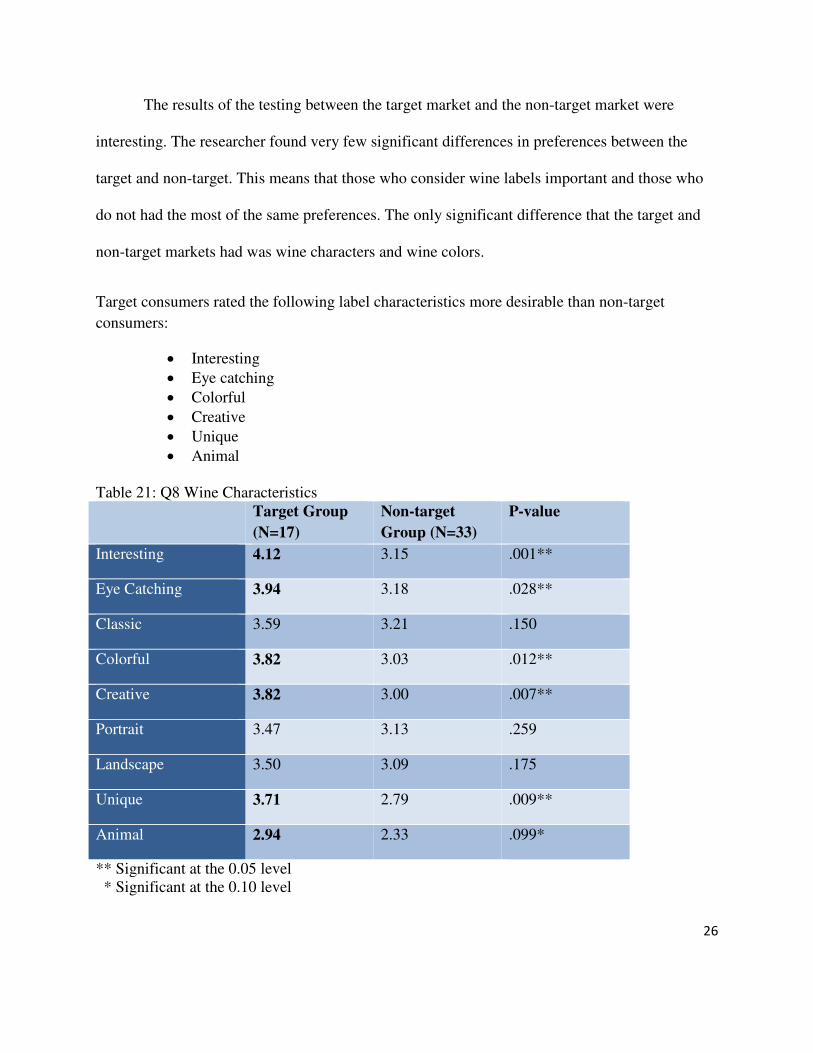
The results of the testing between the target market and the non-target market were
interesting. The researcher found very few significant differences in preferences between the
target and non-target. This means that those who consider wine labels important and those who
do not had the most of the same preferences. The only significant difference that the target and
non-target markets had was wine characters and wine colors.
Target consumers rated the following label characteristics more desirable than non-target
consumers:
• Interesting
• Eye catching
• Colorful
• Creative
• Unique
• Animal
Table 21: Q8 Wine Characteristics Target Group
(N=17)
Non-target
Group (N=33)
P-value
Interesting 4.12 3.15 .001**
Eye Catching 3.94 3.18 .028**
Classic 3.59 3.21 .150
Colorful 3.82 3.03 .012**
Creative 3.82 3.00 .007**
Portrait 3.47 3.13 .259
Landscape 3.50 3.09 .175
Unique 3.71 2.79 .009**
Animal 2.94 2.33 .099*
** Significant at the 0.05 level * Significant at the 0.10 level
27
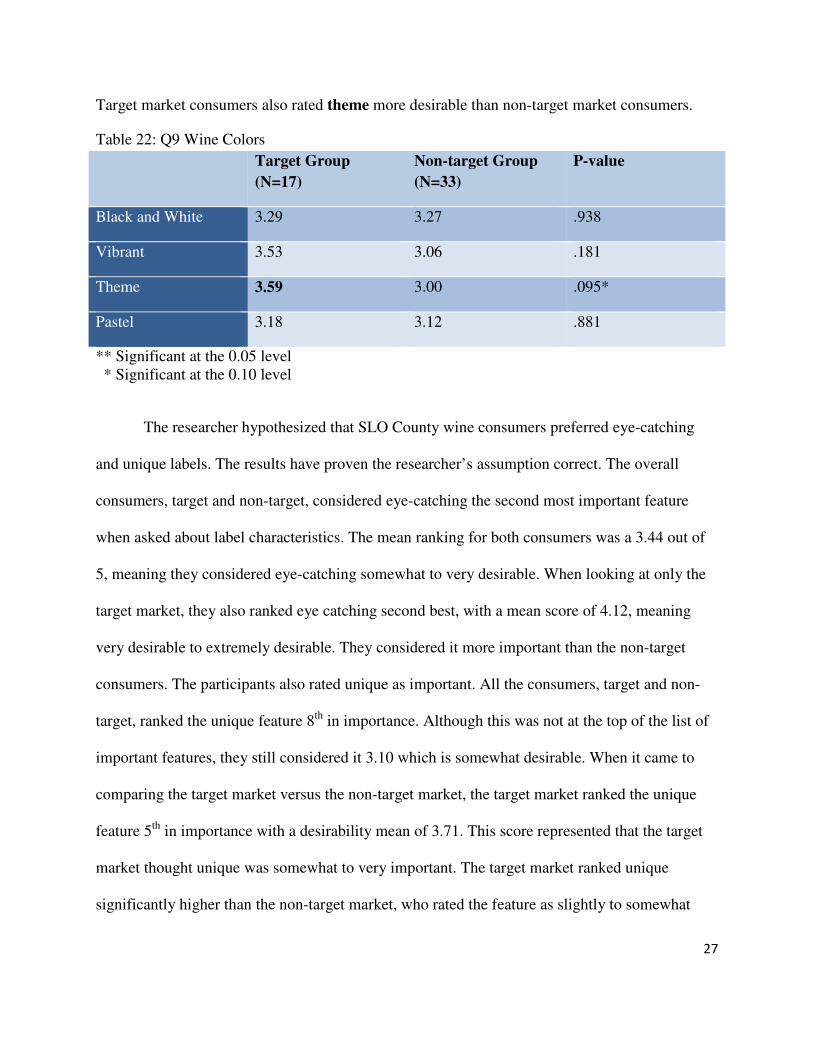
Target market consumers also rated theme more desirable than non-target market consumers.
Table 22: Q9 Wine Colors
Target Group
(N=17)
Non-target Group
(N=33)
P-value
Black and White 3.29 3.27 .938
Vibrant 3.53 3.06 .181
Theme 3.59 3.00 .095*
Pastel 3.18 3.12 .881
** Significant at the 0.05 level * Significant at the 0.10 level
The researcher hypothesized that SLO County wine consumers preferred eye-catching
and unique labels. The results have proven the researcher’s assumption correct. The overall
consumers, target and non-target, considered eye-catching the second most important feature
when asked about label characteristics. The mean ranking for both consumers was a 3.44 out of
5, meaning they considered eye-catching somewhat to very desirable. When looking at only the
target market, they also ranked eye catching second best, with a mean score of 4.12, meaning
very desirable to extremely desirable. They considered it more important than the non-target
consumers. The participants also rated unique as important. All the consumers, target and non-
target, ranked the unique feature 8th in importance. Although this was not at the top of the list of
important features, they still considered it 3.10 which is somewhat desirable. When it came to
comparing the target market versus the non-target market, the target market ranked the unique
feature 5th in importance with a desirability mean of 3.71. This score represented that the target
market thought unique was somewhat to very important. The target market ranked unique
significantly higher than the non-target market, who rated the feature as slightly to somewhat
28
desirable with a mean of 2.79. The researcher focused on the target market because that is the
group that marketers try to attract. They want to please the people that don’t know or care much
about the wine inside, but the ones who buy the wine by looking at the label on the front.
29
CHAPTER 5
SUMMARY, CONSLUSIONS, RECOMMENDATIONS
With the wine industry being so impacted and competitive, marketers need a way for
their wine to attract consumers. This study used volunteer’s input as well as technological
programs to determine what attracts consumers in SLO County.
The majority of respondents were 21-29 year old white females. Most of them married
with 2 people living in their household. They have some college education and are employed
full-time, making over $50,000 a year. These participants consume 5-9 glasses of wine a week
and purchase 1-3 bottles a month at $5.00-$14.99
a bottle on average. They typically consume red wine that is a good value for their money or
inexpensively priced. They prefer to see interesting wine labels that feature black and white and
the wine’s origin of region. After dividing the consumers into groups that indicated wine labels
are important and those who do not think wine labels are important, we found little differences in
their preferences. They prefer all of the same attributes on a wine label except label
characteristics and label colors. Those who consider a wine label very important, who the
consumer focused on, preferred labels that are interesting, eye catching, colorful, creative,
unique and feature an animal. They also are attracted to labels that have a themed color scheme.
With this information, marketers are able to focus on certain consumers while designing a
label that appeals specifically to them. Because the research focuses on SLO County, those
aware of this study can develop wine labels dedicated to the local consumers.
30
Based on the results from the study, it is recommended that wineries and wine marketers
design labels that are interesting, eye-catching, colorful, creative, unique, feature an animal and
themed color schemes. These attributes are specifically appealing to those who live in SLO
County and consider a wine label very important. In order to have an increase in sales, they
should construct a label that stands out among the rest on the shelves.
If this study were to be extended into further research, the recommendations would be to
expand. The research should evaluate consumers from a much broader area because the
demographics are not diverse in SLO County. Because of these circumstances, the sample size of
SLO County is not very representative to other areas. Also, the research should include more
responses from consumers. Surveys should be handed out to more than 50 participants in order to
get a better idea of true preferences.
31
References Cited
“2009 California Wine Sales.” 2009. The Wine Institute: Sec. 1, p. 1.
Barber, Nelson, Barbara A. Almanza, and Janis R. Donovan (2006). “Motivational factors of gender, income and age on selecting a bottle of wine.” International Journal of Wine
Marketing. 218-220.
Bettman, James R., John W. Payne and Richard Staelin.1986. “Cognitive Considerations in Designing Effective Labels for Presenting Risk Information.” Journal of Public Policy
and Marketing. 1-22. Cross, Bill. 2009. “The Changing Demographics of Today’s Grocery Shopper.” Food Biz Daily. Dillman, Don A. 1998. “Mail and Other Self-Administered Surveys in the 21st Century: The
Beginning of a New Era.” Gallup Research Journal. (March): 1-22.
Gil, Jose M. and Mercedes Sanchez. 1997. “Consumer Preferences for Wine Attributes.” British
Food Journal: 3-11.
“History of Wines: From First Vines to Modern Day Regions.” Tasting Wine: Section 4, part 1. Knapp, Herschel and Stuart A. Kirk. 2003. “Using pencil and paper, Internet or Touch-Tone
Phones for Self-Administered Surveys: Does Methodology Matter?” Computers in
Human Behavior:117-134. Lamar, Jim. 2009. “Wine History: Science and Social Impact Through Time.” Professional
Friends of Wine. (June): p. 1.
Orth, Ulrich R., Mina McDaniel, Cindy Lederer and Aurelie Bourrain. 2003. “Effects of
Ambient Scent on Wine Consumer Behavior and Preferences.” Wine Business Monthly.
(November 1): 1-4.
Sartor, Michelle. 2008. “Wine labeling: more so than with most products, labels sell wine.
Converters work closely with wineries to provide the labels that meet or exceed
expectations.” Business Publications. (January-February): 1-6.
Sawyer, Christopher. 2006 “The Power of Wine Label Design.” Wine Business Monthly. (April
15): p. 1-3
Stajda, Sharon. 2008. “Ever Wonder When America was Introduced to Wine?” History of
American Wine. (November): 1.
32
U.S. Census Bureau. 2010. Population Census for San Luis Obispo County.
U.S. Census Bureau. 2005. Estimated Median Age at First Marriage, by Sex: 1890 to the Present.
33
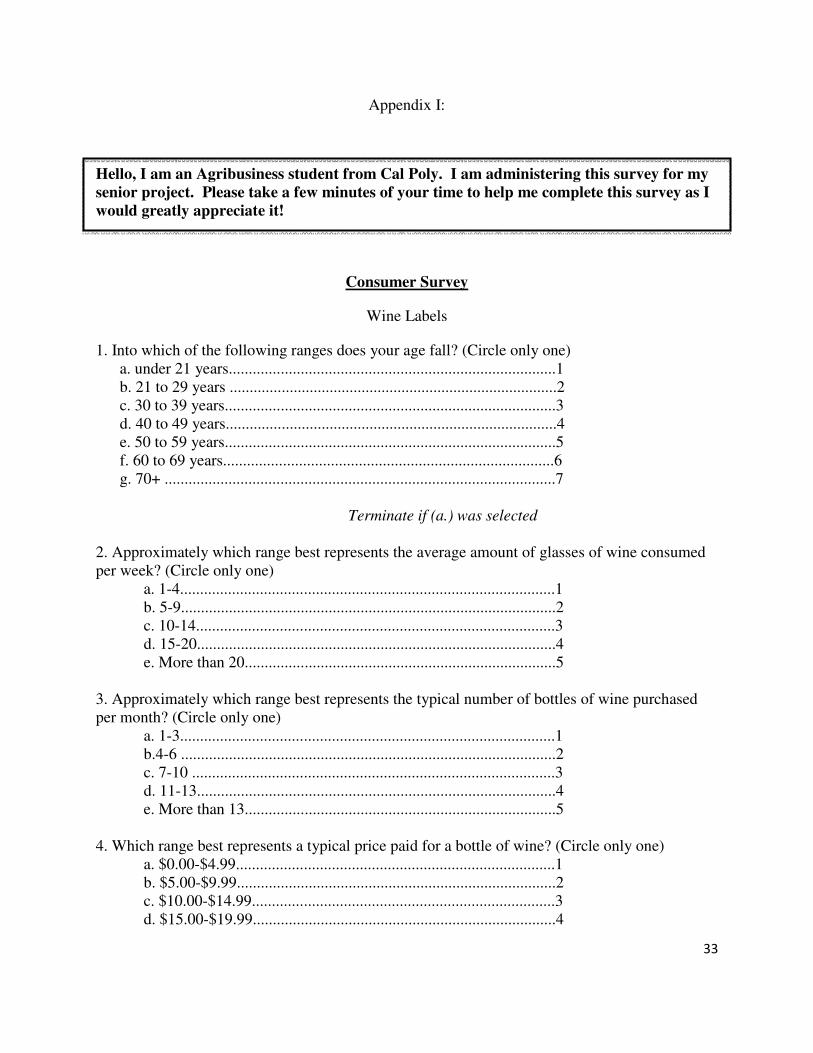
Appendix I:
Hello, I am an Agribusiness student from Cal Poly. I am administering this survey for my
senior project. Please take a few minutes of your time to help me complete this survey as I
would greatly appreciate it!
Consumer Survey
Wine Labels
1. Into which of the following ranges does your age fall? (Circle only one) a. under 21 years..................................................................................1 b. 21 to 29 years ..................................................................................2 c. 30 to 39 years...................................................................................3 d. 40 to 49 years...................................................................................4 e. 50 to 59 years...................................................................................5 f. 60 to 69 years...................................................................................6 g. 70+ ..................................................................................................7
Terminate if (a.) was selected
2. Approximately which range best represents the average amount of glasses of wine consumed per week? (Circle only one)
a. 1-4..............................................................................................1 b. 5-9..............................................................................................2 c. 10-14..........................................................................................3 d. 15-20..........................................................................................4 e. More than 20..............................................................................5
3. Approximately which range best represents the typical number of bottles of wine purchased per month? (Circle only one)
a. 1-3..............................................................................................1 b.4-6 ..............................................................................................2 c. 7-10 ...........................................................................................3 d. 11-13..........................................................................................4 e. More than 13..............................................................................5
4. Which range best represents a typical price paid for a bottle of wine? (Circle only one)
a. $0.00-$4.99................................................................................1 b. $5.00-$9.99................................................................................2 c. $10.00-$14.99............................................................................3 d. $15.00-$19.99............................................................................4
34
e. $20.00+.......................................................................................5
5. Which of the following types of wines do you drink most often? (Circle only one) a. Red.............................................................................................1 b. White..........................................................................................2 c. Other..........................................................................................3
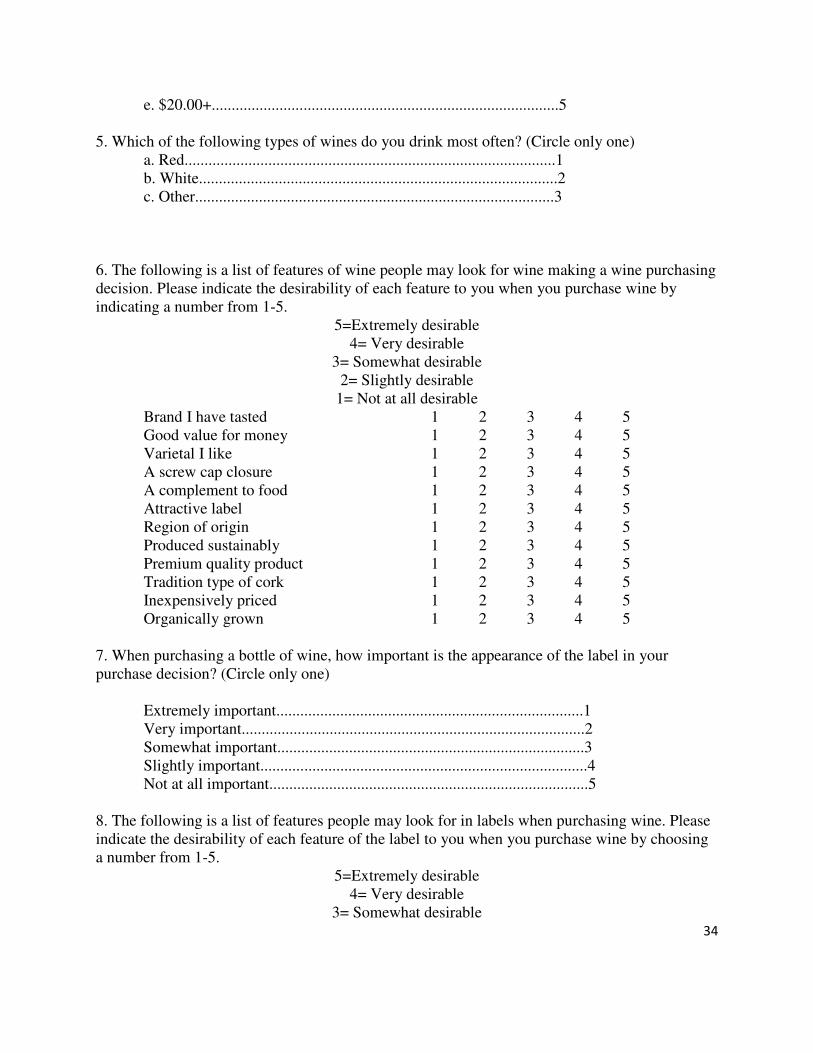
6. The following is a list of features of wine people may look for wine making a wine purchasing decision. Please indicate the desirability of each feature to you when you purchase wine by indicating a number from 1-5.
5=Extremely desirable 4= Very desirable
3= Somewhat desirable 2= Slightly desirable
1= Not at all desirable Brand I have tasted 1 2 3 4 5 Good value for money 1 2 3 4 5 Varietal I like 1 2 3 4 5 A screw cap closure 1 2 3 4 5 A complement to food 1 2 3 4 5 Attractive label 1 2 3 4 5 Region of origin 1 2 3 4 5 Produced sustainably 1 2 3 4 5 Premium quality product 1 2 3 4 5 Tradition type of cork 1 2 3 4 5 Inexpensively priced 1 2 3 4 5 Organically grown 1 2 3 4 5
7. When purchasing a bottle of wine, how important is the appearance of the label in your purchase decision? (Circle only one)
Extremely important.............................................................................1 Very important......................................................................................2 Somewhat important.............................................................................3 Slightly important..................................................................................4 Not at all important................................................................................5
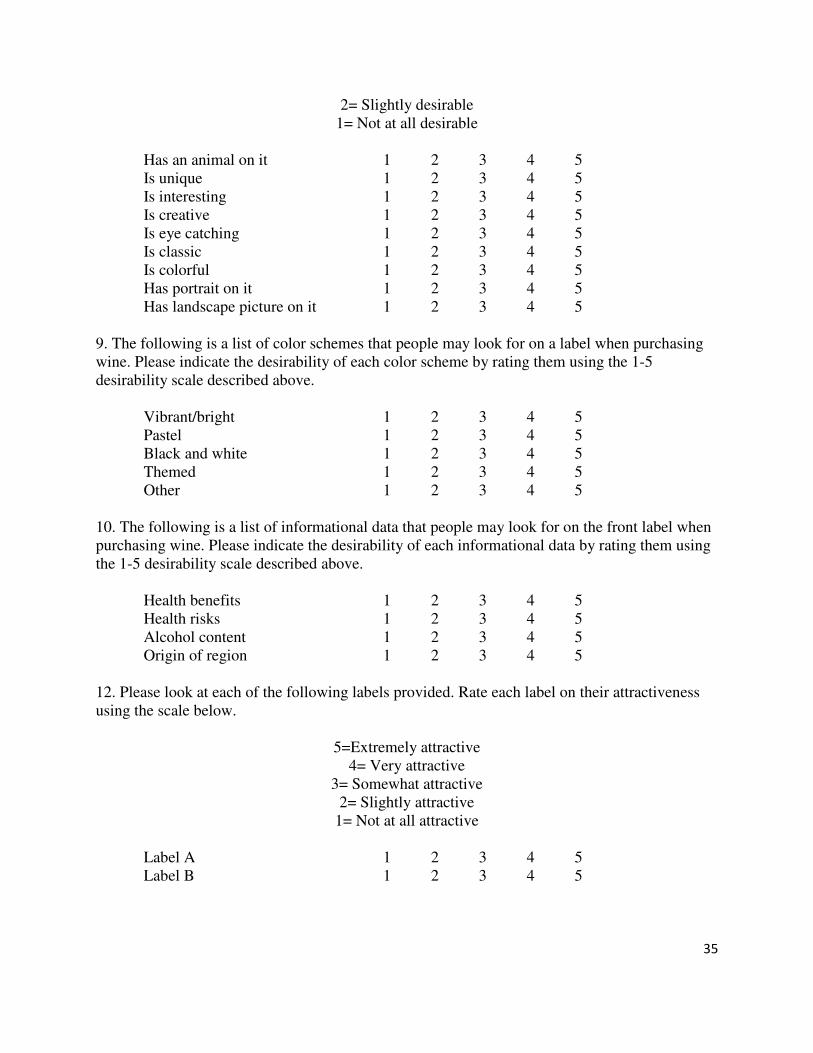
8. The following is a list of features people may look for in labels when purchasing wine. Please indicate the desirability of each feature of the label to you when you purchase wine by choosing a number from 1-5.
5=Extremely desirable 4= Very desirable
3= Somewhat desirable
35
2= Slightly desirable 1= Not at all desirable
Has an animal on it 1 2 3 4 5 Is unique 1 2 3 4 5 Is interesting 1 2 3 4 5 Is creative 1 2 3 4 5 Is eye catching 1 2 3 4 5 Is classic 1 2 3 4 5 Is colorful 1 2 3 4 5 Has portrait on it 1 2 3 4 5 Has landscape picture on it 1 2 3 4 5
9. The following is a list of color schemes that people may look for on a label when purchasing wine. Please indicate the desirability of each color scheme by rating them using the 1-5 desirability scale described above.
Vibrant/bright 1 2 3 4 5 Pastel 1 2 3 4 5 Black and white 1 2 3 4 5 Themed 1 2 3 4 5 Other 1 2 3 4 5
10. The following is a list of informational data that people may look for on the front label when purchasing wine. Please indicate the desirability of each informational data by rating them using the 1-5 desirability scale described above.
Health benefits 1 2 3 4 5 Health risks 1 2 3 4 5 Alcohol content 1 2 3 4 5 Origin of region 1 2 3 4 5
12. Please look at each of the following labels provided. Rate each label on their attractiveness using the scale below.
5=Extremely attractive 4= Very attractive
3= Somewhat attractive 2= Slightly attractive
1= Not at all attractive
Label A 1 2 3 4 5 Label B 1 2 3 4 5
36
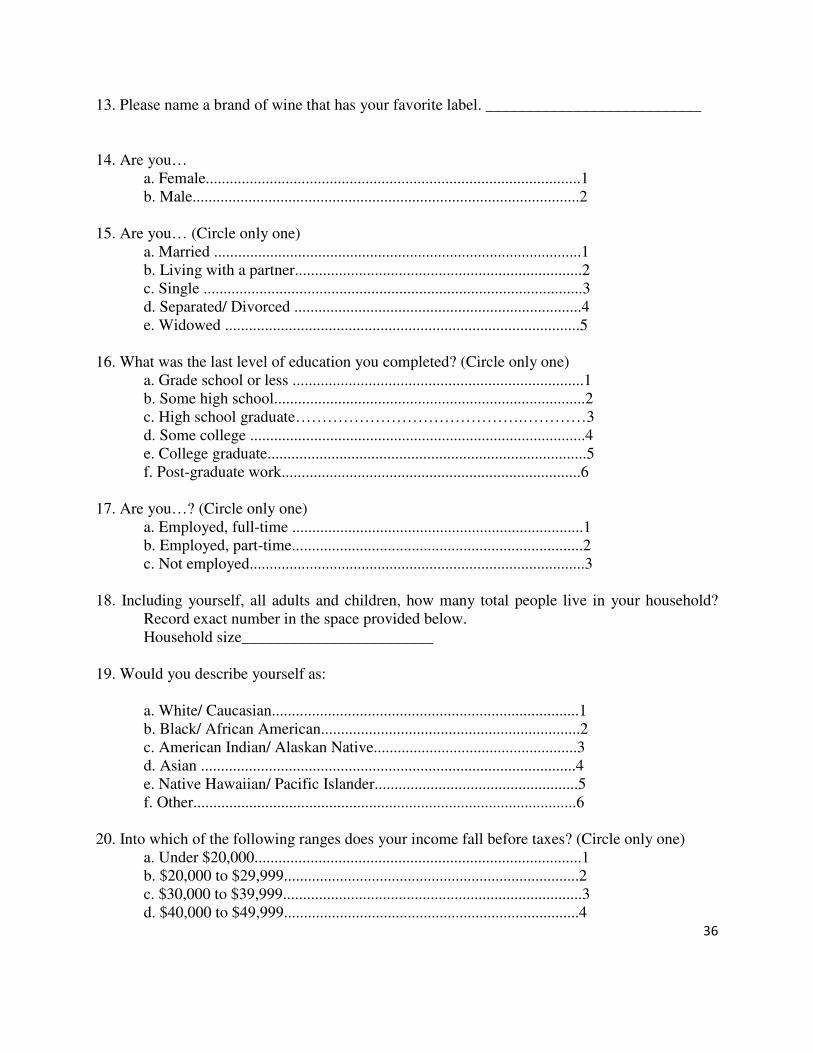
13. Please name a brand of wine that has your favorite label. ___________________________
14. Are you…
a. Female..............................................................................................1 b. Male.................................................................................................2
15. Are you… (Circle only one)
a. Married ............................................................................................1 b. Living with a partner........................................................................2 c. Single ...............................................................................................3 d. Separated/ Divorced ........................................................................4 e. Widowed .........................................................................................5
16. What was the last level of education you completed? (Circle only one)
a. Grade school or less .........................................................................1 b. Some high school..............................................................................2 c. High school graduate…………………………………….…………3 d. Some college ....................................................................................4 e. College graduate................................................................................5 f. Post-graduate work...........................................................................6
17. Are you…? (Circle only one)
a. Employed, full-time .........................................................................1 b. Employed, part-time.........................................................................2 c. Not employed....................................................................................3
18. Including yourself, all adults and children, how many total people live in your household?
Record exact number in the space provided below. Household size________________________
19. Would you describe yourself as:
a. White/ Caucasian.............................................................................1 b. Black/ African American.................................................................2 c. American Indian/ Alaskan Native...................................................3 d. Asian ..............................................................................................4 e. Native Hawaiian/ Pacific Islander...................................................5 f. Other................................................................................................6
20. Into which of the following ranges does your income fall before taxes? (Circle only one)
a. Under $20,000..................................................................................1 b. $20,000 to $29,999..........................................................................2 c. $30,000 to $39,999...........................................................................3 d. $40,000 to $49,999..........................................................................4
37
e. $50,000 to $59,999...........................................................................5 f. $60,000 to $74,999...........................................................................6 g. $75,000 to $99,999...........................................................................7 h. $100,000 to $149,999.......................................................................8 i. $150,000 or more...............................................................................9
Label A: Label B: